SPATIAL STATISTICAL ANALYSES TO ASSESS THE ...
8
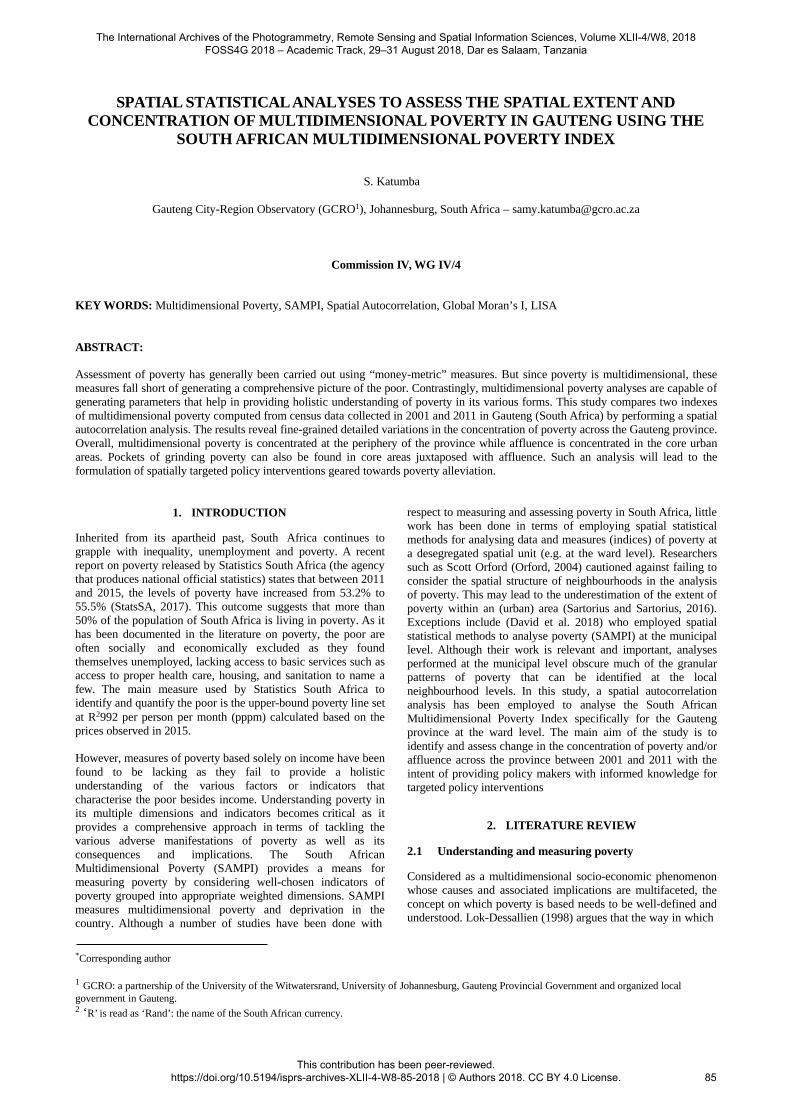
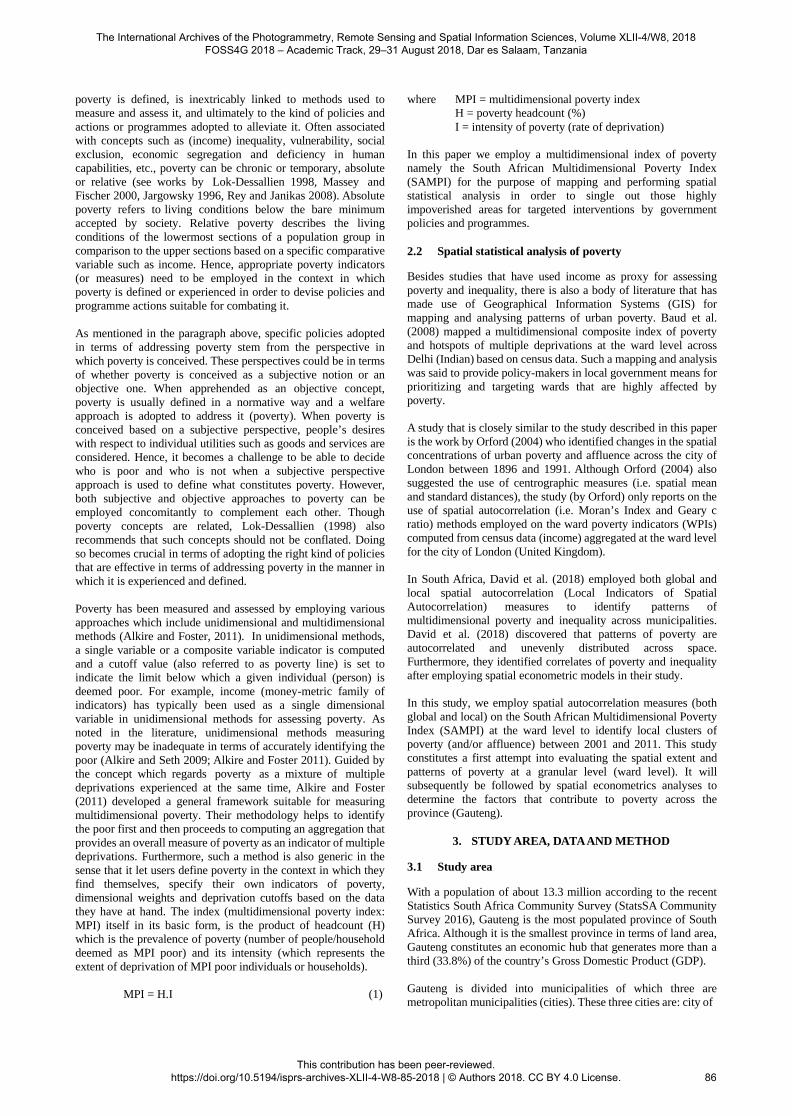
SPATIAL STATISTICAL ANALYSES TO ASSESS THE SPATIAL EXTENT AND CONCENTRATION OF MULTIDIMENSIONAL POVERTY IN GAUTENG USING THE SOUTH AFRICAN MULTIDIMENSIONAL POVERTY INDEX S. Katumba Gauteng City-Region Observatory (GCRO 1 ), Johannesburg, South Africa – [email protected] Commission IV, WG IV/4 KEY WORDS: Multidimensional Poverty, SAMPI, Spatial Autocorrelation, Global Moran’s I, LISA ABSTRACT: Assessment of poverty has generally been carried out using “money-metric” measures. But since poverty is multidimensional, these measures fall short of generating a comprehensive picture of the poor. Contrastingly, multidimensional poverty analyses are capable of generating parameters that help in providing holistic understanding of poverty in its various forms. This study compares two indexes of multidimensional poverty computed from census data collected in 2001 and 2011 in Gauteng (South Africa) by performing a spatial autocorrelation analysis. The results reveal fine-grained detailed variations in the concentration of poverty across the Gauteng province. Overall, multidimensional poverty is concentrated at the periphery of the province while affluence is concentrated in the core urban areas. Pockets of grinding poverty can also be found in core areas juxtaposed with affluence. Such an analysis will lead to the formulation of spatially targeted policy interventions geared towards poverty alleviation. 1. INTRODUCTION Inherited from its apartheid past, South Africa continues to grapple with inequality, unemployment and poverty. A recent report on poverty released by Statistics South Africa (the agency that produces national official statistics) states that between 2011 and 2015, the levels of poverty have increased from 53.2% to 55.5% (StatsSA, 2017). This outcome suggests that more than 50% of the population of South Africa is living in poverty. As it has been documented in the literature on poverty, the poor are often socially and economically excluded as they found themselves unemployed, lacking access to basic services such as access to proper health care, housing, and sanitation to name a few. The main measure used by Statistics South Africa to identify and quantify the poor is the upper-bound poverty line set at R 2 992 per person per month (pppm) calculated based on the prices observed in 2015. However, measures of poverty based solely on income have been found to be lacking as they fail to provide a holistic understanding of the various factors or indicators that characterise the poor besides income. Understanding poverty in its multiple dimensions and indicators becomes critical as it provides a comprehensive approach in terms of tackling the various adverse manifestations of poverty as well as its consequences and implications. The South African Multidimensional Poverty (SAMPI) provides a means for measuring poverty by considering well-chosen indicators of poverty grouped into appropriate weighted dimensions. SAMPI measures multidimensional poverty and deprivation in the country. Although a number of studies have been done with respect to measuring and assessing poverty in South Africa, little work has been done in terms of employing spatial statistical methods for analysing data and measures (indices) of poverty at a desegregated spatial unit (e.g. at the ward level). Researchers such as Scott Orford (Orford, 2004) cautioned against failing to consider the spatial structure of neighbourhoods in the analysis of poverty. This may lead to the underestimation of the extent of poverty within an (urban) area (Sartorius and Sartorius, 2016). Exceptions include (David et al. 2018) who employed spatial statistical methods to analyse poverty (SAMPI) at the municipal level. Although their work is relevant and important, analyses performed at the municipal level obscure much of the granular patterns of poverty that can be identified at the local neighbourhood levels. In this study, a spatial autocorrelation analysis has been employed to analyse the South African Multidimensional Poverty Index specifically for the Gauteng province at the ward level. The main aim of the study is to identify and assess change in the concentration of poverty and/or affluence across the province between 2001 and 2011 with the intent of providing policy makers with informed knowledge for targeted policy interventions 2. LITERATURE REVIEW 2.1 Understanding and measuring poverty Considered as a multidimensional socio-economic phenomenon whose causes and associated implications are multifaceted, the concept on which poverty is based needs to be well-defined and understood. Lok-Dessallien (1998) argues that the way in which * Corresponding author 1 GCRO: a partnership of the University of the Witwatersrand, University of Johannesburg, Gauteng Provincial Government and organized local government in Gauteng. 2 ‘R’ is read as ‘Rand’: the name of the South African currency. The International Archives of the Photogrammetry, Remote Sensing and Spatial Information Sciences, Volume XLII-4/W8, 2018 FOSS4G 2018 – Academic Track, 29–31 August 2018, Dar es Salaam, Tanzania This contribution has been peer-reviewed. https://doi.org/10.5194/isprs-archives-XLII-4-W8-85-2018 | © Authors 2018. CC BY 4.0 License. 85
-
Upload
khangminh22 -
Category
Documents
-
view
3 -
download
0
Transcript of SPATIAL STATISTICAL ANALYSES TO ASSESS THE ...
SPATIAL STATISTICAL ANALYSES TO ASSESS THE SPATIAL EXTENT AND CONCENTRATION OF MULTIDIMENSIONAL POVERTY IN GAUTENG USING THE
SOUTH AFRICAN MULTIDIMENSIONAL POVERTY INDEX
S. Katumba
Gauteng City-Region Observatory (GCRO1), Johannesburg, South Africa – [email protected]
Commission IV, WG IV/4
KEY WORDS: Multidimensional Poverty, SAMPI, Spatial Autocorrelation, Global Moran’s I, LISA
ABSTRACT:
Assessment of poverty has generally been carried out using “money-metric” measures. But since poverty is multidimensional, these measures fall short of generating a comprehensive picture of the poor. Contrastingly, multidimensional poverty analyses are capable of generating parameters that help in providing holistic understanding of poverty in its various forms. This study compares two indexes of multidimensional poverty computed from census data collected in 2001 and 2011 in Gauteng (South Africa) by performing a spatial autocorrelation analysis. The results reveal fine-grained detailed variations in the concentration of poverty across the Gauteng province. Overall, multidimensional poverty is concentrated at the periphery of the province while affluence is concentrated in the core urban areas. Pockets of grinding poverty can also be found in core areas juxtaposed with affluence. Such an analysis will lead to the formulation of spatially targeted policy interventions geared towards poverty alleviation.
1. INTRODUCTION
Inherited from its apartheid past, South Africa continues to grapple with inequality, unemployment and poverty. A recent report on poverty released by Statistics South Africa (the agency that produces national official statistics) states that between 2011 and 2015, the levels of poverty have increased from 53.2% to 55.5% (StatsSA, 2017). This outcome suggests that more than 50% of the population of South Africa is living in poverty. As it has been documented in the literature on poverty, the poor are often socially and economically excluded as they found themselves unemployed, lacking access to basic services such as access to proper health care, housing, and sanitation to name a few. The main measure used by Statistics South Africa to identify and quantify the poor is the upper-bound poverty line set at R2992 per person per month (pppm) calculated based on the prices observed in 2015.
However, measures of poverty based solely on income have been found to be lacking as they fail to provide a holistic understanding of the various factors or indicators that characterise the poor besides income. Understanding poverty in its multiple dimensions and indicators becomes critical as it provides a comprehensive approach in terms of tackling the various adverse manifestations of poverty as well as its consequences and implications. The South African Multidimensional Poverty (SAMPI) provides a means for measuring poverty by considering well-chosen indicators of poverty grouped into appropriate weighted dimensions. SAMPI measures multidimensional poverty and deprivation in the country. Although a number of studies have been done with
respect to measuring and assessing poverty in South Africa, little work has been done in terms of employing spatial statistical methods for analysing data and measures (indices) of poverty at a desegregated spatial unit (e.g. at the ward level). Researchers such as Scott Orford (Orford, 2004) cautioned against failing to consider the spatial structure of neighbourhoods in the analysis of poverty. This may lead to the underestimation of the extent of poverty within an (urban) area (Sartorius and Sartorius, 2016). Exceptions include (David et al. 2018) who employed spatial statistical methods to analyse poverty (SAMPI) at the municipal level. Although their work is relevant and important, analyses performed at the municipal level obscure much of the granular patterns of poverty that can be identified at the local neighbourhood levels. In this study, a spatial autocorrelation analysis has been employed to analyse the South African Multidimensional Poverty Index specifically for the Gauteng province at the ward level. The main aim of the study is to identify and assess change in the concentration of poverty and/or affluence across the province between 2001 and 2011 with the intent of providing policy makers with informed knowledge for targeted policy interventions
2. LITERATURE REVIEW
2.1 Understanding and measuring poverty
Considered as a multidimensional socio-economic phenomenon whose causes and associated implications are multifaceted, the concept on which poverty is based needs to be well-defined and understood. Lok-Dessallien (1998) argues that the way in which
*Corresponding author
1 GCRO: a partnership of the University of the Witwatersrand, University of Johannesburg, Gauteng Provincial Government and organized local government in Gauteng. 2 ‘R’ is read as ‘Rand’: the name of the South African currency.
The International Archives of the Photogrammetry, Remote Sensing and Spatial Information Sciences, Volume XLII-4/W8, 2018 FOSS4G 2018 – Academic Track, 29–31 August 2018, Dar es Salaam, Tanzania
This contribution has been peer-reviewed. https://doi.org/10.5194/isprs-archives-XLII-4-W8-85-2018 | © Authors 2018. CC BY 4.0 License.
85
poverty is defined, is inextricably linked to methods used to measure and assess it, and ultimately to the kind of policies and actions or programmes adopted to alleviate it. Often associated with concepts such as (income) inequality, vulnerability, social exclusion, economic segregation and deficiency in human capabilities, etc., poverty can be chronic or temporary, absolute or relative (see works by Lok-Dessallien 1998, Massey and Fischer 2000, Jargowsky 1996, Rey and Janikas 2008). Absolute poverty refers to living conditions below the bare minimum accepted by society. Relative poverty describes the living conditions of the lowermost sections of a population group in comparison to the upper sections based on a specific comparative variable such as income. Hence, appropriate poverty indicators (or measures) need to be employed in the context in which poverty is defined or experienced in order to devise policies and programme actions suitable for combating it.
As mentioned in the paragraph above, specific policies adopted in terms of addressing poverty stem from the perspective in which poverty is conceived. These perspectives could be in terms of whether poverty is conceived as a subjective notion or an objective one. When apprehended as an objective concept, poverty is usually defined in a normative way and a welfare approach is adopted to address it (poverty). When poverty is conceived based on a subjective perspective, people’s desires with respect to individual utilities such as goods and services are considered. Hence, it becomes a challenge to be able to decide who is poor and who is not when a subjective perspective approach is used to define what constitutes poverty. However, both subjective and objective approaches to poverty can be employed concomitantly to complement each other. Though poverty concepts are related, Lok-Dessallien (1998) also recommends that such concepts should not be conflated. Doing so becomes crucial in terms of adopting the right kind of policies that are effective in terms of addressing poverty in the manner in which it is experienced and defined.
Poverty has been measured and assessed by employing various approaches which include unidimensional and multidimensional methods (Alkire and Foster, 2011). In unidimensional methods, a single variable or a composite variable indicator is computed and a cutoff value (also referred to as poverty line) is set to indicate the limit below which a given individual (person) is deemed poor. For example, income (money-metric family of indicators) has typically been used as a single dimensional variable in unidimensional methods for assessing poverty. As noted in the literature, unidimensional methods measuring poverty may be inadequate in terms of accurately identifying the poor (Alkire and Seth 2009; Alkire and Foster 2011). Guided by the concept which regards poverty as a mixture of multiple deprivations experienced at the same time, Alkire and Foster (2011) developed a general framework suitable for measuring multidimensional poverty. Their methodology helps to identify the poor first and then proceeds to computing an aggregation that provides an overall measure of poverty as an indicator of multiple deprivations. Furthermore, such a method is also generic in the sense that it let users define poverty in the context in which they find themselves, specify their own indicators of poverty, dimensional weights and deprivation cutoffs based on the data they have at hand. The index (multidimensional poverty index: MPI) itself in its basic form, is the product of headcount (H) which is the prevalence of poverty (number of people/household deemed as MPI poor) and its intensity (which represents the extent of deprivation of MPI poor individuals or households).
MPI = H.I (1)
where MPI = multidimensional poverty index H = poverty headcount (%) I = intensity of poverty (rate of deprivation)
In this paper we employ a multidimensional index of poverty namely the South African Multidimensional Poverty Index (SAMPI) for the purpose of mapping and performing spatial statistical analysis in order to single out those highly impoverished areas for targeted interventions by government policies and programmes.
2.2 Spatial statistical analysis of poverty
Besides studies that have used income as proxy for assessing poverty and inequality, there is also a body of literature that has made use of Geographical Information Systems (GIS) for mapping and analysing patterns of urban poverty. Baud et al. (2008) mapped a multidimensional composite index of poverty and hotspots of multiple deprivations at the ward level across Delhi (Indian) based on census data. Such a mapping and analysis was said to provide policy-makers in local government means for prioritizing and targeting wards that are highly affected by poverty.
A study that is closely similar to the study described in this paper is the work by Orford (2004) who identified changes in the spatial concentrations of urban poverty and affluence across the city of London between 1896 and 1991. Although Orford (2004) also suggested the use of centrographic measures (i.e. spatial mean and standard distances), the study (by Orford) only reports on the use of spatial autocorrelation (i.e. Moran’s Index and Geary c ratio) methods employed on the ward poverty indicators (WPIs) computed from census data (income) aggregated at the ward level for the city of London (United Kingdom).
In South Africa, David et al. (2018) employed both global and local spatial autocorrelation (Local Indicators of Spatial Autocorrelation) measures to identify patterns of multidimensional poverty and inequality across municipalities. David et al. (2018) discovered that patterns of poverty are autocorrelated and unevenly distributed across space. Furthermore, they identified correlates of poverty and inequality after employing spatial econometric models in their study.
In this study, we employ spatial autocorrelation measures (both global and local) on the South African Multidimensional Poverty Index (SAMPI) at the ward level to identify local clusters of poverty (and/or affluence) between 2001 and 2011. This study constitutes a first attempt into evaluating the spatial extent and patterns of poverty at a granular level (ward level). It will subsequently be followed by spatial econometrics analyses to determine the factors that contribute to poverty across the province (Gauteng).
3. STUDY AREA, DATA AND METHOD
3.1 Study area
With a population of about 13.3 million according to the recent Statistics South Africa Community Survey (StatsSA Community Survey 2016), Gauteng is the most populated province of South Africa. Although it is the smallest province in terms of land area, Gauteng constitutes an economic hub that generates more than a third (33.8%) of the country’s Gross Domestic Product (GDP).
Gauteng is divided into municipalities of which three are metropolitan municipalities (cities). These three cities are: city of
The International Archives of the Photogrammetry, Remote Sensing and Spatial Information Sciences, Volume XLII-4/W8, 2018 FOSS4G 2018 – Academic Track, 29–31 August 2018, Dar es Salaam, Tanzania
This contribution has been peer-reviewed. https://doi.org/10.5194/isprs-archives-XLII-4-W8-85-2018 | © Authors 2018. CC BY 4.0 License.
86

∑ ∑ �
Johannesburg (Central), city of Tshwane (North) and Ekurhuleni (East). Municipalities are further divided into wards. Although Gauteng has currently been divided into 529 in total, the data (SAMPI) analysed in this study was computed with 479 wards in Gauteng. It also relevant to mention that besides being the economic heartland of South Africa, Gauteng has its own set of challenges. Existing high levels of poverty and inequality inherited from the apartheid era continues to haunt the province. The task of the current government is therefore to redress the imbalances of the past and assure an equitable future for Gauteng citizens. Figure 1 describes the geographic location of Gauteng province.
Figure 1. Gauteng province (study area)
3.2 Data: South African Multidimensional Poverty Index (SAMPI), Headcount and Intensity
The data on poverty analysed in this study is the South African Multidimensional Poverty Index (SAMPI) computed based on census data collected in 2001 and 2011 by Statistics South Africa in 2014 (StatsSA 2014). StatsSA saw the need to construct a multidimensional index to measure poverty and deprivation in the country and map it (the index) at different geographical
Dwelling type
If an informal shack/traditional dwelling/caravan/tent/other
1/8
Asset owner- ship
If household does not own more than one of radio, televi- sion, telephone or refrigerator and does not own a car
1/8
Eco- nomic activity
Unem- ployment
If all adults (aged 15 to 64) in the household are unemployed
1/4
Table 1. Dimensions, indicators and deprivation cut-offs for
SAMPI
Based on the global MPI methodology, SAMPI defines an individual or household that fall short (or lack) in at least 33.3% of the indicators (weighting included) as being multidimensionally poor. The proportion of all the individuals or households that have been declared as multidimensionally poor is defined as the headcount (H). The intensity (I) is the proportion of indicators in which an individual or households has fallen short of (on average per ward for example). In other words, intensity measures the depth of poverty experienced by individuals or households. Finally SAMPI (index) is then obtained by computing the product of the headcount (H) by the intensity (I).
3.3 Method: Spatial Autocorrelation
The global Moran’s Index (I) and Anselin’s Local Indicators of Spatial Association (LISA, a local version of the global Moran’s I) were used to determine significant occurrences of clustering of similar values (positive spatial autocorrelation) or the clustering of dissimilar values (negative spatial autocorrelation). LISA was particularly used to determine localised patterns of spatial autocorrelation of poverty across the province at the ward level. The global spatial autocorrelation (global Moran’s I) was considered as a precursor of localised spatial autocorrelation (LISA). Global Moran’s I is mathematically described by the formula as follows (Moran, 1950; Cliff & Ord, 1981):
𝑛𝑛 ∑ ∑𝑛𝑛 ��,�(��−𝑋𝑋)(�𝐽𝐽−𝑋𝑋)
levels. The SAMPI was constructed using the Alkire and Foster � = 𝑛𝑛 � �
∑(� −𝑋𝑋)2 (2) (2011) methodology (global MPI) by considering a set of eleven indicators of poverty grouped into four dimensions as described in Table 1.
� � �,� � � where �� = is a SAMPI, headcount, or intensity value of ward
i (a ward of interest) � = is a SAMPI, headcount, or intensity value of ward � (a neighbouring ward of ward i)
𝑋𝑋 = is the (global) mean of the considered variable (i.e. SAMPI, headcount or intensity) across the study area (i.e. Gauteng province) ��,�= specifies the weight that define the spatial relationship between adjacent wards (i.e. ward i and ward J; Adjacent wards have more weight as compared to distant wards).
𝑛𝑛 = is the number of wards (in this case n = 497) A positive value of the global Moran’s I statistics suggests an instance of positive spatial autocorrelation (clustering of similar values), and a negative value of the statistics index signals the presence of negative spatial autocorrelation (clustering of dissimilar values). Spatial randomness is reflected by a global Moran’s I of zero.
The local Moran’s I statistics (LISA) as defined by Anselin, (1995) is given by the expression as follows:
Dimen- sion
Indicator Deprivation cut-off Weight
Health Child mortality
If any child under the age of 5 has died in the past 12 months
1/4
Educa- tion
Years of schooling
If no household member aged 15 or older has completed 5 years of schooling
1/8
School attend- ance
If any school-aged child (aged 7 to 15) is out of school
1/8
Standard of living
Fuel for lighting
If household is using paraf- fin/candles/nothing/other
1/8
Fuel for heating
If household is using paraf- fin/wood/coal/dung/other/none
1/8
Fuel for cooking
If household is using paraf- fin/wood/coal/dung/other/none
1/8
Water ac- cess
If no piped water in dwelling or on stand
1/8
Sanita- tion type
If not a flush toilet 1/8
The International Archives of the Photogrammetry, Remote Sensing and Spatial Information Sciences, Volume XLII-4/W8, 2018 FOSS4G 2018 – Academic Track, 29–31 August 2018, Dar es Salaam, Tanzania
This contribution has been peer-reviewed. https://doi.org/10.5194/isprs-archives-XLII-4-W8-85-2018 | © Authors 2018. CC BY 4.0 License.
87

�� − 𝑋𝑋 𝑛𝑛 �� = 𝑛𝑛−1 ∑(� −𝑋𝑋)2 ∑� ��,� (�𝐽𝐽 − 𝑋𝑋) (3)
� � Figure 2. Poverty headcount (%) in 2001
The variables are defined the same as the ones in the global Moran’s I expression (2). However for LISA, a local index of spatial autocorrelation is computed for each of the 497 wards in Gauteng.
Lastly, in order to model spatial relationships among wards, the first order queen contiguity matrix with raw standardization was employed.
4. RESULTS AND DISCUSSIONS
The discussions of the results begin with the description of the mapping of poverty headcount, intensity and the index of multidimensional poverty itself. The mapping was done using QGIS software package. This was followed by the mapping of concentration of poverty (and/or affluence) using GeoDa software. Subsequently, measures of spatial autocorrelation namely the global Moran’s I and LISA were also computed using GeoDa.
4.1 Mapping poverty headcount, intensity and index (SAMPI) across Gauteng between 2001 and 2011
Figure 2 illustrates a map of poverty headcount computed from census data obtained in 2001. About 60% of the population was identified as multidimensionally poor. As it can be seen in the map, the majority of poor residents of Gauteng are living in the periphery of metropolitan municipalities (namely city of Johannesburg, city of Tshwane and Ekurhuleni) in places such as Tembisa, Soshanguve, Hammanskraal, Diepsloot, Bekkersdal and Orange Farm. Lower proportions of people affected by poverty can be observed in wards located in the core areas of the province. These include places such as Pretoria (city of Tshwane), Sandton (city of Johannesburg) and in Benoni (Ekurhuleni). Some improvements in terms of poverty reduction are noticeable in 2011 with a headcount of 46.9% (refer Figure 3). This suggests that the number of people deemed as multidimensionally poor had decreased in 2011 in comparison with 2001 (60%). However the patterns of the spatial distribution of poverty and affluence as observed in 2001 remained more or less the same as in 2011.
Figure 3. Poverty headcount (%) in 2011
As illustrated in Figure 4 and Figure 5, the intensity of poverty per ward experienced by Gauteng’s residents has decreased from 52% in 2001 to 48% in 2011. In 2001 (refer Figure 4), high levels of deprivation can be observed among wards located around the northern parts of the city of Tshwane (in Hammanskraal, Soshanguve), in the southern parts of the city of Johannesburg (in Orange Farm) and in Ekurhuleni (in Kwa-Thema and Katlehong). Lower levels of deprivation can be observed in local municipalities located in south western (Mogale, Merafong and Ranfontein) and south eastern (Midvaal and Lesedi) parts of the province. Pockets of high levels of deprivation can also be observed in places such as Tembisa, Bekkersdal and Mamelodi. In 2011, although the overall rate of poverty deprivation has decreased, high levels of the intensity of poverty are very much pronounced in wards located in the peripheral municipalities of the province while lower levels of deprivation are noticeable in wards located in the core areas (refer Figure 5).
The International Archives of the Photogrammetry, Remote Sensing and Spatial Information Sciences, Volume XLII-4/W8, 2018 FOSS4G 2018 – Academic Track, 29–31 August 2018, Dar es Salaam, Tanzania
This contribution has been peer-reviewed. https://doi.org/10.5194/isprs-archives-XLII-4-W8-85-2018 | © Authors 2018. CC BY 4.0 License.
88

Figure 4. Intensity of poverty (%) in 2001
Figure 5. Intensity of poverty (%) in 2011
Figure 6 and Figure 7 illustrate the mapping of SAMPI (product of headcount by the intensity of poverty) in 2001 and 2011. Overall, poverty was more prevalent in 2001 as compared to 2011. Many of the wards that were stricken by poverty in 2001 became less affected in 2011.
Figure 6. SAMPI in 2001
Figure 7. SAMPI in 2001
4.2 Spatial concentration of poverty in 2001 and 2011
The results of a fine grained analysis of poverty using spatial autocorrelation methods (namely global Moran’s I and LISA) that were used to identify the concentration of poverty and affluence are provided in subsequence sections. Results of global Moran’s I for the headcount, intensity and SAMPI for 2001 and 2011 are provided. The mapping of LISA’s results that include headcount, intensity and SAMPI for 2001 and 2011 are also provided and described. The mapping of LISA’s results produce clusters which are to be interpreted as follows:
• High-High clusters: wards with high values of the mapped measure of poverty (i.e. headcount, intensity and SAMPI) clustered together across space.
• Low-Low clusters: wards with low values of the mapped measure of poverty clustered together across space.
The International Archives of the Photogrammetry, Remote Sensing and Spatial Information Sciences, Volume XLII-4/W8, 2018 FOSS4G 2018 – Academic Track, 29–31 August 2018, Dar es Salaam, Tanzania
This contribution has been peer-reviewed. https://doi.org/10.5194/isprs-archives-XLII-4-W8-85-2018 | © Authors 2018. CC BY 4.0 License.
89

• Low-High clusters: wards with low values of the mapped measure of poverty surrounding a ward with high value of the measure of poverty being mapped.
• High-Low clusters: wards with high values of the mapped measure of poverty surrounding a ward with low value of the measure of poverty being mapped.
It is important to note that the results of the statistical tests for the global Moran’s Indices were all significant with p-value<0.05. The LISA’s statistical test results were also significant at p- values of 0.001, 0.01 or 0.05. In other words, the performed statistical tests rejected the null hypothesis which suggest that the observed clusters (spatial autocorrelation) are occurrences of complete spatial randomness.
The global Moran’s I results with respect to headcount in 2001 and 2011 were 0.42 and 0.26 respectively. These results suggest evidence of an overall spatial clustering (autocorrelation) of poverty headcount across the study area (refer Figure 8 and Figure 9). This is further confirmed by the LISA’s results which also corroborate the description of the mapping in Figure 2 and Figure 3: wards with high rates of poverty headcount are concentrated in the peripheral municipalities of the province while affluent wards are clustered in the core areas. Some wards with higher rates of poverty headcount can also be seen next to wards with lower rates of poverty headcount at the core areas of the province. This signals the existence of poverty juxtaposed with affluence in urban area.
The mapping of concentration of SAMPI (with global Moran’s I of 0.41 in 2001 and of 0.25 in 2011) as illustrated in Figure 12 and Figure 13 also follows the same spatial patterns as the ones observed with poverty headcount.
Figure 9. Cluster map of Headcount (%) in 2011
With respect to the intensity of poverty, in 2001 (refer Figure 10) , the observed global Moran’s I is 0.23 and clusters of wards with lower rates of deprivation can be observed in the central areas of the city of Tshwane, city of city of Johannesburg and in Mogale (Western part of Gauteng). In 2011 (refer Figure 11), an observed low value of global Moran’s I (0.16) for the intensity of poverty signaled a weak occurrence of spatial autocorrelation. Clusters of wards with higher rates of poverty deprivation can be observed in Ekurhuleni (Eastern part of the province). In the core areas of the province (city of Johannesburg and city of Tshwane) wards with higher and lower rates of poverty deprivation can also be observed.
Figure 8. Cluster map of Headcount (%) in 2001
Figure 10. Cluster map of intensity of poverty (%) in 2001
The International Archives of the Photogrammetry, Remote Sensing and Spatial Information Sciences, Volume XLII-4/W8, 2018 FOSS4G 2018 – Academic Track, 29–31 August 2018, Dar es Salaam, Tanzania
This contribution has been peer-reviewed. https://doi.org/10.5194/isprs-archives-XLII-4-W8-85-2018 | © Authors 2018. CC BY 4.0 License.
90
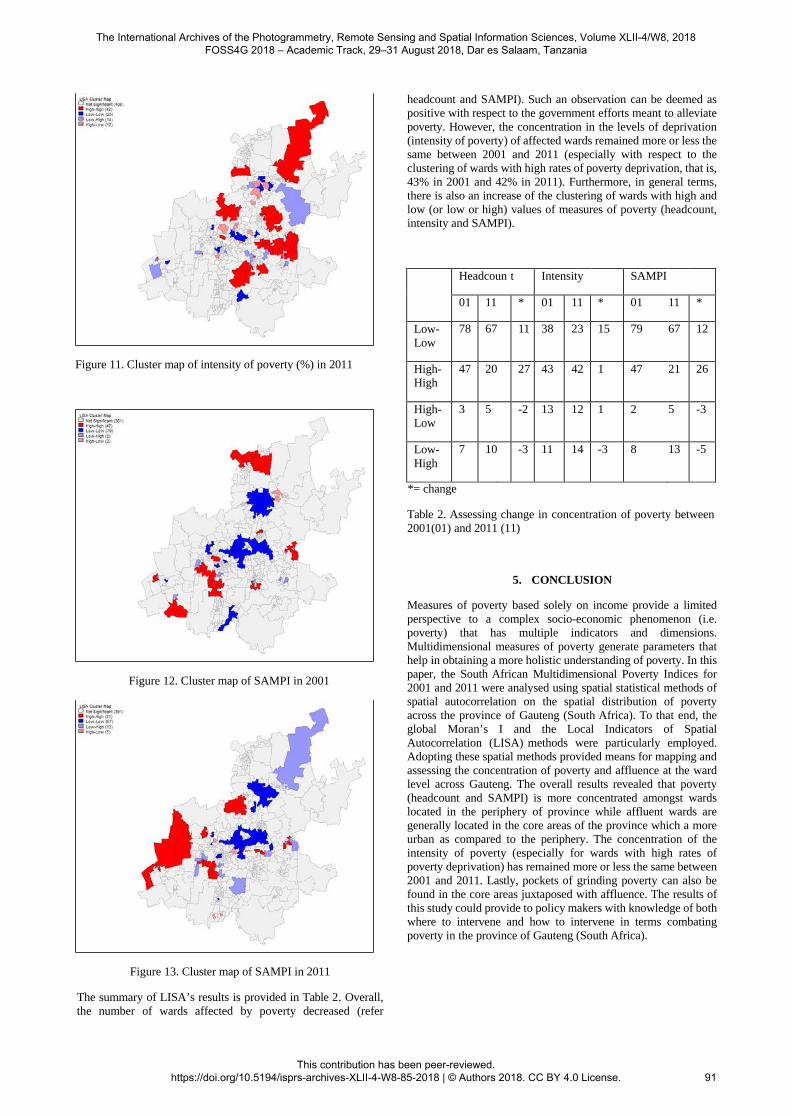
headcount and SAMPI). Such an observation can be deemed as positive with respect to the government efforts meant to alleviate poverty. However, the concentration in the levels of deprivation (intensity of poverty) of affected wards remained more or less the same between 2001 and 2011 (especially with respect to the clustering of wards with high rates of poverty deprivation, that is, 43% in 2001 and 42% in 2011). Furthermore, in general terms, there is also an increase of the clustering of wards with high and low (or low or high) values of measures of poverty (headcount, intensity and SAMPI).
Figure 11. Cluster map of intensity of poverty (%) in 2011
*= change
Table 2. Assessing change in concentration of poverty between 2001(01) and 2011 (11)
5. CONCLUSION
Figure 12. Cluster map of SAMPI in 2001
Measures of poverty based solely on income provide a limited perspective to a complex socio-economic phenomenon (i.e. poverty) that has multiple indicators and dimensions. Multidimensional measures of poverty generate parameters that help in obtaining a more holistic understanding of poverty. In this paper, the South African Multidimensional Poverty Indices for 2001 and 2011 were analysed using spatial statistical methods of spatial autocorrelation on the spatial distribution of poverty across the province of Gauteng (South Africa). To that end, the global Moran’s I and the Local Indicators of Spatial Autocorrelation (LISA) methods were particularly employed. Adopting these spatial methods provided means for mapping and assessing the concentration of poverty and affluence at the ward level across Gauteng. The overall results revealed that poverty (headcount and SAMPI) is more concentrated amongst wards located in the periphery of province while affluent wards are generally located in the core areas of the province which a more urban as compared to the periphery. The concentration of the intensity of poverty (especially for wards with high rates of poverty deprivation) has remained more or less the same between 2001 and 2011. Lastly, pockets of grinding poverty can also be found in the core areas juxtaposed with affluence. The results of this study could provide to policy makers with knowledge of both where to intervene and how to intervene in terms combating poverty in the province of Gauteng (South Africa).
Figure 13. Cluster map of SAMPI in 2011
The summary of LISA’s results is provided in Table 2. Overall, the number of wards affected by poverty decreased (refer
Headcoun t Intensit y SAMPI
01 11 * 01 11 * 01 11 *
Low- Low
78 67 11 38 23 15 79 67 12
High- High
47 20 27 43 42 1 47 21 26
High- Low
3 5 -2 13 12 1 2 5 -3
Low- High
7 10 -3 11 14 -3 8 13 -5
The International Archives of the Photogrammetry, Remote Sensing and Spatial Information Sciences, Volume XLII-4/W8, 2018 FOSS4G 2018 – Academic Track, 29–31 August 2018, Dar es Salaam, Tanzania
This contribution has been peer-reviewed. https://doi.org/10.5194/isprs-archives-XLII-4-W8-85-2018 | © Authors 2018. CC BY 4.0 License.
91

6. REFERENCES
Alkire, S. and Seth, S., 2009. Determining BPL Status: Some Methodological Improvements, Indian Journal of Human Development, 2 (2), pp. 407-24
Alkire, S. and Foster, J., 2011. Understandings and misunderstandings of multidimensional poverty measurement. Oxford Poverty & Human Development Initiative (OPHI), Working Paper No. 43 ISSN 2040-8188; ISBN: 978-1-907194- 27-6
Baud, I., Sridharan, N. and Pfeffer, K., 2008. Mapping Urban Poverty for Local Governance in an Indian Mega-City: The Case of Delhi, Urban Studies, 45(7), pp. 1385–1412
Cliff, D. and Ord, K., 1981. Spatial Processes: Models & Applications. Taylor & Francis.
David, A., Guilbert, N., Hamaguchi, N., Higashi, Y., Hino, H., Leibbrant, M. and Shifa, M., 2018. Spatial poverty and inequality in South Africa: A municipality level analysis, AFD Research Papers Series, No. 2018-66, January
Jargowsky, P., 1996. Take the Money and Run: Economic Segregation in U.S. Metropolitan Areas, American Sociological Review, 61(6), pp. 984-998
Lok-Dessalien, R., 1998. Review of poverty concepts and indicators, Poverty Elimination Programme, UNDP
Massey, D. and Fischer, M., 2000. How segregation concentrates poverty, Ethnic and Racial Studies, 23(4), pp. 670-691
Moran, P., 1948. The Interpretation of Statistical Maps, Journal of the Royal Statistical Society. Series B (Methodological), 10 (2), pp. 243–51
Orford, S., 2004. Identifying and comparing changes in the spatial concentrations of urban poverty and affluence: a case study of inner London, Computers, Environment and Urban Systems, 28(6), pp. 701-717
Rey, S. and Janikas, M., 2008. On the relationship between spatial clustering, inequality, and economic growth in the United States: 1969-2000, Region et Development, 2008, 27, pp. 13-34
Sartorius, K. and Sartorius, B., 2016. Service delivery inequality in South African municipal areas: A new way to account for inter- jurisdictional differences. Urban Studies, 53(15), pp. 3336-3355
StatsSA, 2014. The South African MPI: Creating a multidimensional poverty index using census data. http://beta2.statssa.gov.za/publications/Report-03-10-08/Report- 03-10-082014.pdf (04 October 2017)
StatsSA, 2017. Poverty Trends in South Africa, An examination of absolute poverty between 2006 and 2015. http://www.statssa.gov.za/publications/Report-03-10-06/Report- 03-10-062015.pdf (04 October 2017)
The International Archives of the Photogrammetry, Remote Sensing and Spatial Information Sciences, Volume XLII-4/W8, 2018 FOSS4G 2018 – Academic Track, 29–31 August 2018, Dar es Salaam, Tanzania
This contribution has been peer-reviewed. https://doi.org/10.5194/isprs-archives-XLII-4-W8-85-2018 | © Authors 2018. CC BY 4.0 License.
92