statistical handbook west bengal
314
STATISTICAL HANDBOOK WEST BENGAL 2011 BUREAU OF APPLIED ECONOMICS & STATISTICS GOVERNMENT OF WEST BENGAL
-
Upload
khangminh22 -
Category
Documents
-
view
0 -
download
0
Transcript of statistical handbook west bengal
STATISTICAL HANDBOOK
WEST BENGAL 2011
BUREAU OF APPLIED ECONOMICS & STATISTICS GOVERNMENT OF WEST BENGAL
PREFACE
Statistical Handbook, West Bengal provides information on salient features o f various socio-economic aspects o f the State. The present issue is the fortj-fourth edition in the series. The data furnished in its previous issue have been updated to the extent possible so that continuity in time-series data can be maintained.
I w ould like to thank various State & Central Govt. Departments and organisations for active co-operation received from their end in timely supply of required information.
The officers and staff of the Reference Technical Section of the Bureau also deserve my thanks for their sincere effort in bringing out this pubhcation.
It is hoped that this issue would be useful to planners, pohcy makers and researchers.
Suggestions for improvement o f this pubhcation are most welcome.
Dipankar ChattopadhyayNew Secretariat Director,Buildings, Kolkata, Bureau of Applied Economics & Statistics, 31st December, 2012. Government of West Bengal.
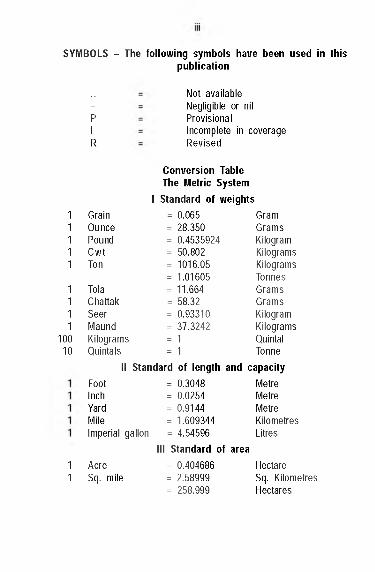
SYMBOLS - The following symbols have been used in this publication
10010
.. Not available- Negligible or nilp Provisional1 Incomplete in coverageR Revised
Conversion TableThe Metric System
1 Standard of weightsGrain = 0.065 GramOunce = 28.350 GramsPound = 0.4535924 KilogramC w t = 50.802 KilogramsTon = 1016.05 Kilograms
= 1.01605 TonnesTola = 11.664 GramsChattak = 58.32 GramsSeer = 0.93310 KilogramMaund = 37.3242 KilogramsKilograms = 1 QuintalQuintals = 1 Tonne
II Standard of length and capacityFoot = 0.3048 MetreInch = 0.0254 MetreYard = 0.9144 MetreMile = 1.609344 KilometresImperial gallon = 4.54596 Litres
1 Acre 1 Sq. mile
III Standard of area= 0.404686 = 2.58999 = 258.999
HectareSq. Kilometres Hectares
GramG ra mK ilo g ra mK ilo g ra mK ilo g ra mT o n n eG ra mG ra mK ilo g ra mK ilo g ra m
I V
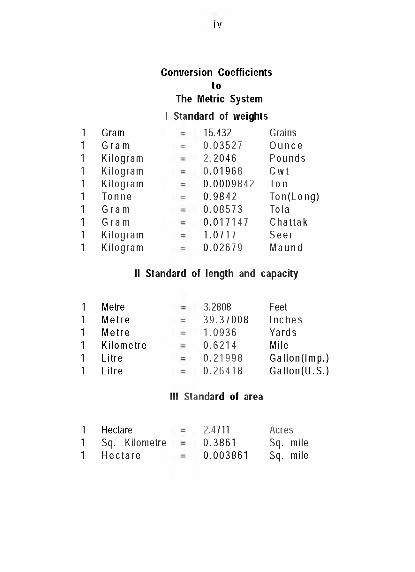
Conversion Coefficients to
The Metric SystemI Standard of weights
15.4320 .0 3 5 2 72 .2 0 4 60 .0 1 9 6 80 .0 0 0 9 8 4 20 .9 8 4 20 .0 8 5 7 30 .0 1 7 1 4 71 .0 7 1 70 .0 2 6 7 9
GrainsO u n c eP o u n d sC w tTonT o n (L o n g )To laC h a tta kS e e rM a u n d
II Standard of length and capacity
MetreM e treM e treK ilo m e treL itreL itre
3.28083 9 .3 7 0 0 81 .0 9 3 60 .6 2 1 40 .2 1 9 9 80 .2 6 4 1 8
FeetIn c h e sY ardsM ileG a llo n ( lm p .)G a llo n (U .S .)
Ill Standard of area
1 Hectare 1 Sq. K ilom etre 1 H e c ta re
2.47110 .386 10 .0 0 3 8 6 1
Acres Sq. mile Sq. mile
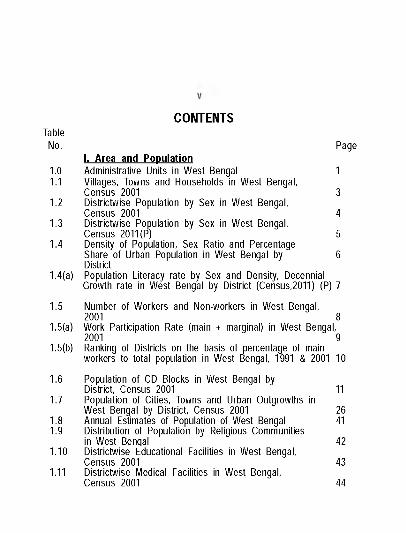
CONTENTS
No. PageI. Area and Population
1.0 Administrative Units in West Bengal 11.1 Villages, Towns and Households in West Bengal,
Census 2001 31.2 Districtwise Population by Sex in West Bengal,
Census 2001 41.3 Districtwise Population by Sex in West Bengal,
Census 2011 (P) 51.4 Density of Population, Sex Ratio and Percentage
Share of Urban Population in West Bengal by 6District
1.4(a) Population Literacy rate by Sex and Density, DecennialGrowth rate in West Bengal by District (Census,2011) (P) 7
1.5 Number of Workers and Non-workers in West Bengal,2001 8
1.5(a) Work Participation Rate (main + marginal) in West Bengal,2001 9
1.5(b) Ranking of Districts on the basis of percentage of mainworkers to total population in West Bengal, 1991 & 2001 10
1.6 Population of CD Blocks in West Bengal byDistrict, Census 2001 11
1.7 Population of Cities, Towns and Urban Outgrowths in West Bengal by District, Census 2001 26
1.8 Annual Estimates of Population of West Bengal 411.9 Distribution of Population by Religious Communities
in West Bengal 421.10 Districtwise Educational Facilities in West Bengal,
Census 2001 431.11 Districtwise Medical Facilities in West Bengal,
Census 2001 44
Table
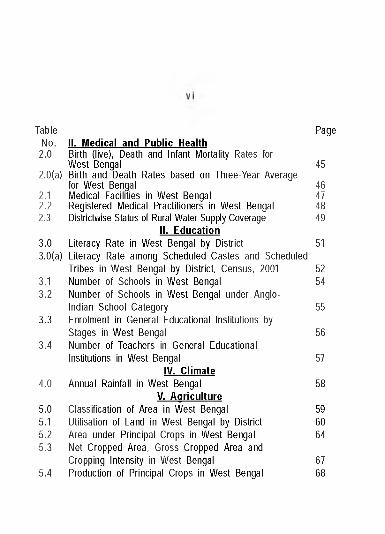
Table PageNo. II. Medical and Public Health
2.0 Birth (live), Death and Infant Mortality Rates forWest Bengal 45
2.0(a) Birth and Death Rates based on Three-Year Averagefor West Bengal 46
2.1 Medical Facilities in West Bengal 472.2 Registered Medical Practitioners in West Bengal 482.3 Districtwise Status of Rural Water Supply Coverage 49
II. Education3.0 Literacy Rate in West Bengal by District 51 3.0(a) Literacy Rate among Scheduled Castes and Scheduled
Tribes in West Bengal by District, Census, 2001 523.1 Number of Schools in West Bengal 543.2 Number of Schools in West Bengal under Anglo-
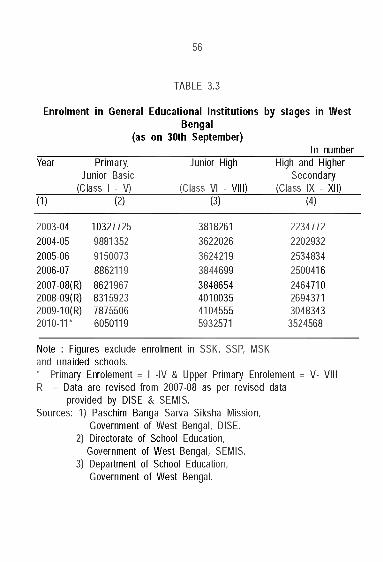
Indian School Category 553.3 Enrolment in General Educational Institutions by
Stages in West Bengal 563.4 Number of Teachers in General Educational
Institutions in West Bengal 57IV. Clim ate
4.0 Annual Rainfall in West Bengal 58V. Agriculture
5.0 Classification of Area in West Bengal 595.1 Utilisation of Land in West Bengal by District 605.2 Area under Principal Crops in West Bengal 645.3 Net Cropped Area, Gross Cropped Area and
Cropping Intensity in West Bengal 675.4 Production of Principal Crops in West Bengal 68
No. Page
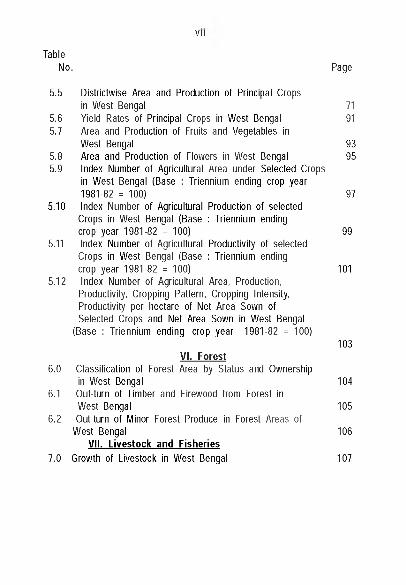
5.5 Districtwise Area and Production of Principal Cropsin West Bengal 71
5.6 Yield Rates of Principal Crops in West Bengal 915.7 Area and Production of Fruits and Vegetables in
West Bengal 935.8 Area and Production of Flowers in West Bengal 955.9 Index Number of Agricultural Area under Selected Crops
in West Bengal (Base : Triennium ending crop year1981-82 = 100) 97
5.10 Index Number of Agricultural Production of selected Crops in West Bengal (Base : Triennium endingcrop year 1981-82 = 100) 99
5.11 Index Number of Agricultural Productivity of selected Crops in West Bengal (Base : Triennium endingcrop year 1981-82 = 100) 101
5.12 Index Number of Agricultural Area, Production,Productivity, Cropping Pattern, Cropping Intensity Productivity per hectare of Net Area Sown of Selected Crops and Net Area Sown in West Bengal
(Base : Triennium ending crop year 1981-82 = 100)103
VI. Forest6.0 Classification of Forest Area by Status and Ownership
in West Bengal 1046.1 Out-turn of Timber and Firewood from Forest in
West Bengal 1056.2 Out-turn of Minor Forest Produce in Forest Areas of
West Bengal 106VII. Livestock and Fisheries
7.0 Growth of Livestock in West Bengal 107
V I I
Table
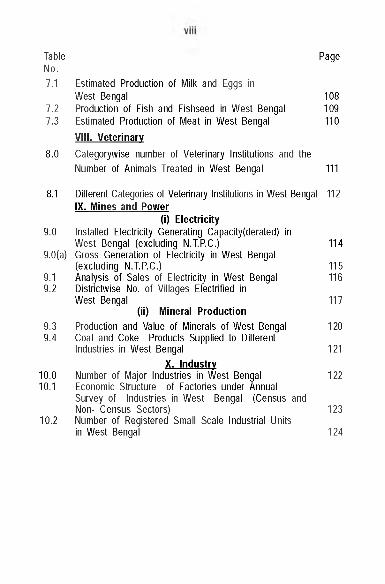
7.1 Estimated Production of IViill< and Eggs inWest Bengal 108
7.2 Production of Fish and Fishseed in West Bengal 1097.3 Estimated Production of Meat in West Bengal 110
VIII. Veterinary8.0 Categorywise number of Veterinary Institutions and the
Number of Animals Treated in West Bengal 111
8.1 Different Categories of Veterinary Institutions in West Bengal 112IX. Mines and Power
(i) Electricity9.0 Installed Electricity Generating Capacity(derated) in
West Bengal (excluding N .TPC .) 1149.0(a) Gross Generation of Electricity in West Bengal
(excluding N .T P C .) 1159.1 Analysis of Sales of Electricity in West Bengal 1169.2 Districtwise No. of Villages Electrified in
West Bengal 117(ii) Mineral Production
9.3 Production and Value of Minerals of West Bengal 1209.4 Coal and Coke Products Supplied to Different
Industries in West Bengal 121X. Industry
10.0 Number of Major Industries in West Bengal 12210.1 Economic Structure of Factories under Annual
Survey of Industries in West Bengal (Census andNon- Census Sectors) 123
10.2 Number of Registered Small Scale Industrial Unitsin West Bengal 124
Table PageNo.
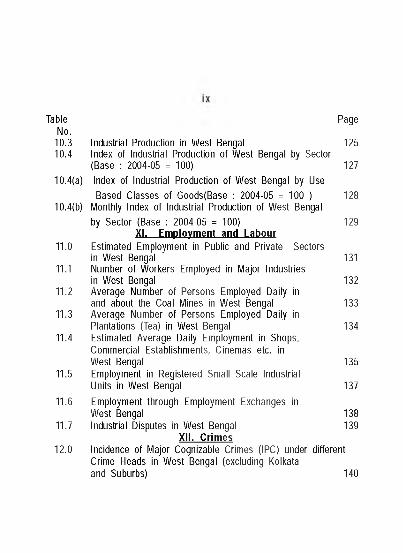
10.3 Industrial Production in West Bengal 12510.4 Index of Industrial Production of West Bengal by Sector
(Base : 2004-05 = 100) 12710.4(a) Index of Industrial Production of West Bengal by Use
Based Classes of Goods(Base : 2004-05 = 100 ) 128 10.4(b) Monthly Index of Industrial Production of West Bengal
by Sector (Base : 2004-05 = 100) 129XI. Employm ent and Labour
11.0 Estimated Employment in Public and Private Sectorsin West Bengal 131
11.1 Number of Workers Employed in Major Industriesin West Bengal 132
11.2 Average Number of Persons Employed Daily inand about the Coal Mines in West Bengal 133
11.3 Average Number of Persons Employed Daily in Plantations (Tea) in West Bengal 134
11.4 Estimated Average Daily Employment in Shops,Commercial Establishments, Cinemas etc. inWest Bengal 135
11.5 Employment in Registered Small Scale IndustrialUnits in West Bengal 137
11.6 Employment through Employment Exchanges inWest Bengal 138
11.7 Industrial Disputes in West Bengal 139XII. Crimes
12.0 Incidence of Major Cognizable Crimes (IPC) under different Crime Heads in West Bengal (excluding Kolkata and Suburbs) 140
Table PageNo.
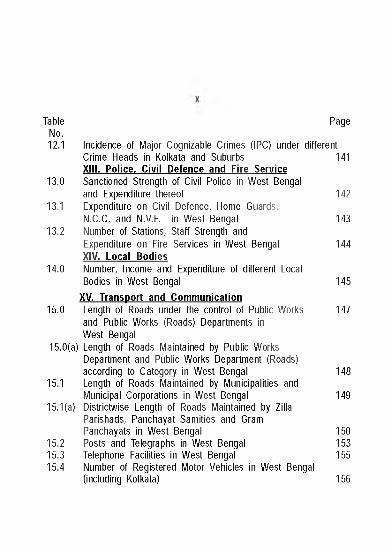
12.1 Incidence of Major Cognizable Crimes (IPC) under differentCrime Heads in Kolkata and Suburbs 141XIII. Police. Civil Defence and Fire Service
13.0 Sanctioned Strength of Civil Police in West Bengaland Expenditure thereof 142
13.1 Expenditure on Civil Defence, Home Guards,N.C.C. and N.V.F. in West Bengal 143
13.2 Number of Stations, Staff Strength andExpenditure on Fire Services in West Bengal 144XIV. Local Bodies
14.0 Number, Income and Expenditure of different LocalBodies in West Bengal 145
XV. Transport and Communication15.0 Length of Roads under the control of Public Works 147
and Public Works (Roads) Departments inWest Bengal
15.0(a) Length of Roads Maintained by Public WorksDepartment and Public Works Department (Roads) according to Category in West Bengal 148
15.1 Length of Roads Maintained by Municipalities and Municipal Corporations in West Bengal 149
15.1(a) Districtwise Length of Roads Maintained by Zilla Parishads, Panchayat Samities and Gram Panchayats in West Bengal 150
15.2 Posts and Telegraphs in West Bengal 15315.3 Telephone Facilities in West Bengal 15515.4 Number of Registered Motor Vehicles in West Bengal
(including Kolkata) 156
Table PageNo.
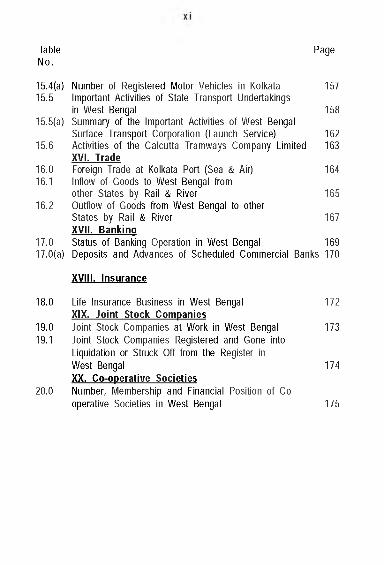
15.4(a) Number of Registered Motor Vehicles in Kolkata 15715.5 Important Activities of State Transport Undertakings
in West Bengal 15815.5(a) Summary of the Important Activities of West Bengal
Surface Transport Corporation (Launch Service) 16215.6 Activities of the Calcutta Tramways Company Limited 163
XVI. Trade16.0 Foreign Trade at Kolkata Port (Sea & Air) 16416.1 Inflow of Goods to West Bengal from
other States by Rail & River 16516.2 Outflow of Goods from West Bengal to other
States by Rail & River 167XVII. Banking
17.0 Status of Banking Operation in West Bengal 169 17.0(a) Deposits and Advances of Scheduled Commercial Banks 170
XVIII. Insurance
18.0 Life Insurance Business in West Bengal 172XIX. Joint Stock Companies
19.0 Joint Stock Companies at Work in West Bengal 17319.1 Joint Stock Companies Registered and Gone into
Liquidation or Struck Off from the Register inWest Bengal 174XX. Co operative Societies
20.0 Number, Membership and Financial Position of Cooperative Societies in West Bengal 175
Table PageNo.
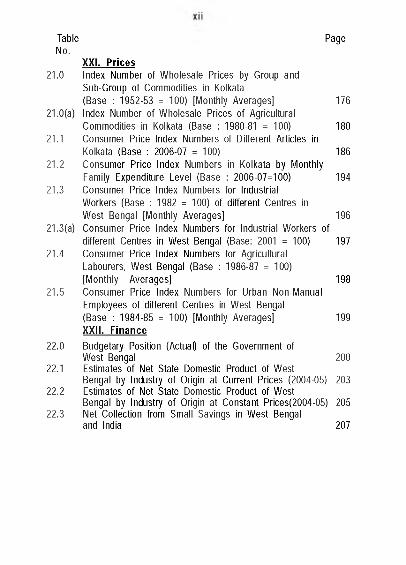
XXI. Prices21.0 Index Number of Wholesale Prices by Group and
Sub-Group of Commodities in Kolkata(Base : 1952-53 = 100) [Monthly Averages] 176
21.0(a) Index Number of Wholesale Prices of AgriculturalCommodities in Kolkata (Base : 1980-81 = 100) 180
21.1 Consumer Price Index Numbers of Different Articles in Kolkata (Base : 2006-07 = 100) 186
21.2 Consumer Price Index Numbers in Kolkata by Monthly Family Expenditure Level (Base : 2006-07=100) 194
21.3 Consumer Price Index Numbers for Industrial Workers (Base : 1982 = 100) of different Centres inWest Bengal [Monthly Averages] 196
21.3(a) Consumer Price Index Numbers for Industrial Workers ofdifferent Centres in West Bengal (Base: 2001 = 100) 197
21.4 Consumer Price Index Numbers for Agricultural Labourers, West Bengal (Base : 1986-87 = 100)[Monthly Averages] 198
21.5 Consumer Price Index Numbers for Urban Non-Manual Employees of different Centres in West Bengal(Base : 1984-85 = 100) [Monthly Averages] 199XXII. Finance
22.0 Budgetary Position (Actual) of the Government ofWest Bengal 200
22.1 Estimates of Net State Domestic Product of WestBengal by Industry of Origin at Current Prices (2004-05) 203
22.2 Estimates of Net State Domestic Product of WestBengal by Industry of Origin at Constant Prices(2004-05) 205
22.3 Net Collection from Small Savings in West Bengaland India 207
Table PageNo.
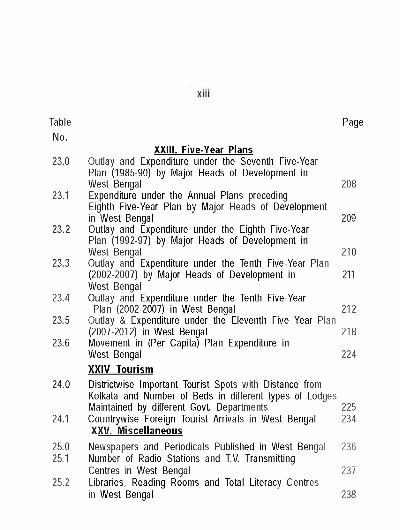
No.XXIII. Five-Year Plans
23.0 Outlay and Expenditure under the Seventh Five-Year Plan (1985-90) by Major Heads of Development inWest Bengal 208
23.1 Expenditure under the Annual Plans precedingEighth Five-Year Plan by Major Fleads of Development in West Bengal 209
23.2 Outlay and Expenditure under the Eighth Five-Year Plan (1992-97) by Major Fleads of Development inWest Bengal 210
23.3 Outlay and Expenditure under the Tenth Five-Year Plan (2002-2007) by Major Fleads of Development in 211 West Bengal
23.4 Outlay and Expenditure under the Tenth Five-YearPlan (2002-2007) in West Bengal 212
23.5 Outlay & Expenditure under the Eleventh Five Year Plan (2007-2012) in West Bengal 218
23.6 Movement in (Per Capita) Plan Expenditure inWest Bengal 224XXIV Tourism
24.0 Districtwise Important Tourist Spots with Distance from Kolkata and Number of Beds in different types of Lodges Maintained by different Govt. Departments 225
24.1 Countrywise Foreign Tourist Arrivals in West Bengal 234XXV. Miscellaneous
25.0 Newspapers and Periodicals Published in West Bengal 23625.1 Number of Radio Stations and TV. Transmitting
Centres in West Bengal 23725.2 Libraries, Reading Rooms and Total Literacy Centres
in West Bengal 238
Table Page
APPENDICES
X I V
Table PageNo.
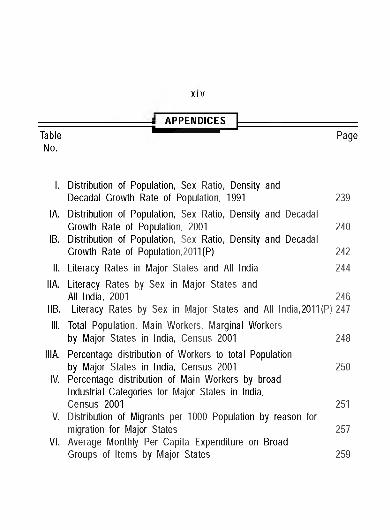
I. Distribution of Population, Sex Ratio, Density andDecadal Growth Rate of Population, 1991 239
IA. Distribution of Population, Sex Ratio, Density and Decadal Growth Rate of Population, 2001 240
IB. Distribution of Population, Sex Ratio, Density and Decadal Growth Rate of Population,2011(P) 242
II. Literacy Rates in Major States and All India 244IIA. Literacy Rates by Sex in Major States and
All India, 2001 246IIB. Literacy Rates by Sex in Major States and All lndia,2011(P) 247III. Total Population, Main Workers, Marginal Workers
by Major States in India, Census 2001 248IIIA. Percentage distribution of Workers to total Population
by Major States in India, Census 2001 250IV. Percentage distribution of Main Workers by broad
Industrial Categories for Major States in India,Census 2001 251
V. Distribution of Migrants per 1000 Population by reason for migration for Major States 257
VI. Average Monthly Per Capita Expenditure on BroadGroups of Items by Major States 259
APPENDICES
Table PageNo.
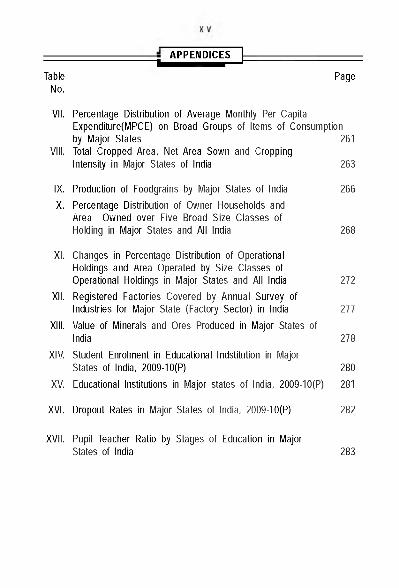
VII. Percentage Distribution of Average Monthly Per Capita Expenditure(MPCE) on Broad Groups of Items of Consumption by Major States 261
VIII. Total Cropped Area, Net Area Sown and CroppingIntensity in Major States of India 263
IX. Production of Foodgrains by Major States of India 266X. Percentage Distribution of Owner Households and
Area Owned over Five Broad Size Classes ofFlolding in Major States and All India 268
XI. Changes in Percentage Distribution of Operational Floldings and Area Operated by Size Classes ofOperational Floldings in Major States and All India 272
XII. Registered Factories Covered by Annual Survey of Industries for Major State (Factory Sector) in India 277
XIII. Value of Minerals and Ores Produced in Major States ofIndia 278
XIV Student Enrolment in Educational Indstitution in MajorStates of India, 2009-10(P) 280
XV Educational Institutions in Major states of India, 2009-10(P) 281
XVI. Dropout Rates in Major States of India, 2009-10(P) 282
XVII. Pupil Teacher Ratio by Stages of Education in MajorStates of India 283
APPENDICES
Table PageNo.
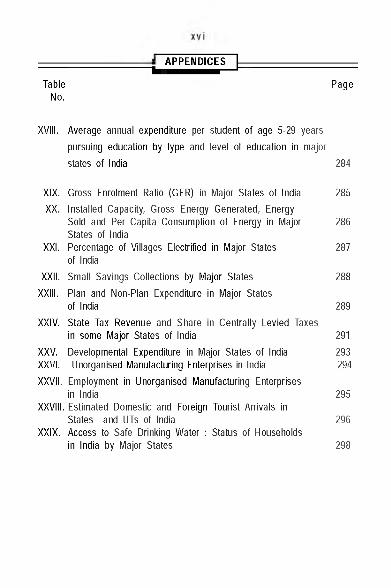
XVIII. Average annual expenditure per student of age 5-29 years pursuing education by type and level of education in major states of India 284
XIX. Gross Enrolment Ratio (GER) in Major States of India 285XX. Installed Capacity, Gross Energy Generated, Energy
Sold and Per Capita Consumption of Energy in Major 286 States of India
XXI. Percentage of Villages Electrified in Major States 287 of India
XXII. Small Savings Collections by Major States 288XXIII. Plan and Non-Plan Expenditure in Major States
of India 289XXIV. State Tax Revenue and Share in Centrally Levied Taxes
in some Major States of India 291XXV. Developmental Expenditure in Major States of India 293XXVI. Unorganised Manufacturing Enterprises in India 294XXVII. Employment in Unorganised Manufacturing Enterprises
in India 295XXVIII. Estimated Domestic and Foreign Tourist Arrivals in
States and UTs of India 296XXIX. Access to Safe Drinking Water : Status of Households
in India by Major States 298
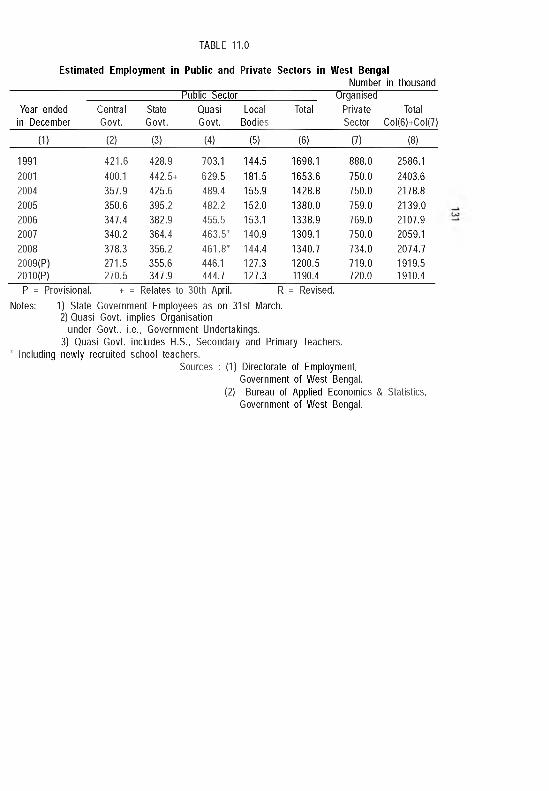
TABLE 11.0
Estimated Employment in Public and Private Sectors in West BengalNumber in thousand
Public Sector OrganisedYear ended Central State Quasi Local Total Private Total
in December Govt. Govt. Govt. Bodies Sector Col(6)+Col(7)
(1) (2) (3) (4) (5) (6) (7) (8)
1991 421.6 428.9 703.1 144.5 1698.1 888.0 2586.12001 400.1 442.5+ 629.5 181.5 1653.6 750.0 2403.62004 357.9 425.6 489.4 155.9 1428.8 750.0 2178.82005 350.6 395.2 482.2 152.0 1380.0 759.0 2139.02006 347.4 382.9 455.5 153.1 1338.9 769.0 2107.92007 340.2 364.4 463.5 ’ 140.9 1309.1 750.0 2059.12008 378.3 356.2 461.8 ’ 144.4 1340.7 734.0 2074.72009(P) 271.5 355.6 446.1 127.3 1200.5 719.0 1919.52010(P) 270.5 347.9 444.7 127.3 1190.4 720.0 1910.4
P = Provisional. + = Relates to 30th April. R = Revised.Notes: 1) State Government Employees as on 31st March.
2) Quasi Govt, implies Organisationunder Govt., i.e., Government Undertakings.
3) Quasi Govt, includes H.S., Secondary and Primary Teachers.• Including newly recruited school teachers.
Sources : (1) Directorate of Employment,Government of West Bengal.
(2) Bureau of Applied Economics & Statistics, Government of West Bengal.
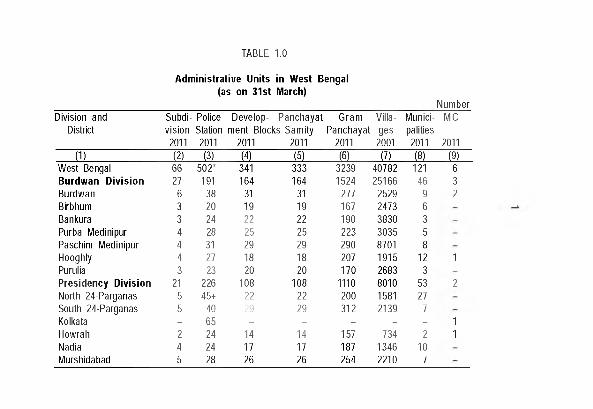
TABLE 1.0
Adm inistrative Units in West Bengal (as on 31st March)
NumberDivision and
DistrictSubdi- Police Develop- Panchayat Gram Villa- Munici- MC vision Station ment Blocks Samity Panchayat ges palities
2011 2011 2011 2011 2011 2001 2011 2011J I L J2)__ (3L JIL M . M . m _____ (8)_____(9 L
West Bengal 66 502’ 341 333 3239 40782 121 6Burdwan D ivision 27 191 164 164 1524 25166 46 3Burdwan 6 38 31 31 277 2529 9 2Birbhum 3 20 19 19 167 2473 6Bankura 3 24 22 22 190 3830 3Purba Medinipur 4 28 25 25 223 3035 5Paschim Medinipur 4 31 29 29 290 8701 8Hooghly 4 27 18 18 207 1915 12 1Purulia 3 23 20 20 170 2683 3Presidency Division 21 226 108 108 1110 8010 53 2North 24-Parganas 5 45+ 22 22 200 1581 27South 24-Parganas 5 40 29 29 312 2139 7Kolkata - 65 - - - - - 1Howrah 2 24 14 14 157 734 2 1Nadia 4 24 17 17 187 1346 10Murshidabad 5 28 26 26 254 2210 7
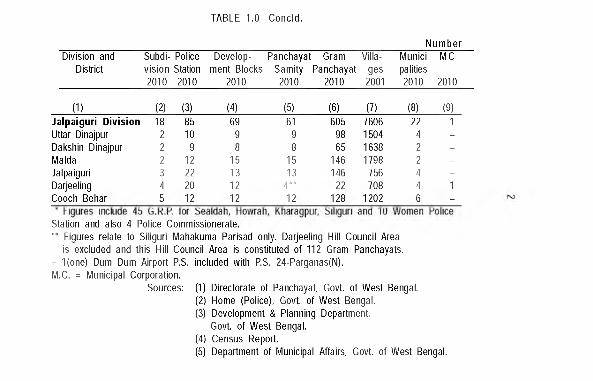
TABLE 1.0 -Concld.
N um berDivision and
DistrictSubdi- Police v ision Station 2010 2010
Development Blocks
2010
PanchayatSamity
2010
GramPanchayat
2010
Villages2001
Municipalities2010
MC
2010
(1) (2) (3) (4) (5) (6) (7) (8) (9)Jalpaiguri Division 18 85 69 61 605 7606 22 1Uttar Dinajpur 2 10 9 9 98 1504 4 -
Dakshin Dinajpur 2 9 8 8 65 1638 2 -
Malda 2 12 15 15 146 1798 2 -
Jalpaiguri 3 22 13 13 146 756 4 -
Darjeeling 4 20 12 4 „ 22 708 4 1Cooch Behar 5 12 12 12 128 1202 6 -
Station and also 4 Police Commissionerate.•• Figures relate to Siliguri Mahakuma Parisad only. Darjeeling Hill Council Area
is excluded and this Hill Council Area is constituted of 112 Gram Panchayats.+ 1(one) Dum Dum Airport PS. included with PS. 24-Parganas(N).M.C. = Municipal Corporation.
Sources: (1) Directorate of Panchayat, Govt, of West Bengal.(2) Home (Police), Govt, of West Bengal.(3) Development & Planning Department,
Govt, of West Bengal.(4) Census Report.(5) Department of Municipal Affairs, Govt, of West Bengal.
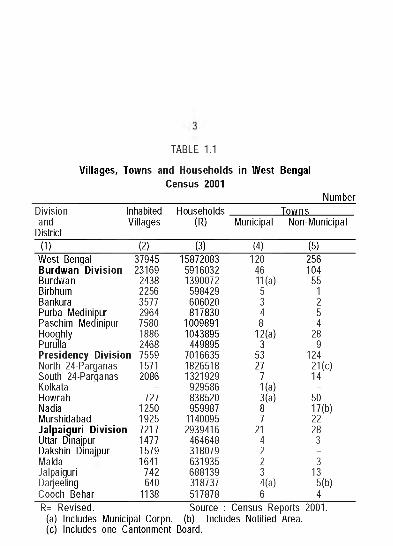
TABLE 1.1
Villages, Towns and Households in West Bengal Census 2001
NumberDivision Inhabited Households Townsand
DistrictVillages (R) Municipal Non-Municipal
(1) (2) (3) (4) (5)West Bengal 37945 15872083 120 256Burdwan Division 23169 5916032 46 104Burdwan 2438 1390072 11(a) 55Birbhum 2256 598429 5 1Bankura 3577 606020 3 2Purba Medini )ur 2964 817830 4 5Paschim Mec inipur 7580 1009891 8 4Hooghly 1886 1043895 12(a) 28Puru la 2468 449895 3 9Presidency Division 7559 7016635 53 124North 24-Parganas 1571 1826518 27 21(c)South 24-Parganas 2086 1321929 7 14Kolkata - 929586 1(a) -
Howrah 727 838520 3(a) 50Nadia 1250 959987 8 17(b)Murshidabad 1925 1140095 7 22Jalpaiguri Division 7217 2939416 21 28Uttar Dinaj pur 1477 464648 4 3Dakshin D naipur 1579 318079 2 -
Malda 1641 631935 2 3JalpaiguriDarjeeling
742640
688139318737
34(a)
135(b)
Cooch Behar 1138 517878 6 4R= Revised. Source : Census Reports 2001.
(a) Includes Municipal Corpn. (b) Includes Notified Area.(c) Includes one Cantonment Board.
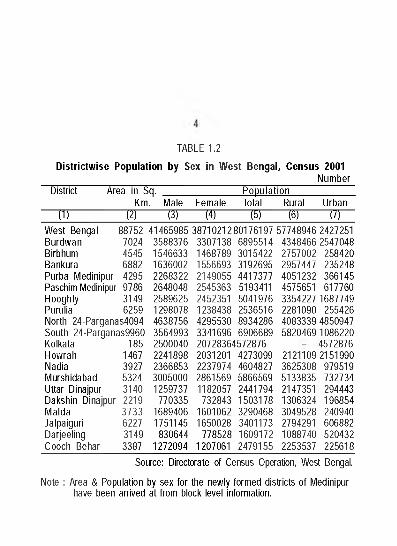
TABLE 1.2
Districtwise Population by Sex in West Bengal, Census 2001Number
District Area in Sq. Population
■ w 121Km. iViale Female
W ■ wTotal- w
Rural1 5 T
Urban~ U J ~
West Bengal 88752 41465985Burdwan 7024 3588376Birbhum 4545 1546633Bankura 6882 1636002Purba Medinipur 4295 2268322Paschim Medinipur 9786 2648048Hooghly 3149 2589625Purulia 6259 1298078North 24-Parganas4094 4638756South 24-Parganas9960 3564993Kolkata 185 2500040Howrah 1467 2241898Nadia 3927 2366853Murshidabad 5324 3005000Uttar Dinajpur 3140 1259737Dakshin Dinajpur 2219 770335Malda 3733 1689406Jalpaiguri 6227 1751145Darjeeling 3149 830644Cooch Behar 3387 1272094
38710212801761973307138 68955141468789 30154221556693 31926952149055 44173772545363 51934112452351 50419761238438 25365164295530 89342863341696 6906689 207283645728762031201 42730992237974 46048272861569 58665691182057 2441794732843 1503178
1601062 32904681650028 3401173
778528 16091721207061 2479155
57748946434846627570022957447405123245756513354227228109040833395820469
212110936253085133835214735113063243049528279429110887402253537
24272512547048
258420235248366145617760
1687749255426
4850947108622045728762151990979519732734294443196854240940606882520432225618
Source: Directorate of Census Operation, West Bengal.
Note : Area & Population by sex for the newly formed districts of Medinipur have been arrived at from block level information.
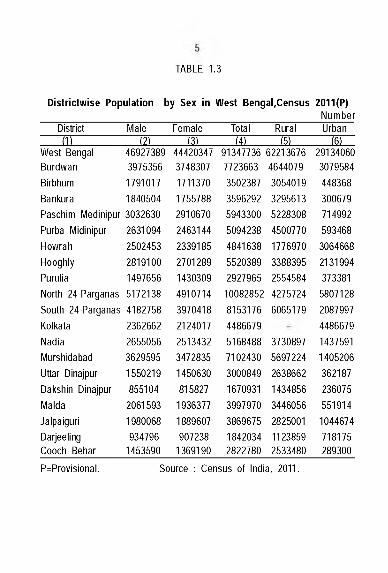
TABLE 1.3
Districtwise Population by Sex in West Bengal.Census 2011(P)Num ber
District3E IVIale Female (2) (3 ) :
TotalH E
RuralJ K
Urban3 6 E
West Bengal Burdwan Birbhum BankuraPaschim Medinipur Purba Midinipur Howrah Hooghly PuruliaNorth 24-Parganas South 24-Parganas Kolkata NadiaMurshidabad Uttar Dinajpur Dakshin Dinajpur Malda Jalpaiguri Darjeeling Cooch Behar
46927389 44420347 91347736 622136763975356 3748307 7723663 46440791791017 1711370 3502387 30540191840504 1755788 3596292 32956133032630 2910670 5943300 52283082631094 2463144 5094238 45007702502453 2339185 4841638 17769702819100 2701289 5520389 33883951497656 1430309 2927965 25545845172138 4910714 10082852 42757244182758 3970418 8153176 60651792362662 2124017 44866792655056 2513432 5168488 37308973629595 3472835 7102430 56972241550219 1450630 3000849 2638662855104 815827 1670931 1434856
2061593 1936377 3997970 34460561980068 1889607 3869675 2825001934796 907238 1842034 1123859
1453590 1369190 2822780 2533480
29134060307958444836830067971499259346830646682131994373381
580712820879974486679143759114052063621872360755519141044674718175289300
P=Provisional. Source : Census of India, 2011.
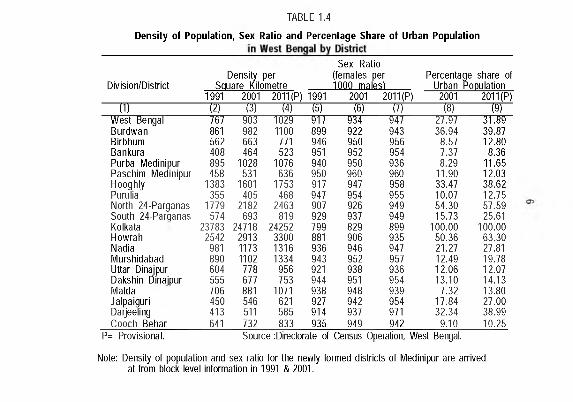
TABLE 1.4
Density of Population, Sex Ratio and Percentage Share of Urban Population
Division/DistrictDensity per
Sauare Kilometre
Sex Ratio (females per 1000 males)
Percental Urban 1
je share of PoDulation
1991 2001 2011(P) 1991 2001 2011(P) 2001 2011(P)(1) & (3) (4) (b) (S) (7) («) (9)
West Bengal 767 903 1029 91/ 934 947 27.97 31.89Burdwan 861 982 1100 899 922 943 36.94 39.87Birbhum 562 663 771 946 950 956 8.57 12.80Bankura 408 464 523 951 952 954 7.37 8.36Purba Medini )ur 895 1028 1076 940 950 936 8.29 11.65Paschim Mec inipur 458 531 636 950 960 960 11.90 12.03Hooghly 1383 1601 1753 917 947 958 33.47 38.62Purulia 355 405 468 947 954 955 10.07 12.75North 24-Parganas 1779 2182 2463 907 926 949 54.30 57.59South 24-Parqanas 574 693 819 929 937 949 15.73 25.61Kolkata 23783 24718 24252 799 829 899 100.00 100.00Howrah 2542 2913 3300 881 906 935 50.36 63.30Nadia 981 1173 1316 936 946 947 21.27 27.81Murshidabad 890 1102 1334 943 952 957 12.49 19.78Uttar Dinajpur 604 778 956 921 938 936 12.06 12.07Dakshin Dinaipur 555 677 753 944 951 954 13.10 14.13Malda 706 881 1071 938 948 939 7.32 13.80Jalpaiguri 450 546 621 927 942 954 17.84 27.00Darjeeling 413 511 585 914 937 971 32.34 38.99Cooch Behar 641 732 833 935 949 942 9.10 10.25
P= Provisional. Source :Directorate of Census Operation, West Bengal.
Note: Density of population and sex ratio for the newly formed districts of Medinipur are arrived at from block level information in 1991 & 2001.
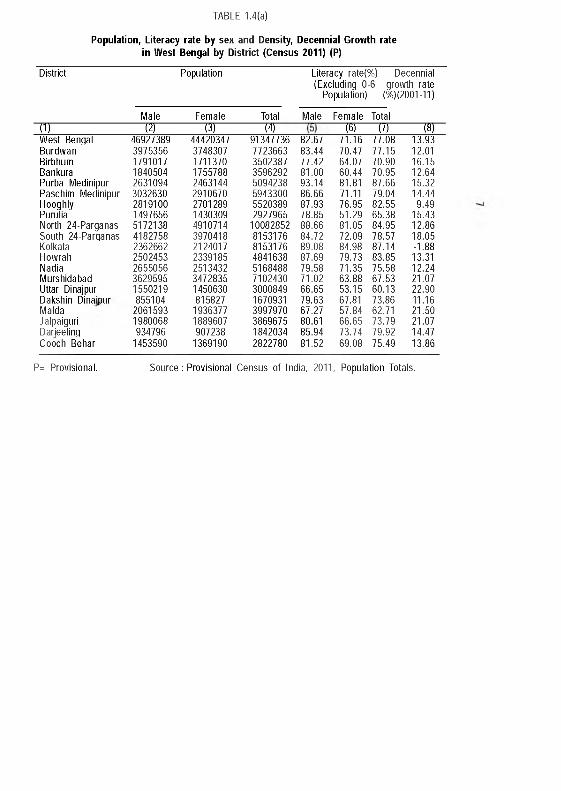
TABLE 1.4(a)
Population, Literacy rate by sex and Density, Decennial Growth rate in West Bengal by District (Census 2011) (P)
District Population Literacy rate(%) D( (Excluding 0-6 grow
Population) (%)(2
;cennial ^th rate 1001-11)
Male Female Total Male Female Total(1) (^) (3) (4) (S) [I] («)West Bengal 46927389 44420347 91347736 82.67 71.16 77.08 13.93Burdwan 3975356 3748307 7723663 83.44 70.47 77.15 12.01Birbhum 1791017 1711370 3502387 77.42 64.07 70.90 16.15Bankura 1840504 1755788 3596292 81.00 60.44 70.95 12.64Purba Medini )ur 2631094 2463144 5094238 93.14 81.81 87.66 15.32Paschim Mec inipur 3032630 2910670 5943300 86.66 71.11 79.04 14.44Hooghly 2819100 2701289 5520389 87.93 76.95 82.55 9.49Purulia 1497656 1430309 2927965 78.85 51.29 65.38 15.43North 24-Parganas 5172138 4910714 10082852 88.66 81.05 84.95 12.86South 24-Parganas 4182758 3970418 8153176 84.72 72.09 78.57 18.05Kolkata 2362662 2124017 8153176 89.08 84.98 87.14 -1.88Howrah 2502453 2339185 4841638 87.69 79.73 83.85 13.31Nadia 2655056 2513432 5168488 79.58 71.35 75.58 12.24Murshidabad 3629595 3472835 7102430 71.02 63.88 67.53 21.07Uttar Dinaj pur 1550219 1450630 3000849 66.65 53.15 60.13 22.90Dakshin D naipur 855104 815827 1670931 79.63 67.81 73.86 11.16Malda 2061593 1936377 3997970 67.27 57.84 62.71 21.50Jalpaiguri 1980068 1889607 3869675 80.61 66.65 73.79 21.07Darieeling 934796 907238 1842034 85.94 73.74 79.92 14.47Cooch Behar 1453590 1369190 2822780 81.52 69.08 75.49 13.86
P= Provisional. S ou rce : Provisional Census of India, 2011, Population Totals.
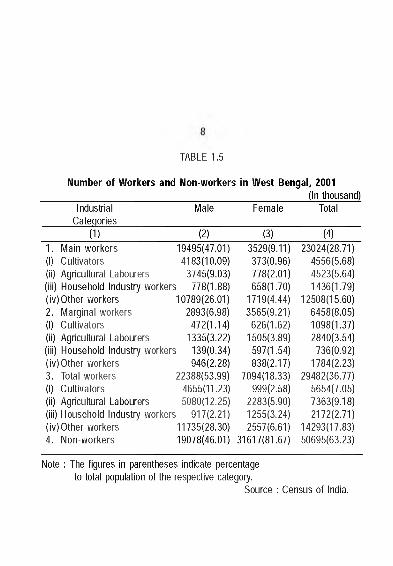
Number of Workers and Non-workers in West Bengal, 2001(In thousand)
TABLE 1.5
IndustrialCategories
Male Female Total
(1) (2) (3) (4)1. Main workers 19495(47.01) 3529(9.11) 23024(28.71) (I) Cultivators 4183(10.09) 373(0.96) 4556(5.68) (ii) Agricultural Labourers 3745(9.03) 778(2.01) 4523(5.64) (ill) Household Industry workers 778(1.88) 658(1.70) 1436(1.79) (iv)O ther workers 10789(26.01) 1719(4.44) 12508(15.60)2. Marginal workers 2893(6.98) 3565(9.21) 6458(8.05) (I) Cultivators 472(1.14) 626(1.62) 1098(1.37) (ii) Agricultural Labourers 1335(3.22) 1505(3.89) 2840(3.54) (ill) Household Industry workers 139(0.34) 597(1.54) 736(0.92) (iv)O ther workers 946(2.28) 838(2.17) 1784(2.23)3. Total workers 22388(53.99) 7094(18.33) 29482(36.77) (I) Cultivators 4655(11.23) 999(2.58) 5654(7.05)(ii) Agricultural Labourers 5080(12.25) 2283(5.90) 7363(9.18) (ill) Household Industry workers 917(2.21) 1255(3.24) 2172(2.71) (iv)O ther workers 11735(28.30) 2557(6.61) 14293(17.83)4. Non-workers 19078(46.01) 31617(81.67) 50695(63.23)
Note : The figures in parentheses indicate percentage to total population of the respective category.
Source : Census of India.
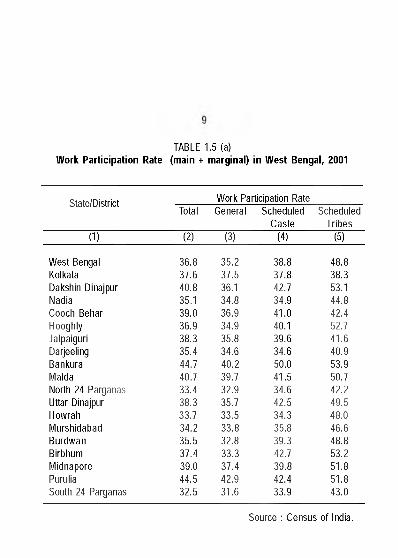
Work Participation RateTABLE 1.5 (a)
(main + marginal) in West Bengal, 2001
State/District Work Participation RateTotal General Scheduled
CasteScheduled
Tribes(1) (2) (3) (4) (5)
West Bengal 36.8 35.2 38.8 48.8Kolkata 37.6 37.5 37.8 38.3Dakshin Dinajpur 40.8 36.1 42.7 53.1Nadia 35.1 34.8 34.9 44.8Cooch Behar 39.0 36.9 41.0 42.4Hooghly 36.9 34.9 40.1 52.7Jalpaiguri 38.3 35.8 39.6 41.6Darjeeling 35.4 34.6 34.6 40.9Bankura 44.7 40.2 50.0 53.9Malda 40.7 39.7 41.5 50.7North 24 Parganas 33.4 32.9 34.6 42.2Uttar Dinajpur 38.3 35.7 42.5 49.5Howrah 33.7 33.5 34.3 48.0Murshidabad 34.2 33.8 35.8 46.6Burdwan 35.5 32.8 39.3 48.8Birbhum 37.4 33.3 42.7 53.2Midnapore 39.0 37.4 39.8 51.8Purulia 44.5 42.9 42.4 51.8South 24 Parganas 32.5 31.6 33.9 43.0
Source : Census of India.
10
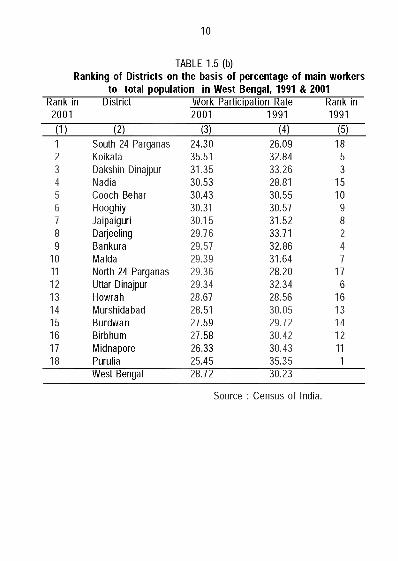
TABLE 1.5 (b)Ranking of Districts on the basis of percentage of main workers
to total population in West Bengal, 1991 & 2001Rank in District Work Participation Rate Rank in
2001 2001 1991 1991(1) (2) (3) (4) (5)1 South 24 Parganas 24.30 26.09 182 Koil<ata 35.51 32.84 53 Dai<shin Dinajpur 31.35 33.26 34 Nadia 30.53 28.81 155 Cooch Behar 30.43 30.55 106 Hooghiy 30.31 30.57 97 Jaipaiguri 30.15 31.52 88 Darjeeling 29.76 33.71 29 Bankura 29.57 32.86 4
10 Malda 29.39 31.64 711 North 24 Parganas 29.36 28.20 1712 Uttar Dinajpur 29.34 32.34 613 Howrah 28.67 28.56 1614 Murshidabad 28.51 30.05 1315 Burdwan 27.59 29.72 1416 Birbhum 27.58 30.42 1217 Midnapore 26.33 30.43 1118 Purulia 25.45 35.35 1
West Bengal 28.72 30.23
Source : Census of India.
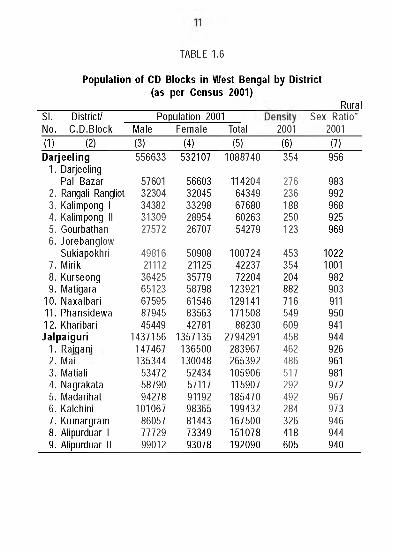
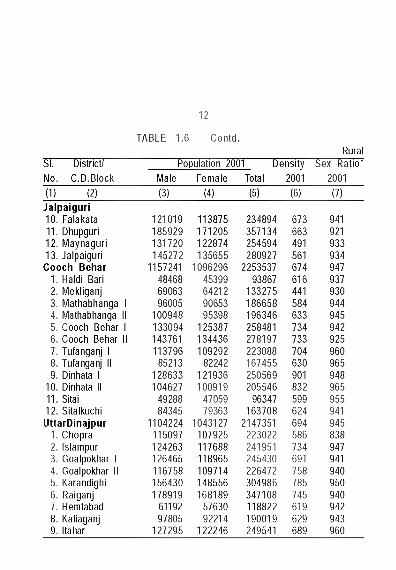
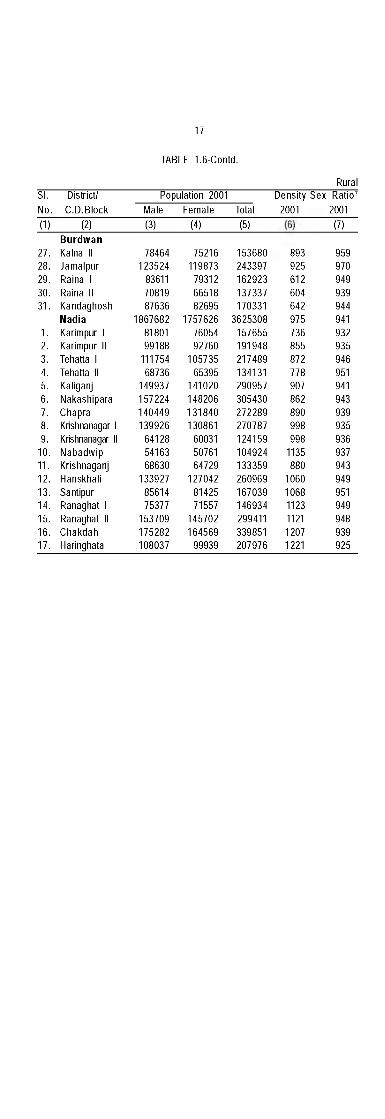
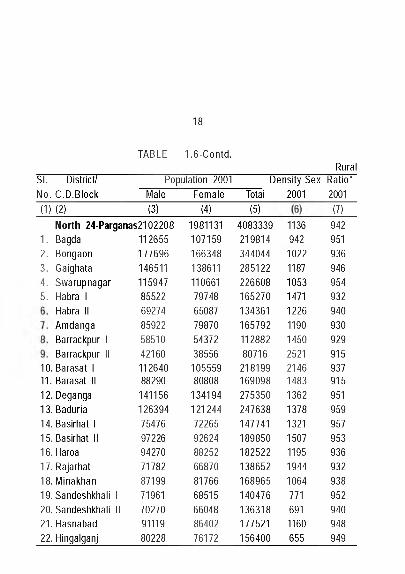
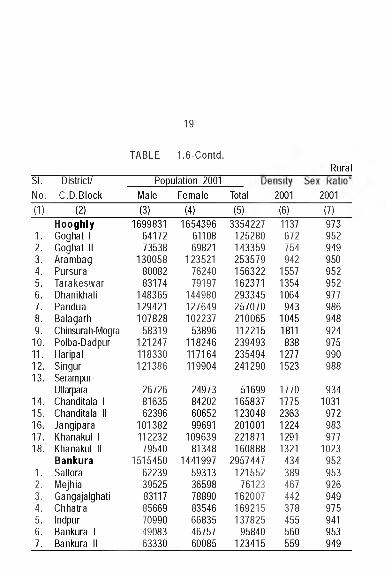
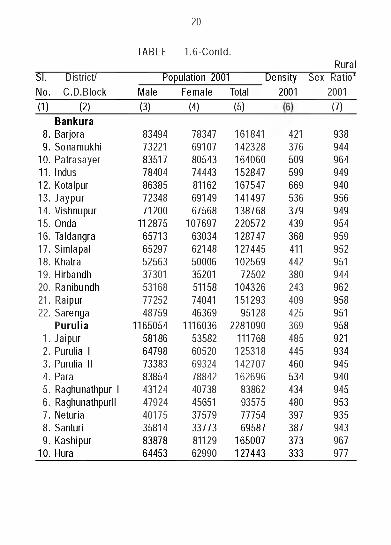
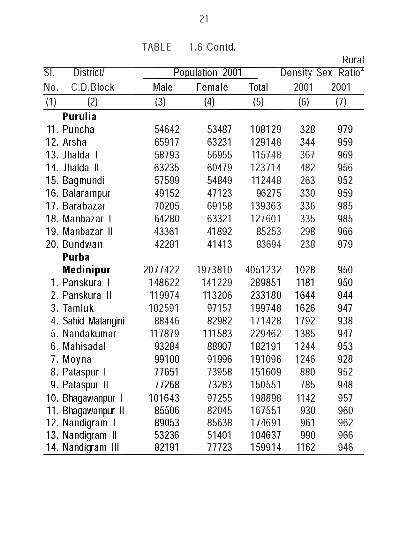
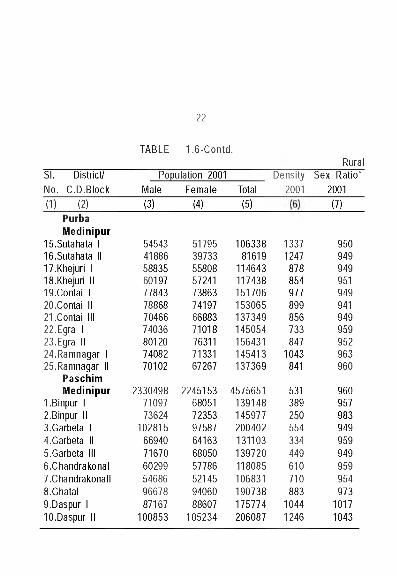
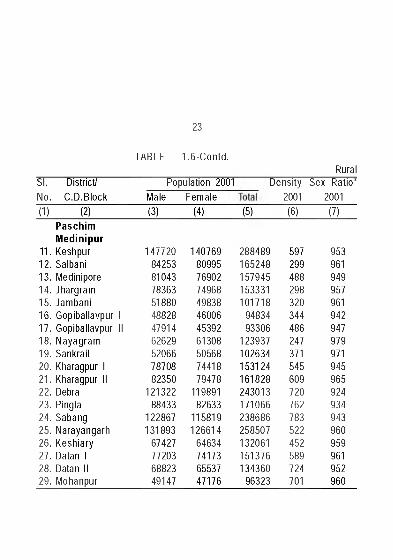
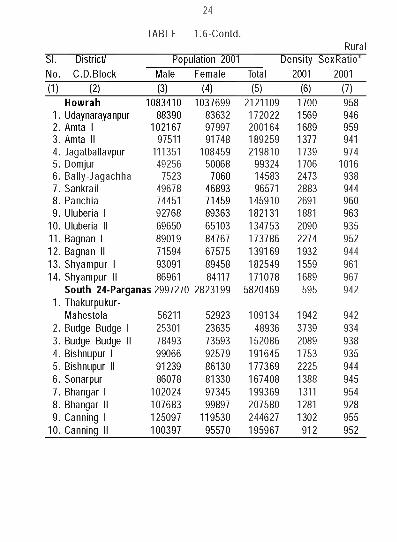
TABLE 1.6
Population of CD Blocks in West Bengal by District (as per Census 2001)
RuralSI. District/ Population 2001 Sex Ratio*No. C .D .B lock Male Female Total 2001 2001(1) (2) (3) (4) (5) (6) (7)D arjeeling 556633 532107 1088740 354 956
1. Darjeeling Pal Bazar 57601 56603 114204 276 983
2. Rangali Rangliot 32304 32045 64349 236 9923. Kalimpong 1 34382 33298 67680 188 9684. Kalimpong II 31309 28954 60263 250 9255. Gourbathan 27572 26707 54279 123 9696. Jorebanglow
Sukiapokhri 49816 50908 100724 453 10227. Mirik 21112 21125 42237 354 10018. Kurseong 36425 35779 72204 204 9829. Matigara 65123 58798 123921 882 903
10. Naxalbari 67595 61546 129141 716 91111. Phansidewa 87945 83563 171508 549 95012. Kharibari 45449 42781 88230 609 941Jalpaiguri 1437156 1357135 2794291 458 944
1. Raigani 147467 136500 283967 462 9262. Mai 135344 130048 265392 486 9613. Matiali 53472 52434 105906 517 9814. Nagrakata 58790 57117 115907 292 9725. Madarihat 94278 91192 185470 492 9676. Kalchini 101067 98365 199432 284 9737. Kumargram 86057 81443 167500 326 9468. Alipurduar 1 77729 73349 151078 418 9449. Alipurduar II 99012 93078 192090 605 940
12
TABLE 1.6 - Contd.
SI. District/ Population 2001No. C .D .B lock Male Female Total 2001 2001
RuralDensity Sex Ratio*
(1) (2) (3) (4) (5) (6) (7)Jalpaiguri10. Falakata11. Dhupguri12. Maynaguri13. Jalpaiguri Cooch Behar
1. Haldi Bari2. Mekliganj3. Mathabhanga I4. Mathabhanga II5. Cooch Behar I6. Cooch Behar II7. Tufanganj I8. Tufanganj II9. Dinhata I
10. Dinhata II11. Sitai12. Sitalkuchi U ttarD inajpur
1. Chopra2. Islampur3. Goalpokhar I4. Goalpokhar II5. Karandighi6. Raiganj7. Hemtabad8. Kaliaganj9. Itahar
121019185929131720145272
1157241484686906396005
100948133094143761113796
85213128633104627
4928884345
1104224115097124263126465116758156430178919
6119297805
127295
113875171205122874135655
109629645399642129065395398
125387134436109292
82242121936100919
4705979363
1043127107925117688118965109714148556168189
5763092214
122246
234894 357134 254594 280927
2253537 93867
133275 186658 584 196346 633 258481 278197 223088 167455 250569 205546 832
96347 599 163708 624
2147351 223022 241951 245430 226472 304986 785 347108 745 118822 190019 249541
673 663 491 561674 616 441
734733704630901
694586734691758
619629689
941 921933934947 937 930944945942 925 960 965948 965 955 941 945 838 947941 940 950 940942943 960
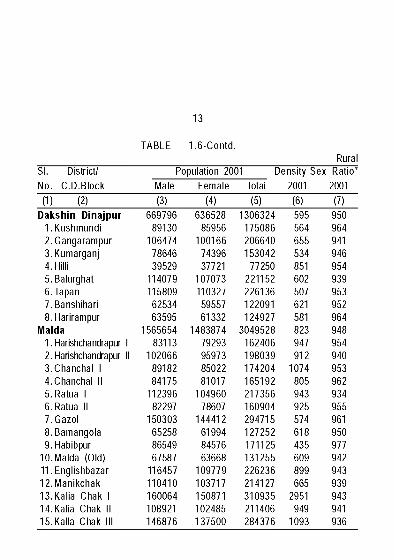
13
TABLE 1 .6-C ontd.
SI. District/No. C.D.BIocl<
Population 2001 Density Sex M a i 2001
RuralRatio ’
2001Male Female(1) (2) (3) (4) (5) (6) (7)
D akshin D inajpur 669796 636528 1306324 595 9501.Kushm undi 89130 85956 175086 564 9642.Gangaram pur 106474 100166 206640 655 9413.Kum arganj 78646 74396 153042 534 9464.Hilli 39529 37721 77250 851 9545.Balurghat 114079 107073 221152 602 9396.Tapan 115809 110327 226136 507 9537.Banshihari 62534 59557 122091 621 9528.Harirampur 63595 61332 124927 581 964
Malda 1565654 1483874 3049528 823 9481.Harishchandrapur I 83113 79293 162406 947 9542. Harishchandrapur II 102066 95973 198039 912 9403.Chanchal I 89182 85022 174204 1074 9534.Chanchal II 84175 81017 165192 805 9625.Ratua I 112396 104960 217356 943 9346.Ratua II 82297 78607 160904 925 9557.G azol 150303 144412 294715 574 9618.Bam angola 65258 61994 127252 618 9509.Habibpur 86549 84576 171125 435 977
10. Malda (Old) 67587 63668 131255 609 94211.Englishbazar 116457 109779 226236 899 94312.M anikchak 110410 103717 214127 665 93913.Kalia Chak I 160064 150871 310935 2951 94314.Kalia Chak II 108921 102485 211406 949 94115. Kalla Chak III 146876 137500 284376 1093 936
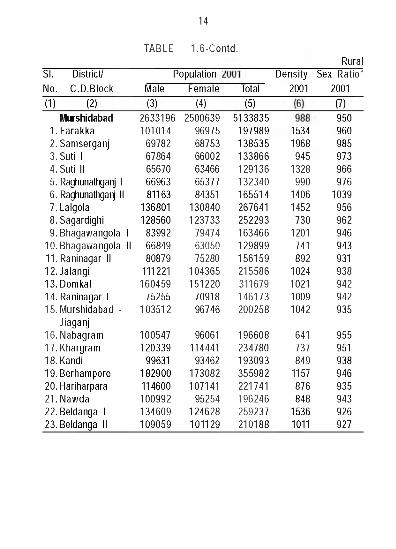
14
TABLE 1.6-C ontd.
SI. District/No. C.D.BIocl<
Population Male Female
Density2001
Rural Sex Ratio*
2001Total(1) (2) (3) (4) (5) (7)
MurshidabadI.F a ra k ka 2.Sam serganjа.Suti I 4.Suti II5. Raghunathganj Iб. Raghunathganj II y .La lgo la S.Sagardighi g.Bhagawangola I
10. Bhagawangola IIII.R an inagar II12. Jalangi13. Domkal14. Raninagar I15. Murshidabad -
Jiaganj16. Nabagram17. Khargram IS .Kand i19. Berhampore20. Hariharpara21.Nawda22. Beldanga I23.Beldanga II
2633196 2500639 101014 96975
6978267864656706696381163
136801128560
839926684980879
111221160459
75255103512
100547120339
99631182900114600100992134609109059
6875366002634666537784351
130840123733
794746305075280
104365151220
7091896746
96061114441
93462173082107141
95254124628101129
5133835197989138535133866129136132340165514267641252293163466129899156159215586311679146173200258
196608234780193093355982221741196246259237210188
15341968
9451328
99014061452
7301201
741892
1024102110091042
641737849
1157876848
15361011
950 960 985 973 966 976
1039956962946943931938942942 935
955951 938 946 935943926927
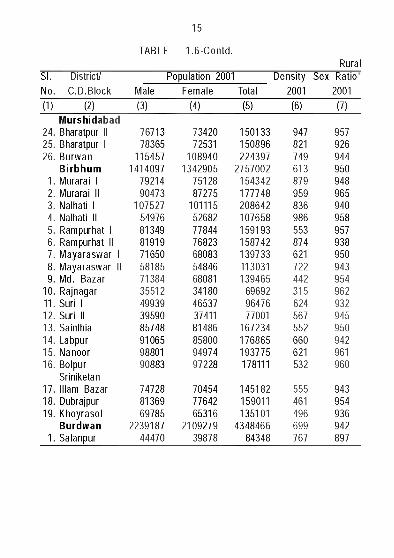
15
TABLE 1.6-C ontd.Rural
SI. District/ No. C.D.BIocl<
Population 2001 Male Female Total
Density Sex Ratio* 2001 2001
(1) (2) (3) (4) (5) (6) (7)Murshidabad
24. Bharatpur II 76713 73420 150133 947 95725. Bharatpur 1 78365 72531 150896 821 92626. Burwan 115457 108940 224397 749 944
B irbhum 1414097 1342905 2757002 613 9501. Murarai 1 79214 75128 154342 879 9482. Murarai II 90473 87275 177748 959 9653. Nalhati 1 107527 101115 208642 836 9404. Nalhati II 54976 52682 107658 986 9585. Rampurhat 1 81349 77844 159193 553 9576. Rampurhat II 81919 76823 158742 874 9387. Mayaraswar 1 71650 68083 139733 621 9508. Mayaraswar II 58185 54846 113031 722 9439. Md. Bazar 71384 68081 139465 442 954
10. Rajnagar 35512 34180 69692 315 96211. Suri 1 49939 46537 96476 624 93212. Suri II 39590 37411 77001 567 94513. Sainthia 85748 81486 167234 552 95014. Labpur 91065 85800 176865 660 94215. Nanoor 98801 94974 193775 621 96116. Bolpur 90883 97228 178111 532 960
Sriniketan17. Illam Bazar 74728 70454 145182 555 94318. Dubrajpur 81369 77642 159011 461 95419. Khoyrasol 69785 65316 135101 496 936
B urdw an 2239187 2109279 4348466 699 9421. Salanpur 44470 39878 84348 767 897
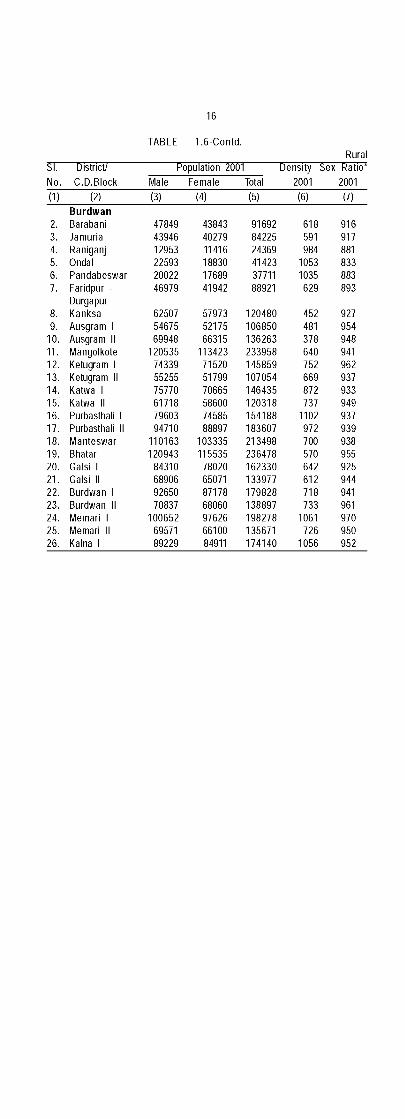
16
TABLE 1.6-C ontd.
SI. District/No. C.D.BIocl<
Population 2001Rural
Density Sex Ratio*Male Female Total 2001 2001
(1) (2) (3) (4) (5) (6) (7)B urdw an
2. Barabani3. Jamuria4. Raniganj5. Ondal6. Pandabeswar7. Faridpur -
Durgapur8. Kanksa9. Ausgram I
10. Ausgram II11. Mangolkote12. Ketugram I13. Ketugram II14. Katwa I15. Katwa II16. Purbasthali I17. Purbasthali II18. Manteswar19. Bhatar20. Galsi I21. Galsi II22. Burdwan I23. Burdwan II24. Memari I25. Memari II26. Kalna I
478494394612953225932002246979
625075467569948
120535743395525575770617187960394710
110163120943
84310689069265070837
1006526957189229
438434027911416188301768941942
579735217566315
113423715205179970665586007458588897
103335115535
78020650718717868060976266610084911
916928422524369414233771188921
120480106850136263233958145859107054146435120318154188183607213498236478162330133977179828138897198278135671174140
618591984
10531035
629
452481378640752669872737
1102972700570642612718733
1061726
1056
916917 881 833 883 893
927954948 941 962 937 933949937 939938955 925 944 941 961 970950 952
17
TABLE 1.6-Contd.
SI. District/No. C.D.BIocl<
RuralPopulation 2001
Male Female TotalDensity Sex Ratio*
2001 2001(1) (2) (3) (4) (5) (7)
B urdw an27. Kalna II28. Jamalpur29. Raina I30. Raina II31. Kandaghosh
Nadia1. Karimpur I2. Karimpur II3. Tehatta I4. Tehatta II5. Kaliganj6. Nakashipara7. Chapra8. Krishnanagar I9. Krishnanagar II
10. Nabadwip11. Krishnaganj12. Hanskhali13. Santipur14. Ranaghat I15. Ranaghat II16. Chakdah17. Haringhata
78464123524
836117081987636
18676828180199188
11175468736
149937157224140449139926
641285416368630
1339278561475377
153709175282108037
75216119873
793126651882695
17576267605492760
10573565395
141020148206131840130861
600315076164729
1270428142571557
145702164569
99939
153680243397162923137337170331
3625308157655191948217489134131290957305430272289270787124159104924133359260969167039146934299411339851207976
893 959925 970612 949604 939642 944975 941736 932855 935872 946778 951907 941862 943890 939998 935998 936
1135 937880 943
1060 9491068 9511123 9491121 9481207 9391221 925
18
TABLE 1.6-C ontd.Rural
SI. District/No. C .D .Block
Population 2001Male Female
Density Sex " M a i 2001
Ratio*2001
(1) (2) (3) (4) (5) (7)North 24-Parganas2102208
1. Bagda2. Bongaon3. Gaighata4. Swarupnagar5. Habra I
Habra II Amdanga Barrackpur I Barrackpur II
10. Barasat I11. Barasat II12. Deganga13. Baduria14. Basirhat I15. Basirhat II16. Haroa17. Rajarhat18. Mina khan ig .Sandeshkha li I20. Sandeshkhali II2 1 .Hasnabad22. HingalganJ
112655177696146511115947855226927485922585104216011264088290
141156126394754769722694270717828719971961702709111980228
1981131 107159 166348 138611 110661 79748 65087 79870 54372 38556
105559 80808
134194 121244 72265 92624 88252 66870 81766 68515 66048 86402 76172
4083339 1136 219814 94234404428512222660816527013436116579211288280716
218199169098275350247638147741189850182522138652168965140476136318177521156400
102211871053147112261190145025212146148313621378132115071195194410647716911160655
942951936 946 954 932 940 930 929 915937 915951 959 957 953 936 932938952 940948949
19
TABLE 1.6-C ontd.Rural
SI. District/ Population 2001No. C.D.BIock Male Female Total 2001 2001(1) (2) (3) (4) (5) (6) (7)
H ooghly 1699831 1654396 3354227 1137 9731. Goghat 1 64172 61108 125280 672 9522. Goghat II 73538 69821 143359 754 9493. Aram bag 130058 123521 253579 942 9504. Pursura 80082 76240 156322 1557 9525. Tarakeswar 83174 79197 162371 1354 9526. Dhanikhali 148365 144980 293345 1064 9777. Pandua 129421 127649 257070 943 9868. Balagarh 107828 102237 210065 1045 9489. Chinsurah-Mogra 58319 53896 112215 1811 924
10. Polba-Dadpur 121247 118246 239493 838 97511. Haripal 118330 117164 235494 1277 99012. Singur 121386 119904 241290 1523 98813. Serampur-
Uttarpara 26726 24973 51699 1770 93414. Chanditala 1 81635 84202 165837 1775 103115. Chanditala II 62396 60652 123048 2363 97216. Jangipara 101382 99691 201001 1224 98317. Khanakul 1 112232 109639 221871 1291 97718. Khanakul II 79540 81348 160888 1321 1023
Bankura 1515450 1441997 2957447 434 9521. Saltora 62239 59313 121552 389 9532. Mejhia 39525 36598 76123 467 9263. Gangajalghati 83117 78890 162007 442 9494. Chhatra 85669 83546 169215 378 9755. Indpur 70990 66835 137825 455 9416. Bankura 1 49083 46757 95840 560 9537. Bankura II 63330 60085 123415 559 949
20
TABLE 1 .6-C ontd.
SI. District/No. C.D.BIocl<
Population 2001Rural
Density Sex Ratio*Male Female Total 2001 2001
(1) (2) (3) (4) (5) (7)Bankura
8. Barjora9. Sonamukhi
10. Patrasayer11. Indus12. Kotalpur13. Jaypur14. Vishnupur15. Onda16. Taldangra17. Simlapal18. Khatra19. Hirbandh20. Ranibundh21. Raipur22. Sarenga
Purulia1. Jaipur2. Purulia I3. Purulia II4. Para5. Raghunathpur I6. Raghunathpurll7. Neturia8. Santuri9. Kashipur
10. Hura
83494732218351778404863857234871200
11287565713652975256337301531687725248759
116505458186647987338383854431244792440175358148387864453
78347691078054374443811626914967568
10769763034621485000635201511587404146369
111603653582605206932478842407384565137579337738112962990
161841142328164060152847167547141497138768220572128747127445102569
72502104326151293
951282281090
111768125318142707162696
83862935757775469587
165007127443
421376509599669536379 439368 411 442380 243 409 425369 485 445 460 534 434 480 397 387 373 333
938944964949940956949954959952 951944 962 958 951 958 921934945 940 945953935 943 967 977
TABLE
21
1.6-C ontd.Rural
SI. District/ No. C.D.BIocl<
Population 2001 Male Female
Density Sex Ratio* Total 2001 2001
(1) (2) (3) (4) (5) (6) (7)Purulia
11. Puncha 54642 53487 108129 328 97912. Arsha 65917 63231 129148 344 95913. Jhalda 1 58793 56955 115748 367 96914. Jhalda II 63235 60479 123714 482 95615. Bagmundi 57599 54849 112448 263 95216. Balarampur 49152 47123 96275 330 95917. Barabazar 70205 69158 139363 336 98518. Manbazar 1 64280 63321 127601 335 98519. Manbazar II 43361 41892 85253 298 96620. Bundwan 42281 41413 83694 238 979
PurbaM edin ipur 2077422 1973810 4051232 1028 950
1. Panskura 1 148622 141229 289851 1181 9502. Panskura II 119974 113206 233180 1644 9443. Tamluk 102591 97157 199748 1626 9474. Sahid Matangini 88446 82982 171428 1792 9385. Nandakumar 117879 111583 229462 1385 9476. Mahisadal 93284 88907 182191 1244 9537. Moyna 99100 91996 191096 1246 9288. Pataspur 1 77651 73958 151609 880 9529. Pataspur II 77268 73283 150551 785 948
10. Bhagawanpur 1 101643 97255 198898 1142 95711. Bhagawanpur II 85506 82045 167551 930 96012. Nandigram 1 89053 85638 174691 961 96213. Nandigram II 53236 51401 104637 990 96614. Nandigram III 82191 77723 159914 1162 946
22
TABLE 1.6-C ontd.Rural
SI. District/No. C .D .Block
Population 2001Male Female Total
Density Sex Ratio*2001 2001
(1) (2) (3) (4) (5) (7)PurbaM edin ipur
15.Sutahata I le.Sutahata II17.Khejuri IIS.Khejuri II ig .C ontai I20.Contai II21.Contai III22.Egra I23.Egra II24.Ramnagar I25.Ramnagar II
Paschim M edin ipur
1.Binpur I2.Binpur IIS.Garbeta I4.Garbeta II5.Garbeta III e.Chandrakonal y.ChandrakonallS.Ghatal g.Daspur IlO.Daspur II
5454341886588356019777843788687046674036801207408270102
23304987109773624
102815669407167060299546869667887167
100853
5179539733558085724173863741976688371018763117133167267
2245153680517235397587641636805057786521459406088607
105234
10633881619
114643117438151706153065137349145054156431145413137369
4575651139148145977200402131103139720118085106831190738175774206087
13371247
878854977899856733847
1043 841
531389250554334449610710883
1044 1246
950 949 949951 949 941 949959952 963960
960957983949959949959954973
10171043
23
TABLE 1.6-C ontd.
SI. District/No. C.D.BIocl<
RuralPopulation 2001
Male FemaleDensity Sex Ratio*
2001 2001(1) (2) (3) (4) (5) (6) (7)
PaschimM edin ipur
11. Keshpur 147720 140769 288489 597 95312. Salbani 84253 80995 165248 299 96113. Medinipore 81043 76902 157945 488 94914. Jhargram 78363 74968 153331 298 95715. Jambani 51880 49838 101718 320 96116. Gopiballavpur 1 48828 46006 94834 344 94217. Gopiballavpur II 47914 45392 93306 486 94718. Nayagram 62629 61308 123937 247 97919. Sankrail 52066 50568 102634 371 97120. Kharagpur 1 78708 74418 153124 545 94521. Kharagpur II 82350 79478 161828 609 96522. Debra 121322 119891 243013 720 92423. Pingla 88433 82633 171066 762 93424. Sabang 122867 115819 238686 783 94325. Narayangarh 131893 126614 258507 522 96026. Keshiary 67427 64634 132061 452 95927. Datan 1 77203 74173 151376 589 96128. Datan II 68823 65537 134360 724 95229. Mohanpur 49147 47176 96323 701 960
24
TABLE 1.6-C ontd.Rural
SI. District/ No. C.D.BIocl<
Population 2001 Male Female
Density SexRatio* Total 2001 2001
(1) (2) (3) (4) (5) (6) (7)Howrah 1083410 1037699 2121109 1700 958
1. Udaynarayanpur 88390 83632 172022 1569 9462. Amta 1 102167 97997 200164 1689 9593. Amta II 97511 91748 189259 1377 9414. Jagatballavpur 111351 108459 219810 1739 9745. Domjur 49256 50068 99324 1706 10166. Bally-Jagachha 7523 7060 14583 2473 9387. Sankrail 49678 46893 96571 2883 9448. Panchia 74451 71459 145910 2691 9609. Uluberia 1 92768 89363 182131 1881 963
10. Uluberia II 69650 65103 134753 2090 93511. Bagnan 1 89019 84767 173786 2274 95212. Bagnan II 71594 67575 139169 1932 94413. Shyampur 1 93091 89458 182549 1559 96114. Shyampur II 86961 84117 171078 1689 967
South 24-Parganas 2997270 2823199 5820469 595 9421. Thakurpukur-
Mahestola 56211 52923 109134 1942 9422. Budge Budge 1 25301 23635 48936 3739 9343. Budge Budge II 78493 73593 152086 2089 9384. Bishnupur 1 99066 92579 191645 1753 9355. Bishnupur II 91239 86130 177369 2225 9446. Sonarpur 86078 81330 167408 1388 9457. Bhangar 1 102024 97345 199369 1311 9548. Bhangar II 107683 99897 207580 1281 9289. Canning 1 125097 119530 244627 1302 955
10. Canning II 100397 95570 195967 912 952
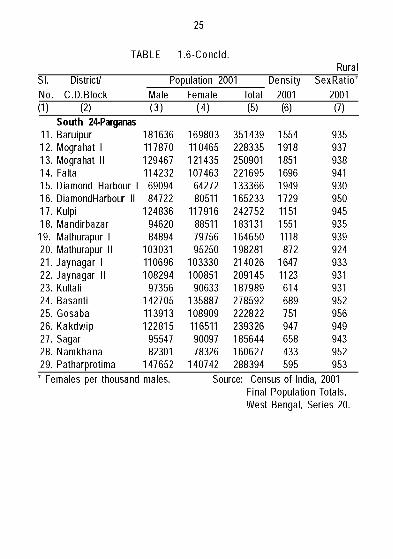
25
TABLE 1 .6-C oncld .Rural
SI. District/ No. C .D.BIock
Population 2001 Male Female Total
Density2001
S exR atio ’2001
(1) (2) (3) (4 ) (5) (6) (7)South 24-Parganas
11. Baruipur 181636 169803 351439 1554 93512. Mograhat 1 117870 110465 228335 1918 93713. Mograhat II 129467 121435 250901 1851 93814. Falta 114232 107463 221695 1696 94115. Diamond Flarbour 1 69094 64272 133366 1949 93016. DiamondFlarbour II 84722 80511 165233 1729 95017. Kulpi 124836 117916 242752 1151 94518. Mandirbazar 94620 88511 183131 1551 93519. Mathurapur 1 84894 79756 164650 1118 93920. Mathurapur II 103031 95250 198281 872 92421. Jaynagar 1 110696 103330 214026 1647 93322. Jaynagar II 108294 100851 209145 1123 93123. Kultali 97356 90633 187989 614 93124. Basanti 142705 135887 278592 689 95225. Gosaba 113913 108909 222822 751 95626. Kakdwip 122815 116511 239326 947 94927. Sagar 95547 90097 185644 658 94328. Namkhana 82301 78326 160627 433 95229. Patharprotima 147652 140742 288394 595 953• Females per thousand males. Source: Census of India, 2001
Final Population Totals, West Bengal, Series 20.
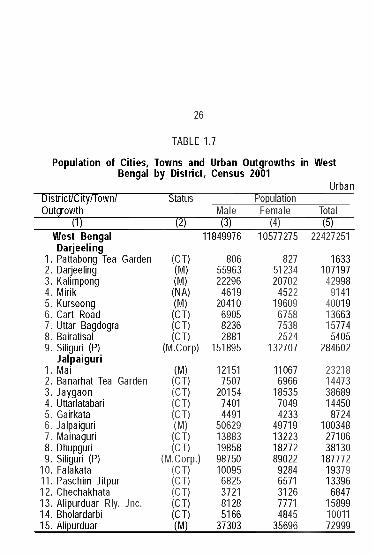
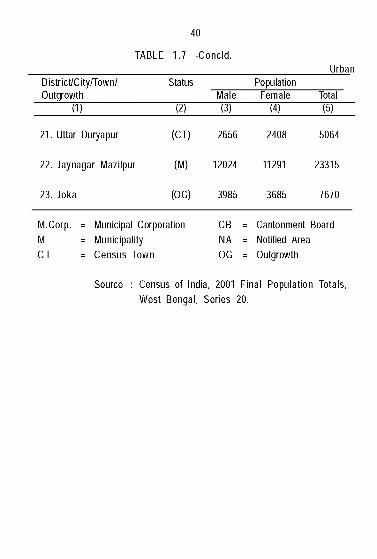
26
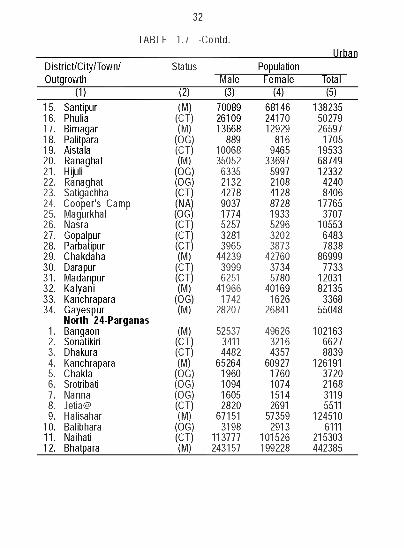
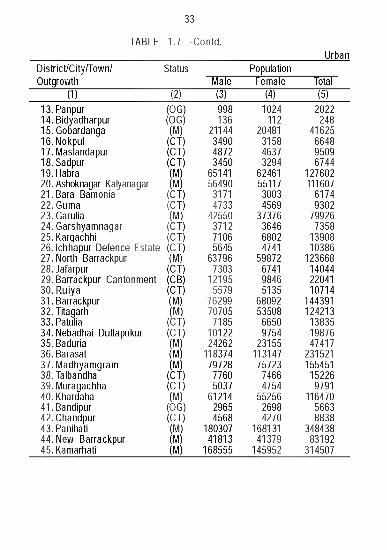
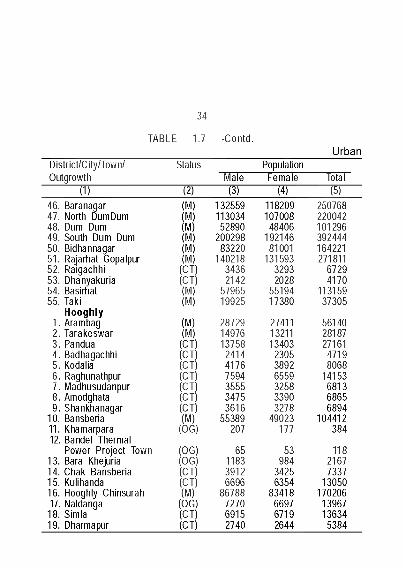
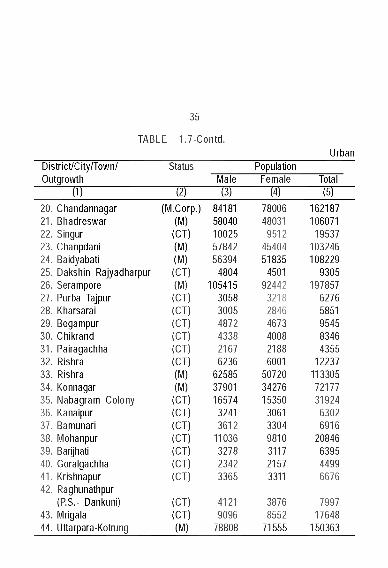
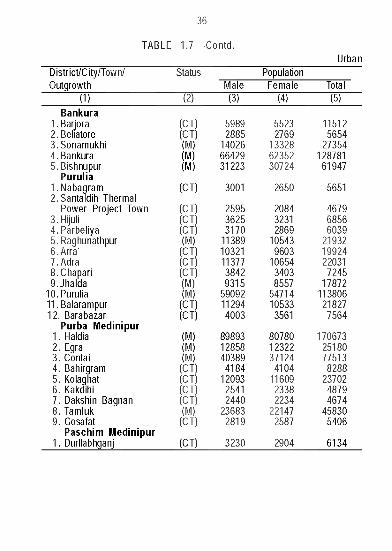
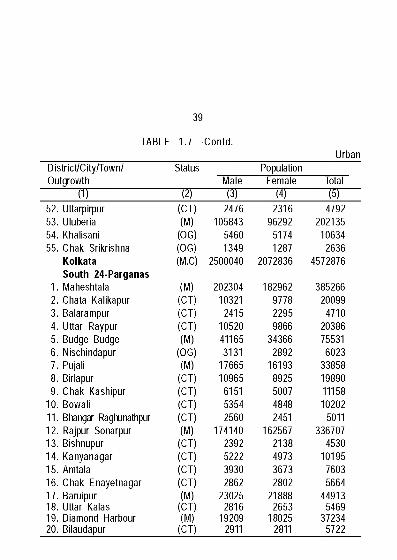
TABLE 1.7
Population of Cities, Towns and Urban Outgrowths in West Bengal by District, Census 2001
UrbanDistrict/City/Town/Outgrowth
StatusMale
PopulationFemale Total
(1) (2) (3) (4) (b)West Bengal 11849976 10577275 22427251Darjeeling
1. Pattabong Tea Garden (CT) 806 827 16332. Darjeeling (M) 55963 51234 1071973. Kalimpong (M) 22296 20702 429984. Mirik (NA) 4619 4522 91415. Kurseong (M) 20410 19609 400196. Cart Road (CT) 6905 6758 136637. Uttar Bagdogra (CT) 8236 7538 157748. Bairatisal (CT) 2881 2524 54059. Siliguri (P) (M.Corp) 151895 132707 284602
Jalpaiguri1. Mai (M) 12151 11067 232182. Banarhat Tea Garden (CT) 7507 6966 144733 . Jaygaon (CT) 20154 18535 386894. Uttarlatabari (CT) 7401 7049 144505. Gairkata (CT) 4491 4233 87246. Jalpaiguri (M) 50629 49719 1003487. Mainaguri (CT) 13883 13223 271068. Dhupguri (CT) 19858 18272 381309. Siliguri (P) (M.Corp.) 98750 89022 187772
10. Falakata (CT) 10095 9284 1937911. Paschim Jitpur (CT) 6825 6571 1339612. Chechakhata (CT) 3721 3126 684713. Alipurduar RIy. Jnc. (CT) 8128 7771 1589914. Bholardarbi (CT) 5166 4845 1001115. Alipurduar (M) 37303 35696 72999
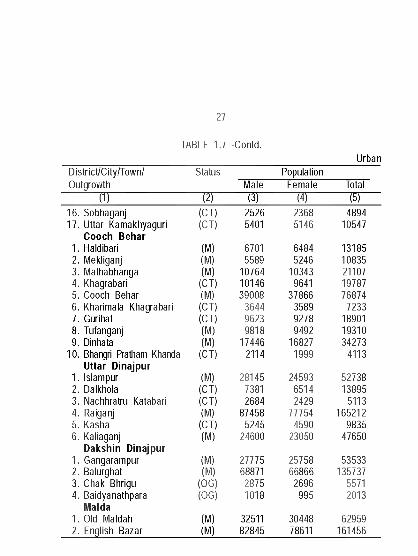
27
TABLE 1.7 -Contd.Urban
District/City/Town/Outgrowth
StatusMale
PopulationFemale Total
(1) (2) (3) (4) (5)16. Sobhaganj (CT) 2526 2368 489417. Uttar Kamakhyaguri (CT) 5401 5146 10547
Cooch Behar1. Haldibari (M) 6701 6484 131852. Mekliganj (M) 5589 5246 108353. Mathabhanga (M) 10764 10343 211074. Khagrabari (CT) 10146 9641 197875. Cooch Behar (M) 39008 37866 768746. Kharimala Khagrabari (CT) 3644 3589 72337. Gurihat (CT) 9623 9278 189018. Tufanganj (M) 9818 9492 193109. Dinhata (M) 17446 16827 34273
10. Bhangri Pratham Khanda (CT) 2114 1999 4113Uttar Dinajpur
1. Islampur (M) 28145 24593 527382. Dalkhola (CT) 7381 6514 138953. Nachhratru Katabari (CT) 2684 2429 51134. Raiganj (M) 87458 77754 1652125. Kasha (CT) 5245 4590 98356. Kaliaganj (M) 24600 23050 47650
Dakshin Dinajpur1. Gangarampur (M) 27775 25758 535332. Balurghat (M) 68871 66866 1357373. Chak Bhrigu (OG) 2875 2696 55714. Baidyanathpara (OG) 1018 995 2013
Malda1. Old Maldah (M) 32511 30448 629592. English Bazar (M) 82845 78611 161456
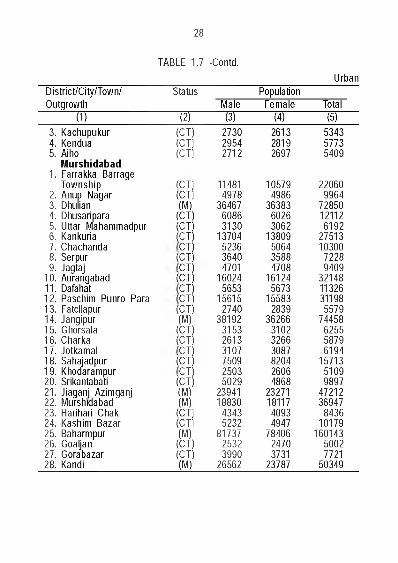
28
TABLE 1.7 -Contd.Urban
District/City/Town/ Status PopulationOutgrowth Male Female Total
(1) (^) (3) (4) (5)3. Kachupukur (CT) 2730 2613 53434. Kendua (CT 2954 2819 57735. Aiho (CT 2712 2697 5409
M urshidabad1. Farrakka Barrage
Township (CT 11481 10579 220602. Anup Nagar (CT 4978 4986 99643. Dhuian (M) 36467 36383 728504. Dhusaripara (CT) 6086 6026 121125. Uttar Mahammadpur (c t ;1 3130 3062 61926. Kankuria (c t :1 13704 13809 275137. Chachanda c t ;1 5236 5064 103008. Serpur (c t :1 3640 3588 72289. Jagtaj c t ;1 4701 4708 9409
10. Aurangabad (c t :1 16024 16124 3214811. Dafahat c t ;1 5653 5673 1132612. Paschim Punro Para CT 1 15615 15583 3119813. Fatcllapur (CT) 2740 2839 557914. Jangipur (M) 38192 36266 7445815. Ghorsala (c t ;1 3153 3102 625516. Charka (c t :1 2613 3266 587917. Jotkamal c t ;1 3107 3087 619418. Sahajadpur19. Khodarampur
(c t :1 7509 8204 15713c t ;1 2503 2606 5109
20. Srikantabati (c t :1 5029 4868 989721. Jiaganj Azimganj (M) 23941 23271 4721222. Murshidabad (M) 18830 18117 3694723. Harihari Chak (CT 4343 4093 843624. Kashim Bazar (CT 5232 4947 1017925. Baharmpur (M) 81737 78406 16014326. Goaljan (CT) 2532 2470 500227. Gorabazar (CT) 3990 3731 772128. Kandi (M) 26562 23787 50349
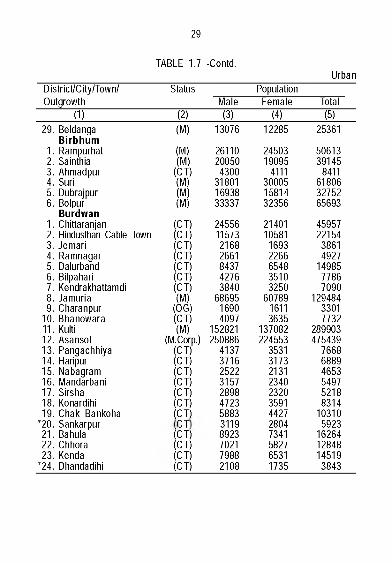
29
TABLE 1.7 -Contd.Urban
District/City/Town/Outgrowth
StatusMale
PopulationFemale Total
(1) (2) (3) (4) (5)29. Beldanqa (M) 13076 12285 25361
B irbhum1. Rampurhat (M) 26110 24503 506132. Sainthia (M) 20050 19095 391453. Ahmadpur (CT) 4300 4111 84114. Suri (M) 31801 30005 618065. Dubrajpur (M) 16938 15814 327526. Bolpur (M) 33337 32356 65693
Burdwan1. Chittaranjan (CT) 24556 21401 459572. Hindusthan Cable Town (CT) 11573 10581 221543. Jemari (CT) 2168 1693 38614. Ramnagar (CT) 2661 2266 49275. Dalurband (CT) 8437 6548 149856. Bilpahari (CT) 4276 3510 77867. Kendrakhattamdi (CT) 3840 3250 70908. Jamuria (M) 68695 60789 1294849. Charanpur (OG) 1690 1611 3301
10. Bhanowara (CT) 4097 3635 773211. Kulti (M) 152821 137082 28990312. Asansol (M.Corp.) 250886 224553 47543913. Pangachhiya (CT) 4137 3531 766814. Haripur (CT) 3716 3173 688915. Nabagram (CT) 2522 2131 465316. Mandarbani (CT) 3157 2340 549717. Sirsha (CT) 2898 2320 521818. Konardihi (CT) 4723 3591 831419. Chak Bankoha (CT) 5883 4427 10310
•20. Sankarpur CT 3119 2804 592321. Bahula (CT) 8923 7341 1626422. Chhora (CT) 7021 5827 1284823. Kenda (CT) 7988 6531 14519
•24. Dhandadihi (CT) 2108 1735 3843
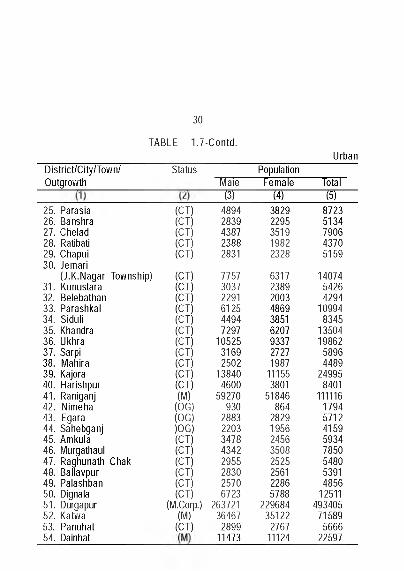
30
TABLE 1.7-Contd.Urban
District/City/Town/Outgrowth
Status■Miir
1 3 T
PopulationFemalei r
Total1 5 T
25. Parasia26. Banshra27. Chelad28. Ratibati29. Chapui30. Jemari
(J.K.Nagar Township)31. Kunustara32. Belebathan33. Parashkal34. Siduli35. Khandra36. Ukhra37. Sarpi38. Mahira39. Kajora40. Harishpur41. Raniganj42. Nimeha43. Egara44. Sahebganj45. Amkula46. Murgathaul47. Raghunath Chak48. Balavpur49. Palashban50. Dignala51. Durgapur52. Katwa53. Panuhat54. Dainhat
(CT)(CT)(CT)(CT)(CT)
(CT)(CT)(CT)(CT)(CT)(CT)(CT)(CT)(CT)(CT)(CT)(M)
(OG)(OG))0G)(CT)(CT)(CT)(CT)(CT)(CT)
(M.Corp.)(M)
(CT)
4894 3829 87232839 2295 51344387 3519 79062388 1982 43702831 2328 5159
7757 6317 140743037 2389 54262291 2003 42946125 4869 109944494 3851 83457297 6207 13504
10525 9337 198623169 2727 58962502 1987 4489
13840 11155 249954600 3801 8401
59270 51846 111116930 864 1794
2883 2829 57122203 1956 41593478 2456 59344342 3508 78502955 2525 54802830 2561 53912570 2286 48566723 5788 12511
263721 229684 49340536467 35122 71589
2899 2767 566611473 11124 22597
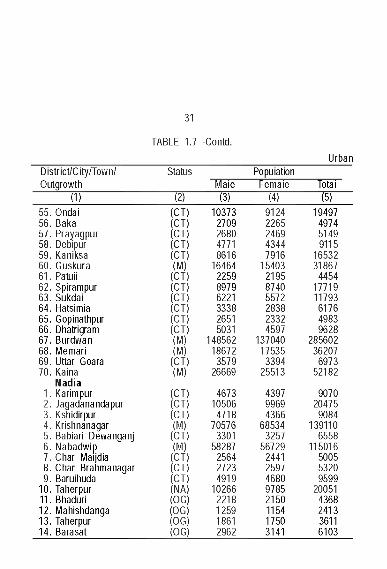
31
TABLE 1.7 -Contd.Urban
District/City/Town/ Outgrowth
------------- [11---------------
Status Population
~ wMale
1 3 TFemale
“ 1 4 ) —Total
1 5 T55. Ondal (CT) 10373 9124 1949756. Baka (CT) 2709 2265 497457. Prayagpur (CT) 2680 2469 514958. Deblpur (CT) 4771 4344 911559. Kanlksa (CT) 8616 7916 1653260. Guskura (M) 16464 15403 3186761.Patu ll (CT) 2259 2195 445462. Splrampur (CT) 8979 8740 1771963. Sukdal (CT) 6221 5572 1179364. Hatslmla (CT) 3338 2838 617665. Goplnathpur (CT) 2651 2332 498366. Dhatrlgram (CT) 5031 4597 962867. Burdwan (M) 148562 137040 28560268. Memarl (M) 18672 17535 3620769. Uttar Goara (CT) 3579 3394 697370. Kalna (M) 26669 25513 52182
Nadia1. Karlmpur (CT) 4673 4397 90702. Jagadanandapur (CT) 10506 9969 204753. Kshldlrpur (CT) 4718 4366 90844. Krlshnanagar (M) 70576 68534 1391105. Bablarl Dewanganj (CT) 3301 3257 65586. Nabadwlp (M) 58287 56729 1150167. Char Maljdla (CT) 2564 2441 50058. Char Brahmanagar (CT) 2723 2597 53209. Barulhuda (CT) 4919 4680 9599
10. Taherpur (NA) 10266 9785 2005111. Bhadurl (OG) 2218 2150 436812. Mahlshdanga (OG) 1259 1154 241313. Taherpur (OG) 1861 1750 361114. Barasat (OG) 2962 3141 6103
32
TABLE 1.7 -Contd.Urban
District/City/Town/Outgrowth
StatusMale
PopulationFemale Total
(1) (2) (3) (4) (5)15. Santipur (M) 70089 68146 13823516. Phulia (CT) 26109 24170 5027917. Birnagar (M) 13668 12929 2659718. Palitpara (OG) 889 816 170519. Aistala (CT) 10068 9465 1953320. Ranaghat (M) 35052 33697 6874921. Hijuli (OG) 6335 5997 1233222. Ranaghat (OG) 2132 2108 424023. Satigachha (CT) 4278 4128 840624. Cooper's Camp (NA) 9037 8728 1776525. Magurkhal (OG) 1774 1933 370726. Nasra (CT) 5257 5296 1055327. Gopalpur (CT) 3281 3202 648328. Parbatipur (CT) 3965 3873 783829. Chakdaha (M) 44239 42760 8699930. Darapur (CT) 3999 3734 773331. Madanpur (CT) 6251 5780 1203132. Kalyani (M) 41966 40169 8213533. Kanchrapara (OG) 1742 1626 336834. Gayespur
North 24-Parganas(M) 28207 26841 55048
1. Bangaon (M) 52537 49626 1021632. Sonatikiri (CT) 3411 3216 66273. Dhakura (CT) 4482 4357 88394. Kanchrapara (M) 65264 60927 1261915. Chakla (OG) 1960 1760 37206. Srotribati (OG) 1094 1074 21687. Nanna (OG) 1605 1514 31198. Jetia® (CT) 2820 2691 55119. Halisahar (M) 67151 57359 124510
10. Balibhara (OG) 3198 2913 611111. Naihati (CT) 113777 101526 21530312. Bhatpara (M) 243157 199228 442385
33
TABLE 1.7 -Contd.Urban
District/City/Town/ Status PopulationOutgrowth Male Female Total
(1) (2) (3) (4) (5)13. Panpur (OG) 998 1024 202214. Bidyadharpur (OG) 136 112 24815. Gobardanga (M) 21144 20481 41625le .N o kp u l 17. Maslandapur
(CT)(CT)
34904872
31584637
66489509
18. Sadpur (CT) 3450 3294 674419. Habra (M) 65141 62461 12760220. Ashoknagar Kalyanagar (M) 56490 55117 11160721. Bara Bamonia (CT) 3171 3003 617422. Guma (CT) 4733 4569 930223. Garulia (M) 42550 37376 7992624. Garshyamnagar (CT) 3712 3646 735825. Karqachhi (CT) 7106 6802 1390826. Ichhapur Defence Estate (CT) 5645 4741 1038627. North Barrackpur (M) 63796 59872 12366828. Jafarpur (CT) 7303 6741 1404429. Barrackpur Cantonment (CB) 12195 9846 2204130. Ruiya (CT) 5579 5135 1071431. Barrackpur (M) 76299 68092 14439132. Titagarh (M) 70705 53508 12421333. Patulia (CT) 7185 6650 1383534. Nebadhai Duttapukur (CT) 10122 9754 1987635. Baduria (M) 24262 23155 4741736. Barasat (M) 118374 113147 23152137. Madhyamgram (M) 79728 75723 15545138. Talbandha (CT) 7760 7466 1522639. Muragachha (CT) 5037 4754 979140. Khardaha (M) 61214 55256 11647041. Bandipur (OG) 2965 2698 566342. Chandpur (CT) 4568 4270 883843. Panihati (M) 180307 168131 34843844. New Barrackpur (M) 41813 41379 8319245. Kamarhati (M) 168555 145952 314507
34
TABLE 1.7 -Contd.Urban
District/City/Town/ Status PopulationOutgrowth Male Female Total
(1) (2) (3) (4) (5)46. Baranagar (M) 132559 118209 25076847. North DumDum (M) 113034 107008 22004248. Dum Dum (M) 52890 48406 10129649. South Dum Dum (M) 200298 192146 39244450. Bidhannagar (M) 83220 81001 16422151. Rajarhat Gopalpur (M) 140218 131593 27181152. Raigachhi (CT) 3436 3293 672953. Dhanyakuria54. Basirhat
(CT) 2142 2028 4170(M) 57965 55194 113159
55. Taki (M) 19925 17380 37305Hooghly
1. Arambag (M) 28729 27411 561402. Tarakeswar (M) 14976 13211 281873. Pandua (CT) 13758 13403 271614. Badhagachhi (CT) 2414 2305 47195. Kodalia (CT) 4176 3892 80686. Raghunathpur (CT) 7594 6559 141537. Madhusudanpur (CT) 3555 3258 68138. Amodghata (CT) 3475 3390 68659. Shankhanagar (CT) 3616 3278 6894
10. Bansberia (M) 55389 49023 10441211. Khamarpara (OG) 207 177 38412. Bandel Thermal
Power Project Town (OG) 65 53 11813. Bara Khejuria (OG) 1183 984 216714. Chak Bansberia (CT) 3912 3425 733715. Kulihanda (CT) 6696 6354 1305016. Hooghly Chinsurah (M) 86788 83418 17020617. Naldanga (OG) 7270 6697 1396718. Simla (CT) 6915 6719 1363419. Dharmapur (CT) 2740 2644 5384
35
TABLE 1.7-Contd.Urban
District/City/Town/Outgrowth
StatusMale
PopulationFemale Total
(1) (2) (3) (4) (5)20. Chandannagar (M.Corp.,) 84181 78006 16218721. Bhadreswar (M) 58040 48031 10607122. Singur (CT) 10025 9512 1953723. Chanpdani (M) 57842 45404 10324624. Baidyabati (M) 56394 51835 10822925. Dakshin Rajyadharpur (CT) 4804 4501 930526. Serampore (M) 105415 92442 19785727. Purba Tajpur (CT) 3058 3218 627628. Kharsarai (CT) 3005 2846 585129. Begampur (CT) 4872 4673 954530. Chikrand (CT) 4338 4008 834631. Pairagachha (CT) 2167 2188 435532. Rishra (CT) 6236 6001 1223733. Rishra (M) 62585 50720 11330534. Konnagar (M) 37901 34276 7217735. Nabagram Colony (CT) 16574 15350 3192436. Kanaipur (CT) 3241 3061 630237. Bamunari (CT) 3612 3304 691638. Mohanpur (CT) 11036 9810 2084639. Barijhati (CT) 3278 3117 639540. Goralgachha (CT) 2342 2157 449941. Krishnapur (CT) 3365 3311 667642. Raghunathpur
(P.S.- Dankuni) (CT) 4121 3876 799743. Mrigala (CT) 9096 8552 1764844. Uttarpara-Kotrung (M) 78808 71555 150363
36
TABLE 1.7 ■Contd.Urban
District/City/Town/Outgrowth
StatusMale
PopulationFemale Total
(1) (2) (3) (4) (5)Bankura
1. Barjora (CT) 5989 5523 115122. Beliatore (CT) 2885 2769 5654S.Sonamukhi (M) 14026 13328 273544. Bankura (M) 66429 62352 1287815. Bishnupur (M) 31223 30724 61947
PuruliaI.N abagram (CT) 3001 2650 56512.Santadih Thermal
Power Project Town (CT) 2595 2084 4679a.Hijuli (CT) 3625 3231 68564. Parbeliya (CT) 3170 2869 60395. Raghunathpur (M) 11389 10543 219326. Arra' (CT) 10321 9603 199247.Adra (CT) 11377 10654 22031S.Chapari (CT) 3842 3403 7245g.Jhalda (M) 9315 8557 17872
10. Purulia (M) 59092 54714 113806II.B a la ram pur (CT) 11294 10533 2182712. Barabazar (CT) 4003 3561 7564
Purba M edinipur1. Haldia (M) 89893 80780 1706732. Egra (M) 12858 12322 251803. Cental (M) 40389 37124 775134. Bahlrgram (CT) 4184 4104 82885. Kolaghat (CT) 12093 11609 237026. Kakdlhl (CT) 2541 2338 48797. Dakshin Bagnan (CT) 2440 2234 46748. Tamluk (M) 23683 22147 458309. Gosafat (CT) 2819 2587 5406
Paschim M edinipur1. Durllabhganj (CT) 3230 2904 6134
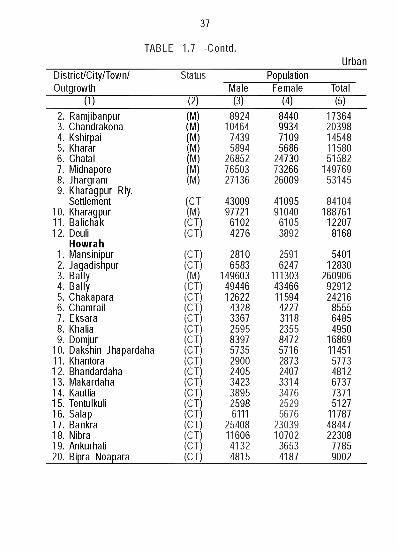
37
TABLE 1.7 -Contd.Urban
District/City/Town/Outgrowth
StatusMale
PopulationFemale Total
(1) (2) (3) (4) (5)2. Ramjibanpur (M) 8924 8440 173643. Chandrakona (M) 10464 9934 203984. Kshirpai (M) 7439 7109 145485. Kharar (M) 5894 5686 115806. Ghatal (M) 26852 24730 515827. Midnapore (M) 76503 73266 1497698. Jhargram (M) 27136 26009 531459. Kharagpur RIy.
Settlement (CT 43009 41095 8410410. Kharagpur (M) 97721 91040 18876111. Balichak (CT) 6102 6105 1220712. Deuli (CT) 4276 3892 8168
Howrah1. Mansinipur (CT) 2810 2591 54012. Jagadishpur (CT) 6583 6247 128303. Ba ly (M) 149603 111303 2609064. Bally (CT) 49446 43466 929125. Chakapara (CT) 12622 11594 242166. Chamrail (CT) 4328 4227 85557. Eksara (CT) 3367 3118 64858. Khalia (CT) 2595 2355 49509. Domjur (CT) 8397 8472 16869
10. Dakshin Jhapardaha (CT) 5735 5716 1145111. Khantora (CT) 2900 2873 577312. Bhandardaha (CT) 2405 2407 481213. Makardaha (CT) 3423 3314 673714. Kautlia (CT) 3895 3476 737115. Tentulkuli (CT) 2598 2529 512716. Salap (CT) 6111 5676 1178717. Bankra (CT) 25408 23039 4844718. Nibra (CT) 11606 10702 2230819. Ankurhati (CT) 4132 3653 778520. Bipra Noapara (CT) 4815 4187 9002
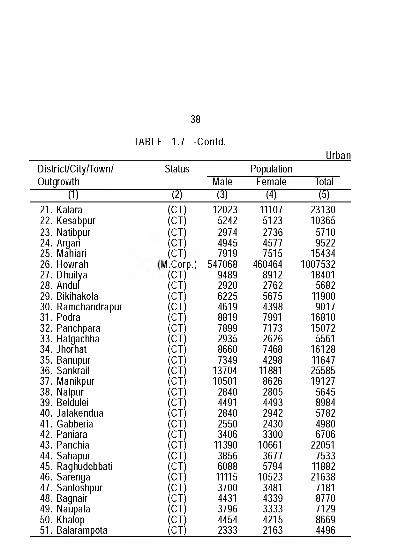
38
TABLE 1.7 -Contd.Urban
District/City/Town/ Outgrowth
---------- [11-----------
Status Population
~ wMale
1 3 TFemale
“ 1 4 ) —Total
1 5 T21. Kalara22. Kesabpur23. Natlbpur24. Argarl25. Mahlarl26. Howrah27. Dhuilya28. Andul29. Blklhakola30. Ramchandrapur31. Podra32. Panchpara33. Hatgachha34. Jhorhat35. Banupur36. Sankrall37. Manlkpur38. Nalpur39. Beldulel40. Jalakendua41. Gabberla42. Panlara43. Panchia44. Sahapur45. Raghudebbatl46. Sarenga47. Santoshpur48. Bagnair49. Naupala50. Khalop51. Balarampota
(CT)(CT)(CT)(CT)(CT)
(/I.Corp.) (CT) (CT) (CT) (CT) (CT) (CT) (CT) (CT) (CT) (CT) (CT) (CT) (CT) (CT) (CT) (CT) (CT) (CT) (CT) (CT) (CT) (CT) (CT) (CT) (CT)
120235242297449457919
547068948929206225461988197899293586607349
1370410501
28404491284025503406
11390385660881111537004431379644542333
111075123273645777515
460464891227625675439879917173262674684298
11881862628054493294224303300
1066136775794
1052334814339333342152163
2313010365
57109522
154341007532
184015682
119009017
1681015072
556116128116472558519127
56458984578249806706
220517533
1188221638
71818770712986694496
39
TABLE 1.7 -Contd.Urban
District/City/Town/Outgrowth
StatusMale
PopulationFemale Total
(1) 0 (3) (4) (5)52. Uttarpirpur (CT) 2476 2316 479253. Uluberia (M) 105843 96292 20213554. Khalisani (OG) 5460 5174 1063455. Chak Srikrishna (OG) 1349 1287 2636
Kolkata (M.C) 2500040 2072836 4572876South 24-Parganas
1. Maheshtala (M) 202304 182962 3852662. Chata Kalikapur (CT) 10321 9778 200993. Balarampur (CT) 2415 2295 47104. Uttar Raypur (CT) 10520 9866 203865. Budge Budge (M) 41165 34366 755316. Nischindapur (OG) 3131 2892 60237. Pujali (M) 17665 16193 338588. Birlapur (CT) 10965 8925 198909. Chak Kashipur (CT) 6151 5007 11158
10. Bowali (CT) 5354 4848 1020211. Bhangar Raghunathpur (CT) 2560 2451 501112. Rajpur Sonarpur (M) 174140 162567 33670713. Bishnupur (CT) 2392 2138 453014. Kanyanagar (CT) 5222 4973 1019515. Amtala (CT) 3930 3673 760316. Chak Enayetnagar (CT) 2862 2802 566417. Baruipur (M) 23025 21888 4491318. Uttar Kalas (CT) 2816 2653 546919. Diamond Harbour (M) 19209 18025 3723420. Bilaudapur (CT) 2911 2811 5722
40
TABLE 1.7 -Concld.Urban
District/City/Town/Outgrowth
StatusMale
PopulationFemale Total
(1) (2) (3) (4) (5)
21. Uttar Duryapur (CT) 2656 2408 5064
22. Jaynagar Mazilpur (M) 12024 11291 23315
23. Joka (OG) 3985 3685 7670
M.Corp. = Municipal Corporation IVI = IVIunicipality CT = Census Town
CB = Cantonment Board NA = Notified Area OG = Outgrowth
Source : Census of India, 2001 Final Population Totals, West Bengal, Series 20.
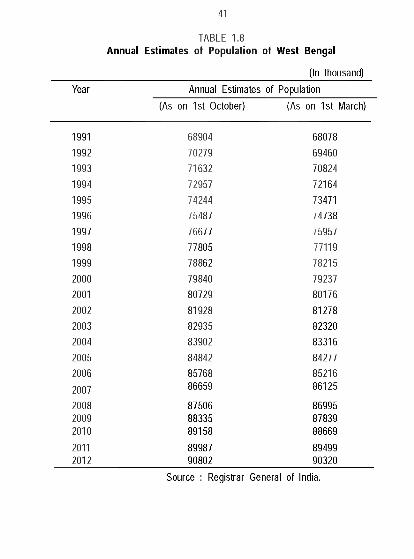
41
TABLE 1.8 Annual Estimates of Population of West Bengal
(In thousand)Year Annual Estimates of Population
(As on 1st October) (As on 1st March)
1991 68904 680781992 70279 694601993 71632 708241994 72957 721641995 74244 734711996 75487 747381997 76677 759571998 77805 771191999 78862 782152000 79840 792372001 80729 801762002 81928 812782003 82935 823202004 83902 833162005 84842 842772006 85768 852162007 86659 86125
2008 87506 869952009 88335 878392010 89158 886692011 89987 894992012 90802 90320
Source : Registrar General of India.
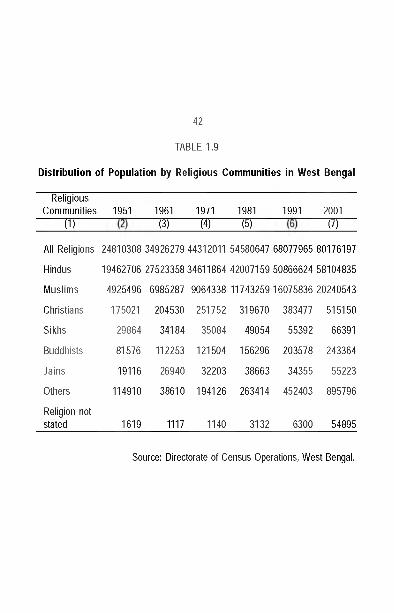
Distribution of Population by Religious Communities in West Bengal
42
TABLE 1.9
Religious Communities
----------( i) ----------1951 1961
1 3 T1971
1 4 T1981
1 5 T1991 2001
I T T
All Religions 24810308 34926279 44312011 54580647 68077965 80176197
Hindus 19462706 27523358 34611864 42007159 50866624 58104835
Muslims 4925496 6985287 9064338 11743259 16075836 20240543
Christians 175021 204530 251752 319670 383477 515150
Sikhs 29864 34184 35084 49054 55392 66391
Buddhists 81576 112253 121504 156296 203578 243364
Jains 19116 26940 32203 38663 34355 55223
Others 114910 38610 194126 263414 452403 895796
Religion not stated 1619 1117 1140 3132 6300 54895
Source: Directorate of Census Operations, West Bengal.
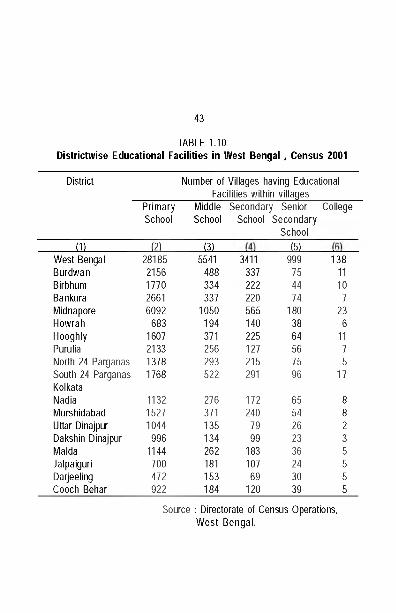
43
TABLE 1.10Districtwise Educational Facilities in West Bengal , Census 2001
District Number of Villages having Educational_________________ Facilities within villages__________
Primary Middle Secondary Senior College School School School Secondary
School_ f l i J2 1 13L J 5 L
West Bengal 28185 5541 3411 999 138Burdwan 2156 488 337 75 11Birbhum 1770 334 222 44 10Bankura 2661 337 220 74 7Midnapore 6092 1050 565 180 23Howrah 683 194 140 38 6Hooghly 1607 371 225 64 11Purulia 2133 256 127 56 7North 24 Parganas 1378 293 215 75 5South 24 Parganas Kolkata
1768 522 291 96 17
Nadia 1132 276 172 65 8Murshidabad 1527 371 240 54 8Uttar Dinajpur 1044 135 79 26 2Dakshin Dinajpur 996 134 99 23 3Malda 1144 262 183 36 5Jalpaiguri 700 181 107 24 5Darjeeling 472 153 69 30 5Cooch Behar 922 184 120 39 5
Source : Directorate of Census Operations, W est Bengal.
44
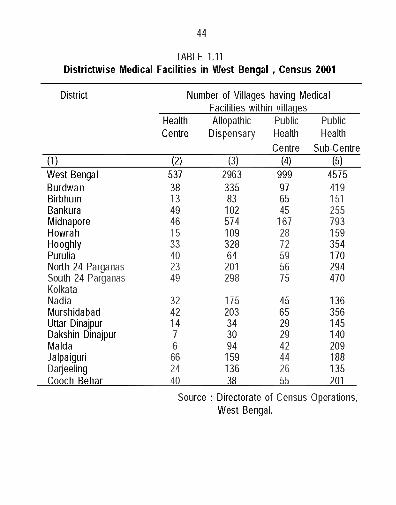
TABLE 1.11Districtwise Medical Facilities in West Bengal , Census 2001
District Number of Villages having Medical Facilities within villaqes
HealthCentre
AllopathicDispensary
PublicHealthCentre
PublicHealth
Sub-Centre(1) (2) (3) (4) (5)West Bengal 537 2963 999 4575Burdwan 38 335 97 419Birbhum 13 83 65 151Bankura 49 102 45 255Midnapore 46 574 167 793Howrah 15 109 28 159Hooghly 33 328 72 354Purulia 40 64 59 170North 24 Parganas 23 201 56 294South 24 Parganas Kolkata
49 298 75 470
Nadia 32 175 45 136Murshidabad 42 203 65 356Uttar Dinajpur 14 34 29 145Dakshin Dinajpur 7 30 29 140Malda 6 94 42 209Jalpaiguri 66 159 44 188Darjeeling 24 136 26 135Cooch Behar 40 38 55 201
Source : Directorate of Census Operations, West Bengal.
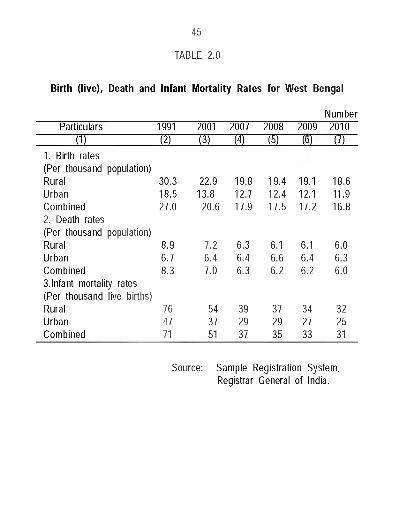
Birth (live). Death and Infant Mortality Rates for West Bengal
Number
45
TABLE 2.0
Particulars 1991 2001 2007 2008 2009 2010(1) (2) (3) (4) (5) (t>) (/)
1. Birth rates(Per thousand population)Rural 30.3 22.9 19.8 19.4 19.1 18.6Urban 18.5 13.8 12.7 12.4 12.1 11.9Combined 27.0 20.6 17.9 17.5 17.2 16.82. Death rates(Per thousand population)Rural 8.9 7.2 6.3 6.1 6.1 6.0Urban 6.7 6.4 6.4 6.6 6.4 6.3Combined 8.3 7.0 6.3 6.2 6.2 6.03.Infant mortality rates (Per thousand live births) Rural 76 54 39 37 34 32Urban 47 37 29 29 27 25Combined 71 51 37 35 33 31
Source: Sample Registration System, Registrar General of India.
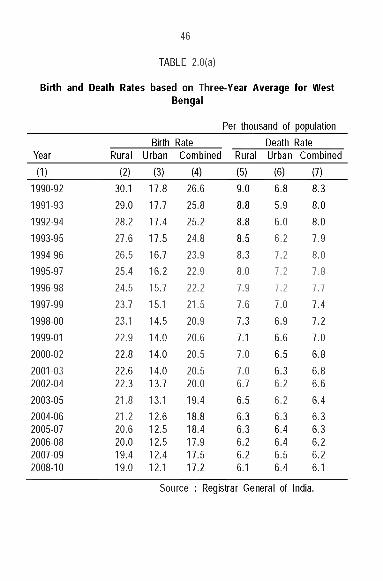
Birth and Death Rates based on Three-Year Average for West Bengal
Per thousand of population Birth Rate Death Rate
46
TABLE 2.0(a)
Year Rural Urban Combined Rural Urban Combined(1) (2) (3) (4) (5) (6) (7)
1990-92 30.1 17.8 26.6 9.0 6.8 8.31991-93 29.0 17.7 25.8 8.8 5.9 8.01992-94 28.2 17.4 25.2 8.8 6.0 8.01993-95 27.6 17.5 24.8 8.5 6.2 7.91994-96 26.5 16.7 23.9 8.3 7.2 8.01995-97 25.4 16.2 22.9 8.0 7.2 7.81996-98 24.5 15.7 22.2 7.9 7.2 7.71997-99 23.7 15.1 21.5 7.6 7.0 7.41998-00 23.1 14.5 20.9 7.3 6.9 7.21999-01 22.9 14.0 20.6 7.1 6.6 7.02000-02 22.8 14.0 20.5 7.0 6.5 6.82001-03 22.6 14.0 20.5 7.0 6.3 6.82002-04 22.3 13.7 20.0 6.7 6.2 6.62003-05 21.8 13.1 19.4 6.5 6.2 6.42004-06 21.2 12.6 18.8 6.3 6.3 6.32005-07 20.6 12.5 18.4 6.3 6.4 6.32006-08 20.0 12.5 17.9 6.2 6.4 6.22007-09 19.4 12.4 17.5 6.2 6.5 6.22008-10 19.0 12.1 17.2 6.1 6.4 6.1
Source : Registrar General of India.
Number
A1
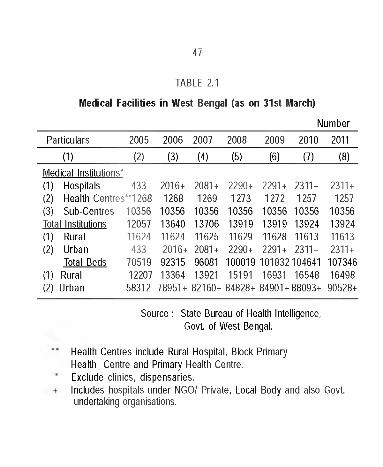
TABLE 2.1
Medical Facilities in West Bengal (as on 31st March)
Particulars 2005 2006 2007 2008 2009 2010 2011
(1) (2) (3) (4) (5) (6) (7) (8)Medical Institutions’(1) Hospitals 433 2016+ 2081 + 2290+ 2291 + 2311 + 2311 +(2) Health Centresi"12 68 1268 1269 1273 1272 1257 1257(3) Sub-Centres 10356 10356 10356 10356 10356 10356 10356Total Institutions 12057 13640 13706 13919 13919 13924 13924(1) Rural 11624 11624 11625 11629 11628 11613 11613(2) Urban 433 2016+ 2081 + 2290+ 2291 + 2311 + 2311 +
Total Beds 70519 92315 96081 100019 101832104641 107346(1) Rural 12207 13364 13921 15191 16931 16548 16498(2) Urban 58312 78951+ 82160+ 84828+ 84901 + 88093+ 90528+
Source : State Bureau of Health Intelligence,Govt, of West Bengal.
Health Centres include Rural Hospital, Block Primary Health Centre and Primary Health Centre.Exclude clinics, dispensaries.Includes hospitals under NGO/ Private, Local Body and also Govt, undertaking organisations.
48
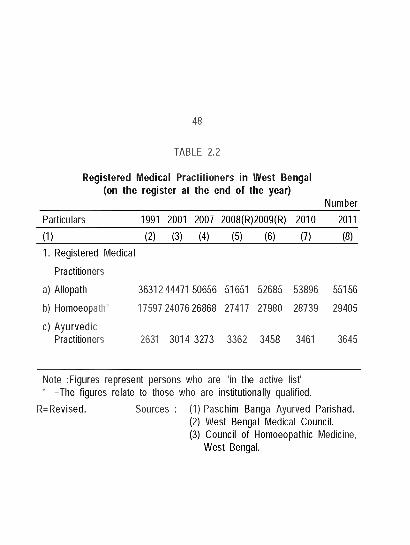
TABLE 2.2
Registered Medical Practitioners in West Bengal (on the register at the end of the year)
NumberParticulars 1991 2001 2007 2008(R)2009(R) 2010 2011
(1) (2) (3) (4) (5) (6) (7) (8)1. Registered Medical
Practitioners
a) Allopath 3631244471 50656 51651 52685 53896 55156
b) Homoeopath* 17597 24076 26868 27417 27980 28739 29405
c) Ayurvedic Practitioners 2631 3014 3273 3362 3458 3461 3645
Note : Figures represent persons who are "in the active list"• =The figures relate to those who are institutionally qualified.
R=Revised. Sources : (1) Paschim Banga Ayurved Parishad.(2) West Bengal Medical Council.(3) Council of Homoeopathic Medicine,
West Bengal.
49
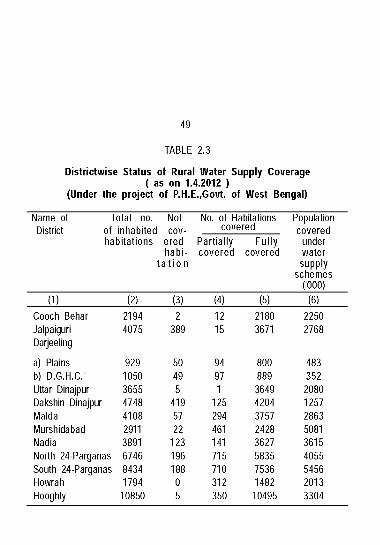
TABLE 2.3
Districtwise Status of Rural W ater Supply Coverage ( as on 1.4.2012 )
(Under the project of P.H.E.,Govt. of West Bengal)
Name of Total no. NotDistrict o f inhabited cov-
habita tions ered Partia lly habi- covered
ta t io n
No. of Habitations covered
F u llycovered
Populationcovered
underwatersupply
schemes('000)
(1) (2) (3) (4) (5) (6)Cooch Behar 2194 2 12 2180 2250JalpaiguriDarjeeling
4075 389 15 3671 2768
a) Plains 929 50 94 800 483b) D.G.H.C.’ 1050 49 97 889 352Uttar Dinajpur 3655 5 1 3649 2080Dakshin Dinajpur 4748 419 125 4204 1257Malda 4108 57 294 3757 2863Murshidabad 2911 22 461 2428 5081Nadia 3891 123 141 3627 3615North 24-Parganas 6746 196 715 5835 4055South 24-Parganas 8434 188 710 7536 5456Howrah 1794 0 312 1482 2013Hooghly 10850 5 350 10495 3304
50
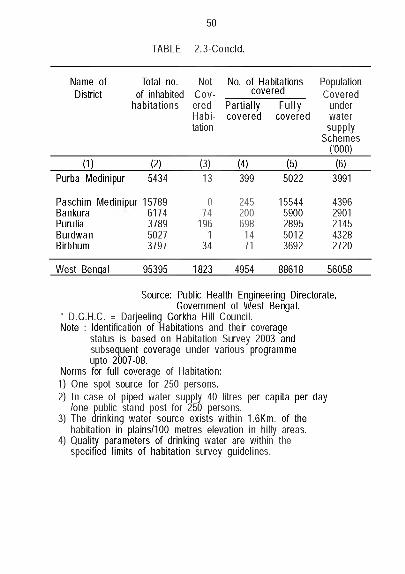
TABLE 2.3-Concld.
Name of Total no. Not No. of Habitations PopulationDistrict of inhabited C ov covered Covered
habitations ered Partially F u lly underH abi covered covered watertation supply
Schemes('000)
(1) (2) (3) (4) (5) (6)Purba Medinipur 5434 13 399 5022 3991
Paschim Medinipur 15789 0 245 15544 4396Bankura 6174 74 200 5900 2901Purulia 3789 196 698 2895 2145Burdwan 5027 1 14 5012 4328Birbhum 3797 34 71 3692 2720
West Bengal 95395 1823 4954 88618 56058
Source: Public Health Engineering Directorate, Government of West Bengal.
• D.G.H.C. = Darjeeling Gorkha Hill Council.Note : Identification of Habitations and their coverage
status is based on Habitation Survey 2003 and subsequent coverage under various programme upto 2007-08.
Norms for full coverage of Habitation:1) One spot source for 250 persons.2) In case of piped water supply 40 litres per capita per day
/one public stand post for 250 persons.3) The drinking water source exists within 1.6Km. of the
habitation in plains/100 metres elevation in hilly areas.4) Quality parameters of drinking water are within the
specified limits of habitation survey guidelines.
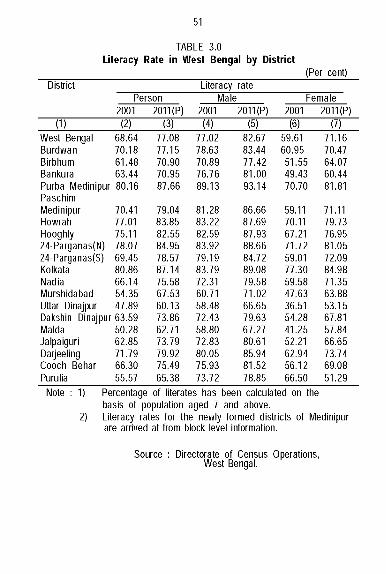
TABLE 3.0Literacy Rate in West Bengal by District
(Per cent)District Literacy rate
Person M a li Female
51
2001 2011(P) 2001 2011(P) 2001 2011(P)(1) (2) (3) (4) (5) (6) (7)—
West Bengal 68.64 77.08 77.02 82.67 59.61 71.16Burdwan 70.18 77.15 78.63 83.44 60.95 70.47Birbhum 61.48 70.90 70.89 77.42 51.55 64.07Bankura 63.44 70.95 76.76 81.00 49.43 60.44Purba Medinipur 80.16 87.66 89.13 93.14 70.70 81.81 PaschimMedinipur 70.41 79.04 81.28 86.66 59.11 71.11Howrah 77.01 83.85 83.22 87.69 70.11 79.73Hooghly 75.11 82.55 82.59 87.93 67.21 76.9524-Parganas(N) 78.07 84.95 83.92 88.66 71.72 81.0524-Parganas(S) 69.45 78.57 79.19 84.72 59.01 72.09Kolkata 80.86 87.14 83.79 89.08 77.30 84.98Nadia 66.14 75.58 72.31 79.58 59.58 71.35Murshidabad 54.35 67.53 60.71 71.02 47.63 63.88Uttar Dinajpur 47.89 60.13 58.48 66.65 36.51 53.15Dakshin Dinajpur 63.59 73.86 72.43 79.63 54.28 67.81Malda 50.28 62.71 58.80 67.27 41.25 57.84Jalpaiguri 62.85 73.79 72.83 80.61 52.21 66.65Darjeeling 71.79 79.92 80.05 85.94 62.94 73.74Cooch Behar 66.30 75.49 75.93 81.52 56.12 69.08Purulia__________ 55.57 65.38 73.72 78.85 66.50 51.29
Note : 1) Percentage of literates has been calculated on the basis of population aged 7 and above.
2) Literacy rates for the newly formed districts of Medinipur are arrived at from block level information.
Source : Directorate of Census Operations,West Bengal.
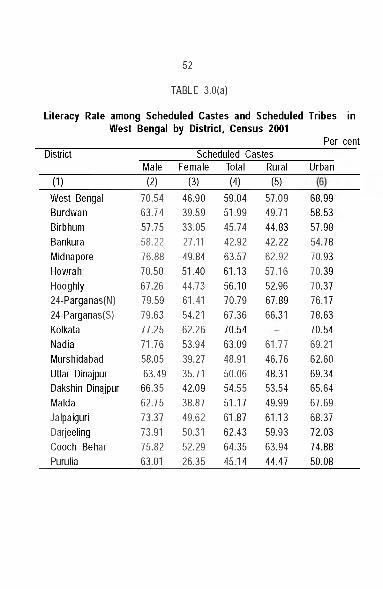
52
Literacy Rate among Scheduled Castes and Scheduled West Bengal by District, Census 2001
TABLE 3.0(a)
Tribes in
Per centDistrict Scheduled Castes
IVIale Female Total Rural Urban(1) (2) (3) (4) (5)
West BengalBurdwanBirbhumBankuraMidnaporeHowrahHooghly24-Parganas(N)24-Parganas(S)KolkataNadiaMurshidabad Uttar Dinajpur Dakshin Dinajpur Malda Jalpaiguri Darjeeling Cooch Behar Purulia
70.5463.7457.75 58.22 76.88 70.50 67.26 79.59 79.63 77.2571.76 58.05 63.49
66.35 62.75 73.37 73.91 75.82 63.01
46.9039.5933.0527.1149.8451.40 44.7361.41 54.21 62.26 53.94 39.27 35.71 42.09 38.87 49.62 50.31 52.29 26.35
59.0451.9945.7442.9263.5761.13 56.10 70.79 67.3670.54 63.09 48.91 50.0654.55 51.17 61.87 62.43 64.3545.14
57.0949.7144.8342.2262.92 57.16 52.96 67.8966.31
61.7746.7648.31 53.54 49.99 61.1359.9363.94 44.47
68.9958.53 57.98 54.78 70.93 70.3970.37 76.1778.6370.54 69.21 62.60 69.3465.64 67.6968.37 72.03 74.88 50.08
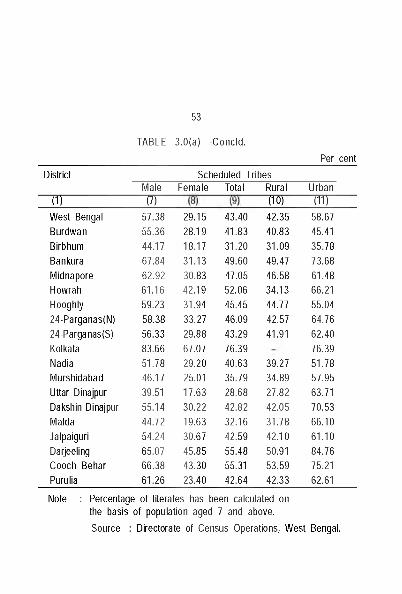
53
TABLE 3.0(a) -Concld.Per cent
District
■ w
Scheduled TribesIVIale
I T TFemale Total Rural
WUrban
- m rWest BengalBurdwanBirbhumBankuraMidnaporeHowrahHooghly24-Parganas(N)24-Parganas(S)KolkataNadiaMurshidabad Uttar Dinajpur Dakshin Dinajpur Malda Jalpaiguri Darjeeling Cooch Behar Purulia
57.38 55.3644.17 67.84 62.92 61.1659.2358.38 56.33 83.66 51.7846.17 39.51 55.14 44.7254.24 65.0766.38 61.26
29.1528.19 18.17 31.13 30.8342.19 31.94 33.27 29.88 67.0729.20 25.0117.63 30.2219.63 30.67 45.85 43.30 23.40
43.4041.8331.2049.6047.0552.06 45.45 46.09 43.29 76.3940.63 35.79 28.68 42.82 32.16 42.59 55.48 55.3142.64
42.3540.8331.09 49.4746.58 34.1344.77 42.5741.91
39.2734.8927.8242.0531.7842.1050.9153.59 42.33
58.67 45.4135.7873.68 61.48 66.21 55.0464.76 62.40 76.3951.78 57.95 63.71 70.53 66.10 61.1084.76 75.21 62.61
Note : Percentage of literates has been calculated on the basis of population aged 7 and above.Source : Directorate of Census Operations, West Bengal.
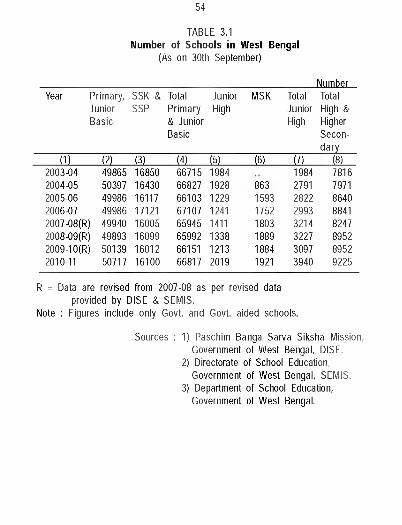
TABLE 3.1 Number of Schools in West Bengal
(As on 30th September)
54
NumberYear Primary,
Junior Basic
SSK & SSP
Total Primary & Junior Basic
JuniorHigh
MSK TotalJuniorHigh
Total High & Higher Secondary
(1) (2) (3) (4) (5) (6) (7) (8)2003-04 49865 16850 66715 1984 1984 78162004-05 50397 16430 66827 1928 863 2791 79712005-06 49986 16117 66103 1229 1593 2822 86402006-07 49986 17121 67107 1241 1752 2993 88412007-08(R) 49940 16005 65945 1411 1803 3214 82472008-09(R) 49893 16099 65992 1338 1889 3227 89522009-10(R) 50139 16012 66151 1213 1884 3097 89522010-11 50717 16100 66817 2019 1921 3940 9225
R = Data are revised from 2007-08 as per revised data provided by DISE & SEIVIIS.
Note : Figures include only Govt, and Govt, aided schools.
Sources : 1) Paschim Banga Sarva Siksha Mission, Government of West Bengal, DISE.
2) Directorate of School Education, Government of West Bengal, SEMIS.
3) Department of School Education, Government of West Bengal.
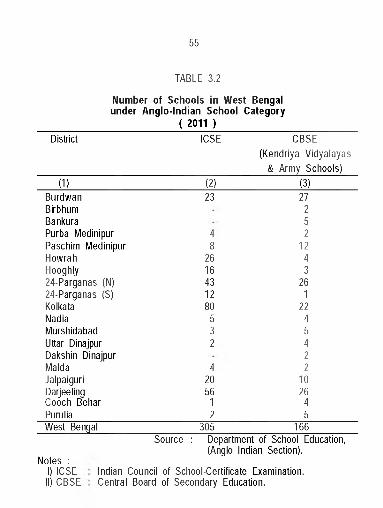
55
Number of Schools in W est Bengal under Anglo-Indian School Category
TABLE 3.2
( 2011 )
District ICSE CBSE (Kendriya Vidyalayas
& Army Schools)(1) (2) (3)
Burdwan 23 27Birbhum 2Bankura 5Purba Medinipur 4 2Paschim Medinipur 8 12Howrah 26 4Hooghly 16 324-Parganas (N) 43 2624-Parganas (S) 12 1Kolkata 80 22Nadia 5 4Murshidabad 3 5Uttar Dinajpur 2 4Dakshin Dinajpur 2Malda 4 2Jalpaiguri 20 10Darjeeling 56 26Cooch Behar 1 4Purulia 2 5West Bengal 305 166
Source : Department of School Education, (Anglo Indian Section).
Indian Council of School-Certificate Examination.Central Board of Secondary Education.
Notes :I) ICSEII) CBSE
56
TABLE 3.3
Enrolment in General Educational Institutions by stages in West Bengal
(as on 30th September)In number
Year Primary, Junior Basic
(Class 1 - V)
Junior High
(Class VI - VIII)
High and Higher Secondary
(Class IX - XII)(1) (2) (3) (4)
2003-04 10327725 3818261 22347722004-05 9881352 3622026 22029322005-06 9150073 3624219 25348342006-07 8862119 3844699 25004162007-08(R) 8621967 3848654 24647102008-09(R) 8315923 4010035 26943712009-10(R) 7875506 4104555 30483432010-11 • 6050119 5932571 3524568
Note : Figures exclude enrolment in SSK, SSP, MSK and unaided schools.• Primary Enrolement = I -IV & Upper Primary Enrolement = V- VIII R = Data are revised from 2007-08 as per revised data
provided by DISE & SEMIS.Sources: 1) Paschim Banga Sarva Siksha Mission,
Government of West Bengal, DISE.2) Directorate of School Education,
Government of West Bengal, SEMIS.3) Department of School Education,
Government of West Bengal.
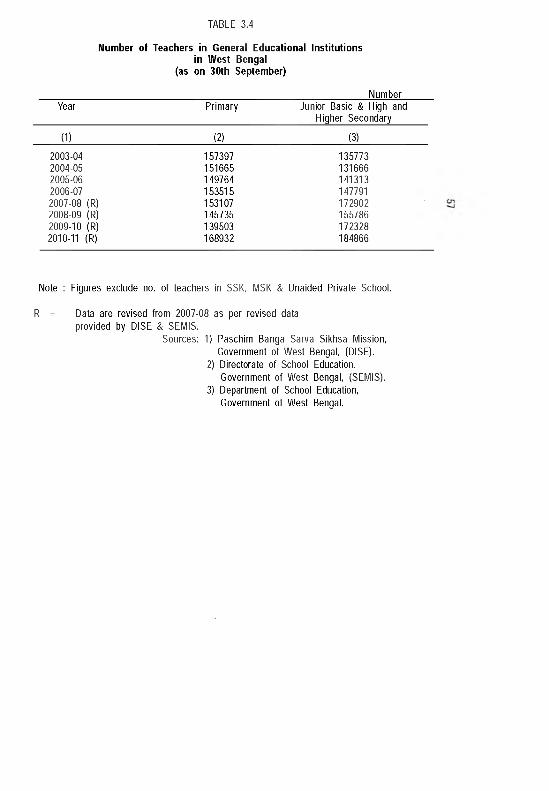
TABLE 3.4
Number of Teachers in General Educational Institutionsin West Bengal
(as on 30th September)
NumberYear Primary Junior Basic & High and
Higher Secondary
(1) (2) (3)
2003-04 157397 1357732004-05 151665 1316662005-06 149764 1413132006-07 153515 1477912007-08 (R) 153107 1729022008-09 (R) 145735 1557862009-10 (R) 139503 1723282010-11 (R) 168932 184866
Note : Figures exclude no. of teachers in SSK, IVISK & Unaided Private School.
R = Data are revised from 2007-08 as per revised data provided by DISE & SEMIS.
Sources: 1) Paschim Banga Sarva Sikhsa Mission, Government of West Bengal, (DISE).
2) Directorate of School Education. Government of West Bengal, (SEMIS).
3) Department of School Education, Government of West Bengal.
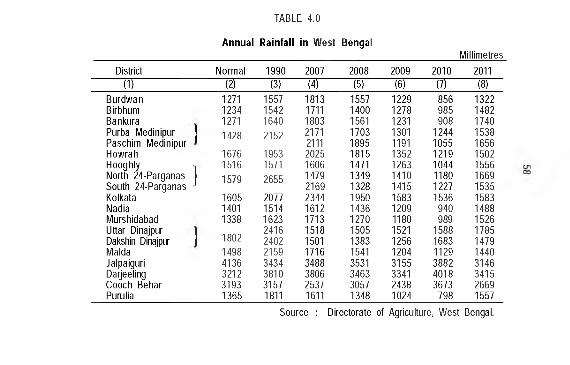
TABLE 4.0
Annual Rainfall in West BengalMillimetres
District Normal 1990 2007 2008 2009 2010 2011(1) (2) (3) (4) (5) (6) (7) (8)
Burdwan 1271 1557 1813 1557 1229 856 1322Birbhum 1234 1542 1711 1400 1278 985 1482Bankura 1271 1640 1803 1561 1231 908 1740Purba Medinipur Paschim Medinipur
1428 2152 21712111
17031895
13011191
12441055
15381656
Howrah 1676 1953 2025 1815 1352 1219 1502HooghlyNorth 24-Parganas South 24-Parganas
15161579
15712655
160614792169
147113491328
126314101415
104411801227
155616691535
Kolkata 1605 2077 2344 1950 1583 1536 1583Nadia 1401 1514 1612 1436 1209 940 1488Murshidabad 1338 1623 1713 1270 1180 989 1526Uttar Dinajpur
18022416 1518 1505 1521 1588 1785
Dakshin Dinajpur 2402 1501 1383 1256 1683 1479Malda 1498 2159 1716 1541 1204 1129 1440Jalpaiguri 4136 3434 3488 3531 3155 3882 3146Darjeeling 3212 3810 3806 3463 3341 4018 3415Cooch Behar 3193 3157 2537 3057 2438 3673 2669Purulia 1365 1811 1611 1348 1024 798 1557
Source : Directorate of Agriculture, West Bengal.
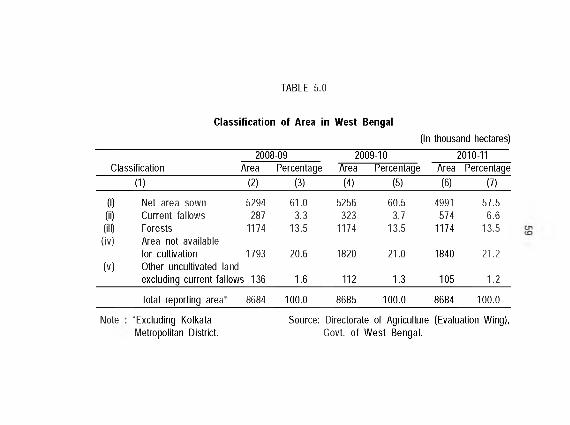
TABLE 5.0
Classification of Area in West Bengal(In thousand hectares)
2008-09 2009-10 2010-11Classification Area Percentage Area Percentage Area Percentage
(1) (2) (3) (4) (5) (6) (7)
(1) Net area sown 5294 61.0 5256 60.5 4991 57.5(ii) Current fallows 287 3.3 323 3.7 574 6.6(ill) Forests 1174 13.5 1174 13.5 1174 13.5(iv) Area not available
for cultivation 1793 20.6 1820 21.0 1840 21.2(V) Other uncultivated land
excluding current fallows 136 1.6 112 1.3 105 1.2
Total reporting area* 8684 100.0 8685 100.0 8684 100.0
Note •Excluding Kolkata Metropolitan District.
Source: Directorate of Agriculture (Evaluation Wing), Govt, o f W est Bengal.
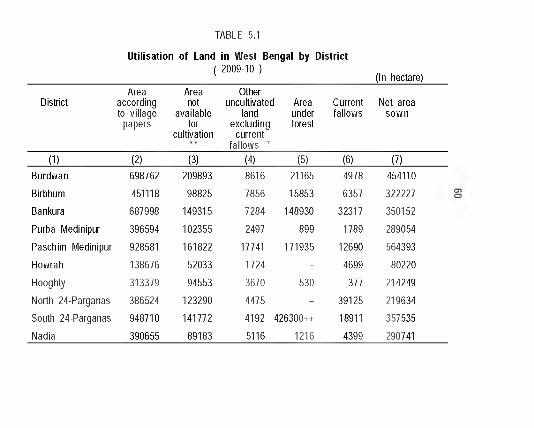
TABLE 5.1
Utilisation of Land in West Bengal by District( 2009-10 )
(In hectare)
DistrictArea
according to village
papers
Areanot
availablefor
cultivation
Otheruncultivated
landexcluding
currentfa llows’ "
Areaunderforest
Currentfallows
Net area sown
(1) (2) (3) (4) (5) (6) (7)Burdwan 698762 209893 8616 21165 4978 454110
Birbhum 451118 98825 7856 15853 6357 322227
Banl<ura 687998 149315 7284 148930 32317 350152
Purba IVIedinipur 396594 102355 2497 899 1789 289054
Paschim IVIedinipur 928581 161822 17741 171935 12690 564393
Howrah 138676 52033 1724 - 4699 80220
Hooghly 313379 94553 3670 530 377 214249
North 24-Parganas 386524 123290 4475 - 39125 219634
South 24-Parganas 948710 141772 4192 426300++ 18911 357535
Nadia 390655 89183 5116 1216 4399 290741
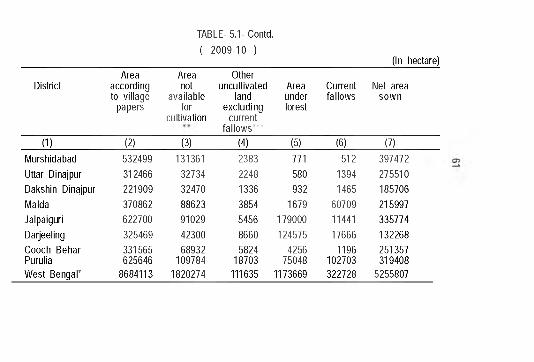
TABLE- 5.1-Contd. ( 2009-10 )
(In hectare)
DistrictArea
according to village
papers
Areanot
availablefor
cultivation
Otheruncultivated
landexcluding
currentfa llow s’ "
Areaunderforest
Currentfallows
Net area sown
(1) (2) (3) (4) (5) (6) (7)IVIurshidabad 532499 131361 2383 771 512 397472Uttar Dinajpur 312466 32734 2248 580 1394 275510Dal<shin Dinajpur 221909 32470 1336 932 1465 185706IVIalda 370862 88623 3854 1679 60709 215997Jalpaiguri 622700 91029 5456 179000 11441 335774Darjeeling 325469 42300 8660 124575 17666 132268Cooch Behar 331565 68932 5824 4256 1196 251357Purulia 625646 109784 18703 75048 102703 319408West Bengal* 8684113 1820274 111635 1173669 322728 5255807
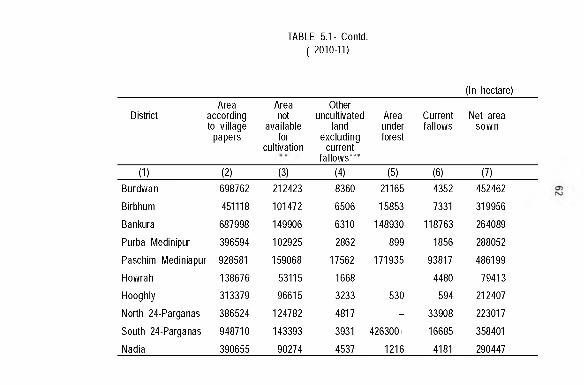
TABLE 5.1- Contd. ( 2010-11)
(In hectare)
DistrictArea
according to village
papers
Areanot
availablefor
cultivation
Otheruncultivated
landexcluding
currentfa llows’ "
Areaunderforest
Currentfallows
Net area sown
(1) (2) (3) (4) (5) (6) (7)Burdwan 698762 212423 8360 21165 4352 452462
Birbhum 451118 101472 6506 15853 7331 319956
Banl<ura 687998 149906 6310 148930 118763 264089
Purba IVIedinipur 396594 102925 2862 899 1856 288052
Paschim IViediniapur 928581 159068 17562 171935 93817 486199
Howrah 138676 53115 1668 - 4480 79413
Hooghly 313379 96615 3233 530 594 212407
North 24-Parganas 386524 124782 4817 - 33908 223017
South 24-Parganas 948710 143393 3931 426300+ 16685 358401
Nadia 390655 90274 4537 1216 4181 290447
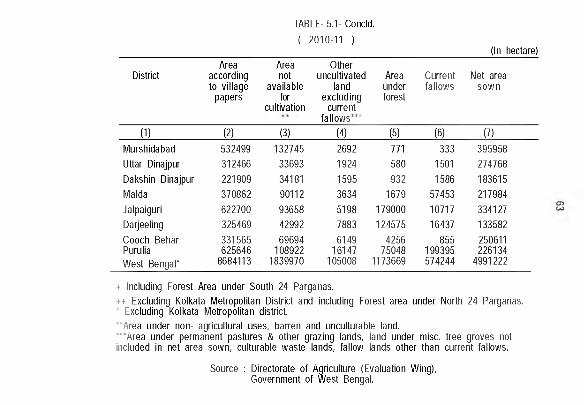
TABLE- 5.1-Concld.( 2010-11 )
(In hectare)
DistrictArea
according to village
papers
Areanot
availablefor
cultivation
Otheruncultivated
landexcluding
currentfa llows’ "
Areaunderforest
Currentfallows
Net area sown
(1) (2) (3) (4) (5) (6) (7)Murshidabad 532499 132745 2692 771 333 395958Uttar Dinajpur 312466 33693 1924 580 1501 274768Dakshin Dinajpur 221909 34181 1595 932 1586 183615Malda 370862 90112 3634 1679 57453 217984Jalpaiguri 622700 93658 5198 179000 10717 334127Darjeeling 325469 42992 7883 124575 16437 133582Cooch Behar 331565 69694 6149 4256 855 250611Purulia 625646 108922 16147 75048 199395 226134West Bengal* 8684113 1839970 105008 1173669 574244 4991222
+ Including Forest Area under South 24 Parganas.++ Excluding Kolkata Metropolitan District and including Forest area under North 24 Parganas.• Excluding Kolkata Metropolitan district."A rea under non- agricultural uses, barren and unculturable land.•"A rea under permanent pastures & other grazing lands, land under misc. tree groves not included in net area sown, culturable waste lands, fallow lands other than current fallows.
Source : Directorate of Agriculture (Evaluation Wing),Government of West Bengal.
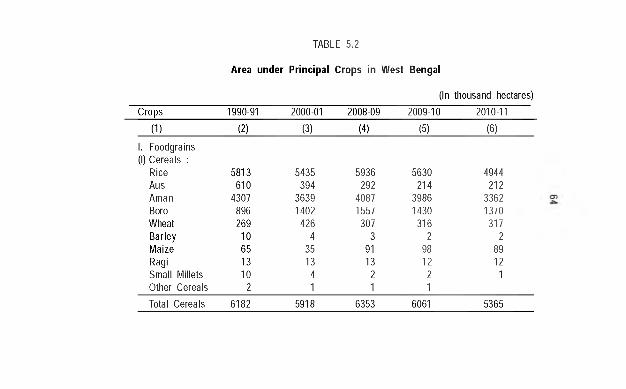
TABLE 5.2
Area under Principal Crops in West Bengal
(In thousand hectares)Crops 1990-91 2000-01 2008-09 2009-10 2010-11
(1) (2) (3) (4) (5) (6)1. Foodgrains (1) Cereals :
Rice 5813 5435 5936 5630 4944Aus 610 394 292 214 212Aman 4307 3639 4087 3986 3362Boro 896 1402 1557 1430 1370Wheat 269 426 307 316 317Barley 10 4 3 2 2Maize 65 35 91 98 89Ragi 13 13 13 12 12Small Millets 10 4 2 2 1Other Cereals 2 1 1 1Total Cereals 6182 5918 6353 6061 5365
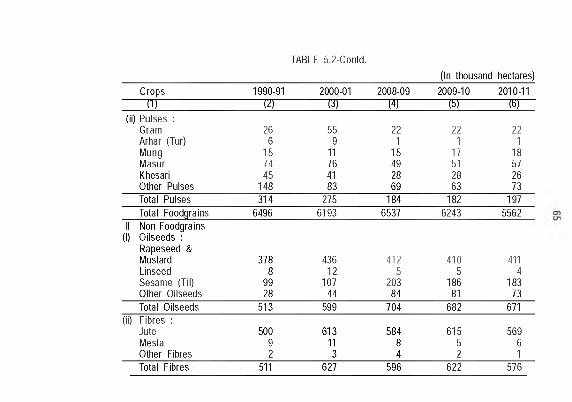
TABLE 5.2-Contd.(In thousand hectares)
Crops 1990-91 2000-01 2008-09 2009-10 2010-11 “ T H ----------------------------------------(2)-------------------- (3)-------------------P)-------------------(5)-------------------(5)—
(ii) Pulses :Gram 26 55 22 22 22Arhar (Tur) 6 9 1 1 1Mung 15 11 15 17 18Masur 74 76 49 51 57Khesari 45 41 28 28 26Other Pulses 148 83 69 63 73Total Pulses 314 275 184 182 197Total Foodgralns 6496 6193 6537 6243 5562
II Non-Foodgralns(1) Oilseeds :
Rapeseed &Mustard 378 436 412 410 411Linseed 8 12 5 5 4Sesame (Til) 99 107 203 186 183Other Oilseeds 28 44 84 81 73Total Oilseeds 513 599 704 682 671
(ii) Fibres :Jute 500 613 584 615 569Mesta 9 11 8 5 6Other Fibres 2 3 4 2 1Total Fibres 511 627 596 622 576
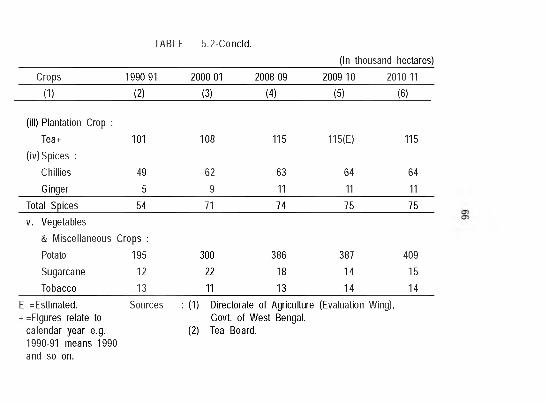
TABLE 5.2-Concld.(In thousand hectares)
Crops 1990-91 2000-01 2008-09 2009-10 2010-11
(1) (2) (3) (4) (5) (6)
(ill) Plantation Crop :Tea+ 101 108 115 115(E) 115
(iv)Spices :Chillies 49 62 63 64 64Ginger 5 9 11 11 11
Total Spices 54 71 74 75 75V . Vegetables
& Miscellaneous Crops :Potato 195 300 386 387 409Sugarcane 12 22 18 14 15Tobacco 13 11 13 14 14
E =Estlmated.+ =Flgures relate to
calendar year e.g. 1990-91 means 1990 and so on.
Sources : (1) Directorate of Agriculture (Evaluation Wing), Govt, of West Bengal.
(2) Tea Board.
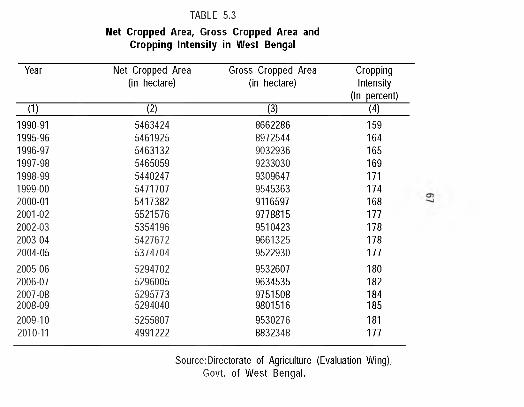
TABLE 5.3Net Cropped Area, Gross Cropped Area and
Cropping Intensity in West Bengal
Year Net Cropped Area (in hectare)
Gross Cropped Area (in hectare)
Cropping Intensity
(In percent)(1) (2) (3) (4)
1990-91 5463424 8662286 1591995-96 5461925 8972544 1641996-97 5463132 9032936 1651997-98 5465059 9233030 1691998-99 5440247 9309647 1711999-00 5471707 9545363 1742000-01 5417382 9116597 1682001-02 5521576 9778815 1772002-03 5354196 9510423 1782003-04 5427672 9661325 1782004-05 5374704 9522930 1772005-06 5294702 9532607 1802006-07 5296005 9634535 1822007-08 5295773 9751508 1842008-09 5294040 9801516 1852009-10 5255807 9530276 1812010-11 4991222 8832348 177
Source:Directorate of Agriculture (Evaluation Wing), Govt, o f W est Bengal.
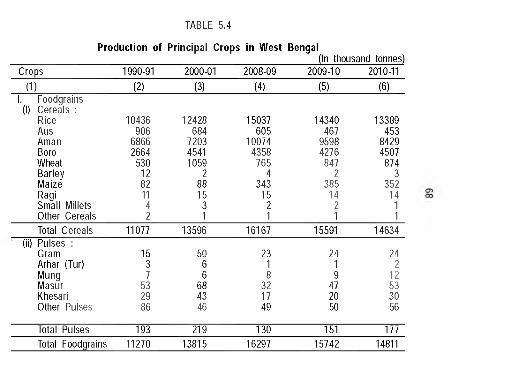
TABLE 5.4
Production of Principal Crops in W est Bengal(In thousand tonnes)
Crops 1990-91 2000-01 2008-09 2009-10 2010-11(1) (2) (3) (4) (5) (6)
1. Foodgrains (1) Cereals :
Rice 10436 12428 15037 14340 13389Aus 906 684 605 467 453Aman 6866 7203 10074 9598 8429Boro 2664 4541 4358 4276 4507Wheat 530 1059 765 847 874Barley 12 2 4 2 3Maize 82 88 343 385 352Ragi 11 15 15 14 14Small Millets 4 3 2 2 1Other Cereals 2 1 1 1 1Total Cereals 11077 13596 16167 15591 14634
(ii) Pulses :Gram 15 50 23 24 24Arhar (Tur) 3 6 1 1 2Mung 7 6 8 9 12Masur 53 68 32 47 53Khesari 29 43 17 20 30Other Pulses 86 46 49 50 56
Total Pulses 193 219 130 151 177Total Foodgrains 11270 13815 16297 15742 14811
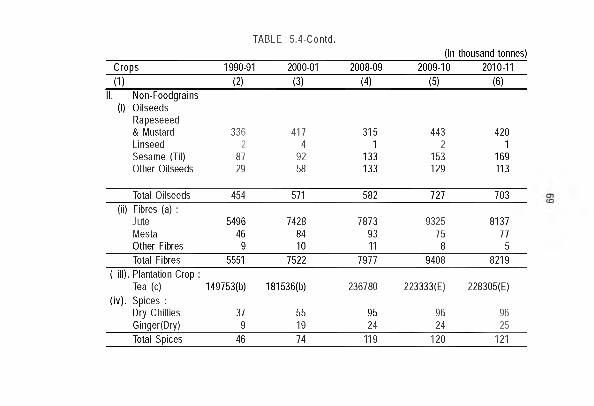
TABLE 5.4-Contd.(In thousand tonnes)
Crops 1990-91 2000-01 2008-09 2009-10 2010-11(1) (2) (3) (4) (5) (6)
II. Non-Foodgrains (1) Oilseeds
Rapeseeed& Mustard 336 417 315 443 420Linseed 2 4 1 2 1Sesame (Til) 87 92 133 153 169Other Oilseeds 29 58 133 129 113
Total Oilseeds 454 571 582 727 703(ii) Fibres (a) :
Jute 5496 7428 7873 9325 8137Mesta 46 84 93 75 77Other Fibres 9 10 11 8 5Total Fibres 5551 7522 7977 9408 8219
( ill). Plantation Crop :Tea (c) 149753(b) 181536(b) 236780 223333(E) 228305(E)
(iv). Spices :Dry Chillies 37 55 95 96 96Ginger(Dry) 9 19 24 24 25Total Spices 46 74 119 120 121
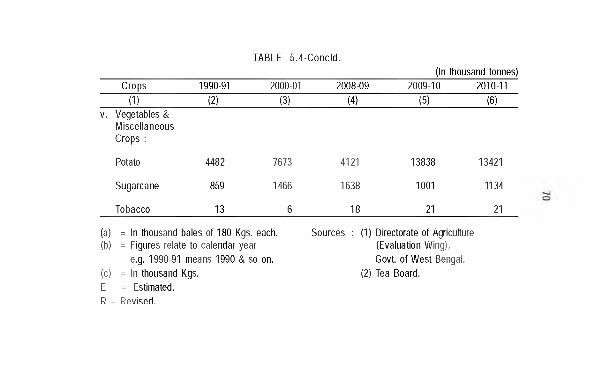
TABLE 5.4-Concld.(In thousand tonnes)
Crops 1990-91 2000-01 2008-09 2009-10 2010-11(1) (2) (3) (4) (5) (6)
V . Vegetables & Miscellaneous Crops :
Potato 4482 7673 4121 13838 13421
Sugarcane 859 1466 1638 1001 1134
Tobacco 13 6 18 21 21
(a) = In thousand bales of 180 Kgs. each. Sources : (1) Directorate of Agriculture(b) = Figures relate to calendar year (Evaluation Wing),
e.g. 1990-91 means 1990 & so on. Govt, of West Bengal.(c) = In thousand Kgs. (2) Tea Board.E = Estimated.R = Revised.
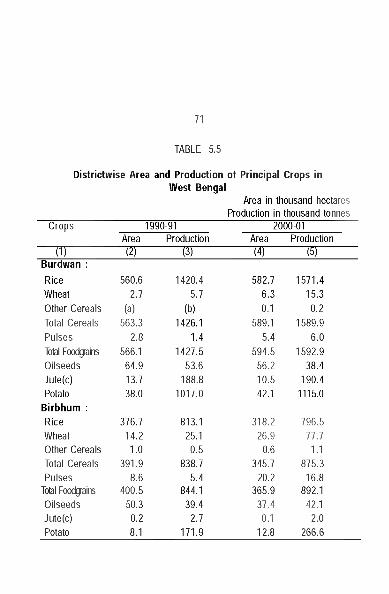
71
TABLE 5.5
Districtwise Area and Production of Principal Crops in West Bengal
Area in thousand hectaresProduction in thousand tonnes
Crops 1990-91 2000-01Area Production Area Production
(1) (2) (3) (4) (5)Burdwan :Rice 560.6 1420.4 582.7 1571.4Wheat 2.7 5.7 6.3 15.3Other Cereals (a) (b) 0.1 0.2Total Cereals 563.3 1426.1 589.1 1589.9Pulses 2.8 1.4 5.4 6.0Total Foodgains 566.1 1427.5 594.5 1592.9Oilseeds 64.9 53.6 56.2 38.4Jute(c) 13.7 188.8 10.5 190.4Potato 38.0 1017.0 42.1 1115.0
Birbhum :Rice 376.7 813.1 318.2 796.5Wheat 14.2 25.1 26.9 77.7Other Cereals 1.0 0.5 0.6 1.1Total Cereals 391.9 838.7 345.7 875.3Pulses 8.6 5.4 20.2 16.8
Total Foodgains 400.5 844.1 365.9 892.1Oilseeds 50.3 39.4 37.4 42.1Jute(c) 0.2 2.7 0.1 2.0Potato 8.1 171.9 12.8 266.6
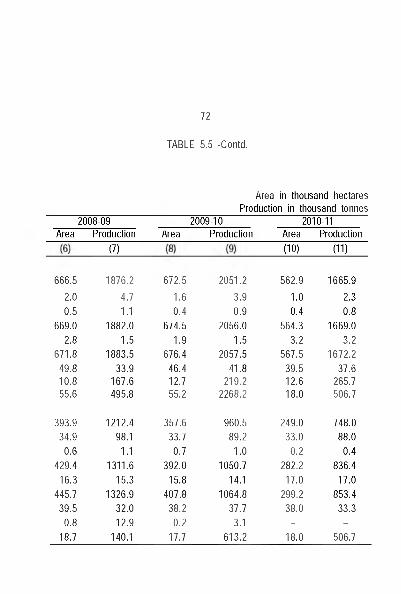
72
TABLE 5.5 -Contd.
Area in thousand hectaresProduction in thousand tonnes
2008-09Area Production
2009-10Area Production
2010-11Area Production
(7) (10) (11)
666.5 1876.2 672.5 2051.2 562.9 1665.92.0 4.7 1.6 3.9 1.0 2.30.5 1.1 0.4 0.9 0.4 0.8
669.0 1882.0 674.5 2056.0 564.3 1669.02.8 1.5 1.9 1.5 3.2 3.2
671.8 1883.5 676.4 2057.5 567.5 1672.249.8 33.9 46.4 41.8 39.5 37.610.8 167.6 12.7 219.2 12.6 265.755.6 495.8 55.2 2268.2 18.0 506.7
393.9 1212.4 357.6 960.5 249.0 748.034.9 98.1 33.7 89.2 33.0 88.0
0.6 1.1 0.7 1.0 0.2 0.4429.4 1311.6 392.0 1050.7 282.2 836.4
16.3 15.3 15.8 14.1 17.0 17.0445.7 1326.9 407.8 1064.8 299.2 853.4
39.5 32.0 38.2 37.7 38.0 33.30.8 12.9 0.2 3.1 - -
18.7 140.1 17.7 613.2 18.0 506.7
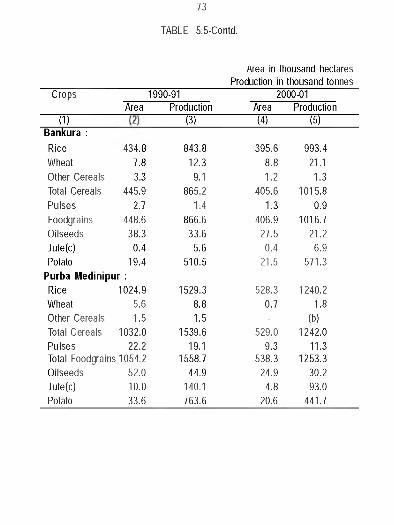
73
TABLE 5.5-Contd.
Area in thousand hectaresProduction in thousand tonnes
Crops
l i T
1990-91Area Production
(3)
2000-01Area
■ WProduction
(5)Bankura :Rice 434.8 843.8 395.6 993.4Wheat 7.8 12.3 8.8 21.1Other Cereals 3.3 9.1 1.2 1.3Total Cereals 445.9 865.2 405.6 1015.8Pulses 2.7 1.4 1.3 0.9Foodgrains 448.6 866.6 406.9 1016.7Oilseeds 38.3 33.6 27.5 21.2Jute(c) 0.4 5.6 0.4 6.9Potato 19.4 510.5 21.5 571.3
Purba Medinipur :Rice 1024.9 1529.3 528.3 1240.2Wheat 5.6 8.8 0.7 1.8Other Cereals 1.5 1.5 - (b)Total Cereals 1032.0 1539.6 529.0 1242.0Pulses 22.2 19.1 9.3 11.3Total Foodgrains 1054.2 1558.7 538.3 1253.3Oilseeds 52.0 44.9 24.9 30.2Jute(c) 10.0 140.1 4.8 93.0Potato 33.6 763.6 20.6 441.7
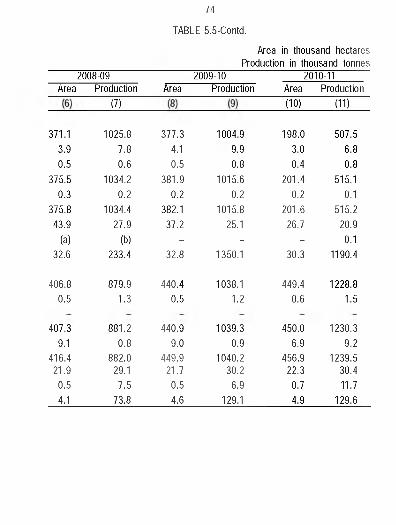
74
TABLE 5.5-Contd.
Area in thousand hectaresProduction in thousand tonnes
2008-09Area Production
2009-10 Area Production
2010-11Area Production
(7) (10) (11)
371.1 1025.8 377.3 1004.9 198.0 507.53.9 7.8 4.1 9.9 3.0 6.80.5 0.6 0.5 0.8 0.4 0.8
375.5 1034.2 381.9 1015.6 201.4 515.10.3 0.2 0.2 0.2 0.2 0.1
375.8 1034.4 382.1 1015.8 201.6 515.243.9 27.9 37.2 25.1 26.7 20.9
(a) (b) - - - 0.132.6 233.4 32.8 1350.1 30.3 1190.4
406.8 879.9 440.4 1038.1 449.4 1228.80.5 1.3 0.5 1.2 0.6 1.5
407.3 881.2 440.9 1039.3 450.0 1230.39.1 0.8 9.0 0.9 6.9 9.2
416.4 882.0 449.9 1040.2 456.9 1239.521.9 29.1 21.7 30.2 22.3 30.4
0.5 7.5 0.5 6.9 0.7 11.74.1 73.8 4.6 129.1 4.9 129.6
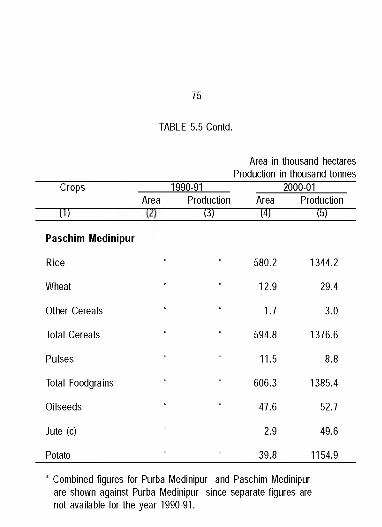
75
TABLE 5.5-Contd.
Area in thousand hectaresProduction in thousand tonnes
Crops 1990-91 2000-01Area Production Area Production
(1) (3) (4) (!))
Paschim Medinipur
Rice * * 580.2 1344.2
Wheat , , 12.9 29.4
Other Cereals , , 1.7 3.0
Total Cereals , , 594.8 1376.6
Pulses , , 11.5 8.8
Total Foodgrains , , 606.3 1385.4
Oilseeds • • 47.6 52.7
Jute (c) , , 2.9 49.6
Potato , , 39.8 1154.9
• Combined figures for Purba iViedinipur and Paschim iViedinipur are shown against Purba IViedinipur since separate figures are not available for the year 1990-91.
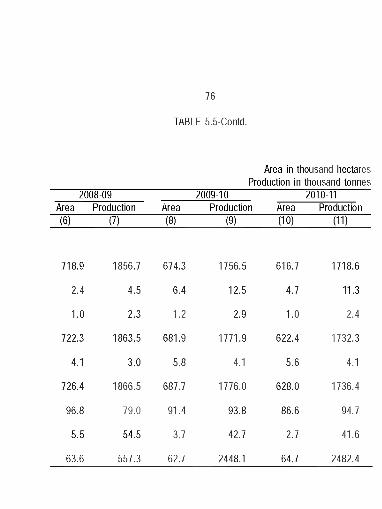
76
TABLE 5.5-Contd.
Area in thousand hectaresProduction in thousand tonnes
2008-09 2009-10 2010-11Area Production Area Production Area Production(6) (7) (8) (9) (10) (11)
718.9 1856.7 674.3 1756.5 616.7 1718.6
2.4 4.5 6.4 12.5 4.7 11.3
1.0 2.3 1.2 2.9 1.0 2.4
722.3 1863.5 681.9 1771.9 622.4 1732.3
4.1 3.0 5.8 4.1 5.6 4.1
726.4 1866.5 687.7 1776.0 628.0 1736.4
96.8 79.0 91.4 93.8 86.6 94.7
5.5 54.5 3.7 42.7 2.7 41.6
63.6 557.3 62.7 2448.1 64.7 2482.4
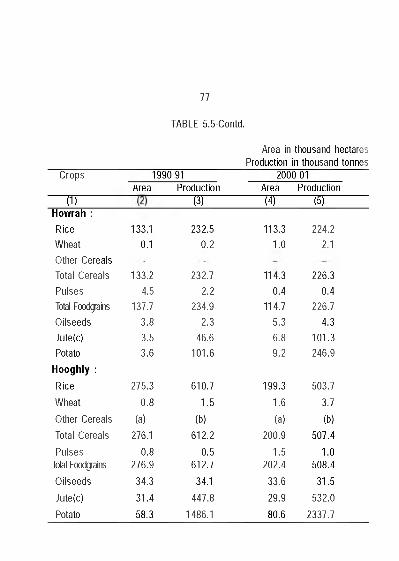
77
TABLE 5.5-Contd.
Area in thousand hectaresProduction in thousand tonnes
Crops 1990-91 2000-01
(1)Howrah :RiceWheatOther CerealsTotal CerealsPulsesTotal FoodgainsOilseedsJute(c)Potato
Hooghly : Rice WheatOther Cereals Total Cereals Pulses
Total Foodgains Oilseeds Jute(c)Potato
Area Production[3)
Area■ W
Production[5)
133.1 0.1
133.24.5
137.73.83.53.6
275.3 0.8
(a)276.1
0.8276.934.331.4 58.3
232.5 0.2
232.7 2.2
234.92.3
46.6101.6
610.7 1.5
(b)612.2
0.5612.7
34.1447.8
1486.1
113.3 1.0
114.3 0.4
114.75.36.89.2
199.3 1.6
(a)200.9
1.5202.4
33.629.980.6
224.2 2.1
226.3 0.4
226.7 4.3
101.3246.9
503.7 3.7
(b)507.4
1.0508.4
31.5532.0
2337.7
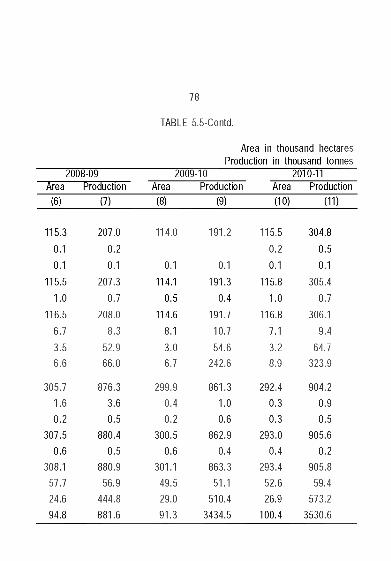
Area in thousand hectares Production in thousand tonnes
2008-09-----------------------------2 0 0T f0 --------------------------------2 0 i m -------------
78
TABLE 5.5-Contd.
Area Production Area Production Area Production(6) (7) (8) (9) (10) (11)
115.3 207.0 114.0 191.2 115.5 304.80.1 0.2 - - 0.2 0.50.1 0.1 0.1 0.1 0.1 0.1
115.5 207.3 114.1 191.3 115.8 305.41.0 0.7 0.5 0.4 1.0 0.7
116.5 208.0 114.6 191.7 116.8 306.16.7 8.3 8.1 10.7 7.1 9.43.5 52.9 3.0 54.6 3.2 64.76.6 66.0 6.7 242.6 8.9 323.9
305.7 876.3 299.9 861.3 292.4 904.21.6 3.6 0.4 1.0 0.3 0.9 0.2 0.5 0.2 0.6 0.3 0.5
307.5 880.4 300.5 862.9 293.0 905.6 0.6 0.5 0.6 0.4 0.4 0.2
308.1 880.9 301.1 863.3 293.4 905.857.7 56.9 49.5 51.1 52.6 59.424.6 444.8 29.0 510.4 26.9 573.294.8 881.6 91.3 3434.5 100.4 3530.6
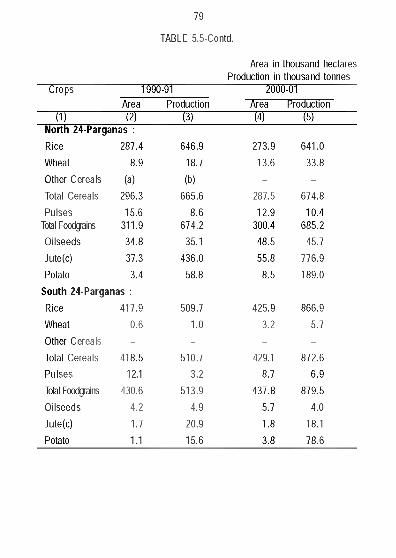
79
TABLE 5.5-Contd.
Area in thousand hectares Production in thousand tonnes
Crops 1990-91 2000-01Area Production Area Production
(1) (2) (3) (4) (5)North 24-Parganas :Rice 287.4 646.9 273.9 641.0Wheat 8.9 18.7 13.6 33.8Other Cereals (a) (b) - -
Total Cereals 296.3 665.6 287.5 674.8Pulses 15.6 8.6 12.9 10.4
Total Foodgains 311.9 674.2 300.4 685.2Oilseeds 34.8 35.1 48.5 45.7Jute(c) 37.3 436.0 55.8 776.9Potato 3.4 58.8 8.5 189.0
South 24-Parganas :Rice 417.9 509.7 425.9 866.9Wheat 0.6 1.0 3.2 5.7Other Cereals - - - -
Total Cereals 418.5 510.7 429.1 872.6Pulses 12.1 3.2 8.7 6.9Total Foodgains 430.6 513.9 437.8 879.5Oilseeds 4.2 4.9 5.7 4.0Jute(c) 1.7 20.9 1.8 18.1Potato 1.1 15.6 3.8 78.6
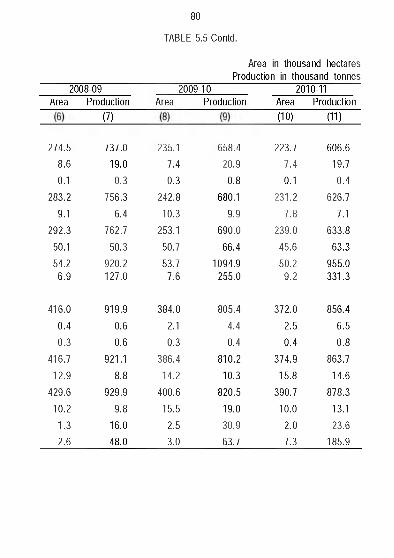
80
TABLE 5.5-Contd.
Area in thousand hectaresProduction in thousand tonnes
2008-09Area Production
2009-10Area Production
2010-11Area Production
(7) (10) (11)
274.5 737.0 235.1 658.4 223.7 606.68.6 19.0 7.4 20.9 7.4 19.70.1 0.3 0.3 0.8 0.1 0.4
283.2 756.3 242.8 680.1 231.2 626.79.1 6.4 10.3 9.9 7.8 7.1
292.3 762.7 253.1 690.0 239.0 633.850.1 50.3 50.7 66.4 45.6 63.354.2 920.2 53.7 1094.9 50.2 955.0
6.9 127.0 7.6 255.0 9.2 331.3
416.0 919.9 384.0 805.4 372.0 856.40.4 0.6 2.1 4.4 2.5 6.50.3 0.6 0.3 0.4 0.4 0.8
416.7 921.1 386.4 810.2 374.9 863.712.9 8.8 14.2 10.3 15.8 14.6
429.6 929.9 400.6 820.5 390.7 878.310.2 9.8 15.5 19.0 10.0 13.1
1.3 16.0 2.5 30.9 2.0 23.62.6 48.0 3.0 63.7 7.3 185.9
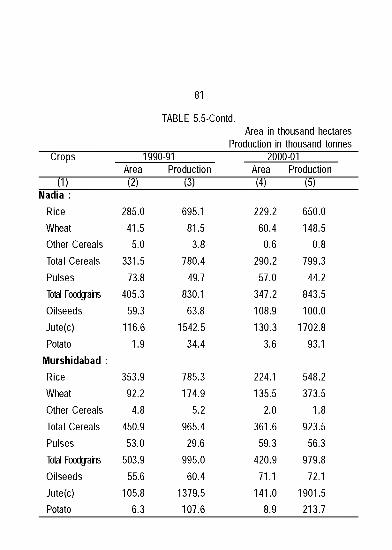
81
TABLE 5.5-Contd.Area in thousand hectares
Production in thousand tonnesCrops 1990-91
Area Production2000-01
Area Production(1) (2) (3) (4) (5)
Nadia :Rice 285.0 695.1 229.2 650.0Wheat 41.5 81.5 60.4 148.5Other Cereals 5.0 3.8 0.6 0.8Total Cereals 331.5 780.4 290.2 799.3Pulses 73.8 49.7 57.0 44.2Total Foodggins 405.3 830.1 347.2 843.5Oilseeds 59.3 63.8 108.9 100.0Jute(c) 116.6 1542.5 130.3 1702.8Potato 1.9 34.4 3.6 93.1
Murshidabad :Rice 353.9 785.3 224.1 548.2Wheat 92.2 174.9 135.5 373.5Other Cereals 4.8 5.2 2.0 1.8Total Cereals 450.9 965.4 361.6 923.5Pulses 53.0 29.6 59.3 56.3Total Foodggins 503.9 995.0 420.9 979.8Oilseeds 55.6 60.4 71.1 72.1Jute(c) 105.8 1379.5 141.0 1901.5Potato 6.3 107.6 8.9 213.7
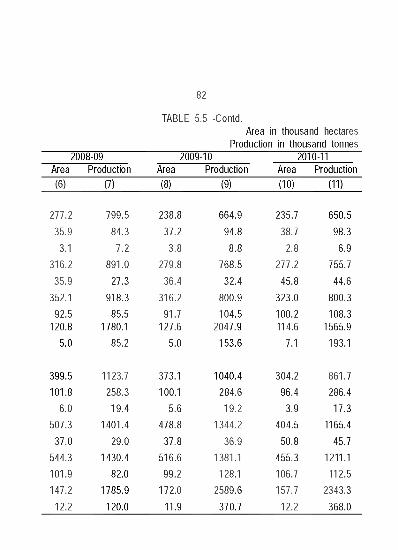
82
TABLE 5.5 -Contd.Area in thousand hectares
Production in thousand tonnes2008-09 2009-10 2010-11
Area Production Area Production Area Production(6) (7) (8) (9) (10) (11)
277.2 799.5 238.8 664.9 235.7 650.535.9 84.3 37.2 94.8 38.7 98.3
3.1 7.2 3.8 8.8 2.8 6.9316.2 891.0 279.8 768.5 277.2 755.7
35.9 27.3 36.4 32.4 45.8 44.6352.1 918.3 316.2 800.9 323.0 800.3
92.5 85.5 91.7 104.5 100.2 108.3120.8 1780.1 127.6 2047.9 114.6 1565.9
5.0 85.2 5.0 153.6 7.1 193.1
399.5 1123.7 373.1 1040.4 304.2 861.7101.8 258.3 100.1 284.6 96.4 286.4
6.0 19.4 5.6 19.2 3.9 17.3507.3 1401.4 478.8 1344.2 404.5 1165.4
37.0 29.0 37.8 36.9 50.8 45.7544.3 1430.4 516.6 1381.1 455.3 1211.1101.9 82.0 99.2 128.1 106.7 112.5147.2 1785.9 172.0 2589.6 157.7 2343.3
12.2 120.0 11.9 370.7 12.2 368.0
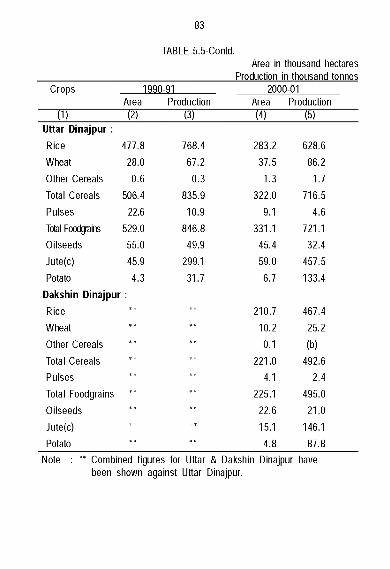
83
TABLE 5.5-Contd.Area in thousand hectares
Production in thousand tonnesCrops 1990-91 2000-01
Area Production Area Production(1) (2) (3) (4) (5)
Uttar Dinajpur :Rice 477.8 768.4 283.2 628.6Wheat 28.0 67.2 37.5 86.2Other Cereals 0.6 0.3 1.3 1.7Total Cereals 506.4 835.9 322.0 716.5Pulses 22.6 10.9 9.1 4.6Total Foodgains 529.0 846.8 331.1 721.1Oilseeds 55.0 49.9 45.4 32.4Jute(c) 45.9 299.1 59.0 457.5Potato 4.3 31.7 6.7 133.4
Dakshin Dinajpur :Rice ,, ,, 210.7 467.4Wheat , , , , 10.2 25.2Other Cereals , , , , 0.1 (b)Total Cereals , , , , 221.0 492.6Pulses 4.1 2.4Total Foodgrains 225.1 495.0Oilseeds 22.6 21.0Jute(c) 15.1 146.1Potato 4.8 87.8
Note : •• Combined figures for Uttar & Dal<shin Dinajpur been shown against Uttar Dinajpur.
have
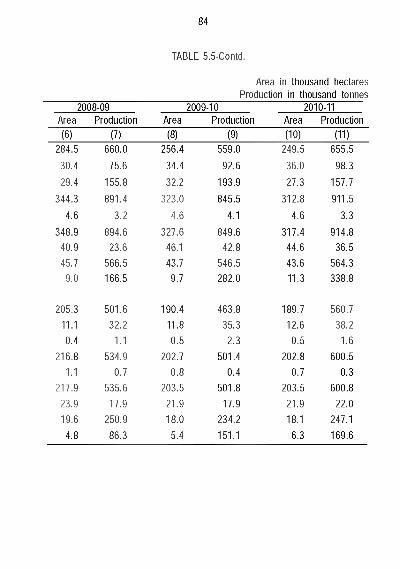
84
TABLE 5.5-Contd.
Area in thousand hectaresProduction in thousand tonnes
2008-09 2009-10 2010-11Area Production Area Production Area Production(6) (7) (8) (9) (10) (11) ~
284.5 660.0 256.4 559.0 249.5 655.530.4 75.6 34.4 92.6 36.0 98.329.4 155.8 32.2 193.9 27.3 157.7
344.3 891.4 323.0 845.5 312.8 911.54.6 3.2 4.6 4.1 4.6 3.3
348.9 894.6 327.6 849.6 317.4 914.840.9 23.6 46.1 42.8 44.6 36.545.7 566.5 43.7 546.5 43.6 564.3
9.0 166.5 9.7 282.0 11.3 338.8
205.3 501.6 190.4 463.8 189.7 560.711.1 32.2 11.8 35.3 12.6 38.20.4 1.1 0.5 2.3 0.5 1.6
216.8 534.9 202.7 501.4 202.8 600.51.1 0.7 0.8 0.4 0.7 0.3
217.9 535.6 203.5 501.8 203.5 600.823.9 17.9 21.9 17.9 21.9 22.019.6 250.9 18.0 234.2 18.1 247.1
4.8 86.3 5.4 151.1 6.3 169.6
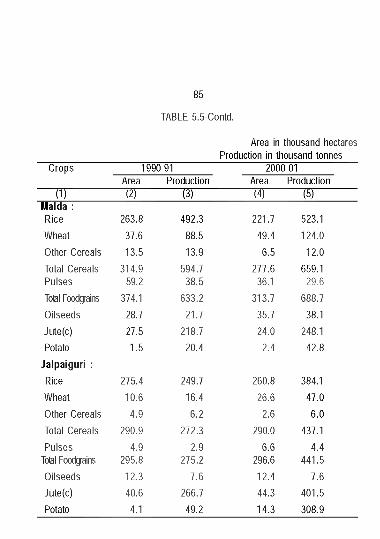
85
TABLE 5.5-Contd.
Crops 1990-91
Area in thousand hectares Production in thousand tonnes
--------------- 2000:01------------------
mIS i ld F l ------------
RiceWheatOther CerealsTotal CerealsPulsesTotal FoodgginsOilseedsJute(c)Potato
Jalpaiguri :RiceWheatOther Cereals Total Cereals Pulses
Total Foodgains Oilseeds Jute(c)Potato
Area~ 1 2 T
263.837.613.5
314.959.2
374.128.727.51.5
275.410.6
4.9290.9
4.9295.8
12.340.64.1
Production(3)
492.388.513.9
594.738.5
633.221.7
218.720.4
249.716.4
6.2
272.32.9
275.27.6
266.749.2
Area~ ( 4 r ~
221.749.4
6.5277.6
36.1313.7
35.724.0
2.4
260.826.6
2.6
290.06.6
296.612.444.314.3
Production(5)
523.1124.0
12.0
659.129.6
688.738.1
248.142.8
384.1 47.0
6.0437.1
4.4441.5
7.6401.5308.9
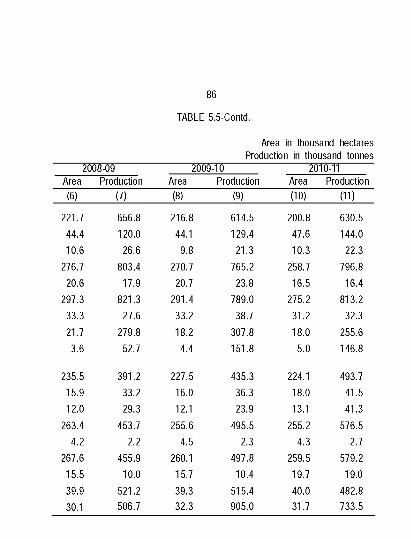
86
TABLE 5.5-Contd.
Area in thousand hectaresProduction in thousand tonnes
2008-09 2009-10 2010-11Area Production Area Production Area Production(6) (7) (8) (9) (10) (11)
221.7 656.8 216.8 614.5 200.8 630.544.4 120.0 44.1 129.4 47.6 144.010.6 26.6 9.8 21.3 10.3 22.3
276.7 803.4 270.7 765.2 258.7 796.820.6 17.9 20.7 23.8 16.5 16.4
297.3 821.3 291.4 789.0 275.2 813.233.3 27.6 33.2 38.7 31.2 32.321.7 279.8 18.2 307.8 18.0 255.63.6 52.7 4.4 151.8 5.0 146.8
235.5 391.2 227.5 435.3 224.1 493.715.9 33.2 16.0 36.3 18.0 41.512.0 29.3 12.1 23.9 13.1 41.3
263.4 453.7 255.6 495.5 255.2 576.54.2 2.2 4.5 2.3 4.3 2.7
267.6 455.9 260.1 497.8 259.5 579.215.5 10.0 15.7 10.4 19.7 19.039.9 521.2 39.3 515.4 40.0 482.830.1 506.7 32.3 905.0 31.7 733.5
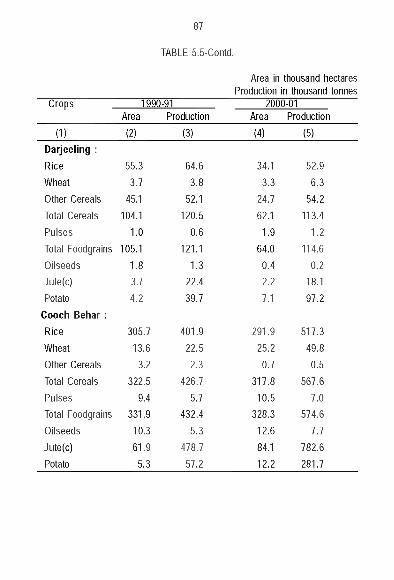
87
TABLE 5.5-Contd.
Area in thousand hectares Production in thousand tonnes
Crops 1990-91 2000-01Area Production Area Production
(1) (2) (3) (4) (5)Darjeeling :Rice 55.3 64.6 34.1 52.9Wheat 3.7 3.8 3.3 6.3Other Cereals 45.1 52.1 24.7 54.2Total Cereals 104.1 120.5 62.1 113.4Pulses 1.0 0.6 1.9 1.2Total Foodgralns 105.1 121.1 64.0 114.6Oilseeds 1.8 1.3 0.4 0.2Jute(c) 3.7 22.4 2.2 18.1Potato 4.2 39.7 7.1 97.2
Cooch Behar :Rice 305.7 401.9 291.9 517.3Wheat 13.6 22.5 25.2 49.8Other Cereals 3.2 2.3 0.7 0.5Total Cereals 322.5 426.7 317.8 567.6Pulses 9.4 5.7 10.5 7.0Total Foodgralns 331.9 432.4 328.3 574.6Oilseeds 10.3 5.3 12.6 7.7Jute(c) 61.9 478.7 84.1 782.6Potato 5.3 57.2 12.2 281.7
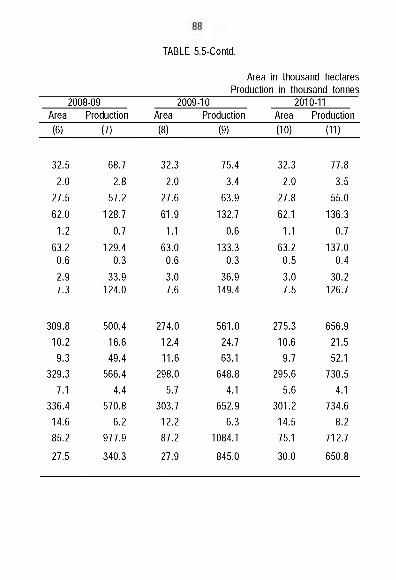
TABLE 5.5-Contd.
Area in thousand hectaresProduction in thousand tonnes
2008-09 2009-10 2010-11Area Production Area Production Area Production(6) (7) (8) (9) (10) (11)
32.5 68.7 32.3 75.4 32.3 77.82.0 2.8 2.0 3.4 2.0 3.5
27.5 57.2 27.6 63.9 27.8 55.062.0 128.7 61.9 132.7 62.1 136.3
1.2 0.7 1.1 0.6 1.1 0.763.2 129.4 63.0 133.3 63.2 137.0
0.6 0.3 0.6 0.3 0.5 0.42.9 33.9 3.0 36.9 3.0 30.27.3 124.0 7.6 149.4 7.5 126.7
309.8 500.4 274.0 561.0 275.3 656.910.2 16.6 12.4 24.7 10.6 21.5
9.3 49.4 11.6 63.1 9.7 52.1329.3 566.4 298.0 648.8 295.6 730.5
7.1 4.4 5.7 4.1 5.6 4.1336.4 570.8 303.7 652.9 301.2 734.6
14.6 6.2 12.2 6.3 14.5 8.285.2 977.9 87.2 1084.1 75.1 712.7
27.5 340.3 27.9 845.0 30.0 650.8
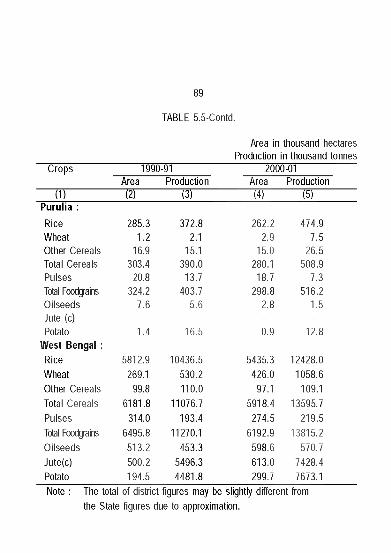
89
TABLE 5.5-Contd.
Area in thousand hectaresProduction in thousand tonnes
Crops 1990-91 2000-01Area Production Area Production
(1) (2) (3) (4) (5)Purulia :Rice 285.3 372.8 262.2 474.9Wheat 1.2 2.1 2.9 7.5Other Cereals 16.9 15.1 15.0 26.5Total Cereals 303.4 390.0 280.1 508.9Pulses 20.8 13.7 18.7 7.3Total Foodggins 324.2 403.7 298.8 516.2Oilseeds 7.6 5.6 2.8 1.5Jute (c) - - - -
Potato 1.4 16.5 0.9 12.8West Bengal :
Rice 5812.9 10436.5 5435.3 12428.0Wheat 269.1 530.2 426.0 1058.6Other Cereals 99.8 110.0 97.1 109.1Total Cereals 6181.8 11076.7 5918.4 13595.7Pulses 314.0 193.4 274.5 219.5Total Foodggins 6495.8 11270.1 6192.9 13815.2Oilseeds 513.2 453.3 598.6 570.7Jute(c) 500.2 5496.3 613.0 7428.4Potato 194.5 4481.8 299.7 7673.1Note : The total of district figures may be slightly different from
the State figures due to approximation.
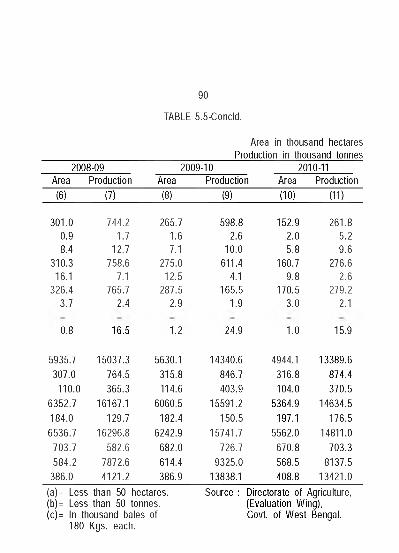
90
TABLE 5.5-C oncld .
Area in thousand hectaresProduction in thousand tonnes
2008-09 2009-10 2010-11Area Production Area Production Area Production(6) (7) (8) (9) (10) (11)
301.0 744.2 265.7 598.8 152.9 261.80.9 1.7 1.6 2.6 2.0 5.28.4 12.7 7.1 10.0 5.8 9.6
310.3 758.6 275.0 611.4 160.7 276.616.1 7.1 12.5 4.1 9.8 2.6
326.4 765.7 287.5 165.5 170.5 279.23.7 2.4 2.9 1.9 3.0 2.1
0.8 16.5 1.2 24.9 1.0 15.9
5935.7 15037.3 5630.1 14340.6 4944.1 13389.6307.0 764.5 315.8 846.7 316.8 874.4
110.0 365.3 114.6 403.9 104.0 370.56352.7 16167.1 6060.5 15591.2 5364.9 14634.5184.0 129.7 182.4 150.5 197.1 176.56536.7 16296.8 6242.9 15741.7 5562.0 14811.0
703.7 582.6 682.0 726.7 670.8 703.3584.2 7872.6 614.4 9325.0 568.5 8137.5
386.0 4121.2 386.9 13838.1 408.8 13421.0(a)= Less than 50 hectares.(b)= Less than 50 tonnes.(c)= In thousand bales of
180 Kgs. each.
Source : Directorate of Agriculture, (Evaluation Wing),Govt, of West Bengal.
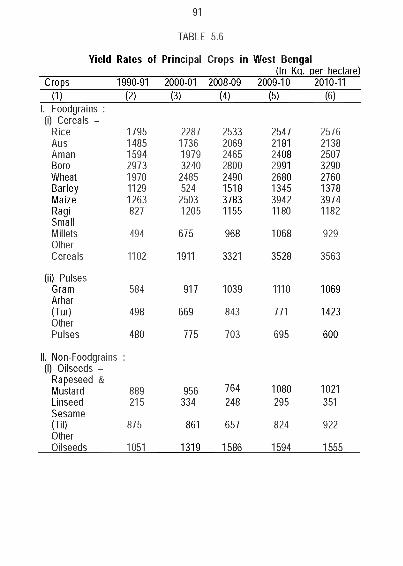
91
TABLE 5.6
Yield Rates of Principal Crops in West Bengal(In Kq. per hectare)
Crops 1990-91 2000-01 2008-09 2009-10 2010-11(1) (2) (3) (4) (5) (6)
1. Foodgrains : (i) Cereals -
Rice 1795 2287 2533 2547 2576Aus 1485 1736 2069 2181 2138Aman 1594 1979 2465 2408 2507Boro 2973 3240 2800 2991 3290Wheat 1970 2485 2490 2680 2760Barley 1129 524 1518 1345 1378Maize 1263 2503 3783 3942 3974Ragi 827 1205 1155 1180 1182SmallMillets 494 675 968 1068 929OtherCereals 1102 1911 3321 3528 3563
(ii) Pulses- Gram 584 917 1039 1110 1069Arhar(Tur) 498 669 843 771 1423OtherPulses 480 775 703 695 600
II. Non-Foodgrains :(I) Oilseeds -
Rapeseed &Mustard 889 956 764 1080 1021Linseed 215 334 248 295 351Sesame(Til) 875 861 657 824 922OtherOilseeds 1051 1319 1586 1594 1555
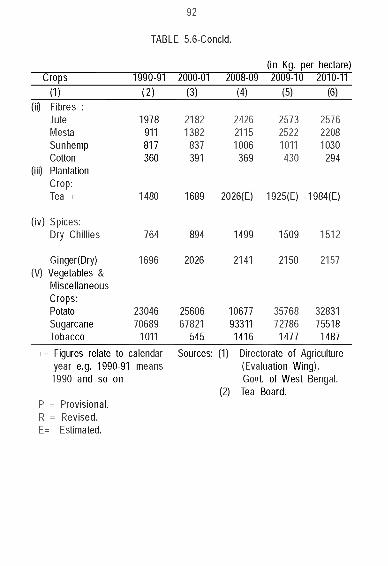
92
TABLE 5 .6-C oncld .
(In Kg. per hectare)Crops 1990-91 2000-01 2008-09 2009-10 2010-11
(1) (2) (3) (4) (5) (6)(II) Fibres :
Jute 1978 2182 2426 2573 2576Mesta 911 1382 2115 2522 2208Sunhemp 817 837 1006 1011 1030Cotton 360 391 369 430 294
(ill) Plantation Crop:Tea + 1480 1689 2026(E) 1925(E) 1984(E)
(iv) Spices:Dry Chillies 764 894 1499 1509 1512
Ginger(Dry) 1696 2026 2141 2150 2157(V) Vegetables &
Miscellaneous Crops:Potato 23046 25606 10677 35768 32831Sugarcane 70689 67821 93311 72786 75518Tobacco 1011 545 1416 1477 1487
+= Figures relate to calendar year e.g. 1990-91 means 1990 and so on
P = Provisional.R = Revised.E= Estimated.
Sources: (1) Directorate of Agriculture (Evaluation Wing),Govt, of West Bengal.
(2) Tea Board.
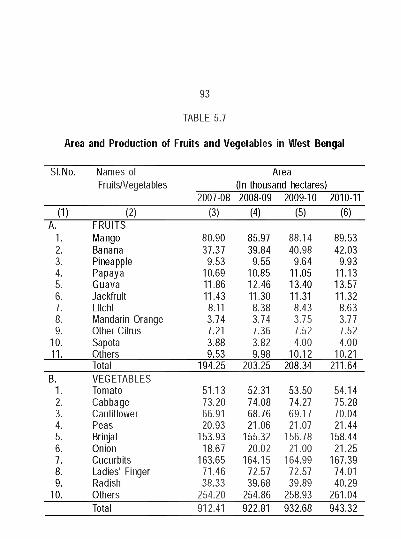
SI.No. Names of AreaFruits/Vegetables ________ (In thousand hectares)________
2007-08 2008-09 2009-10 2010-11(1)____________ (2)________________(3) (4) (5) (6)
A. FRUITS1. Mango 80.90 85.97 88.14 89.532. Banana 37.37 39.84 40.98 42.033. Pineapple 9.53 9.55 9.64 9.934. Papaya 10.69 10.85 11.05 11.135. Guava 11.86 12.46 13.40 13.576. Jackfrult 11.43 11.30 11.31 11.327. Lltchl 8.11 8.38 8.43 8.638. Mandarin Orange 3.74 3.74 3.75 3.779. Other Citrus 7.21 7.36 7.52 7.52
10. Sapota 3.88 3.82 4.00 4.0011. Others___________________ 9.53 9.98 10.12 10.21
__________ Total___________________194.25 203.25 208.34 211.64B. VEGETABLES
1. Tomato 51.13 52.31 53.50 54.142. Cabbage 73.20 74.08 74.27 75.283. Cauliflower 66.91 68.76 69.17 70.044. Peas 20.93 21.06 21.07 21.445. Brinjal 153.93 155.32 156.78 158.446. Onion 18.67 20.02 21.00 21.257. Cucurbits 163.65 164.15 164.99 167.398. Ladies' Finger 71.46 72.57 72.57 74.019. Radish 38.33 39.68 39.89 40.29
10. Others 254.20 254.86 258.93 261.04Total 912.41 922.81 932.68 943.32
93
TABLE 5.7
Area and Production of Fruits and Vegetables in West Bengal
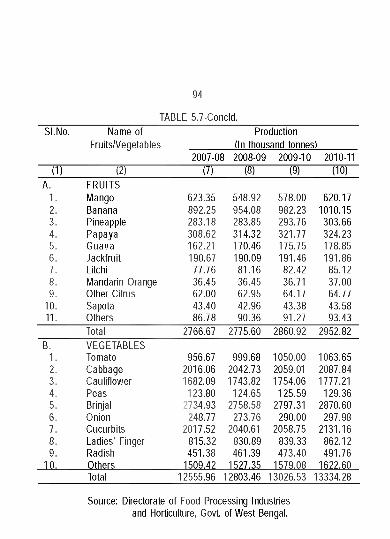
94
TABLE 5.7-C oncld .SI.No. Name of Production
Fruits/Vegetables __________ (In thousand tonnes)_________2007-08 2008-09 2009-10 2010-11
(1) (2) (7) (8) (9) (10) ~A. FRUITS
1. Mango 623.35 548.92 578.00 620.172. Banana 892.25 954.08 982.23 1010.153. Pineapple 283.18 283.85 293.76 303.664. Papaya 308.62 314.32 321.77 324.235. Guava 162.21 170.46 175.75 178.856. Jackfruit 190.67 190.09 191.46 191.867. Litchi 77.76 81.16 82.42 85.128. Mandarin Orange 36.45 36.45 36.71 37.009. Other Citrus 62.00 62.95 64.17 64.77
10. Sapota 43.40 42.96 43.38 43.5811. Others 86.78 90.36 91.27 93.43
Total_________________ 2766.67 2775.60 2860.92 2952.82B. VEGETABLES
1. Tomato 956.67 999.68 1050.00 1063.652. Cabbage 2016.06 2042.73 2059.01 2087.843. Cauliflower 1682.09 1743.82 1754.06 1777.214. Peas 123.80 124.65 125.59 129.365. Brinjal 2734.93 2758.58 2797.31 2870.606. Onion 248.77 273.76 290.00 297.987. Cucurbits 2017.52 2040.61 2058.75 2131.168. Ladies' Finger 815.32 830.89 839.33 862.129. Radish 451.38 461.39 473.40 491.76
10. Others_______________ 1509.42 1527.35 1579.08 1622.60__________ Total_______________ 12555.96 12803.46 13026.53 13334.28
Source: Directorate of Food Processing Industries and Florticulture, Govt, of West Bengal.
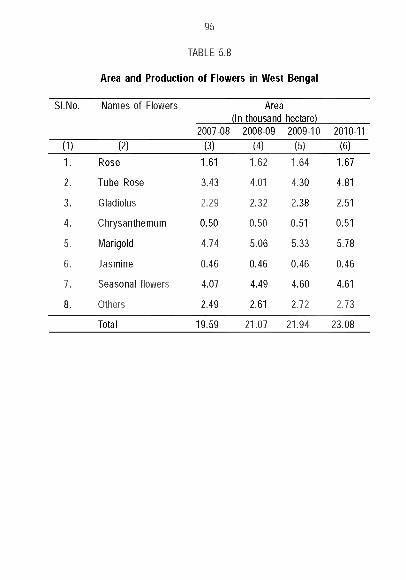
95
TABLE 5.8
Area and Production of Flowers in West Bengal
SI.No. Names of Flowers Area(In thousand hectare)
2007-08 2008-09 2009-10 2010-11(1) (2) (3) (4) (5) (6)1. Rose 1.61 1.62 1.64 1.67
2. Tube Rose 3.43 4.01 4.30 4.81
3. Gladiolus 2.29 2.32 2.38 2.51
4. Chrysanthemum 0.50 0.50 0.51 0.51
5. Marigold 4.74 5.06 5.33 5.78
6. Jasmine 0.46 0.46 0.46 0.46
7. Seasonal flowers 4.07 4.49 4.60 4.61
8. Others 2.49 2.61 2.72 2.73
Total 19.59 21.07 21.94 23.08
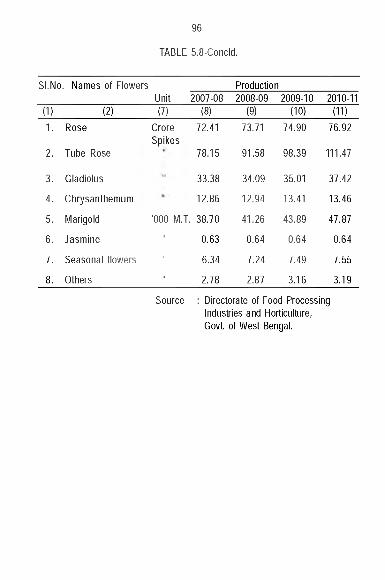
96
TABLE 5.8-C oncld .
SI.No. Names of Flowers ProductionUnit 2007-08 2008-09 2009-10 2010-11
(1) (2) (7) (8) (9) (10) (11)1. Rose Crore
Spikes72.41 73.71 74.90 76.92
2. Tube Rose 78.15 91.58 98.39 111.47
3. Gladiolus 33.38 34.09 35.01 37.42
4. Chrysanthemum 12.86 12.94 13.41 13.46
5. Marigold '000 M.T 38.70 41.26 43.89 47.87
6. Jasmine " 0.63 0.64 0.64 0.64
7. Seasonal flowers " 6.34 7.24 7.49 7.55
8. Others " 2.78 2.87 3.16 3.19
Source : Directorate of Food Processing Industries and Horticulture, Govt, of West Bengal.
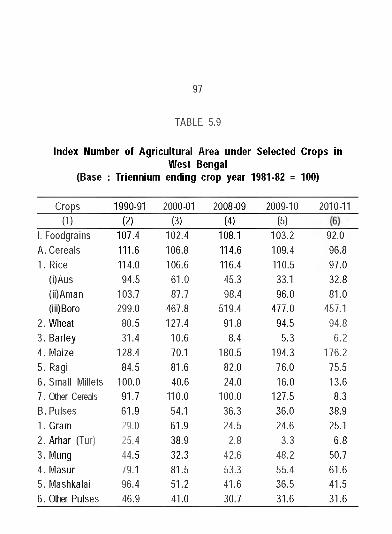
97
TABLE 5.9
Index Number of Agricultural Area under Selected Crops inWest Bengal
(Base : Triennium ending crop year 1981-82 = 100)
Crops 1990-91 2000-01 2008-09 2009-10 2010-11(1) (2) (3) (4) (5)
I. FoodgrainsA. Cereals1. Rice
(i)Aus(ii)Aman(iii)Boro
2. Wheat3. Barley4. Maize5. Ragi6. Small Millets7. Other CerealsB. Pulses1. Gram2. Arhar (Tur)3. Mung4. Masur5. Mashkalai6. Other Pulses
107.4 111.6114.094.5
103.7299.080.531.4
128.484.5
100.0 91.761.929.025.444.579.1 96.446.9
102.4 106.8 106.6
61.087.7
467.8127.4
10.670.1 81.6 40.6
110.054.161.938.9 32.3 81.551.2 41.0
108.1114.6116.445.398.4
519.4 91.8
8.4180.5
82.0 24.0
100.036.324.5
2.842.653.341.630.7
103.2109.4110.533.196.0
477.094.5
5.3194.3
76.016.0
127.5 36.024.6
3.348.255.436.531.6
92.096.897.032.881.0
457.194.8
6.2176.2
75.513.6
8.338.9 25.16.8
50.7 61.641.531.6
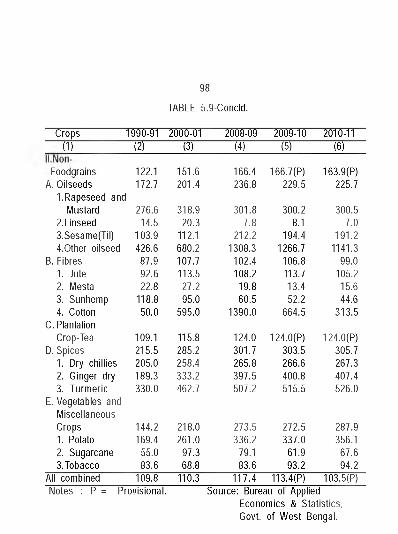
98
TABLE 5 .9-C oncld .
Crops“ l i T “
1990-91“ 1 2 T “
2000-01(3)
2008-09“ 1 4 ) —
20 09-101 5 )
2010-11“ (6)—
Foodgrains 122.1 151.6 166.4 166.7(P) 163.9(P)A. Oilseeds 172.7 201.4 236.8 229.5 225.7
I.Rapeseed and Mustard 276.6 318.9 301.8 300.2 300.5
2.Linseed 14.5 20.3 7.8 8.1 7.03.Sesame(Til) 103.9 112.1 212.2 194.4 191.24.0ther oilseed 426.6 680.2 1308.3 1266.7 1141.3
B. Fibres 87.9 107.7 102.4 106.8 99.01. Jute 92.6 113.5 108.2 113.7 105.22. Mesta 22.8 27.2 19.8 13.4 15.63. Sunhemp 118.8 95.0 60.5 52.2 44.64. Cotton 50.0 595.0 1390.0 664.5 313.5
C. Plantation Crop-Tea 109.1 115.8 124.0 124.0(P) 124.0(P)
D. Spices 215.5 285.2 301.7 303.5 305.71. Dry chillies 205.0 258.4 265.8 266.6 267.32. Ginger dry 189.3 333.2 397.5 400.8 407.43. Turmeric 330.0 462.7 507.2 515.5 526.0
E. Vegetables and Miscellaneous Crops 144.2 218.0 273.5 272.5 287.91. Potato 169.4 261.0 336.2 337.0 356.12. Sugarcane 55.0 97.3 79.1 61.9 67.63.Tobacco 83.6 68.8 83.6 93.2 94.2
All combined 109.8 110.3 117.4 113.4(P) 103.5(P)Notes : P = Provisional. Source: Bureau of Applied
Economics & Statistics, Govt, of West Bengal.
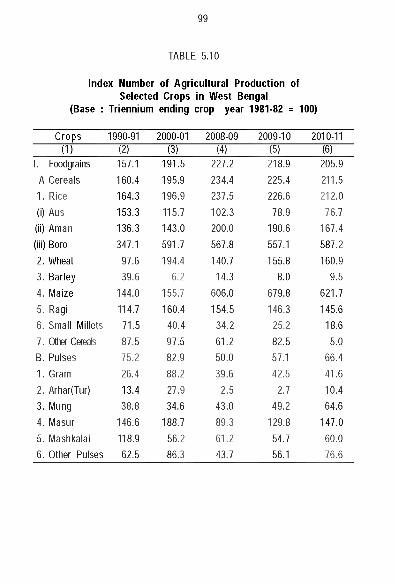
99
C rops 1990-91 2000-01 2008-09 2009-10 2010-11(1) (2) (3) (4) (5) (6)
I. Foodgrains 157.1 191.5 227.2 218.9 205.9A Cereals 160.4 195.9 234.4 225.4 211.51 .R ic e 164.3 196.9 237.5 226.6 212.0(i) Aus 153.3 115.7 102.3 78.9 76.7(ii) Aman 136.3 143.0 200.0 190.6 167.4(iii)Boro 347.1 591.7 567.8 557.1 587.22. Wheat 97.6 194.4 140.7 155.8 160.93. Barley 39.6 6.2 14.3 8.0 9.54. Maize 144.0 155.7 606.0 679.8 621.75. Ragi 114.7 160.4 154.5 146.3 145.66. Small Millets 71.5 40.4 34.2 25.2 18.67. Other Cereals 87.5 97.5 61.2 82.5 5.0B. Pulses 75.2 82.9 50.0 57.1 66.41 .G ra m 26.4 88.2 39.6 42.5 41.62. Arhar(Tur) 13.4 27.9 2.5 2.7 10.43. Mung 38.8 34.6 43.0 49.2 64.64. Masur 146.6 188.7 89.3 129.8 147.05. Mashkalai 118.9 56.2 61.2 54.7 60.06. Other Pulses 62.5 86.3 43.7 56.1 76.6
TABLE 5 .10
Index Number of A gricultural Production ofSelected Crops in West Bengal
(Base : Triennium ending crop year 1981-82 = 100)
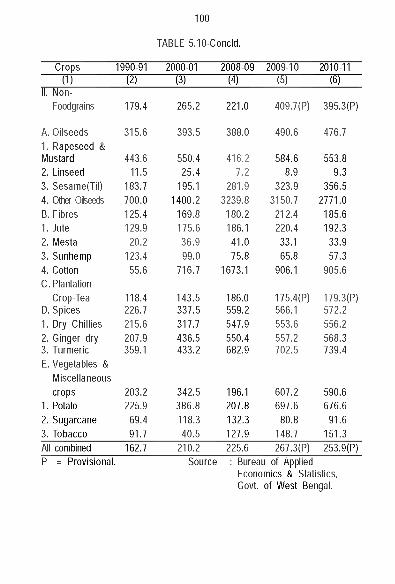
100
TABLE 5 .10 -C oncld .
Crops 1990-91 2000-01 2008-09 2009-10 2010-11(1) (2) (3) (4) (5) (6)
II. Non- Foodgrains 179.4 265.2 221.0 409.7(P) 395.3(P)
A. Oilseeds 315.6 393.5 388.0 490.6 476.71. Rapeseed & Mustard 443.6 550.4 416.2 584.6 553.82. Linseed 11.5 25.4 7.2 8.9 9.33. Sesame(Til) 183.7 195.1 281.9 323.9 356.54. Other Oilseeds 700.0 1400.2 3239.8 3150.7 2771.0B. Fibres 125.4 169.8 180.2 212.4 185.61. Jute 129.9 175.6 186.1 220.4 192.32. Mesta 20.2 36.9 41.0 33.1 33.93. Sunhemp 123.4 99.0 75.8 65.8 57.34. Cotton 55.6 716.7 1673.1 906.1 905.6C. Plantation
Crop-Tea 118.4 143.5 186.0 175.4(P) 179.3(P)D. Spices 226.7 337.5 559.2 566.1 572.21. Dry Chillies 215.6 317.7 547.9 553.6 556.22. Ginger dry 207.9 436.5 550.4 557.2 568.33. Turmeric 359.1 433.2 682.9 702.5 739.4E. Vegetables &
Miscellaneous crops 203.2 342.5 196.1 607.2 590.6
1. Potato 225.9 386.8 207.8 697.6 676.62. Sugarcane 69.4 118.3 132.3 80.8 91.63. Tobacco 91.7 40.5 127.9 148.7 151.3All combined 162.7 210.2 225.6 267.3(P) 253.9(P)P = Provisional. Source : Bureau of Applied
Economics & Statistics, Govt, of West Bengal.
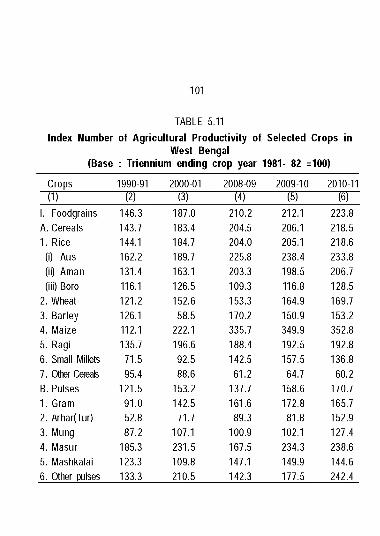
101
TABLE 5.11
Index Number of Agricultural Productivity of Selected Crops inWest Bengal
(Base : Triennium ending crop year 1981- 82 =100)
Crops 1990-91 2000-01 2008-09 2009-10 2010-11(1) (2) (3) (4) (5) (6)
1. Foodgrains 146.3 187.0 210.2 212.1 223.8A. Cereals 143.7 183.4 204.5 206.1 218.51. Rice 144.1 184.7 204.0 205.1 218.6
(i) Aus 162.2 189.7 225.8 238.4 233.8(ii) Aman 131.4 163.1 203.3 198.5 206.7(iii) Boro 116.1 126.5 109.3 116.8 128.5
2. Wheat 121.2 152.6 153.3 164.9 169.73. Barley 126.1 58.5 170.2 150.9 153.24. Maize 112.1 222.1 335.7 349.9 352.85. Ragi 135.7 196.6 188.4 192.5 192.86. Small Millets 71.5 92.5 142.5 157.5 136.87. Other Cereals 95.4 88.6 61.2 64.7 60.2B. Pulses 121.5 153.2 137.7 158.6 170.71. Gram 91.0 142.5 161.6 172.8 165.72. Arhar(Tur) 52.8 71.7 89.3 81.8 152.93. Mung 87.2 107.1 100.9 102.1 127.44. Masur 185.3 231.5 167.5 234.3 238.65. Mashkalai 123.3 109.8 147.1 149.9 144.66. Other pulses 133.3 210.5 142.3 177.5 242.4
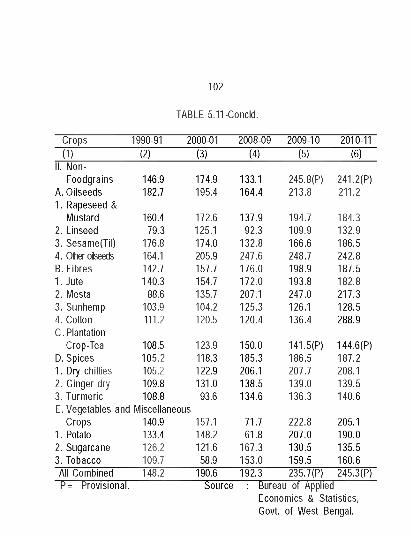
102
TABLE 5.11-Concld.
Crops 1990-91 2000-01 2008-09 2009-10 2010-11(1) (2) (3) (4) (5) (6)
II. Non-Foodgrains 146.9 174.9 133.1 245.8(P) 241.2(P)
A. Oilseeds 182.7 195.4 164.4 213.8 211.21. Rapeseed &
Mustard 160.4 172.6 137.9 194.7 184.32. Linseed 79.3 125.1 92.3 109.9 132.93. Sesame(Til) 176.8 174.0 132.8 166.6 186.54. Other oilseeds 164.1 205.9 247.6 248.7 242.8B. Fibres 142.7 157.7 176.0 198.9 187.51. Jute 140.3 154.7 172.0 193.8 182.82. Mesta 88.6 135.7 207.1 247.0 217.33. Sunhemp 103.9 104.2 125.3 126.1 128.54. Cotton 111.2 120.5 120.4 136.4 288.9C. Plantation
Crop-Tea 108.5 123.9 150.0 141.5(P) 144.6(P)D. Spices 105.2 118.3 185.3 186.5 187.21. Dry chillies 105.2 122.9 206.1 207.7 208.12. Ginger dry 109.8 131.0 138.5 139.0 139.53. Turmeric 108.8 93.6 134.6 136.3 140.6E. Vegetables and Miscellaneous
Crops 140.9 157.1 71.7 222.8 205.11. Potato 133.4 148.2 61.8 207.0 190.02. Sugarcane 126.2 121.6 167.3 130.5 135.53. Tobacco 109.7 58.9 153.0 159.5 160.6All Combined 148.2 190.6 192.3 235.7(P) 245.3(P)P= Provisional. Source : Bureau of Applied
Economics & Statistics, Govt, of West Bengal.
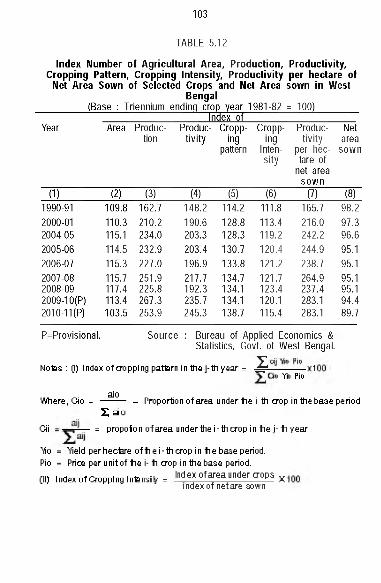
103
TABLE 5 .12
Index Number of Agricultural Area, Production, Productivity, Cropping Pattern, Cropping Intensity, Productivity per hectare of
Net Area Sown of Selected Crops and Net Area sown in West Bengal
___________ (Base : Triennium ending crop year 1981-82 = 100)_________Index ot
Year Area Produc- Produc- Cropp- Cropp- Produc- Nettion tiv ity ing ing tiv ity area
pattern Inten- per hec- sown sity tare of
net area sown
(1) (2) (3) (4) (5) (6) (7) (8)1990-91 109.8 162.7 148.2 114.2 111.8 165.7 98.22000-01 110.3 210.2 190.6 128.8 113.4 216.0 97.32004-05 115.1 234.0 203.3 128.3 119.2 242.2 96.62005-06 114.5 232.9 203.4 130.7 120.4 244.9 95.12006-07 115.3 227.0 196.9 133.8 121.2 238.7 95.12007-08 115.7 251.9 217.7 134.7 121.7 264.9 95.12008-09 117.4 225.8 192.3 134.1 123.4 237.4 95.12009-10(P) 113.4 267.3 235.7 134.1 120.1 283.1 94.42010-11(P) 103.5 253.9 245.3 138.7 115.4 283.1 89.7
P=Provisional. Source : Bureau of Applied Economics &Statistics, Govt, of West Bengal.
Nofes : 0) Index o f OToppIng pattern in ttia j- tt i /e a r = ^ ^'Vn Pin
ajoW iere, Qo = --------- = Proporlion of area under tie i-tti oiop in ttie base periodS a o
Q i — = propolo n o f area under ttie i- tt i crop in tie i - t i year
'Vio = ’/ield per hectare of t i e i - tti cfop i n t i e base period.Pio = Price per unit of tie i- t i oop in Itie base period.Cii) inde.ofC roppinginten3iV = l"d^^ ° f area under aops ^
index of net are sown
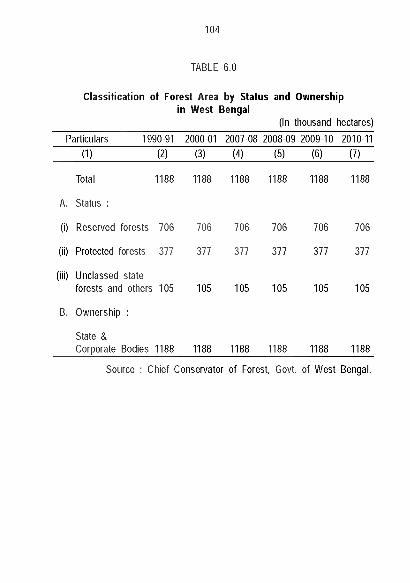
104
TABLE 6 .0
Classification of Forest Area by Status and Ownership in West Bengal
(In thousand hectares)Particulars 1990-91 2000-01 2007-08 2008-09 2009-10 2010-11
(1) (2) (3) (4) (5) (6) (7)
Total 1188 1188 1188 1188 1188 1188
A. Status :
(i) Reserved forests 706 706 706 706 706 706
(ii) Protected forests 377 377 377 377 377 377
(ill) Unclassed state forests and others 105 105 105 105 105 105
B. Ownership :
State &Corporate Bodies 1188 1188 1188 1188 1188 1188
Source : C h ie f Conservator of Forest, Govt, o f W es t Bengal.
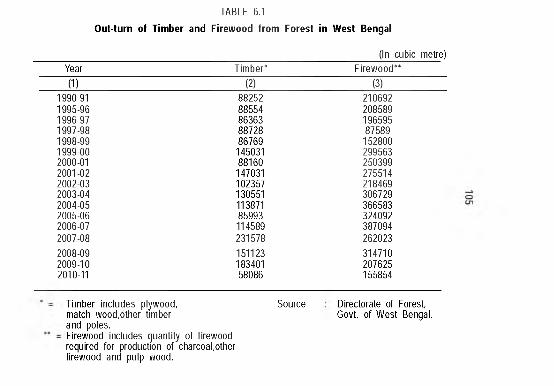
Out-turnTABLE 6.1
of Timber and Firewood from Forest in West Bengal
(In cubic metre)Year Timber* F ire w ood "(1) (2) (3)
1990-91 88252 2106921995-96 88554 2085891996-97 86363 1965951997-98 88728 875891998-99 86769 1528001999-00 145031 2995632000-01 88160 2503992001-02 147031 2755142002-03 102357 2184692003-04 130551 3067292004-05 113871 3665832005-06 85993 3240922006-07 114589 3870942007-08 231578 2620232008-09 151123 3147102009-10 183401 2076252010-11 58086 155854
Timber includes plywood, match wood,other timber and poles.Firewood includes quantity of firewood required for production of charcoal,other firewood and pulp wood.
Source Directorate of Forest, Govt, of West Bengal.
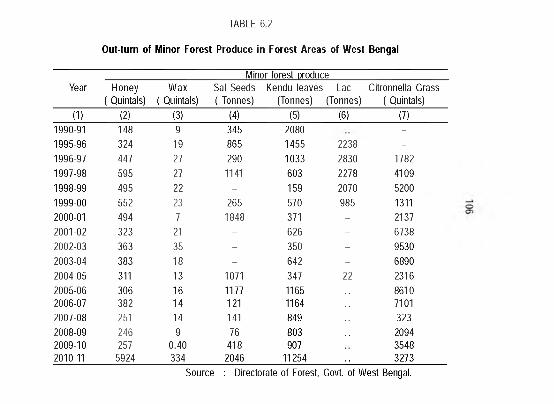
TABLE 6.2
Out-turn of Minor Forest Produce in Forest Areas of West Bengal
Minor forest oroduceYear Honey Wax Sal Seeds Kendu leaves Lac Citronnella Grass
( Quintals) ( Quintals) ( Tonnes) (Tonnes) (Tonnes) ( Quintals)(1) (2) (3) (4) (5) (6) (7)
1990-91 148 9 345 2080 -
1995-96 324 19 865 1455 2238 -
1996-97 447 27 290 1033 2830 17821997-98 595 27 1141 603 2278 41091998-99 495 22 - 159 2070 52001999-00 552 23 265 570 985 13112000-01 494 7 1848 371 - 21372001-02 323 21 - 626 - 67382002-03 363 35 - 350 - 95302003-04 383 18 - 642 - 68902004-05 311 13 1071 347 22 23162005-06 306 16 1177 1165 86102006-07 382 14 121 1164 71012007-08 251 14 141 849 3232008-09 246 9 76 803 20942009-10 257 0.40 418 907 35482010-11 5924 334 2046 11254 3273
Source : Directorate of Forest, Govt, of W est Bengal.
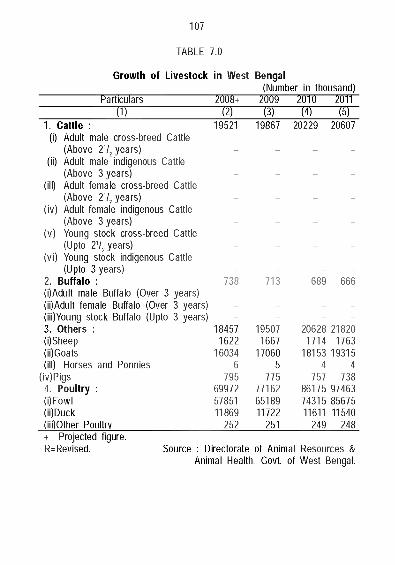
107
TABLE 7.0
Growth of Livestock in West Bengal(Number in thousand)
Particulars 2008+ 2009 2010 2011(1) & (3) (4) (5)
1. C attle : 19521 19867 20229 20607(I) Adult male cross-breed Cattle
(Above 2Vj years) - - - -
(ii) Adult male indigenous Cattle(Above 3 years) - - - -
(ill) Adult female cross-breed Cattle(Above 2Vj years) - - - -
(iv) Adult female indigenous Cattle(Above 3 years) - - - -
(v) Young stock cross-breed Cattle(Upto 2Vj years) - - - -
(vi) Young stock indigenous Cattle(Upto 3 years) - - - -
2. B u ffa lo : 738 713 689 666(i)Adult male Buffalo (Over 3 years) - - - -(ii)Adult female Buffalo (Over 3 years) - - - -(iii)Young stock Buffalo (Upto 3 years) - - - -3. O thers : 18457 19507 20628 21820(i)Sheep 1622 1667 1714 1763(ii)Goats 16034 17060 18153 19315(ill) Horses and Pennies 6 5 4 4
(iv)Pigs 795 775 757 7384. P ou ltry : 69972 77162 86175 97463(i)Fowl 57851 65189 74315 85675(ii)Duck 11869 11722 11611 11540(iii)Other Poultry 252 251 249 248+ Projected figure.R= Revised. Source : Directorate
Animal Health,of Animal Resources &
Govt, of West Bengal.
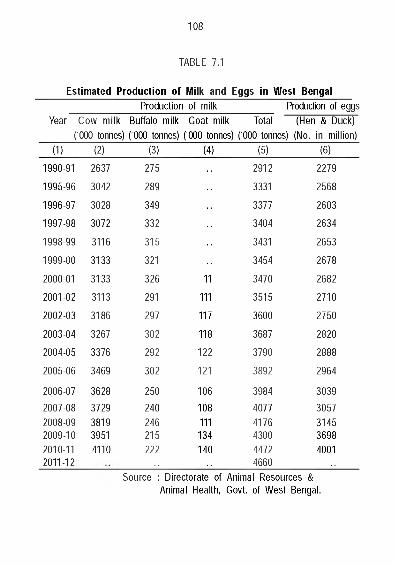
108
Estimated Production of Milk and Eggs in West BengalProduction of milk Production of eggs
Year Cow mill< Buffalo milk Goat milk Total (Hen & Duck)(000 tonnes) (000 tonnes) (000 tonnes) (000 tonnes) (No. in million)
(1) (2) (3) (4) (5)_______________ (6)
1990-91 2637 275 .. 2912 2279
1995-96 3042 289 .. 3331 2568
1996-97 3028 349 .. 3377 2603
1997-98 3072 332 .. 3404 2634
1998-99 3116 315 .. 3431 2653
1999-00 3133 321 .. 3454 2678
2000-01 3133 326 11 3470 2682
2001-02 3113 291 111 3515 2710
2002-03 3186 297 117 3600 2750
2003-04 3267 302 118 3687 2820
2004-05 3376 292 122 3790 2888
2005-06 3469 302 121 3892 2964
2006-07 3628 250 106 3984 30392007-08 3729 240 108 4077 30572008-09 3819 246 111 4176 31452009-10 3951 215 134 4300 36982010-11 4110 222 140 4472 40012011-12 ^ ^ _________4660____________ ..
Source : Directorate of Animal Resources &Animal Health, Govt, of West Bengal.
TABLE 7.1
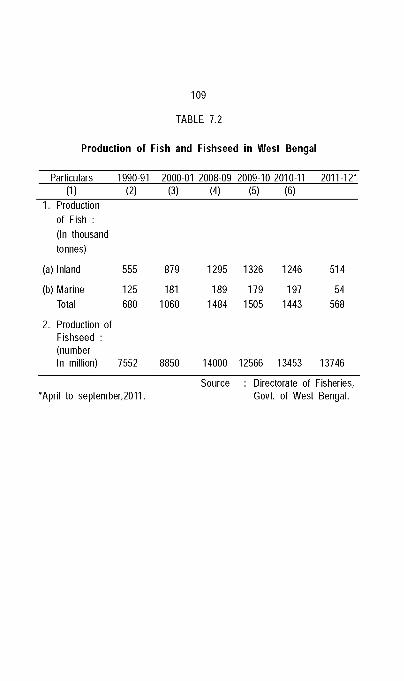
Production of Fish and Fishseed in West Bengal
109
TABLE 1 2
Particulars 1990-91 2000-01 2008-09 2009-10 2010-11 2011-12’(1) (2) (3) (4) (5) (6)
1. Production of Fish :(In thousand tonnes)
(a) Inland 555 879 1295 1326 1246 514
(b) Marine 125 181 189 179 197 54Total 680 1060 1484 1505 1443 568
2. Production of Fishseed : (number In million) 7552 8850 14000 12566 13453 13746
Source : Directorate of Fisheries, •April to September,2011. Govt, of West Bengal.
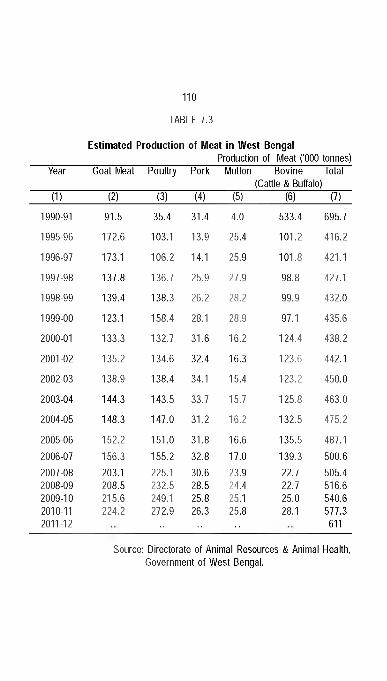
Estimated Production of Meat in West BengalProduction of Meat ('000 tonnes)
Year Goat Meat Poultry Pork Mutton Bovine Total(Cattle & Buffalo)
(1) (2) (3) (4) (5) (6) (7)
1990-91 91.5 35.4 31.4 4.0 533.4 695.7
1995-96 172.6 103.1 13.9 25.4 101.2 416.2
1996-97 173.1 106.2 14.1 25.9 101.8 421.1
1997-98 137.8 136.7 25.9 27.9 98.8 427.1
1998-99 139.4 138.3 26.2 28.2 99.9 432.0
1999-00 123.1 158.4 28.1 28.9 97.1 435.6
2000-01 133.3 132.7 31.6 16.2 124.4 438.2
2001-02 135.2 134.6 32.4 16.3 123.6 442.1
2002-03 138.9 138.4 34.1 15.4 123.2 450.0
2003-04 144.3 143.5 33.7 15.7 125.8 463.0
2004-05 148.3 147.0 31.2 16.2 132.5 475.2
2005-06 152.2 151.0 31.8 16.6 135.5 487.12006-07 156.3 155.2 32.8 17.0 139.3 500.62007-08 203.1 225.1 30.6 23.9 22.7 505.42008-09 208.5 232.5 28.5 24.4 22.7 516.62009-10 215.6 249.1 25.8 25.1 25.0 540.62010-11 224.2 272.9 26.3 25.8 28.1 577.32011-12 611
Source: Directorate of Animal Resources & Animal Health, Government of West Bengal.
110
TABLE 7.3
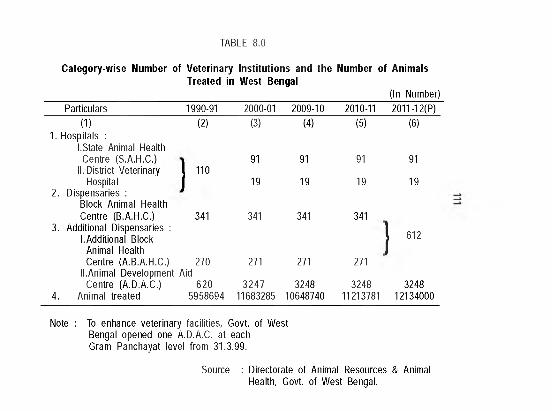
TABLE 8 .0
Category-wise Number of Veterinary Institutions and the Number of Animals Treated in West Bengal
(In Number)Particulars 1990-91 2000-01 2009-10 2010-11 2011-12(P)
(1)1. Hospitals :
1.State Animal Health
(2) (3) (4) (5) (6)
Centre (S.A.H.C.) II. District Veterinary 110
91 91 91 91
Hospital 2. Dispensaries :
Block Animal Health
19 19 19 19
Centre (B.A.H.C.)3. Additional Dispensaries :
1. Additional Block Animal Health
341 341 341 341
612
Centre (A.B.A.H.C.) 270 II.Animal Development Aid
271 271 271
Centre (A.D.A.C.) 620 3247 3248 3248 32484. Animal treated 5958694 11683285 10648740 11213781 12134000
Note : To enhance veterinary facilities, Govt, of West Bengal opened one A.D.A.C. at each Gram Panchayat level from 31.3.99.
Source : D irectorate of Animal Resources & AnimalHealth, Govt, o f W est Bengal.
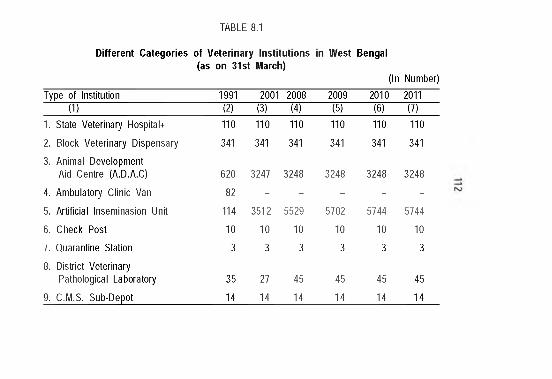
Different Categories of Veterinary Institutions in West Bengal (as on 31st March)
TABLE 8.1
(In Num ber)
Type of Institution 1991 2001 2008 2009 2010 2011(1) (2) (3) (4) (5) (6) (7)
1. State Veterinary Hospitak 110 110 110 110 110 110
2. Block Veterinary Dispensary 341 341 341 341 341 341
3. Animal Development Aid Centre (A.D.A.C) 620 3247 3248 3248 3248 3248
4. Ambulatory Clinic Van 82 - - - - -
5. Artificial Inseminasion Unit 114 3512 5529 5702 5744 5744
6. Check Post 10 10 10 10 10 10
7. Quarantine Station 3 3 3 3 3 3
8. District Veterinary Pathological Laboratory 35 27 45 45 45 45
9. C.M.S. Sub-Depot 14 14 14 14 14 14
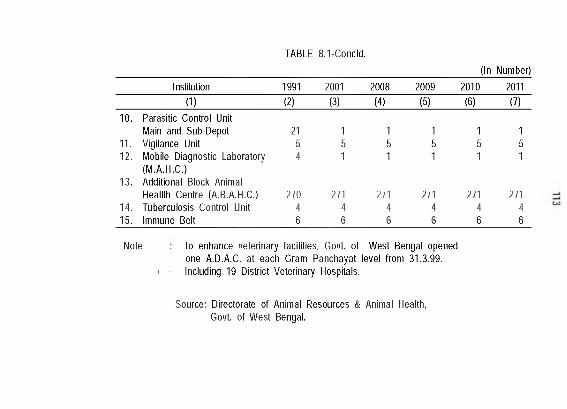
TABLE 8 .1-C oncld .
(In Num ber)
Institution 1991 2001 2008 2009 2010 2011(1) (2) (3) (4) (5) (6) (7)
10. Parasitic Control UnitMain and Sub-Depot 21 1 1 1 1 1
11. Vigilance Unit 5 5 5 5 5 512. Mobile Diagnostic Laboratory 4 1 1 1 1 1
(M.A.H.C.)13. Additional Block Animal
Heallth Centre (A.B.A.H.C.) 270 271 271 271 271 27114. Tuberculosis Control Unit 4 4 4 4 4 415. Immune Belt 6 6 6 6 6 6
Note To enhance veterinary facilities, Govt, of West Bengal openedone A.D.A.C. at each Gram Panchayat level from 31.3.99.
+ = Including 19 District Veterinary Hospitals.
Source: Directorate of Animal Resources & Animal Health, Govt, of West Bengal.
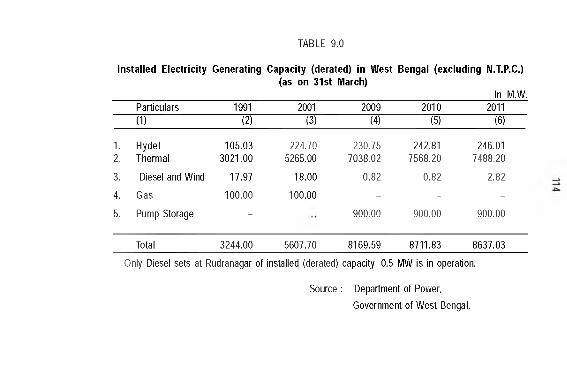
Installed Electricity Generating Capacity (derated) in West Bengal (excluding N.T.P.C.)(as on 31st March)
In M.W.
TABLE 9 .0
Particulars 1991 2001 2009 2010 2011(1) (2) (3) (4) (5) (6)
1. Hydel 105.03 224.70 230.75 242.81 246.012. Thermal 3021.00 5265.00 7038.02 7568.20 7488.20
3. Diesel and Wind 17.97 18.00 0.82 0.82 2.82
4. Gas 100.00 100.00 - - -5. Pump Storage - 900.00 900.00 900.00
Total 3244.00 5607.70 8169.59 8711.83 8637.03
• Only Diesel sets at Rudranagar of installed (derated) capacity 0.5 MW is in operation.
Source : Department of Power,Government of West Bengal.
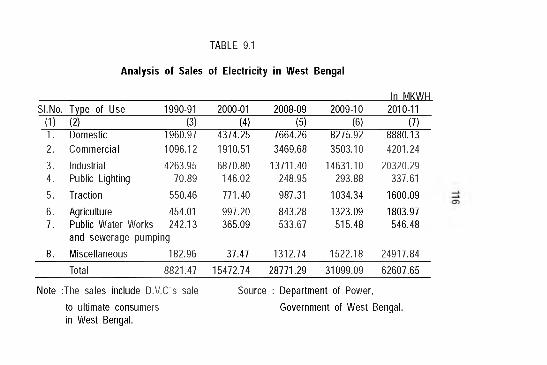
TABLE 9.1
Analysis of Sales of Electricity in West Bengal
In MKWHSI.No. Type of Use 1990-91 2000-01 2008-09 2009-10 2010-11
(1) (2) (3) (4) (5) (6) (7)1. Domestic 1960.97 4374.25 7664.26 8275.92 8880.132. Commercial 1096.12 1910.51 3469.68 3503.10 4201.243. Industrial 4263.95 6870.80 13711.40 14631.10 20320.294. Public Lighting 70.89 146.02 248.95 293.88 337.615. Traction 550.46 771.40 987.31 1034.34 1600.096. Agriculture 454.01 997.20 843.28 1323.09 1803.977. Public Water Works 242.13 365.09 533.67 515.48 546.48
and sewerage pumping8. Miscellaneous 182.96 37.47 1312.74 1522.18 24917.84
Total 8821.47 15472.74 28771.29 31099.09 62607.65
Note :The sales include D.V.C's sale to ultimate consumers in West Bengal.
Source : Department of Power,Government of West Bengal.
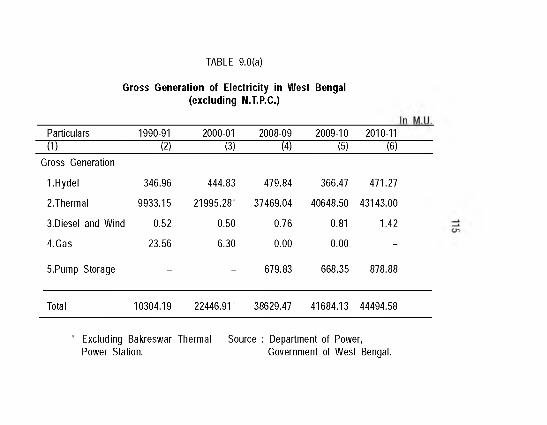
Gross Generation of Electricity in West Bengal (excluding N.T.P.C.)
TABLE 9 .0(a)
Particulars 1990-91 2000-01 2008-09 2009-10 2010-11(1) (2) (3) (4) (5) (6)
Gross Generation
I.H yde l 346.96 444.83 479.84 366.47 471.27
2.Thermal 9933.15 21995.28’ 37469.04 40648.50 43143.00
3.Diesel and Wind 0.52 0.50 0.76 0.81 1.42
4 .Gas 23.56 6.30 0.00 0.00 -
5.Pump Storage - - 679.83 668.35 878.88
Total 10304.19 22446.91’ 38629.47 41684.13 44494.58
• Excluding Bakreswar Thermal Source : Department of Power,Power Station. Government of West Bengal.
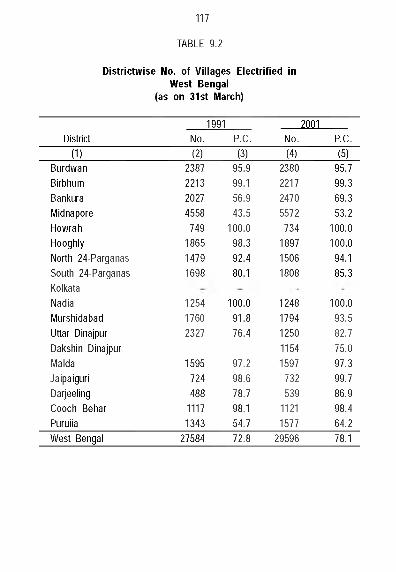
Districtwise No. of Villages Electrified in West Bengal
(as on 31st March)
117
TABLE 9 .2
1991 2001District
(1)BurdwanBirbhumBanl<uraIVIidnaporeHowrahHooghlyNorth 24-Parganas South 24-Parganas Koll<ata NadiaIVIurshidabad Uttar Dinajpur Dal<shin Dinajpur iVialda Jaipaiguri Darjeeling Cooch Behar Puruiia West Bengal
No.(2)
2387221320274558
749186514791698
125417602327
1595724488
11171343
27584
P.C.(3)
95.999.156.943.5
100.098.392.480.1
100.091.876.4
97.298.678.7 98.154.772.8
No.(4)
2380221724705572
734189715061808
12481794125011541597
732539
11211577
29596
P.C.(5)
95.799.369.353.2
100.0 100.0
94.185.3
100.093.582.775.097.399.7 86.998.464.278.1
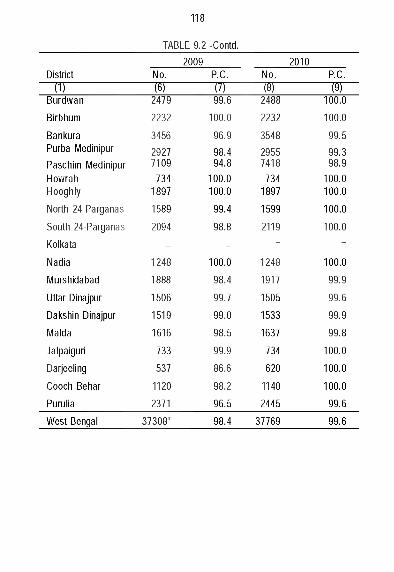
118
TABLE 9.2 -Contd.
2009 2010District No. P.C. No. P.C.
(1) (6) (7) (8) (9)Burdwan 2479 99.6 2488 100.0
Birbhum 2232 100.0 2232 100.0
Banl<ura 3456 96.9 3548 99.5Purba IVIedinipur 2927 98.4 2955 99.3Paschim IVIedinipur 7109 94.8 7418 98.9Howrah 734 100.0 734 100.0Hooghly 1897 100.0 1897 100.0
North 24-Parganas 1589 99.4 1599 100.0
South 24-Parganas 2094 98.8 2119 100.0
Kolkata - - - -
Nadia 1248 100.0 1248 100.0
Murshidabad 1888 98.4 1917 99.9
Uttar Dinajpur 1506 99.7 1505 99.6
Dakshin Dinajpur 1519 99.0 1533 99.9
Malda 1616 98.5 1637 99.8
Jalpaiguri 733 99.9 734 100.0
Darjeeling 537 86.6 620 100.0
Cooch Behar 1120 98.2 1140 100.0
Purulia 2371 96.5 2445 99.6
West Bengal 37308’ 98.4 37769 99.6
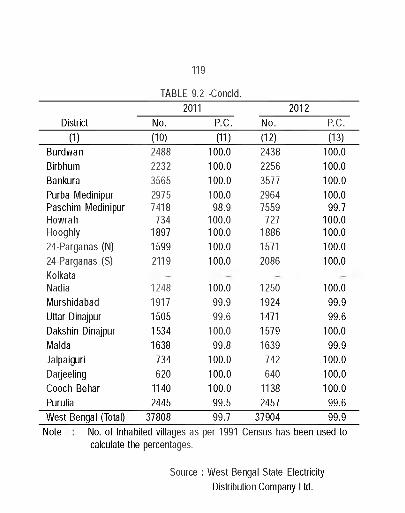
119
TABLE 9.2 -Concld.2011 2012
District No. P.C. No. P.C.(1) (10) (11) (12) (13)
BurdwanBirbhumBanl<uraPurba IVIedinipur Paschim IVIedinipur Howrah Hooghly24-Parganas (N) 24-Parganas (S) Kolkata NadiaMurshidabad Uttar Dinajpur Dakshin Dinajpur Malda Jalpaiguri Darjeeling Cooch Behar Purulia
24882232356529757418
734189715992119
12481917150515341638
734620
11402445
100.0100.0100.0100.0
98.9 100.0 100.0 100.0 100.0
100.099.9 99.6
100.099.8
100.0100.0100.0
99.5
24382256357729647559
727188615712086
12501924147115791639
742640
11382457
100.0100.0100.0100.0
99.7100.0100.0100.0100.0
100.099.999.6
100.099.9
100.0 100.0 100.0
99.6West Bengal (Total) 37808 99.7 37904 99.9
Note No. of Inhabited villages as per 1991 Census has been used to calculate the percentages.
Source : West Bengal State Electricity Distribution Company Ltd.
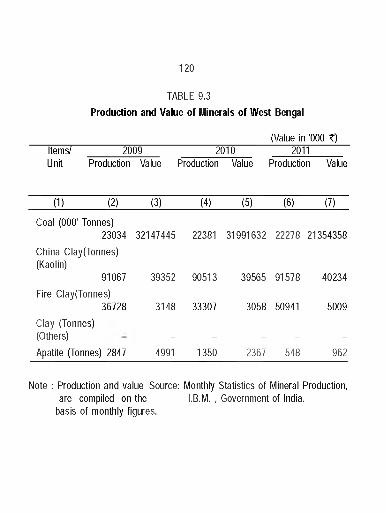
120
TABLE 9.3Production and Value of Minerals of West Bengal
(Value in '000 ?)Items/ 2009 2010 2011Unit Production Value Production Value Production Value
(1) (2) (3) (4) (5) (6) (7)
Coal (000' Tonnes)23034 32147445 22381 31991632 22278 21354358
China Clay(Tonnes) (Kaolin)
91067 39352 90513 39565 91578 40234Fire Clay(Tonnes)
36728 3148 33307 3058 50941 5009Clay (Tonnes) (Others) _ _ _ _ _Apatite (Tonnes) 2847 4991 1350 2367 548 962
Note : Production and value Source: Monthly Statistics of Mineral Production, are compiled on the I.B.M. , Government of India,
basis of monthly figures.
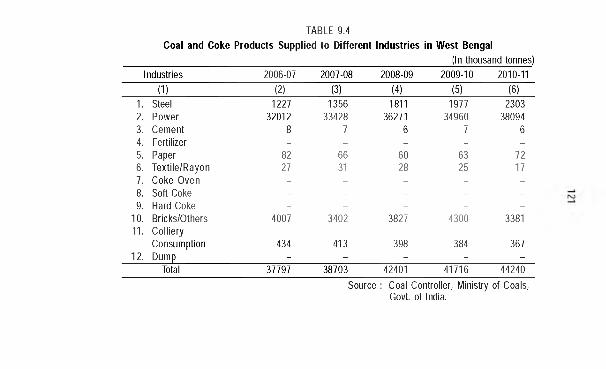
TABLE 9.4Coal and Coke Products Supplied to Different Industries in West Bengal
(In thousand tonnes)Industries 2006-07 2007-08 2008-09 2009-10 2010-11
(1) (2) (3) (4) (5) (6)1. Steel 1227 1356 1811 1977 23032. Power 32012 33428 36271 34960 380943. Cement 8 7 6 7 64. Fertilizer - - - - -
5. Paper 82 66 60 63 726. Textile/Rayon 27 31 28 25 177. Coke Oven - - - - -
8. Soft Coke - - - - -
9. Hard Coke - - - - -
10. Bricks/Others 4007 3402 3827 4300 338111. Colliery
Consumption 434 413 398 384 36712. Dump - - - - -
Total 37797 38703 42401 41716 44240Source : Coal Controller, Ministry of Coals,
Govt, of India.
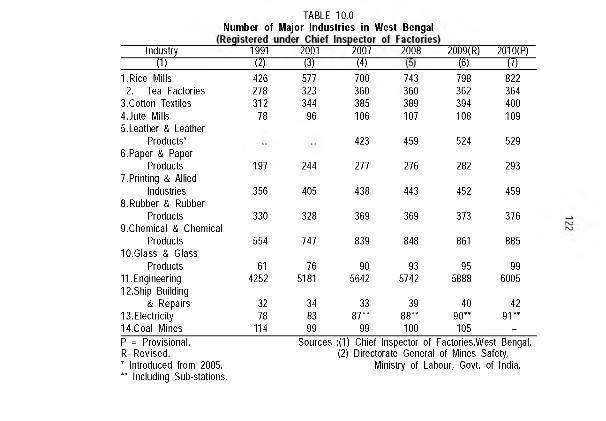
TABLE 10 .0Number of Major Industries in West Bengal
Industry 1991 2001 2007 2008 2009(R) 2010(P)(1) (2) (3) (4) (S) U)
I.R ice Mills 426 577 700 743 798 8222. Tea Factories 278 323 360 360 362 364
3.Cotton Textiles 312 344 385 389 394 4004.Jute Mills 78 96 106 107 108 1095 .Leather & Leather
Products’ 423 459 524 5296. Pa per & Paper
Products 197 244 277 276 282 2937 .Printing & Allied
Industries 356 405 438 443 452 4598 .Rubber & Rubber
Products 330 328 369 369 373 3769.Chemical & Chemical
Products 554 747 839 848 861 88510.Glass & Glass
Products 61 76 90 93 95 9911.Engineering 4252 5181 5642 5742 5888 600512.Ship Building
& Repairs 32 34 33 39 40 4213. Electricity 78 83 8 7 " 8 8 " 9 0 " 9 1 "14.Coal Mines 114 99 99 100 105 -P = Provisional.R= Revised.• Introduced from 2005. •• Including Sub-stations.
Sources :(1) Chief Inspector of Factories,West Bengal. (2) Directorate General of Mines Safety,
Ministry of Labour, Govt, of India.
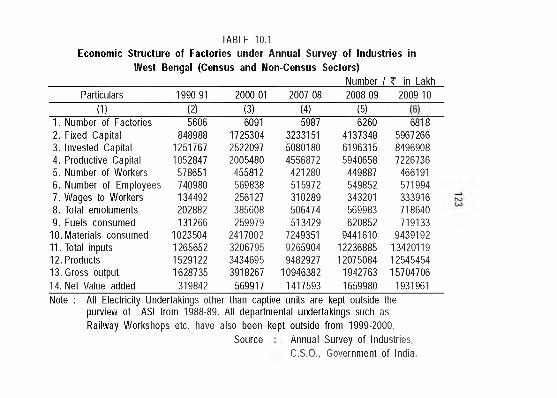
TABLE 10.1Economic Structure of Factories under Annual Survey of Industries in
West Bengal (Census and Non-Census Sectors)____________________________________________________________ Number / ? in Lakh
Particulars 1990-91 2000-01 2007-08 2008-09 2009-10(1) (2) (3) (4) (5)
1. Number of Factories 5606 6091 5987 6260 68182. Fixed Capital 848988 1725304 3233151 4137348 59672663. Invested Capital 1251767 2522097 5080180 6196315 84969084. Productive Capital 1052847 2005480 4556872 5940658 72267365. Number of Workers 578651 455812 421280 449887 4661916. Number of Employees 740980 569838 515972 549852 5719947. Wages to Workers 134492 256127 310289 343201 3339168. Total emoluments 202882 385608 506474 569983 7186409. Fuels consumed 131266 259979 513429 620852 719133
10. Materials consumed 1023504 2417002 7249351 9441610 943919211. Total inputs 1265652 3206795 9265904 12236885 1342011912. Products 1529122 3434695 9482927 12075084 1254545413. Gross output 1628735 3918267 10946382 1942763 1570470614. Net Value added_________ 319842 569917 1417593 1659980 1931961Note : All Electricity Undertakings other than captive units are kept outside the
purview of ASI from 1988-89. All departmental undertakings such as Railway Workshops etc. have also been kept outside from 1999-2000.
Source Annual Survey of Industries,C.S.O., Government of India.
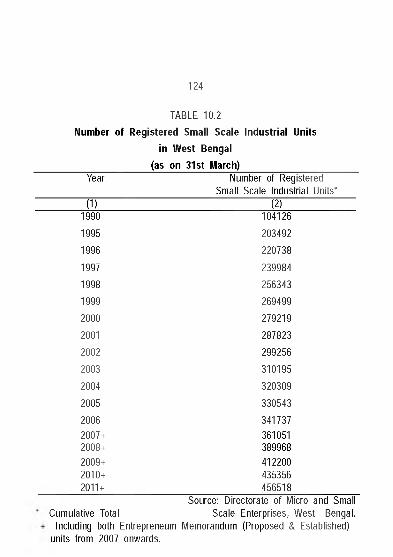
124
TABLE 10.2Number of Registered Small Scale Industrial Units
in West Bengal (as on 31st March)
Year Number of Registered Small Scale Industrial Units’
(1) (2)1990 1041261995 2034921996 2207381997 2399841998 2563431999 2694992000 2792192001 2878232002 2992562003 3101952004 3203092005 3305432006 3417372007+ 3610512008+ 3899682009+ 4122002010+ 4353562011 + 456518
Source: Directorate of Micro and Small Cumulative Total Scale Enterprises, West Bengal.
Including both Entrepreneum Memorandum (Proposed & Established) units from 2007 onwards.
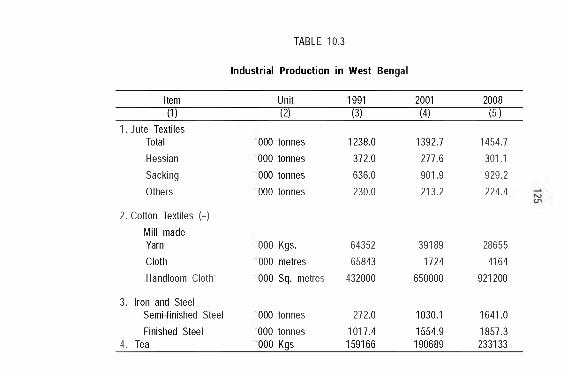
TABLE 10 .3
Industrial Production in W est Bengal
Item Unit 1991 2001 2008(1) (2) (3) (4) (5)
1. Jute TextilesTotal 000 tonnes 1238.0 1392.7 1454.7Hessian 000 tonnes 372.0 277.6 301.1Sacking 000 tonnes 636.0 901.9 929.2Others 000 tonnes 230.0 213.2 224.4
2. Cotton Textiles (+) Mill madeYarn 000 Kgs. 64352 39189 28655Cloth 000 metres 65843 1724 4164Handloom Cloth* 000 Sq. metres 432000 650000 921200
3. Iron and SteelSemi finished Steel 000 tonnes 272.0 1030.1 1641.0Finished Steel 000 tonnes 1017.4 1554.9 1857.3
4. Tea 000 Kgs 159166 190689 233133
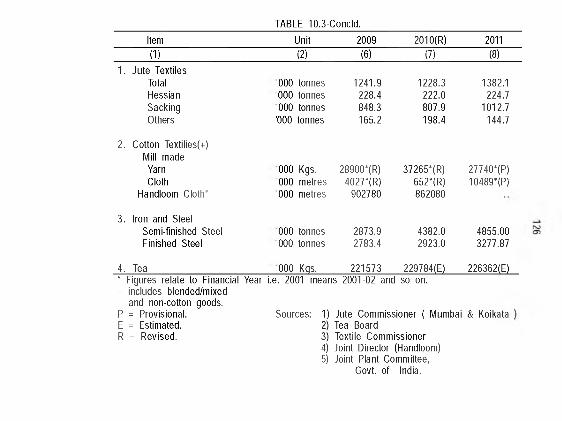
TABLE 10 .3 -C oncld .
Item Unit 2009 2010(R) 2011(1) (2) (6) (7) (8)
1. Jute Textiles Total Flessian Sacking Others
000 tonnes 000 tonnes 000 tonnes
'000 tonnes
1241.9228.4848.3165.2
1228.3222.0807.9198.4
1382.1224.7
1012.7144.7
2. Cotton Textilies(+) Mill made Yarn Cloth
Flandloom Cloth*
000 Kgs. 000 metres 000 metres
28900’ (R)4027’ (R)
902780
37265’ (R)652’ (R)862080
27740’ (P)10489’ (P)
3. Iron and SteelSemi-finished Steel Finished Steel
000 tonnes 000 tonnes
2873.92783.4
4382.02923.0
4855.003277.87
4. Tea 000 Kqs. 221573 229784(E) 226362(E)• Figures relate to Financial Year i.e. 2001 means 2001-02 and so on. + includes blended/mixed
and non-cotton goods.P = Provisional. Sources:E = Estimated.R = Revised.
1) Jute Commissioner ( Mumbai & Koikata2) Tea Board3) Textile Commissioner4) Joint Director (Flandloom)5) Joint Plant Committee,
Govt, of India.
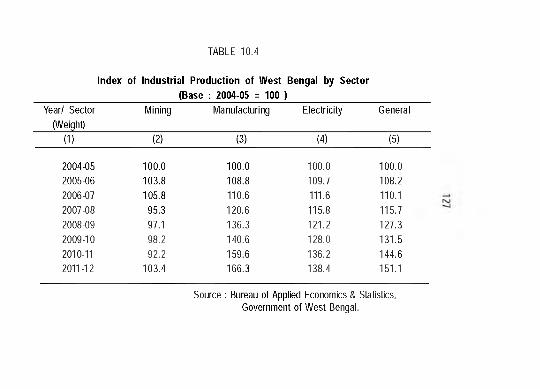
TABLE 10 .4
Index of Industrial Production of West Bengal by Sector (Base : 2004-05 = 100 )
Year/ Sector (Weight)
Mining Manufacturing Electricity General
(1) (2) (3) (4) (5)
2004-05 100.0 100.0 100.0 100.02005-06 103.8 108.8 109.7 108.22006-07 105.8 110.6 111.6 110.12007-08 95.3 120.6 115.8 115.72008-09 97.1 136.3 121.2 127.32009-10 98.2 140.6 128.0 131.52010-11 92.2 159.6 136.2 144.62011-12 103.4 166.3 138.4 151.1
Source : Bureau of Applied Economics & Statistics,Government of West Bengal.
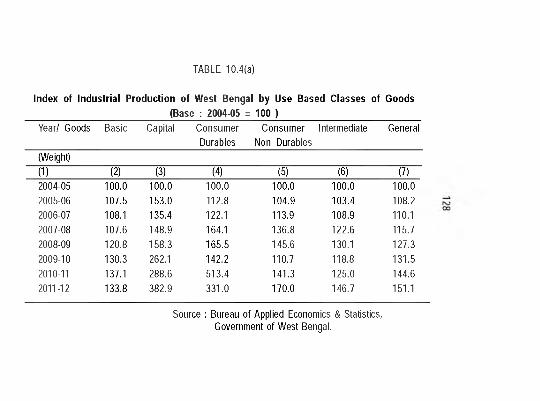
Index of Industrial Production of West Bengal by Use Based Classes of Goods _______________________________ (Base : 2004-05 = 100 )_______________________________
Year/ Goods Basic Capital Consumer Consumer Intermediate GeneralDurables Non Durables
(Weight)
TABLE 10 .4 (a )
(1) (2) (3) (4) (5) (6) (7)2004-05 100.0 100.0 100.0 100.0 100.0 100.02005-06 107.5 153.0 112.8 104.9 103.4 108.22006-07 108.1 135.4 122.1 113.9 108.9 110.12007-08 107.6 148.9 164.1 136.8 122.6 115.72008-09 120.8 158.3 165.5 145.6 130.1 127.32009-10 130.3 262.1 142.2 110.7 118.8 131.52010-11 137.1 288.6 513.4 141.3 125.0 144.62011-12 133.8 382.9 331.0 170.0 146.7 151.1
Source : Bureau of Applied Economics & Statistics, Government of West Bengal.
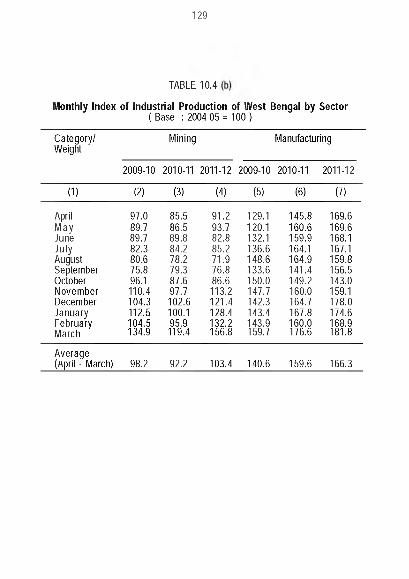
129
TABLE 10.4
Monthly Index of Industrial Production of West Bengal by Sector( Base : 2004-05 = 100 )
Category/ Mining IVIanufacturingWeight
2009-10 2010-11 2011-12 2009-10 2010-11 2011-12
(1) (2) (3) (4) (5) (6) (7)
April 97.0 85.5 91.2 129.1 145.8 169.6iViay 89.7 86.5 93.7 120.1 160.6 169.6June 89.7 89.8 82.8 132.1 159.9 168.1Ju ly 82.3 84.2 85.2 136.6 164.1 167.1August 80.6 78.2 71.9 148.6 164.9 159.8September 75.8 79.3 76.8 133.6 141.4 156.5October 96.1 87.6 86.6 150.0 149.2 143.0November 110.4 97.7 113.2 147.7 160.0 159.1December 104.3 102.6 121.4 142.3 164.7 178.0January 112.5 100.1 128.4 143.4 167.8 174.6February 104.5 95.9 132.2 143.9 160.0 168.9March 134.9 119.4 156.8 159.7 176.6 181.8
Average (April - March) 98.2 92.2 103.4 140.6 159.6 166.3
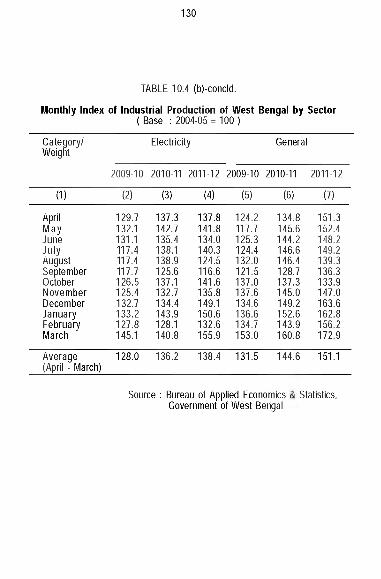
130
TABLE 10 .4 (b)-concld.
Monthly Index of Industrial Production of West Bengal by Sector(Base : 2004-05 = 100 )
Category/Weight
Electricity General
2009-10 2010-11 2011-12 2009-10 2010-11 2011-12
(1) (2) (3) (4) (5) (6) (7)
April 129.7 137.3 137.8 124.2 134.8 151.3M ay 132.1 142.7 141.8 117.7 145.6 152.4June 131.1 135.4 134.0 125.3 144.2 148.2Ju ly 117.4 138.1 140.3 124.4 146.6 149.2August 117.4 138.9 124.5 132.0 146.4 139.3September 117.7 125.6 116.6 121.5 128.7 136.3October 126.5 137.1 141.6 137.0 137.3 133.9November 125.4 132.7 135.8 137.6 145.0 147.0December 132.7 134.4 149.1 134.6 149.2 163.6January 133.2 143.9 150.6 136.6 152.6 162.8February 127.8 128.1 132.6 134.7 143.9 156.2March 145.1 140.8 155.9 153.0 160.8 172.9
Average (April - March)
128.0 136.2 138.4 131.5 144.6 151.1
Source : Bureau of Applied Economics i Government of West Bengal
Statistics,
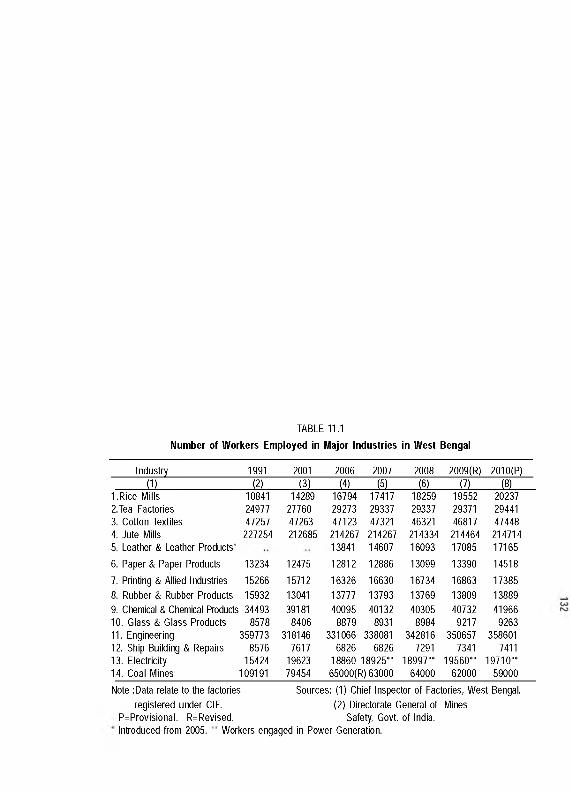
TABLE 11.1
Number of Workers Employed in Major Industries in West Bengal
Industry 1991 2001 2006 2007 2008 2009(R) 2010(P)(1) (2) (3) (4) (5) (6) (7) (8)
I.R ice Mills 10841 14289 16794 17417 18259 19552 202372.Tea Factories 24977 27760 29273 29337 29337 29371 294413. Cotton Textiles 47257 47263 47123 47321 46321 46817 474484. Jute Mills 227254 212685 214267 214267 214334 214464 2147145. Leather & Leather Products’ 13841 14607 16093 17085 171656. Paper & Paper Products 13234 12475 12812 12886 13099 13390 145187. Printing & Allied Industries 15266 15712 16326 16630 16734 16863 173858. Rubber & Rubber Products 15932 13041 13777 13793 13769 13809 138899. Chemical & Chemical Products 34493 39181 40095 40132 40305 40732 4196610. Glass & Glass Products 8578 8406 8879 8931 8984 9217 926311. Engineering 359773 318146 331066 338081 342816 350657 35860112. Ship Building & Repairs 8576 7617 6826 6826 7291 7341 741113. Electricity 15424 19623 18860 1892 5" 1899 7" 1956 0" 1971 0"14. Coal Mines 109191 79454 65000(R) 63000 64000 62000 59000Note :Data relate to the factories
registered under GIF.Sources: (1) Chief Inspector of Factories, West Bengal.
(2) Directorate General of Mines P=Provisional. R=Revised. Safety, Govt, of India.Introduced from 2005. " Workers engaged in Power Generation.
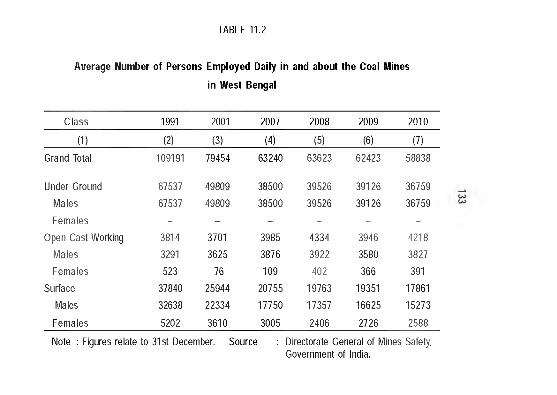
Average Number of Persons Employed Daily in and about the Coal Mines
in West Bengal
TABLE 11.2
Class 1991 2001 2007 2008 2009 2010
(1) (2) (3) (4) (5) (6) (7)Grand Total 109191 79454 63240 63623 62423 58838
Under Ground 67537 49809 38500 39526 39126 36759Males 67537 49809 38500 39526 39126 36759Females - - - - - -
Open Cast Working 3814 3701 3985 4334 3946 4218Males 3291 3625 3876 3922 3580 3827Females 523 76 109 402 366 391
Surface 37840 25944 20755 19763 19351 17861Males 32638 22334 17750 17357 16625 15273
Females 5202 3610 3005 2406 2726 2588
Note : Figures relate to 31st December. Source : Directorate General of Mines Safety, Government of India.
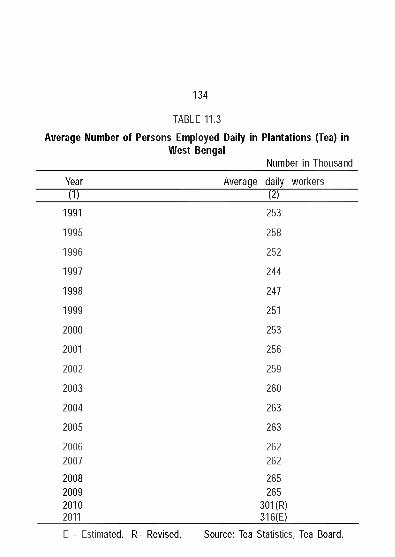
134
TABLE 11.3
Average Number of Persons Employed Daily in Plantations (Tea) inWest Bengal
Number in Thousand
Year Average daily wori<ers(1) (2)
1991 253
1995 258
1996 252
1997 244
1998 247
1999 251
2000 253
2001 256
2002 259
2003 260
2004 263
2005 263
2006 2622007 262
2008 2652009 2652010 301(R)2011 316(E)E = Estimated. R= Revised. Source: Tea Statistics, Tea Board.
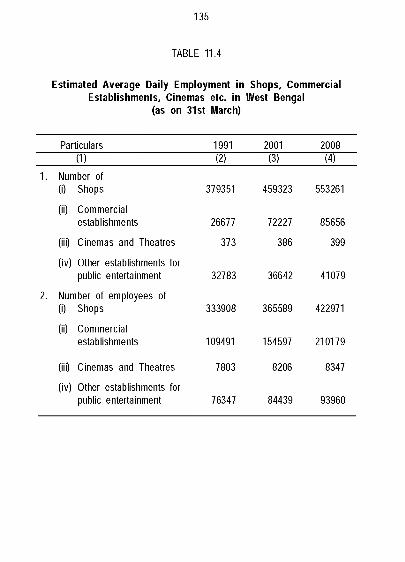
135
TABLE 11.4
Estimated Average Daily Employment in Shops, CommercialEstablishments, Cinemas etc. in West Bengal
(as on 31st March)
Particulars 1991 2001 2008(1) (2) (3) (4)
1. Number of (i) Shops 379351 459323 553261
(ii) Commercial establishments 26677 72227 85656
(ill) Cinemas and Theatres 373 386 399
(iv) Other establishments for public entertainment 32783 36642 41079
2. Number of employees of (I) Shops 333908 365589 422971
(ii) Commercial establishments 109491 154597 210179
(ill) Cinemas and Theatres 7803 8206 8347
(iv) Other establishments for public entertainment 76347 84439 93960
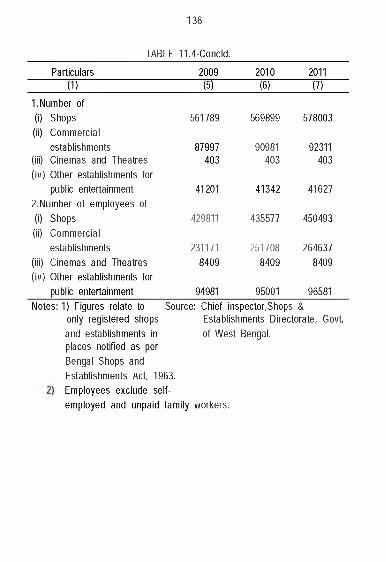
TABLE
136
11.4-Concld.
Particulars 2009 2010 2011(1) (5) (6) (7)
1.Number of(I) Shops 561789 569899 578003(II) Commercial
establishments 87997 90981 92311(ill) Cinemas and Theatres 403 403 403(iv) Other establishments for
public entertainment 41201 41342 416272.Number of employees of(I) Shops 429811 435577 450493(II) Commercial
establishments 231171 251708 264637(ill) Cinemas and Theatres 8409 8409 8409(iv) Other establishments for
public entertainment 94981 95001 96581Notes: 1) Figures relate to Source: Chief Inspector,Shops &
only registered shops Establishments Directorate, Govt.and establishments in places notified as per Bengal Shops and Establishments Act, 1963.Employees exclude self- employed and unpaid family workers.
of West Bengal.
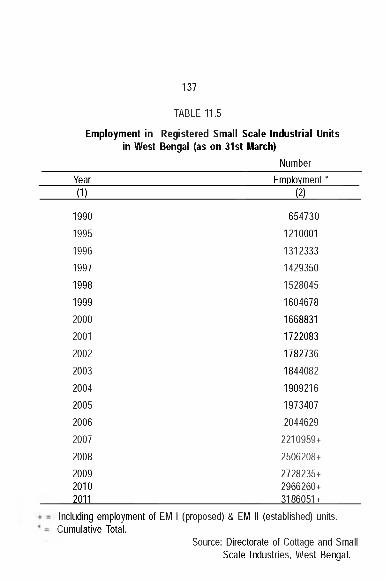
Employment in Registered Small Scale Industrial Units in West Bengal (as on 31st March)
Number
137
TABLE 11.5
Year Employment ’(1) (2)
1990 6547301995 12100011996 13123331997 14293501998 15280451999 16046782000 16688312001 17220832002 17827362003 18440822004 19092162005 19734072006 20446292007 2210959+2008 2506208+2009 2728235+2010 2966260+2011 3186051 +
Including employment of EM I (proposed) & EM II (established) units. Cumulative Total.
Source: Directorate of Cottage and Small Scale Industries, West Bengal.
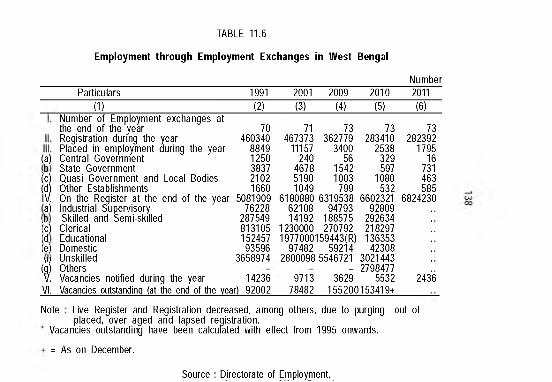
Employment through Employment Exchanges in W est Bengal
TABLE 11.6
NumberParticulars 1991 2001 2009 2010 2011
(1) (2) (3) (4) (5) (6)
(a)b
(c)(d) IV. a) b c) d e)
iVI.
Number of Employment exchanges atthe end of the year 70Registration durmg the year 460340Placed in employment during the year 8849Central Government 1250State Government 3837Quasi Government and Local Bodies 2102Other Establishments 1660On the Register at the end of the year 5081909Industrial Supervisory 76228Skilled and Semi-skilled 287549Clerical 813105Educational 152457Domestic 93596Unskilled 3658974 OthersVacancies notified during the year 14236 Vacancies outstanding (at the end of the year) 92002
71 73 73 73467373 362779 283410 282392
11157 3400 2538 1795240 56 329 16
4678 1542 597 7315190 1003 1080 4631049 799 532 585
6180880 6319538 6602321 682423062108 94793 9280914192 188575 292634
1230000 270792 2182971977000159443(R) 136353
97482 59214 423082800098 5546721 3021443
- 27984779713 3629 5532 2436
78482 155200153419+
Note Live Register and Registration decreased, among others, due to purging out of placed, over aged and lapsed registration.
Vacancies outstanding have been calcufated with effect from 1995 onwards.
= As on December.
Source : Directorate of Employment,
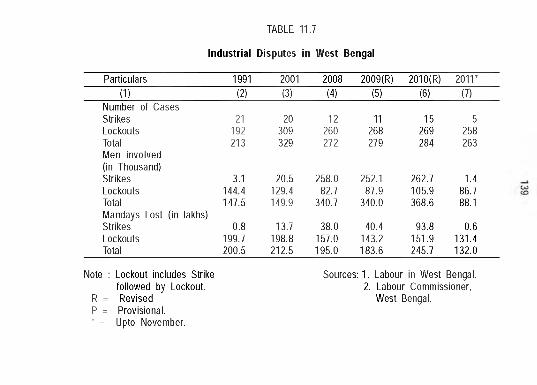
TABLE 11.7
Industrial Disputes in West Bengal
Particulars 1991 2001 2008 2009(R) 2010(R) 2 0 i r(1) (2) (3) (4) (5) (6) (7)
Number of Cases Strikes 21 20 12 11 15 5Lockouts 192 309 260 268 269 258Total 213 329 272 279 284 263Men involved (in Thousand) Strikes 3.1 20.5 258.0 252.1 262.7 1.4Lockouts 144.4 129.4 82.7 87.9 105.9 86.7Total 147.5 149.9 340.7 340.0 368.6 88.1Mandays Lost (in lakhs) Strikes 0.8 13.7 38.0 40.4 93.8 0.6Lockouts 199.7 198.8 157.0 143.2 151.9 131.4Total 200.5 212.5 195.0 183.6 245.7 132.0
Note : Lockout includes Strike followed by Lockout.
R = Revised P = Provisional.• = Upto November.
S o u rc e s :! Labour in West Bengal.2. Labour Commissioner,
West Bengal.
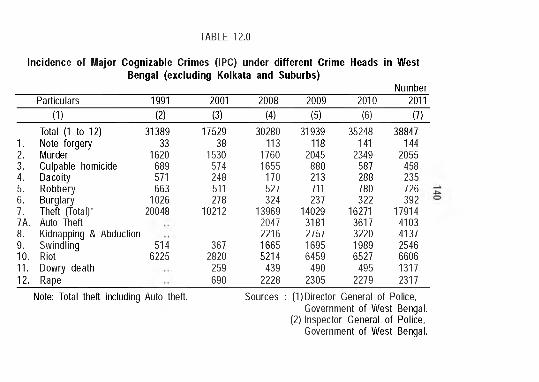
TABLE 12 .0
Incidence of Major Cognizable Crimes (IPC) under different Crime Heads in West Bengal (excluding Kolkata and Suburbs)
NumberParticulars 1991 2001 2008 2009 2010 2011
(1) (2) (3) (4) (5) (6) (7)Total (1 to 12)
1. Note forgery2. Murder3. Culpable homicide4. Dacoity5. Robbery6. Burglary7. Theft (Total)’7A. Auto Theft8. Kidnapping & Abduction9. Swindling10. Riot11. Dowry death12. Rape
3138933
1620689571663
102620048
5146225
1752938
1530574248511278
10212
3672820
259690
30280113
17601655
170527324
139692047221616655214
4392228
31939118
2045880213711237
140293181275716956459
4902305
35248141
2349587288780322
162713617322019896527
4952279
38847144
2055458235726392
17914410341372546660613172317
Note: Total theft including Auto theft. Sources : (1) Director General of Police, Government of West Bengal.
(2) Inspector General of Police, Government of West Bengal.
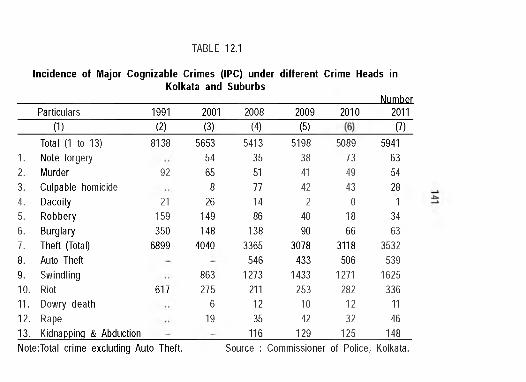
TABLE 12.1
Incidence of Major Cognizable Crimes (IPC) under different Crime Heads in Kolkata and Suburbs
______________________________________________________________________________NumberParticulars 1991 2001 2008 2009 2010 2011
(1) (2) (3) (4) (5) (7)Total (1 to 13)
1. Note forgery2. Murder3. Culpable homicide4. Dacoity5. Robbery6. Burglary7. Theft (Total)8. Auto Theft9. Swindling10. Riot11. Dowry death12. Rape13. Kidnapping & Abduction
8138
92
21159350
6899
617
565354658
26149148
4040
863275
619
54133551771486
1383365
5461273
2111235
116
5198384142
24090
3078433
1433253
1042
129
5089734943
01866
3118506
1271282
1232
125
59416354281
3463
3532539
1625336
1146
148Note:Total crime excluding Auto Theft. Source : Commissioner of Police, Kolkata.
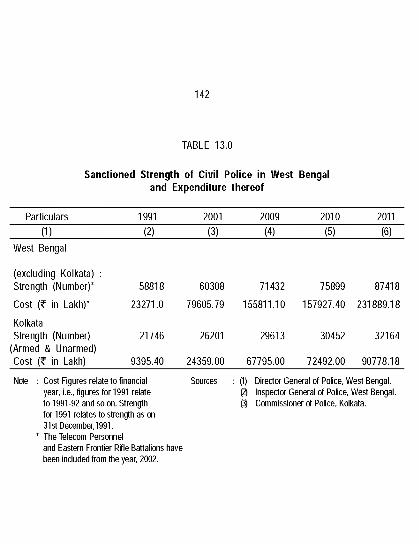
142
TABLE 13.0
Sanctioned Strength of Civil Police in West Bengal and Expenditure thereof
Particulars 1991 2001 2009 2010 2011(1) (2) (3) (4) (5) (6)
West Bengal
(excluding Kolkata) :Strength (Number)’ 58818 60308 71432 75899 87418
Cost (? in Lakh)’ 23271.0 79605.79 155811.10 157927.40 231889.18
KolkataStrength (Number) 21746 26201 29613 30452 32164
(Armed & Unarmed) Cost (? in Lakh) 9395.40 24359.00 67795.00 72492.00 90778.18
Note : Cost Figures relate to financial year, i.e., figures for 1991 relate to 1991 -92 and so on. Strength for 1991 relates to strength as on 31stD ecem ber,1991.
• T he Telecom Personnel and Eastern Frontier Rifle Battalions have been included from the year, 2002 .
Sources : (1) Director G eneral of Police, W est Bengal.(2) Inspector G eneral of Police, W est Bengal.0 Com m issioner of Police, Kolkata.
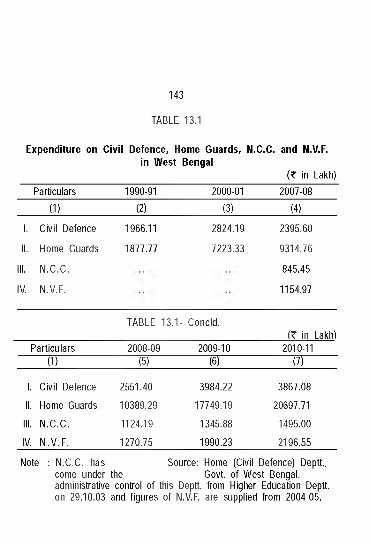
143
TABLE 13.1
Expenditure on Civil Defence, Home Guards, N.C.C. and N.V.F.in West Bengal
(? in Lakh)Particulars 1990-91 2000-01 2007-08
(1) (2) (3) (4)
1. Civil Defence 1966.11 2824.19 2395.60
II. Home Guards 1877.77 7223.33 9314.76
III. N .C.C. 845.45
IV. N.V.F. 1154.97
TABLE 13.1 - Concld.(? in Lakh)
Particulars 2008-09 2009-10 2010-11(1) (5) (6) (7)
1. Civil Defence 2551.40 3984.22 3867.08
II. Home Guards 10389.29 17749.19 20697.71
III. N .C.C. 1124.19 1345.88 1495.00
IV N .V .F . 1270.75 1990.23 2196.55
Note : N.C.C. has Source: Home (Civil Defence) Deptt.,come under the Govt, of West Bengal,administrative control of this Deptt. from Higher Education Deptt. on 29.10.03 and figures of N.V.F. are supplied from 2004-05.
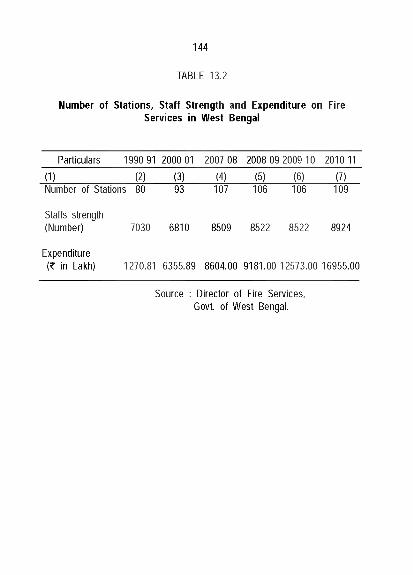
Number of Stations, S taff Strength and Expenditure on Fire Services in West Bengal
144
TABLE 13.2
Particulars 1990-91 2000-01 2007-08 2008-09 2009-10 2010-11
(1) (2) (3) (4) (5) (6) (7)Number of Stations 80 93 107 106 106 109
Staffs strength (Number) 7030 6810 8509 8522 8522 8924
Expenditure (? in Lakh) 1270.81 6355.89 8604.00 9181.00 12573.00 16955.00
Source : Director of Fire Services, Govt, of West Bengal.
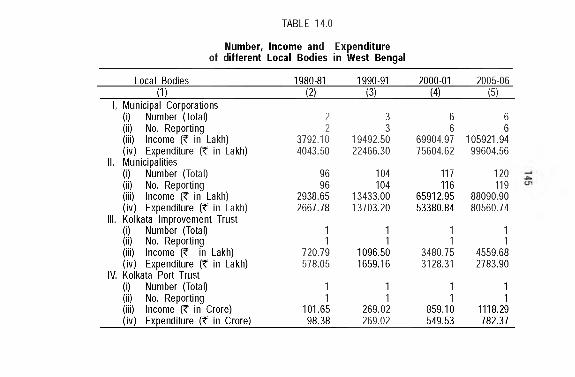
TABLE 14.0
Number, Income and Expenditure of different Local Bodies in West Bengal
Local Bodies 1980-81 1990-91 2000-01 2005-06(1) (2) (3) (4) (5)
L Municipal Corporations(I) Number (Total) 2 3 6 6(II) No. Reporting 2 3 6 6(ill) Income (? in Lakh) 3792.10 19492.50 69904.97 105921.94(iv) Expenditure (? in Lakh) 4043.50 22466.30 75604.62 99604.56
II. Municipalities(I) Number (Total) 96 104 117 120(ii) No. Reporting 96 104 116 119(ill) Income (? in Lakh) 2938.65 13433.00 65912.95 88090.90(iv) Expenditure (? in Lakh) 2667.78 13703.20 53380.84 80560.74
III. Kolkata Improvement Trust(I) Number (Total) 1 1 1 1(ii) No. Reporting 1 1 1 1(ill) Income (? in Lakh) 720.79 1096.50 3480.75 4559.68(iv) Expenditure (? in Lakh) 578.05 1659.16 3128.31 2783.90
IV. Kolkata Port Trust(I) Number (Total) 1 1 1 1(ii) No. Reporting 1 1 1 1(ill) Income (? in Crore) 101.65 269.02 859.10 1118.29(iv) Expenditure (? in Crore) 98.38 269.02 549.53 782.37
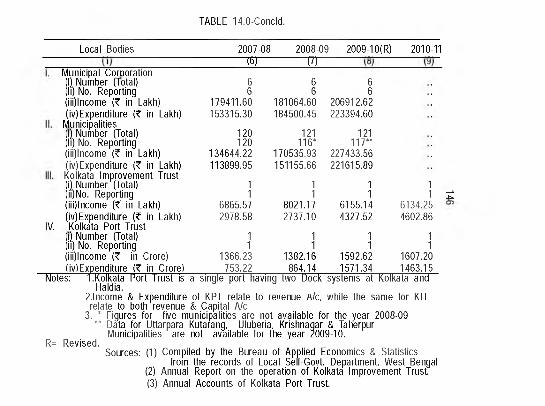
TABLE 14.0-Concld.
Local Bodies 2007-08— (5)-------
2008-09(7)
2009-10(R) 2010-11
Municipal Comoration I) Number (Total) li) No. Reporting
(iii)lncome (? in Lakh)(iv) Expenditure ( f in Lakh)
MunicipalitiesI) Number (Total) li) No. Reporting
(iii)lncome (? in Lakh)(iv)Expenditure (? in Lakh) Kolkata Improvement Trust I) Number (Total)ii)No. Reporting
(iii)lncome (? in Lakh)(iv)Expenditure ( f in Lakh) Kolkata Port TrustI) Number (Total) ii) No. Reporting
(iii)lncome (? in Crore)(iv) Expenditure (? in Crore)
IV.
66
179411.60153315.30
120120
134644.22113899.95
116865.572978.58
111366.23
753.22
66
181064.60184500.45
121116’
170535.93151155.66
118021.172737.10
111382.16
864.14
66
206912.62223394.60
1211 1 7 "
227433.56221615.89
116155.144327.52
11
1592.621571.34
11 ^
6134.254602.86
111607.201463.15
Notes: 1.Kolkata Port I rust is a single port having two Dock systems at Kolkata and Haldia.
2.lncome & Expenditure of KPT relate to revenue A/c, while the same for KIT relate to both revenue & Capital A/c
3. • Figures for five municipalities are not available for the year 2008-09 •• Data for Uttarpara Kutarang, Uluberia, Krishnagar & Taherpur
Municipalities are not available for the year 2009-10.R= Revised.
Sources: (1) Compiled by the Bureau of Applied Economics & Statisticsfrom the records of Local Self-Govt. Department, West Bengal
(2) Annual Report on the operation of Kolkata Improvement Trust.(3) Annual Accounts of Kolkata Port Trust.
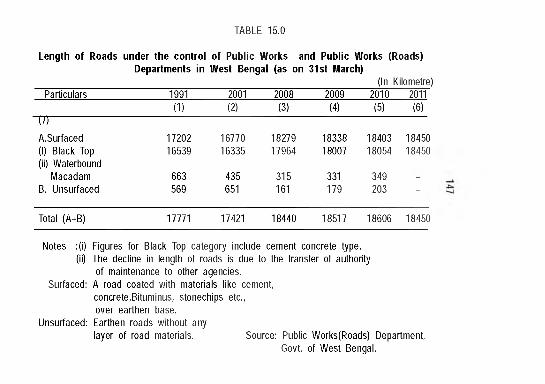
TABLE 15.0
Length of Roads under the control of Public Works and Public Works (Roads) Departments in West Bengal (as on 31st March)
(In Kilometre)Particulars 1991 2001 2008 2009 2010 2011
(1) (2) (3) (4) (5) (6)U )
A.Surfaced 17202 16770 18279 18338 18403 18450(1) Black Top 16539 16335 17964 18007 18054 18450(ii) Waterbound
Macadam 663 435 315 331 349 -
B. Unsurfaced 569 651 161 179 203 -
Total (A+B) 17771 17421 18440 18517 18606 18450
Notes :(i) Figures for Black Top category include cement concrete type.(ii) The decline in length of roads is due to the transfer of authority
of maintenance to other agencies.Surfaced: A road coated with materials like cement,
concrete,Bituminus, stonechips etc., over earthen base.
Unsurfaced: Earthen roads without anylayer of road materials. Source: Public Works(Roads) Department,
Govt, of West Bengal.
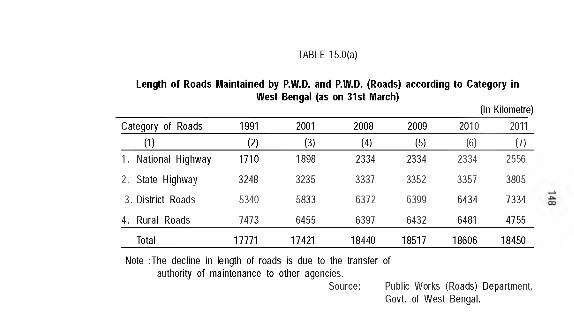
Length of Roads Maintained by P.W.D. and P.W.D. (Roads) according to Category in West Bengal (as on 31st March)
(In Kilometre)
TABLE 15.0(a)
Category of Roads 1991 2001 2008 2009 2010 2011
(1) (2) (3) (4) (5) (6) (7)1. National Highway 1710 1898 2334 2334 2334 2556
2. State Highway 3248 3235 3337 3352 3357 3805
3. District Roads 5340 5833 6372 6399 6434 7334
4. Rural Roads 7473 6455 6397 6432 6481 4755
Total 17771 17421 18440 18517 18606 18450
Note :The decline in length of roads is due to the transfer of authority of maintenance to other agencies.
Source: Public Works (Roads) Department, Govt, of West Bengal.
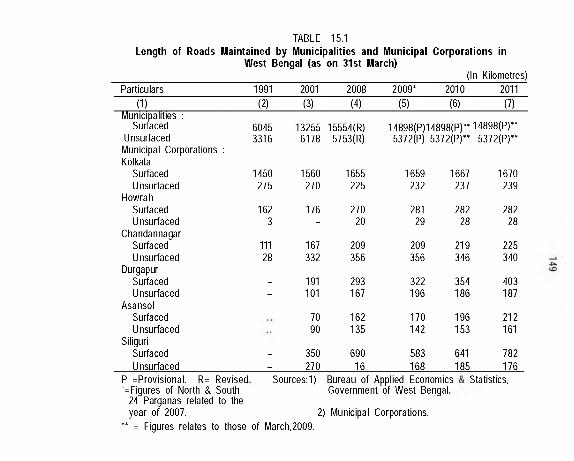
Length of Roads Maintained by Municipalities and Municipal Corporations in West Bengal (as on 31st March)
(In Kilometres)
TABLE 15.1
Particulars 1991 2001 2008 2009’ 2010 2011(1) (2) (3) (4) (5) (6) (7)
Municipalities :Sur aced 6045 13255 15554(R) 14898(P)14898(P)" 14898(P )"
Unsurfaced 3316 6178 5753(R) 5372(P) 5372 (P )" 5372 (P )"Municipal Corporations : Kolkata
Surfaced 1450 1560 1655 1659 1667 1670Unsurfaced 275 270 225 232 237 239
HowrahSurfaced 162 176 270 281 282 282Unsurfaced 3 - 20 29 28 28
ChandannagarSurfaced 111 167 209 209 219 225Unsurfaced 28 332 356 356 346 340
DurgapurSurfaced - 191 293 322 354 403Unsurfaced - 101 167 196 186 187
AsansolSurfaced 70 162 170 196 212Unsurfaced 90 135 142 153 161
SiliguriSurfaced - 350 690 583 641 782Unsurfaced - 270 16 168 185 176
P =Provisional. R= Revised •=Figures of North & South
24 Parganas related to the year of 2007.
•• = Figures relates to those of March,2009.
Sources:1) Bureau of Applied Economics Government of West Bengal.
2) Municipal Corporations.
Statistics,
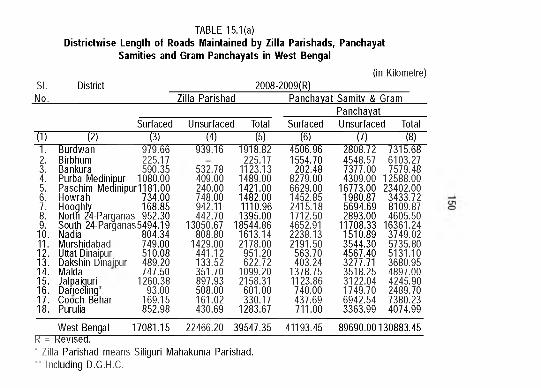
TABLE 15.1(a)Districtwise Length of Roads Maintained by Zilla Parishads, Panchayat
Sanities and Gram Panchayats in West Bengal(in Kilometre)
SI.No.
District 2008-2009(R)Zilla Parishad Panchayat Samitv & Gram
Surfaced(1) (2) (3)1. Burdwan 979.662. Birbhum 225.173. Bankura 590.354. Purba Medinipur 1080.005. Paschim Medinipur1181.006. Howrah 734.007. Hooghly 168.858. North 24-Parganas 952.309. South 24-Parqanas5494.19
10. Nadia 804.3411. Murshidabad 749.0012. Uttat Dinaipur 510.0813. Dakshin Dinaipur 489.2014. Malda 747.5015. Jalpaiguri 1260.3816. Darieelinq* 93.0017. Cooch Behar 169.1518. Purulia 852.98
Unsurfaced Total1 4 ) [5 T
Surfaced1 6 T
PanchayatUnsurfaced
I T TTotali r
939.16 1918.82225.17
532.78 1123.13409.00 1489.00240.00 1421.00748.00 1482.00942.11 1110.96442.70 1395.00
13050.67 18544.86808.80 1613.14
1429.00 2178.00441.12 951.20133.52 622.72351.70 1099.20897.93 2158.31508.00 601.00161.02 330.17430.69 1283.67
4506.961554.70
202.488279.006629.001452.85 2415.181712.50 4652.91 2238.132191.50 563.70 403.24
1378.751123.86740.00 437.69711.00
2808.72 7315.684548.57 6103.277377.00 7579.484309.00 12588.00
16773.00 23402.001980.87 3433.725694.69 8109.872893.00 4605.50
11708.33 16361.241510.89 3749.023544.30 5735.804567.40 5131.103277.71 3680.953518.25 4897.003122.04 4245.901749.70 2489.706942.54 7380.23 3363.99 4074.99
17081.15 22466.20 39547.35 41193.45 89690.00130883.45West BengalK = Kevised.• Zilla Parishad means Siliguri Mahakuma Parishad. " Including D.G.H.C.
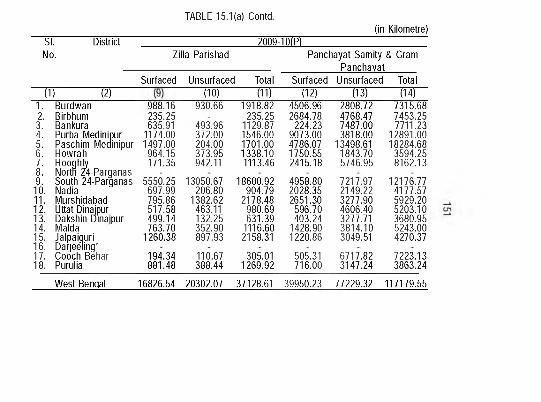
TABLE 15.1(a) Contd.
2009-10(P)(in Kilometre)
SI.No.
DistrictZilla Parishad
l i T ~ WSurfaced Unsurfaced
(10)Total
■ W
Panchayat Samity & Gram ________ Panchayat_______
Surfaced(12)
UnsurfacedTi3)
Total“W
1. Burdwan2. Birbhum3. Bankura4. Purba Medinipur5. Paschim Medinipur6. Howrah7. Hooghly8. North 24-Parganas9. South 24-Parganas
10. Nadia11. Murshidabad12. Uttat Dinajpur13. Dakshin Dinajpur14. Malda15. Jalpaiguri16. Darjeeling*17. CoochBehar18. Purulia
988.16 930.66 1918.82 4506.96 2808.72 7315.68235.25 235.25 2684.78 4768.47 7453.25635.91 493.96 1129.87 224.23 7487.00 7711.23
1174.00 372.00 1546.00 9073.00 3818.00 12891.001497.00 204.00 1701.00 4786.07 13498.61 18284.68
964.15 373.95 1338.10 1750.55 1843.70 3594.25171.35 942.11 1113.46 2415.18 5746.95 8162.13
5550.25 13050.67 18600.92 4958.80 7217.97 12176.77697.99 206.80 904.79 2028.35 2149.22 4177.57795.86 1382.62 2178.48 2651.30 3277.90 5929.20517.58 463.11 980.69 596.70 4606.40 5203.10499.14 132.25 631.39 403.24 3277.71 3680.95763.70 352.90 1116.60 1428.90 3814.10 5243.00
1260.38 897.93 2158.31 1220.86 3049.51 4270.37
194.34 110.67 305.01 505.31 6717.82 7223.13881.48 388.44 1269.92 716.00 3147.24 3863.24
West Bengal 16826.54 20302.07 37128.61 39950.23 77229.32 117179.55
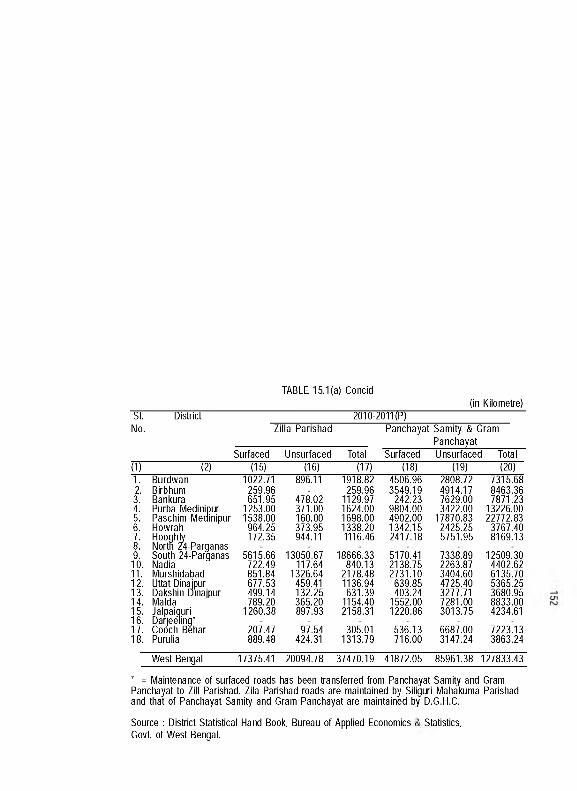
TABLE 15.1(a) Concid(in Kilometre)
SI. District 2010-2011(P)No. Zilla Parishad Panchayat Samity & Gram
PanchayatSurfaced Unsurfaced Total Surfaced Unsurfaced Total
(1) (2) (15) (16) (17) (18) (19) (20)1. Burdwan 1022.71 896.11 1918.82 4506.96 2808.72 7315.682. Birbhum 259.96 - 259.96 3549.19 4914.17 8463.363. Bankura 651.95 478.02 1129.97 242.23 7629.00 7871.234. Purba Medinipur 1253.00 371.00 1624.00 9804.00 3422.00 13226.005. Paschim Medinipur 1538.00 160.00 1698.00 4902.00 17870.83 22772.836. Howrah 964.25 373.95 1338.20 1342.15 2425.25 3767.407.8.
HooghjyNorth 24-Parganas
172.35 944.11 1116.46 2417.18 5751.95 8169.13
9. South 24-Parganas 5615.66 13050.67 18666.33 5170.41 7338.89 12509.3010. Nadia 722.49 117.64 840.13 2138.75 2263.87 4402.6211. Murshidabad 851.84 1326.64 2178.48 2731.10 3404.60 6135.7012. Uttat Dinajpur
Dakshin Dinajpur677.53 459.41 1136.94 639.85 4725.40 5365.25
13. 499.14 132.25 631.39 403.24 3277.71 3680.9514. Malda 789.20 365.20 1154.40 1552.00 7281.00 8833.0015.16.
JalpaiguriDarjeeling*
1260.38 897.93 2158.31 1220.86 3013.75 4234.61
17. Cooch Behar 207.47 97.54 305.01 536.13 6687.00 7223.1318. Purulia 889.48 424.31 1313.79 716.00 3147.24 3863.24
West Bengal 17375.41 20094.78 37470.19 41872.05 85961.38 127833.43
• = Maintenance of surfaced roads has been transferred from Panchayat Samity and Gram Panchayat to Zill Parishad. Zila Parishad roads are maintained by Siliguri IViahal<uma Parishad and that of Panchayat Samity and Gram Panchayat are maintained by D.G.H.C.
Source : District Statistical Hand Booi<, Bureau of Applied Economics i Govt, of West Bengal.
Statistics,
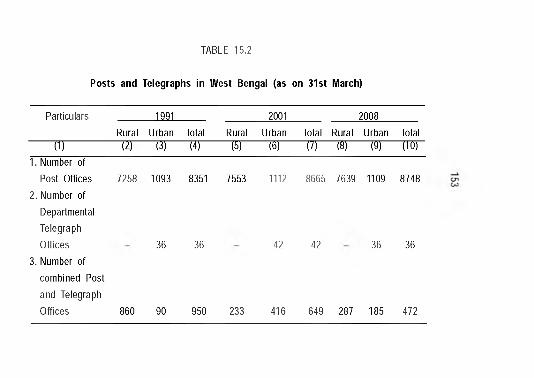
Posts and Telegraphs in West Bengal (as on 31st March)
TABLE 15.2
Particulars 1991 2001 2008Rural Urban Total Rural Urban Total Rural Urban Total
(1) (-') (-i) (4) (!)) (S) (1} («) (y) (10)1. Number of
Post Offices 7258 1093 8351 7553 1112 8665 7639 1109 87482. Number of
Departmental Telegraph Offices 36 36 42 42 36 36
3. Number of combined Post and Telegraph Offices 860 90 950 233 416 649 287 185 472
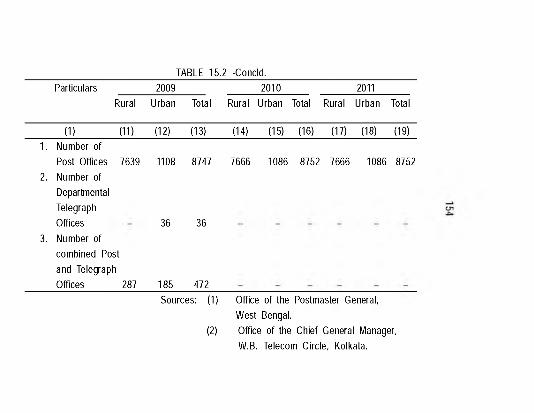
TABLE 15.2 -Concld.Particulars 2009 2010 2011
Rural Urban Total Rural Urban Total Rural Urban Total
(1) (11) (12) (13) (14) (15) (16) (17) (18) (19)1. Number of
Post Offices 7639 1108 8747 7666 1086 8752 7666 1086 87522. Number of
Departmental Telegraph Offices 36 36
3. Number of combined Post and Telegraph Offices 287 185 472
Sources: (1) Office of the Postmaster General, West Bengal.
(2) Office of the Chief General Manager, W.B. Telecom Circle, Kolkata.
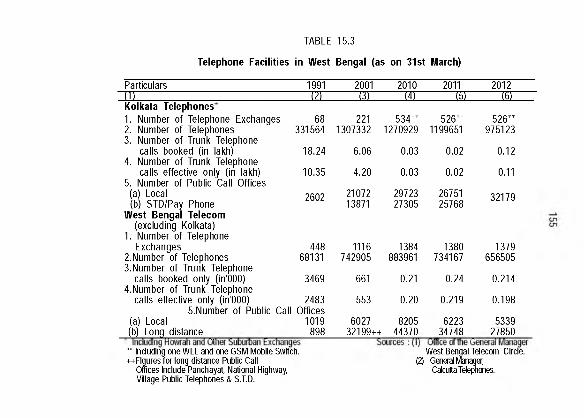
Telephone Facilities in West Bengal (as on 31st March)
TABLE 15.3
Particulars 1991 2001 2010 2011 2012(1) (?) (31 (4) (51 (6)Kolkata Telephones*1. Number of Telephone Exchanges 68 221 5 3 4 " 5 2 6 " 5 2 6 "2. Number of Telephones 331564 1307332 1270929 1199651 9751233. Number of Trunl< Telephone
calls bool<ed (in lal<h) 18.24 6.06 0.03 0.02 0.124. Number of Trunl< Telephone
calls effective only (in lakh) 10.35 4.20 0.03 0.02 0.115. Number of Public Call Offices
(a) Local 2602 21072 29723 26751 32179(b) STD/Pay Phone 13871 27305 25768West Bengal Telecom
(excluding Kolkata)1. Number of Telephone
Exchanges 448 1116 1384 1380 13792.Number of Telephones 68131 742905 883961 734167 6565053.Number of Trunk Telephone
calls booked only (in'OOO) 3469 661 0.21 0.24 0.2144.Number of Trunk Telephone
calls effective only (in'OOO) 2483 553 0.20 0.219 0.198S.Number of Public Call Offices
(a) Local 1019 6027 8205 6223 5339(b) Long distance 898 32199+hh 44370 34748 27850
• • Including one W L L and one G S M Mobile Switch. ++Flgures for long distance Public Call
Offices Include Panchayat, National Highway, Village Public Telephones & S .T D .
W est Bengal Telecom Circle. (2) General Manager,
Calcutta Telephones.
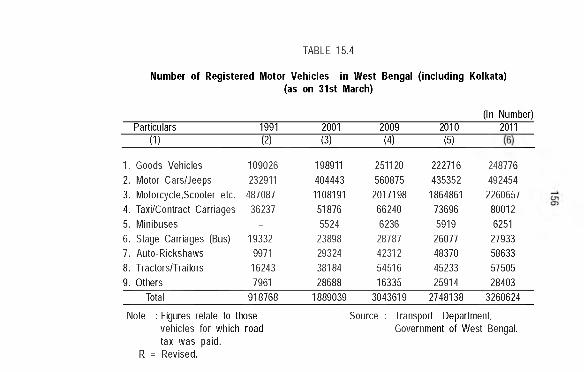
Number of Registered Motor Vehicles in West Bengal (including Kolkata) (as on 31st March)
TABLE 15.4
(In Number)Particulars 1991 2001 2009 2010 2011
(1) (2) (3) (4) (5)
1. Goods Vehicles 109026 198911 251120 222716 2487762. Motor Cars/Jeeps 232911 404443 560875 435352 4924543. Motorcycle,Scooter etc. 487087 1108191 2017198 1864861 22606574. Taxi/Contract Carriages 36237 51876 66240 73696 800125. Minibuses - 5524 6236 5919 62516. Stage Carriages (Bus) 19332 23898 28787 26077 279337. Auto-Rickshaws 9971 29324 42312 48370 586338. Tractors/Trailors 16243 38184 54516 45233 575059. Others 7961 28688 16335 25914 28403
Total 918768 1889039 3043619 2748138 3260624
Note : Figures relate to those vehicles for which road tax was paid.
R = Revised.
Source : Transport Department,Government of West Bengal.
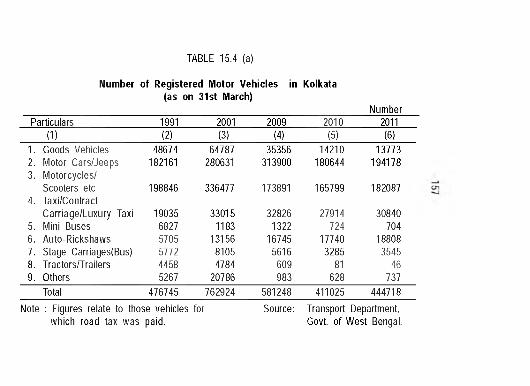
TABLE 15.4 (a)
Number of Registered Motor Vehicles in (as on 31st March)
Kolkata
NumberParticulars 1991 2001 2009 2010 2011
(1) (2) (3) (4) (5) (6)1. Goods Vehicles 48674 64787 35356 14210 137732. Motor Cars/Jeeps3. Motorcycles/
182161 280631 313900 180644 194178
Scooters etc 4. Taxi/Contract
198846 336477 173891 165799 182087
Carriage/Luxury Taxi 19035 33015 32826 27914 308405. Mini Buses 6827 1183 1322 724 7046. Auto-Rickshaws 5705 13156 16745 17740 188087. Stage Carriages(Bus) 5772 8105 5616 3285 35458. Tractors/Trailers 4458 4784 609 81 469. Others 5267 20786 983 628 737
Total 476745 762924 581248 411025 444718Note : Figures relate to those vehicles for Source: Transport Department,
which road tax was paid. Govt, of West Bengal.
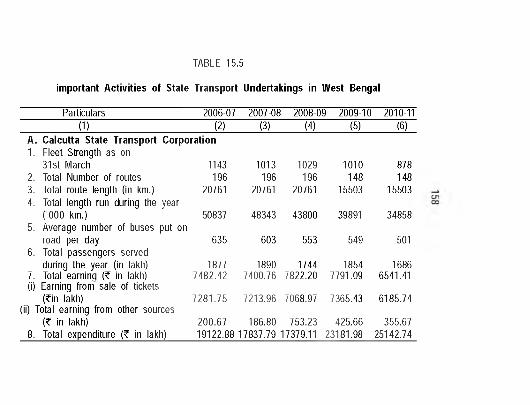
TABLE 15.5
important Activities of State Transport Undertakings in West Bengal
Particulars 2006-07 2007-08 2008-09 2009-10 2010-11(1) (2) (3) (4) (5) (6)
A. Calcutta State Transport Corporation1. Fleet Strength as on
31st March 1143 1013 1029 1010 8782. Total Number of routes 196 196 196 148 1483. Total route length (in km.) 20761 20761 20761 15503 155034. Total length run during the year
( 000 km.) 50837 48343 43800 39891 348585. Average number of buses put on
road per day 635 603 553 549 5016. Total passengers served
during the year (in lakh) 1877 1890 1744 1854 16867. Total earning (? in lakh) 7482.42 7400.76 7822.20 7791.09 6541.41(I) Earning from sale of tickets
( t in lakh) 7281.75 7213.96 7068.97 7365.43 6185.74(ii) Total earning from other sources
(? in lakh) 200.67 186.80 753.23 425.66 355.678. Total expenditure (? in lakh) 19122.88 17837.79 17379.11 23181.98 25142.74
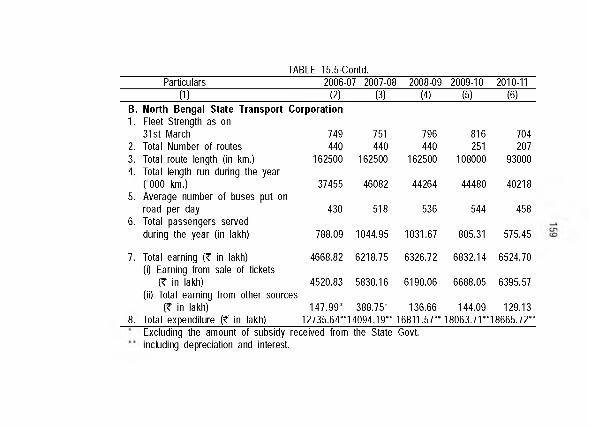
TABLE 15.5-Contd.Particulars 2006-07 2007-08 2008-09 2009-10 2010-11
(1) (2) (3) (4) (5) (6)B. North Bengal State Transport Corporation1. Fleet Strength as on
31st March 749 751 796 816 7042. Total Number of routes 440 440 440 251 2073. Total route length (in km.) 162500 162500 162500 108000 930004. Total length run during the year
( 000 km.) 37455 46082 44264 44480 402185. Average number of buses put on
road per day 430 518 536 544 4586. Total passengers served
during the year (in lakh) 788.09 1044.95 1031.67 805.31 575.45
7. Total earning ( f in lakh) 4668.82 6218.75 6326.72 6832.14 6524.70(I) Earning from sale of tickets
(? in lakh) 4520.83 5830.16 6190.06 6688.05 6395.57(II) Total earning from other sources
(? in lakh) 147.99 ’ 388.75’ 136.66 144.09 129.138. Total expenditure ( f in lakh) 12735.64"14094 .19 " 16811.57" 18063 .71"18665 .72"
Excluding the amount of subsidy received from the State Govt, including depreciation and interest.
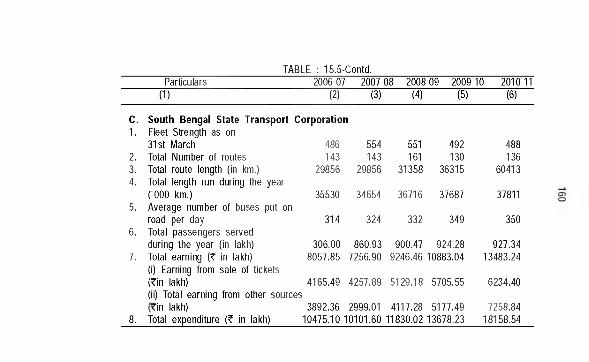
TABLE : 15.5-Contd.Particulars 2006-07 2007-08 2008-09 2009-10 2010-11
(1) (2) (3) (4) (5) (6)
c .1.
South Bengal State TransportFleet Strength as on 31st March
Corporation
486 554 551 492 4882. Total Number of routes 143 143 161 130 1363. Total route length (in km.) 29856 29856 31358 36315 604134. Total length run during the year
( 000 km.) 35530 34654 36716 37687 378115. Average number of buses put on
road per day 314 324 332 349 3506. Total passengers served
during the year (in lakh) 306.00 860.93 900.47 924.28 927.347. Total earning ( f in lakh) 8057.85 7256.90 9246.46 10883.04 13483.24
(I) Earning from sale of tickets ( t in lakh) 4165.49 4257.89 5129.18 5705.55 6234.40(ii) Total earning from other sources?in lakh) 3892.36 2999.01 4117.28 5177.49 7258.84
8. Total expenditure (? in lakh) 10475.10 10101.60 11830.02 13678.23 18158.54
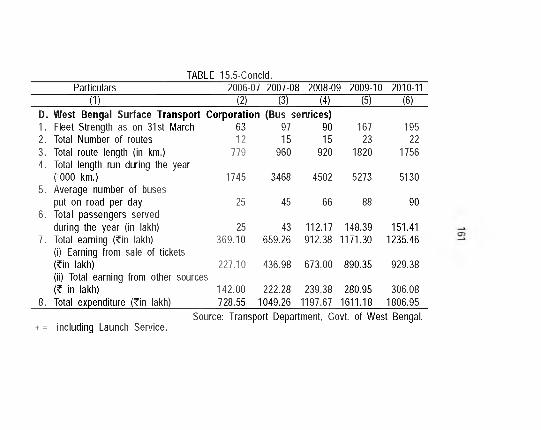
TABLE 15.5-Concld.Particulars 2006-07 2007-08 2008-09 2009-10 2010-11
(1) (2) (3) (4) (5) (6)D. West Bengal Surface Transport Corporation (Bus services)1. Fleet Strength as on 31st March 63 97 90 167 1952. Total Number of routes 12 15 15 23 223. Total route length (in km.) 779 960 920 1820 17564. Total length run during the year
( 000 km.) 1745 3468 4502 5273 51305. Average number of buses
put on road per day 25 45 66 88 906. Total passengers served
during the year (in lakh) 25 43 112.17 148.39 151.417. Total earning ( t in lakh) 369.10 659.26 912.38 1171.30 1235.46
(I) Earning from sale of tickets(?in lakh) 227.10 436.98 673.00 890.35 929.38(ii) Total earning from other sources(? in lakh) 142.00 222.28 239.38 280.95 306.08
8. Total expenditure ( t in lakh) 728.55 1049.26 1197.67 1611.18 1806.95Source: Transport Department, Govt, of West Bengal.
+ = including Launch Service.
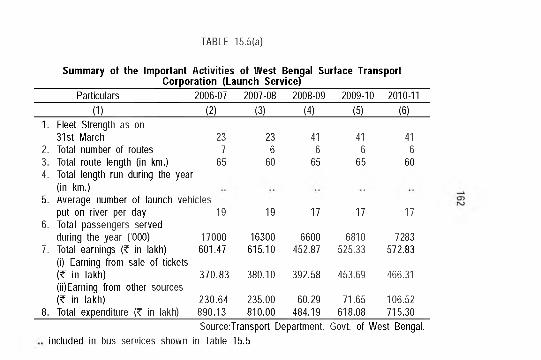
TABLE 15.5(a)
Summary of the Important Activities of West Bengal Surface Transport Corporation (Launch Service)
Particulars 2006-07 2007-08 2008-09 2009-10 2010-11(1) (2) (3) (4) (5) (6)
1. Fleet Strength as on31st March 23 23 41 41 41
2. Total number of routes 7 6 6 6 63. Total route length (in km.) 65 60 65 65 604. Total length run during the year
(in km.)5. Average number o f launch vehicles
put on river per day 19 19 17 17 176. Total passengers served
during the year ('000) 17000 16300 6600 6810 72837. Total earnings (? in lakh) 601.47 615.10 452.87 525.33 572.83
(I) Earning from sale of tickets(? in lakh) 370.83 380.10 392.58 453.69 466.31(ii)Earning from other sources(? in lakh) 230.64 235.00 60.29 71.65 106.52
8. Total expenditure (? in lakh) 890.13 810.00 484.19 618.08 715.30Source:Transport Department, Govt, of West Bengal,
included in bus services shown in Table 15.5
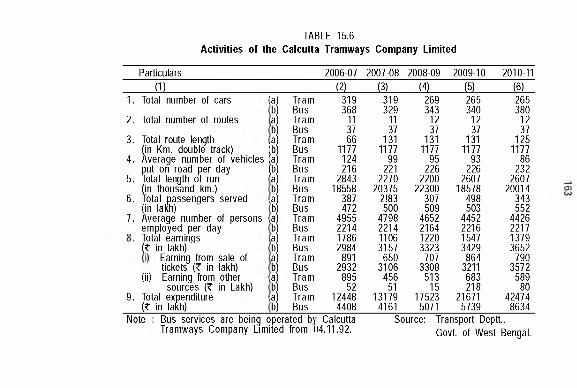
TABLE 15.6Activities of the Calcutta Tramways Company Limited
Particulars 2006-07 2007-08 2008-09 2009-10 2010-11J I L (2) (3) (4) (5) (6)
[a Tram 319 319 269 265 265b Bus 368 329 343 340 380a Tram 11 11 12 12 12b Bus 37 37 37 37 37a Tram 66 131 131 131 125b Bus 1177 1177 1177 1177 1177a Tram 124 99 95 93 86b Bus 216 221 226 226 232a Tram 2843 2270 2200 2607 2607b Bus 18558 20375 22300 18578 20014a Tram 387 2183 307 498 343b Bus 472 500 509 503 552
>a Tram 4955 4798 4652 4452 4426b Bus 2214 2214 2164 2216 2217a Tram 1786 1106 1220 1547 1379b Bus 2984 3157 3323 3429 3652a Tram 891 650 707 864 790b Bus 2932 3106 3308 3211 3572la Tram 895 456 513 683 589b Bus 52 51 15 218 80la Tram 12448 13179 17523 21671 42474b Bus 4408 4161 5071 5739 8634
1. Total number of cars
2. Total number of routes
3. Total route length(In Km. double track)
4. Average number of vehicles put on road per day
5. Total length of run (in thousand km.)
6. Total passengers served (in lakh)
7. Average number of persons employed per day
" Total earnings ;? in lakh)
Earning from sale of tickets (? in lakh)
(II) Earning from other sources (? in Lakh)
9. Total expenditure (? in lakh)
Note Bus services are being operated b) Tramways Company Limited from (
Calcutta14.11.92.
Source: Transport Deptt.,Govt, of West Bengal.
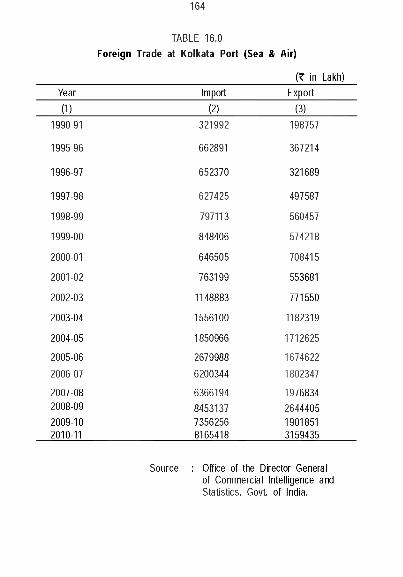
164
TABLE 16.0 Foreign Trade at Kolkata Port (Sea & Air)
(? in Lakh)Year Import Export
(1) (2) (3)1990-91 321992 198757
1995-96 662891 367214
1996-97 652370 321689
1997-98 627425 497587
1998-99 797113 560457
1999-00 848406 574218
2000-01 646505 708415
2001-02 763199 553681
2002-03 1148883 771550
2003-04 1556100 1182319
2004-05 1850966 1712625
2005-06 2679988 16746222006-07 6200344 1802347
2007-08 6366194 19768342008-09 8453137 26444052009-10 7356256 19018512010-11 8165418 3159435
Source : Office of the Director General of Commercial Intelligence and Statistics, Govt, of India.
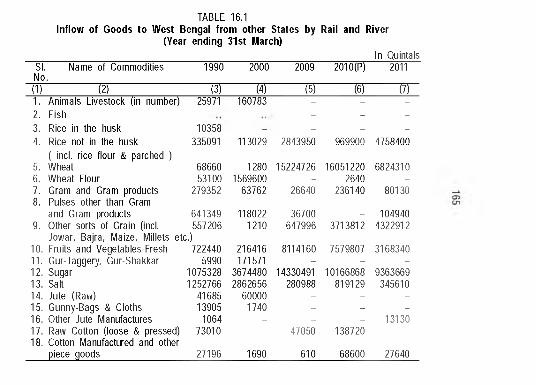
TABLE 16.1Inflow of Goods to West Bengal from other States by Rail and River
(Year ending 31st March)In Quintals
SI. Name of Commodities No.
1990 2000 2009 2010(F) 2011
(1) (2) (3) (4) (5) (6) (7)1. Animals Livestock (in number) 25971 160783 - - -
2. Fish - - -
3. Rice in the husk 10358 - - - -
4. Rice not in the husk( incl. rice flour & parched )
335091 113029 2843950 969900 4758400
5. Wheat 68660 1280 15224726 16051220 68243106. Wheat Flour 53100 1569600 - 2640 -
7. Gram and Gram products8. Pulses other than Gram
279352 63762 26640 236140 80130
and Gram products 641349 118022 36700 - 1049409. Other sorts of Grain (incl. 557206
Jowar, Bajra, Maize, Millets etc.)1210 647996 3713812 4322912
10. Fruits and Vegetables-Fresh 722440 216416 8114160 7579807 316834011. Gur-Jaggery, Gur-Shakkar 5990 171571 - - -12. Sugar 1075328 3674480 14330491 10166868 936366913. Salt 1252766 2862656 280988 819129 34561014. Jute (Raw) 41685 60000 - - -15. Gunny-Bags & Cloths 13905 1740 - - -16. Other Jute Manufactures 1064 - - - 1313017. Raw Cotton (loose & pressed)18. Cotton Manufactured and other
73010 - 47050 138720 -
piece goods 27196 1690 610 68600 27640
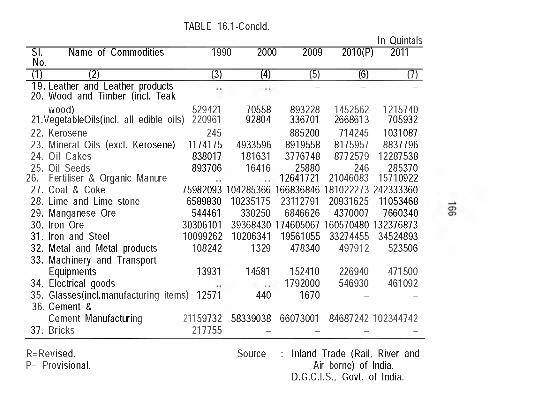
TABLE 16.1-Concld.In Quintals
SI. Name of Commodities No.
1990 2000 2009 201o(p;1 2011
(1) (2) (3) (4) (5) (6) (7)19. Leather and Leather products20. Wood and Timber (incl. Teak
- - -
wood) 529421 70558 893228 1452562 121574021.VegetableOils(incl. all edible oils) 220961 92804 336701 2668613 70593222. Kerosene 245 - 885200 714245 103108723. Mineral Oils (excl. Kerosene) 1174175 4933596 8919558 8175957 883779624. Oil Cakes 838017 181631 3776748 8772579 1228753825. Oil Seeds 893706 16416 25880 246 285370
26. Fertiliser & Organic Manure 12641721 21046083 1571092227. Coal & Coke 75982093 104285366 166836846 181022273 24233336028. Lime and Lime stone 6589830 10235175 23112791 20931625 1105346829. Manganese Ore 544461 330250 6846626 4370007 766034030. Iron Ore 30306101 39368430 174605067 160570480 13237687331. Iron and Steel 10099262 10206341 19561055 33274455 3452489332. Metal and Metal products33. Machinery and Transport
108242 1329 478340 497912 523506
Equipments 13931 14581 152410 226940 47150034. Electrical goods 1792000 546930 46109235. Glasses(incl.manufacturing items) 1257136. Cement &
440 1670 - -
Cement Manufacturing 21159732 58339038 66073001 84687242 10234474237. Bricks 217755 - - - -
R=Revised.P= Provisional.
Source : Inland Trade (Rail, River and Air borne) of India.
D.G.C.I.S., Govt, of India.
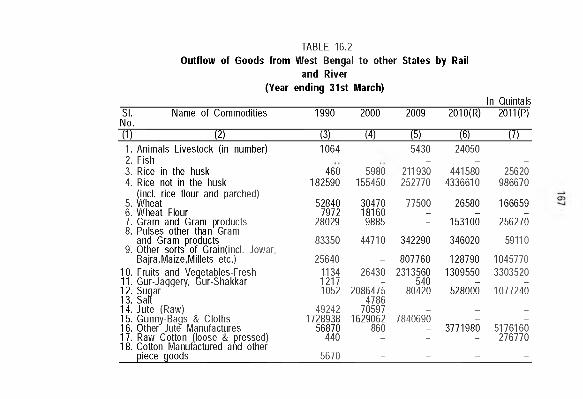
TABLE 16.2Outflow of Goods from West Bengal to other States by Rail
and River (Year ending 31st March)
In QuintalsSI. Name of Commodities No.
1990 2000 2009 2010(R) 2011(P)
(1) (2) (3) (4) (5) (6) (7)1. Animals Livestock (in number) 1064 _ 5430 24050 _
2. Fish - - -
3. Rice in the husk 460 5980 211930 441580 256204. Rice not in the husk
(incl. rice flour and parched)182590 155450 252770 4336610 986670
5. Wheat 52840 30470 77500 26580 1666596. Wheat Flour 7972 18160 - - -7. Gram and Gram products8. Pulses other than Gram
28029 9885 - 153100 256270
and Gram products 9. Other sorts of Grain(incl. Jowar,
83350 44710 342290 346020 59110
Bajra,Maize,Millets etc.) 25640 - 807760 128790 104577010. Fruits and Vegetables-Fresh 1134 26430 2313560 1309550 330352011. Gur-Jaggery, Gur-Shakkar 1217 - 540 - -12. Sugar 1052 2086475 80420 528000 107724013. Saif - 4786 - - -14. Jute (Raw) 49242 70597 _ _ _15. Gunny-Bags & Cloths 1728938 1629062 7840690 _ _16. Other Jute Manufactures 56870 860 - 3771980 517616017. Raw Cotton (loose & pressed)18. Cotton Manufactured and other
440 - - - 276770
piece goods 5670 - - - -
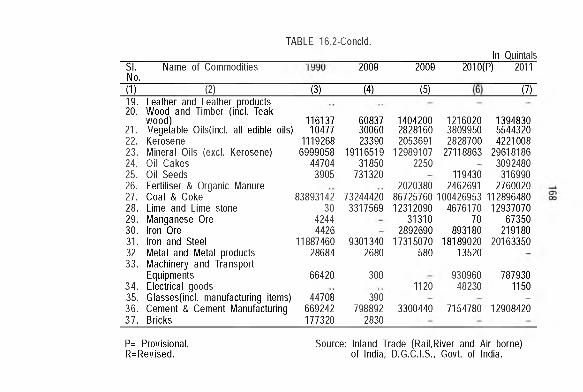
TABLE 16.2-Concld.
■ST“No.
Name of Commodities l o o r ■ T o o r ■ T o iip yIn Quintals
m r
(1) (2) (3) (4) (5) (7)19. Leather and Leather products20. Wood and Timber (incl. Teak
wood) 11613721. Vegetable Oils(incl. all edible oils) 1047722. Kerosene 111926823. Mineral Oils (excl. Kerosene) 699905824. Oil Cakes 4470425. Oil Seeds 390526. Fertiliser & Organic Manure27. Coal & Coke 8389314228. Lime and Lime stone 3029. Manganese Ore 424430. Iron Ore 442631. Iron and Steel 11887460 32 Metal and Metal products 2868433. Machinery and Transport
Equipments 6642034. Electrical goods35. Glasses(incl. manufacturing items) 4470836. Cement & Cement Manufacturing 66924237. Bricks 177320
608373006023390
1911651931850
731320
732444203317569
93013402680
300
390798892
2830
140420028281602053691
129891072250
20203808672576012312090
313102892690
17315070580
1120
121602038099502828700
27118863
1194302462691
1004269534676170
70893180
1818902013520
930960 48230
139483055443204221008
296181863092480
3169902760020
11289648012937070
67350219180
20163350
7879301150
3300440 7154780 12908420
P= Provisional. R= Revised.
Source: Inland Trade (Rail,River and Air borne) of India, D.G.C.I.S., Govt, of India.
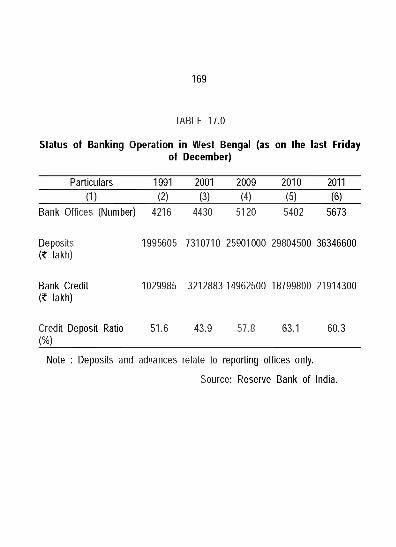
169
TABLE 17.0
Status of Banking Operation in West Bengal (as on the last Friday of December)
Particulars 1991 2001 2009 2010 2011(1) (2) (3) (4) (5) (6)
Bank Offices (Number) 4216 4430 5120 5402 5673
Deposits (? lakh)
1995605 7310710 25901000 29804500 36346600
Bank Credit (? lakh)
1029985 3212883 14962500 18799800 21914300
Credit Deposit Ratio (%)
51.6 43.9 57.8 63.1 60.3
Note : Deposits and advances relate to reporting offices only.
Source: Reserve Bank of India.
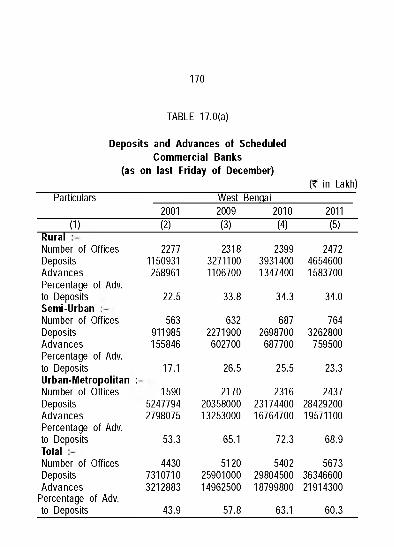
170
TABLE 17.0(a)
Deposits and Advances of Scheduled Comm ercial Banks
(as on last Friday of December)(? in Lakh)
Particulars West Benaai2001 2009 2010 2011
(1) (2) (3) (4) (5)RuralNumber of Offices 2277 2318 2399 2472Deposits 1150931 3271100 3931400 4654600Advances 258961 1106700 1347400 1583700Percentage of Adv. to Deposits 22.5 33.8 34.3 34.0Semi-UrbanNumber of Offices 563 632 687 764Deposits 911985 2271900 2698700 3262800Advances 155846 602700 687700 759500Percentage of Adv. to Deposits 17.1 26.5 25.5 23.3Urban-M etropolitan :Number of Offices 1590 2170 2316 2437Deposits 5247794 20358000 23174400 28429200Advances 2798075 13253000 16764700 19571100Percentage of Adv. to Deposits 53.3 65.1 72.3 68.9TotalNumber of Offices 4430 5120 5402 5673Deposits 7310710 25901000 29804500 36346600Advances 3212883 14962500 18799800 21914300
Percentage of Adv to Deposits 43.9 57.8 63.1 60.3
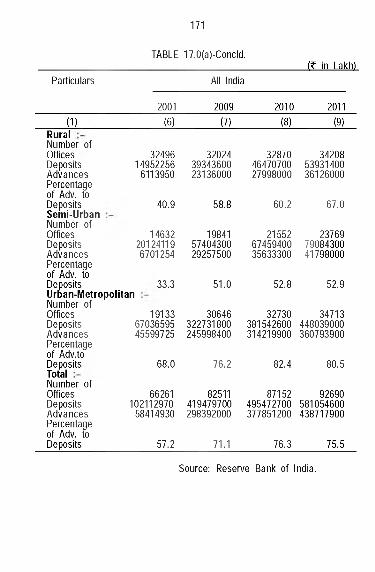
171
TABLE 17.0(a)-Concld.(e in Lakh)
Particulars All India
2001 2009 2010 2011(1) (6) (7) (8) (9)
RuralNumber of Offices 32496 32024 32870 34208Deposits 14952256 39343600 46470700 53931400Advances 6113950 23136000 27998000 36126000Percentage of Adv. to Deposits 40.9 58.8 60.2 67.0Semi-UrbanNumber of Offices 14632 19841 21552 23769Deposits 20124119 57404300 67459400 79084300Advances 6701254 29257500 35633300 41798000Percentage of Adv. to Deposits Urban-MetropoNumber of Offices
33.3 51.0 52.8 52.9litan
19133 30646 32730 34713Deposits 67036595 322731800 381542600 448039000Advances 45599725 245998400 314219900 360793900Percentage of Adv.to Deposits Total
68.0 76.2 82.4 80.5
Number of Offices 66261 82511 87152 92690Deposits 102112970 419479700 495472700 581054600Advances 58414930 298392000 377851200 438717900Percentage of Adv. to Deposits 57.2 71.1 76.3 75.5
Source: Reserve Bank of India.
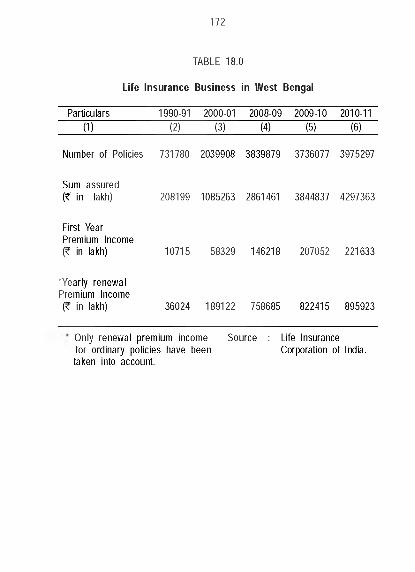
172
TABLE 18.0
Life Insurance Business in West Bengal
Particulars 1990-91 2000-01 2008-09 2009-10 2010-11(1) (2) (3) (4) (5) (6)
Number of Policies 731780 2039908 3839879 3736077 3975297
Sum assured (? in lakh) 208199 1085263 2861461 3844837 4297363
First Year Premium Income (? in lakh) 10715 58329 146218 207052 221633
•Yearly renewal Premium Income (? in lakh) 36024 189122 758685 822415 895923
Only renewal premium income Source : Life Insurance for ordinary policies have been Corporation of India,taken into account.
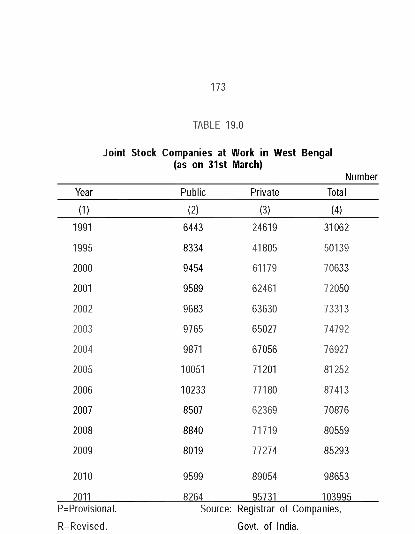
173
TABLE 19.0
Joint Stock Companies at Work in West Bengal (as on 31st March)
NumberYear Public Private Total
(1) (2) (3) (4)1991 6443 24619 31062
1995 8334 41805 50139
2000 9454 61179 70633
2001 9589 62461 72050
2002 9683 63630 73313
2003 9765 65027 74792
2004 9871 67056 76927
2005 10051 71201 81252
2006 10233 77180 87413
2007 8507 62369 70876
2008 8840 71719 80559
2009 8019 77274 85293
2010 9599 89054 98653
2011 8264 95731 103995P=Provisional.
R=Revised.
Source: Registrar of Companies,
Govt, of India.
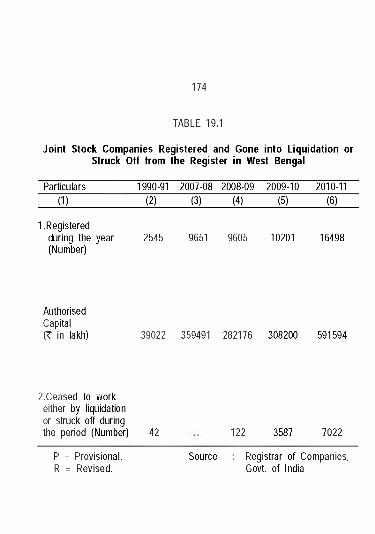
174
TABLE 19.1
Joint Stock Companies Registered and Gone into Liquidation or Struck Off from the Register in West Bengal
Particulars 1990-91 2007-08 2008-09 2009-10 2010-11(1) (2) (3) (4) (5) (6)
1. Registered during the year (Number)
2545 9651 9605 10201 16498
Authorised Capital (? in lakh) 39022 359491 282176 308200 591594
2.Ceased to work either by liquidation or struck off during the period (Number) 42 122 3587 7022
P = Provisional. R = Revised.
Source Registrar of Companies, Govt, of India
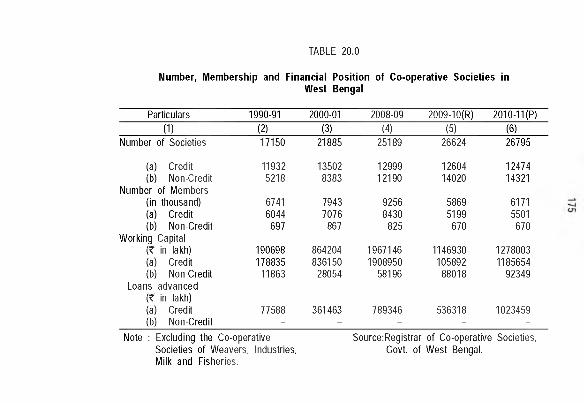
Number, Membership and Financial Position of Co-operative Societies inWest Bengal
TABLE 20.0
Particulars 1990-91 2000-01 2008-09 2009-10(R) 2010-11 (P)(1) (2) (3) (4) (5) (6)
Number of Societies 17150 21885 25189 26624 26795
(a) Credit 11932 13502 12999 12604 12474(b) Non-Credit 5218 8383 12190 14020 14321
Number of Members(in thousand) 6741 7943 9256 5869 6171(a) Credit 6044 7076 8430 5199 5501(b) Non-Credit 697 867 825 670 670
Working Capital(? in lakh) 190698 864204 1967146 1146930 1278003(a) Credit 178835 836150 1908950 105892 1185654(b) Non-Credit 11863 28054 58196 88018 92349
Loans advanced(? in lakh)(a) Credit 77588 361463 789346 536318 1023459(b) Non-Credit - - - - -
Note : Excluding the Co-operativeSocieties of Weavers, Industries, Milk and Fisheries.
Source: Registrar of Co-operative Societies, Govt, of West Bengal.
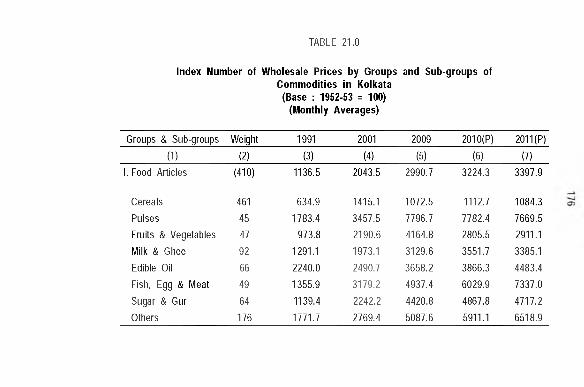
Index Number of W holesale Prices by Groups and Sub-groups of Comm odities in Kolkata
(Base : 1952-53 = 100)(Monthly Averages)
TABLE 21.0
Groups & Sub-groups Weight 1991 2001 2009 2010(P) 2011 (P)
(1) (2) (3) (4) (5) (6) (7)1. Food Articles (410) 1136.5 2043.5 2990.7 3224.3 3397.9
Cereals 461 634.9 1415.1 1072.5 1112.7 1084.3Pulses 45 1783.4 3457.5 7796.7 7782.4 7669.5Fruits & Vegetables 47 973.8 2190.6 4164.8 2805.5 2911.1Milk & Ghee 92 1291.1 1973.1 3129.6 3551.7 3385.1Edible Oil 66 2240.0 2490.7 3658.2 3866.3 4483.4Fish, Egg & Meat 49 1355.9 3179.2 4937.4 6029.9 7337.0Sugar & Gur 64 1139.4 2242.2 4420.8 4867.8 4717.2Others 176 1771.7 2769.4 5087.6 5911.1 6518.9
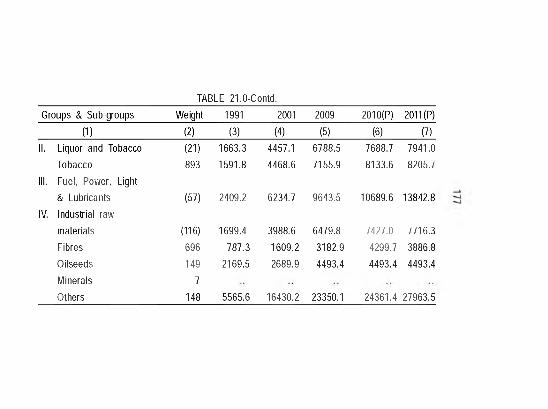
TABLE 21.0-Contd.Groups & Sub-groups Weight 1991 2001 2009 2010(P) 2011(P)
(1) (2) (3) (4) (5) (6) (7)II. Liquor and Tobacco (21) 1663.3 4457.1 6788.5 7688.7 7941.0
Tobacco 893 1591.8 4468.6 7155.9 8133.6 8205.7III. Fuel, Power, Light
& Lubricants (57) 2409.2 6234.7 9643.5 10689.6 13842.8IV. Industrial raw
materials (116) 1699.4 3988.6 6479.8 7427.0 7716.3Fibres 696 787.3 1609.2 3182.9 4299.7 3886.8Oilseeds 149 2169.5 2689.9 4493.4 4493.4 4493.4Minerals 7Others 148 5565.6 16430.2 23350.1 24361.4 27963.5
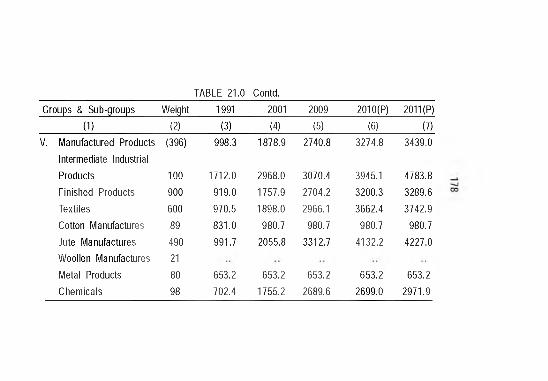
TABLE 21.0 -Contd.Groups & Sub-groups Weight 1991 2001 2009 2010(P) 2011 (P)
(1)_________________(2) (3) (4) (5) (6) (7)V. Manufactured Products (396) 998.3 1878.9 2740.8 3274.8 3439.0
Intermediate Industrial Products 100 1712.0 2968.0 3070.4 3945.1 4783.8Finished Products 900 919.0 1757.9 2704.2 3200.3 3289.6Textiles 600 970.5 1898.0 2966.1 3662.4 3742.9Cotton Manufactures 89 831.0 980.7 980.7 980.7 980.7Jute Manufactures 490 991.7 2055.8 3312.7 4132.2 4227.0Woollen Manufactures 21Metal Products 80 653.2 653.2 653.2 653.2 653.2Chemicals 98 702.4 1755.2 2689.6 2699.0 2971.9
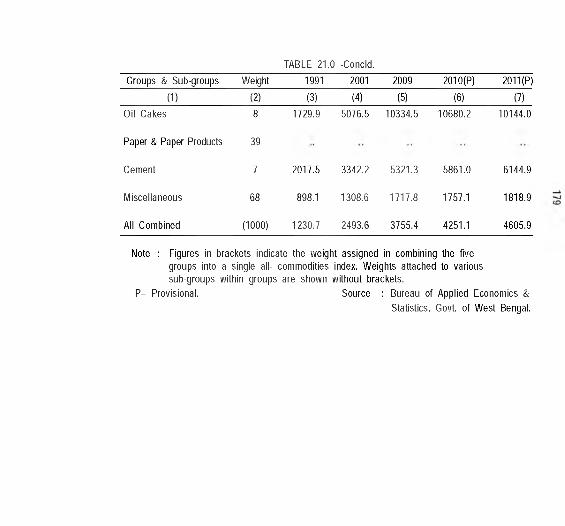
TABLE 21.0 -Concld.Groups & Sub-groups Weight 1991 2001 2009 2010(P) 2011 (P)
(1) (2) (3) (4) (5) (6) (7)Oil Cakes 8 1729.9 5076.5 10334.5 10680.2 10144.0
Paper & Paper Products 39
Cement 7 2017.5 3342.2 5321.3 5861.0 6144.9
Miscellaneous 68 898.1 1308.6 1717.8 1757.1 1818.9
All Combined (1000) 1230.7 2493.6 3755.4 4251.1 4605.9
Note : Figures in bracl<ets indicate the weight assigned in combining the five groups into a single all- commodities index. Weights attached to various sub-groups within groups are shown without brackets.
P= Provisional. Source : Bureau of Applied Economics &Statistics, Govt, of West Bengal.
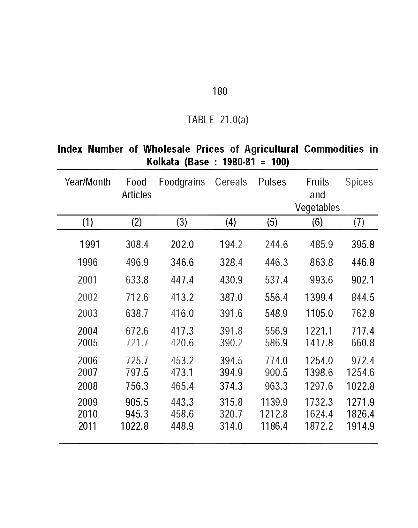
Index Number of W holesale Prices of Agricultural Commodities in Kolkata (Base : 1980-81 = 100)
180
TABLE 21.0(a)
Year/Month FoodArticles
Foodgrains Cereals Pulses Fruitsand
Vegetables
Spices
(1) (2) (3) (4) (5) (6) (7)
1991 308.4 202.0 194.2 244.6 485.9 395.8
1996 496.9 346.6 328.4 446.3 863.8 446.8
2001 633.8 447.4 430.9 537.4 993.6 902.1
2002 712.6 413.2 387.0 556.4 1399.4 844.52003 638.7 416.0 391.6 548.9 1105.0 762.8
2004 672.6 417.3 391.8 556.9 1221.1 717.42005 721.7 420.6 390.2 586.9 1417.8 660.8
2006 725.7 453.2 394.5 774.0 1254.0 972.42007 797.5 473.1 394.9 900.5 1398.6 1254.62008 756.3 465.4 374.3 963.3 1297.6 1022.82009 905.5 443.3 315.8 1139.9 1732.3 1271.92010 945.3 458.6 320.7 1212.8 1624.4 1826.42011 1022.8 448.9 314.0 1186.4 1872.2 1914.9
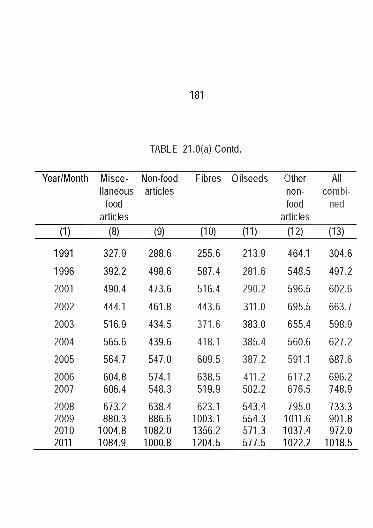
181
TABLE 21.0(a)-Contd.
Year/Month M iscellaneous
foodarticles
Non-foodarticles
Fibres Oilseeds Othernonfood
articles
Allcombi
ned
(1) (8) (9) (10) (11) (12) (13)
1991 327.9 288.6 255.6 213.9 464.1 304.6
1996 392.2 498.6 587.4 281.6 548.5 497.2
2001 490.4 473.6 516.4 290.2 596.5 602.6
2002 444.1 461.8 443.6 311.0 695.5 663.7
2003 516.9 434.5 371.6 383.0 655.4 598.9
2004 565.6 439.6 418.1 385.4 560.6 627.2
2005 564.7 547.0 609.5 387.2 591.1 687.6
2006 604.8 574.1 638.5 411.2 617.2 696.22007 606.4 548.3 519.9 502.2 676.5 748.9
2008 673.2 638.4 623.1 543.4 795.0 733.32009 880.3 886.6 1003.1 554.3 1011.6 901.82010 1004.8 1082.0 1356.2 571.3 1037.4 972.02011 1084.9 1000.8 1204.5 577.5 1022.2 1018.5
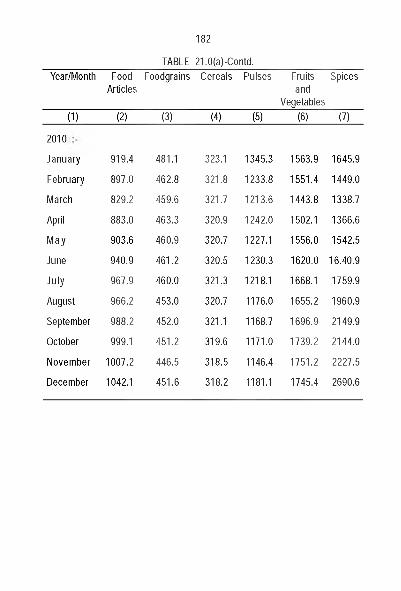
182
TABLE 21.0(a)-Contd.Year/Month Food
ArticlesFoodgrains Cereals Pulses Fruits
andVegetables
Spices
(1) (2) (3) (4) (5) (6) (7)
2010
January 919.4 481.1 323.1 1345.3 1563.9 1645.9
February 897.0 462.8 321.8 1233.8 1551.4 1449.0
March 829.2 459.6 321.7 1213.6 1443.8 1338.7
April 883.0 463.3 320.9 1242.0 1502.1 1366.6
M ay 903.6 460.9 320.7 1227.1 1556.0 1542.5
June 940.9 461.2 320.5 1230.3 1620.0 16.40.9
July 967.9 460.0 321.3 1218.1 1668.1 1759.9
August 966.2 453.0 320.7 1176.0 1655.2 1960.9
September 988.2 452.0 321.1 1168.7 1696.9 2149.9
October 999.1 451.2 319.6 1171.0 1739.2 2144.0
November 1007.2 446.5 318.5 1146.4 1751.2 2227.5
December 1042.1 451.6 318.2 1181.1 1745.4 2690.6
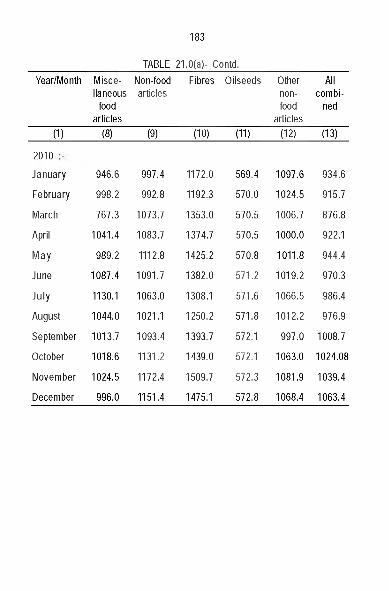
183
TABLE 21.0(a)- Contd.Year/Month M isce
llaneousfood
articles
Non-foodarticles
Fibres Oilseeds Othernonfood
articles
Allcombi
ned
(1) (8) (9) (10) (11) (12) (13)
2010
January 946.6 997.4 1172.0 569.4 1097.6 934.6
February 998.2 992.8 1192.3 570.0 1024.5 915.7
March 767.3 1073.7 1353.0 570.5 1006.7 876.8
April 1041.4 1083.7 1374.7 570.5 1000.0 922.1
May 989.2 1112.8 1425.2 570.8 1011.8 944.4
June 1087.4 1091.7 1382.0 571.2 1019.2 970.3
Ju ly 1130.1 1063.0 1308.1 571.6 1066.5 986.4
August 1044.0 1021.1 1250.2 571.8 1012.2 976.9
September 1013.7 1093.4 1393.7 572.1 997.0 1008.7
October 1018.6 1131.2 1439.0 572.1 1063.0 1024.08
November 1024.5 1172.4 1509.7 572.3 1081.9 1039.4
December 996.0 1151.4 1475.1 572.8 1068.4 1063.4
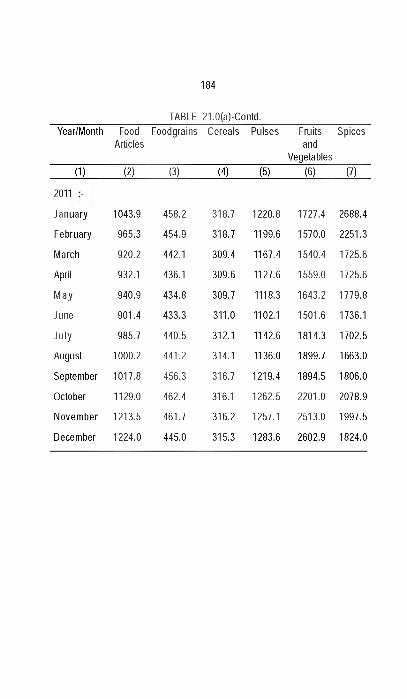
184
TABLE 21.0(a)-Contd.Year/Month Food Foodgrains Cereals Pulses Fruits Spices
Articles andVegetables
(1) (2) (3) (4) (5) (6) (7)
2011
January 1043.9 458.2 318.7 1220.8 1727.4 2688.4
February 965.3 454.9 318.7 1199.6 1570.0 2251.3
March 920.2 442.1 309.4 1167.4 1540.4 1725.6
April 932.1 436.1 309.6 1127.6 1559.0 1725.6
M ay 940.9 434.8 309.7 1118.3 1643.2 1779.8
June 901.4 433.3 311.0 1102.1 1501.6 1736.1
Ju ly 985.7 440.5 312.1 1142.6 1814.3 1702.5
August 1000.2 441.2 314.1 1136.0 1899.7 1663.0
September 1017.8 456.3 316.7 1219.4 1894.5 1806.0
October 1129.0 462.4 316.1 1262.5 2201.0 2078.9
Novem ber 1213.5 461.7 316.2 1257.1 2513.0 1997.5
December 1224.0 445.0 315.3 1283.6 2602.9 1824.0
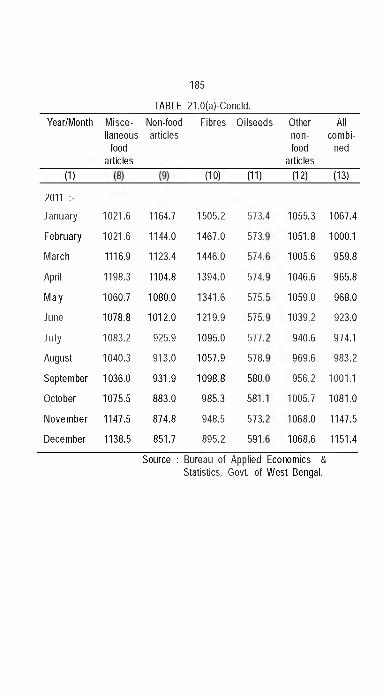
185
TABLE 21.0(a)-Concld.Year/Month Misce- Non-food
llaneous articles food
articles
Fibres Oilseeds Other Allnon- combi-food ned
articles(1) (10) (11) (12) (13)
2011 : -
January
February
March
April
May
June
July
August
September
October
November
December
1021.6
1021.6
1116.9
1198.3
1060.7
1078.8
1083.2
1040.3
1036.0
1075.5
1147.5
1138.5
1164.7
1144.0
1123.4
1104.8
1080.0
1012.0
925.9
913.0
931.9
883.0
874.8
851.7
1505.2
1467.0
1446.0
1394.0
1341.6
1219.9
1095.0
1057.9
1098.8
985.3
948.5
895.2
573,
573,
574,
574,
575,
575,
577,
578,
580,
581.
573,
591
1055.3
1051.8
1005.6
1046.6
1059.0
1039.2
940.6
969.6
956.2
1005.7
1068.0
1068.6
1067.4
1000.1
959.8
965.8
968.0
923.0
974.1
983.2
1001.1
1081.0
1147.5
1151.4
Source : Bureau of Applied Statistics, Govt, of
Economics & West Bengal.
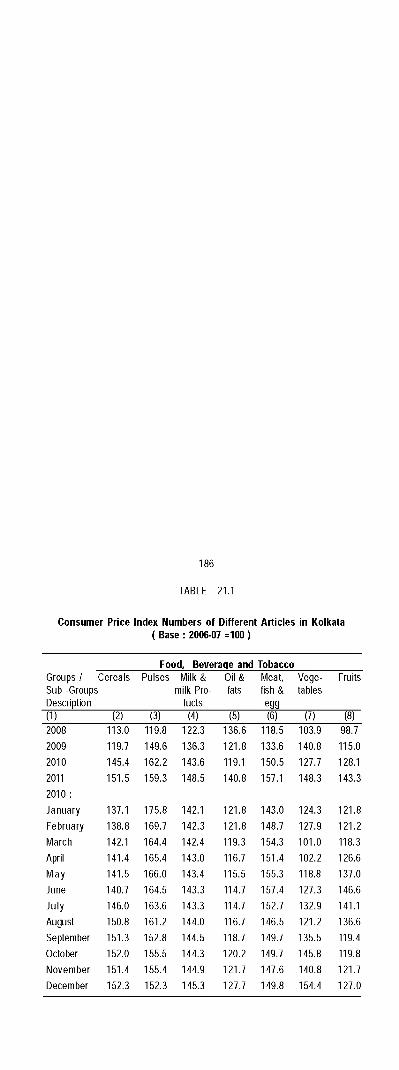
186
TABLE 21.1
Consumer Price Index Numbers of Different Articles in Kolkata ( Base : 2006-07 =100 )
Food, Beverage and TobaccoGroups / Cereals Sub -Groups Description
Pulses M ilk s milk Pro-
fucts
O ilsfats
Meat, fish &egg
Vegetables
Fruits
(1) (2) (3) (4) (5) (6) (7) (8)2008 113.0 119.8 122.3 136.6 118.5 103.9 98.72009 119.7 149.6 136.3 121.8 133.6 140.8 115.02010 145.4 162.2 143.6 119.1 150.5 127.7 128.12011 2010 :
151.5 159.3 148.5 140.8 157.1 148.3 143.3
January 137.1 175.8 142.1 121.8 143.0 124.3 121.8February 138.8 169.7 142.3 121.8 148.7 127.9 121.2IVIarch 142.1 164.4 142.4 119.3 154.3 101.0 118.3April 141.4 165.4 143.0 116.7 151.4 102.2 126.6May 141.5 166.0 143.4 115.5 155.3 118.8 137.0June 140.7 164.5 143.3 114.7 157.4 127.3 146.6Ju ly 146.0 163.6 143.3 114.7 152.7 132.9 141.1August 150.8 161.2 144.0 116.7 146.5 121.2 136.6September 151.3 152.8 144.5 118.7 149.7 135.5 119.4October 152.0 155.5 144.3 120.2 149.7 145.8 119.8November 151.4 155.4 144.9 121.7 147.6 140.8 121.7December 152.3 152.3 145.3 127.7 149.8 154.4 127.0
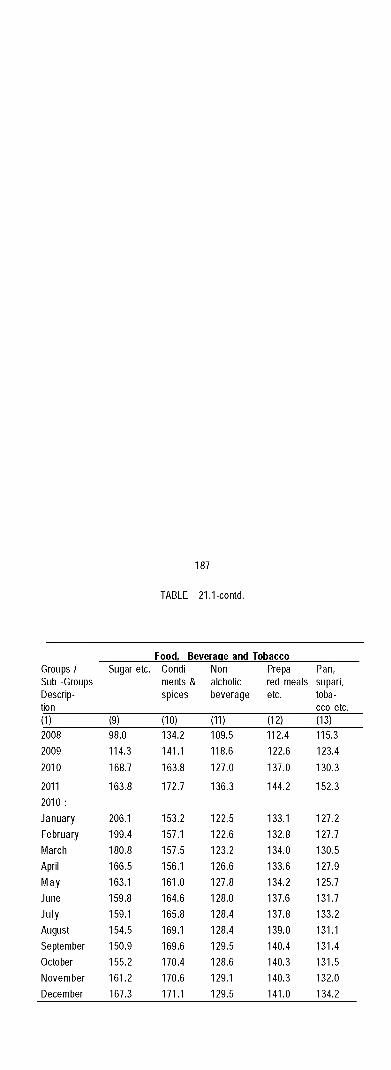
187
TABLE 21.1-contd.
Food, Beverage and TobaccoGroups /Sub -Groups Description
Sugar etc. Condiments & spices
Non-alcholicbeverage
Prepared meals etc.
Pan, supari, tobacco etc.
(1) (9) (10) (11) (12) (13)2008 98.0 134.2 109.5 112.4 115.32009 114.3 141.1 118.6 122.6 123.42010 168.7 163.8 127.0 137.0 130.3
2011 163.8 172.7 136.3 144.2 152.32010 :January 206.1 153.2 122.5 133.1 127.2February 199.4 157.1 122.6 132.8 127.7IVIarch 180.8 157.5 123.2 134.0 130.5April 166.5 156.1 126.6 133.6 127.9IVlay 163.1 161.0 127.8 134.2 125.7June 159.8 164.6 128.0 137.6 131.7Ju ly 159.1 165.8 128.4 137.8 133.2August 154.5 169.1 128.4 139.0 131.1September 150.9 169.6 129.5 140.4 131.4October 155.2 170.4 128.6 140.3 131.5November 161.2 170.6 129.1 140.3 132.0December 167.3 171.1 129.5 141.0 134.2
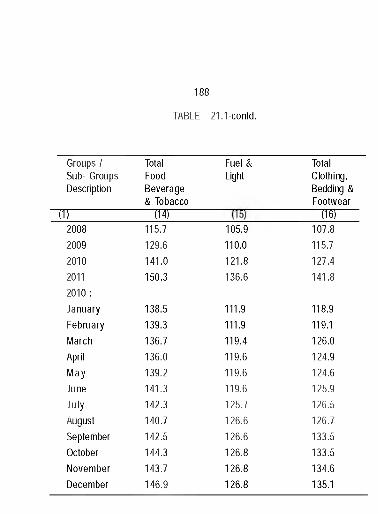
188
TABLE 21.1-contd.
Groups I Sub- Groups Description
"nr
Total Food Beverage & Tobacco
(14)115.7129.6141.0150.3
138.5139.3136.7136.0139.2141.3142.3140.7142.5144.3143.7146.9
Fuel & Light
105.9 110.0 121.8136.6
111.9111.9 119.4119.6119.6119.6125.7 126.6 126.6126.8 126.8 126.8
Total Clothing, Bedding & Footwear
(ia)107.8115.7127.4141.8
118.9119.1126.0124.9124.6125.9126.5126.7133.5133.5134.6135.1
200820092010 2011 2010 : January February March April M ay June Ju ly August September October November December
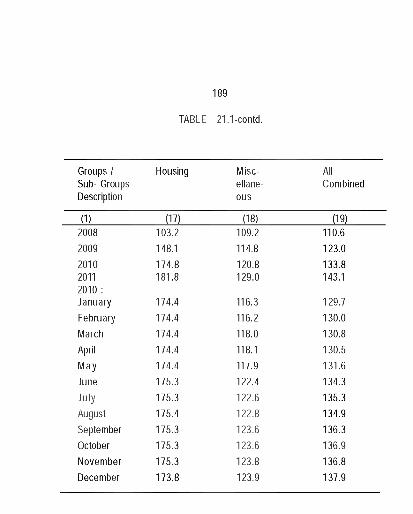
189
TABLE 21.1-contd.
Groups / Housing M isc AllSub- Groups ellane CombinedDescription ous
(1) (17) (18) (19)2008 103.2 109.2 110.62009 148.1 114.8 123.02010 174.8 120.8 133.82011 181.8 129.0 143.12010 :January 174.4 116.3 129.7February 174.4 116.2 130.0IVIarch 174.4 118.0 130.8April 174.4 118.1 130.5IVlay 174.4 117.9 131.6June 175.3 122.4 134.3July 175.3 122.6 135.3August 175.4 122.8 134.9September 175.3 123.6 136.3October 175.3 123.6 136.9November 175.3 123.8 136.8December 173.8 123.9 137.9
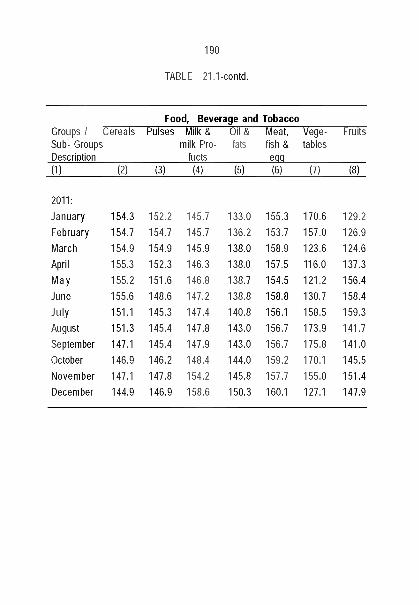
190
TABLE 21.1-contd.
Groups / Sub- Groups DescriDtion
Food, Beverage and TobaccoCereals Pulses Milk &
milk Pro- fucts
Oil & fats
Meat, fish & eqq
Vegetables
Fruits
(1) (2) (3) (4) (5) (6) (7) (8)
2011:January 154.3 152.2 145.7 133.0 155.3 170.6 129.2February 154.7 154.7 145.7 136.2 153.7 157.0 126.9March 154.9 154.9 145.9 138.0 158.9 123.6 124.6April 155.3 152.3 146.3 138.0 157.5 116.0 137.3May 155.2 151.6 146.8 138.7 154.5 121.2 156.4June 155.6 148.6 147.2 138.8 158.8 130.7 158.4July 151.1 145.3 147.4 140.8 156.1 158.5 159.3August 151.3 145.4 147.8 143.0 156.7 173.9 141.7September 147.1 145.4 147.9 143.0 156.7 175.8 141.0October 146.9 146.2 148.4 144.0 159.2 170.1 145.5November 147.1 147.8 154.2 145.8 157.7 155.0 151.4December 144.9 146.9 158.6 150.3 160.1 127.1 147.9
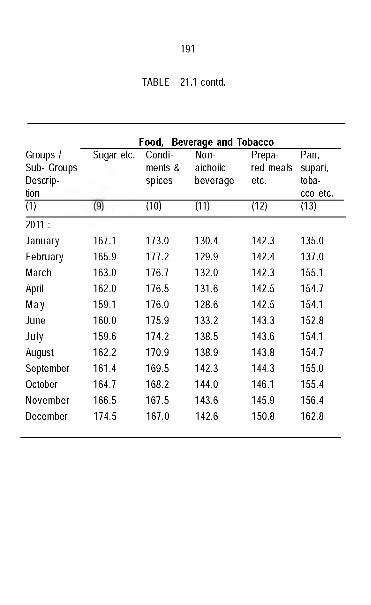
191
TABLE 21.1-contd.
Groups / Sub- Groups Description
Food, Beverage and TobaccoSugar etc. Condi
ments & spices
Non- aichoiic beverage
Prepa- Pan, red meals supari, etc. toba
cco etc.(1) (10) (11) (12) (13)
2011 :January 167.1 173.0 130.4 142.3 135.0February 165.9 177.2 129.9 142.4 137.0iViarch 163.0 176.7 132.0 142.3 155.1April 162.0 176.5 131.6 142.5 154.7May 159.1 176.0 128.6 142.5 154.1June 160.0 175.9 133.2 143.3 152.8July 159.6 174.2 138.5 143.6 154.1August 162.2 170.9 138.9 143.8 154.7September 161.4 169.5 142.3 144.3 155.0October 164.7 168.2 144.0 146.1 155.4November 166.5 167.5 143.6 145.9 156.4December 174.5 167.0 142.6 150.8 162.8
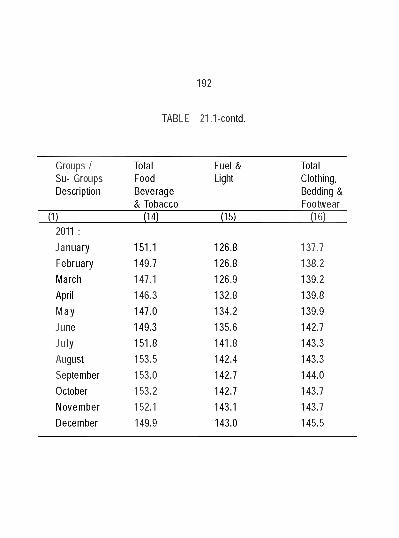
192
TABLE 21.1-contd.
Groups / Su- Groups Description
Total Food Beverage & Tobacco
Fuel & Light
Total Clothing, Bedding & Footwear
(1) (14) (15) (16)2011 :January 151.1 126.8 137.7February 149.7 126.8 138.2March 147.1 126.9 139.2April 146.3 132.8 139.8M ay 147.0 134.2 139.9June 149.3 135.6 142.7Ju ly 151.8 141.8 143.3August 153.5 142.4 143.3September 153.0 142.7 144.0October 153.2 142.7 143.7November 152.1 143.1 143.7December 149.9 143.0 145.5
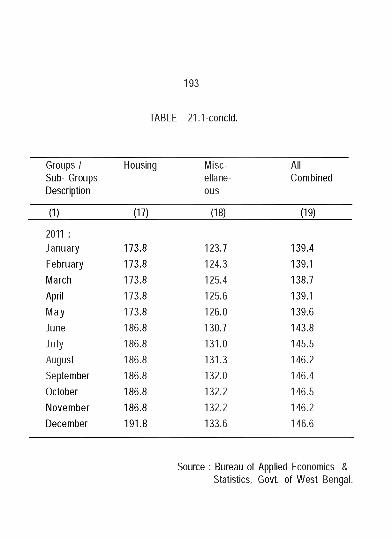
193
TABLE 21.1-concld.
Groups / Housing M isc AllSub- Groups ellane CombinedDescription ous
(1) (17) (18) (19)
2011 :January 173.8 123.7 139.4February 173.8 124.3 139.1March 173.8 125.4 138.7April 173.8 125.6 139.1M ay 173.8 126.0 139.6June 186.8 130.7 143.8July 186.8 131.0 145.5August 186.8 131.3 146.2September 186.8 132.0 146.4October 186.8 132.2 146.5November 186.8 132.2 146.2December 191.8 133.6 146.6
Source : Bureau of Applied Economics & Statistics, Govt, of West Bengal.
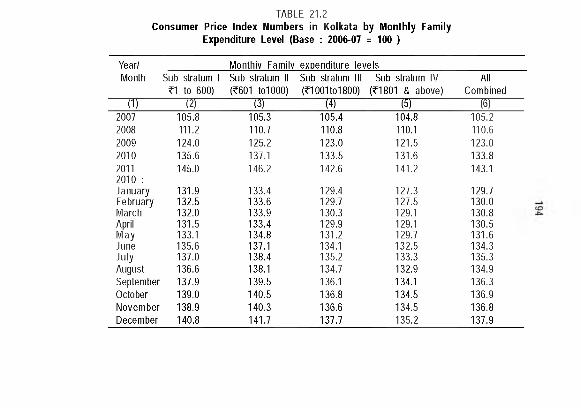
TABLE 21.2Consumer Price Index Numbers in Kolkata by Monthly Family
Expenditure Level (Base : 2006-07 = 100 )
Year/ Monthiv Familv exDenditure levelsMonth Sub stratum 1
?1 to 600)Sub stratum II (?601 tolOOO)
Sub stratum III (?1001to1800)
Sub stratum IV (?1801 & above)
AllCombined
(1) (2) (3) (4) (5) (6)2007 105.8 105.3 105.4 104.8 105.22008 111.2 110.7 110.8 110.1 110.62009 124.0 125.2 123.0 121.5 123.02010 135.6 137.1 133.5 131.6 133.82011 2010 :
145.0 146.2 142.6 141.2 143.1
January 131.9 133.4 129.4 127.3 129.7February 132.5 133.6 129.7 127.5 130.0March 132.0 133.9 130.3 129.1 130.8April 131.5 133.4 129.9 129.1 130.5M ay 133.1 134.8 131.2 129.7 131.6June 135.6 137.1 134.1 132.5 134.3July 137.0 138.4 135.2 133.3 135.3August 136.6 138.1 134.7 132.9 134.9September 137.9 139.5 136.1 134.1 136.3October 139.0 140.5 136.8 134.5 136.9November 138.9 140.3 136.6 134.5 136.8December 140.8 141.7 137.7 135.2 137.9
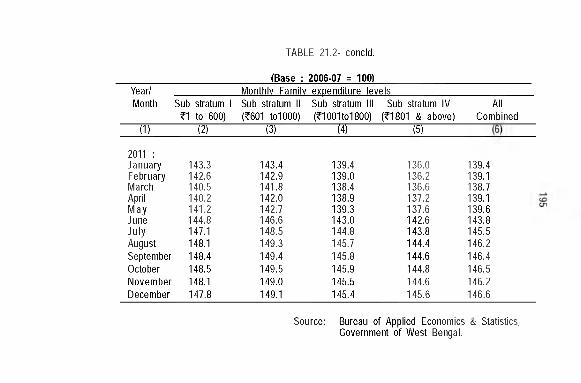
TABLE 21.2- concld.
(Base : 2006-07 = 100)Year/Month
Monthly Family expenditure levels
liTSub stratum I
?1 to 600) (2)
Sub stratum II (?601 tolOOO)
----------(3)-----------
Sub stratum III (?1001to1800)
---------- (4)-----------
Sub stratum IV (?1801 & above)
[5)
AllCombined
2011 :JanuaryFebruaryMarchAprilMayJuneJulyAugustSeptemberOctoberNovemberDecember
143.3 142.6 140.5140.2141.2144.8147.1148.1148.4148.5148.1147.8
143.4 142.9 141.8142.0 142.7 146.6148.5149.3149.4149.5149.0149.1
139.4139.0138.4 138.9139.3143.0 144.8145.7145.8145.9145.5145.4
136.0136.2136.6137.2137.6142.6143.8 144.4144.6144.8144.6145.6
139.4139.1138.7139.1 139.6143.8145.5146.2146.4146.5146.2146.6
Source: Bureau of Applied Economics & Statistics, Government of West Bengal.
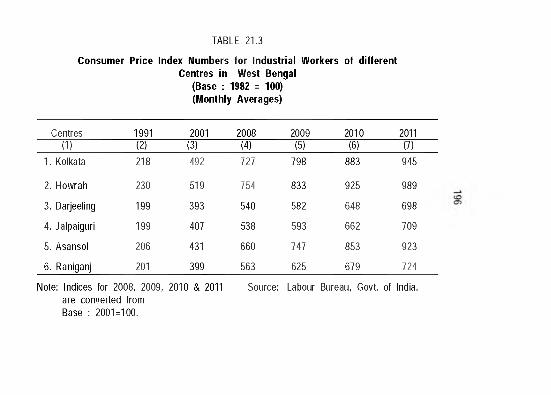
Consumer Price Index Numbers for Industrial Workers of different
TABLE 21.3
Centres in West Bengal (Base : 1982 = 100) (Monthly Averages)
Centres 1991 2001 2008 2009 2010 2011(1) (2) (3) (4) (5) (6) (7)
1. Kolkata 218 492 727 798 883 945
2. Howrah 230 519 754 833 925 989
3. Darjeeling 199 393 540 582 648 698
4. Jalpaiguri 199 407 538 593 662 709
5. Asansol 206 431 660 747 853 923
6. Raniganj 201 399 563 625 679 724
Note: Indices for 2008, 2009, 2010 & 2011 are converted from Base : 2001=100.
Source: Labour Bureau, Govt, of India.
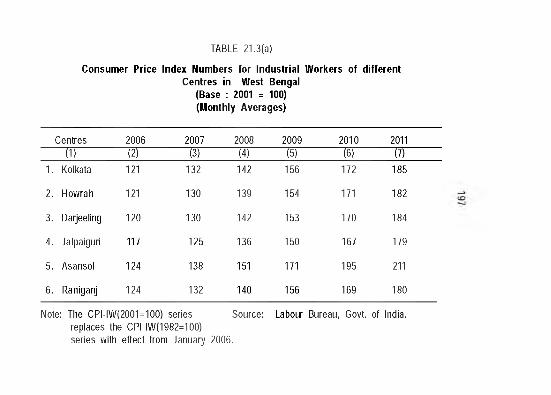
Consumer Price Index Numbers for Industrial Workers of different Centres in West Bengal
(Base : 2001 = 100)(Monthly Averages)
TABLE 21.3(a)
Centres 2006 2007 2008 2009 2010 2011~ r n (2) [3) (4) (5) (6) (T T
1. Kolkata 121 132 142 156 172 185
2. Howrah 121 130 139 154 171 182
3. Darjeeling 120 130 142 153 170 184
4. Jalpaiguri 117 125 136 150 167 179
5. Asansol 124 138 151 171 195 211
6. Raniganj 124 132 140 156 169 180
Note: The CPI-IW(2001=100) series Source: Labour Bureau, Govt, of India,replaces the CPI-IW(1982=100) series with effect from January 2006.
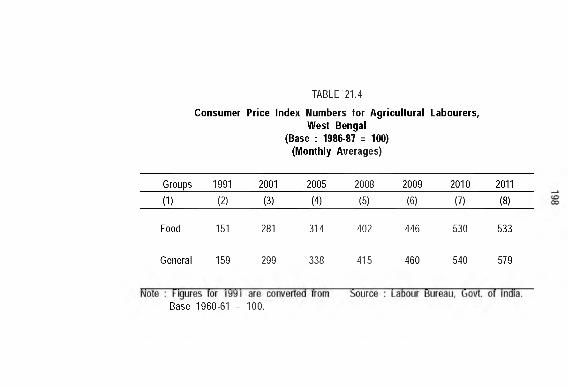
Consumer Price Index Numbers for A gricultural Labourers, West Bengal
(Base : 1986-87 = 100)(Monthly Averages)
TABLE 21.4
Groups 1991 2001 2005 2008 2009 2010 2011
(1) (2) (3) (4) (5) (6) (7) (8)
Food 151 281 314 402 446 530 533
General 159 299 338 415 460 540 579
Base 1960-61 = 100.
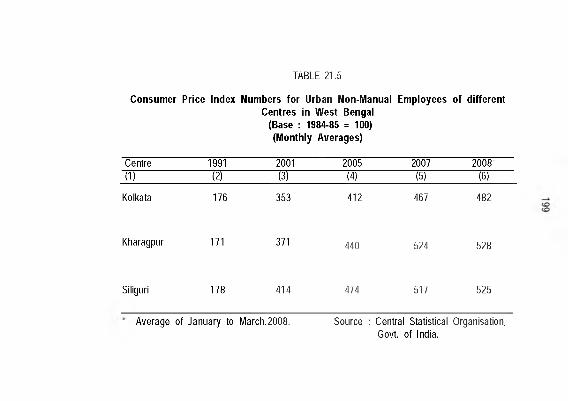
Consumer Price Index Numbers for Urban Non-Manual Employees of different Centres in West Bengal
(Base : 1984-85 = 100)(Monthly Averages)
TABLE 21.5
Centre 1991 2001 2005 2007 2008’(1) (2) (3) (4) (5) (6)
Kolkata 176 353 412 467 482
Kharagpur 171 371 440 524 528
Siliguri 178 414 474 517 525
Average of January to March.2008. Source : Central Statistical Organisation, Govt, of India.
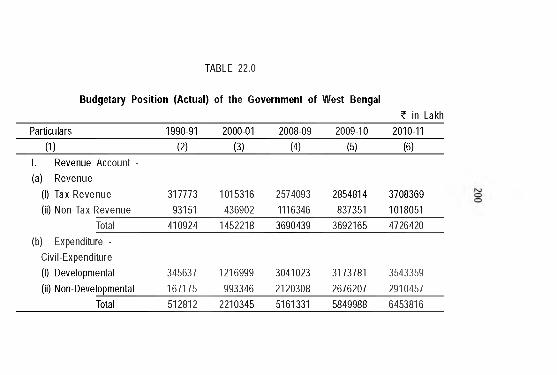
TABLE 22.0
Budgetary Position (Actual) of the Government of West Bengal? in Lakh
Particulars 1990-91 2000-01 2008-09 2009-10 2010-11
(1) (2) (3) (4) (5) (6)1. Revenue Account - (a) Revenue
(1) Tax Revenue 317773 1015316 2574093 2854814 3708369(ii) Non-Tax Revenue 93151 436902 1116346 837351 1018051
Total 410924 1452218 3690439 3692165 4726420(b) Expenditure -
Civil-Expenditure (1) Developmental 345637 1216999 3041023 3173781 3543359(ii) Non-Developmental 167175 993346 2120308 2676207 2910457
Total 512812 2210345 5161331 5849988 6453816
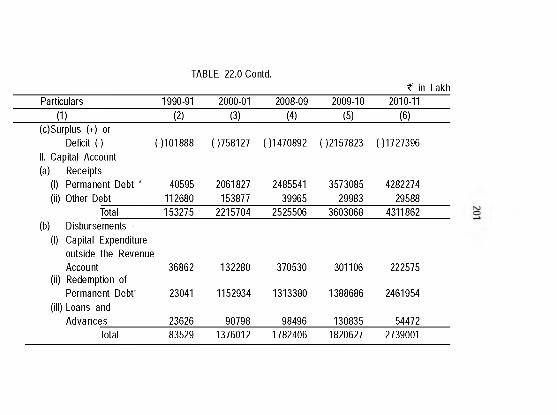
TABLE 22.0-Contd.? in Lakh
Particulars 1990-91 2000-01 2008-09 2009-10 2010-11(1) (2) (3) (4) (5) (6)
(c)Surplus (+) or Deficit (-) (-)101888 (-)758127 (-)l 470892 (-)2157823 (-)1727396
II. Capital Account - (a) Receipts
(1) Permanent Debt ’ 40595 2061827 2485541 3573085 4282274(ii) Other Debt 112680 153877 39965 29983 29588
Total 153275 2215704 2525506 3603068 4311862(b) Disbursements -
(1) Capital Expenditure outside the RevenueAccount
(ii) Redemption of Permanent Debt*
36862
23041
132280
1152934
370530
1313380
301106
1388686
222575
2461954(ill) Loans and
Advances 23626 90798 98496 130835 54472Total 83529 1376012 1782406 1820627 2739001
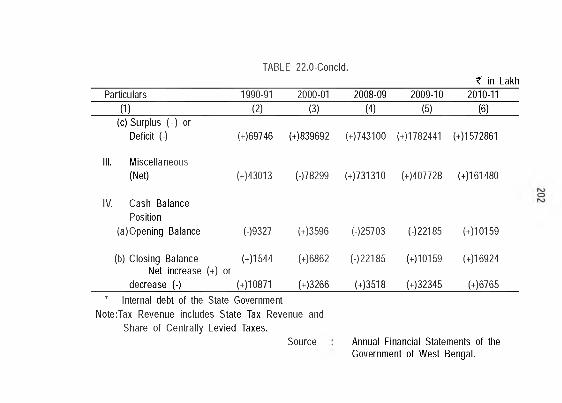
TABLE 22.0-Concld.? in Lakh
Particulars 1990-91 2000-01 2008-09 2009-10 2010-11(1) (2) (3) (4> (5> (6>
(c) Surplus (+) orDeficit (-) (+)69746 (+>839692 (+>743100 (+>1782441 (+>1572861
III. Miscellaneous(Net) (+)43013 (->78299 (+>731310 (+>407728 (+>161480
IV. Cash Balance Position
(a)Opening Balance 09327 (+>3596 (->25703 (->22185 (+>10159
(b) Closing Balance (+)1544 Net increase (+) or
(+>6862 (->22185 (+>10159 (+>16924
decrease (-) (+)10871 (+>3266 (+>3518 (+>32345 (+>6765• Internal debt of the State Government
Note:Tax Revenue includes State Tax Revenue and Share of Centrally Levied Taxes.
Source Annual Financial Statements of the Government of West Bengal.
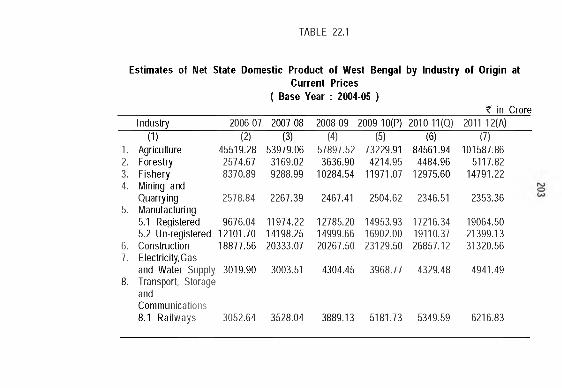
TABLE 22.1
Estimates of Net State Domestic Product of West Bengal by Industry of Origin atCurrent Prices
( Base Year : 2004-05 )? in Crore
Industry 2006-07 2007-08 2008-09 2009-10(P) 2010-11 (Q) 2011-12(A)(1) (2) (3) (4) (5) (6) (7)
1. Agriculture 45519.28 53979.06 57897.52 73229.91 84561.94 101587.862. Forestry 2574.67 3169.02 3636.90 4214.95 4484.96 5117.823. Fishery 8370.89 9288.99 10284.54 11971.07 12975.60 14791.224. Mining and
Quarrying 2578.84 2267.39 2467.41 2504.62 2346.51 2353.365. Manufacturing
5.1 Registered 9676.04 11974.22 12785.20 14953.93 17216.34 19064.505.2 Un-registered 12101.70 14198.25 14999.66 16902.00 19110.37 21399.13
6. Construction 18877.56 20333.07 20267.50 23129.50 26857.12 31320.567. Electricity,Gas
and Water Supply 3019.90 3003.51 4304.45 3968.77 4329.48 4941.498. Transport, Storage
andCommunications8.1 Railways 3052.64 3528.04 3889.13 5181.73 5349.59 6216.83
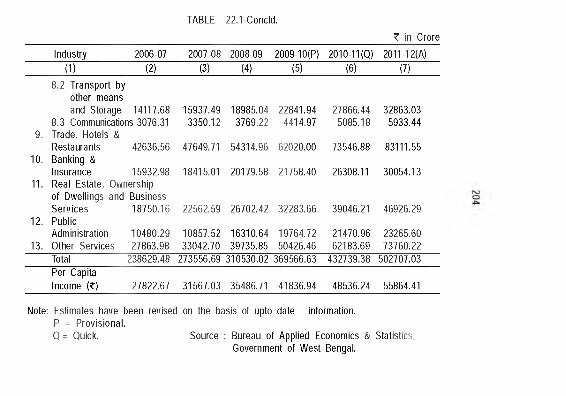
TABLE 22.1-Concld.? in Crore
Industry 2006-07 2007-08 2008-09 2009-10(P) 2010-11(0) 2011-12(A)(1) (2) (3) (4) (5) (6) (7)
8.2 Transport byother meansand Storage 14117.68 15937.49 18985.04 22841.94 27866.44 32863.03
8.3 Communications 3076.31 3350.12 3769.22 4414.97 5085.18 5933.449. Trade, Hotels &
Restaurants 42636.56 47649.71 54314.96 62020.00 73546.88 83111.5510. Banking &
Insurance 15932.98 18415.01 20179.58 21758.40 26308.11 30054.1311. Real Estate, Ownership
of Dwellings and BusinessServices 18750.16 22562.59 26702.42 32283.66 39046.21 46926.29
12. PublicAdministration 10480.29 10857.52 16310.64 19764.72 21470.96 23265.60
13. Other Services 27863.98 33042.70 39735.85 50426.46 62183.69 73760.22Total 238629.48 273556.69 310530.02 369566.63 432739.38 502707.03Per CapitaIncome (?) 27822.67 31567.03 35486.71 41836.94 48536.24 55864.41
Note: Estimates have been revised on the basis of upto date information.P = Provisional.Q = Quici<. Source : Bureau of Applied Economics & Statistics,
Government of West Bengal.
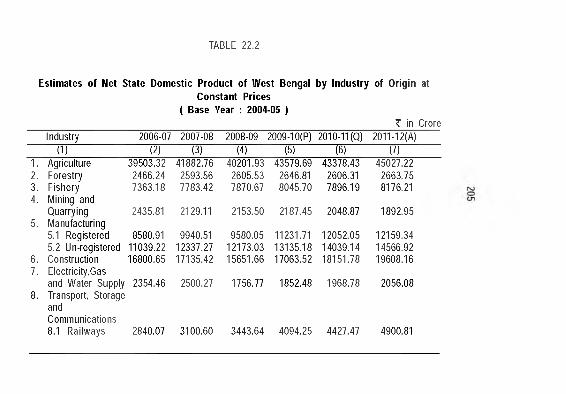
TABLE 111
Estimates of Net State Domestic Product of West Bengal by Industry of Origin atConstant Prices
( Base Year : 2004-05 )t in Crore
Industry 2006-07 2007-08 2008-09 2009-10(P) 2010-11(Q) 2011-12(A)(1) (2) (3) (4) (5) (6) (7)
1. Agriculture 39503.32 41882.76 40201.93 43579.69 43378.43 45027.222. Forestry 2466.24 2593.56 2605.53 2646.81 2606.31 2663.753. Fishery 7363.18 7783.42 7870.67 8045.70 7896.19 8176.214. Mining and
Quarrying 2435.81 2129.11 2153.50 2187.45 2048.87 1892.955. Manufacturing
5.1 Registered 8580.91 9940.51 9580.05 11231.71 12052.05 12159.345.2 Un-registered 11039.22 12337.27 12173.03 13135.18 14039.14 14566.92
6. Construction 16800.65 17135.42 15651.66 17063.52 18151.78 19608.167. Electricity,Gas
and Water Supply 2354.46 2500.27 1756.77 1852.48 1968.78 2056.088. Transport, Storage
andCommunications8.1 Railways 2840.07 3100.60 3443.64 4094.25 4427.47 4900.81
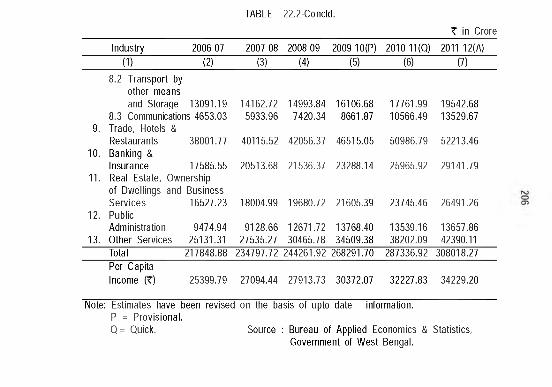
TABLE 22.2-Concld.? in Crore
Industry 2006-07 2007-08 2008-09 2009-10(P) 2010-11(0) 2011-12(A)(1) (2) (3) (4) (5) (6) (7)
8.2 Transport by other meansand Storage 13091.19 14162.72 14993.84 16106.68 17761.99 19542.68
8.3 Communications 4653.03 5933.96 7420.34 8661.87 10566.49 13529.679. Trade, Hotels &
Restaurants 38001.77 40115.52 42056.37 46515.05 50986.79 52213.4610. Banking &
Insurance 17585.55 20513.68 21536.37 23288.14 25965.92 29141.7911. Real Estate, Ownership
of Dwellings and Business Services 16527.23 18004.99 19680.72 21605.39 23745.46 26491.26
12. PublicAdministration 9474.94 9128.66 12671.72 13768.40 13539.16 13657.86
13. Other Services 25131.31 27535.27 30465.78 34509.38 38202.09 42390.11Total 217848.88 234797.72 244261.92 268291.70 287336.92 308018.27Per CapitaIncome (?) 25399.79 27094.44 27913.73 30372.07 32227.83 34229.20
Note: Estimates have been revised on the basis of upto date information.P = Provisional.Q = Quici<. Source : Bureau of Applied Economics & Statistics,
Government of West Bengal.
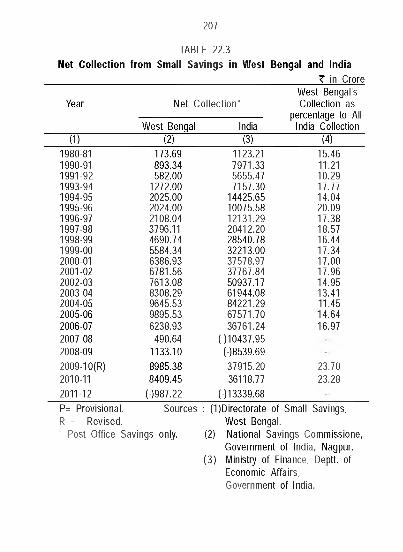
207
TABLE 22.3Net Collection from Small Savings in West Bengal and India
___________? in Crore
Year Net Collection*
West Bengal India
West Bengal's Collection as
percentage to All- India Collection
(1) (2) (3) (4)1980-811990-911991-921993-941994-951995-961996-971997-981998-991999-002000-01 2001-022002-032003-042004-052005-062006-072007-082008-092009-10(R)2010-11 2011-12
173.69893.34582.00
1272.002025.002024.00 2108.04 3796.11 4690.74 5584.346386.93 6781.56 7613.08 8308.299645.539895.536238.93
490.641133.108985.388409.45
(-)987.22
1123.217971.335655.477157.30
14425.6510075.5812131.2920412.20 28540.78 32213.00 37578.97 37767.84 50937.17 61944.0884221.29 67571.70 36761.24
010437.95(-)8539.6937915.20 36118.77
(-)l 3339.68
15.4611.2110.2917.7714.0420.0917.3818.5716.44 17.34 17.0017.96 14.95 13.4111.45 14.6416.97
23.7023.28
P= Provisional.R = Revised.• Post Office Savings only.
Sources : (l)D irectorate of Small Savings, West Bengal.
(2) National Savings Commissione, Government of India, Nagpur.
(3 ) Ministry of Finance, Deptt. of Economic Affairs,Government of India.
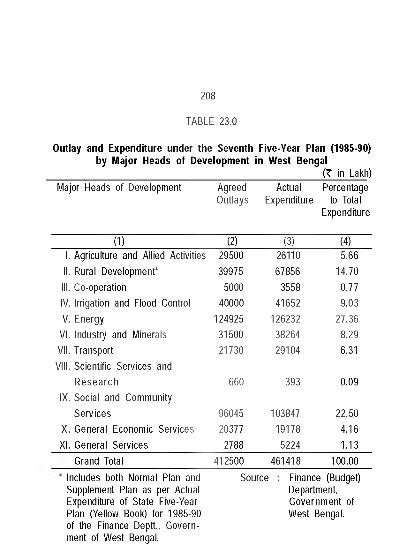
208
TABLE 23.0
Outlay and Expenditure under the Seventh Five-Year Plan (1985-90) by Major Heads of Development in West Bengal
(? in Lakh)Major Fleads of Development Agreed
OutlaysActual
ExpenditurePercentage
to Total Expenditure
(1) (2) (3) (4)1. Agriculture and Allied Activities 29500 26110 5.66II. Rural Development* 39975 67856 14.70III. Co-operation 5000 3558 0.77IV. Irrigation and Flood Control 40000 41652 9.03V. Energy 124925 126232 27.36
VI. Industry and Minerals 31500 38264 8.29VII. Transport 21730 29104 6.31VIII. Scientific Services and
R esearch 660 393 0.09IX. Social and Community
Services 96045 103847 22.50X. General Economic Services 20377 19178 4.16XI. General Services 2788 5224 1.13
Grand Total 412500 461418 100.00Includes both Normal Plan and Supplement Plan as per Actual Expenditure of State Five-Year Plan (Yellow Book) for 1985-90 of the Finance Deptt., Government of West Bengal.
Source Finance (Budget) Department, Government of West Bengal.
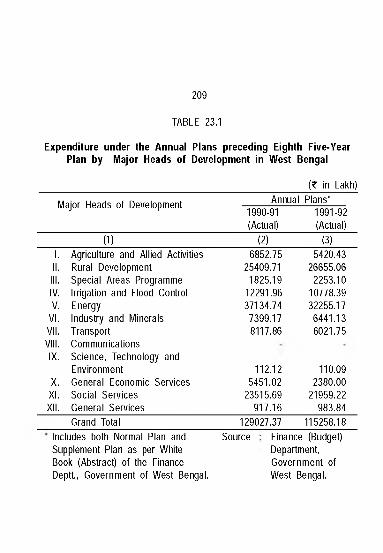
209
TABLE 23.1
Expenditure under the Annual Plans preceding Eighth Five-Year Plan by Major Heads of Development in West Bengal
(? in Lakh)
Major Fleads of Development Annual Plans*1990-91(Actual)
1991-92(Actual)
(1) (2) (3)1. Agriculture and Allied Activities 6852.75 5420.43II. Rural Development 25409.71 26655.06III. Special Areas Programme 1825.19 2253.10IV. Irrigation and Flood Control 12291.96 10778.39V. Energy 37134.74 32255.17
VI. Industry and Minerals 7399.17 6441.13VII. Transport 8117.86 6021.75VIII. CommunicationsIX. Science, Technology and
Environment 112.12 110.09X. General Economic Services 5451.02 2380.00XI. Social Services 23515.69 21959.22XII. General Services 917.16 983.84
Grand Total 129027.37 115258.18Includes both Normal Plan and Supplement Plan as per White Book (Abstract) of the Finance Deptt., Government of West Bengal.
Source Finance (Budget) Department, Government of West Bengal.
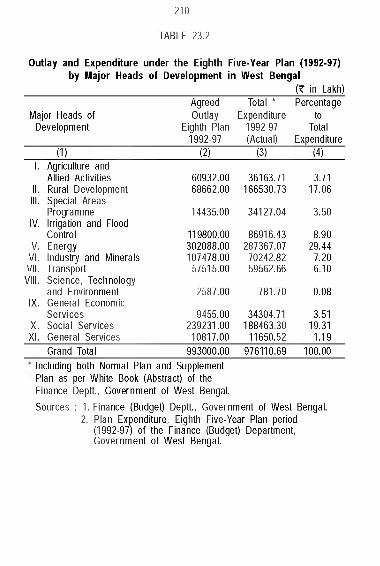
210
TABLE 23.2
Outlay and Expenditure under the Eighth Five-Year Plan (1992-97) by Major Heads of Development in West Bengal
(? in Lakh)
Major Fleads of Development
Agreed Outlay
Eighth Plan 1992-97
Total • Expenditure
1992-97 (Actual)
Percentageto
TotalExpenditure
(1) (2) (3) (4)1. Agriculture and
Allied Activities 60932.00 36163.71 3.71II. Rural Development 68662.00 166530.73 17.06III. Special Areas
Programme 14435.00 34127.04 3.50IV. Irrigation and Flood
Control 119800.00 86916.43 8.90V. Energy 302088.00 287367.07 29.44
VI. Industry and Minerals 107478.00 70242.82 7.20VII. Transport 57515.00 59562.66 6.10VIII. Science, Technology
and Environment 2587.00 781.70 0.08IX. General Economic
Services 9455.00 34304.71 3.51X. Social Services 239231.00 188463.30 19.31XI. General Services 10817.00 11650.52 1.19
Grand Total 993000.00 976110.69 100.00Including both Normal Plan and Supplement Plan as per White Book (Abstract) of the Finance Deptt., Government of West Bengal.Sources : 1. Finance (Budget) Deptt., Government of West Bengal.
2. Plan Expenditure, Eighth Five-Year Plan period (1992-97) of the Finance (Budget) Department, Government o f West Bengal.
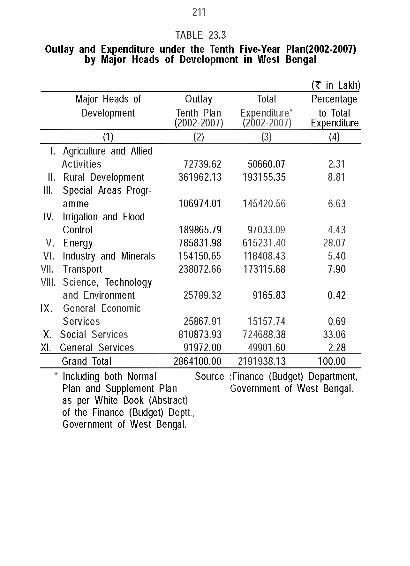
TABLE 23.3Outlay and Expenditure under the Tenth Five-Year Plan(2002-2007)
by Major Heads of Development in West Bengal
211
(? in Lakh)Major Fleads of
DevelopmentOutlay
Tenth Plan (2002-2007)
TotalExpenditure*(2002-2007)
Percentageto Total
Expenditure(1) (2) (3) (4)
1. Agriculture and AlliedA ctiv ities 72739.62 50660.07 2.31
II. Rural Development 361962.13 193155.35 8.81III. Special Areas Progr
amme 106974.01 145420.56 6.63IV. Irrigation and Flood
Control 189865.79 97033.09 4.43V. Energy 785831.98 615231.40 28.07
VI. Industry and Minerals 154150.65 118408.43 5.40VII. Transport 238072.66 173115.68 7.90VIII. Science, Technology
and Environment 25789.32 9165.83 0.42IX. General Economic
Services 25867.91 15157.74 0.69X. Social Services 810873.93 724688.38 33.06
XI. General Services 91972.00 49901.60 2.28Grand Total 2864100.00 2191938.13 100.00Including both Normal Plan and Supplement Plan as per White Book (Abstract) of the Finance (Budget) Deptt., Government of West Bengal.
Source : Finance (Budget) Department, Government of West Bengal.
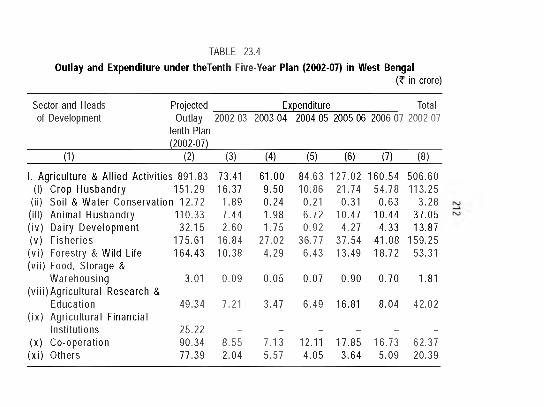
TABLE 23.4Outlay and Expenditure under theTenth Five-Year Plan (2002-07) in West Bengal
(? in crore)
Sector and Heads Projected _______________ Expenditure_______________ Totalof Development Outlay 2002-03 2003-04 2004-05 2005-06 2006-07 2002-07
Tenth Plan (2002-07)
(1) (2) (3) (4) (5) (6) (7) (8)
1. A gricu ltu re & A llied A c tiv itie s 891.83 73.41 61.00 84.63 127.02 160.54 506.60(1) C rop H usbandry 151.29 16.37 9.50 10.86 21.74 54.78 113.25
(ii) So il & W ater C on se rva tio r1 12.72 1.89 0.24 0.21 0.31 0.63 3.28(ill) An im a l H usbandry 110.33 7.44 1.98 6.72 10.47 10.44 37.05( iv ) D airy D eve lopm en t 32.15 2.60 1.75 0.92 4.27 4.33 13.87(v) F ishe ries 175.61 16.84 27.02 36.77 37.54 41.08 159.25(v i) Forestry & W ild Life 164.43 10.38 4.29 6.43 13.49 18.72 53.31(v ii) Food, S torage &
W arehousing 3.01 0.09 0.05 0.07 0.90 0.70 1.81(v i ii)A g r ic u ltu ra l Research &
Education 49.34 7.21 3.47 6.49 16.81 8.04 42.02( ix ) A g ricu ltu ra l F inancia l
Institu tions 25.22 - - - - - -
(x ) C o-opera tion 90.34 8.55 7.13 12.11 17.85 16.73 62.37(x i) O thers 77.39 2.04 5.57 4.05 3.64 5.09 20.39
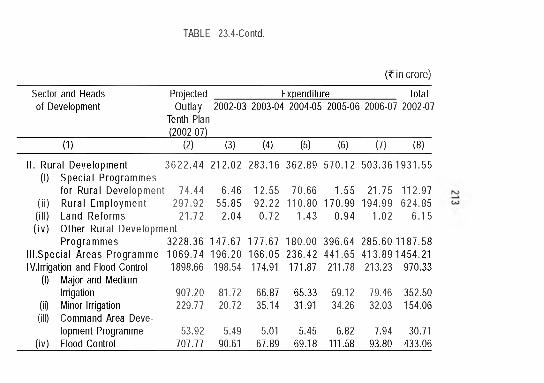
TABLE 23.4-Contd.
(? in crore)
Sector and Heads of Development
Projected Outlay
Tenth Plan (2002-07)
Expenditure Total 2002-03 2003-04 2004-05 2005-06 2006-07 2002-07
(1) (2) (3) (4) (5) (6) (7) (8)
II. Rural D evelopm ent 3 6 2 2 .4 4 212.02 283.16 362.89 570.12 503.36 1931 .55(1) S pec ia l P rogram m es
fo r Rural Developm enI; 74.44 6.46 12.55 70.66 1 .55 21.75 112.97(ii) R ura l Em p loym ent 297.92 55.85 92.22 110.80 170.99 194.99 624.85(ill) Land Reform s 21.72 2.04 0.72 1 .43 0 .94 1.02 6 .15(iv ) O ther Rural Developm ent
P rogram m es 3228 .36 147.67 177.67 180.00 396.64 285.60 1187.58III.Specia l A reas Program m e 1069 .74 196.20 166.05 236.42 441.65 413.89 1454.21IV.Irrigation and Flood Control 1898.66 198.54 174.91 171.87 211.78 213.23 970.33
(1) Major and MediumIrrigation 907.20 81.72 66.87 65.33 59.12 79.46 352.50
(ii) Minor Irrigation 229.77 20.72 35.14 31.91 34.26 32.03 154.06(ill) Command Area Deve
lopment Programme 53.92 5.49 5.01 5.45 6.82 7.94 30.71(iv) Flood Control 707.77 90.61 67.89 69.18 111.58 93.80 433.06
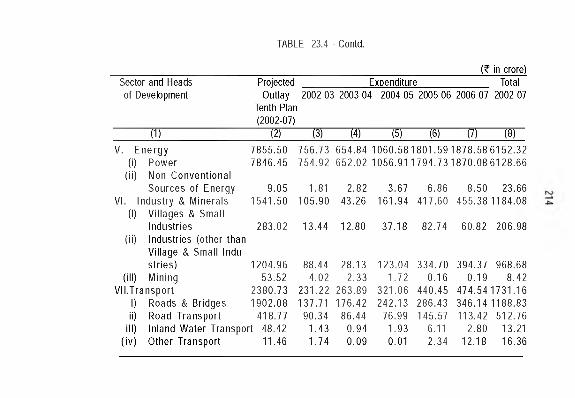
TABLE 23.4 - Contd.
(? in crore)Sector and Heads of Development
Projected Outlay
Tenth Plan (2002-07)
Expenditure 2002-03 2003-04 2004-05 2005-06 2006-07
1
Total2002-07
(1) (2) (3) (4) (5) (6) (7) (8)V. E n e rg y 7855 .50 756.73 654.84 1 0 6 0 .5 8 1 8 0 1 .5 9 1 8 7 8 .5 8 6152 .32
(i) Pow er(ii) Non C on ven tiona l
7846 .45 754.92 652.02 1056.91 1 7 9 4 .7 3 1 8 7 0 .0 8 6128 .66
S ources o f Energy 9.05 1.81 2.82 3.67 6.86 8.50 23.66VI. Indus try & M inera ls
(1) V illages & Sm all1541 .50 105.90 43.26 161.94 417.60 455.38 1184.08
Industries (ii) Industries (other than
V illage & Sm all Indu
283.02 13.44 12.80 37.18 82.74 60.82 206.98
s tr ie s ) 1204 .96 88.44 28.13 123.04 334.70 394.37 968.68(ill) M ining 53.52 4.02 2.33 1.72 0.16 0.19 8.42
V II.T ran spo rt 2380 .73 231.22 263.89 321.06 440.45 474.54 1731.161) Roads & Bridges 1902 .08 137.71 176.42 242.13 286.43 346.14 1188.83ii) Road T ran sp o rt 418.77 90.34 86.44 76.99 145.57 113.42 512.76
ill) In land W ater T ransport 48.42 1.43 0.94 1.93 6.11 2.80 13.21( iv ) O ther T ransport 11.46 1.74 0.09 0.01 2.34 12.18 16.36
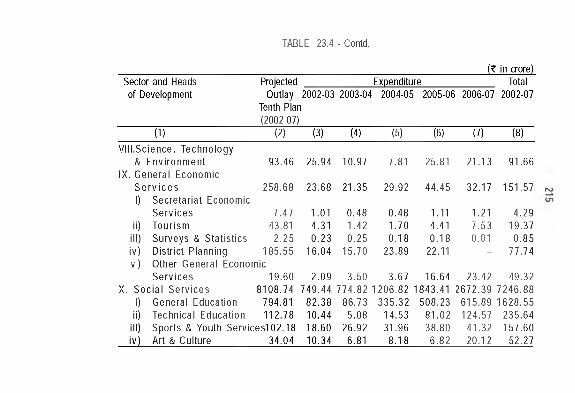
TABLE 23.4 - Contd.
(? in crore)Sector and Heads
of DevelopmentProjected
Outlay Tenth Plan (2002-07)
Expenditure Total2002-072002-03 2003-04
1I 2004-05 2005-06 2006-07
(1) (2) (3) (4) (5) (6) (7) (8)V III.S c ience , Techno logy
& E n v iro n m e n t 93.46 25.94 10.97 7.81 25.81 21.13 91.66IX. G enera l Econom ic
S e rv ic e s 258.68 23.68 21.35 29.92 44.45 32.17 151.571) S ec re ta ria t Econom ic
S e rv ic e s 7.47 1.01 0.48 0.48 1.11 1.21 4.29ii) Tourism 43.81 4.31 1.42 1 .70 4.41 7 .53 19.37
ill) Surveys & S ta tis tic s 2.25 0 .23 0.25 0 .18 0 .18 0.01 0 .85iv ) D is tric t P lanning 185.55 16.04 15.70 23.89 22.11 - 77.74v ) O ther G eneral Econom ic
S e rv ic e s 19.60 2.09 3.50 3.67 16.64 23.42 49.32X. S o c ia l S e rv ic e s 8108 .74 749.44 774.82 1206 .82 1843.41 2672 .39 7246 .88
1) G eneral Education 794.81 82.38 86.73 335.32 508.23 615.89 1628 .55ii) Techn ica l Education 112.78 10.44 5.08 14.53 81.02 124.57 235.64
ill) Sports & Youth S erv ices102 .18 18.60 26.92 31.96 38.80 41.32 157.60iv ) A rt & Culture 34.04 10.34 6.81 8 .18 6 .82 20.12 52.27
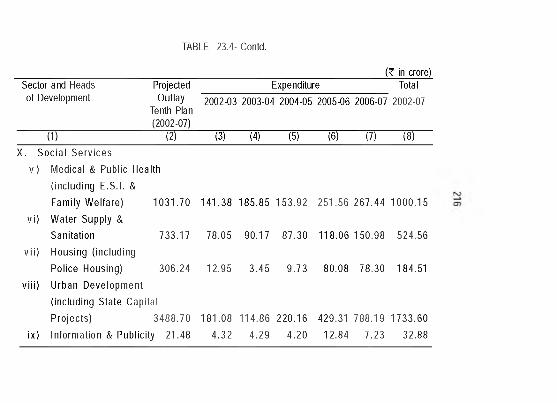
TABLE 23.4-Contd.
(? in crore)Sector and Heads Projected Expenditure Totalof Development Outlay
Tenth Plan (2002-07)
2002-03 2003-04 2004-05 2005-06 2006-07 2002-07
(1) (2) (3) (4) (5) (6) (7) (8)X . S o c ia l S e rv ice s
V) M edical & Public Health(inc lud ing E .S.I. &Fam ily W elfa re ) 1031 .70 141.38 185.85 153.92 251.56 267.44 1000 .15
Vi) W ater Supply &Sanita tion 733.17 78.05 90.17 87.30 118.06 150.98 524.56
v ii) Housing (includ ingPolice Housing) 306.24 12.95 3.45 9 .73 80.08 78.30 184.51
v iii) Urban D eve lopm en t(includ ing S tate C apita lP ro jec ts) 3488 .70 181.08 114.86 220.16 429.31 788.19 1733 .60
ix ) In form ation & P ub lic ity 21.48 4 .32 4.29 4 .20 12.84 7.23 32.88
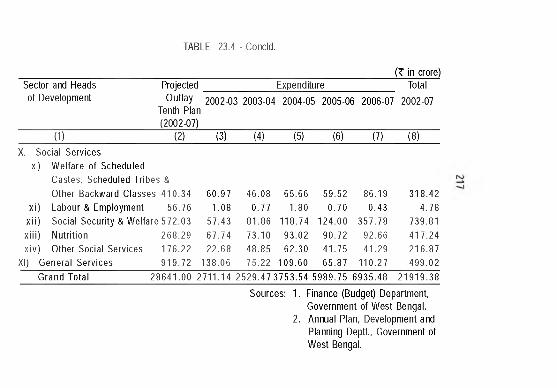
TABLE 23.4 - Concld.
(? in crore)Sector and Heads Projected Expenditure Totalof Development Outlay
Tenth Plan2002-03 2003-04I 2004-05 2005-06 2006-07 2002-07
(2002-07)(1) (2) (3) (4) (5) (6) (7) (8)
X. Social Servicesx ) Welfare of Scheduled
Castes, Scheduled Tribes &Other Backward Classes 410.34 60.97 46.08 65.66 59.52 86.19 318.42
x i) Labour & Employment 56.76 1.08 0.77 1.80 0.70 0.43 4.78x ii) Social Security & Welfare 572.03 57.43 81.86 118.74 124.00 357.78 739.81x iii) Nutrition 268.29 67.74 73.10 93.02 90.72 92.66 417.24x iv) Other Social Services 176.22 22.68 48.85 62.30 41.75 41.29 216.87
XI) General Services 919.72 138.06 75.22 109.60 65.87 110.27 499.02Grand Total 28641.00 2711.14 2529.47 3753.54 5989.75 6935.48 21919.38
Sources: 1. Finance (Budget) Department, Government of West Bengal.
2. Annual Plan, Development and Planning Deptt., Government of West Bengal.
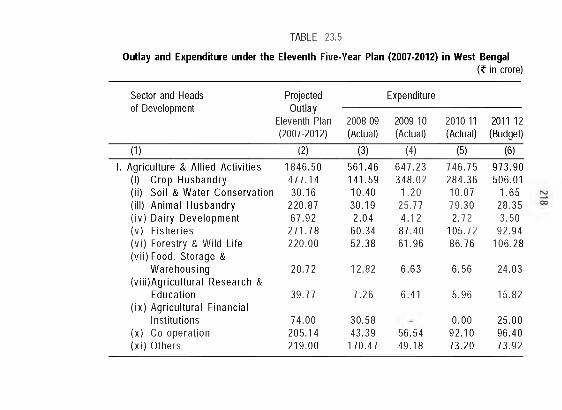
Outlay and Expenditure under the Eleventh Five-Year Plan (2007-2012) in West Bengal(? in crore)
TABLE 23.5
Sector and Heads of Development
Projected Outlay
Eleventh Plan (2007-2012)
Expenditure
2008-09(Actual)
2009-10(Actual)
2010-11(Actual)
2011-12(Budget)
(1) (2) (3) (4) (5) (6)1. A gricu ltu re & A llied A c tiv ities 1846 .50 561.46 647.23 746.75 973.90
(1) C rop H usbandry 477.14 141.59 348.02 284.36 506.01(ii) So il & W ater C onservation 30.16 10.40 1.20 10.07 1.65(ill) Anim a l H usbandry 220.87 30.19 25.77 79.30 28.35( iv ) D airy D eve lopm en t 67.92 2.04 4.12 2.72 3.50(v) F ishe ries 271.78 60.34 87.40 105.72 92.94(v i) Forestry & W ild Life 220.00 52.38 61.96 86.76 106.28(v ii) Food, S torage &
W arehousing 20.72 12.82 6.63 6.56 24.03(v iii)A g r ic u ltu ra l R esearch &
Education 39.77 7.26 6.41 5.96 15.82( ix ) A g ricu ltu ra l F inancia l
Institu tions 74.00 30.58 0.00 25.00(x) C o-opera tion 205.14 43.39 56.54 92.10 96.40(x i) O thers 219.00 170.47 49.18 73.20 73.92
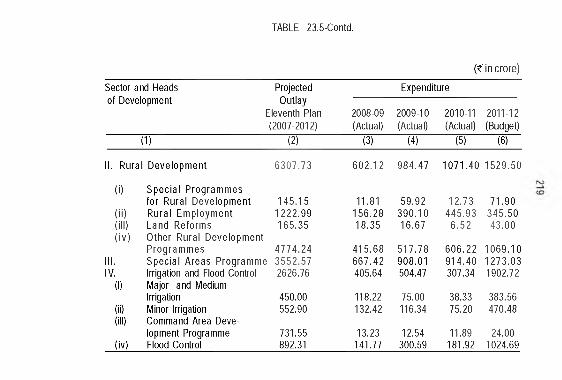
TABLE 23.5-Contd.
(? in crore)
Sector and Heads of Development
Projected Outlay
Eleventh Plan (2007-2012)
Expenditure
2008-09(Actual)
2009-10(Actual)
2010-11(Actual)
2011-12(Budget)
(1) (2) (3) (4) (5) (6)
II. Rural D evelopm ent 6307 .73 602.12 984.47 1071 .40 1529 .50
(i) S pec ia l P rogram m esfo r Rural D evelopm ent 145.15 11.81 59.92 12.73 71.90
(ii) R ura l Em p loym ent 1 222.99 156.28 390.10 445.93 345.50(ill) Land Reform s 165.35 18.35 16.67 6 .52 43.00(iv ) O ther Rural Developm ent
P rogram m es 4774 .24 415.68 517.78 606.22 1069 .10III. S pecia l A reas Programme! 3552.57 667.42 908.01 914.40 1273 .03IV. Irrigation and Flood Control 2626.76 405.64 504.47 307.34 1902.72
(I) Major and MediumIrrigation 450.00 118.22 75.00 38.33 383.56
(ii) Minor Irrigation 552.90 132.42 116.34 75.20 470.48(ill) Command Area Deve
lopment Programme 731.55 13.23 12.54 11.89 24.00(iv) Flood Control 892.31 141.77 300.59 181.92 1024.69
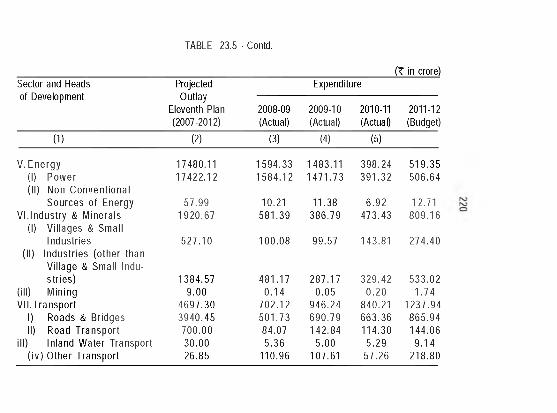
TABLE 23.5 ■ Contd.
(? in crore)Sector and Heads of Development
Projected Outlay
Eleventh Plan (2007-2012)
Expenditure
2008-09(Actual)
2009-10(Actual)
2010-11(Actual)
2011-12(Budget)
(1) (2) (3) (4) (5)
V. E ne rgy 17480.11 1594 .33 1483.11 398.24 519.35(1) P ow er 17422.1 2 1584 .12 1471 .73 391.32 506.64(II) Non C onve n tio na l
Sources o f Energy 57.99 10.21 11.38 6 .92 12.71V I.Indu s try & M inera ls 1920 .67 581.39 386.79 473.43 809.16
(1) V illages & Sm all Industries 527.10 100.08 99.57 143.81 274.40
(II) In dus trie s (o the r than V illage & Sm all Indus tr ie s ) 1384 .57 481.17 287.17 329.42 533.02
(ill) M in ing 9.00 0 .14 0.05 0 .20 1 .74V II.T ran spo rt 4697 .30 702.1 2 946.24 840.21 1237 .94
1) Roads & Bridges 3940 .45 501.73 690.79 663.36 865.94II) Road T ran sp o rt 700.00 84.07 142.84 114.30 144.06
ill) In land W ater T ransport 30.00 5 .36 5.00 5 .29 9 .14( iv ) O ther T ransport 26.85 110.96 107.61 57.26 218.80
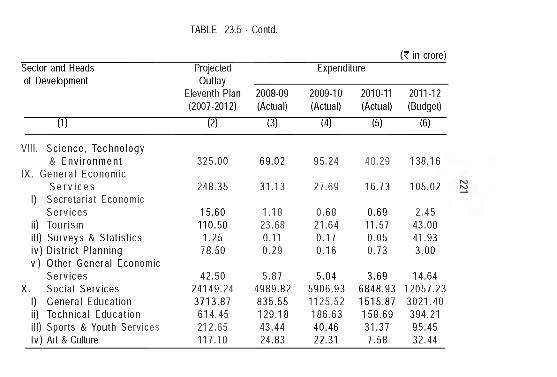
TABLE 23.5 ■Contd.
(? in crore)Sector and Heads of Development
Projected Outlay
Eleventh Plan (2007-2012)
Expenditure
2008-09(Actual)
2009-10(Actual)
2010-11(Actual)
2011-12(Budget)
(1) (2) (3) (4) (5) (6)
VIII. S c ie n ce , T echno logy& E n v iro n m e n t 325.00 69.02 95.24 40.29 138.16
IX. G enera l Econom icS e rv ic e s 248.35 31.13 27.69 16.73 105.02
1) S ec re ta ria t Econom icS e rv ic e s 15.60 1.18 0.68 0.69 2.45
ii) Tourism 110.50 23.68 21.64 11.57 43.00ill) Surveys & S ta tis tic s 1.25 0.11 0.17 0.05 41.93iv ) D is tric t P lanning 78.50 0.29 0.16 0.73 3.00v ) O ther G eneral Econom ic
S e rv ic e s 42.50 5.87 5.04 3.69 14.64X. S oc ia l S erv ices 24149.24 4989 .82 5906 .93 6848 .93 1 2057.23
1) G enera l Education 3713 .87 835.55 1125.52 1515 .87 3021 .40ii) Techn ica l Educa tion 614.45 129.18 186.63 158.69 394.21ill) Sports & Youth Serv ices 212.65 43.44 40.46 31.37 95.45Iv) Art & Culture 117.10 24.83 22.31 7.58 32.44
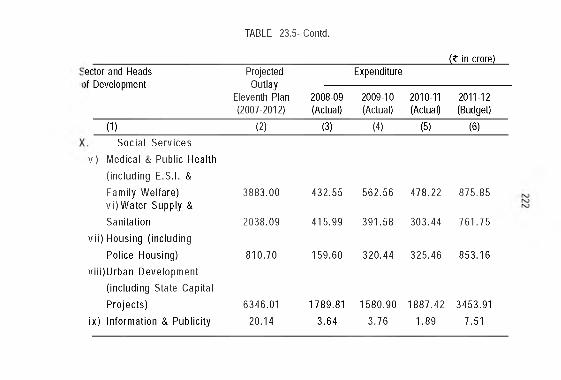
TABLE 23.5- Contd.
(? in crore)iGctor and Heads )f Development
Projected Outlay
Eleventh Plan (2007-2012)
Expenditure
2008-09(Actual)
2009-10(Actual)
2010-11(Actual)
2011-12(Budget)
(1) (2) (3) (4) (5) (6)S o c ia l S e rv ice s
v ) M edical & Public Health (inc lud ing E.S.I. & Fam ily W elfare) 3883 .00 432.55 562.56 478.22 875.85v i)W a te r Supply & S anita tion 2038 .09 415.99 391.58 303.44 761.75
v ii) Housing (inc lud ing Police Housing) 810.70 159.60 320.44 325.46 853.16
v iii)U rb a n D eve lopm en t (includ ing State C apita l P ro jec ts ) 6346.01 1789.81 1580 .90 1887 .42 3453.91
ix ) In fo rm ation & Pub lic ity 20.14 3.64 3.76 1.89 7.51
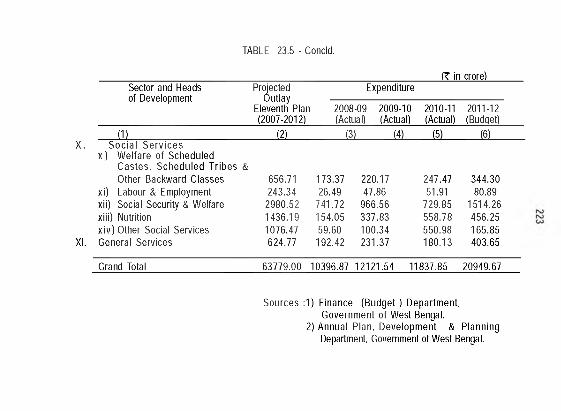
TABLE 23.5 - Concld.
(? in crore)Sector and Heads Projected Expenditureof Development Outlay
Eleventh Plan 2008-09 2009-10 2010-11 2011-12(2007-2012) (Actual) (Actual) (Actual) (Budget)
(1) (2) (3) (4) (5) (6)S o c ia l S e rv ice s
x ) W elfare o f ScheduledC astes, Schedu led T ribes &Other Backward Classes 656.71 173.37 220.17 247.47 344.30
xi) Labour & Employment 243.34 26.49 47.86 51.91 80.89xii) Social Security & Welfare 2980.52 741.72 966.56 729.85 1514.26xiii) Nutrition 1436.19 154.05 337.83 558.78 456.25x iv ) Other Social Services 1076.47 59.60 100.34 550.98 165.85General Services 624.77 192.42 231.37 180.13 403.65
Grand Total 63779.00 10396.87 ■12121.54 11837.85 20949.67
X.
XI.
Sources :1) Finance (B u d g e t) Departm ent, Governm ent o f West Bengal.
2) Annual Plan, Developm ent & P lanning Department, Government of West Bengal.
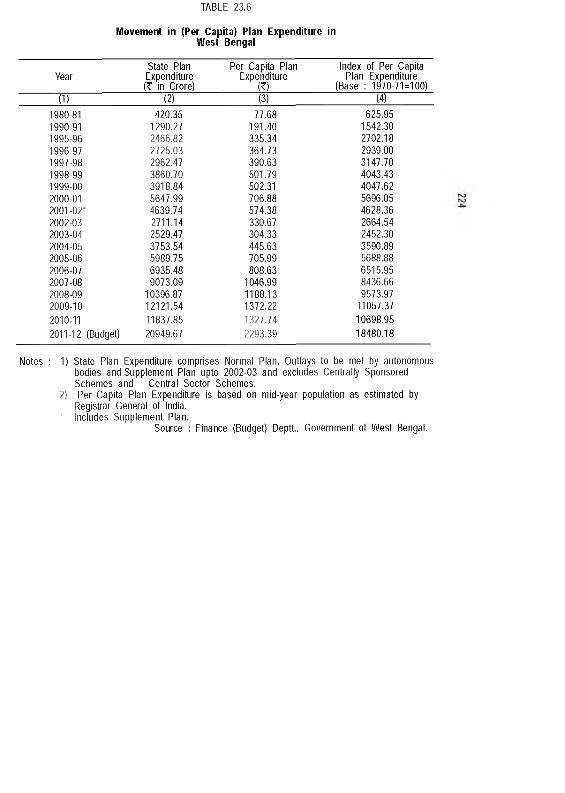
TABLE 23.6
Movement in (Per Capita) Plan Expenditure in West Bengal
YearState Plan Expenditure (? in Crore)
Per Capita Plan Expenditure
(?)
Index of Per Capita Plan Expenditure
(Base : 1970-71=100)(1) (2) (3) (4)
1980-81 420.35 77.68 625.951990-91 1290.27 191.40 1542.301995-96 2466.82 335.34 2702.181996-97 2725.03 364.73 2939.001997-98 2962.47 390.63 3147.701998-99 3860.70 501.79 4043.431999-00 3918.84 502.31 4047.622000-01 5647.99 706.88 5696.052001-02’ 4639.74 574.38 4628.362002-03 2711.14 330.67 2664.542003-04 2529.47 304.33 2452.302004-05 3753.54 445.63 3590.892005-06 5989.75 705.99 5688.882006-07 6935.48 808.63 6515.952007-08 9073.09 1046.99 8436.662008-09 10396.87 1188.13 9573.972009-10 12121.54 1372.22 11057.372010-11 11837.85 1327.74 10698.952011-12 (Budget) 20949.67 2293.39 18480.18
Notes : 1) State Plan Expenditure comprises Normal Plan, Outlays to be met by autonomous bodies and Supplement Plan upto 2002-03 and excludes Centrally Sponsored Schemes and Central Sector Schemes.
2) Per Capita Plan Expenditure is based on mid-year population as estimated by Registrar General of India.
• Includes Supplement Plan.Source : Finance (Budget) Deptt., Government of West Bengal.
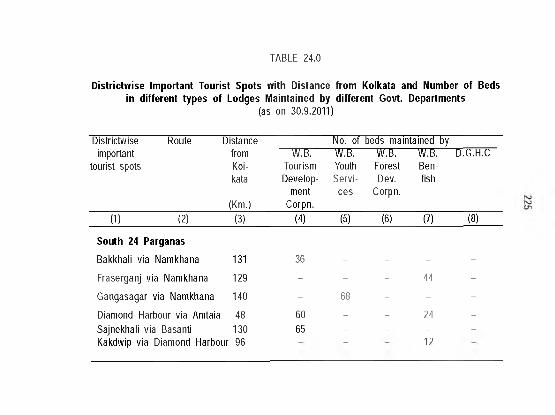
Districtwise Important Tourist Spots with Distance from Kolkata and Number of Beds in different types of Lodges Maintained by different Govt. Departments
(as on 30.9.2011)
TABLE 24.0
Districtwise Route important
tourist spots
DistancefromKoi-l<ata
(Km.)
No. of beds maintained by•W.B.
TourismDevelop
mentCorpn.
W.B.YouthServi
ces
W.B.ForestDev.
Corpn.
W.B.Ben-fish
D.G.H.C
(1) (2) (3) (4) (5) (6) (7) (8)
Sou th 24 Parganas
Bai<l<hali via Nami<hana 131 36 - - - -
Fraserganj via Nami<hana 129 - - - 44 -
Gangasagar via Namkhana 140 - 68 - - -
Diamond Harbour via Amtaia 48 60 - - 24 -
Sajnei<hali via Basanti 130 65 - - - -
Kai<dwip via Diamond Harbour 96 12
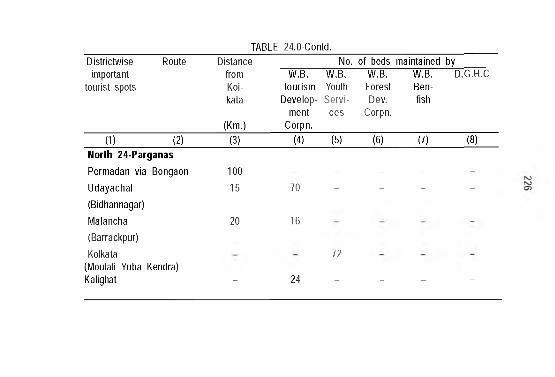
TABLE 24.0-Contd.Districtwise Route
important tourist spots
DistancefromKoi-l<ata
(Km.)
W.B.TourismDevelop
mentCorpn.
No. of beds W.B. W.B. Youtii Forest Servi- Dev
ces Corpn.
maintainedW.B.Ben-fisii
byD.G.H.C
(1) (2) (3) (4) (5) (6) (7) (8)North 24-ParganasPermadan via Bongaon 100 _ _ _ _ _Udayaciial 15 70 - - - -(Bidiiannagar)IVialanciia 20 16(Barracl<pur)Koll<ata 72
(IVIoulali Yuba Kendra) Kaligiiat - 24 - - - -
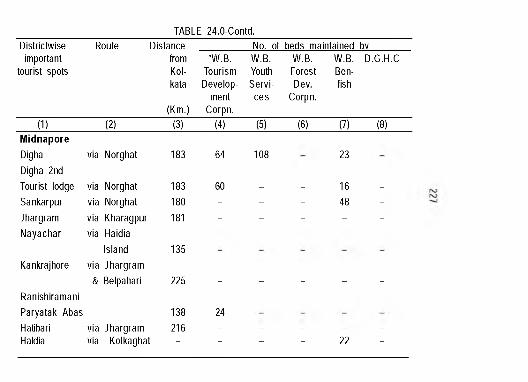
TABLE 24.0-Contd.Districtwise Route Distance No. of beds maintained bv
important tourist spots
fromKol-kata
(Km.)
•W.B.TourismDevelop
mentCorpn.
W.B.YouthServi
ces
W.B.ForestDev.
Corpn.
W.B. D.G.H.CBen-fish
(1) (2) (3) (4) (5) (6) (7) (8)M idnaporeDigha via Norghat 183 64 108 23Digha 2nd Tourist lodge via Norghat 183 60 _ _ 16 _
Sanl<arpur via Norghat 180 - - - 48 -Jhargram via Kharagpur 181 - - - - -
Nayachar via Haidia Island 135
Kanl<rajhore via Jhargram & Belpahari 225 _ _ _ _ _
Ranishiramani Paryatal< Abas 138 24Hatibari via Jhargram 216 - - - - -
IHaldia via Kolkaghat - - - - 22 -
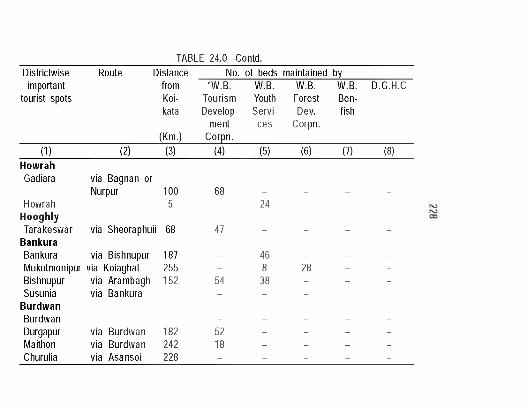
TABLE 24.0 -Contd.Districtwise Route Distance No. of beds maintained by
important from •W.B. W.B. W.B. W.B. D.G.H.Ctourist spots Koi- Tourism Youth Forest Ben-
l<ata Develop Servi Dev fishment ces Corpn.
(Km.) Corpn.(1) (2) (3) (4) (5) (6) (7) (8)
HowrahGadiara via Bagnan or
Nurpur 100 68 - - - -
Howrah 5 - 24 - - -
HooghlyTaral<eswar via Sheoraphuii 68 47 - - - -
BankuraBanl<ura via Bishnupur 187 - 46 - - -
IViul<utmonipur via Koiaghat 255 - 8 28 - -
Bishnupur via Arambagh 152 54 38 - - -
Susunia via Bani<ura - - -
BurdwanBurdwan - - - - -
Durgapur via Burdwan 182 52 - - - -
IVIaithon via Burdwan 242 18 - - - -
Churulia via Asansoi 228 - - - - -
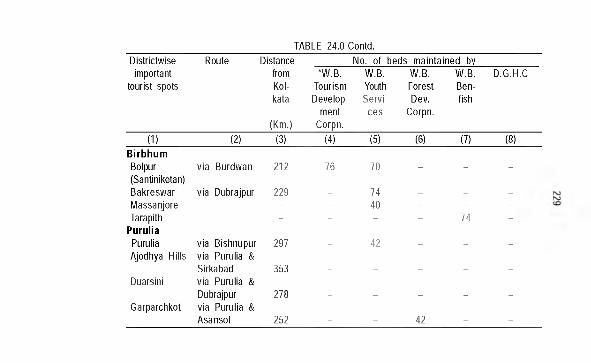
TABLE 24.0-Contd.Districtwise Route Distance No. o f beds maintained bv
important tourist spots
fromKol-kata
(Km.)
•W.B.TourismDevelop
mentCorpn.
W.B.YouthServi
ces
W.B.ForestDev.
Corpn.
W.B.Ben-fish
D.G.H.C
(1) (2) (3) (4) (5) (6) (7) (8)B irbhumBolpur via Burdwan 212 76 70 - - -
(Santinil<etan)Bal<reswar via Dubrajpur 229 - 74 - - -
IVIassanjore - - 40 - - -Tarapith - - - - 74 -
PuruliaPuruliaAjodhya Hills
via Bishnupur via Purulia &
297 - 42 - - -
DuarsiniSirkabad via Purulia &
353 - - - - -
GarparchkotDubrajpur via Purulia &
278 - - - - -
Asansol 252 - - 42 - -
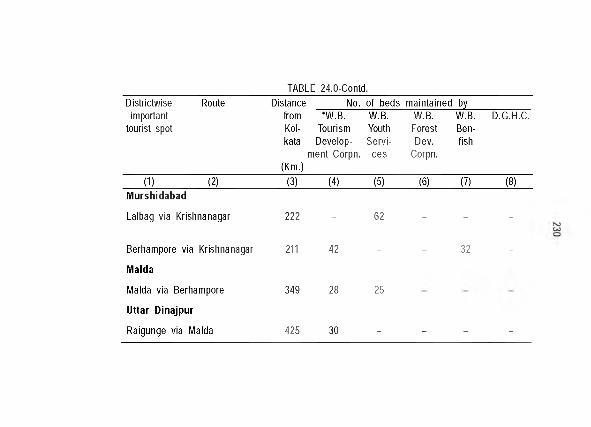
TABLE 24.0-Contd.Districtwise Route Distance No. o f beds maintained by
important tourist spot
fromKol-kata
(Km.)
•W.B. Tourism Develop
ment Corpn.
W.B.YouthS ervi
ces
W.B.ForestDev.
Corpn.
W.B.Ben-fish
D.G.H.C.
(1) (2) (3) (4) (5) (6) (7) (8)M urshidabad
Lalbag via Krishnanagar 222 - 62 - - -
Berhampore via Krishnanagar 211 42 - - 32 -
Malda
iVialda via Berhampore 349 28 25
Uttar Dinajpur
Raigunge via IVialda 425 30 _ _ _ _
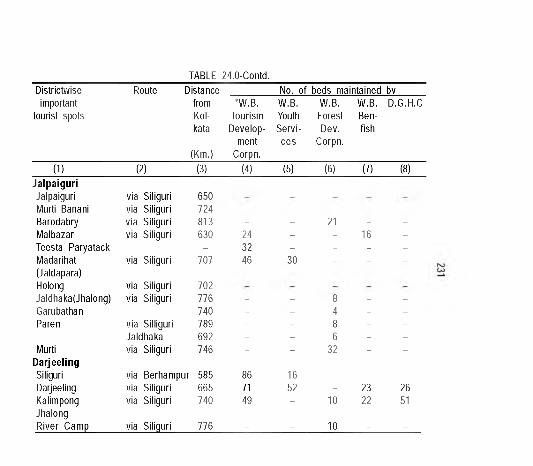
TABLE 24.0-Contd.Districtwise
important tourist spots
Route DistancefromKol-kata
(Km.)
•W.B.TourismDevelop
mentCorpn.
No. of W.B. Youth S ervi
ces
beds maintained bv W.B. W.B. D.G.H.C Forest Ben- Dev. fish
Corpn.
(1) (2) (3) (4) (5) (6) (7) (8)JalpaiguriJalpaiguri via Siliguri 650IVIurti Banani via Siliguri 724 - - - - -
Barodabry via Siliguri 813 - - 21 - -
IVIalbazar via Siliguri 630 24 - - 16 -
Teesta Paryatacl< - 32 - - - -
IVIadarihat via Siliguri 707 46 30 - - -
(Jaldapara)Holong via Siliguri 702Jaldhal<a(Jhalong) via Siliguri 776 - - 8 - -
Garubathan 740 - - 4 - -
Paren via Silliguri 789 - - 8 - -
Jaldhaka 692 - - 6 - -
IVIurti via Siliguri 746 - - 32 - -
DarjeelingSiliguri via Berhampur 585 86 16 _ _ _Darjeeling via Siliguri 665 71 52 - 23 26Kalimpong via Siliguri 740 49 - 10 22 51Jhalong River Camp via Siliquri 776 _ _ 10 _ _
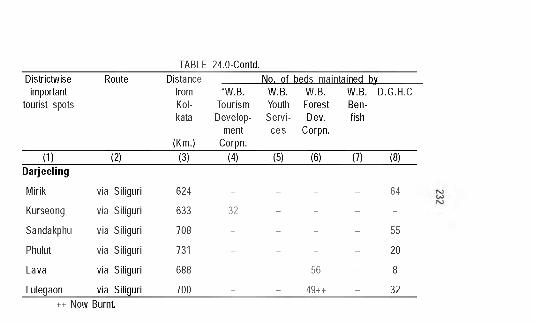
TABLE 24.0-Contd.Districtwise
important tourist spots
Route DistancefromKol-kata
(Km.)
•W.B.TourismDevelop
mentCorpn.
No. of beds maintained by W.B. W.B. W.B. D.G.H.C Youth Forest Ben- Servi- Dev. fish
ces Corpn.
(1) (2) (3) (4) (5) (6) (7) (8)Darjeeling
IVIiril< via Siliguri 624 _ _ _ _ 64
Kurseong via Siliguri 633 32 - - - -
Sandal<phu via Siliguri 708 - - - - 55
Phulut via Siliguri 731 - - - - 20
Lava via Siliguri 688 - - 56 - 8
Lulegaon via Siliguri 700 - - 49++ - 32++ Now Burnt.
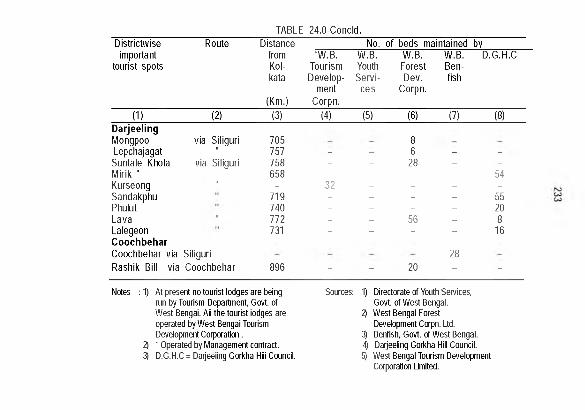
TABLE 24.0-Concld.Districtwise Route Distance No. of beds maintained by
important tourist spots
fromKoLkata
(Km.)
•W.B.TourismDevelop
mentCorpn.
W.B.YouthServi
ces
W.B.ForestDev.
Corpn.
W.B.Ben-fish
D.G.H.C
(1) (2) (3) (4) (5) (6) (7) (8)DarjeelingMongpoo via Siliguri 705 8Lepchajagat " 757 - - 6 - -
Suntale Khola via Siliguri 758 - - 28 - -
Mirik " 658 - - - - 54Kurseong " - 32 - - - -
Sandakphu 719 - - - - 55Phulut 740 - - - - 20Lava " 772 - - 56 - 8Lalegeon 731 - - - - 16CoochbeharCoochbehar via Siliguri 28Rashik Bill via Coochbehar 896 - - 20 - -
Notes : 1) At present no tourist lodges a re being run by Tourism Departm ent, Govt, of W est Bengai. Aii tlie tourist iodges are operated by W est Bengai Tourism Development Corporation.
2) • Operated by iVlanagement contract.3) D .G .H .C = Darjeeiing Gorid ia Hiii Council.
Sources: 1) Directorate of Youth Services,Govt, of W est Bengal.
2) W est Bengal Forest Development Corpn. Ltd.
3) Benfish, G ovt, of W est Bengal.^ Darjeeling Gorkha Hill Council.S) W est Bengal Tourism Developm ent
Corporation Limited.
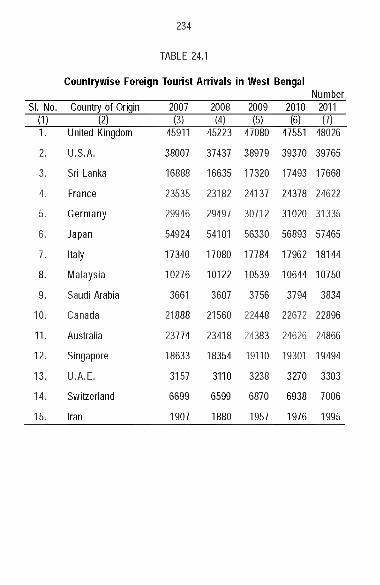
234
TABLE 24.1
Countrywise Foreign Tourist Arrivals in West BengalNumber
SI. No. Country of Origin 2007 2008 2009 2010 2011(1) (2) (3) (4)______(5) (6)____ (7)1 .
2 .
3.
4.
5.
6 .
7.
8 .
9.
1 0 .
11 .
1 2 .
13.
14.
15.
United Kingdom
U.S.A.
Sri Lani<a
France
Germany
Japan
Italy
Malaysia
Saudi Arabia
Canada
Australia
Singapore
U.A.E.
Switzerland
Iran
45911
38007
16888
23535
29946
54924
17340
10276
3661
21888
23774
18633
3157
6699
1907
45223
37437
16635
23182
29497
54101
17080
10122
3607
21560
23418
18354
3110
6599
1880
47080
38979
17320
24137
30712
56330
17784
10539
3756
22448
24383
19110
3238
6870
1957
47551
39370
17493
24378
31020
56893
17962
10644
3794
22672
24626
19301
3270
6938
1976
48026
39765
17668
24622
31335
57465
18144
10750
3834
22896
24866
19494
3303
7006
1995
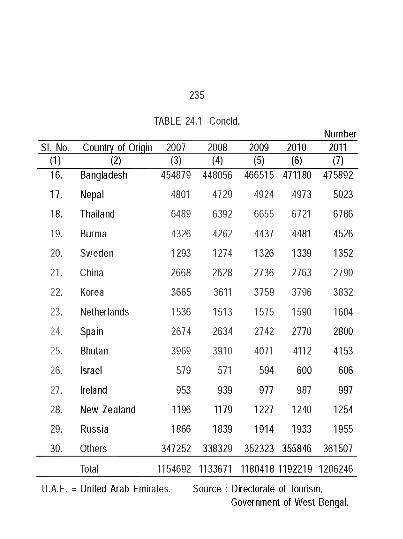
235
TABLE 24.1 -Concld.Number
SI. No. Country of Origin 2007 2008 2009 2010(1) (2) (3) (4) (5) (6)
2011(7)
16.
17.
18.
19.
2 0 .
21.
2 2 .
23.
24.
25.
26.
27.
28.
29.
30.
Bangladesh
Nepal
Thailand
Burma
Sweden
China
Korea
Netherlands
Spain
Bhutan
Israel
Ireland
New Zealand
Russia
Others
454879
4801
6489
4326
1293
2668
3665
1536
2674
3969
579
953
1196
1866
347252
448056
4729
6392
4262
1274
2628
3611
1513
2634
3910
571
939
1179
1839
338329
466515
4924
6655
4437
1326
2736
3759
1575
2742
4071
594
977
1227
1914
352323
471180
4973
6721
4481
1339
2763
3796
1590
2770
4112
600
987
1240
1933
355846
475892
5023
6786
4526
1352
2790
3832
1604
2800
4153
606
997
1254
1955
361507
Total 1154692 1133671 1180418 1192219 1206246
U.A.E. = United Arab Emirates. Source : Directorate of Tourism,Government of West Bengal.
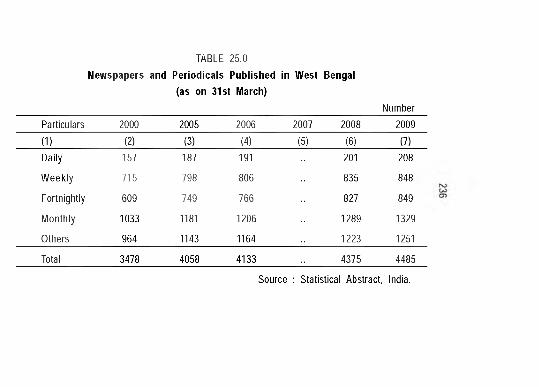
TABLE 25.0 Newspapers and Periodicals Published
(as on 31st March)in W est Bengal
NumberParticulars 2000 2005 2006 2007 2008 2009
(1) (2) (3) (4) (5) (6) (7)Daily 157 187 191 201 208
W eekly 715 798 806 835 848
Fortnightly 609 749 766 827 849
Monthly 1033 1181 1206 1289 1329
Others 964 1143 1164 1223 1251
Total 3478 4058 4133 4375 4485
Source : Statistical Abstract, India.
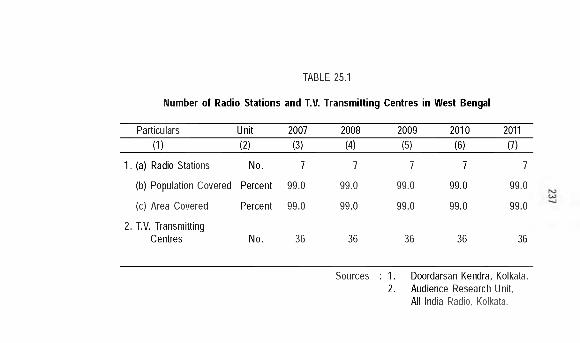
TABLE 25.1
Number of Radio Stations and T.V. Transmitting Centres in West Bengal
Particulars Unit 2007 2008 2009 2010 2011(1) (2) (3) (4) (5) (6) (7)
1. (a) Radio Stations No. 7 7 7 7 7
(b) Population Covered Percent 99.0 99.0 99.0 99.0 99.0
(c) Area Covered Percent 99.0 99.0 99.0 99.0 99.0
2. T.V. Transmitting Centres No. 36 36 36 36 36
Sources : 1. Doordarsan Kendra, Kolkata. 2. Audience Research Unit,
All India Radio, Kolkata.
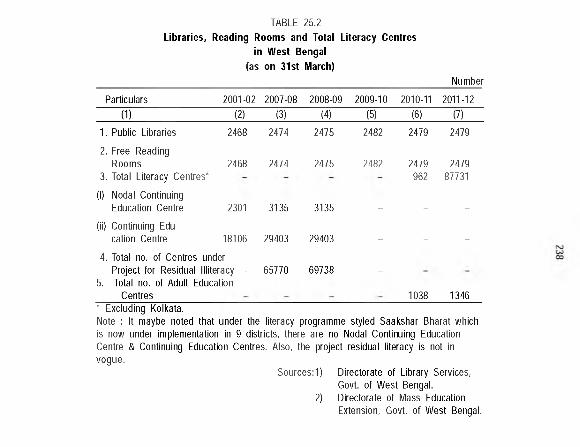
TABLE 25.2Libraries, Reading Rooms and Total Literacy Centres
in W est Bengal (as on 31st March)
Number
Particulars 2001-02 2007-08 2008-09 2009-10 2010-11 2011-12(1) (2) (3) (4) (5) (6) (7)
1. Public Libraries 2468 2474 2475 2482 2479 2479
2. Free Reading Rooms
3. Total Literacy Centres’2468 2474 2475 2482 2479
9622479
87731
(1) Nodal Continuing Education Centre 2301 3135 3135 _ _ _
(ii) Continuing Education Centre 18106 29403 29403 _ _ _
4. Total no. of Centres under Project for Residual Illiteracy -
5. Total no. of Adult EducationCentres
65770 69738 -
1038 1346• Excluding Kolkata.Note : It maybe noted that under the literacy programme styled Saakshar Bharat which is now under implementation in 9 districts, there are no Nodal Continuing Education Centre & Continuing Education Centres. Also, the project residual literacy is not in vogue.
Sources:1) Directorate of Library Services, Govt, of West Bengal.
2) Directorate of Mass Education Extension, Govt, of West Bengal.
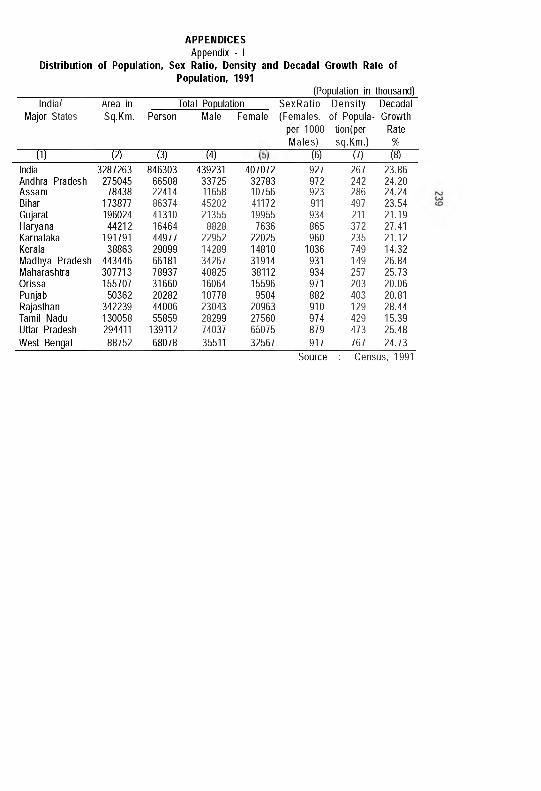
APPENDICESAppendix - I
Distribution of Population, Sex Ratio, Density and Decadal Growth Rate of Population, 1991
(Population in thousand)India/ Area in
Major States Sq.Km. Person Male FemaleTotal Population
T T 12T 1 3 T 1 4 T
S exR atio D ensity Decadal(Females, o f Popula- Growth
per 1000 tion(per Rate Males) sq.Km .) %
(6) (7) (8)—IndiaAndhra PradeshAssamBiharGujaratFlaryanaKarnatakaKeralaMadhya Pradesh Maharashtra Orissa Punjab Rajasthan Tamil Nadu Uttar Pradesh West Bengal
3287263275045
78438173877196024
44212191791
38863443446307713155707
5036234223913005829441188752
84630366508224148637441310164644497729099661817893731660202824400655859
13911268078
43923133725116584520221355
882822952142893426740825160641077823043282997403735511
40707232783107564117219955
76362202514810319143811215596
950420963275606507532567
927972923911934865960
1036931934971882910974879917
267242286497211372235749149257203403129429473767
23.8624.2024.2423.5421.1927.4121.1214.3226.8425.73 20.06 20.81 28.44 15.39 25.4824.73
Source : Census, 1991
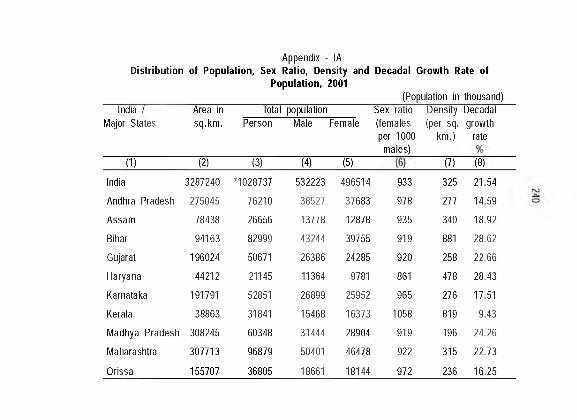
Appendix - lADistribution of Population, Sex Ratio, Density and Decadal Growth Rate of
Population, 2001__________________________________________________ (Population in thousand)
India / Major States
Area in sq.km.
Total populationPerson Male Female
Sex ratio Density(females (per sq.per 1000 km.)
males)
Decadalgrowth
rate
(1) (2) (3) (4) (5) (7) (8)
India
Andhra Pradesh
Assam
Bihar
Gujarat
Haryana
Karnataka
Kerala
Madhya Pradesh
Maharashtra
Orissa
3287240
275045
78438
94163
196024
44212
191791
38863
308245
307713
155707
•1028737
76210
26656
82999
50671
21145
52851
31841
60348
96879
36805
532223
38527
13778
43244
26386
11364
26899
15468
31444
50401
18661
496514
37683
12878
39755
24285
9781
25952
16373
28904
46478
18144
933
978
935
919
920
861
965
1058
919
922
972
325
277
340
881
258
478
276
819
196
315
236
21.54
14.59
18.92
28.62
22.66
28.43
17.51
9.43
24.26
22.73
16.25
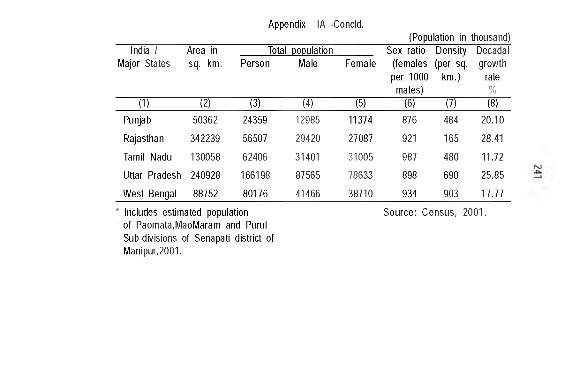
Appendix lA -Concld.(Population in thousand)
India / Major States
Area in sq. km.
Total DODulation Person Male Female
Sex ratio Density (females (per sq. per 1000 km.)
males)
Decadalgrowth
rate%
(1) (2) (3) (4) (5) (6) (7) (8)Punjab 50362 24359 12985 11374 876 484 20.10
Rajasthan 342239 56507 29420 27087 921 165 28.41
Tamil Nadu 130058 62406 31401 31005 987 480 11.72
Uttar Pradesh 240928 166198 87565 78633 898 690 25.85
West Bengal 88752 80176 41466 38710 934 903 17.77
Includes estimated population of Paomata.MaoMaram and Purul Sub-divisions of Senapati district of Manipur,2001.
Source: Census, 2001.
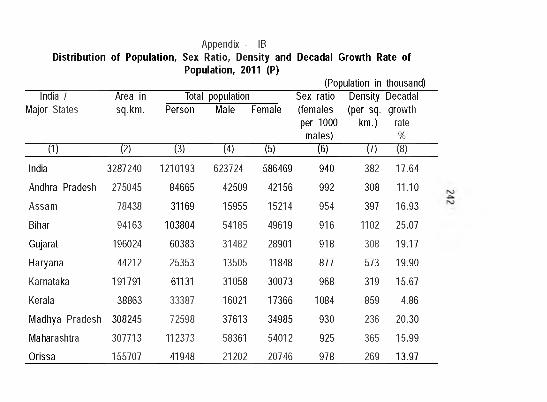
Appendix - IBDistribution of Population, Sex Ratio, Density and Decadal Growth Rate of
Population, 2011 (P)__________________________________________________ (Population in thousand)
India / Major States
Area in sq.km.
Total populationPerson Male Female
Sex ratio Density Decadal(females (per sq. growthper 1000 km.) rate
males) %(1) (2) (3) (4) (5) (6) (7) (8)
India
Andhra Pradesh
Assam
Bihar
Gujarat
Haryana
Karnataka
Kerala
Madhya Pradesh
Maharashtra
Orissa
3287240
275045
78438
94163
196024
44212
191791
38863
308245
307713
155707
1210193
84665
31169
103804
60383
25353
61131
33387
72598
112373
41948
623724
42509
15955
54185
31482
13505
31058
16021
37613
58361
21202
586469
42156
15214
49619
28901
11848
30073
17366
34985
54012
20746
940
992
954
916
918
877
968
1084
930
925
978
382
308
397
1102
308
573
319
859
236
365
269
17.64
11.10
16.93
25.07
19.17
19.90
15.67
4.86
20.30
15.99
13.97
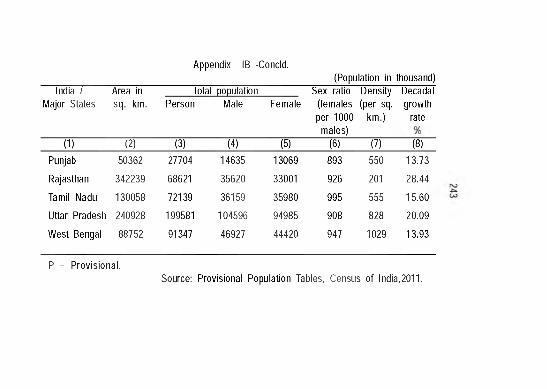
T T
Appendix IB -Concld.(Population in thousand)
India I Area in Total population_________ Sex ratio Density DecadalMajor States sq. km. Person Male Female (females (per sq. growth
per 1000 km.) rate males)
12T (3) " W (5) (6) (7) " WPunjab 50362 27704 14635 13069 893 550 13.73
Rajasthan 342239 68621 35620 33001 926 201 28.44
Tamil Nadu 130058 72139 36159 35980 995 555 15.60
Uttar Pradesh 240928 199581 104596 94985 908 828 20.09
West Bengal 88752 91347 46927 44420 947 1029 13.93
P = Provisional.Source: Provisional Population Tables, Census of India,2011.
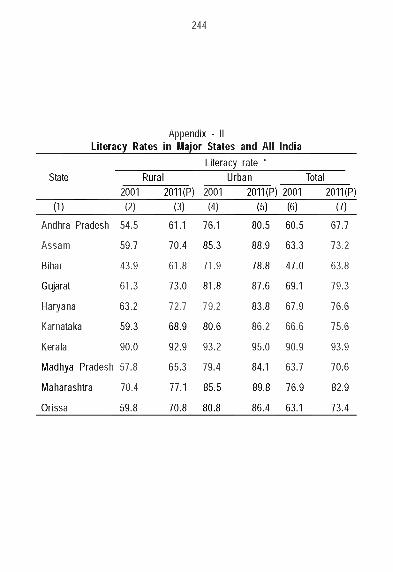
244
Appendix - II Literacy Rates in Major States and All India
___________________ Literacy rate *_____________State Rural Urban Total
2001 2011(P) 2001 2011(P) 2001 2011(P) (1) (2) (3) (4) (5) (6) (7)
Andhra Pradesh 54.5 61.1 76.1 80.5 60.5 67.7
Assam 59.7 70.4 85.3 88.9 63.3 73.2
Bihar 43.9 61.8 71.9 78.8 47.0 63.8
Gujarat 61.3 73.0 81.8 87.6 69.1 79.3
Haryana 63.2 72.7 79.2 83.8 67.9 76.6
Karnataka 59.3 68.9 80.6 86.2 66.6 75.6
Kerala 90.0 92.9 93.2 95.0 90.9 93.9
Madhya Pradesh 57.8 65.3 79.4 84.1 63.7 70.6
Maharashtra 70.4 77.1 85.5 89.8 76.9 82.9
Orissa 59.8 70.8 80.8 86.4 63.1 73.4
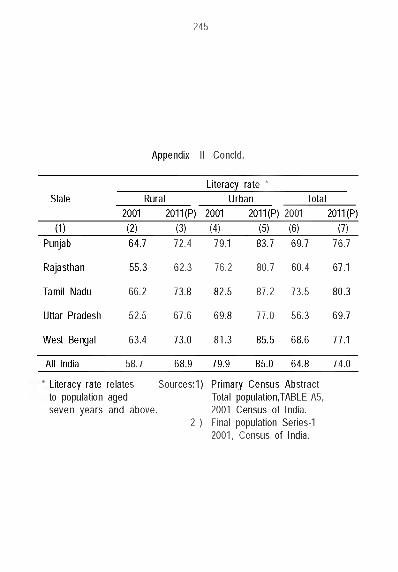
245
Appendix II -Concld.
Literacy rate ’State Rural Urban Total
2001 2011(P) 2001 2011(P) 2001 2011(P)
(1) (2) (3) (4) (5) (6) (7)Punjab 64.7 72.4 79.1 83.7 69.7 76.7
Rajasthan 55.3 62.3 76.2 80.7 60.4 67.1
Tamil Nadu 66.2 73.8 82.5 87.2 73.5 80.3
Uttar Pradesh 52.5 67.6 69.8 77.0 56.3 69.7
West Bengal 63.4 73.0 81.3 85.5 68.6 77.1
All India 58.7 68.9 79.9 85.0 64.8 74.0
Literacy rate relates Sources:1) Primary Census Abstract to population aged Total population,TABLE-A5,seven years and above. 2001 Census of India.
2 ) Final population Series-1 2001, Census of India.
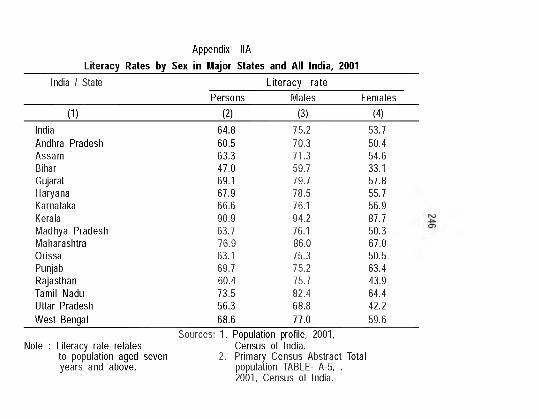
Appendix IIALiteracy Rates by Sex in Major States and All India, 2001
India / StatePersons
Literacy rate Males Females
(1) (2) (3) (4)India 64.8 75.2 53.7Andhra Pradesh 60.5 70.3 50.4Assam 63.3 71.3 54.6Bihar 47.0 59.7 33.1Gujarat 69.1 79.7 57.8Haryana 67.9 78.5 55.7Karnataka 66.6 76.1 56.9Kerala 90.9 94.2 87.7Madhya Pradesh 63.7 76.1 50.3Maharashtra 76.9 86.0 67.0Orissa 63.1 75.3 50.5Punjab 69.7 75.2 63.4Rajasthan 60.4 75.7 43.9Tamil Nadu 73.5 82.4 64.4Uttar Pradesh 56.3 68.8 42.2West Bengal 68.6 77.0 59.6
Note : Literacy rate relatesto population aged seven years and above.
Sources: 1. Population profile, 2001,Census of India.
2. Primary Census Abstract Total population TABLE- A-5, .2001, Census of India.
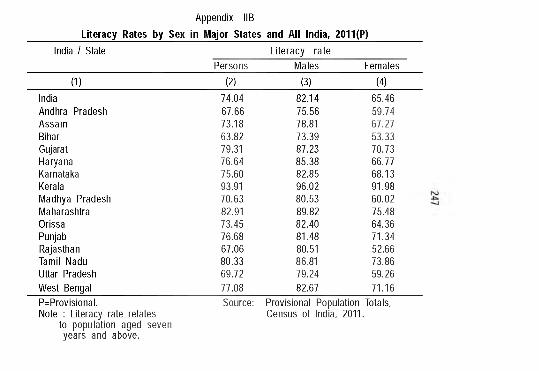
Appendix IIBLiteracy Rates by Sex in Major States and All India, 2011(F)
India / StatePersons
Literacy rate Males Females
(1) (2) (3) (4)India 74.04 82.14 65.46Andhra Pradesh 67.66 75.56 59.74Assam 73.18 78.81 67.27Bihar 63.82 73.39 53.33Gujarat 79.31 87.23 70.73Haryana 76.64 85.38 66.77Karnataka 75.60 82.85 68.13Kerala 93.91 96.02 91.98Madhya Pradesh 70.63 80.53 60.02Maharashtra 82.91 89.82 75.48Orissa 73.45 82.40 64.36Punjab 76.68 81.48 71.34Rajasthan 67.06 80.51 52.66Tamil Nadu 80.33 86.81 73.86Uttar Pradesh 69.72 79.24 59.26West Bengal 77.08 82.67 71.16P=Provisional.Note : Literacy rate relates
to population aged seven years and above.
Source: Provisional Population Totals, Census of India, 2011.
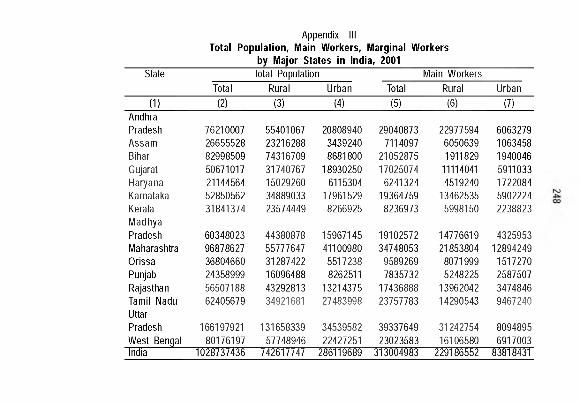
Appendix IIITotal Population, Main Workers, Marginal Workers
by Major States in India, 2001State Total Population Main Workers
Total Rural Urban Total Rural Urban(1) (2) (3) (4) (5) (6) (7)
AndhraPradesh 76210007 55401067 20808940 29040873 22977594 6063279Assam 26655528 23216288 3439240 7114097 6050639 1063458Bihar 82998509 74316709 8681800 21052875 1911829 1940046Gujarat 50671017 31740767 18930250 17025074 11114041 5911033Haryana 21144564 15029260 6115304 6241324 4519240 1722084Karnataka 52850562 34889033 17961529 19364759 13462535 5902224Kerala 31841374 23574449 8266925 8236973 5998150 2238823MadhyaPradesh 60348023 44380878 15967145 19102572 14776619 4325953Maharashtra 96878627 55777647 41100980 34748053 21853804 12894249Orissa 36804660 31287422 5517238 9589269 8071999 1517270Punjab 24358999 16096488 8262511 7835732 5248225 2587507Rajasthan 56507188 43292813 13214375 17436888 13962042 3474846Tamil Nadu 62405679 34921681 27483998 23757783 14290543 9467240UttarPradesh 166197921 131658339 34539582 39337649 31242754 8094895West Bengal 80176197 57748946 22427251 23023583 16106580 6917003India 1028737436 742617747 286119689 313004983 229186552 83818431
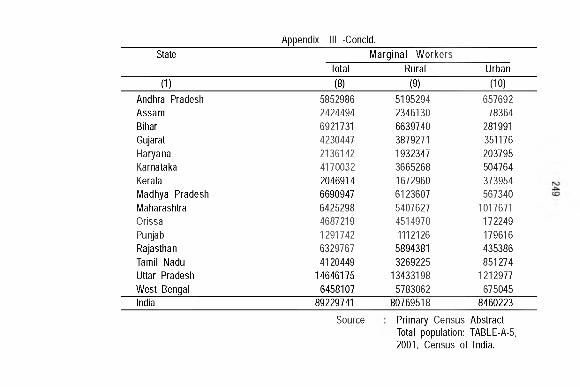
Appendix III -Concld.State M arginal W orkers
Total Rural Urban(1) (8) (9) (10)
Andhra Pradesh 5852986 5195294 657692Assam 2424494 2346130 78364Bihar 6921731 6639740 281991Gujarat 4230447 3879271 351176Haryana 2136142 1932347 203795Karnataka 4170032 3665268 504764Kerala 2046914 1672960 373954Madhya Pradesh 6690947 6123607 567340Maharashtra 6425298 5407627 1017671Orissa 4687219 4514970 172249Punjab 1291742 1112126 179616Rajasthan 6329767 5894381 435386Tamil Nadu 4120449 3269225 851274Uttar Pradesh 14646175 13433198 1212977West Bengal 6458107 5783062 675045India 89229741 80769518 8460223
Source Primary Census AbstractTotal population: TABLE-A-5, 2001, Census of India.
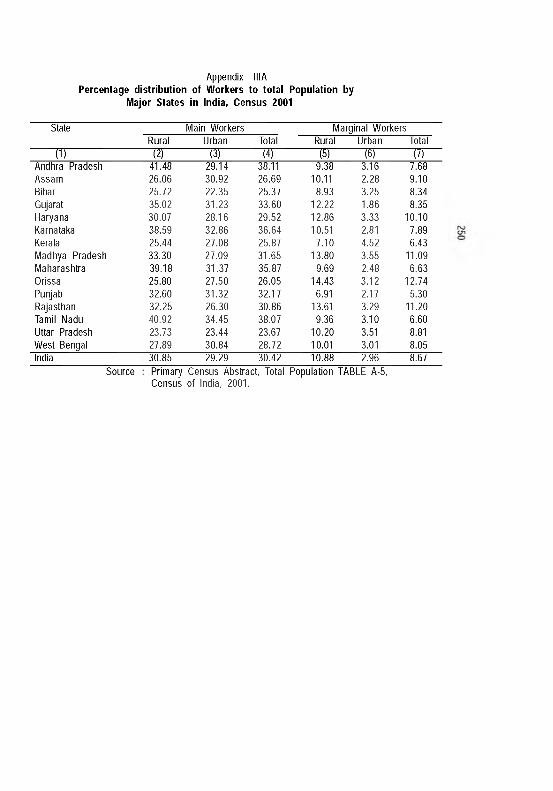
Appendix IIIAPercentage distribution of Workers to total Population by
Major States in India, Census 2001
State Main Workers Marginal WorkersRural Urban Total Rural Urban Total
(1) (2) (3) (4) (5) (6) (7)Andhra Pradesh 41.48 29.14 38.11 9.38 3.16 7.68Assam 26.06 30.92 26.69 10.11 2.28 9.10Bihar 25.72 22.35 25.37 8.93 3.25 8.34Gujarat 35.02 31.23 33.60 12.22 1.86 8.35Haryana 30.07 28.16 29.52 12.86 3.33 10.10Karnataka 38.59 32.86 36.64 10.51 2.81 7.89Kerala 25.44 27.08 25.87 7.10 4.52 6.43Madhya Pradesh 33.30 27.09 31.65 13.80 3.55 11.09Maharashtra 39.18 31.37 35.87 9.69 2.48 6.63Orissa 25.80 27.50 26.05 14.43 3.12 12.74Punjab 32.60 31.32 32.17 6.91 2.17 5.30Rajasthan 32.25 26.30 30.86 13.61 3.29 11.20Tamil Nadu 40.92 34.45 38.07 9.36 3.10 6.60Uttar Pradesh 23.73 23.44 23.67 10.20 3.51 8.81West Bengal 27.89 30.84 28.72 10.01 3.01 8.05India 30.85 29.29 30.42 10.88 2.96 8.67
Source PrimaryCensus
Census Abstract, Total of India, 2001.
Population TABLE A-5,
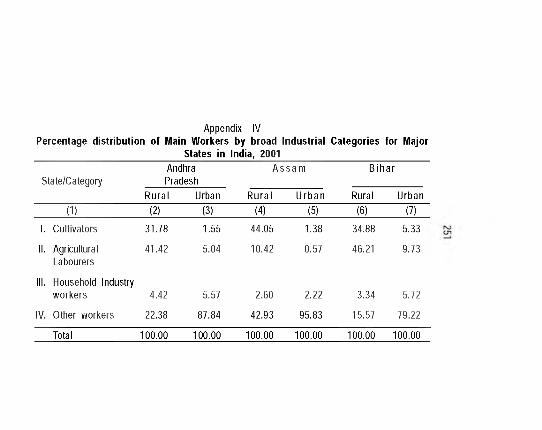
Appendix IVPercentage distribution of Main Workers by broad Industrial Categories for Major
States in India, 2001
State/CategoryAndhraPradesh
A s s a m B ih a r
R ura l Urban R ura l U rba n Rural Urban(1) (2) (3) (4) (5) (6) (7)
1. Cultivators 31.78 1.55 44.05 1.38 34.88 5.33
II. Agricultural Labourers
41.42 5.04 10.42 0.57 46.21 9.73
III. Household Industry workers 4.42 5.57 2.60 2.22 3.34 5.72
IV. Other workers 22.38 87.84 42.93 95.83 15.57 79.22
Total 100.00 100.00 100.00 100.00 100.00 100.00
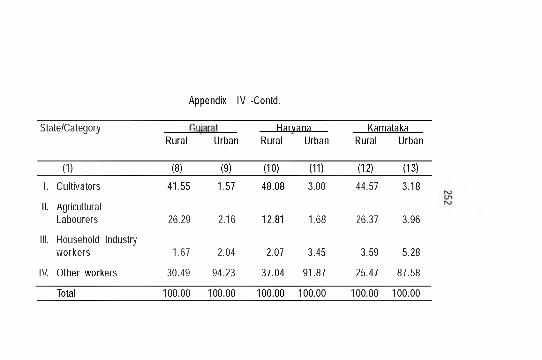
Appendix IV -Contd.
State/Category Harvana KarnatakaRural Urban Rural Urban Rural Urban
(1) (8) (9) (10) (11) (12) (13)
1. Cultivators 41.55 1.57 48.08 3.00 44.57 3.18
II. Agricultural Labourers 26.29 2.16 12.81 1.68 26.37 3.96
III. Household Industry workers 1.67 2.04 2.07 3.45 3.59 5.28
IV. Other workers 30.49 94.23 37.04 91.87 25.47 87.58
Total 100.00 100.00 100.00 100.00 100.00 100.00
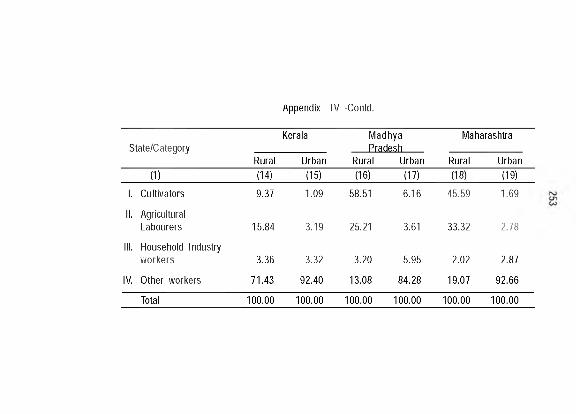
Appendix IV -Contd.
State/CategoryKerala Madhya
PradeshMaharashtra
Rural Urban Rural Urban Rural Urban(1) (14) (15) (16) (17) (18) (19)
1. Cultivators 9.37 1.09 58.51 6.16 45.59 1.69
II. Agricultural Labourers 15.84 3.19 25.21 3.61 33.32 2.78
III. Household Industry workers 3.36 3.32 3.20 5.95 2.02 2.87
IV. Other workers 71.43 92.40 13.08 84.28 19.07 92.66
Total 100.00 100.00 100.00 100.00 100.00 100.00
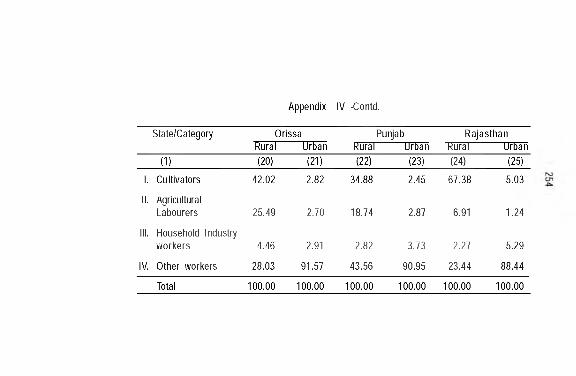
Appendix IV -Contd.
State/Category Orissa Punjab RajasthanRural Urban Rural Urban Rural Urban
(1) (20) (21) (22) (23) (24) (25)
1. Cultivators 42.02 2.82 34.88 2.45 67.38 5.03
II. Agricultural Labourers 25.49 2.70 18.74 2.87 6.91 1.24
III. Household Industry workers 4.46 2.91 2.82 3.73 2.27 5.29
IV. Other workers 28.03 91.57 43.56 90.95 23.44 88.44
Total 100.00 100.00 100.00 100.00 100.00 100.00
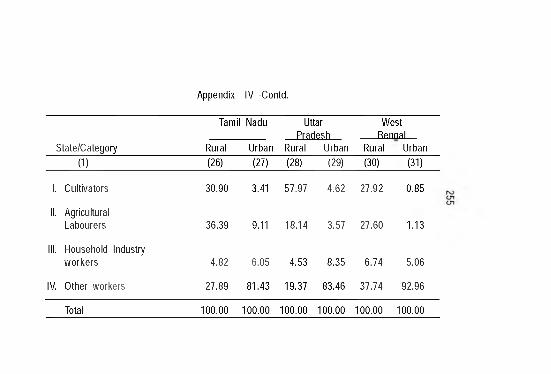
Appendix IV -Contd.
Tamil Nadu UttarPradesh
WestBennal
State/Category Rural Urban Rural Urban Rural Urban(1) (26) (27) (28) (29) (30) (31)
1. Cultivators 30.90 3.41 57.97 4.62 27.92 0.85
II. Agricultural Labourers 36.39 9.11 18.14 3.57 27.60 1.13
III. Household Industry workers 4.82 6.05 4.53 8.35 6.74 5.06
IV. Other workers 27.89 81.43 19.37 83.46 37.74 92.96
Total 100.00 100.00 100.00 100.00 100.00 100.00
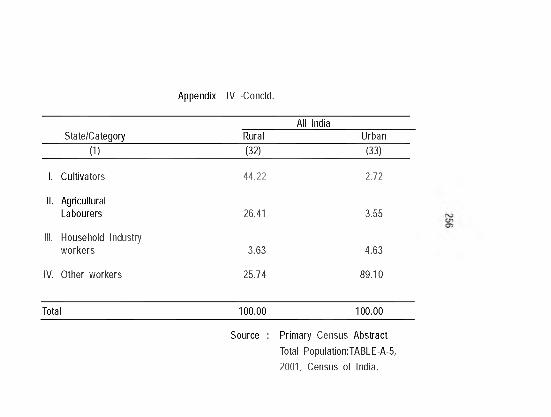
Appendix IV -Concld.
State/Category RuralAll India
Urban(1) (32) (33)
1. Cultivators 44.22 2.72
II. AgriculturalLabourers 26.41 3.55
III. Household Industryworkers 3.63 4.63
IV. Other workers 25.74 89.10
Total 100.00 100.00
Source : Primary Census Abstract Total Population:TABLE-A-5, 2001, Census of India.
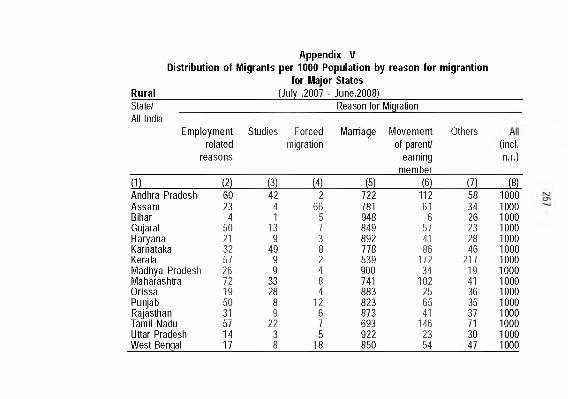
Rural
Appendix VDistribution of Migrants per 1000 Population by reason for migrantion
for Major States_________________________ (July ,2007 - June,2008)
State/ All India
Reason for Migration
Employment Studies Forced related migration
reasons
Marriage Movement of parent/
earning member
Others(incl.n.r.)
(1) (2) (3) (4) (5) (6) (7) (8)Andhra Pradesh 60 42 2 722 112 58 1000Assam 23 4 66 781 61 34 1000Bihar 4 1 5 948 6 26 1000Gujarat 50 13 7 849 57 23 1000Haryana 21 9 3 892 41 28 1000Karnataka 32 49 8 778 86 46 1000Kerala 57 9 2 539 172 217 1000Madhya Pradesh 26 9 4 900 34 19 1000Maharashtra 72 33 8 741 102 41 1000Orissa 19 28 4 883 25 36 1000Punjab 50 8 12 823 65 35 1000Rajasthan 31 9 6 873 41 37 1000Tamil Nadu 57 22 7 693 146 71 1000Uttar Pradesh 14 3 5 922 23 30 1000West Bengal 17 8 18 850 54 47 1000
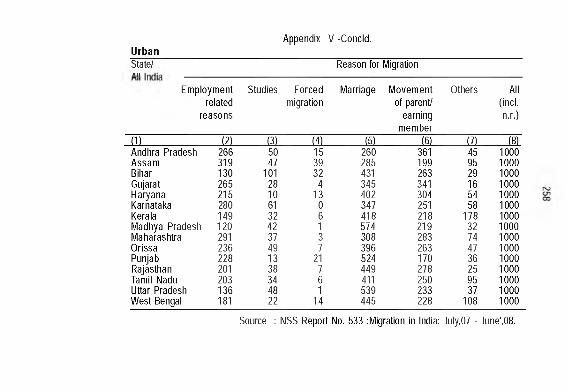
UrbanAppendix V -Concld.
State/All
Reason for Migration
Employmentrelated
reasons
Studies Forcedmigration
Marriage Movement of parent/
earning member
Others All(incl.n.r.)
(1) (2) (3) (4) (5) (6) (7) (8)Andhra Pradesh 266 50 15 260 361 45 1000Assam 319 47 39 285 199 95 1000Bihar 130 101 32 431 263 29 1000Gujarat 265 28 4 345 341 16 1000Haryana 215 10 13 402 304 54 1000Karnataka 280 61 0 347 251 58 1000Kerala 149 32 6 418 218 178 1000Madhya Pradesh 120 42 1 574 219 32 1000Maharashtra 291 37 3 308 283 74 1000Orissa 236 49 7 396 263 47 1000Punjab 228 13 21 524 170 36 1000Rajasthan 201 38 7 449 278 25 1000Tamil Nadu 203 34 6 411 250 95 1000Uttar Pradesh 136 48 1 539 233 37 1000West Bengal 181 22 14 445 228 108 1000
Source : NSS Report No. 533 :Migration in India: July,07 - June',08.
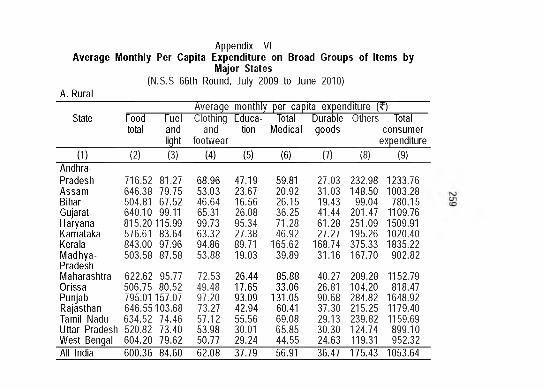
Appendix VIAverage Monthly Per Capita Expenditure on Broad Groups of Items by
Major States(N.S.S 66th Round, July 2009 to June 2010)
A. Rural~ ^ r a q e monthly per capita expenditure (?)
State
(1)
Food Fuel Clothing Educa- Total Durable Others Total total and and tion Medical goods consumer
light footwear expenditure(2) (3) (4) (5) (6) (7) (8) (9)
Andhra-Pradesh 716.52 81.27 68.96 47.19 59.81 27.03 232.98 1233.76Assam 646.38 79.75 53.03 23.67 20.92 31.03 148.50 1003.28Bihar 504.81 67.52 46.64 16.56 26.15 19.43 99.04 780.15Gujarat 640.10 99.11 65.31 26.08 36.25 41.44 201.47 1109.76Flaryana 815.20115.99 99.73 95.34 71.28 61.28 251.09 1509.91Karnataka 576.61 83.64 63.32 27.38 46.92 27.27 195.26 1020.40Kerala 843.00 97.96 94.86 89.71 165.62 168.74 375.33 1835.22Madhya-Pradesh
503.58 87.58 53.88 19.03 39.89 31.16 167.70 902.82
Maharashtra 622.62 95.77 72.53 26.44 85.88 40.27 209.28 1152.79Orissa 506.75 80.52 49.48 17.65 33.06 26.81 104.20 818.47Punjab 795.01 157.07 97.20 93.09 131.05 90.68 284.82 1648.92Rajasthan 646.55103.68 73.27 42.94 60.41 37.30 215.25 1179.40Tamil Nadu 634.52 74.46 57.12 55.56 69.08 29.13 239.82 1159.69Uttar Pradesh 520.82 73.40 53.98 30.01 65.85 30.30 124.74 899.10West Bengal 604.20 79.62 50.77 29.24 44.55 24.63 119.31 952.32All India 600.36 84.60 62.08 37.79 56.91 36.47 175.43 1053.64
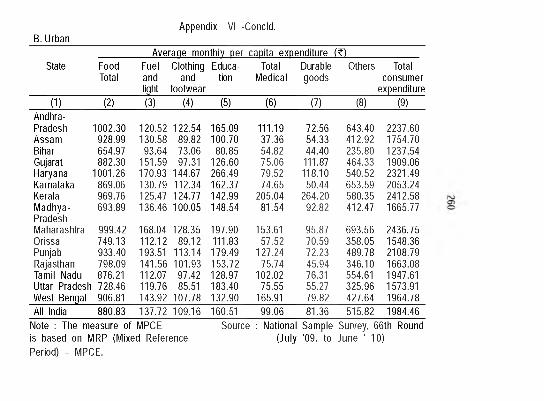
B. UrbanAppendix VI -Concld.
Averaae monthiv oer caoita exoenditure (?)State Food Fuel Clothing Educa- Total Durable Others Total
Total and and tion Medical goods consumerlight footwear expenditure
(1) (2) (3) (4) (5) (6) (7) (8) (9)Andhra-Pradesh 1002.30 120.52 122.54 165.09 111.19 72.56 643.40 2237.60Assam 928.99 130.58 89.82 100.70 37.36 54.33 412.92 1754.70Bihar 654.97 93.64 73.06 80.85 54.82 44.40 235.80 1237.54Gujarat 882.30 151.59 97.31 126.60 75.06 111.87 464.33 1909.06Haryana 1001.26 170.93 144.67 266.49 79.52 118.10 540.52 2321.49Karnataka 869.06 130.79 112.34 162.37 74.65 50.44 653.59 2053.24Kerala 969.76 125.47 124.77 142.99 205.04 264.20 580.35 2412.58Madhya- 693.89 136.46 100.05 148.54 81.54 92.82 412.47 1665.77PradeshMaharashtra 999.42 168.04 128.35 197.90 153.61 95.87 693.56 2436.75Orissa 749.13 112.12 89.12 111.83 57.52 70.59 358.05 1548.36Punjab 933.40 193.51 113.14 179.49 127.24 72.23 489.78 2108.79Rajasthan 798.09 141.56 101.93 153.72 75.74 45.94 346.10 1663.08Tamil Nadu 876.21 112.07 97.42 128.97 102.02 76.31 554.61 1947.61Uttar Pradesh1 728.46 119.76 85.51 183.40 75.55 55.27 325.96 1573.91West Bengal 906.81 143.92 107.78 132.90 165.91 79.82 427.64 1964.78All India 880.83 137.72 109.16 160.51 99.06 81.36 515.82 1984.46
Note : The measure of MPCE is based on IVIRP (IVIixed Reference Period) - IVIPCE.
Source : National Sample Survey, 66th Round (July '09. to June ' 10)
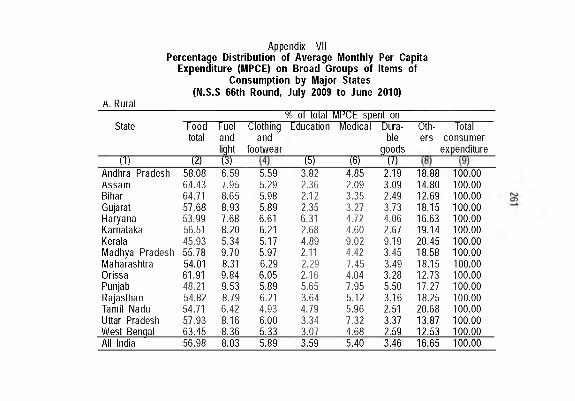
A. Rural
Appendix VIIPercentage Distribution of Average Monthly Per Capita
Expenditure (MPCE) on Broad Groups of Items of Consumption by Major States
(N.S.S 66th Round, July 2009 to June 2010)
% ot total Education
MPCb spent on Medical Dura
ble goods
— (B)— u y -
State Foodtotal
■ n r ~ w
Fueland
■ T
Clothingand
footwear
Others
1 5 T
Totalconsumer
expenditure
Andhra Pradesh 58.08 6.59 5.59 3.82 4.85 2.19 18.88 100.00Assam 64.43 7.95 5.29 2.36 2.09 3.09 14.80 100.00Bihar 64.71 8.65 5.98 2.12 3.35 2.49 12.69 100.00Gujarat 57.68 8.93 5.89 2.35 3.27 3.73 18.15 100.00Flaryana 53.99 7.68 6.61 6.31 4.72 4.06 16.63 100.00Karnataka 56.51 8.20 6.21 2.68 4.60 2.67 19.14 100.00Kerala 45.93 5.34 5.17 4.89 9.02 9.19 20.45 100.00Madhya Pradesh 55.78 9.70 5.97 2.11 4.42 3.45 18.58 100.00Maharashtra 54.01 8.31 6.29 2.29 7.45 3.49 18.15 100.00Orissa 61.91 9.84 6.05 2.16 4.04 3.28 12.73 100.00Punjab 48.21 9.53 5.89 5.65 7.95 5.50 17.27 100.00Rajasthan 54.82 8.79 6.21 3.64 5.12 3.16 18.25 100.00Tamil Nadu 54.71 6.42 4.93 4.79 5.96 2.51 20.68 100.00Uttar Pradesh 57.93 8.16 6.00 3.34 7.32 3.37 13.87 100.00West Benaal 63.45 8.36 5.33 3.07 4.68 2.59 12.53 100.00All India 56.98 8.03 5.89 3.59 5.40 3.46 16.65 100.00
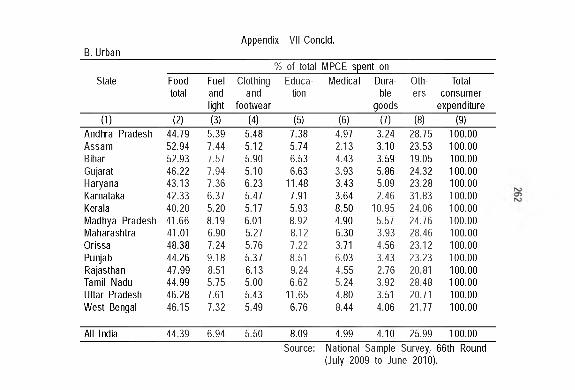
B. UrbanAppendix Vll-C oncld .
% of total MPCE spent onState Food Fuel Clothing Educa Medical Dura Oth Total
total and and tion ble ers consumerlight footwear goods expenditure
(1) (2) (3) (4) (5) (6) (7) (8) (9)Andhra Pradesh 44.79 5.39 5.48 7.38 4.97 3.24 28.75 100.00Assam 52.94 7.44 5.12 5.74 2.13 3.10 23.53 100.00Bihar 52.93 7.57 5.90 6.53 4.43 3.59 19.05 100.00Gujarat 46.22 7.94 5.10 6.63 3.93 5.86 24.32 100.00Haryana 43.13 7.36 6.23 11.48 3.43 5.09 23.28 100.00Karnataka 42.33 6.37 5.47 7.91 3.64 2.46 31.83 100.00Kerala 40.20 5.20 5.17 5.93 8.50 10.95 24.06 100.00Madhya Pradesh 41.66 8.19 6.01 8.92 4.90 5.57 24.76 100.00Maharashtra 41.01 6.90 5.27 8.12 6.30 3.93 28.46 100.00Orissa 48.38 7.24 5.76 7.22 3.71 4.56 23.12 100.00Punjab 44.26 9.18 5.37 8.51 6.03 3.43 23.23 100.00Rajasthan 47.99 8.51 6.13 9.24 4.55 2.76 20.81 100.00Tamil Nadu 44.99 5.75 5.00 6.62 5.24 3.92 28.48 100.00Uttar Pradesh 46.28 7.61 5.43 11.65 4.80 3.51 20.71 100.00West Bengal 46.15 7.32 5.49 6.76 8.44 4.06 21.77 100.00
All India 44.39 6.94 5.50 8.09 4.99 4.10 25.99 100.00Source: National Sample Survey, 66th Round
(July 2009 to June 2010).
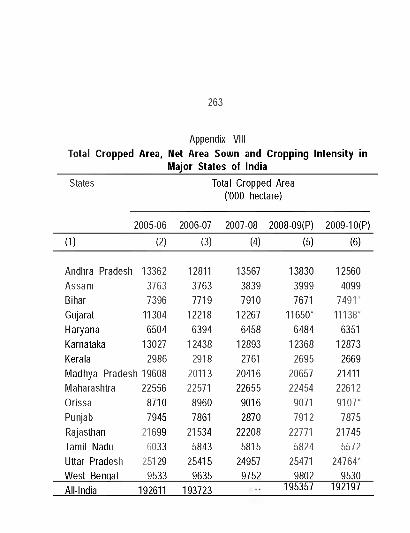
263
Total Cropped Area, Net Area Sown and Cropping Intensity in _______________________Major States of India_______________________
Appendix VIII
States
(1)
Total Cropped Area ('000 hectare)
2005-06 2006-07 2007-08 2008-09(P) 2009-10(P)
(2) (3) (4) (5) (6)
Andhra Pradesh 13362 12811 13567 13830 12560Assam 3763 3763 3839 3999 4099Bihar 7396 7719 7910 7671 7491’Gujarat 11304 12218 12267 11650’ 11138’Haryana 6504 6394 6458 6484 6351Karnataka 13027 12438 12893 12368 12873Kerala 2986 2918 2761 2695 2669Madhya Pradesh 19608 20113 20416 20657 21411Maharashtra 22556 22571 22655 22454 22612Orissa 8710 8960 9016 9071 9107’Punjab 7945 7861 2870 7912 7875Rajasthan 21699 21534 22208 22771 21745Tamil Nadu 6033 5843 5815 5824 5572Uttar Pradesh 25129 25415 24957 25471 24764’West Benaal 9533 9635 9752 9802 9530All-India 192611 193723 195357 192197
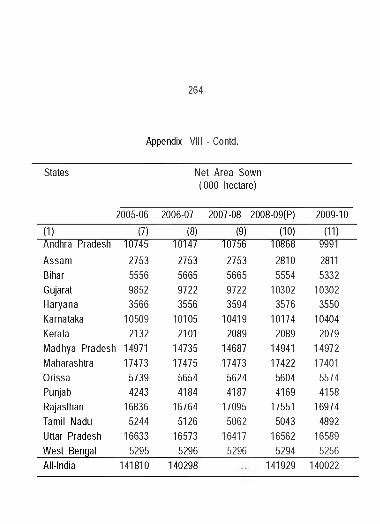
264
Appendix VIII - Contd.
States Net Area Sown ('000 hectare)
2005-06 2006-07 2007-08 2008-09(P) 2009-10
(1) (7) (8) (9) (10) (11)Andhra Pradesh 10745 10147 10756 10868 9991Assam 2753 2753 2753 2810 2811Bihar 5556 5665 5665 5554 5332Gujarat 9852 9722 9722 10302 10302Haryana 3566 3556 3594 3576 3550Karnataka 10509 10105 10419 10174 10404Kerala 2132 2101 2089 2089 2079Madhya Pradesh 14971 14735 14687 14941 14972Maharashtra 17473 17475 17473 17422 17401Orissa 5739 5654 5624 5604 5574Punjab 4243 4184 4187 4169 4158Rajasthan 16836 16764 17095 17551 16974Tamil Nadu 5244 5126 5062 5043 4892Uttar Pradesh 16633 16573 16417 16562 16589West Bengal 5295 5296 5296 5294 5256All-India 141810 140298 141929 140022
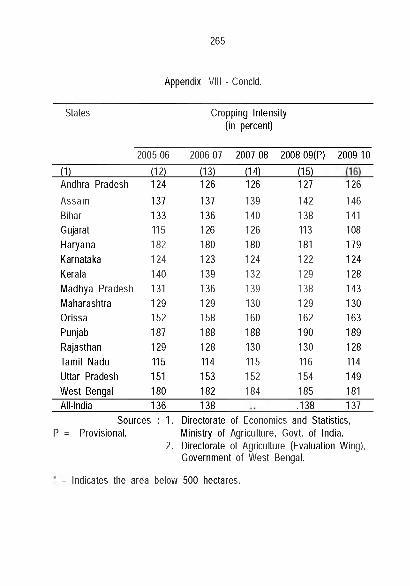
265
Appendix VIII - Concld.
States Cropping Intensity (in percent)
2005-06 2006-07 2007-08 2008-09(P) 2009-10
J I L J 1 2 L J13)______ Q 4 L i i a .Andhra PradeshAssamBiharGujaratHaryanaKarnatakaKeralaMadhya Pradesh Maharashtra Orissa Punjab Rajasthan Tamil Nadu Uttar Pradesh West Bengal
124137133115182124140131129152187129115151180
126137136126180123139136129158188128114153182
126139140 126 180 124 132 139 130 160 188 130 115 152 184
127142138113181122129138129 162 190130 116 154 185
126146141108179124128143130163189128114149181
All-India 136 138 .138 137Sources : 1.
P = Provisional.2.
Directorate of Economics and Statistics, Ministry of Agriculture, Govt, of India. Directorate of Agriculture (Evaluation Wing), Government of West Bengal.
= Indicates the area below 500 hectares.
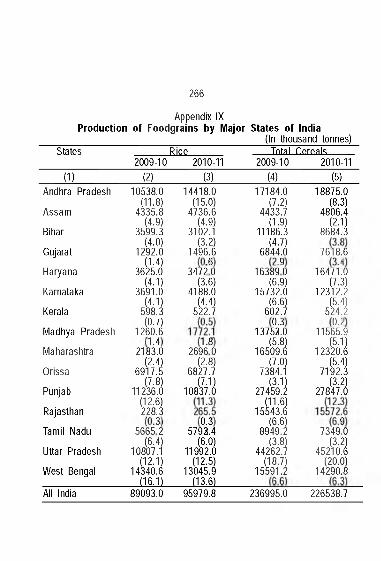
266
Appendix IXProduction of Foodgrains by Major States of India
(In thousand tonnes)States
2009-10Rice
2010-11T o ta l C e r e a ls
2009-10 2010-11(1) (2) (3) (4) (5)
Andhra Pradesh
Assam
Bihar
Gujarat
Haryana
Karnataka
Kerala
Madhya Pradesh
Maharashtra
Orissa
Punjab
Rajasthan
Tamil Nadu
Uttar Pradesh
West Bengal
10538.0(11.8)
4335.8(4.9)
3599.3(4.0)
1292.0(1.4)
3625.0(4.1)
3691.0(4.1)
598.3
12<6V^
21sY o(2.4)
6917.5(7.8)
11236.0
<2\¥1
5665^2(6.4)
10807.1(12.1)
14340.6(16.1)
14418.0(15.0)
4736.6(4.9)
3102.1
14<9¥^
3472^0(3.6)
4188.0(4.4)
522.7
2696^0(2.8)
6821.1(7.1)
10837.0
57 9^4(6.0)
11992.0(12.5)
13045.9(13.6)
17184.0(7.2)
4433.7(1.9)
11186.3
68<4V^
16389^0(6.9)
15732.0 (6.6)
602.7
1375^0(5.8)
16509.6(7.0)
7384.1(3.1)
27459.2 (11.6)
15543.6 (6.6)
8949.2(3.8)
44262.7(18.7)
15591.2 ____
18875.0(8.3)
4806.4(2.1)
8684.3
7 6 m 6
16471'!o(7.3)
12312.2(5.4)
524.2
1156¥9(5.1)
12320.6(5.4)
7192.3(3.2)
27847.0
7349^0(3.2)
45210.6(20.0)
14290.8____
All India 89093.0 95979.8 236995.0 226538.7
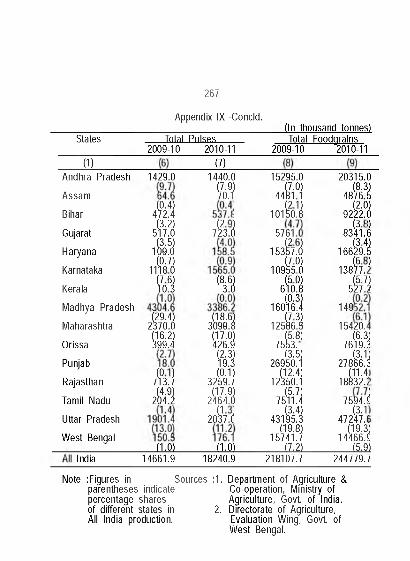
267
Appendix IX -Concld.(In thousand tonnes)
States Total Pulses20 09-10 2010-11 2009-10
Total Foodgralns2010-11
(1) (7)Andhra Pradesh
Assam
Bihar
Gujarat
Haryana
Karnataka
Kerala
Madhya Pradesh
Maharashtra
Orissa
Punjab
Rajasthan
Tamil Nadu
Uttar Pradesh
West Bengal
1429.0
m5*i¥ ( ]
li)¥ ^
11%^^
?0^i
[29.4]2370.0
? 9 ¥ i
7 ? l ]
2i)V]
i u i
C7-9J Q70.1 448
1440.0 (7.9 70.
7?1(]
(8.6J3.0
m(17.0J426.912-3)19.3(0.1)
3259.7(17.9)
2A& A .6
2o5 7 I
i u i
15295.0
4 4 ^ " ]
lO l i ) ^ ^
576
153?L(]
109^5°^
6^0“^
1 6 0 ? d
125^^6^^[5.8
7553.(3.5
269M .'02 .4
12350.'
75*i¥ ^
4 3 l i ¥ ] (19.8j
15741.7 J L 2 1
20315.0
48%^^(2.0)
9222.6
8 3 ? r^
166?g!'^
138?L^
149
5^7^]
15420,(6.3
7619.;(3.1
27866.;(11.4
1 8 ^ 2 . ;
7594.5 (3.1
47247.f (19.3
14466.5 J 5 J 1
India 14661.9 18240.9 218107.7 244779.7
Note : Figures in Sources :1. Department of Agriculture &parentheses indicate Co-operation, Mmistry ofpercentage shares Agriculture, Govt, of India,of different states in 2. Directorate of Agriculture,All India production. Evaluation Wing, Govt, of
West Bengal.
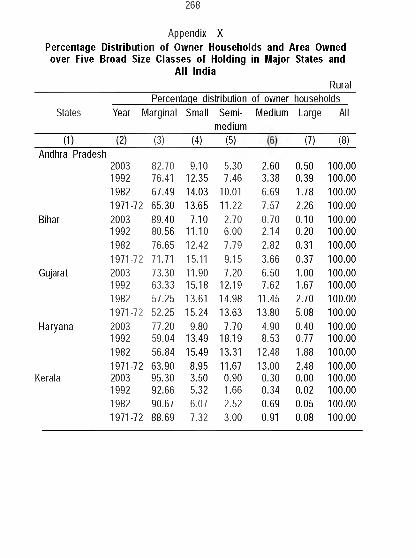
268
Percentage Distribution of Owner Households and Area Owned over Five Broad Size Classes of Holding in Major States and
All IndiaRural
A ppendix X
Percentage distribution of owner householdsStates Year Marginal Small Semi
mediumMedium Large All
(1) (2) (3) (4) (5) (7) (8)Andhra Pradesh
Bihar
Gujarat
Haryana
Kerala
20031992198219712003199219821971200319921982197120031992198219712003199219821971
-72
-72
-72
-72
-72
82.70 76.41 67.4965.30 89.40 80.5676.6571.7173.30 63.3357.2552.25 77.20 59.04 56.84 63.9095.3092.6690.67 88.69
9.10 12.35 14.03 13.65
7.10 11.10 12.42 15.11 11.90 15.18 13.61 15.24
9.8013.4915.49 8.95 3.505.32 6.077.32
5.307.46
10.0111.222.70 6.00 7.79 9.15 7.20
12.19 14.98 13.63
7.7018.19 13.31 11.670.901.662.523.00
2.603.386.697.570.702.142.823.666.507.62
11.4513.80
4.908.53
12.4813.00
0.300.340.690.91
0.500.391.782.260.100.200.310.371.001.672.705.080.400.771.882.480.000.020.050.08
100.00100.00100.00100.00100.00100.00100.00100.00100.00100.00100.00100.00100.00100.00100.00100.00100.00100.00100.00100.00
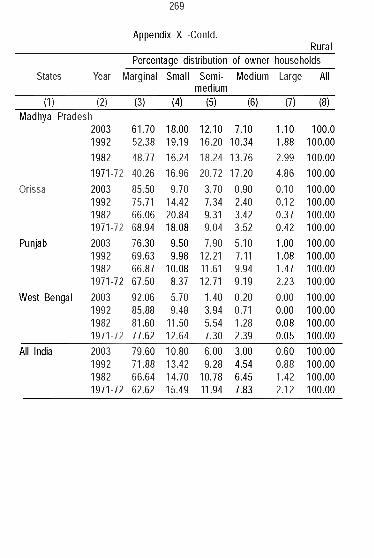
269
Appendix X -Contd.Rural
Percentage distribution of owner householdsStates Year Marginal Small Semi Medium Large All
medium(1) (2) (3) (4) (5) (6) (7) (8)
Madhya Pradesh2003 61.70 18.00 12.10 7.10 1.10 100.01992 52.38 19.19 16.20 10.34 1.88 100.001982 48.77 16.24 18.24 13.76 2.99 100.001971-72 40.26 16.96 20.72 17.20 4.86 100.00
Orissa 2003 85.50 9.70 3.70 0.90 0.10 100.001992 75.71 14.42 7.34 2.40 0.12 100.001982 66.06 20.84 9.31 3.42 0.37 100.001971-72 68.94 18.08 9.04 3.52 0.42 100.00
Punjab 2003 76.30 9.50 7.90 5.10 1.00 100.001992 69.63 9.98 12.21 7.11 1.08 100.001982 66.87 10.08 11.61 9.94 1.47 100.001971-72 67.50 8.37 12.71 9.19 2.23 100.00
West Bengal 2003 92.06 5.70 1.40 0.20 0.00 100.001992 85.88 9.48 3.94 0.71 0.00 100.001982 81.60 11.50 5.54 1.28 0.08 100.001971-72 77.62 12.64 7.30 2.39 0.05 100.00
All India 2003 79.60 10.80 6.00 3.00 0.60 100.001992 71.88 13.42 9.28 4.54 0.88 100.001982 66.64 14.70 10.78 6.45 1.42 100.001971-72 62.62 15.49 11.94 7.83 2.12 100.00
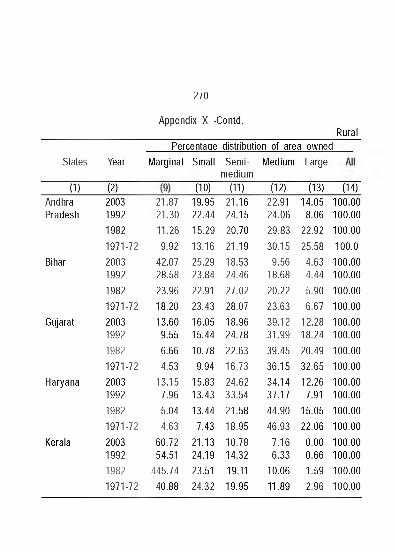
270
Appendix X -Contd.Rural
Percentage distribution of area ownedStates Year iViarginal Small Semi
mediumMedium Large
(1) (2) (10) (11) (12) (13) (14)AndhraPradesh
Bihar
Gujarat
Haryana
Kerala
2003199219821971-722003199219821971-722003199219821971-722003199219821971-722003199219821971-72
21.87 21.30 11.26 9.92
42.0728.5823.9618.2013.60
9.556.664.53
13.157.965.044.63
60.7254.51
445.7440.88
19.9522.4415.29 13.1625.29 23.84 22.9123.43 16.0515.44 10.78
9.9415.8313.4313.44
7.4321.1324.1923.5124.32
21.1624.1520.7021.1918.53 24.46 27.02 28.07 18.9624.78 22.63 16.73 24.6233.54 21.5818.9510.78 14.32 19.1119.95
22.9124.06 29.8330.15
9.5618.6820.2223.6339.1231.9939.4536.15 34.14 37.17 44.90 46.93
7.166.33
10.06 11.89
14.05 8.06
22.9225.584.634.445.90 6.67
12.2818.2420.4932.6512.26
7.9115.0522.06
0.00 0.66 1.59 2.96
100.00100.00100.00100.0
100.00100.00100.00100.00100.00100.00100.00100.00100.00100.00100.00100.00100.00100.00100.00100.00
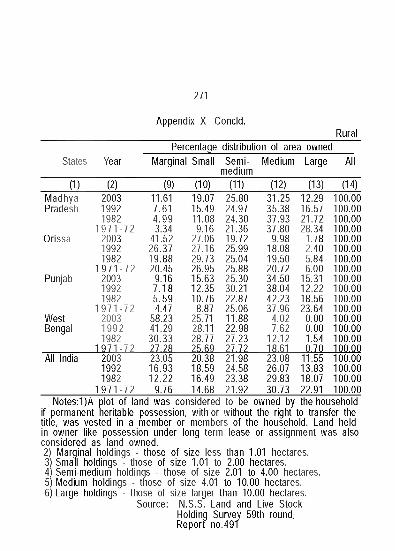
271
A ppendix X -Concld.Rural
States YearPercentage distribution of area owned
iViarginal Small Semimedium
Medium Large All
(1) (2) (9) (10) (11) (12) (13) (14)Madhya 2003 11.61 19.07 25.80 31.25 12.29 100.00Pradesh 1992 7.61 15.49 24.97 35.38 16.57 100.00
1982 4.99 11.08 24.30 37.93 21.72 100.001 9 7 1 -7 2 3.34 9.16 21.36 37.80 28.34 100.00
Orissa 2003 41.52 27.06 19.72 9.98 1.78 100.001992 26.37 27.16 25.99 18.08 2.40 100.001982 19.88 29.73 25.04 19.50 5.84 100.00
1 9 7 1 -7 2 20.45 26.95 25.88 20.72 6.00 100.00Punjab 2003 9.16 15.63 25.30 34.50 15.31 100.00
1992 7.18 12.35 30.21 38.04 12.22 100.001982 5.59 10.76 22.87 42.23 18.56 100.00
1 9 7 1 -7 2 4.47 8.87 25.06 37.96 23.64 100.00West 2003 58.23 25.71 11.88 4.02 0.00 100.00Bengal 1992 41.29 28.11 22.98 7.62 0.00 100.00
1982 30.33 28.77 27.23 12.12 1.54 100.001 9 7 1 -7 2 27.28 25.69 27.72 18.61 0.70 100.00
All India 2003 23.05 20.38 21.98 23.08 11.55 100.001992 16.93 18.59 24.58 26.07 13.83 100.001982 12.22 16.49 23.38 29.83 18.07 100.00
1 9 7 1 -7 2 9.76 14.68 21.92 30.73 22.91 100.00Notes:1)A plot of land was considered to be owned by the household
if permanent heritable possession, with or without the right to transfer the title, was vested in a member or members of the household. Land held in owner like possession under long term lease or assignment was also considered as land owned.2) Marginal holdings - those of size less than 1.01 hectares.3) Small holdings - those of size 1.01 to 2.00 hectares.4) Semi-medium holdings - those of size 2.01 to 4.00 hectares.5) Medium holdings - those of size 4.01 to 10.00 hectares.6) Large holdings - those of size larger than 10.00 hectares.
Source: N.S.S. Land and Live Stock Holding Survey 59th round.Report no.491
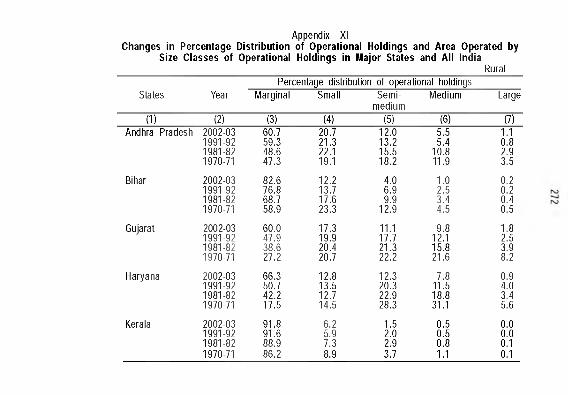
Appendix XIChanges in Percentage Distribution of Operational Holdings and Area Operated by
Size Classes of Operational Holdings in Major States and All IndiaRural
States YearPercentage distribution of operational holdings
Marginal Small Semimedium
Medium Large
(1) (2) (3) (4) (5) (6) (7)Andhra Pradesh 2002-03 60.7 20.7 12.0 5.5 1.1
1991-92 59.3 21.3 13.2 5.4 0.81981-82 48.6 22.1 15.5 10.8 2.91970-71 47.3 19.1 18.2 11.9 3.5
Bihar 2002-03 82.6 12.2 4.0 1.0 0.21991-92 76.8 13.7 6.9 2.5 0.21981-82 68.7 17.6 9.9 3.4 0.41970-71 58.9 23.3 12.9 4.5 0.5
Gujarat 2002-03 60.0 17.3 11.1 9.8 1.81991-92 47.9 19.9 17.7 12.1 2.51981-82 38.6 20.4 21.3 15.8 3.91970-71 27.2 20.7 22.2 21.6 8.2
Haryana 2002-03 66.3 12.8 12.3 7.8 0.91991-92 50.7 13.5 20.3 11.5 4.01981-82 42.2 12.7 22.9 18.8 3.41970-71 17.5 14.5 28.3 31.1 5.6
Kerala 2002-03 91.8 6.2 1.5 0.5 0.01991-92 91.6 5.9 2.0 0.5 0.01981-82 88.9 7.3 2.9 0.8 0.11970-71 86.2 8.9 3.7 1.1 0.1
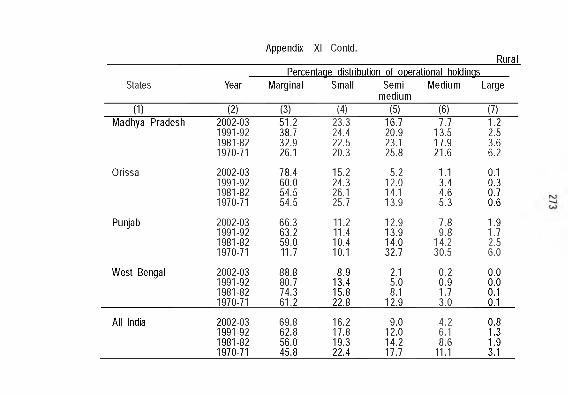
Appendix XI -Contd.Rural
StatesPercentaae distribution of ooerational holdinas
Year Marginal Small Semimedium
Medium Large
(1) (2) (3) (4) (5) (6) (7)Madhya Pradesh 2002-03 51.2 23.3 16.7 7.7 1.2
1991-92 38.7 24.4 20.9 13.5 2.51981-82 32.9 22.5 23.1 17.9 3.61970-71 26.1 20.3 25.8 21.6 6.2
Orissa 2002-03 78.4 15.2 5.2 1.1 0.11991-92 60.0 24.3 12.0 3.4 0.31981-82 54.5 26.1 14.1 4.6 0.71970-71 54.5 25.7 13.9 5.3 0.6
Punjab 2002-03 66.3 11.2 12.9 7.8 1.91991-92 63.2 11.4 13.9 9.8 1.71981-82 59.0 10.4 14.0 14.2 2.51970-71 11.7 10.1 32.7 30.5 6.0
West Bengal 2002-03 88.8 8.9 2.1 0.2 0.01991-92 80.7 13.4 5.0 0.9 0.01981-82 74.3 15.8 8.1 1.7 0.11970-71 61.2 22.8 12.9 3.0 0.1
All India 2002-03 69.8 16.2 9.0 4.2 0.81991-92 62.8 17.8 12.0 6.1 1.31981-82 56.0 19.3 14.2 8.6 1.91970-71 45.8 22.4 17.7 11.1 3.1
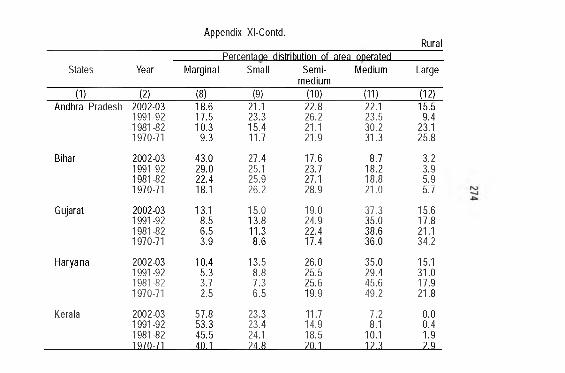
Appendix Xl-Contd.Rural
StatesPercentaae distribution of area operated
Year Marginal Small Semimedium
Medium Large
(1) (2) (8) (9) (10) (11) (12)Andhra Pradesh 2002-03 18.6 21.1 22.8 22.1 15.5
1991-92 17.5 23.3 26.2 23.5 9.41981-82 10.3 15.4 21.1 30.2 23.11970-71 9.3 11.7 21.9 31.3 25.8
Bihar 2002-03 43.0 27.4 17.6 8.7 3.21991-92 29.0 25.1 23.7 18.2 3.91981-82 22.4 25.9 27.1 18.8 5.91970-71 18.1 26.2 28.9 21.0 5.7
Gujarat 2002-03 13.1 15.0 19.0 37.3 15.61991-92 8.5 13.8 24.9 35.0 17.81981-82 6.5 11.3 22.4 38.6 21.11970-71 3.9 8.6 17.4 36.0 34.2
Haryana 2002-03 10.4 13.5 26.0 35.0 15.11991-92 5.3 8.8 25.5 29.4 31.01981-82 3.7 7.3 25.6 45.6 17.91970-71 2.5 6.5 19.9 49.2 21.8
Kerala 2002-03 57.8 23.3 11.7 7.2 0.01991-92 53.3 23.4 14.9 8.1 0.41981-82 45.5 24.1 18.5 10.1 1.91970-71 40,1 24,8 20,1 12,3 2,9
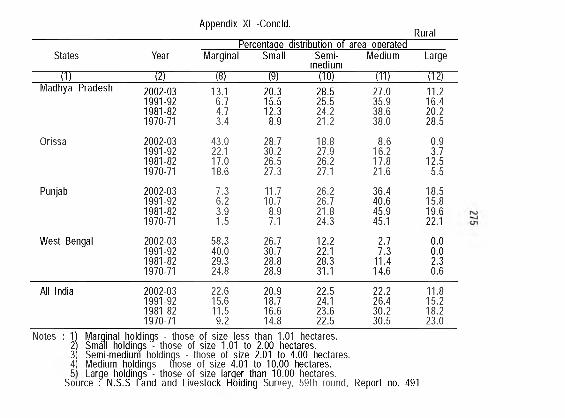
Appendix XI -Concld.Rural
States YearPercentaae distribution of area ooerated
Marginal Small Semimedium
Medium Large
(1) (2) («) (9) (10) (11) (12)Madhya Pradesh 2002-03 13.1 20.3 28.5 27.0 11.2
1991-92 6.7 15.5 25.5 35.9 16.41981-82 4.7 12.3 24.2 38.6 20.21970-71 3.4 8.9 21.2 38.0 28.5
Orissa 2002-03 43.0 28.7 18.8 8.6 0.91991-92 22.1 30.2 27.9 16.2 3.71981-82 17.0 26.5 26.2 17.8 12.51970-71 18.6 27.3 27.1 21.6 5.5
Punjab 2002-03 7.3 11.7 26.2 36.4 18.51991-92 6.2 10.7 26.7 40.6 15.81981-82 3.9 8.9 21.8 45.9 19.61970-71 1.5 7.1 24.3 45.1 22.1
West Bengal 2002-03 58.3 26.7 12.2 2.7 0.01991-92 40.0 30.7 22.1 7.3 0.01981-82 29.3 28.8 28.3 11.4 2.31970-71 24.8 28.9 31.1 14.6 0.6
All India 2002-031991-921981-821970-71
22.615.611.59.2
20.918.7 16.614.8
22.5 24.123.6 22.5
22.226.4 30.230.5
11.815.218.2 23.0
Notes : 1) Marginal holdings - those of size less than 1.01 hectares.2) Small holdings - those of size 1.01 to 2.00 hectares.3 Semi-medium holdings - those of size 2.01 to 4.00 hectares.4 Medium holdings - those of size 4.01 to 10.00 hectares.5 Large holdings - those of size larger than 10.00 hectares.
Source : N.S.S Land and Livestock Koiding Survey, 59th round, Report no. 491
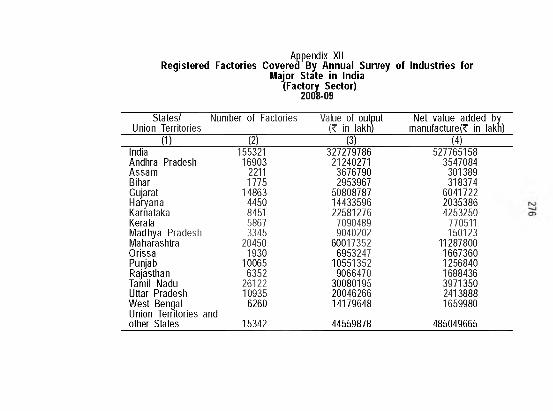
Appendix XIIRegistered Factories Covered By Annual Survey of Industries for
Major State in India (Factory Sector)
2008-09
States/ Union Territories
Number of Factories Value of output (? in lakh)
Net value added by manufacture(? in lakh)
(1) (2) (3) (4)India 155321 327279786 527765158Andhra Pradesh 16903 21240271 3547084Assam 2211 3676790 301389Bihar 1775 2953967 318374Gujarat 14863 50808787 6041722Haryana 4450 14433596 2035386Karnataka 8451 22581276 4253250Kerala 5867 7090489 770511Madhya Pradesh 3345 9040202 150123Maharashtra 20450 60017352 11287800Orissa 1930 6953247 1667360Punjab 10065 10551352 1256840Rajasthan 6352 9066470 1688436Tamil Nadu 26122 30080195 3971350Uttar Pradesh 10935 20046266 2413888West Bengal 6260 Union Territories and
14179648 1659980
other States 15342 44559878 485049665
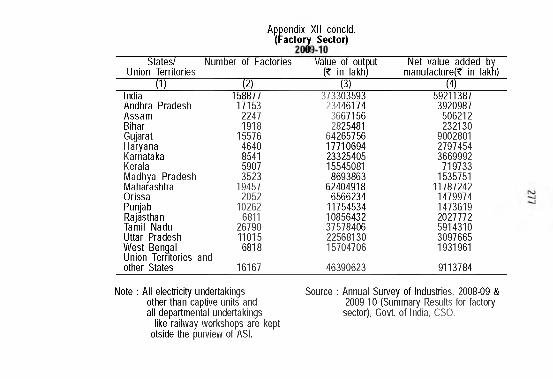
Appendix XII concld. (Fac to ry Sector)
States/ Union Territories
(1)
Number of Factories Value of output (? in lakh)
(3)
Net value added by manufacture(? in lakfi)
(4)~ WIndiaAndhra PradeshAssamBiharGujaratHaryanaKarnatakaKeralaMadhya Pradesh Maharashtra Orissa Punjab Rajasthan Tamil Nadu Uttar Pradesh West Bengal Union Territories other States
and
15887717153
22471918
155764640854159073523
194572052
102626811
26790110156818
16167
37330359323446174
36671562825481
64265756177106942332540515545081
869386362404918
65662341175453410856432375784062256813015704706
46390623
592113873920987
506212232130
900280127974543669992
7197331535751
11787242147997414736192027772591431030976651931961
9113784
Note : All electricity undertakings other than captive units and all departmental undertakings
like railway workshops are kept otside the purview of ASI.
Source : Annual Survey of Industries, 2008-09 & 2009-10 (Summary Results for factory
sector), Govt, of India, CSO.
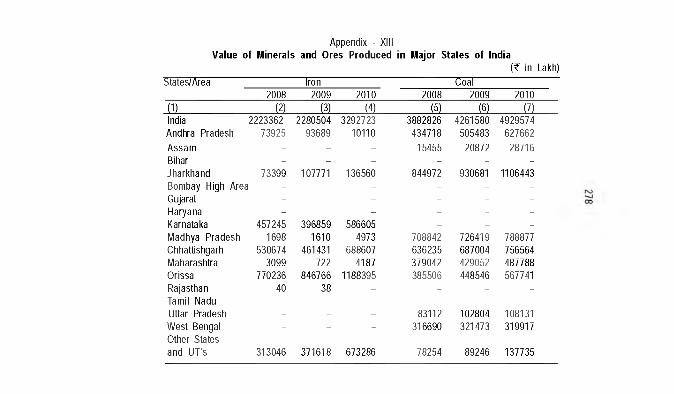
Appendix - XIIIValue of Minerals and Ores Produced in Major States of India
(? in Lakh)States/Area Iron Coal
2008 2009 2010 2008 2009 2010(1) (2) (3) (4) (5) (6) (7)India 2223362 2280504 3292723 3882826 4261580 4929574Andhra Pradesh 73925 93689 10110 434718 505483 627662Assam - - - 15455 20872 28716Bihar - - - - - -
Jharkhand 73399 107771 136560 844972 930681 1106443Bombay High Area - - - - -
Gujarat - - - - -
Haryana - - - - -
Karnataka 457245 396859 586605 - - -
Madhya Pradesh 1698 1610 4973 708842 726419 788877Chhattishgarh 530674 461431 688607 636235 687004 756564Maharashtra 3099 722 4187 379042 429052 487788Orissa 770236 846766 1188395 385506 448546 567741Rajasthan 40 38 - - - -
Tamil Nadu - - - - - -
Uttar Pradesh - - - 83112 102804 108131West Bengal Other States
- - - 316690 321473 319917
and UT's 313046 371618 673286 78254 89246 137735
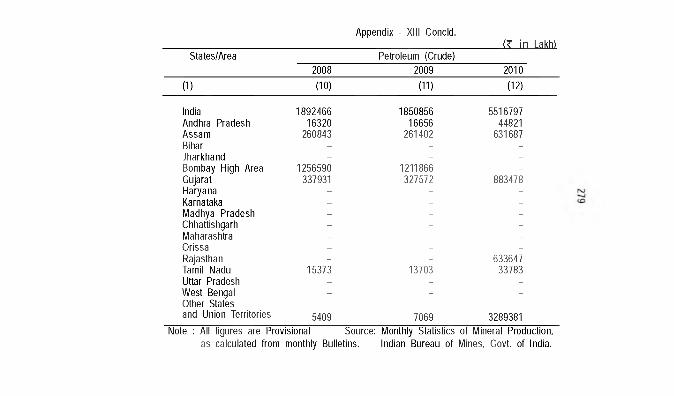
Appendix - XIII Concld.( f In la kh i
States/Area Petroleum (Crude)2008 2009 2010
(1) (10) (11) (12)
India 1892466 1850856 5516797Andhra Pradesh 16320 16656 44821Assam 260843 261402 631687Bihar _ _ _
Jharkhand - - -
Bombay High Area 1256590 1211866 -
Gujarat 337931 327572 883478Haryana - - -
Karnataka - - -
Madhya Pradesh - - -Chhattishgarh - - -
Maharashtra - - -
Orissa - - -
Rajasthan - - 633647Tamil Nadu 15373 13703 33783Uttar Pradesh - - -
West Bengal Other States
- - -
and Union Territories 5409 7069 3289381Note : All figures are Provisional Source: Monthly Statistics of Mineral Production,
as calculated from monthly Bulletins. Indian Bureau of Mines, Govt, of India.
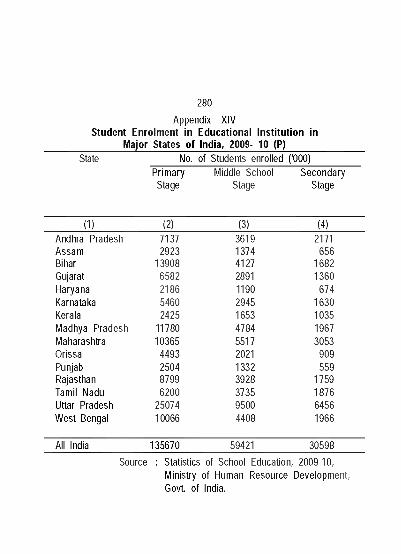
280
Appendix XIV Student Enrolment in Educational Institution in
Major States of India, 2009- 10 (P)State No. of Students enrolled ('000)
PrimaryStage
Middle School Stage
SecondaryStage
(1) (2) (3) (4)Andhra Pradesh 7137 3619 2171Assam 2923 1374 656Bihar 13908 4127 1682Gujarat 6582 2891 1360Haryana 2186 1190 674Karnataka 5460 2945 1630Kerala 2425 1653 1035Madhya Pradesh 11780 4784 1967Maharashtra 10365 5517 3053Orissa 4493 2021 909Punjab 2504 1332 559Rajasthan 8799 3928 1759Tamil Nadu 6200 3735 1876Uttar Pradesh 25074 9500 6456West Bengal 10066 4408 1966
All India 135670 59421 30598Source : Statistics of School Education, 2009-10,
IVIinistry of Human Resource Development, Govt, of India.
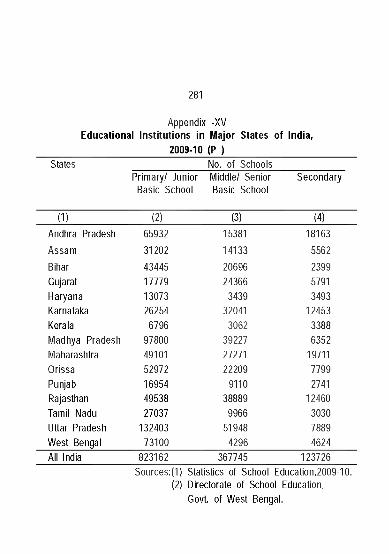
281
Appendix -XV Educational Institutions in Major States of India,
2009-10 (P )States No. of Schools
Primary/ Junior Basic School
Middle/ Senior Basic School
Secondary
(1) (2) (3) (4)Andhra PradeshAssamBiharGujaratHaryanaKarnatakaKeralaMadhya Pradesh Maharashtra Orissa Punjab Rajasthan Tamil Nadu Uttar Pradesh West Bengal
6593231202434451777913073262546796
978004910152972169544953827037
13240373100
15381141332069624366
343932041
3062392272727122209
911038889
996651948
4296
181635562239957913493
1245333886352
1971177992741
12460303078894624
All India 823162 367745 123726Sources:(1) Statistics of School Education,2009-10.
(2) Directorate of School Education,Govt, of West Bengal.
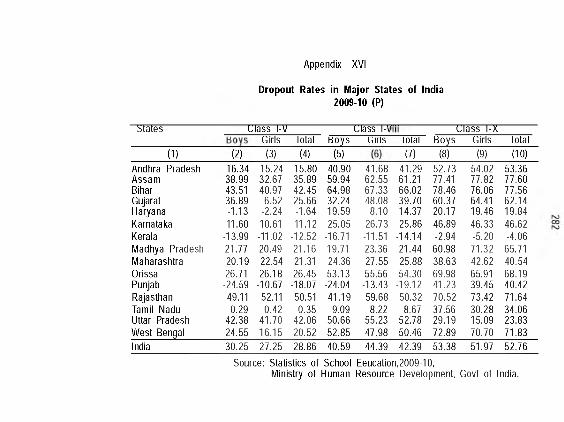
Dropout Rates in Major States of India2009-10 (P)
Appendix XVI
btates Class l-V-------------------------Class l-VGirls Total Boys G irls"
C lass l-X~ Boys Girlslotal Total
(1) (2) (3) (4) (5) (7) (8) (9) (10)Andhra PradeshAssamBiharGujaratHaryanaKarnatakaKeralaMadhya Pradesh Maharashtra Orissa Punjab Rajasthan Tamil Nadu Uttar Pradesh West Bengal
16.34 15.24 15.80 40.90 41.68 41.29 52.73 54.02 53.3638.99 32.67 35.89 59.94 62.55 61.21 77.41 77.82 77.6043.51 40.97 42.45 64.98 67.33 66.02 78.46 76.06 77.5636.89 6.52 25.66 32.24 48.08 39.70 60.37 64.41 62.14-1.13 -2.24 -1.64 19.59 8.10 14.37 20.17 19.46 19.8411.60 10.61 11.12 25.05 26.73 25.86 46.89 46.33 46.62
-13.99 -11.02 -12.52 -16.71 -11.51 -14.14 -2.94 -5.20 -4.0621.77 20.49 21.16 19.71 23.36 21.44 60.98 71.32 65.7120.19 22.54 21.31 24.36 27.55 25.88 38.63 42.62 40.5426.71 26.18 26.45 53.13 55.56 54.30 69.98 65.91 68.19-24.59 -10.67 -18.07 -24.04 -13.43 -19.12 41.23 39.45 40.4249.11 52.11 50.51 41.19 59.68 50.32 70.52 73.42 71.640.29 0.42 0.35 9.09 8.22 8.67 37.56 30.28 34.06
42.38 41.70 42.06 50.66 55.23 52.78 29.19 15.09 23.8324.55 16.15 20.52 52.85 47.98 50.46 72.89 70.70 71.83
India 30.25 27.25 28.86 40.59 44.39 42.39 53.38 51.97 52.76Source: Statistics of School Eeucation,2009-10,
Ministry of Human Resource Development, Govt of India.
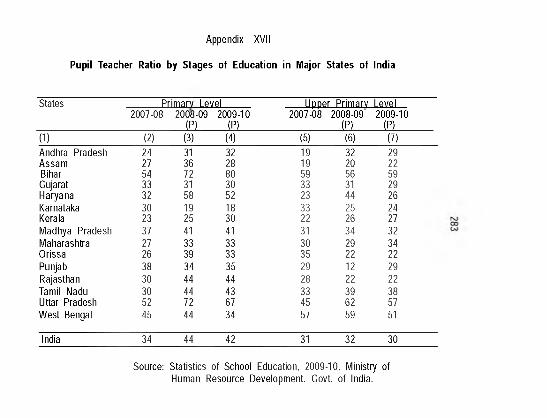
Appendix XVII
Pupil Teacher Ratio by Stages of Education in Major States of India
States Primarv Level lipp er Primarv Level2007-08 2008-09
(P)2009-10
(P)2007-08 2008-09
(P)2009-10
(P)(1) (2) (3) (4) (5) (6) (7)Andhra Pradesh 24 31 32 19 32 29Assam 27 36 28 19 20 22Bihar 54 72 80 59 56 59Gujarat 33 31 30 33 31 29Haryana 32 58 52 23 44 26Karnataka 30 19 18 33 25 24Kerala 23 25 30 22 26 27Madhya Pradesh 37 41 41 31 34 32Maharashtra 27 33 33 30 29 34Orissa 26 39 33 35 22 22Punjab 38 34 35 29 12 29Rajasthan 30 44 44 28 22 22Tamil Nadu 30 44 43 33 39 38Uttar Pradesh 52 72 67 45 62 57West Bengal 45 44 34 57 59 51
India 34 44 42 31 32 30
Source: Statistics of School Education, 2009-10, Ministry of Human Resource Development. Govt, of India.
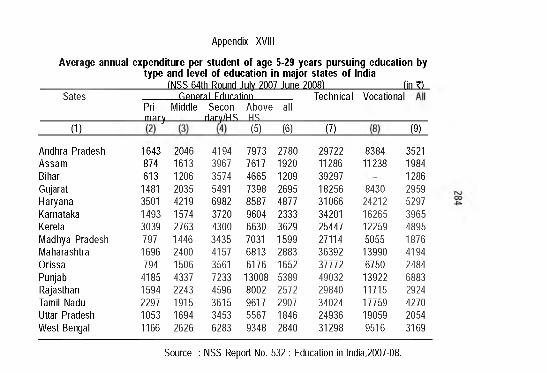
Average annual expenditure per student of age 5-29 years pursuing education by type and level of education in major states of India
; 64th Round July 2007-June :
Appendix XVIII
(NSSI I 20081 (in ?)Sates General Fdiinatlnn Technical Vocational
Pri- Middle Secon- mary________ riary/HSirWH
Above JJS____
all
(1) (5)____ (6) (7) (9)
Andhra PradeshAssamBiharGujaratHaryanaKarnatakaKerelaMadhya Pradesh Maharashtra Orissa Punjab Rajasthan Tamil Nadu Uttar Pradesh West Bengal
1643874613
14813501149330397971696794
41851594229710531166
204616131206203542191574276314462400150643372243191516942626
419439673574549169823720430034354157356172334596361534536283
7973761746657398858796046630703168136176
130088002961755679348
278019201209269548772333362915992883165253892572290718462840
297221128639297182563106634201254472711436392377724903229840340242493631298
838411238
84302421216265122595055
139906750
139221171517759190599516
352119841286295952973965489518764194248468832924427020543169
Source : NSS Report No. 532 : Education in India,2007-08.
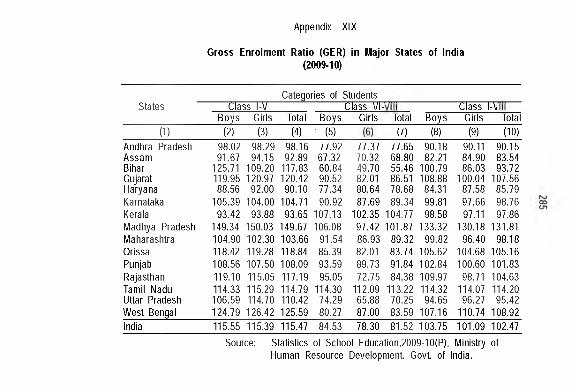
Gross Enrolment Ratio (GER) in Major States of India (2009-10)
Appendix X IX
States
(1)
Class l-VCategories of Students
Class VI-' Class l-\yBoys Girls Total Boys Girls Total Boys Girls Total
(2) (3) (4) (5) (7) (8) (9) (10)Andhra Pradesh 98.02 98.29 98.16 77.92 77.37 77.65 90.18 90.11 90.15Assam 91.67 94.15 92.89 67.32 70.32 68.80 82.21 84.90 83.54Bihar 125.71 109.20 117.83 60.84 49.70 55.46 100.79 86.03 93.72Gujarat 119.95 120.97 120.42 90.52 82.01 86.51 108.88 100.04 107.56Haryana 88.56 92.00 90.10 77.34 80.64 78.68 84.31 87.58 85.79Karnataka 105.39 104.00 104.71 90.92 87.69 89.34 99.81 97.66 98.76Kerala 93.42 93.88 93.65 107.13 102.35 104.77 98.58 97.11 97.86Madhya Pradesh 149.34 150.03 149.67 106.08 97.42 101.87 133.32 130.18 131.81Maharashtra 104.90 102.30 103.66 91.54 86.93 89.32 99.82 96.40 98.18Orissa 118.42 119.28 118.84 85.39 82.01 83.74 105.62 104.68 105.16Punjab 108.56 107.50 108.09 93.59 89.73 91.84 102.84 100.60 101.83Rajasthan 119.10 115.05 117.19 95.05 72.75 84.38 109.97 98.71 104.63Tamil Nadu 114.33 115.29 114.79 114.30 112.09 113.22 114.32 114.07 114.20Uttar Pradesh 106.59 114.70 110.42 74.29 65.88 70.25 94.65 96.27 95.42West Bengal 124.79 126.42 125.59 80.27 87.00 83.59 107.16 110.74 108.92India 115.55 115.39 115.47 84.53 78.30 81.52 103.75 101.09 102.47
Source: Statistics of School Education,2009-10(P), Ministry of Human Resource Development. Govt, of India.
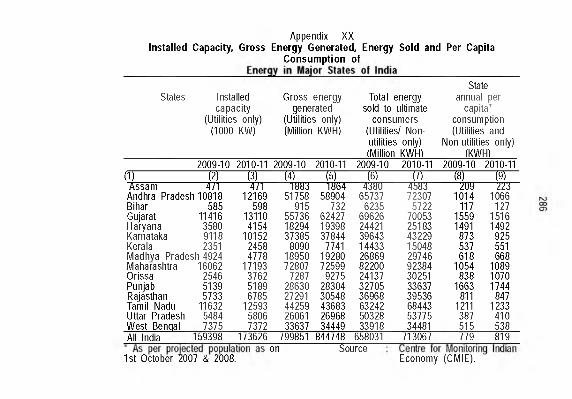
Appendix - XXInstalled Capacity, Gross Energy Generated, Energy Sold and Per Capita
Consum ption of
States Installed capacity
(Utilities only) (1000 KW)
Gross energy generated
(Utilities only) (Million KWH)
Total energy sold to ultimate
consumers (Utilities/ Nonutilities only) (Million KWH)
State annual per
capita* consumption (Utilities and
Non-utilities only) (KWH)
2009-10 2010-11 2009-10 2010-11 2009-10 2010-11 2009-10 :?010-11(1) (2) (3) (4) (b) (S) (/) («) (y)
Assam 4/1 4/1 1883 1864 4380 4583 209 ZZiAndhra Pradesh 10818 12169 51758 58904 65737 72307 1014 1066Bihar 585 598 915 732 6235 5722 117 127Gujarat 11416 13110 55736 62427 69626 70053 1559 1516Haryana 3580 4154 18294 19398 24421 25183 1491 1492Karnatal<a 9118 10152 37385 37844 39643 43229 873 925Kerala 2351 2458 8090 7741 14433 15048 537 551IVIadhva Pradesh 4924 4778 18950 19280 26869 29746 618 668IVIaharashtra 16062 17193 72807 72599 82200 92384 1054 1089Orissa 2546 3762 7287 9275 24137 30251 838 1070Punjab 5139 5189 28630 28304 32705 33637 1663 1744Rajasthan 5733 6785 27291 30548 36968 39536 811 847Tamil Nadu 11632 12593 44259 43683 63242 68443 1211 1233Uttar Pradesh 5484 5806 26061 26968 50328 53775 387 410West Bengal 7375 7372 33637 34449 33918 34481 515 538All India 159398 173626 799851 844748 658031 713067 779 819
1st October 2007 & 2008.on Source
Economy (CMIE).
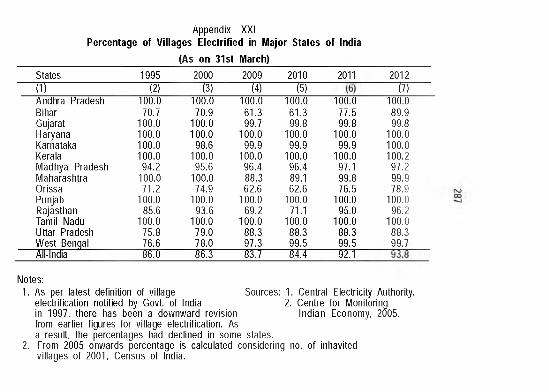
Appendix XXIPercentage of Villages Electrified in Major States of India
(As on 31st March)States
l i T1995~ W
2000i r
2009! ¥ ■
20101 5 T
2011 2012I T T
Andhra PradeshBiharGujaratHaryanaKarnatal<aKeralaMadhya Pradesh Maharashtra Orissa Punjab Rajasthan Tamil Nadu Uttar Pradesh West Bengal All-India -----------
1 T O X70.7
100.0 100.0 100.0 100.0
94.2 100.071.2
100.085.6
100.075.876.686.0
1 T O X70.9
100.0 100.0
98.6 100.0
95.6 100.074.9
100.093.6
100.079.078.0
“ 5 0 “
1 T O X61.3 99.7
100.099.9
100.096.4 88.3 62.6
100.069.2
100.088.397.3
“srr
1 T O X61.399.8
100.099.9
100.096.489.1 62.6
100.071.1
100.088.399.5
s u -
1 T O X77.599.8
100.099.9
100.097.199.876.5
100.095.0
100.088.399.5
“ 5 z r
■ m r89.999.8
100.0 100.0 100.2
97.299.978.9
100.096.2
100.088.3 99.7
Notes:1. As per latest definition of village
electrification notified by Govt, of India in 1997, there has been a downward revision from earlier figures for village electrification. As a result, the percentages had declined in some states.
2. From 2005 onwards percentage is calculated considering no. of inhavited villages of 2001, Census of India.
Sources: 1. Central Electricity Authority. 2. Centre for Monitoring
Indian Economy, 2005.
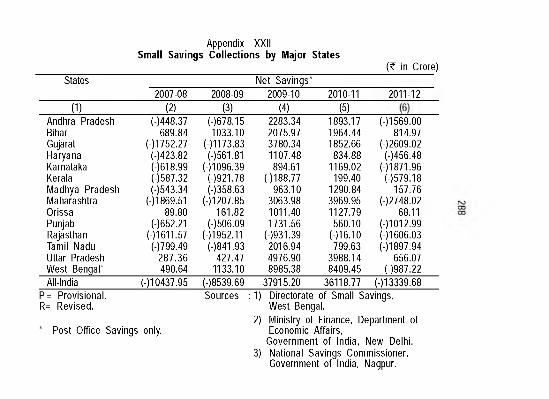
Appendix XXII Small Savings Collections by Major States
(? in Crore)States
2007-08 2008-09Net Savings*
2009-10 2010-11 2011-12(1) (2) (3) (4) (5)
Andhra PradeshBiharGujaratHaryanaKarnatakaKeralaMadhya Pradesh Maharashtra Orissa Punjab Rajasthan Tamil Nadu Uttar Pradesh West Bengal*
(-)448.37689.84
(-)1752.27(-)423.820618 .99(-)587.32(-)543.34
01869.5189.80
0652.2101611.570799 .49
287.36490.64
0678.151033.10
01173.830561.81
01096.39 0921.78 (-)358.63
0 1 207.85 161.82
(-)506.0901952.11
0841 .93 427.47
1133.10
2283.342075.973780.34 1107.48894.61
0188.77963.10
3063.98 1011.40 1731.56
0931 .392016.944976.908985.38
1893.171964.44 1852.66
834.881169.02199.40
1290.843969.951127.79560.10
01 6 .1 0 799.63
3988.148409.45
01569.00 814.97
0 2609.02 (-)456.48
01871.96 0579 .18
157.7602748.02
68.1101012.99 (-)l 606.03 01897.94
656.07 Q987.22
All-India 010437.95 08539.69 37915.20 36118.77 013339.68P= Provisional.R= Revised.
* Post Office Savings only
Sources : 1) Directorate of Small Savings,West Bengal.
2) Ministry of Finance, Department of Economic Affairs,
Government of India, New Delhi.3) National Savings Commissioner,
Government of India, Nagpur.
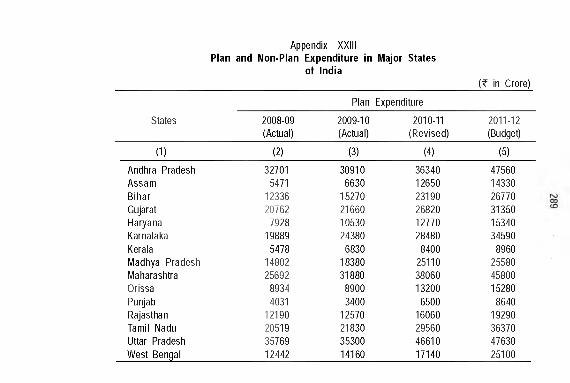
Appendix XXIII Plan and Non-Plan Expenditure in Major States
of India(? in Crore)
States
Plan Expenditure
2008-09(Actual)
2009-10(Actual)
2010-11(Revised)
2011-12(Budget)
(1) (2) (3) (4) (5)Andhra Pradesh 32701 30910 36340 47560Assam 5471 6630 12650 14330Bihar 12336 15270 23190 26770Gujarat 20762 21660 26820 31350Haryana 7928 10530 12770 15340Karnataka 19889 24380 28480 34590Kerala 5478 6830 8400 8960Madhya Pradesh 14802 18380 25110 25580Maharashtra 25692 31880 38060 45800Orissa 8934 8900 13200 15280Punjab 4031 3400 6500 8640Rajasthan 12190 12570 16060 19290Tamil Nadu 20519 21830 29560 36370Uttar Pradesh 35769 35300 46610 47630West Bengal 12442 14160 17140 25100
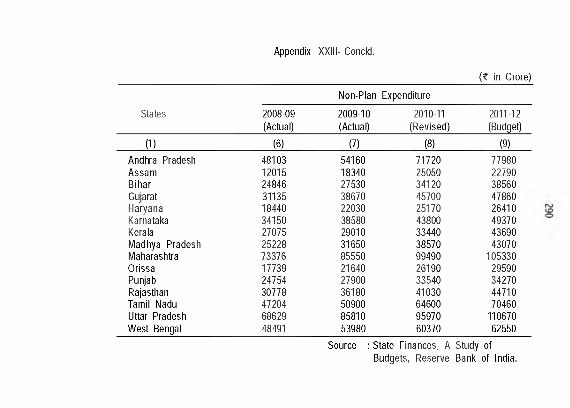
Appendix XXIII- Concld.
(? in Crore)
States
Non-Plan Expenditure
2008-09(Actual)
2009-10(Actual)
2010-11(Revised)
2011-12(Budget)
(1) (6) (7) (8) (9)Andhra Pradesh 48103 54160 71720 77980Assam 12015 18340 25050 22790Bihar 24846 27530 34120 38560Gujarat 31135 38670 45700 47860Haryana 18440 22030 25170 26410Karnatal<a 34150 38580 43800 49370Kerala 27075 29010 33440 43690Madhya Pradesh 25228 31650 38570 43070Maharashtra 73376 85550 99490 105330Orissa 17739 21640 26190 29590Punjab 24754 27900 33540 34270Rajasthan 30778 36180 41030 44710Tamil Nadu 47204 50900 64600 70460Uttar Pradesh 68629 85810 95970 110670West Bengal 48491 53980 60370 62550
Source : State Finances, A Study ofBudgets, Reserve Bank of India.
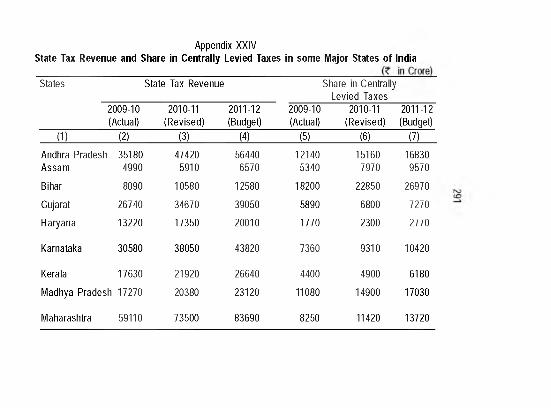
Appendix XXIVState Tax Revenue and Share in Centrally Levied Taxes in some Major States of India
States State Tax Revenue Share in Centrally Levied Taxes
2009-10(Actual)
2010-11(Revised)
2011-12(Budget)
2009-10(Actual)
2010-11(Revised)
2011-12(Budget)
(1) (2) (3) (4) (5) (6) (7)Andhra Pradesh1 35180 47420 56440 12140 15160 16830Assam 4990 5910 6570 5340 7970 9570
Bihar 8090 10580 12580 18200 22850 26970
Gujarat 26740 34670 39050 5890 6800 7270
Haryana 13220 17350 20010 1770 2300 2770
Karnatal<a 30580 38050 43820 7360 9310 10420
Kerala 17630 21920 26640 4400 4900 6180
Madhya Pradesh 17270 20380 23120 11080 14900 17030
Maharashtra 59110 73500 83690 8250 11420 13720
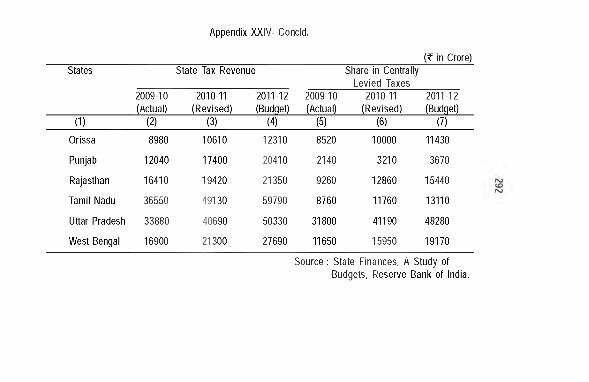
Appendix X X IV - Concld.
(? in Crore)States State Tax Revenue Share in Centrally
Levied Taxes2009-10(Actual)
2010-11(Revised)
2011-12(Budget)
2009-10(Actual)
2010-11(Revised)
2011-12(Budget)
(1) (2) (3) (4) (5) (6) (7)Orissa 8980 10610 12310 8520 10000 11430
Punjab 12040 17400 20410 2140 3210 3670
Rajasthan 16410 19420 21350 9260 12860 15440
Tamil Nadu 36550 49130 59790 8760 11760 13110
Uttar Pradesh 33880 40690 50330 31800 41190 48280
West Bengal 16900 21300 27690 11650 15950 19170
Source : State Finances, A Study ofBudgets, Reserve Banl< of India.
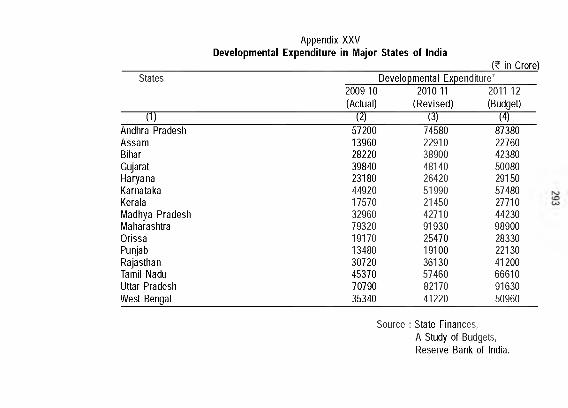
Appendix XXV Developmental Expenditure in Major States of India
( t in Crore)States 1
2009-10(Actual)
Developmental Expenditure*2010-11 2011-12
(Revised) (Budget)(1) (n (3) (4)
Andhra Pradesh 57200 74580 87380Assam 13960 22910 22760Bihar 28220 38900 42380Gujarat 39840 48140 50080Haryana 23180 26420 29150Karnatal<a 44920 51990 57480Kerala 17570 21450 27710Madhya Pradesh 32960 42710 44230Maharashtra 79320 91930 98900Orissa 19170 25470 28330Punjab 13480 19100 22130Rajasthan 30720 36130 41200Tamil Nadu 45370 57460 66610Uttar Pradesh 70790 82170 91630West Bengal 35340 41220 50960
Source : State Finances,A Study of Budgets, Reserve Bank of India.
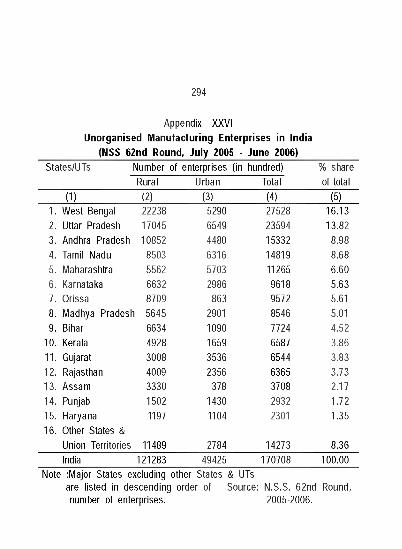
Appendix XXVI Unorganised Manufacturing Enterprises in India
(NSS 62nd Round, July 2005 ■ June 2006)
294
States/UTs Number of enterprises (in hundred) % shareRural Urban Total of total
(1) (2) (3) (4) (5)1. West Bengal 22238 5290 27528 16.132. Uttar Pradesh 17045 6549 23594 13.823. Andhra Pradesh 10852 4480 15332 8.984. Tamil Nadu 8503 6316 14819 8.685. Maharashtra 5562 5703 11265 6.606. Karnataka 6632 2986 9618 5.637. Orissa 8709 863 9572 5.618. Madhya Pradesh1 5645 2901 8546 5.019. Bihar 6634 1090 7724 4.52
10. Kerala 4928 1659 6587 3.8611. Gujarat 3008 3536 6544 3.8312. Rajasthan 4009 2356 6365 3.7313. Assam 3330 378 3708 2.1714. Punjab 1502 1430 2932 1.7215. Haryana 1197 1104 2301 1.3516. Other States &
Union Territories 11489 2784 14273 8.36India 121283 49425 170708 100.00
Note :Major States excluding other States & UTsare listed in descending order of Source: N.S.S. 62nd Round, number of enterprises. 2005-2006.
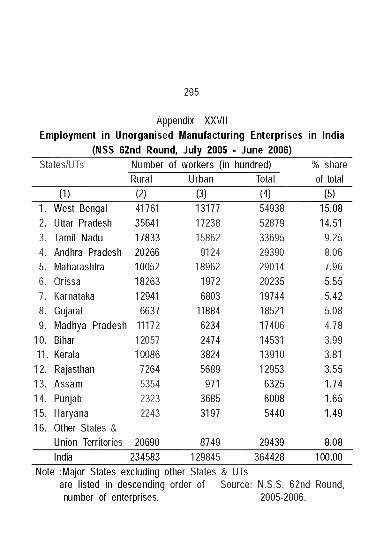
295
Appendix XXVIIEmployment in Unorganised Manufacturing Enterprises in India
(NSS 62nd Round, July 2005 ■ June 2006)States/UTs Number of workers (in hundred)
Rural Urban Total% share of total
(1) (2) (3)
India 234583 129845
(4)
364428
(5)1. West Bengal 41761 13177 54938 15.082. Uttar Pradesh 35641 17238 52879 14.513. Tamil Nadu 17833 15862 33695 9.254. Andhra Pradesh 20266 9124 29390 8.065. Maharashtra 10052 18962 29014 7.966. Orissa 18263 1972 20235 5.557. Karnataka 12941 6803 19744 5.428. Gujarat 6637 11884 18521 5.089. Madhya Pradesh 11172 6234 17406 4.78
10. Bihar 12057 2474 14531 3.9911. Kerala 10086 3824 13910 3.81
12. Rajasthan 7264 5689 12953 3.5513. Assam 5354 971 6325 1.7414. Punjab 2323 3685 6008 1.6515. Haryana 2243 3197 5440 1.4916. Other States &
Union Territories 20690 8749 29439 8.08100.00
Note :Major States excluding other States & UTs are listed in descending order of Source: number of enterprises.
N.S.S. 62nd 2005-2006.
Round,
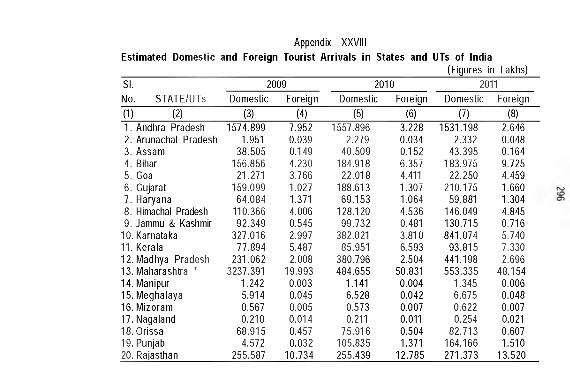
Appendix XX V IIIEstimated Domestic and Foreign Tourist Arrivals in States and UTs of India
(Figures in Lakhs)SI.No. STATE/UTs
2009 2010 2011Domestic Foreign Domestic Foreign Domestic Foreign
(1) (2) (3) (4) (5) (6) (7) (8)1. Andhra Pradesh 1574.899 7.952 1557.896 3.228 1531.198 2.6462. Arunachal Pradesh 1.951 0.039 2.279 0.034 2.332 0.0483. Assam 38.505 0.149 40.509 0.152 43.395 0.1644. Bihar 156.856 4.230 184.918 6.357 183.975 9.7255. Goa 21.271 3.766 22.018 4.411 22.250 4.4596. Gujarat 159.099 1.027 188.613 1.307 210.175 1.6607. Haryana 64.084 1.371 69.153 1.064 59.881 1.3048. Himachal Pradesh 110.366 4.006 128.120 4.536 146.049 4.8459. Jammu & Kashmir 92.349 0.545 99.732 0.481 130.715 0.716
10. Karnataka 327.016 2.997 382.021 3.810 841.074 5.74011. Kerala 77.894 5.487 85.951 6.593 93.815 7.33012. Madhya Pradesh 231.062 2.008 380.796 2.504 441.198 2.69613. Maharashtra ’ 3237.391 19.993 484.655 50.831 553.335 48.15414. Manipur 1.242 0.003 1.141 0.004 1.345 0.00615. Meghalaya 5.914 0.045 6.528 0.042 6.675 0.04816. Mizoram 0.567 0.005 0.573 0.007 0.622 0.00717. Nagaland 0.210 0.014 0.211 0.011 0.254 0.02118. Orissa 68.915 0.457 75.916 0.504 82.713 0.60719. Punjab 4.572 0.032 105.835 1.371 164.166 1.51020. Raiasthan 255.587 10.734 255.439 12.785 271.373 13.520
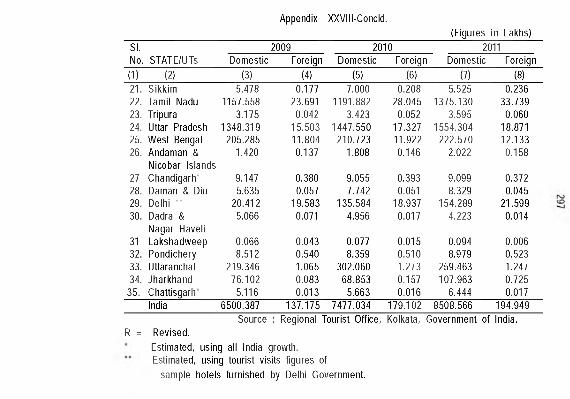
Appendix XXVIII-Concld.(Figures in Lakhs)
SI.No. STATE/UTs
2009 2010 2011Domestic Foreign Domestic Foreign Domestic Foreign
(1) (2) (3) (4) (5) (6) (7) (8)21. S ikkim 5.478 0.177 7.000 0.208 5.525 0.23622. Tamil Nadu 1157.558 23.691 1191.882 28.045 1375.130 33.73923. Tripura 3.175 0.042 3.423 0.052 3.595 0.06024. Uttar Pradesh 1348.319 15.503 1447.550 17.327 1554.304 18.87125. West Bengal 205.285 11.804 210.723 11.922 222.570 12.13326. Andaman & 1.420 0.137 1.808 0.146 2.022 0.158
Nicobar Islands27 Chandigarh* 9.147 0.380 9.055 0.393 9.099 0.37228. Daman & Diu 5.635 0.057 7.742 0.051 8.329 0.04529. Delhi •• 20.412 19.583 135.584 18.937 154.289 21.59930. Dadra & 5.066 0.071 4.956 0.017 4.223 0.014
Nagar Haveli31 Lakshadweep 0.066 0.043 0.077 0.015 0.094 0.00632. Pondichery 8.512 0.540 8.359 0.510 8.979 0.52333. Uttaranchal 219.346 1.065 302.060 1.273 259.463 1.24734. Jharkhand 76.102 0.083 68.853 0.157 107.963 0.725
35. Chattisgarh’ 5.116 0.013 5.663 0.016 6.444 0.017India 6500.387 137.175 7477.034 179.102 8508.566 194.949
Source : Regional Tourist Office,R = Revised.
Estimated, using all India growth.Estimated, using tourist visits figures of
sample hotels furnished by Delhi Government.
Kolkata, Government of India.
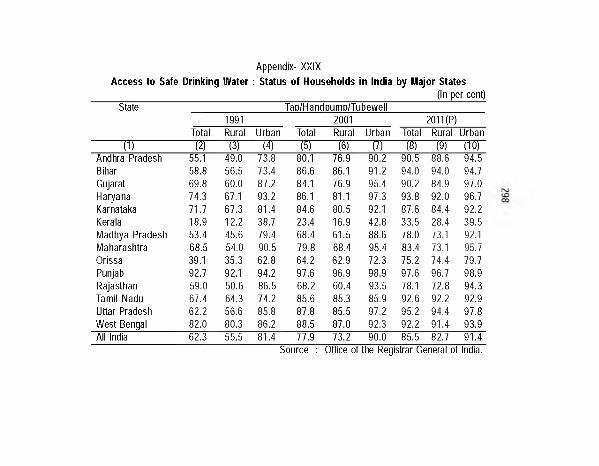
Appendix- X X IXAccess to Safe Drinking Water : Status of Households in India by Major States
(In per cent)State TaD/HandDumD/Tubewell
1991 2001 2011(P)Total Rural Urban Total Rural Urban Total Rural Urban
(1) (2) (3) (4) (5) (6) (7) (8) (9) (10)Andhra Pradesh 55.1 49.0 73.8 80.1 76.9 90.2 90.5 88.6 94.5Bihar 58.8 56.5 73.4 86.6 86.1 91.2 94.0 94.0 94.7Gujarat 69.8 60.0 87.2 84.1 76.9 95.4 90.2 84.9 97.0Haryana 74.3 67.1 93.2 86.1 81.1 97.3 93.8 92.0 96.7Karnataka 71.7 67.3 81.4 84.6 80.5 92.1 87.6 84.4 92.2Kerala 18.9 12.2 38.7 23.4 16.9 42.8 33.5 28.4 39.5Madhya Pradesh 53.4 45.6 79.4 68.4 61.5 88.6 78.0 73.1 92.1Maharashtra 68.5 54.0 90.5 79.8 68.4 95.4 83.4 73.1 95.7Orissa 39.1 35.3 62.8 64.2 62.9 72.3 75.2 74.4 79.7Punjab 92.7 92.1 94.2 97.6 96.9 98.9 97.6 96.7 98.9Rajasthan 59.0 50.6 86.5 68.2 60.4 93.5 78.1 72.8 94.3Tamil Nadu 67.4 64.3 74.2 85.6 85.3 85.9 92.6 92.2 92.9Uttar Pradesh 62.2 56.6 85.8 87.8 85.5 97.2 95.2 94.4 97.8West Bengal 82.0 80.3 86.2 88.5 87.0 92.3 92.2 91.4 93.9All India 62.3 55.5 81.4 77.9 73.2 90.0 85.5 82.7 91.4
Source : Office of the Registrar General of India.