Long-term osseous morphologic outcome of surgically treated unilateral coronal craniosynostosis
Upload
independentCategory
view
2download
0
www.elsevier.com/locate/ynimg
NeuroImage 40 (2008) 482–494Quantitative validation of voxel-wise statistical analyses ofautoradiographic rat brain volumes: Application tounilateral visual stimulation
Albertine Dubois,a,⁎ Anne-Sophie Hérard,a Guillaume Flandin,b Edouard Duchesnay, b
Laurent Besret,c Vincent Frouin,d Philippe Hantraye,a Gilles Bonvento,a and Thierry Delzescauxa
aCEA-DSV-I2BM-MIRCen, 4 place du Général Leclerc, 91401 Orsay Cedex, FrancebCEA-DSV-I2BM-Neurospin-LNAO, CEA Saclay, Bat 145, 91191 Gif-sur-Yvette, FrancecCEA-CNRS URA 2210, Orsay, FrancedCEA-DSV-IRCM-SCSR-LEFG, Evry, France
Received 28 August 2007; revised 23 November 2007; accepted 28 November 2007Available online 15 December 2007
PET scanners devoted to in vivo functional study have recently beendeveloped, but autoradiography remains the reference technique forassessing cerebral glucose metabolism (CMRGlu) in rodents. Auto-radiographs are conventionally subjected to region of interest (ROI)analysis, which is intrinsically hypothesis-driven and therefore notsuitable for whole-brain investigation. Voxel-wise statistical methodsof analysis have long been used to determine differences in brainactivity during in vivo functional neuroimaging experiments. Theyhave also recently been applied to 3D reconstructed autoradiographicvolume images from rat brains. We present here a fully automatedanalysis for autoradiographic data combining (1) computerizedprocedures for the acquisition and 3D reconstruction of postmortemvolume images and (2) spatial normalization followed by classicalwhole-brain voxel-wise statistical analysis. We also describe anadditional procedure for characterizing functional differences be-tween the right and left hemispheres of the brain. We compared twospatial normalization techniques and evaluated how the effect ofchoosing a particular normalization technique impacted on thestatistical analysis. We also propose a small volume correctionanalysis to address the problem of multiple statistical comparisons.Lastly, we investigated the reliability of such analyses, by comparingtheir results qualitatively and quantitatively with those previouslyobtained with our semiautomated ROI-based analysis [Dubois, A.,Dauguet, J., Herard, A.-S., Besret, L., Duchesnay, E., Frouin, V.,Hantraye, P., Bonvento, G., Delzescaux, T., 2007. Automated three-dimensional analysis of histologic and autoradiographic rat brainsections: application to an activation study. J. Cereb. Blood FlowMetab.27 (10), 1742–1755.]. Both voxel-wise statistical analyses led to thedetection of consistent interhemispheric differences in CMRGlu. This
⁎ Corresponding author. Fax: +33 1 69 86 77 45.E-mail address: [email protected] (A. Dubois).Available online on ScienceDirect (www.sciencedirect.com).
1053-8119/$ - see front matter © 2007 Elsevier Inc. All rights reserved.doi:10.1016/j.neuroimage.2007.11.054
work demonstrates the potential value and robustness of voxel-wisestatistical methods for analyzing autoradiographic data sets.© 2007 Elsevier Inc. All rights reserved.
Keywords: Autoradiography; Cerebral glucose metabolism; Voxel-wiseanalysis; Unilateral visual stimulation; 3D reconstruction
Introduction
The development of dedicated small animal magnetic resonance(MR; Morris, 1999) and positron emission tomography (PET;Cherry and Phelps, 1996) scanners has improved our understandingof brain function in both physiological and pathological conditions.It has also opened up the possibility of performing repeated studiesin the same animal: longitudinal follow up of cerebral glucosemetabolism, blood flow and oxygen metabolism; studies of proteinsynthesis under different conditions; tracing of neural pathways(manganese-enhanced MRI; Leergaard et al., 2003); and theinvestigation of neurotransmission processes (Araujo et al., 2000;Aznavour et al., 2006). However, these systems remain subject totechnical limitations, including poor sensitivity and low spatialresolution (~0.5 to 3 mm), making it impossible to avoid theinclusion of tissues with different rates of metabolism or blood flowwithin a single voxel or region of interest (ROI). Furthermore, only afew laboratories are equipped with these systems due to their highcost.
High-resolution autoradiography (~100–200 μm spatial resolu-tion) is a low-cost, widely available technique for functional neu-roimaging in small animals. It is usually required to validate the invivo functional results obtained with small-animal MR and PETimaging systems (Houston et al., 2001; Thanos et al., 2002; Toyamaet al., 2004; Schmidt and Smith, 2005) and remains the reference
483A. Dubois et al. / NeuroImage 40 (2008) 482–494
technique most widely used in small animal research. However,autoradiography cannot be used for longitudinal studies because itrequires the sectioning of brain tissues. This entails the productionof large numbers (up to several hundreds) of serial sections and theinherent loss of three-dimensional (3D) spatial consistency.Autoradiographic data are classically analyzed in two dimensions(2D), using a limited number of sections, resulting in the use of onlya fraction of the functional information. The first step towardsimproving the analysis of the whole autoradiographic brain sectionswas the development of reliable, automated procedures for the 3Dreconstruction of these sections (Hibbard and Hawkins, 1988;Andreasen et al., 1992; Goldszal et al., 1995; Zhao et al., 1995;Rangarajan et al., 1997; Kim et al., 1997; Hess et al., 1998;Thevenaz et al., 1998; Ourselin et al., 2001). However, the analysisof 3D reconstructed autoradiographic volumes remains traditionallylimited to the observation of individual animals or conventionalROI-based analysis. These methods may be subject to observer biasand inaccurate manual delineation of the ROI, particularly when theROI is defined directly on autoradiographic sections. ROI-basedanalyses are intrinsically hypothesis-driven, and significant effectsaway from the initially, a priori defined ROIs may therefore beoverlooked.
Some of the limitations of conventional ROI-based analyseshave been overcome by the development of methods combiningdata from different subjects into a common spatial referential.Indeed, this spatial normalization of data from individual subjectsto a standardized brain volume, using operator-independentintensity-based registration, makes it possible to use voxel-wisestatistical analysis for group comparisons. This automated,exploratory, whole-brain approach can be used to analyze localfunctional differences between population groups without theneed for prior assumptions. Techniques for stereotactic anatomicstandardization combined with voxel-wise analysis have beendeveloped and successfully applied to both PET (Friston et al.,1991) and fMRI (Friston et al., 1995) data from humans, for morethan a decade. The use of a similar approach has recently beenproposed for analyses of rat brain in vivo, including the creationof specific MRI (Schweinhardt et al., 2003; Cross et al., 2004;Schwarz et al., 2006) or ligand-specific (Casteels et al., 2006)templates. The feasibility of applying these methods to 3D recon-structed autoradiographic volume images (Nguyen et al., 2004;Lee et al., 2005b; Holschneider et al., 2006) has also recentlybeen assessed, leading to the identification of significant whole-brain differences in voxel intensity between two groups of ratsplaced under different experimental conditions (treadmill walking,cortical deafness model and conditioned fear stimulus, respec-tively). However, theses studies tackled only some of themethodological issues encountered in such voxel-wise analyseson high-resolution autoradiographic data (level of accuracy andautomation of the 3D reconstruction algorithm, correction for themultiple comparison problem, and Gaussian field theoryassumptions).
In this study, we provide a fully automated analysis of auto-radiographic data from rodent brain combining (1) computerizedprocedures for the acquisition and the 3D reconstruction ofhistological (Nissl stain) and autoradiographic volume images,using a comprehensive and fully automated registration algorithmbased on a similarity criterion between sections and (2) spatialnormalization followed by classical voxel-wise statistical analysis.Unilateral studies are often carried out in rodents to reduce thenumber of experimental animals required, and hence the inter-
animal variability. We therefore supply an additional procedure tocharacterize functional differences between the right and lefthemispheres of the brain. We compared two spatial normalizationtechniques, based on either a functional (autoradiographic) or ananatomical (histological) template, and evaluated the effect ofchoosing a particular normalization technique on the statisticalanalysis. Having addressed the methodological issues linked to themultiple comparison problem and statistical significance (P-value), we investigated the reliability of voxel-wise analysis bycomparing qualitatively and quantitatively the results obtainedwith our previously reported ROI-based morphometric andfunctional measurements (Dubois et al., 2007).
Materials and methods
Unilateral visual stimulation and measurement of the localcerebral metabolic rate of glucose (CMRGlu)
CMRGlu was measured using the [14C]-2-deoxyglucoseautoradiographic method (Sokoloff, 1977), in adult Long-Evansrats, under a complex visual stimulation (n=5), in which the lefteye was left open (stimulated) and the right eye was closed withan opaque adhesive tape (unstimulated). A comprehensive anddetailed description of the experimental protocol is providedelsewhere (Herard et al., 2006). Adjacent brain sections (150 peranimal, 20 μm thick) encompassing the visual system were cutwith a cryostat at −20 °C, mounted on SuperFrost glass slides,rapidly heat-dried, and exposed to an autoradiographic film for5 days, together with radioactive [14C] standards. The same brainsections were then stained with cresyl violet (Nissl stain) toprovide complementary anatomical information. The sectioningoperation was performed according to stereotaxic coordinates ofthe Paxinos and Watson rat brain atlas (Paxinos and Watson,1998): each brain was entirely sectioned at 20-μm thicknessbetween bregma −5.2 mm and bregma −8.2 mm in the coronalplane. We used a single 35×43 cm autoradiography film with theproper cassette per rat brain, the sections being distributed on thefilm as follows: 3 columns of 6 glass slides and 1 column of 7glass slides, each one containing 6 sections, and 1 slide bearing[14C] standards within the fourth column. Hence, for each ratbrain, both [14C] standards and background were identical for allsections and consequently a single calibration was necessary.
Data acquisition and 3D reconstruction of anatomical andfunctional postmortem volumes
Acquisition of autoradiographic and histological sections and3D reconstruction of the corresponding volumes were performed aspreviously described (Dubois et al., 2007). Briefly, the autoradio-graphs, the corresponding histological sections and the [14C]standards were digitized as 8-bit gray-scale column images called“overall scans” (Fig. 1A), with a flatbed scanner (600 dpi in-planeresolution, pixel size 42×42 μm2). The sections were thenextracted from the scans, using an automated procedure based onrobust histogram analysis (Mangin et al., 1998), thresholding anditerative mathematical morphology operations. The actual sectionnumbers (corresponding to the order of sectioning) were alsoautomatically assigned to each single brain section extracted.Lastly, a rectangular bounding box was calculated around each ofsection to produce one image per section, arranged in a continuousanteroposterior relationship (Fig. 1B).
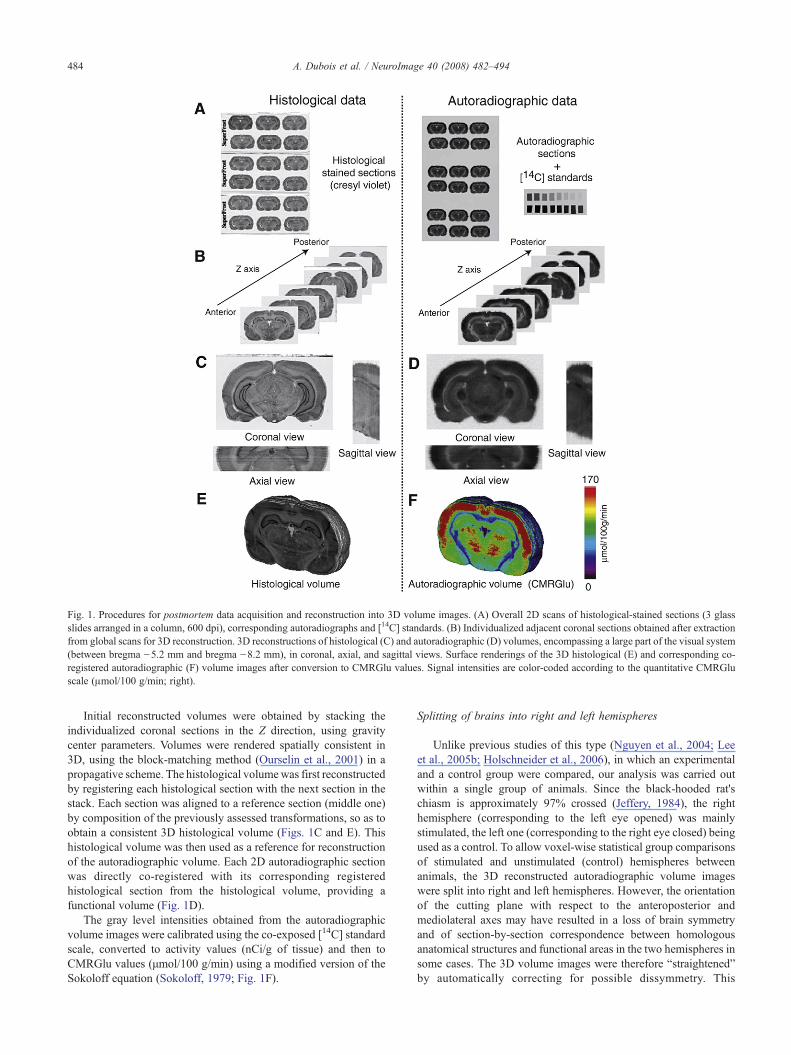
Fig. 1. Procedures for postmortem data acquisition and reconstruction into 3D volume images. (A) Overall 2D scans of histological-stained sections (3 glassslides arranged in a column, 600 dpi), corresponding autoradiographs and [14C] standards. (B) Individualized adjacent coronal sections obtained after extractionfrom global scans for 3D reconstruction. 3D reconstructions of histological (C) and autoradiographic (D) volumes, encompassing a large part of the visual system(between bregma −5.2 mm and bregma −8.2 mm), in coronal, axial, and sagittal views. Surface renderings of the 3D histological (E) and corresponding co-registered autoradiographic (F) volume images after conversion to CMRGlu values. Signal intensities are color-coded according to the quantitative CMRGluscale (μmol/100 g/min; right).
484 A. Dubois et al. / NeuroImage 40 (2008) 482–494
Initial reconstructed volumes were obtained by stacking theindividualized coronal sections in the Z direction, using gravitycenter parameters. Volumes were rendered spatially consistent in3D, using the block-matching method (Ourselin et al., 2001) in apropagative scheme. The histological volumewas first reconstructedby registering each histological section with the next section in thestack. Each section was aligned to a reference section (middle one)by composition of the previously assessed transformations, so as toobtain a consistent 3D histological volume (Figs. 1C and E). Thishistological volume was then used as a reference for reconstructionof the autoradiographic volume. Each 2D autoradiographic sectionwas directly co-registered with its corresponding registeredhistological section from the histological volume, providing afunctional volume (Fig. 1D).
The gray level intensities obtained from the autoradiographicvolume images were calibrated using the co-exposed [14C] standardscale, converted to activity values (nCi/g of tissue) and then toCMRGlu values (μmol/100 g/min) using a modified version of theSokoloff equation (Sokoloff, 1979; Fig. 1F).
Splitting of brains into right and left hemispheres
Unlike previous studies of this type (Nguyen et al., 2004; Leeet al., 2005b; Holschneider et al., 2006), in which an experimentaland a control group were compared, our analysis was carried outwithin a single group of animals. Since the black-hooded rat'schiasm is approximately 97% crossed (Jeffery, 1984), the righthemisphere (corresponding to the left eye opened) was mainlystimulated, the left one (corresponding to the right eye closed) beingused as a control. To allow voxel-wise statistical group comparisonsof stimulated and unstimulated (control) hemispheres betweenanimals, the 3D reconstructed autoradiographic volume imageswere split into right and left hemispheres. However, the orientationof the cutting plane with respect to the anteroposterior andmediolateral axes may have resulted in a loss of brain symmetryand of section-by-section correspondence between homologousanatomical structures and functional areas in the two hemispheres insome cases. The 3D volume images were therefore “straightened”by automatically correcting for possible dissymmetry. This
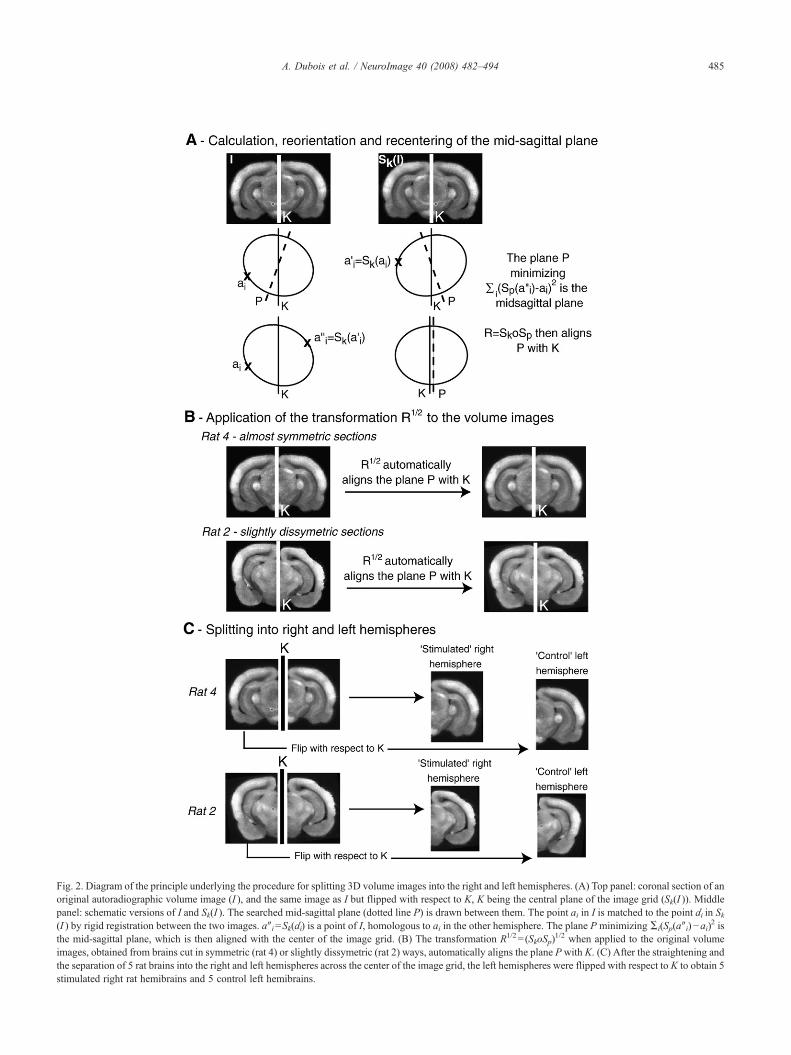
Fig. 2. Diagram of the principle underlying the procedure for splitting 3D volume images into the right and left hemispheres. (A) Top panel: coronal section of anoriginal autoradiographic volume image (I ), and the same image as I but flipped with respect to K, K being the central plane of the image grid (Sk(I )). Middlepanel: schematic versions of I and Sk(I ). The searched mid-sagittal plane (dotted line P) is drawn between them. The point ai in I is matched to the point ai′ in Sk(I ) by rigid registration between the two images. a″i=Sk(ai′) is a point of I, homologous to ai in the other hemisphere. The plane P minimizing Σi(Sp(a″i)−ai)2 isthe mid-sagittal plane, which is then aligned with the center of the image grid. (B) The transformation R1/2= (SkoSp)
1/2 when applied to the original volumeimages, obtained from brains cut in symmetric (rat 4) or slightly dissymetric (rat 2) ways, automatically aligns the plane Pwith K. (C) After the straightening andthe separation of 5 rat brains into the right and left hemispheres across the center of the image grid, the left hemispheres were flipped with respect to K to obtain 5stimulated right rat hemibrains and 5 control left hemibrains.
485A. Dubois et al. / NeuroImage 40 (2008) 482–494

486 A. Dubois et al. / NeuroImage 40 (2008) 482–494
procedure was equivalent to defining and calculating an appropriateplane to split the brain into two roughly symmetric parts (Fig. 2A),and then realigning this plane – defined as the mid-sagittal plane –with the center of the image lattice (Fig. 2B; P is the mid-sagittalplane andK is the center of the image lattice; Prima et al., 2002). The3D “straightened” volume images were then cut across the center ofthe image lattice. As the center plane of the image grid thus becamethe plane best superposing the two hemispheres of the brain byreflective symmetry, we then flipped the left hemispheres withrespect to this plane. This resulted in 10 straightened half-brainimages, called “hemibrains,” including five stimulated hemibrainscorresponding to the right hemispheres of rat brains and five controlhemibrains corresponding to the left hemispheres rendered sym-metric (Fig. 2C).
Creation of a study-specific template and spatial normalization
The standardized 3D coordinate space required for voxel-wiseanalysis was defined by creating a study-specific template of the rathemibrain. As both the autoradiographic and histological volumeimages were available to consider functional and correspondinganatomical information, we compared two different techniques ofspatial normalization: (1) an anatomical template-based method, inwhich the deformation parameters were calculated based entirelyon a histological template and then applied to the correspondingautoradiographic hemibrain volume images; and (2) a functional
Fig. 3. Evaluation of spatial normalization using study-specific templates. (A) Anatostandard deviation (SD) of spatially normalized 3D autoradiographic volume imagtemplate; those on the right were derived using the functional template. (C) Supernormalized stimulated reference hemibrain (rat 4) before and after spatial normali
template-based method, as previously described (Nguyen et al.,2004; Lee et al., 2005b), in which only a study-specificautoradiographic template was used. The deformation parametersdetermined from the autoradiographic hemibrain volume imageswere also applied to the corresponding histological hemibrainvolume images. With both methods, we first selected one referencehemibrain from the 10 hemibrain images obtained (based on a highdegree of symmetry, alignment, and freedom from artifacts), whichwe smoothed with a Gaussian kernel (FWHM=3 times the voxeldimensions). An affine transformation followed by a nonlinearnormalization was then used to warp each rat hemibrain into thesmoothed reference hemibrain (Friston et al., 1995; Ashburner andFriston, 1997; Ashburner and Friston, 1999). The images of thereference hemibrain and the nine remaining normalized hemibrainswere averaged to create a mean image. This image was smoothedwith the same Gaussian kernel to create the final rat hemibraintemplate. Each of the 10 original 3D reconstructed and straightenedhemibrains was then spatially normalized, using the final templateand individually smoothed. The study-specific hemibrain tem-plates were created and the spatial normalization was carried outwith SPM2 software package (Wellcome Department of ImagingNeuroscience, London, UK; http://www.fil.ion.ucl.ac.uk/spm/).The accuracy of the spatial normalization techniques based on theanatomical or functional template (Fig. 3A) was assessed by twoprocedures: (1) the calculation of voxel-by-voxel means andstandard deviations of spatially normalized autoradiographic
mical (histology) and functional (autoradiography) templates. (B) Mean andes from 10 hemibrains. Images on the left were derived using the anatomicalimposition of the edges of the stimulated hemibrain of rat 2 on the spatiallyzation with the anatomical and functional templates.
487A. Dubois et al. / NeuroImage 40 (2008) 482–494
volume images from the 10 hemibrains (Fig. 3B); and (2) thesuperimposition of the contours of the five normalized stimulatedhemibrains, extracted using the Canny–Deriche edge detector(Deriche, 1987), onto the normalized stimulated hemibrain chosenas reference to generate both anatomical and functional templates(Fig. 3C).
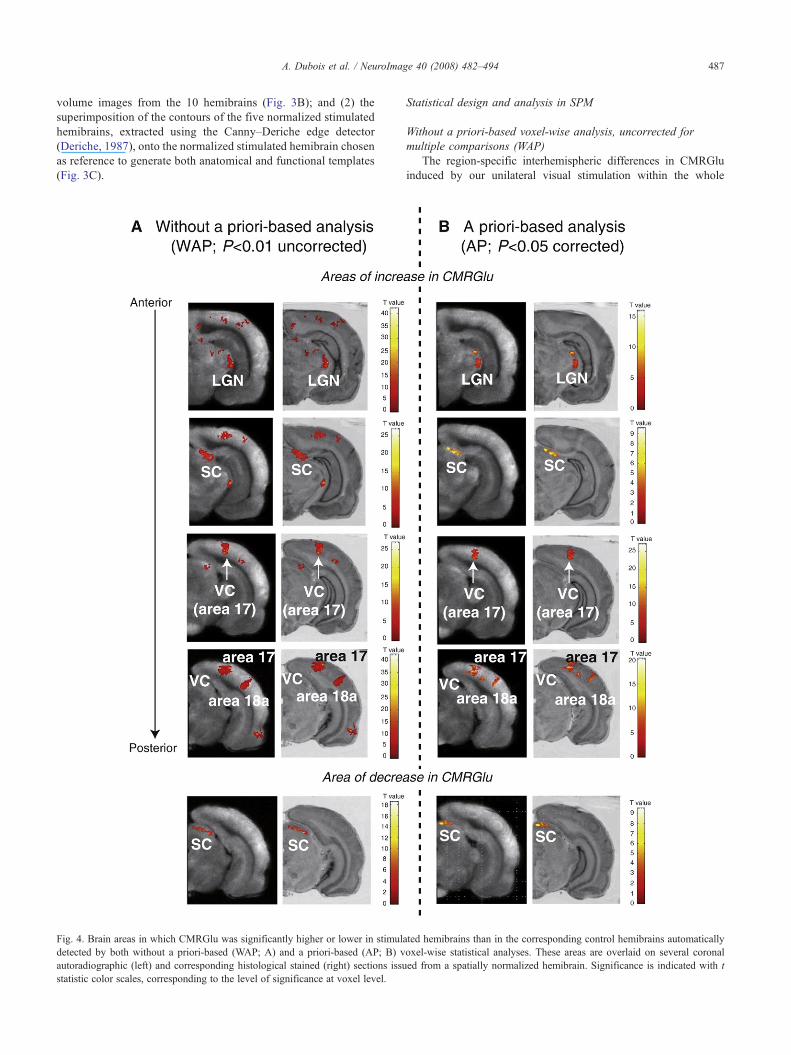
Fig. 4. Brain areas in which CMRGlu was significantly higher or lower in stimuladetected by both without a priori-based (WAP; A) and a priori-based (AP; B) vautoradiographic (left) and corresponding histological stained (right) sections issustatistic color scales, corresponding to the level of significance at voxel level.
Statistical design and analysis in SPM
Without a priori-based voxel-wise analysis, uncorrected formultiple comparisons (WAP)
The region-specific interhemispheric differences in CMRGluinduced by our unilateral visual stimulation within the whole
ted hemibrains than in the corresponding control hemibrains automaticallyoxel-wise statistical analyses. These areas are overlaid on several coronaled from a spatially normalized hemibrain. Significance is indicated with t
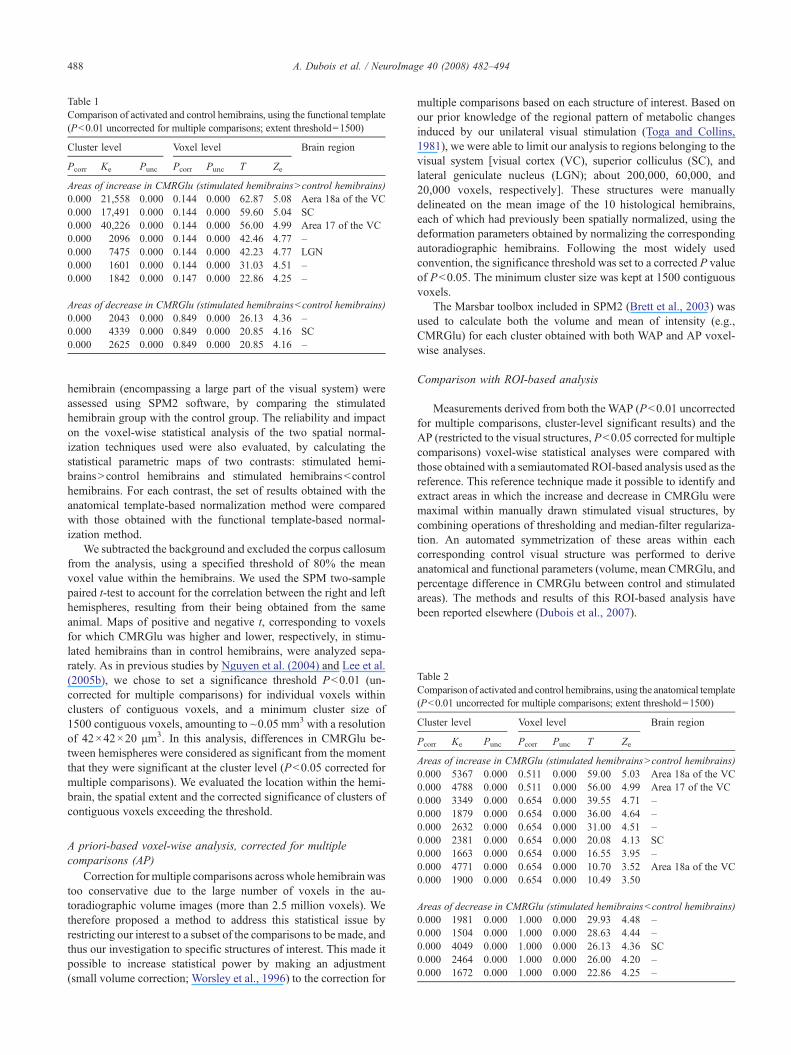
Table 1Comparison of activated and control hemibrains, using the functional template(Pb0.01 uncorrected for multiple comparisons; extent threshold=1500)
Cluster level Voxel level Brain region
Pcorr Ke Punc Pcorr Punc T Ze
Areas of increase in CMRGlu (stimulated hemibrainsNcontrol hemibrains)0.000 21,558 0.000 0.144 0.000 62.87 5.08 Aera 18a of the VC0.000 17,491 0.000 0.144 0.000 59.60 5.04 SC0.000 40,226 0.000 0.144 0.000 56.00 4.99 Area 17 of the VC0.000 2096 0.000 0.144 0.000 42.46 4.77 –0.000 7475 0.000 0.144 0.000 42.23 4.77 LGN0.000 1601 0.000 0.144 0.000 31.03 4.51 –0.000 1842 0.000 0.147 0.000 22.86 4.25 –
Areas of decrease in CMRGlu (stimulated hemibrainsbcontrol hemibrains)0.000 2043 0.000 0.849 0.000 26.13 4.36 –0.000 4339 0.000 0.849 0.000 20.85 4.16 SC0.000 2625 0.000 0.849 0.000 20.85 4.16 –
Table 2Comparison of activated and control hemibrains, using the anatomical template(Pb0.01 uncorrected for multiple comparisons; extent threshold=1500)
Cluster level Voxel level Brain region
Pcorr Ke Punc Pcorr Punc T Ze
Areas of increase in CMRGlu (stimulated hemibrainsNcontrol hemibrains)0.000 5367 0.000 0.511 0.000 59.00 5.03 Area 18a of the VC0.000 4788 0.000 0.511 0.000 56.00 4.99 Area 17 of the VC0.000 3349 0.000 0.654 0.000 39.55 4.71 –0.000 1879 0.000 0.654 0.000 36.00 4.64 –0.000 2632 0.000 0.654 0.000 31.00 4.51 –0.000 2381 0.000 0.654 0.000 20.08 4.13 SC0.000 1663 0.000 0.654 0.000 16.55 3.95 –0.000 4771 0.000 0.654 0.000 10.70 3.52 Area 18a of the VC0.000 1900 0.000 0.654 0.000 10.49 3.50
Areas of decrease in CMRGlu (stimulated hemibrainsbcontrol hemibrains)0.000 1981 0.000 1.000 0.000 29.93 4.48 –0.000 1504 0.000 1.000 0.000 28.63 4.44 –0.000 4049 0.000 1.000 0.000 26.13 4.36 SC0.000 2464 0.000 1.000 0.000 26.00 4.20 –0.000 1672 0.000 1.000 0.000 22.86 4.25 –
488 A. Dubois et al. / NeuroImage 40 (2008) 482–494
hemibrain (encompassing a large part of the visual system) wereassessed using SPM2 software, by comparing the stimulatedhemibrain group with the control group. The reliability and impacton the voxel-wise statistical analysis of the two spatial normal-ization techniques used were also evaluated, by calculating thestatistical parametric maps of two contrasts: stimulated hemi-brainsNcontrol hemibrains and stimulated hemibrainsbcontrolhemibrains. For each contrast, the set of results obtained with theanatomical template-based normalization method were comparedwith those obtained with the functional template-based normal-ization method.
We subtracted the background and excluded the corpus callosumfrom the analysis, using a specified threshold of 80% the meanvoxel value within the hemibrains. We used the SPM two-samplepaired t-test to account for the correlation between the right and lefthemispheres, resulting from their being obtained from the sameanimal. Maps of positive and negative t, corresponding to voxelsfor which CMRGlu was higher and lower, respectively, in stimu-lated hemibrains than in control hemibrains, were analyzed sepa-rately. As in previous studies by Nguyen et al. (2004) and Lee et al.(2005b), we chose to set a significance threshold Pb0.01 (un-corrected for multiple comparisons) for individual voxels withinclusters of contiguous voxels, and a minimum cluster size of1500 contiguous voxels, amounting to ~0.05 mm3 with a resolutionof 42×42×20 μm3. In this analysis, differences in CMRGlu be-tween hemispheres were considered as significant from the momentthat they were significant at the cluster level (Pb0.05 corrected formultiple comparisons). We evaluated the location within the hemi-brain, the spatial extent and the corrected significance of clusters ofcontiguous voxels exceeding the threshold.
A priori-based voxel-wise analysis, corrected for multiplecomparisons (AP)
Correction formultiple comparisons across whole hemibrain wastoo conservative due to the large number of voxels in the au-toradiographic volume images (more than 2.5 million voxels). Wetherefore proposed a method to address this statistical issue byrestricting our interest to a subset of the comparisons to bemade, andthus our investigation to specific structures of interest. This made itpossible to increase statistical power by making an adjustment(small volume correction; Worsley et al., 1996) to the correction for
multiple comparisons based on each structure of interest. Based onour prior knowledge of the regional pattern of metabolic changesinduced by our unilateral visual stimulation (Toga and Collins,1981), we were able to limit our analysis to regions belonging to thevisual system [visual cortex (VC), superior colliculus (SC), andlateral geniculate nucleus (LGN); about 200,000, 60,000, and20,000 voxels, respectively]. These structures were manuallydelineated on the mean image of the 10 histological hemibrains,each of which had previously been spatially normalized, using thedeformation parameters obtained by normalizing the correspondingautoradiographic hemibrains. Following the most widely usedconvention, the significance threshold was set to a corrected P valueof Pb0.05. The minimum cluster size was kept at 1500 contiguousvoxels.
The Marsbar toolbox included in SPM2 (Brett et al., 2003) wasused to calculate both the volume and mean of intensity (e.g.,CMRGlu) for each cluster obtained with both WAP and AP voxel-wise analyses.
Comparison with ROI-based analysis
Measurements derived from both the WAP (Pb0.01 uncorrectedfor multiple comparisons, cluster-level significant results) and theAP (restricted to the visual structures, Pb0.05 corrected for multiplecomparisons) voxel-wise statistical analyses were compared withthose obtained with a semiautomated ROI-based analysis used as thereference. This reference technique made it possible to identify andextract areas in which the increase and decrease in CMRGlu weremaximal within manually drawn stimulated visual structures, bycombining operations of thresholding and median-filter regulariza-tion. An automated symmetrization of these areas within eachcorresponding control visual structure was performed to deriveanatomical and functional parameters (volume, mean CMRGlu, andpercentage difference in CMRGlu between control and stimulatedareas). The methods and results of this ROI-based analysis havebeen reported elsewhere (Dubois et al., 2007).
489A. Dubois et al. / NeuroImage 40 (2008) 482–494
Results
Acquisition, 3D reconstruction and splitting into right and lefthemispheres
Using our optimized digitization procedure, each series ofstained histological sections and autoradiographs (about 300 images
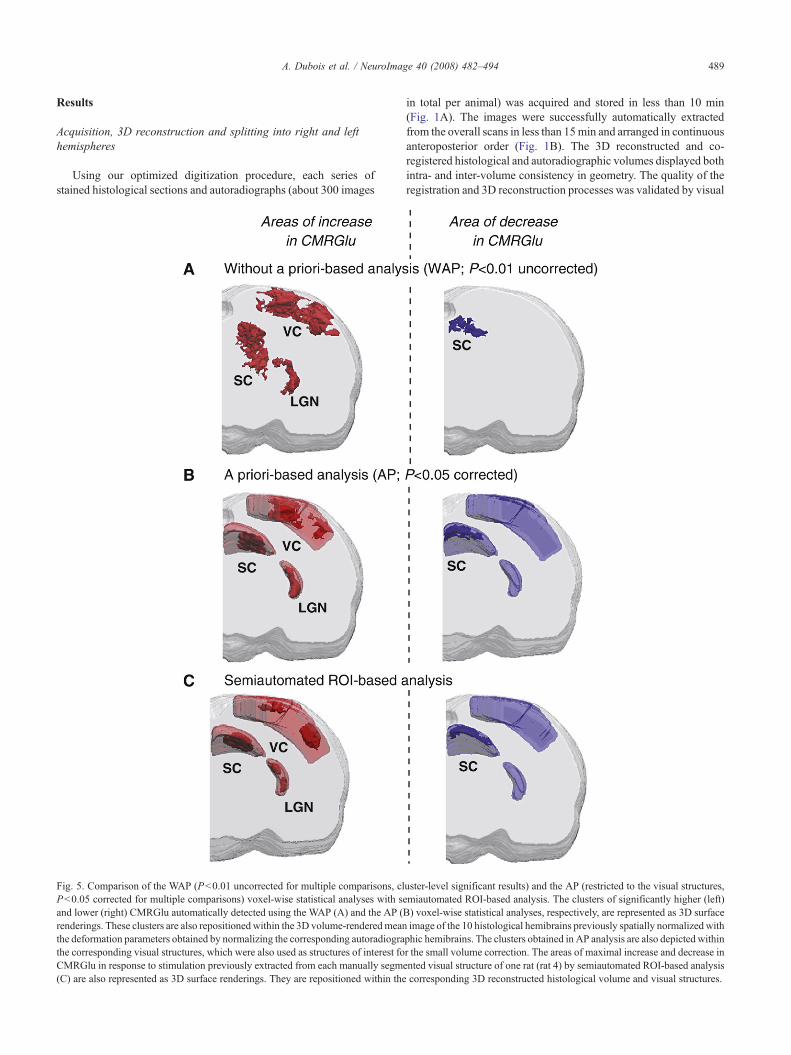
Fig. 5. Comparison of the WAP (Pb0.01 uncorrected for multiple comparisons, clPb0.05 corrected for multiple comparisons) voxel-wise statistical analyses with seand lower (right) CMRGlu automatically detected using the WAP (A) and the AP (Brenderings. These clusters are also repositionedwithin the 3D volume-renderedmeanthe deformation parameters obtained by normalizing the corresponding autoradiograthe corresponding visual structures, which were also used as structures of interest foCMRGlu in response to stimulation previously extracted from each manually segme(C) are also represented as 3D surface renderings. They are repositioned within the
in total per animal) was acquired and stored in less than 10 min(Fig. 1A). The images were successfully automatically extractedfrom the overall scans in less than 15min and arranged in continuousanteroposterior order (Fig. 1B). The 3D reconstructed and co-registered histological and autoradiographic volumes displayed bothintra- and inter-volume consistency in geometry. The quality of theregistration and 3D reconstruction processes was validated by visual
uster-level significant results) and the AP (restricted to the visual structures,miautomated ROI-based analysis. The clusters of significantly higher (left)) voxel-wise statistical analyses, respectively, are represented as 3D surfaceimage of the 10 histological hemibrains previously spatially normalizedwithphic hemibrains. The clusters obtained in AP analysis are also depicted withinr the small volume correction. The areas of maximal increase and decrease innted visual structure of one rat (rat 4) by semiautomated ROI-based analysiscorresponding 3D reconstructed histological volume and visual structures.
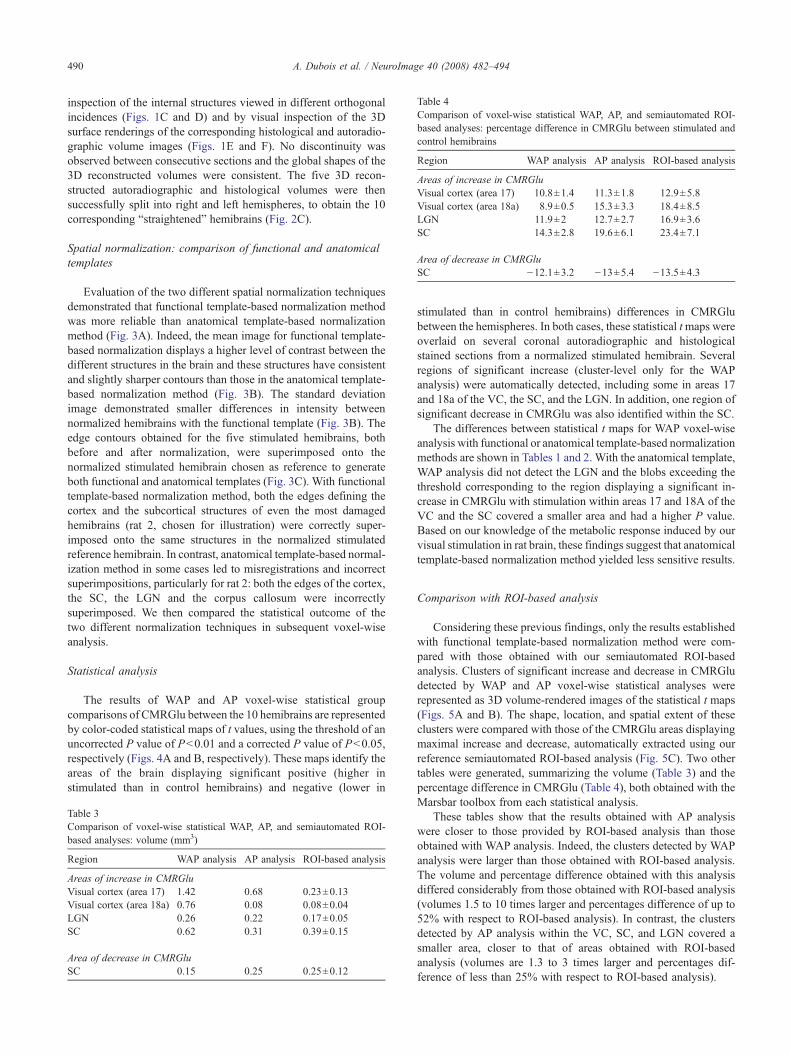
Table 4Comparison of voxel-wise statistical WAP, AP, and semiautomated ROI-based analyses: percentage difference in CMRGlu between stimulated andcontrol hemibrains
Region WAP analysis AP analysis ROI-based analysis
Areas of increase in CMRGluVisual cortex (area 17) 10.8±1.4 11.3±1.8 12.9±5.8Visual cortex (area 18a) 8.9±0.5 15.3±3.3 18.4±8.5LGN 11.9±2 12.7±2.7 16.9±3.6SC 14.3±2.8 19.6±6.1 23.4±7.1
Area of decrease in CMRGluSC −12.1±3.2 −13±5.4 −13.5±4.3
490 A. Dubois et al. / NeuroImage 40 (2008) 482–494
inspection of the internal structures viewed in different orthogonalincidences (Figs. 1C and D) and by visual inspection of the 3Dsurface renderings of the corresponding histological and autoradio-graphic volume images (Figs. 1E and F). No discontinuity wasobserved between consecutive sections and the global shapes of the3D reconstructed volumes were consistent. The five 3D recon-structed autoradiographic and histological volumes were thensuccessfully split into right and left hemispheres, to obtain the 10corresponding “straightened” hemibrains (Fig. 2C).
Spatial normalization: comparison of functional and anatomicaltemplates
Evaluation of the two different spatial normalization techniquesdemonstrated that functional template-based normalization methodwas more reliable than anatomical template-based normalizationmethod (Fig. 3A). Indeed, the mean image for functional template-based normalization displays a higher level of contrast between thedifferent structures in the brain and these structures have consistentand slightly sharper contours than those in the anatomical template-based normalization method (Fig. 3B). The standard deviationimage demonstrated smaller differences in intensity betweennormalized hemibrains with the functional template (Fig. 3B). Theedge contours obtained for the five stimulated hemibrains, bothbefore and after normalization, were superimposed onto thenormalized stimulated hemibrain chosen as reference to generateboth functional and anatomical templates (Fig. 3C). With functionaltemplate-based normalization method, both the edges defining thecortex and the subcortical structures of even the most damagedhemibrains (rat 2, chosen for illustration) were correctly super-imposed onto the same structures in the normalized stimulatedreference hemibrain. In contrast, anatomical template-based normal-ization method in some cases led to misregistrations and incorrectsuperimpositions, particularly for rat 2: both the edges of the cortex,the SC, the LGN and the corpus callosum were incorrectlysuperimposed. We then compared the statistical outcome of thetwo different normalization techniques in subsequent voxel-wiseanalysis.
Statistical analysis
The results of WAP and AP voxel-wise statistical groupcomparisons of CMRGlu between the 10 hemibrains are representedby color-coded statistical maps of t values, using the threshold of anuncorrected P value of Pb0.01 and a corrected P value of Pb0.05,respectively (Figs. 4A and B, respectively). These maps identify theareas of the brain displaying significant positive (higher instimulated than in control hemibrains) and negative (lower in
Table 3Comparison of voxel-wise statistical WAP, AP, and semiautomated ROI-based analyses: volume (mm3)
Region WAP analysis AP analysis ROI-based analysis
Areas of increase in CMRGluVisual cortex (area 17) 1.42 0.68 0.23±0.13Visual cortex (area 18a) 0.76 0.08 0.08±0.04LGN 0.26 0.22 0.17±0.05SC 0.62 0.31 0.39±0.15
Area of decrease in CMRGluSC 0.15 0.25 0.25±0.12
stimulated than in control hemibrains) differences in CMRGlubetween the hemispheres. In both cases, these statistical tmaps wereoverlaid on several coronal autoradiographic and histologicalstained sections from a normalized stimulated hemibrain. Severalregions of significant increase (cluster-level only for the WAPanalysis) were automatically detected, including some in areas 17and 18a of the VC, the SC, and the LGN. In addition, one region ofsignificant decrease in CMRGlu was also identified within the SC.
The differences between statistical t maps for WAP voxel-wiseanalysis with functional or anatomical template-based normalizationmethods are shown in Tables 1 and 2. With the anatomical template,WAP analysis did not detect the LGN and the blobs exceeding thethreshold corresponding to the region displaying a significant in-crease in CMRGlu with stimulation within areas 17 and 18A of theVC and the SC covered a smaller area and had a higher P value.Based on our knowledge of the metabolic response induced by ourvisual stimulation in rat brain, these findings suggest that anatomicaltemplate-based normalization method yielded less sensitive results.
Comparison with ROI-based analysis
Considering these previous findings, only the results establishedwith functional template-based normalization method were com-pared with those obtained with our semiautomated ROI-basedanalysis. Clusters of significant increase and decrease in CMRGludetected by WAP and AP voxel-wise statistical analyses wererepresented as 3D volume-rendered images of the statistical t maps(Figs. 5A and B). The shape, location, and spatial extent of theseclusters were compared with those of the CMRGlu areas displayingmaximal increase and decrease, automatically extracted using ourreference semiautomated ROI-based analysis (Fig. 5C). Two othertables were generated, summarizing the volume (Table 3) and thepercentage difference in CMRGlu (Table 4), both obtained with theMarsbar toolbox from each statistical analysis.
These tables show that the results obtained with AP analysiswere closer to those provided by ROI-based analysis than thoseobtained with WAP analysis. Indeed, the clusters detected by WAPanalysis were larger than those obtained with ROI-based analysis.The volume and percentage difference obtained with this analysisdiffered considerably from those obtained with ROI-based analysis(volumes 1.5 to 10 times larger and percentages difference of up to52% with respect to ROI-based analysis). In contrast, the clustersdetected by AP analysis within the VC, SC, and LGN covered asmaller area, closer to that of areas obtained with ROI-basedanalysis (volumes are 1.3 to 3 times larger and percentages dif-ference of less than 25% with respect to ROI-based analysis).
491A. Dubois et al. / NeuroImage 40 (2008) 482–494
Discussion
We aimed to develop and validate a comprehensive procedure forthe 3D analysis of autoradiographic data sets, combining automatedmethods for the acquisition and 3D reconstruction of autoradio-graphic volume images with spatial normalization and voxel-wisestatistical analysis. In addition, the incorporation of an automatedmethod for separating brains into right and left hemispheres makes itpossible to use this procedure for characterizing metabolic dif-ferences between two groups of animals or between individualswithin a single group. The relevance of the methodological choicesmade and the reliability of the voxel-based analysis for assessinginterhemispheric CMRGlu differences in rats were evaluated byqualitatively and quantitatively comparing the results with pre-viously reported ROI-based morphometric and functional measure-ments (Dubois et al., 2007).
Acquisition, 3D reconstruction, and splitting into right and lefthemispheres
The optimization of data acquisition under the form of “overall”scans associated with a robust procedure for the simultaneousextraction of tens of sections from these scans (including fullyautomated section number assignment) was of prime importance.This made possible convenient and rapid section-by-section align-ment and reconstruction into 3D volumetric images, as required forvoxel-wise analysis. Consistent 3D reconstruction of both thehistological and autoradiographic data sets was also a crucial step.Indeed, any misalignment of sections inducing anatomic differencesin brain morphology between animals could result in difficulties inwarping the 3D-reconstructed brains onto the template, potentiallyrendering spatial normalization incomplete for isolated regions.Such misalignment might also decrease the statistical power todetect significant differences for cerebral structures within themisaligned sections. We therefore selected the algorithm for the 3Dreconstruction of histological and autoradiographic volumes basedon the block-matching rigid registration technique (Ourselin et al.,2001). We removed a few damaged sections from the initial 3Dreconstructed volumes (obtained by stacking the individualizedcoronal sections in the Z direction). Considering that we wereprocessing 20-μm-thick consecutive sections, this operation did notaffect the global shape of the final volume.When several sections aremissing or damaged, due to bad sectioning, using the previous or thenext section for additional registration may appear as more ap-propriate than simply removing them. However, the block-matchingrigid registration technique is reliable, robust to dissimilaritiesbetween sections, missing data and outlying measurements, andhighly suitable for brain sections obtained with a cryostat. Ittherefore generally enables the registration of slightly distorted ordamaged sections so that the registration procedure can be entirelyautomated without supplementary data handling—like the removalor the replacement of these sections. Furthermore, the propagation oferrors due to misregistrations of preceding sections through theentire volume is limited by section thickness (20-μm-thick adjacentsections) and the high quality of the postmortem data sets, and bytheir continuous nature (Nikou et al., 2003). However, if the numberof sections to be registered is large, an overall offset of the volume,due to error accumulation, may occur. Obviously, this issue is morepronounced when distant sections are involved in the registration.Thus, a modification of the global shape of the 3D reconstructed
volume may be observed. This technique has been intensivelyvalidated and is acknowledged to be the most comprehensiveregistration algorithm, in the absence of a 3D geometric reference(such as MR scans or images from the surface of the block acquiredbefore the sectioning of each cryostat section; Malandain et al.,2004; Pitiot et al., 2006; Dauguet et al., 2007). In addition, theautomation of tools for data acquisition and 3D reconstruction andtheir integration into a graphical interface (BrainVISA, Cointepaset al., 2001; http://brainvisa.info) facilitated their use and madepossible the simple, rapid, operator-independent prior processing oflarge data sets. The procedure for separating 3D reconstructed brainimages into two hemispheres was based on a fully automatedalgorithm for the calculation, reorientation, and recentering of themid-sagittal plane. This algorithm has been extensively validated inhumans by the visual evaluation of large sets of real isotropic andanisotropic anatomical (MRI, computed tomography) and func-tional (single-photon emission computed tomography, PET) images,from normal and pathological subjects (Prima et al., 2002). In thepresent work, the same algorithm was successfully applied to bothhistological and autoradiographic volume images of the part of therat brain encompassing the visual system. The algorithm is fast andaccurate, even for data with strong deformations artifacts due to theeffects of sectioning and tissue shrinkage, and for brains displaying aloss of symmetry due to the orientation of the cutting plane. Theentire separation procedure, including calculation of the mid-sagittalplane, splitting the brain into its two hemispheres, and flipping lefthemispheres with respect to the central plane of the image grid, hasbeen integrated into BrainVISA. It is now automated andreproducible, and provides a useful tool for further accurate analysisof data from unilateral studies. Nevertheless, we noticed in Fig. 2that the procedure was sufficient to re-align the mid-sagittal planewith the center of the image grid but did not entirely correct for theloss of the symmetry between the two hemispheres induced by theorientation of the cutting plane. Hence, before comparing stimulatedand control hemibrains, each of them had also to be warped into astudy-specific hemibrain template also to allow a correct matchbetween homologous anatomical structures and functional areas.
Spatial normalization
Because hemibrains differed in size, shape, and orientation, onegoal of the spatial normalization procedure was to compensateanatomical differences so that we have a one-to-one localization inbetween the hemibrain volume images. Hence, we ensured that acorrect comparison of stimulated and control hemibrains was readilyperformed.
Diffusion of the radioactive tracer during tissue preparationlimits the spatial resolving power of 2-DG autoradiography(Gallistel and Nichols, 1983) and the morphological accuracy offunctional information. However, we found that the functionaltemplate was more appropriate for spatial normalization than theanatomical template. However, based on previous literature dealingwith spatial normalization in different imaging techniques of humanbrain (Ashburner and Friston, 1999; Davatzikos et al., 2001),anatomical template-based normalization method, in which thedeformation parameters are determined from structural images, suchas anatomical MRI scans, and then applied to the functional PETimages or functional MRI scans, is traditionally considered to be thereference technique. The intensity-based approach used for thenonlinear spatial normalization procedure minimizes the sum ofsquared differences between the images to be normalized and the
492 A. Dubois et al. / NeuroImage 40 (2008) 482–494
template image when warping images such that functionally similarregions from different subjects are as close together as possible(Ashburner and Friston, 1999). For this matching criterion to besuccessful, correspondence in gray-scale levels for the differenttissue types is required between the images and the template. Nissl-stained sections provided greater anatomical detail than autoradio-graphy (the inner anatomical structures, such as the molecular layerof the hippocampus, are visualized accurately because of theirstrongly contrasting textures; see Fig. 3A), but did not providesufficient information to discriminate between regions, due to thelow level of contrast in gray-scale intensity between differentstructures of the brain, making it difficult to achieve correspondencebetween an image and the template. In addition, this low level ofcontrast also resulted in a failure of the normalization method tocompensate for potential deformation artifacts due to sectioning andtissue shrinkage. These observations may account for the consider-able variability observed between images normalized using theanatomical template (Fig. 3B). In contrast, although autoradiogra-phy has a lower resolving power than histology, it provides a muchgreater level of contrast between some anatomical structures (cortex,geniculate nuclei, and hippocampus). Nevertheless, the anatomicalinformation provided by the Nissl-stained sections was required toguarantee the reproducible, operator-independent delineation ofeach visual structure in ROI-based analysis and the correctautomatic identification of areas of significant differences inCMRGlu in voxel-wise analysis. Anatomical template-basednormalization method did not provide accurate spatial normal-izations and failed to reach the high level of spatial specificityobtained with functional template-based normalization method.Other techniques could therefore be envisaged, based onMRI scans,as with human brains, or blockface images (Toga et al., 1994b; Togaet al., 1994a; Cannestra et al., 1997; Annese et al., 2006; Dauguet etal., 2007). The great value of these imaging methods is that theyconstitute a consistent 3D geometric reference free from possibledeformations associated with the sectioning process and between-animal physiological or paradigm-induced differences in intensity(activity or CMRGlu). They could therefore be used for thereconstruction and spatial normalization of both histological andautoradiographic volume images. In particular, the use of post-mortem blockface images should overcome the need to correct formajor deformations induced by tissue shrinkage and otherdeformations during the step of histological preparation withnonrigid registration algorithms, as required for registration betweenMRI and histology (Malandain et al., 2004).
Comparison of ROI-based and voxel-wise analyses
The consistency of our results with published findings (Rooneyand Cooper, 1988; McIntosh and Cooper, 1989; Cooper and Allen,1995; Binns, 1999) and results previously obtained with oursemiautomated ROI-based analysis (Dubois et al., 2007) showedthat the voxel-wise WAP and AP analyses identified all regions ofvisual structures involved in the visual processing of our complexstimulus (areas 17 and 18a of the VC, the SC, and both the ventraland dorsal LGN, LGNv, and LGNd, respectively). These entirelyautomated analyses were therefore both relevant. However, thevolumes of clusters of significant differences in CMRGlu obtainedwith both these analyses were greater than those obtained with oursemiautomated ROI-based analysis. These findings may beaccounted for by the considerable conceptual differences betweenthe two methods, as the ROI approach supplies individual vol-
umetric and functional data whereas voxel-wise analysis providesstatistical between-group differences in the CMRGlu distribution ofsmoothed normalized images.
By providing a common reference system for inter-subject com-parisons, the spatial normalization procedure both allowed andcompensated for subtle variations in anatomical structures betweenrat hemibrains. Smoothing the normalized rat hemibrains beforevoxel-wise analysis also reduced the impact on subsequent analysisof data misregistrations in the template space. The combination ofthese two procedures thus reduced the effect of shape variability onsize measurements, by averaging the differences between animals.Moreover, spatial normalization compensated for the possibledeformation artifacts (mainly within the cortex) of sectionsassociated with the removal of the brain from skull, the freezingand sectioning processes. This may account for the higher valuesobtained for VC with this method than with ROI-based analysis,particularly as the VC is a region difficult to delineate accurately andour complex visual stimulation paradigm is known to produce auniform and global metabolic activation encompassing the entirestructure. In addition, the differences obtained between the volumesin WAP or AP analysis (those obtained with the AP analysis arecloser to the volumes defined with ROI-based approach than thoseobtained with theWAP analysis) may be accounted for by the lack ofcorrection for multiple comparisons inWAP analysis, increasing theprobability of obtaining false positives. Indeed, by restricting theanalysis to particular structures of interest, we reduced the numbersof voxels to be compared, making it possible to correct for multiplecomparisons.
The WAP analysis was easy and rapid to perform. It gave theusers some general information concerning the functional effectsinduced by the experimental protocol within the whole rathemibrain. The AP analysis was more rigorous in terms of statisticsand provided accurate quantitative results on the regions ofsignificant between-group differences in CMRGlu (volume, meanCMRGlu, and percentage difference). Thus, we could compare thesequantitative results with those obtained using our semiautomatedROI-based analysis. In a general manner, an automated WAPanalysis might be performed through the target structure (wholebrain, part of the brain, whole hemibrain, and so on) in order to locateand identify the main significant between-group differences in voxelintensity. To reduce the number of voxels considered, the analysisshould be further restricted to the regions of the target structurewhere the main significant differences in the voxel intensity werepreviously spotted. The resulting regions could then be analyzedwith an automated AP analysis.
Autoradiography provides images of greater quality and higherresolution than PET images, resulting in larger numbers of pixels foranalysis (Zhao et al., 2006). Prior assumptions have to be made toreduce the number of voxels to be compared, and hence to provideresults that meet the community standards for statistical significance(Pb0.05 corrected for multiple comparisons). We therefore need todevelop a strategy for handling the problem of multiple comparisonsby avoiding the manual delineation of particular structures ofinterest. Indeed, this process remains operator-dependent and time-consuming and requires prior knowledge for selection of the regionsto be analyzed, thereby constraining the targets to be studied. In thefuture, this limitation may be overcome by carrying out AP voxel-wise analyses of specific subdivisions of the brain, using 3D labelvolumes for the main neural structures provided by a digital rat ormouse brain volume atlas (Mackenzie-Graham et al., 2004; Ali et al.,2005; Lee et al., 2005a; Bock et al., 2006), for example.

493A. Dubois et al. / NeuroImage 40 (2008) 482–494
Conclusion
We developed and validated a fully automated procedure for theanalysis of rat brain autoradiographic volumes combining (1)computerized procedures for the acquisition and 3D reconstructionof histological (Nissl stain) and autoradiographic volume imagesand (2) spatial normalization followed by voxel-wise statisticalanalysis. The automation of these tools was a prerequisite for thevoxel-wise analysis, and their integration into a graphical interfacemade the simple, rapid, operator-independent processing of largedata sets possible. It also guaranteed the reproducibility andobjectivity of the results. These tools, when made available to thesmall-animal postmortem imaging community, should make itpossible to use voxel-based analysis with SPM as a routine tech-nique for investigating large study populations (including severaltens of animals). We also used a robust procedure for separating 3Dreconstructed brain volumes into right and left hemispheres, whichwill also soon be made available to the scientific community. Thissystem was accurately validated by qualitative and quantitativecomparison of the results with those previously obtained with oursemiautomated ROI-based analysis (Dubois et al., 2007). Compar-ison of our results with expectations based on fundamentalknowledge (“ground truth”) also showed that our procedure enabledvoxel-wise statistical analysis to generate the right hypothesis.
This work should also facilitate unilateral activation studies(often used by biologists) inducing small differences in CMRGluwithin only part of the brain (visual system). This approach couldnow easily be applied to the brain of whole small animals (mice,rats, etc.) and extended to other activation models and domains ofapplication including pathological and therapeutic studies invol-ving animal models of various brain diseases (neurodegenerativediseases, ischemia, and cancers). Our results confirm that voxel-wise statistical analysis is a promising generic approach forinvestigating autoradiographic data sets and highlight the capacityof image processing techniques to support and contribute to theimprovement of biological research.
Acknowledgments
Wewould like to thank Dr Gwenaelle Douaud for assistance withSPM2 software, and Drs. Philippe Ciuciu, Jean-Baptiste Poline, andAlexis Roche for providing helpful comments and suggestions con-cerning statistics.
References
Ali, A.A., Dale, A.M., Badea, A., Johnson, G.A., 2005. Automated segmen-tation of neuroanatomical structures in multispectral MR microscopy ofthe mouse brain. Neuroimage 27 (2), 425–435.
Andreasen, A., Drewes, A., Assentoft, J., Larsen, N., Nielsen, H., Holm, I.,Geneser, F., 1992. Computer-assisted three-dimensional reconstructionof the hippocampal region based on serial sections. J. Neurosci. Methods37 (2), 151–160.
Annese, J., Sforza, D.M., Dubach, M., Bowden, D., Toga, A.W., 2006.Postmortem high-resolution 3-dimensional imaging of the primate brain:blockface imaging of perfusion stained tissue. Neuroimage 30 (1),61–69.
Araujo, D.M., Cherry, S.R., Tatsukawa, K.J., Toyokuni, T., Kornblum, H.I.,2000. Deficits in striatal dopamine D(2) receptors and energy me-tabolism detected by in vivo microPET imaging in a rat model ofHuntington's disease. Exp. Neurol. 166 (2), 287–297.
Ashburner, J., Friston, K., 1997. Spatial transformation of images. In:Frackowiak, R., Friston, K., Frith, C., Dolan, R., Mazziotta, J. (Eds.),Human Brain Function. Academic Press USA, pp. 43–58.
Ashburner, J., Friston, K.J., 1999. Nonlinear spatial normalization usingbasis functions. Hum. Brain Mapp. 7 (4), 254–266.
Aznavour, N., Rbah, L., Leger, L., Buda, C., Sastre, J., Imhof, A., Charnay,Z., Zimmer, L., 2006. A comparison of in vivo and in vitro neuroimagingof 5-HT(1A) receptor binding sites in the cat brain. J. Chem. Neuroanat.31 (3), 226–232.
Binns, K.E., 1999. The synaptic pharmacology underlying sensoryprocessing in the superior colliculus. Prog. Neurobiol. 59 (2), 129–159.
Bock, N.A., Kovacevic, N., Lipina, T.V., Roder, J.C., Ackerman, S.L.,Henkelman, R.M., 2006. In vivo magnetic resonance imaging andsemiautomated image analysis extend the brain phenotype for cdf/cdfmice. J. Neurosci. 26 (17), 4455–4459.
Brett, M., Valabregue, R., Poline, J.-B., 2003. Region of interest analysisusing an SPM toolbox (abstract). Neuroimage 16 (Suppl.) (CD-ROM).
Cannestra, A.F., Santori, E.M., Holmes, C.J., Toga, A.W., 1997. A three-dimensional multimodality brain map of the nemestrina monkey. BrainRes. Bull. 43 (2), 141–148.
Casteels, C., Vermaelen, P., Nuyts, J., Linden, A.V.D., Baekelandt, V.,Mortelmans, L., Bormans, G., Laere, K.V., 2006. Construction andevaluation of multitracer small-animal PET probabilistic atlases forvoxel-based functional mapping of the rat brain. J. Nucl. Med. 47 (11),1858–1866.
Cherry, S., Phelps, M., 1996. Imaging brain function with positron emissiontomography. In: Toga, A., Mazziotta, J. (Eds.), Brain mapping: Themethods.
Cointepas, Y., Mangin, J.-F., Garnero, L., Poline, J.-B., Benali, H., 2001.BrainVISA: Software platform for visualization and analysis of multi-modality brain data. Proc. 7th HBM. Brighton, United Kingdom, p. S98.
Cooper, R.M., Allen, K., 1995. Metabolic activity in rat visual system duringexposure to high and low intensities of patterned and diffuse light. Int. J.Neurosci. 81 (1–2), 27–34.
Cross, D.J., Minoshima, S., Anzai, Y., Flexman, J.A., Keogh, B.P., Kim, Y.,Maravilla, K.R., 2004. Statistical mapping of functional olfactoryconnections of the rat brain in vivo. Neuroimage 23 (4), 1326–1335.
Dauguet, J., Delzescaux, T., Condé, F., Mangin, J.-F., Ayache, N., Hantraye,P., Frouin, V., 2007. Three-dimensional reconstruction of stainedhistological slices and 3D non-linear registration with in-vivo MRI forwhole baboon brain. J. Neurosci. Methods 164 (1), 191–204.
Davatzikos, C., Li, H.H., Herskovits, E., Resnick, S.M., 2001. Accuracy andsensitivity of detection of activation foci in the brain via statisticalparametric mapping: a study using a PET simulator. Neuroimage 13 (1),176–184.
Deriche, R., 1987. Using Canny's criteria to derive a recursivelyimplemented optimal edge detector. The International Journal ofComputer Vision 1 (2), 167–187.
Dubois, A., Dauguet, J., Herard, A.-S., Besret, L., Duchesnay, E., Frouin, V.,Hantraye, P., Bonvento, G., Delzescaux, T., 2007. Automated three-dimensional analysis of histologic and autoradiographic rat brainsections: application to an activation study. J. Cereb. Blood FlowMetab. 27 (10), 1742–1755.
Friston, K.J., Frith, C.D., Liddle, P.F., Frackowiak, R.S., 1991. Comparingfunctional PET images: the assessment of significant change. J. Cereb.Blood Flow Metab. 11 (4), 690–699.
Friston, K.J., Holmes, A.P., Poline, J.B., Grasby, P.J., Williams, S.C.,Frackowiak, R.S., Turner, R., 1995. Analysis of fMRI time-seriesrevisited. Neuroimage 2 (1), 45–53.
Gallistel, C.R., Nichols, S., 1983. Resolution-limiting factors in 2-deoxyglucose autoradiography: I. factors other than diffusion. BrainRes. 267 (2), 323–333.
Goldszal, A., Tretiak, O., Hand, P., Bhasin, S., McEachron, D., 1995.Threedimensional reconstruction of activated columns from 2-[14C]deoxy-D-glucose data. Neuroimage 2 (1), 9–20.
Herard, A.S., Besret, L., Dubois, A., Dauguet, J., Delzescaux, T., Hantraye,P., Bonvento, G., Moya, K.L., 2006. siRNA targeted against amyloid
494 A. Dubois et al. / NeuroImage 40 (2008) 482–494
precursor protein impairs synaptic activity in vivo. Neurobiol. Aging 27(12), 1740–1750.
Hess, A., Lohmann, K., Gundelfinger, E., Scheich, H., 1998. A new meth-od for reliable and efficient reconstruction of 3-dimensional imagesfrom autoradiographs of brain sections. J. Neurosci. Methods 84 (1–2),77–86.
Hibbard, L., Hawkins, R., 1988. Objective image alignment for three-dimensional reconstruction of digital autoradiograms. J. Neurosci.Methods 26 (1), 55–74.
Holschneider, D.P., Yang, J., Sadler, T.R., Nguyen, P.T., Givrad, T.K.,Maarek, J.-M.I., 2006. Mapping cerebral blood flow changes duringauditory-cued conditioned fear in the nontethered, nonrestrained rat.Neuroimage 29 (4), 1344–1358.
Houston, G.C., Papadakis, N.G., Carpenter, T.A., Hall, L.D., Mukherjee, B.,James, M.F., Huang, C.L., 2001. Mapping of brain activation in responseto pharmacological agents using fMRI in the rat. Magn. Reson. Imaging19 (7), 905–919.
Jeffery, G., 1984. Retinal ganglion cell death and terminal field retraction inthe developing rodent visual system. Dev. Brain Res. 13, 81–96.
Kim, B., Boes, J., Frey, K., Meyer, C., 1997. Mutual information forautomated unwarping of rat brain autoradiographs. NeuroImage 5,31–40.
Lee, E.-F., Jacobs, R.E., Dinov, I., Leow, A., Toga, A.W., 2005a. Standardatlas space for C57BL/6J neonatal mouse brain. Anat. Embryol. (Berl)210 (4), 245–263.
Lee, J., Ahn, S.-H., Lee, D., Oh, S., Kim, C., Jeong, J., Park, K., Chung, J.-K.,Lee, M., 2005b. Voxel-based statistical analysis of cerebral glucosemetabolism in the rat cortical deafness model by 3D reconstruction ofbrain from autoradiographic images. Eur. J. Nucl. Med. Mol. Imaging 32(6), 696–701.
Leergaard, T.B., Bjaalie, J.G., Devor, A., Wald, L.L., Dale, A.M., 2003. Invivo tracing of major rat brain pathways using manganese-enhancedmagnetic resonance imaging and three-dimensional digital atlasing.Neuroimage 20 (3), 1591–1600.
Mackenzie-Graham, A., Lee, E.F., Dinov, I.D., Bota, M., Shattuck, D.W.,Ruffins, S., Yuan, H., Konstantinidis, F., Pitiot, A., Ding, Y., Hu, G.,Jacobs, R.E., Toga, A.W., 2004. A multimodal, multidimensional atlasof the C57BL/6J mouse brain. J. Anat. 204 (2), 93–102.
Malandain, G., Bardinet, E., Nelissen, K., Vanduffel, W., 2004. Fusion ofautoradiographs with an MR volume using 2-D and 3-D lineartransformations. NeuroImage 23 (1), 111–127.
Mangin, J.F., Coulon, O., Frouin, V., 1998. Robust brain segmentation usinghistogram scale–space analysis and mathematical morphology. Proc. 1stMICCAI. LNCS-1496. Springer Verlag, MIT, Boston, pp. 1230–1241.
McIntosh, A.R., Cooper, R.M., 1989. Movement and novelty of a squarewave display affect 2-deoxyglucose uptake in the rat visual system.Behav. Brain Res. 32 (1), 1–9.
Morris, P.G., 1999. Magnetic resonance imaging and magnetic resonancespectroscopy assessment of brain function in experimental animals andman. J. Psychopharmacol. 13 (4), 330–336.
Nguyen, P., Holschneider, D., Maarek, J., Yang, J., Mandelkern, M., 2004.Statistical parametric mapping applied to an autoradiographic study ofcerebral activation during treadmill walking in rats. NeuroImage 23 (1),252–259.
Nikou, C., Heitz, F., Nehlig, A., Namer, I., Armspach, J., 2003. A robuststatistics-based global energy function for the alignment of seriallyacquired autoradiographic sections. J. Neurosci. Methods 124 (1),93–102.
Ourselin, S., Roche, A., Subsol, G., Pennec, X., Ayache, N., 2001. Re-constructing a 3D structure from serial histological sections. Image andVision Computing 19 (1–2), 25–31.
Paxinos, G., Watson, C., 1998. The Rat Brain in Stereotaxic cooordinates.Academic Press, Orlando, FL.
Pitiot, A., Bardinet, E., Thompson, P.M., Malandain, G., 2006. Piecewiseaffine registration of biological images for volume reconstruction. Med.Image Anal. 10 (3), 465–483.
Prima, S., Ourselin, S., Ayache, N., 2002. Computation of the mid-sagittalplane in 3D brain images. IEEE Transaction on Medical Imaging 21 (2),122–138.
Rangarajan, A., Chui, H., Mjolsness, E., Pappu, S., Davachi, L., Goldman-Rakic, P., Duncan, J., 1997. A robust point-matching algorithm forautoradiograph alignment. Med. Image Anal. 1 (4), 379–398.
Rooney, B.J., Cooper, R.M., 1988. Effects of square-wave gratings anddiffuse light on metabolic activity in the rat visual system. Brain Res.439 (1–2), 311–321.
Schmidt, K., Smith, C., 2005. Resolution, sensitivity and precision withautoradiography and small animal positron emission tomography:implications for functional brain imaging in animal research. Nucl.Med. Biol. 32 (7), 719–725.
Schwarz, A.J., Danckaert, A., Reese, T., Gozzi, A., Paxinos, G., Watson, C.,Merlo-Pich, E.V., Bifone, A., 2006. A stereotaxic MRI template set forthe rat brain with tissue class distribution maps and co-registeredanatomical atlas: application to pharmacological MRI. Neuroimage 32(2), 538–550.
Schweinhardt, P., Fransson, P., Olson, L., Spenger, C., Andersson, J.L.R.,2003. A template for spatial normalisation of MR images of the rat brain.J. Neurosci. Methods 129 (2), 105–113.
Sokoloff, L., 1977. Relation between physiological function and energymetabolism in the central nervous system. J. Neurochem. 29 (1), 13–26.
Sokoloff, L., 1979. The [14C]deoxyglucose method: four years later. ActaNeurol. Scand., Suppl. 72, 640–649.
Thanos, P.K., Taintor, N.B., Alexoff, D., Vaska, P., Logan, J., Grandy, D.K.,Fang, Y., Lee, J.H., Fowler, J.S., Volkow, N.D., Rubinstein, M., 2002. Invivo comparative imaging of dopamine D2 knockout and wild-type micewith (11)C-raclopride and microPET. J. Nucl. Med. 43 (11), 1570–1577.
Thevenaz, P., Ruttimann, U., Unser, M., 1998. A pyramid approach tosubpixel registration based on intensity. IEEE Transactions on MedicalImaging 7 (1), 27–41.
Toga, A., Collins, R., 1981. Metabolic response to optic centers to visualstimuli in the albino rat: anatomical and physiological considerations.J. Comp. Neurol. 199 (4), 443–464.
Toga, A.W., Ambach, K., Quinn, B., Hutchin, M., Burton, J.S., 1994a.Postmortem anatomy from cryosectioned whole human brain. J.Neurosci. Methods 54 (2), 239–252.
Toga, A.W., Ambach, K.L., Schluender, S., 1994b. High-resolution anatomyfrom in situ human brain. Neuroimage 1 (4), 334–344.
Toyama, H., Ichise, M., Liow, J.S., Modell, K.J., Vines, D.C., Esaki, T.,Cook, M., Seidel, J., Sokoloff, L., Green, M.V., Innis, R.B., 2004.Absolute quantification of regional cerebral glucose utilization in miceby 18F-FDG small animal PET scanning and 2-14C-DG autoradiography.J. Nucl. Med. 45 (8), 1398–1405.
Worsley, K., Marrett, S., Neelin, P., Vanda, A., Friston, K., Evans, A., 1996.A unified statistical approach for determining significant signals inimages of cerebral activation. Human Brain Mapping 4, 58–73.
Zhao, W., Ginsberg, M.D., Smith, D.W., 1995. Three-dimensionalquantitative autoradiography by disparity analysis: theory and applica-tion to image averaging of local cerebral glucose utilization. J. Cereb.Blood Flow Metab. 15 (4), 552–565.
Zhao, W., Wu, C., Yin, K., Young, T.Y., Ginsberg, M.D., 2006. Pixel-basedstatistical analysis by a 3D clustering approach: application to auto-radiographic images. Comput. Methods Programs Biomed. 83 (1),18–28.
Copyright © 2022 FDOKUMEN