Spatial distribution of neo-intimal hyperplasia 6 months after zotarolimus-eluting stent...
8
Archives of Cardiovascular Disease (2011) 104, 147—154 CLINICAL RESEARCH Spatial distribution of neo-intimal hyperplasia 6 months after zotarolimus-eluting stent implantation, analysed by optical coherence tomography Distribution spatiale de l’hyperplasie néo-intimale six mois après implantation de stents actifs au zotarolimus analysée par tomographie par cohérence optique Geraud Souteyrand a,b,d,∗ , Sebastien Levesque a , Lemlih Ouchchane b,c , Laurent Sarry b , Romain Eschalier a , Jean-René Lusson a,b , Pascal Motreff a,b a Department of Cardiology, Clermont-Ferrand University Hospital, Clermont-Ferrand, France b ERIM-EA3295, University of Auvergne, Clermont-Ferrand, France c Department of Biostatistics, Faculty of Medicine, University of Auvergne, Clermont-Ferrand, France d Department of Cardiology, Gabriel Montpied Hospital, CHU Clermont-Ferrand, 63003 Clermont-Ferrand, France Received 10 September 2010; received in revised form 9 December 2010; accepted 17 December 2010 KEYWORDS Optical coherence tomography; Neointimal hyperplasia; Zotarolimus-eluting stent Summary Background. — Optical coherence tomography is a high-resolution imaging technology that allows in vivo assessment of neointimal hyperplasia and strut coverage after coronary stenting. Aim. — Assessment of spatial distribution of healing, 6 months after zotarolimus-eluting stent implantation. Methods. — Forty-two zotarolimus-eluting stents were monitored by optical coherence tomog- raphy 6 months after implantation. Mean neointimal strut coverage thickness and percentage of neointimal hyperplasia were measured every millimetre. Non-covered strut ratios were assessed on each slice. In addition, the spatial distribution of neointimal hyperplasia and strut coverage were analysed longitudinally on five stent segments and axially on each slice. Abbreviations: DES, drug-eluting stent; NIH, neointimal hyperplasia; OCT, optical coherence tomography; PES, paclitaxel-eluting stent; QCA, quantitative coronary angiography; SES, sirolimus-eluting stent; ZES, zotarolimus-eluting stent. ∗ Corresponding author. E-mail address: [email protected] (G. Souteyrand). 1875-2136/$ — see front matter © 2011 Elsevier Masson SAS. All rights reserved. doi:10.1016/j.acvd.2010.12.004
-
Upload
independent -
Category
Documents
-
view
2 -
download
0
Transcript of Spatial distribution of neo-intimal hyperplasia 6 months after zotarolimus-eluting stent...

Archives of Cardiovascular Disease (2011) 104, 147—154
CLINICAL RESEARCH
Spatial distribution of neo-intimal hyperplasia 6months after zotarolimus-eluting stent implantation,analysed by optical coherence tomography
Distribution spatiale de l’hyperplasie néo-intimale six mois après implantationde stents actifs au zotarolimus analysée par tomographie par cohérenceoptique
Geraud Souteyranda,b,d,∗, Sebastien Levesquea,Lemlih Ouchchaneb,c, Laurent Sarryb,Romain Eschaliera, Jean-René Lussona,b,Pascal Motreffa,b
a Department of Cardiology, Clermont-Ferrand University Hospital, Clermont-Ferrand, Franceb ERIM-EA3295, University of Auvergne, Clermont-Ferrand, Francec Department of Biostatistics, Faculty of Medicine, University of Auvergne,Clermont-Ferrand, Franced Department of Cardiology, Gabriel Montpied Hospital, CHU Clermont-Ferrand, 63003Clermont-Ferrand, France
Received 10 September 2010; received in revised form 9 December 2010; accepted 17 December2010
KEYWORDSOptical coherencetomography;Neointimal
SummaryBackground. — Optical coherence tomography is a high-resolution imaging technology thatallows in vivo assessment of neointimal hyperplasia and strut coverage after coronary stenting.Aim. — Assessment of spatial distribution of healing, 6 months after zotarolimus-eluting stent
hyperplasia;Zotarolimus-elutingstent
implantation.Methods. — Forty-two zotarolimus-eluting stents were monitored by optical coherence tomog-raphy 6 months after implantation. Mean neointimal strut coverage thickness and percentage ofneointimal hyperplasia were measured every millimetre. Non-covered strut ratios were assessedon each slice. In addition, the spatial distribution of neointimal hyperplasia and strut coveragewere analysed longitudinally on five stent segments and axially on each slice.
Abbreviations: DES, drug-eluting stent; NIH, neointimal hyperplasia; OCT, optical coherence tomography; PES, paclitaxel-elutingstent; QCA, quantitative coronary angiography; SES, sirolimus-eluting stent; ZES, zotarolimus-eluting stent.
∗ Corresponding author.E-mail address: [email protected] (G. Souteyrand).
1875-2136/$ — see front matter © 2011 Elsevier Masson SAS. All rights reserved.doi:10.1016/j.acvd.2010.12.004

148 G. Souteyrand et al.
Results. — There were no clinical events at 6 months under dual antiplatelet therapy. Theoptical coherence tomography analysis showed a mean neointimal hyperplasia thickness of333 ± 147 �m and neointimal hyperplasia obstruction of 36.1 ± 12.3%. The percentage of cov-ered struts at 6 months was very high (98.9%). Only 6/745 slices analysed (0.8%) had non-coveredstrut ratios exceeding 30%. There was no significant heterogeneity in either longitudinal or axialneointimal hyperplasia distribution. No thrombi were observed.Conclusion. — This optical coherence tomography study found relatively constant neointimalhyperplasia thickness, regardless of the zotarolimus-eluting stent length or diameter. This spa-tially homogeneous neointimal hyperplasia was associated with near-total coverage of all struts,6 months after implantation.© 2011 Elsevier Masson SAS. All rights reserved.
MOTS CLÉSImagerie parcohérence optique ;Hyperplasienéo-intimale ;Stent actif auzotarolimus
RésuméContexte. — L’imagerie par cohérence optique (OCT) est une imagerie de haute résolution per-mettant l’analyse in vivo de l’hyperplasie néo-intimale et de la couverture des mailles desstents.Objectif. — Analyse quantitative de la couverture néo-intimale de stents au zotarolimus à sixmois et de sa distribution spatiale.Méthode. — Quarante-deux stents au zotarolimus ont été contrôlé par OCT six mois après leurimplantation. L’épaisseur moyenne de la couverture néo-intimale des mailles et le pourcentaged’hyperplasie néo-intimale ont été mesurés tous les millimètres. Sur chaque coupe, le ratio demailles non couvertes est mesuré. La distribution spatiale de l’hyperplasie néo-intimale et dela couverture du stent est analysée longitudinalement sur cinq segments du stent et axialementsur chaque coupe.Résultats. — Il n’y a pas eu d’évènements cliniques à six mois sous double anti-agrégationplaquettaire. L’analyse OCT retrouve une épaisseur moyenne d’hyperplasie néo-intimale de333 ± 147 �m et une obstruction néo-intimale de 36,1 ± 12,3 %. Le pourcentage de mailles cou-vertes à six mois est élevé de 98,9 %. Seulement six coupes sur les 745 analysées (0,8 %) ontun ratio de mailles non couvertes/couvertes de plus de 30 %. La distribution de l’hyperplasienéo-intimale est homogène en axial et en longitudinal. Aucun thrombus n’a été visualisé.Conclusion. — Cette analyse OCT retrouve une épaisseur d’hyperplasie néo-intimale relative-ment homogène dans le stent, quelle que soit sa longueur ou son diamètre. Cette homogénéitéd’hyperplasie néo-intimale est associée à une couverture quasi totale des mailles six mois après
. Tou
B
Rrspsaaioai
[rstb
to
sfm
sZ
M
S
B(iwi
l’implantation des stents.© 2011 Elsevier Masson SAS
ackground
andomised studies have shown that DESs significantlyeduce clinical restenosis rates compared with bare-metaltents [1—4]. This benefit is due to inhibition of intimal neo-roliferation [5]. Animal and autopsy studies, however, havehown this effect to be associated with delayed or deficientrterial healing. It is therefore advisable to continue dualntiplatelet therapy beyond the first month post stenting,n order to avoid late intrastent thrombosis [6]. In a seriesf 8000 DESs, Wenaweser et al. reported a consistent 0.6%nnual late thrombosis rate over the first 4 years post stent-ng [7].
Intrastent thrombosis is a multifactorial phenomenon8], but one significant factor is failure of stent—strute-endothelialization [9]. Post-mortem studies of stentedubjects [10] have reported deficient re-endothelialization
o be more frequently associated with late intrastent throm-osis than with other causes of death [11,12].OCT is a high-resolution (around 10 microns) imagingechnology that is particularly well adapted for the studyf the most superficial layers of the vessel wall and for
tOscD
s droits réservés.
trut-by-strut stent analysis. Several recent studies haveocused on OCT analysis of neointimal coverage in bare-etal and first-generation DESs [13—16].The present study used OCT to quantify and analyse the
patial distribution of NIH and strut coverage, 6 months afterES implantation.
ethods
tudy population and methods
etween October 2006 and September 2007, 25 patients21 men, four women) gave consent and were includedn this prospective, observational study. These 25 patientsere selected from the 220 patients who underwent ZES
mplantation in our centre during the study period, using
he following inclusion criteria: consent and feasibility ofCT. Exclusion criteria were left main coronary artery steno-is, bypass lesion, ostial stenosis, renal insufficiency, acuteoronary syndrome, stent overlapping, contraindication forES and OCT limitations. OCT limitations were tortuous and
lw0d3ilaalSli
O
Ot
Zotarolimus-eluting stent analysed by OCT
calcified vessels, proximal lesion or large coronary diame-ter (> 3.5 mm) preventing the good saline flush downstreamof an occlusion balloon that is necessary for image quality.The 25 patients underwent native coronary stenting, using atotal of 42 ZESs. Angiographic analyses were done at base-line and after angioplasty. The angiograms were evaluatedby a QCA system (QuantCor, CASS II, Siemens, Erlangen, Ger-many). An angiographic control with OCT was scheduled at 6months post stenting. Restenosis was defined as > 50% lumennarrowing on QCA.
Optical coherence tomography procedure
Optical coherence tomography at 6 months post stentingimmediately followed the control angiography. A 6F catheterwas used to inject 30 UI/kg of unfractionated heparin intra-arterially. A 0.014-inch guide was introduced into the vesseland positioned distally to the stent. A HeliosTM coaxial occlu-sion balloon catheter (LightLab Imaging, Westford, MA, USA)
was then introduced along the guide across the vessel untilthe balloon marker was at the distal extremity of the stent.The guide was then withdrawn and replaced by a 1.4F opticfibre, connected up to the OCT system (M2 version, LightLabImaging, Westford, MA, USA) and inserted through the bal-ib
•
a
b
c
Figure 1. Stent analysis on optical coherence tomography millimetric immalapposed; D. facing collateral); (b) quantitative analysis (neointimal hstrut [red arrows]); (c) longitudinal analysis in five segments of equal lengtD2: distal).
149
oon until distal to the stent. The occlusion balloon was thenithdrawn until proximal to the DES and inflated to between.4 and 0.7 atm. Physiological saline was then injectedownstream of the occlusion balloon via its coaxial catheter;0 mL were injected during each pullback. OCT gives a clearmage once the lumen is sufficiently transparent. Automaticight-source pullback then began (1 mm/s, with 15 image/scquisitions). A 30-mm DICOM-format video recording of thertery was made, including the stented segment. The bal-oon was then deflated and the saline injection stopped.everal pullbacks were sometimes needed for analysis of theongest stents. Pullback was repeated until perfect visual-zation of the whole length of all stents was obtained.
ptical coherence tomography analysis
ptical coherence tomography images were selected fromhe DICOM pullback recordings every millimetre (every 15
mages) over the entire stented segment and were analysedy two independent operators (Fig. 1).Each strut was classified into one of four categories:well apposed to vessel wall with apparent neointimal cov-erage (A);
ages: (a) qualitative strut analysis (A. covered; B. non-covered; C.yperplasia area [green]; lumen area [red]; coverage thickness perh (P2: proximal; P1: proximal-medial; M: medial; D1: distal-medial;
1 G. Souteyrand et al.
•
•
•
t0
c•
•
•
bma
mela
S
Cpmuwltps
I
R
P
Piseww
iS3
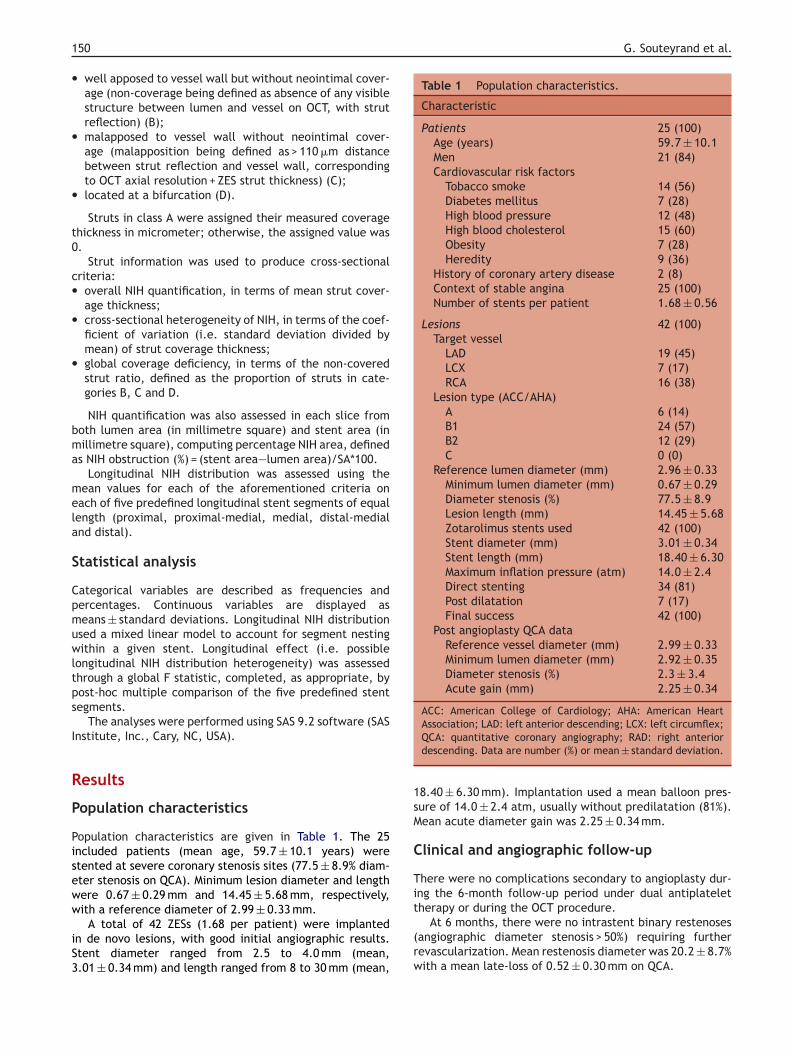
Table 1 Population characteristics.
Characteristic
Patients 25 (100)Age (years) 59.7 ± 10.1Men 21 (84)Cardiovascular risk factors
Tobacco smoke 14 (56)Diabetes mellitus 7 (28)High blood pressure 12 (48)High blood cholesterol 15 (60)Obesity 7 (28)Heredity 9 (36)
History of coronary artery disease 2 (8)Context of stable angina 25 (100)Number of stents per patient 1.68 ± 0.56
Lesions 42 (100)Target vessel
LAD 19 (45)LCX 7 (17)RCA 16 (38)
Lesion type (ACC/AHA)A 6 (14)B1 24 (57)B2 12 (29)C 0 (0)
Reference lumen diameter (mm) 2.96 ± 0.33Minimum lumen diameter (mm) 0.67 ± 0.29Diameter stenosis (%) 77.5 ± 8.9Lesion length (mm) 14.45 ± 5.68Zotarolimus stents used 42 (100)Stent diameter (mm) 3.01 ± 0.34Stent length (mm) 18.40 ± 6.30Maximum inflation pressure (atm) 14.0 ± 2.4Direct stenting 34 (81)Post dilatation 7 (17)Final success 42 (100)
Post angioplasty QCA dataReference vessel diameter (mm) 2.99 ± 0.33Minimum lumen diameter (mm) 2.92 ± 0.35Diameter stenosis (%) 2.3 ± 3.4Acute gain (mm) 2.25 ± 0.34
ACC: American College of Cardiology; AHA: American Heart
1sM
C
Ti
50
well apposed to vessel wall but without neointimal cover-age (non-coverage being defined as absence of any visiblestructure between lumen and vessel on OCT, with strutreflection) (B);malapposed to vessel wall without neointimal cover-age (malapposition being defined as > 110 �m distancebetween strut reflection and vessel wall, correspondingto OCT axial resolution + ZES strut thickness) (C);located at a bifurcation (D).
Struts in class A were assigned their measured coveragehickness in micrometer; otherwise, the assigned value was.
Strut information was used to produce cross-sectionalriteria:
overall NIH quantification, in terms of mean strut cover-age thickness;cross-sectional heterogeneity of NIH, in terms of the coef-ficient of variation (i.e. standard deviation divided bymean) of strut coverage thickness;global coverage deficiency, in terms of the non-coveredstrut ratio, defined as the proportion of struts in cate-gories B, C and D.
NIH quantification was also assessed in each slice fromoth lumen area (in millimetre square) and stent area (inillimetre square), computing percentage NIH area, defined
s NIH obstruction (%) = (stent area—lumen area)/SA*100.Longitudinal NIH distribution was assessed using the
ean values for each of the aforementioned criteria onach of five predefined longitudinal stent segments of equalength (proximal, proximal-medial, medial, distal-medialnd distal).
tatistical analysis
ategorical variables are described as frequencies andercentages. Continuous variables are displayed aseans ± standard deviations. Longitudinal NIH distribution
sed a mixed linear model to account for segment nestingithin a given stent. Longitudinal effect (i.e. possible
ongitudinal NIH distribution heterogeneity) was assessedhrough a global F statistic, completed, as appropriate, byost-hoc multiple comparison of the five predefined stentegments.
The analyses were performed using SAS 9.2 software (SASnstitute, Inc., Cary, NC, USA).
esults
opulation characteristics
opulation characteristics are given in Table 1. The 25ncluded patients (mean age, 59.7 ± 10.1 years) weretented at severe coronary stenosis sites (77.5 ± 8.9% diam-ter stenosis on QCA). Minimum lesion diameter and lengthere 0.67 ± 0.29 mm and 14.45 ± 5.68 mm, respectively,
ith a reference diameter of 2.99 ± 0.33 mm.A total of 42 ZESs (1.68 per patient) were implantedn de novo lesions, with good initial angiographic results.tent diameter ranged from 2.5 to 4.0 mm (mean,.01 ± 0.34 mm) and length ranged from 8 to 30 mm (mean,
t
(rw
Association; LAD: left anterior descending; LCX: left circumflex;QCA: quantitative coronary angiography; RAD: right anteriordescending. Data are number (%) or mean ± standard deviation.
8.40 ± 6.30 mm). Implantation used a mean balloon pres-ure of 14.0 ± 2.4 atm, usually without predilatation (81%).ean acute diameter gain was 2.25 ± 0.34 mm.
linical and angiographic follow-up
here were no complications secondary to angioplasty dur-ng the 6-month follow-up period under dual antiplatelet
herapy or during the OCT procedure.At 6 months, there were no intrastent binary restenosesangiographic diameter stenosis > 50%) requiring furtherevascularization. Mean restenosis diameter was 20.2 ± 8.7%ith a mean late-loss of 0.52 ± 0.30 mm on QCA.

Zotarolimus-eluting stent analysed by OCT 151
Optical coherence tomography analysis
Optical coherence tomography was feasible in all 25 patientsand 69 pullbacks were performed to analyse the 42 stents(1.64 per stent). In all, 745 mm of stent were studied, and10 169 struts were visualized. Strut coverage thickness wasassessed by two independent operators. Concordance onquantitative measurements was virtually perfect, with anintraclass correlation coefficient of 0.99. The value sub-mitted for analysis was the mean of the two observers’estimates. Strut coverage was likewise classified in thefour exclusive categories by the two independent observers,
Table 2 Results of optical coherence tomographyanalysis.
Variable
QCA dataReference lumen diameter
(mm)3.00 ± 0.33
Minimum lumen diameter (mm) 2.40 ± 0.46Diameter stenosis (%) 20.2 ± 8.7Late-loss (mm) 0.52 ± 0.30
OCT dataStents (n = 42)
Lumen area (mm2) 5.46 ± 2.17Stent area (mm2) 8.31 ± 2.15NIH area (mm2) 2.85 ± 0.82NIH obstruction (%) 36.1 ± 12.3Lumen diameter (mm) 2.57 ± 0.52Stent diameter (mm) 3.22 ± 0.41NIH thickness (mm) 0.65 ± 0.23
Cross sections (n = 745)Number of cross sections per
stent17.7 ± 5.7
Cross sections with allcovered struts
699 (93.8)
Cross sections withnon-covered struts
23 (3.1)
Cross sections withmalapposed struts
11 (1.5)
Cross sections with strutsfacing a collateral branch
12 (1.6)
Cross sections with thrombus 0 (0)Cross sections with
non-covered strutratio > 0.3
6 (0.8)
Struts (n = 10169)Number of struts per stent 242.1 ± 92Covered struts 10058 (98.9)Non-covered struts 46 (0.5)Malapposed struts 47 (0.5)Collateral struts 18 (0.2)Coverage thickness per strut
(�m)333 ± 147
NIH: neointimal hyperplasia; OCT: optical coherence tomogra-phy; QCA: quantitative coronary angiography. Data are number(%) or mean ± standard deviation.
again with virtually perfect agreement (kappa = 0.99). Incase of disagreement, the category to be adopted for anal-ysis was determined by a third observer. Results are shownin Table 2.
Neointimal hyperplasiaMean stent area was 8.31 ± 2.15 m2 and mean lumen areawas 5.46 ± 2.17 mm2. Mean NIH area was 2.85 ± 0.82 mm2,with a percentage obstruction of 36.1 ± 12.3%. Consideringlumen area and stent area as disks, with diameters cal-culated as diameter = 2*
√(area/�), mean stent diameter,
lumen diameter and NIH thickness were 3.22 ± 0.41 mm,2.57 ± 0.52 mm and 0.65 ± 0.23 mm, respectively. Mean cov-erage thickness measured on each strut (n = 10,169) was333 ± 147 �m for 42 ZESs.
Neointimal strut coverageThe incidence of non-covered struts was very low at 6months (111/10,169; non-covered strut ratio = 1.1%). Only65 struts were observed to be remote from the coronarywall because of malapposition (0.5%) or a collateral branch(0.2%). On most slices, all struts were covered (699/745,93.8%). No thrombi were observed in any of the 42 stents.
The rate of cross sections with a non-covered strutratio > 0.3 was very low (6/745, 0.8%). On the 745 slices,a converse relation was also found between non-coveredstrut ratio and strut coverage thickness or NIH percentageobstruction (Fig. 2).
Spatial distribution of neointimal hyperplasiaFig. 3 shows mean stent area, lumen area, NIH area, strutcoverage thicknesses, NIH obstruction and non-covered strutratio on the 745 slices and in each segment. There wereno significant differences in longitudinal distribution withregard to any of the criteria studied (p > 0.05).
Figure 2. Relationship between strut coverage thickness (�m),neointimal hyperplasia (NIH) obstruction (%) and non-covered strutratio, studied on 745 optical coherence tomography slices (699slices with all struts covered; 28 slices with non-covered strut [NCS]ratio < 0.15; 12 slices with NCS ratio between 0.15 and 0.30; sixslices with NCS ratio > 0.30).

1
(th
D
OhspstA
aDr0Z[
at
F(7Mp
52
Mean cross-sectional NIH heterogeneity was very low0.375 ± 0.107). No longitudinal effect was found on this cri-erion (p = 0.662), suggesting a high level of longitudinal NIHomogeneity.
iscussion
ptical coherence tomography is a particularly effective,igh-resolution, imaging technique for analysing the more
uperficial coronary layers and controlling stenting. Theresent study confirms the feasibility of the technique inelected lesions and the good reproducibility of its qualita-ive and quantitative analysis of neointimal stent coverage.ll 42 stents initially selected for control were analysed.NaacN
igure 3. Spatial distribution of neointimal hyperplasia (NIH) and strun = 42), from quantitative optical coherence tomography analysis. A. M45 slices; mean areas in five longitudinal stent segments (P2: proximal;ean strut coverage thickness (�m) in all cross sections and in five lonercentage obstruction (points). C. Mean non-covered strut ratio in all c
G. Souteyrand et al.
Previous angiographic findings showed greater late-lossfter implantation of a ZES compared with a first-generationES (SES or PES). In 11 randomised trials, Pocock et al.eported a late-loss of less than 0.21 mm with SESs, between.30 and 0.49 mm with PESs, between 0.60 and 0.61 mm withESs, and between 0.80 and 1.06 mm with bare-metal stents17].
Comparative OCT studies have confirmed greater NIHfter ZES implantation. Kim et al. [18] observed a mean NIHhickness of 251.2 vs 85.5 �m (p < 0.001) and a percentage
IH area of 27.9 vs 11.2% (p < 0.001) at 9 months with ZESsnd SESs, respectively. In a previous study [19], we foundsignificant difference between ZESs and PESs: mean strutoverage thickness 333 vs 154 �m (p < 0.001) and percentageIH area 38 vs 17% (p < 0.001), respectively.
t coverage, 6 months after zotarolimus-eluting stent implantationean stent area, NIH area (NIHA) and lumen area (LA) (mm2) in allP1: proximal-medial; M: medial; D1: distal-medial; D2: distal). B.
gitudinal stent segments (bars), and neointimal hyperplasia (NIH)ross sections and in five longitudinal stent segments.

Zotarolimus-eluting stent analysed by OCT 153
eointnths
us[
e(fazg
lfinsatm[b
abmtr
Figure 4. Relationship between mean strut coverage thickness, ntomography and stent length (A, B) and stent diameter (C, D), 6 mo
Guagliumi et al. reported a similar difference in theODESSA trial [20], in which 77 patients (189 stents) were ran-domised and monitored by OCT 6 months after long-lesionstenting requiring overlapping stents: mean percentage NIHwas 19.3% with SESs, 31.5% with PESs, 45.2% with ZESs and57.8% with bare-metal stents.
The present mean 0.333 mm strut coverage thickness(to be multiplied by two to obtain the OCT diameter late-loss value) agrees with the late-loss values reported in theENDEAVOR II and IV studies (0.61 and 0.67 mm, respec-tively [21]). It was noteworthy that coverage thickness wasindependent of stent diameter or length (Fig. 4), mak-ing percentage obstruction greater with small-diameterstents (Fig. 4D); with a constant strut coverage thicknessof 0.333 mm, obstruction with a 2.5 mm diameter stent the-oretically approximates 50%.
ZES strut coverage was virtually complete by 6 months. Inother series [18—20], as in the present, no thrombi were everreported and ZES strut coverage was almost total on OCT.First-generation DES coverage was less at 6 or 9 months, with8 to 12% of SES struts remaining non-covered [14,18,20],and was still incomplete at 24 months (5% non-covered SESstruts) [22].
The originality of the present study lay in its analy-sis of the spatial distribution of NIH at six months poststenting. NIH proved homogeneous in terms of both cov-erage thickness and non-covered strut ratio, longitudinally
and axially. There were no significant differences betweenthe five longitudinal stent segments, while NIH variabilitywas very low on all slices. These data suggest that, in thepresent series, the coronary response to zotarolimus washomogeneous.abOtv
imal hyperplasia (NIH) obstruction measured by optical coherenceafter zotarolimus-eluting stent implantation (n = 42).
Non-uniform NIH was observed in previous intravascularltrasound studies of SESs, attributed by the authors to pos-ible non-uniform stent distribution, stent under-expansion23,24] or a heterogeneous local response to the drug [25].
In the present series, the homogeneous reaction may bexplained by the non-occurrence of stent under-expansionconfirmed by stent area measurement), lesion selectionor OCT feasibility, which excluded more complex plaques,nd the absence of overlapping. The specific impact ofotarolimus or of the stent platform will need to be investi-ated in larger-scale, comparative studies.
Anatomopathology studies reported delayed endothe-ialization after DES implantation. Post-mortem studies onrst-generation DESs found NIH to be sometimes heteroge-eous, with a converse relationship between non-coveredtrut ratio and NIH thickness [11]. Finn et al. reported that
non-covered strut ratio of > 0.30 in a given cross sec-ion increased the intrastent thrombosis risk ninefold. Theost recent OCT studies have adopted this prognostic index
16,18]. We also found in the present series a relationshipetween NIH and non-covered strut ratio (Fig. 2).
Deficient strut coverage on OCT can be considered to bethrombosis risk marker. There is, however, a discrepancy
etween the rate of non-covered active stents at severalonths post implantation and the much lower rate of late
hrombosis. Such ‘‘vulnerable’’ stents may be at increasedisk of thrombosis in case of termination of or resistance to
ntiplatelet therapy. If a correlation could be demonstratedetween OCT findings and large-scale clinical study results,CT might be able to guide the duration of dual antiplateletherapy, comparing theoretical late thrombosis risk for thearious kinds of stent.
1
S
TpsIcafCru
C
Oshmscotmrrbs
D
Tc
R
[
[
[
[
[
[
[
[
[
[
[
[
[
[
[
54
tudy limitations
here are some limitations to this study. The series com-rised only 25 patients and analysis concerned only 42tents. Lesions were selected for OCT (M2 version, LightLabmaging) feasibility. The most complex stenoses (bifur-ations, overlapping, in tortuous or calcified coronaryrteries) were excluded. Moreover, despite its good per-ormance, OCT cannot be assimilated to in vivo histology.ertain aspects of coverage may, in fact, be due to fib-in or microthrombus. Conversely, endothelialization may benderestimated on OCT, when thin and translucent.
onclusion
CT provides precise measurement of NIH volume andtent—strut coverage. The present study found constant,omogeneous NIH, 6 months after ZES implantation. Theean strut coverage thickness of 333 �m did not lead to
ignificant angiographic stenosis or recurrent angina, butould be harmful for the smallest stent diameters. On thether hand, ZES strut coverage at 6 months was almostotal and homogeneous. The converse relationship betweenean strut coverage thickness and non-covered strut ratio
eported in anatomopathology was confirmed on OCT. Theelevance of these findings to the issue of intrastent throm-osis, especially on termination of antiplatelet biotherapy,hould be investigated in larger-scale clinical studies.
isclosure of interest
he authors declare that they have no conflicts of interestoncerning this article.
eferences
[1] Fajadet J, Wijns W, Laarman GJ, et al. Randomized, double-blind, multicenter study of the Endeavor zotarolimus-elutingphosphorylcholine-encapsulated stent for treatment of nativecoronary artery lesions: clinical and angiographic results of theENDEAVOR II trial. Circulation 2006;114:798—806.
[2] Moses JW, Leon MB, Popma JJ, et al. Sirolimus-eluting stentsversus standard stents in patients with stenosis in a nativecoronary artery. N Engl J Med 2003;349:1315—23.
[3] Stone GW, Ellis SG, Cox DA, et al. One-year clinical results withthe slow-release, polymer-based, paclitaxel-eluting TAXUSstent: the TAXUS-IV trial. Circulation 2004;109:1942—7.
[4] Stone GW, Ellis SG, Cox DA, et al. A polymer-based, paclitaxel-eluting stent in patients with coronary artery disease. N Engl JMed 2004;350:221—31.
[5] Babapulle MN, Joseph L, Belisle P, et al. A hierarchical Bayesianmeta-analysis of randomised clinical trials of drug-elutingstents. Lancet 2004;364:583—91.
[6] Iakovou I, Schmidt T, Bonizzoni E, et al. Incidence, predictors,and outcome of thrombosis after successful implantation of
drug-eluting stents. JAMA 2005;293:2126—30.[7] Wenaweser P, Daemen J, Zwahlen M, et al. Incidence andcorrelates of drug-eluting stent thrombosis in routine clini-cal practice. 4-year results from a large 2-institutional cohortstudy. J Am Coll Cardiol 2008;52:1134—40.
[
G. Souteyrand et al.
[8] Holmes Jr DR, Kereiakes DJ, Laskey WK, et al. Thrombosis anddrug-eluting stents: an objective appraisal. J Am Coll Cardiol2007;50:109—18.
[9] Awata M, Kotani J, Uematsu M, et al. Serial angioscopicevidence of incomplete neointimal coverage after sirolimus-eluting stent implantation: comparison with bare-metal stents.Circulation 2007;116:910—6.
10] Finn AV, Nakazawa G, Joner M, et al. Vascular responses to drug-eluting stents: importance of delayed healing. ArteriosclerThromb Vasc Biol 2007;27:1500—10.
11] Finn AV, Joner M, Nakazawa G, et al. Pathological correlates oflate drug-eluting stent thrombosis: strut coverage as a markerof endothelialization. Circulation 2007;115:2435—41.
12] Joner M, Finn AV, Farb A, et al. Pathology of drug-eluting stentsin humans: delayed healing and late thrombotic risk. J Am CollCardiol 2006;48:193—202.
13] Chen BX, Ma FY, Luo W, et al. Neointimal coverage of bare-metal and sirolimus-eluting stents evaluated with opticalcoherence tomography. Heart 2008;94:566—70.
14] Matsumoto D, Shite J, Shinke T, et al. Neointimal coverageof sirolimus-eluting stents at 6-month follow-up: evaluated byoptical coherence tomography. Eur Heart J 2007;28:961—7.
15] Takano M, Inami S, Jang IK, et al. Evaluation by opticalcoherence tomography of neointimal coverage of sirolimus-eluting stent three months after implantation. Am J Cardiol2007;99:1033—8.
16] Takano M, Yamamoto M, Inami S, et al. Long-term follow-upevaluation after sirolimus-eluting stent implantation by opticalcoherence tomography: do uncovered struts persist? J Am CollCardiol 2008;51:968—9.
17] Pocock SJ, Lansky AJ, Mehran R, et al. Angiographic surrogateend points in drug-eluting stent trials: a systematic evalua-tion based on individual patient data from 11 randomized,controlled trials. J Am Coll Cardiol 2008;51:23—32.
18] Kim JS, Jang IK, Kim TH, et al. Optical coherence tomog-raphy evaluation of zotarolimus-eluting stents at 9-monthfollow-up: comparison with sirolimus-eluting stents. Heart2009;95:1907—12.
19] Motreff P, Souteyrand G, Levesque S, et al. Compara-tive analysis of neointimal coverage with paclitaxel andzotarolimus drug-eluting stents, using optical coherencetomography 6 months after implantation. Arch Cardiovasc Dis2009;102:617—24.
20] Guagliumi G, Sirbu V, Suzuki N, et al. Prospective, random-ized, controlled study using optical coherence tomographyto evaluate strut coverage of Sirolimus-, Paclitaxel- andZotarolimus-Eluting coronary stents in long lesions requir-ing overlapping (ODESSA-OCT for DES safety). Am J Cardiol200;102. (abstract).
21] Kornovski R. The long-term results of the ‘‘Endeavor’’ stent.Catheter Cardiovasc Interv 2009;74:996—9.
22] Takano M, Yamamoto M, Xie Y, et al. Serial long-term evaluationof neointimal stent coverage and thrombus after sirolimus-eluting stent implantation by use of coronary angioscopy. Heart2007;93:1533—6.
23] Sano K, Mintz GS, Carlier SG, et al. Volumetric intravas-cular ultrasound assessment of neointimal hyperplasia andnon-uniform stent strut distribution in sirolimus-eluting stentrestenosis. Am J Cardiol 2006;98:1559—62.
24] Takebayashi H, Mintz GS, Carlier SG, et al. Non-uniformstrut distribution correlates with more neointimal hyper-plasia after sirolimus-eluting stent implantation. Circulation
2004;110:3430—4.25] Kaneda H, Ako J, Terashima M, et al. Distribution patternof neointimal hyperplasia following sirolimus-eluting stentimplantation assessed by 3-dimensional intravascular ultra-sound. Int J Cardiol 2009;135:243—5.