Space Station Wireless Local Area Network Signal Characteristics Modeling and Measurements
8
1-4244-0378-2/06/$20.00 ©2006 IEEE. 5D3-1 SPACE STATION WIRELESS LOCAL AREA NETWORK SIGNAL CHARACTERISTICS MODELING AND MEASUREMENTS Shian U. Hwu, Barrios Technology, and Yin-Chung Loh, Jacobs Engineering, Houston, TX Catherine C. Sham, NASA Johnson Space Center, Houston, TX Abstract This paper presents the signal characteristic analysis of the International Space Station 2.4 GHz Wireless Local Area Networks (WLANs). The test data indicate the Space Station RF environment is quite different from typical indoor environment. The empty Space Station modules may be regarded as oversized waveguides with very little propagation loss. The furnished Space Station modules are imperfect waveguides with many lossy materials presented. The propagation loss in both unfurnished and furnished module is less than in free space. It is observed that the propagation characteristics are significantly affected by the presence of the equipment and furniture inside the Space Station modules. The obtained results indicate the module geometry and interior furniture materials are the two important factors determining the propagation characteristics of the Space Station WLAN system. The analysis results from this paper are essential for Space Station WLAN access point placement and RF coverage performance determination. Introduction The propagation characteristics and signal distribution are the essential parameters for wireless network planning and systems performance analysis. Both theoretical and experimental studies indicate the propagation characteristics are very dependent on the specific RF environment. The International Space Station (ISS) uses 2.4 GHz Wireless Local Area Networks (WLANs) to provide continuous LAN services to mobile astronauts carrying portable computers. Wireless LANs can provide a flexibility not offered by wired systems when astronauts carry portable computers in the Space Station zero gravity environments. The wireless LANs also provide cost advantage on infrastructure initial installation and future modifications as compared to the traditional wired LANs. The performance of mobile communication systems, such as wireless LANs, is greatly affected by the RF environment between the transmitter and the receiver. Therefore, it is necessary to determine the signal distribution and RF coverage for system planning and performance evaluation. Figure 1. International Space Station module environment. The International Space Station consists of many modules, which are metallic cylindrical structures. The enclosed space and the one- dimensional extension make the Space Station modules a very unique propagation environment, as shown in Figure 1 and 2. Previous studies indicate the propagation characteristics are unique inside the Space Station module environment [1-3]. Small path loss for WLAN signals propagates inside the empty Space Station modules. However, the equipment furnished Space Station modules can be different due to the presence of many lossy materials from equipments and furniture. There is no universally applicable propagation model for RF coverage analysis in all environments. The RF coverage is typically based on intensive field measurements, which are expensive and time consuming. In this study, the signal characteristics are investigated experimentally inside a mockup resembling the Space Station module environment.
-
Upload
independent -
Category
Documents
-
view
1 -
download
0
Transcript of Space Station Wireless Local Area Network Signal Characteristics Modeling and Measurements
1-4244-0378-2/06/$20.00 ©2006 IEEE. 5D3-1
SPACE STATION WIRELESS LOCAL AREA NETWORK SIGNAL CHARACTERISTICS MODELING AND MEASUREMENTS
Shian U. Hwu, Barrios Technology, and Yin-Chung Loh, Jacobs Engineering, Houston, TX Catherine C. Sham, NASA Johnson Space Center, Houston, TX
Abstract This paper presents the signal characteristic
analysis of the International Space Station 2.4 GHz Wireless Local Area Networks (WLANs). The test data indicate the Space Station RF environment is quite different from typical indoor environment. The empty Space Station modules may be regarded as oversized waveguides with very little propagation loss. The furnished Space Station modules are imperfect waveguides with many lossy materials presented. The propagation loss in both unfurnished and furnished module is less than in free space. It is observed that the propagation characteristics are significantly affected by the presence of the equipment and furniture inside the Space Station modules. The obtained results indicate the module geometry and interior furniture materials are the two important factors determining the propagation characteristics of the Space Station WLAN system. The analysis results from this paper are essential for Space Station WLAN access point placement and RF coverage performance determination.
Introduction The propagation characteristics and signal
distribution are the essential parameters for wireless network planning and systems performance analysis. Both theoretical and experimental studies indicate the propagation characteristics are very dependent on the specific RF environment.
The International Space Station (ISS) uses 2.4 GHz Wireless Local Area Networks (WLANs) to provide continuous LAN services to mobile astronauts carrying portable computers. Wireless LANs can provide a flexibility not offered by wired systems when astronauts carry portable computers in the Space Station zero gravity environments. The wireless LANs also provide cost advantage on infrastructure initial installation and future modifications as compared to the traditional wired
LANs. The performance of mobile communication systems, such as wireless LANs, is greatly affected by the RF environment between the transmitter and the receiver. Therefore, it is necessary to determine the signal distribution and RF coverage for system planning and performance evaluation.
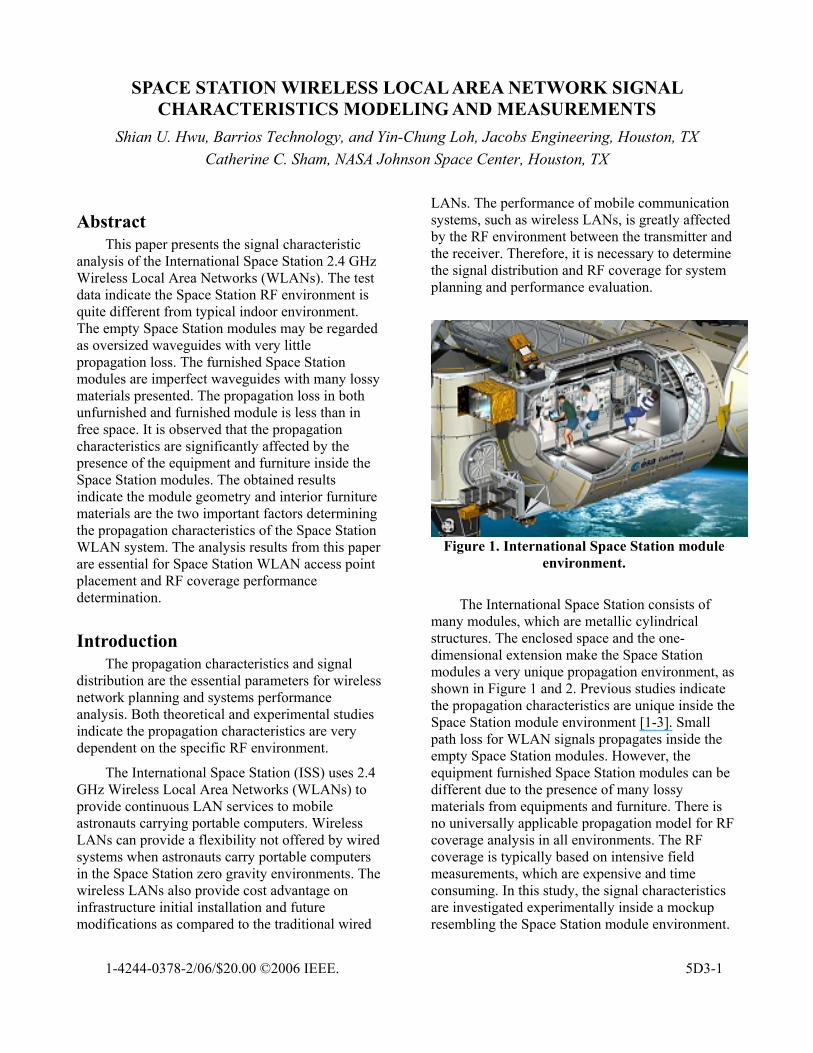
Figure 1. International Space Station module
environment.
The International Space Station consists of many modules, which are metallic cylindrical structures. The enclosed space and the one-dimensional extension make the Space Station modules a very unique propagation environment, as shown in Figure 1 and 2. Previous studies indicate the propagation characteristics are unique inside the Space Station module environment [1-3]. Small path loss for WLAN signals propagates inside the empty Space Station modules. However, the equipment furnished Space Station modules can be different due to the presence of many lossy materials from equipments and furniture. There is no universally applicable propagation model for RF coverage analysis in all environments. The RF coverage is typically based on intensive field measurements, which are expensive and time consuming. In this study, the signal characteristics are investigated experimentally inside a mockup resembling the Space Station module environment.

5D3-2
The signal distributions of the WLAN system inside the International Space Station were computed using the computational electromagnetic technique.
Figure 2. Inside International Space Station
module environment.
Experimental Investigation The signal strength measurements were
performed inside a trailer resembling the Space Station module. The measurement data were used to analyze the propagation characteristics in the Space Station RF environment [4]. The measurements were performed in both unfurnished and furnished module mockups. The module mockup is a rectangular box with dimensions of 28 ft long, a cross-section 8 ft high and 8 ft width. The transmitting and receiving antennas are quarter-wave monopoles, vertically polarized and located in the middle of the module. The propagation loss in the Space Station environment was compared to the free space environment. Comparisons were made between unfurnished and furnished modules. A circular polarized patch antenna was also tested and compared with monopole antenna. The effects of a human body blockage on received signal levels were also investigated. Data obtained from the measurements were compared and discussed in the following sections.
Propagation Loss Figure 3 shows the signal strength versus the
distance between the transmitter and the receiver inside the empty module. The signal strengths inside the unfurnished module are much stronger
than in the free space environment. This indicates the propagation loss inside the unfurnished Space Station module is smaller than that in the free space environment. Data obtained from the measurements in furnished module were shown in Figure 4.
-60
-50
-40
-30
0 2 4 6
Distance (m)
Sig
nal S
treng
th (d
Bm
)
Free SpaceUnfurnished
Figure 3. Comparison of measured signal
strength in unfurnished module and in free space.
-60
-50
-40
-30
0 2 4 6
Distance (m)
Sig
nal S
treng
th (d
Bm
)
Free SpaceFurnished
Figure 4. Comparison of measured signal
strength in furnished module and in free space.
Similarly, the signal strengths inside the furnished module are still stronger than that in the free space environment. The propagation loss inside the Space Station module is smaller than that in the free space environment. The Space Station module seems to represent a different environment from typical office and residential indoor environment. Some waveguide and cavity characteristics may exist in the Space Station module environment.
5D3-3
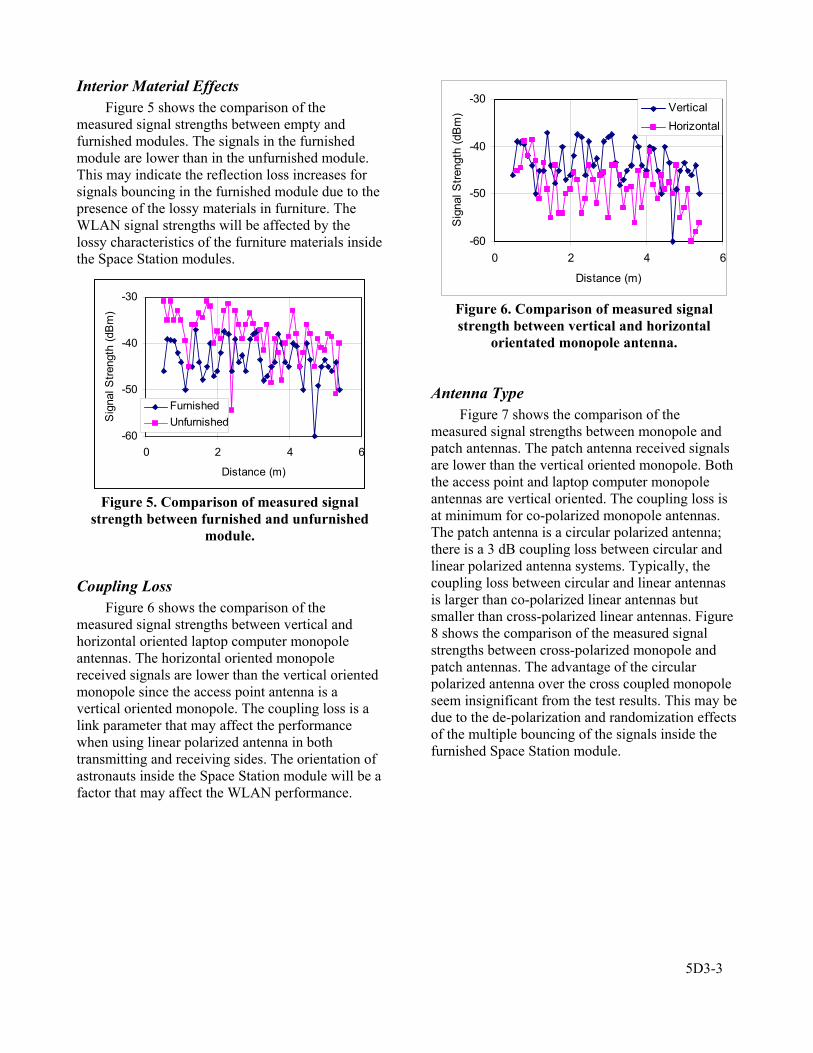
Interior Material Effects Figure 5 shows the comparison of the
measured signal strengths between empty and furnished modules. The signals in the furnished module are lower than in the unfurnished module. This may indicate the reflection loss increases for signals bouncing in the furnished module due to the presence of the lossy materials in furniture. The WLAN signal strengths will be affected by the lossy characteristics of the furniture materials inside the Space Station modules.
-60
-50
-40
-30
0 2 4 6
Distance (m)
Sig
nal S
treng
th (d
Bm
)
FurnishedUnfurnished
Figure 5. Comparison of measured signal
strength between furnished and unfurnished module.
Coupling Loss Figure 6 shows the comparison of the
measured signal strengths between vertical and horizontal oriented laptop computer monopole antennas. The horizontal oriented monopole received signals are lower than the vertical oriented monopole since the access point antenna is a vertical oriented monopole. The coupling loss is a link parameter that may affect the performance when using linear polarized antenna in both transmitting and receiving sides. The orientation of astronauts inside the Space Station module will be a factor that may affect the WLAN performance.
-60
-50
-40
-30
0 2 4 6
Distance (m)
Sig
nal S
treng
th (d
Bm
) VerticalHorizontal
Figure 6. Comparison of measured signal strength between vertical and horizontal
orientated monopole antenna.
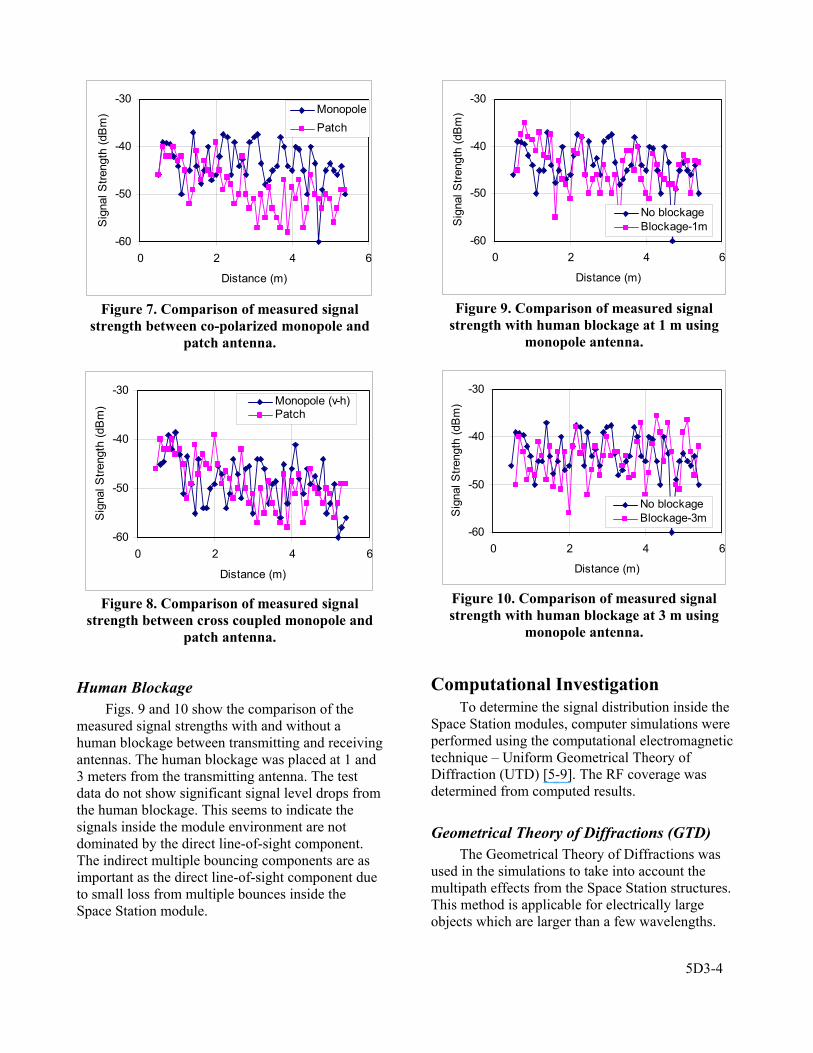
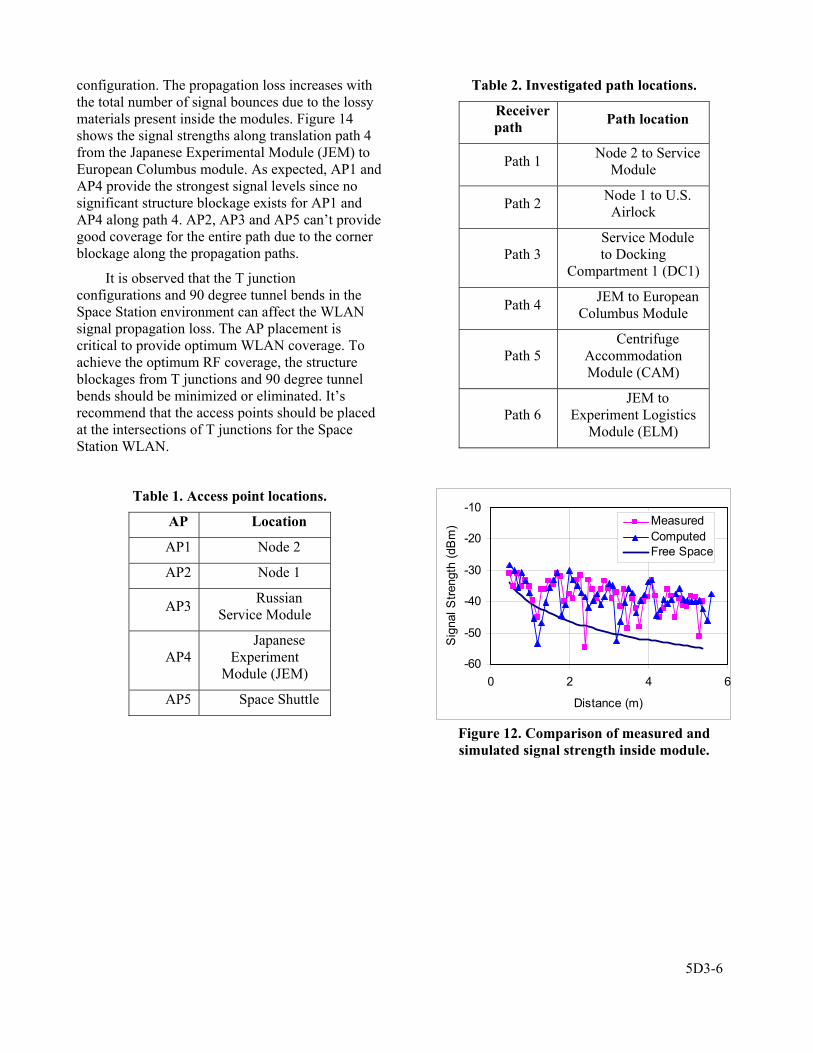
Antenna Type Figure 7 shows the comparison of the
measured signal strengths between monopole and patch antennas. The patch antenna received signals are lower than the vertical oriented monopole. Both the access point and laptop computer monopole antennas are vertical oriented. The coupling loss is at minimum for co-polarized monopole antennas. The patch antenna is a circular polarized antenna; there is a 3 dB coupling loss between circular and linear polarized antenna systems. Typically, the coupling loss between circular and linear antennas is larger than co-polarized linear antennas but smaller than cross-polarized linear antennas. Figure 8 shows the comparison of the measured signal strengths between cross-polarized monopole and patch antennas. The advantage of the circular polarized antenna over the cross coupled monopole seem insignificant from the test results. This may be due to the de-polarization and randomization effects of the multiple bouncing of the signals inside the furnished Space Station module.
5D3-4
-60
-50
-40
-30
0 2 4 6
Distance (m)
Sig
nal S
treng
th (d
Bm
) MonopolePatch
Figure 7. Comparison of measured signal
strength between co-polarized monopole and patch antenna.
-60
-50
-40
-30
0 2 4 6
Distance (m)
Sig
nal S
treng
th (d
Bm
) Monopole (v-h)Patch
Figure 8. Comparison of measured signal
strength between cross coupled monopole and patch antenna.
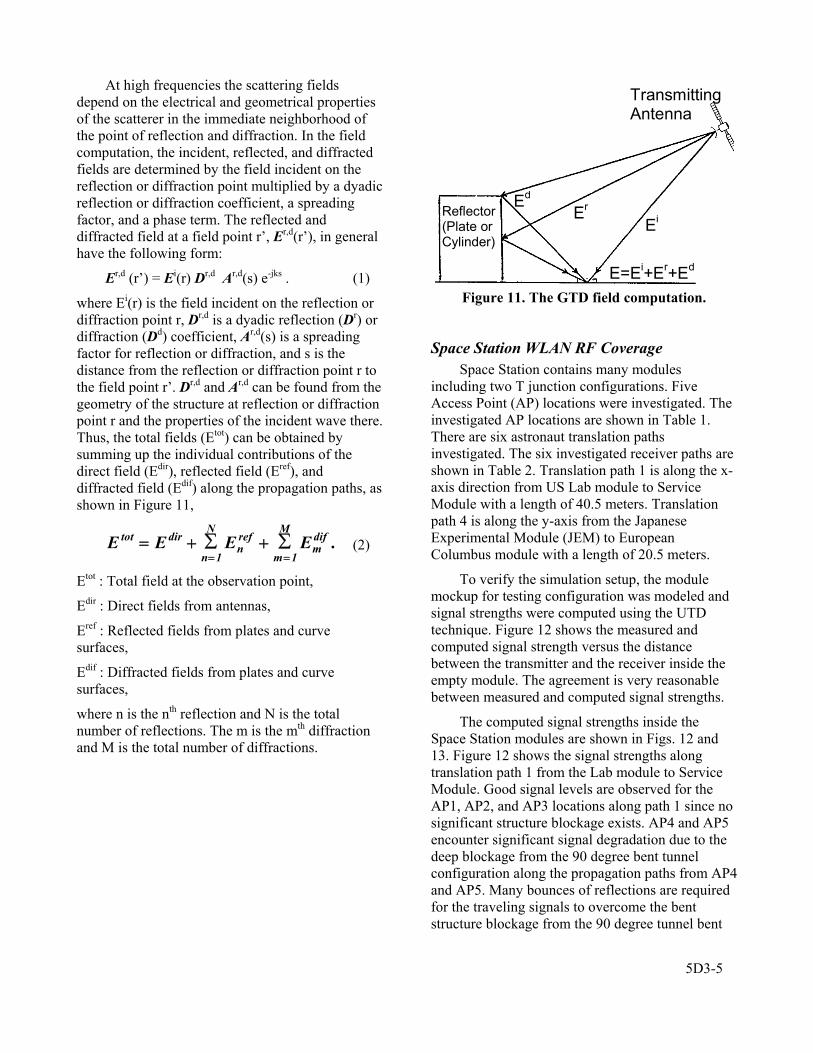
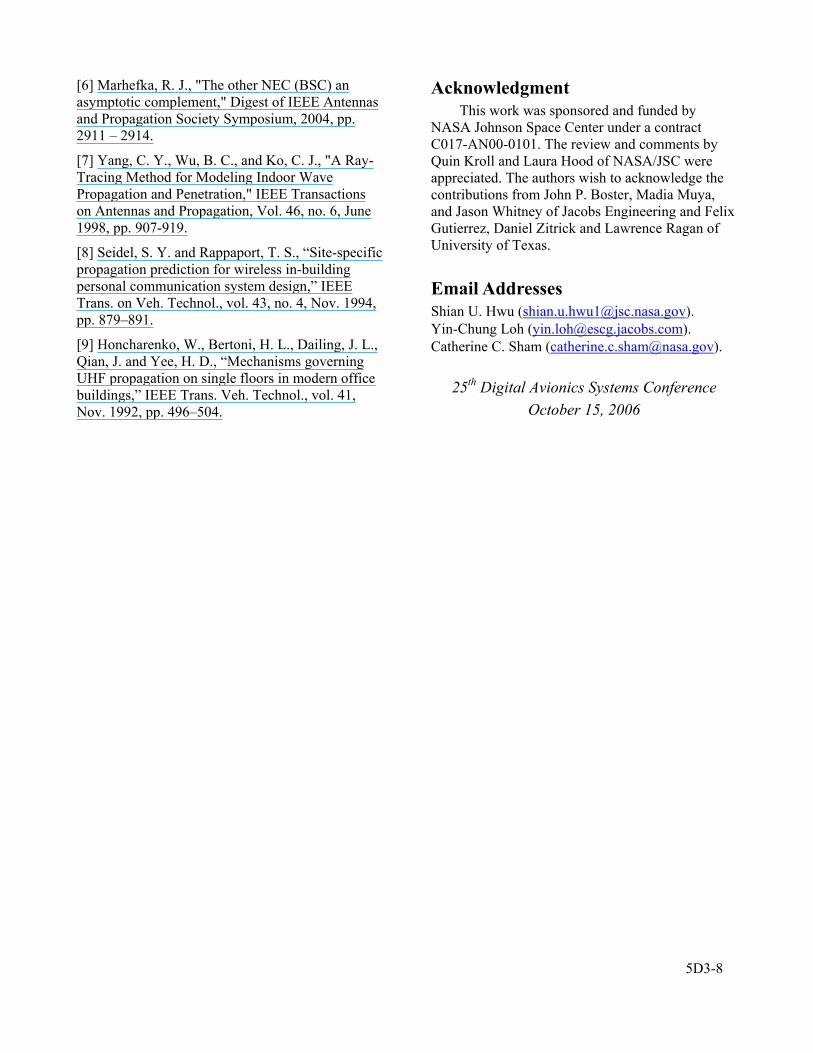
Human Blockage Figs. 9 and 10 show the comparison of the
measured signal strengths with and without a human blockage between transmitting and receiving antennas. The human blockage was placed at 1 and 3 meters from the transmitting antenna. The test data do not show significant signal level drops from the human blockage. This seems to indicate the signals inside the module environment are not dominated by the direct line-of-sight component. The indirect multiple bouncing components are as important as the direct line-of-sight component due to small loss from multiple bounces inside the Space Station module.
-60
-50
-40
-30
0 2 4 6
Distance (m)
Sig
nal S
treng
th (d
Bm
)
No blockageBlockage-1m
Figure 9. Comparison of measured signal
strength with human blockage at 1 m using monopole antenna.
-60
-50
-40
-30
0 2 4 6
Distance (m)
Sig
nal S
treng
th (d
Bm
)
No blockageBlockage-3m
Figure 10. Comparison of measured signal strength with human blockage at 3 m using
monopole antenna.
Computational Investigation To determine the signal distribution inside the
Space Station modules, computer simulations were performed using the computational electromagnetic technique – Uniform Geometrical Theory of Diffraction (UTD) [5-9]. The RF coverage was determined from computed results.
Geometrical Theory of Diffractions (GTD) The Geometrical Theory of Diffractions was
used in the simulations to take into account the multipath effects from the Space Station structures. This method is applicable for electrically large objects which are larger than a few wavelengths.
5D3-5
At high frequencies the scattering fields depend on the electrical and geometrical properties of the scatterer in the immediate neighborhood of the point of reflection and diffraction. In the field computation, the incident, reflected, and diffracted fields are determined by the field incident on the reflection or diffraction point multiplied by a dyadic reflection or diffraction coefficient, a spreading factor, and a phase term. The reflected and diffracted field at a field point r’, Er,d(r’), in general have the following form:
Er,d (r’) = Ei(r) Dr,d Ar,d(s) e-jks . (1)
where Ei(r) is the field incident on the reflection or diffraction point r, Dr,d is a dyadic reflection (Dr) or diffraction (Dd) coefficient, Ar,d(s) is a spreading factor for reflection or diffraction, and s is the distance from the reflection or diffraction point r to the field point r’. Dr,d and Ar,d can be found from the geometry of the structure at reflection or diffraction point r and the properties of the incident wave there. Thus, the total fields (Etot) can be obtained by summing up the individual contributions of the direct field (Edir), reflected field (Eref), and diffracted field (Edif) along the propagation paths, as shown in Figure 11,
E E E Etot dirnref
n
N
mdif
m
M= + ∑ + ∑
= =1 1. (2)
Etot : Total field at the observation point,
Edir : Direct fields from antennas,
Eref : Reflected fields from plates and curve surfaces,
Edif : Diffracted fields from plates and curve surfaces,
where n is the nth reflection and N is the total number of reflections. The m is the mth diffraction and M is the total number of diffractions.
Reflector(Plate or Cylinder)
Transmitting Antenna
Ed
Er Ei
E=Ei+Er+Ed
Figure 11. The GTD field computation.
Space Station WLAN RF Coverage Space Station contains many modules
including two T junction configurations. Five Access Point (AP) locations were investigated. The investigated AP locations are shown in Table 1. There are six astronaut translation paths investigated. The six investigated receiver paths are shown in Table 2. Translation path 1 is along the x-axis direction from US Lab module to Service Module with a length of 40.5 meters. Translation path 4 is along the y-axis from the Japanese Experimental Module (JEM) to European Columbus module with a length of 20.5 meters.
To verify the simulation setup, the module mockup for testing configuration was modeled and signal strengths were computed using the UTD technique. Figure 12 shows the measured and computed signal strength versus the distance between the transmitter and the receiver inside the empty module. The agreement is very reasonable between measured and computed signal strengths.
The computed signal strengths inside the Space Station modules are shown in Figs. 12 and 13. Figure 12 shows the signal strengths along translation path 1 from the Lab module to Service Module. Good signal levels are observed for the AP1, AP2, and AP3 locations along path 1 since no significant structure blockage exists. AP4 and AP5 encounter significant signal degradation due to the deep blockage from the 90 degree bent tunnel configuration along the propagation paths from AP4 and AP5. Many bounces of reflections are required for the traveling signals to overcome the bent structure blockage from the 90 degree tunnel bent
5D3-6
configuration. The propagation loss increases with the total number of signal bounces due to the lossy materials present inside the modules. Figure 14 shows the signal strengths along translation path 4 from the Japanese Experimental Module (JEM) to European Columbus module. As expected, AP1 and AP4 provide the strongest signal levels since no significant structure blockage exists for AP1 and AP4 along path 4. AP2, AP3 and AP5 can’t provide good coverage for the entire path due to the corner blockage along the propagation paths.
It is observed that the T junction configurations and 90 degree tunnel bends in the Space Station environment can affect the WLAN signal propagation loss. The AP placement is critical to provide optimum WLAN coverage. To achieve the optimum RF coverage, the structure blockages from T junctions and 90 degree tunnel bends should be minimized or eliminated. It’s recommend that the access points should be placed at the intersections of T junctions for the Space Station WLAN.
Table 1. Access point locations.
AP Location
AP1 Node 2
AP2 Node 1
AP3 Russian Service Module
AP4 Japanese
Experiment Module (JEM)
AP5 Space Shuttle
Table 2. Investigated path locations.
Receiver path Path location
Path 1 Node 2 to Service Module
Path 2 Node 1 to U.S. Airlock
Path 3 Service Module to Docking
Compartment 1 (DC1)
Path 4 JEM to European Columbus Module
Path 5 Centrifuge
Accommodation Module (CAM)
Path 6 JEM to
Experiment Logistics Module (ELM)
-60
-50
-40
-30
-20
-10
0 2 4 6
Distance (m)
Sig
nal S
treng
th (d
Bm
) MeasuredComputedFree Space
Figure 12. Comparison of measured and simulated signal strength inside module.

5D3-7
-90
-80
-70
-60
-50
-40
-30
-20-0.5 9.5 19.5 29.5 39.5
X Position along Path 1 (Meters)
Rec
eive
d P
ower
(dBm
)
AP1 AP2 AP3 AP4 AP5
11 Mbps
2 Mbps
Figure 13. Relative signal strength along
translation path1 from US Lab module to Service module.
-90
-80
-70
-60
-50
-40
-30
-20
-100 5 10 15 20
Y Position on Path from JEM to Columbus (Meters)
Rec
eive
d Po
wer
(dBm
)
AP1 AP2 AP3 AP4 AP5
11 Mbps
2 Mbps
Figure 14. Relative signal strength along
translation path4 from JEM to Columbus module.
Conclusion The propagation loss inside the Space Station
module is smaller than that in the free space environment. The Space Station module seems to represent a quite different environment from typical
office and residential indoor environments. Some waveguide and cavity characteristics may exist in the Space Station module environment. The signals are not dominated by the direct line-of-sight ray. The indirect multiple bouncing rays are as important as the direct line-of-sight ray inside the Space Station module. The coupling loss is a link parameter that may affect the performance when using linear polarized monopole antenna in both transmitting and receiving sides. The orientation of astronauts inside the Space Station module will be a factor that may affect the WLAN performance. In the Space Station environment, the module geometry and interior equipment/furniture materials are the two important factors determining the propagation characteristics of the Space Station WLAN system. The analysis results from this paper are essential for Space Station WLAN access point placement and RF coverage performance determination.
References [1] Tobin, M. L. ,Richie, J. E., “A study of indoor propagation: Theory and results of the wireless communication system for the Space Station Freedom,” Digest of IEEE Antennas and Propagation Society International Symposium, 1993, pp. 1065-1068.
[2] Hwu, S. U., Loh, Y. C., Sham, C. C., “Propagation Characteristics of International Space Station Wireless Local Area Network," Proceedings of IEEE Radio and Wireless Conference, Atlanta, GA, 2004, pp. 407-410.
[3] Fernandez, O., Domingo, M., Torres, R.P., “Experimental analysis of wireless data transmission systems in space platforms,” Antennas and Propagation Magazine, IEEE, Aug. 2004, Vol. 46 , No. 4, pp. 38 – 60.
[4] Felix Gutierrez, Jr., Daniel Zitrick, Lawrence Ragan, and Ted Rappaport, “Multipath Study for a Wi-Fi Network in a Space Station Environment,” Technical Report WNCG-TR-2005-09-01, The University of Texas at Austin, October 2005.
[5] Marhefka, R. J. and Silvestro, J. W., “Near zone – basic scattering code user’s manual with space station applications,” NASA CR-181944, Dec. 1989.
5D3-8
[6] Marhefka, R. J., "The other NEC (BSC) an asymptotic complement," Digest of IEEE Antennas and Propagation Society Symposium, 2004, pp. 2911 – 2914.
[7] Yang, C. Y., Wu, B. C., and Ko, C. J., "A Ray-Tracing Method for Modeling Indoor Wave Propagation and Penetration," IEEE Transactions on Antennas and Propagation, Vol. 46, no. 6, June 1998, pp. 907-919.
[8] Seidel, S. Y. and Rappaport, T. S., “Site-specific propagation prediction for wireless in-building personal communication system design,” IEEE Trans. on Veh. Technol., vol. 43, no. 4, Nov. 1994, pp. 879–891.
[9] Honcharenko, W., Bertoni, H. L., Dailing, J. L., Qian, J. and Yee, H. D., “Mechanisms governing UHF propagation on single floors in modern office buildings,” IEEE Trans. Veh. Technol., vol. 41, Nov. 1992, pp. 496–504.
Acknowledgment This work was sponsored and funded by
NASA Johnson Space Center under a contract C017-AN00-0101. The review and comments by Quin Kroll and Laura Hood of NASA/JSC were appreciated. The authors wish to acknowledge the contributions from John P. Boster, Madia Muya, and Jason Whitney of Jacobs Engineering and Felix Gutierrez, Daniel Zitrick and Lawrence Ragan of University of Texas.
Email Addresses Shian U. Hwu ([email protected]). Yin-Chung Loh ([email protected]). Catherine C. Sham ([email protected]).
25th Digital Avionics Systems Conference
October 15, 2006