Soil slip/debris flow localized by site attributes and wind-driven rain in the San Francisco Bay...
24
Soil slip/debris flow localized by site attributes and wind-driven rain in the San Francisco Bay region storm of January 1982 Richard J. Pike a, ⁎ , Steven Sobieszczyk b a M/S 973, U.S. Geological Survey, Menlo Park, CA 94025, USA b WRD District Office, U.S. Geological Survey, Portland, OR 97216, USA Received 25 March 2005; received in revised form 21 February 2006; accepted 10 September 2006 Available online 14 June 2007 Abstract GIS analysis at 30-m resolution reveals that effectiveness of slope-destabilizing processes in the San Francisco Bay area varies with compass direction. Nearly half the soil slip/debris flows mapped after the catastrophic rainstorm of 3–5 January 1982 occurred on slopes that face S to WSW, whereas fewer than one-quarter have a northerly aspect. Azimuthal analysis of hillside properties for susceptible terrain near the city of Oakland suggests that the skewed aspect of these landslides primarily reflects vegetation type, ridge and valley alignment, and storm–wind direction. Bedrock geology, soil expansivity, and terrain height and gradient also were influential but less so; the role of surface curvature is not wholly resolved. Normalising soil-slip aspect by that of the region's NNW-striking topography shifts the modal azimuth of soil-slip aspect from SW to SE, the direction of origin of winds during the 1982 storm—but opposite that of the prevailing WNW winds. Wind from a constant direction increases rainfall on windward slopes while diminishing it on leeward slopes, generating a modelled difference in hydrologically effective rainfall of up to 2:1 on steep hillsides in the Oakland area. This contrast is consistent with numerical simulations of wind-driven rain and with rainfall thresholds for debris- flow activity. We conclude that storm winds from the SE in January 1982 raised the vulnerability of the Bay region's many S-facing hillsides, most of which are covered in shallow-rooted shrub and grass that offer minimal resistance to soil slip. Wind-driven rainfall also appears to have controlled debris-flow location in a major 1998 storm and probably others. Incorporating this overlooked influence into GIS models of debris-flow likelihood would improve predictions of the hazard in central California and elsewhere. Published by Elsevier B.V. Keywords: Soil slips; Debris flow; Slope aspect; Hillside properties; Wind-driven rainfall; Digital terrain modelling; GIS; California 1. Introduction Debris flows are slurries of water-saturated soil that originate as shallow landslides (“soil slips”) on steep hillsides during or immediately after heavy rainfall and run rapidly downslope, sometimes for considerable distances (Fig. 1; Kesseli, 1943; Campbell, 1975). In a 33-hour period over 3–5 January 1982, a catastrophic rainstorm delivered up to half the mean annual pre- cipitation to the San Francisco Bay region (SFBR), triggering over 18,000 debris flows. The storm, which killed 33 people and caused $208 Million in property damage across the ten-county area, revealed debris flow as an unappreciated slope process in the Coast Ranges of central California (Wieczorek, 1987; Ellen et al., 1988a). Resulting concern for public safety prompted attempts to identify hazardous areas by studying the factors that lead to debris flow; early predictive maps based on surface morphology were qualitative (e.g. Smith, 1988). A more Available online at www.sciencedirect.com Geomorphology 94 (2008) 290 – 313 www.elsevier.com/locate/geomorph ⁎ Corresponding author. Tel.: +1 650 329 4947. E-mail address: [email protected] (R.J. Pike). 0169-555X/$ - see front matter. Published by Elsevier B.V. doi:10.1016/j.geomorph.2006.09.024
Transcript of Soil slip/debris flow localized by site attributes and wind-driven rain in the San Francisco Bay...

Available online at www.sciencedirect.com
2008) 290–313www.elsevier.com/locate/geomorph
Geomorphology 94 (
Soil slip/debris flow localized by site attributes and wind-driven rainin the San Francisco Bay region storm of January 1982
Richard J. Pike a, ⁎, Steven Sobieszczyk b
a M/S 973, U.S. Geological Survey, Menlo Park, CA 94025, USAb WRD District Office, U.S. Geological Survey, Portland, OR 97216, USA
Received 25 March 2005; received in revised form 21 February 2006; accepted 10 September 2006Available online 14 June 2007
Abstract
GIS analysis at 30-m resolution reveals that effectiveness of slope-destabilizing processes in the San Francisco Bay area varieswith compass direction. Nearly half the soil slip/debris flowsmapped after the catastrophic rainstorm of 3–5 January 1982 occurred onslopes that face S to WSW, whereas fewer than one-quarter have a northerly aspect. Azimuthal analysis of hillside properties forsusceptible terrain near the city of Oakland suggests that the skewed aspect of these landslides primarily reflects vegetation type,ridge and valley alignment, and storm–wind direction. Bedrock geology, soil expansivity, and terrain height and gradient alsowere influential but less so; the role of surface curvature is not wholly resolved. Normalising soil-slip aspect by that of the region'sNNW-striking topography shifts the modal azimuth of soil-slip aspect from SW to SE, the direction of origin of winds during the 1982storm—but opposite that of the prevailing WNWwinds. Wind from a constant direction increases rainfall on windward slopes whilediminishing it on leeward slopes, generating a modelled difference in hydrologically effective rainfall of up to 2:1 on steep hillsides inthe Oakland area. This contrast is consistent with numerical simulations of wind-driven rain and with rainfall thresholds for debris-flow activity. We conclude that storm winds from the SE in January 1982 raised the vulnerability of the Bay region's many S-facinghillsides, most of which are covered in shallow-rooted shrub and grass that offer minimal resistance to soil slip. Wind-driven rainfallalso appears to have controlled debris-flow location in a major 1998 storm and probably others. Incorporating this overlookedinfluence into GIS models of debris-flow likelihood would improve predictions of the hazard in central California and elsewhere.Published by Elsevier B.V.
Keywords: Soil slips; Debris flow; Slope aspect; Hillside properties; Wind-driven rainfall; Digital terrain modelling; GIS; California
1. Introduction
Debris flows are slurries of water-saturated soil thatoriginate as shallow landslides (“soil slips”) on steephillsides during or immediately after heavy rainfall andrun rapidly downslope, sometimes for considerabledistances (Fig. 1; Kesseli, 1943; Campbell, 1975). In a33-hour period over 3–5 January 1982, a catastrophic
⁎ Corresponding author. Tel.: +1 650 329 4947.E-mail address: [email protected] (R.J. Pike).
0169-555X/$ - see front matter. Published by Elsevier B.V.doi:10.1016/j.geomorph.2006.09.024
rainstorm delivered up to half the mean annual pre-cipitation to the San Francisco Bay region (SFBR),triggering over 18,000 debris flows. The storm, whichkilled 33 people and caused $208 Million in propertydamage across the ten-county area, revealed debris flowas an unappreciated slope process in the Coast Ranges ofcentral California (Wieczorek, 1987; Ellen et al., 1988a).Resulting concern for public safety prompted attempts toidentify hazardous areas by studying the factors that leadto debris flow; early predictive maps based on surfacemorphology were qualitative (e.g. Smith, 1988). A more

Fig. 1. Typical small soil-slip/debris flows in the East Bay hills southof Oakland, triggered by the central California storm of 2–3 February1998. Grass-covered WSW-facing failure sites (ID nos. 492 and 493 inCoe and Godt, 2001) are 122 m above sea level and slope at 30° and35°; hillside configurations are essentially planar at slope-curvaturevalues of −0.001 m/m2 and −0.007 m/m2. Photo by J.A. Coe.
291R.J. Pike, S. Sobieszczyk / Geomorphology 94 (2008) 290–313
quantitative approach enables landslide-susceptibilitymapping to be addressed statistically, as a multivariateproblem (Brabb et al., 1972; Mark, 1992; Pike et al.,2001; NOAA-USGS Debris-Flow Task Force, 2005).While phenomenology of the 1982 soil slips was welldescribed, mapping technology limited the quantitativeanalysis of soil slips to brief studies of slope, geology,vegetation, and hillside materials (Ellen et al., 1988b;Wieczorek et al., 1988;McKean et al., 1991). Such limitsno longer exist. Applications of geographic informationsystems (GIS) technology (e.g. Brabb, 1987; Carraraet al., 1991; Van Westen, 1993) have advanced the art oflandslide prediction to the point where it is practicable toevaluate the areal distribution of the 1982 debris flows indetail (e.g., Mark, 1992; Campbell et al., 1998).
Future soil-slip locations can be estimated from asynthesis of spatially variant criteria (Fernández et al.,1996; Ellen et al., 1997; Casadei et al., 2003;Morton et al.,2003; Ayalew and Yamagishi, 2005). In addition to steepterrain, sufficient colluvial soil, and prolonged heavyrainfall (Kesseli, 1943; Campbell, 1975), factors contrib-uting to shallow landsliding may include antecedentmoisture, vegetative cover, surface form, upslope area thatcontributes drainage to the site, and physical propertiesof the bedrock and soil (Rice et al., 1969; Reneau andDietrich, 1987; Wieczorek et al., 1988; Montgomery andDietrich, 1994; Campbell et al., 1998). Among the lessstudied factors is slope aspect, the compass directionof maximum downslope gradient from a point on a hill-side. Many landslide-hazard models incorporate aspectwithout close scrutiny, as one of several descriptors ofslope geometry (e.g., Fernandes et al., 2004; Lee, 2007)
rather than as a site attribute linked to a particular sur-face process or meteorological condition (e.g., Wieczoreket al., 1997; Pinter and Vestal, 2005). In semi-arid south-ern California, aspect has been identified as one of theprimary controls on soil-slip/debris-flow by Morton et al.(2003), who found up to 400% more failures on steep S-facing slopes than on N-facing hillsides and provisionallyrelated the contrast to differences in vegetation.
The few studies of landslide aspect in northernCalifornia, most of them in the SFBR (Fig. 2, inset map),have been inconclusive or did not include debris flows:Beaty (1956) found that 78 of 112 small landslides ofunspecified type east of the city of Oakland occupiedNW–NE slopes; the 42 flows, slides, and avalanchesmapped by Bonilla (1960) in San Francisco mostly facedSW; Radbruch and Weiler (1963) observed that 45 of 78shallow slumps and earth flows east of Oakland had aNEorientation; the 582 earth flows mapped by Turnbull(1976) south of Oaklandwere distributed evenly (the fewN and NE slopes hosted commensurately few failures);and analysis byMcKean et al. (1991) of 4000 of the 1982debris flows in San Mateo County south of SanFrancisco noted fewer failures on N–NE slopes, butcould discern no clear relation among slope gradient,aspect, and vegetation type.
We undertook a GIS analysis of shallow landslidesfrom the 1982 SFBR storm to determine the influence, ifany, of slope aspect in locating soil slips and the ensuingdebris flows. Initial results (Pike and Sobieszczyk, 2003)revealed that the distribution of aspect for 1942 debrisflows in the Oakland hills (Fig. 2) differed entirely fromthat for 6714 dormant deep-seated landslides in the samearea (Pike et al., 2001). We also found that soil-slip aspectnormalised by aspect of the area's topography had astrong SE skew, which we ascribed to wind-driven rain-fall. Subsequently, we expanded the study to includemoreproperties of soil-slip sites (Pike and Sobieszczyk, 2005).In this paper we document in detail how several attri-butes of site vary with aspect—both for the 1942 soilslips and for susceptible Oakland-area topography as awhole (Fig. 2), little of which failed in 1982. We alsoexamine storm-wind direction and apply a simple trigo-nometric model to quantify its effects on rainfall intensityin the 1982 storm. This paper does not address debris-flowrunout and location of the downslope flow-paths that arethe actual hazard resulting from the initiation of soil slips(Ellen et al., 1988a,b; Lorente et al., 2003).
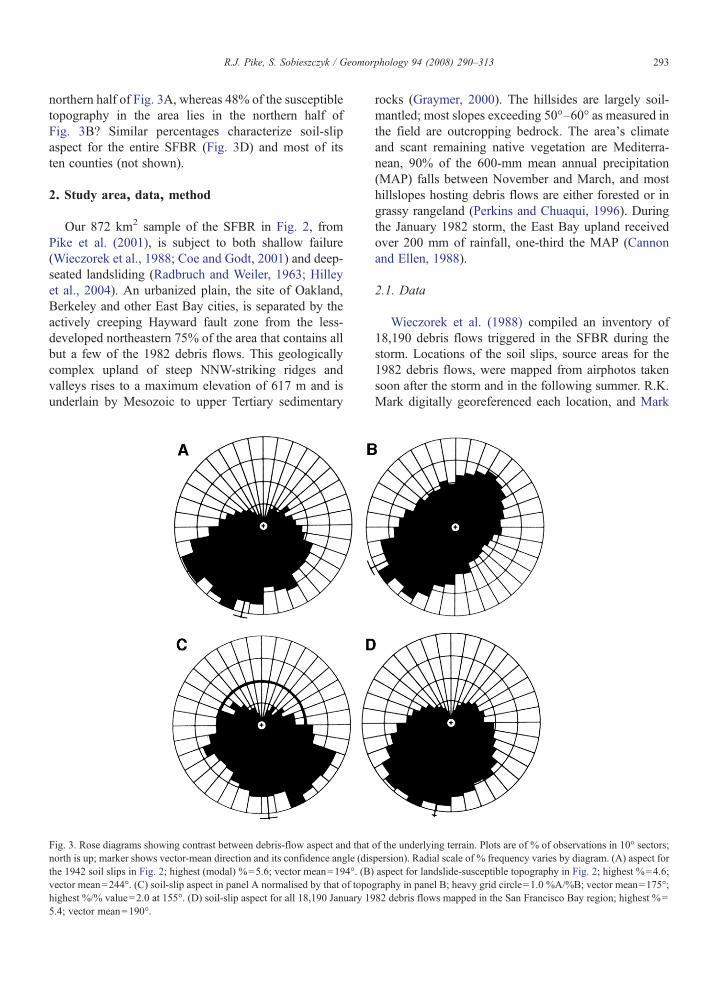
Fig. 3 states the overarching problem, first posed byBonilla (1960) for small landslides in the city of SanFrancisco: why were soil slips that formed in the studyarea during the January 1982 storm oriented primarilySW (44%) and SE (32%), with only 24% in the entire

Fig. 2. Oakland hills study area. Dots locate 1942 soil slips, the source areas for debris flows that occurred in storm of 3–5 January 1982. Grey-shadedarea: elevation of hilly upland topography susceptible to debris flow (light tones are higher) containing sample of 54,082 30-m grid cells 70 m–530 min height and 5°–35° in slope gradient. White: non-susceptible terrain excluded from analysis—mostly the low-sloping Bay plain and level artificialfill. Dark grey: water bodies. The NW-striking Hayward fault zone follows the juncture of the Bay plain with the susceptible upland.
292 R.J. Pike, S. Sobieszczyk / Geomorphology 94 (2008) 290–313
293R.J. Pike, S. Sobieszczyk / Geomorphology 94 (2008) 290–313
northern half of Fig. 3A, whereas 48% of the susceptibletopography in the area lies in the northern half ofFig. 3B? Similar percentages characterize soil-slipaspect for the entire SFBR (Fig. 3D) and most of itsten counties (not shown).
2. Study area, data, method
Our 872 km2 sample of the SFBR in Fig. 2, fromPike et al. (2001), is subject to both shallow failure(Wieczorek et al., 1988; Coe and Godt, 2001) and deep-seated landsliding (Radbruch and Weiler, 1963; Hilleyet al., 2004). An urbanized plain, the site of Oakland,Berkeley and other East Bay cities, is separated by theactively creeping Hayward fault zone from the less-developed northeastern 75% of the area that contains allbut a few of the 1982 debris flows. This geologicallycomplex upland of steep NNW-striking ridges andvalleys rises to a maximum elevation of 617 m and isunderlain by Mesozoic to upper Tertiary sedimentary
Fig. 3. Rose diagrams showing contrast between debris-flow aspect and thatnorth is up; marker shows vector-mean direction and its confidence angle (disthe 1942 soil slips in Fig. 2; highest (modal) %=5.6; vector mean=194°. (B)vector mean=244°. (C) soil-slip aspect in panel A normalised by that of topohighest %/% value=2.0 at 155°. (D) soil-slip aspect for all 18,190 January 195.4; vector mean=190°.
rocks (Graymer, 2000). The hillsides are largely soil-mantled; most slopes exceeding 50°–60° as measured inthe field are outcropping bedrock. The area's climateand scant remaining native vegetation are Mediterra-nean, 90% of the 600-mm mean annual precipitation(MAP) falls between November and March, and mosthillslopes hosting debris flows are either forested or ingrassy rangeland (Perkins and Chuaqui, 1996). Duringthe January 1982 storm, the East Bay upland receivedover 200 mm of rainfall, one-third the MAP (Cannonand Ellen, 1988).
2.1. Data
Wieczorek et al. (1988) compiled an inventory of18,190 debris flows triggered in the SFBR during thestorm. Locations of the soil slips, source areas for the1982 debris flows, were mapped from airphotos takensoon after the storm and in the following summer. R.K.Mark digitally georeferenced each location, and Mark
of the underlying terrain. Plots are of % of observations in 10° sectors;persion). Radial scale of % frequency varies by diagram. (A) aspect foraspect for landslide-susceptible topography in Fig. 2; highest %=4.6;graphy in panel B; heavy grid circle=1.0 %A/%B; vector mean=175°;82 debris flows mapped in the San Francisco Bay region; highest %=

294 R.J. Pike, S. Sobieszczyk / Geomorphology 94 (2008) 290–313
(1992), Ellen et al. (1997), and Campbell et al. (1998)later modelled debris-flow susceptibility for some ofthese failures. (None of these studies included slopeaspect.) The coordinates of our 1942 Oakland-area soilslips (Fig. 2) are from this data file. We computed slopeaspect for each soil-slip location from a 30-m square-grid digital elevation model (DEM) compiled for thestudy area from U.S. Geological Survey (USGS)contour maps (http://bard.wr.usgs.gov/). Effective spa-tial resolution of the measurements thus is 90 m×90 m.(Accuracy of the soil-slip locations is not sufficient tosupport use of the available 10-m DEM extracted fromthe same source contours.) Aspect (Fig. 3) was derivedfrom a polynomial fit to the default 3×3 elevation array,or subgrid, in the GRID module of the Arc/Info GIS. Wereport aspect to the nearest whole degree clockwisefrom N in 10° increments, or bins. Three additionalparameters calculated from this DEM are describedbelow in Sections 3.2–3.4.
Statistical error in subsequent calculations may arisefrom two uncertainties in the inventory of 1982 soil slips,one systematic and the other random (Ellen et al., 1988b;Wieczorek et al., 1988; Ellen et al., 1997). A source ofsystematic error is the possibility of unmapped debrisflows in forested areas and on N-facing slopes obscuredby shadows cast by the low January sun. Fig. 3A and asimilar aspect plot for all 18,190 soil slips in Fig. 3Dreveal an unpopulated V-shaped sector that could reflectundersampling on N-facing hillsides. Percent frequencyis essentially zero at due N (two soil slips in 20° of arc)and increases gradually out to about 50° in eachdirection. The sharp definition of the V in Fig. 3A andD suggests that any loss of data is limited to this 310°–050° sector (G. Wieczorek, personal communication 14April 2005, claims to have identified all of the 1982debris flows in the Oakland area). Manual transfer ofsoil-slip locations from airphotos to coarse-scale contourmaps added a random element of uncertainty. Again,crispness of the unpopulated sector in Fig. 3A and Dsuggests that the error is modest. Had this error beenlarge, the V-shaped gap would contain at least a few falsenortherly values and thus be less sharply defined.Despite these ambiguities, we judge the 1982 soil-slipinventory adequate to address the objectives of thispaper.
We obtained three sets of meteorological datarecorded during the January 1982 storm. Hourly rainfalltotals for nearby East Bay locations at Merritt Collegeand the city of Piedmont were read from Fig. 3.1 ofCannon and Ellen (1988). Hourly averages of windspeed and direction at Oakland Airport and at five otherSFBR weather stations were extracted from climate
archives distributed by the National Oceanic andAtmospheric Administration (e.g., http://www.wrcc.dri.edu; http://www.ndbc.noaa.gov). Like rainfall data,wind measurements must be specific to the landslide-triggering storm rather than annual or seasonal summa-ries. Winds that accompany winter storms in the SFBRare from the SE to SSW and differ entirely from theprevailing WNW winds. This seldom observed distinc-tion is not unique to the SFBR (Leipper, 1996). Windsduring the 5 December 1997 storm that dropped160 mm of rain on Santa Cruz Island in SouthernCalifornia and initiated hundreds of debris flows (Pinterand Vestal, 2005) were from due E, whereas theprevailing direction, even in the winter rainy season, isWNW. Also, winter storm systems move through theSFBR from the N and W. While this movement resultsin broad-scale orographic enhancement of rainfall on thehigher W-facing slopes and a rain shadow on most E-facing slopes (Rantz, 1971), it is unrelated to thesoutherly winds measured during the storm.
2.2. Method
We evaluated the location of the Oakland area's 1982debris flows by analysing storm-wind conditions andseven attributes of site. To quantify hillside sites wecreated an Arc/Info grid for the land portions of Fig. 2 at aspatial resolution of 30 m. For this 969,003-cell area wecomputed DEM derivatives describing planimetric sym-metry, height, steepness, and geometry of the groundsurface. Similarly registered data layers describing soilconditions, bedrock geology, and plant cover wereprepared from existing digital maps. We extracted valuesfrom the seven layers at the coordinates of each of the1942 soil slips and from them derived seven parametersthrough spreadsheet operations. The parameters, calcu-lated for 10° sectors of azimuth, are median aspect,elevation, and gradient; concave grid cells as a percentageof all cells; an index number ranking expansivity of thesurficial mantle; frequency of slope aspect for individualgeologic-map units; and the ratio of rangeland area to thatof forested land. Hourly measurements of January 1982stormwinds and rainfall alsowere arrayed by 10° azimuthbins. Analyses of wind data include only those hours forwhich rainfall was also recorded.
To contrast the soil slips with terrain that did not fail in1982, we obtained site attributes for the study area as awhole from the same seven digital map layers. However,we retained data for only the 541,325 grid cells that fellwithin the same range of elevation (70 m to 530 m) andslope gradient (5° to 35°) as the 1942 soil slips. This 56%(487 km2) subset of the study area includes 89% of the

295R.J. Pike, S. Sobieszczyk / Geomorphology 94 (2008) 290–313
bedrock upland (Graymer, 2000) and 99% of the 1982soil slips and thus eliminates terrain that is unlikely tohost future debris flows. (A similar two-stage approachbased on threshold criteria was required to modelliquefaction susceptibility; Pike et al., 1994.) Amongthe discarded 427,678 cells sloping at less than 5° aremore than 200,000 that have near-zero values ofgradient. The loss is doubly advantageous: mostalgorithms that compute slope aspect do not accuratelyprocess near-zero gradients but create false aspectmaxima at 45° or 90° intervals (Pike et al., 1988, Fig.8; Bucknam et al., 2001, Fig. 28; Morton et al., 2003,Fig. 26). The remaining 541,325 susceptible cells wererandomly sampled down to 54,082 cells to facilitatesorting, correlation, and analysis by spreadsheet.
Our comparisons of the eight sets of measurementsagainst slope aspect are summarized in rose (radial)diagrams or bivariate (XY) graphs. Because the rosediagrams, in percentage of total observations, are allscaled to a common output-grid size by the computersoftware, we include the percentage in the highest (modal)10° bin to aid visual comparison. In the XY graphs, widerdispersion of soil-slip data over those for topographyreflects the 1942-to-54,082 disparity in sample size.Sparsely populated, statistically weak, bins of N-facingsoil slips are omitted. Polynomial fits aid in identifyingtrends in the XY graphs although the equations do notprovide unique solutions because the distributions areradial and thus any aspect is valid as the origin of X. Thecoefficient of determination (R2), however, remains auseful test for goodness of fit. Values of each parameterare graphed against median bin values of aspect clockwisefrom due N, 5° to 355°.
3. Analysis by aspect
The aspect of soil slips triggered in the January 1982storm is skewed. Most slips initiated on SW to SEslopes, as evident by the distribution in Fig. 3A and itswell-constrained SSW vector mean of 194°±4°; manyfewer slips have a northerly aspect. A likely explanationfor the skew would appear to be the linear pattern of theregion's ridges and valleys.
3.1. Plan symmetry
California's central Coast Ranges follow aNNW–SSEalignment, or grain, imparted primarily by the SanAndreas fault zone and such related faults as the Haywardin the study area (Fig. 2). This topographic asymmetry,quantified in plan by slope aspect, is evident for the studyarea in Fig. 3B as NE and SW maxima and NW and SE
minima. The topography is further asymmetric in that theSW half of the distribution (140°–320°) includes more(55%) of the area's 54,082 grid cells than the NE half. TheSW vector mean of 244°±5°, close to values of 238° and241° for a sample of SanMateo County (Pike et al., 1988),is typical of the SFBR as a whole.
If the conditions that caused soil slip in January 1982had been azimuthally uniform, the resulting failures inFig. 3Awould be expected to reproduce the aspect of thetopography in Fig. 3B. Such is not the case. While theabundance of SW-facing slopes may account for many ofthe SW-oriented soil slips, differences between the twoplots indicate that topography alone can not explainFig. 3A. The differences are exposed by normalising(dividing) soil-slip aspect (in 10° bins) by that oftopography. Had topography alone controlled soil-slipaspect, the result would be a circle of radius 1.0 (in %/%)rather than the skewed plot in Fig. 3C. The northern halfof Fig. 3C still contains 25% of the distribution and theSW quadrant, while accounting for 33% of the plot, isreduced from its prominence in Fig. 3A. The SEquadrant of Fig. 3C is much larger: normalised valuesof SE-facing soil slips approach 2.0%/% and occupy42% of the distribution. Modal azimuth has shifted fromSW (205°) in Fig. 3A to SE (155°) in Fig. 3C and the175°±6° vector mean lies a substantial 19° from itsposition in Fig. 3A.
Fig. 3A–C indicates that initiation of the 1982 soilslips required directionally variant conditions, of weath-er or hillside site or both, in addition to those imposed bythe region's aligned topography. To understand thepersistent dearth of N-facing soil slips in Fig. 3A and C,as well as the excess of normalised SE-facing slips inFig. 3C, we explored the remaining seven attributes ofsite, the last four of which emerge as the most germane.The first three attributes describe the ground surface. Theincreasing statistical “noise” evident in the progressionfrom terrain height (Fig. 4) to slope curvature (Fig. 6)reflects the sensitivity of increasingly high-order deri-vatives of elevation to DEM resolution and accuracy,particularly for the soil-slip data.
3.2. Terrain height
Susceptible Oakland-area topography and the 1982debris flows differ greatly in overall elevation despitethe exclusion of topography in which debris flows areabsent or rare (b70 m). Median height above sea levelfor the 1942 soil slips calculated from the 30-m DEM is232 m, well above the 153-m median for topography(n=54,082 grid cells). The two sets of medians (10°bins) in Fig. 4, 148 m to 158 m for topography (n=36)

Fig. 4. Elevation of the 1982 Oakland-area soil slips and susceptibletopography as a function of slope aspect, by 10° sectors (bins). Bothpolynomial trends mirror the asymmetric distribution of aspectfrequency in Fig. 3B.
Fig. 5. Slope inclination as a function of slope aspect (10° bins) for soilslips and susceptible topography. Topographic gradient diminishessystematically from N–NE to SW–WSW. Polynomial fit to soil-slipdata (R2=0.29) is less well constrained.
296 R.J. Pike, S. Sobieszczyk / Geomorphology 94 (2008) 290–313
and 196 m to 273 m for soil slips (n=34), do notoverlap. The preference of soil slips for high elevationsis consistent with the orographically induced enhance-ment of storm rainfall observed at upland sites in theSFBR (Rantz, 1971; Wilson and Jayko, 1997). Storm-wind strength also generally rises with terrain height,exemplified for 3–5 January 1982 by the doubling offree-air wind velocity above Oakland Airport asrecorded in radiosonde measurements, from 3 m/s–12 m/s near sea level to 6 m/s–25 m/s at 600 m altitude(not shown).
Differences in elevation by aspect in Fig. 4 mirror theplanimetric asymmetry in study-area terrain shown inFig. 3B. Polynomial fits to median heights reveal a subtletrend with little dispersion for topography (R2 =0.48)and a higher-amplitude trend but greater scatter for thesoil slips (R2 =0.45). Slight elevation maxima (NNE,SSW) and minima (SSE, NNW) for the topography inFig. 4 (lower curve) indicate that compass directionspopulated by the most slopes (Fig. 3B) also are morelikely, statistically, to include higher slopes. The similar,but exaggerated, variation of soil-slip height in Fig. 4suggests that slope-destabilizing processes in the 1982storm amplified the subtler height/aspect trend of thetopography. The physical basis of such an enhancementis not evident from Figs. 3 and 4 alone and remainselusive.
3.3. Terrain inclination
We calculated slope gradient, the first derivative ofterrain height, from the DEM by the slope function inArc/InfoGRID. The low values in Fig. 5 reflect the broad90 m×90 m extent of the 3×3 subgrid; because gradientincreases with finer spatial resolution, slopes measured
in the field are up to twice as steep as those output fromthe 30-m DEM (Ellen et al., 1988a,b; Wieczorek et al.,1988). A relatively high overall-median gradient at 30-mresolution for both soil slips (18.5°) and susceptibletopography (16°) in the study area reflects the long-documented observation that debris flows initiate onsteep hillsides (Kesseli, 1943; Rice at al., 1969). Becauseboth distributions in Fig. 5 are from the same population(gradient≥5°), the 2.5° higher value for soil slipsindicates the extent to which the 1982 failures sought outsteeper slopes within susceptible topography. Thedifference, less distinct than that for elevation (Fig. 4),reflects the lower resistance to failure of a saturated soilmantle on steeper slopes (Campbell, 1975, Fig. 8.).
Both distributions in Fig. 5 vary with aspect. Mediangradient plotted by 10° aspect bins ranges from 14° to17° for topography (n=36) and more widely, 15° to 21°,for soil slips (n=34). The two sets of data overlapslightly, gradients for soil slips being steeper at all butfive azimuths. Median gradient of Oakland-area topog-raphy diminishes systematically (R2 =0.77) from N–NE(17°) to SW–WSW (14°), an asymmetry not previouslyreported in the SFBR although known elsewhere in theCalifornia Coast Ranges (Emery, 1947; Dohrenwend,1978). The low gradient of SW-facing topography com-plements the high frequency of SW slopes in Fig. 3B, arelation we revisit in Sect. 3.7. Azimuthal variation ofsoil-slip gradient is less orderly. It, too, decreases fromN-to S-facing slopes but the polynomial fit is looselyconstrained at R2 =0.29. Such deviations from thetrend line as the low values at 70° to 100° aspect, do notappear to reflect geology or to be otherwise systematic.Replotting both sets of data over the aspect range185°–175° (not shown) does not yield trends differing

Fig. 6. Surface geometry as a function of slope aspect (10° bins) for soilslips and susceptible topography. Overall, sites of soil-slip initiation areless convergent (concave) than topography as a whole. Topographyfacing SW is only half as convergent as slopes facing NE; the weakly-constrained distribution for soil-slip convergence roughly parallels thatfor topography.
297R.J. Pike, S. Sobieszczyk / Geomorphology 94 (2008) 290–313
substantially from those in Fig. 5. In the absence ofstronger evidence, we provisionally interpret the azimuth-al distribution of topographic gradient as having onlymoderately influenced that of soil slips in 1982.
3.4. Surface geometry
Slope curvature, the second derivative of terrainheight, compares surface form of the 1982 soil slips tothat of susceptible Oakland-area topography. Fig. 6 ex-presses the relation of curvature to aspect by the per-centage of grid cells that are convergent (concaveupward). Values of curvature were obtained from a poly-nomial fit to a 3×3 elevation array by the default optionfor curvature in Arc/Info GRID (Zevenbergen andThorne, 1987). We define convergent slopes as thosemeasuring b–0.05 units of curvature (1/100 m); valuesbetween −0.05 and +0.05 are designated planar; theremaining slopes are divergent (convex upward). Eight ofthe most northerly 10° aspect bins contain fewer than tensoil slips and are omitted from the analysis.
The style of curvature characteristic of randomly sam-pled topography is not widely established from measure-ments. Sources as disparate as Hack and Goodlett (1960,Fig. 2, varied resolution), Young (1972, Fig. 60E andelsewhere, varied res.), Valeriano and Carvalho Jr. (2003,Fig. 13, 10- to 30-m res.), and Lee (2007, Table 2, 5-mres.) show convergent slopes as predominant; the data inFig. 6 are consistent with these observations. The over-all landslide/topography comparison from our data raisesintriguing questions: by 35% to 44% overall, soil-slipsites are less convergent than the underlying topography.The relative order reverses that in Figs. 4 and 5. It is alsothe reverse of what was anticipated, 35% being less thanhalf the value commonly asserted to characterize soil-sliplocations in the SFBR (Reneau andDietrich, 1987; Smith,1988; Ellen et al., 1988b, 1997). A t-test confirms thatthe difference is statistically significant, and contrasts inrangeland vegetation (e.g., Gabet and Dunne, 2002) donot account for the disparity.
The unexpected reversal in relative order, if not due toinaccurate soil-slip locations, poses a dilemma. For debrisflows to arise preferentially within hillside hollows, thefrequency of soil slips on convergent sites must exceedthe frequency of convergent cells in randomly sampledtopography. Well known shortcomings—poor capture ofslope concavities at 1:24,000 scale by 20- and 40-footcontours, DEMs insufficiently accurate for the curvaturealgorithm, 30-m DEMs too coarse for the fine-scaleerosional terrain of the SFBR, and soil-masked concav-ities in subjacent bedrock (Reneau and Dietrich, 1987)—could account for the low 35% for soil slips but not the 9%
higher mean for topography, which is subject to identicaldeficiencies of measurement. While this dilemma cannotbe resolved here, we raise two possibilities. The firstinvokes perception and selectivity in sampling. Large orwell developed debris flowswith “classic” features, whichinvite study and adoption as type examples, arise mostreadily in well-formed hollows (Reneau and Dietrich,1987) and other concavities, whereas smaller or less welldeveloped debris flows, which attract no notice but arefar greater in number, are able to initiate on planar(Fig. 1) or convex slopes. Alternatively, fewer soil slips ofall descriptions occur on convergent terrain than has beenposited. Coe and Godt (2001), for example, found only44% of 531 accurately located 1998 soil slips in theOakland hills to be convergent (at 10-m resolution), and apreference of shallow landslides for nonconvergent aswell as convergent slopes has been observed elsewhere(Wieczorek et al., 1997; Gabet and Dunne, 2002; Lee,2007). Clarifying this issue requires field study of random-ly selected soil slips across a broad range of sizes, andbetter topographic data, such as provided by LiDAR.
Surface convergence varies strongly with slope as-pect for the area's topography but less so for the 1982soil slips. Respective percentages of concave grid cells(10° aspect bins) in Fig. 6 range from 29% to 61% andfrom 27% to 47%. The frequency of concave cells atsoil-slip sites describes a tenuous relation with aspect(0.18 R2) suggesting less convergence on S- to SW-facing slopes than on NE slopes–evidently mirroringconvergence frequency of the underlying topography.The well defined trend for susceptible topography (0.96R2) peaks on NE-facing slopes and reaches its minimumon SSW slopes. Although these extrema (see also slope

298 R.J. Pike, S. Sobieszczyk / Geomorphology 94 (2008) 290–313
gradient in Fig. 5) coincide with maximum slope occur-rences (Fig. 3B), slope frequency does not explain sur-face convergence. Both curves in Fig. 6 probably reflectthe azimuthal variation of solar radiation and the re-sulting distribution of evapotranspiration and vegeta-tion type (Section 3.7). We further speculate below inSection 5 on the contributing influence of more intensestorm rainfall on S-facing than on N-facing hillsides.
3.5. Bedrock geology
Debris-flow location in the SFBR varies withgeology. By modifying the Brabb et al. (1972) techniquefor mapping susceptibility to deep-seated landsliding,Wieczorek et al. (1988) estimated the degree to whichsoils that developed on some rocks in San Mateo Countywere more prone to debris flow in 1982 than soils on
Table 1Thirty-one representative geologic units in the Oakland, California, study aJanuary 1982 storm, and ranked expansivity of the surficial mantle
Symbol (age) Geologic Unit (after Graymer, 2000)
Tbh Briones Sandstone–Hercules Shale memberTt Tice ShaleTbl Briones SS–lower sandstone, siltstone memberTbu Briones SS–upper sandstone and shale memberKus Great Valley sequence — ss., siltstone, shaleTo Oursan SandstoneTh Hambre SandstoneTr Rodeo ShaleTor Orinda Formation (Miocene)Tmlu Mulholland Formation — upperTmll Mulholland Formation — lowerTshc Eocene shale and claystoneTmb Moraga Formation — basaltKu Great Valley sequence — undifferentiatedTbg Briones SS — massive ss, pebble cgl, shell brecciaTbr Briones Sandstone — ss, slt, cgl, shell brecciaTn Neroly SandstoneTus Unnamed late Miocene sedimentary & volcanic rocksKcv Unnamed Tertiary sandstone, conglomerate, shaleKr Redwood Canyon Formation (Cretaceous)Ko Oakland Conglomerate (Cretaceous)Tcc Claremont ChertTgvt Green Valley Tonalite, Tassajara Formation — undivideKsc Shephard Creek FormationKjm Joaquin Miller FormationQpaf Pleistocene alluvial fan and fluvial depositsJgb Gabbro and diabase — Coast Range ophioliteJsv Keratophyre, qtz. keratophyre above ophioliteKJfm Franciscan Complex mélange — undividedKJk Knoxville FormationQhaf Holocene alluvial fan and fluvial depositsa Susceptible terrain only: 70 m–530 m in elevation and 5°–35° in slopeb Source: C.M. Wentworth and R.J. Pike, unpublished U.S. Geological Su
other rocks. In the Oakland study area (Graymer, 2000),these differences are substantial among the 47 geologicunits that hosted from one to 320 debris flows in 1982(73 units had no failures). Spatial density of debris flowsfor the 26 affected units in Table 1 varied from 0.1/km2
on gently sloping Pleistocene alluvial fan and fluvialdeposits (Qpaf) to 35/km2 on the Hercules Shale (Tbh),a subunit of the Briones Sandstone that also is prone todeep-seated landsliding (Pike et al., 2001). Debris-flowdensity in Table 1 is similar to the debris-flow“incidence” of Wieczorek et al. (1988). The first ninegeologic units in Table 1 have a high incidence offailure, the second nine a medium incidence, and allothers a low incidence. The 1982 debris flows areconcentrated in a few susceptible formations. Only 13large units with high to medium incidence of soil-slip—chief among them the Hambre Sandstone (Th), Orinda
rea — number and spatial density of soil slip/debris flows in the 3–5
Area a
(km2)Number oflandslides
Landslides/km2
Expansivityrank b
1.4 48 34.6 63.3 72 21.5 56.0 102 16.9 67.5 116 15.5 46.8 68 10.0 54.9 45 9.3 521.6 191 8.8 77.5 63 8.4 521.1 154 7.3 512.5 65 5.2 514.7 75 5.1 55.5 24 4.4 613.2 56 4.3 510.4 44 4.2 3.510.5 44 4.2 1.528.4 118 4.2 420.0 78 3.9 584.4 320 3.8 615.3 31 2.0 3.523.9 32 1.3 3.517.1 20 1.2 3.58.9 10 1.1 2.5
d 6.9 5 0.7 75.0 3 0.6 415.4 4 0.3 3.58.4 1 0.1 45.1 0 0.0 211.8 0 0.0 25.9 0 0.0 26.3 0 0.0 3.56.1 0 0.0 2
gradient (30 m DEM).rvey data. See text for explanation.

Fig. 7. Geology as a function of slope aspect. Paired rose diagrams (same display conventions as Fig. 3) contrasting aspect of the 1982 soil slips (upper rows) with aspect of susceptible topography fortwelve bedrock units in the Oakland area (lower rows). Map-unit symbol (see Table 1) is followed by number of debris flows/km2. Debris-flow aspect rarely mirrors that of unit topography. 299
R.J.
Pike,
S.Sobieszczyk
/Geom
orphology94
(2008)290–313

Fig. 9. Soil-mantle expansivity as a function of slope aspect.Expansivity of surface materials in the study area is consistentlysevere (rank 5.0) at most values of aspect (10° bins) at both soil-slipsites and for susceptible topography. The seven departures from overalluniformity are discussed in the text.
300 R.J. Pike, S. Sobieszczyk / Geomorphology 94 (2008) 290–313
Formation (Tor), and upper and lower MulhollandFormations (Tmlu, Tmll)—account for 75% of the 1942failures. The differences in soil-slip occurrence shownin Table 1 for individual units probably reflect variousphysiographic and lithologic properties. Evaluatingsuch likely factors as elevation, slope gradient andaspect, and rock induration, permeability, bedding dip,and fracture spacing lies beyond the scope of this study.
Soil slips and topography differ more in slope aspectfor individual geologic units than they do for the studyarea as a whole. Rose diagrams in Fig. 7 compare twelveunits in Table 1 that had debris-flow densities of 4/km2
to 35/km2 in 1982. Whereas overall values of vector-mean aspect for Oakland-area topography and soil slipsin Fig. 3 differ by 50°, in Fig. 7 the disparity ranges from104° to 178° for the six least-similar pairs of vectormeans. Although no two soil-slip distributions in Fig. 7are alike, most tend to be multimodal and, like Fig. 3A,bear generally SW to SE. Few debris flows on theseunits have a northerly aspect. In contrast to the SW–SEorientation of most soil-slip arrays in Fig. 7, the overallNE–SW alignment of aspect for each unit's topographyresembles that of the study area in Fig. 3B. The ex-ception is the small (1.4 km2) Hercules Shale unit (Tbh),for which both distributions bear E–W. Soil slips on theHambre Sandstone (Th) have a strong SE component,which we discuss in Sections 3.6 and 5. The factors thatcontribute to aspect differences among other units inFig. 7 are not examined further here.
3.6. Soil expansivity
Kesseli (1943) ascribed one type of shallow landslid-ing in the SFBR partly to the ease of saturation of
Fig. 8. Debris-flow incidence in the January 1982 storm as an indirectfunction of geology. Dependence of slope failure on expansivity of thesoil mantle is moderate for these major Oakland-area bedrock units(see Table 1). Ranked severity, ranging from 1.0 (unexpansive) to 7.0(most of unit is severely expansive) explained in text.
(expansive) clay-rich soils developed on local rocks.Table 1 and Fig. 8 show that this influence may haveoperated in the Oakland area in the 1982 storm. Using anindex number devised by C.M. Wentworth, R.J. Pike andWentworth (unpublished U.S. Geological Survey data)ranked the relative expansivity of hillside-materialsunits in the SFBR. The units had been mapped fromobservations byEllen andWentworth (1995) on lithologiccomposition and such physical properties as permeability,hardness, bedding thickness, and fracture spacing. Thematerials units, comprising groups of similar geologicunits, were ranked from 1.0 (unexpansive) to 7.0 (most ofunit severely expansive) for both bedrock (not consideredhere) and the surficial mantle. Table 1 lists these rankingsfor 31 geologic units mapped by Graymer (2000) in theOakland area.
Fig. 8 shows that density of January 1982 debris-flowsources on the 15most important units in the study area, interms of areal coverage and soil-slip frequency, increasesmoderately (R2=0.46) with expansivity of the surficialmantle. The younger (Tertiary) units in Table 1 tend torank higher on the Wentworth/Pike scale than older(Mesozoic) units. The widespread Hambre Sandstone(unit Th in Fig. 7) has both the most expansive surficialmaterial (rank 7.0) and the highest spatial density (8.8/km2) of debris flows in Fig. 8. This relation suggests,together with the high percentage (46%) of SE-facingdebris flows on the Hambre in Fig. 7 and the SE mode ofnormalised soil-slip frequency in Fig. 3C, a slope-destabilizing mechanism that preferentially exploitedexpansive soil on SE slopes in 1982. While theseobservations are consistent with Kesseli's (1943) conjec-ture, the role of soil expansivity in shallow landslidingremains an area of ongoing research (Meisina, 2004).

Table 2Relation of land cover to spatial density of soil slip/debris flows in theOakland study area for the 3–5 January 1982 storm
Vegetation type a % of studyarea b
% of 1942debris flows
% Debris flows /% study area
Mixed rangeland(grasses and shrub,including chaparral)
1.5 6 4.0
Herbaceous rangeland(grasses)
22 51 2.3
Evergreen forest 5.3 6 1.1Mixed forest (evergreen
and deciduous)41 30 0.7
a from Perkins and Chuaqui (1996); land-use categories of Andersonet al. (1976).b 54,082 30 m grid cells 70 m–530 m in elevation and 5°–35° in
slope gradient.
301R.J. Pike, S. Sobieszczyk / Geomorphology 94 (2008) 290–313
Soil expansivity may have exerted some influence onthe variation of shallow landsliding with azimuth. Fig. 9shows combined Pike/Wentworth rankings of allgeologic units for the 1982 soil slips (28 aspect bins)and for 30-m grid cells on study-area topography (36bins). The median rank of soil expansivity is 5.0 (some ofthe unit is severely expansive) across all but seven pairs of10° bins. The seven bins, clustered in two groups at nearlyopposite azimuths, may reflect the uneven distribution ofsix geologic units that have the most severely expansivesoils, ranks 6.0 and 7.0: Tbh, Tbl, Tgvt, Th, Tshc, and Tus(Table 1). The three 6.0-ranked E–NE-facing bins inFig. 9, for example, have more soil slips (53%) on theseunits than do the seven nearest E–NE rank-5.0 bins of soilslips (37%). The 16% difference suggests that the 1982debris flows arose more readily on the most expansivesoils (for topography, percentages of the most-expansiveunits average a comparatively even 30%±4% across allten bins). In contrast, percentages of 6.0- and 7.0-rankedcells on topography of the four 4.0-ranked SW-facing bins(19%) and the six flanking 5.0-ranked bins (23%) are low.We speculate that 19% was not enough to induce acommensurately low rank in these four SW bins for soilslips, 30% of which are located on 6.0- and 7.0-rankedgeologic units. The higher 30% value suggests, instead,that soil-slip/debris-flow initiated preferentially on thecomparatively few 6.0- and 7.0-rank slopes available inthis SW sector. More detailed analysis lies beyond thescope of this paper.
3.7. Plant cover
Vegetation appears to have been a major control onthe location of debris flows in the Oakland hills duringthe January 1982 storm. McKean et al. (1991) reachedsimilar conclusions for San Mateo County. Analysis ofthe 100-m-resolution land-use map by Perkins andChuaqui (1996) regridded to 30 m shows that 93% of the1942 soil slips occurred on the 71% of the study areaclassified as rangeland (i.e. grass and shrub) or forest.Residential and mixed-urban use (29%) account for only7% of the slips. Although forested areas (47%) are twiceas abundant as rangeland (24%), more slips occurred onrangeland than in forested terrain, by 57% to 36%. Thelatter difference probably is too great to attribute toconcealment of debris flows on forested slopes (q.v. sup.,Wieczorek, pers. comm. 2005). Table 2 shows relativesoil-slip density in the 1982 storm, expressed as per-centage of soil slips / percentage of study area, forfour types of vegetation. Slope failure was most commonon the comparatively few occurrences of mixed herba-ceous (grassy) and shrub (including chaparral) rangeland
(%/%=4.0), followed by the more widespread herba-ceous rangeland (2.3) and then evergreen forest (1.1) andmixed deciduous and evergreen forest (0.7). Comparablesoil-slip densities for undifferentiated rangeland andforest are 2.4 and 0.8, respectively.
According to Fig. 10 the two main types of plant coverin the study area vary systematicallywith azimuth, and theplant distribution for topography differs from that for the1982 soil slips. Forested topography (Fig. 10A) is skewedto the NNE (vector mean aspect=16°), while mosttopography in grass and shrub (Fig. 10B) faces SW(224°). However, soil slips in both forest (Fig. 10C) andrangeland (Fig. 10D) primarily face S–SSW, at 185° and201°, respectively, rather like rangeland topography(10B) but with a more southerly aspect. Many soil slipsin forest (Fig. 10C) also face SE. Soil slips are more likelyto have a southerly aspect (91°–270°) than topography, by71% to 45% in forest and 78% to 61% on rangeland.Although the high density of soil slips on S-facing slopesmirrors the predominance of rangeland, this associationalone does not necessarily explain why N-facing soil slipsare so uncommon on forested land (Fig. 10C).
The azimuthal relation of shallow landsliding tovegetation is revealed in detail (10° aspect bins) for theOakland hills by the ratio of rangeland area to forest area,a sensitive measure of vegetation contrasts. Fig. 11 showsthat rangeland/forest ratios for soil slips are uniformlyhigher than those for topography, indicating that soil slipsinitiated preferentially on grassland at all azimuths, notsolely on southerly slopes. However, the ratio increasesfrom N to S for both sets of observations. Rangeland/forest ratios for topography are low, rising with littledispersion (R2=0.92) from 0.21 on NNE-facing slopes to0.85 on SW slopes. The ratio rises similarly for soil slips,with substantial dispersion (R2=0.45), from about 0.5 on
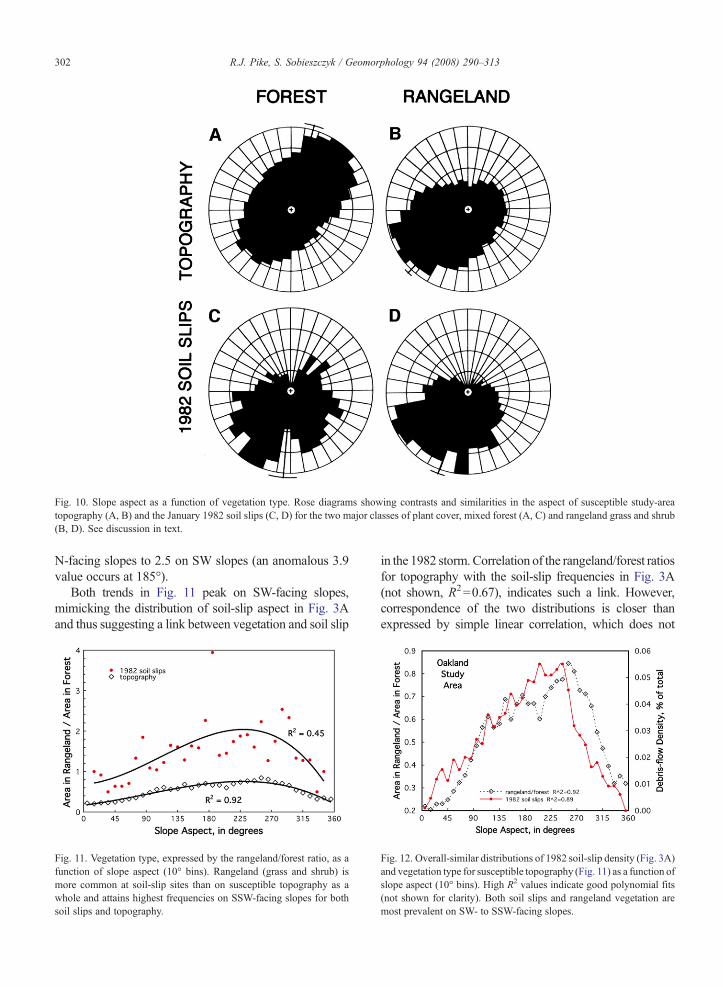
Fig. 10. Slope aspect as a function of vegetation type. Rose diagrams showing contrasts and similarities in the aspect of susceptible study-areatopography (A, B) and the January 1982 soil slips (C, D) for the two major classes of plant cover, mixed forest (A, C) and rangeland grass and shrub(B, D). See discussion in text.
302 R.J. Pike, S. Sobieszczyk / Geomorphology 94 (2008) 290–313
N-facing slopes to 2.5 on SW slopes (an anomalous 3.9value occurs at 185°).
Both trends in Fig. 11 peak on SW-facing slopes,mimicking the distribution of soil-slip aspect in Fig. 3Aand thus suggesting a link between vegetation and soil slip
Fig. 11. Vegetation type, expressed by the rangeland/forest ratio, as afunction of slope aspect (10° bins). Rangeland (grass and shrub) ismore common at soil-slip sites than on susceptible topography as awhole and attains highest frequencies on SSW-facing slopes for bothsoil slips and topography.
in the 1982 storm.Correlation of the rangeland/forest ratiosfor topography with the soil-slip frequencies in Fig. 3A(not shown, R2=0.67), indicates such a link. However,correspondence of the two distributions is closer thanexpressed by simple linear correlation, which does not
Fig. 12. Overall-similar distributions of 1982 soil-slip density (Fig. 3A)and vegetation type for susceptible topography (Fig. 11) as a function ofslope aspect (10° bins). High R2 values indicate good polynomial fits(not shown for clarity). Both soil slips and rangeland vegetation aremost prevalent on SW- to SSW-facing slopes.

Fig. 14. Frequency of forested topography in the Oakland areaincreases with mean year-round soil moisture. Vegetation type,expressed by the forest/rangeland ratio in 10° aspect bins (N.B.,usage reversed from that in Figs. 11–13), as a function of potentialevapotranspiration. Polynomial fit is very well constrained.
303R.J. Pike, S. Sobieszczyk / Geomorphology 94 (2008) 290–313
incorporate adjacency of the 10° aspect bins—the spatialcontext that creates the parallelism observed in Fig. 11. Theimportance of this context is confirmed in Fig. 12, anazimuthal plot of soil-slip density (R2=0.89) and therangeland/forest ratio for topography (R2=0.92). Overallsimilarity of the two trends, despite some mismatch in theNE and S–NW sectors, is among the strongest evidencefor localization ofmany of the 1982 soil slips by vegetationtype. Inverse correlations (not shown) between the prev-alence of topographic convergence in Fig. 6 and the fourdistributions in Figs. 11 and 12 additionally link debrisflow with the shaping of Oakland-area hillsides
Fig. 13 shows that the rangeland/forest ratio fortopography in the study area also varies (inversely) withslope gradient (R2=0.82), further extending the signifi-cance of the gradient/aspect relation noted for topographyin Fig. 5 and its complement, the 10% NE/SW differencein hillside area identified in Fig. 3B. The NE/SWasymmetry of slope gradient in Fig. 5 (although not theareal asymmetry in Fig. 3B) is known from upland terrainfurther south along the California coast as a N/S contrast.This difference has been attributed to the varied responseof surface processes to the control of vegetation type anddensity by incident solar radiation in a semiarid climate,mainly reduction of slope gradient by higher rates oferosion on surfaces most exposed to the sun (Emery,1947; Dohrenwend, 1978). The asymmetric distributionof the 1982 SFBR soil slips in Fig. 3C and D is furtherconsistent with this explanation.
The contrasting distributions of rangeland and forest inFig. 10 as well as the shape of the rangeland/forest trendsin Fig. 11 reflect soil moisture and thus the localmicroclimate, which derives from several factors. Theseinclude latitude, elevation, hillside geometry, temperature,precipitation, and wind direction, but, ultimately, solar
Fig. 13. Grass and shrub (rangeland) vegetation on study-area topography(Figs. 11, 12) becomes increasingly common with decreasing slope gra-dient (Fig. 5).
illumination. The northern hemisphere's SSW maximumof effective solar radiation (Geiger, 1950) is close to theWSWorientation observed for the Oakland area's highestfrequency of rangeland (Figs. 11, 12) and lowest slopegradients (Fig. 5). Moisture content of the soil mantle hasbeen modelled by various measures of effective evapo-transpiration. One such index number based on slopeaspect (Parker, 1982) ranges from zero in the SSW to 20.0in the NNE (for more precise estimates of incidentradiation see Fu and Rich, 2002). This proxy for year-round soil moisture correlates well with study-areavegetation in Fig. 14 and (inversely) with the density of
Fig. 15. Increasing density of 1982 debris flows in the Oakland area(Fig. 3A) with decreasing year-round soil moisture (approximated bypotential evapotranspiration). Polynomial fit is well constrained. Highyear-round soil moisture promotes deep-rooted vegetation (i.e., forest)that resists soil slip (Fig. 14).

304 R.J. Pike, S. Sobieszczyk / Geomorphology 94 (2008) 290–313
1982 debris flows in Fig. 15. The latter relationemphasizes that it is short-term rainfall from winterstorms, not the overall moisture regime, that triggersdebris flow in Mediterranean climates. Fig. 15 thus isconsistent with the location of so many small debris flowson nonconvergent hillslopes (Figs. 1, 6) poorly providedwith year-round moisture, rather than in hollows thatremain relatively moist for much of the year.
We conclude that most of the January 1982 soil slipsmobilized on xeric (moisture-deficient) southerly slopesexposed to high insolation and clothed in shallow-rootedvegetation, particularly annual grasses that replaced nativeMediterranean shrub and deep-rooted grasses (Kesseli,1943; Rice et al., 1969; Gabet and Dunne, 2002). N- andNE-facing slopes in the SFBR are less exposed to the sunand thus evolved under mesic (moderately moist)conditions favorable to trees, whose deeper roots anchorthe soil and resist shallow landsliding—but leave theseslope prone to deep-seated failure (Beaty, 1956; Radbruchand Weiler, 1963; McKean et al., 1991). The N/S mesic/xeric contrast partly explainswhy so few 1982 soil slips inforested Oakland-area topography (Fig. 10C) have anortherly orientation.
3.8. Wind direction
The hillside properties arrayed by slope aspect inFigs. 4–15 do not explain the SE orientation of terrain-normalised soil slips in Fig. 3C. The SE mode, and tosome extent the dearth of N-facing soil slips revealedin Figs. 3, 7 and 10, suggests a locational control onshallow failure in January 1982 other than—or, morelikely, in addition to—topography or plant cover. Aconstant storm–wind direction may be this control.
Table 3 shows that winds accompanying six of themostdamaging SFBR rainstorms over the last 50 years were
Table 3Wind direction, wind velocity, and rainfall at San Francisco Bay area weath
December 1955 January 1956 b Octo
WINDNumber of stations 5 5 5Averaged Directions:
Compass sector S SSE SSWVector mean, deg. 190° 157° 212°
Velocity, m/s:Mean 8–11 4–6 6–10Maximum 14–18 6–10 10–1
RAINFALLStation San Francisco Oakland OaklTotal, mm 141 97 208Duration, h 43 45 43
a Source: calculated from records maintained by the National Oceanic andb Ground was saturated from December 1955 rainfall.
southerly and frequently from the SE—partly channelledby the region's NNW-striking topography, especially atlow elevations (Smalley, 1957). During the January 1982storm, the vector-mean wind direction recorded just westof the study area at Oakland International Airport was145°±10°, with 14 of the 33 hourly measurementsclustered between 150° and 160° (Fig. 16A, Table 4).Velocity of the wind that drove storm rainfall from the SEvaried from 2 m/s to 15 m/s at the airport and averaged abrisk 10 m/s (Table 4). Hourly precipitation ranged fromzero to 12 mm with a 6-mm mean over the 33-hourduration of the storm, as measured at nearby MerrittCollege and the city of Piedmont, where respective totalswere 176 mm and 188 mm (rainfall was not recorded atOakland Airport during the storm).
The initiation of soil slip on a hillside requires intenserainfall of sufficient duration to saturate the soil layer andovercome resistance of the slope to shear stress (Camp-bell, 1975; Wieczorek, 1987). Because the rate ofmoisture delivery to a steep slope varies according tofactors other than constancy of wind direction, chieflyamong them wind speed and the amount of rainfall, werecalculated wind direction to better reflect its influenceon soil-slip initiation. Weighting (multiplying) eachhourly measurement of mean wind direction in the 1982storm by the total hourly rainfall (in mm) and averagedwind speed (in m/s) shifts the vector mean only slightly to147° but further reduces the already low dispersion(confidence angle) to ±4° (Fig. 16B). The winds that wererecorded nearest the study area in 1982 thus came out ofthe SE with remarkable consistency. Similar observations(here unweighted) on wind direction at five other sea-level weather stations in Table 4 attest to SE winds acrossmuch, if not all, of the SFBR during the storm.
Over 25% of the normalised 1982 soil-slip data inFig. 3C are concentrated between azimuths of 110° and
er stations for six major storms, 1955–1998 a
ber 1962 January 1982 December 1995 February 1998
6 15 9
SE SSE SSE143° 162° 147°
8–11 4–17 3–109 12–20 10–27 8–23
and Piedmont San Francisco San Francisco185 105 11433 32 34
Atmospheric Administration.

Fig. 16. Constant SE wind direction at Oakland Airport during 3–5 January 1982 storm (same display conventions as Fig. 3). (A) 33 hourlymeasurements, highest %=42. (B) wind direction weighted by rainfall and wind speed (see text), highest %=48. Vector means (145° and 147°,respectively) fall between the 155° mode for normalised debris-flow aspect in Fig. 3C and the 135° median of the SE-facing 50° sector in Fig. 3C.
305R.J. Pike, S. Sobieszczyk / Geomorphology 94 (2008) 290–313
160°. The 135° median direction for this SE-facing 50°sector and the 155° mode for the entire distribution inFig. 3C straddle the storm wind's SE vector mean of145°–147°. We interpret the agreement to infercausation and propose wind-driven rainfall (WDR) asthe mechanism that located many of the S-facing, andespecially SE-facing, debris flows in the Oakland hillsand throughout the SFBR in January 1982.
4. Wind-driven rainfall
WDR is succinctly defined (Blocken and Carmeliet,2004) as
“rain that is given a horizontal velocity componentby the wind and that falls obliquely.”
Slanting rain driven by wind from a constant directionalters the nominally uniform distribution of moisture thatresults from vertical raindrop trajectories. The windward/leeward (“exposed”/“sheltered”) contrast in the intensityof rain falling under windy conditions has been perceived
Table 4Wind statistics for San Francisco Bay Area weather stations during the storm
Station Wind direction
Compasssector
Vector mean(°)
Confidence(°)
Oakland Airport SE 145 ±10Oakland Airport b SE 147 ±4Alameda Naval Air Station SE 134 ±18San Francisco Airport SE 132 ±17Moffett Field Naval Air Station SSE 155 ±10Half Moon Bay buoy c SE 143 ±9Bodega Bay buoy c SSE 150 ±12a Source: calculated from records maintained by the National Oceanic andb Wind direction weighted by hourly rainfall and wind speed (see text).c In Pacific Ocean off SFBR coast (all other stations are located on San F
since antiquity, particularly for the built environment. Aquantitative, experimentally verified understanding of theeffects of WDR on natural topography, however, datesback scarcely more than a century. In explaining theselective affinity of forests for steep S and SE slopes in thesemi-arid South African colony of Natal, Fourcade (1889,p. 26) observed
“The bulk of the rain comes from the south-east anddrives at some inclination, so that slopes with thataspect will receive (the) most water.”
Fig. 17 illustrates how terrain slope and aspectmodulate incident rainfall such that more moisture perunit area is delivered to surfaces that face the wind than tolevel ground or slopes facing away from the wind.Fourcade (1889) estimated the magnitude of this contrastat about 1.4:1 to 1.7:1 for the forested steeplands of Natal,and Horton (1919) calculated a 1.3:1 difference for steepslopes in the Catskill Mountains of New York State. Thedisparity, which increases with wind speed and groundslope and lessens with increasing angular (horizontal)
of 3-5 January 1982 a
Velocity (m/s)
angle Rmagnitude
Modal10° bin
% data inmodal bin
mean maximum
0.87 151–160 42 10 150.96 151–160 48 " "0.65 141–150 35 9 120.69 131–140 32 10 140.88 161–170 38 8 130.91 141–150 49 11 200.83 141–150 31 11 18
Atmospheric Administration.
rancisco Bay).

Fig. 17. An explanation for the coincidence of normalized soil-slipaspect (Fig. 3C) and wind direction (Fig. 16) in the storm of 3–5January 1982. Illustration of trigonometric model (Eq. (1) in text)estimating relative amounts of slanting wind-driven rainfall onOakland-area hillsides during the storm. Wind is from SE, left, at10 m/s. From raindrop trajectories i' inclined 47° from vertical,windward 18° slope f receives about 35% more rain, and leeward 19°slope e 37% less rain, than level surfaces a and b receive from vertical iand oblique i' rainfall, respectively. The catch of vertical rain i onslopes c (18°) and d (19°) differs minimally (6% less) from that onlevel surfaces a and b.
306 R.J. Pike, S. Sobieszczyk / Geomorphology 94 (2008) 290–313
distance from the mean wind direction, can occur underconditions of light rain and low wind speeds (Struzer,1972). The phenomenology of WDR is most thoroughlyunderstood from its destructive effects on exteriorbuilding surfaces, for which a vast technical literatureexists (Underwood andMeentemeyer, 1998; Blocken andCarmeliet, 2004). WDR complicates the accurate estima-tion of rainfall totals (Burns, 1953; Jackson and Aldridge,1972), catchment runoff and the timing of floods (Horton1919; Hamilton, 1944), and soil erosion and the resultingtransport of sediment (Helming, 1999; Erpul et al., 2002).As observed by Fourcade (1889), WDR affects theazimuthal distribution of vegetation on sloping terrain,particularly in a semi-arid climate where plants are mostsensitive to differences in rainfall and slope exposure.Measurements by Geiger (1928) from a 360° array ofrain gauges emplaced normal to the surface of a conicalhill quantified the directional effects of WDR innatural topography, revealing a maximum windward/leeward disparity exceeding 1.3:1 (see Gieger, 1950,pp. 213–247).
Gilbert (1909) may have been the first earth scientistto comment at length on the effectiveness of WDR as ageomorphological agent, but his description and photo-graphs are of cm-scale erosion by oblique-rain impactrather than landsliding. More recently, the direction ofprevailing winds or of movement of a large stormsystem has been linked to debris-flow aspect (Larsenand Parks, 1998; Pinter and Vestal, 2005). Rarely,however, has landslide aspect been attributed specifi-
cally to the direction of the local winds that accompanyrain during a storm (Rapp and Strömquist, 1976;Wieczorek et al., 1997). In attempting to explain themismatch between landslide aspect on the San Franciscopeninsula and the overall aspect of SFBR topography(e.g., Fig. 3A and B), Bonilla (1960) can be creditedwith all but explicitly ascribing landslide orientation toWDR:
“… the trajectory of raindrops may be important, asthe amount of rain that falls can vary with the sine ofthe angle of incidence. For example, if the rain isfalling toward the northeast at 60° from thehorizontal, a 30° slope inclined to the northeastwould theoretically receive only half as much rain asa similar slope inclined toward the southwest.”
We estimated the true amount of precipitationdelivered to windward and leeward hillsides in theOakland area in January 1982. Rainfall is treated not asthe usual scalar quantity but as a vector, comprising bothmagnitude and direction (Horton, 1919; Jackson andAldridge, 1972). From the trigonometric model ofSharon (1980), after the equation in which Fourcade(1942) refined his earlier (1889) estimates, the hydro-logically effective precipitation received at the groundsurface, Pe, is calculated
Pe ¼ Po 1þ tan a tan b cos za� zbð Þ½ � ð1Þ
where Po is the total catch by a conventionalhorizontally oriented rain gauge for any time intervalof interest, a and za are hillslope gradient and aspect,respectively, b is angular departure of raindrop trajec-tories from the vertical, and zb is the compass directionfrom which the wind originates. Angle b was notmeasured during the January 1982 storm, but accordingto experimental results elsewhere (Sharon, 1980; DeLima, 1990; Erpul et al., 2002) the mean 10 m/s windspeed at Oakland Airport infers an average inclinationfor raindrop trajectories of at least 47°. For a 10 m/swind from the SE at 145° (Fig. 16) and a hillside directlyfacing the wind at 145° and sloping at an averagegradient of 18° (from upper curve in Fig. 5), theresulting Pe is about 1.35 Po. On a hillside 180°opposite the wind, at 325°, and sloping at a mean 19°(also from Fig. 5), Pe is about 0.63 Po. These estimatesare consistent with our illustration of the model's effectsin Fig. 17, which assumes a decreasing distance betweenparallel raindrop trajectories with increasing windspeed. The estimates also are consistent with thedetailed 2-D numerical simulations of WDR modelledby Blocken et al. (2005) for fine-scale topography. Their

Fig. 18. Likely combined effect of geology and wind-driven rain onincidence of debris flow with aspect in the 1982 storm. Vegetation typeand debris-flow density on the Hambre Sandstone (Fig. 7, unit Th) as afunction of slope aspect (10° bins). Landslide density on the Hambre'sseverely expansive surficial mantle is higher on SE-facing slopes andlower on SW-facing slopes than it is for study area as a whole inFig. 12. See discussion in text.
307R.J. Pike, S. Sobieszczyk / Geomorphology 94 (2008) 290–313
experiments yielded Pe /Po ratios ranging from 0.46 to1.37 depending on wind speed, distance from nearesthilltop, and windward or leeward location. Unlike theseauthors, we did not include the effects of raindrop size,location on a hillside, and other contributing factors.Further modulating the estimates of Pe at specific sitesfrom Eq. (1) are the channelling of wind down localvalleys and the disruption of wind flow by nearbytopographic features (Smalley, 1957; Juuso, 2002), bothof which must have varied the assumed average zb of145° in January 1982.
During the storm, therefore, rainfall delivered to EastBay hillsides may have varied by as much as 100%.Rather than the 176–188 mm totals recorded at MerrittCollege and Piedmont (Cannon and Ellen, 1988), Eq.(1) suggests that slopes directly opposite the SE windprobably received up to 240–255 mm and on NW slopes180° from the wind as little as 110–120 mm. The rate ofmoisture delivery to SE hillsides likely averaged about7 mm/h over the duration of the storm and may havebeen as high as 16 mm/h; comparable rates for NWslopes would have been about 3.5 mm/h and 7.5 mm/h.Because the modeled wind speed is an average and theslope gradients are averages from a 30-m DEM ratherthan the steeper values from field measurements, theseestimates are conservative. Locally, the maximumcontrast in rainfall between SE-and NW-facing slopesis even greater. Offsetting this enhancement is diminu-tion of the effect as slope aspect approaches 90° from themean wind direction, whereupon the SE/NW differencetheoretically decreases to zero.
WDR from the SE helps to explain the counterintu-itive observation that moisture-triggered landslides inthe Bay area occur mostly on sunny S-facing slopes thatfor most of the year are dry, not wet. The estimated 2:1windward/leeward contrast in rainfall in 1982 probablyreinforced existing S/N differences in terrain aspect(Figs. 3B and 10A and B) and vegetation type (Fig. 12)to produce the skewed distributions of soil-slip aspectobserved in Figs. 3A, 10C and D. Wind-augmented rainfrom the SE would have been driven against steep S-facing hillsides at near-normal angles of incidence.These slopes are covered largely in shallow-rooted grassand shrub that offer little resistance to landsliding.Locally, soil expansivity may have been a contributingfactor. The uniquely high density of SE-facing debrisflows on the Hambre Sandstone in Fig. 18 suggests thatthe clay-rich surface mantle of this unit was especiallyprone to instability under the intense rainfall from theSE—despite the greater availability of vulnerable SW-facing grass-covered slopes (Fig. 18). Landslide sus-ceptibility varies widely throughout the Oakland hills.
Storm-wind direction, hillside orientation, and vegeta-tion probably are among the major factors that deter-mined whether the critical amounts of moisture neededto trigger soil slip/debris flows were exceeded locally in1982.
Threshold conditions of rainfall duration and inten-sity were determined for the SFBR by Cannon and Ellen(1988) and revised and mapped by Wilson and Jayko(1997). Table 5 summarizes the revised estimates forMerritt College and Piedmont. The rainfall durationsrequired to exceed 6-hour (64 mm of rain) and 24-hour(102 mm) thresholds in the 1982 storm were 30 hoursand 21–23 hours, respectively. Neither of these times-to-failure agrees with the onset of landsliding observedin the East Bay in 1982 (Cannon and Ellen, 1988,Fig. 3.1). The estimates do agree, however, whenrecalculated to incorporate the effects of WDR illustrat-ed in Fig. 17. To make this correction we multiplied theplots of cumulative rainfall in Cannon and Ellen (1988,Fig. 3.1) by the Pe values of 1.35 and 0.63 resulting fromEq. (1) and reapplied the threshold criteria. The WDRmodel predicts that the most sheltered northerly slopesin 1982 would have failed to receive the required 64 mmrainfall within 6 hours (physically, the more realisticof the two thresholds for local conditions). The mostexposed southerly slopes, moreover, would havereached the 6-hour threshold 17 to 23 hours into thestorm, at approximately the time that the first debrisflows were observed in the East Bay hills (Cannon andEllen, 1988). While these modelled estimates, like therainfall thresholds themselves, are subject to uncertaintythey are consistent with the observed N/S dichotomy in

Table 5Estimated duration of rainfall — with and without a driving wind — required to trigger debris flows in the Oakland study area during the 33-hourstorm of 3–5 January 1982
Threshold conditions fordebris-flow initiation a
Elapsed time from start of storm to attainment of rainfall-threshold conditions(number of hours)
(amount of rainfall within6 and 24 hours)
Rainfall notcorrected foreffects ofdriving wind b
Rainfall corrected for effects of wind from SE at 10 m/s c
North-facing slopes South-facing slopes
6 hours: 64 mm (2.5 in) 30 Threshold not reached during storm 17–2324 hours: 102 mm (4 in) 21–23 27–29 8–21a From two 1:50,000-scale rainfall-threshold maps (Wilson and Jayko, 1997).b Frommaps (Wilson and Jayko, 1997) and plots of cumulative storm rainfall for gauges at Merritt College and Piedmont (Cannon and Ellen, 1988,
Fig. 3.1).c Frommaps (Wilson and Jayko, 1997), cumulative rainfall curves forMerritt College and Piedmont (Cannon and Ellen, 1988, Fig. 3.1), and Eq. (1)
in text.
308 R.J. Pike, S. Sobieszczyk / Geomorphology 94 (2008) 290–313
the distribution of soil slips in Figs. 3A and C and 10Cand D.
5. Discussion
A number of slope-destabilizing factors vary with thecontrasting conditions of WDR illustrated in Fig. 17;among the most important is rainfall intensity. Inconsidering erosive force, for example, Helming (1999)found that the average raindrop energy derived fromwindon slopes facing the wind is as much as 25% of the totalkinetic energy of falling rain. This percentage would becorrespondingly lower on slopes sheltered from WDR.The transient processes by which soil slips are thought toinitiate (Iverson, 2000) almost certainly responded toaspect-controlled variations in rainfall intensity in 1982.Of major importance is infiltration of the surficial mantle(Kesseli, 1943). In the absence of field observationsduring the stormwe can only speculate, but surface runoffand soil drainage were least likely to have kept pace withrainfall intensity on hillsides facing the SE winds. Soilsaturation on southerly slopes may have been very rapid,elevating and prolonging positive pore-water pressures tothe extent that failures occurred with little control bysurface form. Rather than concentrating in hollows andtriggering soil slip in ravine fill, on steep southerlyhillsides lacking strong surface relief the runoff may havespread downslope in a discontinuous sheet and triggeredfailures in the slabs of colluvium that mantle nonconver-gent slopes. Such slips may be smaller than the classicexamples of Reneau and Dietrich (1987) and others.
These extreme conditions may partly explain whyso few soil slips are observed on convergent slopes inFig. 6. The unexpected shortfall is evident not only in theOakland hills but elsewhere in the SFBR in 1982(Wieczorek, 1987) and also during the February 1998
storm (Coe and Godt, 2001), as well as in severe stormsoutside the region (Wieczorek et al., 1997). Fig. 6 furthersuggests that 1982 soil slips on nonconvergent slopeswere most common at southerly aspects (69% on SSEslopes, facing the SE winds), consistent with highestintensity of modelledWDR and accelerated infiltration ofthe soil mantle. Conversely, soil slips with a northerlyaspect appear to have occupied fewer nonconvergentslopes in Fig. 6 (62% on NNE slopes), a tendency furtherevident inmoving averages and higher-order polynomialsfor the same data (not shown). The higher frequency ofconvergent soil-slip sites at northerly aspects in 1982mayhave reflected less intense rainfall on sheltered slopes, lessrapid soil saturation, and thus a more orderly concentra-tion of runoff in surface concavities—subsequentlyleading to soil slip—than would be possible on S-facingslopes overwhelmed by intense WDR. Whether thesespeculative differences in process correlate with soil-slipand debris-flow size, failure early or late in the storm, orsuch site factors as depth of colluvium and soil properties(e.g., Gabet and Dunne, 2002) remains to be tested. Overthe long term, greater soil-slip activity on S-facing slopesmay have contributed to higher overall rates of mass-wasting on southerly slopes and thus to the lower gradientof S-facing topography in Fig. 5 and to the dramaticallylower percentage of convergent slopes on S-facingtopography in Fig. 6.
Southerly WDR was not unique to January 1982.Table 3 shows that strong winds varied narrowly fromSE to SSW in five other damaging storms in the SFBR.The severe El Niño storm of 2–3 February 1998, arecent example, triggered many shallow landslides, fewof which were mapped in detail (Godt, 1999). Werepeated the analyses in Figs. 3 and 16A for February1998 soil slips in the Walpert Ridge area south ofOakland. The 531 debris flows identified from high-

309R.J. Pike, S. Sobieszczyk / Geomorphology 94 (2008) 290–313
resolution airphotos by Coe and Godt (2001) in their91 km2 study site were located with sufficient accuracyto support DEM analysis at a 10-m spatial resolution.Fig. 19A–C shows slope aspect for the 1998 soil slips,the local topography, and the soil slips normalised bytopography, respectively. While Fig. 19C has a strongerwesterly component than the 1982 data in Fig. 3C, italso has a prominent SE mode at 135° that we attributeto WDR on the basis of the predominantly SE 1998storm-wind direction evident in Fig. 19D.
The wind measurements in Fig. 19D were obtainedfrom sources unavailable in 1982. Since 1990, remoteautomated weather stations (RAWS) have recordedrainfall, wind speed, and wind direction hourly atisolated U.S. locations, primarily those prone to wildfirein the arid and semiarid West. The two dozen or socurrently active RAWS in the SFBR are closer to uplanddebris-flow sites than the region's sea-level airports(http://www.wrcc.dri.edu/wraws/ccaF.html), offshorebuoys (http://seaboard.ndbc.noaa.gov/Maps/monterey_bay_hist.shtml), and ports (http://sfports.wr.usgs.gov/cgi-bin/TS-Plot.cgi?Controls=arch). Combined wind
Fig. 19. Results from aspect analysis of a later debris-flow event in the Bay Aand wind direction in the 2–3 February 1998 storm,Walpert Ridge study area,soil slips, highest %=9.0 at 215°. (B) aspect for study-area topography (91,78susceptible topography, %A/%B; heavy grid circle=1.0, highest value=2.2Table 6 and text), highest %=12.0 at 155°, vector mean=142°. Compare w
data recorded at the three RAWS nearest the 1998study area (Fig. 19D, Table 6) yield a SE vector mean of142°±17°; mean wind speed was 6 m/s and maximumvelocity 14 m/s. The more variable wind direction andlower velocity in 1998 may explain why the SE mode ofnormalised soil-slip aspect in Fig. 19C is smaller thanthat for the 1982 storm in Fig. 3C. Table 6 shows winddata for ten SFBR weather stations during the 1998storm. The resultant SE–SSE direction suggests thatmany of the thousands of unmapped debris flowstriggered across the region in 1998 (Godt, 1999) alsowere, as in 1982, located on SE- to SSE-facing slopes.Finally, general agreement between RAWS, airport, andother data in 1998 (Table 6) infers that the SE windsrecorded at sea-level and at SFBR locations removedfrom the study area in January 1982 (Table 4) prevailedin the Oakland hills as well.
The results in this paper further complicate the pre-diction of debris-flow location in future SFBR rainstorms.Our results, however, also carry potential for improvingpublic safety through the refinement of hazard estimatesand eventually contributing to a National Debris-Flow
rea resemble those for the 1982 storm. Rose diagrams for slope aspectjust SE of Fig. 2 (same display conventions as Fig. 3). (A) aspect of 5313 10-m grid cells), highest %=4.8 at 225°. (C) soil slips normalised byat 135°. (D) combined wind directions from three nearest RAWS (seeith 1982 aspect and wind direction in Figs. 3 and 16.

Table 6Wind direction and velocity at San Francisco Bay Area weatherstations during the 34-hour storm of 2–3 February 1998 a
Station CompassSector
Vectormean (°)
Velocity, m/s
Mean Maximum
Oakland Airport SE 126 7 10Alameda MeteorologicalStation
SE 143 6 14
San Francisco Airport ESE 109 6 12Moffett Field NavalAir Station
SSE 148 5 11
Travis Air Force Base SSE 147 7 15Port of Redwood City SSE 159 4 8Briones RAWS SSW 202 3 19Las Trampas Ridge RAWSb S–SSE 169 10 22Calaveras Road RAWSb ESE 116 6 23Livermore RAWSb SE 141 4 11
a Source: calculated from data maintained by the National Oceanicand Atmospheric Administration; RAWS = remote automated weatherstation (see text).b RAWS closest to the 1998 Walpert Ridge study area (see Fig. 19D
and text).
310 R.J. Pike, S. Sobieszczyk / Geomorphology 94 (2008) 290–313
Warning System (e.g., NOAA-USGS Debris-Flow TaskForce, 2005). The most straightforward change wouldbe incorporation of vegetation type, terrain aspect, andstorm-wind direction into debris flow/rainfall thresh-olds and susceptibility models for shallow landsliding.The 1982 storm and its large inventory of debris flowsmight be an appropriate design template for suchrefinements. Improving real-time hazard warnings, forexample through decision-support modelling, poses agreater challenge. One obstacle is the sparse networkof recording weather stations (estimates of storm rain-fall by radar and infrared sensors are prone to wind-generated error; Wieczorek et al., 2003). Where RAWSor other ground-based instruments have been installed,however, the sequential measurement of storm rain-fall and wind speed and direction could contribute todynamic representations of slope instability (Campbellet al., 1998). GIS modelling could continually updatehazard maps on-the-fly during passage of a storm througha vulnerable area. Such spatially-distributed warningsystems (NOAA-USGS Debris-Flow Task Force, 2005),21st-Century successors to first-generation SFBR pro-genitors (Wilson et al., 1993), could be deployedwherever the necessary data on meteorology and sitecharacteristics are available in real time.
Susceptible hillsides during severe storms do notencourage the direct observations that might furtherelucidate soil slip/debris flow and answer some of thequestions raised here. However, measurements similarto those of Geiger (1928, 1950) would at least evaluatethe predicted differences in rainfall on exposed and
sheltered terrain. Test sites in susceptible SFBR uplandsrequire location near RAWS or other instrumentationthat records wind direction and velocity. Grass-coveredor otherwise unobstructed locations would minimiseinaccurate measurements due to disturbance of rainfalltrajectories by trees and large shrubs. Sites near ridgetops, which receive less rainfall due to eddying windcurrents (e.g. Blocken et al., 2005), also are unrepre-sentative. The rain gauges would need to be emplacednear the ground parallel to the hillslope, but elevatedabove it to avoid contaminating the catch with raindropsplash and surface runoff. A major winter storm wouldyield test results most relevant to debris-flow initiation.
6. Conclusions
The frequency distribution of slope aspect for shallowOakland-area landslides mobilized in the January 1982storm is neither random nor matches that of the localtopography. Detailed GIS analysis of seven influenceson soil-slip location, deliberately limited to susceptibletopography, shows that the failures did not initiate underazimuthally uniform conditions. Three major factors—aN-to-SSW increase in the predominance of xeric overmesic vegetation, an abundance of SW-facing slopes,and a constant SE storm-wind direction—are consistentwith, respectively (but not exclusively), few N-facingsoil slips, abundant SW-facing soil slips, and many SE-facing soil slips. The three factors are interrelated, butthere is insufficient evidence upon which to assign anorder of relative importance at this time.
We conclude that prolonged heavy rainfall intensifiedby storm winds from the SE preferentially destabilizedS-facing hillsides clad in vegetation that offered littleresistance to shallow failure. The analysis also revealedthe wide variation in susceptibility of bedrock units tosoil slip, identified a NE/SW asymmetry in the slope ofthe local terrain, and adduced some support for the viewthat expansive soils can facilitate soil slip/debris flow inthe SFBR. In addition, we found that the three DEM-derived properties of surface form either appear to havehad only minor influence on the aspect of shallowlandslides in 1982 or require further study. For theOakland area's 1,942 soil slips, slope gradient variesweakly with aspect, the systematic variation of elevationwith aspect eludes physical explanation, and a likelyrelation of initiation-site curvature to aspect is poorlyconstrained from the available data. For the study area'sunderlying topography, the modest variations of grid-cell elevation, frequency, and inclination with azimuthappear readily explainable by local microclimate or ridgeand valley alignment. The systematic variation of land-

311R.J. Pike, S. Sobieszczyk / Geomorphology 94 (2008) 290–313
surface curvature with azimuth is well constrained andclosely related to environmental factors reflecting theincidence of solar radiation.
Wind-driven rainfall, which may have delivered twicethe moisture to exposed than to sheltered hillsides in theOakland area in 1982, is a hitherto overlooked influenceon shallow landsliding. The modelled 2:1 contrast isconsistent with local rainfall thresholds for debris-flowactivity as well as with the results of numericalsimulations of WDR on fine-scale topography. Histori-cally in the SFBR, the wind accompanying large winterstorms is unrelated to the prevailing WNW winds butrather has SSW to SE origins. SE winds were recordedacross the SFBR during the 1982 storm and thus probablyraised the frequency of S-oriented soil slip outside the EastBay study area. Analysis of wind direction and debrisflows triggered by the El Niño storm of February 1998indicates that driving rainwas not unique to January 1982.Accordingly, a southerly storm wind may be as importanta contributor to debris-flow location as type of vegetationor aspect of the local topography. Incorporating thesethree factors within probabilistic models of landslidesusceptibility, together with such conventional attributesof site as slope gradient and materials properties, wouldreduce uncertainty in the prediction of debris-flowlocation and improve the effectiveness of debris-flowwarning systems. It is not unlikely, moreover, that theresults reached here apply outside the SFBR, in the easily-destabilized steeplands of Southern California, NewZealand, Japan, the Mediterranean basin, and elsewhere(Pike, in press).
Acknowledgements
This paper is dedicated to the memory of USGScolleague Manuel (“Doc”) Bonilla. The U.S. GeologicalSurvey's Geologic Mapping and Landslide HazardPrograms supported the work. Sebastian Roberts, whilea USGS employee, created the map of soil expansivity.Pike thanks Jan Null of Golden Gate Weather Servicesfor meteorological data, Jeff Coe and Jonathan Godt foraspect data, and Steve Ellen for Arc/Info tutorials. Thepaper benefited from discussions with Ray Wilson andKevin Schmidt and reviews by Steve Ellen and GerryWieczorek.
References
Anderson, J.R., Hardy, E.E., Roach, J.T., Witmer, R.E., 1976. A landuse and land cover classification for use with remote sensor data.U.S. Geol. Surv. Prof. Pap. 964 28 pp. http://landcover.usgs.gov/pdf/anderson.pdf.
Ayalew, L., Yamagishi, H., 2005. The application of GIS-based logisticregression for landslide susceptibility mapping in the Kakuda–Yahiko Mountains, Central Japan. Geomorph. 65 (1-2), 15–31.
Beaty, C.B., 1956. Landslides and slope exposure. J. Geol. 64 (1),70–74.
Blocken, B., Carmeliet, J., 2004. A review of wind-driven rainresearch in building science. J. Wind Eng. Ind. Aerodyn. 92 (13),1079–1130. http://perswww.kuleuven.ac.be/~u0008129/pdf/JWEIA_WDRreview_preprint.pdf.
Blocken, B., Carmeliet, J., Poesen, J., 2005. Numerical simulation ofthe wind-driven rainfall distribution over small-scale topographyin space and time. J. Hydrol. 315 (1-4), 252–273 http://www.kuleuven.ac.be/bwf/common/data/JP_2005_Blocken_1.pdf.
Bonilla, M.G., 1960. Landslides in the San Francisco Southquadrangle, CA. U.S. Geol. Survey, OF-500. 43 pp.
Brabb, E.E., 1987. Analyzing and portraying geologic and cartographicinformation for land-use planning, emergency response, anddecisionmaking in SanMateo County, CA. GIS’87–San Francisco,Proc. 2nd Intl. Conf. GIS. ASPRS/ACSM, Falls Church, VA, vol. 1,pp. 362–374.
Brabb, E.E., Pampeyan, E.H., Bonilla, M.G., 1972. LandslideSusceptibility in SanMateoCounty, CA:U.S. Geol. SurveyMF-360.
Bucknam, R.C., Coe, J.A., Chavarría, M.M., Godt, J.W., Tarr, A.C.,Bradley, L.-A., Rafferty, S.A., Hancock, Dean, Dart, R.L.,Johnson, M.L., 2001. Landslide susceptibility mapping on thePueblo Viejo and Río Hondo Quadrangles. Landslides Triggeredby Hurricane Mitch in Guatemala; Inventory and Discussion. U.S.Geol. Survey OF-01-0443, pp. 26–33. http://greenwood.cr.usgs.gov/pub/open-file-reports/ofr-01-0443/.
Burns, J.I., 1953. Small-scale topographic effects on precipitationdistribution in SanDimas Experimental Forest. Trans. Am.Geophys.Union 34 (5), 761–768.
Campbell, R.H., 1975. Soil slips, debris flows, and rainstorms in theSanta Monica Mountains, Southern CA. U. S. Geol. Surv. Prof.Pap. 851. 51 pp.
Campbell, R.H., Bernknopf, R.L., Soller, D.R., 1998. Mapping time-dependent changes in soil-slip / debris-flow probability. U.S. Geol.Survey, I-2586. 16 pp.
Cannon, S.H., Ellen, S.D., 1988. Rainfall that resulted in abundantdebris-flow activity during the storm. In: Ellen, S.D., Wieczorek,G.F. (Eds.), Landslides, Floods, and Marine Effects of the Storm ofJanuary 3-5, 1982, in the San Francisco Bay Region, CA. U.S.Geol. Survey Prof. Paper, vol. 1434, pp. 27–33.
Casadei, M., Dietrich, W.E., Miller, N.L., 2003. Testing a model forpredicting the timing and location of shallow landslide initiationin soil-mantled landscapes. Earth Surf. Process. Landf. 28 (9),925–950.
Carrara, A., Cardinali,M.,Detti, R., Guzzetti, F., Pasqui, V., Reichenbach,P., 1991. GIS techniques and statistical models in evaluating landslidehazard. Earth Surf. Process. Landf. 16 (5), 427–445.
Coe, J.A., Godt, J.W., 2001. Debris flows triggered by the El Niñorainstorm of February 2-3, 1998, Walpert Ridge and vicinity,Alameda County, CA. U.S. Geol. Survey, MF-2384. http://pubs.usgs.gov/mf/2002/mf-2384/.
DeLima, J.L.M.P., 1990. The effect of oblique rain on inclined surfaces: anomograph for the rain-gauge correction factor. J. Hydrol. 115 (1-4),407–412.
Dohrenwend, J.C., 1978. Systematic valley asymmetry in the centralCalifornia Coast Ranges. Geol. Soc. Amer. Bull. 89, 891–900.
Ellen, S.D., Wentworth, C.M., 1995. Hillside Materials and Slopes ofthe San Francisco Bay Region, CA. U. S. Geol. Surv. Prof. Pap.,1357. (215 pp.).

312 R.J. Pike, S. Sobieszczyk / Geomorphology 94 (2008) 290–313
Ellen, S.D., Algus, M.A., Cannon, S.H., Fleming, R.W., Lahr, P.C.,Peterson, D.M., Reneau, S.L., 1988a. Description andmechanics ofsoil slip/debris flows in the storm. In: Ellen, S.D., Wieczorek, G.F.(Eds.), Landslides, Floods, and Marine Effects of the Storm ofJanuary 3-5, 1982, in the San Francisco Bay Region, CA. U. S.Geol. Surv. Prof. Pap., vol. 1434, pp. 63–112.
Ellen, S.D., Cannon, S.H., Reneau, S.L., Langholz, B.M., Mark, R.K.,Peterson, D.M., Robinson, S.W., 1988b. Distribution of debrisflows in Marin County. In: Ellen, S.D., Wieczorek, G.F. (Eds.),Landslides, floods, and marine effects of the storm of January 3–5,1982, in the San Francisco Bay Region, CA. U. S. Geol. Surv. Prof.Pap., 1434, pp. 113–131.
Ellen, S.D., Mark, R.K., Wieczorek, G.F., Wentworth, C.M., Ramsey,D.W., May, T.E., 1997. Map showing principal debris flow sourceareas in theSan FranciscoBay region, CA.U.S.Geol. Survey, OF 97-745-E. http://pubs.usgs.gov/of/1997/of97-745/of97-745e.html.
Emery, K.O., 1947. Asymmetrical valleys of San Diego County, CA.Bull. Soc. Calif. Acad. Sci. 46, 61–71.
Erpul, G., Norton, L.D., Gabriels, D., 2002. The effect of wind onraindrop impact and rainsplash detachment. Trans. Am. Soc.Agric. Eng. 45 (6), 51–62.
Fernandes, N.F., Guimarães, R.F., Gomes, R.A.T., Vieira, B.C.,Montgomery, D.R., Greenberg, H., 2004. Topographic controls oflandslides in Rio de Janeiro: field evidence and modeling. Catena55 (2), 163–181.
Fernández, T., Irigaray, C., Chacón, J., 1996. G.I.S. analysis andmapping of landslides determinant factors in the Contraviesa area(Granada, Southern Spain). In: Chacón, J., et al. (Ed.), Proc. 8thIntl. Conf. Landslides. Balkema, Rotterdam, pp. 141–151.
Fourcade, H.G., 1889. Report on the Natal forests, W. Watson,Pietermaritzburg. 197 pp.
Fourcade, H.G., 1942. Some notes on the effects of the incidence ofrain on the distribution of rainfall over the surface of unlevelground. Trans. Royal Soc. S. Africa 29 (3), 235–254.
Fu, P., Rich, P.M., 2002. A geometric solar radiation model withapplications in agriculture and forestry. Comp. Electron. Agricul.37, 25–35. http://www.fs.fed.us/informs/download.php.
Gabet, E.J., Dunne, T., 2002. Landslides on coastal sage-scrub andgrassland hillslopes in a severe El Niño winter: the effects ofvegetation conversion on sediment delivery. Geol. Soc. AmericaBull. 114 (8), 983–990.
Geiger, R., 1928. Messung des Expositionsklimas. V. Forstwis-senschaftliches Centralblatt 50, 437–448.
Gieger, R., 1950. The Climate Near the Ground. Harvard Univ.,Cambridge. 482 pp.
Gilbert, G.K., 1909. The convexity of hilltops. J. Geol. 17, 344–350.Godt, J.W. (Ed.), 1999. Maps Showing Locations of Damaging
Landslides Caused by El Niño Rainstorms, Winter Season 1997-98, San Francisco Bay region, California. U.S. Geol. Survey, MF-2325-A–J. http://pubs.usgs.gov/mf/1999/mf-2325/.
Graymer, R.W., 2000. GeologicMap andMapDatabase of the OaklandMetropolitan Area, Alameda, Contra Costa, and San FranciscoCounties, CA. U.S. Geol. Survey, MF-2342. http://pubs.usgs.gov/mf/2000/2342/.
Hack, J.C., Goodlett, J.C., 1960. Geomorphology and forest ecologyof a mountain region in the central Appalachians. U.S. Geol.Survey Prof. Pap. 347. 66 pp.
Hamilton, E.L., 1944. Rainfall-measurement as influenced by storm-characteristics in southern California mountains. Trans. AGU 25(3), 502–518.
Helming, K., 1999.Wind speed effects on rain erosivity. In: Stott, D.E.,Mohtar, R.H., Steinhardt, G.C. (Eds.), Sustaining the global farm,
proc. 10th int'l. soil conserv. org. mtg., 24-29 May, Purdue Univ.and USDA-ARS Nat'l. Soil Eros. Res. Lab., pp. 771–776.
Hilley, G.E., Bürgmann, R., Ferretti, A., Novali, F., Rocca, F., 2004.Dynamics of slow-moving landslides from permanent scattereranalysis. Science 304, 1952–1955.
Horton, R.E., 1919. The measurement of rainfall and snow. J. NewEngl. Water Works Assoc. 33 (1), 14–71.
Iverson, R.M., 2000. Landslide triggering by rain infiltration. WaterRes. Res. 36 (7), 1897–1910.
Jackson, R.J., Aldridge, R., 1972. Rainfall measurements at TaitaExperimental Station, New Zealand, 2—tilted raingauges andvectopluviometers. J. Hydrol. (N.Z.) 11 (1), 15–37.
Juuso, N., 2002. Modeling the Wind Climate in Mountain ValleysUsing the MIUU Mesoscale Model: Examensarbete vid Institu-tionen för geovetenskaper, No. 23. Uppsala University. http://www.geo.uu.se/luva/exarb/2002/nikolaus_juuso.pdf.
Kesseli, J.E., 1943. Disintegrating soil slips of the Coast Ranges ofCentral California. J. Geol. 51 (5), 342–352.
Larsen, M.C., Parks, J.E., 1998. Map showing landslide susceptibilityin the Comerío Municipality, Puerto Rico. U.S. Geol. Survey, OF-98-566.
Lee, S., 2007. Application and verification of fuzzy algebraic opera-tors to landslide susceptibility mapping. Environ. Geol. 52 (4),615–623.
Leipper, D.F., 1996. Comments on “Structure of the lower atmosphereover the northern California coast during winter”. Mon. WeatherRev. 124 (7), 1604–1605.
Lorente, A., Beguería, S., Bathurst, J.C., García-Ruiz, J.M., 2003.Debris flow characteristics and relationships in the central SpanishPyrenees. Nat. Hazards Earth System Sci. 3 (6), 683–691.
Mark, R.K., 1992. Map of debris-flow probability, San Mateo County,CA. U.S. Geol. Survey, I-1257-M.
McKean, J., Buechel, S., Gaydos, L., 1991. Remote sensing andlandslide hazard assessment. Photogramm. Eng. Remote Sensing57 (9), 1185–1193.
Meisina, C., 2004. Swelling–shrinking properties of weathered clayeysoils associated with shallow landslides. Q. J. Eng. Geol. Hydrogeol.37 (2), 77–94.
Montgomery, D.R., Dietrich,W.E., 1994. A physically basedmodel for thetopographic control on shallow landsliding. Water Res. Res. 30 (4),1153–1171 see also: http://socrates.berkeley.edu/~geomorph/shalstab/.
Morton, D.M., Alvarez, R.M., Campbell, R.H., 2003. Preliminary soil-slip susceptibility maps, southwestern California. U.S. Geol. Survey,OF-03-17. http://geopubs.wr.usgs.gov/open-file/of03-17/.
NOAA-USGS Debris-Flow Task Force, 2005. NOAA-USGS debris-flow warning system—final report: U.S. Geol. Survey. Circular,vol.1283. 47 p; http://pubs.usgs.gov/circ/2005/1283/.
Parker, A.J., 1982. The topographic relative moisture index: anapproach to soil-moisture assessment in mountain terrain. Phys.Geogr. 3 (2), 160–168.
Perkins, J.B., Chuaqui, B., 1996. Existing LandUse in 1995:Data for BayArea Counties and Cities. Assoc. Bay Area Governments, Oakland,CA. 200 pp; http://www.abag.ca.gov/planning/bayareafutures/bay5.jpg.
Pike, R.J., in press. Debris flows in Guatemala from Hurricane Mitchlocalized by wind-driven rain? Assoc. Amer. Geogr. AnnualMeeting, abstract 14547. http://communicate.aag.org/eseries/aag_org/program/AbstractDetail.cfm?AbstractID=14547.
Pike, R.J., Sobieszczyk, S., 2003. Process-modulated contrasts inslope exposure of landslides in the San Francisco Bay area. EosTrans. AGU 84 (46), F746–F747. http://www.agu.org/meetings/fm03/fm03-pdf/fm03-H51D.pdf.

313R.J. Pike, S. Sobieszczyk / Geomorphology 94 (2008) 290–313
Pike, R.J., Sobieszczyk, S., 2005. San Francisco Bay area debris flowslocalized bywind-driven precipitation.Geol. Soc.Am.Abs. Prog. 37 (4),78. http://gsa.confex.com/gsa/2005CD/finalprogram/abstract_85330.htm.
Pike, R.J., Acevedo,W., Thelin, G.P., 1988. Some topographic ingredientsof a geographic information system. Proc. Sympos. Int'l. Geogr. Info.Systems—The Research Agenda, NASA, (2), pp. 151–164.
Pike, R.J., Bernknopf, R.L., Tinsley III, J.C., Mark, R.K., 1994. Hazardof earthquake-induced lateral-spread ground failure on the centralCalifornia coast modeled from Earth-science map data in a geo-graphic information system. U.S. Geol. Survey OF 94-662. 46 pp.
Pike, R.J., Graymer, R.W., Roberts, S., Kalman, N.B., Sobiesczczyk,S., 2001. Map and map database of susceptibility to slope failureby sliding & earth flow in the Oakland area, CA. U.S. Geol.Survey, MF-2385. http://pubs.usgs.gov/mf/2002/2385/.
Pinter, N., Vestal, W.D., 2005. El Niño-driven landsliding andpostgrazing vegetative recovery, Santa Cruz Island, California.J. Geophys. Res. 110 (F2), 1–17.
Radbruch, D.H., Weiler, L.M., 1963. Preliminary report on landslidesin a part of the Orinda Formation, Contra Costa County, CA. U.S.Geol. Survey, OF-689. 50 pp.
Rantz, S.E., 1971. Mean annual precipitation and precipitation depth-duration-frequency data for the San Francisco Bay region, CA. U.S.Geol. Survey, S.F. Bay Reg. Environ. Res. Planning Study, BasicData Contrib. 32. 23 pp.
Rapp, A., Strömquist, L., 1976. Slope erosion due to extreme rainfallin the Scandinavian mountains. Geogr. Annaler 58A (3), 193–200.
Reneau, S.L., Dietrich,W.E., 1987. The importance of hollows in debris flowstudies; examples from Marin County, California. In: Costa, J.E.,Wieczorek,G.F. (Eds.),DebrisFlows /Avalanches:Process,Recognition,and Mitigation. Geol. Soc. America, Boulder, pp. 165–180.
Rice, R.M., Corbett, E.S., Bailey, R.G., 1969. Soil slips related tovegetation, topography, and soil in southern California. Water Res.Research 5 (3), 647–659.
Sharon, D., 1980. The distribution of hydrologically effective rainfallincident on sloping ground. J. Hydrology 46 (1/2), 165–188.
Smalley, C.L., 1957. A survey of air flow patterns in the San FranciscoBay area, California. U.S. Weather Bureau Forecast Center, SanFrancisco, CA, Preliminary Report. 36 pp.
Smith, T.C., 1988. A method for mapping relative susceptibility todebris flows, with an example from San Mateo County. In: Ellen,S.D., Wieczorek, G.F. (Eds.), Landslides, Floods, and MarineEffects of the Storm of January 3-5, 1982, in the San Francisco BayRegion, CA. U.S. Geol. Survey Prof. Paper 1434, pp. 185–194.
Struzer, L.R., 1972. The problem of determining precipitation fallingon mountain slopes. Soviet Hydrol. (2), 129–142.
Turnbull, R.W., 1976. Engineering Geology of the Eden Canyon areanear Castro Valley, Alameda County, CA. Stanford Univ. M.S.thesis, 107 pp.
Underwood, S.J., Meentemeyer, V., 1998. Climatology of wind-drivenrain for the contiguous United States for the period 1971 to 1995.Phys. Geog. 19 (6), 445–462.
Valeriano, M.M., Carvalho Jr., O.A., 2003. Geoprocessamento demodelos digitais de elevação para mapeamento da curvaturahorizontal em microbacias. Rev. Brasil. Geomorf. 4 (1), 17–29.
Van Westen, C.J., 1993. Geographic information systems in slopeinstability zonation. Int. Inst. Aerospace Survey Earth Sci. Theory,vol. 1. ITC Publ. 15, Enschede. 245 pp.
Wieczorek, G.F., 1987. Effect of rainfall intensity and duration on debrisflows in central Santa Cruz Mountains, California. In: Costa, J.E.,Wieczorek, G.F. (Eds.), Debris flows / avalanches: Process, Recogni-tion, and Mitigation. Geol. Soc. America, Boulder, pp. 93–104.
Wieczorek, G.F., Harp, E.L., Mark, R.K., Bhattacharyya, A.K., 1988.Debris flows and other landslides in San Mateo, Santa Cruz,Contra Costa, Alameda, Napa, Solano, Sonoma, Lake, and YoloCounties, and factors influencing debris-flow distribution. In:Ellen, S.D., Wieczorek, G.F. (Eds.), Landslides, floods, and marineeffects of the storm of January 3-5, 1982, in the San Francisco BayRegion, CA. U.S. Geol. Survey Prof. Paper, 1434, pp. 133–161.
Wieczorek, G.F., Mandrone, G., DeCola, L., 1997. The influence ofhillslope shape on debris-flow initiation. In: Chen, C.-L. (Ed.),Debris-flow Hazards Mitigation: Mechanics, Prediction, andAssessment. Am. Soc. Civil Eng, N.Y., pp. 21–31.
Wieczorek, G.F., Coe, J.A., Godt, J.W., 2003. Remote sensing ofrainfall for debris-flow hazard assessment. In: Rickenmann, D.,Chen, C.-L. (Eds.), Debris-flow hazards mitigation: mechanics,prediction, and assessment. Millpress, Rotterdam, pp. 1257–1268.
Wilson, R.C., Mark, R.K., Barbato, G., 1993. Operation of a real-timewarning system for debris flows in the San Francisco Bay area,California. In: Shen, H.W., Su, S.T., Wen, F. (Eds.), Proc. Hydraul.Eng. Conf. 2. Am. Soc. Civil Eng., N.Y., pp. 1908–1913.
Wilson, R.C., Jayko, A.S., 1997. Preliminary maps showing rainfallthresholds for debris-flow activity, San Francisco Bay region, CA.U. S. Geol. Survey, OF 97-745 F. http://pubs.usgs.gov/of/1997/of97-745/of97-745f.html.
Young, A., 1972. Slopes. Oliver and Boyd, Edinburgh. 288 pp.Zevenbergen, L.W., Thorne, C.R., 1987. Quantitative analysis of land
surface topography. Earth Surf. Process. Landf. 12 (1), 47–56.