Have Philosophical Accusations Of Talking Nonsense Been Treated With Unmerited Respect?
Upload
khangminh22Category
view
0download
0
Edinburgh Research Explorer
Identification of a localized Nonsense-Mediated Decay pathwayat the Endoplasmic Reticulum
Citation for published version:Longman, D, Jackson-Jones, K, Maslon, M, Murphy, L, Young, R, Stoddart, J, Hug, N, Taylor, M,Papadopoulos, DK & Caceres, JF 2020, 'Identification of a localized Nonsense-Mediated Decay pathway atthe Endoplasmic Reticulum', Genes & Development, vol. 34, no. 15-16, pp. 1075-1088.https://doi.org/10.1101/gad.338061.120
Digital Object Identifier (DOI):10.1101/gad.338061.120
Link:Link to publication record in Edinburgh Research Explorer
Document Version:Peer reviewed version
Published In:Genes & Development
General rightsCopyright for the publications made accessible via the Edinburgh Research Explorer is retained by the author(s)and / or other copyright owners and it is a condition of accessing these publications that users recognise andabide by the legal requirements associated with these rights.
Take down policyThe University of Edinburgh has made every reasonable effort to ensure that Edinburgh Research Explorercontent complies with UK legislation. If you believe that the public display of this file breaches copyright pleasecontact [email protected] providing details, and we will remove access to the work immediately andinvestigate your claim.
Download date: 17. Jul. 2022

Longman et al.
1
Identification of a localized Nonsense-Mediated Decay pathway at the Endoplasmic Reticulum Dasa Longman,1 Kathryn A. Jackson-Jones,1 Magdalena M. Maslon,1 Laura C. Murphy,1 Robert S. Young,1,2 Jack J. Stoddart,1 Nele Hug,1 Martin S. Taylor,1
Dimitrios K. Papadopoulos,1 and Javier F. Cáceres1
1MRC Human Genetics Unit, Institute of Genetics and Molecular Medicine, University of Edinburgh, Crewe Road South, Edinburgh EH4 2XU, UK
2Present address: Centre for Global Health Research, Usher Institute, University of Edinburgh, Old Medical School, Teviot Place, Edinburgh EH8 9AG, UK *Corresponding author: [email protected]
Running title: NMD regulation at the ER
[Keywords: Nonsense-mediated decay (NMD); RNA quality control; UPF1; NBAS; ER stress,
UPR]

Longman et al.
2
Nonsense-mediated decay (NMD) is a translation-dependent RNA quality control mechanism
that occurs in the cytoplasm. However, it is unknown how NMD regulates the stability of RNAs
translated at the Endoplasmic Reticulum (ER). Here, we identify a localized NMD pathway
dedicated to ER-translated mRNAs. We previously identified NBAS, a component of the
Syntaxin 18 complex involved in Golgi-to-ER trafficking, as a novel NMD factor. Here, we show
that NBAS fulfils an independent function in NMD. This ER-NMD pathway requires the
interaction of NBAS with the core NMD factor UPF1, which is partially localized at the ER in
the proximity of the translocon. NBAS and UPF1 co-regulate the stability of ER-associated
transcripts, in particular those associated with the cellular stress response. We propose a model
where NBAS recruits UPF1 to the membrane of the ER and activates an ER-dedicated NMD
pathway, thus providing an ER protective function by ensuring quality control of ER-
translated mRNAs.

Longman et al.
3
The nonsense-mediated decay (NMD) pathway is a highly conserved surveillance mechanism that
targets mRNAs harboring premature termination codons (PTCs) for degradation. In doing so, it
prevents the accumulation of truncated proteins and modulates the phenotypic outcome of genetic
disorders that arise due to the presence of PTCs (Bhuvanagiri et al. 2010). Importantly, NMD also
controls the stability of a large number of endogenous RNAs and fine-tunes many physiological
processes (reviewed by (Karousis and Mühlemann, 2019; Kurosaki et al., 2019)).
Core NMD factors were initially identified in genetic screens in C. elegans and in S. cerevisiae
and were later shown to be involved in NMD in other species, including Arabidopsis, Drosophila and
mammals. Human orthologs include SMG1, UPF1, UPF2, UPF3, SMG5, SMG6, and SMG7.
Additional NMD factors have been identified using a variety of different experimental approaches,
including interactome studies, RNAi screens in nematodes and CRISPR screens in mammalian cells
(Alexandrov et al. 2017; Baird et al. 2018; Hug et al. 2016). Mechanistically, NMD is tightly linked
to mRNA translation and is initiated by the recognition of a PTC by the surveillance (SURF) complex
within which the RNA helicase UPF1, and its associated kinase, SMG1, bind to the ribosomal release
factors eRF1 and eRF3 (Karousis and Mühlemann 2019). Subsequently, components of the SURF
complex interact with the core NMD factors UPF2 and UPF3b, and with an exon junction complex
(EJC) located downstream of the PTC, to form the decay-inducing complex (DECID) that triggers
UPF1 phosphorylation by SMG1, and dissociation of eRF1 and eRF3 (Kashima et al. 2006; Singh et
al. 2007). This leads to the recruitment of mRNA degradation factors that trigger RNA decay.
Substrate selection for NMD occurs not only in an EJC-dependent manner, but alternatively via an
EJC-independent mechanism, which targets transcripts harboring very long 3’UTRs (Kurosaki et al.,
2019; Metze et al., 2013).

Longman et al.
4
Using RNAi screens in C. elegans, we previously identified several novel NMD factors that were
also essential for viability, suggesting that they fulfil additional functions in nematodes, where this
pathway is not essential (Longman et al. 2007; Casadio et al. 2015). One of these novel NMD factors
is encoded by smgl-1 that corresponds to the human gene NBAS (neuroblastoma amplified sequence,
also known as NAG, for neuroblastoma amplified gene). NBAS was first identified as a gene that is
co-amplified with the N-myc gene in human neuroblastomas, however no clear role in the disease has
been reported (Wimmer et al. 1999; Scott et al. 2003). We previously showed that NBAS acts in
concert with UPF1 to co-regulate a large number of transcripts not only in nematodes but also in
zebrafish and human cells (Anastasaki et al. 2011; Longman et al. 2013). NBAS encodes a peripheral
ER membrane protein that is a component of the Syntaxin 18 complex, which functions in Golgi-to-
ER retrograde transport (Aoki et al. 2009). A series of loss-of-function mutations in NBAS have been
found in several human conditions, including biallelic mutations in patients with a multisystem
disease involving liver, eye, immune system, connective tissue and bone (Haack et al. 2015; Segarra
et al. 2015). Compound heterozygous variants in NBAS were also identified as a cause of atypical
osteogenesis imperfecta (Balasubramanian et al. 2017) and in a short stature with optic atrophy and
Pelger-Huët anomaly (SOPH) syndrome (Maksimova et al. 2010). Currently, it remains unclear
whether the phenotypes observed in patients with mutations in NBAS, are due to a compromised NMD
response, defects in Golgi-to-ER retrograde transport, or a combination of both.
Despite initial controversy concerning the intracellular location of NMD in mammalian cells, it
has been conclusively demonstrated that decay of a PTC-containing β-globin NMD reporter occurs
in the cytoplasm (Trcek et al. 2013). The ER is a major site of localized protein synthesis, with
approximately a third of all mRNAs being translated there, in particular, those encoding proteins
entering the secretory pathway. It has become increasingly evident that ER and cytosol constitute

Longman et al.
5
different environment for protein translation and post-transcriptional gene regulation (Reid and
Nicchitta 2015). Current efforts have focused on the mechanism and regulation of cytoplasmic NMD;
however, it is largely unknown how this mechanism operates on mRNAs that are translated at the
ER, which due to their intrinsic localized translation will not have sufficient exposure to cytoplasmic
NMD. There is a precedent for a localized NMD response in neurons, where NMD regulates the
expression of both dendritic and axonal mRNAs upon their activation of localized mRNA translation
(Giorgi et al. 2007; Colak et al. 2013). Both NBAS and a second novel NMD factor identified in our
RNAi screens, SEC13 (nuclear pore and COPII coat complex component), localize to the membrane
of the ER, raising the possibility that they could be involved in an ER-localized NMD pathway
(Longman et al. 2007; Casadio et al. 2015).
Here, we present evidence that reveals a central role for NBAS, acting together with UPF1, in an
NMD response that is associated with the ER. We show that NBAS has dual roles in NMD and Golgi-
to-ER retrograde transport; but importantly, these functions act independent of each other. We
demonstrate that NBAS recruits the core NMD factor UPF1 to the membrane of the ER and promotes
the degradation of NMD substrates that are translated at the ER.

Longman et al.
6
Results A dual role of NBAS in Golgi-to-ER transport and NMD
NBAS encodes a 2,371 amino acid protein containing WD40 repeats and a SEC39 domain, present in
proteins involved in the secretory pathway (Fig. 1A). Together with RINT1 and ZW10, NBAS forms
part of the evolutionarily conserved NRZ complex, which functions as a tethering complex for
retrograde trafficking of COPI vesicles from the Golgi to the ER and is part of the larger Syntaxin 18
complex (Aoki et al. 2009; Civril et al. 2010).
To dissect whether NBAS had separate roles in NMD and Golgi-to-ER transport, or whether these
processes influence each other, we first tested whether abrogating the NMD pathway influences ER
trafficking. We used a modified flow cytometry-based assay that relies on the expression of an eGFP
fluorescent reporter for measuring constitutive secretion. This assay is based on the property of
mutant FKBP (FK506-binding protein) (F36M) to form large aggregates that when expressed in the
ER cannot be secreted. However, upon incubation with an FKBP (F36M) ligand, D/D Solubilizer,
these aggregates are solubilized leading to efficient secretion (Gordon et al., 2010). We used this
reporter in combination with siRNA-mediated knock-down of individual NMD factors or of
components of the Syntaxin 18 complex (Fig. 1B and Supplemental Fig. S1A). Fluorescence of clonal
HeLa C1 cells stably expressing the eGFP reporter decreased upon addition of the ligand, D/D
Solubilizer, to the level of control cells, as was previously observed (Gordon et al. 2010)
(Supplemental Fig. S1A, left panel). As expected, siRNA-mediated knockdown of components of the
Syntaxin 18 complex, including STX18, p31 and NBAS resulted in an increase of the remaining
fluorescence, due to an interference with the secretion process (Fig. 1B). We observed some effect
upon depletion of ZW10, but almost no effect with the knock-down of RINT1, perhaps reflecting a
differential contribution of these components to the secretion process. Importantly, we observed that

Longman et al.
7
a strong reduction in the levels of individual NMD factors did not interfere with secretion. This was
the case for UPF1 and UPF2, but also for the RNA helicase DHX34, and for SEC13, another NMD
factor that localizes to the ER (Fig. 1B and Supplemental Fig. S1A). From this experiment, we
conclude that NMD activity is not required for ER secretion.
Next, we investigated whether interfering with constitutive secretion had any effect on the NMD
pathway. For this, HeLa cells stably expressing a well characterized b-globin NMD reporter
harboring a nonsense mutation at position 39 (HBB NS39) (Trecartin et al. 1981), or its wild-type
(wt) HBB counterpart, were depleted of NMD factors (UPF2 or NBAS) or of secretion factors
(STX18 or STX5) using specific siRNAs (Supplemental Fig. S1D). As expected, the level of HBB
WT mRNA remained unchanged upon UPF1, NBAS, STX18 or STX5 depletion (Fig. 1C, right
panel). By contrast, depletion of UPF2 or of NBAS resulted in an increased level of the HBB NS39
NMD reporter mRNA, compared to mock depleted cells (Fig. 1C, left panel). Importantly, depletion
of either STX18 or STX5 did not affect the level of b-globin NMD reporter mRNA (Fig. 1C),
indicating that normal ER secretion is not required for NMD. These results were confirmed using a
fluorescent NMD reporter (NMD+) that quantifies NMD activity at the single cell level. Cells
carrying the NMD+ reporter were identified by the constitutive expression of red fluorescence,
whereas NMD activity was determined by the mean green fluorescence, which is subject to NMD, in
all red cells (Pereverzev et al. 2015). Here again, whereas knock-down of UPF2 and NBAS resulted
in increased levels of the NMD reporter (measured by increased green fluorescence), depletion of
STX18 or STX5 had no effect (Supplemental Fig. S1B). We extended these observations to show
that NMD activity is not affected by blocking constitutive secretion with the use of Brefeldin A that
inhibits Golgi-to-ER protein transport (Aridor et al. 1995) (Supplemental Fig. S1C). HeLa cells stably
expressing either HBB WT or HBB NS39 were treated with Actinomycin D to block transcription in

Longman et al.
8
the presence or absence of Brefeldin A. We observed that the stability of the HBB NS39 NMD
reporter mRNA was not increased by blocking ER secretion (Fig. 1D). Altogether, these experiments
show that NMD activity and ER secretion are not functionally linked, strongly suggesting that NBAS
has two independent roles in Golgi-ER retrograde transport and in NMD.
NBAS regulates a subset of NMD targets specifically translated at the ER
Previously, we conducted RNA profiling experiments that revealed a large proportion of NBAS
mRNA targets are co-regulated by the core NMD factor UPF1, with a significant enrichment for
genes involved in the cellular stress response (Longman et al. 2013). Here, we extended this analysis
by RNA-sequencing to profile changes in mRNA abundance upon depletion of NBAS or UPF1. Both
NBAS and UPF1 were the most significantly downregulated genes in the relevant samples (fold
change -1.85, p<3.51x10⁻¹³ and fold change -3.28, p<1.14x10-148, respectively) (Supplemental Table
S1). Depletion of UPF1 significantly affected the mRNAs of 4756 genes, with 2411 genes displaying
an increased mRNA expression upon UPF1 knock-down. Depletion of NBAS increased the mRNA
levels of 209 genes (Supplemental Table S1), consistent with the view that NBAS regulates a subset
of the UPF1 targets. We observed a robust co-regulation of mRNAs when UPF1 or NBAS was
depleted (Pearson’s correlation r=0.67, p<0.0001) (Fig. 2A), indicating that UPF1 and NBAS
function in a common pathway. Gene ontology (GO) analysis of the mRNAs regulated by both NBAS
and UPF1 revealed a strong enrichment for the secretome, which is preferentially translated at the ER
translocon (Supplemental Table S2). Interestingly, we found a significant increase in fold change in
genes associated with the ER unfolded protein response (UPR) (GO: 0006986) when either NBAS or
UPF1 was depleted (p < 0.05 and p < 0.001 respectively; Wilcoxon rank sum test), showing that the
ER stress response is perturbed when the NMD response at the ER is not functional (Supplemental

Longman et al.
9
Fig. S2). This supports our hypothesis that an ER-specific NMD pathway is essential for cellular
homeostasis.
To further characterize genes regulated by NBAS and UPF1, we intersected targets regulated
by either NBAS or UPF1 and also common targets, with three experimental datasets identifying
genes localized and/or translated at the ER. APEX-seq, a method for RNA sequencing based on
direct proximity labeling of RNA led to the identification of 1077 mRNAs localized at the ER
(Fazal et al., 2019), cell fractionation followed by ribosome footprinting identified 486 mRNAs
(Reid & Nicchitta, 2012), and proximity-specific ribosome profiling, based on ER membrane
proximity labelling of ribosomes, identified 686 mRNAs translated at the ER (Jan et al., 2014).
We found that NBAS targets are strongly enriched for experimentally validated ER genes (31.6%),
as compared to 14.4% of UPF1 targets. Furthermore, 18.2% of NBAS targets were found in two
or more of the datasets, as compared to only 6.3% of UPF1 targets. Considering NBAS and UPF1
common targets, 37.9% of targets were found in at least one dataset, whilst 23.2% were found in
two or more datasets (Fig. 2B). NBAS-regulated targets were strongly enriched for experimentally
identified ER-localized genes (OR=6.07, p<0.001, Fisher's Exact test), whereas UPF1 targets were
only modestly enriched (OR=2.44, p<0.001, Fisher's Exact test). Compared to UPF1 targets, we
found that those targets which were also regulated by NBAS were 2.6-fold more likely than
expected by chance to be found at the ER (p<0.001, Exact Binomial test), confirming that NBAS
and UPF1 together regulate NMD targets specifically at the ER.
We next examined how NBAS depletion affected transcripts specifically at the ER compared to
the cytoplasm, and how this differs from depletion of core NMD factors UPF1 and UPF2. We
performed RNA-sequencing on cytoplasmic and membrane fractions of HeLa cells depleted for each
factor or mock-depleted control cells, following subcellular fractionation. By comparing expression

Longman et al.
10
of genes in each fraction in control samples we defined a group of “membrane-associated” genes, as
those that in the control sample showed a two-fold higher expression in the membrane fraction
(magenta points), whereas all other expressed genes were deemed “non-membrane” genes (Fig. 2C).
We assessed the validity of cell fractionation by identifying genes in the previously described
experimentally validated ER datasets in our data. As expected, we observed that the majority of genes
present in two or more ER datasets were found in the membrane-associated set (OR = 66.94,
p<0.0001, Fishers Exact test) (Supplemental Fig. S3A). Next, we analyzed changes in gene
expression of ‘membrane-associated’ genes in the membrane fraction, and of ‘non-membrane’ genes
in the cytoplasmic fraction, upon depletion of individual NMD factors (Fig. 2D, Supplemental Figs.
S3B and S3C, Supplemental Table S3). Knock-down of UPF1 led to a robust increase in the
abundance of mRNAs in both membrane and cytoplasmic fractions, whereas depletion of NBAS led
to an upregulation of a higher percentage of membrane-associated genes than of non-membrane genes
(5-fold increase, p<0.001, Exact Binomial test). In contrast, depletion of UPF2 led to preferential
upregulation of ‘non-membrane’ genes in the cytoplasm (>2.5-fold, p<0.001, Exact Binomial test).
Altogether, these results suggest that NBAS is a crucial component of an ER-NMD pathway that
targets for degradation mRNAs that are translated at the ER, constituting a novel localized NMD
response.
Site of NMD for transcripts translated at the ER
Single-molecule RNA Fluorescent in Situ Hybridization (smRNA FISH) was previously used to
localize the NMD response of a β-globin NMD reporter to the cytoplasm (Trcek et al. 2013). Here,
we have used smRNA FISH to spatially map the location of mRNA degradation of mRNAs that are
translated at the ER and that we have also shown to be upregulated upon UPF1 and/or NBAS
Longman et al.
11
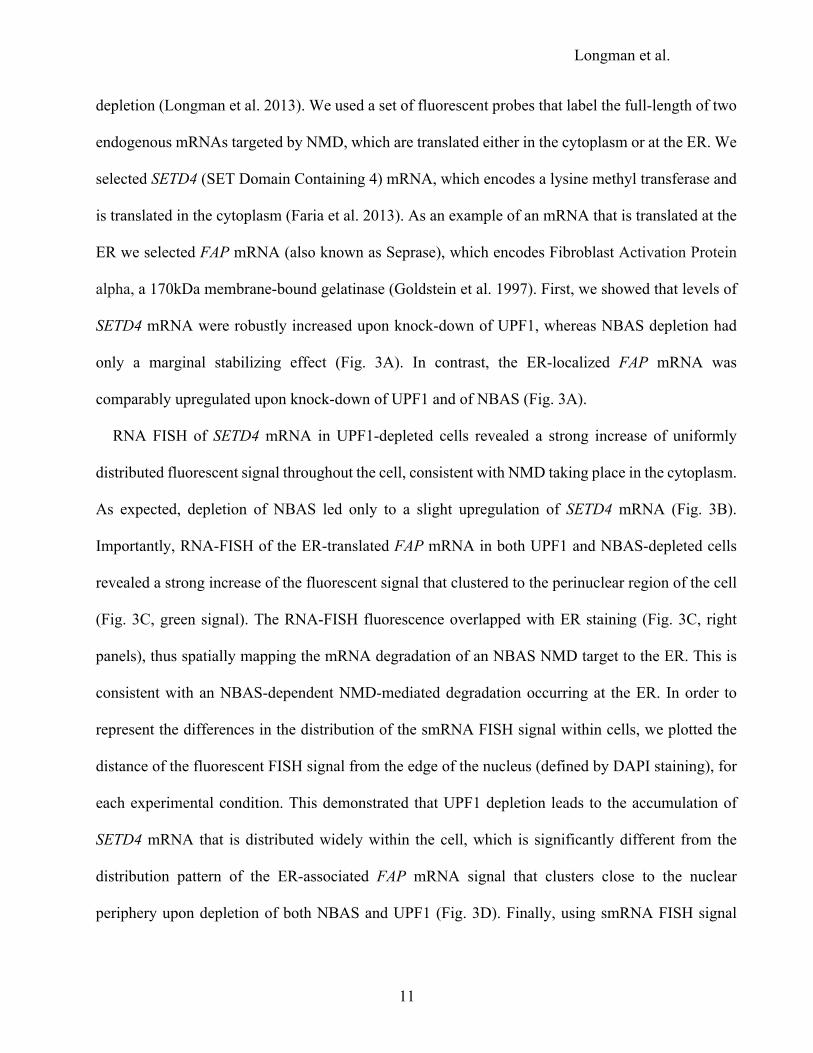
depletion (Longman et al. 2013). We used a set of fluorescent probes that label the full-length of two
endogenous mRNAs targeted by NMD, which are translated either in the cytoplasm or at the ER. We
selected SETD4 (SET Domain Containing 4) mRNA, which encodes a lysine methyl transferase and
is translated in the cytoplasm (Faria et al. 2013). As an example of an mRNA that is translated at the
ER we selected FAP mRNA (also known as Seprase), which encodes Fibroblast Activation Protein
alpha, a 170kDa membrane-bound gelatinase (Goldstein et al. 1997). First, we showed that levels of
SETD4 mRNA were robustly increased upon knock-down of UPF1, whereas NBAS depletion had
only a marginal stabilizing effect (Fig. 3A). In contrast, the ER-localized FAP mRNA was
comparably upregulated upon knock-down of UPF1 and of NBAS (Fig. 3A).
RNA FISH of SETD4 mRNA in UPF1-depleted cells revealed a strong increase of uniformly
distributed fluorescent signal throughout the cell, consistent with NMD taking place in the cytoplasm.
As expected, depletion of NBAS led only to a slight upregulation of SETD4 mRNA (Fig. 3B).
Importantly, RNA-FISH of the ER-translated FAP mRNA in both UPF1 and NBAS-depleted cells
revealed a strong increase of the fluorescent signal that clustered to the perinuclear region of the cell
(Fig. 3C, green signal). The RNA-FISH fluorescence overlapped with ER staining (Fig. 3C, right
panels), thus spatially mapping the mRNA degradation of an NBAS NMD target to the ER. This is
consistent with an NBAS-dependent NMD-mediated degradation occurring at the ER. In order to
represent the differences in the distribution of the smRNA FISH signal within cells, we plotted the
distance of the fluorescent FISH signal from the edge of the nucleus (defined by DAPI staining), for
each experimental condition. This demonstrated that UPF1 depletion leads to the accumulation of
SETD4 mRNA that is distributed widely within the cell, which is significantly different from the
distribution pattern of the ER-associated FAP mRNA signal that clusters close to the nuclear
periphery upon depletion of both NBAS and UPF1 (Fig. 3D). Finally, using smRNA FISH signal

Longman et al.
12
counts we confirmed the increase of SETD4 and FAP transcripts in response to UPF1 and NBAS
depletion (Supplemental Fig. S4). Altogether, these results provide strong evidence that NBAS has a
role in NMD regulation of mRNAs translated at the ER.
UPF1 is present at the ER
The involvement of the ER-associated factor NBAS in the NMD response, together with its co-
regulation of RNA targets with UPF1, led us to probe whether UPF1 localizes to the ER and interacts
with NBAS. It has been previously reported that UPF1 localizes to the cytoplasm both in yeast (Atkin
et al. 1995) and human cells (Applequist et al., 1997;Serin et al., 2001). There is, however, evidence
that UPF1 is also localized at the ER. First, UPF1 was found associated with cytoplasmic, but also
with ER-bound polysomes (Jagannathan et al. 2014a). Moreover, a large-scale protein-protein
interactome revealed that UPF1 interacts with components of the Syntaxin 18 complex; ZW10, p31
and STX18, where NBAS also resides (Brannan et al. 2016; Aoki et al. 2009). First, we tagged
endogenous NBAS with an eGFP/ 3xFLAG-tag at its N-terminus and following anti-GFP
immunoprecipitation, we revealed the interacting proteins using Mass Spectrometry. This resulted in
the identification of several components of the Syntaxin 18 complex as well as of SEC61A1, a
component of the trimeric SEC61 complex at the ER translocon that interact with NBAS
independently of the presence of RNA (Hartmann et al. 1994) (Supplemental Fig. S5A and
Supplemental Table S4). We did not observe a robust enrichment of NMD factors despite having
demonstrated these interactions by other experimental approaches (see below Fig. 5 and
Supplemental Figs. S6 and S7). We hypothesize this is due to the more transient nature of interactions
between NBAS and NMD factors compared to components of the Syntaxin 18 complex.
Longman et al.
13
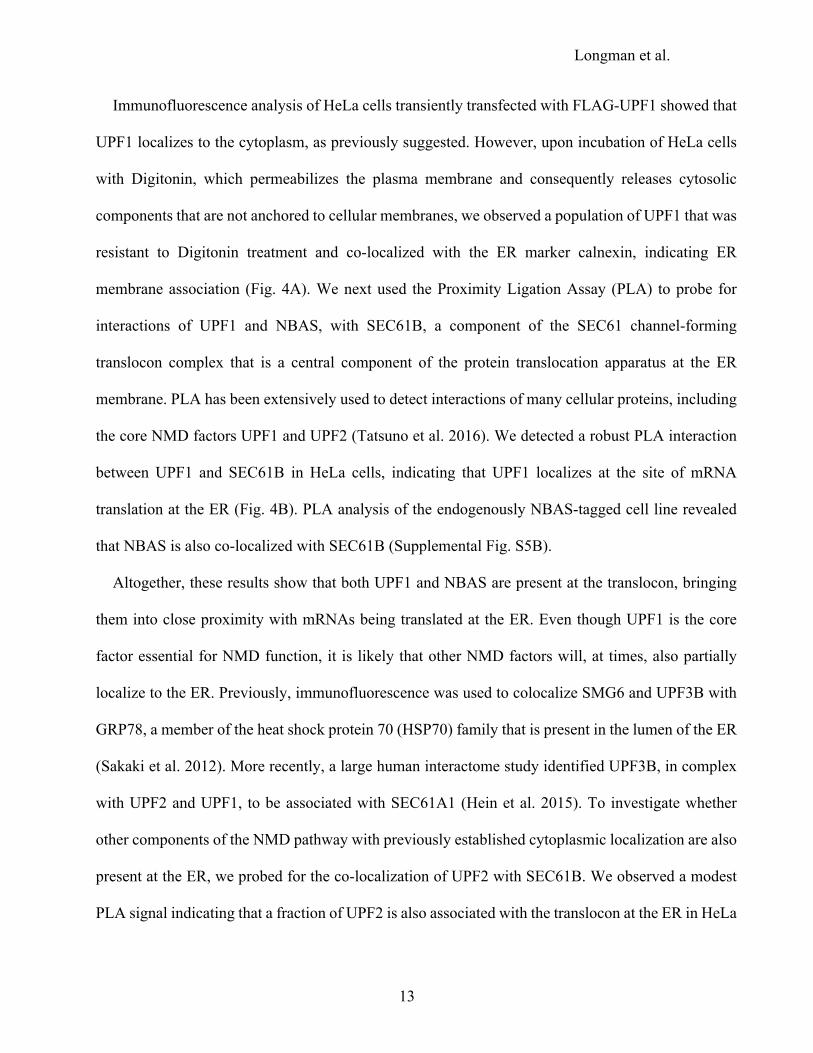
Immunofluorescence analysis of HeLa cells transiently transfected with FLAG-UPF1 showed that
UPF1 localizes to the cytoplasm, as previously suggested. However, upon incubation of HeLa cells
with Digitonin, which permeabilizes the plasma membrane and consequently releases cytosolic
components that are not anchored to cellular membranes, we observed a population of UPF1 that was
resistant to Digitonin treatment and co-localized with the ER marker calnexin, indicating ER
membrane association (Fig. 4A). We next used the Proximity Ligation Assay (PLA) to probe for
interactions of UPF1 and NBAS, with SEC61B, a component of the SEC61 channel-forming
translocon complex that is a central component of the protein translocation apparatus at the ER
membrane. PLA has been extensively used to detect interactions of many cellular proteins, including
the core NMD factors UPF1 and UPF2 (Tatsuno et al. 2016). We detected a robust PLA interaction
between UPF1 and SEC61B in HeLa cells, indicating that UPF1 localizes at the site of mRNA
translation at the ER (Fig. 4B). PLA analysis of the endogenously NBAS-tagged cell line revealed
that NBAS is also co-localized with SEC61B (Supplemental Fig. S5B).
Altogether, these results show that both UPF1 and NBAS are present at the translocon, bringing
them into close proximity with mRNAs being translated at the ER. Even though UPF1 is the core
factor essential for NMD function, it is likely that other NMD factors will, at times, also partially
localize to the ER. Previously, immunofluorescence was used to colocalize SMG6 and UPF3B with
GRP78, a member of the heat shock protein 70 (HSP70) family that is present in the lumen of the ER
(Sakaki et al. 2012). More recently, a large human interactome study identified UPF3B, in complex
with UPF2 and UPF1, to be associated with SEC61A1 (Hein et al. 2015). To investigate whether
other components of the NMD pathway with previously established cytoplasmic localization are also
present at the ER, we probed for the co-localization of UPF2 with SEC61B. We observed a modest
PLA signal indicating that a fraction of UPF2 is also associated with the translocon at the ER in HeLa

Longman et al.
14
cells (Supplemental Fig. S5C). This modest co-localization of UPF2 with the ER is consistent with
our previous observation that UPF2 plays only a minor role in the regulation of ER-translated mRNAs
(Fig. 2D).
NBAS interacts with UPF1 and preferentially associates with the SURF complex
The presence of NBAS and UPF1 in proximity with the ER translocon, together with the co-
regulation of RNA targets by NBAS and UPF1 as part of the ER-NMD response strongly suggested
an interaction of these two NMD factors. To investigate this, we first tested for the co-purification of
NBAS with UPF1 by co-immunoprecipitation in HeLa cells, in the presence or absence of RNases.
We found that FLAG-tagged UPF1 co-immunoprecipitated with co-transfected T7-NBAS
(Supplemental Fig. S6A) and we also detected the interaction of endogenous UPF1 with FLAG-
tagged NBAS, even in the absence of RNA (Supplemental Fig. S6B). Since UPF1 phosphorylation
is a later step in NMD activation it can be used as a diagnostic tool to infer the timing of recruitment
of a particular protein to the NMD complex. We used two UPF1 mutants that resemble the
hypophosphorylated state of UPF1 when present in the early surveillance (SURF) complex (C126S),
or the hyperphosphorylated UPF1 present in the late decay-inducing (DECID) complex (K498A)
(Weng et al. 1996; Kashima et al. 2006)). As previously observed, the C126S mutation blocks UPF1
interaction with UPF2, yet it binds to T7-tagged NBAS, whereas the K498A UPF1 mutant displayed
no NBAS binding (Supplemental Fig. S6C). This strongly suggests that NBAS is preferentially
associated with the initial surveillance SURF complex, where UPF1 is hypophosphorylated.
Interestingly, we previously observed similar results for the RNA helicase DHX34 (Hug and Cáceres
2014), suggesting that most of the regulatory steps of the NMD pathway occur in the early stages of
the NMD response. The observed biochemical interaction of NBAS with UPF1 was not RNA-

Longman et al.
15
dependent (Supplemental Fig. S6A, B). Nevertheless, we wanted to investigate the possibility that
NBAS directly recruits NMD targets for degradation. We tested whether NBAS directly binds to
mRNA using an mRNA capture assay, which relies on in-situ UV crosslinking, followed by affinity
selection of mRNPs by oligo-dT cellulose (Piñol-Roma and Dreyfuss 1992; Sanford et al. 2005).
Affinity selection of mRNPs by oligo-dT cellulose showed that NBAS binds to mRNA (Supplemental
Fig. S6D), opening the possibility that RNA-binding by NBAS contributes to selection of NMD
targets at the ER.
Next, we probed for the interaction of endogenous NBAS with other core NMD factors. We
detected an interaction of transiently expressed FLAG-tagged SMG5, SMG6, SMG7 and UPF1 with
endogenous NBAS, even in the absence of RNA (Supplemental Fig. S7A). Additionally, we observed
that endogenous NBAS can also be co-purified with full-length tagged RNA helicase DHX34, but
not with a truncated DHX34 version lacking an essential OB-like domain (Supplemental Fig. S7B),
which is required for helicase function (Melero et al. 2016).
We used Förster Resonance Energy Transfer (FRET) to probe the interaction of NBAS and UPF1
in HeLa cells in culture. This approach is based on the transfer of energy from the excited state of a
donor fluorophore to an adjacent acceptor fluorophore when the two molecules are in the correct
orientation and less than 10nm apart. FRET was detected by a reduction in the amount of energy that
the donor releases as fluorescence, measured by Fluorescence Lifetime Imaging Microscopy (FLIM)
(Day et al. 2001; Ellis et al. 2008). Co-transfection of GFP-NBAS and mCherry-UPF1 in HeLa cells
resulted in a reduction of the average donor fluorescence lifetime and an increase in the FRET
efficiency, as compared to transfection of GFP-NBAS and mCherry (Fig. 5A). This experiment
strongly suggests that NBAS and UPF1 interact directly. Next, we performed Fluorescence Cross-
Correlation Spectroscopy (FCCS) to probe the interaction of NBAS and UPF1 in HeLa cells

Longman et al.
16
transiently expressing GFP-NBAS and mCherry-UPF1 or GFP-NBAS and mCherry, as a control.
The cross-correlation signal is a direct indication of both molecules moving together, where a low
amplitude of cross-correlation signal indicates that the labeled molecules diffuse separately, whereas
high amplitude of cross-correlation signal is only achieved when both molecules are bound and
diffuse together. The high cross-correlation signal observed in HeLa cells transiently expressing GFP-
NBAS and mCherry-UPF1 indicated that NBAS and UPF1 interact directly (Fig. 5B, black curve),
in contrast to the low amplitude of cross-correlation signal observed in cells expressing GFP-NBAS
with mCherry, as a negative control (Fig. 5B, grey curve). Finally, we confirmed the interaction of
endogenous NBAS and UPF1 using PLA. We observed a prominent PLA signal using antibodies
against endogenous UPF1 and NBAS proteins, which was absent in cells that do not express NBAS
(NBAS KO) (Fig. 5C). These results robustly show that NBAS and UPF1 interact directly in situ.
NBAS recruits UPF1 to the membrane of the ER
To probe the functional consequences of the NBAS-UPF1 interaction in vivo we used Fluorescence
Correlation Spectroscopy (FCS). This is a non-invasive method with single-molecule sensitivity that
allows the analysis of the dynamic behavior of fluorescent molecules with high temporal resolution
and at low, physiologically-relevant concentrations in live cells (Liu et al. 2015; Papadopoulos et al.
2019). When the recorded fluorescence intensity fluctuations are caused by molecular movement,
FCS measurements can be used to measure molecular mobility/diffusion rate of fluorescent molecules
in a sub-femtoliter detection volume in live cells. Thus, free, fast diffusing molecular movement is
reflected by autocorrelation curves that display decays in shorter characteristic times (Fig. 6A, green
curve), whereas bound or slow diffusing molecules are characterized by autocorrelation curves with
slower decay times (Fig. 6A, orange curve). We performed FCS measurements to derive the mobility
Longman et al.
17
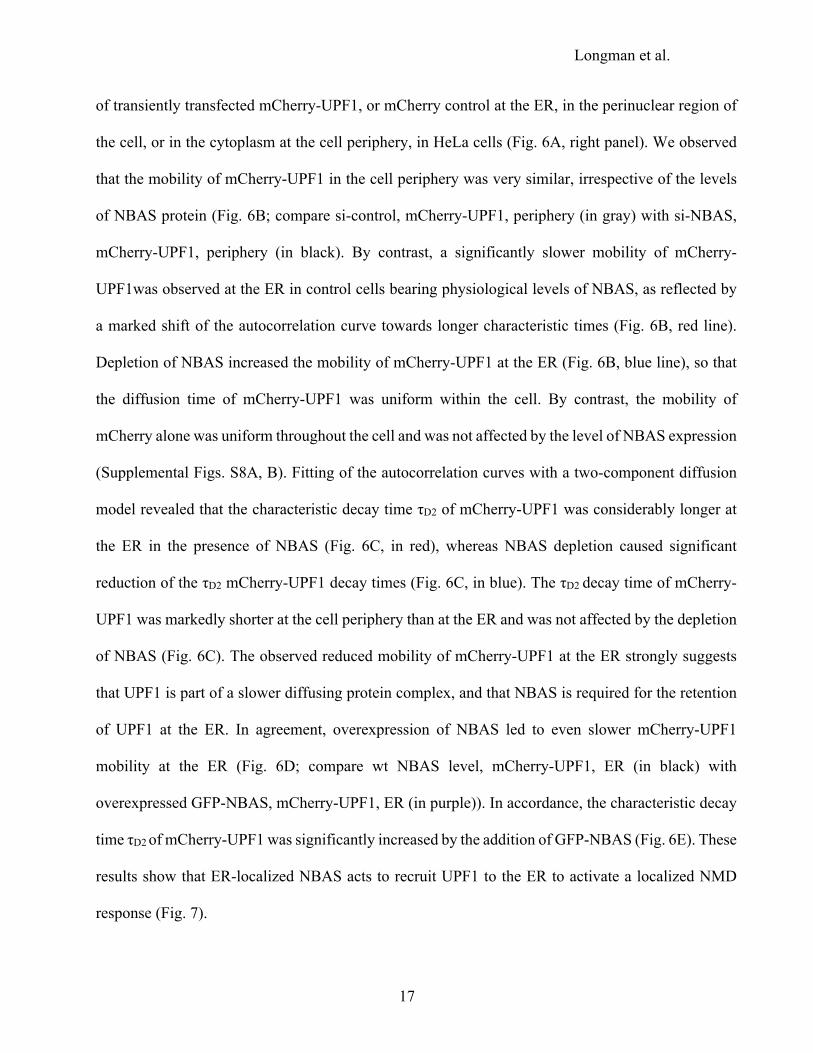
of transiently transfected mCherry-UPF1, or mCherry control at the ER, in the perinuclear region of
the cell, or in the cytoplasm at the cell periphery, in HeLa cells (Fig. 6A, right panel). We observed
that the mobility of mCherry-UPF1 in the cell periphery was very similar, irrespective of the levels
of NBAS protein (Fig. 6B; compare si-control, mCherry-UPF1, periphery (in gray) with si-NBAS,
mCherry-UPF1, periphery (in black). By contrast, a significantly slower mobility of mCherry-
UPF1was observed at the ER in control cells bearing physiological levels of NBAS, as reflected by
a marked shift of the autocorrelation curve towards longer characteristic times (Fig. 6B, red line).
Depletion of NBAS increased the mobility of mCherry-UPF1 at the ER (Fig. 6B, blue line), so that
the diffusion time of mCherry-UPF1 was uniform within the cell. By contrast, the mobility of
mCherry alone was uniform throughout the cell and was not affected by the level of NBAS expression
(Supplemental Figs. S8A, B). Fitting of the autocorrelation curves with a two-component diffusion
model revealed that the characteristic decay time τD2 of mCherry-UPF1 was considerably longer at
the ER in the presence of NBAS (Fig. 6C, in red), whereas NBAS depletion caused significant
reduction of the τD2 mCherry-UPF1 decay times (Fig. 6C, in blue). The τD2 decay time of mCherry-
UPF1 was markedly shorter at the cell periphery than at the ER and was not affected by the depletion
of NBAS (Fig. 6C). The observed reduced mobility of mCherry-UPF1 at the ER strongly suggests
that UPF1 is part of a slower diffusing protein complex, and that NBAS is required for the retention
of UPF1 at the ER. In agreement, overexpression of NBAS led to even slower mCherry-UPF1
mobility at the ER (Fig. 6D; compare wt NBAS level, mCherry-UPF1, ER (in black) with
overexpressed GFP-NBAS, mCherry-UPF1, ER (in purple)). In accordance, the characteristic decay
time τD2 of mCherry-UPF1 was significantly increased by the addition of GFP-NBAS (Fig. 6E). These
results show that ER-localized NBAS acts to recruit UPF1 to the ER to activate a localized NMD
response (Fig. 7).

Longman et al.
18
Discussion
An NMD response at the ER
The targeting of mRNAs to specific subcellular sites for local translation has an important role in
many cellular processes and during development (Decker and Parker 2006). In particular, translation
of secreted and integral membrane proteins occurs on ER-bound ribosomes, whereas cytosolic protein
synthesis mostly occurs on ribosomes dispersed throughout the cytoplasm. A subset of transcripts
that are targeted for translation at the ER encode a leading signal peptide that is recognized after
emerging from the ribosome by the signal recognition particle (SRP). These SRP-bound transcripts
are subsequently targeted to the ER, and the resulting translated peptides are translocated across or
inserted into the membrane by the SEC61 translocation channel (Walter and Johnson 1994).
However, recent evidence showed that mRNAs encoding cytosolic proteins can also be translated by
ER-associated ribosomes, suggesting a more diverse role for the ER in mRNA translation
(Jagannathan et al. 2014b; Reid and Nicchitta 2015).
Despite the ER representing a specialized environment for the translation of a large proportion of
cellular mRNAs, it remains unclear how RNA quality control pathways in general, and NMD in
particular, operate on those mRNAs. Since NMD is dependent on active translation, transcripts
coding for secreted and integral membrane proteins will not have sufficient exposure to the NMD
quality control in the cytoplasm due to the intrinsic nature of ER-associated translation, which is
spatially and temporally distinct from mRNA translation in the cytosol. In fact, ER-targeted
transcripts are only translationally active once they encounter the ER membrane (Wu et al. 2016).
Thus, ER-targeted transcripts will fail to undergo NMD in the cytoplasm, until their translation is
activated at the ER membrane. We propose that these transcripts are instead targeted for degradation

Longman et al.
19
by an ER-NMD dedicated pathway that is responsible for the quality control of cellular mRNAs that
are translated at the ER.
We have previously shown that NBAS together with core NMD factors regulates the stability of a
large number of endogenous RNA targets that are preferentially linked to cellular stress and
membrane trafficking in nematodes, zebrafish and human cells (Anastasaki et al. 2011; Longman et
al. 2013). We also showed that NBAS contributes to a negative feedback regulatory network, in which
the NMD pathway controls the levels of transcripts encoding NMD factors (Huang et al. 2011;
Yepiskoposyan et al. 2011; Longman et al. 2013). Here, we used RNA-sequencing to profile changes
in mRNA abundance upon depletion of NBAS or UPF1. Importantly, this analysis revealed that a
large proportion of NBAS regulated targets were co-regulated by UPF1, establishing them as
candidate NMD targets (Figure 2). These results, together with evidence provided by FCS
experiments demonstrates that NBAS, which is anchored at the membrane of the ER, promotes the
recruitment of the core NMD factor UPF1 and thereby activates the NMD response at the ER (Fig.
6). The decay step in NMD involves the recruitment of nucleases along two pathways that involve
endonucleolytic decay mediated by SMG6 (Huntzinger et al. 2008; Eberle et al. 2009), or
alternatively exonucleolytic decay mediated by the SMG5–SMG7 heterodimer (Loh et al. 2013).
Interestingly, despite NBAS being preferentially associated with hypophosphorylated UPF1 in the
SURF complex, we also detected its interaction with SMG5, SMG6 and SMG7 (Supplemental Fig.
S7), which are required for mRNA degradation at the later stages of NMD. Altogether, this suggests
that the presence of several core NMD factors is required for an active NMD pathway in the vicinity
of the ER. In summary, we have identified a localized NMD response at the ER that acts on transcripts
localized and translated at the ER, which we term ER-NMD (Fig. 7).

Longman et al.
20
Biological role of ER-NMD pathway
Recent evidence supports a role for NMD in modulating the ER stress response by ensuring
appropriate activation of the Unfolded Protein Response (UPR) (Goetz and Wilkinson 2017). This
pathway is able to sense and respond to excessive amounts of misfolded proteins in the ER (Walter
and Ron 2011). Interestingly, mRNAs encoding several UPR components are targeted by NMD,
including the UPR sensor IRE1α, as well as ATF-4 and CHOP that are activated by PERK branch
signaling. Thus, NMD can act to control the threshold of cellular stress that is necessary to activate
the UPR (Gardner 2008; Karam et al. 2015; Sieber et al. 2016). As a consequence, appropriate level
of NMD activity is required to protect cells from detrimental stress response activation. In particular,
pathological UPR activation is recognized as a major causal mechanism in neurodegenerative
diseases including Alzheimer's, Parkinson's and prion diseases, which are associated with the
accumulation of misfolded disease-specific proteins (Hetz and Mollereau 2014). A chronic activation
of PERK/eIF2α-P signaling results in a sustained reduction of global protein synthesis rates in
neurons, caused by the phosphorylation and inactivation of eIF2α, which blocks translation at the
level of initiation. Inappropriate eIF2α phosphorylation contributes to disease pathogenesis, and is
observed in patient’s brains, and in mouse models of protein-misfolding neurodegenerative diseases
(Hoozemans et al. 2009; Moreno et al. 2012). Thus, limiting the chronic activation of the UPR could
have a neuroprotective effect in neurodegenerative diseases.
We hypothesize that modulation of the activity of the ER-NMD pathway could be crucial to
regulate the response to ER stress. It is tempting to speculate that increasing the activity of the ER-
NMD pathway will have a neuroprotective effect by limiting excessive UPR signalling in
neurodegeneration. Indeed, a protective role for UPF1 has already been shown in primary neuronal
models of amyotrophic lateral sclerosis (ALS) and frontotemporal dementia (FTD) induced by

Longman et al.
21
overexpression of the RNA-binding proteins, TDP43 and FUS (Barmada et al. 2015). Moreover,
NMD has been shown to protect against the effects of hexanucleotide repeat expansion in C9orf72
(C9-HRE) found in Drosophila and cellular models of ALS/FTD (Ortega et al. 2020; Xu et al. 2019).
In summary, we have uncovered a localized NMD response at the ER, which provides spatial and
temporal separation from cytoplasmic NMD acting on mRNAs that are translated at the ER. This
could have important implications to protect cells from ER stress/dysfunction that results from the
accumulation of aberrantly processed RNAs, leading to the production of truncated proteins and
affecting cellular homeostasis. This could be of particular relevance for many disease processes, such
as neurodegenerative diseases, where an exacerbated ER stress is observed. Future studies will aim
to further characterize this novel ER-NMD pathway; investigating its physiological role, as well as
the biological consequences of manipulating its activity.

Longman et al.
22
Material and methods
NMD reporter assays
HeLa cells stably expressing HBB wt or HBB NS39 reporters were mock-depleted or depleted twice
of UPF2, NBAS, STX18 and STX5, and harvested 5 days after the first depletion. Alternatively,
HeLa HBB NS39/WT expressing cells were treated with 2 µg/ml Actinomycin D (Sigma A9415) to
block transcription and/or 2µg/ml Brefeldin A (Sigma B5936) to block secretion for 6 h. The stability
of HBB reporters was determined by qRT-PCR. The fluorescence-based NMD assay was performed
as described previously (Pereverzev et al. 2015). NMD activity was determined by quantitative
measurement of red and green fluorescence using FACS BD LSR-Fortessa™ X-20 SORP with BD
FACSDiva™ software. Gates were set using a non-fluorescent control. Compensation was applied in
BD FACSDiva™ software using single transfected cells. Green fluorescence expression (488-
525/50) was analyzed by gating the single cell population in SSC-H/SSC-A scatter plot, followed by
debris-exclusion gate in SSC-A/FSC-A scatter plot, followed by gating only the red fluorescent
positive cells in 405-450/50 (autofluorescence) and 561-610/20 dot plot. Gate settings were kept
constant during the experiment. Data was analyzed with FlowJo™ Software (Version 10.6.0).
Between 4500 and 12000 red fluorescent cells were analyzed in each biological replica. NMD
disruption was determined by the increase of green fluorescence in red cells, normalized to mock-
depleted cells.
Single-molecule (sm) RNA FISH
smRNA FISH was performed following the Stellaris RNA FISH protocol for adherent cells
(www.biosearchtech.com/stellarisprotocols), using RNase-free reagents. Transcript-specific
Quasar® 570-labeled Stellaris probes were designed with the Stellaris® RNA FISH Probe Designer
Longman et al.
23
(Biosearch Technologies, Inc., Petaluma, CA)(www.biosearchtech.com/ stellarisdesigner), and
resuspended in TE buffer to make 12.5µM Probes stock. Probe sequences are listed on Supplemental
Table S5. HeLa cells were depleted as described above, with the addition of mEmerald-ER-3
(Addgene plasmid # 54082; http://n2t.net/addgene:54082; RRID:Addgene 54082) at 1µg per well in
6-well plates) during the second round of depletions. Cells were seeded on high precision coverslips
(Marienfeld, #0107052), washed twice with PBS and fixed with 4% formaldehyde at room
temperature for 10 min. Cells were permeabilized in 70% ethanol for at least 1 hour and hybridization
of probes was performed in a humidified chamber at 37°C for 15 hours. Probe hybridization and all
subsequent steps were carried out in the dark. Following hybridization, coverslips were washed as
described in the protocol. Nuclei were counterstained with 5ng/ml of DAPI in buffer A for 30min.
Cell outlines were determined by staining with the addition of 20 nM MemBright 640 nm dye (Idylle
MCO-MEM-640-1902) (Collot et al. 2019) in buffer B for 15 min at room temperature. Coverslips
were mounted in Vectashield and sealed with nail polish.
Proximity Ligation Assay (PLA)
PLA assay was performed following Duolink® PLA Fluorescence Protocol (Sigma-Aldrich). Cells
were grown, fixed and permeabilized as for immunofluorescence. Coverslips were then incubated for
1 h with PLA block buffer provided with the Duolink in situ PLA probes at room temperature and
incubated with primary antibodies. Coverslips were then washed 3 times with Duolink wash buffer
A and Duolink probes incubation, ligation and PLA signal amplification was performed using
Duolink® In Situ Detection Reagents Red kit according to the manufacturer’s instructions. In the last
wash coverslips were incubated with DAPI at 50ng/ml in 0.01x wash buffer B for 5 min, mounted in
Vectrashield and sealed with nail varnish.

Longman et al.
24
FRET-FLIM
HeLa cells transiently expressing GFP-NBAS with mCherry or mCherry-UPF1 were grown on slides
for 48 h post transfection, fixed in 4% PFA for 10 min, washed in PBS and mounted in Vectashield
with DAPI to visualize cell nuclei. Fluorescence lifetime images were acquired on a Leica SP5 SMD
confocal laser-scanning microscope fitted with a time- correlated single photon counting module
(PicoHarp 300) using a 63/1.4 numeric aperture HCX PL Apo oil immersion objective lens, as
previously described (Saleeb et al. 2019). The donor EGFP was excited using a tunable white light
supercontinuum laser operating at 488 nm and pulsing at 40 MHz. Emission was detected with an
external single- photon avalanche diode (MicroPhoton Devices). Single-pixel fluorescence lifetime
analyses were carried out with SymPhoTime version 5.4.4 (PicoQuant).
FCS and FCCS
FCS measurements were performed by recording fluorescence intensity fluctuations in a very small,
approximately ellipsoidal observation volume element (OVE) (about 0.2 µm wide and 1 µm long)
that is generated in HeLa cells by focusing the laser light through the microscope objective and by
collecting the fluorescence light through the same objective using a pinhole in front of the detector to
block out-of-focus light. The fluorescence intensity fluctuations caused by fluorescently labeled
molecules passing through the OVE were analyzed using temporal autocorrelation analysis. HeLa
cells were mock-depleted or depleted of NBAS in two rounds of depletions. During the second round
of depletions cell were co-transfected with 1 µg of mCherry control or of mCherry-UPF1plasmids.
For NBAS overexpression, cells were co-transfected with GFP-NBAS and mCherry or mCherry-
UPF1 (1 µg of each). Prior to FCS/FCCS measurement, cells were grown overnight on chambered
coverslips (μ-slide, 8 well, Ibidi) and the growth medium was replaced with L-15 medium (Leibovitz)

Longman et al.
25
(Sigma-Aldrich L1518) immediately prior to FCS/FCCS measurements. Where appropriate, ER was
visualized by the addition of 1 µM ER Tracker (green) dye (Thermo Fisher, E34251). Measurements
were made only in weakly expressing cells. Fluorescence microscopy imaging of HeLa cells and FCS
measurements were performed on a PicoQuant modified Leica SP5 microscope which features
Avalanche PhotoDiodes that enable close to single-photon detection (Vukojević et al. 2008).
Fluorescence intensity fluctuations were recorded for 50 sec or 100 sec. Autocorrelation curves were
analysed using the SymphoTime 64 software package (PicoQuant). Control FCS measurements to
assess the detection volume were routinely performed prior to data acquisition, using dilute solutions
(10nM and 20nM, respectively) of Alexa488 and Alexa568 dyes (Petrášek and Schwille 2008). The
variability between independent measurements reflects the variability between cells, rather than
imprecision of FCS measurements.
Quantification and Statistical analysis
For information about the number of replicates, the meaning of error bars (e.g., standard error of the
mean) and other relevant statistical analysis, see the corresponding figure legend. For information
about how data was analyzed and/or quantified, see the relevant section in Materials and methods
and/or the figure legend. GraphPad Prism software was used for the statistical analysis in Figures 1C,
1D, 3A, 4B, 5C, 6C, 6E, and Supplemental Figs. S1B, S1C, S4, S5A, B. RStudio was used for the
statistical analysis in Figures 2A, 2B, 2D, S2 and S3.
Data availability
All RNA-Seq data will be available at GEO. Accession number being processed.
The raw uncropped gels, blots and confocal micrographs will be deposited at Mendeley Data.

Longman et al.
26
Acknowledgements
We are grateful to Andrew Peden (University of Sheffield) for the gift of HeLa C1 cells, a secretion
reporter and for advice on secretion experiments, and Konstantin Lukyanov (Moscow) for the gift of
the NMD+ reporter. We thank Matthew Pearson (Advanced Imaging), Elisabeth Freyer (Flow
Cytometry) and Craig Nicol (Graphics) from the MRC IGMM core support facilities for technical
assistance and advice, Shelagh Boyle for her help with the smRNA FISH set up, and Alison Dun and
Rory Duncan at the MRC-funded Edinburgh Super-Resolution Imaging Consortium (ESRIC) for
expertise and infrastructure. We are thankful to our MRC HGU colleagues, Andrew Jackson, Ian
Adams and Wendy Bickmore for critical reading of the manuscript. This work was supported by a
Chancellor’s fellowship of the University of Edinburgh (D.K.P) and an Institutional Strategic
Research Fund (ISSF3) (J-J.S.) and core funding to the MRC Human Genetics Unit from the Medical
Research Council (J.F.C).
Author contributions
D.L. and J.F.C. conceived and designed the project. D.L. performed secretion assays, NMD assays,
RNA FISH, cell biological, FRET-FLIM and FCS experiments. K.J.J. and M.M.M. carried out RNA-
seq profiling of NBAS and UPF1 knock-down cells, K.J.J. generated the endogenously tagged NBAS
cell line and together with R.S.Y and M.S.T performed all bioinformatic and statistical analysis. N.H.
analyzed the interaction of NBAS with core NMD factors. L.M. performed the analysis of FISH
signal distribution. D.K.P. and J.J.S. performed, analyzed and interpreted the FCS and FCCS
experiments. The manuscript was co-written by all authors.

Longman et al.
27
References Alexandrov A, Shu M-D, Steitz JA. 2017. Fluorescence Amplification Method for Forward
Genetic Discovery of Factors in Human mRNA Degradation. Mol Cell 65: 191–201. Anastasaki C, Longman D, Capper A, Patton EE, Cáceres JF. 2011. Dhx34 and Nbas function in
the NMD pathway and are required for embryonic development in zebrafish. Nucleic Acids Res 39: 3686–94.
Aoki T, Ichimura S, Itoh A, Kuramoto M, Shinkawa T, Isobe T, Tagaya M. 2009. Identification of the neuroblastoma-amplified gene product as a component of the syntaxin 18 complex implicated in Golgi-to-endoplasmic reticulum retrograde transport. Mol Biol Cell 20: 2639–49.
Applequist SE, Selg M, Raman C, Jäck HM. 1997. Cloning and characterization of HUPF1, a human homolog of the Saccharomyces cerevisiae nonsense mRNA-reducing UPF1 protein. Nucleic Acids Res 25: 814–21.
Aridor M, Bannykh SI, Rowe T, Balch WE. 1995. Sequential coupling between COPII and COPI vesicle coats in endoplasmic reticulum to Golgi transport. J Cell Biol 131: 875–93.
Atkin AL, Altamura N, Leeds P, Culbertson MR. 1995. The majority of yeast UPF1 co-localizes with polyribosomes in the cytoplasm. Mol Biol Cell 6: 611–25.
Baird TD, Cheng KC-C, Chen Y-C, Buehler E, Martin SE, Inglese J, Hogg JR. 2018. ICE1 promotes the link between splicing and nonsense-mediated mRNA decay. Elife 7: e33178.
Balasubramanian M, Hurst J, Brown S, Bishop NJ, Arundel P, DeVile C, Pollitt RC, Crooks L, Longman D, Caceres JF, et al. 2017. Compound heterozygous variants in NBAS as a cause of atypical osteogenesis imperfecta. Bone 94: 65–74.
Barmada SJ, Ju S, Arjun A, Batarse A, Archbold HC, Peisach D, Li X, Zhang Y, Tank EMH, Qiu H, et al. 2015. Amelioration of toxicity in neuronal models of amyotrophic lateral sclerosis by hUPF1. Proc Natl Acad Sci U S A 112: 7821–7826.
Bhuvanagiri M, Schlitter AM, Hentze MW, Kulozik AE. 2010. NMD: RNA biology meets human genetic medicine. Biochem J 430: 365–77.
Brannan KW, Jin W, Huelga SC, Banks CAS, Gilmore JM, Florens L, Washburn MP, Van Nostrand EL, Pratt GA, Schwinn MK, et al. 2016. SONAR Discovers RNA-Binding Proteins from Analysis of Large-Scale Protein-Protein Interactomes. Mol Cell 64: 282–293.
Casadio A, Longman D, Hug N, Delavaine L, Vallejos Baier R, Alonso CR, Cáceres JF. 2015. Identification and characterization of novel factors that act in the nonsense-mediated mRNA decay pathway in nematodes, flies and mammals. EMBO Rep 16: 71–8.
Civril F, Wehenkel A, Giorgi FM, Santaguida S, Di Fonzo A, Grigorean G, Ciccarelli FD, Musacchio A. 2010. Structural analysis of the RZZ complex reveals common ancestry with multisubunit vesicle tethering machinery. Structure 18: 616–26.
Colak D, Ji S-J, Porse BT, Jaffrey SR. 2013. Regulation of axon guidance by compartmentalized nonsense-mediated mRNA decay. Cell 153: 1252–65.

Longman et al.
28
Collot M, Ashokkumar P, Anton H, Boutant E, Faklaris O, Galli T, Mély Y, Danglot L, Klymchenko AS. 2019. MemBright: A Family of Fluorescent Membrane Probes for Advanced Cellular Imaging and Neuroscience. Cell Chem Biol 26: 600-614.e7.
Day RN, Periasamy A, Schaufele F. 2001. Fluorescence Resonance Energy Transfer Microscopy of Localized Protein Interactions in the Living Cell Nucleus. Methods 25: 4–18.
Decker CJ, Parker R. 2006. CAR-1 and trailer hitch: Driving mRNP granule function at the ER? J Cell Biol 173: 159–163.
Eberle AB, Lykke-Andersen S, Mühlemann O, Jensen TH. 2009. SMG6 promotes endonucleolytic cleavage of nonsense mRNA in human cells. Nat Struct Mol Biol 16: 49–55.
Ellis JD, Llères D, Denegri M, Lamond AI, Cáceres JF. 2008. Spatial mapping of splicing factor complexes involved in exon and intron definition. J Cell Biol 181: 921–34.
Faria JA, Corrêa NC, de Andrade C, de Angelis Campos AC, Dos Santos de Almeida R, Rodrigues TS, de Goes AM, Gomes DA, Silva FP. 2013. SET domain-containing protein 4 (SETD4) is a newly identified cytosolic and nuclear lysine methyltransferase involved in breast cancer cell proliferation. J Cancer Sci Ther 5: 058–065.
Fazal FM, Han S, Parker KR, Kaewsapsak P, Xu J, Boettiger AN, Chang HY, Ting AY. 2019. Atlas of Subcellular RNA Localization Revealed by APEX-Seq. Cell 178: 473-490.e26.
Gardner LB. 2008. Hypoxic inhibition of nonsense-mediated RNA decay regulates gene expression and the integrated stress response. Mol Cell Biol 28: 3729–41.
Giorgi C, Yeo GW, Stone ME, Katz DB, Burge C, Turrigiano G, Moore MJ. 2007. The EJC factor eIF4AIII modulates synaptic strength and neuronal protein expression. Cell 130: 179–91.
Goetz AE, Wilkinson M. 2017. Stress and the nonsense-mediated RNA decay pathway. Cell Mol Life Sci 74: 3509–3531.
Goldstein LA, Ghersi G, Piñeiro-Sánchez ML, Salamone M, Yeh Y, Flessate D, Chen WT. 1997. Molecular cloning of seprase: A serine integral membrane protease from human melanoma. Biochim Biophys Acta - Mol Basis Dis 1361: 11–19.
Gordon DE, Bond LM, Sahlender DA, Peden AA. 2010. A Targeted siRNA Screen to Identify SNAREs Required for Constitutive Secretion in Mammalian Cells. Traffic 11: 1191–1204.
Haack TB, Staufner C, Köpke MG, Straub BK, Kölker S, Thiel C, Freisinger P, Baric I, McKiernan PJ, Dikow N, et al. 2015. Biallelic Mutations in NBAS Cause Recurrent Acute Liver Failure with Onset in Infancy. Am J Hum Genet 97: 163–9.
Hartmann E, Sommer T, Prehn S, Görlich D, Jentsch S, Rapoport TA. 1994. Evolutionary conservation of components of the protein translocation complex. Nature 367: 654–657.
Hein MY, Hubner NC, Poser I, Cox J, Nagaraj N, Toyoda Y, Gak IA, Weisswange I, Mansfeld J, Buchholz F, et al. 2015. A Human Interactome in Three Quantitative Dimensions Organized by Stoichiometries and Abundances. Cell 163: 712–723.
Hetz C, Mollereau B. 2014. Disturbance of endoplasmic reticulum proteostasis in neurodegenerative diseases. Nat Rev Neurosci 15: 233–249.

Longman et al.
29
Hoozemans JJM, van Haastert ES, Nijholt DAT, Rozemuller AJM, Eikelenboom P, Scheper W. 2009. The unfolded protein response is activated in pretangle neurons in Alzheimer’s disease hippocampus. Am J Pathol 174: 1241–51.
Huang L, Lou C-H, Chan W, Shum EY, Shao A, Stone E, Karam R, Song H-W, Wilkinson MF. 2011. RNA homeostasis governed by cell type-specific and branched feedback loops acting on NMD. Mol Cell 43: 950–61.
Hug N, Cáceres JF. 2014. The RNA Helicase DHX34 Activates NMD by Promoting a Transition from the Surveillance to the Decay-Inducing Complex. Cell Rep 8: 1845–1856.
Hug N, Longman D, Cáceres JF. 2016. Mechanism and regulation of the nonsense-mediated decay pathway. Nucleic Acids Res 44: 1483–1495.
Huntzinger E, Kashima I, Fauser M, Saulière J, Izaurralde E. 2008. SMG6 is the catalytic endonuclease that cleaves mRNAs containing nonsense codons in metazoan. RNA 14: 2609–17.
Jagannathan S, Hsu JC-C, Reid DW, Chen Q, Thompson WJ, Moseley AM, Nicchitta C V. 2014a. Multifunctional roles for the protein translocation machinery in RNA anchoring to the endoplasmic reticulum. J Biol Chem 289: 25907–24.
Jagannathan S, Reid DW, Cox AH, Nicchitta C V. 2014b. De novo translation initiation on membrane-bound ribosomes as a mechanism for localization of cytosolic protein mRNAs to the endoplasmic reticulum. RNA 20: 1489–98.
Jan CH, Williams CC, Weissman JS. 2014. Principles of ER cotranslational translocation revealed by proximity-specific ribosome profiling. Science 346: 1257521.
Karam R, Lou C-HC-H, Kroeger H, Huang L, Lin JH, Wilkinson MF. 2015. The unfolded protein response is shaped by the NMD pathway. EMBO Rep 16: 599–609.
Karousis ED, Mühlemann O. 2019. Nonsense-Mediated mRNA Decay Begins Where Translation Ends. Cold Spring Harb Perspect Biol 11: a032862.
Kashima I, Yamashita A, Izumi N, Kataoka N, Morishita R, Hoshino S, Ohno M, Dreyfuss G, Ohno S. 2006. Binding of a novel SMG-1-Upf1-eRF1-eRF3 complex (SURF) to the exon junction complex triggers Upf1 phosphorylation and nonsense-mediated mRNA decay. Genes Dev 20: 355–67.
Kurosaki T, Popp MW, Maquat LE. 2019. Quality and quantity control of gene expression by nonsense-mediated mRNA decay. Nat Rev Mol Cell Biol 20: 406–420.
Liu Z, Lavis LD, Betzig E. 2015. Imaging Live-Cell Dynamics and Structure at the Single-Molecule Level. Mol Cell 58: 644–659.
Loh B, Jonas S, Izaurralde E. 2013. The SMG5-SMG7 heterodimer directly recruits the CCR4-NOT deadenylase complex to mRNAs containing nonsense codons via interaction with POP2. Genes Dev 27: 2125–2138.
Longman D, Hug N, Keith M, Anastasaki C, Patton EE, Grimes G, Cáceres JF. 2013. DHX34 and NBAS form part of an autoregulatory NMD circuit that regulates endogenous RNA targets in human cells, zebrafish and Caenorhabditis elegans. Nucleic Acids Res 41: 8319–31.

Longman et al.
30
Longman D, Plasterk RHA, Johnstone IL, Cáceres JF. 2007. Mechanistic insights and identification of two novel factors in the C. elegans NMD pathway. Genes Dev 21: 1075–85.
Maksimova N, Hara K, Nikolaeva I, Chun-Feng T, Usui T, Takagi M, Nishihira Y, Miyashita A, Fujiwara H, Oyama T, et al. 2010. Neuroblastoma amplified sequence gene is associated with a novel short stature syndrome characterised by optic nerve atrophy and Pelger-Huët anomaly. J Med Genet 47: 538–48.
Melero R, Hug N, Lopez-Perrote A, Yamashita A, Caceres JF, Llorca O, López-Perrote A, Yamashita A, Cáceres JF, Llorca O. 2016. The RNA helicase DHX34 functions as a scaffold for SMG1-mediated UPF1 phosphorylation. Nat Commun 7: 10585.
Metze S, Herzog VA, Ruepp M-DM-D, Mühlemann O. 2013. Comparison of EJC-enhanced and EJC-independent NMD in human cells reveals two partially redundant degradation pathways. RNA 19: 1432–48.
Moreno JA, Radford H, Peretti D, Steinert JR, Verity N, Martin MG, Halliday M, Morgan J, Dinsdale D, Ortori CA, et al. 2012. Sustained translational repression by eIF2α-P mediates prion neurodegeneration. Nature 485: 507–11.
Ortega JA, Daley EL, Kour S, Samani M, Tellez L, Smith HS, Hall EA, Esengul YT, Tsai Y-H, Gendron TF, et al. 2020. Nucleocytoplasmic Proteomic Analysis Uncovers eRF1 and Nonsense-Mediated Decay as Modifiers of ALS/FTD C9orf72 Toxicity. Neuron 106: 90-107.e13.
Papadopoulos DK, Skouloudaki K, Engström Y, Terenius L, Rigler R, Zechner C, Vukojević V, Tomancak P. 2019. Control of Hox transcription factor concentration and cell-to-cell variability by an auto-regulatory switch. Development 146: dev168179.
Pereverzev AP, Gurskaya NG, Ermakova G V, Kudryavtseva EI, Markina NM, Kotlobay AA, Lukyanov SA, Zaraisky AG, Lukyanov KA. 2015. Method for quantitative analysis of nonsense-mediated mRNA decay at the single cell level. Sci Rep 5: 7729.
Petrášek Z, Schwille P. 2008. Precise measurement of diffusion coefficients using scanning fluorescence correlation spectroscopy. Biophys J 94: 1437–1448.
Piñol-Roma S, Dreyfuss G. 1992. Shuttling of pre-mRNA binding proteins between nucleus and cytoplasm. Nature 355: 730–2.
Reid DW, Nicchitta C V. 2015. Diversity and selectivity in mRNA translation on the endoplasmic reticulum. Nat Rev Mol Cell Biol 16: 221–231.
Reid DW, Nicchitta C V. 2012. Primary role for endoplasmic reticulum-bound ribosomes in cellular translation identified by ribosome profiling. J Biol Chem 287: 5518–5527.
Sakaki K, Yoshina S, Shen X, Han J, DeSantis MR, Xiong M, Mitani S, Kaufman RJ. 2012. RNA surveillance is required for endoplasmic reticulum homeostasis. Proc Natl Acad Sci U S A 109: 8079–84.
Saleeb RS, Kavanagh DM, Dun AR, Dalgarno PA, Duncan RR. 2019. A VPS33A-binding motif on syntaxin 17 controls autophagy completion in mammalian cells. J Biol Chem 294: 4188–4201.
Longman et al.
31
Sanford JR, Ellis JD, Cazalla D, Cáceres JF. 2005. Reversible phosphorylation differentially affects nuclear and cytoplasmic functions of splicing factor 2/alternative splicing factor. Proc Natl Acad Sci U S A 102: 15042–7.
Scott DK, Board J., Lu X, Pearson AD, Kenyon RM, Lunec J. 2003. The neuroblastoma amplified gene, NAG: genomic structure and characterisation of the 7.3 kb transcript predominantly expressed in neuroblastoma. Gene 307: 1–11.
Segarra NG, Ballhausen D, Crawford H, Perreau M, Campos-Xavier B, van Spaendonck-Zwarts K, Vermeer C, Russo M, Zambelli P-Y, Stevenson B, et al. 2015. NBAS mutations cause a multisystem disorder involving bone, connective tissue, liver, immune system, and retina. Am J Med Genet Part A 167: 2902–2912.
Serin G, Gersappe A, Black JD, Aronoff R, Maquat LE. 2001. Identification and characterization of human orthologues to Saccharomyces cerevisiae Upf2 protein and Upf3 protein (Caenorhabditis elegans SMG-4). Mol Cell Biol 21: 209–23.
Sieber J, Hauer C, Bhuvanagiri M, Leicht S, Krijgsveld J, Neu-Yilik G, Hentze MW, Kulozik AE. 2016. Proteomic analysis reveals branch-specific regulation of the unfolded protein response by nonsense-mediated mRNA decay. Mol Cell Proteomics 15: 1584–97.
Singh G, Jakob S, Kleedehn MG, Lykke-Andersen J. 2007. Communication with the exon-junction complex and activation of nonsense-mediated decay by human Upf proteins occur in the cytoplasm. Mol Cell 27: 780–92.
Tatsuno T, Nakamura Y, MA S, Tomosugi N, Ishigaki Y. 2016. Nonsense-mediated mRNA decay factor Upf2 exists in both the nucleoplasm and the cytoplasm. Mol Med Rep 14: 655–660.
Trcek T, Sato H, Singer RH, Maquat LE. 2013. Temporal and spatial characterization of nonsense-mediated mRNA decay. Genes Dev 27: 541–51.
Trecartin RF, Liebhaber SA, Chang JC. 1981. β° Thalassemia in Sardinia is caused by a nonsense mutation. J Clin Invest 68: 1012–1017.
Vukojević V, Heidkamp M, Ming Y, Johansson B, Terenius L, Rigler R. 2008. Quantitative single-molecule imaging by confocal laser scanning microscopy. Proc Natl Acad Sci U S A 105: 18176–18181.
Walter P, Johnson AE. 1994. Signal sequence recognition and protein targeting to the endoplasmic reticulum membrane. Annu Rev Cell Biol 10: 87–119.
Walter P, Ron D. 2011. The unfolded protein response: from stress pathway to homeostatic regulation. Science (80- ) 334: 1081–1086.
Weng Y, Czaplinski K, Peltz SW. 1996. Genetic and biochemical characterization of mutations in the ATPase and helicase regions of the Upf1 protein. Mol Cell Biol 16: 5491–506.
Wimmer K, Zhu XX, Lamb BJ, Kuick R, Ambros PF, Kovar H, Thoraval D, Motyka S, Alberts JR, Hanash SM. 1999. Co-amplification of a novel gene, NAG, with the N-myc gene in neuroblastoma. Oncogene 18: 233–8.
Wu B, Eliscovich C, Yoon YJ, Singer RH. 2016. Translation dynamics of single mRNAs in live cells and neurons. Science 352: 1430–5.

Longman et al.
32
Xu W, Bao P, Jiang X, Wang H, Qin M, Wang R, Wang T, Yang Y, Lorenzini I, Liao L, et al. 2019. Reactivation of nonsense-mediated mRNA decay protects against C9orf72 dipeptide-repeat neurotoxicity. Brain 142: 1349–1364.
Yepiskoposyan H, Aeschimann F, Nilsson D, Okoniewski M, Mühlemann O. 2011. Autoregulation of the nonsense-mediated mRNA decay pathway in human cells. RNA 17: 2108–18.

Longman et al.
33
Figure legends
Figure 1. NBAS is an ER-localized protein with dual, independent, functions in NMD and ER
secretion. (A) Cartoon depicting the functional domains of NBAS and its intracellular localization at
the Endoplasmic Reticulum (ER), as part of the Syntaxin 18 complex. (B) NMD activity is not
required for constitutive secretion. Depletion of NMD factors, with the exception of NBAS, does not
affect the ability of HeLa C1 cells to secrete a GFP-based reporter construct. GFP accumulation was
A B
D
Golgi
Nucleus
COPI vesicle(Stx18 complex)
ER
COPIIvesicle
NBAS
Sly1
p31
ZW10 RINT
Vesicle
ER membrane
Sec22bSTx18
BNIP1
1 90 370 725 1374 2371
NBASȕ-propeller Į-solenoidWD40 Sec39
Rel
ativ
e H
BB
exp
ress
ion
6hours of ActD treatment
HBB NS39HBB NS39 BrefAHBB WTHBB WT BrefA
1.5
1.0
0.5
0
0
2
4
6
8
10
12
untre
ated
si co
ntrol
si UPF1
si UPF2
si DHX34
si SEC13
si NBAS
si p3
1
si RIN
T1
si ZW10
si STX18
Rel
ativ
e flu
orec
ence
re
mai
ning
00
1
2
3**
*ns
ns
STOP
HBB NS39
C
rela
tive
HB
B N
S39
ex
pres
sion
ns
ns
si co
ntrol
0.0
0.5
1.0
1.5
HBB WT
rela
tive
HB
B W
T ex
pres
sion
si UPF2
si NBAS
si STX18
si STX5
si co
ntrol
si UPF2
si NBAS
si STX18
si STX5
Longman_Fig.1
]
]

Longman et al.
34
measured by flow cytometry and a secretion defect was defined as a two-fold accumulation of GFP
reporter (after the addition of 1 µM D/D Solubilizer (ligand) compared to untreated HeLa C1 cells
(dashed line). Each point represents one biological replica, bars indicate mean with SEM. (C) NMD
activity is not affected by depletion of secretion factors, STX18 and STX5. In contrast, depletion of
UPF2 and NBAS led to an upregulation of the HBB NS39 NMD-sensitive reporter. HeLa cells stably
expressing the HBB NS39 or wild-type (WT) reporters were depleted of the indicated factors and the
steady state level of the reporter mRNA was measured by qRT-PCR and normalized to POLR2J
expression. Each point represents one biological replica, bars indicate mean with SEM. Significance
was determined by two-tailed unpaired t-test: **: p<0.005; *: p<0.05; ns: not significant. (D) NMD
activity is not affected by blocking constitutive secretion. HeLa cells expressing HBB WT or HBB
NS39 reporters were treated with Actinomycin D to block transcription and Brefeldin A to block
constitutive secretion. HBB expression was measured as described in panel (C). Each point represents
the mean and SEM of three biological replicas. The significance of Brefeldin A treatment was
determined by two-tailed unpaired t-test: ns: not significant. See Supplemental Fig. S1C for the effect
of Brefeldin A on secretion.
Longman et al.
35
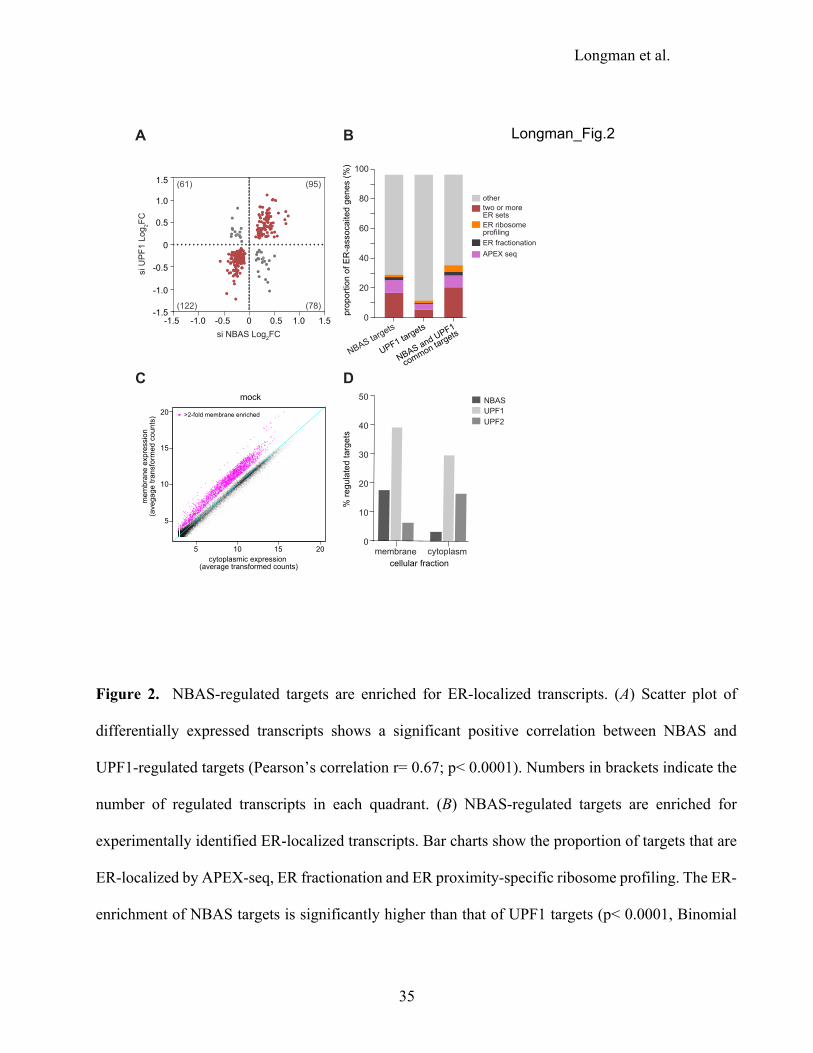
Figure 2. NBAS-regulated targets are enriched for ER-localized transcripts. (A) Scatter plot of
differentially expressed transcripts shows a significant positive correlation between NBAS and
UPF1-regulated targets (Pearson’s correlation r= 0.67; p< 0.0001). Numbers in brackets indicate the
number of regulated transcripts in each quadrant. (B) NBAS-regulated targets are enriched for
experimentally identified ER-localized transcripts. Bar charts show the proportion of targets that are
ER-localized by APEX-seq, ER fractionation and ER proximity-specific ribosome profiling. The ER-
enrichment of NBAS targets is significantly higher than that of UPF1 targets (p< 0.0001, Binomial
A
C
B
D
APEX seqER fractionation
ER ribosomeprofiling
two or moreER sets
other
0
20
40
60
80
100
NBAS targets
UPF1 targets
NBAS and UPF1
common targets-1.5 -1.0 -0.5 0 0.5 1.0 1.5
1.5
1.0
0.5
-0.5
-1.0
-1.5
0
si NBAS Log2FC
si U
PF1
Log
2FC
>2-fold membrane enriched
5 10 15 20 membrane cytoplasm0
10
20
30
40
50 NBASUPF1UPF2
mock
cytoplasmic expression (average transformed counts)
mem
bran
e ex
pres
sion
(ave
gage
tran
sfor
med
cou
nts)
5
10
15
20
% re
gula
ted
targ
ets
cellular fraction
prop
ortio
n of
ER
-ass
ocai
ted
gene
s (%
)
(95)
(78)
(61)
(122)
Longman_Fig.2

Longman et al.
36
Exact test), whereas the difference between NBAS targets and NBAS-UPF1 common targets is not
statistically significant (p= 0.1867, Binomial Exact test). (C) RNA-seq of samples from subcellular
fractions (membrane and cytoplasm) allows identification of membrane-associated genes. Scatter plot
shows average transformed counts of each gene in membrane and cytoplasmic fractions in mock-
depleted cells. (D) NBAS preferentially regulates membrane-associated targets. Plot shows
percentage of ‘membrane-associated’ genes in the membrane fraction and of ‘non-membrane’ genes
in the cytoplasm that are regulated (p<0.05) by each NMD factor. NBAS regulates over 5-fold higher
percentage of membrane-associated genes than non-membrane genes (p<0.001, Exact Binomial test).
By contrast, UPF1 regulates a similar percentage of both membrane-associated and non-membrane
genes (1.3-fold higher percentage of membrane-associated genes, p<0.001, Exact Binomial test), and
UPF2 regulates 2.5-fold higher percentage of non-membrane genes than membrane genes (p<0.001,
Exact Binomial test).

Longman et al.
37
B
A
SETD40
1
2
3
4
8
10
12
NBASk.d.
Cytoplasmic NMD target: SETD4
ER-localized NMD target: FAP
UPF1k.d.
controlk.d.
rela
tive
expr
essi
on
FAP
si controlsi UPF1si NBAS
qRT-PCR
C
D**
*
*
*
controlk.d.
UPF1k.d.
NBASk.d.
0
10
20
30
40
50****
ns
****
SETD4 FAPsmRNA FISH
(8) (8) (8) (8) (7) (14)
Dis
tanc
e of
sig
nal f
rom
the
nucl
eus
(µ)
si controlsi UPF1si NBAS
Longman_Fig.3

Longman et al.
38
Figure 3. ER-localized NMD targets are degraded at the ER. (A) Relative changes in SETD4 and
FAP expression upon UPF1 or NBAS depletion were measured by qRT-PCR and normalized to
POLR2J expression. Each point represents one biological replica, bars indicate mean with SEM.
Significance was determined by two-tailed unpaired t-test: **: p<0.005; *: p<0.05. (B-C) Single-
molecule (sm) RNA FISH was used to visualize the site of accumulation of a cytoplasmic NMD
target SETD4 (B), or an ER-localized NMD target FAP (C), within the cell when NMD was abrogated
by either UPF1 or NBAS knock-down. Individual RNA molecules were visualized by a set of
transcript-specific Quasar® 570-labelled Stellaris probes and pseudo-colored green. The cell outline
was visualized by staining with MemBright 640nm probe and is indicated by the yellow line. The ER
compartment was visualized by mEmeral-ER-3 co-transfected plasmid and is pseudocolored red
(right column). Each scale bar is 10µm. (D) Distribution of FISH signal within imaged cells is
represented by the distance of signal from the nucleus in each condition. Graph shows distances as 5-
95 percentile box plots, numbers in brackets indicate the number of analyzed cells. Data was acquired
in three independent experiments. Statistical significance was determined by one-way ANOVA test.
****: p_adj<0.0001; ns: not significant.

Longman et al.
39
Figure 4. UPF1 localizes at the ER. (A) Immunofluorescence of HeLa cells transiently expressing
FLAG-tagged UPF1 (in green) together with the ER-marker Calnexin (in red). Cell nuclei were
visualized by DAPI staining. UPF1 predominantly shows a diffused cytoplasmic localization (top
panel). Partial cell permeabilization with Digitonin revealed that a fraction of UPF1 is anchored at
the ER membrane and co-localizes with Calnexin (bottom panel). (B) UPF1 is localized in the close
proximity of the SEC61B translocon component at the ER. Proximity Ligation Assay (PLA) using
antibodies against endogenous UPF1 and SEC61B proteins generated a discrete signal (red spots),
indicating that the proteins are less than 40nm apart. The graph shows the quantification of PLA
signal. Each point represents mean PLA count per cell in one captured frame. Significance was
determined by two-tailed Mann-Whitney test: **: p<0.005. Data showing the co-localization of
NBAS and UPF2 with SEC61B can be found in Supplemental Fig. S5.
A
UPF1 onlycontrol
UPF1with SEC61B
0
10
20
30
40
50
num
ber o
f PLA
foci
per
cel
l
UPF1 only control UPF1with SEC61B
F-UPF1
F-UPF1with Digitonin
BDAPI anti-FLAG anti-Calnexin merge
**
Longman_Fig.4

Longman et al.
40
Figure 5. NBAS and UPF1 interact directly. (A) The interaction between NBAS and UPF1 was
measured by FRET-FLIM. The average fluorescence lifetime of GFP-NBAS donor molecules was
measured in HeLa cells expressing GFP-tagged NBAS together with mCherry-UPF1 or mCherry, as
a control. Cells were pseudo-colored by average lifetime (ns) where red represents longer lifetime
and green corresponds to a shorter lifetime. Average fluorescence lifetime was used to calculate the
FRET efficiency (right panel). Cells were pseudo-colored by FRET efficiency (%). (B) The
A
NBAS KO NBAS wt0
5
10
15
rela
tive
PLA
sig
nal
C UPF1 and NBAS
(wt cells)UPF1 and NBAS(NBAS KO cells)
FRET efficiency (%)1.5 2.1 0 15
GFP-NBAS + mCherry
GFP-NBAS + mCherry-UPF1
GFP-NBAS + mCherry
GFP-NBAS + mCherry-UPF1
Average donor lifetime (ns)
B
1.000
1.005
G(IJ)
1.010
1.015
1.020
1.025
1x10⁻⁵ 1x10-11x10-21x10-31x10-4 1x100
IJ/s1x101
mCherry-UPF1, GFP-NBAS,cross-correlation (FCCS)mCherry, GFP-NBAS,cross-correlation (FCCS)
****
Longman_Fig.5
Longman et al.
41
interaction between NBAS and UPF1 was measured by Fluorescence Cross-Correlation Spectroscopy
(FCCS) in HeLa cells transiently expressing GFP-NBAS and mCherry-UPF1 or GFP-NBAS and
mCherry, as a control. Increased G(τ) amplitude of the average cross-correlation curves corresponds
to higher cross-correlation (higher fraction of co-diffusing molecules) of GFP-NBAS and mCherry-
UPF1 (in black), as compared to GFP-NBAS and mCherry average cross-correlation (in grey). (C) A
direct interaction between endogenous NBAS and UPF1 was determined by PLA using antibodies
against endogenous UPF1 and NBAS proteins in HeLa cells. The PLA signal in wild-type (wt) HeLa
cells was compared to a HeLa NBAS knock-out (KO) cells, as a negative control. The PLA signal
was quantified in the graph where each point represents mean PLA count in one captured frame,
relative to NBAS KO negative control. Significance was determined by two-tailed Mann-Whitney
test: ****: p<0.0001.
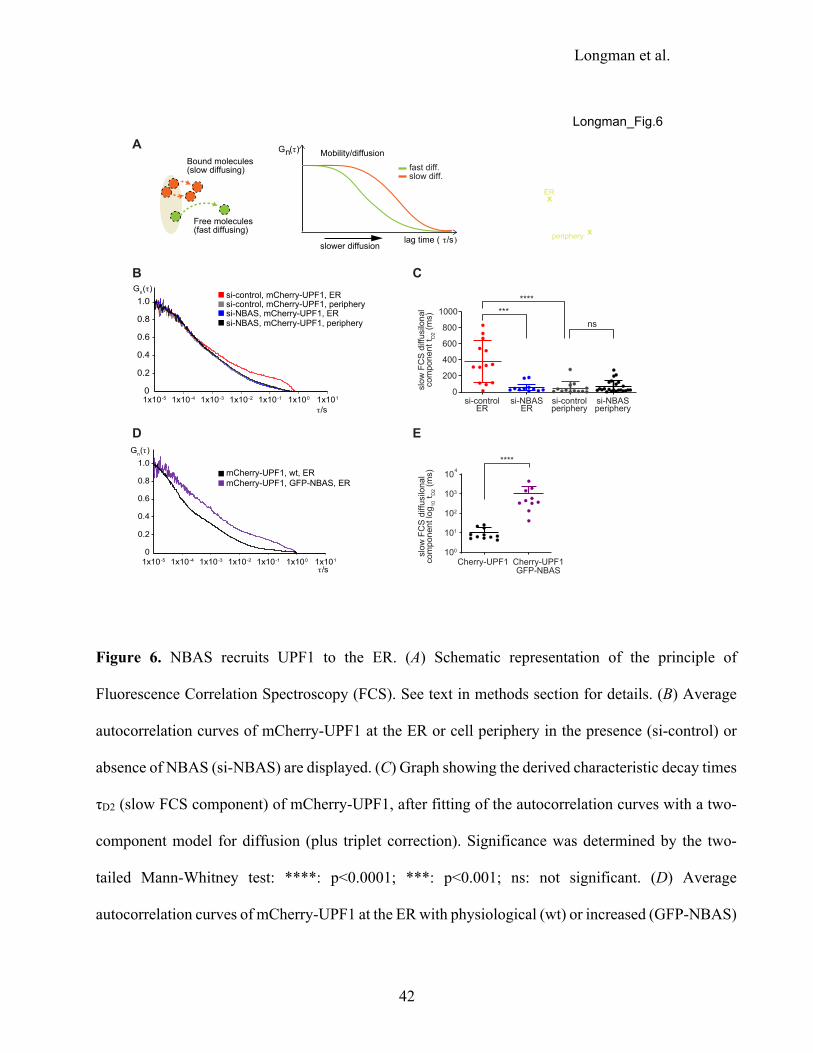
Longman et al.
42
Figure 6. NBAS recruits UPF1 to the ER. (A) Schematic representation of the principle of
Fluorescence Correlation Spectroscopy (FCS). See text in methods section for details. (B) Average
autocorrelation curves of mCherry-UPF1 at the ER or cell periphery in the presence (si-control) or
absence of NBAS (si-NBAS) are displayed. (C) Graph showing the derived characteristic decay times
τD2 (slow FCS component) of mCherry-UPF1, after fitting of the autocorrelation curves with a two-
component model for diffusion (plus triplet correction). Significance was determined by the two-
tailed Mann-Whitney test: ****: p<0.0001; ***: p<0.001; ns: not significant. (D) Average
autocorrelation curves of mCherry-UPF1 at the ER with physiological (wt) or increased (GFP-NBAS)
A
x
x
ER
periphery
B C
D E
0
0.2
Gn(IJ)
0.4
0.6
0.8
1.0
1x10⁻⁵ 1x10-11x10-21x10-31x10-4 1x100
IJ/s1x101
si-NBAS, mCherry-UPF1, ER
si-control, mCherry-UPF1, ER
si-NBAS, mCherry-UPF1, periphery
si-controlER
si-NBASER
si-controlperiphery
si-NBASperiphery
0
200
400
600
800
1000ns
*******
Cherry-UPF1 Cherry-UPF1GFP-NBAS
100
101
102
103
104
****
Free molecules(fast diffusing)
Bound molecules(slow diffusing)
Mobility/diffusion
lag time ( IJ/s)
Gn(IJ)
slower diffusion
fast diff.slow diff.
0
0.2
Gn(IJ)
0.4
0.6
0.8
1.0
1x10⁻⁵ 1x10-11x10-21x10-31x10-4 1x100
IJ/s1x101
mCherry-UPF1, GFP-NBAS, ERmCherry-UPF1, wt, ER
slow
FC
S d
iffus
ilona
l co
mpo
nent
t D2 (
ms)
slow
FC
S d
iffus
ilona
l co
mpo
nent
log 10
t D2 (
ms)
si-control, mCherry-UPF1, periphery
Longman_Fig.6

Longman et al.
43
level of NBAS expression. (E) Characteristic decay times τD2 (slow FCS component), derived as in
(C) of mCherry-UPF1 at the ER. Significance was determined by the two-tailed Mann-Whitney test:
****: p<0.0001. Data showing FCS control experiments can be found in Supplemental Fig. S8.

Longman et al.
44
Figure 7. Model for an ER-NMD pathway. NBAS is an NMD factor that localizes to the membrane
of the endoplasmic reticulum (ER). NBAS recruits the core NMD factor UPF1 and tethers it to the
membrane of the ER to activate a local NMD response that targets for degradation mRNAs that are
translated at the ER.
Longman_Fig.7
cytoplasm
ER
Copyright © 2022 FDOKUMEN