Vascular malformations: localized defects in vascular morphogenesis
Upload
independentCategory
view
2download
0
3D Lung Image Retrieval Using Localized Features
Adrien Depeursingea,b, Tatjana Zrimecc,d, Sata Busayaratd,e, Henning Mullera,b
aUniversity of Applied Sciences Western Switzerland (HES–SO), Sierre, Switzerland;bUniversity and University Hospitals of Geneva, Medical Informatics, Geneva, Switzerland;cHealth Informatics, Faculty of Medicine,University of New South Wales, Sydney, Australia;
dComputer Science and Engineering, University of New South Wales, Sydney, Australia;eMicrosoft Corporation, One Microsoft Way, Redmond, WA 98052-6399, USA;
ABSTRACT
The interpretation of high–resolution computed tomography (HRCT) images of the chest showing disorders of thelung tissue associated with interstitial lung diseases (ILDs) is time–consuming and requires experience. Whereasautomatic detection and quantification of the lung tissue patterns showed promising results in several studies, itsaid for the clinicians is limited to the challenge of image interpretation, letting the radiologists with the problemof the final histological diagnosis. Complementary to lung tissue categorization, providing visually similar casesusing content–based image retrieval (CBIR) is in line with the clinical workflow of the radiologists.
In a preliminary study, a Euclidean distance based on volume percentages of five lung tissue types was usedas inter–case distance for CBIR. The latter showed the feasibility of retrieving similar histological diagnosesof ILD based on visual content, although no localization information was used for CBIR. However, to retrieveand show similar images with pathology appearing at a particular lung position was not possible. In this work,a 3D localization system based on lung anatomy is used to localize low–level features used for CBIR. Whencompared to our previous study, the introduction of localization features allows improving early precision forsome histological diagnoses, especially when the region of appearance of lung tissue disorders is important.
Keywords: Content–based medical image retrieval, 3D lung atlas, texture analysis, chest high–resolution CT,localized features, interstitial lung diseases.
1. INTRODUCTION
Interstitial lung diseases (ILD) group more than 150 disorders of the lung tissue from various causes leadingto breathing dysfunction. Many of them are rare and present unspecific symptoms such as altered pulmonaryfunctions and cough. Diagnosing ILDs is a difficult task for non–specialists and is based on observations of clinical,physiologic, pathologic manifestations as well as radiologic findings.1 The latter occupy an important role as theyallow assessing the appearance of the lung parenchyma, which is often representative of a particular histologicaldiagnostic of ILDs.2 The most employed imaging technique is the chest X–ray due to its low cost and limitedradiation dose. However, it allows limited diagnosing specificity for ILDs as the lung tissue is superimposed withribs and other organs. When the clinical and physiological presentations arouse suspicions towards an ILD, theHRCT imaging protocol is favored as it enables accurate visual assessment of the lung parenchyma by providingthree–dimensional images at a sub–millimetric resolution in axial slices. The interpretation of high–resolutioncomputed tomography (HRCT) images of the chest showing disorders of the lung tissue associated with ILDsis time–consuming and requires experience as the various diagnoses of ILDs are can be differentiated only bysubtle changes in the lung parenchyma, with characteristic distribution within the lung anatomy.
Image–based computerized diagnosis aid tools were proposed to assist the radiologists in the HRCT interpre-tation tasks. Automatic detection and quantification of the lung tissue patterns in HRCT image series have theadvantage to reduce the risk of omission of important lesions and provide a three–dimensional map of the catego-rized lung tissue to serve as a second opinion to the radiologist. Whereas automatic detection and quantificationof the lung tissue patterns showed promising results in several studies,3–5 its aid for the clinicians is limited to
Further author information: (Send correspondence to Adrien Depeursinge, [email protected])

the challenge of image interpretation, letting the radiologists down with the problem of the final histologicaldiagnosis. Complementary to lung tissue categorization, providing visually similar cases using content–basedimage retrieval (CBIR) is in accordance with the clinical workflow of the radiologists. CBIR of HRCT of thechest provides valuable information from cases with confirmed diagnoses and corresponds to the approach of theclinician with little experience who compares the image under investigation with typical cases listed in textbooksor contained in personal collections.6, 7 CBIR of chest CT has rarely been proposed in the literature and theexisting studies8–11 have presented systems for retrieving similar lung tissue types, which are of limited use inclinical practice. Moreover, all proposed systems require delineating query regions, which does not allow globalinter–case similarity assessment including information from the whole lung. Retrieving similar cases in terms ofhistological diagnoses is closer to the needs of radiologists. The latter is however more challenging to implementas the content of the HRCT scans need to be analyzed as a whole. Each histological diagnosis of ILD is character-ized by proportions and predominance of a given set of abnormal lung tissue patterns. In a previous study,12 3Dcase–based retrieval was introduced and evaluated based on the histological diagnoses. The inter–case distancewas based on the differences of percentages of five lung tissue patterns within the whole lung, along with selectedclinical parameters. The retrieval performances obtained suggest the feasibility of retrieving similar cases interms of final histological diagnosis using CBIR. However, although known as being very discriminative for thedifferential diagnosis of ILDs,13 the localization of the diseased tissue was discarded by this approach. The goalof the work described in this article is to evaluate the benefits from using localized features for content–basedimage retrieval of HRCT images of the lung with ILDs. The retrieval performance is compared with the previousapproach using the volume percent ages of five types of lung tissue as visual attributes without localization.12
1.1. Histological diagnoses and associated abnormal tissue locations
To identify the key locations of tissue disorders associated with ILDs, the most important lung tissue patternsand their corresponding localizations are detailed in Table 1 for seven frequent ILDs.13 As observed in Table 1,ground glass patterns are encountered in most of the ILDs and are thus non–specific. Therefore, its location aswell as the clinical context and other HRCT findings are required to interpret the presence of ground glass.
• Pulmonary fibrosis (PF) means scarring throughout the lungs. The term fibrosis is used in this work todescribe HRCT findings that are associated with the histological diagnosis PF and includes reticulation,traction bronchiectasis, architecture distortion and honeycombing. The characteristic basal and peripheralpredominance of the abnormalities on HRCT scans is an important clue to the diagnosis of PF.14 Amongthe most common appearance reported in13 is lower lung zone with posterior predominance.
• Tuberculosis (TB) is an infectious disease caused by the inhalation of air–borne organisms (bacterias).Typically, the upper lobes are most affected. In patients with active TB signs include focal consolidationand cavitation.13 In miliary TB, a fine nodular pattern shows random distribution within the lung.13
• Pneumocystis pneumonia or Pneumocystis carinii pneumonia (PCP) is an opportunistic fungal infection,most common in human immunodeficiency virus (HIV) infected patients. Findings include patchy/diffuseground glass, crazy–paving, cysts, pneumothorax and a central, perihilar or upper lobe distribution.
• Hypersensitivity pneumonitis (HP) is an allergic lung disease caused by breathing in a foreign substance.HRCT findings show patchy distribution of fibrosis, ground glass opacities or centri–lobular nodules.
• Acute interstitial pneumonia (AIP) is a disease causing rapid onset of respiratory failure. HRCT finingsconsist of patchy bilateral areas of ground glass opacities and diffuse or patchy consolidation.13
• Cryptogenic organizing pneumonia (COP), also known as Bronchiolitis obliterans organizing pneumonia, isa inflammatory process with presence of “granulation tissue polyps within the respiratory bronchioles andalveolar duct”.13 HRCT scans of the lung reveal patchy air–space consolidation, ground glass opacities,small nodular opacities, as well as bronchial wall thickening and dilation. These patchy opacities occurmore frequently in the periphery of the lung and are often in the lower lung zone.15

Table 1. 7 common histological diagnoses of ILDs and associated HRCT findings according to.13
histological diagnosisHRCT lung
tissue patternspredominance
Pulmonary fibrosis(PF)
fibrosis, bronchiectasis,ground glass
peripheral,sub–pleural,
basal, posterior
Tuberculosis (TB)micronodules (miliary),
tree–in–bud, consolidation
diffuse, apical(cavitary)
Pneumocystispneumonia (PCP)
ground glass, crazy–paving, cysts,pneumothorax
central, perihilar
Hypersensitivitypneumonitis (HP)
ground glass, emphysema, fibrosis diffuse
Acute interstitialpneumonia (AIP)
ground glass, consolidation basal, diffuse
Cryptogenic organizingpneumonia (COPa)
aBronchiolitis obliteransorganizing pneumonia wasformerly used and replacedby COP
ground glass,consolidation (patchy),
macronodules, bronchial wallthickening, crazy–paving
peripheral, basal,peribronchovascular,
subpleural
Sarcoidosis (SA)micronodules, consolidation,macronodules, ground glass,
fibrosis (end–stage)
apical,peribronchovascular,subpleural, peripheral
• Sarcoidosis (SA) is a systemic disorder of unknown origin. It is characterised by non–caseating granulomasthat may resolve spontaneously or progress to fibrosis.13 The most characteristic findings are small nodulesin a perilymphatic distribution. Common HRCT findings for SA are upper lobes and peribronchovascularpredominance of confluent nodules or masses and fibrotic tissue in patients with end–stage disease.
1.2. Atlas–based localization of the features in CBIR
Localization is important for CBIR as the similarity between two images perceived by human observers stronglydepends on the layout of the image as well as the spatial relations among depicted objects.16 Several approacheswere proposed for localizing features for CBIR:17
• partitioning, which consists in extracting features at regularly sampled points,18
• salient points, where features are extracted at locations found by detectors (e.g. high–gradient, corner),16
• weak segmentation, features are extracted for each locally homogeneous region,19
• strong segmentation (or altas–based), dividing the image into real world objects with prior knowledge.
In the context of content–based medical image retrieval, the variations among patients in terms of organsize, shape and location renders the localization tasks even more challenging. Moreover, similarity of medicalimages is often defined based on the type and extent of the disease as well as age and gender of the patient. Thelocalizations of the features must be in accordance with the targeted diseases and the anatomy of the diseasedorgan. The use of regularly or randomly sampled points is hardly applicable to texture retrieval of the lungparenchyma as comparing lung tissue at locations that are not dermined by the lung anatomy does not make

sense. The use of keypoint detectors is not adapted for texture analysis as the detectors are based on shapeproperties by placing salient points on edges or regions with high gradient values,16 whereas few detectors arebased on texture properties.20
The use of atlases including anatomical knowledge for feature localization is in accordance with the approachof radiologists with image interpretation. Moreover, ILDs have clearly defined predominances of appearance ofthe diseased lung tissue that are typical to each histological diagnosis (see Table 1), which suggests that an atlas–based localization of the features is appropriate. In,21 low–level features (e.g. shape, size, texture) are extractedin automatically segmented objects of interest for image retrieval. The objects are learned in a preliminary step.The system can then be tailored to a specific application (e.g. retrieval of brain lesions in magnetic resonanceimaging (MRI) images). No quantitative evaluation of the system is carried out and the success of the proposedapproach strongly depends on the segmentation performance, related to the complexity of the seeked objectsand thus to the medical application.
Concepts of using an indexed atlas to localize lesions for further CBIR of mammograms are detailed in.22
However the selection of the locations of the lesions within the atlas are manual, which does not enable auto-matic indexation of large image collections. In,23 altas–based localizations of the endoscope in upper digestiveendoscopy is used for similar case retrieval. However, the retrieval is not based on the numerical content ofimages but on standardized descriptions of the studied case carried out by the physician.
Another imaging modality where atlas based localization is required is Positron emission tomography (PET).CBIR of brain PET images is not possible without using feature localization as most information is containedin the anatomic location of the activated region. CBIR of multi–dimensional dynamic PET images (3D andtime) of the brain is investigated in.24 The localization of volumes of interests within a standardized 3D anatom-ical atlas25 is used as an additional feature for retrieval. Unfortunately, neither quantitative analysis of theretrieval performance nor systematic evaluation of the importance of the localization feature is carried out. Inanother study,26 CBIR of neurological PET images based on Gabor wavelets and mean activity levels of specificanatomical regions is carried out. Again, no quantitative analysis of the retrieval performance is carried out.
1.2.1. Local features for CBIR of HRCT images of the chest
Atlas–based indexation of chest CTs has been little investigated. In,27 similarity searching for chest CT imagesbased on object features and spatial relation maps. In a first step, the lung lobes and the mediastinium aresegmented using a tailored watershed algorithm. Then, shape–based features are extracted from the mediastiniumregion and texture attributes for the lung parenchyma as well as spatial relationships between the lung lobes andthe mediastinium. The system uses a Euclidean distance in the feature space without feature weighting, whichdoes not allow evaluating the contribution of the localization features in the retrieval performance.
Local versus global characterization of HRCT images for CBIR is invesigated in.9 The ASSERT (AutomaticSearch and Selection Engine with Retrieval Tools) system uses low–level features either from hand–drawn regionsin axial slices or from the whole lung. The distance from the centroid of the marked region and the nearest lungboundary point is also used as an additional feature. The empirical evaluation shows that using localized featuressignificantly improves performance over using only global features. This study however shows several limitations.The localization information is only provided by the location of the delineated region and thus does not enable asystematic regional comparison among cases. Due to the requirement of delineating regions, the system can notbe fully automatic and requires significant amount of work for annotating regions in all image series. At last,the low–level features are averaged over the whole lung which cannot be relevant information for indexing. Forinstance, severely injured lungs containing equal proportions of emphysema and consolidated tissue may haveidentical averaged grey–level value over the whole lungs as perfectly healthy lungs.
CBIR based on localized 2D features was reported in.28 However, CBIR based on texture features localizedin a three–dimensional referential has rarely been rarely attempted in the literature, and never to our knowledgeon HRCT images of the chest, where the appearance of the diseased patterns is very important for establishingthe diagnosis of ILDs.29 In a preliminary study,12 we used a Euclidean distance based on the percentages ofautomatically segmented volumes of five lung tissue types as inter–case distance for CBIR. The latter showedfeasibility of retrieving similar histological diagnoses based on image content although no localization informationwas used for visual indexation. However, to retrieve and show similar images with pathology, appearing at a

particular lung position was not possible. In this work, a 3D referential based on lung anatomy is utilized tolocalize features used for CBIR. The hypothesis under inverstigation is to test whether a systematic regionalcomparison of the percentages of five lung tissue types enables to learn the typical anatomical distribution of thelung tissue disorders that are specific to each histological diagnosis as shown in Table 1.
2. MATERIAL AND METHODS
In this section, the methods used for both global and localized content–based retrieval of HRCT images serieswith similar histological diagnosis are detailed. In Section 2.1, the database of ILD cases is described. Then, thevarious CBIR steps are explained in the following sequential order:
1. semi–automatic segmentation of the lung regions (Section 2.2),
2. blockwise texture classification of the lung parenchyma to generate a 3D map of the lung tissue (Section 2.3),
3. generation of the lung atlas from the lung masks segmented by step 1 (Section 2.4),
4. inter–case distance being either global or local (Section 2.5).
The validation strategy for retrieval performance estimation is described in Section 2.6.
2.1. Dataset
The dataset used is part of a database of ILD cases containing HRCT images with a slice thickness of 1mm andannotated regions performed by two radiologists at the Universtity Hospitals of Geneva (HUG).30 HRCT imageseries of 85 patients are used to evaluate the performance of the proposed approach. The diagnoses of each casewas confirmed either by pathology (biopsy, bronchoalveolar washing) or by a laboratory/specific test. Seven ILDdiagnoses were selected as being frequent and having sufficient number of cases, with a minimum of 3 cases forCOP and 30 cases for PF. The distributions of the 7 ILDs diagnoses as well as marked regions of interest (ROI)are very unbalanced and representative of the respective prevalences in the Geneva area. Distributions of theannotated regions and histological diagnoses can be deduced from Tables 4 and 6 respectively.
2.2. Semi–automatic segmentation of lungs
The segmentation of the lung regions is a prerequisite for both texture–based categorization of the lung tissueand the generation of the lung atlas. Segmentation errors in the lung regions influence all further steps and ahigh accuracy is required. Since the geometries and shapes of the lungs are subject to large variations amongcases due to various morphologies and extents of the disease, semi–automatic segmentation based on 3D regiongrowing and 3D mathematical morphology is carried out with a graphical user interface (see Figure 2). 3D regiongrowing mimics the propagation of air in lung volumes. The region growing routine is contained in YaDiV∗.Starting from a seed point s(xs, ys, zs) defined by the user, each 26–connected neighbor is added to the regionMlung if the summed value of its own neighbors differs by less than a given variance v. Mlung describes the globallung regions well but contains many holes where the region growing algorithm was stopped by denser regionssuch as vessels or consolidations of the lung parenchyma. To fill these holes, a closing operation is applied toMlung using a spherical structuring element. Two parameters require attention from the user: the radius r ofthe structuring element in millimeters and Nop which defines the number of closing operations.
∗YaDiV: Yet Another DIcom Viewer, http://www.welfenlab.de/en/research/fields of research/yadiv/

2.3. 3D map of categorized lung tissue
The approach for categorizing lung tissue patterns associated with ILDs in HRCT relies on texture analysis. Fourtypes of lung tissue disorders (i.e. emphysema, ground glass, fibrosis and micronodules) as well as healthy tissueare most common to the seven ILD diagnoses chosen. Features based on a grey–level histogram in HounsfieldUnits (HU) are used. CT scanners deliver DICOM (Digital Imaging and COmunications in Medicine) imageswith pixel values in HU that can be univoquely mapped to the density of the observed tissue. Thus, essentialinformation is contained directly in the grey–levels. To encode this information, 22 histogram bins binj of grey–levels in [−1050; 600[ corresponding to the interval of the lung HU values (including pathological) are used astexture features. An additional feature pixair counts the number of air pixels which have value below −1000 HU.All lung tissue patterns depict nonfigurative and cellularly organized areas of pixels and have specific texturesignatures. To describe texture properties, statistical measures from a tailored wavelet transform are extracted.Multiscale analysis using wavelet transforms proved to be adequate for texture analysis31 but requires to controlthe three essential affine parameters: translation, scale–progression and directionality. For lung tissue analysis,it is assumed that lung tissues patterns in transversal slices are translation and rotation–invariant, and isotropicmother wavelet functions are used. Moreover, a fine and initializable scale–progression is necessary to distinguishbetween vessels and micronodules. The quincunx scale–progression is finer than the widely used dyadic onewith a subsampling factor of
√2 instead of 2 and is used to oversample the wavelet filters in an overcomplete
frame transform, which provides translation invariance. Additional justifications for using the described wavelettransform for lung tissue categorization can be found in.32
Based on the lung mask Mlung, the lung parenchyma is analyzed in overlappling 32× 32 blocks in 2D axialslices. The distance between the center of contiguous blocks is set to 4 pixels, which leads to a granularity ofthe analysis of 4× 4. For each block, the 22 histogram bins and the number of air pixels pixair are concatenatedinto one hybrid feature vector v along with parameters of Gaussian mixture models for each 8 iterations of thequincunx wavelet frame transform. A support vector machine (SVM) classifier is used to draw boundaries amongthe distinct classes of lung tissue represented in the feature space and to assign each block to one of the five lungtissue types. This step outputs a 3D map of the categorized lung tissue which can be used as a basis for bothglobal and local–based similar case retrieval.
2.4. 3D anatomical atlas of the lungs
An anatomical atlas of the lung is used as a 3D referential to localize the various lung tissue types. The locationsare chosen according to33 and aim at distinguishing the predominant regions of the 7 ILDs as detailed in Table 1.The lungs are split perpendicularly to 4 axes. Vertically the lungs are divided into upper lung or apical, middlelung and lower lung or basal lung. The lungs are divided into anterior and posterior regions based on theintersection of the coronal and sagittal plane. The axial division results into central lung, intermediate andperipheral lung region. The regions are depicted in Figure 2. A finer localization of the lung tissue types isobtained using the intersection of all 10 regions, generating 36 sub–regions as depicted in Figure 1 (b) and (c).The patient orientations are aligned using the “image orientation” DICOM tag (0020,0037). Peribronchovascularlocations, despite being relevant for several ILDs are not used as these would need more complex segmentationof the bronchial tree,34 which is not conceivable with the high inter–slice gap imposed in the HRCT protocol.The next paragraphs describe the rules used to split the lungs perpendicularly to the four axes.
⊥ coronal and sagittal The center of mass c0(x0, y0, z0) of Mlung is used as reference point to split the lungs.The left and right regions are defined as being all points of Mlung with x ≤ x0 and x > x0 respectively. Similarly,the anterior and posterior regions are defined as being all points of Mlung with y ≤ y0 and y > y0.
⊥ vertical The apical, central and basal regions are defined as z < zmax/3, zmax/3 ≤ z ≤ 2zmax/3 andz > 2zmax/3 respectively.

(a) (b) (c)
Figure 1. (a): definition of the peripheral region. (b) and (c): the 36 sub–regions resulting from the intersections of the10 initial regions are used as the 3D localization system.
⊥ axial The division of Mlung into peripheral, middle and central regions is performed as follows:
1. the projection of c0 is reported in each axial slice as c0,axial(x0, y0, z),
2. peripheral region is defined as all points of Mlung that are between a lung boundary and c0,axial, and thatare less distant from the lung boundary than a distance dp (see Figure 1 (a)). dp is arbitrarily chosen asthe width of one single lung divided by 5.5 at a c0 level to have aproximately same widths for the threeaxial sub–regions,
(a) a 3D closing operation is applied using a spherical structural element with a radius of 5mm.
3. step 2 is repeated to the remaining voxels of Mlung to obtain the middle region,
4. the remaining voxels of Mlung are constituting the central region.
2.5. Global and local inter–case distances
Both inter–case distance measures are based on the percentages of each of the five lung tissue types. The globaldistance dglobal is defined as the l2–Euclidean distance in the space of the differences δ of percentages of thetissue types:
dglobal =√
δ2h + δ2e + δ2g + δ2f + δ2m, (1)
where h stands for healthy, e for emphysema, g for ground glass, f for fibrosis and m for micronodules.
The inter–case distance is obtained by pairwise comparison of tissue distributions for the 36 sub–regions r:
dlocal =
36∑
r=1
wr
√
δ2hr+ δ2er + δ2gr + δ2fr + δ2mr
, (2)
where wr are weights of each sub–region.
2.5.1. Optimization of the regional weights for the local inter–case distance
Obviously, not all anatomical locations are relevant for the characterization of the histological diagnoses. In orderto promote the most important regions, the weights wr in (2) are optimized using an exhaustive grid search in[0 : 50] per axis. Due to computational constraints, a global grid search requiring to run the whole experiment3650 times is not conceivable. Thus, the optimization is carried out per axis, where the regions are comparedbetween each other per axis. For instance, in the vertical axis the retrieval performance is evaluated for eachcombination of three weights:
dlocal = wapicaldapical + wcentraldcentral + wbasaldbasal. (3)
After obtaining optimal weights for each of the ten regions, the weight assigned to each of the 36 sub–regionsis computed as the sum of normalized weights of each region from which it belongs. For instance, the regionapical peripheral anterior left obtains the weight w = wapicalbest + wperipheralbest + wanteriorbest + wleftbest , where(˜) denotes the per–axis normalization.
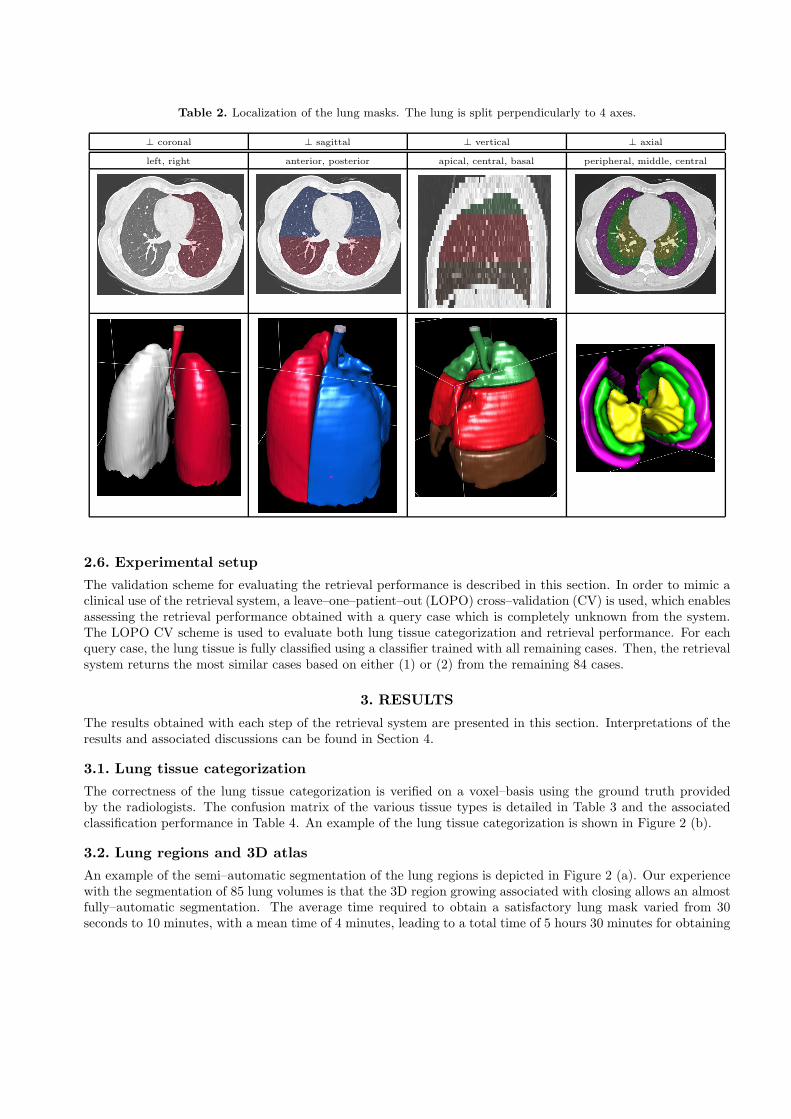
Table 2. Localization of the lung masks. The lung is split perpendicularly to 4 axes.
⊥ coronal ⊥ sagittal ⊥ vertical ⊥ axial
left, right anterior, posterior apical, central, basal peripheral, middle, central
2.6. Experimental setup
The validation scheme for evaluating the retrieval performance is described in this section. In order to mimic aclinical use of the retrieval system, a leave–one–patient–out (LOPO) cross–validation (CV) is used, which enablesassessing the retrieval performance obtained with a query case which is completely unknown from the system.The LOPO CV scheme is used to evaluate both lung tissue categorization and retrieval performance. For eachquery case, the lung tissue is fully classified using a classifier trained with all remaining cases. Then, the retrievalsystem returns the most similar cases based on either (1) or (2) from the remaining 84 cases.
3. RESULTS
The results obtained with each step of the retrieval system are presented in this section. Interpretations of theresults and associated discussions can be found in Section 4.
3.1. Lung tissue categorization
The correctness of the lung tissue categorization is verified on a voxel–basis using the ground truth providedby the radiologists. The confusion matrix of the various tissue types is detailed in Table 3 and the associatedclassification performance in Table 4. An example of the lung tissue categorization is shown in Figure 2 (b).
3.2. Lung regions and 3D atlas
An example of the semi–automatic segmentation of the lung regions is depicted in Figure 2 (a). Our experiencewith the segmentation of 85 lung volumes is that the 3D region growing associated with closing allows an almostfully–automatic segmentation. The average time required to obtain a satisfactory lung mask varied from 30seconds to 10 minutes, with a mean time of 4 minutes, leading to a total time of 5 hours 30 minutes for obtaining

Table 3. Confusion matrix of the lung tissue categorization in % obtained with the LOPO CV.
healthy emphysema ground glass fibrosis micronodules
healthy 79 7.8 6.5 7.3 5.9
emphysema 4.4 69.2 3.9 15.8 6.7
ground glass 9.4 1.7 59.3 22.9 6.7
fibrosis 4.6 3.4 9.2 80.5 2
micronodules 9.9 2.6 3.9 13.5 70.2
Table 4. Performance measures in % associated with Table 3. Nvox and Ncases denote the number of voxels and casesused for evaluation. Global geometric and arithmetic mean accuracies of 88.5% and 71.6% are achieved respectively.
recall precision F–measure accuracy Nvox Ncases
healthy 79 49.6 61 90.7 441’472 5
emphysema 69.2 49.7 57.8 95.7 204’536 5
ground glass 59.3 67.8 63.3 88.3 813’689 23
fibrosis 80.5 64.6 71.7 84.5 1’162’803 30
micronodules 70.2 92.8 79.9 84.1 2’157’766 14
the 85 lung masks. Manual corrections are required when the closing operation cannot fill large regions ofconsolidated tissue. Given that the 3D region growing mimics the propagation of air in the lung volumes, thetrachea is naturally included in Mlung.
3.3. Case–based retrieval
The optimal weights wr obtained with the optimization strategy described in Section 2.5.1 using various targetedperformance measures are shown in Table 5. The retrieval performance using dglobal and dlocal with weightsfavoring either mean P@1 or mean P@Nr are detailed in Table 6. The performance obtained using a globalEuclidean distance with each percentages of lung tissue type in each region (36× 5 dimensions) were lower than
(a)
(b)
Figure 2. (a): segmentation of the lung volumes using YaDiV. A closing tab was added to YaDiV to perform a closingoperation after the region growing. (b): an example of the color–coded lung tissue categorization. Colors are attributedas follows: green for healthy, blue for emphysema, yellow for ground glass, red for fibrosis and pink for micronodules.

Table 5. Weights wr obtained with the optimization strategy described in Section 2.5.1. Numbers in bold are where amedical signification was found (more details in Section 4.3). The weights obtained when targeting performance measuresof PCP, AIP and COP are not shown as being in most cases equal to 0 as discussed.
vertical axial sagittal lateral
histologicaldiagnosis
targetedperformance
apical central basal peripheral middle central anterior posterior left right
P@1 0 1 4 1 0 1 7 4 2 3PF
P@(Nr = 30) 0 14 9 1 0 0 3 38 16 1
P@1 0 1 0 0 0 1 0 1 0 1TB
P@(Nr = 12) 7 4 2 6 1 1 1 3 0 1
P@1 0 3 2 0 1 1 4 1 1 0HP
P@(Nr = 16) 1 10 0 6 1 4 0 1 6 1
P@1 10 9 6 0 3 4 1 0 1 3SA
P@(Nr = 16) 3 4 0 3 1 13 1 0 1 3
P@1 0 4 15 3 0 4 5 1 12 19global mean(case–based) P@Nr 8 11 25 16 0 1 41 3 11 13.5
Table 6. Retrieval performance with the LOPO CV for dglobal and dlocal using weights favoring either P@1 or [email protected] numbers show best performance.
dglobal as defined in (1)dlocal as defined in (2),
with weights favoring P@1dlocal as defined in (2),
with weights favoring P@Nr
histologicaldiagnosis
cases P@1 P@5 P@10 P@Nr P@1 P@5 P@10 P@Nr P@1 P@5 P@10 P@Nr
PF 30 50 50 48 40.9 63.3 39.3 35 31.7 56.7 42.7 35 35.7
TB 12 33.3 31.7 22.5 21.5 33.3 21.7 25 23.6 33.3 11.7 21.7 22.7
PCP 4 0 10 5 12.5 25 10 5 12.5 25 15 7.5 18.7
HP 16 43.7 26.2 21.9 21.1 37.5 20 19.4 20.3 25 22.5 20.6 21.1
AIP 4 0 0 0 0 0 0 2.5 0 0 0 2.5 0
COP 3 0 6.7 6.7 11.1 66.7 13.3 6.7 22.2 66.7 13.3 6.7 22.2
SA 16 31.2 28.7 25.6 24.6 62.5 43.7 39.4 31.6 56.2 38.7 38.1 31.2
mean(case–based)
85 36.5 33.2 29.5 27.1 49.4 29.8 27.5 25.7 43.5 29.4 27.2 27.3
mean(class–based)
85 24.4 23.3 19.9 19.8 42.2 22.2 20.1 21 38.3 21.7 19.9 22.4
the ones with the weighting scheme, which was also the case when using equivalent weight for each region (e.g.wr = 1∀r in Eq. (2)).
4. INTERPRETATION
The results presented in Section 3 were obtained with the various steps of the retrieval system described inSection 2 and are interpreted here.

4.1. Lung segmentation and 3D atlas
The trachea is included in Mlung in most cases, which may bias the volume percentages of the five patterns inEq. (1) and (2). The trachea is classified either as emphysema because it contains air, or as fibrosis which alsocontains air bubbles and is a class favored by the SVM because it has a high number of instances. The constructionof the 3D atlas from Mlung was in general successful, although no quantitative evaluation is carried out due to alack of ground truth. Minor problems were observed with the separation of the left and right regions when theright and the left lung were naturally overlapping. A quality control was carried out, and although no pixelwisemanual corrections were added, some regions (e.g. left/right, anterior/posterior and apical/central/basal) wereinverted due to errors in the “image orientation” DICOM tag.
4.2. Lung tissue classification
The 5–class lung tissue classification reaches a geometric mean of 88.5%, which suggests that the 3D map ofcategorized lung tissue provides an appropriate estimation of both spatial and cardinal distribution of the diseasesto be used for case–based retrieval. Ground glass has the weakest recall of 59.3, and is mixed 22.9 times over100 with fibrosis. This recurrent mistake can be partly explained by the available ground truth: fibrosis patternsalways contain a small percentage of ground glass, due to the redistribution of the perfusion which has beenannotated as fibrosis and thus introduces noise in the training examples. Fibrosis and micronodules have ahigh number of false positives due to their dominant representation in the dataset as SVMs tends to favor largeclasses to maximize global accuracy. Some classification errors appear close to the lung boundary where waveletcoefficients from large scales are influenced by the lung borders.
4.3. Case–based retrieval
The optimal weights found for diagnoses PCP, AIP and COP are most often close to zero. The latter diagnosesare containing a small number of cases (4, 4 and 3 respectively), suggesting that not enough data is availableto have a representative distribution of the abnormal tissue specific to these diagnoses. After analysis of theoptimal weights obtained for the diagnoses in Table 5, justifications could be found for several observations thatare consistent with prior medical knowledge detailed in Table 1 and in Section 1.1.
• Pulmonary fibrosis High weights obtained for central, basal, peripheral and posterior regions all are inaccordance with medical knowledge. According to,13 idiopathic PF is known to have peripheral, basal andsub–pleural predominance in 70% of the cases. Honeycombing HRCT finding is also predominant in thelower lung and posterior zone.
• Tuberculosis Apical regions are promoted by the weighting scheme, which is in accordance with the factthat many cases of cavitary TB, pleural abnormalities represent the sequela of underlaying parenchymaldisease and are apical in location. In addition, micronodules that are characteristic to the miliary TB areeasier to detect in the peripheral region due to smaller and less visible bronchovascular structures.
• Sarcoidosis Upper parts of the lungs are favored by the weighting scheme and is consistent with the expecteddistribution of micronodules with SA that is peribronchovascular in the central lung and upper lobes.
For all diagnoses, peripheral and basal regions are promoted by the system, which is indeed the siege of severalhistological diagnoses of ILDs. It can be observed in Table 6 that the weighting scheme enables to tune thesystem to favor a given disease at a given performance measure.
When compared to global inter–case distance dglobal, region–based retrieval using dlocal clearly improves earlyprecision (P@1) as it can be observed in Table 6. Localized comparisons of the tissue percentages with dlocalhave not the same effect on all diagnoses. It is obvious that dlocal globally improves retrieval performance fordiagnoses SA, PCP and COP. However, only early precision is improved for PF, whereas the dglobal enables betterretrieval when looking at the precision after N > 3 results. For HP, global–based retrieval performs better thanlocal, which can be explained by the fact that the disease has a patchy but diffuse (non–localized) distributionwithin the lung. No clear trend can be deduced for TB. In order to benefit from both approaches, a fusion ofdglobal and dlocal may help to use localization only for the diseases having a characteristic predominance. Beyond

improving the quantitative evaluation of the early retrieval performance, we believe that local retrieval improvesthe quality of the retrieved cases in terms of visual similarity.
It worth noting that no LOPO CV is used to choose the regional weights wr, which may introduce a risk ofoverfitting the data and slightly bias the retrieval performance in Table 6. A risk of inducing false alarms to theradiologists is also present as no control cases are contained in the database and the retrieval system can onlyretrieve positive cases. When interpreting performances in Table 6, it is also important to keep in mind that thelink between visual similarity of two HRCT scans and their associated diagnoses is not straightforward. Finally,a system showing cases that are visually similar but with distinct diagnoses prevents the reader from mixingdiagnoses with similar radiological findings, which is difficult to assess with the quantitative evaluation.
5. CONCLUSIONS
The CBIR approach proposed in this work provides complementary information, from past cases with confirmeddiagnoses, to lung tissue classification and quantification in HRCT. The system exploits the locations of thepathological lung tissue and allows significant improvement in terms of early retrieval precision when comparedto the approach based on global features only. The distribution of the optimal regional weights is in accordancewith medical knowledge. The weighting scheme allows to tune the system by optimizing the retrieval performanceof a given diagnosis at a given performance measure (e.g. P@1, P@10). The limited performance observed forsome of the diagnoses can partially be explained by the fact that the link between visual similarity of twoHRCT scans and their associated diagnoses is not straightforward. The system provides an objective inter–casesimilarity measure enabling advanced browsing in large collections of cases.
Acknowledgments
This work was supported by the Swiss National Science Foundation (FNS) with grants 200020–118638 and205321–130046 as well as the EU 7th Framework Program in the context of the Khresmoi project (FP7–257528).
REFERENCES
1. T. E. King, Approach to the adult with interstitial lung disease: clinical evaluation, UpToDate, Waltham,MA, Denise S. Basow ed., 2010.
2. G. W. Hunninghake, D. A. Lynch, J. R. Galvin, B. H. Gross, N. Muller, D. A. Schwartz, T. E. King, J. P.Lynch, R. Hegele, J. Waldron, T. V. Colby, and J. C. Hogg, “Radiologic Findings Are Strongly AssociatedWith a Pathologic Diagnosis of Usual Interstitial Pneumonia,” Chest 124(4), pp. 1215–1223, 2003.
3. Y. Uchiyama, S. Katsuragawa, H. Abe, J. Shiraishi, F. Li, Q. Li, C.-T. Zhang, K. Suzuki, and K. Doi, “Quan-titative computerized analysis of diffuse lung disease in high–resolution computed tomography,” MedicalPhysics 30, pp. 2440–2454, September 2003.
4. E. A. Hoffman, J. M. Reinhardt, M. Sonka, B. A. Simon, J. Guo, O. Saba, D. Chon, S. Samrah, H. Shikata,J. Tschirren, K. Palagyi, K. C. Beck, and G. McLennan, “Characterization of the interstitial lung disease viadensity–based and texture–based analysis of computed tomography images of lung structure and function,”Academic Radiology 10, pp. 1104–1118, October 2003.
5. I. C. Sluimer, P. F. van Waes, M. A. Viergever, and B. van Ginneken, “Computer–aided diagnosis in highresolution CT of the lungs,” Medical Physics 30, pp. 3081–3090, December 2003.
6. C. Brodley, A. Kak, C. Shyu, J. Dy, L. Broderick, and A. M. Aisen, “Content–based retrieval from medicalimage databases: A synergy of human interaction, machine learning and computer vision,” in Proceedingsof the 10th National Conference on Artificial Intelligence, pp. 760–767, (Orlando, FL, USA), July 1999.
7. A. M. Aisen, L. S. Broderick, H. Winer-Muram, C. E. Brodley, A. C. Kak, C. Pavlopoulou, J. Dy, C.-R.Shyu, and A. Marchiori, “Automated storage and retrieval of thin–section CT images to assist diagnosis:System description and preliminary assessment,” Radiology 228, pp. 265–270, July 2003.
8. C.-R. Shyu, C. E. Brodley, A. C. Kak, A. Kosaka, A. M. Aisen, and L. S. Broderick, “ASSERT: A physician–in–the–loop content–based retrieval system for HRCT image databases,” Computer Vision and Image Un-derstanding 75(1/2), pp. 111–132, 1999.
9. C. R. Shyu, C. E. Brodley, A. C. Kak, A. Kosaka, A. Aisen, and L. Broderick, “Local versus globalfeatures for content–based image retrieval,” in Content–Based Access of Image and Video Libraries, 1998.Proceedings. IEEE Workshop on, pp. 30–34, June 1998.
10. C.-T. Liu, P.-L. Tai, A. Y.-J. Chen, C.-H. Peng, and J.-S. Wang, “A content–based medical teaching fileassistant for CT lung image retrieval,” in Proceedings of the IEEE International Conference on Electronics,Circuits, Systems (ICECS2000), pp. 361–365, (Jouneih–Kaslik, Lebanon), December 2000.
11. Y. Tao, X. S. Zhou, J. Bi, A. Jerebkoa, M. Wolf, M. Salganicoff, and A. Krishnana, “An adaptive knowledge–driven medical image search engine for interactive diffuse parenchymal lung disease quantification,” MedicalImaging 2009: Computer–Aided Diagnosis 7260(1), p. 726007, SPIE, 2009.
12. A. Depeursinge, A. Vargas, A. Platon, A. Geissbuhler, P.-A. Poletti, and H. Muller, “3D case–based retrievalfor interstitial lung diseases,” in MCBR–CDS 2009: Medical Content–based Retrieval for Clinical DecisionSupport, B. Caputo, H. Muller, T. Syeda-Mahmood, J. Kalpathy-Cramer, and J. Duncan, eds., LectureNotes in Computer Science (LNCS), pp. 39–48, Springer, February 2010.
13. W. R. Webb, N. L. Muller, and D. P. Naidich, eds., High-Resolution CT of the Lung, Lippincott Williams& Wilkins, Philadelphia, USA, 2001.
14. C. A. Souza, N. L. Muller, J. Flint, J. L. Wright, and A. Churg, “Idiopathic pulmonary fibrosis: Spectrumof high–resolution CT findings,” American Journal of Roentgenology 185, pp. 1531–1539, December 2005.
15. M. Ujita, E. A. Renzoni, S. Veeraraghavan, A. U. Wells, and D. M. Hansell, “Organizing Pneumonia:Perilobular Pattern at Thin–Section CT,” Radiology 232(3), pp. 757–761, 2004.
16. D. G. Lowe, “Distinctive image features from scale-invariant keypoints,” International Journal of ComputerVision 60(2), pp. 91–110, 2004.
17. H. Muller, User Interaction and Performance Evaluation in Content–Based Visual Information Retrieval.PhD thesis, Computer Vision and Multimedia Laboratory, University of Geneva, Geneva, Switzerland,June 2002.
18. T. Westerveld, “Image retrieval: Content versus context,” in Recherche d’Informations Assistee par Or-dinateur (RIAO’2000) Computer–Assisted Information Retrieval, 1, pp. 276–284, CID, (Paris, France),April 2000.
19. A.Winter and C. Nastar, “Differential feature distribution maps for image segmentation and region queries inimage databases,” in IEEE Workshop on Content–based Access of Image and Video Libraries (CBAIVL’99),pp. 9–17, (Fort Collins, Colorado, USA), 22 1999.
20. J. Zhang, M. Marszalek, S. Lazebnik, and C. Schmid, “Local features and kernels for classification of textureand object categories: A comprehensive study,” in Computer Vision and Pattern Recognition Workshop,2006. CVPRW ’06. Conference on, p. 13, June 2006.
21. W. W. Chu, C.-C. Hsu, A. F. Cardenas, and R. K. Taira, “Knowledge–based image retrieval with spatialand temporal constructs,” IEEE Transactions on Knowledge and Data Engineering 10(6), pp. 872–888,1998.
22. H. Alto, R. Rangayyan, R. Paranjape, J. Desautels, and H. Bryant, “An indexed atlas of digital mam-mograms for computer–aided diagnosis of breast cancer,” Annals of Telecommunications 58, pp. 820–835,2003.
23. C. Le Guillou, J. M. Cauvin, B. Solaiman, M. Robaszkiewicz, and C. Roux, “Knowledge representationand cases indexing in upper digestive endoscopy,” in Engineering in Medicine and Biology Society, 2000.Proceedings of the 22nd Annual International Conference of the IEEE, 1, pp. 9–12, July 2000.
24. H. Wu, J. Kim, W. Cai, and D. D. Feng, “Volume of interest (VOI) feature representation and retrievalof multi–dimensional dynamic positron emission tomography images,” in Intelligent Multimedia, Video andSpeech Processing, 2004. Proceedings of 2004 International Symposium on, pp. 639–642, October 2004.
25. S. Minoshima, R. A. Koeppe, K. A. Frey, and D. E. Kuhl, “Anatomic Standardization: Linear Scaling andNonlinear Warping of Functional Brain Images,” Journal of Nuclear Medicine 35(9), pp. 1528–1537, 1994.
26. S. Batty, J. Clark, T. Fryer, and X. Gao, “Prototype system for semantic retrieval of neurological PETimages,” in Medical Imaging and Informatics, X. Gao, H. Muller, M. Looms, R. Comley, and S. Luo, eds.,Lecture Notes in Computer Science 4987, pp. 179–188, Springer Berlin / Heidelberg, 2008.

27. S.-N. Yu and C.-T. Chiang, “Similarity searching for chest CT images based on object features and spatialrelation maps,” in Engineering in Medicine and Biology Society, 2004. EMBS ’04. 26th Annual InternationalConference of the IEEE, 1, pp. 1298–1301, September 2004.
28. T. Zrimec and I. Lajovic, “A medical image assistant for efficient access to medical images and patientdata,” The Journal on Information Technology in Healthcare 7, pp. 261–271, October 2009.
29. T. Zrimec and J. S. J. Wong, “Improving computer aided disease detection using knowledge of diseaseappearance,” in MEDINFO 2007. Proceedings of the 12th World Congress on Health (Medical) Informatics,Studies in Health Technology and Informatics 129, pp. 1324–1328, IOS Press, August 2007.
30. A. Depeursinge, A. Vargas, A. Platon, A. Geissbuhler, P.-A. Poletti, and H. Muller, “Building a referencemultimedia database for interstitial lung diseases,” Computerized Medical Imaging and Graphics , submitted.
31. M. Unser, “Texture classification and segmentation using wavelet frames,” IEEE Transactions on ImageProcessing 4, pp. 1549–1560, November 1995.
32. A. Depeursinge, D. Van De Ville, A. Platon, A. Geissbuhler, P.-A. Poletti, and H. Muller, “Affine–invarianttexture learning for the characterization of lung tissue in HRCT using isotropic wavelet frames,” IEEETransactions in Medical Imaging , submitted.
33. T. Zrimec, S. Busayarat, and P. Wilson, “A 3D model of the human lung,” in Proceedings of MICCAI 2004,S. LNCS, ed., 3217, pp. 1074–1075, October 2004.
34. D. Aykac, E. A. Hoffman, G. McLennan, and J. M. Reinhardt, “Segmentation and analysis of the humanairway tree from three–dimensional X–ray CT images,” IEEE Transactions on Medical Imaging 22, pp. 940–950, August 2003.
Copyright © 2022 FDOKUMEN