Inhomogeneity of Lung Parenchyma during the Open Lung Strategy: A Computed
11
Dynamics of lung collapse and recruitment during prolonged breathing in porcine lung injury PETER NEUMANN, 1 JAN ERIK BERGLUND, 2 ENRIQUE FERNA ´ NDEZ MONDE ´ JAR, 1 ANDERS MAGNUSSON, 3 AND GO ¨ RAN HEDENSTIERNA 1 Departments of 1 Clinical Physiology, 2 Anesthesiology, and 3 Diagnostic Radiology, University of Uppsala, Uppsala 75185, Sweden Neumann, Peter, Jan Erik Berglund, Enrique Fer- na ´ ndez Monde ´jar, Anders Magnusson, and Go ¨ ran Hedenstierna. Dynamics of lung collapse and recruitment during prolonged breathing in porcine lung injury. J. Appl. Physiol. 85(4): 1533–1543, 1998.—Oleic acid (OA) injection, lung lavage, and endotoxin infusion are three commonly used methods to induce experimental lung injury. The dynamics of lung collapse and recruitment in these models have not been studied, although knowledge of this is desirable to establish ventilatory techniques that keep the lungs open. We mea- sured lung density by computed tomography during breath- holding procedures. Lung injury was induced with OA, lung lavage, or endotoxin in groups of six mechanically ventilated pigs. After a stabilization period, repetitive computed tomog- raphy scans of the same slice were obtained during prolonged expirations with and without positive end-expiratory pres- sure and during prolonged inspirations after 5 and 30 s of expiration. Lung collapse and recruitment occurred mainly within the first 4 s of breath-holding procedures in all three lung injury models, and some collapse and recruitment occurred even within 0.6 s. OA-injured lungs were signifi- cantly more unstable than lungs injured by bronchoalveolar lavage or endotoxin infusion. In this experimental setting, expiration times ,0.6 s are required to avoid cyclic alveolar collapse during mechanical ventilation without extrinsic posi- tive end-expiratory pressure. acute respiratory distress syndrome; computed tomography; lung density THE OPTIMAL VENTILATORY strategy for the treatment of patients with acute respiratory failure is a matter of considerable debate (19). Mechanical ventilation might even be a major cause of deteriorating lung function by the exposure to high pressure and tidal volume (VT), i.e., baro-/volotrauma, and by repeated opening and closing of airways and alveoli (15, 20). A general guideline for the treatment of patients with acute respiratory failure has been proposed as ‘‘open up the lung and keep the lung open’’ (10). In experimental lung injury, this goal can be achieved by applying a ventila- tory mode, which results in a high mean airway pres- sure (Paw, 25 cmH 2 O) (18). Because a high mean Paw increases the risk of baro-/volotrauma (15) and de- presses cardiac performance (18), a different approach to keep the lung open might be justified. Lachmann (10) suggested a choice of ‘‘the absolute time of the expira- tory phase so short that also the stiffest parts of the lung have no time for collapse.’’ However, it is not clear how rapidly lung collapse and recruitment occur during mechanical ventilation and which expiratory and inspi- ratory time intervals should, therefore, be used. The present study investigated the dynamics of lung col- lapse and recruitment during changing Paw with com- puted tomography (CT) in three commonly used models of lung injury: 1 ) oleic acid (OA) injection, which produces a syndrome of acute endothelial and alveolar epithelial cell necrosis resulting in alveolar protein- aceous edema, without an initial inflammatory re- sponse (17), 2 ) repeated lung lavage, which leads to surfactant depletion but causes no morphological dam- age to alveolar or perivascular cells (13), and 3 ) endo- toxin infusion, which causes an inflammatory response with accumulation of granulocytes and lymphocytes in the pulmonary microcirculation and damage to pulmo- nary endothelial cells and leads finally to a protein- aceous edema (2, 3). Because the degree of lung damage might vary with the administered dose of OA or endotoxin and the number of lavages performed, we used the three models as frequently described in the literature but increased the amount of endotoxin to cause macroatelectasis. MATERIAL AND METHODS Study Protocol After approval by the local animal ethics committee, 18 healthy pigs (Hampshire, Yorkshire, and Swedish mixed country breed; 32.2 6 4.0 kg body wt) were anesthetized and mechanically ventilated. Baseline values were obtained after a 30-min stabilization period, then lung injury was induced with OA, lung lavage, or endotoxin infusion (see below). Hemodynamic and ventilatory parameters were measured again after 90 min (OA and lavage) or 180 min (endotoxin), when lung injury was stable. Thereafter, positive end- expiratory pressure (PEEP) was increased from 0 to 10 cmH 2 O to recruit collapsed lung tissue, and hemodynamic and ventilatory measurements were made 45 min after PEEP had been applied. The pigs were transferred to the Depart- ment of Radiology, and repeated CT scans were taken in the same transverse plane of the chest during two different expiratory- and inspiratory-hold procedures. This resulted in a total study period of 6.5–8 h (Fig. 1). Anesthesia Azaperone (40 mg im, Stresnil, Janssen) was given intra- muscularly as premedication before transport of animals from the farm. General anesthesia was induced with atropine (0.04 mg/kg), tiletamin-zolazepam (Zoletil, Reading, Carros, France; 6 mg/kg), and xylazine (Rompun, Bayer, Leverkusen, Germany; 2.2 mg/kg) intramuscularly, then clomethiazole (400 mg/h; Heminevrin, Astra, So ¨derta ¨ lje, Sweden), fentanyl (150 μg/h), and pancuronium bromide (2.5 mg/h) were con- stantly infused for muscle relaxation. Additional fentanyl and pancuronium bromide were given when needed. The animals were tracheotomized and ventilated through a cuffed endotra- cheal tube. 8750-7587/98 $5.00 Copyright r 1998 the American Physiological Society 1533 http://www.jap.org
-
Upload
dukemedschool -
Category
Documents
-
view
5 -
download
0
Transcript of Inhomogeneity of Lung Parenchyma during the Open Lung Strategy: A Computed
Dynamics of lung collapse and recruitmentduring prolonged breathing in porcine lung injury
PETER NEUMANN,1 JAN ERIK BERGLUND,2 ENRIQUE FERNANDEZ MONDEJAR,1ANDERS MAGNUSSON,3 AND GORAN HEDENSTIERNA1
Departments of 1Clinical Physiology, 2Anesthesiology, and 3DiagnosticRadiology, University of Uppsala, Uppsala 75185, Sweden
Neumann, Peter, Jan Erik Berglund, Enrique Fer-nandez Mondejar, Anders Magnusson, and GoranHedenstierna. Dynamics of lung collapse and recruitmentduring prolonged breathing in porcine lung injury. J. Appl.Physiol. 85(4): 1533–1543, 1998.—Oleic acid (OA) injection,lung lavage, and endotoxin infusion are three commonly usedmethods to induce experimental lung injury. The dynamics oflung collapse and recruitment in these models have not beenstudied, although knowledge of this is desirable to establishventilatory techniques that keep the lungs open. We mea-sured lung density by computed tomography during breath-holding procedures. Lung injury was induced with OA, lunglavage, or endotoxin in groups of six mechanically ventilatedpigs. After a stabilization period, repetitive computed tomog-raphy scans of the same slice were obtained during prolongedexpirations with and without positive end-expiratory pres-sure and during prolonged inspirations after 5 and 30 s ofexpiration. Lung collapse and recruitment occurred mainlywithin the first 4 s of breath-holding procedures in all threelung injury models, and some collapse and recruitmentoccurred even within 0.6 s. OA-injured lungs were signifi-cantly more unstable than lungs injured by bronchoalveolarlavage or endotoxin infusion. In this experimental setting,expiration times ,0.6 s are required to avoid cyclic alveolarcollapse during mechanical ventilation without extrinsic posi-tive end-expiratory pressure.
acute respiratory distress syndrome; computed tomography;lung density
THE OPTIMAL VENTILATORY strategy for the treatment ofpatients with acute respiratory failure is a matter ofconsiderable debate (19). Mechanical ventilation mighteven be a major cause of deteriorating lung function bythe exposure to high pressure and tidal volume (VT),i.e., baro-/volotrauma, and by repeated opening andclosing of airways and alveoli (15, 20). A generalguideline for the treatment of patients with acuterespiratory failure has been proposed as ‘‘open up thelung and keep the lung open’’ (10). In experimental lunginjury, this goal can be achieved by applying a ventila-tory mode, which results in a high mean airway pres-sure (Paw, 25 cmH2O) (18). Because a high mean Pawincreases the risk of baro-/volotrauma (15) and de-presses cardiac performance (18), a different approachto keep the lung open might be justified. Lachmann (10)suggested a choice of ‘‘the absolute time of the expira-tory phase so short that also the stiffest parts of thelung have no time for collapse.’’ However, it is not clearhow rapidly lung collapse and recruitment occur duringmechanical ventilation and which expiratory and inspi-ratory time intervals should, therefore, be used. Thepresent study investigated the dynamics of lung col-
lapse and recruitment during changing Paw with com-puted tomography (CT) in three commonly used modelsof lung injury: 1) oleic acid (OA) injection, whichproduces a syndrome of acute endothelial and alveolarepithelial cell necrosis resulting in alveolar protein-aceous edema, without an initial inflammatory re-sponse (17), 2) repeated lung lavage, which leads tosurfactant depletion but causes no morphological dam-age to alveolar or perivascular cells (13), and 3) endo-toxin infusion, which causes an inflammatory responsewith accumulation of granulocytes and lymphocytes inthe pulmonary microcirculation and damage to pulmo-nary endothelial cells and leads finally to a protein-aceous edema (2, 3).
Because the degree of lung damage might vary withthe administered dose of OA or endotoxin and thenumber of lavages performed, we used the three modelsas frequently described in the literature but increasedthe amount of endotoxin to cause macroatelectasis.
MATERIAL AND METHODS
Study Protocol
After approval by the local animal ethics committee, 18healthy pigs (Hampshire, Yorkshire, and Swedish mixedcountry breed; 32.2 6 4.0 kg body wt) were anesthetized andmechanically ventilated. Baseline values were obtained aftera 30-min stabilization period, then lung injury was inducedwith OA, lung lavage, or endotoxin infusion (see below).Hemodynamic and ventilatory parameters were measuredagain after 90 min (OA and lavage) or 180 min (endotoxin),when lung injury was stable. Thereafter, positive end-expiratory pressure (PEEP) was increased from 0 to 10cmH2O to recruit collapsed lung tissue, and hemodynamicand ventilatory measurements were made 45 min after PEEPhad been applied. The pigs were transferred to the Depart-ment of Radiology, and repeated CT scans were taken in thesame transverse plane of the chest during two differentexpiratory- and inspiratory-hold procedures. This resulted ina total study period of 6.5–8 h (Fig. 1).
Anesthesia
Azaperone (40 mg im, Stresnil, Janssen) was given intra-muscularly as premedication before transport of animalsfrom the farm. General anesthesia was induced with atropine(0.04 mg/kg), tiletamin-zolazepam (Zoletil, Reading, Carros,France; 6 mg/kg), and xylazine (Rompun, Bayer, Leverkusen,Germany; 2.2 mg/kg) intramuscularly, then clomethiazole(400 mg/h; Heminevrin, Astra, Sodertalje, Sweden), fentanyl(150 µg/h), and pancuronium bromide (2.5 mg/h) were con-stantly infused for muscle relaxation. Additional fentanyl andpancuronium bromide were given when needed. The animalswere tracheotomized and ventilated through a cuffed endotra-cheal tube.
8750-7587/98 $5.00 Copyright r 1998 the American Physiological Society 1533http://www.jap.org
Ringer acetate (1,000 ml; Pharmacia, Stockholm, Sweden)at body temperature was infused before baseline measure-ments were made; thereafter the aim of fluid replacementwas a constant hemoglobin value and a stable systemicarterial pressure. This resulted in an average infusion rate of10 ml·kg21 ·h21 after the induction of lung injury with lavageand 30–40 ml·kg21 ·h21 after induction of lung injury withOA or endotoxin.
Ventilation
Mechanical ventilation was initiated in a volume-con-trolled mode (Servo 900 C, Siemens Elema, Lund, Sweden)with a constant flow, a rate of 20 breaths/min, an inspiratory-to-expiratory ratio of 1:2, 0 cmH2O PEEP, inspiratory O2fraction of 1.0, and initial VT of 15 ml/kg. VT was thenadjusted to maintain normocapnia (arterial PCO2 5 35–45Torr) guided by end-tidal CO2 monitoring (Capnomac Ultima,Datex Instrumentation, Helsinki, Finland) and intermittentsampling of arterial blood-gas samples (see below). If hyper-capnia developed throughout the study, VT values wereincreased as long as VT was ,15 ml/kg while the respiratoryrate was kept constant. After induction of lung injury and thefollowing stabilization period, PEEP was increased to 10cmH2O. For transportation to the Department of Radiologyand during CT scanning, a Servo 300 ventilator (SiemensElema) was used. The prolonged inspiration and expiration(see below) were performed in the continuous positive airwaypressure (CPAP) ventilation mode, with pressure increasedand decreased manually by changing the CPAP level.
Ventilatory Parameters
For comparison of VT and minute ventilation, the readingsof the ventilator were used. Paw and flow were measured inthe ventilator on the inspiratory side and recorded with apersonal computer for on-line signal processing, with gascompression within the ventilatory circuit taken into account(LabVIEW 3.1 software, C-O Sjoberg Engineering, NationalInstruments). Resistance (Rrs) and static compliance (Crs) ofthe total respiratory system were determined during aninspiratory-hold maneuver (,4 s). Rrs (lung and chest wall)was calculated according to Kochi and co-workers (9) by rapidairway occlusion. Crs was calculated as follows: Crs 5VT/(Pawplat 2 PawEE), where Pawplat and PawEE representplateau Paw and Paw at end expiration, respectively. The
mean of two inspiratory-hold maneuvers was used for statisti-cal evaluation.
Hemodynamics and Gas Exchange
For pressure measurement and arterial blood sampling, an18-gauge catheter was inserted into the left carotid artery,together with a thermistor-tipped fiber-optic catheter (Pulsio-cath 4F FT PV 2024, Pulsion Medical System, Munich,Germany), which was advanced into the descending aorta formeasurements of cardiac output (CO) and extravascular lungwater (EVLW). A Swan-Ganz catheter and an 18-gaugecatheter were introduced into the right external jugular vein.The exact position of catheters was confirmed by pressurerecordings as well as radiologically by means of CT scanning.
Systemic, pulmonary arterial, and central venous pres-sures were displayed on a bedside monitor, together with theoxyhemoglobin saturation (series 7010, Tram, MarquetteElectronics), and recorded with reference to atmosphericpressure at midthoracic level at end expiration. CO andEVLW were determined randomly within the respiratorycycle by injection of 8–10 ml of a double-indicator bolusconsisting of 1 mg/ml indocyanine green (ICG-Pulsion, Pul-sion Medical System) mixed in sterile water (,5–7°C). Thethermistor-tipped fiber-optic catheter in the descending aortadetects the dye- and temperature-dilution curves, and COand EVLW are automatically calculated by a connectedcomputer (Pulsion COLD Z-021, Pulsion Medical System).The mean of triplicate measurements was calculated andused for statistical evaluation. Venous admixture (Qs/QT), O2delivery, and systemic and pulmonary vascular resistanceswere calculated with standard formulas.
Arterial and mixed venous blood samples were analyzed forPO2, PCO2, and O2 saturation with hemoximeters (models ABL300 and OSM 3, Radiometer, Copenhagen, Denmark).
Lung Injury
Lung injury was induced with one of three differentmethods in groups of six animals each
OA edema. OA (Apoteksbolaget, Goteborg, Sweden; 0.1ml/kg suspended in 20 ml isotonic saline) was slowly (over 20min) injected via the central venous catheter. During injec-tion, blood pressure was stabilized with titrated doses ofepinephrine.
Lung lavage. Lavage was performed in a manner similar tothe method described by Lachmann et al. (11) with isotonicsaline at body temperature. Before lavage, PEEP was set to10 cmH2O and VT was raised by ,20%, since an increase ofPEEP and VT during the lavage sequence has been reportedto result in improved hemodynamic stability (13). Saline(1,000 ml) was instilled through the endotracheal tube anddrained out when the O2 saturation had declined to 90%. Theprocedure was repeated 10 times with 5-min intervals be-tween lavages. PEEP and VT were set back to baseline valuesat the end of the lavage procedure.
Endotoxin infusion. The animals received an intravenousinfusion of endotoxin (Escherichia coli lipopolysaccharideO111:B4, Sigma-Aldrich, Stockholm, Sweden) prepared inisotonic saline. A dose of 20 µg·kg21 ·h21 was given, since itwas found to cause lung collapse similar to the other two lunginjury models. This dose was twice as high as the dose usedpreviously, which was shown not to cause macroatelectasis(1). In addition, a bolus dose of 500 µg of endotoxin was given,then the infusion rate was increased to 30 µg·kg21 ·h21 if noincrease in the mean pulmonary arterial pressure occurredwithin the 1st h of infusion.
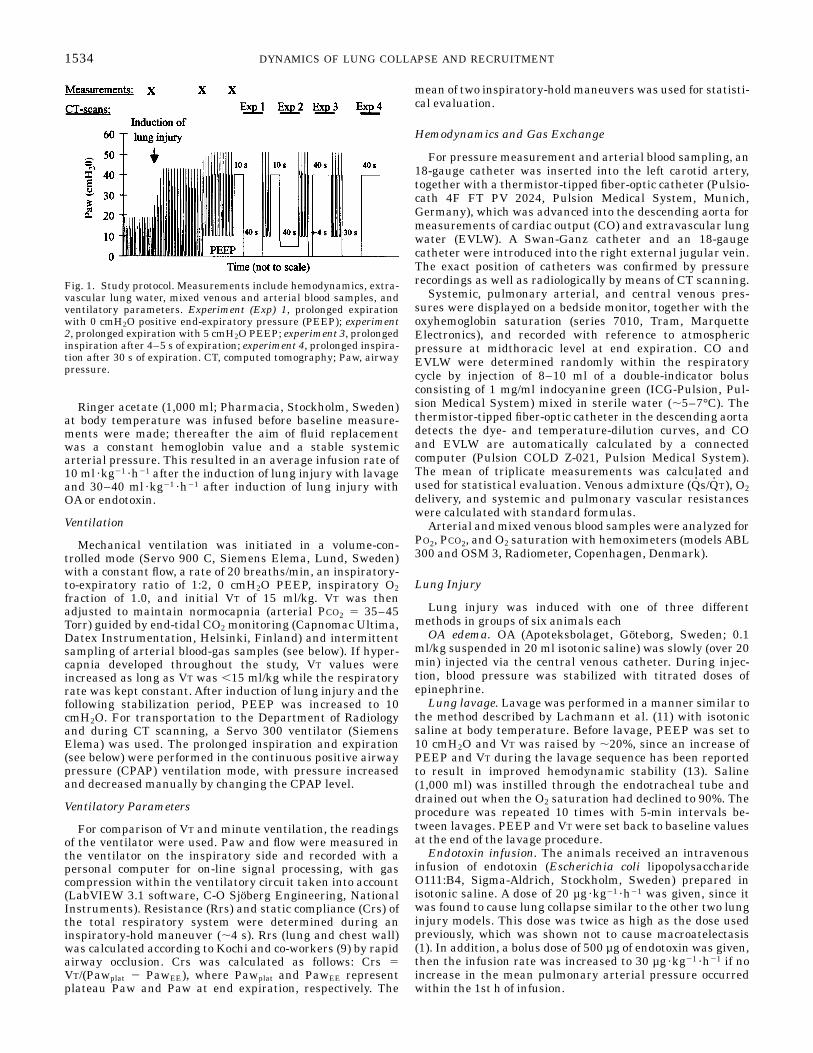
Fig. 1. Study protocol. Measurements include hemodynamics, extra-vascular lung water, mixed venous and arterial blood samples, andventilatory parameters. Experiment (Exp) 1, prolonged expirationwith 0 cmH2O positive end-expiratory pressure (PEEP); experiment2, prolonged expiration with 5 cmH2O PEEP; experiment 3, prolongedinspiration after 4–5 s of expiration; experiment 4, prolonged inspira-tion after 30 s of expiration. CT, computed tomography; Paw, airwaypressure.
1534 DYNAMICS OF LUNG COLLAPSE AND RECRUITMENT

CT
During expiratory and inspiratory breath holding, frontaltopograms and helical CT of the chest were performed with aSomatom Plus 4 (Siemens, Erlangen, Germany) using a512 3 512 matrix, 140 kV, 200 mA, scanning time of 0.75 s,pitch of 1.0, and collimation of 8 mm. Images were recon-structed with an increment of 8 mm to determine thescanning level that resulted in the largest transverse lungarea. This level turned out to be located right above thediaphragm and below the base of the heart in all animals, andit was kept constant during all succeeding experiments byavoiding any movement of the animal or the CT table.Immediately before each experiment, arterial and mixedvenous blood-gas samples were obtained for the calculation ofQs/QT.
Experiment 1: Prolonged Expiration to 0 cmH2O Paw
The ventilatory mode was changed to CPAP, and a 10-sinspiratory hold was performed to recruit collapsed lungtissue, with the CPAP level matching Pawplat during volume-controlled ventilation with 10 cmH2O PEEP. Then, a dynamicserial CT was performed of the same slice with the shortestpossible scanning time of 0.5 s, an interval of 0.3 s betweenscans, 140 kV, and 111 mA for the first 20 images, and fourmore images were obtained with a scanning time of 0.75 s andan interval of 6 s between scans. During the 0.3 s between thefirst and second scan, CPAP was decreased to 0 cmH2O,resulting in a prolonged expiration. The first scan, which wasobtained before the change in CPAP, was used as the refer-ence scan corresponding to end inspiration. With CT, lungdensity is averaged over the whole scanning time. The firstscan obtained after end expiration or end inspiration, there-fore, showed changes corresponding to a time interval of,0.6 s (0.3-s pause 1 1⁄2 scanning time), rather than 0.8 s.
Throughout the maneuver, Paw was measured continu-ously between the endotracheal tube and the Y piece with adifferential pressure transducer (model MPX 2010 DP, Mo-torola, Solna, Sweden). The CT scanner triggered pulses via afiber-optic receiving module (model TORX 173, Toshiba) witheach scan, which were recorded along with Paw. After the lastCT scan, the ventilatory mode was switched back to volume-controlled ventilation with 10 cmH2O PEEP and maintainedfor 15 min before the next experiment started.
Experiment 2: Prolonged Expiration to 5 cmH2O Paw
The procedure described for experiment 1 was repeatedwith 5 cmH2O CPAP during the prolonged expiration.
Experiment 3: Prolonged Inspiration After 4–5 sof Expiration
An expiratory hold was performed with 0 cmH2O PEEP.After 4 s, which is a common expiratory time interval duringmechanical ventilation in humans, the first CT scan wasobtained (0.5 s of scanning time) corresponding to end expira-tion. During the 0.3 s between the first and second scan,CPAP was increased to match the previously recorded Pawplatand maintained for 39 s. The sequence of images wasidentical to that in experiment 1 (see above).
Experiment 4: Prolonged Inspiration After 30 s of Expiration
The inspiratory maneuver (experiment 3) was repeatedafter 30 s of expiration. The prolonged expiration was appliedto allow the lungs to collapse more or less entirely before theinspiration.
Image Analysis
Images were analyzed with the computer software Sienet-Magic View (version VA30A, Siemens).
All transverse CT scans were analyzed by two differentapproaches.
1) The entire left and right lungs were chosen as a region ofinterest (ROI) by drawing the external boundaries of thelungs at the inside of the ribs and the internal boundariesalong the mediastinal organs. The total area of both lungsand its mean density, which has been shown to correlatelinearly with the gas volume of the lungs (8, 21), were determinedby including pixels with density values between 21,000 and1100 Hounsfield units (HU). Selecting a wider range, between21,000 and 11,000 HU, resulted in an increase in the total areaof ,1%. Thereafter, with use of the identical ROI, the area ofpixels with HU in the range 2100 to 1100 representingatelectasis or lung parenchyma with a maximum of 10% gas(7, 12) and the area of pixels with HU between 1100 and2500 representing poorly aerated tissue (lung parenchymawith a maximum of 50% gas) (7) were measured.
2) To analyze differences in regional aeration, six circularROIs, averaging 1.8 6 0.5 cm2, were drawn in the uppermost,ventrolateral, ventromedial, dorsolateral, dorsomedial, andlower dorsal parts of the right lung (Fig. 2). The positions ofthe ROIs were kept constant for each animal to evaluateapproximately the same area in each scan. No adjustmentswere made for the changes in size and shape of the transversescans that occurred with changing lung volumes. The meandensity of each ROI was determined, including pixels withinthe range 21,000 to 1100 HU.
Statistics
Values are means 6 SD. P , 0.05 was chosen as the level ofsignificance. If the same parameter was compared within one
Fig. 2. Schematic drawing of region of interest (ROI) positions.Vertical distance from ventral border of lung parenchyma indicatedby horizontal bar to center of ROI was 1.7 6 0.2 cm for ROI 1(uppermost ROI), 4.8 6 0.5 cm for ROI 2 (ventrolateral ROI), 4.8 60.5 cm for ROI 3 (ventromedial ROI), 8.4 6 0.8 cm for ROI 4(dorsolateral ROI), 8.6 6 0.9 cm for ROI 5 (dorsomedial ROI), and11.4 6 0.9 cm for ROI 6 (lower dorsal ROI). In horizontal plane, ROIs1 and 6 were positioned in midline of right lung. Horizontal distanceto pleural space was 1.5 6 0.2 cm for ROI 2, 4.6 6 0.5 cm for ROI 3,1.5 6 0.2 cm for ROI 4, and 4.8 6 0.7 cm for ROI 5. Differenthorizontal positions of ROIs 4 and 5, as well as different verticalpositions of ROIs 3 and 5, were caused by a main bronchus to lowerlobe, which was avoided when dorsomedial ROI was drawn. SeeFig. 3 for more details.
1535DYNAMICS OF LUNG COLLAPSE AND RECRUITMENT

group of animals (baseline vs. lung injury at 0 cmH2O PEEPvs. lung injury at 10 cmH2O PEEP), a Friedman ANOVA wasapplied, then a Wilcoxon signed rank test was carried out ifsignificant differences were detected. For comparison of pa-rameters between the three different study groups (OA vs.lavage vs. endotoxin) a Kruskal-Wallis analysis was used,then a Mann-Whitney U-test was applied in case of signifi-cant differences. Regression analyses were performed by theleast-squares method. Calculations were made with thesoftware package Statistica on a personal computer.
RESULTS
Baseline Measurements
Ventilatory and hemodynamic parameters were notsignificantly different (P 5 NS) among the three studygroups during baseline readings.All results are summa-rized in Tables 1 and 2.
Lung Injury
Induction of lung injury resulted in significant effectson respiratory mechanics and gas exchange in all threegroups, as shown in Tables 1 and 2. Qs/QT was similarin the OA and lavage groups but was significantlysmaller in the endotoxin group. Gas exchange andmechanics were improved to various extents with 10cmH2O PEEP, with more improvement in the lavagegroup than in the OA group. Moreover, EVLW in-creased in the OA and endotoxin groups and decreasedin the lavage group. Whether the changes were a PEEPeffect per se or whether time also influenced the resultshas not been analyzed.
CT Scans
The mean density of the transverse scans in OA-induced lung injury was significantly greater (P , 0.05)at the end of the inspiration- and expiration-holdprocedures, respectively, than in lavage- or endotoxin-induced lung injury (Table 3). Various amounts ofatelectasis (2100 to 1100 HU) were present preferen-tially in dependent lung areas in all three models oflung injury (Fig. 3).
Experiment 1: Prolonged Expiration to 0 cmH2O Paw
The decrease in Paw was 90 6 5% complete withinthe first 0.5 s of expiration; i.e., Paw fell from 32.3 6 5.3to 3.2 6 0.2 cmH2O at the end of the second CT scan.The changes in mean lung density, poorly aeratedtissue, and atelectasis occurred mainly within the first4 s of a prolonged expiration (Fig. 4). To compare therate of these changes, data were fitted to an exponentialrise function: y 5 y0(1 2 e2t/t), where y0 is the differencein lung density, atelectasis, or poorly aerated tissuebetween the beginning of expiration and infinity, t isthe time constant measured in seconds, and t is time(14) (Fig. 5).
Lung density. The mean density changes averaged264–337 HU (P 5 NS for differences among groups) inthe three groups (Table 3). The t averaged 0.85–1.98 sand were significantly longer (P , 0.05) in the lavagethan in the other two groups (Table 4).
Poorly aerated tissue. Poorly aerated tissue increasedby 25–58% of the total lung area (P , 0.01 for differ-ences among groups; Table 3). The t averaged between0.75 s in the OA group and 1.63 s in the lavage group,but differences among the three groups were not signifi-cant.
Atelectasis. Atelectasis increased by 58% of the totallung area in OA-induced lung injury but only by ,25%in the other two groups (P 5 0.01). The t, however, didnot differ significantly between the OA and the endo-toxin group (2.5–4.5 s), but t was significantly longer(P # 0.05) in the lavage group. In lavage-induced lunginjury, t varied most among individual animals, with aminimum of 4.3 s and a maximum of 40.5 s. If data wereanalyzed excluding the animal with t of 40.5 s, taveraged 16.0 6 8.1 s, and the difference from the othertwo groups was still significant (P , 0.05).
Table 1. Hemodynamic parameters
Parameter Baseline
Lung Injury
0 cmH2O PEEP 10 cmH2O PEEP
MAP, mmHgOA 83.8616.3 82.8613.3 84.0618.8Lavage 94.7613.7 89.7615.7 79.068.3ET 92.5614.7 76.8614.4 81.5618.8
CVP, mmHgOA 5.262.2* 8.263.0* 10.361.9Lavage 6.561.9* 8.362.7* 10.863.2ET 7.262.8 6.862.0* 11.861.8
MPAP, mmHgOA 20.264.6* 41.364.8 40.565.9Lavage 17.762.7* 23.065.4†‡§ 22.363.3‡§ET 16.263.3* 35.863.8* 41.763.5
PCWP, mmHgOA 5.562.3 8.863.5 10.262.5Lavage 6.761.5 7.362.2* 10.863.3ET 7.063.0 8.762.1* 12.261.8
SvO2, %
OA 81.265.7* 47.3613.6* 58.3614.9Lavage 85.664.9* 64.2618.8*† 85.063.5‡§ET 78.764.0* 69.765.3 69.4610.9
CO, l/minOA 4.561.1 5.160.6* 4.161.5Lavage 5.260.6 5.760.5*§ 4.760.7§ET 4.460.4 4.360.7* 3.360.4
SVR, dyn·s ·cm25
OA 1,4746540* 1,1806183* 1,5026265Lavage 1,3476148 1,1446265 1,161690‡ET 1,5726298 1,3276295* 1,7076545
PVR, dyn·s ·cm25
OA 2736121* 513623* 627697Lavage 168635 222683‡§ 198688‡§ET 169674* 5236102* 711662
DO2, ml/minOA 5546175* 4776126 4446131Lavage 668663 6246161 6186127‡§ET 503699 539661* 445653
Values are means 6 SD; n 5 6 in each group. OA, oleic acid; ET,endotoxin; PEEP, positive end-expiratory pressure; MAP, mean arte-rial pressure; CVP, central venous pressure; MPAP, mean pulmonaryarterial pressure; PCWP, pulmonary capillary wedge pressure;SvO2
, mixed venous O2 saturation; CO, cardiac output; SVR, sys-temic vascular resistance; PVR, pulmonary vascular resistance; DO2,O2 delivery. *Significant difference (P,0.05) between adjacent val-ues. Significant difference (by Mann-Whitney U-test) between OAand ET (†), between OA and lavage (‡), and between ET and lavage(§). All P , 0.05.
1536 DYNAMICS OF LUNG COLLAPSE AND RECRUITMENT
Experiment 2: Prolonged Expiration to 5 cmH2O Paw
Paw averaged 7.6 6 0.9 cmH2O at the end of thesecond CT scan.
Lung density. The mean lung density increased lessat 5 than at 0 cmH2O PEEP in all three groups (P ,0.05 for differences between 0 and 5 cmH2O PEEP). Thet was significantly longer with PEEP than withoutPEEP in the OA group but was unaffected by PEEP inthe endotoxin group and decreased significantly in thelavage group (Table 4).
Poorly aerated tissue. The amount of poorly aeratedtissue increased less with 5 than with 0 cmH2O PEEP,but this was only significant (P , 0.05) in the lavageand endotoxin group. The t with and without PEEPwere similar in lavage- and endotoxin-induced lung
injury but increased significantly with 5 cmH2O PEEPin the OA group.
Atelectasis. PEEP reduced atelectasis formation sig-nificantly compared with no PEEP in all groups, withthe greatest reduction in lavage-induced lung injury.The t increased in the OA group (P , 0.05) but was notsignificantly altered in the other two groups. In lavage-induced lung injury, t was significantly longer than inthe endotoxin group (P , 0.05), whereas the differencefrom OA-induced lung injury reached only borderlinesignificance (P 5 0.055).
Experiment 3: Prolonged Inspiration After 4–5 sof Expiration
Paw averaged 30 6 4 cmH2O at the end of the secondCT scan; thus the Paw increase was .90% completewithin 0.5 s. Atelectasis, poorly aerated tissue, andlung density decreased most within the first 4 s ofinspiration (Fig. 6), but compared with experiment 1the changes in lung density and atelectasis were smallerin all three groups (Table 3). The amount of poorlyaerated tissue changed to a similar degree in experi-ments 1 and 3.
To compare the rate of these changes, data werefitted to exponential decay curves as y 5 y0e2t/t, and tvalues were compared (Fig. 7).
The t was generally shorter during prolonged inspira-tion than during expiration in lavage- and endotoxin-induced lung injury (Table 4). However, in OA-inducedlung injury, the mean density and poorly aerated tissuechanged more slowly during inspiration than duringexpiration (P , 0.05).
Experiment 4: Prolonged Inspiration After 30 sof Expiration
Only five animals with OA-induced lung injury areincluded in the analysis of this experiment, because oneanimal died after the inspiratory hold of experiment 3.
After the 30-s expiration, the changes in lung densityand atelectasis were significantly larger (P , 0.05)during inspiration in all three groups than during the5-s expiration of experiment 3 (Table 3). The t valuesincreased after the prolonged expiration in OA-inducedlung injury but were unchanged in the other two lunginjury models (Table 4).
Regional aeration. At the end of a prolonged expira-tion, the mean density of the ROIs was linearly corre-lated to their vertical position [mean density 5 66.46 3cm(2687), where cm denotes the distance to the top ofthe lung; r 5 0.99, P , 0.001 for 0 cmH2O PEEP]. At 5cmH2O PEEP, there was a parallel shift of the regres-sion line, indicating an equal increase in aeration at allvertical levels with significant decreases in lung den-sity in five of the six ROIs [mean density 5 65.78 3cm(2747); r 5 0.99, P , 0.001 for 5 cmH2O PEEP]. Atthe end of a prolonged inspiration, the relationshipbetween vertical position and lung density of an ROIwas best described by a quadratic regression curve (r 50.96, P 5 0.004 for experiment 3) with insignificantdifferences between experiments 3 and 4. In horizontal
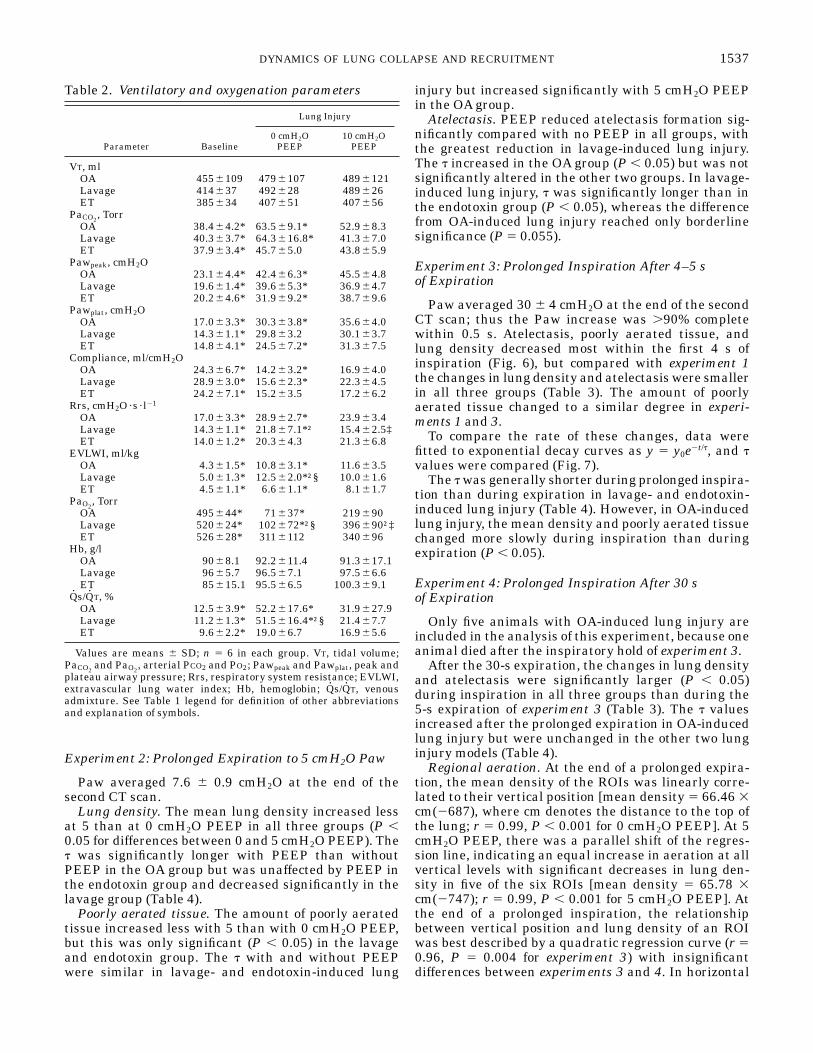
Table 2. Ventilatory and oxygenation parameters
Parameter Baseline
Lung Injury
0 cmH2OPEEP
10 cmH2OPEEP
VT, mlOA 4556109 4796107 4896121Lavage 414637 492628 489626ET 385634 407651 407656
PaCO2, Torr
OA 38.464.2* 63.569.1* 52.968.3Lavage 40.363.7* 64.3616.8* 41.367.0ET 37.963.4* 45.765.0 43.865.9
Pawpeak, cmH2OOA 23.164.4* 42.466.3* 45.564.8Lavage 19.661.4* 39.665.3* 36.964.7ET 20.264.6* 31.969.2* 38.769.6
Pawplat, cmH2OOA 17.063.3* 30.363.8* 35.664.0Lavage 14.361.1* 29.863.2 30.163.7ET 14.864.1* 24.567.2* 31.367.5
Compliance, ml/cmH2OOA 24.366.7* 14.263.2* 16.964.0Lavage 28.963.0* 15.662.3* 22.364.5ET 24.267.1* 15.263.5 17.266.2
Rrs, cmH2O·s · l21
OA 17.063.3* 28.962.7* 23.963.4Lavage 14.361.1* 21.867.1*† 15.462.5‡ET 14.061.2* 20.364.3 21.366.8
EVLWI, ml/kgOA 4.361.5* 10.863.1* 11.663.5Lavage 5.061.3* 12.562.0*†§ 10.061.6ET 4.561.1* 6.661.1* 8.161.7
PaO2, Torr
OA 495644* 71637* 219690Lavage 520624* 102672*†§ 396690†‡ET 526628* 3116112 340696
Hb, g/lOA 9068.1 92.2611.4 91.3617.1Lavage 9665.7 96.567.1 97.566.6ET 85615.1 95.566.5 100.369.1
Qs/QT, %OA 12.563.9* 52.2617.6* 31.9627.9Lavage 11.261.3* 51.5616.4*†§ 21.467.7ET 9.662.2* 19.066.7 16.965.6
Values are means 6 SD; n 5 6 in each group. VT, tidal volume;PaCO2
and PaO2, arterial PCO2 and PO2; Pawpeak and Pawplat, peak and
plateau airway pressure; Rrs, respiratory system resistance; EVLWI,extravascular lung water index; Hb, hemoglobin; Qs/QT, venousadmixture. See Table 1 legend for definition of other abbreviationsand explanation of symbols.
1537DYNAMICS OF LUNG COLLAPSE AND RECRUITMENT

planes (ventrolateral vs. ventromedial ROI and dorso-lateral vs. dorsomedial ROI), both medially locatedROIs had slightly higher attenuation values duringinspiration and expiration. Thus aeration was better inthe lateral aspects of the lung.
The smallest lung density changes (average 60–109HU for the 3 groups combined, P , 0.01 compared withall other ROIs) occurred in the uppermost ROI (ROI 1in Fig. 2). In 7 of the 18 animals, lung density evendecreased slightly in ROI 1 during the first 4 s ofexpiration with 0 cmH2O PEEP and in 5 animalsduring expiration with 5 cmH2O PEEP, rather thanincreased, as might have been expected. In the ventro-lateral and ventromedial ROIs, density changes aver-aged 170–296 HU, which was significantly less than inthe dorsolateral and dorsomedial ROIs (325–450 HU).There were no significant differences between the den-sity changes of the lateral and medial ROIs. In thelower dorsal ROI the density differences between endexpiration and end inspiration averaged 275–373 HU.Thus ventilation was largest in the dorsal parts of thelung. Among the three study groups, significant differ-ences in the density changes occurred only in theuppermost ROI.
Radiological findings and Qs/QT. In the groups ofOA- and lavage-induced lung injury, Qs/QT was linearlycorrelated with the percent area of atelectasis at endinspiration (r 5 0.87, P 5 0.024 and r 5 0.82, P 5 0.048,respectively). In the endotoxin group, no such correla-tion was found. There was no significant correlationbetween Qs/QT and CT findings at end expiration.
DISCUSSION
Lung collapse and reopening occurred within thefirst seconds of an expiratory- and inspiratory-holdprocedure in OA-, lavage-, and endotoxin-induced lunginjury in pigs. The amount of lung collapse and reopen-ing, however, varied considerably among the threedifferent types of lung injury used in the present study.OA caused significantly more atelectasis than the othertwo lung injury models, and the rate of collapse was
similar and higher in OA- and endotoxin-induced lunginjury than in lavage-induced lung injury. Thus, in thepresent study, OA injection produced the most unstablelung. The degree of lung damage, however, might varywith the administered dose of OA or endotoxin and thenumber of lavages performed. Therefore, we used thethree models as frequently described in the literaturebut increased the amount of endotoxin to cause macroat-electasis. Saline recovered from the lungs at the end ofthe repeated lavages was nearly clear. This indicatedthat surfactant was almost completely removed by ourlavage procedure, so that no further lung damage wasexpected from additional lung lavages.
Methodological Aspects
CT scans were obtained at a constant scanning levelrelative to the spine. However, the position of thediaphragm changes with respiration. Thus the lungparenchyma scanned during the course of a prolongedbreath was not exactly the same. An uneven craniocau-dal distribution of the lung damage could thereforeinfluence our results. The lung density of transversescans located immediately above the diaphragm and1.6 cm more cranially differed by 19.6 6 11.4 HU at endexpiration and 27.8 6 18.5 HU at end inspiration, andno significant correlation was found between the levelof CT cuts through the lung and mean lung density atend expiration or end inspiration. Therefore, a system-atic influence on our results by scanning different lungtissue during prolonged breathing seems unlikely.
At end expiration the lung area in the transversescans was 16.7 6 5.4 cm2 (10.5 6 3.3% of lung area atend inspiration) smaller than at end inspiration, asdetermined in experiment 1. Thus, even without achange in the amount of collapsed lung tissue, wewould have determined an ,10% change in atelectasisand poorly aerated tissue in our experiments as aconsequence of the varying lung area. This effect,however, is small, considering an increase in atelectasisbetween 214 and 841% and an increase in poorlyaerated tissue between 40 and 290% in experiment 1.
Table 3. Static computed tomography data
Parameter
Experiment 1 Experiment 2 Experiment 3 Experiment 4
Inspiration Expiration Inspiration Expiration Inspiration Expiration Inspiration Expiration
Mean density, HUOA 2452632 2153644 2457631 2190642 2459626 2190638 2456633 2157643Lavage 2627636†‡ 2290689†‡ 2631640†‡ 2408679†‡ 2635642†‡ 2348664‡ 2631645†‡ 2322682†‡ET 2597674 23336151 2592672 23916132 2590664 23536126 2608664 23316142
Atelectasis, %OA 6.862.8 64611 6.262.7 5768 5.862.4 5568 6.363.4 6268Lavage 4.463.4§ 32616†‡ 3.962.6§ 16611†‡ 3.963.8§ 1868†‡ 4.565.2 28614†‡ET 10.564.7 33622 10.464.8 26616 10.665.6 27615 10.965.3 29619
Poorly aerated tissue, %OA 6267 8765 5968 8265 5968 8565 6069 8665Lavage 2065†‡ 78615 1965†‡ 60613†‡ 1967†‡ 7169‡ 2068†‡ 73611ET 3069 67619 28610 56620 2768 64619 2566 60619
Values are means 6 SD. Experiment 1, expiration to 0 cmH2O PEEP; experiment 2, expiration to 5 cmH2O PEEP; experiment 3, inspirationafter 4–5 s of expiration; experiment 4, inspiration after 30 s of expiration. See Table 1 legend for definition of abbreviations and explanation ofsymbols.
1538 DYNAMICS OF LUNG COLLAPSE AND RECRUITMENT
For evaluation of separate lung regions, the positionsof the ROIs were kept constant for each animal. How-ever, when the shape of the lungs changed duringinspiration and expiration, fixed ROI positions meanthat the same lung tissue was not scanned. The ROIsmoved slightly (usually ,0.5 cm) in a ventrolateraldirection within the thorax during expiration, and
attenuation numbers increased with the distance fromthe ventral lung border (average 66.5 HU/cm). Thismight have caused an underestimation of the measureddensity changes and may have contributed to theparadoxical decrease of lung density in the uppermostROI during the beginning of expiration in some ani-mals.
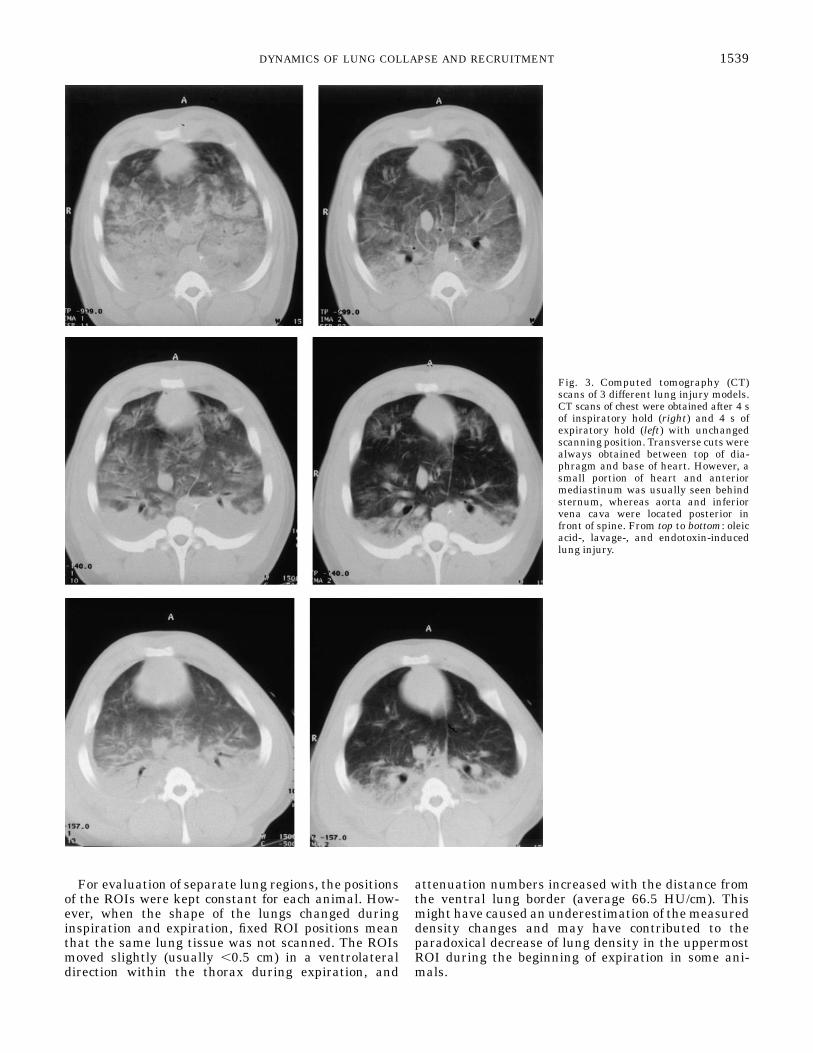
Fig. 3. Computed tomography (CT)scans of 3 different lung injury models.CT scans of chest were obtained after 4 sof inspiratory hold (right) and 4 s ofexpiratory hold (left) with unchangedscanning position. Transverse cuts werealways obtained between top of dia-phragm and base of heart. However, asmall portion of heart and anteriormediastinum was usually seen behindsternum, whereas aorta and inferiorvena cava were located posterior infront of spine. From top to bottom: oleicacid-, lavage-, and endotoxin-inducedlung injury.
1539DYNAMICS OF LUNG COLLAPSE AND RECRUITMENT
Intrathoracic blood volume decreases with an in-crease in mean Paw (13). It is therefore likely thatchanges in the filling of pulmonary blood vessels duringinspiration and expiration maneuvers have influencedthe density changes of the lung. This may not have
affected the three study groups to the same extent,since the proportion of alveolar pressure transmitted tothe pulmonary vessels is affected by the compliance ofthe respiratory system. The highest compliance wasfound in lavage-induced lung injury. Consequently, the
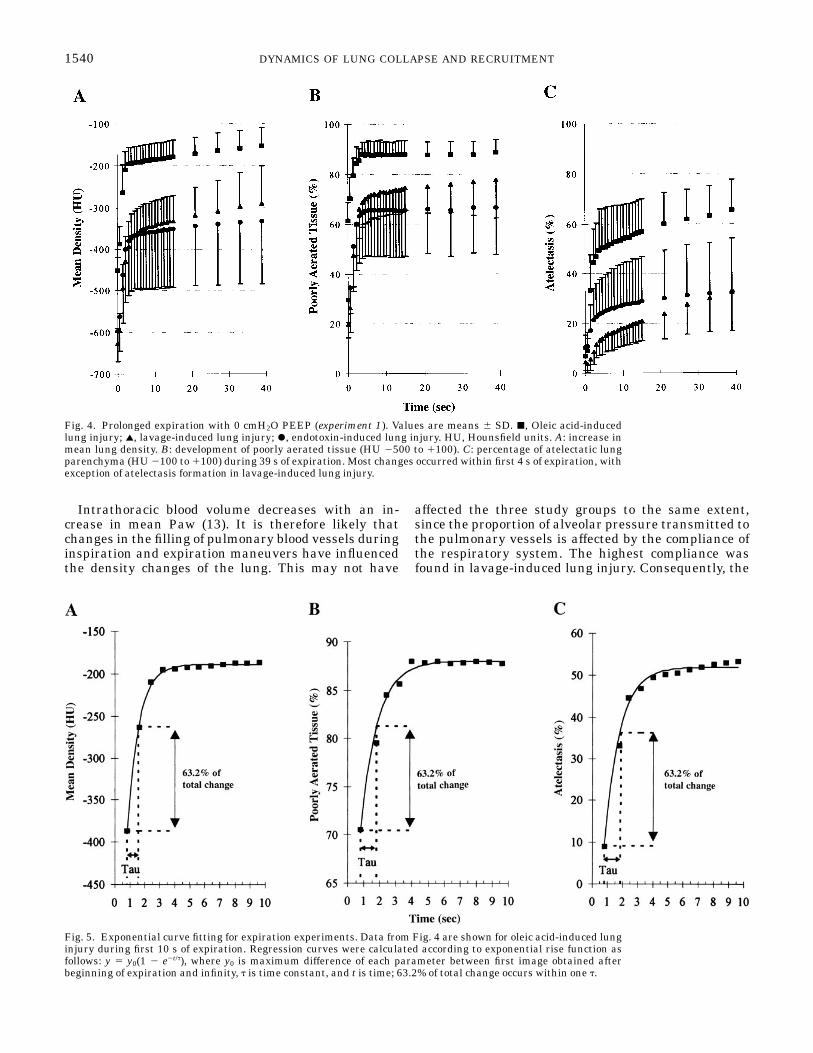
Fig. 4. Prolonged expiration with 0 cmH2O PEEP (experiment 1). Values are means 6 SD. j, Oleic acid-inducedlung injury; l, lavage-induced lung injury; r, endotoxin-induced lung injury. HU, Hounsfield units. A: increase inmean lung density. B: development of poorly aerated tissue (HU 2500 to 1100). C: percentage of atelectatic lungparenchyma (HU 2100 to 1100) during 39 s of expiration. Most changes occurred within first 4 s of expiration, withexception of atelectasis formation in lavage-induced lung injury.
Fig. 5. Exponential curve fitting for expiration experiments. Data from Fig. 4 are shown for oleic acid-induced lunginjury during first 10 s of expiration. Regression curves were calculated according to exponential rise function asfollows: y 5 y0(1 2 e2t/t), where y0 is maximum difference of each parameter between first image obtained afterbeginning of expiration and infinity, t is time constant, and t is time; 63.2% of total change occurs within one t.
1540 DYNAMICS OF LUNG COLLAPSE AND RECRUITMENT
velocity of recruitment and atelectasis formation mighthave been overestimated in this group relative to theother two lung injury models.
Ventilation with fraction of inspired O2 of 1.0, whichwas necessary to avoid severe hypoxia during ventila-tion without PEEP and during breath holding, has beenshown to facilitate atelectasis formation (16) and mayhave influenced the relationship of inspiratory to expi-ratory time constants.
These methodological aspects must be kept in mindwhen the results of the present study are interpreted.
Implications
Lung density increased nearly linearly with thevertical distance from the ventral lung border at endexpiration and increased curvilinearly with verticaldistance at end inspiration. This finding might be
explained by different inflation mechanisms and de-grees of recruitment (4): in the uppermost ROI, inspira-tion caused mainly distension of already air-filled al-veoli. In the lower dorsal ROI, decreasing lung densityindicated predominantly recruitment, and in the middleparts of the lung (ROIs 2–5 in Fig. 2), density decreasedprobably because of alveolar distension and recruit-ment.
The mean lung density changes decreased signifi-cantly when 5 cmH2O PEEP was applied (Table 4) butdiffered only insignificantly among the three lunginjury models. Inasmuch as gas volume correlateslinearly with lung density (8, 21), t values calculatedfor the density changes should be related to the lung tvalues calculated as compliance 3 resistance. However,no significant correlation was obtained between theseparameters. This emphasizes that a changing lung
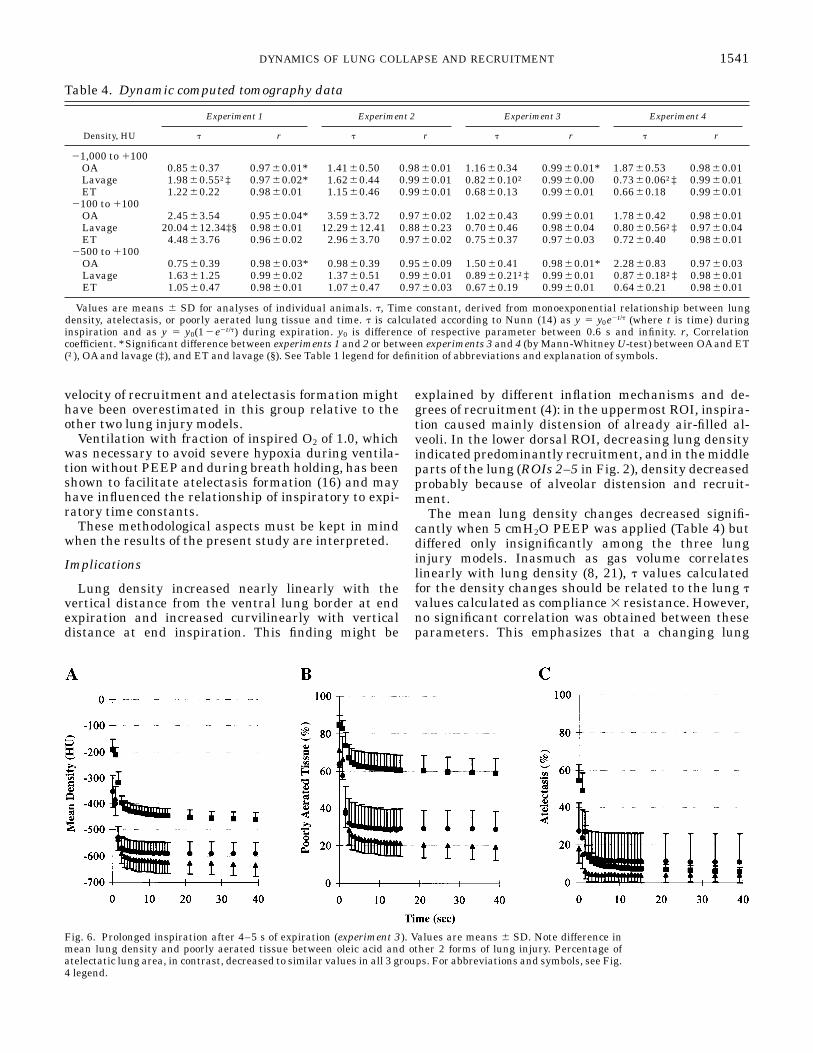
Fig. 6. Prolonged inspiration after 4–5 s of expiration (experiment 3). Values are means 6 SD. Note difference inmean lung density and poorly aerated tissue between oleic acid and other 2 forms of lung injury. Percentage ofatelectatic lung area, in contrast, decreased to similar values in all 3 groups. For abbreviations and symbols, see Fig.4 legend.
Table 4. Dynamic computed tomography data
Density, HU
Experiment 1 Experiment 2 Experiment 3 Experiment 4
t r t r t r t r
21,000 to 1100OA 0.8560.37 0.9760.01* 1.4160.50 0.9860.01 1.1660.34 0.9960.01* 1.8760.53 0.9860.01Lavage 1.9860.55†‡ 0.9760.02* 1.6260.44 0.9960.01 0.8260.10† 0.9960.00 0.7360.06†‡ 0.9960.01ET 1.2260.22 0.9860.01 1.1560.46 0.9960.01 0.6860.13 0.9960.01 0.6660.18 0.9960.01
2100 to 1100OA 2.4563.54 0.9560.04* 3.5963.72 0.9760.02 1.0260.43 0.9960.01 1.7860.42 0.9860.01Lavage 20.04612.34‡§ 0.9860.01 12.29612.41 0.8860.23 0.7060.46 0.9860.04 0.8060.56†‡ 0.9760.04ET 4.4863.76 0.9660.02 2.9663.70 0.9760.02 0.7560.37 0.9760.03 0.7260.40 0.9860.01
2500 to 1100OA 0.7560.39 0.9860.03* 0.9860.39 0.9560.09 1.5060.41 0.9860.01* 2.2860.83 0.9760.03Lavage 1.6361.25 0.9960.02 1.3760.51 0.9960.01 0.8960.21†‡ 0.9960.01 0.8760.18†‡ 0.9860.01ET 1.0560.47 0.9860.01 1.0760.47 0.9760.03 0.6760.19 0.9960.01 0.6460.21 0.9860.01
Values are means 6 SD for analyses of individual animals. t, Time constant, derived from monoexponential relationship between lungdensity, atelectasis, or poorly aerated lung tissue and time. t is calculated according to Nunn (14) as y 5 y0e2t/t (where t is time) duringinspiration and as y 5 y0(12e2t/t) during expiration. y0 is difference of respective parameter between 0.6 s and infinity. r, Correlationcoefficient. *Significant difference between experiments 1 and 2 or between experiments 3 and 4 (by Mann-Whitney U-test) between OA and ET(†), OA and lavage (‡), and ET and lavage (§). See Table 1 legend for definition of abbreviations and explanation of symbols.
1541DYNAMICS OF LUNG COLLAPSE AND RECRUITMENT

density does not reflect exclusively a changing aerationbut also, for example, different filling of pulmonaryblood vessels. The t values for mean density changeswere significantly shorter during inspiration than dur-ing expiration (experiments 1 and 3) in the lavage andendotoxin groups. Thus lung opening occurred fasterthan lung collapse in these groups. This difference wasmore pronounced in the lavage group, which also hadthe most favorable response to PEEP in terms of gasexchange, respiratory mechanics (Table 2), and lungdensity (Table 3). In OA-induced lung injury, in con-trast, lung density increased significantly faster duringexpiration than it decreased during inspiration (Table4). This may suggest a progressive collapse of the lungbreath by breath, if the same time intervals are used forinspiration and expiration.
At the beginning of an expiration a short delayoccurred (Fig. 4) before atelectasis started to increaserapidly. This was most obvious in lavage-induced lunginjury. During the first 4 s in OA- and endotoxin-induced lung injury, 60–70% of the total increase inatelectasis took place, but only ,30% occurred in thelavage model. Repeated lavages lead to surfactantdepletion without morphological changes in alveolar orperivascular cells (13), whereas OA (17) and endotoxin(1–3) damage pulmonary endothelial cells, leading to aproteinaceous edema. Thus lung collapse may only inpart be attributed to depletion or inactivation of surfac-tant. In addition, OA injection causes alveolar epithe-lial cell necrosis with intra-alveolar edema (17), whichexplains why more atelectasis occurred in this lunginjury model than in endotoxin-induced lung injury.Loss of the alveolar epithelial barrier might havecaused rapid replacement of air with fluid, whichcannot be distinguished from alveolar collapse in CTscans.
The finding that 5 cmH2O PEEP decreased, ratherthan increased, t for atelectasis formation in lavage-and endotoxin-induced lung injury was unexpected,since 5 cmH2O PEEP reduced the amount of atelectasissignificantly in all three groups. However, 5 cmH2OPEEP might have preferentially stabilized lung areasthat were only moderately unstable and collapsedslowly. If those lung areas were more common inlavage- and endotoxin-induced lung injury than in theOA group, the different effect of PEEP on t in the threestudy groups would be explained.
Within 4 s of expiration, 80–90% of the conversionfrom normally aerated to poorly aerated lung tissueoccurred and vice versa during the first 4 s of inspira-tion (Figs. 4 and 6). Thus lung parenchyma, whichremains expanded during expiration or partially col-lapsed during inspiration within this time period, isunlikely to change between these two states, evenduring a longer breath-holding procedure. However,during expiration, lung density and atelectasis, whichare included in our definition of poorly aerated tissue,increased further after the amount of poorly aeratedtissue was stable. This shows that poorly aerated tissuechanged toward a more collapsed state throughoutprolonged expiration.
Conclusion
Lung collapse and reopening occurred rapidly withinthe first seconds during breath-holding procedures inpigs with OA-, lavage- and endotoxin-induced lunginjury. To completely avoid cyclic alveolar collapseduring mechanical ventilation without extrinsic PEEPwould therefore require short expiration times of ,0.6 sin this experimental setting. Such a ventilatory pat-tern, however, would certainly lead to a high intrinsic
Fig. 7. Exponential curve fitting during inspiration experiments. Data from Fig. 6 are shown for lavage-inducedlung injury. Regression curves were fit according to exponential decay function as follows: y 5 y0e2t/t. For furtherdetails, see Fig. 5.
1542 DYNAMICS OF LUNG COLLAPSE AND RECRUITMENT
PEEP and a high mean Paw. Thus it is questionablewhether it offers any advantage over a ventilatorypattern that stabilizes the lung with extrinsic PEEP.
OA-injured lungs collapsed to a greater extent andsignificantly faster than did lungs damaged by endo-toxin infusion or bronchoalveolar lavage. This might beof importance in studies comparing different ventila-tory strategies for the treatment of acute respiratoryfailure.
We thank Eva-Maria Hedin, Anne Abrahamson, Agneta Roneus,and the X-ray laboratory team (Marianne Almgren, Ann Erikson, andEwa Larsson) for skillful technical help.
This study was supported by Swedish Medical Research CouncilGrant 5315 and grants from the Swedish Heart-Lung Foundationand the Datex-Engstrom Company. E. F. Mondejar was supported bya grant from the Fondo de Investigaciones Sanitarias de la SeguridadSocial (Spain).
The investigation was performed in the experimental laboratoriesof the Department of Clinical Physiology and in the Department ofDiagnostic Radiology at the University Hospital of Uppsala.
Address for reprint requests: G. Hedenstierna, Dept. of ClinicalPhysiology, University of Uppsala, S-75185 Uppsala, Sweden.
Received 2 September 1997; accepted in final form 3 June 1998.
REFERENCES
1. Borg, T., A. Alvfors, B. Gerdin, and J. Modig. A porcine modelof early adult respiratory distress syndrome induced by endotox-aemia. Acta Anaesthesiol. Scand. 29: 814–830, 1985.
2. Brigham, K. L., and B. Meyrick. Endotoxin and lung injury.Am. Rev. Respir. Dis. 133: 913–927, 1986.
3. Frevert, C. W., and A. E. Warner. Respiratory distress result-ing from acute lung injury in the veterinary patient. J. Vet.Intern. Med. 6: 154–165, 1992.
4. Gattinoni, L., L. D’Andrea, P. Pelosi, G. Vitale, A. Pesenti,and R. Fumagalli. Regional effects and mechanism of positiveend-expiratory pressure in early adult respiratory distress syn-drome. JAMA 269: 2122–2127, 1993.
5. Gattinoni, L., P. Pelosi, S. Crotti, and F. Valenza. Effects ofpositive end-expiratory pressure on regional distribution of tidalvolume and recruitment in adult respiratory distress syndrome.Am. J. Respir. Crit. Care Med. 151: 1807–1814, 1995.
6. Gattinoni, L., P. Pelosi, A. Pesenti, L. Brazzi, G. Vitale, A.Moretto, A. Crespi, and M. Tagliabue. CT scan in ARDS:clinical and physiopathological insights. Acta Anaesthesiol. Scand.Suppl. 95: 87–94, 1991.
7. Gattinoni, L., A. Pesenti, M. Bombino, S. Baglioni, M.Rivolta, F. Rossi, G. Rossi, R. Fumagalli, R. Marcolin, D.
Mascheroni, and A. Torresin. Relationship between lungcomputed tomographic density, gas exchange and PEEP in acuterespiratory failure. Anesthesiology 69: 824–832, 1988.
8. Gattinoni, L., A. Presenti, A. Torresin, S. Baglioni, M.Rivolta, F. Rossi, F. Scarani, R. Marcolin, and G. Capelletti.Adult respiratory distress syndrome profiles by computed tomog-raphy. J. Thorac. Imaging 1: 25–30, 1986.
9. Kochi, T., S. Okubo, W. A. Zin, and J. Milic-Emili. Flow andvolume dependence of pulmonary mechanics in anesthetizedcats. J. Appl. Physiol. 64: 441–450, 1988.
10. Lachmann, B. Open up the lung, and keep the lung open.Intensive Care Med. 18: 319–321, 1992.
11. Lachmann, B., B. Robertson, and J. Vogel. In vivo lunglavage as an experimental model of the respiratory distresssyndrome. Acta Anaesthesiol. Scand. 24: 231–236, 1980.
12. Lundquist, H., G. Hedenstierna, A. Strandberg, L. Tokics,and B. Brismar. CT-assessment of dependent lung densities inman during general anaesthesia. Acta Radiol. 36: 626–632,1995.
13. Nielsen, J. B., U. H. Sjostrand, E. L. Edgren, M. Lichtwarck-Aschoff, and B. A. Svensson. An experimental study of differ-ent ventilatory modes in piglets in severe respiratory distressinduced by surfactant depletion. Intensive Care Med. 17: 225–233, 1991.
14. Nunn, J. F. Nunn’s Applied Respiratory Physiology. Oxford, UK:Butterworth Heinemann, 1993, p. 586–593.
15. Pelosi, P., and L. Gattinoni. Mechanical ventilation in adultrespiratory distress syndrome: a good friend or a secret killer?Curr. Opin. Anaesthesiol. 9: 515–523, 1996.
16. Rothen, H. U., B. Sporre, G. Engberg, G. Wegenius, M.Hogman, and G. Hedenstierna. Influence of gas compositionon recurrence of atelectasis after a reexpansion maneuver duringgeneral anesthesia. Anesthesiology 82: 832–842, 1995.
17. Schuster, D. P. ARDS: clinical lessons from the oleic acid modelof acute lung injury. Am. J. Respir. Crit. Care Med. 149: 245–260,1994.
18. Sjostrand, U., H., M. Lichtwarck-Aschoff, J. B. Nielsen, A.Markstrom, A. Larsson, B. A. Svensson, G. A. Wegenius,and K. A. Nordgren. Different ventilatory approaches to keepthe lung open. Intensive Care Med. 21: 310–318, 1995.
19. Sydow, M., and H. Burchardi. Inverse ratio ventilation andairway pressure release ventilation. Curr. Opin. Anaesthesiol. 9:523–528, 1996.
20. Sykes, M. K. Does mechanical ventilation damage the lung?Acta Anaesthesiol. Scand. Suppl. 95: 35–38, 1991.
21. Wegenius, G. A., U. H. Sjostrand, B. A. Svensson, M. Licht-warck-Aschoff, A. M. Markstrom, and A. K. Nordgren.Radiological assessment of surfactant depletion lung injury.Appl. Cardiopulm. Pathophysiol. 6: 119–129, 1996.
1543DYNAMICS OF LUNG COLLAPSE AND RECRUITMENT