Analysis of an Experimental Space Debris Removal Mission
93
Air Force Institute of Technology AFIT Scholar eses and Dissertations Student Graduate Works 6-15-2017 Analysis of an Experimental Space Debris Removal Mission Krista L.L. Roth Follow this and additional works at: hps://scholar.afit.edu/etd Part of the Astrodynamics Commons , and the Space Vehicles Commons is esis is brought to you for free and open access by the Student Graduate Works at AFIT Scholar. It has been accepted for inclusion in eses and Dissertations by an authorized administrator of AFIT Scholar. For more information, please contact richard.mansfield@afit.edu. Recommended Citation Roth, Krista L.L., "Analysis of an Experimental Space Debris Removal Mission" (2017). eses and Dissertations. 1701. hps://scholar.afit.edu/etd/1701
-
Upload
khangminh22 -
Category
Documents
-
view
0 -
download
0
Transcript of Analysis of an Experimental Space Debris Removal Mission

Air Force Institute of TechnologyAFIT Scholar
Theses and Dissertations Student Graduate Works
6-15-2017
Analysis of an Experimental Space Debris RemovalMissionKrista L.L. Roth
Follow this and additional works at: https://scholar.afit.edu/etd
Part of the Astrodynamics Commons, and the Space Vehicles Commons
This Thesis is brought to you for free and open access by the Student Graduate Works at AFIT Scholar. It has been accepted for inclusion in Theses andDissertations by an authorized administrator of AFIT Scholar. For more information, please contact [email protected].
Recommended CitationRoth, Krista L.L., "Analysis of an Experimental Space Debris Removal Mission" (2017). Theses and Dissertations. 1701.https://scholar.afit.edu/etd/1701

ANALYSIS OF AN EXPERIMENTAL SPACE DEBRIS REMOVAL MISSION
THESIS
Krista L. L. Roth, Capt, USAF
AFIT-ENY-MS-17-J-071
DEPARTMENT OF THE AIR FORCE AIR UNIVERSITY
AIR FORCE INSTITUTE OF TECHNOLOGY
Wright-Patterson Air Force Base, Ohio
DISTRIBUTION STATEMENT A: UNLIMITED DISTRIBUTION

The views expressed in this thesis are those of the author and do not reflect the official
policy or position of the United States Air Force, Department of Defense, or the United
States Government. This material is declared a work of the United States Government
and is not subject to copyright protection in the United States.
AFIT-ENY-MS-17-J-071
ANALYSIS OF AN EXPERIMENTAL SPACE DEBRIS REMOVAL MISSION
THESIS
Presented to the Faculty
Department of Astronautical Engineering
Graduate School of Engineering and Management
Air Force Institute of Technology
Air University
Air Education and Training Command
In Partial Fulfillment of the Requirements for the
Degree of Master of Science in Astronautical Engineering
Krista L. L. Roth, BS, MS
Capt, USAF
June 2017
DISTRIBUTION STATEMENT A: UNLIMITED DISTRIBUTION
AFIT-ENY-MS-17-J-071
ANALYSIS OF AN EXPERIMENTAL SPACE DEBRIS REMOVAL MISSION
THESIS
Krista L. L. Roth, BS, MS
Capt, USAF
Committee Membership:
Eric Swenson, PhD
Chairman
Carl Hartsfield, PhD
Member
Joshuah Hess, Capt, PhD
Member

AFIT-ENY-MS-17-J-071
iv
Abstract
Encountering space debris is an ever-increasing problem in space exploration and
exploitation, especially in Low Earth Orbit. While many space-faring governing bodies
have attempted to control the orbital lifetime post mission completion of satellites and
rocker bodies, objects already in orbit pose a danger to future mission planning.
Currently, governments and academic institutions are working to develop missions to
remove space debris; however, the proposed missions are typically costly primary
missions. This research proposes an alternative to use an upper stage rocket, to be called
a chaser, already launching a primary mission near the desired debris as a host for a
removal mission. This research models the alternative system as an experimental test
concept deploying a target from the Evolved Expendable Launch Vehicle Secondary
Payload Adapter ring. A net and tether system is deployed towards the target to capture
it, and at the opposite end of the tether is released a drag chute to deorbit the target. Once
the capture method is proven with a cooperative body through experimentation, the target
can then be an uncooperative piece of space debris of any size. The orbital life of a dead
rocket body in an 800 km sun synchronous orbit can theoretically be reduced from
approximately 500 years to less than a year using this method. This proposed concept is
new in that it is planned as a secondary mission and the majority of the mission
components will not separate from the Payload Adapter ring. This research’s initial
model predictions show feasibility for this new concept.

AFIT-ENY-MS-17-J-071
v
To my daughter

vi
Acknowledgments
I would like to thank all those who have contributed their time and effort to help
me with this thesis. I would especially like to thank my thesis advisor Dr. Eric Swenson
for taking me on and working with me to refine my proposed idea. The evolution of the
originally proposed concept brought this research from the realm of imagination to a
feasible space mission. He continually pushed me to take that extra step in my research to
prove how I was proposing something new and innovative to the field and show how my
research would have an impact on the space community. I would also like to thank my
committee members, Dr. Carl Hartsfield, and Captain Joshuah Hess (PhD) for their
support and idea brainstorming sessions. Without their input the refined scope presented
in this work would not have been established as early as it was. In addition to the faculty
I would also like to thank Captain Stephen Tullino and 1st Lieutenant Joshua Lee for the
help with coding issues. Also, I would like to thank the Air Force Research Laboratory
for the use of their code as an original idea starting point despite the minimal impact it
played in the final product. Finally, I would like to thank my friends and family who have
stood by me in my research. They have allowed me to bounce ideas off of them, read my
work repeatedly checking for grammar errors and listened to my presentations about my
progress. Thank you especially to family for all of your support through this entire
process.
Krista L. L. Roth

vii
Table of Contents
Page
Abstract .............................................................................................................................. iv
Acknowledgments.............................................................................................................. vi
Table of Contents .............................................................................................................. vii
List of Figures .................................................................................................................... ix
List of Tables ................................................................................................................... xiii
I. Introduction ......................................................................................................................1
General Issue ...................................................................................................................1
Problem Statement ..........................................................................................................2 Research Question/Hypothesis .......................................................................................2
Research Focus................................................................................................................3 Methodology ...................................................................................................................4 Assumptions/Limitations ................................................................................................4
II. Literature Review ............................................................................................................6
Chapter Overview ...........................................................................................................6
Description ......................................................................................................................6
Relevant Research ...........................................................................................................8
Summary .......................................................................................................................26
III. Methodology ................................................................................................................27
Chapter Overview .........................................................................................................27 Target Orbital Life ........................................................................................................27
Chaser, Target, Net and Drag Chute Modeling.............................................................30 Net Deployment and Target Capture ............................................................................37 System Deorbit ..............................................................................................................42 Summary .......................................................................................................................43
IV. Results and Analysis ....................................................................................................44
Chapter Overview .........................................................................................................44 Results ...........................................................................................................................44
Target Orbital Life .................................................................................................. 44 System Model ........................................................................................................... 52
Summary .......................................................................................................................63

viii
V. Conclusions ...................................................................................................................64
Chapter Overview .........................................................................................................64 Conclusions of Research ...............................................................................................64 Significance of Research ...............................................................................................65
Recommendations for Action .......................................................................................66 Recommendations for Future Research ........................................................................66 Summary .......................................................................................................................68
Bibliography ......................................................................................................................69

ix
List of Figures
Page
Figure 1: Monthly increase of objects in space. Pointed out are the FY-1C ASAT test and
the Iridium/Cosmos collision spikes [2] ...................................................................... 9
Figure 2: Mass distribution in LEO. (The International Space Station is not included in
the distribution) [2] .................................................................................................... 10
Figure 3: Examples of current tentacle capture satellites (a) e.Deorbit by ESA (b) Capture
and De-Orbiting Technologies (CADET) by Aviospace (c) Target Collaborativize
(TAKO) Flyer/Gripper by Japan [3] [20] .................................................................. 12
Figure 4: Single Robotic Arm Capture Satellites. (a) Deutsche Orbital Servicing Mission
(DEOS) by DLR (b) European Proximity Operations Simulator (EPOS) by DLR and
(c) Front-End Robotics Enabling Near-Term Demonstration (FREND) by DARPA
[3] ............................................................................................................................... 14
Figure 5: Current net capturing satellites. (a) Robotic Geostationary Orbit Restorer
(ROGER) (focused on GEO mitigation) (b) e.Deorbit by the ESA (c) Debris
Collecting Net (D-CoNe) by Italy and (d) Research and Development for the Capture
and Removal of Orbital Clutter (REDCROC) by University of Colorado at Boulder
[3] ............................................................................................................................... 15
Figure 6: Drag augmentation mission concepts. (a) foam method (b) inflated balloon
method (c) fiber-based method [3] ............................................................................ 17
Figure 7: Modular debris removal satellite placing Thruster De-Orbiting kits onto a piece
of debris. For rough sizing purposes the red box is 1.5x1.5x1.5 meters cubed [9] ... 18

x
Figure 8: ARM spacecraft with captured asteroid. The displayed frames are the inertial,
FI, body fixed, FB, to the target and satellite fixed, FS. Also shown are the center of
mass of the body, BCM, and the satellite, SCM, and the satellite origin, SO [27] ........ 20
Figure 9: D-CoNe concept model of net capture of ovoid shaped debris [23] ................. 21
Figure 10: Net mesh modeling for a lumped mass-spring model as done by Benvenuto
and Lavagna [23] ....................................................................................................... 22
Figure 11: LCROSS Spacecraft ESPA Ring Configuration [31] ..................................... 24
Figure 12: Combined Rocket Configuration after impact of net but before release of a
drag chute or firing of additional propulsion systems for deorbit ............................. 29
Figure 13: Phase 1 – Initial Steady State of System. The ‘i’ frame refers to the inertial.
The ‘c’ frame refers to the chaser. The ‘t’ frame refers to the target. The ‘n’ frame
refers to the net. Not pictured is the drag chute frame which would be labeled as ‘d’
................................................................................................................................... 31
Figure 14: Phase 2 – Deployment of the target................................................................. 36
Figure 15: Phase 3 – Target drifts away from chaser at approximately 1 m/s .................. 37
Figure 16: Bullet deployment angle .................................................................................. 38
Figure 17: Phase 4 to 7 – Deployment of bullets and net. The bullets accelerate and then
drift until they pull the net vertex out which accelerates and then the combined
system drifts towards the target ................................................................................. 38
Figure 18: Phase 8 – Net captures the target decelerating the net and accelerating the
target .......................................................................................................................... 39
Figure 19: Phase 9 – The combined net and target drift until they reach the length of the
tether, 100 m .............................................................................................................. 39

xi
Figure 20: Phase 10 – Release of drag chute from chaser ................................................ 40
Figure 21: Phase 11 - Deployment of drag chute. Phase 12 (not pictured) – Deorbit of
target .......................................................................................................................... 41
Figure 22: Lifetime of Empty Single Engine Centaur Rocket Body ................................ 45
Figure 23: Dual Rocket Body Deorbit Times ................................................................... 46
Figure 24: Percent Increase from Single Rocket to Dual Rocket System (Without Added
Measures) ................................................................................................................... 47
Figure 25: Comparison of 800 and 900 km orbits at 53 degree inclinations. Compares
altitude each cycle. Black line indicates slope of initial part of curves ..................... 48
Figure 26: Change in Deorbit Time at 89 Degrees with Increasing Drag (Multiplication
Factor of Dual System Cross Section Area) .............................................................. 49
Figure 27: Required drag area for target orbits versus time to deorbit ............................. 50
Figure 28: Quaternions of the Chaser ............................................................................... 53
Figure 29: Impact locations capable of inducing an angular rate that can be overcome by
the deployment of the drag chute. Center point is center of net. Percentages are based
on the percentage of the radius covered from the center point .................................. 57
Figure 30: Feasible impact locations of target on net if tether is held taut by the chaser for
0.1 s before the drag chute is deployed ...................................................................... 58
Figure 31: Impact locations that induce an angular rate that would take longer than 14 s to
wind up the entire 100 m tether without accounting for target linear drift. The center
is denoted with a black square ................................................................................... 59
Figure 35: Adjusted acceptable impact region based on continued linear movement of the
target at the control speed of 1.02 m/s ....................................................................... 60

xii
xiii
List of Tables
Page
Table 1: Centaur Specifications and Mission Orbital Parameters .................................... 27
Table 2: STK Model Specifications .................................................................................. 28
Table 3: Combined 2 Rocket Body System with Tether and Net ..................................... 30
Table 4: Object attribute initial conditions and source ..................................................... 31
Table 5: Comparison of Orbital life for 53 degree inclination orbit at 800 and 900 km
altitudes with and without maneuver to decrease orbit to 600 km at beginning of life
................................................................................................................................... 48
Table 6: Delta-V Required to Change from One Orbit to Another for a Single Centaur . 51
Table 7: Comparison of STK density models ................................................................... 52
Table 8: Control Run results of selected criteria comparing expected versus observed
values ......................................................................................................................... 55

xiv
Nomenclature
A: State Matrix
Achute: Area of drag chute
a: acceleration
B: Input Matrix
C: Output Matrix
Cd: coefficient of drag
Cr: solar radiation pressure coefficient
D: Direct Transition of feedthrough matrix
d: distance
F: Force
G: Gravitational Constant
g: resultant torque
I: Identity matrix
I: MOI of system
Icm: Current MOI of object before applying parallel axis modification
Iparallel axis: MOI of an object about a parallel axis
𝑱𝑡𝑜𝑡𝐵𝐶𝑀: Inertia tensor of the total system at the center or mass expressed in the body frame
𝑱𝑜𝑏𝑗𝐵𝐶𝑀: Inertia tensor of the target object in the body frame
𝑱𝑆𝐶𝑆𝐶𝑀: Inertia tensor of the spacecraft in the spacecraft’s frame
�̅�: Angular Momentum Vector
M: mass
𝑚𝑆𝐶: Mass of the spacecraft
Mcentral: Mass of the central body

xv
�̅�: Linear momentum vector
ρ or 𝜌𝑜: density
𝒓𝐵
𝐴: Vector from B to A
RE: radius of the earth plus the orbital altitude of the object
t: time
�̅�: inputs
�̅�: velocity vector
v: scalar velocity
�̅�: Angular rates vector
x: x axis
�̅�: state vector
�̅�o: initial state vector
y: y axis
�̅�: outputs
z: z axis

xvi
Acronyms
AAReST: Autonomous Assemble of a Reconfigurable Space Telescope
ADCS: Attitude, Determination and Control System
ADR: Active Debris Removal
ARM: Asteroid Redirect Mission
ASAT: Anti-Satellite
ASI: Agenzia Spaziale Italiana
ATLAS: Advanced Telerobotic Actuation System
CADET: Capture and De-Orbiting Technologies
Cal Poly: California Polytechnic State University
CMG: Control Moment Gyroscope
CSD: Canisterized Satellite Dispenser
DARPA: Defense Advanced Research Projects Agency
D-CoNe:
DEOS: Deutsche Orbital Servicing Mission
DICE: Dynamic Ionosphere CubeSat Experiment
DLR: Deutsches Zentrum fur Luft-und Raumfahrt (German Aerospace Center)
DoD: Department of Defense
EELV: Evolved Expendable Launch Vehicle
EPOS: European Proximity Operations Simulator
EPS: Electrical Power Subsystem
ESA: European Space Agency
ESPA: EELV Secondary Payload Adapter
FREND: Front-End Robotics Enabling Near-Term Demonstration

xvii
GEO: Geostationary Earth Orbit
GS: Grappling System
ISS: International Space Station
LCROSS: Lunar Crater Observation and Sensing Satellite
LEO: Low Earth Orbit
MOI: Moment of Inertia
MSIS: Mass Spectrometer-Incoherent Scatter Radar
NASA: National Aeronautical and Space Administration
NEO: Near Earth Orbit
ODE: Ordinary Differential Equation
P-POD: Poly Picosatellite Orbital Deployer
RAAN: Right Ascension of the Ascending Node
REDCROC: Research and Development for the Capture and Removal of Orbital Clutter
ROGER: Robotic Geostationary Orbit Restorer
SpaceX: Space Exploration Technologies
STK: Systems Tool Kit
TAKO: Target Collaborativize
TRL: Technology Readiness Level
TSR: Tethered Space Robot
UK: United Kingdom
ULA: United Launch Alliance
UN: United Nations
US: United States

xviii
ANALYSIS OF AN EXPERIMENTAL SPACE DEBRIS REMOVAL MISSION
I. Introduction
General Issue
As nations around the world develop new and more advanced technology, they begin to
expand further into exploring the benefits of space operations. The number of countries that
currently exploit space has grown significantly in the last few decades with an expectation for it
to continue [1]. With the increased interest and use from governments and private companies, the
amount of material going into space has been steadily rising [2]. As a result of the increase in
material, there is an increased chance of collisions, that subsequently create additional debris. Of
the greatest concern is low Earth orbit (LEO) where the majority of satellites currently orbiting
Earth are located. J C Liou predicted that eventually LEO will be unusable due to the amount of
debris from exponentially rising collisions as predicted by Kessler and Cour-Palais in 1978 [2].
Because of this startling possibility, countries have begun instituting limitations on how long
objects are allowed to remain in orbit after their useful life. Several organizations worldwide
have also started initiatives to look at reducing the amount of debris and dead objects that
currently reside in LEO [3].
The efforts to reduce space debris to date have been more theoretical with ground based
testing rather than routine missions that aim to capture and remove debris such as e.Deorbit by
the European Space Agency (ESA) [3]. There are several barriers to the space debris removal
mission concept. Chief among the afore mentioned barriers is the large cost to build and launch a
satellite that does not serve a purpose for the nation or corporation beyond cleaning up space. To
make the space debris reduction objective more appealing, a mission concept that is capable of
utilizing a low cost satellite or that can make use of currently launching upper stages already
planning to re-enter can be explored. Presently some universities and national organizations,
such as the ESA, Defense Advanced Research Projects Agency (DARPA) and University of
Colorado Boulder, are exploring small and large satellite implementations [3]. An area that could
provide immense benefit to the community is the use of upper stages as a carrier vehicle for a
device capable of capturing large debris. With the removal of large debris from highly desirable
orbits, LEO can be made usable without the fear of a loss of capability.
Problem Statement
The purpose of this study is to model and create a simulation of a proposed experimental
system that can be attached to an United Launch Alliance (ULA) Atlas V (and future proposed
Vulcan) upper stage, the single engine Centaur rocket that is capable of decreasing the orbital life
of space debris. This thesis presents a methodology for the use of a Centaur, from here on out to
be referred to as the chaser, via an externally mounted control system to aid in a close approach
maneuver. The mounted system will release a cooperative target, deploy a net to capture the
target and then deorbit the target using a drag chute. Another aspect analyzed is the possibility to
scale up the target to the same size as the chaser and still deorbit within 25 years of capture.
Additional problems investigated included a look at the total benefit that is gained from this type
of implementation and a look at safety precautions to be undertaken in the implementation of the
system and mission to minimize the risk of creating additional debris.
Research Question/Hypothesis
In this research, the use of a Centaur and Evolved Expendable Launch Vehicle (EELV)
Secondary Payload Adapter (ESPA) ring as a host for a debris removal mission is studied.
Modeling will be conducted to determine feasibility of the design using a self-deployed target
from the ESPA ring to be captured by a full size net and tether system which will then be de-
orbited by an independent drag chute released from the ESPA ring. The complete dynamics of
this system will be modeled to determine feasibility of the proposed mission. Additionally in this
research, the benefit gained for a non-cooperative dead rocket body using the proposed modeled
system will be studied.
The goal of this study is that a series of boxes mounted to an ESPA ring on a Centaur are
capable of capturing a target and reducing its orbital lifetime.
Research Focus
The focus of this study will be the modeling and simulation of the mission from post
close-approach maneuvers by the chaser until the deorbit of the self-deployed target. The use of
an ESPA ring as the chaser and deploying the drag chute for the target to de-orbit are novel in
the area of debris removal research while the use of net and tether systems in combination with a
drag chute is not. The focus will be to study the feasibility of the complete proposed system
rather than fine detail of the net and tether system.
The ideal use of the system is to capture a dead rocket body; however, initial modeling is
done on a concept mission using a self-deployed 27U CubeSat as a target. The initial orbit of
both the chaser and target would be such that both would deorbit within the required 25 years
without further assistance.

Methodology
This study will evaluate and estimate the current lifetimes of a dead rocket body at
varying altitudes and inclinations and the amount of delta V is required to achieve the desired
final altitudes. The proposed final mission concept is to deorbit a dead rocket body using the
ESPA as a host. The presented research will be modeled using a self-deployed target instead of
making a rendezvous with existing orbital debris in an orbit determined safe in terms of orbital
lifetime for all components of the mission. After the deployment of the target, a net and tether
system will be deployed followed by a drag chute. The capture system will deorbit the target
independent of the chaser.
Assumptions/Limitations
Several constraints and limitations have been placed on the scope of the included study.
The politics of space debris removal will not be addressed. The problem is constrained to looking
at only using a current Centaur single engine upper stage rocket as the chaser. The two-engine
variation of the Centaur was not considered for this research. The target during the orbital
lifetime analysis is a second Centaur single engine upper stage and during the modeling portion
is a deployed 27U CubeSat originating from the chaser. The chaser rocket is assumed to be
capable of reaching the desired orbit after releasing its primary payload with residual fuel needed
to complete at least a partial re-entry burn and completing the close approach maneuvers. The
position and velocity are only modeled locally to the system. The specifications of the net,
specifically the dimensions and weights of the components, to be employed by the system have
been determined by previous work and are sufficient to capture the self-deployed target. A scaled
up version from the same research would be capable of capturing the dead rocket body. The

research looks at the system rather than details of net deployment design and dynamics which
have been studied extensively to date.

II. Literature Review
Chapter Overview
The rate at which debris is being deposited into LEO (less than 3,000 km in altitude), has
been increased steadily since spaceflight began [4]. This is a factor of the continually growing
space community attempting to utilize the space and the slow rate of orbital decay of objects
currently occupying the space. To prevent making space inaccessible due to the growing debris
field, this author and others developing ADR satellites such as e.Deorbit believe action has to be
taken early to start eliminating large objects [5] [6]. Several mission concepts have been
proposed over the years and a few have made it to the design and testing phase [3] [7]. The
greatest challenge to correcting the orbital debris problem is not imposing rules and regulations
on currently launching spacecraft, but rather finding a cost effective solution to correct the
already existing on-orbit issue of large objects posing a risk of creating a cascade effect of more
debris [8]. This chapter will cover what active debris removal (ADR) entails, current
technologies being researched or developed for use in ADR, modeling done with net and tether
technology and hosted payloads on an ESPA ring.
Description
According to Schmitz et al. and the ESA, there exist over 17,000 identified objects larger
than 5 to 10 cm in LEO with only 1,200 of those being active satellites [9]. It has been reported
[5] that in order to keep LEO usable for the foreseeable future, 5 to 10 large objects need to be
removed every year. The reduction in debris can reduce the possibility of the cascading of debris
collisions in high risk regions such as sun-synchronous orbits [9]. The United Nations (UN)
report [10] defines large debris as anything over 10 cm in size. Currently, there exists no

economically feasible option for the removal of large space debris by either a space or ground
based platform [11]. The lack of economically feasible options or secondary missions creates a
large barrier for most countries to creating and launching space debris removal missions.
The National Aeronautics Space Administration (NASA) has established guidelines on
debris analysis required prior to the launch of any mission, and these guidelines have
subsequently been adopted by the United States (US) Government for all Department of Defense
(DoD) Launches as well. The most constraining factor in the guidelines is that all spent rocket
stages and satellites at the end of their life must be moved to a pre-determined parking orbit, such
as the Geostationary Earth Orbit (GEO) parking orbit beyond the GEO belt, or de-orbit within 25
years after the end of their mission [12]. The contributing factors to the growing debris issue
include long de-orbit times for unassisted debris, increasing use of space, collisions, and anti-
satellite testing (ASAT) as conducted by both the US and China [13]. There is no international
treaty mandating how to handle or minimize space debris by the international community,
however there were non-binding guidelines published by the United Nations in 2010 [14]. As an
example, the 25-year limit used by the US and the ESA, is only followed by 80% of upper stage
rocket bodies and 60% of satellites [15]. To mitigate the problem, institutions from across the
globe have been researching for years different approaches to reducing the amount of debris
currently in orbit. Ground based systems such as lasers that are intended to pulverize 1 to 10 cm
debris could potentially reduce the small debris in LEO by up to 23%; however, the issue of
creating additional untrackable debris exists with this method [11]. Also under development is a
collection plate for the capture of microscopic debris; however, this type of debris is not the most
appealing for capture targets due to the limited risk to active systems they currently pose [16]. To
adequately address the debris issue, a large-scale mission whose objective is large target objects

such as spent rocket bodies currently appears to be the only practical option available. Large-
scale missions that have been proposed currently require larger satellites with higher price tags,
such as e.Deorbit’s mission cost ceiling of 150 million Euros, and complexity for what many see
as a disposable satellite offering no use to furthering science or products for the commercial
industry [17].
Relevant Research
Currently, the ESA has started a Clean Space Initiative in an effort to bring awareness to
the issue with space debris and to promote research to find missions capable of assisting in the
active removal of debris [17]. The ESA states that “the most effective short-term” solution to the
space debris problem is the “prevention of in-orbit explosions” [17]. However, this does not
address a long-term solution that would require debris removal in order to reach a “safe-level”
for the debris environment [17]. To the extent of the literature review, not addressed in any of the
research is the impact of large projects such as Elon Musk’s SpaceX project to provide global
satellite internet with a 4,000 satellite LEO based constellation [18]. There have been several
studies into possible space debris removal missions and some studies into combined body
dynamics and detailed modeling of the different elements of a debris removal mission [2] [7] [9]
[11] [18-24]. There is no current research on using a Centaur and ESPA ring to host a secondary
debris removal mission capable of capturing a dead rocket body.
Impact of Debris Removal Systems
The following section will cover why debris removal missions are needed and why this
research is relevant to the current space environment. The biggest question facing the world

today concerning fixing the space debris problem is whether active space debris removal
missions will have any impact or is it already too late to fix the problem with our current levels
of technology. NASA and the DoD were directed by President Obama in 2010 to “pursue
research and development of technologies and techniques… to mitigate and remove on-orbit
debris, reduce hazards, and increase understanding of the current and future debris environment”
[2]. With this direction, NASA conducted a sensitivity study to determine the impact of ADR on
the stabilization of the LEO debris environment [2]. The current mitigation strategy did not
qualify as active debris removal and for the purposes of the study varying levels of debris
removal efforts were considered against a control of no removal and a rate of growth
commensurate with the current level of launches as shown in Figure 1 [2].
Figure 1: Monthly increase of objects in space. Pointed out are the FY-1C ASAT test and
the Iridium/Cosmos collision spikes [2]

In 2010 40% of the total 5900 tons of mass in orbit resides in LEO in three different
concentrations (600, 800 and 1000 km) most of which are rocket bodies (at 800 and 1000 km)
and spacecraft (at 600 km) as seen in Figure 2 [2].
Figure 2: Mass distribution in LEO. (The International Space Station is not included in the
distribution) [2]
Liou showed that in the next 200 years there would be a 60% increase in the mass of the
LEO debris environment, however, not addressed was at what point LEO would no longer be
useable as it currently is, or passed through with either signals or spacecraft [2]. After a study
into current technology, NASA predicted that between the years 2020 and 2060, technology will
be advanced enough to conduct ADR missions. However, waiting towards the end of this
window results in approximately 2,000 more objects due to collisions in the same timeframe [2].
Of note, the study stated that limiting to a narrow inclination range might not be the most
efficient way to control the debris population at a given altitude [2]. Finally, the study identified
the top 500 targets with the highest mass and collision probabilities by altitude and inclination
that included Cosmos, SL-3, SL-8 and SL-16 rocket bodies and Envisat ranging from 1,000 to
8,300 kg [2]. This study did not address why going after the largest objects over just those
objectives with high collision probabilities or damage potentials was the preferable approach. If
repeated, the study may focus more on damage potentials from collisions, however, this would
be a simulation and computing intensive effort and may not be a cost-effective approach for
mission planning purposes.
Current and Planned Space Debris Removal Missions
In this section, current research and proposed space debris missions are discussed
including different approaches to removing debris and the pros and cons of each method to the
overall mission success probability. All of these approaches were considered prior to final
selection for this research in an attempt to determine the area where the greatest degree of impact
to the field could be made. In looking at the variety of debris removal missions today, they fall
into several different categories of removal types including [3]:
Stiff Connection Capturing: tentacles, and single/multiple robotic arms
Flexible Connection Capturing: nets, tether grippers, and harpoons (nets are
studied in this research)
Drag augmentation systems (studied in this research)
Electro-dynamic tethers
Solar radiation force
Contactless and contact removal methods

All of these debris removal approaches come with advantages and disadvantages to their use.
Next systems that currently have work in progress, including stiff and flexible connection
capturing and drag augmentation systems, will be discussed.
Stiff connection capturing methods are currently being developed by Aviospace, German
Aerospace Center (aka Deutsches Zentrum für Luft- und Raumfahrt or DLR), DARPA, ESA,
Japan, and the United Kingdom (UK) [3] [19]. Within this category are tentacle and robotic arm
style capturing devices. The difference between the two is that tentacles are flexible appendages
that can “embrace” the debris at multiple points rather than latching on to a single point as done
by robotic arms [3]. Tentacle operations can be performed with or without a robotic arm assist in
the capture of the target [3]. The advantages of tentacle systems include the ease of test and
higher Technology Readiness Level (TRL); however, it has the issue of being a higher cost,
mass, volume and hazardousness level project [3]. As a result of these factors, tentacle systems
are not as appealing for debris removal missions unless they could be incorporated into a satellite
that could dispose of multiple pieces of debris per chaser satellite, reducing the cost per piece of
debris removed. Examples of satellites and test systems currently under work are shown in
Figure 3.
Figure 3: Examples of current tentacle capture satellites (a) e.Deorbit by ESA (b) Capture
and De-Orbiting Technologies (CADET) by Aviospace (c) Target Collaborativize (TAKO)
Flyer/Gripper by Japan [3] [20]

Of these systems, the CADET satellite by Aviospace is the closest to on-orbit testing with
ground testing having occurred in November 2015, which is a year after the original predicted
launch date of 2014 [3] [7]. The delays may in part be due to the relatively low TRLs of tentacles
such as CADET advertising a starting TRL of 2 and rising to 4 over the course of development
[21]. The other type of stiff arm capturing method, the robotic arm, has a much higher TRL and
space flight history as seen on the International Space Station (ISS) and the Space Shuttle. For
these reasons, the tentacle type of capture method is not ideal for a mission designed to be low
cost (need to do extensive testing and development still exists) and employed in the near future
(which would require a TRL of 6 or higher for an active mission rather than demonstration) to be
considered.
Robotic arms can be used as a single arm or multiple arm cooperative system. These
systems would have a much more appealing concept to a near term mission than the previous
concept; however, for reasons explained below are robotic arms are not ideal for the proposed
research. While the cost is lower for a single arm system, a satellite is more flexible with a
multiple arm system [3]. These systems are typically very easy to test on the ground and have a
high TRL; however, rendezvous and docking maneuver are required as well as a point on the
target to grapple [3]. Determination of the grappling point is one of the larger issues when the
robotic arm approach is considered. One must consider the fact that space debris is tumbling in
what can be seen as an unpredictable way and may or may not be of a known configuration. Also
of note is that once the chaser satellite attaches to the target an “impact influence” is experienced
that will affect the overall dynamics of the system creating the need to plan for an optimal time
and position to perform the capture with respect to a deorbit plan [3]. Examples of current single
arm satellites and ground test systems are shown in Figure 4.

Figure 4: Single Robotic Arm Capture Satellites. (a) Deutsche Orbital Servicing Mission
(DEOS) by DLR (b) European Proximity Operations Simulator (EPOS) by DLR and (c)
Front-End Robotics Enabling Near-Term Demonstration (FREND) by DARPA [3]
The EPOS system was designed as a ground based test facility for hardware-in-the-loop testing
of the behavior of satellites during their docking and capture phases of their missions [3]. The
only current multiple arm satellite in development is the Advanced Telerobotic Actuation System
(ATLAS) that is being designed in the UK[3]. Multiple arm systems are less cost effective with
more mass and complexity than their single arm counterparts that are equally capable of
performing the same mission, making them a less desirable first choice for debris removal
missions [3]. Overall, the incorporation of any stiff connection capturing method would require a
large amount of money as well as a larger satellite capable of housing the battery and computing
power required to perform their missions. These missions would not be suitable for a hosted
mission on an ESPA ring.
Of greatest interest are flexible connection capturing systems for a hosted mission
concept which are being evaluated as a part of this research. Flexible connection capturing
systems can be used in smaller scale satellites to some degree unlike most stiff connection
capturing systems. The largest advantage of most of these systems is that they do not require a
precise rendezvous with the target. The tether-gripper approach is the exception as it does require
a grappling point [3]. The focus of most research in this area has been done on net capturing

systems. Their obvious advantages include a “larger capturing distance,” up to 100 m seen to
date, that reduces the requirements on precision and compatibility with different size debris
targets, however, the nets can be hard to control, are difficult to test on the ground and have a
risk of critical oscillations [3] [5]. Net capturing systems have varying dimensions capable of
capturing different sizes and amounts of debris. Current systems under development are shown
in Figure 5.
Figure 5: Current net capturing satellites. (a) Robotic Geostationary Orbit Restorer
(ROGER) (focused on GEO mitigation) (b) e.Deorbit by the ESA (c) Debris Collecting Net
(D-CoNe) by Italy and (d) Research and Development for the Capture and Removal of
Orbital Clutter (REDCROC) by University of Colorado at Boulder [3]
The basic concept of a net capturing device is to shoot four weights attached to a net from a
spring system on the main body of the chaser satellite. They are typically modeled as a spring-
mass system in simulators [3]. The REDCROC satellite takes a slightly different approach with
creating an inflatable arm net [22]. After capture, it takes approximately 365 days to deorbit the
debris from 900 km with an assist from a drag augmentation balloon, and only one piece of
debris can be targeted per satellite launched [22]. The design shows more promise with its size
than many other systems, being approximately 1.78 x 1.17 x 2.01 m3 in size, with the intent to

launch 10 satellites at once that all perform transfer orbits to intended debris targets [22]. In its
published configuration, it would be limited on the size of debris it could capture and may not be
able to target large spent rocket bodies. A proposed net system by Benvenuto and Lavagna is 36
m x 36 m in size and would be capable of capturing debris up to 8000 kg with a flexible
appendage such as solar panel [23]. Benvenuto and Lavagna’s work is used for sizing the net in
this research.
While net capturing systems are the more popular of the flexible connection capture
concepts, there are two other concepts currently being explored, a tether-gripper and a harpoon,
that should be discussed for completeness of the research. A tether-gripper is similar to a net in
that it allows for a larger capturing distance with lower mass and cost; however, it does require a
grappling point for the gripper portion of the system [3]. The configuration requires that the
tether must always be under tension to avoid the possibility of a collision between the target and
chaser during reentry [3]. Overall, the system has a lower reliability than other alternatives and is
not well understood [3]. Currently the only examples of a tether-gripper system are ROGER by
the ESA and Tethered Space Robot (TSR) by China [3] [24]. The harpoon system eliminates the
need for a gripper point and is compatible with multiple target types, however, also has the
disadvantage of potentially causing additional debris either by creating fragments due to the
capture or compromising the target sufficiently to cause breakup [3]. Due to the nature of the
system, it is not compatible with high tumbling rate targets but Astrium and ESA are still
working on Grappling System (GS) and e.Deorbit respectively to demonstrate a harpoon system
[3]. Overall, the harpoon method has a higher TRL and lower cost when compared to the net
capture method, as well as it being relatively easy to test on the ground which could bring it to
the front in a competition between the two [3]. The simplicity of many of the flexible connection

capture methods and low cost make these systems ideal concepts for implementation on a much
smaller satellite with the intent to reduce costs.
Other than the previously mentioned methods, the most promising removal method is a
drag augmentation system which increases the area-to-mass ratio of the debris to increase its
atmospheric drag [3]. This method can be used in conjunction with other methods and is being
considered as a part of this research for deorbit purposes. This approach can be used in
conjunction with other approaches as shown by the University of Colorado’s REDCROC
satellite or independently [22]. Several different tactics have been proposed for this type of
mission such as spraying a target with foam and turning it into a large foam ball, inflating a large
ball-like envelope on either the chaser satellite or directly on the target or a fiber-based substance
extruded from a heat source to wrap the target much like the foam ball approach [3]. These
approaches are seen in Figure 6.
Figure 6: Drag augmentation mission concepts. (a) foam method (b) inflated balloon
method (c) fiber-based method [3]
Other than the previously mentioned application being used by REDCROC, these methods are
not being explored for a currently under development mission. A concept that is starting to
become more prevalent is the use of a drag chute or drag sail to deorbit satellites in LEO at the
end of mission life [25] [26].
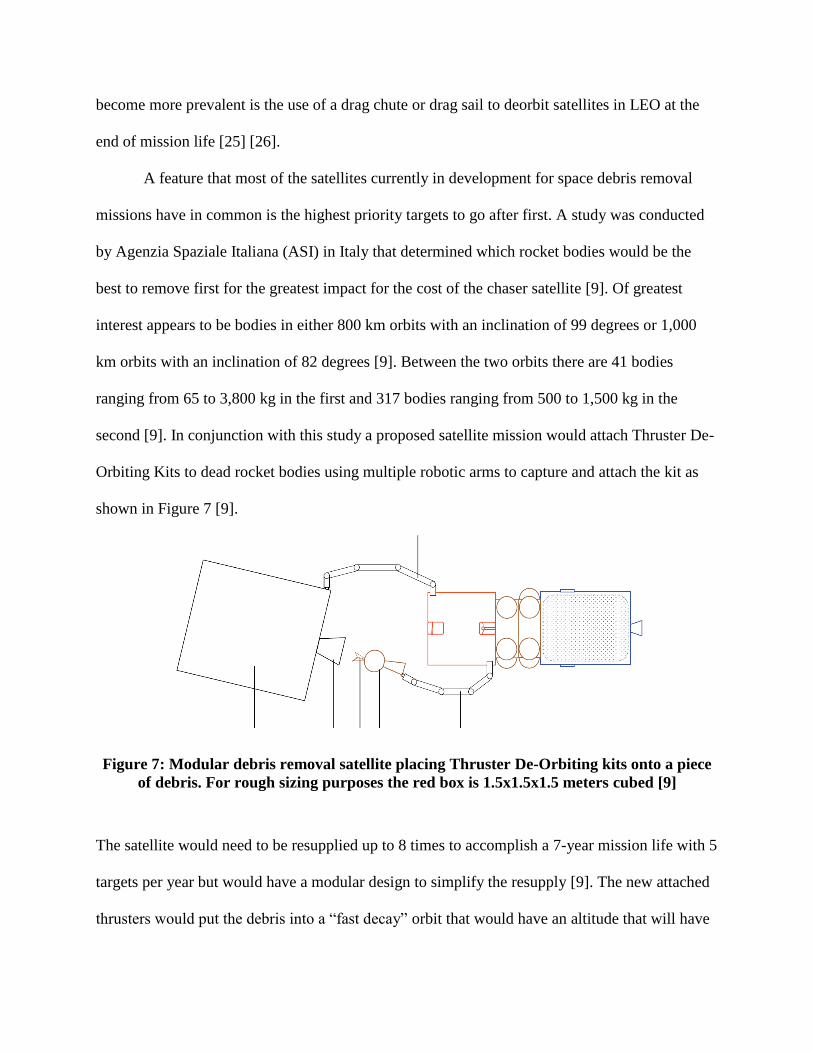
A feature that most of the satellites currently in development for space debris removal
missions have in common is the highest priority targets to go after first. A study was conducted
by Agenzia Spaziale Italiana (ASI) in Italy that determined which rocket bodies would be the
best to remove first for the greatest impact for the cost of the chaser satellite [9]. Of greatest
interest appears to be bodies in either 800 km orbits with an inclination of 99 degrees or 1,000
km orbits with an inclination of 82 degrees [9]. Between the two orbits there are 41 bodies
ranging from 65 to 3,800 kg in the first and 317 bodies ranging from 500 to 1,500 kg in the
second [9]. In conjunction with this study a proposed satellite mission would attach Thruster De-
Orbiting Kits to dead rocket bodies using multiple robotic arms to capture and attach the kit as
shown in Figure 7 [9].
Figure 7: Modular debris removal satellite placing Thruster De-Orbiting kits onto a piece
of debris. For rough sizing purposes the red box is 1.5x1.5x1.5 meters cubed [9]
The satellite would need to be resupplied up to 8 times to accomplish a 7-year mission life with 5
targets per year but would have a modular design to simplify the resupply [9]. The new attached
thrusters would put the debris into a “fast decay” orbit that would have an altitude that will have

an apogee below 700 km within 12 months of firing the thruster [9]. The sample mission
currently does not have a name or expected launch date as of the publishing of the article in 2011
[9]. Overall, most missions currently being explored involve applications of higher TRL
technology with the intent to go after multiple targets during the mission life. None of the
proposed missions to date have mentioned possible side missions or being a secondary payload
to a different primary mission.
Current Research in Modeling Debris Removal
In order to make a debris mission possible that involves touching a target object in some
way either through a ranged catching object such as a net or a rendezvous with robotic arms, the
dynamics of the combined system could be drastically different that those of the original system.
Using the assumption that the targets are all non-cooperative, then all control must be provided
by the chaser satellite. With this in mind, potentially none of the attitude controls will be in ideal
locations for both the chaser satellite alone as well as the combined system, thus a realistic
tradeoff in placement must be made.
To combat some of these issues, nonlinear attitude and control algorithms are under
development that allow for the optimal control of the combined system while having the
placement of the attitude control systems within the chaser satellite be in optimal positions for
the actual rendezvous [27]. The specific intent of the research was to take the combined system
case to a logical extreme where a smaller chaser satellite would attach to and direct a
significantly larger object such as asteroid or boulder [27]. The control strategy was developed in
conjunction with the NASA proposed Asteroid Redirect Mission (ARM) which intends to

“capture a near Earth orbit (NEO) asteroid or to pick up a boulder from some bigger asteroid and
transport to the Earth-moon system” as shown in Figure 8 [27].
Figure 8: ARM spacecraft with captured asteroid. The displayed frames are the inertial, FI,
body fixed, FB, to the target and satellite fixed, FS. Also shown are the center of mass of the
body, BCM, and the satellite, SCM, and the satellite origin, SO [27]
The proposed control law promises exponential convergence of tracking errors and has
been demonstrated with numerical simulations using the ARM concept and is related to the
tracking control law for Euler-Lagrangian systems [27]. Of the greatest importance to the
relevance of the current research are the non-cooperative state of the target and the uncertainty of
the target’s size and shape prior to mission launch [27]. The combined inertial tensor of the
entire system is expressed in the body frame of the captured object as
𝐽𝑡𝑜𝑡𝐵𝐶𝑀 = 𝐽𝑜𝑏𝑗
𝐵𝐶𝑀 + 𝐽𝑆𝐶𝑆𝐶𝑀 + 𝑚𝑆𝐶 [(𝑟
𝑆𝐶𝑀𝐵𝐶𝑀)
𝑇
(𝑟𝑆𝐶𝑀𝐵𝐶𝑀) 𝐼 − (𝑟
𝑆𝐶𝑀𝐵𝐶𝑀)(𝑟
𝑆𝐶𝑀𝐵𝐶𝑀)
𝑇
] (1)

The (𝑟𝑆𝐶𝑀𝐵𝐶𝑀) = (𝑟
𝑆𝐶𝑀𝑆𝑂 ) + (𝑟
𝑆𝑂𝐵𝐶𝑀) term and (𝑟
𝑆𝐶𝑀𝑆𝑂 ) term are the known vectors from the
spacecraft origin, fixed at the joining point between the captured body and the spacecraft, to the
spacecraft center of mass [27]. Mass is that of the spacecraft and does not account for the mass
of the captured object [27]. This equation could potentially be modified for further work with
known capture objects and projected weights to reduce some of the errors and uncertainties. The
system could also be improved by going after known targets such as recently launched rocket
bodies that are not projected to re-enter within the 25-year limit. Not addressed in the proposed
research was how to actually conduct the rendezvous with the target and how much the target
could be working against the chaser satellite with an initial erratic tumbling motion.
Other modeling work that has been done to date includes extensive work on modeling the
detailed mechanics of a net capture device. While D-CoNe modeled their net to include the net,
debris, net vertex and bullets, bullets were modeled as point masses attached to the net via a
tether as seen in Figure 9.
Figure 9: D-CoNe concept model of net capture of ovoid shaped debris [23]

Benvenuto and Lavagna conducted detailed analysis into the net itself using different size
nets, weights and mesh sizes. They modeled their nets considering each detail of the mesh
making it a lumped spring-mass model to show the flexibility of the net however it also comes
with a very large number of constraints [23]. An image of how one section of mess is modeled is
seen in Figure 10
Figure 10: Net mesh modeling for a lumped spring-mass model as done by Benvenuto and
Lavagna [23]
The only modeling published that was found to include the exact dimensions of a bullet
that was not a point mass or spherical was e.Deorbit [28]. e.Deorbit used a cylindrical mass
similar to the one proposed by Benvenuto and Lavagna in their research. Each mass was similar
in size to a marker pen and propelled at an angle causing the net to open as it traversed the
distance to the desired target and then become entangled within the net after closing around the
target [28].
New Debris Removal System Concepts
Most published research on debris removal evaluates small to large satellites to capture
space debris. One possibility is the use of a CubeSat as a chaser, while another would be the use

of the ESPA ring attached to a Centaur Rocket. Neither approach has been proposed to date as a
viable mission concept however CubeSats have been proposed as a testbed for some of the
technologies including the net and tether systems as well as the harpoon and drag sails [26]. Both
of these possibilities would expand the available trade space for designers to reduce costs and
create secondary payloads.
A 1U CubeSat is nominally defined as a 10 cm cubed body that typically weighs up to
1.33 kg [29]. Each of the nominal cubes can be combined to create a larger CubeSat in several
standard sizes including 3U (1x3x1 cubes), 6U (2x3x1 cubes), 12U (2x3x2 cubes), 27U (3x3x3
cubes) [30]. The actual final dimensions of the larger CubeSats exceed the nominal dimensions
provided by their labels. Variations on these sizes have been seen, such as the Dynamic
Ionosphere CubeSat Experiment (DICE) and the Autonomous Assemble of a Reconfigurable
Space Telescope (AAReST) [31] [32]. However, they are typically designed to fit within
preexisting launch containers such as Planetary Systems Corporation’s (PSC) Canisterized
Satellite Dispenser (CSD) or California Polytechnic State University’s (Cal Poly) Poly
Picosatellite Orbital Deployer (P-POD) [30] [29]. With the size of a CubeSat in mind, the space
required to put both a capture device such as a net, as well as a deorbit device such as a drag
augmentation system, there is little space remaining for standard satellite components such as the
attitude and determination control subsystem (ADCS) and electrical power subsystem (EPS).
With the requirement to be able to capture and control a combined body CubeSat and spent
rocket body, an oversized ADCS most likely would be required compared to a standard CubeSat
ADCS. Currently existing modeling for net capture device deployment, capture and spacecraft
dynamics, such as created for e.Deorbit or ROGER, could potentially be modified for a CubeSat
application [3]. e.Deorbit researchers have shown that testing such a net can be conducted on a

special aircraft that flies a parabolic orbit to simulate microgravity for testing of the net
deployment and capture of a stationary object [28]. The existing modeling for such a system
could be scaled up to show a larger target and net design.
The concept evaluated in this presented research would be to create a mission that never
detaches from a Centaur ESPA ring. Only one similar mission has been conducted to date.
NASA performed a mission using the ESPA as a host on the Lunar Crater Observation and
Sensing Satellite (LCROSS) Mission to the moon [33]. Several control and data collection panels
were attached to the connection points of the ESPA ring as seen in Figure 11.
The main propulsion, communications and power could be supplied from the Centaur rather than
needing to provide an independent source onboard the satellite. A net and tether system could be
R1 Panel
R6 Panel
Electronics
R3 Panel
R5 Panel
Attitude Control
Electronics R4 Panel
Figure 11: LCROSS Spacecraft ESPA Ring Configuration [31]

added to an ESPA ring location as well as additional ADCS at another location. The added
ADCS would provide finer control that is required for matching the rotation of a target as well as
detumbling the target. An additional propulsion system may be necessary for close
approach/rendezvous operations, however, using one or two of the six locations on the ESPA
ring would not pose a problem for this. The only requirement for this approach would be having
a primary mission going near the desired location for the debris removal. The reasoning behind
this is that additional fuel will be needed by the Centaur to perform the orbit change to get to the
rendezvous orbit and conduct a potentially larger deorbit burn than would have previously been
required. The primary mission would require the secondary payload to ensure there are no risks
associated with the equipment added to the ESPA ring. There is to the risk to the secondary
payload after the primary payload deploys due to the repeated starts and stops of the Centaur
main engine or a need to carry a secondary engine. A potential benefit, however, is the
possibility to add more than one net and tether system to the ESPA ring to allow either multiple
attempts at the same target or, depending on the remaining Centaur fuel, the ability to go after
multiple targets.
A similar project to the proposed test is the mission in 2016 of RemoveDEBRIS by the
University of Surrey [26]. While still only a concept tester for the different types of technologies,
it launched a self-deployed CubeSat that would then be captured again. They used a net and
tether system as well as a harpoon designed not to cause additional debris. A drag sail was
planned to be attached to the main body to burn it up however it was not clarified if it was also
used on the target. The updated mission timeline will not have it launching until 2017 from the
ISS [25]. This mission however is not meant to be a demonstration of full scale net or drag sail
technologies, rather a concept mission for the types of removal methods [26]. Even the small-

scale mission is forecast to cost about 13 million Euros with the full-scale mission being
significantly more. The biggest difference in the RemoveDEBRIS mission and the proposed
research is the lack of testing full scale and not requiring an independent satellite to carry the
debris removal method.
Summary
Extensive work has been done to date to design systems to attempt to solve the space
debris in LEO; however, there have not been any missions launched and showing flight heritage
of the technologies. Two missions are currently scheduled but were delayed from their originally
published launch dates, RemoveDEBRIS in 2017 and e.Deorbit in 2023 [25] [6]. According to
Shan et al. the most promising options are in robotics and net capture devices [3]. The major
limiting factor in all proposed missions to date is limited impact on debris removal for large
amounts of money on potentially single mission spacecraft. The largest gap in current
technologies is designing a space debris removal spacecraft that can fly as a secondary payload
or with a secondary payload. By taking a secondary mission approach to the issue, a cost
reduction, or sharing, can be achieved making the appeal of conducting these types of missions
higher and thus cleanup of LEO more likely before it becomes unusable. If a design could be
achieved to accomplish this mission at a lower cost, governments around the world would be
more amenable to conducting debris removal missions in addition to leveeing guidance on debris
lifetime for future missions.

III. Methodology
Chapter Overview
In this chapter, the methodology of the modeling will be discussed. Explained in detail
will be the equations used for modeling the chaser capturing the target with a net tether system
and releasing a drag chute. Also to be discussed are the chosen parameters and the modeling of
the orbital lifetime calculations for the dead rocket body target scenario.
Target Orbital Life
The orbital life of an object is primarily dependent upon its cross-sectional area, mass,
mass moment of inertia and area exposed to the sun. While some of these do not change with
orientation, such as mass and mass moment of inertia if the body is non-deformable, others, such
as the cross-sectional area and area exposed to the sun, are highly dependent on orientation and
could change rapidly if an object were tumbling. Orbital lifetimes also depend on inclination and
altitude. To predict the lifetime of the chaser, the approximate dimensions were used for a Single
Engine Rocket Centaur upper stage from the NASA Technical Memorandum for the Centaur
[34]. In Table 1, there are the specifications used for the single rocket system including the
Centaur specifications and orbital parameters.
Table 1: Centaur Specifications and Mission Orbital Parameters
Mass [34] 2247 kg
Radius [34] 3.05 m
Height [34] 12.68 m
Moment of 35300 0 0 Inertia (MOI)
0 35300 0
kg*m2
(estimated) 0 0 10400
Altitude 300-1100 km
Eccentricity 0
Inclination 0-92 degrees

The mass moment of inertia is approximated using Eq. (2) using the NASA information
and the approximation of a cylinder [34].
𝑀𝑂𝐼𝑐𝑦𝑙𝑖𝑛𝑑𝑒𝑟 =
[ 𝑚𝑎𝑠𝑠
12∗ (3 ∗ 𝑟𝑎𝑑𝑖𝑢𝑠2 + ℎ𝑒𝑖𝑔ℎ𝑡2) 0 0
0𝑚𝑎𝑠𝑠
12∗ (3 ∗ 𝑟𝑎𝑑𝑖𝑢𝑠2 + ℎ𝑒𝑖𝑔ℎ𝑡2) 0
0 0 𝑚𝑎𝑠𝑠 ∗𝑟𝑎𝑑𝑖𝑢𝑠2
2 ]
(2)
To approximate the decay rate for the object, Satellite Tool Kit (STK) was used. A representative
‘satellite’ body was input into a simulation that matched the specifications from Table 1. Then a
model was created using the specifications for the lifetime calculations in Table 2.
Table 2: STK Model Specifications
Mu 3.99E+14 m3s-2
atmospheric density model MSIS 1986
CD 2.2
Cr 1
Drag area 29 m2
Area exposed to sun 77 m2
Solar flux sigma level 0
Solar flux file solflx_schatten.dat
Argument of Perigee 0 rad
RAAN 0 rad
True Anomaly 0 rad
Orbit Epoch
2 Aug 2016 16:00:00.000
UTCG
The STK orbital model was run for a rocket body starting at 1100 km altitude and
decreasing the altitude by 100 km each time. The inclinations considered were 89 and 92 degrees
due to the high interest in the number of objects in these orbits, 53 degrees chosen for the

approximate inclination of the International Space Station (ISS), 23 degrees chosen for the
launch inclination of Cape Canaveral, Florida and 0 degrees as a control case [2].
The Delta-V required by a single rocket to change its orbit from the above parameters to
bring it down to a 300 to 600 km orbit in 100 km increments from starting altitudes of 400 to
1100 km orbits was calculated. If drag alone is not sufficient to deorbit a rocket in the required
25 year time limit, an additional propulsion source will be required.
For a chaser and target case (i.e. the “combined case”), to determine the impact of a
stable joint configuration with two rocket bodies joined by a tether as shown in Figure 12, the set
of parameters in Table 3 was used, and the STK model run using the same parameters listed in
Table 2 using the method in the previous paragraph.
Figure 12: Combined Rocket Configuration after impact of net but before release of a drag
chute or firing of additional propulsion systems for deorbit
This configuration was chosen based on the desired target, a dead rocket body, rather
than the modeled mission concept seen later in this section. To determine the combined MOI of
the system the Parallel Axis Theorem was used as shown below.

𝐼𝑐𝑜𝑚𝑏𝑖𝑛𝑒𝑑 = 𝐼𝑐𝑎𝑡𝑐ℎ𝑒𝑟 + 𝐼𝑡𝑎𝑟𝑔𝑒𝑡 + 𝑚𝑑2 (3)
Eq. (3) is only valid for a rigid body and would not work on a non-rigid body problem. To
account for this in the presented research it has to be assumed that the tether is taut when this
equation is applied. For future research adapting Eq. (3) to a flexible system may be preferable.
Table 3: Combined 2 Rocket Body System with Tether and Net
Weight (including net) 4541 kg
MOI (in thousands)
(kg*m2)
23100 0 0 0 23100 0
0 0 23050
Drag Area (assume both rockets head on) 58 m2
Area Exposed to Sun (assume both rockets side on) 155 m2
Finally, a case was created using only the 89 degree inclination circular orbit between
700 and 1100 km to determine the benefits gained by additional drag as if a drag altering device
had been deployed. The 89 degree orbit was chosen based on it being one of the two orbits of
interest. These were compared using a multiplication factor to the drag area of the combined
system using the numbers from Table 3 as a control case. All data was compared with a percent
change to their respective controls for each data point comparison as well as an average across
all altitudes.
Chaser, Target, Net and Drag Chute Modeling
The model simulation was developed to observe the dynamics of the system from the
point of a stable chaser until the deployment of the drag chute. It was assumed that the chaser
would remain fixed linearly at the origin of the simulation, however it would be allowed to rotate
due to reaction forces from deploying objects. The initial phase as seen in Figure 13, was
established as a steady state to better be able to observe reactions.

Figure 13: Phase 1 – Initial Steady State of System. The ‘i’ frame refers to the inertial. The
‘c’ frame refers to the chaser. The ‘t’ frame refers to the target. The ‘n’ frame refers to the
net. Not pictured is the drag chute frame which would be labeled as ‘d’
Other necessary assumptions included initial conditions and attributes of the different
objects modeled as listed in Table 4. The main objects accounted for include the chaser, target,
net, each bullet, drag chute and tether.
Table 4: Object attribute initial conditions and source
Object Element
Definition
Initial
Condition
Units Assumptions/Source
Chaser Mass 2247 kg No fuel, single engine
from NASA internet
information page [35]
Radius 3.05 m from NASA internet
information page [35]
Height 12.67 m Not including ESPA
ring, from NASA
internet information
page [35]
Target Mass 54 kg Max weight of 27U [36]

Depth (x) 0.3328 m Max dimensions of 27U
[36]
Width (y) 0.3525 m Max dimensions of 27U
[36]
Length (z) 0.366 m Max dimensions of 27U
[36]
Speed 1 m/s Anticipated speed based
on CSD user guide [36]
Net Mass 0.33 kg Based on previous
research [23]
Length 24 m Based on previous
research [23]
Height 24 m Based on previous
research [23]
Width 0.01 m Based on previous
research [23]
Speed speed_bullet
*cos(bullet_
angle)
m/s Anticipated speed based
on geometry in the x-
direction
Stowed
length
0.1 m Initial condition until
deployed for MOI
contribution purposes,
dimensions of 1U [29]
Stowed
height
0.1 m Initial condition until
deployed for MOI
contribution purposes,
dimensions of a 1U [29]
Stowed
width
0.1 m Initial condition until
deployed for MOI
contribution purposes,
dimensions of a 1U [29]
Bullet (x4) Mass 0.5 kg Based on previous
research [23]
Deployment
angle
8 deg Based on previous
research [23] (see Figure
16)
Speed 3 m/s Upon deployment [23]
Net
Electronics
Mass 21.3 kg Based on previous
research [23]
Tether Length 100 m Based on previous
research, Max length,
Negligible mass [23]
Drag Chute Mass 0.28 kg Assuming Mylar
material weight 0.7 g/m2
Length 20 m Assumes 400 m2 chute
Height 20 m Assumes 400 m2 chute

The governing equations of motion are second order ordinary differential equations
(ODE) and they are implemented in the simulation using a non-stiff medium order method
known as ODE45 [38]. ODE45 is based upon the Dormand-Prince pair which is an explicit
Runge-Kutta formula [38]. In order to model the system, state space equations are being used as
seen in Eqs (4) and (5) which show the state derivative of a linear system.
�̇̅� = A�̅� + B�̅� (4)
�̅� = C�̅� + D�̅� (5)
Where �̅� (t) is an nx1 vector known as the state vector which can be a function of time. A
is the state matrix, B is the input matrix, and �̅� is the input and can be a function of time. C is the
output matrix, D is the direct transition of feedthrough matrix and �̅� is the output of the system.
For this scenario there is no D matrix because the system does not have any feedthrough
components. The input used is the quaternions, angular rate, linear position and linear velocity of
each object. The total state vector is 114 elements long however when evaluated it is broken up
into 13 element chunks. The output is the updated initial state at every time step.
Width
(thickness)
4.5E-6 m Based on NASA
proposed Solar Sail
mission [37]
Stowed
length
0.1 m Initial condition until
deployed for MOI
contribution purposes,
dimensions of a 1U [29]
Stowed
height
0.1 m Initial condition until
deployed for MOI
contribution purposes,
dimensions of a 1U [29]
Stowed
width
0.1 m Initial condition until
deployed for MOI
contribution purposes,
dimensions of a 1U [29]

Required for the ODEs using the state space equations are a system state vector and time
vector. The state vector �̅� is 13x1 for each of the represented objects. There is a separate state
vector for each of the following, chaser, target, net, drag chute and each of the four bullets. As a
result of these vectors A is 13x13, B is 13x1, C is 1x13, as seen in Eqs. (6)-(8), and D is 0 and
thus not shown below. The zero elements within the matrices represent elements that do not have
any cross coupling in the states.
𝐴 =
[ 0000000000000
0000000000000
0000000000000
0000000000000
0.5 ∗ 𝑞40.5 ∗ 𝑞3
−0.5 ∗ 𝑞2−0.5 ∗ 𝑞1
0(𝐼11 ∗ 𝑤3)/𝐼22
−(𝐼11 ∗ 𝑤2)/𝐼33000000
−0.5 ∗ 𝑞30.5 ∗ 𝑞40.5 ∗ 𝑞1
−0.5 ∗ 𝑞2
−(𝐼22 ∗ 𝑤3)𝐼110
(𝐼22 ∗ 𝑤1)/𝐼33000000
0.5 ∗ 𝑞2−0.5 ∗ 𝑞10.5 ∗ 𝑞4
−0.5 ∗ 𝑞3(𝐼33 ∗ 𝑤2)/𝐼11
−(𝐼33 ∗ 𝑤1)𝐼220000000
0000000000000
0000000000000
0000000000000
0000000000000
0000000000000
0000000000000]
(6)
𝐵 =
[
0000
(𝑅_𝑏𝑖11 ∗ (𝑇1))/𝐼11 + (𝑅_𝑏𝑖12 ∗ (𝑇2))/𝐼11 + (𝑅_𝑏𝑖13 ∗ (𝑇3))/𝐼11(𝑅_𝑏𝑖21 ∗ (𝑇1))/𝐼22 + (𝑅_𝑏𝑖21 ∗ (𝑇2))/𝐼22 + (𝑅_𝑏𝑖23 ∗ (𝑇3))/𝐼22
(𝑅_𝑏𝑖31 ∗ (𝑇1))/𝐼33 + (𝑅_𝑏𝑖32 ∗ (𝑇2))/𝐼33 + (𝑅_𝑏𝑖33 ∗ (𝑇3))/𝐼33000000 ]
(7)
𝐶 = [1 1 1 1 1 1 1 1 1 1 1 1 1] (8)

At every time-step, a check of both angular and linear momentum is conducted to ensure
the law of conservation of momentum is not violated. The equations for linear and angular
momentum are seen in Eqs. (9) and (10) respectively, where m is the mass and I is the MOI of
the objects.
�̅� = 𝑚�̅� (9)
�̅� = 𝐈�̅� (10)
The principle MOI’s needed to conduct the calculations in the simulation are
approximations based on the shape of the objects. Two different shapes were used to make these
approximations, box and cylinder. The chaser and the bullets use the cylinder approximation
shown in Eq. (2) and the net, drag chute, and target are approximated as a box as shown in Eq.
(11).
MOIbox =
[ mass
12∗ (width2 + depth2) 0 0
0mass
12∗ (depth2 + height2) 0
0 0mass
12∗ (width2 + height2)]
(11)
At the initial state, all components are stationary with respect to each other. During the
second phase, a target is released by way of a CubeSat deployer, such as PSC’s CSD, as seen in
Figure 14.

Figure 14: Phase 2 – Deployment of the target
The second phase only lasts as long as the force is applied to the target. The force is centered on
the plate of the target closest to the center of the chaser for approximately 0.1 s. The resultant
torque caused by the target pushing on the chaser during the deployment is calculated using Eq.
(12) while an approximation of the acceleration is calculated from the expected duration of the
force being applied and the final velocity as seen in Eq. (13). There is no torque on the target
caused by the chaser pushing back due to the force being applied through the origin, assumed
center of mass, along an axis. The tether is not considered in the system yet since it is only
exerting a force when in tension.
g = 𝑑𝑖𝑠𝑡𝑎𝑛𝑐𝑒 ∗ 𝑓𝑜𝑟𝑐𝑒 (12)
acceleration=velocity/time (13)
After the target has been successfully deployed and is only at a constant velocity after being
ejected from the CubeSat deployer, the scenario enters Phase 3 as seen in Figure 15.

Figure 15: Phase 3 – Target drifts away from chaser at approximately 1 m/s
Net Deployment and Target Capture
Once the target has reached a pre-arranged distance from the chaser, a net will be
deployed. The distance can be adjusted based on the length of the tether, velocity of the target
and expected velocity of the net. For this simulation, it was considered to be a constraint that the
net would deploy once the target reached a distance of 40 m. This would allow the net to be
almost fully extended by the time it was expected to impact the target at an expected distance of
60 m. The net deployment consists of four bullets shot simultaneously from the canister towards
the target. The bullets each weigh approximately 0.5 kg and are propelled at a rate of 3 m/s at an
angle of 8 deg off the centerline as seen in Figure 16 and Figure 17 of Phase 4.

Figure 16: Bullet deployment angle
Figure 17: Phase 4 to 7 – Deployment of bullets and net. The bullets accelerate and then
drift until they pull the net vertex out which accelerates and then the combined system
drifts towards the target
The subsequent stages include the capture of the net and the pulling of the tether taut before the
release of the drag chute as seen in Figure 18 and Figure 19.
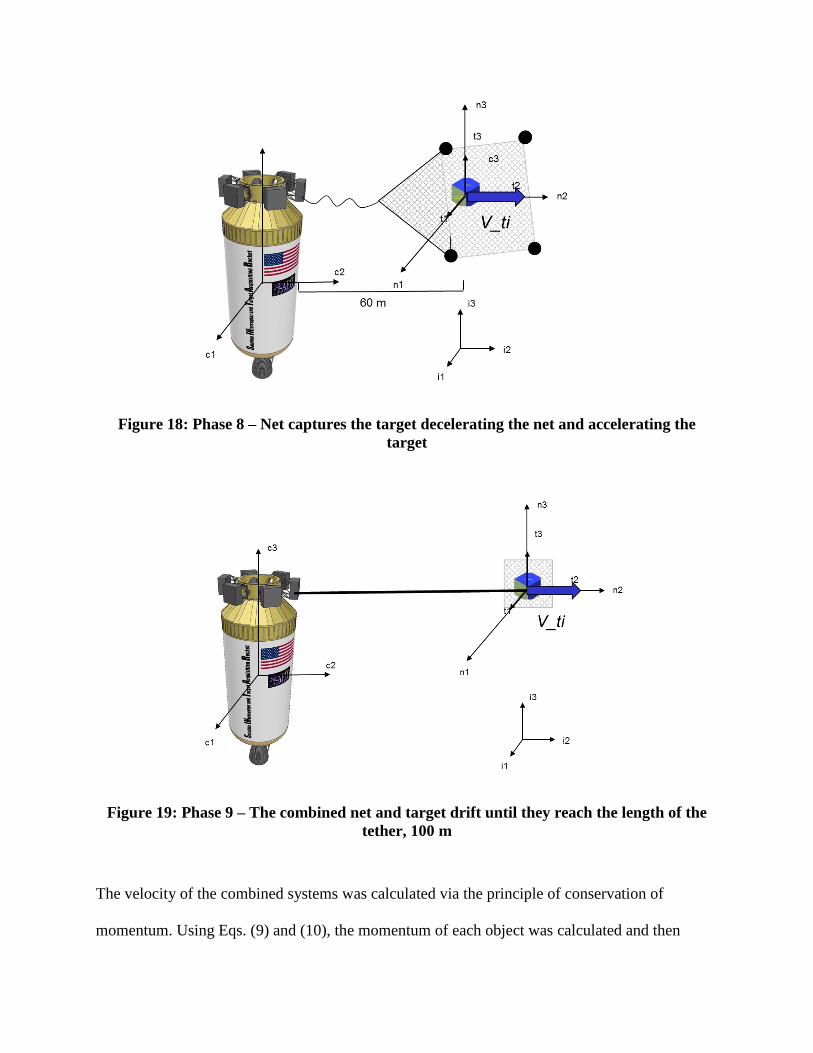
Figure 18: Phase 8 – Net captures the target decelerating the net and accelerating the
target
Figure 19: Phase 9 – The combined net and target drift until they reach the length of the
tether, 100 m
The velocity of the combined systems was calculated via the principle of conservation of
momentum. Using Eqs. (9) and (10), the momentum of each object was calculated and then

combined for the total momentum of the system. The resulting velocity of the combined system
must have the same momentum so the total momentum was divided by the total mass of all the
objects after impact assuming no losses. After the tether reached a length of 100 m, then the drag
chute was deployed as seen in Figure 20 and Figure 21.
Figure 20: Phase 10 – Release of drag chute from chaser

Figure 21: Phase 11 - Deployment of drag chute. Phase 12 (not pictured) – Deorbit of target
The force exerted by the drag chute is dependent upon initial conditions including the
size of the chute, orbital altitude and weight of objects attached to the chute. The orbital velocity
was determined using Eq. (14) where 𝑀𝑐𝑒𝑛𝑡𝑟𝑎𝑙 is the mass of the earth, G is the gravitational
constant and RE is the radius from the center of the earth to the satellite.
𝑣 = √(𝐺 ∗ 𝑀𝑐𝑒𝑛𝑡𝑟𝑎𝑙
𝑅𝐸) (14)
The density is determined based on the current altitude of the drag chute at the time of the
calculation. For the purposes of this research, the altitude was considered to be constant, so the
simulation would not take the target all the way to burnup, rather, the simulation would end soon
after the drag chute deployment. A more detailed simulation could be run for future work to
model all the way through burnup of the target. Eq. (15) provides a relatively simple relationship
between density and altitude which is determined with the scale height being found in a lookup

table and where 𝜌𝑜 is the density at a reference altitude [39]. The equation is a very simplified
assumption.
𝜌 = 𝜌𝑜 ∗ 𝑒
−𝑎𝑙𝑡𝑖𝑡𝑢𝑑𝑒
𝑠𝑐𝑎𝑙𝑒 ℎ𝑒𝑖𝑔ℎ𝑡 (15)
The coefficient of drag Cd for a satellite in orbit that is not a sphere is generally assumed
to be 2, which was used in this simulation [39], thus the resulting force of the chute is calculated
using Eq (16). The force calculated was then transformed into an acceleration using Newton’s
Second Law as seen in Eq. (17)
𝐹 =
1
2∗ 𝜌 ∗
𝐴𝑐ℎ𝑢𝑡𝑒
𝑚∗ 𝐶𝑑 ∗ 𝑣2 (16)
a=F/m (17)
System Deorbit
The design of the deorbit required careful thought to attempt to eliminate or reduce the
issue of potentially crashing the target or chaser into the other. The approach of using the main
engine on the chaser was evaluated but removed as potential solution because it was determined
that resultant orientation of the chaser and target after firing the engine would put the target
directly behind the chaser in line with the chaser engine. This orientation would result most
likely in break in the tether or a collision between the target and chaser. The chaser engine and
any remaining fuel is only used to deorbit the chaser. The primary deorbit method evaluated for
the target was a drag chute deployed from the ESPA ring at the opposite end of the tether from
the net as shown in Figure 21. First, the chaser would move out of range of the target and drag
chute doing its deorbit burn, and then the drag chute could be fully extended. The estimated time
for the drag chute to fully extend is 3 s in the simulation. The speed at which it is deployed is not
dependent on the need for the force provided by the drag chute to prevent windup of the target

and tether. To accomplish this arrangement the drag chute would be encased in another small
CubeSat, either 1U or 2U in size, which will deploy independently after a given condition. The
specifics on how it deploys was considered to be future work.
The drag method was evaluated to determine if a reasonable size chute would work at the
desired altitudes using STK as described in the Target Orbital Life section below. The force from
chute size determined from the STK model was then applied to the model to observe the
dynamics of the system. If the drag chute method did not work, an electric motor propulsion
method would be needed. An electric motor propulsion method was not evaluated in the
demonstration mission concept model; however, cases where it would be required were noted.
The requirement is to deorbit the rocket to the point that it would decay within at least 25 years
as a threshold value, however, the objective value would be within 1 year.
Summary
In this chapter, the methodology of the simulations was covered. This included how the
STK models were established for orbital lifetime calculations. Also discussed were the important
equations needed to model the system during the capture to observe the dynamics. The results
and analysis of these calculations are discussed in the next chapter.

IV. Results and Analysis
Chapter Overview
In this chapter, the results of the calculations and models will be discussed. An analysis
was performed on the results of the STK modeling to quantify the impact of the proposed
mission. Analysis was also conducted on the dynamics model to determine constraints of the
proposed system. Specific areas that were analyzed in the simulation include the effects of the
net not hitting the target in the center of the net, impacts of a tip-off angle change to one of the
bullets upon firing, a mis-firing of one bullet which changes its speed and a varying of the
deployment speed of the target.
Results
Target Orbital Life
The first set of data obtained from the model results generated using STK was the
lifetime of a Single Engine Centaur that was varied over a circular orbit in different inclinations
and altitudes. Altitudes were chosen based on research showing a current level of high density
such as at 89 and 92 degrees, high interest orbits due to use such as the ISS and Cape Canaveral
and 0 degrees to be used as a control. The results of these initial runs are shown below in Fig. 22.
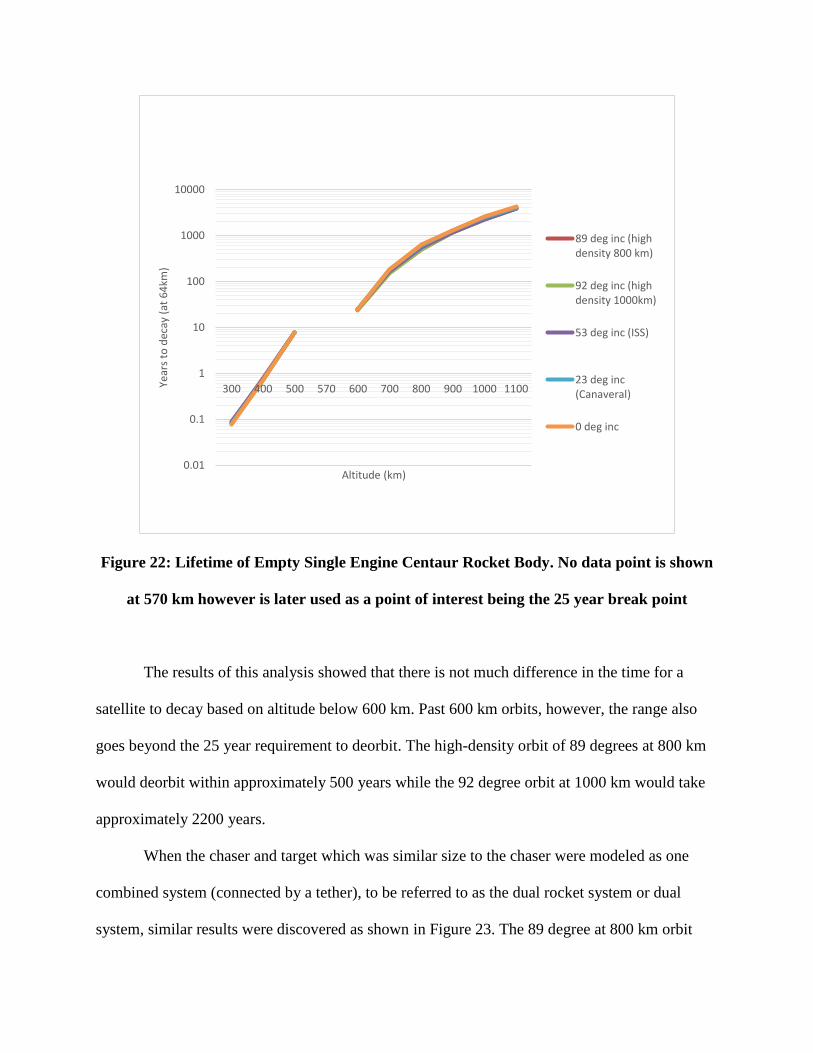
Figure 22: Lifetime of Empty Single Engine Centaur Rocket Body. No data point is shown
at 570 km however is later used as a point of interest being the 25 year break point
The results of this analysis showed that there is not much difference in the time for a
satellite to decay based on altitude below 600 km. Past 600 km orbits, however, the range also
goes beyond the 25 year requirement to deorbit. The high-density orbit of 89 degrees at 800 km
would deorbit within approximately 500 years while the 92 degree orbit at 1000 km would take
approximately 2200 years.
When the chaser and target which was similar size to the chaser were modeled as one
combined system (connected by a tether), to be referred to as the dual rocket system or dual
system, similar results were discovered as shown in Figure 23. The 89 degree at 800 km orbit
0.01
0.1
1
10
100
1000
10000
300 400 500 570 600 700 800 900 1000 1100Year
s to
dec
ay (
at 6
4km
)
Altitude (km)
89 deg inc (highdensity 800 km)
92 deg inc (highdensity 1000km)
53 deg inc (ISS)
23 deg inc(Canaveral)
0 deg inc

was now 510 years, a 0.84 percent increase over the single rocket system, and the 92 degree orbit
at 1000 km was now 2258 years, a 1.04 percent increase. All of these are within the error of the
model and could be considered to have no change.
Figure 23: Dual Rocket Body Deorbit Times
The percent increase showed similar results for all of the different orbits at each altitude.
The one exception was 53 degree and 0 degree inclinations at 300 km orbits which did not have
any change where the others had about 3.5% increase as seen in Figure 24. All of the orbits
averaged about a 1% increase in total time to deorbit in the dual configuration over the single
rocket body configuration. The percentage seen was within the error of the system.
0.001
0.01
0.1
1
10
100
1000
10000
6600 6800 7000 7200 7400 7600Tim
e (y
ears
)
Semi-major axis (km)
89 deg inc (highdensity 800 km)
92 deg inc (highdensity 1000km)
53 deg inc (ISS)
23 deg inc(Canaveral)
0 deg inc

Figure 24: Percent Increase from Single Rocket to Dual Rocket System (Without Added
Measures)
The observed decay time at the orbits of interest poses a problem if an additional deorbit
method is not also employed. When looking at methods and ways to implement an additional
deorbit method two main ideas are typically used, a deorbit burn or drag. A majority of the time
is spent at the higher altitudes and until they reach a certain height, the effects of drag are not
reducing the overall orbital lifetime. This overcomes the time spent in the lower altitudes where
the drag is affecting the altitude. When a spacecraft or debris starts lower, already in the drag
environment, or so close that minimal time is spent outside of it, the decrease in altitude is seen
more rapidly because of the increased drag. When an example case report was pulled from STK
showing the orbital parameters over the course of the orbital lifetime as seen below in Figure 25
you can see a verification of this theory.
0
0.5
1
1.5
2
2.5
3
3.5
4
4.5
6600 6800 7000 7200 7400 7600
Pe
rce
nt
Incr
eas
e
Semi-Major Axis (km)
89
92
53
23
0
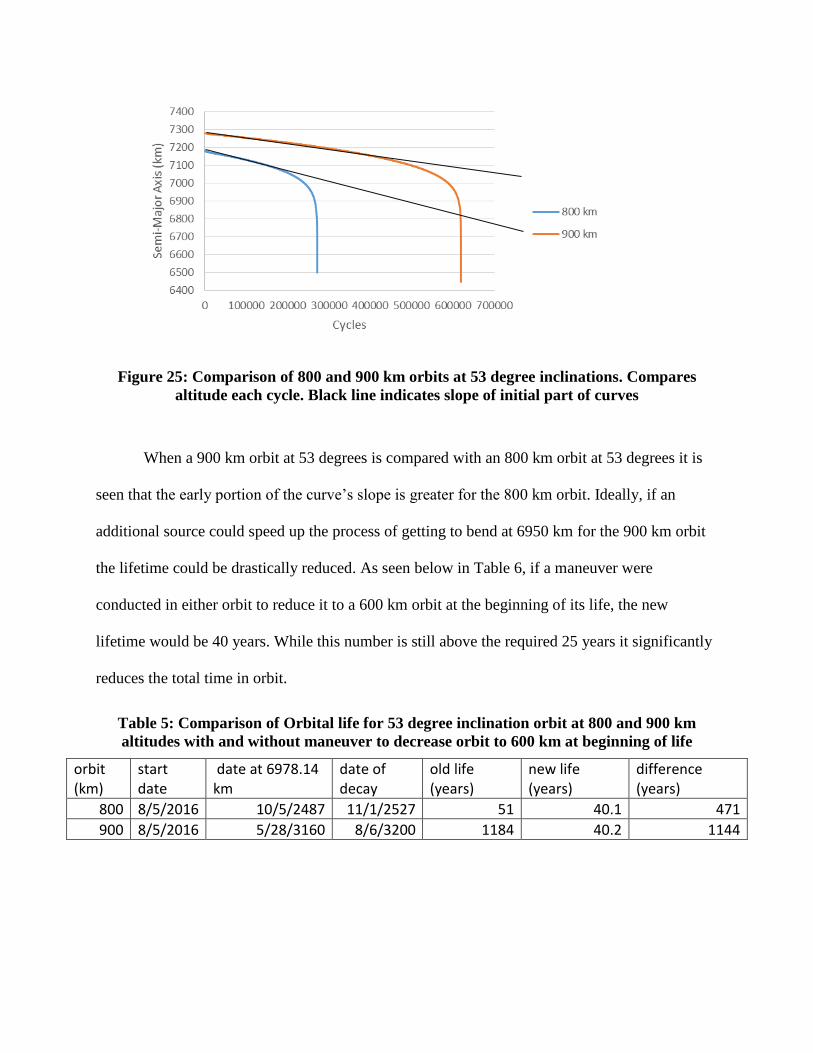
Figure 25: Comparison of 800 and 900 km orbits at 53 degree inclinations. Compares
altitude each cycle. Black line indicates slope of initial part of curves
When a 900 km orbit at 53 degrees is compared with an 800 km orbit at 53 degrees it is
seen that the early portion of the curve’s slope is greater for the 800 km orbit. Ideally, if an
additional source could speed up the process of getting to bend at 6950 km for the 900 km orbit
the lifetime could be drastically reduced. As seen below in Table 6, if a maneuver were
conducted in either orbit to reduce it to a 600 km orbit at the beginning of its life, the new
lifetime would be 40 years. While this number is still above the required 25 years it significantly
reduces the total time in orbit.
Table 5: Comparison of Orbital life for 53 degree inclination orbit at 800 and 900 km
altitudes with and without maneuver to decrease orbit to 600 km at beginning of life
orbit (km)
start date
date at 6978.14 km
date of decay
old life (years)
new life (years)
difference (years)
800 8/5/2016 10/5/2487 11/1/2527 51 40.1 471
900 8/5/2016 5/28/3160 8/6/3200 1184 40.2 1144

For an 800 km orbit, this is a 92% decrease in the orbital life and for the 900 km orbit a
96%. To achieve the desired 25 years, the orbit would need to be reduced to a semi-major axis of
6948.14 km or a 570 km altitude.
When looking at deploying only a drag chute as an augmented deorbit method for the
combined system the results showed an almost exponential decay in total lifetime. This was
more dramatic for the higher altitudes where the starting lifetime was higher than the lower
orbits as shown below in Figure 26.
Figure 26: Change in Deorbit Time at 89 Degrees with Increasing Drag (Multiplication
Factor of Dual System Cross Section Area)
Seeing the results of Figure 26, an analysis was conducted on the two target orbits of 89
degrees, 800 km and 92 degrees, 1000 km to determine how big a drag chute would have to be if
used on just one rocket. As seen in Figure 27 below, an area of ~350 square meters is required
for the 89 degree orbit, however, nearly 1850 square meters is required for the 92 degree orbit.
1
10
100
1000
10000
0 2 4 6 8 10 12
Deo
rbit
Tim
e (y
ears
)
Multiplication Factor of Dual Rocket System Cross Section Area
7078.14
7178.14
7278.14
7378.14
7478.14
required

Figure 27: Required drag area for target orbits versus time to deorbit
Of note about the data was the appearance of a diminishing return line with increasing
area. For the 89 degree orbit this line appeared around 7 years and for the 92 degree orbit this
line appeared around 21 years. This shows that the best possible lifetime with a drag chute in
these orbits is approaching 7 and 21 years, respectively. These achieve the desired threshold
value of less than 25 years however for the 92 degree orbit the required area may be problematic.
To achieve the objective value of less than a year and to not have an excessively sized drag chute
an alternative would be required.
The final portion that was examined for this part of the study was the required delta-V to
change the orbits. This did not take into account the different inclinations or starting and
stopping a maneuver at a specific location in the orbit. In Table 6 below, there is a comparison
from all orbit altitudes down to either 300, 400, 500 or 600 km orbits.
0
50
100
150
200
250
0 500 1000 1500 2000 2500
De
cay
Tim
e (
year
s)
Cross Sectional Area (m2)
89 deg800 km
92 deg1000 km
required

Table 6: Delta-V Required to Change from One Orbit to Another for a Single Centaur
Initial Orbit Altitude (km)
Delta V to 300 km (m/s)
400 km (m/s)
500 km (m/s)
600 km (m/s)
300 0 0 0 0
400 28 0 0 0
500 56 28 0 0
600 84 55 27 0
700 111 82 54 26
800 138 109 80 53
900 164 135 106 79
1000 190 160 132 104
1100 215 186 157 129
After noticing the stark change in the orbital lifetime curves in Figure 25, it would make
sense that all that is required would be to decrease the orbit to at least the 600 km altitude or
6978 km semi-major axis. The lower altitude will then cause the more rapid decay of the orbit.
To conduct the maneuver discussed previously of getting to the 570 km altitude orbit the amount
of delta-V required for the 800 km orbit would be 61 m/s and for a 1000 km orbit, 113 m/s. This
is a 13% and 7% increase respectively over the amount needed to achieve the 600 km altitude
orbit. However, this is a 55% and 40% decrease respectively over the amount needed to achieve
the 300 km altitude orbit.
Further investigation was conducted to study the effects of the drag model chosen on the
orbit lifetime and the valid range. The model used for the initial data set was MSIS 1986, which
is an empirical density model based on satellite data and is valid from 90-1000 km [40]. A newer
version was created in 1990, and this model is valid from 0-1000 km [40]. Because the model is
not valid for 1100 km, this data is extrapolated and may not be as accurate as other models that
have a higher range. The newest version of the model was created by the US Naval Research
Laboratory in 2000, which also changed the way a certain routine was called in the code [40].
The only models that are valid past the 1000 km point are the Jacchia models, however, they are
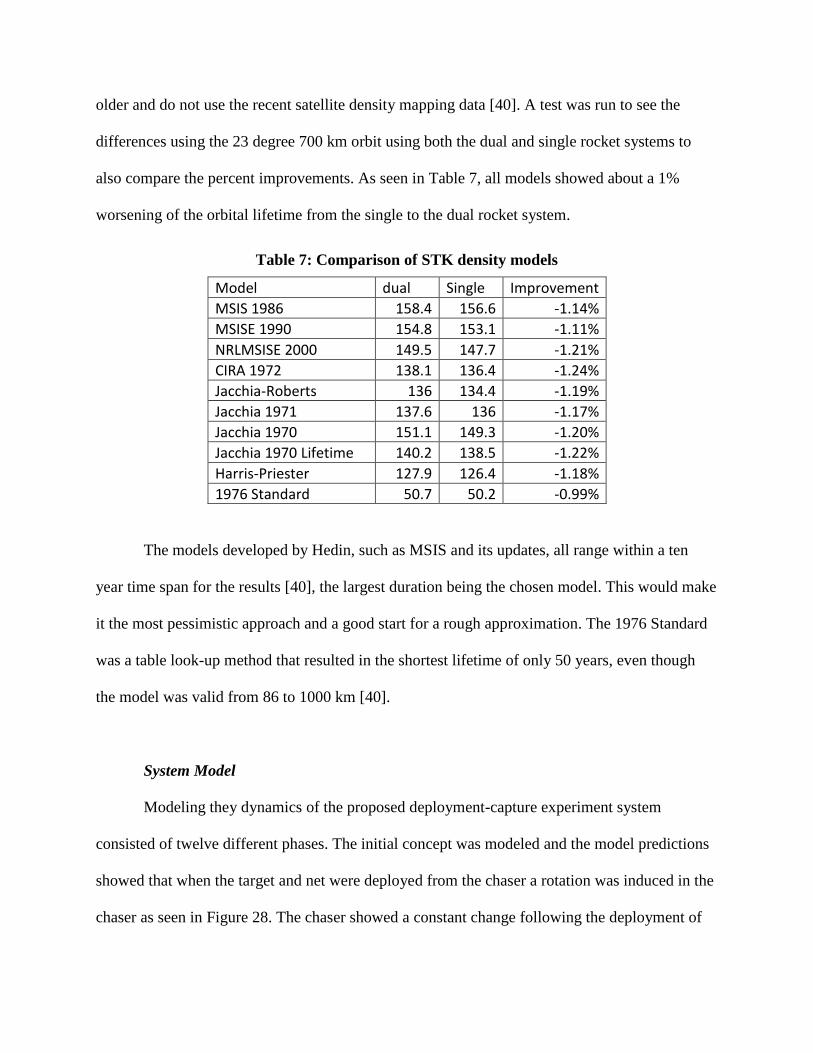
older and do not use the recent satellite density mapping data [40]. A test was run to see the
differences using the 23 degree 700 km orbit using both the dual and single rocket systems to
also compare the percent improvements. As seen in Table 7, all models showed about a 1%
worsening of the orbital lifetime from the single to the dual rocket system.
Table 7: Comparison of STK density models
Model dual Single Improvement
MSIS 1986 158.4 156.6 -1.14%
MSISE 1990 154.8 153.1 -1.11%
NRLMSISE 2000 149.5 147.7 -1.21%
CIRA 1972 138.1 136.4 -1.24%
Jacchia-Roberts 136 134.4 -1.19%
Jacchia 1971 137.6 136 -1.17%
Jacchia 1970 151.1 149.3 -1.20%
Jacchia 1970 Lifetime 140.2 138.5 -1.22%
Harris-Priester 127.9 126.4 -1.18%
1976 Standard 50.7 50.2 -0.99%
The models developed by Hedin, such as MSIS and its updates, all range within a ten
year time span for the results [40], the largest duration being the chosen model. This would make
it the most pessimistic approach and a good start for a rough approximation. The 1976 Standard
was a table look-up method that resulted in the shortest lifetime of only 50 years, even though
the model was valid from 86 to 1000 km [40].
System Model
Modeling they dynamics of the proposed deployment-capture experiment system
consisted of twelve different phases. The initial concept was modeled and the model predictions
showed that when the target and net were deployed from the chaser a rotation was induced in the
chaser as seen in Figure 28. The chaser showed a constant change following the deployment of

the target and an additional change following the deployment of the bullets and the net. All of the
others remained constant at their initial attitude of [0 0 0 1] though out as expected due to several
assumptions imposed upon the simulation and the graphs of their quaternions are not shown
here. The vertical lines reflect the end of each phase.
Figure 28: Quaternions of the Chaser (only q2 and q4 are changing)
The rotation of the chaser had an angular rate of 0.0187 rad/s after the target deployment
and 0.0208 rad/s after the bullets are deployed. The torque on the chaser that would be applied
with the deployment of the drag chute was not considered in this model due to the initial
assumption that the chute is released only by the tether going taut and does not actually pull on
the chaser’s structure. The effects of the torques on the chaser as well as the possibility of the
tether going taught prior to the drag chute release, should be considered in future work where a
more detailed model of the system and the release of the drag chute is explored. For the purposes
of the rest of this research, the torques applied to the chaser were removed with the assumption
of an ADCS being implemented capable of handling the induced angular rates. Future work

should consider adding in active feedback control in the model to help determine the time
required to combat the torque and re-align with the target for net deployment. After the
adjustment involving the removal of the chaser torque, it was shown that the deployment of the
target, bullets, net and drag chute did not induce an angular rate on the chaser. Ideal conditions
were assumed for the model.
The initial case had the net impact the target in the exact center of the net with all bullets
equidistant and traveling at the same velocity. Due to this configuration, all of the forces of the
bullets were able to cancel each other out and no induced angular rate was seen on the target.
Other than the primary control case, listed below are the variations examined:
Impact location on net of the target from - 10 m to 10 m in both the x and y
direction 0.2 m increments. (83% of total net area) with [0, 0] being the control
and the full size being 24 m by 24 m (area covered is 20 m by 20 m)
Target deployment velocity varied from 0.5 to 2 m/s at 0.5 m/s increments with 1
m/s being the control
One Bullet deployment angle varied between 5 and 10 degrees at 1 degree
increments with 8 degrees being the control
One Bullet velocity varied between 1 and 5 m/s at 0.5 m/s increments and 3 m/s
being the control
These cases were chosen based on the greatest likelihood of mission impact and chance of
occurrence from a chosen group of experts [41]. The nominal case was considered the control
with the results shown in Table 8, which includes all parameters considered for comparison
across the different scenarios.

Table 8: Control Run results of selected criteria comparing expected versus observed
values
Criteria Expected Observed Difference Cause
Target Deployment Velocity
(x)
1 m/s 0.99 m/s Time resolution of
simulation
Net Vertex Velocity (x) 2.9 m/s 1.62 m/s How the firing
angle was initially
calculated and
implemented in
the simulation
Target and Net Combined
Velocity (x)
1.3 m/s 1.02 m/s Difference in the
net vertex velocity
Induced Angular Rate of
Target After Net Impact
0 rad/s 0 rad/s For ideal case,
results as expected
Force of Drag Chute Very High 0.0045 N Did not accurately
account for the
continuous
acceleration
Velocity Change by End of
Scenario after Chute
Deployment
Very High -0.02 m/s Difference in the
force of the drag
chute
Of note is the difference in the expected vs observed results for the deployment
velocities, combined target, and net velocity and the force of the drag chute applied on the target.
The target deployment velocity difference as shown in Table 8 is likely due to the time resolution
of the simulation and the time step used in that phase. As future work, it was recommended to
adjust the time step to get better resolution of this velocity. The net deployment velocity
difference as shown in Table 8 is due to the way the deployment angle was calculated in the
rough calculations and the final simulation. The final simulation is correct for the way it was
desired to be implemented. The combined velocity difference as shown in Table 8 is due to the
inaccuracy of the target deployment velocity and the drastically different net deployment
velocity. The force of the drag chute as shown in Table 8 was expected to be a very large number
(1000+ N) due to the lifetime calculation done prior to the simulation. Based on the scenario
parameters of 300 km it was expected that the combined target, net and drag chute system would
deorbit in less than a day if the chute deploys to its full 20 m x 20 m size. If the chute failed to
deploy, it was estimated that it would take the target and net system 6.1 years to deorbit. The
difference in the expected and observed values in the drag chute force numbers as shown in
Table 8 is due to the non-linear nature of the force over the course of the lifetime that in the 300
s of the scenario was treated as a constant acceleration and linear velocity change. The drag
chute force is constantly being applied which allows for a continuous acceleration during the
entire deorbit, which was not modeled. If the force had been applied, the position of the target
would have an exponential altitude decay and would the less than 1 day lifetime results.
For the net location impact case a batch run was created. It accounted for every offset
from – 10 to 10 m in y- and z- directions from the center point of the net every 0.2 m. For this
case, it was assumed that the net was traveling directly at the target and it and the target’s
velocity vector directions matched (+x only). For future work, it is recommended to account for
velocity vector directions that do not match. The scenario was only run up until the target and net
were traveling as a combined system. The induced angular rate of the target was then estimated.
The predictions were then compared against the expected angular rate the drag chute could
overcome based on the control case’s observed force. Figure 29 shows that most locations for
impact induced an angular rate too large for the force of the net to overcome by itself. The figure
shows in red any location on the net that if the target impacted there the drag chute would not be
able to overcome the induced angular rate whereas the green highlights locations that can. Each
position on the chart is a 0.2 by 0.2 m section of the sampled area and the values represent the

expected induced angular rate if the target were to impact that location. The top and right
highlighted areas are believed to be artifacts of the simulation and not true impact points.
Figure 29: Impact locations capable of inducing an angular rate that can be overcome by
the deployment of the drag chute. Center point is center of net. Percentages are based on
the percentage of the radius covered from the center point
The outcome where very specific locations must be hit on the net by the target was
determined to not be an acceptable scenario based on previously established mission parameters
and desire for mission success. In an effort to determine if there was a simple mission design
parameter that could be adjusted to account for this another calculation of the force was done as
if the drag chute had to be released from the chaser 0.1 s after the tether goes taut. The new force
was calculated to be 2292 N due to the resistance of the massive chaser with respect to target.
The force of the drag chute is not considered in this number since the chute has not been released
yet. The calculation made assumes that momentum is conserved and that the force is applied as a
constant over the 0.1 s time. Using this new force and the same calculations from before Figure
30 shows that any impact point on the evaluated area is feasible for the target not to roll up into
the drag chute.
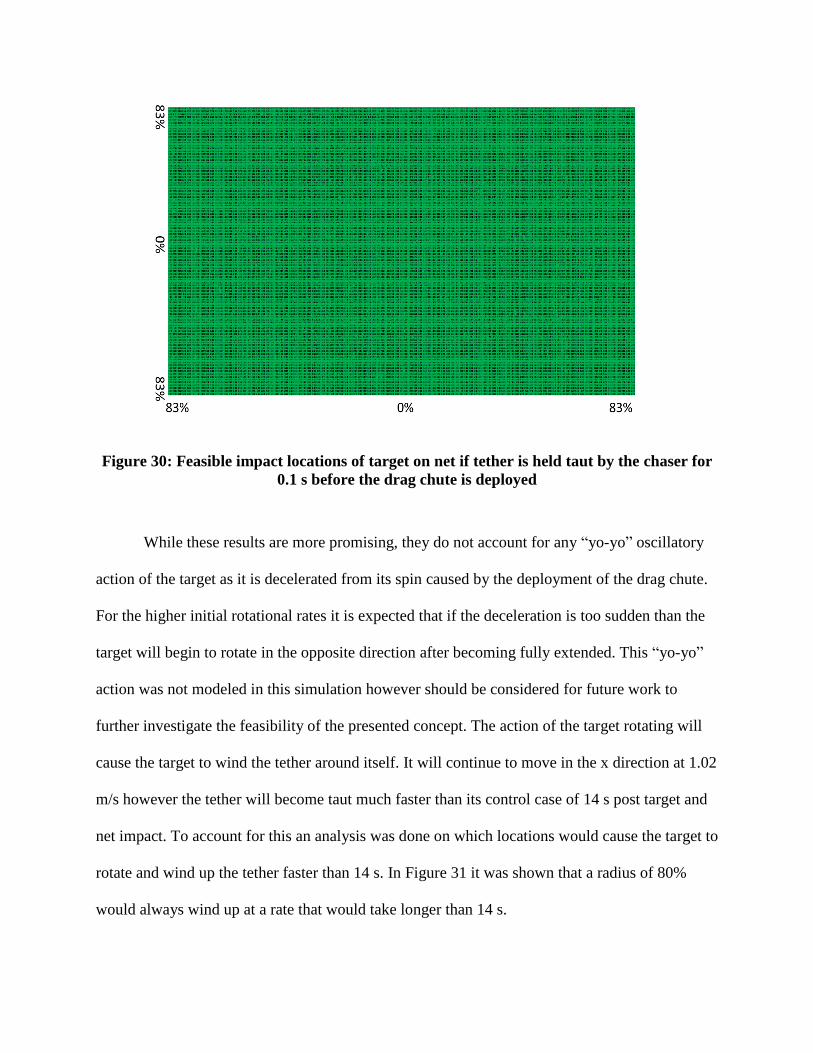
Figure 30: Feasible impact locations of target on net if tether is held taut by the chaser for
0.1 s before the drag chute is deployed
While these results are more promising, they do not account for any “yo-yo” oscillatory
action of the target as it is decelerated from its spin caused by the deployment of the drag chute.
For the higher initial rotational rates it is expected that if the deceleration is too sudden than the
target will begin to rotate in the opposite direction after becoming fully extended. This “yo-yo”
action was not modeled in this simulation however should be considered for future work to
further investigate the feasibility of the presented concept. The action of the target rotating will
cause the target to wind the tether around itself. It will continue to move in the x direction at 1.02
m/s however the tether will become taut much faster than its control case of 14 s post target and
net impact. To account for this an analysis was done on which locations would cause the target to
rotate and wind up the tether faster than 14 s. In Figure 31 it was shown that a radius of 80%
would always wind up at a rate that would take longer than 14 s.

Figure 31: Impact locations that induce an angular rate that would take longer than 14 s to
wind up the entire 100 m tether without accounting for target linear drift. The center is
denoted with a black square
After the data was analyzed using these criteria it was determined that the time needed to
be adjusted to account for the continued drift of the target as well. The updated results are seen in
Figure 35.
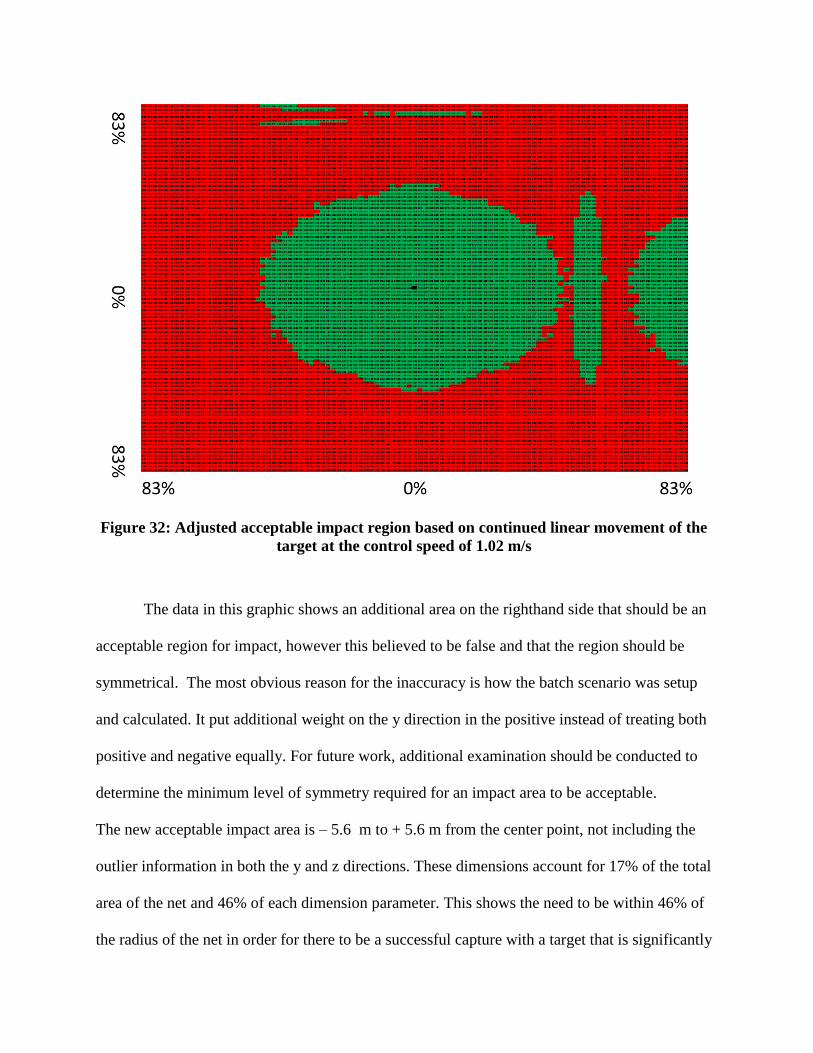
The data in this graphic shows an additional area on the righthand side that should be an
acceptable region for impact, however this believed to be false and that the region should be
symmetrical. The most obvious reason for the inaccuracy is how the batch scenario was setup
and calculated. It put additional weight on the y direction in the positive instead of treating both
positive and negative equally. For future work, additional examination should be conducted to
determine the minimum level of symmetry required for an impact area to be acceptable.
The new acceptable impact area is – 5.6 m to + 5.6 m from the center point, not including the
outlier information in both the y and z directions. These dimensions account for 17% of the total
area of the net and 46% of each dimension parameter. This shows the need to be within 46% of
the radius of the net in order for there to be a successful capture with a target that is significantly
Figure 32: Adjusted acceptable impact region based on continued linear movement of the
target at the control speed of 1.02 m/s

smaller than the net. Future work should look at the effects of different size nets on the same
target size and how that impacts the evaluation conducted here with induced angular rates and
impact zones.
The next area considered was the change in the target velocity. This area was considered
due to the expected variability in the deployment velocity of the bullets from the canister. The
results were as expected in that the total distance of the net and target from the chaser at the end
of the 300 s scenario is lower with a longer time between capture and drag chute deployment for
lower velocities and the opposite for greater velocities. The case of a target traveling at 2 m/s
was unsuccessful due to the equivalent velocity of the net vertex only being 1.62 m/s, as seen in
Table 8. A subset of the offset analysis was conducted for the new velocities and it showed that
at the same offset the target’s induced angular rate increased 27%. Also observed was the fact
that it took 22% longer for the net and target velocities to equalize. It was initially hypothesized
that a target moving slower would be better for chances to catch, however a target that is moving
only slightly less than the velocity of the net is best in this case to minimize induced angular
momentum.
The next aspect explored was the bullet angle. This was considered due to a possibility of
a tipoff angle upon deployment that would change the effective firing angle. The bullet
deployment angle analysis only changed the angle of bullet 1, which was the top right bullet as if
the observer was looking at the system down the x-axis towards -x. When adjusted from 5 to 10
degrees the range did not show any noticeable impacts on the overall system. The angles were
not adjusted to more drastic angles due to the expected hardware constraints of the firing
mechanism.

The last area considered for analysis was the bullet velocity. This area was considered
due to the likelihood of failures or small differences in friction in one of the bullet firing
mechanisms. Each bullet is fired using compressed air that if one leaked between launch and the
mission, that bullet would fire at a reduced velocity or not at all. Also considered were velocities
greater than expected in case a canister were not monitored and filled correctly and produced
more pressure than desired. The test looked at the differences in the velocity of only one bullet
between 1 m/s and 5 m/s where 3 m/s was the control case. The velocity of the one bullet was
simulated at 0.5 m/s intervals. The remaining three bullets were kept at the control of 3 m/s upon
initial firing. The case where one bullet does not fire at all was not simulated, however, was
theorized about. If one did not fire and was not released the net would return to strike the chaser
after reaching the maximum allowed distance of 28.2 m between two diagonal bullets. A better
setup of the system would allow remaining bullets to pull the bullet that was not fired. This case
most likely would not capture the target, however it also would not impact the chaser. Future
work should take a closer look at this dynamic.
The velocity adjustments were only conducted on the top right bullet as was done for the
angle adjustments previously discussed. For a decrease in the velocity of one bullet, it was
observed that it induced an angular rate in the target equivalent to an offset of the net. For a 1
m/s velocity of one of the bullets which is -2 m/s off the control case it was noted that the
angular rate was equivalent to an offset of +/- 1.8 m in the z and +/- 1.8 m in the y. A change of
only -0.5 m/s (2.5 m/s) showed a +/- 0.4 m/s in both directions. These results showed that there
was a nonlinear correlation between change in velocity and the equivalent net offset in the
induced angular rate. After impact with the target, it was observed that the time to equalize the
velocities was less for the greater changes, 12 s when going 1 m/s instead of 18 s when going 3

m/s. The remaining three bullets did increase the velocity of the slower bullet at the cost of some
of their own velocity. The overall velocity of the net was lower, but not drastically. The opposite
was observed during the case when the velocity of one bullet increased. There was a linear
correlation between the velocity change of one bullet and the velocity change of the net vertex.
The induced angular rate of the target from the impact shows the same equivalent net offset for
the same change in velocity: +/-0.5 m/s showed a +/- 0.4 m/s in both directions. Future research
should look at creating more resolution on the impacts of the variable velocity and look to vary
all four bullets within a given range simultaneously rather than just one.
Summary
In this chapter, the collected data was analyzed to determine the feasibility of the
proposed mission. It was shown that the greatest amount of adjustment to an orbit given the
proposed drag chute would be to reduce an 800 km altitude orbit to a lifetime of 7 years. Either a
1000 km altitude orbit needs a larger drag chute or an additional de-orbit propulsion system in
order to achieve the desired less than 25 years orbital lifetime. It was determined that an offset of
the net when it hits the target has the greatest impact on the likelihood of mission success.

V. Conclusions
Chapter Overview
In this chapter, a very condensed review of the research is presented first. Included are
the conclusions of the presented research as well as the significance of the findings.
Recommendations for actions to the research community are addressed as well as
recommendations for any future work in the area addressed by this research.
Conclusions of Research
Based on the background research presented in Chapter II, it was seen that the issue of
space debris is an ever-growing problem. The highest priorities are the sun-synchronous orbits
and their associated trash orbits at 89 deg 800 km and 92 deg 1000 km [2]. If 5-10 large debris
can be removed from LEO every year it can continue to be used with reduced risk of collision
with existing debris. Current projects to remove space debris cover a wide range of applications,
however, the main focus for this research is a net and tether concept. A few missions have been
proposed with expected launch dates to test some of the developing net and tether technologies
using independent satellites.
In Chapter III, the methodology of the research was presented. Covered were the
parameters used for the STK lifetime analysis of the expected debris for the orbits of interest.
Also explored were the methods used to create the simulation for the proposed concept mission.
The primary focus was the defining of the parameters and the equations for the state space
modeling of the non-linear problem.
Based on the results presented in Chapter IV, the proposed simulated mission is feasible
for a proof of concept mission based on these preliminary analysis. Given the current testing
standards for space hardware, concerns raised including the need to be within the center 17% of

the target upon impact is plausible with current technology based on the Level 6 TRL of net and
tether system based on the NASA SPHERES mission [42] [43]. The possibility to construct a
working system with current technology is also possible based on the background conducted and
the currently existing systems using similar hardware designs. The greatest challenge will be
incorporating existing hardware within the deployers in the correct configuration.
Based on the research it was also shown that there is a need and there is a possibility to
greatly affect targets of interest as presented by the space community. While some targets at the
1000 km altitude orbit may not be feasible for this mission type there are numerous targets at the
lower 800 km altitude which would pose the more immediate threat for collisions in the future. If
targets are only considered up to 800 km altitude, then only a drag chute would be required for
deorbit purposes and no additional propulsion is required.
Overall, the proposed mission appears feasible as a space debris removal mission while
the remaining issues of impact accuracy can be significantly reduced by test and further
simulations. Also, it is important to note that the control of the target and the chaser is possible
based on the LCROSS mission and CubeSat missions that have launched to date [33]. It can
work as a secondary mission mounted to an ESPA ring in the proposed configuration if
additional ADCS is added to maintain the stability of the chaser during net and/or target
deployment.
Significance of Research
The significance of the presented research is a new approach to tackling the problem of
active space debris removal. It presents the possibility of being a secondary mission to lower
overall debris removal mission costs. Also presented are currently feasible approaches that
would not require a significant amount of time to design and test to begin impacting the space

debris problem. A collaboration with some international partners, such as the Surry
RemoveDebris Project, could prove a feasible first mission within the next decade.
Recommendations for Action
It is recommended that greater fidelity modeling be conducted on the system that further
refines mission parameters. Also, active feedback and control devices should be incorporated
into this concept in order to analyze and correct certain parameters of the mission to account for
unforeseen circumstances. Some of these devices include distance monitoring of the target and
net as well as an ADCS system for the chaser and target.
Recommendations for Future Research
The presented research only scratches the surface of required research that can be
conducted in this area. Based on the results and analysis presented several specific opportunities
for future work are detailed out below. Some areas of further study are minor, and would only
add a small amount of refinement to the problem. However, others are larger would have a
greater impact on the mission design. Several of the concepts presented below have been
presented previously to facilitate the understanding of some decisions that were made in the
progress of the research and are re-iterated here for completeness and ease of reference.
One area of background research includes addressing why going after the largest objects
over just those objects with high collision probabilities or damage potentials was the preferable
approach. If repeated, the study may focus more on damage potentials from collisions. The
proposed analysis would be a simulation and computing intensive effort and may not be a cost-
effective approach for mission planning purposes.

Several areas regarding the design of the proposed mission are candidates for future
work. One area is to release the drag chute from the chaser before deploying the actual chute.
This can be done either before the tether goes taut, or once it goes taut. Based on the results
presented, it may be preferable to allow the tether to go taut for an undetermined time before
releasing the drag chute. To accomplish this idea, the drag chute would be encased in another
small CubeSat such as a 2U, which would deploy independently after a given condition, such as
when either a certain time or distance from the chaser had been achieved. If this scenario is
explored, additional work is also required into the torque induced on chaser from the target
through the tether.
Overall, the simulation can be improved with the inclusion of active feedback control in
the modeling to help determine the time required to combat the torques on the chaser and re-
align with the target for net deployment. The chaser would also have to combat the torque
imparted by the target when the tether goes taut as well as when the bullets are deployed.
Additional work into active feedback could be done on the system design allowing the system to
adapt to changes in the expected velocities and angles of deployment of the target, bullets and
net. Another area of future work would be to improve the resolution of the simulation. The target
deployment velocity difference is due to the resolution of the simulation and the time step used
in that phase. This also includes modeling the entire deorbit scenario and having the chaser
moving in the inertial frame as if it were orbiting, rather than keeping it static in the frame.
Some of the bigger impact areas that require additional work are accounting for the net
impacting the target at an angle off center, and what the resulting imparted angular rate would
be. Along with the imparted angular rate would be to examine more closely the potential for the
target to wind back up the tether after being unwound by the force of the drag chute and chaser.

To conduct this research, higher fidelity for the net and a more refined model that incorporates
the flexibility of the net connections, the tether and the drag chute.
In regards to more work on the net itself, if the proposed mission were to be executed, it
is recommended that the net be modelled as a more deformable body rather than the rigid body
presented in this research. The effects of difference size nets in relation to the same size target
should also be explored for planning purposes. The cost benefit analysis should be conducted on
the need for accuracy versus weight and likelihood of mission success.
Some areas of the presented research require refinement in future work. The most
significant of these is the analysis of net impact mapping. The net mapping presented in relation
to the impact offset should be symmetrical, however the results did not show this. Also, refining
how the bullets interact to allow for a bullet that was not fired to be dragged along by the other
bullets should also be incorporated. The refined model showing how the bullets are dragged in
certain cases would be most critical when looking at failure mode analysis. Future research
should look at creating more resolution on the impacts of the variable velocity of the bullets and
look to vary all four bullets within a given range simultaneously rather than just one. All areas
presented for future research are possible next steps in determining the feasibility of the proposed
mission.
Summary
In this research, it was theorized that a large piece of space debris could be captured by a
net and tether system launched as a secondary mission from a Centaur rocket ESPA ring chaser
and deorbited. It has been proven that the theory is feasible given certain constraining
parameters. Presented in this chapter was the significance of this research as well as areas for
future work related to the presented research and findings.

Bibliography
[1] A. Smith, "20 New Countries to Invest in Space Programs by 2025," Paris, 2016.
[2] J. -C. Liou, "An Active Debris Removal Parametric Study for LEO Environment Remediation,"
Advances in Space Research, vol. 47, pp. 1865-1876, 2011.
[3] M. Shan, J. Guo and E. Gill, "Review and comparison of active space debris capturing and removal
methods," Progress in Aerospace Sciences, no. 80, pp. 18-32, 2016.
[4] J. R. Wertz, D. F. Everett and J. J. Puschell, Eds., Space Mission Engineering: The New SMAD,
Hawthorne, California: Microcosm Press, 2011, p. 208.
[5] R. Benvenuto, S. Salavi and M. Lavagna, "Dynamics analysis and GNC design of flexible systems for
space debris removal," Acta Astronautica, no. 110, pp. 247-265, 2015.
[6] ESA, "E.DEORBIT," 12 April 2016. [Online]. Available:
http://www.esa.int/Our_Activities/Space_Engineering_Technology/Clean_Space/e.Deorbit.
[Accessed 20 April 2017].
[7] Aviospace, "CADET (CApture and DE-orbiting Technologies) test campaign video," 23 November
2015. [Online]. Available: http://www.aviospace.com/index.php/news/43-cadetvideo1. [Accessed 9
May 2016].
[8] J. Pelton, "The Space Debris Threat and the Kessler Syndrome," in Space Debris and Other Threats
from Outer Space, Springer, 2013, pp. 17-23.
[9] M. M. Castronuovo, "Active space debris removal - A preliminary mission analysis and design," Acta
Astronautica, no. 69, pp. 848-859, 2011.
[10] United Nations, "Technical Report on Space Debris," United Nations Publication, New York, 1999.
[11] M. Schmitz, S. Fasoulas and J. Ultzmann, "Performance Model for Space-Based Laser Debris
Sweepers," Acta Astronautica, vol. 115, pp. 376-383, 2015.
[12] NASA, "Orbital Debris Improtant Reference Documents," NASA and JSC, 10 August 2010. [Online].
Available: http://orbitaldebris.jsc.nasa.gov/library/references.html. [Accessed 11 April 2016].

[13] NASA, "Space Debris and Human Spacecraft," 26 September 2013. [Online]. Available:
http://www.nasa.gov/mission_pages/station/news/orbital_debris.html. [Accessed 9 May 2016].
[14] United Nations Office for Outer Space Affaris, "Space Debris Mitigation Guidelines of the Commitee
on the Peaceful Uses of Outer Space," Vienna, 2010.
[15] P. B. de Selding, Orbital Debris Experts Call for Space Junk Remocal Missions, 2013.
[16] A. T. Kearsley, G. A. Graham, M. J. Burchell, E. A. Taylor, G. Drolshagen, R. J. Charter and D.
McPhail, "MULPEX: A compact multi-layered polymer foil collector for micrometeoroids and
orbital debris," Advances in Space Research, no. 35, pp. 1270-1281, 2005.
[17] European Space Agency, "Space Debris," 20 April 2013. [Online]. Available:
http://www.esa.int/Our_Activities/Operations/Space_Debris/FAQ_Frequently_asked_questions.
[Accessed 11 April 2016].
[18] L. Morgan, "Elon Musk Wants to Launch a Fleedt of 4000 Satellites into Low Earth Orbit to Provide
Global Internet," 22 September 2015. [Online]. Available: https://nycnews.net/content/283297-
elon-musk-wants-launch-fleet-4000-satellites-low-earth-orbit-provide-global-internet. [Accessed 2
May 2016].
[19] German Aeropace Center, "Space Research," 27 June 2011. [Online]. Available:
http://www.dlr.de/dlr/en/desktopdefault.aspx/tabid-10196/342_read-265/#/gallery/283. [Accessed 9
May 2016].
[20] K. Yoshida and H. Nakanichi, "The TAKO (Target Collaborativise) Flyer: a New Concept for Future
Satellite Servicing," in 6th International Symposium on Artificial Intelligence and Robotics &
Automation in Space, Quebec, 2001.
[21] CADET, "Project Objectives," Aviospace, 2016. [Online]. Available:
http://www.aviospace.com/cadet/project-objectives/. [Accessed 9 May 2016].
[22] N. Zinner, A. Williamson, K. Brenner, C. B. John, A. Isaak, M. Knoch, A. Leppek and J. Lestishen,
"Junk Hunter: Autonomous Rendezvous, Capture, and De-Orbit of Orbital Debris," in AIAA Space
2011 Conference & Exposistion, Long Beach, 2011.
[23] R. Benvenuto and M. R. Lavagna, "Flexible Capture Devices for Medium to Large Debris Active
Removal: Simulations Results to Drive Experiments," Research Publications at Politecnico di
Milano, Milano, 2013.

[24] F. Zhang and P. Huang, "Segmented control for retrieval of space debris after captured by Tethered
Space Robot," IEEE, 28 September 2015. [Online]. Available:
http://ieeexplore.ieee.org/xpls/abs_all.jsp?arnumber=7354149&tag=1. [Accessed 9 May 2016].
[25] C. Henry, "NanoRacks to Deploy RemoveDebris Mission from ISS in 2017," 2016.
[26] N. Davis, "Space junk cleanup mission prepars for launch," 2016.
[27] S. Bandyopadhyay, S.-J. Chung and F. Y. Hadaegh, "Nonlinear Attitude Control of Spacecraft with a
Large Captured Object," Journal of Guidance, Control and Dynamics, vol. 39, no. 4, pp. 754-769,
April 2016.
[28] K. Barbaw, "Fishing for Space Junk: New Nets Capture Old Satellites," 10 04 2015. [Online].
Available: http://www.space.com/29070-space-junk-fishing-net-video.html. [Accessed 20 05
2016].
[29] The CubeSat Program, Cal Poly SLO, "Developer Resources," 06 04 2015. [Online]. Available:
http://www.cubesat.org/resources/. [Accessed 20 05 2016].
[30] Planetary Systems Corporation, "Canisterized Satellite Dispenser," [Online]. Available:
http://www.planetarysystemscorp.com/?post_type=product&p=448. [Accessed 20 05 2016].
[31] ASTRA, "CubeSat Technologies," Virtuallinda Media, [Online]. Available:
http://www.astraspace.net/tech-development/cubesat-technologies/. [Accessed 20 05 2016].
[32] H. J. Kramer, "AAReST," 2002. [Online]. Available:
https://directory.eoportal.org/web/eoportal/satellite-missions/a/aarest. [Accessed 20 05 2016].
[33] National Aeronautics and Space Administration, "Lunar Reconnaissance Orbiter: Leading NASA's
Way Back to the Moon; Lunar Crater Observation and Sensing Satellite: NASA's Mission to
Search for Water on the Moon," Huntsville, 2009.
[34] R. Crierie, "Centaur Upper Stage Family," 22 October 2012. [Online]. Available:
http://www.alternatewars.com/BBOW/Boosters/Centaur/Centaur.htm. [Accessed 11 January 2017].
[35] "Big Book of Warfare and other stuff," 22 October 2012. [Online]. Available:
http://www.alternatewars.com/BBOW/Boosters/Centaur/Centaur.htm. [Accessed 20 April 2017].

[36] Spaceflight , "Spaceflight, Inc. General Payload Users Guide," 22 May 2015. [Online]. Available:
http://www.spaceflight.com/wp-content/uploads/2015/05/SPUG-RevF.pdf. [Accessed 20 April
2017].
[37] L. Johnson, "Solar Sail Propulsion," 2012. [Online]. Available:
https://ntrs.nasa.gov/archive/nasa/casi.ntrs.nasa.gov/20120015076.pdf.
[38] MathWorks, "ODE45," The MathWorks, Inc., [Online]. Available:
https://www.mathworks.com/help/matlab/ref/ode45.html?requestedDomain=www.mathworks.com.
[Accessed 24 April 2017].
[39] "How to Calculate Drag in LEO using Matlab," Spacience, 1 March 2012. [Online]. Available:
http://spacience.blogspot.com/2012/03/how-to-calculate-drag-in-leo-using.html. [Accessed 3 May
2017].
[40] Systems Tool Kit, "Satellite Lifetime," January 2017. [Online]. Available:
http://help.agi.com/stk/index.htm#stk/tools-11.htm. [Accessed 19 January 2017].
[41] E. Swenson, R. Cobb, C. Hartsfield and J. Hess, Interviewees, Thesis Concpet Initial Orientation.
[Interview]. 11 April 2017.
[42] K. Costello, "International Space Station," NASA, 22 November 2016. [Online]. Available:
https://www.nasa.gov/mission_pages/station/reserach/experiments/2182.html. [Accessed 13 May
2017].
[43] B. Dunbar, "Technology Readiness Level," NASA, 31 July 2015. [Online]. Available:
https://www.nasa.gov/directorates/heo/scan/engineering/technology/txt_accordion1.html.
[Accessed 13 May 2017].

REPORT DOCUMENTATION PAGE Form Approved OMB No. 074-0188
The public reporting burden for this collection of information is estimated to average 1 hour per response, including the time for reviewing instructions, searching existing data sources, gathering and maintaining the data needed, and completing and reviewing the collection of information. Send comments regarding this burden estimate or any other aspect of the collection of information, including suggestions for reducing this burden to Department of Defense, Washington Headquarters Services, Directorate for Information Operations and Reports (0704-0188), 1215 Jefferson Davis Highway, Suite 1204, Arlington, VA 22202-4302. Respondents should be aware that notwithstanding any other provision of law, no person shall be subject to any penalty for failing to comply with a collection of information if it does not display a currently valid OMB control number. PLEASE DO NOT RETURN YOUR FORM TO THE ABOVE ADDRESS.
1. REPORT DATE (DD-MM-YYYY)
15-06-2017
2. REPORT TYPE Master’s Thesis
3. DATES COVERED (From – To) 24 Aug 2016 to 15 Jun 2017
4. TITLE AND SUBTITLE Analysis Of An Experimental Space Debris Removal Mission
5a. CONTRACT NUMBER
5b. GRANT NUMBER
5c. PROGRAM ELEMENT NUMBER
6. AUTHOR(S) Roth, Krista L, L. Capt, USAF
5d. PROJECT NUMBER NA
5e. TASK NUMBER
5f. WORK UNIT NUMBER
7. PERFORMING ORGANIZATION NAMES(S) AND ADDRESS(S) Air Force Institute of Technology
Graduate School of Engineering and Management (AFIT/EN)
2950 Hobson Way, Building 640
WPAFB OH 45433-8865
8. PERFORMING ORGANIZATION REPORT NUMBER AFIT-ENY-MS-17-J-071
9. SPONSORING/MONITORING AGENCY NAME(S) AND ADDRESS(ES) None
10. SPONSOR/MONITOR’S ACRONYM(S)
11. SPONSOR/MONITOR’S REPORT NUMBER(S)
12. DISTRIBUTION/AVAILABILITY STATEMENT
DISTRIBUTION STATEMENT A
13. SUPPLEMENTARY NOTES This material is declared a work of the U.S. Government and is not subject to copyright protection in
the United States.
14. ABSTRACT Encountering space debris is an ever-increasing problem in space exploration and exploitation, especially in Low Earth Orbit. While many space-faring governing bodies have attempted to control the orbital lifetime post mission completion of satellites and rocker bodies, objects already in orbit pose a danger to future mission planning. Currently, governments and academic institutions are working to develop missions to remove space debris; however, the proposed missions are typically costly primary missions. This research proposes an alternative to use an upper stage rocket, to be called a chaser, already launching a primary mission near the desired debris as a host for a removal mission. This research models the alternative system as an experimental test concept deploying a target from the Evolved Expendable Launch Vehicle Secondary Payload Adapter ring. A net and tether system is deployed towards the target to capture it, and at the opposite end of the tether is released a drag chute to deorbit the target. Once the capture method is proven with a cooperative body through experimentation, the target can then be an uncooperative piece of space debris of any size. The orbital life of a dead rocket body in an 800 km sun synchronous orbit can theoretically be reduced from approximately 500 years to less than a year using this method. This proposed concept is new in that it is planned as a secondary mission and the majority of the mission components will not separate from the Payload Adapter ring. This research’s initial model predictions show feasibility for this new concept.
15. SUBJECT TERMS Space Debris, Modeling and Simulation, Net and Tether
16. SECURITY CLASSIFICATION OF: 17. LIMITATION OF ABSTRACT
UU or SAR
18. NUMBER OF PAGES
95
19a. NAME OF RESPONSIBLE PERSON Researcher, Eric Swenson, PhD
a. REPORT
U
b. ABSTRACT
U
c. THIS PAGE
U
19b. TELEPHONE NUMBER (Include area code) (937) 255-6565, x 3329 ([email protected])
Standard Form 298 (Rev. 8-98) Prescribed by ANSI Std. Z39-18


![Mission Manager[1]](https://static.fdokumen.com/doc/165x107/6313fe215cba183dbf075a68/mission-manager1.jpg)