The effect of subject awareness and prior slip experience on tribometer-based predictions of slip...
10
DTD 5 The effect of subject awareness and prior slip experience on tribometer-based predictions of slip probability Gunter P. Siegmund a,b, * , Tamika L. Heiden b , David J. Sanderson b , J. Timothy Inglis b , John R. Brault c a MEA Forensic Engineers & Scientists, 11-11151 Horseshoe Way, Richmond, BC, Canada V7A 4S5 b School of Human Kinetics, University of British Columbia, 210-6081 University Blvd., Vancouver, BC, Canada V6T 1Z1 c MEA Forensic Engineers & Scientists, 21076 Bake Parkway, Suite 106 Lake Forest, CA 92630, USA Received 17 May 2005; received in revised form 6 August 2005; accepted 14 August 2005 Abstract Prior knowledge of potentially slippery conditions has been shown to alter normal human gait in slip and fall experiments. We sought to quantify how the empirical relationship between slip probability and available floor friction was affected by subject awareness and prior slip experience. Sixty-eight subjects (40 females, 28 males) walked over three different low-friction surfaces inserted periodically between non- slip control trials. Three increasing levels of prior knowledge were used: deceived (unaware of the slippery surface), aware (20% chance of a slippery surface, but no prior slip experience) and experienced (aware with prior slip experience). Available friction was measured using a drag sled and a variable incidence tribometer. Of 620 low-friction trials, 124 generated slips greater than 27 mm. The proportion of slips, the slip distance and the required friction (taken from the control trial immediately before a low-friction trial) generally decreased with increasing levels of prior knowledge. These adaptations were accommodated by logistically regressing slip outcome (yes/no) against the normalized friction (available friction minus required friction) rather than against available friction alone. The regressions showed that subject awareness biased the slip probability curve toward a lower slip risk for a given normalized friction, but that the subsequent addition of slip experience generated a slip risk curve that was not significantly different from that of deceived (and presumably unprepared) subjects. These findings suggest that data to validate a tribometer’s ability to predict the risk of slipping (but not falling) can be acquired from subjects with prior slip experience. # 2005 Elsevier B.V. All rights reserved. Keywords: Slip and fall; Tribometers; Gait adaptations; Slip prediction 1. Introduction Slips and slip-related falls are responsible for many musculoskeletal injuries [1,2] and typically develop when the friction at the shoe/floor interface is less than expected [3,4]. Floor surface friction can be measured using a device called a tribometer, of which more than 50 different types exist [1]. Although tribometers are designed to measure friction, the values measured by different tribometers often vary considerably—even when identical test feet, flooring materials and contaminants are used [5–8]. As a result of this inter-tribometer variability, a tribometer’s validity must be established before its measurements can be used to predict the probability of a slip on a particular surface. Numerous studies have attempted to correlate the friction measured with a tribometer to the occurrence or severity of slips in ambulating human subjects [9–16]. Although these studies have shown that more slips and longer slips (more likely to lead to a fall) occur when floor friction is low, only one study used sufficient subjects, trials and friction conditions to establish an empirical relationship between tribometer measurements and the probability of slipping and falling [12]. Unfortunately, the www.elsevier.com/locate/gaitpost Gait & Posture xxx (2005) xxx–xxx * Corresponding author. Tel.: +1 604 277 3040; fax: +1 604 277 3020. E-mail address: [email protected] (G.P. Siegmund). 0966-6362/$ – see front matter # 2005 Elsevier B.V. All rights reserved. doi:10.1016/j.gaitpost.2005.08.005 GAIPOS-2153; No of Pages 10
-
Upload
universityofwesternaustralia -
Category
Documents
-
view
2 -
download
0
Transcript of The effect of subject awareness and prior slip experience on tribometer-based predictions of slip...

DTD 5
www.elsevier.com/locate/gaitpost
Gait & Posture xxx (2005) xxx–xxx
The effect of subject awareness and prior slip experience on
tribometer-based predictions of slip probability
Gunter P. Siegmund a,b,*, Tamika L. Heiden b, David J. Sanderson b,J. Timothy Inglis b, John R. Brault c
a MEA Forensic Engineers & Scientists, 11-11151 Horseshoe Way, Richmond, BC, Canada V7A 4S5b School of Human Kinetics, University of British Columbia, 210-6081 University Blvd., Vancouver, BC, Canada V6T 1Z1
c MEA Forensic Engineers & Scientists, 21076 Bake Parkway, Suite 106 Lake Forest, CA 92630, USA
Received 17 May 2005; received in revised form 6 August 2005; accepted 14 August 2005
Abstract
Prior knowledge of potentially slippery conditions has been shown to alter normal human gait in slip and fall experiments. We sought to
quantify how the empirical relationship between slip probability and available floor friction was affected by subject awareness and prior slip
experience. Sixty-eight subjects (40 females, 28 males) walked over three different low-friction surfaces inserted periodically between non-
slip control trials. Three increasing levels of prior knowledge were used: deceived (unaware of the slippery surface), aware (20% chance of a
slippery surface, but no prior slip experience) and experienced (aware with prior slip experience). Available friction was measured using a
drag sled and a variable incidence tribometer. Of 620 low-friction trials, 124 generated slips greater than 27 mm. The proportion of slips, the
slip distance and the required friction (taken from the control trial immediately before a low-friction trial) generally decreased with increasing
levels of prior knowledge. These adaptations were accommodated by logistically regressing slip outcome (yes/no) against the normalized
friction (available friction minus required friction) rather than against available friction alone. The regressions showed that subject awareness
biased the slip probability curve toward a lower slip risk for a given normalized friction, but that the subsequent addition of slip experience
generated a slip risk curve that was not significantly different from that of deceived (and presumably unprepared) subjects. These findings
suggest that data to validate a tribometer’s ability to predict the risk of slipping (but not falling) can be acquired from subjects with prior slip
experience.
# 2005 Elsevier B.V. All rights reserved.
Keywords: Slip and fall; Tribometers; Gait adaptations; Slip prediction
1. Introduction
Slips and slip-related falls are responsible for many
musculoskeletal injuries [1,2] and typically develop when the
friction at the shoe/floor interface is less than expected [3,4].
Floor surface friction can be measured using a device called a
tribometer, of which more than 50 different types exist [1].
Although tribometers are designed to measure friction, the
values measured by different tribometers often vary
considerably—even when identical test feet, flooring
* Corresponding author. Tel.: +1 604 277 3040; fax: +1 604 277 3020.
E-mail address: [email protected] (G.P. Siegmund).
0966-6362/$ – see front matter # 2005 Elsevier B.V. All rights reserved.
doi:10.1016/j.gaitpost.2005.08.005
materials and contaminants are used [5–8]. As a result of
this inter-tribometer variability, a tribometer’s validity must
be established before its measurements can be used to predict
the probability of a slip on a particular surface.
Numerous studies have attempted to correlate the
friction measured with a tribometer to the occurrence or
severity of slips in ambulating human subjects [9–16].
Although these studies have shown that more slips and
longer slips (more likely to lead to a fall) occur when floor
friction is low, only one study used sufficient subjects,
trials and friction conditions to establish an empirical
relationship between tribometer measurements and the
probability of slipping and falling [12]. Unfortunately, the
GAIPOS-2153; No of Pages 10
G.P. Siegmund et al. / Gait & Posture xxx (2005) xxx–xxx2
DTD 5
results of this latter study are difficult to apply outside the
laboratory for three reasons. First, the tribometer used in
the study is a research instrument and not available
commercially. Second, most of the slip trials were
acquired on a sloped surface and humans alter their
normal gait on sloped surfaces [17,18]. And finally, the
subjects were aware of the slippery surfaces and had prior
experience slipping on these surfaces, two factors that
generate anticipatory gait changes and alter the prob-
ability of recovery after a slip [19–22].
The goal of this study was to quantify how the empirical
relationship between the probability of slipping and
tribometer-based measurements of floor friction is affected
by the awareness and prior slip experience of human
subjects. To improve on previous work [12], floor friction
was quantified using two commonly-available tribometers
and all trials were conducted on a level floor surface. Given
prior evidence of a more cautious gait on potentially slippery
surfaces [19–22], we hypothesized that subjects who
encountered a slippery floor unexpectedly would have a
greater probability of slipping than either subjects who were
aware of the slippery surface or subjects who had recent slip
experience. The results of this study will help provide
validation data for two common tribometers and will show
whether experiments designed to validate tribometers need
to control their experimental conditions or correct their data
for subject awareness and experience.
2. Methods
Sixty-eight healthy subjects (40 females, 28 males)
between 18- and 40-year-old participated in this study. The
females were 25 � 6-year-old (mean � S.D.), 165 � 6 cm
tall and had a mass of 61 � 12 kg; the males were 27 � 5-
year-old, 177 � 5 cm tall and had a mass of 77 � 8 kg.
Subjects reported no history of dizziness, vestibular
dysfunction, neurological disorders, low-back pain or
orthopaedic abnormalities of the lower extremities. All
subjects read and signed an informed consent form
approved by the university’s Clinical Research Ethics
Board.
2.1. Instrumentation
Ground reaction forces were measured using a force plate
(Bertec 4060H, Columbus, OH) embedded near the middle
of a 10 m walkway. Force plate signals were low-pass
filtered (1000 Hz) before being sampled simultaneously
using a 12-bit data acquisition system (Win30 DAQ, United
Electronics Incorporated, Watertown, MA) at 2400 Hz for
6 s. Overhead harness loads were measured using a uni-axial
load cell (Artech SS20210, Riverside, CA). Sagittal-plane
motion of a heel marker on the left shoe was measured from
video data acquired at 60 Hz (Sony Digital 8 DCR-
TRV320).
2.2. Slip apparatus
The walkway was clad in vinyl composition tile over a
concrete sub-floor. Four levels of shoe/floor friction were
achieved using 40 cm � 60 cm sheets of paper placed on a
40 cm � 60 cm polished aluminum plate mounted to the top
of the force plate, level with the surrounding floor. The
visible surface of all paper sheets was identical and consisted
of 600 grit sandpaper to eliminate sliding between the shoe
and paper. Glued to the back of the sandpaper were four
materials: wax paper, office printer paper, nothing (the
backing of the sandpaper was used) and aluminum foil. The
latter material was used as the non-slip surface for normal
walking trials; the three other surfaces represented a range of
low-friction surfaces for slip trials.
2.3. Test procedures
Subjects wore appropriately-sized lace-up trainers with a
polyurethane rubber sole (Nike 2530c Air Pegasus). A start
position was selected to ensure the left limb struck the force
plate after at least five steps. Subjects were instructed to
walk with a level gaze at their preferred speed and to not
target the force plate. Normal light levels were used since it
was not possible to discern the friction level from the
outward appearance of the paper on the slip plate. A
different paper sheet was used for every trial to prevent
subjects from potentially identifying friction levels from
blemishes or marks on the sandpaper surfaces. Subjects
wore a safety harness tethered from each shoulder to an
overhead trolley. Tether length was adjusted to minimize
interference with normal walking.
All subjects completed 40 trials (4 blocks � 10 trials/
block). Subjects accommodated to wearing the harness and
walking over the high friction surface during the first block and
their normal gait was measured during the second block.
Despite being told there would be no slips in the first two
blocks, one of the three low-friction surfaces (randomly
selected) was inserted for the last trial of the second block.
After this deception, subjects were told that two low-friction
surfaces (the same friction level experienced in their deception
trial) would be inserted randomly in the third block. All
subjects were then exposed once to each of the three low-
friction surfaces during the fourth block. The first 46 subjects
also completed two additional blocks of 10 trials: one at a self-
selected slow walking speed and the other at a self-selected
fast walking speed. All three low-friction surfaces were
presented once in each additional block. These trials were used
to generate a broader range of walking data. The presentation
order of the slow, normal and fast blocks (4th, 5th and 6th
blocks) was randomized in these 46 subjects.
2.4. Tribometer measurements
Friction between the paper sheets and the aluminum force
plate surface was measured using two tribometers: a

G.P. Siegmund et al. / Gait & Posture xxx (2005) xxx–xxx 3
DTD 5
Fig. 1. Photographs of the drag sled (top) and variable incidence tribometer
(bottom).
drag sled (DS) designed in accordance with the National
Standards of Canada CAN2-75.1-M77, and a variable inci-
dence tribometer (VIT; English XL, William English Inc.,
Alva, FL). The DS consisted of a 15 kg mass pulled at a
constant speed, whereas the VIT had a pneumatically
actuated test foot that strikes the ground and either sticks
or slips depending on the initial angle of the actuator
(Fig. 1). Each surface was tested with each tribometer
three times per day for 13 days (n = 39 tests per surface/
tribometer combination). The force plate surface was
cleaned prior to each tribometer test (and each human
subject test). The available friction (mavailable) measured
by the DS was computed from the force plate data using
Eq. (1), whereas the friction measured by the VIT
was read directly from the scale on the VIT. Both
tribometers distinguished between the three low-friction
surfaces and ranked them in the same order of slipperiness
(Table 1). The friction of the aluminum foil surface used
Table 1
Mean (S.D.) of friction values measured for the three low-friction surfaces
using the two tribometers
Tribometer Wax paper Office paper Sandpaper back
Drag sled (DS) 0.101 (0.011) 0.150 (0.035) 0.181 (0.039)
Variable incidence
tribometer (VIT)
0.118 (0.013) 0.167 (0.020) 0.191 (0.017)
for non-slip trials was 0.6. For reference, the typical friction of
wet ice is 0.05–0.1 and dry concrete is 0.7–0.8.
mavailable ¼
ffiffiffiffiffiffiffiffiffiffiffiffiffiffiffiffiF2
x þ F2y
q
Fz(1)
where mavailable, available friction; Fx, horizontal force in AP
direction; Fy, horizontal force in ML direction; Fz, vertical
force.
2.5. Analysis
All low-friction trials were classified as either a fall,
slip or non-slip trial. A fall occurred if harness load
reached 50% of body weight [14]. Slips and non-slips
were differentiated using the forward displacement of
the heel marker after heel strike (mediolateral displace-
ments were ignored). The distance used to distinguish
slips from non-slips was determined using a logistic
regression of slip distance against the experimenter’s
(TLH) judgment of slip for each subject’s deception trial.
Since all non-slip trials (n = 44) had heel displacements
<23 mm and all slip trials (n = 20) had heel displacements
>32 mm, the slip distance (27 mm) associated with a 50%
slip probability yielded positive and negative predictive
values of 100%. Four deception trials were not included in
this analysis because the slip limb did not land wholly on
the paper.
To test for differences in the number of slips on each low-
friction surface, chi-square tests for homogeneity were
performed on the 3 � 2 (friction level � slip type)
contingency tables. Post hoc analyses were performed
using simple 2 � 2 chi-square comparisons to identify
inter-surface differences. Differences in the number of slips
generated on a specific surface across repeated exposures
were assessed using a Cochran Q-test. The omnibus chi-
square analyses were evaluated non-directionally at a
significance level of a = 0.05. The significance levels for
the non-directional post hoc chi-square tests were adjusted
for the number of post hoc comparisons using a Bonferroni
adjustment. Post hoc differences in the Cochran Q-test were
evaluated directionally (a decrease in slip rate was
expected) using a modified Bonferroni–Dunn method
(CDC) [23].
To develop the empirical relationships needed to
predict the probability of slipping from a tribometer’s
measurement of friction, separate logistic regression
analyses were performed for available and normalized
friction (Eqs. (2a) and (2b), respectively). Available
friction was measured directly by the tribometer. Normal-
ized friction was defined as the difference between the
available and required frictions (mavailable � mrequired) [12].
Required friction was determined from the high-friction
trial immediately preceding a low-friction trial (whether
or not a slip occurred during the low-friction trial), and
was computed from the force plate data (Fig. 2) as the

G.P. Siegmund et al. / Gait & Posture xxx (2005) xxx–xxx4
DTD 5
Fig. 2. Sample ground reaction data for four trials: (a) the trial preceding the deception slip trial; (b) the deception slip trial; (c) the trial preceding an
experienced slip trial; (d) the slip trial with prior experience. The short horizontal line below the friction in panel a shows the period over which average friction
is calculated. All data from a single subject. Heel strike occurs at time zero. Vertical force Fz; M-L, mediolateral force Fy; A-P, anterior–posterior force Fx;
Friction, utilized friction m.
average friction over the 100 ms following slip limb heel
strike in the high-friction trial.
PðslipÞ ¼ expðb0 þ b1mavailableÞ1 þ expðb0 þ b1mavailableÞ
(2a)
PðslipÞ ¼expðb0 þ b1ðmavailable � mrequiredÞÞ
1 þ expðb0 þ b1ðmavailable � mrequiredÞÞ(2b)
where P(slip), probability of slipping; b0, intercept coef-
ficient of the logit model; b1, slope coefficient of the logit
model; mavailable, available friction; mrequired, required
friction.
For each tribometer, separate logistic regressions were
computed using three groups of data: (i) the deception (D)
trials (n = 64), which were assumed to represent the
probability of actual unexpected slips; (ii) the aware (A)
trials (n = 195), in which subjects were aware the surface
was potentially slippery but had no prior slip experience;
(iii) the experienced (E) trials (n = 361), in which subjects
were both aware of a potentially slippery surface and had
prior slip experience. Differences in the b0 and b1
coefficients between the three groups were evaluated using
a Wald statistic if the residual variations were not
significantly different between groups [24]. If the residual
variations were different, a likelihood ratio test was
performed to determine if at least one of the coefficients
was different [24]. Regression analyses were conducted
using Statistica (v6.1, Statsoft, Tulsa, OK) and comparisons
between coefficients were performed at the p < 0.05 level.
Confidence bands for the regressions were computed using
variance–covariance matrices [25].
3. Results
Slips occurred in 31 (17%) of 181 low-friction trials in
Blocks 2 and 3; no falls occurred in this study. Within these

DTD 5
Fig. 3. Proportion of low-friction trials generating a slip for (a) the three surfaces (wax paper, office paper, sandpaper back) during the first three exposures, and
(b) the three levels of subject awareness (deceived, aware and experienced). Data from the first exposure and deceived condition are identical. The second and
third exposures were under aware and possibly experienced conditions in Block 3. The aware and experienced conditions in (b) consist of all slip trials from all
blocks. The symbol (*) designates significant difference in proportion of slips between surface types; the symbol (**) designates significant difference in
proportion of slip between exposure or prior knowledge conditions.
Table 2
Number of trials (%) within a range of slip distances for deceived, aware and
experienced groups
Slip distance (mm) Deceived Aware Experienced
�15 to 0 0 (0.0%) 6 (3.1%) 22 (6.1%)*
0 to 13 28 (43.8%) 119 (61.0%)* 220 (60.9%)*
13 to 27 16 (25.0%) 34 (17.4%) 51 (14.1%)*
27 to 50 4 (6.3%) 5 (2.6%) 15 (4.2%)
50 to 100 6 (9.4%) 6 (3.1%)* 12 (3.3%)*
100 to 200 0 (0.0%) 7 (3.6%) 13 (3.6%)
200 to 525 10 (15.6%) 18 (9.2%) 28 (7.8%)*
Total 64 195 361
* Significantly different from deceived, p < 0.05.
first three low-friction trials, the wax paper surface generated
proportionally more slips than the other two low-friction
surfaces in the first and second exposures ( p < 0.0036), but
not in the third exposure ( p > 0.072) (Fig. 3a). The
proportion of slips decreased between the first and second
exposures to both the wax paper and sandpaper backing
surfaces ( p = 0.0011 and 0.017, respectively; Fig. 3a). No
reduction in the proportion of slips was observed across the
three exposures to the office paper surface ( p = 0.19) or
between the second and third exposure to the wax paper
surface ( p = 0.15). Required friction in the trials preceding
the first three low-friction exposures did not vary with
surface type, but did decrease from 0.183 � 0.022 to
0.170 � 0.030 between the first and second exposures
( p = 0.0005). It did not decrease between the second and
third exposures (0.171 � 0.027; p = 0.85).
When data from all low-friction trials (n = 620) were
grouped according to a subject’s prior knowledge level, the
proportion of slips decreased with awareness for the
sandpaper backing surface ( p = 0.003), but not for the wax
or office paper surfaces ( p = 0.074 and 0.093, respectively)
(Fig. 3b). The addition of slip experience reduced the
proportion of slips for the wax paper surface ( p = 0.035). For
all levels of prior knowledge, the proportion of slips was
higher on the wax paper than on the other two surfaces
( p < 0.0012). Slip distances diminished between the D and A
conditions, but not between the A and E conditions (Table 2).
The required friction decreased from 0.183 � 0.022 for D
trials to 0.172 � 0.029 for A trials ( p = 0.008) and decreased
again to 0.162 � 0.024 for E trials ( p < 0.001). Data from the
last three blocks of the 46 subjects who walked across all three
low-friction surfaces at slow, normal and fast walking speeds
indicated that slip distance did not vary with walking speed
and required friction did not vary with either walking speed or
surface type.
Based on the logistic regression analyses, the probability
of slipping was significantly related to both available and
normalized friction ( p < 0.0001). Despite being significant,
the available friction regressions (Fig. 4a and b; Table 3)
were inferior to the normalized friction regressions (Fig. 4c
and d; Table 4). First, there were only three discrete levels of
available friction with a relatively narrow range (0.10–0.19;
Table 1), whereas a relatively wide range of required friction
values (0.04–0.29) produced normalized friction values that
were more continuously and broadly distributed (�0.14–
0.15). Second, the regression coefficients for the available
friction regressions had standard errors 1.1–5.2 (average 2.6)
times larger than the normalized friction regressions. And
finally, the discrete nature of mavailable yielded regressions
that predicted no slips for any of the A or E trials despite a
19% slip rate in both data sets. For these reasons, the
available friction regressions were not pursued further.
G.P. Siegmund et al. / Gait & Posture xxx (2005) xxx–xxx6
DTD 5
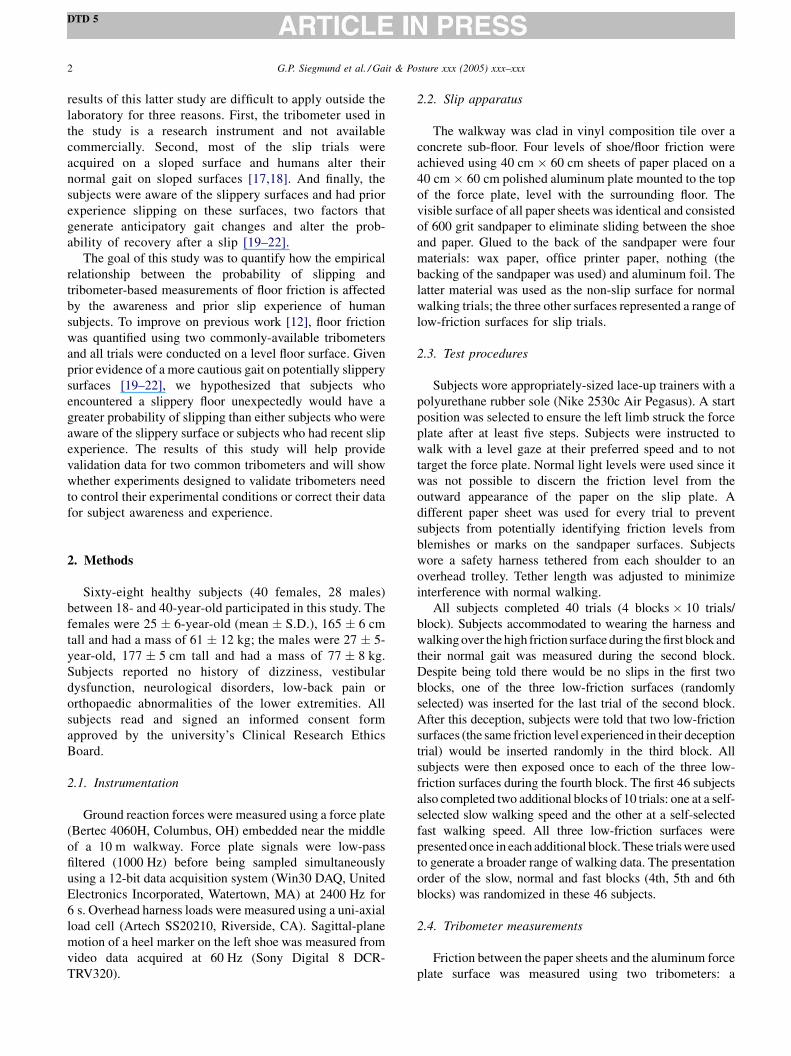
Fig. 4. Probability of slipping as a function of available friction (a and b) and normalized friction (c and d) for the drag sled (a and c) and variable incidence
tribometer (English XL) (b and d) using the deceived, aware and experienced data sets.
The normalized friction associated with a 50% prob-
ability of slipping was largest for the D trials and smallest for
the E trials for both tribometers (Table 4; Fig. 4c and d).
Residual variations were not significantly different between
either the D and A groups or the D and E groups, and thus
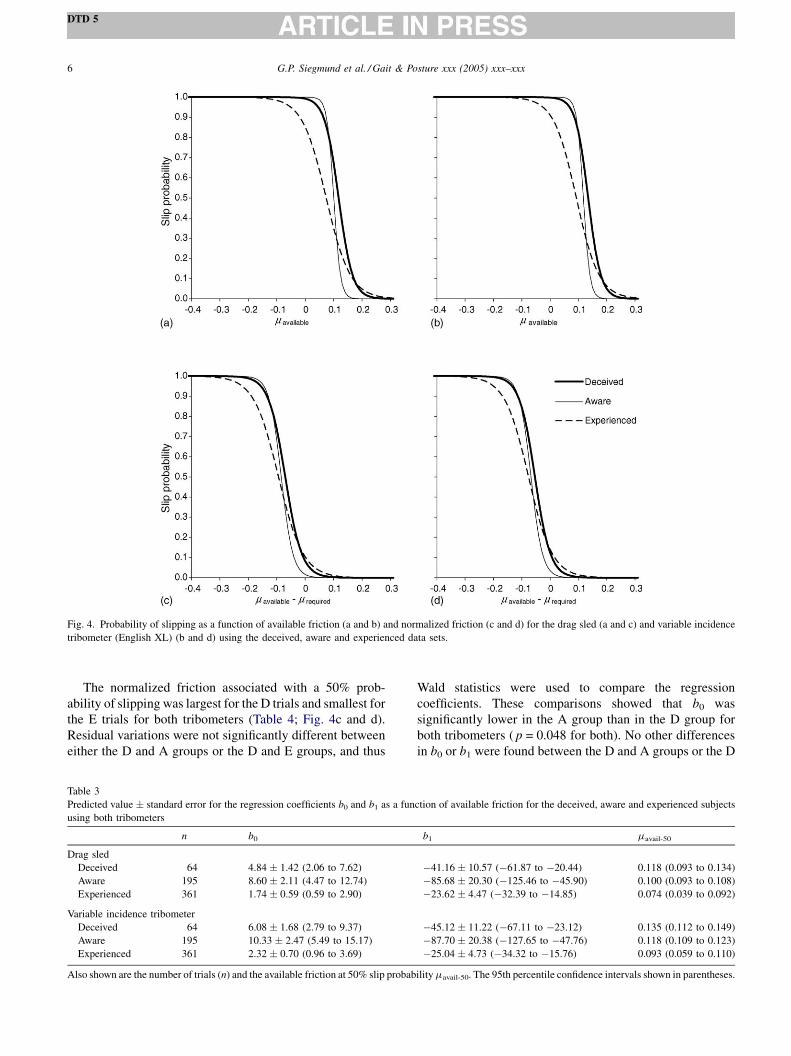
Table 3
Predicted value � standard error for the regression coefficients b0 and b1 as a fun
using both tribometers
n b0
Drag sled
Deceived 64 4.84 � 1.42 (2.06 to 7.62)
Aware 195 8.60 � 2.11 (4.47 to 12.74)
Experienced 361 1.74 � 0.59 (0.59 to 2.90)
Variable incidence tribometer
Deceived 64 6.08 � 1.68 (2.79 to 9.37)
Aware 195 10.33 � 2.47 (5.49 to 15.17)
Experienced 361 2.32 � 0.70 (0.96 to 3.69)
Also shown are the number of trials (n) and the available friction at 50% slip probab
Wald statistics were used to compare the regression
coefficients. These comparisons showed that b0 was
significantly lower in the A group than in the D group for
both tribometers ( p = 0.048 for both). No other differences
in b0 or b1 were found between the D and A groups or the D
ction of available friction for the deceived, aware and experienced subjects
b1 mavail-50
�41.16 � 10.57 (�61.87 to �20.44) 0.118 (0.093 to 0.134)
�85.68 � 20.30 (�125.46 to �45.90) 0.100 (0.093 to 0.108)
�23.62 � 4.47 (�32.39 to �14.85) 0.074 (0.039 to 0.092)
�45.12 � 11.22 (�67.11 to �23.12) 0.135 (0.112 to 0.149)
�87.70 � 20.38 (�127.65 to �47.76) 0.118 (0.109 to 0.123)
�25.04 � 4.73 (�34.32 to �15.76) 0.093 (0.059 to 0.110)
ilitymavail-50. The 95th percentile confidence intervals shown in parentheses.
G.P. Siegmund et al. / Gait & Posture xxx (2005) xxx–xxx 7
DTD 5
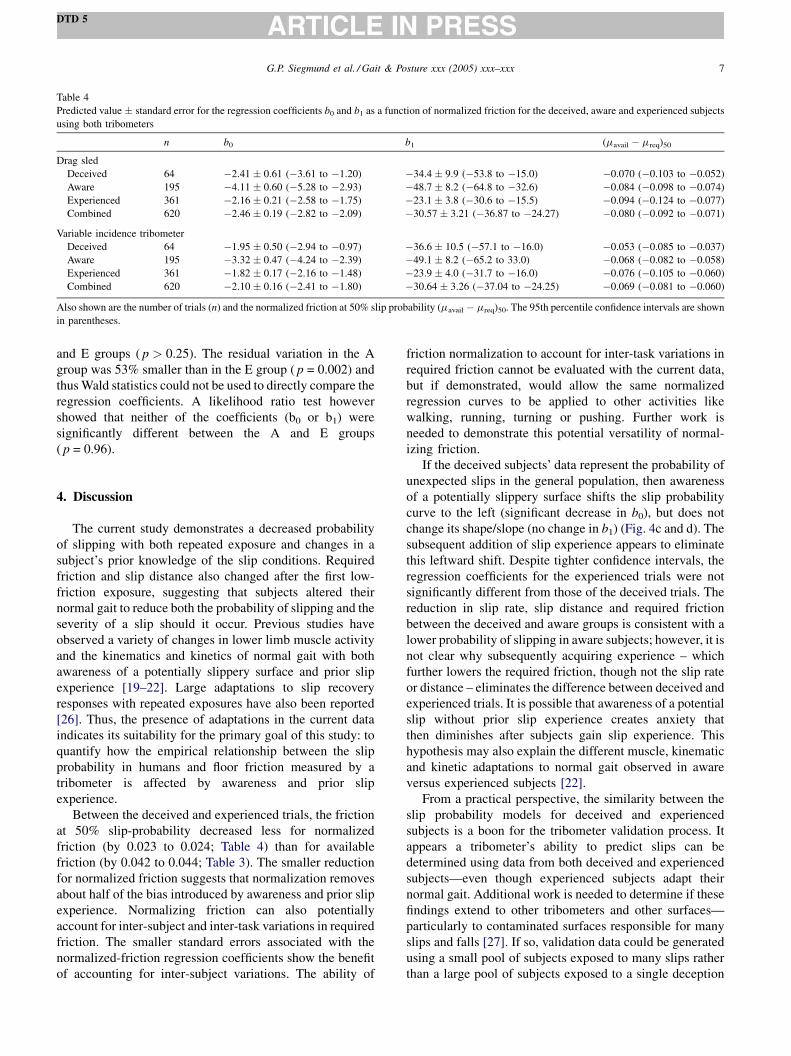
Table 4
Predicted value � standard error for the regression coefficients b0 and b1 as a function of normalized friction for the deceived, aware and experienced subjects
using both tribometers
n b0 b1 (mavail � mreq)50
Drag sled
Deceived 64 �2.41 � 0.61 (�3.61 to �1.20) �34.4 � 9.9 (�53.8 to �15.0) �0.070 (�0.103 to �0.052)
Aware 195 �4.11 � 0.60 (�5.28 to �2.93) �48.7 � 8.2 (�64.8 to �32.6) �0.084 (�0.098 to �0.074)
Experienced 361 �2.16 � 0.21 (�2.58 to �1.75) �23.1 � 3.8 (�30.6 to �15.5) �0.094 (�0.124 to �0.077)
Combined 620 �2.46 � 0.19 (�2.82 to �2.09) �30.57 � 3.21 (�36.87 to �24.27) �0.080 (�0.092 to �0.071)
Variable incidence tribometer
Deceived 64 �1.95 � 0.50 (�2.94 to �0.97) �36.6 � 10.5 (�57.1 to �16.0) �0.053 (�0.085 to �0.037)
Aware 195 �3.32 � 0.47 (�4.24 to �2.39) �49.1 � 8.2 (�65.2 to 33.0) �0.068 (�0.082 to �0.058)
Experienced 361 �1.82 � 0.17 (�2.16 to �1.48) �23.9 � 4.0 (�31.7 to �16.0) �0.076 (�0.105 to �0.060)
Combined 620 �2.10 � 0.16 (�2.41 to �1.80) �30.64 � 3.26 (�37.04 to �24.25) �0.069 (�0.081 to �0.060)
Also shown are the number of trials (n) and the normalized friction at 50% slip probability (mavail � mreq)50. The 95th percentile confidence intervals are shown
in parentheses.
and E groups ( p > 0.25). The residual variation in the A
group was 53% smaller than in the E group ( p = 0.002) and
thus Wald statistics could not be used to directly compare the
regression coefficients. A likelihood ratio test however
showed that neither of the coefficients (b0 or b1) were
significantly different between the A and E groups
( p = 0.96).
4. Discussion
The current study demonstrates a decreased probability
of slipping with both repeated exposure and changes in a
subject’s prior knowledge of the slip conditions. Required
friction and slip distance also changed after the first low-
friction exposure, suggesting that subjects altered their
normal gait to reduce both the probability of slipping and the
severity of a slip should it occur. Previous studies have
observed a variety of changes in lower limb muscle activity
and the kinematics and kinetics of normal gait with both
awareness of a potentially slippery surface and prior slip
experience [19–22]. Large adaptations to slip recovery
responses with repeated exposures have also been reported
[26]. Thus, the presence of adaptations in the current data
indicates its suitability for the primary goal of this study: to
quantify how the empirical relationship between the slip
probability in humans and floor friction measured by a
tribometer is affected by awareness and prior slip
experience.
Between the deceived and experienced trials, the friction
at 50% slip-probability decreased less for normalized
friction (by 0.023 to 0.024; Table 4) than for available
friction (by 0.042 to 0.044; Table 3). The smaller reduction
for normalized friction suggests that normalization removes
about half of the bias introduced by awareness and prior slip
experience. Normalizing friction can also potentially
account for inter-subject and inter-task variations in required
friction. The smaller standard errors associated with the
normalized-friction regression coefficients show the benefit
of accounting for inter-subject variations. The ability of
friction normalization to account for inter-task variations in
required friction cannot be evaluated with the current data,
but if demonstrated, would allow the same normalized
regression curves to be applied to other activities like
walking, running, turning or pushing. Further work is
needed to demonstrate this potential versatility of normal-
izing friction.
If the deceived subjects’ data represent the probability of
unexpected slips in the general population, then awareness
of a potentially slippery surface shifts the slip probability
curve to the left (significant decrease in b0), but does not
change its shape/slope (no change in b1) (Fig. 4c and d). The
subsequent addition of slip experience appears to eliminate
this leftward shift. Despite tighter confidence intervals, the
regression coefficients for the experienced trials were not
significantly different from those of the deceived trials. The
reduction in slip rate, slip distance and required friction
between the deceived and aware groups is consistent with a
lower probability of slipping in aware subjects; however, it is
not clear why subsequently acquiring experience – which
further lowers the required friction, though not the slip rate
or distance – eliminates the difference between deceived and
experienced trials. It is possible that awareness of a potential
slip without prior slip experience creates anxiety that
then diminishes after subjects gain slip experience. This
hypothesis may also explain the different muscle, kinematic
and kinetic adaptations to normal gait observed in aware
versus experienced subjects [22].
From a practical perspective, the similarity between the
slip probability models for deceived and experienced
subjects is a boon for the tribometer validation process. It
appears a tribometer’s ability to predict slips can be
determined using data from both deceived and experienced
subjects—even though experienced subjects adapt their
normal gait. Additional work is needed to determine if these
findings extend to other tribometers and other surfaces—
particularly to contaminated surfaces responsible for many
slips and falls [27]. If so, validation data could be generated
using a small pool of subjects exposed to many slips rather
than a large pool of subjects exposed to a single deception
G.P. Siegmund et al. / Gait & Posture xxx (2005) xxx–xxx8
DTD 5
slip. Optimally, validation studies could include a deception
trial prior to multiple experienced trials to confirm the
similarity between deceived and experienced responses for
the specific protocol being used.
Brady et al. [14] reported a 50% chance of falling for a
slip distance of 318 mm, but none of the 37 trials with slip
distances greater than 318 mm in the current study led to a
fall. Although protocol differences may explain this
difference (they used bare feet on vinyl coated with mineral
oil), our lack of falls limit the applicability of our
conclusions to the probability of slipping, not falling.
Pronounced adaptations to falling [26] suggest that
experienced subjects will not yield data suitable for
validating a tribometer’s ability to predict combined slips
and falls.
Differences between the regression coefficients for the
deceived and aware data were isolated to the intercept (b0).
As a result, the aware data can be corrected by increasing its
normalized friction by the difference between the (mavaila-
ble � mrequired)50 values for the deceived and aware data
(0.014 and 0.015 for the DS and VIT, respectively; Table 4).
With this correction, data from all three groups can be
pooled and an overall regression computed (‘‘combined’’
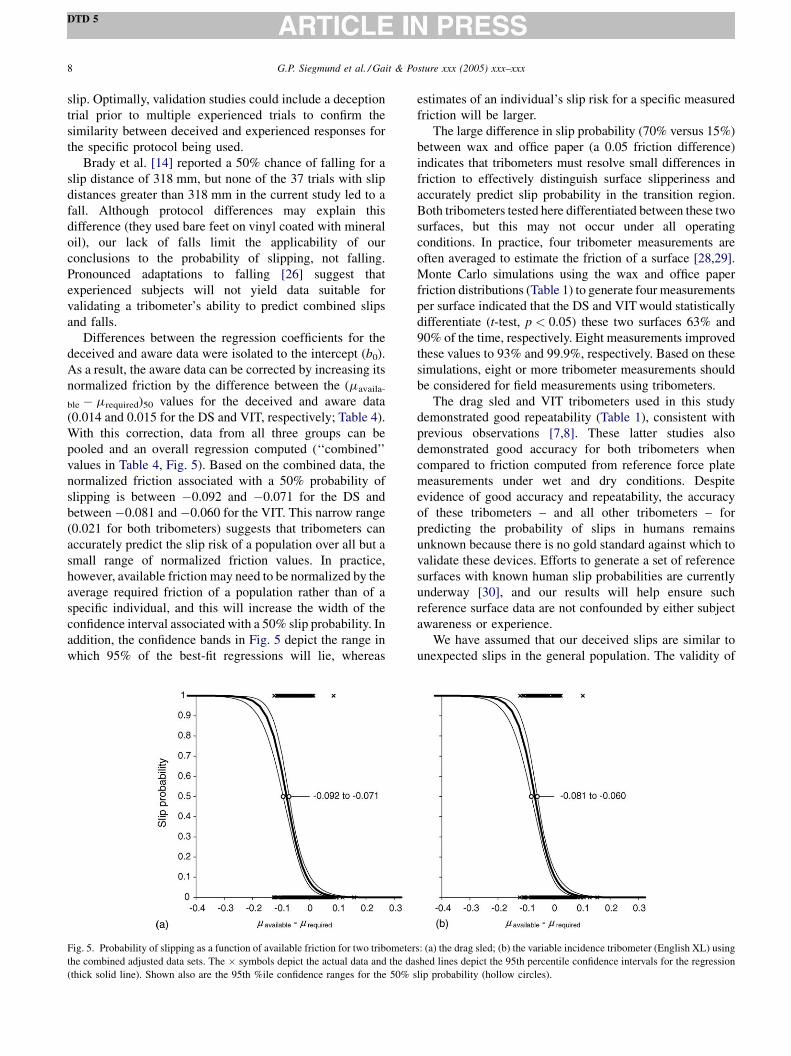
values in Table 4, Fig. 5). Based on the combined data, the
normalized friction associated with a 50% probability of
slipping is between �0.092 and �0.071 for the DS and
between �0.081 and �0.060 for the VIT. This narrow range
(0.021 for both tribometers) suggests that tribometers can
accurately predict the slip risk of a population over all but a
small range of normalized friction values. In practice,
however, available friction may need to be normalized by the
average required friction of a population rather than of a
specific individual, and this will increase the width of the
confidence interval associated with a 50% slip probability. In
addition, the confidence bands in Fig. 5 depict the range in
which 95% of the best-fit regressions will lie, whereas
Fig. 5. Probability of slipping as a function of available friction for two tribometer
the combined adjusted data sets. The � symbols depict the actual data and the da
(thick solid line). Shown also are the 95th %ile confidence ranges for the 50% s
estimates of an individual’s slip risk for a specific measured
friction will be larger.
The large difference in slip probability (70% versus 15%)
between wax and office paper (a 0.05 friction difference)
indicates that tribometers must resolve small differences in
friction to effectively distinguish surface slipperiness and
accurately predict slip probability in the transition region.
Both tribometers tested here differentiated between these two
surfaces, but this may not occur under all operating
conditions. In practice, four tribometer measurements are
often averaged to estimate the friction of a surface [28,29].
Monte Carlo simulations using the wax and office paper
friction distributions (Table 1) to generate four measurements
per surface indicated that the DS and VIT would statistically
differentiate (t-test, p < 0.05) these two surfaces 63% and
90% of the time, respectively. Eight measurements improved
these values to 93% and 99.9%, respectively. Based on these
simulations, eight or more tribometer measurements should
be considered for field measurements using tribometers.
The drag sled and VIT tribometers used in this study
demonstrated good repeatability (Table 1), consistent with
previous observations [7,8]. These latter studies also
demonstrated good accuracy for both tribometers when
compared to friction computed from reference force plate
measurements under wet and dry conditions. Despite
evidence of good accuracy and repeatability, the accuracy
of these tribometers – and all other tribometers – for
predicting the probability of slips in humans remains
unknown because there is no gold standard against which to
validate these devices. Efforts to generate a set of reference
surfaces with known human slip probabilities are currently
underway [30], and our results will help ensure such
reference surface data are not confounded by either subject
awareness or experience.
We have assumed that our deceived slips are similar to
unexpected slips in the general population. The validity of
s: (a) the drag sled; (b) the variable incidence tribometer (English XL) using
shed lines depict the 95th percentile confidence intervals for the regression
lip probability (hollow circles).
G.P. Siegmund et al. / Gait & Posture xxx (2005) xxx–xxx 9
DTD 5
this assumption is difficult to test. The fact that we observed
differences between the deceived and other groups suggests
that we were at least partially successful in reproducing
actual unexpected slips. Our study is also limited by the use
of only two tribometers, both of which measured similar
though not identical friction values for all three materials.
This uniformity may not be typical of all or even these
tribometers, particularly under conditions involving con-
taminants [5–8]. A benefit of the current protocol, however,
is that other tribometers can subsequently measure the
friction of the same paper surfaces and then re-use the
current data to generate slip probability curves.
The paper slip surfaces used in the current study are
different from the fluid contaminants [12,14,19,20,31–33],
rollers [21,26,34] and sliding platforms [35,36] used by
others. Paper was chosen to eliminate or minimize potential
problems with these other systems. The sliding friction
(drag) of fluid contaminants is sensitive to film thickness
[37], which varies with shoe width, shoe angle, sole material,
tread pattern and slip speed—all of which may vary between
subjects and some of which may vary between slips by the
same subject. Rollers eliminate some of these problems, but
introduce others: the heel can land between rollers and each
roller generates an inertial reaction force as it accelerates to
the shoe’s slip speed. Sliding platforms have a larger mass
than rollers and thus have a large inertial reaction force
during slip acceleration. With paper surfaces, the coefficient
of friction is reproducible between tests and the surface is
continuous and flat. The individual surfaces have low mass
(8–18% of shoe mass) and therefore inertial reaction forces
are minimized. Although slips on paper account for only a
small percentage of actual slip and fall injuries, they
provided a reproducible and realistic slip environment which
met the needs of this study.
In summary, the results of the current study show that
gait adaptations due to subject awareness bias the slip risk
curve toward underestimating the actual risk of slipping,
whereas the additional adaptations that occur once slip
experience has been acquired eliminate this bias. Thus,
data from subjects with prior slip experience can be used
to determine the slip risk, but not fall risk, of unprepared
subjects.
Acknowledgements
The authors wish to thank Mr. Jeff Nickel and Mr. Mircea
Oala-Florescu for their help with this experiment. Grants:
This work was funded by a grant from the Workers’
Compensation Board of British Columbia.
References
[1] Strandberg L, Lanshammar H. The dynamics of slipping accidents. J
Occup Accid 1981;3:153–62.
[2] Manning DP. Deaths and injuries caused by slipping, tripping and
falling. Ergonomics 1983;26:3–9.
[3] Leamon TB, Son DH. The natural history of a microslip. In: Mital A,
editor. Advances in industrial ergonomics and safety, I. Taylor &
Francis; 1989. p. 633–8.
[4] Tisserand M. Progress in the prevention of falls caused by slipping.
Ergonomics 1985;28:1027–42.
[5] Chang W-R, Matz S. The slip resistance of common footw ear
materials measured with two slipmeters. Appl Ergon 2001;32:549–58.
[6] Marpet MI. On threshold values that separate pedestrian walkways
that are slip resistant from those that are not. J For Sci 1996;41:
747–55.
[7] Marpet MI, Fleischer DH. Comparison of walkway safety tribometers:
part 2. J Test Eval 1997;25:115–26.
[8] Powers CM, Kulig K, Flynn J, Brault JR. Repeatability and bias of two
walkway safety tribometers. J Test Eval 1999;27:368–74.
[9] Perkins PJ. Measurement of slip between the shoe and ground during
walking. In: Anderson C, Senne H, editors. Walkway surfaces:
measurement of slip resistance, ASTM STP 649. Philadelphia: Amer-
ican Society for Testing and Materials; 1978. p. 71–87.
[10] Myung R. The effect of load carrying and floor contaminants on slip
and fall parameters. Ergonomics 1997;40:235–46.
[11] Myung R, Smith JL, Leamon TB. Slip distance for slip/fall studies. In:
Kumar S, editor. Advances in industrial ergonomics and safety, IV.
Taylor & Francis; 1992. p. 983–7.
[12] Hanson JP, Redfern MS, Mazumdar M. Predicting slips and falls
considering required and available friction. Ergonomics 1999;42:
1619–33.
[13] Kulakowski BT, Buczek FL, Cavanagh PR, Pradhan P. Evaluation of
performance of three slip resistance testers. J Test Eval 1989;17: 234–
40.
[14] Brady RA, Pavol MJ, Owings TM, Grabiner MD. Foot displacement
but not velocity predicts the outcome of a slip induced in young
subjects while walking. J Biomech 2000;33:803–8.
[15] Lockhart TE, Smith JL, Woldstad JC, Li P. Effects of musculoskeletal
and sensory degradation due to aging on the biomechanics of slips and
falls. In: Proceedings of the International Ergonomics Association
(IEA)/Human Factors and Ergonomic Society (HFES) Congress, vol.
5; 2000. p. 83–6.
[16] Lockhart TE, Woldstad JC, Smith JL, Hsiang SM, Li P. Prediction
of falls using a robust definition of slip distance and adjusted
required coefficient of friction. In: Proceedings of the International
Ergonomics Association (IEA)/Human Factors and Ergonomic
Society (HFES) Congress, vol. 4; 2000. p. 506–9.
[17] Redfern MS, DiPasquale J. Biomechanics of descending ramps. Gait
Posture 1997;6:119–25.
[18] McIntosh A, Beatty K. Normal gait on an inclined surface. In:
Proceedings of the 29th Congress of the International Society of
Biomechanics, Abstract 078; 2001.p. 45.
[19] You J, Chou Y, Lin C, Su F. Effect of slip on movement of body centre
of mass relative to base of support. Clin Biomech 2001;16:167–73.
[20] Cham R, Redfern MS. Changes in gait when anticipating slippery
floors. Gait Posture 2002;15:159–71.
[21] Marigold DS, Patla AE. Strategies for dynamic stability during
locomotion on a slippery surface: effects of prior experience and
knowledge. J Neurophysiol 2002;88:339–53.
[22] Heiden TL, Sanderson DJ, Inglis JT, Siegmund GP. Adaptations
to normal human gait on potentially slippery surfaces: the
effects of awareness and prior slip experience. Gait Posture, in
press.
[23] Sheskin DJ. Handbook of parametric and nonparametric statistical
procedures. Boca Raton, FL: CRC Press, 1997.
[24] Allison PD. Comparing logit and probit coefficients across groups.
Sociol Methods Res 1999;28:186–208.
[25] Sofroniou N, Hutcheson GD. Confidence intervals for the
predictions of logistic regression in the presence and absence of a
variance–covariance matrix. Understand Stat 2002;1:3–18.
G.P. Siegmund et al. / Gait & Posture xxx (2005) xxx–xxx10
DTD 5
[26] Marigold DS, Bethune AJ, Patla AE. Role of the unperturbed limb and
arms in the reactive recovery response to an unexpected slip during
locomotion. J Neurophysiol 2003;89:1727–37.
[27] Manning DP, Ayers I, Jones C, Bruce M, Cohen K. The incidence of
underfoot accidents during 1985 in a working population of 10,000
Merseyside People. J Occup Accid 1988;10:121–30.
[28] ASTM. Standard test methods for using a horizontal pull slipmeter
(HPS) (F609-96). West Conshohocken, PA: American Society of
Testing and Materials; 1996.
[29] English W. Pedestrian slip resistance: how to measure it and how to
improve it. Alva, FL: William English Inc., 2003.
[30] Powers CM, Stefanou MA, Tsai YJ, Brault JR, Siegmund GP. Assess-
ment of walkway tribometer readings in evaluating slip resistance: a
gait based approach. In: Proceedings of the International Society for
Occupational Ergonomics & Safety; 2005.
[31] Andres RO, O’Connor D, Eng T. A practical synthesis of biomecha-
nical results to prevent slips and falls in the workplace. In: Kumar S,
editor. Advances in industrial ergonomics and safety, IV. Taylor &
Francis; 1992. p. 1001–8.
[32] Bunterngchit Y, Lockhart TE, Woldstad JC, Smith JL. Age related
effects of transitional floor surfaces and obstruction of view on gait
characteristics related to slips and falls. Int J Ind Ergon 2000;25:
223–32.
[33] Lockhart TE, Woldstad JC, Smith JL. Effects of age-related gait
changes on the biomechanics of slips and falls. Ergonomics 2003;
46:1136–60.
[34] Oates AR, Patla AE, Frank JS, Greig MA. Control of dynamic stability
during gait termination on a slippery surface. J Neurophysiol 2004;
93:64–70.
[35] Pai YC, Wening JD, Runtz EF, Iqbal K, Pavol MJ. Role of feed
forward control of movement stability in reducing slip-related
balance loss and falls among older adults. J Neurophysiol 2003;90:
755–62.
[36] Pavol MJ, Runtz EF, Pai CY. Diminished stepping responses lead to a
fall following a novel slip induced during a sit-to-stand. Gait Posture
2004;20:154–62.
[37] Streeter VL, Wylie EB. Fluid mechanics. Toronto, ON: McGraw-Hill
Ryerson Limited, 1981.