SOCIO-ECONOMIC IMPACT ASSESSMENT OF A BIENNIAL ...
53
SOCIO-ECONOMIC IMPACT ASSESSMENT OF A BIENNIAL FIFA WORLD CUP AND REFORMAT OF THE INTERNATIONAL MATCH CALENDAR TECHNICAL ANNEX OpenEconomics for FIFA Rome 10 December 2021
-
Upload
khangminh22 -
Category
Documents
-
view
0 -
download
0
Transcript of SOCIO-ECONOMIC IMPACT ASSESSMENT OF A BIENNIAL ...

SOCIO-ECONOMIC IMPACT ASSESSMENT OF A BIENNIAL FIFA WORLD CUP AND REFORMAT OF THE INTERNATIONAL MATCH CALENDAR
TECHNICAL ANNEX
OpenEconomics for FIFA
Rome 10 December 2021

THE INTERNATIONAL MATCH CALENDAR REFORM: A SOCIO-ECONOMIC IMPACT ANALYSIS – TECHNICAL ANNEX 2
Document Socio-economic impact assessment of a biennial FIFA World Cup and reformat of the International Match Calendar Technical Annex OEFIFAWC_002_22112021
Related document
Part A: Macroeconomic Analysis Part B: Reform impact for the football Industry OEFIFAWC_001_22112021
Update 10/12/2021
Main authors Pasquale Lucio Scandizzo (Scientific Director)
Gianluca Calvosa (Supervisor)
Giorgio Cesare Carluccio, Lorenzo Santucci, Luca Minotti, Dino Ferrarese, Daniele Nardone, Antonio Maisto.
OpenEconomics
OpenEconomics (OE) assists multilateral institutions, governments, and large enterprises in evaluating policies, programs, and projects in terms of economic, social, and environmental impacts. The company integrates scientific skills with an in-depth knowledge of legislative frameworks and public debate.
Professor Pasquale Lucio Scandizzo, scientific director of OE and Senior Economic Consultant of the World Bank, leads a team of analysts with a long experience evaluating policies and investments. They also developed an intense research activity that generated innovative methodologies, models, and techniques, documented by more than 150 scientific articles and publications.
Pasquale Lucio Scandizzo holds a Ph.D. from the University of California, Berkeley, has held the chair of Economic and Financial Policy at the Faculty of Economics of the University of Rome Tor Vergata, and has been visiting professor at several universities, including the LUISS University of Rome, Johns Hopkins University and George Mason University.
Disclaimer The information contained in this document is subject to copyright and personal data protection regulations.
This document makes descriptive reference to trademarks that others may own. The use of such trademarks herein is not an assertion of ownership of such trademarks by OpenEconomics.
The company operates under the requirements of the UNI EN ISO 9001:2008 standard for: research, development, and application of economic, mathematical, environmental, and technological models for the evaluation of investment policies, programs, and projects (certificate 39508/20/S).

THE INTERNATIONAL MATCH CALENDAR REFORM: A SOCIO-ECONOMIC IMPACT ANALYSIS – TECHNICAL ANNEX 3
GLOSSARY
B USD Billion United States Dollars
CIP Club Insurance premium (attributable to NT matches)
CT Continental tournament for national teams
FIC FIFA Compensation
FTE Full Time Equivalent
FWC FIFA FWC
FYR FIFA Injury Refund scheme
GDP Gross Domestic Product
IMC International Match Calendar
IO Input – Output
IR Injury Refund (from private insurance company)
M USD Million United States Dollars
NPV Net Present Value
NT Tournament for national teams
SAM Social Accounting Matrix
SL Salary-related Loss
TMS (FIFA) Transfer Matching System for international player transfers
TPA Total Player value Appreciation
TPD Total Player value Depreciation
WIOT World Input-Output Table

THE INTERNATIONAL MATCH CALENDAR REFORM: A SOCIO-ECONOMIC IMPACT ANALYSIS – TECHNICAL ANNEX 4
SUMMARY
1. LITERATURE REVIEW .......................................................................... 5
THE ECONOMIC IMPACT OF THE FWC: ANALYSIS OF BENEFITS AND COSTS ........................ 5
THE ECONOMIC EVALUATION ............................................................................................. 11
REVIEW CONCLUSIONS ..................................................................................................... 17
2. FIFA FWC IMPACT .............................................................................. 21
EVALUATION METHODOLOGY ............................................................................................ 21
ASSUMPTIONS ................................................................................................................. 26
KPIs DESCRIPTION ........................................................................................................... 29
RESULTS BREAKDOWN .................................................................................................... 29
CONSUMER SURPLUS ESTIMATES .................................................................................... 32
3. COST-BENEFIT ANALYSIS OF PLAYERS' ENGAGEMENT IN NTs ........... 36
CLUB BENEFITS ................................................................................................................ 37
CLUB COSTS .................................................................................................................... 39
4. BIBLIOGRAPHY ..................................................................................... 42
BIBLIOGRAPHY ON SPORT EVENT IMPACT ........................................................................ 42
BIBLIOGRAPHY ON PLAYER PRICE AS PRODUCTION ASSETS .............................................. 51

THE INTERNATIONAL MATCH CALENDAR REFORM: A SOCIO-ECONOMIC IMPACT ANALYSIS – TECHNICAL ANNEX 5
1. LITERATURE REVIEW
THE ECONOMIC IMPACT OF THE FWC: ANALYSIS OF BENEFITS AND COSTS
In a recent survey article, Scandizzo and Pierleoni (2018) report the opinion (see, for example, Furrer 2002), that hosting a mega-sport event such as Olympics or the FWC cannot be considered as exclusively positive or negative but presents a mix of outcomes that should be carefully sorted out, weighed, and evaluated each on its own merit and under some comprehensive point of view. That said, the FWC impact evaluation differs from a similar study on the Olympics or other sports events because of its unique feature of being part and parcel, but also, in some sense, a synthesis of a sort, of a more engrossing and general discourse on football as a global show and popular cult.
In this context, the benefits of the FWC can still be traced to a broad concept of increasing well-being and more or less enduring legacies, but these concepts have to be somewhat resized and redirected to take into account the higher resonance of football as a continuous, ongoing show. Direct costs, on the other hand, depend on the realization of an event of extraordinary size, but indirect benefits and costs are themselves to be considered within a broader view because of higher global linkages and external effects such as advancements in technology and impacts on the environment that the events may bring about. Similarly to the Olympics, legacies include a complex and differentiated set of impacts on the host cities, regions, and countries. Still, global legacies also loom large, with effects that can be physical, economic, environmental, social, cultural, psychological, political, and even ideological.
As far as benefits are concerned, it is possible to identify the following types:
1) General Impact. Unlike the Olympics, whose most widely publicized economic benefit is the prestige of placing the organizing city “on the map”, the FWC main effect is on the organizing country, whose international profile is directly affected by the winning of the bid to host the games and by the attention received before, during and after the competition has taken place. The FWC impact is thus broadly seen as more” macroeconomic” from the point of view of the spread of the economic stimulus, its consequent spillover over a larger land base and the attraction for investment to the host country. Expected benefits are from increased tourism both from a higher appeal of the destination and the enduring effect of better hotel and restaurant facilities, including technological innovations of the tourist value chain. Increases in trade in general, employment and other indicators of well-being (including GDP) are also expected.
Unlike any other sports event, the FWC also has a global impact on the football universe (or metaverse), a kind of augmented reality that pervades the cultural discourse on football, its fandom substrate and activity, and its ongoing endogenous development. The global impact includes technologies, narratives, and altered states such as emotion and excitement within an expanding cultural space of communication and exchange. It also contains a large ensemble of more subtle developments of social networking, which are common to other cultural goods, but that football increasingly epitomizes as an ultimate popular experience.

THE INTERNATIONAL MATCH CALENDAR REFORM: A SOCIO-ECONOMIC IMPACT ANALYSIS – TECHNICAL ANNEX 6
2) Infrastructural benefits and urban renewal. Since the FWC is not concentrated in a single city like the Olympics, its impact on infrastructure and urban renewal is more limited, and the bulk of its construction works concern essentially the stadiums, with relative minor emphasis on public transportation and other infrastructure and services, including better hotel facilities, restaurants, and private and public amenities. The lower urban concentration of the FWC, however, is at the base of a greater focus on daring architectures, investment in technology, and innovations from the private sector. Stadiums, for example, have been the focus of futuristic, technical changes to accommodate the much larger crowds conjured by the FWC and to catch the imagination of the rest of the world.
A recent case is the technologies that permeate the sports facilities constructed in Qatar for the 2022 FWC. The innovations include environmentally designed stadium architectures that allow energy savings up to 45% and an Internet-of-Things platform to connect a series of sensors around Qatar’s capital city that will make it easier for fans to plan the best route using real-time information about traffic, taxis, the new metro system and even venue entrances and exits1. In addition to smart infrastructures that incorporate new technologies, long-term changes also include different structural and functional improvements: increased airport capacity, new roads, and railway lines, better public transport systems, large halls that can be used for large conferences, etc.
All this, together with the new hotel facilities, not only represents a significant improvement for the daily life of the inhabitants of the host cities, but also a significant legacy for tourism at the local, regional, and national levels, "raising infrastructure standards to a level suitable for international tourism" (Essex and Chalkley, 1999, pp. 196-7).
3) Economic benefits. The literature presents a mixed picture for the evaluation of economic benefits. Since the FWC is mainly a media event, large and globally distributed economic benefits can be attributed to consumers (increased consumer surplus) and producers (from TV rights, sponsorships, and advertising). Still, this important component is played down or absent in most impact studies because a global point of view is seldom present in the analysis, or perhaps because of fear of double-counting financial and economic benefits from commercial revenues. The second layer of benefits derives from the FWC as a sport tourism event that generates both a popular leisure experience and a significant economic boost for the host country (Ritchie & Adair, 2002). Lee and Kim (1998) proposed four key indices to forecast the numbers of foreign football tourists: (i) capacity of the FWC stadium, (ii) percentage of total tickets allocated to foreign football tourists, (iii) expected sales of allocated tickets to foreign football tourists, (iv) number of matches held, and (v) number of matches attended per foreign football tourist. Using a Delphi technique with 41 experts, these criteria produced a prediction of 2,242 USD per tourist or 1.8 times as much as that of ordinary foreign tourists (1,229 USD) for a total predicted expenditure of approximately 522 M USD.
1 https://www.scientificamerican.com/custom-media/a-new-dawn-for-innovation-in-qatar/how-the-world-cup-is-driving-qatari-innovation/

THE INTERNATIONAL MATCH CALENDAR REFORM: A SOCIO-ECONOMIC IMPACT ANALYSIS – TECHNICAL ANNEX 7
4) Communication benefits. Football figures prominently in the internet economy where information flows into the network like a river that overwhelms every obstacle. For many aspects, football fans are at the forefront of exploiting the promises of the new technologies of streaming, unloading, and contributing to manufacturing a large and new ensemble of user base products. This is subjected to the most radical challenge because digital reality threatens to erase the difference between the copy and the original.
The proliferation of informal networks and the nature of storytelling of football as a social parable contributes to a situation of creative fluidity where it is increasingly difficult to subject to the regime of private property the creativity freely expressed by the myriad protagonists of the net. The very distinction between producer and user seems to be blurred by the interactive promise and the incredible capacity for manipulation, dissemination, and reworking offered by the combination of digital technology, network, and computers.
5) Psychological benefits. Many studies have shown how hosting the Olympic Games can create a sense of enthusiasm and pride among the local population by giving an impression of community and unity that can transcend even social and ideological divisions. Several studies utilizing Social Exchange Theory predict that economic, political, psychological, and social benefits are important factors for resident support (Bull and Lovell 2007; Deccio and Baloglu 2002; Fredline 2005; Gursoy and Kendall 2006; Gursoy and Rutherford 2004; Kim, Gursoy, and Lee 2006; Preuss and Solberg 2006; Yoon, Gursoy, and Chen 2001). Along these lines, a carefully designed study by Kaplanidou et al. (2013) found that South Africa residents experienced an increase in their quality-of-life (QOL) level both before and after the event, with the psychological positive impact increasing after the event in contrast to the reduction of the perceived economic impact. Support for hosting the FWC appeared to be magnified by the positive political exposition of the nation as a democracy successfully emerging from the challenge of constructing a multiracial society.
The emotional investment in supporting the hosting of the FWC was also found to be a key element to ensure continuity and positive feelings before during and after the event. An important component of the psychological impact of the FWC and its support among the residents is the motivation toward tourism, which is perceived both as a cultural activity and as an economic opportunity of growing political and social relevance. Psychological benefits present a somewhat elusive impact on the economy because they are reflected in an increase in consumers’ surplus, but this increase is caused by a shift upward and outward of the demand function (an increase in the willingness to pay) that is difficult to capture, except through direct measuring and testing as in in the Kaplanidou et al (2013) study.
6) Geopolitical benefits. The FWC is an opportunity to provide a forum where countries can confront themselves with the world. Because sport is the ultimate unifying issue of open societies and football the only truly global game, the FWC puts countries on the spot and forces them to face both their achievements and shortcomings. This allows them to go beyond the rhetoric of the political confrontation and the stereotypes of ideology and show themselves both their expected and unexpected national characters. For example, this is the case of the violent clashes between English and Russian fans in Marseille in 2016, the social unrest in Brazil in 2014, and the major security emphasis posed by Russian authorities in organizing the FWC in 2018. The Games may also positively impact public policies with

THE INTERNATIONAL MATCH CALENDAR REFORM: A SOCIO-ECONOMIC IMPACT ANALYSIS – TECHNICAL ANNEX 8
unprecedented forms of cooperation within the public authorities’ network and between them and the private sector. The most recent management practices can also be disseminated among different public bodies, thus increasing their efficiency (Furrer, 2002).
7) Environmental benefits. The mega-events inherently imply new construction and additional pressures on the environment due to increased traffic, water consumption, and waste generation, but nevertheless, they can bring many environmental benefits, such as new standards in the construction industry, the use of renewable energy sources, innovations in cleaner technologies, improvement in the management of drinking water and wastewater, new waste management systems, and environmental education programs. For example, in the already cited case of Qatar, the new stadium has become a specific target of innovations aimed to secure energy efficiency and low emissions.
However, the benefits described above should not obscure the risks and pitfalls on the path to success. Preuss stated, in his comparative analysis of Olympic legacies, that "it remains, however, to be determined whether an alternative project could have led to greater benefits for the city and/or a more socially equitable distribution" (Preuss, 2000, p. 100). Even though the lighter territorial concentration of the FWC tends to mitigate its overall impact, some of the biggest negative effects that the FWC can have on the host countries are similar to those more extensively surveyed for the Olympic games (Scandizzo and Pierleoni, 2018).
1) The question of oversizing. The first image that comes to mind is the expensive and half unused "white elephants". This expression refers to the oversizing of the planned facilities and structures considering the 'Olympic queues' and the related ticket sales. The 'white elephants' are designed to showcase the local economy and engineering skills rather than adapt to a long-term urban planning policy and to respond to the needs of local populations in terms of cultural and leisure facilities (e.g., Australia Stadium and Sydney SuperDome 2000 and the oversized stadiums built for the FWC in Korea and Japan of 2002). In some cases, however, the ensuing protests and controversies led to positive social developments that forced the governments to face the plight of poor people, squatters, and the homeless. This is the case, for example, of the $350 million super-stadium built in Sao Paolo, Brazil, for the 2014 FWC, which was the object of controversy and active protest on the part of local people2 but led to the development of housing and social programs. Another type of "white elephant" is the new hotel facilities built for the FWC. Once the FWC have been hosted, an excessive supply of rooms can have serious repercussions on the hotel industry of the host city or region.
2) The unfair distribution of the benefits arising from the events and their legacy. The challenge for public authorities and urban planning is to avoid a situation where the positive effects of infrastructure, transportation, and the sports facilities built, are primarily for the benefit of the wealthy classes. This effect is again less pronounced for the FWC compared to the
2 On May 2, 2014 a group of the Movimento dos Trabalhadores Sem-Teto (MTST, Homeless Workers Movement) took
action on behalf of about 4,800 homeless people living near the $350-million stadium, where the first game of the FWC would take place. After living in the squatter’s camp for more than a month, the government reportedly agreed to build new homes in the camp for “People’s Cup” residents, which the MTST said was a huge success. In Pictures: Brazil poverty vs super stadia | Gallery | Al Jazeera
THE INTERNATIONAL MATCH CALENDAR REFORM: A SOCIO-ECONOMIC IMPACT ANALYSIS – TECHNICAL ANNEX 9
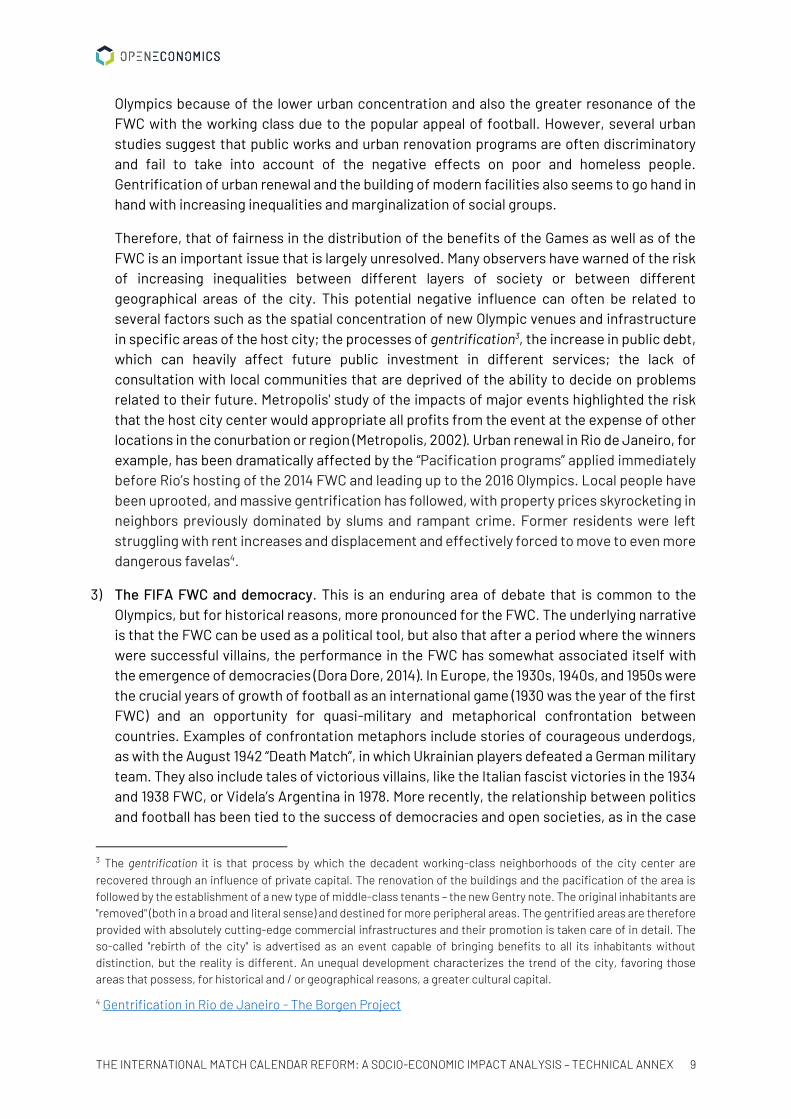
Olympics because of the lower urban concentration and also the greater resonance of the FWC with the working class due to the popular appeal of football. However, several urban studies suggest that public works and urban renovation programs are often discriminatory and fail to take into account of the negative effects on poor and homeless people. Gentrification of urban renewal and the building of modern facilities also seems to go hand in hand with increasing inequalities and marginalization of social groups.
Therefore, that of fairness in the distribution of the benefits of the Games as well as of the FWC is an important issue that is largely unresolved. Many observers have warned of the risk of increasing inequalities between different layers of society or between different geographical areas of the city. This potential negative influence can often be related to several factors such as the spatial concentration of new Olympic venues and infrastructure in specific areas of the host city; the processes of gentrification3, the increase in public debt, which can heavily affect future public investment in different services; the lack of consultation with local communities that are deprived of the ability to decide on problems related to their future. Metropolis' study of the impacts of major events highlighted the risk that the host city center would appropriate all profits from the event at the expense of other locations in the conurbation or region (Metropolis, 2002). Urban renewal in Rio de Janeiro, for example, has been dramatically affected by the “Pacification programs” applied immediately before Rio’s hosting of the 2014 FWC and leading up to the 2016 Olympics. Local people have been uprooted, and massive gentrification has followed, with property prices skyrocketing in neighbors previously dominated by slums and rampant crime. Former residents were left struggling with rent increases and displacement and effectively forced to move to even more dangerous favelas4.
3) The FIFA FWC and democracy. This is an enduring area of debate that is common to the Olympics, but for historical reasons, more pronounced for the FWC. The underlying narrative is that the FWC can be used as a political tool, but also that after a period where the winners were successful villains, the performance in the FWC has somewhat associated itself with the emergence of democracies (Dora Dore, 2014). In Europe, the 1930s, 1940s, and 1950s were the crucial years of growth of football as an international game (1930 was the year of the first FWC) and an opportunity for quasi-military and metaphorical confrontation between countries. Examples of confrontation metaphors include stories of courageous underdogs, as with the August 1942 “Death Match”, in which Ukrainian players defeated a German military team. They also include tales of victorious villains, like the Italian fascist victories in the 1934 and 1938 FWC, or Videla’s Argentina in 1978. More recently, the relationship between politics and football has been tied to the success of democracies and open societies, as in the case
3 The gentrification it is that process by which the decadent working-class neighborhoods of the city center are recovered through an influence of private capital. The renovation of the buildings and the pacification of the area is followed by the establishment of a new type of middle-class tenants – the new Gentry note. The original inhabitants are "removed" (both in a broad and literal sense) and destined for more peripheral areas. The gentrified areas are therefore provided with absolutely cutting-edge commercial infrastructures and their promotion is taken care of in detail. The so-called "rebirth of the city" is advertised as an event capable of bringing benefits to all its inhabitants without distinction, but the reality is different. An unequal development characterizes the trend of the city, favoring those areas that possess, for historical and / or geographical reasons, a greater cultural capital.
4 Gentrification in Rio de Janeiro - The Borgen Project

THE INTERNATIONAL MATCH CALENDAR REFORM: A SOCIO-ECONOMIC IMPACT ANALYSIS – TECHNICAL ANNEX 10
of Korea/Japan and South Africa. At the same time, a form of cognitive dissonance has emerged because of the authoritarian nature of many African and Asian regimes eager to participate and host the FWC. This dissonance is not uncommon in collective storytelling because of the complex nature of society and the variety of national and international constituents and regimes. In the case of the FWC, it also tends to intersect national interests and local teams, and pressure groups.
The democratic posture of the FWC also depends on the participation of civil society to the bidding and planning phase, which in turn depends on the characteristics of the country involved, the degree of political freedom and participation of ordinary citizens, as well as on the maturity of local institutions, associations, and formal and informal social and political bodies. The experience in this regard has been mixed and poses a major challenge to FIFA ‘s ambitions and leadership in matters of responsible corporate governance and social sustainability.
4) The selection argument and the particular case of China and India. Unlike the Olympics, the FWC is linked to a single sport, football, whose success depends on a critical mass of investment in physical and human capital. Investment in human capital, in turn, is partly the effect of the popularity of the sport and cannot be easily forced since it requires the voluntary and enthusiastic participation of a multitude of players and fans. A very important special case in point is China, which has fluctuated between the seventieth and hundredth spot in the FIFA rankings over the past thirty years, in spite of its increasing influence over the world, large investments in stadiums and team building, and the personal interests of political leaders (even president Xi Jinping is said to be a football fan). The 2014 documentary, 11 Out of 1.3 Billion: Football in China, explores the reasons why a huge country like China, with a population of 1.4 billion many of whom are enthusiastic soccer fans, has not succeeded in putting together world levels teams capable to consistently qualify for the FWC finals.
This contrasts sharply with the Olympics, where China is a protagonist and seems to have no trouble being competitive and, in many cases, dominant with respect to other nations. While the answer to this question should take into account many cultural and historical factors, a fundamental reason (Dora and Dore, 2014) seems to lie in difficulty to plan football performance based on simple command and control measures, that is by centralized investment in stadiums, teams and other forms of the physical and human capital building. As many other non-democratic countries have found, football requires a degree of participation and competition that cannot be achieved without a combination of an open society and a market economy. This thesis is, however, not supported by the parallel experience of India, an almost equally populous country (1.2 billion), which is the world's largest democracy and yet has never qualified for the FWC, holding a FIFA ranking (147 out of 207 countries) lower than China’s. The India case suggests that even in an open society, football can develop only if a critical mass of people practices and support it. A democracy appears necessary, in other words, to successfully develop and compete with the “beautiful game”, but not sufficient as a critical mass of practitioners and fans are still required.
Examining the positive and negative effects of sport mega-events is part of a more general framework, which leads to some considerations that contribute to a more in-depth analysis

THE INTERNATIONAL MATCH CALENDAR REFORM: A SOCIO-ECONOMIC IMPACT ANALYSIS – TECHNICAL ANNEX 11
of the issue. In general, the challenge for governments and leading parties is to leave a positive and permanent legacy to the host country. But legacy is a complex phenomenon that is difficult to plan and depends partly on unforeseen circumstances and contingent successes and failures within the network of sub-events originated by the celebration of the FWC as a containing framework. Intangible legacy includes the possible boost to country reputation created by the aura of the FWC, the greater visibility of its natural and cultural attractions for tourists, and many other features that go beyond the clearly perceivable and immediate effects of holding the megaevent. It also includes an impact on country residents and visitors that is part of the process of continuous exchange and negotiation of globalized connectivity that is perhaps the major driver of current social and economic development.
While longer than the Olympics, the FWC remains a one-month event, and consequently, temporary installations can be used. Recent examples have shown that installing removable structures with multiple functions can work. This would allow the sports venues to be targeted to the needs of the city, thus avoiding an additional financial burden in terms of maintenance. A contemporary example for the FWC is the Ras Abu Aboud Stadium, a 40,000-seat temporary venue billed as the world’s first ‘demountable’ stadium in Doha, Qatar. Constructed on an artificial promontory in the district of the same name, Ras Abu Aboud Stadium is of modular design as one of eight new venues under construction ahead of the FWC football competition in 2022 being built to a modular design, and partly out of old shipping containers from Doha Port. The first moveable stadium in FWC history, Ras Abu Aboud Stadium “will be entirely dismantled and repurposed post-2022, setting a new standard in tournament sustainability and legacy,” according to Supreme Committee for Delivery and Legacy (SC), which is overseeing the Qatar 2022 FWC.
The post-event legacy of the FWC is not limited to the increase in the reputation of the country as a source of attractions and hospitality for tourists, or to the use of sports venues and infrastructures created to host the matches, players, and visiting crowds. More generally, the notion of legacy increasingly applies to the environmental, social, and governance (ESG) principles fostered by the global event, through an enduring experience that enhances the ethical aspect of the global competition as a factor contributing to sustainable world development. Greater sport participation, an enhanced sense of community within the host country and across participating ones, civic pride, shortening of social barriers, and greater sharing and participation economy. All these effects are part of the short- and long-term legacy of the FWC and contribute to its benefits over and above the pure financial flows.
THE ECONOMIC EVALUATION
Economic evaluation is of key importance in gaining an analytical understanding of the contribution of the FWC to national and international well-being. It is also crucial to provide rational support to the decision to bid for the candidates host countries, the criteria to choose the best bidder for FIFA, and planning the event and its aftermath so that short- and long-term net benefits are maximized. The criteria and methodologies of evaluation are, however, diverse and the process of evaluation itself assumes different meanings and weights according to whether it precedes the event (ex-ante evaluation), follows its development (monitoring) or assesses its outcomes and impact after the fact (ex-post evaluation). More generally, evaluation

THE INTERNATIONAL MATCH CALENDAR REFORM: A SOCIO-ECONOMIC IMPACT ANALYSIS – TECHNICAL ANNEX 12
should be conceived as part of the project cycle, which is a process of continuous backward and forward assessment of inputs, outputs, outcomes, and impacts aimed at achieving progressive improvements in the value chain of the event over space and time.
Table 1.1 below shows a brief survey of some major evaluation methods used for sport megaevents, mostly concerning the Olympics and the FWC. Among the main techniques employed for ex-ante evaluation of mega-events, a crucial role must be attributed to I-O (Input-Output) analysis, Social Accounting Matrices (SAM), CGE (Computable General Equilibrium) models, and CBA (Cost-Benefit Analysis). Econometrics is also used for estimation and as a technique of comparison between the effects of the event and the counterfactual. A combination of survey methods (contingent evaluation) and econometrics is the technique of choice to estimate consumers’ benefits. The choice of the model might depend on several factors, mainly related to modeling assumptions (e.g., the size of price effects) and data availability. Generally, most studies limit their scope to hosting countries' national economies without delving into the detail of regional results or exploring spillover effects on other countries.
Tab. 1.1. Main evaluation methods used to assess the effects of Sport Mega-Events Type Methods Characteristics Results /Quantitative Impacts
Ex-a
nte
stud
ies
Input-Output (I-O): RIMS
IMPLAN
RMDM
They are useful if assessing the impacts on industry caused by variations in the demand
Their structure is simple and efficient in terms of implementation costs
They are based on sectoral interdependence tables and do not incorporate behavioral functions
There is no integration between final demand and production structure
They do not allow multiplier and/or crowding-out effects to be taken into account
They overestimate the impact of the event
They are focused on the infrastructure costs that have to be incurred, on an estimate of the number of visitors expected and the amount each visitor will spend per day during the event
The economic effects may be estimated in terms of growth in employment and/or GDP
They conclude that staging sports events have favorable effects on public budgets and on the national and regional economies
Overall positive net benefits: 0.01% increase in GDP over 2005-2016; 0.004% change in welfare (equivalent variation) (Blake, 2005 – Impact of 2012 London Olympics)
Expected annual GDP growth of 0.8% from 2004 to 2008 (Ralston et al, 2008)
The total economic impact in terms of GDP ranged from 2.3 billion dollars (Los Angeles, 1984) to 13.2 billion dollars (Beijing, 2008), with a GDP percentage impact of 0.47% in the year of the Olympics (PricewaterhouseCoopers, 2004)
The total economic impact in terms of a) GDP US$ 5.3 billion and b) 69,578 news jobs for the Washington-Baltimore bid, 2012 (Fuller and Clinch, 2000)
An overall increase of about 1.2m jobs for the UK over 2006-12, of which 240,000 are in London, and a further 1.8m jobs over 2012-21, of which 440,000 are in London (Cambridge Econometrics, 2007- Impact of 2012 London Olympics)
Percentage change of real GDP 0.15% (Aus) (New South Wales Treasury, 1997 – Impact of 2000 Sydney Olympics)
A loss of 2.1 billion dollars in Australia’s public and private consumption in terms of net present value (Giesecke and Madden 2007 and 2011 - Impact of 2000 Sydney Olympics)
CGE (including also dynamic models)
MMRF
SAM
They integrate the I-O models with the dynamics of behavioral functions
They can handle the effects of crowding-out and resources constraints
They are more expensive to develop than I-O models
They overestimate the impact of the event

THE INTERNATIONAL MATCH CALENDAR REFORM: A SOCIO-ECONOMIC IMPACT ANALYSIS – TECHNICAL ANNEX 13
Problems relating to the choice of endogenous and exogenous variables and the identification and quantification of the shocks
Saayman and Rossouw (2008) find a «positive impacts on the economy in terms of output and employment gains» for South Africa FWC.
Economic Multipliers:
Transactions Multipliers (TM)
Household Income Multipliers (HIM)
Employment Multipliers (EM)
They are used to assess the impact of the Games by providing an estimate of the number of times a currency unit that has been spent in an economy is spent again within borders of the same economy. The TMs measure the direct and secondary effects of the money that has been spent on economic activity and sales volumes. HIMs focus on the direct and indirect effects on household income. EMs measure the new full-time jobs created by the additional expenditure which has flowed into the economy
This is a particularly controversial method; unreliable results
In some cases, hi multipliers are reported. Haddad and Haddad conclude, «For each US$1 invested other US$ 3.26 would be generated until 2027», but this study does not document, to our judgment, how substitution effects take place (Haddad and Haddad, 2010).
Cost-benefit Analysis
It clearly distinguishes positive impacts (benefits) from negative impacts (costs), quantifying them in monetary terms
It presents the final value of the project in terms of NPV, which is compared with the value that can be obtained from other investment programs. It considers the economic impacts, as well as the social, environmental, and other kinds of effects that affect individuals’ interests. With this approach, the impacts of projects can be calculated more precisely
The real costs of public subsidies in the USA for 99 sports facilities hosting teams from four major leagues (National Football League, Major Baseball League, National Basketball Association, and National Hockey League) turned out to be 40% higher than officially reported costs (that is extra USD 50 million per facility or a total value of USD 5 billion of extra costs) (Long, 2005)
The consumer surplus is an important component of the benefit side. Only the consumers’ surplus of local residents who attend the event are relevant (Mules and Dwyer, 2005)
Budget of the Beijing Games: 1,609 US$ m Operating Expenses; 16 US$ m Surplus; 1,625 US$ m Revenues. Capital infrastructure expenditures: 14,257 US$ m. Capital infrastructure expenditures are nearly nine times larger than the revenue and operating expenses of the Games (Owen, 2005)
«given proper long-term planning and vision FIFA 2010 could turn out to be the most profitable investment in this country's history» (Bohlmann and Van Heerden, 2008)
Ex-p
ost s
tudi
es
Comparison of the situation
with and without the Event
considering similar cities
They require the identification of variations in different economic indicators between two similar cities, which have not hosted the Games, before, during, and after the mega-event.The biggest issue is the identification of the economic impacts perceived as the results of a mega-event and their separation from normal economic fluctuations, which have been seen to be very hard to
Ex-post studies attempt to provide details of the economic impact of a particular mega-event on the basis of various economic indicators, such as GDP changes, per-capita income of the host city’s residents compared with other similar cities, employment rates, sales of various goods, occupancy of hotel facilities, airport traffic, etc.
The South Africa government reported that the 2010 FWC generated a positive economic impact: it contributed USD 509 million to the 2010 real GDP. Moreover, it created USD 769 million in benefits for households, of which USD 228 million was designated to low-income families (OECD Observer & Nene, 2013). The event also generated a direct impact on labor: 130,000 jobs were created through constructions in stadia and infrastructure and hospitality (Sport & Recreation South Africa (SRSA), 2012),

THE INTERNATIONAL MATCH CALENDAR REFORM: A SOCIO-ECONOMIC IMPACT ANALYSIS – TECHNICAL ANNEX 14
isolate in vast metropolitan areas
Matsuoka De Aragao, M. (2015) Economic Impacts of the FIFA FWC in Developing Countries Western Michigan University.
It was predicted that approximately 450,000 spectators and tourists would visit South Africa for the FWC, but only two-thirds of the expectation was met. The government estimated that around 306,600 tourists visited the country for the event, spending USD 444 million, mainly on shopping, food, and accommodation. Even with the visitors’ average spend in 2010 being 24% higher than the previous years, based purely on the numbers, it can be said that South Africa recovered only a tenth of the USD 3.12 billion invested for the FWC (Sport & Recreation South Africa (SRSA), 2012).
South Africa invested USD 3.12 billion in transportation, telecommunication, and stadia. In return, the 2010 FWC generated USD 509 million to the 2010 real GDP. It also created USD 769 million in benefits for the households. Brazil went bigger: it spent USD 15 billion on the 12 host cities' infra-structure. The impact on GDP is still unknown, as there is not many reports released by the government on the FWC. But the Economic Research Institute Foundation estimated the event expenses would inject USD 13.43 billion into the overall economy. For both cases, one must take into consideration those are gross numbers, and they do not account for the reallocation of spending by locals., Matsuoka De Aragao, M. (2015) Economic Impacts of the FIFA FWC in Developing Countries Western Michigan University. The total impact of the 1992 Barcelona Olympic Games could be calculated to be 26,028 US$ m; the annual average effect of employment for the period 1987-1992 from the economic impact of the Games was 59,328 people (Brunet 1995 and 2002)
An increase in employment of 293,000 jobs in areas that hosted events for 1996 Atlanta Olympic Games (Hotchkiss et al. 2002). The econometric model provides a strong basis for estimating the effect of the Olympic Games on employment. Through the carefully considered use of a fixed-effects framework, it has made cross-Games analysis feasible (six Summer Games from 1984-2004: Los Angeles, Seoul, Barcelona, Atlanta, Sydney, and Athens). It provides more robust and more conclusive evidence of the positive impact of the Games on employment than other studies to date (Tucker 2006)
The econometric model investigates the employment impacts of nine different major-sporting events on their host cities, from 1984 to 2004 (i.e., Los Angeles, (1984) – Athens, (2004)). Using a conservative estimate of the deviation of actual employment levels from expected employment, there is a positive, significant but transitory impact of hosting the Games on local employment, lasting from 2.5 years before the event until 2 years after (Ahmar 2008).
Comparison of the situation
with and without the Event
considering the host city’s past
This method uses the past as the counterfactual situation, calculating the economic identifiers only of the host city during the Olympic event and comparing them with those of the same city over different periods of time
The biggest issue is the identification of the economic impacts perceived as the results of a mega-event and their separation from normal economic fluctuations, which have been seen to be very hard to isolate in vast metropolitan areas
Ad-hoc sample surveys by
submitting questionnaires
This is a less utilized qualitative method
It consists in submitting questionnaires to a control group before, during, and after the mega-event
This method may be used to evaluate more judgmental aspects of the mega-event, such as its impact on the host country’s image
Baade and Matheson (2002) conducted an ex-post analysis for the assessment of changes in employment in Atlanta and Los Angeles, which were attributable to the 1996 and 1984 Games, respectively. These two authors took an econometric approach based on behavioral functions with dummy variables for the Olympics. The result in terms of new jobs is the following: 42,448 (State of Georgia – period 1994-1996) for 1996 Atlanta Games and 5,043 (Los Angeles – period 1984) for 1984 Los Angeles Games.

THE INTERNATIONAL MATCH CALENDAR REFORM: A SOCIO-ECONOMIC IMPACT ANALYSIS – TECHNICAL ANNEX 15
Con
ting
ent v
alua
tion
Questionnaires which estimate
individuals’ willingness to pay for a certain event to take or not to take place
This method is used to assess the intangible effects of a mega-event
The interviewees are asked to state whether they are willing to pay for some non-market goods by answering an open or closed question questionnaire
The expression “contingent” refers to the fact that the interviewees are asked to state their willingness to pay for hypothetical events to take place
This is a controversial method because it is based on the assessment of hypothetical scenarios which, in some cases, could be overestimated by the interviewees (on the other hand, empirical findings concerning possible overestimates by the interviewees are controversial)
It is suggested that caution should be exercised in interpreting the results obtained
This method has been widely used in quantifying the success of sport events
Some studies focused on estimating the value of hosting mega sports events emphasize the importance of the method in assessing the value of their intangible effects
Intangible benefits, expressed through the calculation of willingness to pay, should be considered in a cost-benefit analysis in order to justify holding big sport events
Other studies have argued the importance of the intangible effects of big sport events
Some studies have focused on quantifying national sporting success in Olympic competition, finding that achieving a national sporting success in an Olympic competition or in the Football FWC is very important and assumes value for the citizens
WTP for spectator sports and sporting success is lower than for active sports consumption (Johnson, 2008)
WTP estimates from a contingent valuation method study using data from nationally representative surveys before and after the Vancouver Games suggest that Own the Podium program (subsidized by the Canadian government) generated intangible benefits equal to 2 to 4 times its cost. The aggregate value of the intangible benefits generated by the program was between 251 US$ m and 3.4 US$ billion. Then these intangible elements have a significant influence on the value of success in the Olympics (Humphreys et al. 2011)
WTP of the German population for winning the 2006 FWC was on average € 34.97, while their willingness to accept a loss of the German team in the final was € 255.34. Then there would be no substitute for FWC title, and an aggregate €17 billion would be necessary to achieve collective indifference about the outcome for the FWC final (Ratzel and Weimann 2006)
WTP of the German population for winning the 2010 FWC in South Africa was on average € 25.79 while considering only those respondents who stated a WTP higher than 0, average WTP was € 56.67 (Wicker et al. 2012)
Intangible impacts might justify hosting major sporting events on cost-benefit grounds. Respondents drawn from London, Manchester, and Glasgow, were asked for their willingness to pay (WTP) to host the 2012 Olympic Games in London based on the intangible impacts that this event might provide. The annual mean WTP is £22, £12, and £11 per year (for 10 years) in these 3 UK cities, respectively. An illustrative total (UK) WTP for intangible impacts is in the region of £2 billion (Atkinson et al. 2008)
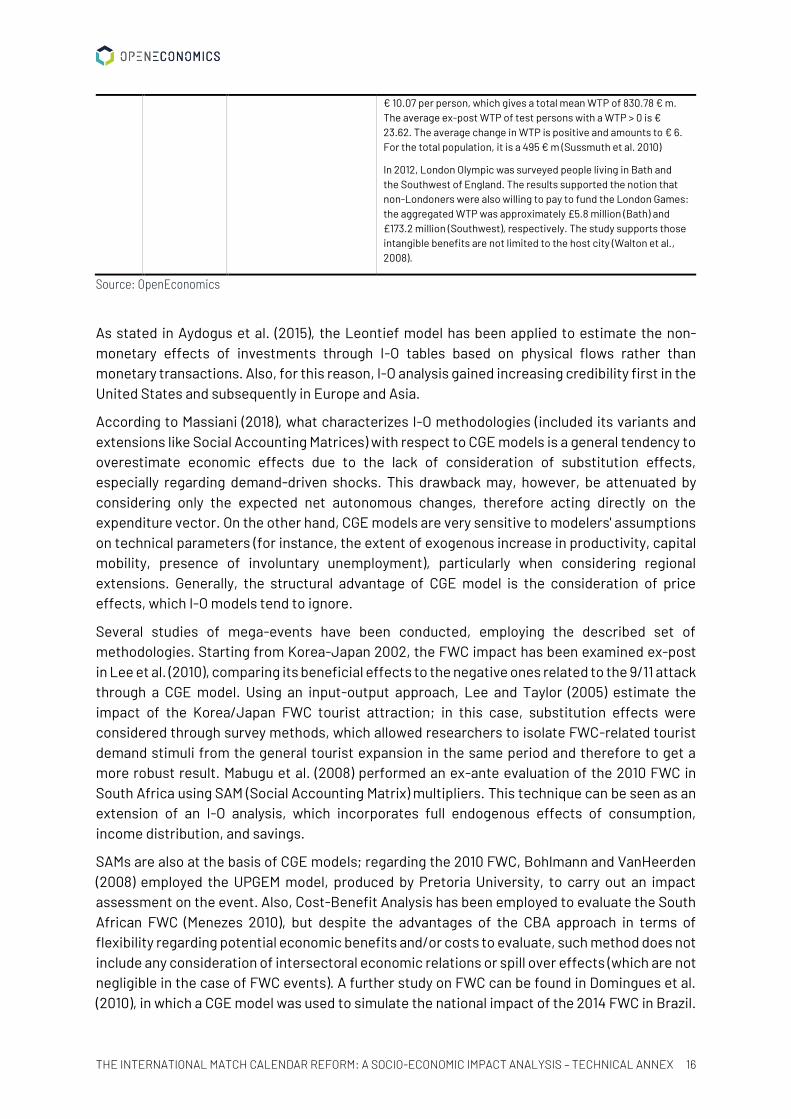
A nation’s contingent value of hosting a mega-event depends on past experience with implied public goods benefits for its residents. Applying data from an ex-ante and ex-post query based on contingent valuation methods, it is used the FIFA FWC 2006 (the first mega-event hosted by reunified Germany) as a natural experiment. By inducing civic pride through collective experience, single events like the hosting of the FWC have the potential to considerably accelerate the convergence of East Germans’ preferences towards those of West Germans. The average ex-ante WTP for the whole sample is € 4.26 per person, which gives a total mean WTP of 351.5 € m for a total population of 82.5 m Germans. The average ex-ante WTP for individuals with a strictly positive WTP is € 22.90. The average ex-post WTP for the whole sample is
THE INTERNATIONAL MATCH CALENDAR REFORM: A SOCIO-ECONOMIC IMPACT ANALYSIS – TECHNICAL ANNEX 16
€ 10.07 per person, which gives a total mean WTP of 830.78 € m. The average ex-post WTP of test persons with a WTP > 0 is € 23.62. The average change in WTP is positive and amounts to € 6. For the total population, it is a 495 € m (Sussmuth et al. 2010)
In 2012, London Olympic was surveyed people living in Bath and the Southwest of England. The results supported the notion that non-Londoners were also willing to pay to fund the London Games: the aggregated WTP was approximately £5.8 million (Bath) and £173.2 million (Southwest), respectively. The study supports those intangible benefits are not limited to the host city (Walton et al., 2008).
Source: OpenEconomics
As stated in Aydogus et al. (2015), the Leontief model has been applied to estimate the non-monetary effects of investments through I-O tables based on physical flows rather than monetary transactions. Also, for this reason, I-O analysis gained increasing credibility first in the United States and subsequently in Europe and Asia.
According to Massiani (2018), what characterizes I-O methodologies (included its variants and extensions like Social Accounting Matrices) with respect to CGE models is a general tendency to overestimate economic effects due to the lack of consideration of substitution effects, especially regarding demand-driven shocks. This drawback may, however, be attenuated by considering only the expected net autonomous changes, therefore acting directly on the expenditure vector. On the other hand, CGE models are very sensitive to modelers' assumptions on technical parameters (for instance, the extent of exogenous increase in productivity, capital mobility, presence of involuntary unemployment), particularly when considering regional extensions. Generally, the structural advantage of CGE model is the consideration of price effects, which I-O models tend to ignore.
Several studies of mega-events have been conducted, employing the described set of methodologies. Starting from Korea-Japan 2002, the FWC impact has been examined ex-post in Lee et al. (2010), comparing its beneficial effects to the negative ones related to the 9/11 attack through a CGE model. Using an input-output approach, Lee and Taylor (2005) estimate the impact of the Korea/Japan FWC tourist attraction; in this case, substitution effects were considered through survey methods, which allowed researchers to isolate FWC-related tourist demand stimuli from the general tourist expansion in the same period and therefore to get a more robust result. Mabugu et al. (2008) performed an ex-ante evaluation of the 2010 FWC in South Africa using SAM (Social Accounting Matrix) multipliers. This technique can be seen as an extension of an I-O analysis, which incorporates full endogenous effects of consumption, income distribution, and savings.
SAMs are also at the basis of CGE models; regarding the 2010 FWC, Bohlmann and VanHeerden (2008) employed the UPGEM model, produced by Pretoria University, to carry out an impact assessment on the event. Also, Cost-Benefit Analysis has been employed to evaluate the South African FWC (Menezes 2010), but despite the advantages of the CBA approach in terms of flexibility regarding potential economic benefits and/or costs to evaluate, such method does not include any consideration of intersectoral economic relations or spill over effects (which are not negligible in the case of FWC events). A further study on FWC can be found in Domingues et al. (2010), in which a CGE model was used to simulate the national impact of the 2014 FWC in Brazil.

THE INTERNATIONAL MATCH CALENDAR REFORM: A SOCIO-ECONOMIC IMPACT ANALYSIS – TECHNICAL ANNEX 17
Of course, the strand of literature regarding mega-event impact assessment is not limited to FIFA FWC manifestations: Daniels and Norman (2003) produced estimates of seven sport tourism events in South Carolina through IMPLAN 2.0, a modelling platform based on multi-regional Input-Output analysis. The Olympics too, have been the subject of many impact assessment publications: Blake (2005) provides CGE estimates of the 2012 London Games; Andersen (1999) and KPMG (1993), using CGE and I-O models respectively, got similar results for the Sydney 2000 Olympic Games impact assessment.
REVIEW CONCLUSIONS
The FWC can be considered a sport megaevent of the same level as the Olympic Games, with some distinguishing features such as the concentration on a single sport, the greater diffusion over space, a somewhat larger audience in terms of both live and virtual crowds, but a lower impact on infrastructure and urban renewal. At the same time, the FWC presents characteristics of popularity, pervasiveness, and connectivity that far transcend any other large sport or non-sport event in terms of social participation, popular appeal, media attraction, and digital communication.
These distinguishing features depend on the nature of football not only as an extremely popular sport but also as a unique cultural artifact and the object of a global multimedia show that never stops and is continually magnified by ever-increasing and worldwide participation. For this reason, the global impact of the FWC is only partially comparable with the impact of the Olympics, and its effects tend to be more pervasive and subtle to describe and measure. While the Games periodically gather global audiences around the celebration of sports competitions and achievements, they are more aulic in character and celebrate heroism and upmanship in terms of high values that are periodically but discontinuously evoked. As unfamiliar protagonists of stories of high achievements, the athletes of the Games are thus somewhat distant from the applauding crowds, and their presence on the media is more spotty and less subject to the positive and negative interactions of continuous fandom culture.
These characteristics are reversed for football, which always enjoys uninterrupted familiarity and around-the-clock communication with masses of live and virtual followers. Within this fandom continuum, and unlike the Olympics, the FWC presents itself as the ultimate end game of an ongoing competitive tournament and show that involves participant athletes and fans in uninterrupted participating interaction. As a consequence, the FWC is an event that is populated by a host of familiar heroes, with well-known biographies, idiosyncrasies, virtues and vices, one where vast crowds enjoy the game not only as an exciting competition and an engaging show, but also as an opportunity to further elaborate ongoing storytelling, commentaries and gossips.
These characteristics of football as a unique cultural product explain why at the same time, few analyses of the impact of the FWC are found in literature, and those that are found produce inconclusive results. In reality, the attempts to apply routine methodologies of impact evaluation and cost-benefit analysis to the FWC are bound to fail if they do not consider the peculiar nature of football as a unique cultural product and its increasing association with technological change, digital communication, and globalization trends. For example, there is no doubt that the FWC is an instrument of global branding for the host country, but the benefits from this major market

THE INTERNATIONAL MATCH CALENDAR REFORM: A SOCIO-ECONOMIC IMPACT ANALYSIS – TECHNICAL ANNEX 18
THE FWC LEGACY AND TOURISM
Tourism represents one of the largest economic sectors in the World. In 1980, 277 million people travelled internationally, compared to 684 million people in 2000, 922 million in 2008 and a projected 1.6 billion by 2020 (UNWTO, 2009). COVID 19 handed a major blow to this trend and instead than the projected increase, the year 2020 witnessed a dramatic fall in international travels, with a reduced expenditure of $83 billion compared to $233 billion in 2019, a loss of 64%. However, tourism appears to be bouncing back in 2021 and remains a significant growing sector and a major source of earnings, especially for many developing countries, even though its global growth faces significant treats for the next future.
Because of the multiplicity of its motivations, and the increasing range of consumption and production patterns of its value chains, it has been proposed to treat tourism as a spectrum with a variety of products which includes both supply and demand factors, such as natural resources, cultural preferences, type of accommodation, types of activity and experiences and type of physical efforts (Wight 1993). Within this spectrum, the market segment occupied by the FWC can be narrowly identified as event tourism, even though the FWC as a unique event can be considered only the initial stimulus for a vaster and longer-term legacy.
operation cannot be seen simply in the increase in the number of tourists and must be evaluated over a reasonably long period of time.
A naïve recourse to cost-benefit methods is thus almost surely destined to fail because it will tend to disregard the most long-term important features of the legacy of the event. These may include, for example, process and product innovation, the adoption of new technologies, and the construction of smart infrastructures.
More intangible benefits, especially for developing countries, may also come from rebranding local products, tourist destinations, and hotel and reception facilities within a larger network of hyperconnected global customers. Investment in transportation and communication facilities are themselves carriers of big benefits, and their contribution to growth should not be considered contingent to the increase in the number of tourists during the event or a few years afterwards. Nor can the limited impact on tourism be considered against the alternative effects of an employment of the same funds for higher merit goods such as education or other social goals, as implied by some critics as Matsuoka De Aragao (2015) or Preuss (2000). The key methodological feature of cost-benefit analysis is comparing the scenario to be evaluated with its most likely, and not with its best, counterfactual.
Comparing simulated factual and counterfactual scenarios is also necessary for impact evaluation, and integrated impact and cost-benefit analysis (Scandizzo, 2020) is the technique of choice to consider the contribution of the megaevents to individual countries, as well as their more extended spillovers in time and space. In this respect, the econometric studies (Ahmar, 2008) also seem to fare much better than ex-ante and ex-post cost-benefit approaches since they can face more satisfactorily the feat of controlling for counterfactuals.

THE INTERNATIONAL MATCH CALENDAR REFORM: A SOCIO-ECONOMIC IMPACT ANALYSIS – TECHNICAL ANNEX 19
In spite of these promising features, the impact of the FWC on tourism remains elusive. Most of the literature concentrates on the short-term effects of the FWC, which in most cases seem to evaporate after a few years. Some studies compare the cost of the stadiums and other host country expenditures with the increases in tourist arrivals and expenditures before, during and after the event. Virtually all studies miss the long-term effects as well as the cumulative legacy of event driven local development and the increase over time of the capacity of the branded hosts to attract more and more visitors, tourism capital and global attention.
An important case of short-term positive analysis is Lee and Taylor (2005) for the case of the FWC in South Korea. Using the arguments put forward by Burgan and Mules (1992) and Crompton et al. (2001), these authors considered only the 57.7% (232,800) of the total foreign tourist arrivals (403,466) that were attributable to the FWC when calculating economic impact and found considerable and significant increases in tourist arrivals and per capita expenditures. These were on average 1.8 times the expenditures of ordinary tourists, a value very close to the 2.0 found by a study of the British Open (Gelan (2003)). The results of I–O analysis indicated that FWC tourists’ expenditure of US$522 million generated US$1.35 billion of output as a result of direct, indirect, and induced impacts. FWC tourists’ expenditure also produced US$307 million of income, US$713 million of value added, and US$71 million of indirect tax, and US$117 million of import.
Zimbalist (2015) argues that mega-sporting events present key features that make them ill-suited to generate future tourism growth in the host place. However, because of word-to-mouth advertising by family and friends who have attended the event, it is likely that tourism is promoted toward next events’ destinations. Thus, Brazil’s 2014 FWC doesn’t generate future tourism for Brazil, but it is likely to increase future tourism for Russia’s 2018 FWC.
Vierhaus (2018) analyzes the longer-term impact of mega-sporting events on international tourism through a model adapting the gravity equation of international trade to bilateral international tourist arrivals. He reported finding that hosting the FIFA FWC is overall ineffective in tourism promotion despite higher tourist arrivals in the event year. Viana (2018) also found seemingly ineffective results, with tourism not statistically correlated with economic growth or development for the host nation of the FIFA FWC.
On the other hand, a study by Fourie and Santana-Gallego (2020) argues that tourism is the key element of the megaevent since it is the basis for most revenues through ticket sales, hotels and restaurant expenditures, and passionate fan participation leading to consumption and business expansion. These authors also find that tourism impact from megaevents varies considerably across different events, hosts and time of the year, but report no evidence of tourism increase persistence beyond a three-year time horizon.
Meurer and Nunes Lins (2018) estimate the effect of hosting the FWC in 2014 on Brazilian international travel receipts and find that the FWC generated an increase of about 50% in receipts during the 2 months of the event, but these effects were short lived as they tended to evaporate within 6 months after the event.
Most of the negative results reported seem to concern special cases and no reliable cross-country study appears to be available for the long-term effects of sports megaevents on tourism.
THE INTERNATIONAL MATCH CALENDAR REFORM: A SOCIO-ECONOMIC IMPACT ANALYSIS – TECHNICAL ANNEX 20
Furthermore, the very attempt to single out the impact of the megaevent on long term tourism may be ill conceived since the effects are likely to depend heavily on times and places, and reliable counterfactual scenarios are very difficult to identify. Finally, and more generally, the increase of tourism in any place over a sufficiently long period of time will likely be path dependent, as a cumulative effect of a chain of events, planned and unplanned. Thus, the contribution of a single sport megaevent will also depend on the other events, urban regeneration programs and private sector opportunities.

THE INTERNATIONAL MATCH CALENDAR REFORM: A SOCIO-ECONOMIC IMPACT ANALYSIS – TECHNICAL ANNEX 21
2. THE FIFA FWC IMPACT
The present chapter presents the most relevant socio-economic effects of the FWC and its Reform from a global and local perspective. It also includes methodology and assumptions, and technical information about the produced simulations.
EVALUATION METHODOLOGY
The analysis aims to assess the direct and indirect socio-economic impact on the global economy resulting from the FWC and Continental Tournaments (CT) related investments, in the short and long term. To this end, an extended, closed-loop, Input-Output (I-O) model has been employed, which is a standard in the Impact Analysis literature.
Tab. 1.1. Stylized representation of the WIOT
Source: OpenEconomics elaboration on WIOD data.
The I-O analysis allows for estimating the impact of an autonomous change on an entire economy by exploiting the interdependencies between the considered interacting agents (e.g., industries, households, etc.). Such information is collected in the so-called input-output table, in which the mapped dimensions determine the potential extension of the analysis. Therefore, to capture the breadth of the FWC impact on the world economy, the most updated release of the world Input-Output table (WIOT)5, published by the World Input-Output Database (WIOD), has been employed in the study. Such database covers the transactions between industries and final users across
5 Timmer, M. P., Dietzenbacher, E., Los, B., Stehrer, R. and de Vries, G. J. (2015), "An Illustrated User Guide to the World
Input–Output Database: the Case of Global Automotive Production", Review of International Economics. - link

THE INTERNATIONAL MATCH CALENDAR REFORM: A SOCIO-ECONOMIC IMPACT ANALYSIS – TECHNICAL ANNEX 22
43 countries, for each of which a 56 sectors disaggregation, classified according to the International Standard Industrial Classification Revision 4 (ISIC Rev. 4), is considered. Data for the remaining countries have been included in a “rest of the world” account. The detailed list of sectors can be found in Tab. 1.2.
Through the detailed information about countries' economic interrelations, the WIOT allows for a broad analysis of the direct, indirect, and induced spillover effects across nations of the resources activated by the FWC. Moreover, the model is extended in order to account for the endogenous increase in final consumption induced by the Reform, modeled by means of households’ propensity to consume.
Specifically, the standard I-O model is based on the equilibrium condition:
X = AX + Y
where X corresponds to a nx1 vector of production levels, A is the closed-loop nxn coefficient matrix of intermediate goods transaction and Y a nx1 vector of exogenous variables. Value-added can be measured as a portion of the total level of production. Specifically, the nx1 vector of value-added V is obtained as:
V = FX
where F is the sum of production factors (e.g., labor and capital) coefficient matrix. From these conditions, the impact of an autonomous economic change can be derived as follows:
dX = (I - A)-1dY
dV = FdX = F(I - A)-1 dY
dX and dV represent the impact on the production and value-added level, respectively, generated by an exogenous shock dY, under the hypothesis of no structural changes (i.e, dA and dF are equal to 0).
As is well known, however, (see, for example, Sancho, 2013), in the standard I-O model the value-
added multipliers F(I - A)-1 necessarily sum to one, anchoring the results of the impact on value-added dV to the total value of the economic impulse dY. To overcome such limitation, the model has been extended to endogenize the effect of final domestic consumption on the total production level, according to the so-called closed-loop Leontief model, thus yielding total value-added multipliers different from one.

THE INTERNATIONAL MATCH CALENDAR REFORM: A SOCIO-ECONOMIC IMPACT ANALYSIS – TECHNICAL ANNEX 23
Tab. 1.2. Sectorial disaggregation
Source: UNSTATS

THE INTERNATIONAL MATCH CALENDAR REFORM: A SOCIO-ECONOMIC IMPACT ANALYSIS – TECHNICAL ANNEX 24
The equilibrium condition of the extended, closed-loop, Input-Output (I-O) model can be restated as:
X = AX + C + Y
where C is the final consumption matrix. Compared to the standard model, the same relation between production and value-added is respected, while the following relation between final consumption and value-added is considered:
C = λV
with as the vector of domestic marginal propensities to consume with respect to disposable income.
Finally, the impact derived from the extended closed-loop input-output model can be summarised by the following equation:
dX = (I - A - λF) -1 dY
Some additional considerations on the exogenous stimulus dY, in order to understand the breath and the depth of the analysis carried out. We can rewrite the impact equation as:
dXt+i= (I - At+i- λFt+i)-1[(dRt+i- mt+idYt) + mt+idYt]
where Rt+i is project revenue vector at time t+i and mt+i maintenance cost vector as a percentage of the value of the project at time t.
Note that maintenance costs can be eliminated from the equation because they enter both as autonomous expenditure (i.e., as a positive contribution) and as reductions in revenues, i.e., the positive shock of the net contribution of the project to the enterprises and financiers.
The total impact of FWC as a demand and supply shock over a period T at zero discount rate is:
∑ dXi
t=0 t
+ ∑ dXτ=T
τ=i+1∑ (I-At − λFt)-1dYt
i
t=0
+ ∑ (I-Aτ − λFτ)-1dRτ
T
τ=i+1
The vector of project revenues dRt (derived from the cash flow generated by preparation and tournament activities) combines supply and demand effects since it is a consequence of the increased production in the FWC induced infrastructure and other enterprises in their operational period. More specifically, we define the following additional equations:
Kt+i = Kt + EdYt
Qt+i = BKt+i

THE INTERNATIONAL MATCH CALENDAR REFORM: A SOCIO-ECONOMIC IMPACT ANALYSIS – TECHNICAL ANNEX 25
where Kt is nx1 vector of capital stocks for each sector, E the nxn matrix mapping investment expenditure from the project in increased capital stock by sector, Qt+ithe nx1 supply vector at time (t+i) of project maturity and 𝐵 the diagonal matrix of capital coefficients.
Substituting K in the latter equation and subtracting from the impact, we can determine the net income from the demand and supply shift in the project operational period:
∑ (I-At- λFt)-1dRt
T
t=i+1- ∑ dQ
T
t=i+1 t= ∑ [(I-At − λFt)-1RQt-1
T
t=i+1] B(Kt+EdYt)
where project proceeds are a function of production Rt = R(Qt), RQτ = ∂Rτ
∂Qτ ≥ 0. If this expression
gives a value greater than zero, the project creates more demand than supply. As a consequence, it will determine an increase in employment, since the excess demand created will be absorbed by excess supply (if any) in the rest of the economy.
The total increase in employment in the operational period will thus be proportional to the demand gap, i.e., the difference between the increase in demand deriving from project proceeds and the increase in production capacity determined by the project. If the estimated cash flow for the project indicates that at the time considered the increase in demand from project proceeds is lower than the increase in production capacity for a given level of unemployment, the project will absorb resources from the rest of the economy to reduce its own excess capacity and create more employment.
Therefore, in the presence of unemployment in the rest of the economy, FWC projects will always increase employment either through a supply shift (more output to meet excess demand from the reset of the economy) or through a demand shift (higher demand to reduce excess supply in the rest of the economy. Notice that these two effects are not present in the case of a pure expenditure increase, which can only increase employment by absorbing unused productive capacity.
To illustrate further the result, consider an economy with unemployment with high excess capacity in the form of underutilized industrial plants. For this economy, FWC projects and related activities have two distinct effects: (i) they reduce unemployment in the construction period by increasing demand, (ii) they also reduce unemployment in the operational period depending on whether they reduce or increase idle productive capacity. If the demand generated by the FWC proceeds exceeds the capacity generated by the projects’ build-up, the project will reduce unemployment in the rest of the economy by increasing aggregate demand.
If on the other hand the project increases productive capacity beyond what can be absorbed through the demand increase spurred by project proceeds, it will reduce unemployment by absorbing labor from the rest of the economy. In other words, in the present world environment characterized by unemployment, expanding the FWC is always likely to generate both demand and supply shocks and additional employment no matter which of the two shocks prevail.
THE INTERNATIONAL MATCH CALENDAR REFORM: A SOCIO-ECONOMIC IMPACT ANALYSIS – TECHNICAL ANNEX 26
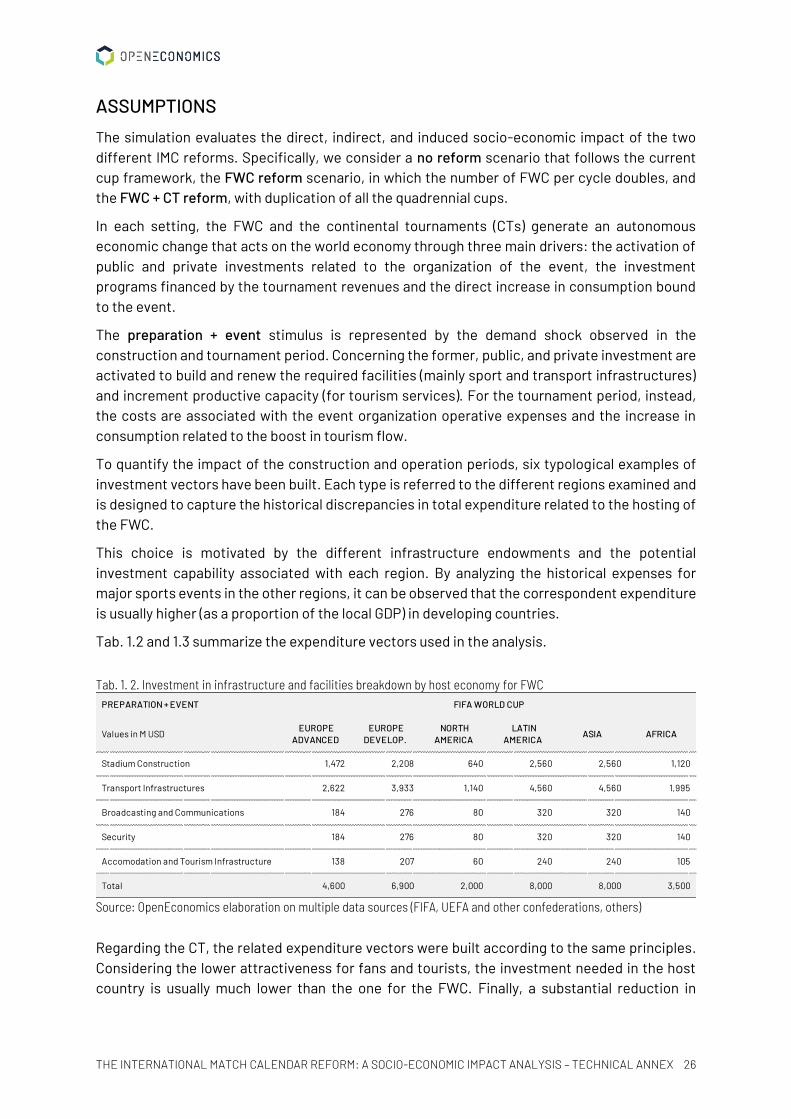
ASSUMPTIONS
The simulation evaluates the direct, indirect, and induced socio-economic impact of the two different IMC reforms. Specifically, we consider a no reform scenario that follows the current cup framework, the FWC reform scenario, in which the number of FWC per cycle doubles, and the FWC + CT reform, with duplication of all the quadrennial cups.
In each setting, the FWC and the continental tournaments (CTs) generate an autonomous economic change that acts on the world economy through three main drivers: the activation of public and private investments related to the organization of the event, the investment programs financed by the tournament revenues and the direct increase in consumption bound to the event.
The preparation + event stimulus is represented by the demand shock observed in the construction and tournament period. Concerning the former, public, and private investment are activated to build and renew the required facilities (mainly sport and transport infrastructures) and increment productive capacity (for tourism services). For the tournament period, instead, the costs are associated with the event organization operative expenses and the increase in consumption related to the boost in tourism flow.
To quantify the impact of the construction and operation periods, six typological examples of investment vectors have been built. Each type is referred to the different regions examined and is designed to capture the historical discrepancies in total expenditure related to the hosting of the FWC.
This choice is motivated by the different infrastructure endowments and the potential investment capability associated with each region. By analyzing the historical expenses for major sports events in the other regions, it can be observed that the correspondent expenditure is usually higher (as a proportion of the local GDP) in developing countries.
Tab. 1.2 and 1.3 summarize the expenditure vectors used in the analysis.
Tab. 1. 2. Investment in infrastructure and facilities breakdown by host economy for FWC
Source: OpenEconomics elaboration on multiple data sources (FIFA, UEFA and other confederations, others)
Regarding the CT, the related expenditure vectors were built according to the same principles. Considering the lower attractiveness for fans and tourists, the investment needed in the host country is usually much lower than the one for the FWC. Finally, a substantial reduction in

THE INTERNATIONAL MATCH CALENDAR REFORM: A SOCIO-ECONOMIC IMPACT ANALYSIS – TECHNICAL ANNEX 27
expenditure per country was considered due to the new co-hosting formula, which should significantly reduce the volume of investments necessary to host the event.
Coherently with past observed expenditure vectors, most of the costs related to a FWC are attributable to building and improving sport and transport infrastructures (30% and 60% of the expenses circa). The remaining funds are divided between event-related costs and the expected increase in tourists’ spending.
This investment breakdown has been similar in all the past events, no matter the amount spent, suggesting a pattern of expenses independent from the level of development of the hosting country. Nonetheless, on average, the total costs of the tournament tend to be a significantly lower GDP proportion for developed regions.
Tab. 1.3. Investment in infrastructure and facilities breakdown by host economy type for CTs.
Source: OpenEconomics elaboration on multiple data sources (FIFA, UEFA and other confederations, others)
The reinvestment programs stimulus consists of those FIFA funds destined to the Education and Development programs activated by the expansion of the revenues. These programs are carried on by directly financing local projects and supporting parallel investments of MAs.
Tab. 1.4. Hypothetical reinvestment policy for FIFA Development & Education programs.
Source: OpenEconomics elaboration on multiple data sources (FIFA, UEFA and other confederations, others)

THE INTERNATIONAL MATCH CALENDAR REFORM: A SOCIO-ECONOMIC IMPACT ANALYSIS – TECHNICAL ANNEX 28
Within the proposed Reform, the reinvestment policy is planned to be increased along with the level of revenues per cycle, going from 2.3 B USD per cycle in the no reform scenario to 5.1 B USD with the Reform6.
In Tab. 1.4 and 1.5 the disaggregation of the typological programs’ expenses and their possible geographical distribution are presented.
The values depicted constitute an estimate of future investment by FIFA per cycle and are based on historical data, FIFA programs policies, and projections of future revenues for the different scenarios.
Tab. 1.5. Hypothetical reinvestment policy for Confederations development programs
Source: OpenEconomics elaboration on multiple data sources (FIFA, UEFA and other confederations, others)
Tab. 1.4 shows how FIFA development and education programs determine a fair redistribution of resources between the members entitled to the funds.
This result is achieved by anchoring the projects financial support to the specific investment needs, prioritizing those associations with limited funding (e.g., developing countries).
It is worth noticing that, besides financial outcomes, the programs carry a high potential for delivering a significant positive impact on welfare and the long-term development of beneficiaries.
Finally, the consumption stimulus includes both demands and supply shocks from the FWC reform and captures the increase in the global consumption of the football product, modeled as an increase in the fruition of broadcasting activities and purchase of electronic devices needed to access such services.
As shown in Tab. 1.6, the main driver of the shock is the increment in consumers’ expenditure for up-to-date technological products.
6 Based on FIFA projection over a four-year cycle without considering prize money.

THE INTERNATIONAL MATCH CALENDAR REFORM: A SOCIO-ECONOMIC IMPACT ANALYSIS – TECHNICAL ANNEX 29
Tab. 1.6. Hypothetical consumption shock per event
Source: OpenEconomics elaboration on multiple data sources (FIFA, UEFA and other confederations, others)
Prudently, a drop of 10% is applied to take into account a decrease of the effect of the reform in the long-term. Indeed, the substitution of electronic devices may present adjustment costs, and TV broadcasting services subscriptions might not increase by the same amount for each FWC or CT event.
KPIs DESCRIPTION
Consistently with the scientific literature on impact evaluation, the results of the analysis are presented along the following dimensions:
1. Additional global GDP (Gross Domestic Product) generated directly (as a result of investment spending), indirectly (along value chains), and via induced activities, such as additional productive capacity, private investment, and goodwill. The results are expressed in cumulated form, using present value calculations, according to benefit-cost practices. The evaluation is performed within an open economy-world trade context so that a discount rate of 4% is used as the world opportunity cost of capital and the US dollar as numeraire.
2. Additional permanent jobs created globally, which are needed to meet the required workforce to support the estimated GDP growth. This KPI is corrected for expected employment duration and is conventionally expressed in terms of Full Time Equivalent jobs (FTE).
3. Additional government revenues in taxes paid by consumers and industries, following the expected increase in incomes and consumption levels due to the additional household real incomes and well-being generated by the FWC event.
RESULTS BREAKDOWN
Tables 1.7-1.9 present results for each of the three sources of shocks and for each one of the considered scenarios. Each table shows the geographical allocation of the impacts on each dimension.
The impact estimates presented in the Tab. 1.7 refer to the “Preparation + Event” phase of the FWC and CT events, hence they are the result of the investment shock created by the building of infrastructures (e.g., stadiums, transportation, etc.), as well as of tourist and accommodation facilities in preparation for the FWC. These shocks originate a series of increases in demand for
CONSUMPTIONS
Values in M USD
Manifacture of electronic products 1,400 140
Broadcasting activities 600 60
Total 2,000 200
FIFAWORLD CUP
CONTINENTAL TOURNAMENTS

THE INTERNATIONAL MATCH CALENDAR REFORM: A SOCIO-ECONOMIC IMPACT ANALYSIS – TECHNICAL ANNEX 30
intermediate inputs and consequent increases in revenues along the value chains both in the host country and in its commercial partners.
These increases in demand cause an increase in employment and incomes and give rise to the so-called multipliers that compound direct, indirect, and induced effects both to the production of intermediate goods, final goods, incomes, and consumption. In the No Reform scenario (with unchanged FWC and continental tournaments calendar), the impact in present value on GDP amounts to almost 66 BUSD and is accompanied by the creation of 723 thousand Full-Time jobs over the whole 16-year period. Such effect is expected to increase by 57% if the FWC frequency doubles (“FWC Reform” scenario). Under the hypothesis of doubling the frequency of all the CT, currently held every four years (“Global Reform” scenario), the impact would rise by 77%. It would translate into a cumulative GDP increase of 116 BUSD in present value and into global job creation of 1,2 million FTEs.
Tab. 1.7. Socio-economic impact on the host and global economies due to the “Preparation + Event” phase of the FWC
Source: OpenEconomics elaboration on multiple data sources (FIFA, UEFA and other confederations, others)
Tab. 1.8. Socio-economic impact on the host and global economies due to funds by FIFA and other confederations
Source: OpenEconomics elaboration on multiple data sources (FIFA, UEFA and other confederations, others)
GDP JOBS TAX GDP JOBS TAX GDP JOBS TAX
B USD K FTE B USD B USD K FTE B USD B USD K FTE B USD
ASIA 23.36 256.28 0.65 42.10 410.28 1.18 47.32 471.13 1.32
EUROPE 15.09 159.49 0.42 24.93 256.87 0.70 27.38 280.83 0.77
SOUTH AMERICA 8.90 96.61 0.25 9.52 103.75 0.27 12.20 131.84 0.34
AFRICA 8.81 128.24 0.25 13.18 193.08 0.37 15.00 219.86 0.42
NORTH AMERICA 9.43 83.24 0.26 13.28 116.34 0.37 13.93 121.68 0.39
TOTAL 65.59 723.86 1.84 103.01 1,080.32 2.88 115.83 1,225.34 3.24
PREPARATION + EVENT
NO REFORM FWC REFORM FWC + CT REFORM
GDP JOBS TAX GDP JOBS TAX GDP JOBS TAX
B USD K FTE B USD B USD K FTE B USD B USD K FTE B USD
ASIA 7.49 87.60 0.21 15.67 183.26 0.44 16.21 189.56 0.45
EUROPE 10.57 113.08 0.30 13.76 147.21 0.39 19.51 208.67 0.55
SOUTH AMERICA 2.12 28.70 0.06 4.49 60.91 0.13 4.60 62.47 0.13
AFRICA 2.54 33.82 0.07 5.41 72.08 0.15 5.54 73.75 0.15
NORTH AMERICA 0.49 4.31 0.01 0.91 8.02 0.03 1.01 8.91 0.03
TOTAL 23.21 267.51 0.65 40.25 471.48 1.13 46.88 543.37 1.31
REINVESTMENT PROGRAMS
NO REFORM FWC REFORM FWC + CT REFORM

THE INTERNATIONAL MATCH CALENDAR REFORM: A SOCIO-ECONOMIC IMPACT ANALYSIS – TECHNICAL ANNEX 31
The second pillar of the Impact Analysis of the Reform concerns the macroeconomic effect of the redistribution of funds that FIFA and the other confederations voluntarily carry out through their Development and Education programs every year.
In the 2016-2022 period, more than 2 B USD has been distributed worldwide thanks to the FIFA Forward program (1.0 and 2.0), through direct spending in the 211 MAs, and the distribution to Confederations and other zonal regional associations. These funds have contributed, among other things, to finance over 1500 projects, ranging from new stadiums to technical centers.
If FIFA kept this spending pattern constant over the successive four cycles, model simulations show that the economic impact of such spending would be 23 B USD, with more than half of such wealth spreading outside Europe and North America. It is straightforward to expect that, should the FWC reform take place, the expenditure for the development of football worldwide would go up, and therefore its impact would increase as well: the estimation for the “FWC Reform” scenario exhibits an impact of around 40 B USD (73% increase compared to the status quo).
These figures also consider the effect of the extra money spent by each confederation; if CTs were to be doubled, the impact of reinvestments of funds carried out by FIFA and continental confederations would reach 47 B USD in terms of GDP, with 543 thousand additional FTE. Compared to the No Reform scenario, the impact would be slightly more than double (102% increase).
In fact, the same mechanism would apply to confederations: an increased frequency of Continental Tournaments would allow confederations to commit a larger amount of funds to their development programs, parallelly to the FIFA ones. It is worth recalling that, in addition to the intrinsic beneficial value of such programs, they contribute to equalizing opportunities and development levels worldwide since they are not limited to host countries but directed to regions that are more in need of external resources.
Tab. 1.9. Socio-economic impact on the host and global economies due to increase in media consumption
Source: OpenEconomics elaboration on multiple data sources (FIFA, UEFA and other confederations, others)
The third dimension under analysis is the expected increase in consumption of TV media content and the extra purchase of electronic devices that would not have occurred without FWC events.
GDP JOBS TAX GDP JOBS TAX GDP JOBS TAX
B USD K FTE B USD B USD K FTE B USD B USD K FTE B USD
ASIA 4.27 46.14 0.12 8.16 82.86 0.23 9.09 93.44 0.25
EUROPE 3.53 36.14 0.10 5.04 51.12 0.14 5.40 54.47 0.15
SOUTH AMERICA 1.09 12.50 0.03 1.42 16.81 0.04 1.71 19.98 0.05
AFRICA 0.48 6.44 0.01 0.79 10.47 0.02 0.85 11.33 0.02
NORTH AMERICA 1.86 16.15 0.05 2.80 24.14 0.08 2.89 24.94 0.08
TOTAL 11.24 117.37 0.31 18.20 185.40 0.51 19.93 204.16 0.56
FWC REFORM FWC + CT REFORM
CONSUMPTIONS
NO REFORM
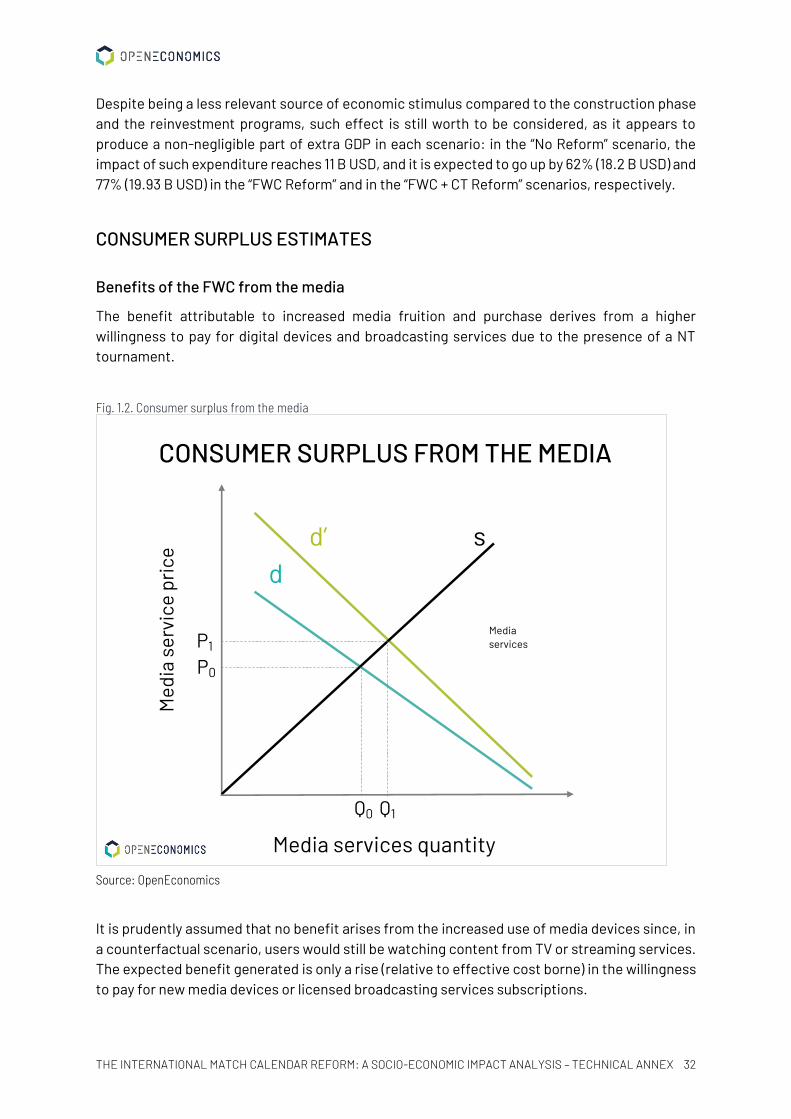
THE INTERNATIONAL MATCH CALENDAR REFORM: A SOCIO-ECONOMIC IMPACT ANALYSIS – TECHNICAL ANNEX 32
Despite being a less relevant source of economic stimulus compared to the construction phase and the reinvestment programs, such effect is still worth to be considered, as it appears to produce a non-negligible part of extra GDP in each scenario: in the “No Reform” scenario, the impact of such expenditure reaches 11 B USD, and it is expected to go up by 62% (18.2 B USD) and 77% (19.93 B USD) in the “FWC Reform” and in the “FWC + CT Reform” scenarios, respectively.
CONSUMER SURPLUS ESTIMATES
Benefits of the FWC from the media
The benefit attributable to increased media fruition and purchase derives from a higher willingness to pay for digital devices and broadcasting services due to the presence of a NT tournament.
Fig. 1.2. Consumer surplus from the media
Source: OpenEconomics
It is prudently assumed that no benefit arises from the increased use of media devices since, in a counterfactual scenario, users would still be watching content from TV or streaming services. The expected benefit generated is only a rise (relative to effective cost borne) in the willingness to pay for new media devices or licensed broadcasting services subscriptions.
Media services quantity
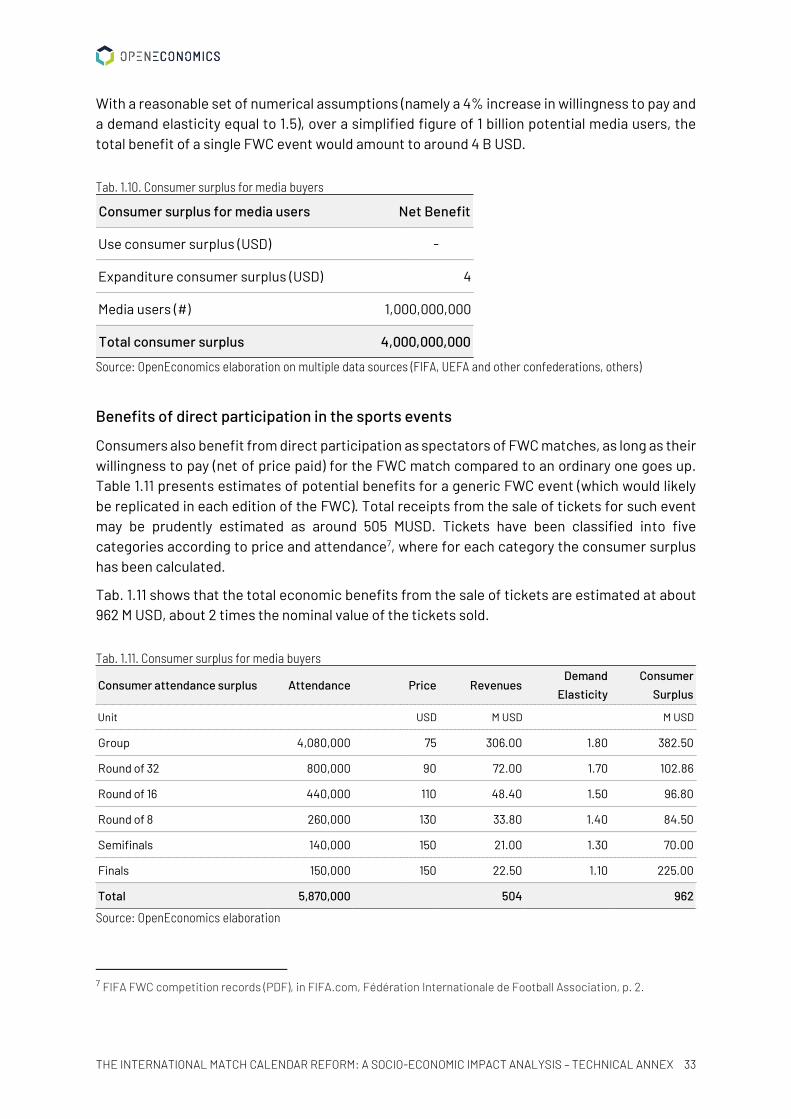
THE INTERNATIONAL MATCH CALENDAR REFORM: A SOCIO-ECONOMIC IMPACT ANALYSIS – TECHNICAL ANNEX 33
With a reasonable set of numerical assumptions (namely a 4% increase in willingness to pay and a demand elasticity equal to 1.5), over a simplified figure of 1 billion potential media users, the total benefit of a single FWC event would amount to around 4 B USD.
Tab. 1.10. Consumer surplus for media buyers
Source: OpenEconomics elaboration on multiple data sources (FIFA, UEFA and other confederations, others)
Benefits of direct participation in the sports events
Consumers also benefit from direct participation as spectators of FWC matches, as long as their willingness to pay (net of price paid) for the FWC match compared to an ordinary one goes up. Table 1.11 presents estimates of potential benefits for a generic FWC event (which would likely be replicated in each edition of the FWC). Total receipts from the sale of tickets for such event may be prudently estimated as around 505 MUSD. Tickets have been classified into five categories according to price and attendance7, where for each category the consumer surplus has been calculated.
Tab. 1.11 shows that the total economic benefits from the sale of tickets are estimated at about 962 M USD, about 2 times the nominal value of the tickets sold.
Tab. 1.11. Consumer surplus for media buyers
Source: OpenEconomics elaboration
7 FIFA FWC competition records (PDF), in FIFA.com, Fédération Internationale de Football Association, p. 2.
Consumer surplus for media users Net Benefit
Use consumer surplus (USD) -
Expanditure consumer surplus (USD) 4
Media users (#) 1,000,000,000
Total consumer surplus 4,000,000,000
Consumer attendance surplus Attendance Price RevenuesDemand
Elasticity
Consumer
Surplus
Unit USD M USD M USD
Group 4,080,000 75 306.00 1.80 382.50
Round of 32 800,000 90 72.00 1.70 102.86
Round of 16 440,000 110 48.40 1.50 96.80
Round of 8 260,000 130 33.80 1.40 84.50
Semifinals 140,000 150 21.00 1.30 70.00
Finals 150,000 150 22.50 1.10 225.00
Total 5,870,000 504 962

THE INTERNATIONAL MATCH CALENDAR REFORM: A SOCIO-ECONOMIC IMPACT ANALYSIS – TECHNICAL ANNEX 34
Existence Value of the FIFA FWC as a Local Public Good
A relevant part of a mega-event economic impact can be quantified through its Existence Value (EV), measured by a contingent valuation based on willingness to pay (WTP) declared in person-to-person interviews (see, for example, Boardman et al. (2001)).
A study of the matter (Atkinson, 2008) suggests Existence Value estimates for the London 2012 Olympics of 22 USD (per capita for the residents directly involved8).
Considering a plausible average hosting country with a population of about 8 million adult residents between the hosting cities and their provinces and assuming as a conservative estimate that 50% of them are willing to pay an average of 10 USD, the Existence Value would be about 40 M USD. This WTP only applies to the core group of residents whose FWC pride is directly aroused by the fact that the tournament would take place in their home city.
The residents of the other neighbouring localities not included in the province, and all the host countries citizens are also assumed to be willing to pay for the Existence Value of the FWC in their country, even though their WTP will probably be lower.
Assuming a WTP of about 5 USD per capita on average for the remaining adult population (about 55 million people), a further Existence Value is estimated at about 123 M USD.
These figures are low and prudent estimates and indicate a likely minimum economic “Existence Value” of the FWC if held in the respondent's home country. The amount deriving from the pride of being the FWC host, and the other intangible characteristics associated with it (social capital, sustainability, etc.), should then be a once and for all value for the WTP of around 164 M USD (Tab. 1.12).
Tab. 1.12. Consumer surplus for media buyers
Source: OpenEconomics
Benefits from increased sport practice
It is possible to model these benefits through the expected payoff of a real option. The prices for exercising the options are the costs to pay to keep running the new sports facilities also after the FWC has ended and the value of the time to devote to the sports activities involved; benefits instead can be identified with the advantages of lower inactivity rates. To produce numerical estimates, it is possible to simulate data and parameters for a generic FWC host city.
8 According to the results, the residents of London would have been willing to pay an average of 22 pounds, those of Manchester 12 and, finally, those of Glasgow 11.
Existence Value Residents Satisfaction Interested
residents
WTP per
capita (USD)Total WTP
Host cities 8,000,000 50% 4,000,000 10 40,000,000
Rest of the country 55,000,000 45% 24,750,000 5 123,750,000
Total 63,000,000 28,750,000 163,750,000

THE INTERNATIONAL MATCH CALENDAR REFORM: A SOCIO-ECONOMIC IMPACT ANALYSIS – TECHNICAL ANNEX 35
Assuming a cost of facilities maintenance equal to 400 M USD, 75,000 expected users (corresponding to the inactive population of a medium-sized sample host city), a 10 USD hourly cost of sports practice, and 60 hours of physical activity per year (corresponding to 2 hours per week for 7/8 months), the total cost of exercising the option amounts to 850 M USD.
Tab. 1.13. Consumer surplus for media buyers
Source: OpenEconomics elaboration
On the benefits side, an individual health benefit of 733 USD per year has been estimated for people practicing sport. In addition, the value of free time that people spend practicing physical activities has been assumed to be 21.6 USD per hour. For the same number of people and hours employed in costs calculation and considering 10 years of average remaining sporting life per capita, total benefits reach 1.5 B USD. With such a hypothesis, the option value, with three volatility scenarios, is shown in Tab. 1.14.
Tab. 1.14. Consumer surplus for media buyers
Source: OpenEconomics elaboration
Sport activity option Value Unit
Operating Cost of facilieties 400,000,000 USD
Users 75,000 people
Hourly cost of sport practice per capita 10 USD
Average hours of sport practice per year 60 Hours
Exercise cost of the option 850,000,000 USD
Annual benefit to healt per capita 733 USD
Free time use value 21.6 USD
Expected benefit from option 1,521,750,000 USD
Average remaining sporting life per capita 10 years
VolatilityOption Value
(USD)
20% 713,251,290
30% 715,291,198
40% 723,832,237

THE INTERNATIONAL MATCH CALENDAR REFORM: A SOCIO-ECONOMIC IMPACT ANALYSIS – TECHNICAL ANNEX 36
3. ECONOMIC COST-BENEFIT ANALYSIS OF PLAYERS' ENGAGEMENT IN NTs
The present chapter offers a detailed examination of the benefits and the costs for clubs resulting from players release during national team windows.
Fig. 2.1. CBA analysis results
Source: OpenEconomics on data provided by Standard Football and FIFA TMS
The analysis aims to assess whether the increasingly intensive engagement in tournaments and friendlies of national teams would impose an excessive burden on clubs or whether the potential benefits outweigh such costs. To evaluate the resulting net benefit, an economic cost-benefit analysis has been performed.
According to the EU guidelines on CBA analysis9, “CBA is an analytical tool to be used to appraise an investment decision in order to assess the welfare change attributable to it […]. The purpose of CBA is to facilitate a more efficient allocation of resources, demonstrating the convenience for society of a particular intervention rather than possible alternatives”. Although in the present study this kind of analysis is applied to an event involving a single asset (the enrolment of football
9 Sartori, D., Catalano, G., Genco, M., Pancotti, C., Sirtori, E., Vignetti, S., & Bo, C. (2014). Guide to cost-benefit analysis of investment projects. Economic appraisal tool for cohesion policy 2014-2020.

THE INTERNATIONAL MATCH CALENDAR REFORM: A SOCIO-ECONOMIC IMPACT ANALYSIS – TECHNICAL ANNEX 37
player in the national team) rather than a large-scale project, all the basic principles about economic benefits and costs evaluation have been applied.
The analysis focuses on 38 most relevant clubs (in terms of revenues generated in the last three seasons) because they have the highest risk exposure. It considered a conventional timeframe of four years.
Statistics on players and clubs was sourced from FIFA Transfer Matching System for international player transfers and a specialised database for the player’s market value provided by Standard Football.
Regarding the club benefits, the analysis considers:
▪ The appreciation of market value for the player taking part in NT fixtures. This is the most important benefit for the club because it contributes to the player portfolio value (the club's main asset) that can be monetized in the transfer market.
▪ The per-day compensation for players’ release for taking part in the FWC recognised by FIFA to clubs under the Club Benefits Program.
▪ The compensation payments by FIFA to clubs under the Club Protection Program.
▪ The compensation payments by insurance companies to clubs.
Regarding the potential costs, the analysis considers:
▪ The depreciation of the market value for players injured while playing for the NT.
▪ The salary paid to players’ while playing for the NT.
▪ The share of the insurance costs attributable to the time spent by players in the NT.
Specific calculation of each benefit can be found in the following session.
CLUB BENEFITS
Total benefits can be expressed according to the following formula:
Club Benefits = TPA + FIC + IR + FIR
Where:
▪ TPA is the total player value appreciation per club. This dimension has been estimated by comparing the market value of players regularly taking part in national team matches with comparable players (in terms of performance, league, and age) usually not included in NT roasters. Empirical evidence shows that NT players are on average 12% more valuable than their colleagues (PVA), meaning that a higher match exposure generates a remarkable effect on market values, which belonging clubs can monetize. Considering that the average

THE INTERNATIONAL MATCH CALENDAR REFORM: A SOCIO-ECONOMIC IMPACT ANALYSIS – TECHNICAL ANNEX 38
market value of all players included in the sample before contract termination (NTV) is equal to 34.8510 M USD, and an average number of 10.55 players (#P) per team regularly plays NT matches, TPA can be expressed as follows:
TPA = PVA ∗ #P ∗ NTV ∗ 4/D11 = 71.36 M USD
▪ FIC corresponds to the FIFA compensation scheme and regards the daily compensation that FIFA recognizes to clubs for letting players attend the final phase of the FWC. The daily compensation can cover up to 2 weeks before the starting date of the tournament and amounts to nearly 8,530 USD (FWCR) per player12. Considering an average 10.5 players per team disputing the FWC and an average 25 days of leave duration for each player (FWCD), the average FIFA compensation per team is calculated as below:
FIC = FWCR ∗ FWCD ∗ #P = 8,530 USD/day ∗ 25 days ∗ 10.55 = 2.25 M USD
▪ IR stands for the average injury refund that football clubs are able to obtain from their internal assurance schemes. This parameter varies on a club-by-club basis, depending on a series of assumptions such as player age, type of injury, number and severity of previous injuries etc. However, according to a small survey conducted among some important sporting directors, it can be assumed that, on average, clubs can obtain up to 8% of the market value as a refund for a typical injury (IR%). The benefit deriving from the internal injury insurance scheme directly attributable to NT matches has been estimated as 2/1213 of the average yearly refund.
For what concerns the computation of an average injury rate (I), the number of missed games over total maximum appearances per season has been calculated for the last 8 years. Results show that the average injury rate (considered to be equal for NT and club matches) amounts to 10%.
As a result, considering that the average value of sampled players (NTV) amounts to 34.85 MUSD, IR is computed as follows:
IR = IR(%) ∗ I(%) ∗ NTV ∗ #P ∗ 212
∗ 4/D = 0.79 M USD
▪ FIR is the average injury refund paid by FIFA per team. This instrument was introduced in 2019, when FIFA agreed to introduce a compensation for clubs in the event of players falling injured while away on international duty. This compensation can be obtained under two conditions: (1) the player has to be unavailable for no less than 28 days, and (2) the
10 Computed considering an average contract duration of 2.49 years. 11 D refers to the average contract duration of sampled players. This adjusts to proportionate benefits
over the conventional 4-year period. 12 Source: FIFA 13 Assuming that NT payers spend on average 1 month out of 12 on international duty.

THE INTERNATIONAL MATCH CALENDAR REFORM: A SOCIO-ECONOMIC IMPACT ANALYSIS – TECHNICAL ANNEX 39
compensation needs to be proportional to the players' salary, with a maximum payment per injury of 8.33 M USD14.
Considering that the average yearly gross salary of players (SAL) included in the sample amounts to 10.33 M USD, and that on average players spend roughly 2 months per year (equivalent to 16 matches per season) with their national teams, applying an injury rate of 10% FIR can be detailed as in the following formula:
FIR = SAL ∗ I(%) ∗ #P ∗ 212
∗ 4 = 7.27 M USD
As a result, total club benefits deriving from the participation of players in national team tournaments over their residual contract duration can be summarised as follows
Club Benefits = TPA + FIC + IR + FIR = 81.66 M USD
CLUB COSTS
Costs associated with clubs for releasing players on international duty mainly include the market value depreciation of players falling injured during NT matches, total salaries paid despite player unavailability during NT windows, and the share of annual insurance price attributable to national team matches.
Club Costs = TPD + SL + CIP
Where:
▪ TPD is the asset depreciation as a result of injuries. To estimate in economic terms the loss experienced by clubs for each injury, the average cash flow per match generated by NT players has been computed by dividing the market value of players by the number of matches before contract expiration:
NPV = NTVMN
= 34.85 M USD
100 = 0.350 M USD
If we assume that, on average, players miss 16 games per injury (GM), we can estimate the yearly per-player expected depreciation as a result of injuries as follows:
PVD = NPV ∗ GM = 0.397 M USD ∗ 16 = 5.6 M USD
Applying the same assumptions in terms of injury rates and NT players per club described above, we can summarise the total players value depreciation per club as a result of injuries in a 4-years cycle as follows:
14 Source: FIFA

THE INTERNATIONAL MATCH CALENDAR REFORM: A SOCIO-ECONOMIC IMPACT ANALYSIS – TECHNICAL ANNEX 40
TPD = PVD ∗ I(%) ∗ #P ∗ 4 = 5.6 M USD ∗ 10% ∗ 10.55 ∗ 4 = 23.65 M USD
▪ SL includes average salaries paid to players while playing for national teams: despite over a season, players spending some time away in international duty, clubs pay salaries to players for the entire season. Since, on a yearly basis, players are deployable by their respective NT coaches for 1 month out of 12, the following formula gives the salary loss for clubs:
SL = #P ∗ SAL ∗ 1
12 ∗ 4 = 36.33 M USD
▪ CIP is the share of insurance policy attributable to matches played in NT competitions. This value can be identified by multiplying an average insurance premium paid by clubs and the % share of this premium that is attributable to matches played for national teams.
▪ The average premium (IP) can be assumed to be around 1% of the average roaster value (RV) of clubs included in the sample, equal to 688 M USD. The share of NT matches over the entire fixtures foreseen on a 4-year cycle is on average 48 out of 240. Insurance cost attributed to NT matches is calculated as follows:
CIP = RV ∗ 1% ∗ 48
240 = 1.38 M USD
Summing up, total club costs arising as a consequence of players’ participation in national team competitions amounts to:
Club Costs = TPD + SL + CIP = 61.36 M USD
Summing up, using again suitable assumptions and players sample data to calculate the Club Costs variables defined before, total club costs arising as a result of players’ participation in national team competitions for a 4-year cycle amount to 61.36 M USD.
Net benefits arising from the presented micro-analysis amount to 20.3 M USD, with a Benefits/Costs ratio of 1.33.
The take-home message of this simplified CBA experiment is that, on average, for clubs exposed to player release, the benefits of national team exposure of their footballers overcome the costs, meaning that it is convenient for clubs to let their players participate in NT competitions, as their market value increases despite a relatively higher exposure to injury risk compared to their colleagues.
Tab. 2.1 depicts the results of the cost-benefit analysis:

THE INTERNATIONAL MATCH CALENDAR REFORM: A SOCIO-ECONOMIC IMPACT ANALYSIS – TECHNICAL ANNEX 41
Tab. 2.1. CBA details by club
Source: OpenEconomics on data provided by Standard Football and FIFA TMS
CLUB NT PLAYERS BENEFIT COST NET RATIO
Real Madrid 19 222.73 182.60 40.12 1.22
PSG 18 194.27 146.99 47.28 1.32
Liverpool 18 204.27 145.51 58.76 1.40
Manchester United 18 203.37 145.55 57.82 1.40
Juventus 18 180.14 139.82 40.32 1.29
Manchester City 17 196.25 143.35 52.90 1.37
Internazionale 17 131.90 102.60 29.29 1.29
Bayern Munich 15 150.28 138.22 12.06 1.09
Chelsea 15 173.77 117.38 56.39 1.48
Atlètico Madrid 14 117.13 74.73 42.40 1.57
Tottenham Hotspur 14 108.77 73.02 35.75 1.49
Napoli 14 89.16 58.86 30.30 1.51
Arsenal 13 80.41 72.78 7.64 1.10
Everton 13 63.45 47.39 16.05 1.34
Borussia Dortmund 12 131.75 92.26 39.49 1.43
Barcelona 11 125.58 119.57 6.01 1.05
Roma 11 56.48 41.39 15.09 1.36
Atalanta 11 75.90 41.82 34.08 1.82
Bayer Leverkusen 10 45.48 34.51 10.97 1.32
Newcastle United 10 38.80 31.97 6.83 1.21
Milan 10 69.82 49.09 20.73 1.42
Ajax 9 42.37 27.30 15.08 1.55
Sevilla 9 31.95 21.99 9.96 1.45
Eintracht Frankfurt 8 33.18 25.89 7.28 1.28
RB Leipzig 8 60.92 38.05 22.87 1.60
Hoffenheim 7 35.88 25.73 10.15 1.39
Besiktas 7 21.59 20.69 0.89 1.04
Leicester City 7 39.50 36.57 2.93 1.08
Crystal Palace 6 23.74 22.29 1.45 1.07
West Ham United 6 16.87 16.26 0.62 1.04
Burnley 6 17.18 16.01 1.18 1.07
Olympique Lyonnais 5 15.44 14.86 0.59 1.04
Southampton 5 17.03 7.51 9.52 2.27
Porto 4 10.67 9.13 1.54 1.17
Wolfsburg 4 23.94 19.18 4.76 1.25
Valencia 4 21.49 13.81 7.68 1.56
Wolverhampton Wanderers 4 21.34 10.41 10.93 2.05
Watford 4 10.43 6.93 3.50 1.51
Average 11 81.66 61.37 20.30 1.33

THE INTERNATIONAL MATCH CALENDAR REFORM: A SOCIO-ECONOMIC IMPACT ANALYSIS – TECHNICAL ANNEX 42
4. BIBLIOGRAPHY
BIBLIOGRAPHY ON SPORT EVENT IMPACT
▪ 2018 FIFA FWC Russia: Global broadcast and audience summary - link
▪ Ahmar, S. (2008) Hosting the Olympics: Sprint or Marathon? An Empirical Study on the Employment Impacts of Hosting Major Sporting Events. Glasgow: University of Strathclyde.
▪ Alegi, P. (2008). “‘A Nation to Be Reckoned with’: The Politics of FWC Stadium Construction in Cape Town and Durban, South Africa.” African Studies, 67 (3): 397-422.
▪ Andereck, K. L., and G. P. Nyaupane. (2011). “Exploring the Nature of Tourism and Quality of Life Perceptions among Residents.” Journal of Travel Research, 50 (3): 248-60.
▪ Andereck, K. L., K. M. Valentine, R. C. Knopf, and C. A. Vogt. (2005). “Residents” Perceptions of Community Tourism Impacts.” Annals of Tourism Research, 32 (4): 1056-76.
▪ Andereck, K. L., K. Valentine, C. Vogt, and R. Knopf. (2007). “A Cross-cultural Analysis of Tourism and Quality of Life Perceptions.” Journal of Sustainable Tourism, 15 (5): 483-500.
▪ Aydoğuş, O., Değer, Ç., ÇALIŞKAN, E. T., & GUNAL, G. G. (2015). Regional Input-Output Analysis of A Mega-Event: Possible Impact of EXPO on Izmir Economy. Anadolu Üniversitesi Sosyal Bilimler Dergisi, 15(2), 75-83.
▪ Blake, A. (2005). Economic impact of the London 2012 Olympics.
▪ Boardman, Greening. Vining, Weimer (2001), Cost-Benefit Analysis: Concepts and Practice, Prentice-Hall, New Jersey.
▪ Bob, U., and K. Swart. (2009). “Resident Perceptions of the 2010 FIFA Soccer FWC Stadia Development in Cape Town.” Urban Forum, 20 (1): 47-59.
▪ Bohlmann, H. R., & Van Heerden, J. H. (2008). Predicting the economic impact of the 2010 FIFA FWC on South Africa. International Journal of sport management and marketing, 3(4), 383-396.
▪ Boyle, R. and Haynes, R. (2017) The Global Event? The Media, Football and the FIFA FWC. In: L. Wenner and A. Billings (Eds) Sport, Media and Mega-Events. New York: Routledge.
▪ Bull, C., and J. Lovell. (2007). “The Impact of Hosting Major Sporting Events on Local Residents: An Analysis of the Views and Perceptions of Canterbury Residents in Relation to the Tour de France 2007.” Journal of Sport & Tourism, 12 (3–4): 229-48.

THE INTERNATIONAL MATCH CALENDAR REFORM: A SOCIO-ECONOMIC IMPACT ANALYSIS – TECHNICAL ANNEX 43
▪ Burgan, B., & Mules, T. (1992). Economic impact of sporting events. Annals of Tourism Research, 19(4), 700–710.
▪ Chalkley, B., & Essex, S. (1999). Urban development through hosting international events: a history of the Olympic Games. Planning perspectives, 14(4), 369-394. - link
▪ Chalip, L. (2002). “Using the Olympics to Optimise Tourism Benefits: University Lecture on the Olympics” [online article]. Barcelona: Centres d’ Estudis Olimpics (UAB), International Chair in Olympism (IOC-UAB). http://olympicstudies.uab.es/ lectures/web/pdf/chalip.pdf.
▪ Chalip, L. (2006). “Towards Social Leverage of Sport Events.” Journal of Sport & Tourism, 11 (2): 109-27.
▪ Chhabra, D., and D. Gursoy. (2009). “Life Dynamism Explorations on Perceived Quality of Life and Social Exchange Paradigms in Casino Settings.” Leisure Sciences, 31 (2): 136-57.
▪ Chien, P. M., B. Ritchie, R. Shipway, and H. Henderson. (2011). “I Am Having a Dilemma: Factors Affecting Resident Support of Event Development in the Community.” Journal of Travel Research, 51 (4): 451-63.
▪ Collins, A., J. Calvin, and M. Munday. (2009). “Assessing the Environmental Impacts of Mega Sporting Events: Two Options?” Tourism Management, 30 (6): 828-37.
▪ Cornelissen, S., and C. Swart. (2006). “The 2010 Football FWC as a Political Construct: The Challenge of Making Good on an African Promise.” Sociological Review, 54: 108-23.
▪ Crompton, J., Lee, S. K., & Shuster, T. (2001). A guide for undertaking economic impact studies: The springfest example. Journal of Travel Research, 40(1), 79–87.
▪ Cummins, R., R. Eckersley, J. Pallant, J. V. Vugt, and R. Misajon. (2003). “Developing a National Index of Subjective Wellbeing: The Australian Unity Wellbeing Index.” Social Indicators Research, 64: 159-90.
▪ Daniels, M. J., & Norman, W. C. (2003). Estimating the economic impacts of seven regular sport tourism events. Journal of sport tourism, 8(4), 214-222.
▪ Deccio, C., and S. Baloglu. (2002). “Non-host Community Resident Reactions to the 2002 Winter Games: The Spillover Impacts.” Journal of Travel Research, 41 (1): 46-56.
▪ Deloitte (2009), Annual Review of Football Finance, June
▪ Deloitte. (2021), Sport industry outlook 2021 - link
▪ Diener, E. (2000). “Subjective Well-Being: The Science of Happiness and a Proposal for a National Index.” American Psychologist, 55: 34-43.
▪ Domingues, E. P., Betarelli Junior, A. A., & Magalhães, A. S. (2011). Predicting the economic impact of the 2014 FIFA FWC in Brazil. Estudos Econômicos (São Paulo), 41, 409-439.

THE INTERNATIONAL MATCH CALENDAR REFORM: A SOCIO-ECONOMIC IMPACT ANALYSIS – TECHNICAL ANNEX 44
▪ Dora Dore, G.M. (2014) Democracy and the FWC, The American Interest, (Democracy and the FWC - The American Interest (the-american-interest.com)
▪ Emerson, R. M. (1976). “Social Exchange Theory.” Annual Review of Sociology, 2: 335-62.
▪ FIFA (2021), FIFA Benchmarking Report: Women’s Football – link
▪ FIFA (2021), FIFA Climate Strategy builds on long-standing commitment to sustainability – link
▪ FIFpro (2021), Lifting up women's professional football - link
▪ FIGC (2021), Report on women’s and girls’ football – link
▪ Fourie, J. & Santana-Gallego M. “The Impact of Mega-Sport Events on Tourist Arrivals.” Tourism Management, vol. 32, no. 6, 19 Jan. 2011, pp. 1364–1370., doi: 10.1016/j.tourman.2011.01.011.
▪ Frawley, S. and Adair, D. (2014), Managing the Football FWC, Managing the Olympics. Basingstoke).
▪ Fredline, E. (2005). “Host and Guest Relations and Sport Tourism.” Sport in Society, 8 (2): 263-79. Fredline, L., L. Jago, and M. Deery. (2003). “The Development of a Generic Scale to Measure the Social Impacts of Events.” Event Management, 8: 23-37.
▪ Furrer, P. (2002). Sustainable Olympic Games. Bollettino della Società Geografica Italiana, (4).
▪ Gerrard B., Dobson S. (2000), Testing for monopoly rents in the market for playing talent. Evidence from English professional football, in Journal of Economic Studies, vol. 27, n. 3.
▪ Gratton, C., and H. Preuss. (2008). “Maximizing Olympic Impacts by Building up Legacies.” International Journal of the History of Sport, 25: 1922-38.
▪ Gursoy, D., C. Chi, J. Ai, and B. Chen. (2011). “Temporal Change in Resident Perceptions of a Mega-Event: The Beijing Olympic Games.” Tourism Geographies, 13: 2999-324.
▪ Gursoy, D., and K. W. Kendall. (2006). “Hosting Mega Events: Modeling Locals’ Support.” Annals of Tourism Research, 33 (3): 603-23.
▪ Gursoy, D., and D. G. Rutherford. (2004). “Host Attitudes toward Tourism: An Improved Structural Model.” Annals of Tourism Research, 31 (3): 495-516.
▪ Hagerty, M. R., R. A. Cummins, A. L. Ferriss, K. Land, A. C. Michalos, M. Peterson, A. Sharpe, J. Sirgy, and J. Vogel. (2001). “Quality of Life Indexes for National Policy: Review and Agenda for Research.” Social Indicators Research, 55 (1): 1-96.
THE INTERNATIONAL MATCH CALENDAR REFORM: A SOCIO-ECONOMIC IMPACT ANALYSIS – TECHNICAL ANNEX 45
▪ Hiller, H. H. (2000). “Mega-Events, Urban Boosterism and Growth Strategies: An Analysis of the Objectives and Legitimations of the Cape Town 2004 Olympic Bid.” International Journal of Urban and Regional Research, 24 (2): 449-58.
▪ Hiller, Harry H., and Richard A. Wanner. (2011). “Public Opinion in Host Olympic Cities: The Case of the 2010 Vancouver Winter Games.” Sociology, 45 (5): 883-99.
▪ Horne, J. (2012). The four ‘Cs’ of sports mega-events: capitalism, connections, citizenship and contradictions. In Hayes, G. & Karamichas, J. (Eds), Olympic games, mega-events and civil societies: globalization, environment, resistance.
▪ Hritz, N., and C. Ross. (2010). “The Perceived Impacts of Sport Tourism: An Urban Host Community Perspective.” Journal of Sport Management, 24: 119-38.
▪ International Olympic committee (2012), Sustainability through sport – link
▪ Jin, L., J. Zhang, X. Ma, and D. Connaughton. (2011). “Residents’ Perceptions of Environmental Impacts of the 2008 Beijing Green Olympic Games.” European Sport Management Quarterly, 11 (3): 275-300.
▪ Jones, C. (2001). “Mega-Events and Host-Region Impacts: Determining the True Worth of the 1999 Rugby FWC.” International Journal of Tourism Research, 3 (3): 241-51.
▪ Journal of Travel Research 52(5) Olympic Studies Centre. (2003). “The Legacy of the Olympic Games: 1984-2000: Conclusions and Recommendations.” International Olympic Committee.
▪ Kaplanidou, K. (2011). “Olympic Research Corner: A Question of Legacy.” Olympic Review, 79: 64-67.
▪ Kaplanidou, K. (2012). “The Importance of Legacy Outcomes for Olympic Games Four Summer Host Cities Residents’ Quality of Life: 1996-2008.” European Sport Management Quarterly, 12 (4): 397-433.
▪ Kaplanidou, K., and K. Karadakis. (2010). “Understanding the Legacies of a Host Olympic City: The Case of the 2010 Vancouver Olympic Games.” Sport Marketing Quarterly, 19: 110-17.
▪ Karadakis, K., and K. Kaplanidou. (2012). “Legacy Perceptions among Host and Non-host Olympic Games Residents: A Longitudinal Study of the 2010 Vancouver Olympic Games.” European Sport Management Quarterly, 12 (3): 243-64.
▪ Kaplanidou, K. , Karadakis K. , Gibson H. , Thapa B., Walker M. , Geldenhuys S. , and Coetzee W. (2013),Quality of Life, Event Impacts, and MegaEvent Support among South African Residents before and after the 2010 FIFA FWC Journal of Travel Research, pp.631-645
▪ Kasimati, Evangelia. (2003). “Economic Aspects and the Summer Olympics: A Review of Related Research.” International Journal of Tourism Research, 5: 433-44.

THE INTERNATIONAL MATCH CALENDAR REFORM: A SOCIO-ECONOMIC IMPACT ANALYSIS – TECHNICAL ANNEX 46
▪ Kim, H. J., D. Gursoy, and S.-B. Lee. (2006). “The Impact of the 2002 FWC on South Korea: Comparisons of Pre- and Post-Games.” Tourism Management, 27: 86-96.
▪ Kim, S. S., and A. M. Morrison. (2005). “Change of Images of South Korea among Foreign Tourists after the 2002 FIFA FWC.” Tourism Management, 26 (2): 233-47.
▪ Kim, S. S., and J. F. Petrick. (2005). “Residents’ Perceptions on Impacts of the FIFA 2002 FWC: The Case of Seoul as a Host City.” Tourism Management, 26 (1): 25-38.
▪ Lance, C. E., M. M. Butts, and L. C. Michels. (2006). “The Sources of Four Commonly Reported Cutoff Criteria: What Did They Really Say?” Organizational Research Methods, 9: 202-21.
▪ Landis, R., B. Edwards, and J. Cortina. (2009). “On the Practice of Allowing Correlated Residuals among Indicators in Structural Equation Models.” In Statistical and Methodological Myths and Urban Legends: Doctrine, Verity and Fable in the Organizational and Social Sciences, edited by C. Lance and R. Vandenberg. New York: Routledge.
▪ Lee, C. K., Moon, S., & Mjelde, J. W. (2010). Disentangling the effects on the Korean economy of the 9/11 terrorist attacks from the short-run effects of hosting the 2002 FWC, using the CGE model. Tourism Economics, 16(3), 611-628.
▪ Lee, C.-K., Y.-K. Lee, and B. Lee. (2005). “Korea’s Destination Image Formed by the 2002 FWC.” Annals of Tourism Research, 32 (4): 839-58.
▪ Lee, C.-K., Y.-K. Lee, and Taylor, T. (2005). Critical reflections on the economic impact assessment of a mega-event: the case of 2002 FIFA FWC, Tourism Management, Volume 26, Issue 4, August 2005, Pages 595-603
▪ Leopkey, B. (2009). “2008 IOC Post graduate Grant Final Report: The Historical Evolution of Olympic Legacy.” University of Ottawa. http://doc.rero.ch/record/12537 on June 2, 2012, International Olympic Committee.
▪ Lisi, C. A. (2007). A history of the FWC: 1930–2006. Lanham, MD: Scarecrow Press. p. 61. ISBN 978-0-8108-5905-0.
▪ Lopresti, S. (28 February 2014). "Italy FWC Rewind: Infamy at the Battle of Santiago, 1962". Bleacher Report. Retrieved 15 June 2014.
▪ Lucifora, C. and Simmons, R. (2003) Superstar effects in sport: evidence from Italian soccer, Journal of Sports Economics, 4, 35–55.
▪ Mabugu, R. E., & Mohamed, A. (2008). The economic impacts of government financing of the 2010 FIFA FWC. University of Stellenbosch, Bureau for Economic Research.
▪ Massiani, J. (2018). Assessing the economic impact of mega events using Computable General Equilibrium models: Promises and compromises. Economic Modelling, 75, 1-9.
▪ Matheson V. (2018) The Economics of the FWC, College of the Holy Cross

THE INTERNATIONAL MATCH CALENDAR REFORM: A SOCIO-ECONOMIC IMPACT ANALYSIS – TECHNICAL ANNEX 47
▪ Matsuoka De Aragao, M. (2015) Economic Impacts of the FIFA FWC in Developing Countries Western Michigan University
▪ McCartney, G., S. Thomas, H. Thomson, J. Scott, V. Hamilton, P. Hanlon, and L. Bond. (2010). “The Health and Socioeconomic Impacts of Major Multi-sport Events: Systematic Review (1978-2008).” British Medical Journal, 340: c2369.
▪ McGehee, N., and K. L. Andereck. (2004). “Factors Predicting Rural Residents’ Support of Tourism.” Journal of Travel Research, 43: 131-40.
▪ McKinsey & Company (2021), Sporting goods 2021: The next normal for an industry in flux - link
▪ Menezes, M. G. (2010). Considerations on the Economic Impact of the 2010 FIFA FWC on South Africa (Doctoral dissertation, Rhodes University).
▪ Meurer R. and Nunes Lins H. (2018) The effects of the 2014 FWC and the 2016 Olympic Games on Brazilian international travel receipts, Tourism Economics 2018, Vol. 24(4) 486–491
▪ Meyer, L. (2011). “An Exploratory Investigation of Perceived Tourism Impacts on Resident Quality of Life and Support for Tourism in Cologne, Germany.” Unpublished doctoral dissertation, University of Florida.
▪ Muller, M. (2015) What makes an event a mega-event? Definitions and sizes. Leisure Studies, 34(6), 627-642
▪ Murphy, N. M., and A. Bauman. (2007). “Mass Sporting and Physical Activity Events—Are They ‘Bread and Circuses’ or Public Health Interventions to Increase population levels of physical activity?” Journal of Physical Activity and Health, 4: 193-202.
▪ Nawijn, Jeroen, and Mitas Ondrej. (2012). “Resident Attitudes to Tourism and Their Effect on Subjective Well-Being: The Case of Palma De Mallorca.” Journal of Travel Research, 51: 531-41.
▪ Newzoo (2021), Global Esports and Live Streaming Market Report 2021 - link
▪ Nichols, M., D. Giacopassi, and G. Stitt. (2002). “Casinos Gambling as a Catalyst of Economic Development: Perceptions of Residents in New Casino Jurisdictions.” Tourism Economics, 8: 59-75. Downloaded from jtr.sagepub.com at UNIV OF FLORIDA Smathers Libraries on December 2, 2013, 644
▪ Owen, J. G. (2005). “Estimating the Cost and Benefit of Hosting Olympic Games: What Can Beijing Expect from Its 2008 Games?” The Industrial Geographer, 3 (1): 1-18.
▪ Portela, A., Pereira, G. (2018) “Overcoming Inequalities in a Fractured World: Between Elite Power and Social Mobilization”, United Nation Institute for Social Research.

THE INTERNATIONAL MATCH CALENDAR REFORM: A SOCIO-ECONOMIC IMPACT ANALYSIS – TECHNICAL ANNEX 48
▪ Preuss, H. (2000) Economics of the Olympic Games: Hosting the Games 1972-2000. Petersham: Walla Walla Press.
▪ Preuss, H. (2004) The economics of staging theOlympics: a comparison of theGames, 1972–2008. Cheltenham: Edward Elgar Publishing Ltd.
▪ Preuss, H. (2007). “FIFA FWC 2006 and Its Legacy on Tourism.” In Trends and Issues in Global Tourism, edited by R. Conrady and M. Buck. Berlin: Springer, pp. 83-102.
▪ Preuss, H., and H. Solberg. (2006). “Attracting Major Sporting Events: The Role of Local Residents.” European Sport Management Quarterly, 6 (4): 391-41.
▪ Ritchie, B., & Adair, D. (2002). The growing recognition of sport tourism. Current Issues in Tourism,5(1), 1–6.
▪ Roche, M. (1992). Mega-Events and Micro-Modernization: On the Sociology of the New Urban Tourism. The British Journal of Sociology. - link
▪ Rogerson, C. M. (2009). “Mega Events and Small Enterprise Development: The 2010 FIFA FWC Opportunities and Challenges.” Development Southern Africa, 26 (3): 335-52.
▪ Scandizzo P.L. and Pierleoni R. (2017), Assessing the Olympic Games: The Economic Impact and Beyond, Journal of Economic Surveys, Volume 32, Issue 3 p. 649-682
▪ Scandizzo, P. L. (1997), L'economia del Calcio come Sport spettacolo, e il mercato internazionale delle Star. Università di Roma “Tor Vergata”, Fondazione Artemio Franchi.
▪ Schalock, R. L., I. Brown, R. Brown, R. Cummins, D. Felce, L. Matikka, K. Keith, and T. Parmenter. (2002). “Conceptualization, Measurement, and Application of Quality of Life for Persons with Intellectual Disabilities: Report of an International Panel of Experts.” Mental Retardation, 40: 457-70.
▪ Solberg, H. A., and H. Preuss. (2007). “Major Sport Events and Long-Term Tourism Impacts.” Journal of Sport Management, 21 (2): 213-34. Statistics South Africa. (2012). General Household Survey. http:// www.statssa.gov.za/publications/P0318/P0318April2012.pdf.
▪ Swart, K., and U. Bob. (2007). “The Eluding Link: Toward Developing a National Sport Tourism Strategy in South Africa beyond 2010.” Politikon, 34: 373-91.
▪ Tabachnick, Barbara G., and Linda S. Fidell. (2007). Using Multivariate Statistics. 5th edition. Boston, MA: Pearson Education.
▪ The Business Research Company (2021), Sports Global Market Report 2021: COVID-19 Impact and Recovery to 2030 – link
▪ The Nielsen Company (2019), Rethinking sports experiences for generation z – link
▪ The Nielsen Company (2020), 2020 commercial trends - link

THE INTERNATIONAL MATCH CALENDAR REFORM: A SOCIO-ECONOMIC IMPACT ANALYSIS – TECHNICAL ANNEX 49
▪ Theron, M. (2008). “The Unification Goal in South Africa and Africa: The Ideological Challenge in Hosting the 2010 FWC.” World Journal of Managing Events, 2 (1): 56-63.
▪ Timmer, M. P., Dietzenbacher, E., Los, B., Stehrer, R. and de Vries, G. J. (2015), "An Illustrated User Guide to the World Input–Output Database: The Case of Global Automotive Production", Review of International Economics.
▪ Toohey, K., and A. J. Veal. (2007). The Olympic Games: A Social Science Perspective. Cambridge, MA: CABI.
▪ Tosun, C. (2002). “Host Perceptions of Impacts: A Comparative Tourism Study.” Annals of Tourism Research, 29 (1): 231-45.
▪ Tucker, L. (2006) How does Hosting the Olympic Games Impact Employment in the Host City? Retrieved from http://www.thefreefood.net/wpCcontent/uploads/2006/02/leetucker_comps.pdf
▪ Tyrrell, T., & Johnston, R. (2001). A framework for assessing direct economic impacts of tourist events: Distinguishing origins, destinations, and causes of expenditures. Journal of TravelResearch,40(1), 94–100.
▪ Torgler, B. and Schmidt, S. L. (2007) What shapes player performance in soccer? Empirical findings from a panel analysis, Applied Economics, 39, 2355–69.
▪ Twynam, D. G., and M. Johnston. (2004). “Changes in Host Community Reactions to a Special Sporting Event.” Current Issues in Tourism, 7 (3): 242-61.
▪ Van Wyk, J. (2008). “The 2010 FIFA FWC in South Africa: The Politics of Hosting a Mega International Event.” World Journal of Managing Events, 2 (1): 1-9.
▪ Vargas-Sanchez, A., N. Porras-Bueno, and M. Plaza-Mejıa. (2011). “Explaining Residents’ Attitudes towards Tourism: Is a Universal Model Possible?” Annals of Tourism Research, 38 (2): 460-80.
▪ Viana, J. (2018) “Does the FWC Get the Economic Ball Rolling? Evidence from a Synthetic Control Approach.” SSRN Electronic Journal, doi:10.2139/ssrn.3160934.
▪ Vierhaus C. (2018) The international tourism effect of hosting the Olympic Games and the FIFA FWC
▪ Walker, M., K. Kaplanidou, H. Gibson, B. Thapa, S. Geldenhuys, and W. Coetzee. (2012). “Win in Africa, With Africa”: Social Responsibility, Event Image, and Destination Benefits. The Case of the 2010 FIFA FWC in South Africa.” Tourism Management, 34 (2013): 80-90.
▪ Waitt, G. (2003). “Social Impacts of the Sydney Olympics.” Annals of Tourism Research, 30 (1): 194-215.
▪ Ward, Colleen, and Tracy Berno. (2011). “Beyond Social Exchange Theory: Attitudes toward Tourists.” Annals of Tourism Research 38 (4): 1556-69.

THE INTERNATIONAL MATCH CALENDAR REFORM: A SOCIO-ECONOMIC IMPACT ANALYSIS – TECHNICAL ANNEX 50
▪ Weed, M. (2008). Olympic Tourism. Burlington, MA: Elsevier.
▪ Weed, M. (2010). “How Will We Know If the London 2012 Olympics and Paralympics Benefit Health?” British Medical Journal, 340: c2202.
▪ Whannel, G. (2001). Media Sport Stars: Masculinities and Moralities (1st ed.). Routledge. – link
▪ Whitson, D., and J. Horne. (2006). “Underestimated Costs and Overestimated Benefits? Comparing the Outcomes of Sports Mega-Events in Canada and Japan.” Sociological Review, 54 (2): 71-89.
▪ World Health Organization. (2019). Global action plan on physical activity 2018-2030: more active people for a healthier world. World Health Organization.
▪ Yoon, Y., D. Gursoy, and S. J. Chen. (2001). “Validating a Tourism Development Theory with Structural Equation Modeling.” Tourism Management, 22 (4): 363-72.
▪ Zhang, J., Pease, D., Lam, E., Bellerive, L., Pham, U., Williamson, D.,Lee, J., & Wall, K. (2001). Socio-motivational factors affecting spectator attendance at minor league hockey games. SportMarketing Quarterly,10(1)
▪ Zhou, Yong, and John Ap. (2009). “Residents’ Perceptions towards the Impacts of the Beijing 2008 Olympic Games.” Journal of Travel Research, 48 (1): 78-91.
▪ Zimbalist, A. (2015). “Circus Maximus: The Economic Gamble Behind Hosting the Olympics and the FWC

THE INTERNATIONAL MATCH CALENDAR REFORM: A SOCIO-ECONOMIC IMPACT ANALYSIS – TECHNICAL ANNEX 51
BIBLIOGRAPHY ON PLAYER PRICE AS PRODUCTION ASSETS
▪ Acero, R. Serrano, P. Dimitropoulos, (2017), Ownership Structure and Financial Performance in European football, Corporate Governance: The International Journal of Business in Society, 17 (3), pp. 511-523
▪ Antonioni P., Cubbin J., (2000), The Bosman ruling and the emergence of a single market in soccer talent, European Journal of Law and Economics, vol. 9, n. 2.
▪ Barajas, C. Fernández-Jardón, L. Crolley, (2005), Does sports performance influence revenues and economic results in Spanish football? MPRA Paper 3234 University Library of Munich, Germany (2005)
▪ Baum, M.E. Schaffer, S. Stillman, V. Wiggins, (2006), Overid: Stata module to calculate tests of overidentifying restrictions Stata
▪ Benjamin R. Auer & Tobias Hiller, (2015), On the evaluation of soccer players: a comparison of a new game-theoretical approach to classic performance measures, Applied Economics Letters
▪ Birkhäuser, C. Kaserer, D. Urban, (2019), Did UEFA’s financial fair play harm competition in European football leagues? Review of Managerial Science, 13 (1) (2019), pp. 113-145
▪ Buchholz, K. Lopatta, (2017), Stakeholder salience of economic investors on professional football clubs in Europe, European Sport Management Quarterly, 17 (4) (2017), pp. 506-530, 10.1080/16184742.2017.1306870
▪ Dimitropoulos, (2009), Profitability of the greek football clubs: implications for financial decisions making, Business Intelligence Journal, 2 (1) (2009), pp. 159-169
▪ Dimitropoulos, S. Leventis, E. Dedoulis, (2016), Managing the European football industry: UEFA’s regulatory intervention and the impact on accounting quality, European Sport Management Quarterly, pp. 459-486
▪ Einolf, K.W. (2004), Is winning everything? A data envelopment analysis of Major League Baseball and the National Football League. Journal of Sports Economics, 5 (2) (2004), pp. 127-151
▪ Feess E., Muehlheusser G., (2003), The impact of transfer fees on professional sports: an analysis of the new transfer system for European Football. Scandinavian Journal of Economics, vol. 105, n. 1.
▪ Feess, F. Stähler, (2009), Revenue sharing in professional sports leagues, Scottish Journal of Political Economy, 56 (2) (2009), pp. 255-265
▪ Ferri, R. Macchioni, M. Maffei, A. Zampella, (2017), Financial Versus Sports Performance: The Missing Link, International Journal of Business and Management, 12 (3) (2017), pp. 36-48

THE INTERNATIONAL MATCH CALENDAR REFORM: A SOCIO-ECONOMIC IMPACT ANALYSIS – TECHNICAL ANNEX 52
▪ Forrest and Simmons, (2002), Team salaries and playing success in sports: a comparative perspective. portökonomie. ZfB Ergänzungshefte, vol 4, Wiesbaden, Gabler. Verlag (2002)
▪ Fort, (2000), European and North American sports differences. Scottish journal of political economy, 47, pp. 431-455
▪ Galariotis, C. Germain, C. Zopounidis, (2018), A combined methodology for the concurrent evaluation of the business, financial and sports performance of football clubs: the case of France Annals of Operations Research, 266 (1-2) (2018), pp. 589-612
▪ Garcia-del-Barrio, S. Szymanski, (2009), Goal! Profit maximization versus win maximization in soccer, Review of Industrial Organization, 34 (1) (2009), pp. 45-68
▪ Gerrard, S. Dobson, (2000), Testing for monopoly rents in the market for playing talent. Evidence from English professional football. Journal of Economic Studies, 27 (3) (2000), pp. 142-164
▪ Gerrard, (2005), A resource-utilization model of organizational efficiency in professional sports teams. Journal of Sport Management, 19 (2005), pp. 143-169
▪ Hall, S. Szymanski, A.S. Zimbalist, (2002), Testing causality between team performance and payroll: the cases of Major League Baseball and English soccer. Journal of Sports Economics, 3 (2) (2002), pp. 149-168
▪ Hamilton, K. and Liu G., (2013), Human Capital, Tangible Wealth, and the Intangible Capital Residual, The World Bank
▪ Lucifora, C. and Simmons, R., (2003), Superstar effects in sport: evidence from Italian soccer, Journal of Sports Economics, 4, 35–55.
▪ Mareque, A. Barajas, F. Lopez-Corrales, (2018), The Impact of Union of European Football Associations (UEFA) Financial Fair Play Regulation on Audit Fees: Evidence from Spanish Football. International Journal of Financial Studies, 6 (4) (2018), p. 92
▪ Morrow, (2003), The people’s game? football, finance and society. Springer, Berlin (2003)
▪ Rohde, C. Breuer, (2017), The market for football club investors: a review of theory and empirical evidence from professional European football, European Sport Management Quarterly, 17 (3) (2017), pp. 265-289
▪ Sanchez, Á Barajas, P. Sánchez-Fernández, (2017), Does the Agency Theory play football? Universia Business Review, 53 (2017), pp. 18-59
▪ Sanchez, P. Sanchez-Fernandez, A. Barajas, (2016), Estructuras de propiedad y rentabilidad financiera en el fútbol europeo, Journal of Sports Economics & Management, 6 (1) (2016), pp. 5-17
▪ Sports scores, financial and administrative variables on the financial performance of football clubs Cultura ciencia y deporte, 11 (33) (2016), pp. 185-195.

THE INTERNATIONAL MATCH CALENDAR REFORM: A SOCIO-ECONOMIC IMPACT ANALYSIS – TECHNICAL ANNEX 53
Copyright © 2021 OpenEconomics.