Association of Divorce with Socio-Demographic Covariates in China, 1955-1985
Upload
khangminh22Category
view
2download
0
DEMOGRAPHIC AND SOCIO-ECONOMIC CORRELATES OF URBAN DYNAMICS-
A CASE STUDY OF BANGLADESH
R E J U A N H O S S A I N B H U I Y A N
THESIS SUBMITTED FOR THE DEGREE OF
Mottox of ^Ijilo^opljp IN
G E O G R A P H Y
1991
DEPARTMENT OF GEOGRAPHY ALIGARH MUSLIM UNIVERSITY
ALIGARH (INDIA)

T4423

ACKNOWLEDGEMENT
This work could not have mater ia l ized in this form had there been no guidance from Professor Abdul Aziz, Department of Geography, Al igarh Muslim Univers i t y , A l i garh . His encoura-gement, and insight into the subject were a lways a constant source of inspirat ion. I am h igh ly indebted to him.
I also f ee l h igh ly indebtedness to Professor Shafi, f o r his useful suggestion. I also thankful to Professor Farooq Siddiqi, Chairman, Department of Geography fo r h is constant support in a l l respects and the help rendered, wherever the need arose.
I am also thankful to Professor Mehdi Raza and all faculty members for providing me adequate guidance and support from time to time.
I would l ike to record my sincere thanks to Dr. Fakhruddin, Lecturer of this Department and Dr. Mohammad Firoz Khan, Reader, Jamia Milia Islamia, Delhi for their valuable suggestions. ^
My research colleagues of the Department of , Geography deserve a spec ia l mention for prov id ing the moral support in completing this work. The occasional discussions that I used to have with them benefitted me a l o t . My special thank to f e l l ow researchers Mrs. Shipra Banarjee, Mr. Zurgham Uddin Khairoowala, Mr. Mohammad Tahir, Ms. Rashida Khatoon, Mr. Mahmud Al l Khan, Mr. Shamim and Mr. Sarwar Alam.
I am also grateful to Mr. Sira j Uddin Ahmed, research scholar in Business Administration Department, Mr. Abul Hossain research scholar in Phys i cs Department and other Bangladeshi who help me in research work .
Bes ides the Al igarh Muslim Univers i t y , thanks are also due to Professor Moniruzzaman Miah, ViceChancel lor and Professor Emazuddin, former Pro-Vice-Chance l lor , Dhaka Univers i ty , for encouragement throughout my work.
I am thankful to Professor Nazrul Islam, Director, CUS Associate Pro fessor Dr. (Mrs . ) Rosie M. Ahsan,' Associate P ro f essor Abdul Baqee, and Associate Pro fessor Dr. Zia-us-Shams Haq, Department of Geography, Univers i ty of Dhaka, Bangladesh from whom I rece ived many valuable suggestions.
I am spec ia l l y grateful to Dr. Humayun Kabir Ex-Di rec tor . Mrs. Khadiza Khatun, Director , Dr. Ashraf Uddin Ahmed Associate Professor , Mr. P.K. Matiur Rehman Associate Professor , Mr. Khan A. Matin Associate Pro fessor , and Mr. Mohammed Shayieb
Assistant Pro fessor , Institute of Stat ist ical Research and Training, Univers i ty of Dhaka for the i r he lp and encouragement.
I also o f f e r my thanks to Mr. Kazi Shafiuddin Ahmed Secretary and Mr. M. Masudur Rahman, ISRT, Dhaka Univers i ty for the i r help in d i f f e r en t phases of work .
My spec ia l thanks to Dr . Kamal Islam of UNICEF, Dr . Asma Khanum of ICDDR, B, Dr. Ashraful Haq and Dr. Mohammad Musa of CARE for the i r encouragement throughout my study. Within the Bangladeshi f r i ends , I am most obl iged to my f r i ends in Bangladesh, Dr . Kausar Mustafa, Lecturer, Ph i losophy , Dhaka Univers i ty , Mr. Kh. Mukaddem Hossain, Lecturer, Socio logy, Dhaka Un ivers i t y , Mr. Asadur Rahman, UNICEF, Dhaka, Mr. Atiqur Rahman, Lecturer, Social Wel fare, Dhaka Univers i ty f o r providing help in pr imary and secondary data co l lect ion.
Both India and Bangladesh governments are duly acknowledged for f inancial support in India which made th is study poss ib l e .
I am deep ly grateful to ray departed mother who passed away waiting my return from my studies in India.
I am grateful to my brothers Mr. Sakhwat Hossain and Mr. Hedayet Hossain for the ir help and encouragement.
I am indebted to Refaya and Lovely, who bore my absence.
I also o f f e r my thanks to Mr. Najmuddin and Mrs. Rana Askari, L ibrar ian, Seminar L i b ra r y , Geography Department, A .M .U . , A l igarh giv ing optimum f a c i l i t i e s .
F ina l ly , I thank Mr. H.S. Sharma for helping me in typing the thes is .
REJUAN HOSSAIN BHUIYAN

CONTENTS Page;
Acknowledgements i
L ist of Tables v i i
L ist of Figures x
List of Photographs x i i i
CHAPTER-I: INTRODUCTION 1
1.1 OPERATIONAL DEFINITION AND CONCEPTS 1
1 .1 .1 Demographic and Socio-Econonic Correlates
1 .1 .2 Urban Dynamics
1.2 BACKGROUND STUDIES 3
1.3 SfOPE AND OBJECTIVES OF THE STUDY 8
1.4 STUDY AREA 11
1 .4 .1 Location and Extent
1.4.2 Area and Population
1 .4 .3 Physical Setting
1 .4 .4 Climate and Soils
1.5 METHODOLOGY (METHODS AND MATERIALS) 15
1.5.1 Data Base
1 .5 .2 Sampling Procedure
1 .5 .3 Selection of Urban Centers ar.d Variables
1.5.4 Technical and Analyt ical Procedures
1.5.5 Method of Principal Componer.t Analysis
1.6 ORGANIZATION 2 8
CHAPTER-II: EVOLUTION AND CLASSIFICATION OF URBAN 39
SETTLEMENTS IN BANGLADESH
2.1 GENESIS OF URBAN PLACES 40
2.1,1 Urban Centers in Ancient period
• 2.1.2 Urban Centers in Medieval period

IV
Pages
2.1.3 Urbanization in the Modern Period
2.2 FACTORS OF URBAN DYNAMICS 5 3
2.3 URBAN POPULATION DYNAMICS AND IT 'S 55 IMPLICATION
2.3.1 Growth Trends
2.4 GROWTH OF URBAN SETTLEMENTS IN DIFFERENT SIZE-CLASS (1901-1981)
2 .4 .1 Size and Distribution of Urban Centers
2.4.2 Size and Proportion of Population in Di f ferent Classes.
2.5 Spatial Interaction and Urban Population 82 Growth by Region
2 .5 .1 Urban Population Growth by Region
3.5.2 Densities of Urban Population
2.6 FLUCTUATIONS IN THE RANK OF URBAN CENTERS 102
2.7 MEAN SIZE OF URBAN CENTERS 109
CHAPTER-m: SPATIAL AND TEMPORAL DIMENSION OF URBAN 115
DYNAMICS
3.1 SPATIAL DISTRIBUTION OF SELECTED URBAN 115 CENTERS
3.2 SPATIO-TEMPORAL DIMENSION OF URBAN 118 POPULATION OF SELECTED URBAN CENTERS
3 .2 .1 Population Growth Characterist ics of the Selected Urban Centers
3.2.2 Spatio-Temporal Patterns of Population Density in the Selected Urban Cmters .
3.2.3 Age Composition
3.2.4 Sex Composition
3.2.5 Dependency Ratio
3.2.6 Literacy
3.3 Occupational Structure 145
3 .3 .1 Definition of Occupation
V
Pages
3.3.2 Employment and Town Size
3.3.3 Basic Occupational Classi f icat ion
3.3.4 Urban Occupational Structure
3.3.5 Changing Pattern of Urban Occupational Structure
3.3.6 Changing Features in Occupational Structure
3.4 FUNCTIONAL CLASSIFICATION OF URBAK CENTERS 8
3.4.1 Method Appl ied f o r Functional Classif ication fo r Urban Centers,
3.4.2 Functional Categories of Urban Centers
CHAPTER-IV: FACTORIAL ^ECOLOGY OF URBAN DYNAMICS 192
4.1 FACTORIAL ECOLOGY; CROSS SECTIONAL 194 ANALYSIS OF 40 URBAN CENTERS
4.2 ECOLOGY OF URBAN CENTERS OF BANGL.ADESH: 197 CROSS-SECTIONAL ANALYSIS OF DIFFERENT DIMENSIONS OF VARI.ABLES 1961
4.2.1 Factor- I : High Urbanization
4.2.2 Factor- I I : Te r r i t o r i a l Stress and Housing Condition
4.2.3 Fac tor - I l l : Demographic and Economic Attributes of Urbanization
4.2.4 Factor-1\": Urban Amenities
4.2.5 Strong Variables in Four Factors, 1961
4.3 ECOLOGY OF URBAN CENTERS: CROSS- 218 SECTIONAL ANALYSIS OF DIFFERENT DIMENSIONS OF VARIATION, 1974
4.3.1 Factor- I : High Economic Urbanization with High Urban Functions (Urban Amenities)
4.3.2 Factor- I I : Deurbanization
4.3.3 Fac tor - I l l : Demographic deurbanization
4.3.4 Factor-I\': High Te r r i t o r i a l Urbanization
4.3.5 Strong Variables in Four Factor, 1974
4.4 ECOLOGY CP URBAN CENTERS OF BANGLADESH: CROSS-SECTIONAL ANALYSIS OF DIFFERENT DIMENSIONS. 1981.
4 .4 .1 Factor- I : High Urbanization
238
ix
Pages
4.4.2 Factor - I I : Demographic and Economic Urbanization
4.4.3 Fac to r - I l l : Urban Functions
4.4.4 Strong Variables in Three Factors, 1981
4.5 URBAN DYNAMICS: 1961-1981 257
4 .5 .1 Factor- I : Demographic and Infrastructural Dynamics
4.5.2 Fac tor - I I : Urban Deterioration ^vith Demographic and Employment Dynamics
4.5.3 Fac to r - I l l : Deteriorating Urbanization with decl ine of primary sector
4.5.4 Factor- IV: Infrastructural Dynamics in loss urbanized towns.
4.6 FACTORIAL RELATIONSHIPS OF URBAN DYNAMICS 280
4.7 CHANGES IN URBAN STATUS 2 83
4 .7 .1 Grouping of High Urbanization, and Terr i tor ia l Stress and Housing Condition, 1961
4.7.2 High Urbanization, and Demographic and Econonic Status, 1981
4.7.3 Grouping of Demographic and infrastructural dynamics, 1961-1981
4.7.4 Comparative Analysis of 1961, 1981 and 1961-1981
CHAPTER-V: CONCLUSIONS 296
Appraidices 3 0 8
1.1 List of Variables 308 3.1 Calculation technique of median Age. 310 4.1 Correlation ne t r i x , 1961 312 4.2 Correlation metrix, 1974 313 4.3 Correlation matrix, 1981 314 5.1 Strong Variables of Urban Dynamics, 1961, 1974 315
and 1981 5.2 Magnitude cf Var iables (1961-1981) 317
Abbreviations 318
Bibliography 319

Vl l
Page;
LIST OF TABLES
1.1 List of Var iables 19
2.1 Intercensal growih rate of Urban and Rural Population, 5 6 1901-1981.
2.2 Number of towns in d i f ferent classes during 1901-81 6 9
2.3 Percentage distr ibution of urban centers, 1901-81 71
2.4 Nearest Neighbour Analysis (Region w i s e ) , 1951, 1961, 7 3 1974 and 1981.
2.5 Nearest Neighbour Analysis of Urban Centers in d i f f e rent 7 9 s ize classes, 1981
2.6 Proportion of Population l iv ing in various categories 80 of urban centers, 1901-1981
2.7 Bangladesh: Rank-Size Relationship, 1981 8 3
2.8 Urban Population Distribution by Region, 1951-81 91
2.9 Bangladesh: Grovith of Urban population 1951-61, 1961- 96 74, and 1974-81
2.10 Districts by Grov,th rate: 1951-1961, 1961-1974 and 1974- 97 1981
2.11 Urban population as percent of total population 1951, 9 9 1961, 1974 and 1981.
2.12 Density of Urban Population (D is t r i c tw ise ) 1981 104
2.13 Rank fluctuation of Urban centers of Bangladesh, 1901- 107 1981.
2.14 Mean Size of Lrban Centers in d i f f e r en t class orders 110 (1901-1981).
3.1 Urban Growth Character of the selected Urban Centers. 119
3.2 Dynamics o f 'Se l ec ted Urban Centers, 1981. 12 5
3.3 Spatio-Temporal \'ariation of Urban Population Density, 128 1951-81.
3.4 Class-V.ise and Average Population Density-1961, 1974 12 9 and 1981.

v i i i
Pages
3.5 Urban Centers of Di f ferent Population Sizes Grouped 131 According to Density, 1981
3.6 Urban Centers of D i f f e rent Density Group in 1961, 1974 13 3 and 1981
3.7 Mediam Age of Urban Population in selected 40 Urban 13 6 centers, 1961, 1974 and 1981
3 .8 Sex Composition of Selected 40 Urban Centers of 13 8 Bangladesh (Number of females per 1000 males ) .
3 .9 Dependency rat io and s i ze of urban centers 1961, 1974, 141 and 1981
3.10 Average L i te racy rate and s i z e of Urban Centers 1961, 143 1974, and 1981
3.11 Occupational Structure of 40 selected urban centers of 147 Bangladesh, 1961, 1974 and 1981 census years .
3.12 Urban centers on the Basis of Workers Engaged in 15 3 Pr imary Sector by Size Class, 1981.
*
3.13 Urban Centers on the Basis of workers Engaged in 15 4 Secondary Sector by s i ze -c lass , 1981.
3.14 Urban Centers on the Basis of Workers Engaged in 15 6 Te r t i a r y Sector by Size-Class, 1981.
3.15 Mean and Standard Deviation for Seva i Ac t i v i t i e s , 1961 170
3.16 Mean and Standard Deviation for Seven ac t i v i t i e s , 1981 171
3.17 Functional Classi f icat ion of Urban Centers (Ne lson 's 172 Method) , 1961
3.18 Functional Classi f icat ion of Urban Centers (Ne lson 's 17 3 Method) , 1981
4 .1 Ecological Structure of 40 Selected Urban Cai ters ; 1961, 195 1974 and 1981
4.2 Strong Var iab les , 1961 198
4.3 Standard Component Scores of Strong Var iab les , 1961 199
4.4 Strong Var iab les , 1974 219
4.5 Standard Component Scores of Strong Var iab les , 1974 2 20

ix
Pages
4.6 Strong Var iables, 1981 243
4.7 Standard Component Scores of Strong Var iab les , 1981 2 44
4.8 Correlation Matrix, 1961-1981: Urban Dynamics 2 59
4.9 Urban Dynamics Component Loadings, 1961-1981 2 61
4.10 Standard Component Scores of Urban Dyanmics, 1961 - 262 1981.
4.11 Demographic and Infrastructural Dynamics 1961-1981 263
4.12 Urban Deterioration (1961-1981) with Demographic and 271 Employment Variables
4.13 Deterioration Urbanization, 1961-1981 276
4.14 Infrastructural Progress, 1961-1981 279
4.15 Correlation Matrix, 1961-1981 2 82

X
Pages
LIST OF FIGURES
1.1 Location of Bangladesh 12
2.1 Ancient Cit ies 4 3
2.2 Administrat ive Div is ion, 1981 44
2.3 Growth of Population in Bangladesh (Urban and Rural) 5 8
2.4 Relation of Total and Urban Population Growth, 1901- 6 3 19S1
2.5 Distribution Pattern of Urban Centers, 1951 7 5
2.6 Distribution Pattern of Urban Centers, 1961 76
2.7 Distribution Pattern of Urban Centers, 1974 77
2.8 Distribution Pattern of Urban Centers, 1981 7 8
2.9 Rank-size relationship (based on major 13 urban 84 centers ) , 1981
2.10 Urban Interaction Dynamics, 1981 85
2.11 Regional Div is ion: Bangladesh 86
2.12 Distributional Pattern of Urban Population Size, 1951 87
2.13 Distributional Pattern of Urban Population Size , 1961 88
2.14 Distributional Pattern of Urban Population Size, 1974 89
2.15 Distributional Pattern of Urban Population Size, 1981 90
2.16 Growth of Urban Population, 1951-61 93
2.17 Growth of Urban Population 1961-74 94
2.18 Growth of Urban Population 1974-81 9 5
2.19 Percentage of Urban Population in Total Population 1951,100 1961, 1974 and 1981
2.20 Rank Fluctuation of Urban Centers, 1901-1981 103
2.21 Mean Size of Urban Centers in Dif ferent Class Order, 111 1901-81.

XI
Pages
3.1 Selected Urban Centers of Bangladesh, 1981 117
3.2 Urban Growth Status, 1951-1981 121
3.3 Status cf Urban Dynamics, 1981 12 2
3.4 Growth of Urban Centers 1951-1981 12 4
3.5 Occupational Structure of Urban Centers, 1961 15 0
3.6 Occupational Structure of Urban Centers, 1974 151
3.7 Occupational Structure of Urban Centers, 1981 15 2
3.8 Value Distribution of Occupational Structure: A Model 15 9
3.9 Agricultural Centers, 1961 17 6
3.10 Agricultural Centers, 1981 17 6
3.11 Centers of Household Industry, 1961 17 8
3.12 Centers of Household Industry, 1981 17 8
3.13 Manufacturing Centers, 1961 180
3.14 Manufacturing Centers, 1981 180
3.15 Centers of Construction, 1961 181
3.16 Centers of Construction, 1981 181
3.17 Trade and Commerce Centers, 1961 183
3.18 Trade end Commerce Centers, 1981 183
3.19 Transport, Storage and Communication, 1961 184
3.20 Transport, Storage and Communication Centers, 1981 184
3.21 Centers of Other Serv ices , 1961 186
3.22 Centers of Other Serv ices , 1981 186
4.1 High Uroanization (Component-I ) , 1951 204
4.2 Te r r i t o r i a l Stress and Housing Condition (Component- 208 I I ) , 19cl
4.3 Demographic and Economic Attr ibutes of Urbanization 213 (Component- I l l ) , 1961

xii
4.4 Urban Amenities (Component-IV), 1961
4.5 High Economic Urbanization with High Urban Amenit ies (Component-I ) , 1974
4.6 Deurbanization (Component-I I ) , 1974 2 31
4.7 Demographic Deurbanization (Component-I I I ) , 1974 333
4.8 Ter r i to r ia l Stress (Component-IV), 1974 3 36
4.9 High Urbanization (Component-I ) , 1981 2 47
4.10 Demographic and Economic Urbanization (Component- I I ) , 25 2 981
4.11 Urban Functions (Component- I l l ) , 1981 255
4.12 Demographic and Infrastructural Dynamics (Component-I ) , 257 1961-1981
4.13 Urban Deterioration with Demographic and Economic 2 74 Dynamics (Component-I I ) , 1961-81
4.14 Deteriorating Urbanization vvith Decline of Pr imary 27 8 Ac t i v i t y (Component- I l l ) , 1961-81
4.15 Infrastructural Dynamics in Less Urbanizated Towns 281 (Component-IV) , 1961-1981
4.16A Grouping of Urban Centers on Two Leading Components 284 ( F - I S F - I I ) , 1961
4.16B Grouping of Urban Centers Based on Scores on the Two 284 Components ( F - I S F - I I ) . 1961
4.17A Grouping of Urban Centers on Two Leading Components 285 I F - I 8 F - I I ) , 1981
4.17B Grouping of Urban Centers Based on Scores on the Two 2 85 Components ( F - I 6 F - I I } , 1981
4.18A Grouping of Urban Centers on Two Components ( F - I 5 292 r - I V ) , 1961-1981
4.18B Grouping of Urban Centers Based on Scores on Two 292 Components ( F - I 5 F - I V ) , 1961-1981.
X l l l
PHOTOGRAPHS Page
Top: A part ia l viev. of Dhaka C i t y : Commercial Area. 301
Bottom: A part ia l viev, of Dneka C i t y : Residential Area. 301

CfiAPTER - I
INTRODUCTION
Urban centers are dynamic organisms. Centrifugal and
centripetal fo rces are always working and leading to structural
channges. The push factors in rural and pull factors in urban
areas are simultinously interacting and shaping the evolution of
urban centers. P rac t i ca l l y , this evolution invo lves both the
modification of long-establ ished functions and the addition of new-
functions (Co lby , 1933). The rap id increase rate of urban
population and uneven growth of urban f a c i l i t i e s and amenities have
been playing an important ro le in urban dynamics. In the process
of evolution s imple v i l l ages turn into town, town deve lop into
c i t ies and c i t i e s into metropolitan centers, with a complex web
of functions. These transformations are occur in both spatial and
temporal sense and the d i f f e rent ia l urban growth is the norm.
A set of determinants determine this growth and act in a ve rv
complex way, which var ies from place to place, and from time
to time. These determinants of urban system mould the Urban
Dynamics . The formulation of any single assumption is not possible
for explaining the internal mechanism of urban dynamics.
1.1 OPERATIONAL DEFINATION AND CONCEPT :
1.1.1: Demographic and Socio-Economic Correlates
Demographic, social and economic correlates are the
determinants of urban dynamics. These are infact various
demographic and socio-economic va r i ab l e s . Demographic var iab les
are based on age and sex of urban population, f e r t i l i t y , mortal i ty ,
migration, urban population growth rate, urban population density,
urban l i t e racy rate, dependency rat io , e tc . On the other hand,
social va r iab l es are post o f f i c es , government and pr ivate o f f i c es ,
park and playgrounds, schools, co l leges , un ivers i t i es , cinema hal ls ,
e l e c t r i c i t y consumption, water supply , news papers, street l ights,
hospi ta ls , Banks, telephones, te lev is ions , buses, e tc . and economic
va r i ab l e includes - monthly income, annual expenditure, worker
in pr imary , secondary and ter t iary a c t i v i t i e s , e tc .
1.1.2: Urban Dynamics
Urban Dynamics here r e f e r s to the determinants of urban
svstem change (Bhuiyan, 1988). It is a kind of kinetic process
in which growth and development are pronounced features. The
growth and changes are being regulated by demographic, social
and economic corre la tes . _
Bhuiyan, Rejuan Hossain (1988), Demographic corre lates of urban dynamics : A case study of Bangladesh, unpublished M.Ph i l .
Dissertation, AMU, Al igarh, India, pp. 2-7.

1.2: BACKGROUND STUDIES
The modern c i ty i s a lways character ized by both growth
of new functions and change or addict ion of old functions.
There are d i f f e r en t approaches to 'Urban Dynamics' as
is exempl i f i ed by the works of Berry (1961), Forres ter (1969),
Pael ink (1974), Moody (1975), Bannister (1977), Boventer (1978),
Beumer and et a l . (1978), Thakur (1980), Mor i l l (1984), Tkachanko
(1984), Yixing and Qin (1984) , Pumain, Saint and Senders (1984),
and Berg (1987). A l l of these studies have been focused a new
dimension with a spec i f i c f ramework. Some of these are micro leve l
study, but most of a l l are macro l e v e l approaches in 'Urban
Dynamics' study.
There is hardlv any study of urban dynamics in time
se r i es . There are, however large number of conceptual studies
on urban system and the internal mechanism of urban dynamics of
a part icular time. Some pioneer works are those of Ber ry (1965,
1966, 1967, 1968, 1971a, 1971b, 1971c, 1972a, 1972b. 1973), Berry
and Horton (1970), 1974), Bourne (1975, 1982), Chen (1972),
Chisholm (1972), Chisholm and Manners (1971) Curry and Mackinnon
(1974), Domanski (1973), Friedmann (1966, 1972), Hoch (1972),
Hughes (1972), Morrison (1973) , Pahl (1971), Parr (1970), Pederson
(1970), and Von-Bovinter (1973) . And some recent work have been
completed by Barras (1987), Mirucki (1986), Alam (1984) , Kennett
(1980), Simmons (1984), Borchert (1986), Whyte (1985), Juppentatz
(1984), and so on.

For the identi f icat ion of strong corre lates and nature and
magnitude of urban dynamics, f o r fo l lowing macro l eve l discussion
have been incorporated l i ke - the or ig in and evolution of urban
centers and growth of urban population of the world and as wel l
as of developing countries. Genesis, distr ibut ion of urban centers
from 1951 to 1981, rank-s ize and rank-order fluctuation, factors
of urban growth, c lassi f icat ion of urban centers of Bangladesh are
a l l taken to understand the urban dynamics. Final ly, the present
attempt considers 40 sample urban centers f o r identi f ication of strong
corre lates for urban dynamics. The fac tor ia l ecology covers both
demographic and socio-economic dimensions.
In urban research on Bangladesh done so far , only some
cross-sect ional studies on urban population problems l i k e
urbanization, growth of towns, slums and squatters, rural-urban
migration, urban poor, housing problems, e tc . have been undertaken
by the Center for Urban Studies (CUS), Dhaka Universi ty , and some
skeleta l ind iv idual research, i . e . , road congestion, transport
problem, housing problem process of urbanization have been dealt
wi th. But there is no study of comprehensive and longitudinal
urban growth dynamics. Moreover , i t seems that other
demographic, social and economic dimensions of urban growth have
not yet been studied by Bangladesh geographers .
It is not only in Bangladesh or India alone that inter
urban and longitudinal ( three point of t ime) urban dynamics study
has not been conducted in other parts of the world. This has
been neglected and Intra-urban l e v e l or 'Social Area Analysis

(SAA) and fac tor ia l ecology of a part icular town/city has been
studied in West and America. But most factor ia l ecologies have
been confined to one time per iod ( the census da t e ) . A Indian case,
Fakhruddin (1984) has discussed the qual i ty of urban l i f e for the
Lucknow c i ty as a social area analysis in one census tract (1971
census). He studied the factor structure of the temporal changes
in the spat ia l pattern in the intra -urban analys is . Some of the
intra-urban dynamics study have been done by Goheen (1969),
Murdie (1969), and Berry and Murdie (1965) through detail
discussion of the changing c i ty of Toronto in each decade from
1850 to 1900 and in 1950 and 1960, and during the decade 1950
to 1960 r e s p e c t i v e l y . Pedersen ' s (1967) study of Copenhagen is
one of the most comprehensive urban ecolog ical analysis in the
intra-urban dynamics context. Two studies have come out, where
demographic, social and economic corre lates have been used for
inter-urban h ierarchy ident i f icat ion through factor ia l ecology,
though these are cross-sect ional (one t ime) analvs is . Moser and
Scott (1961) have c lass i f i ed 157 Bri t ish towns with population more
than 50,000 in 1951, on the basis of 57 indicators pertaining to
population s i ze and structure, population change, households and
housing, economic character is t ics , social c lass, voting behaviour,
health, education and appl icat ion of social amenities.
On the other hand Ahmad (1965) has c lass i f i ed the
Indian c i t i es through factor ia l eco logy . He has selected 62

var iab les re la ted to the fo l lowing aspects -
1. Demographic (19 v a r i ab l e s )
2. Spatial structure (11 v a r i a b l e s )
3. Occupational structure (23 va r i ab l e s ) ,
4. Households and housing (3 va r i ab l e s ) ,
5. Health and hygiene (4 v a r i a b l e s ) and
6. Social amenities (2 v a r i a b l e s ) .
L ike , Moser and Scott, Ahmad appl ied the Pr incipal
component Analys is (PCA) and el iminated the weakness of Moser ' s
c lass i f icat ion of c i t i es . Related to these two studies, Prabha
(1979) has added another work on 102 Punjab towns with emphasis
on the structural analysis . Her method is multivariate in nature.
She has app l i ed a considerable number of correlates in d i f f e rent
sectoral analvs is , l ike demographic t ypo l ogy , nature of economic
base and occupational structure, industr ia l structure, and urban
functions, and urban h i e ra rchy .
Only Elahi (1987) has contributed a cross-sect ional
(one point of t ime) work on fac tor ia l ecology of Bangladesh for
both rural and urban centers. The study has incorporated 40 and
25 geo-demographic var iab les for rural d i s t r i c ts and urban areas
r e spec t i v e l y . More than 90 percent var iance has been expla ined
in unrotated factor matrix in both rural d istr ic t and urban
areas.

The social area analysis of s ingle c i ty and subsequently
inter-urban structural analysis for the one point of time has been
increasingly undertaken through fac tor ia l ecology during the last
three decades but longitudinal ( three point of time) inter-urban
dynamics studies are few and far between in Bangladesh,
However , the present study is also multivariate in
nature. Although, there is emphasis on d i f f e rent sectoral
determinants of urban dynamics, ident i f i cat ion of strong correlates
on the basis of three point of time rather than one cross-sect ional
census tract has been undertaken.
The study is or ig inal in so far as it invest igates the
nature and trend of urban dynamics in three cross-sect ional point
of time for the inter-urban system.
A common set of correlates have been examined, which
cover al l the sectors of urban dynamics. Attempt has also been
made to f ind out the nature of change of d i f f e rent corre lates and
the quality of urban l i f e in the rap id ly growing urban centers.
For the inter dependency of urban analysis the study
w i l l help of concept of Berry (1964). 'C i t i e s As Systems within
Systems of C i t i e s ' , according to this concept c i t i es can be v iewed
as a inter dependency. But B e r r y ' s concept of rank - s ize rule
does not hold good for Bangladesh towns.

The l e v e l and trend of urbanization of the world and
spec ia l l y , the nature of urbanization in the deve lop ing countries
has also been studied. The transformation of urban indigeneous
c iv i l i za t ion and i ts stage of development has also been discussed
for the background study of urban dynamics.
The author thinks that this t ype of urban dynamics
study is essent ia l f o r g iv ing total picture of urban environment
and for the p rospec t i v e planning of r ap i d l y growing small , medium
and large urban centers as we l l as the primate c i t y .
1.3: SCOPE AND OBJECTIVES OF THE STUDY
Qualitat ive and quantitative processes of change in
urban dynamics are determined by the cumulative e f f ec t of
demographic, soc ia l , economic factors and in fra-structure of the
urban centers. Urban dynamics is the result of changes in national
var iab les (Dendrinos, 1980). These changes may be due to
continous technological progress, f o r example, affecting
d i f f e r en t i a l l y var ious urban areas within a nation due to the specia-
l izat ion in production, changes in the rate and location of
extraction of natural resources, changes in tastes nationwide, or
In other demographic, soc ia l , economic, po l i t i ca l , sc i ent i f i c and
technological factors . The purpose of this study is to exp lore
the contribution of demographic, soc ia l , economic and associated
var iab les in urban dvnamics. The time for the study is 1961 to

1981, a per iod spread ove r two decades ( three census p e r i o d s ) .
An urban settlement Is a dynamic place where inter l inked changes
generated by certain cyc l i ca l process occur in the i r internal
structure. These changes themselves are in a cyc l i ca l pattern and
thus severa l stages can be dist inguished. So, there i s need to
deve lop an integral theoret ica l concept of urban dynamics and to
invest igate the nature of urban systems and also to exp lo r e the
k inet ic forces of urban dynamics.
The primary thrust of the study is to evaluate the
general pattern of urban system change and ident i f y the causes
and consequence of urban dynamics machanism, through severa l
stat ist ica l techniques ( desc r ibed e l s ewhe re ) . The app l i cab i l i t y
of the determinates of urban systems change have been appl ied
to the study of 40 se lected urban centers of Bangladesh. Urban
population growth, functions of urban growth and t e r r i t o r i a l growth
of urban centers of Bangladesh have been studied in de ta i l . Urban
dynamics determinants have been examined through PC A. Strong
va r i ab l es of urban dynamics and i t ' s changing nature and magnitude
has been ident i f i ed through correlat ion matrix and factor loading
of d i f f e rent groups. The spec i f i c ob j ec t i ves of the study are:
i ) to know the origin, evolution and growth of urban
system in developing countries and spec ia l focus
for Bangladesh,
i i ) to search the influence of colonialism on urbani-
zation in the develooing countries.
10
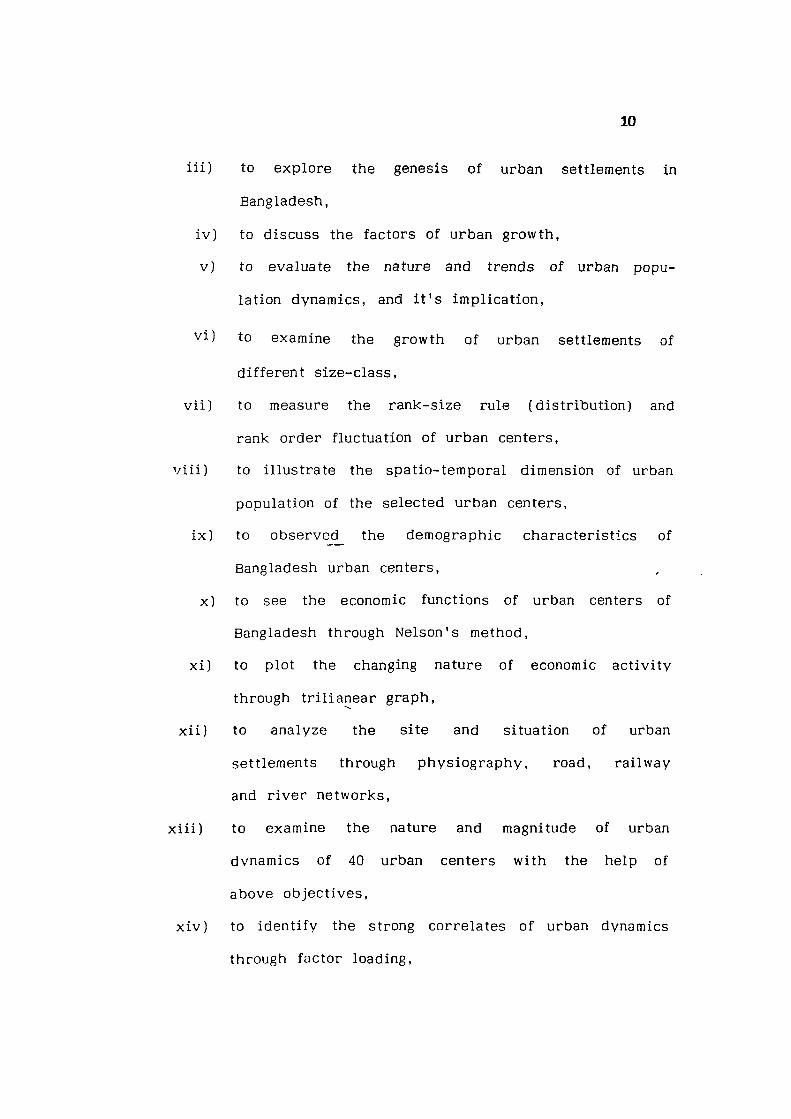
i i i ) to exp lo re the genesis of urban settlements in
Bangladesh,
i v ] to discuss the factors of urban growth,
v ) to evaluate the nature and trends of urban popu-
lation dynamics, and i t ' s impl icat ion,
v i ) to examine the growth of urban settlements of
d i f f e rent s i ze -c lass ,
v i i ) to measure the rank-s ize rule {d is t r ibut ion) and
rank order fluctuation of urban centers,
v i i i ) to i l lustrate the spat io-temporal dimension of urban
population of the selected urban centers,
i x ) to observec^ the demographic character ist ics of
Bangladesh urban centers,
x ) to see the economic functions of urban centers of
Bangladesh through Nelson's method,
x i ) to plot the changing nature of economic ac t i v i t y
through t r i l i anear graph,
x i i ) to analyze the s i te and situation of urban
settlements through phys iography , road, ra i lway
and r i v e r networks,
x i i i ) to examine the nature and magnitude of urban
dvnamics of 40 urban centers with the help of
above ob j ec t i v es ,
x i v ) to ident i f y the strong corre la tes of urban dynamics
through factor loading,

11
XV ) to c l ass i f y urban centers with help of urban dynamics
nature in factor scores .
1.4: STUDY AREA
Urban dynamics d i r e c t l y or ind i rec t l y depends a great
deal upon phys ica l contrasts and terrain d i f ferences , drainage, and
cl imatic character is t ics of the study area. These factors are
inter- l inked with demographic and socio-economic conditions of the
region and accelerate the urban growth and development as a
integrated programme ( Tay l o r , 1951). The factors that have a
bearing on the growth and dynamics of urban centers of Bangladesh
are elaborated below.
1-4.1: Location and Extent
P e o p l e ' s Republic of Bangladesh stretches lat i tudinal lv
between 20° 35'N and 26° 75'N, and longitudinally between 88° 03'E
and 92° 75'E. Bangladesh shares common borders with the Indian
states of West Bengal, Meghalaya, Assam, the Union t e r r i t o r y of
Tripura on the West North and East (3718 km long) and Burma at
the extreme southeast (280 km long ) . The Bay of Bengal in the
south runs for over 717 km. T ibe t (China ) , Nepal, Sikkim, Bhutan,
Nagaland and Manipur are close neighbours of Bangladesh.
Moreover , the country l ies between the eastern margin of the Indian
subcontinent and the Western f r igne ofsprawling southeast Asia
( F i g . 1 . 1 ) .
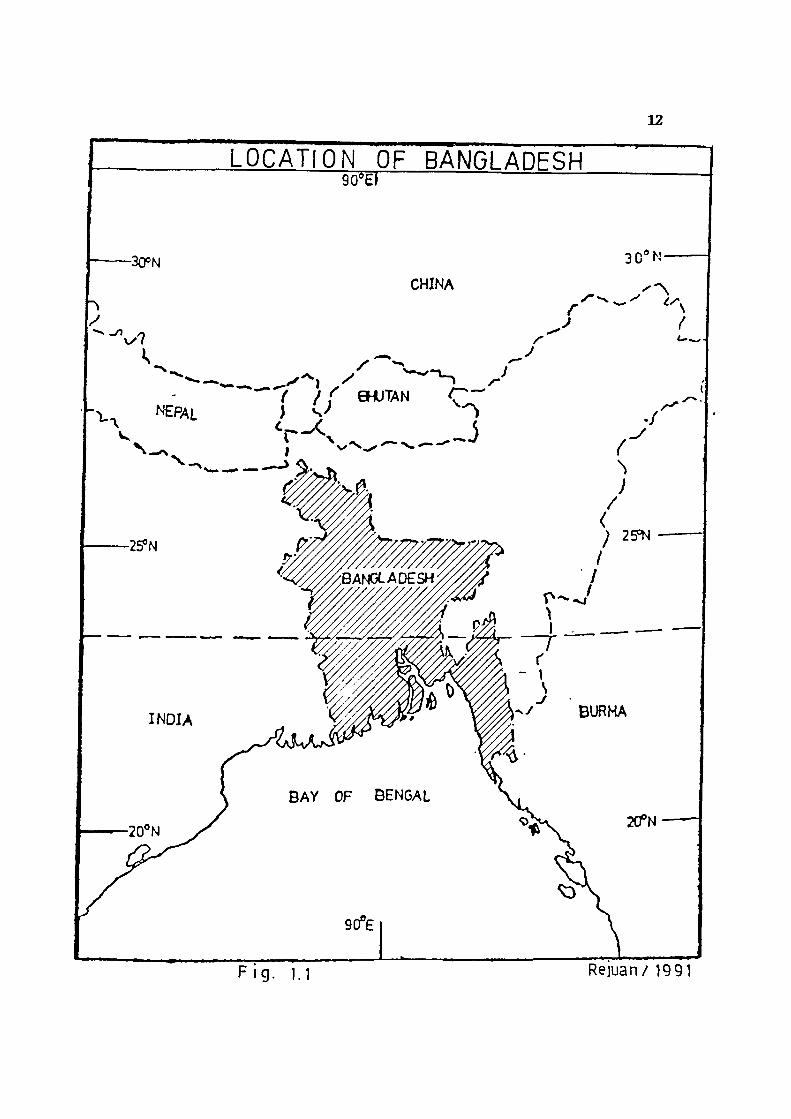
12
LOCATION OF BANGLADESH
CHINA
F i g . 1.1 Rejuan/ 19 91
13
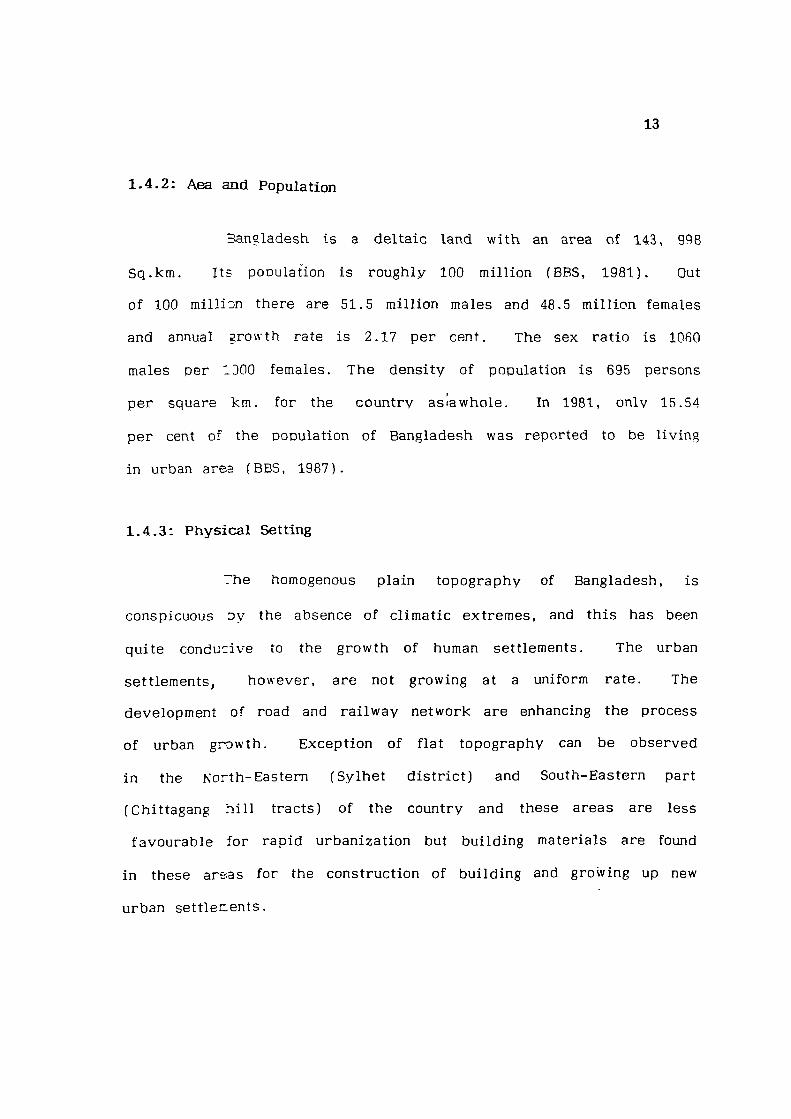
1.4.2: Aea and Population
Bangladesh i s a de l t a i c land wi th an area of 143, 998
Sq .km. I ts pooulation is roughly 100 mi l l ion (BBS, 1981). Out
of 100 mil l ion there are 51.5 mil l ion males and 48.5 mi l l i on females
and annual growth rate is 2.17 per cent. The sex ra t i o is 1060
males per 1300 females. The dens i ty of population i s 695 persons
per square km. for the country as<awhole. In 1981, only 15.54
per cent of the oooulation of Bangladesh was reported to be l i v ing
in urban area (BBS, 1987).
1.4.3 : Physical Setting
The homogenous plain topography of Bangladesh, is
conspicuous oy the absence of c l imat ic extremes, and th is has been
quite conducive to the growth of human sett lements. The urban
sett lements, however , are not growing at a uniform ra te . The
development of road and r a i lway network are enhancing the process
of urban growth . Except ion of f la t topography can be observed
in the North -Eastem (Sy lhe t d i s t r i c t ) and South-Eastern part
(Chittagang h i l l t racts ) of the country and these areas are less
f avourab l e f o r rapid urbanizat ion but building materials are found
in these areas for the construction of bui lding and growing up new
urban se t t l enents .

14
1.4.4: Climate and Soils
The tropic of cancer passes through Bangladesh and
so t ropica l monsoon character ist ics are pronounced. Temperature
var i es between 9.8°C in January to 31.8°C in July and mean annual
var iat ion ranges from 13.9°C to 26.7°C. The summer monsoons are
preceded by pre-monsoon rains in May that often a r r i v e in the
company of v io lent norwesters, and are f requent ly succeeded by
cylonic rainstroms and thunder showers that may go on wel l into
November. Such storms and occasional ti/dal waves cause I
considerable devastat ion. Annual ra infa l l var ies- from 127 cm in
the west to 254 cm in the south - east.
The Geological survey of India compiled a generalized
soil study of the sub-continent of India in 1935 (Wadia, Krishnan and
Mukerjee, 1935). According to this study, on the basis of their
geological o r ig in , Bangladesh so i ls could be d i v i d e d into three
types :
a ) The newer and o lder alluvium areas, including north
Bengali, the eastern plain and the Noakhali-Chittagong
coast,
b ) The de l ta ic area (bounded by the Ganga-Padma-Meghna)
or de l ta ic al luviums. It had three sub-d iv i s ions , fine,
s i l t y c lays to the north, fo l lowed by impure, peatv
depos i ts to the south, and the de l ta ic swamps forming
the sea face, and,

15
c ) The sandy, g r a v e l l y and limV so i l s towards south Sylhet
and the Chittagong Hi l l Tracts . The i r origin was re lated
to' ea r l y Ter t ia ry formations.
In addit ion, the forest area in this region were said
to have damp, mixed so i l s .
1.5: METHODOLOGY (Methods and Materials)
In the present study, var ious methods and techniques
have been app l i ed . For general discussion of d i f f erent indicators,
percentage technique has been taken for the analysis . Rate, rat io
and percentage techniques are used to i d en t i f y the growth/trends
of urban dynamics. . Nelson 's method has been appl ied to study
the functional c lass i f icat ion of urban centers. Principal Component
Analys is (PCA) is used for the ident i f i cat ion of strong var iab les ,
magnitude of change of the indiv idual corre lates . Moreover,
association of var iab les and .parameters factor loading has been
tested through correlat ion matr ix .
1.5.1: Data Base
Related data and l i terature were col lected from various
research papers , Bangladesh Bureau of Stat ist ics (BBS) and
concerned organisations both at home and abroad. In this
connection, the basic data of demographic, soc ia l , economic and
16
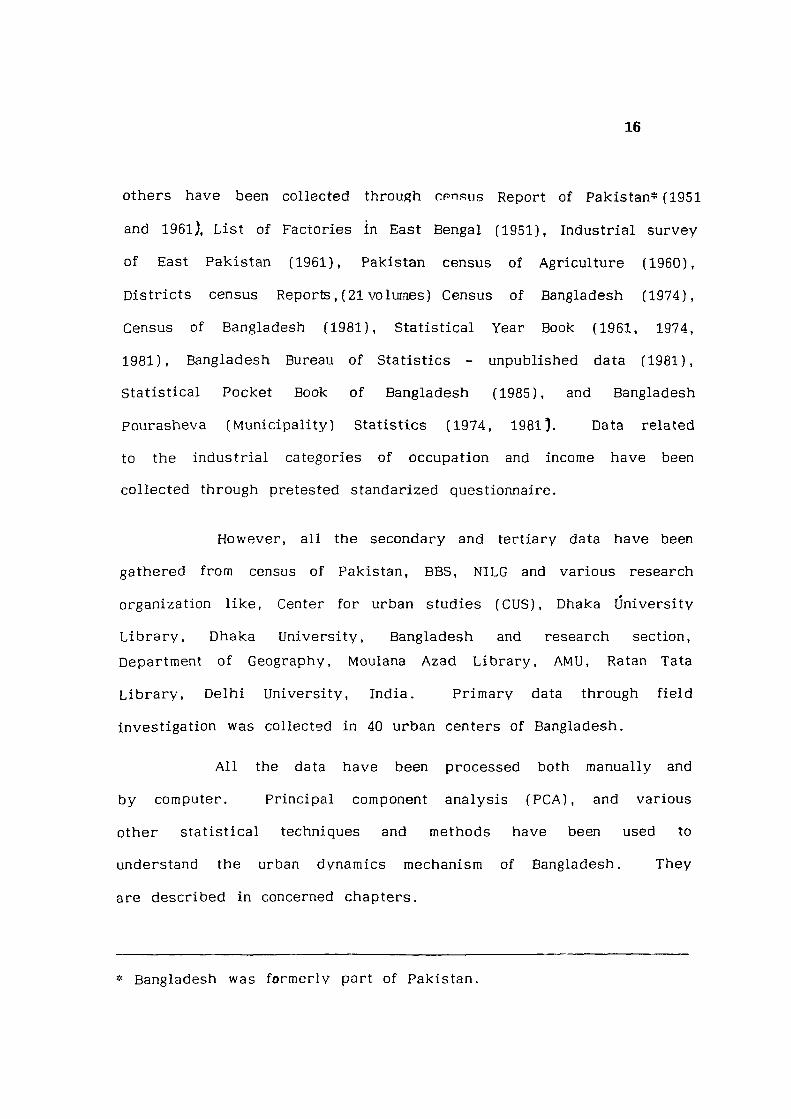
others have been col lected through cphrus Report of Pakistan* (1951
and 1961), L is t of Factories in East Bengal (1951), Industrial survey
of East Pakistan (1961), Pakistan census of Agriculture (1960),
D is t r ic ts census Reports, (21 volumes) Census of Bangladesh (1974),
Census of Bangladesh (1981), Stat ist ical Year Book (1961, 1974,
1981), Bangladesh Bureau of Stat ist ics - unpublished data (1981),
Stat ist ical Pocket Book of Bangladesh (1985), and Bangladesh
Pourasheva (Munic ipa l i ty ) Stat ist ics (1974, 1981^. Data related
to the industrial categories of occupation and income have been
co l lected through pretested standarized questionnaire.
However, all the secondary and tertiary data have been
gathered from census of Pakistan, BBS, NILG and various research
organization l i k e . Center for urban studies (CUS), Dhaka Univers i ty
L i b r a r y , Dhaka Univers i ty , Bangladesh and research section.
Department of Geography, Moulana Azad L ib ra ry , AMU, Ratan Tata
L i b ra r y , Delhi Univers i ty , India. Pr imary data through f i e l d
invest igat ion was col lected in 40 urban centers of Bangladesh.
A l l the data have been processed both manually and
by computer. Pr incipal component analysis (PCA) , and various
other s tat is t ica l techniques and methods have been used to
understand the urban dynamics mechanism of Bangladesh. They
are descr ibed in concerned chapters .
* Bangladesh was formerly part of Pakistan.

18
of the country. Ten urban centers have been chosen from each
d i v i s i on , through s t ra t i f i ed random sampling. Care is taken of a
good regional coverage. Similar type of stratra has been app l i ed by
Berry and N'eils (1969). It had been def ined through a mult ivar iate
grouping analvsis of a l l SMSAs using as attr ibutes in the process the
factor scores for each SMSA that were the product of a factor analysis
of an integrated set of demographic, social and economic indicators
of urban environment.
The proper choice of va r iab l es i s v e r y complex and d i f f i cu l t
from the point of v iew of methodology. Regarding select ion of
indicators, emphasis has been la id on the demographic, socia l ,
occupational and other economic va r i ab l e s as a matter of research
theme. Change is the prominent feature of urban dynamics analys is .
Di f ferent va r iab l es are changing the ir nature and magnitude in separate
ways over the period of time, and r e f l e c t the overa l l trend and
direct ion of urban dynamics. While select ing indicators the author
has tr ied to be v e r y cautions and judicious.
The author has t r i ed to select indicators which f a i th fu l l y
r e f l e c t the urban dynamics and urban growth mechanicm.
Keeping the above considerations in mind the fo l lowing sets
of va r iab l es had been selected for urban dynamics study. The detai l
of the var iab l es used in the computer analys is are l isted in Appendix
- 1.1.

19
TABLE 1.1 : LIST OF URBAN DYNAMICS VARIABLES
S.No. Notations Name of va r i ab l e s
I ) Geodemographic :
a. Demographic Corre lates
1. TOTPOPULATION
2. DEGURBANIZAT
3. MEDIANAGE
4. POPGROWTHRAT
5. POPULDENSITY
6. DEPENDERATIO
7. NETMIGRATION
8. SEXRATIO
Total population
Degree of urbanization
Median Age
Population Growth Rate
Population Density
Dependency Ratio
Net Migration
Sex Ratio
b. Geographic Corre lates
9. AREA
10. AREACHANGE
Area
Area Change
n) Social :
a. Social Fac i l i t i e s
11. POSTOFFICE
12. GOVERNOFFICE
Post Of f i ces
Government O f f i c es

20
S.No. Notations Name of var iab les
13. PARKPLAYGROV Parks and Play grounds
14. CINEMAHALL Cinema Hall seats
15. NEWSPAPERCIR News Paper Circulation
16. STREETLIGHT Street Lights
17. HOSPITALBED Hospital beds
18. BANK Banks
19. BUS Buses
20. FPC 8 MCWC P . P . Centerss and M Centers
21. ELECTRICITY E lec t r i c i t y
22. WATER Water
b. Social Amenities
23. TELEVISION Te l ev i s i on
24. TELEPHONE Telephones
c. Transport, Communication, and Housing Envirorment
25. HOUSEHOLDDEN House-hold Density
26. KUTCHA HOUSE Kutcha House
27. PUCCAROAD Pucca Road
28. ROADCONVERGE Road Convergence
29. ROAD DENSITY Road Density
C . W ,

21
S.No. Notations Nane of va r iab l es
d. Educational Corre lates
30. LITERACYRATE
31. SECONDSCHOOL
32. COLLEGE
33. UNIVEREQUINS
L i te racy Rate
Secondary School
Col leges
Univers i ty and equivalent Institutions
I I I ) Economic :
a. Occupational va r i ab l es
34. UNEMPLOYMENT
35. PRIMACTIVITY
36. SECOACTIVITY
37. TERTACTIVITY
Unemployment Rate
Pr imary A c t i v i t y
Secondary A c t i v i t y
Te r t i a ry A c t i v i t y
b. Income and expenditure
38. PERCAPITAINC
39. ANNUALEXPEND
Per Capita Income
Annual Expenditure

22
Due to the l imitation of software techniques on PCA only
39 var iab les have been considered fo r analys is . The l imitation of
programme is that the number of var iab les should not exceed the
number of observat ions (number of unit) in PCA. As a result , some
indicators have been dropped in the present study. S imi lar ly , the
study had to drop certain var iab l es owing to non-ava i l ab i l i t y of data
in the newly c lass i f i ed urban centers. Some of the var iab l es are
excluded because of the ir ubiquitous nature, l i k e pr imary school an
other lower order f a c i l i t i e s and amenities. However , the results of
both the cross-sect ional and change analysis depend to a large extent
on the r e l i ab i l i t y and v a l i d i t y of pr imary and as wel l as secondary
data. But i t is general ly recognized by stat ist ic ians that some errors
in the raw data are inev i tab l e . Indeed, the s e v e r i t y of such errors
var i es across the urban center depending on. a number of
character ist ics such as the nature of the va r i ab l e being measured,
the enumerator, the respondent, and the s ize of sample. Besides,
sampling e r rors and non-sampling e r ro rs are associated with the
analys is .
1.5.4: Technical and Analytical Procedures
For the study of urban dynamics of Bangladesh urban centers
for the period of 1961 to 1981 a set of technical and analytical
procedures have been formulated. As mentioned ea r l i e r , f o r t y urban
centers have been choosen for the study and indiv idual urban center
is an unit of study. For ident i f i cat ion of strong v a r i a b l e s thirtynine

23
indicators have been selected for al l the three census per iods 1961,
1974 and 1981. Simi lar ly , 27 var iab les were sorted out f o r measuring
the magnitude of urban dynamics. Fi f teen socio-economic var iab les
were choosen for urban h i e ra rchy determination. Where appropr iate ,
the census var iab l es were transformed into rate, rat io and percentage
values.
With the above ob j e c t i v e s , in mind a mult ivariate stat ist ical
technique ca l led Principal Component Analysis (PCA) has been appl ied
to reduce the large number of var iab les (both secondary and
p r imarv ) , many of them interre la ted to the few independent underlying
dimensions, into factors/components, which were responsib le for the
var iat ions among the indicators . A f t e r grouping, desc r i p t i v e names
were assigned to each factor based on the var iab les most c lose ly
re lated with that factor. Character ist ics of urban centers are
genera l ly heterogenous in nature. Wider the heterogeneity , the factors
in factor matrix increase in number. Main technique of PCA has been
taken in the l ight of Ahmad's (1965) work.
1.5.5: Method of principal Component Analysis
The Pr incipal Components Analys is (PCA) is most commonly
used in urban study to i d en t i f y the groups of re lated var iab l es ,
which, if they ex i s t , indicate more general patterns than part icular
indices might suggest (Johnston, 1980). The mathematical der ivat ion
employed to determine the underling kinetic dimensions of var iat ion
is known as the pr incipal components analysis (Ahmad, 1965). Urban
24
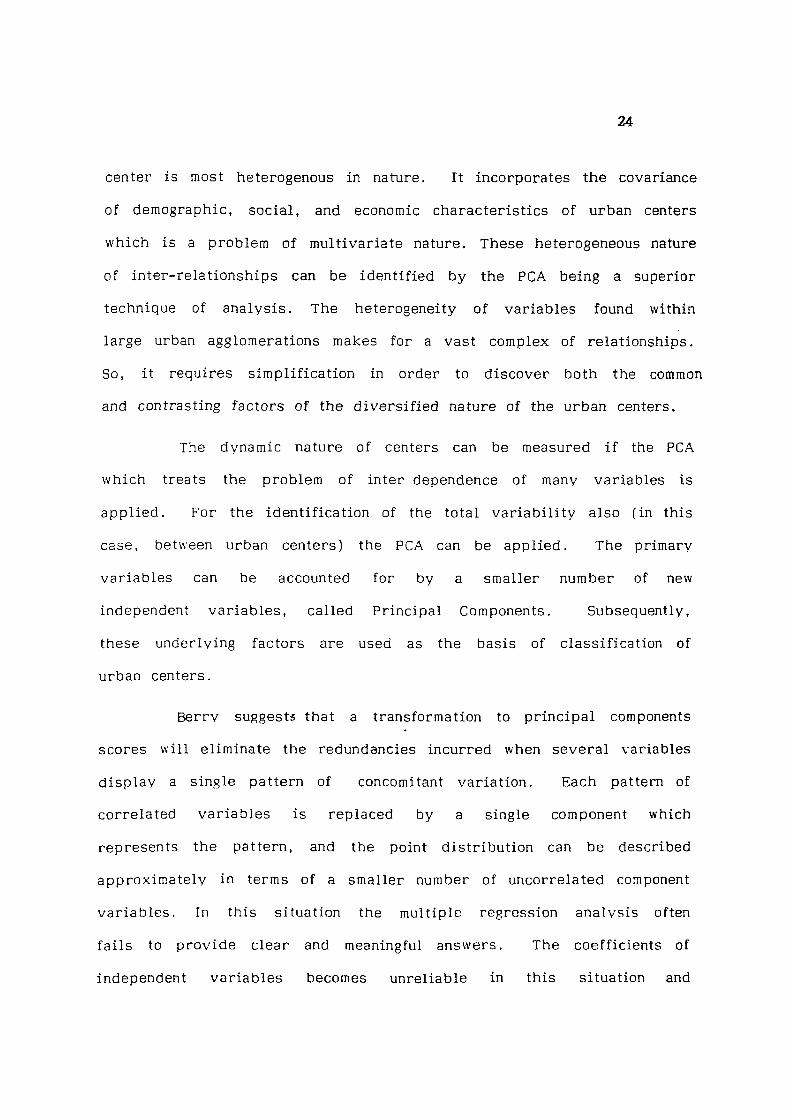
center is most heterogenous in nature. It incorporates the covariance
of demographic, soc ia l , and economic character is t ics of urban centers
which is a problem of mult ivariate nature. These heterogeneous nature
of inter -re lat ionships can be ident i f i ed by the PCA being a superior
technique of analys is . The heterogeneity of var iab les found within
large urban agglomerations makes for a vast complex of re lat ionships.
So, i t requires s impl i f i cat ion in order to d iscover both the common
and contrasting factors of the d i v e r s i f i e d nature of the urban centers.
The dynamic nature of centers can be measured i f the PCA
which treats the problem of inter dependence of many var iab les is
app l i ed . For the ident i f i cat ion of the total v a r i ab i l i t y also (in this
case, between urban centers) the PCA can be app l i ed . The primary
var iab les can be accounted for by a smaller number of new
independent va r i ab l es , cal led Pr incipal Components. Subsequently,
these underlying factors are used as the basis of c lass i f icat ion of
urban centers.
Berry suggests that a transformation to pr inc ipa l components
scores wi l l e l iminate the redundancies incurred when seve ra l var iables
d i sp lay a s ingle pattern of concomitant var ia t ion. Each pattern of
corre lated va r i ab l es i s replaced by a single component which
represents the pattern, and the point distr ibut ion can be described
approximate ly in terms of a smaller number of uncorrelated component
va r i ab l es . In this situation the multiple regression analysis often
f a i l s to p rov ide c lear and meaningful answers. The coe f f i c ients of
independent va r i ab l es becomes unrel iable in this situation and

25
sometimes carry wrong signs - since these become distorted by the
inclusion of other independent va r iab l es with which these show a
high degree of associations. The PCA, on the other hand, takes the
correlat ion matrix into account, and produces components which are
uncorrelated with one another, and so enable the research worker
to bypass the problem of mul t i - co l l inear i t v .
Factor Analysis ( FA ) stresses shared common patterns but
PCA takes care of a l l patterns - shared and unique. However, both
the techniques result in the col lapsing of a set of intercorrelated
var iab les onto a smaller number of basic dimensions or composite
var iab les (King, 1969).
Al l the tables in chapter iV are the products of principal
components analys is subject to orthogonal rotation according to the
normal \-arimax cr i te r ion . The studv considered the orthogonal
rotated factor matr ix . In PCA, there i s no hard-and-fast rule for
taking up the eigen value of the components. But most frequently it
interprets only those components for which the. .eigen value exceeds
1.0. The just i f icat ion of more than 1.0 eigen values is that the
variance of the original va r i ab l es come into unity. The present study
has considered eigen values of 2.0 or more for the identi f icat ion of
strong var iab les and 1.5 for the measuring the magnitude of urban
dynamics for rotation. The rationals for this is to avo id increase
of comp-'^nent i s factor matrix, where the number of var iab les were
v e r y few with the value of 0.50 or more. Here the factor loading
0.50 or more is considered as a strong va r i ab l e f o r the urban
dynamics ana lys i s .
26
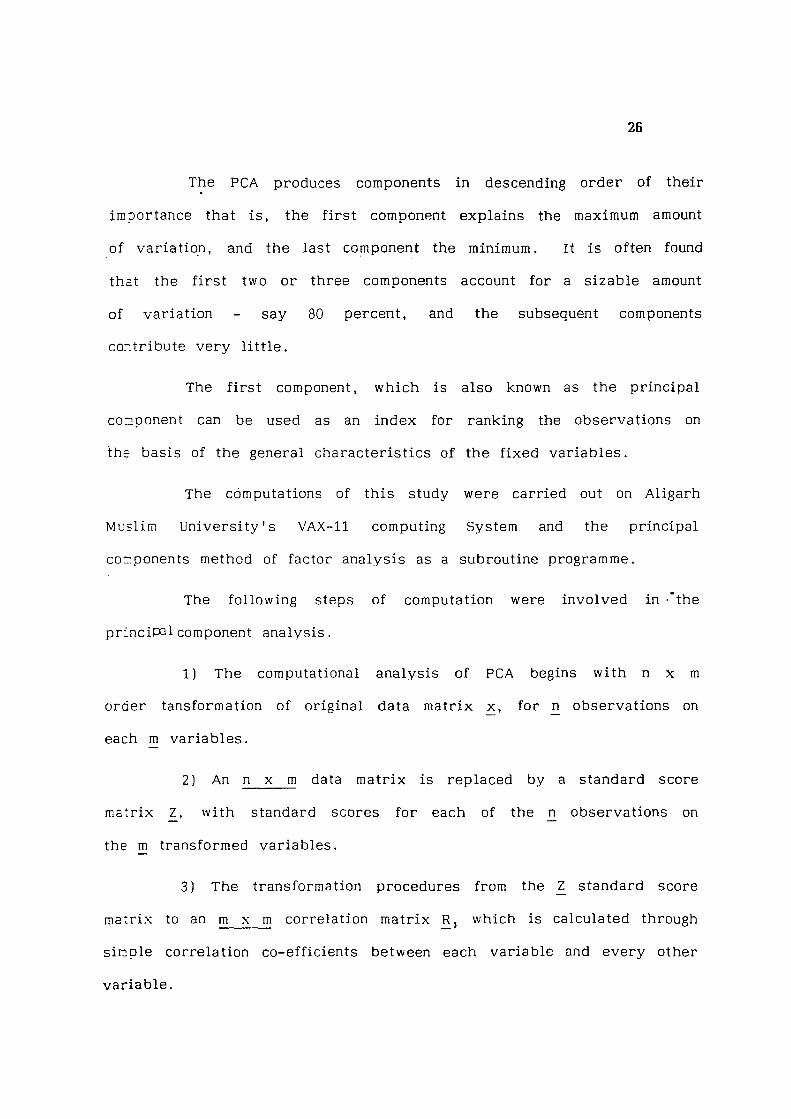
The PCA produces components in descending order of their
importance that is , the f i r s t component expla ins the maximum amount
of var iat ion, and the last component the minimum. It is often found
that the f i r s t two or three components account for a s i zab le amount
of var iat ion - say 80 percent, and the subsequent components
contribute v e r y l i t t l e .
The f i r s t component, which is also known as the pr incipal
coriponent can be used as an index for ranking the observat ions on
the basis of the general character is t i cs of the f i x ed va r i ab l e s .
The computations of this study were carr ied out on Al igarh
Muslim Un i v e r s i t y ' s VAX-11 computing System and the pr incipal
cor.ponents method of factor analys is as a subroutine programme.
The fo l lowing steps of computation were invo lved in ' ' the
principal component analysis .
1) The computational analysis of PCA begins with n x m
order tansformation of original data matrix x . for n observat ions on
each m var iab l es .
2) An n x m data matrix is replaced by a standard score
matrix Z, with standard scores for each of the n observat ions on
the m transformed var i ab l es .
3) The transformation procedures from the Z standard score
matrix to an m x m correlat ion matrix R, which is calculated through
simple corre lat ion co -e f f i c i ents between each var iab le and e v e r y other
va r i ab l e .
27
4) The object of Pr inc ipal component Model (PCM) is to
r e so l v e the correlat ion matri j j R into an m x r factor loading matrix
A, where, m=r was orthogonally rotated according to normal varimax
cr i te r ion to reproduce a new factor matr ix . The rotated factor matrix
makes a minimum poss ib le number of v a r i ab l e loaded high on each
fac tor . In such a way, e v e r y factor became simpler and easier for
interpretat ion in the common group.
5) Multipl ication of standard score matrix n x m order and
orthogonal rotated factor matrix A of m x r order and produced a
new factor score matrix F of n x r o rde r . The factor scores were
then normalized to zero var iance . This p r o v i d e a measure for each
observat ion on the new factors .
With the help of PCA, the study ident i f i ed the strong
va r i ab l e s in the factor matr ix. So, the nature of urban dynamics
can be detected through indiv idual magnitudes of changing character
of factor scores. Factor matrix and comparat ive change can be
detected with the help of First pr inc ipa l component. Thus, the
technique is designed pr imar i l y to synthes ize a large number of
va r i ab l e s into smaller number of compoents, so that they help to
diagnosis the trends and direct ion of demographic, soc ia l , economic
corre la tes of urban dynamics.

28
1.6 : ORGANIZATION .
Urban dynamics is a kinet ic process in which growth and
changes are pronounced features. However , the main interest of this
study is to i d en t i f y the strong va r i ab l e s which a l ter • the urban
system. Urban environments are changing gradual ly with time and
qual i ty of l i f e i s also changing at d i f f e r en t l e v e l s through physio-
socio-economic and demographic characters of urban center. Urban
dynamics nar j r e is also vary ing with the s i ze (both area and
population) of the c i t y .
The whole study has been d i v i d ed into f i v e chapters. The
f i r s t chapter i s an introduction.
Factors re lated to urban growth l i ke - phys ica l , cultural,
demographic, socia l and economic features of the study area have
been e labora:ed in chapter I I . Chapter I I also incorporates the
c lass i f icat ion of urban settlements. Rank-size rule and Rank-order
fluctation also tested in the last section of the chapter, but the
genesis of urban places has been evaluated in terms of physical and
infra-structural elements.
Spatial and temporal dimensions of urban dynamics of
selected 40 urban centers have been discussed in chapter I I I . The
temporal growth of population and area of the towns have been
analysed and functional c lass i f icat ion of 40 towns has been attempted
through Nelson 's method.

29
The theme of the chapter IV is mainly devoted to analysis
the urban dynamics features according to normal varimax cr i ter ion
to reduce a new factor loading matrix of large number of original
va r i ab l es . In th is case Pr inc ipal Components Analysis (PCA) has
been app l i ed for the ident i f icat ion of strong var iab les , grouping of
c i t i es through measuring the dynamic nature of demographic, social ,
and economic va r i ab l e s . However, a l l the sectors of the chapter
IV, deals with the results of PCA and i t ' s interpretation in the l ight
of urban dynamics.
Chapter V is the concluding chapter is a discussion of the
main theme. It conclude, with some suggestions for future.

REFERENCES
Ahmad, Q (1965), Indian Cities : Characteristics and Correlates, The
Univers i ty of Chicago, Dept. of Geography, RP = 102, pp .
21-22.
Arther , D. L i t t l e (1961), Industrial Survey of East Pakistan, 1961.
Bannister, G (1977) "Space-t ime components of urban population change".
Economic Geography, Boston Univers i ty , p. 39.
BBS (1987), Bangladesh Population Census - 1981, Ministry of Planning,
Government of Bangladesh, Vol . 1-21, various pages.
BBS (1987), Bangladesh Population Census, National Series - Report on
Urban Area, - 1981, Ministry of Planning, GOB, p. 11.
BBS (1981), National Census Volume, Ministry of Planning, Government
of Bangladesh, p .9 .
Berg, L .V .D . (1987), Urban System in a Dynamic Society, Gower
Publishing Company L imited, Hampshire, England, p .2 .
Berry , B .J .L . (1961), " City Size Distributions and Economic
Development, Economic Development and Cultural Change, Vol .
IX, pp.38 and 576-88.
Berry , B .J .L . (1964), "C i t ies as Systems within Systems of C i t i es " ,
Papers and Proceeding of the Regional Science Association,
Vol . 13, pp . 21-34 and 147-64.
Be r ry , B . J . L . , and Horton, F . E . , (1970), Geographic perspectives on
Urban Systems: with integrated readings : Prent ice - Hall , New
Jersey , pp. 20-35,

31
Berry , B . J . L . (1971), "Contemporary Urbanization processes" , in U.S.
National Academy of Science", Geographical Perspectives on
Urban Problems, pp. 94-107.
Berry , B .J .L . (1971a). "C i ty Size and Economic Development", in L.
Jakobson and V. Prakash, ( e d s . ) Urbanizations and National
Development, Saga Publications, Berer ly Hi l l s , Ca l i f , pp. 18
and 11-55.
Berry , B .J .L . (1976b) . "The Geography of the United States in the
2000," Ek is t i cs , pp. 389-51.
Berry , B .J .L . (1972a), "Latin Structure of the American Urban system",
in B .J .L . Berry , e d s . , City Classification Hand book, Wiley
Interscience, New York .
Berry , B . J . L . (1972b), "Hierarchical Dif fusion: The Basis of Development-
al F i l ter ing and Spread in a System of Growth Centers", in
N.M. Hassen, ed . Growth Centers in Regional Economic
Development, The Free Press , New York, pp . 108-38.
Berry , B .J .L . (1973), "Growth Centers in the American Urban System",
Vol . 1, Community Development and Regional Growth in the
60's and 70's, Bal l inger, Cambridge, Mass, p. 311.
Berry , B .J .L . and Murdie, R.A. (1965), Socio-Economic Correlates of
Housing Condition, Toronto, Chicago.
Berry , B.J .L .and Nei ls , E.M. (1969), Location, size, and shape of
cities as Influenced by environmental factors: the urban
environment writ large. The Quality of urban environment,
Harvey S. Pe r l o f t , ed . Balt imore: The Johns Hopkins Press
for Resources f o r the future.

32
Berry , B .J .L . and Rees, P .H . (1969), "The Factor ia l Ecology of
Calcutta," American Journal of Society, Vol . 74, pp. 283-326.
Beumer, L. and et a l . (1978), "A Study of the Formal Structure of J.W,
Fo r r es t e r ' s Urban Dynamics Mode l , " Urban Studies, Vol. 15,
p. 109.
Bhuiyan, R.H. (1988), Demographic Correlates of Urban Dynamics; A
Case Study of Bangladesh, Unpublished M . P h i l , dissertat ion,
AMU, p. 2.
Bochert, J.H. (1986), "Urban Systems in transition and governnent
act ions," Netherland Geographic Studies, Vol . 16, pp. 222-330.
Bourne, L .S . (1975), Urban System : Strategies of Regulation - A
Comparison of Policies in Britain, Sweden,' Australia, and
Canada, Clarendon Press , Oxford, p. 11.
Bourne, L .S. (1982), Internal Structure of the City : Reading on Urban
form, growth, and Policy. Oxford Univers i ty Press , New Ycrk,
pp. 104-48.
Boventer, Von, E. (1973), "C i t y Size Systems : Theore t i ca l Issues,
Emprical Regulari t ies and Planning Guides, " Urban Studies,
Vol. 10, pp. 145-62.'
Boventer, E. V©n (1988), "Bandwagion Effect and Product Cyc les in Urban
Dynamics," Urban Studies, Vol. 15, pp. 261-272.
Brown, L .A . and Horton F .E . (1970), "Social Area Analys is : An
Empirical Analys is , Urban Studies, Vo l . 7, 271-88.

33
Census of Bangladesh (1974), Bangladesh Population Census, Vol . 2 a
3, Bangladesh Bureau of s tat is t ics , BBS, Dhaka.
Census of Bangladesh (1981), Report on Urban Area, BBS, 1987, Dhaka.
Census of Bangladesh (1981), Zila (District) Statistics, Vol. 1-21, BBS,
1984-88, Dhaka.
Census of Bangladesh (1981), Analytical Report and National Tables,
BBS, 1984.
Census of Bangladesh (1981), National Volume, 1983, Dhaka.
Census Report of Pakistan (1951), East Bengal, Vo l . I I I .
Census of Pakistan (1951), Bulletins Nos. 1 and 2, Karachi.
Census of Pakistan (1951), East Bengal, Vol . 3, Report and Tables .
Census of Pakistan (1951), Detailed Tables of Economic Characteristics
-East Bengal, Vol . 8, Karachi.
Census of Pakistan (1961), District Census Report, Vol . 1-17.
Census of Pakistan (1961), No. 1-2 (East Pakistan), Karachi.
Chen, K. (1972), Urban Dynamics : Extensions and Reflections, ( e d s ) ,
San Francisco Press, San Francisco, pp . 213-16.
Chisholm, M. (1972), "Macro and Micro Approaches to Urban Systems
Research, " The Geographical Journal, Vo l . 138(1) , pp. 60-
63.
Chisholm, M. and Manners, G. (1971), "Geographic Space : A New
Dimension of Public Concern and P o l i c y , " in M. Chisholm and
G. Manners, ( e d s ) , Spatial Policy Problems of the British
Economy, Cambridge Univers i ty Press , Cambridge, pp. 1-23.

34
Colby, Charles, C. (1933), "Centri fugal and Centripetal Forces in Urban
Geography, "Annals of the Association of American Geographers,
Vol. XXIII, pp. 1-20.
Curry, L. and Mackinson, R.D. (1974), "Aggregat ive Dynamic Urban
Models Oriented Towards Po l i c y " , Report to the Ministry of
State for Urban Af fa i rs by the Center for Urban and Community
Studies, Univers i ty of Toronto, p. 351.
Dendrinos, D.S. (1980), "Dynamics of City Size and Structural S tab i l i t y :
The Case of Single C i t y " , Geographical Analysis, Vol. 12 (3 ) ,
pp. 231-244.
Domanski, R. (1974), "Structure, Law of Motion and Optimal Path of 0
Growth of Complex Urban System," Economic Geography, Vol.49,
pp. 37-46.
Elahi , K.M. (1987), "Spatial Distribution of Population Structures in
Bangladesh," Souviner, National Geographical Association of
Bangladesh, pp . 1-16.
Fakhruddin (1984), Residential Structure of Lucknow : A Study in
quality of Urban l i fe . Unpublished Ph.D. thesis, AMU,
A l i garh , India.
Friedman, J. (1966), "Two Concepts of Urbanization : A Comment,"
Urban Affairs Quarterly, Vol . 1, p. 17.
Friedman, J. (1972), The Spatial Organization of Power and the
Development of Urban System, Univers i ty of Cal i fornia , School
of Agriculture and Urban Planning, Los Angdes (Mimeo) ,
p. 108.

35
GOB (1985), Statistical Pocket Book of Bangladesh, Government of
Bangladesh, BBS, Dhaka.
GOB (1981), statistical Year Book, BBS, Dhaka, 1986.
GOB (1974), Statistical Year Book, Dhaka, 1976.
Goheen, P- (1970), The North American Industrial City in the Late
Nineteenth Century : The Case of Toronto, Department of
Geography, Research Paper; Chicago, Un ivers i ty of Chicago.
RP.# 127.
Govt, of Pakistan (1961), Statistical Year Book, Karachi .
GOP (1960), Pakistan Census of Agriculture, Vo l . 1 (East Pakistan),
Agricultural Census Organization, Min is t ry of Food and
Agriculture, Government of Pakitan, Karachi - 1962.
GOP (1951), List of Factories in East Bengal, Government of East
Bengal, Dhaka.
Haynes, K.E. (1971),, "Spat ia l Change in Urban Structures : Alternative
Approaches to Ecological Dvnamics, " Economic Geography,
Vol.47, pp . 324-35.
Hoch, J. (1972), "Income and City S i z e . " Urban Studies, Vol. 19,
pp. 299-328.
Hughes, J.W. (1972), Urban Indicators, Metropolitan Evolution and Public
Policy, Center f o r Urban Po l icv Research, Rutgers Univers i ty ,
New Brunswick, W.J . , P. 139.

36
Kenneth, S. (1980), "The Changing Distr ibution of sex Ratios in the
Br i t i sh Urban System, "• Geoforum, Vo l . I I , pp. 31-41.
Kendall, M.G. (1957), A Course in Multivariate Analysis, London,
Charles Gr i f f in .
Mor i l l , Richard L (1984), "The Settlement System of the United Sta tes , "
Urbanization and Settlement System : International Perspectives,
Oxford Univers i ty Press, New York, p . 37.
Morrison, W. I . (1973), "The Development of an Urban Inter- industry
Model-1, Building the input - output Accounts," Environment
and Planning, Vol . 5, pp. 569-83.
Moser, C.A. and Scott, W. (1961), British towns : A Statistical Study
of their Social and economic differences, Edinburgh, Center
for Urban Studies, Report no. 2, p. 169.
Mukharjee, M. (1970), "Functions and Functional Classi f icat ion of towns
in B i h a r , " Deccan Geographer, Vo l . V I I I , pp. 56-65.
Murdie, R .A . (1969), Factorial Ecology of Metropolitan Toronto, 1951-
1961 : An Essay on the Social Geography of the C i ty ,
Department of Geography, R .P . # 116.
NILG (1974), Bangladesh Pourashava (Municipality) Statistics, 1977,
Dhaka.
NILG (1981), Bangladesh Pourashava (Munic ipa l i ty ) Stat ist ics, 1988,
Dhaka.

37
NIPORT (1984) , Basic Methods of Evaluative and Action Research
(Monograph), National . Inst i tute of Population Research and
Training Dhaka, p p . 45-46.
Pae l ink , J . H . P . (1974), "A l t e rna t i v e Methods f o r the Study of Urban
Dynamics , " in Funck, R. ( e d s ) , Recent Developments in
Regional Science, U . S . A . , pp . 33-49.
Pah l , R. (1971) , " P o v e r t y and the Urban Sys tem, " in M. Chisholm and
G. Manners, ( e d s ) . Spatial Polity Problems in the Br i t ish
Economy, pp . 126-45.
Pa r r , J .B . (1970) , "Models of c i t y s i z e in an Urban Sys tem, " Papers
of the Regional Science Associations, Vo l . 25, pp . 221-53.
Pederson, P . O . (1967) , Model ler for Befolkningsstruktur
Befolkningsuddvikling i storbyomrader Specie/t med Herbl ik
Storkobenham, Compenhagen.
Pedersen, P .D . (1970), " Innovat ion Di f fus ion within and between National
Urban Sys tem, " Geographical Analysis, Vo l . 2 . , p . 223.
Pumain, D. and e t . a l . (1984) , " Towards a modell ing of intra-urban
dynamics , " Espace Geographique, Vo l . 13, No.2, pp . 125-135
and 308-325.
Rees, P .H . (1979) , Residential Patterns in American Cities : 1960,
Chicago, R . P . # 189.
Simmons, James W. (1984) , " The Canadian Urban System" Urbanization
and Settlement " Systems, Ox fo rd Un i ve rs i t y P ress , New Y o r k ,
p p . 10 and 31-38.

38
Taylor, G. (1951), Urban Geography, Mutheum, London, p. 216.
Timms, D.W.G. (1971), The Urban Mosaic : Towards a Theory of
Residential Differentiation, Cambridge, Cambridge Univers i ty
Press .
Tkachenko, L. Ya (1984), "Phys i ca l - geographic aspects of the study
of urban area , " Soviet Geography - Review and Translation,
Vo l . 25, No.5, pp . 248-252.
Wadia, K. and Mukerjee (1935), Record in Geological Survey : India,
Vol . LXI I I , part 4, Calcutta, pp . 363-91.
Whyte, A. (1985), "Ecological approaches to urban systems : A
r e t rospec t i ve and prospec t i ve l ook " Nature and Resouces,
Vo l . 21 (1 ) , pp . 13-20.
Yining, Zahou and Oin, Z. (1984), "On the determination of City
Character in Urban Planning," Scientia Geographic Since,
V o l . 4 ( 2 ) , pp . 29-37.

CHAPTER I I
EVOLUTION AND CLASSIFICATION OF URBAN SETTLEMENTS IN
BANGLADESH
The present chapter is an attempt to bring out the
salient features of the trends in urbanization and growth pattern
of urban system of Bangladesh. It i s on these trends and on
this partem that present day urban dygf^mics operates . With
these ob j e c t i v e s , an analysis of genesis of urban centers, factors
of urban growth and spat io-temporal trends of urbanization have
been attempted. To ident i f y the growth pattern, the comparative
trends of urban growth, and demographic character is t i cs of the
study area, have been analysed.
Urban centers are the focal points of a l l social,
economic, cultural, administrat ive and other ac t i v i t i e s of
soc ie ty , and p lay a v i ta l ro le in socia l and economic
development of a country. Urban growth is one of the most
important indicator of the development of a nation. Being a
complex socio-economic process c lose ly connected Vvfith the
sc ient i f i c - technolog ica l revolution, urban dynamics influences
all aspects of s o c i e t y ' s l i f e . I t a lso invo l v es demographic,
social and economic processes.
The growth of urban sett lements i s l a rge ly influenced
by the ir locational settings, h is tor ica l evolut ion and the i r socio-

40
economic l inkage within the country. Th is i s an attempt to studv
man's interaction in the geographical environment of the region.
The account of Hiuen Tsaag shows that Bsng^;il|desh has
an old h i s to ry of urbanisation (Majumder, 1924). Pundra (3rd
century B . C . ) , Vanga (4th-5th centuries A D ) , Mahasthan (2nd-
12th centuries A . D ) , Belwa ( 1 0 t h c e n t u r i e s A . D ) , Varendra (5th
and 6th centuries A . D ) , Paharpur (6th century, A . D ) , Bakla (10th
to 11th centuries A . D ) , e tc . were some important towns in ancient
Bangladesh ( F i g . 2 . 1 ) . The area and distr ibut ion can be seen
in map 2.1.
2.1 GENESIS OF URBAN PLACES
In th is section, an attempt has been made to study the
evolution, growth and development of urban centers through
various h is tor ica l per iods in which the demographic, socia l ,
economic, po l i t i ca l and technological conditions were d i f f e r en t .
The evolution and growth of urban centers in Bangladesh is
character ised by three dist inct phases.
a. The f i r s t phase goes back to h i s to r i ca l past when a number
of urban centers f lour ished in Bangladesh as royal towns,
and as re l ig ious and commercial centers. These later
degenerated as result of a number of geographic reasons;
b. The second phase of urbanization in Bangladesh i s

41
character i zed mainly by a colonial background with an
indi'genous rural culture when a number of important towns
emerged.
c. The th i rd phase is the recent phase in which urbanization
took place in an a l ready densely populated area giv ing r i s e
to a v e r y high concentration of urban poDulation, spec i a l l v
in the large urban centers. A town thus r e f l e c t s the complex
socio-cultural background of the var ious stages through which
i t has passed and there fore i t w i l l be worthwhi le to studv
them in the chronological o rde r . They have been arranged
in the fo l lowing three main per iods of h i s t o r y :
Ancient
i . Medieva l
i i . Modern per iods
2.1.1: Urban Centers in Ancient Period (2500 B.C. to 1206 A . D . )
Number of authors have mentioned that a g rea t part o f the
r i v e r ine and wet Bengal delta and the inland low plains were
under forest and marshland through the p re -h i s t o r i c and even
in the h is tor i ca l past (Brown, 1956 and Etahi , 1985). Even as
late as in the Mughal per iod (med ieva l per iod most of the
Gangetic plain was under forest and human occupation was quite
slow to penetrate into such lands. In ancient Bangladesh the
economy was dominated by agr iculture, animal husbandry and

42
trading a c t i v i t i e s . The f i r s t two a c t i v i t i e s were part of the rural
economy but the th i rd found a suitable place in the urban
location. There i s • evidence that major pockets of human
settlements ex i s t ed in the f e r t i l e r i v e r v a l l e y s f i t f o r agr i cu l ture
(E lahi , 1985). There existed many urban settlements and - towns
in ancient Bangladesh ( F i g . 2 .1 ] .
Pundra: in 3rd century B.C. there ex i s t ed a city-Pundravardhan
(Rashid^ 1977) which was d iscovered in Mahasthangarh in Bogra
d is t r i c t and Pancha Nagari in Dinajpur d i s t r i c t of Northern part
of Bangladesh ( F i g . 2 .2 ) in 5th century A .D. Pundra f lourished
at Mahasthan near the d is t r ic t town of Bogra and was a beautiful
and prosoerous town of the Pundravardhonabhukti which included
Varendra roughly ident ica l with North Bengal. The town f lourished
between 5th and 6th centuries A.D. and covered a la rger area
by 12th century (E lah i , 1985). There was a good road linking
Pundra with o ther towns in the west, l i k e - Kajangla in Malda.
Vanga: It was in the Mahaniddesa as an important trade and
commerce center . Vanga was within the Gupta empire in the 4th
and 5th centuries A .D .
Mahastan: I t represents one of the ear l i es t c i t y - s i t e s of
Bangladesh and f lour ished during the 2nd century B.C. to 12th
century A.D. Mahasthan lost i t ' s Importance because of po l i t i ca l
and environmental reasons. It decl ined when the Sena Kings shi f ted

43
fO't
M'v Belv/a
vv-v
V-.
Banoarh V ) 9 \
BANGLADESH
A N C I E N T C I T I E S VA NG A flncitnl counlijr
Court* of the ancitnf eraitiosufra — Proboble coufK of lh» Tiito In the
13 Ih century A 0. ® ImporlonI Arehoeoiogicol liif
B A Y OF B E N G A L
Fig. 2 . 1 Rejuan/'88

44
W " A 9'0'
.r I.
Us- ('hjkui-gjon ) ;Ljlmomrhj( S \ VNilphjmjfi)-. '
A .
- 9l2' E
B A N G L A D E S H
A D M I N I S T R A T I V E D I V I S I O N
1991
N
\ Dinjjpur
''Kurigrjm / ,1 N I
Rjngpur V c ^ i
20 ifO 60 SO K.iloTn«tf >
\
^ — ^ ^ ( Ojibandhd
L25-.•A waogjon \
Bogra
\ I Shtrpur S r \
\ Jamalpur ^
I
i ^ Nowabgon \
\.r ^ py ' S \
V '
/ \ \ \
I ^ J
\ Nelrokona \ Sunamgonj
I \
I
S Mymcn$n«ngh f ^
/ S. a/gon; 1 | f" ' Hoblgonj (' N.lorc \ l-'^fl''! I ^ I Ki.hor.gon)
) > \
y I MouUvibJzar -J
Syihel
r
r
A Pabna
• .l,KusMia
' GJi.pu
(WherpGry /
• \ , ^ arsingdi'"
\ A - I
I y •- i&iuadan i
/
2T c
i.
\
( l---' \/ ^ Comllla •. •(Muruhlgonj ^ J \
u
, -V Faridp.' ,
i \ ' ' ' '
/
\ J r- \ Khagrachan !
•|Hill Tfaclj / r- , / S
U2-
N )
(
I Sorguna
1 I )
/ Bhola
1
" sflangamali
}
N
25-
2'J
I I ( \
\
" INDIA f ' ' 7',/
BAKGLAPESHI 10 ;c 30 <0 50 Milts
( Sandarban \ V ! 1
, "s l . i
r-bizi'^-jJ-' V
1 2V
J£1 SIT _il21. Fig.,2.2 juan/8$

45
the i r capi ta l from Mahasthan to Deopara in Rajshahi and later
to Cauda in Malda. The c i ty also dec l ined and suf fered on account
of f l oods in the r i v e r Karotoya.
Paharpur: Paharpur i s another ancient city which f lour ished in
Rajshahi d i s t r i c t in 6th century A .D.
Bes ides the a foresa id large towns there were many small
towns. Bangarh deve loped 30 Km south of Dinajpur d i s t r i c t . Belwa
was ye t another t o w n D i n a j p u r about 25 Km east of H i l i . Hiuen
Tsang has r e f e r r ed to the town of Bhagauangonj . It was to the
southeast of Dinajpur, and f lour ished as a Buddhist re l i g ious
center. Bakla (Bog la ] was a port town of Chandradvipa . It was
f lour ishing during 1 0 - l l t h century A .D . Gokula was a small town
in Mahasthan near Bogra town. In ear l y 14th century A .D. a
f o r t i f i e d town of the Bana Kings has deve loped in Kotivarsavisaya
of Dinajpur and was ca l led Banagram • Mainamati was a monastery
town in west s ide of Comilla d i s t r i c t and f lour ished during the
1 0 - l l t h centuries A .D.
S im i l a r l y , Sonargaon and Savar in Dhaka d i s t r i c t ,
Vikarampur in Munshigonj d i s t r i c t and Chatigram in Chittagong
d i s t r i c t f lour ished on trade and commerce in the p r e -Br i t i sh
pe r i od .
However , most of the ancient towns declined due to
changes in local phys ica l environment l i k e s h i f t in r i v e r courses.

46
f l oods and oth er natural hazards. Sh i f t i s r i v s r coursBS led to
changes in the transportation l inkages. A l l these factors led
to the dec l ine of many human settlements and towns in the ancient
pe r i od .
2.1.2: Urban Centers in Medieval Period
In the 1526 Babar la id the foundation of a lasting Mughal
Emp i r e . In the recorded h is tory of Bengal, Mugal ru le has been
marked by the sponteneous reoccupation of abandoned lands by
the people moving east wards into Bangladesh. The movement was
easy through in r i v e r s , hence a number of urban centers developed
along them. The growth as we l l as the r e v i v a l of towns were
maximum during the peaceful and tolerant rule of Akbar the Great.
More towns were found by or under him than in the reign of any
other ruler (Prasad, 1939).
Subsequently, at the beginning of the Br i t i sh rule, about
40 to 50 pe r cent of the total area of Bengal (un- d i v i d e d ) was
only set t led and the rest was mainly under f o res t cover and
marshes. The urban centers were v e r y few and far between
(E lah i , 1985). The proport ion of town dwe l l e r s was v e r y small.
Industry, intra-reg ional surface transportation and' communication
were v e r y poor. The exist ing towns were e i the r administrat ive
with some commercial a c t i v i t y and f a c i l i t i e s of r i v e r transport.
They also acted as a s e r v i c e centers of a vast hinterland of raw

47
materials to the Hoogly - Calcutta industr ia l area. This area was
being deve lop by the Br i t i sh by local c ap i t a l i s t i c patronages into
an industr ia l area (Rashid , 1977). The resul t was that the total
number of towns were less than 20 in the end of 19th century.
Most of those were administrat ive and having rural
character is t i cs . The urban population percentage v/as less than
2 (Chowdhury, 1980).
2 .1 .3 : Urbanization in the Modem Period
The modern phase of Bangladesh h i s t o r y begins from the
beginning of 19th century when the area came d i r ec t l y or
ind i r e c t l y under the command of Br i t i sh ru le . The Br i t ish rule
in Bangladesh changed the po l i t i c a l , soc ia l , economic ond
demographic set up of the country. Th i s resulted in changes in
urban centers:
a. the status of ex ist ing towns as co l l ec t ing , export ing or trade
center was extended;
b. they were used for administra ive purooses to suit the
colonial needs, and
c . expansion of urbanization gained momentum with the
establ ishment and expansion of ra i lway network .
Consequently, the towns become the centers of colonial
economy and administration rather than the result of

48
socio-economic development through an internal process of evolution
of the area i t s e l f . Th is stands in sharp contrast to the post
industr ial urban development in the European countries.
The per iod of Br i t i sh rule i s d ist inct in many respects .
Under the Br i t i sh crown, many material and cultural changes took
p lace . There was an ove ra l l development of roads , ra i lways and
r i v e r navigation which maximised the exp lo i ta t ion and col lect ion
of raw mater ia ls and d i s t r ibut i on of f in ished products and coiiniodities.
Development of agriculture and i r r igat ion took p lace. With the
development of agriculture and agrarian raw material base
urban centers deve loped .
Some of the ancient and most of the medieval centers
started developing in terms of population, s i z e and area. During
this per iod , Chittagong, Dhaka and Khulna have deve loped as
trade and administrat ive centers.
Undoubtedly, there occurred a number of po l i t i ca l ,
economic and cultural changes, which act i va ted the centri fugal
and centr ipetal forces responsib le f o r the growth of the towns.
Some of the factors which stimulated the growth of the towns,
were the development of
i . Cantonments
i i . Administrat ive headquarters
i i i . Churches and Chapels

49
i v . Other Publ ic and Cultural Institutions
V. Rai lways and roads
v i . Housing colonies
v i i . Publ ic U t i l i t y Serx'ices
v i i i . Industr ies
The s i tes of Br i t i sh cantonment p layed an important ro l e
in the growth and development of towns. These sites not only
he lped the growth of the Jessore town, but was also responsib le
f o r the or ig in of the new town l ike - Jhinaidah.
Moreover , a considerable areal growth was reg is tered
by the towns when they were e i the r se lected as the d is t r i c t head-
quarters , by the Br i t i sh Government e . g . , Dhaka, Mymensingh,
Sylhet e tc . or as subdivision headquarters, e . g . , Manikganj,
Mushiganj, Narshingdi , Rajbari e t c . A good number of urban
centers grew during the Br i t i sh per iod as a d is t r i c t or
subdiv is ion headquarters .
Among other factors the part p layed by churches,and
chapels v.erc of great importance. The establishment of the Roman
Cathedral Churches and chapels la te r gave b i r th to the clonies
of the Christ ians. The Christian l oca l i t i es of Dhaka, Saidour in
RangDur d i s t r i c t , e tc . occupv qv i te a cons iderable area .
The most important phase of town's growth was that when
thev were g iven the status of corporat ion, municipal board.
50
not i f i ed area and town area, mostly during 1863-1878. In prov id ing
them th is status, conditions were created f o r developing urban
infrastructure and se rv i c es and thus f o r consideration and growth
of urbanizat ion. In the process a la rge number of v i l l ages , came
under towns area such as 17 d i s t r i c t s headquarters , l ike-Dhaka,
Chittagong, Khulna, Sy lhet , Mymensingh, Jessore, Kushtia, Pabna,
Bogra, Rangpur, Dinajpur, Comilla, Bar isa l , Noakhali , Chittagong
Hil l Tracts , Rajshahi and Far idour .
The network of ra i lwavs , and road , revolut ionized the
l i f e of the towns and introduced the urban dynamism in the inflow
and outf low of the t r a f f i c and trade of the towns. The net work
of the ra i lways which spread in late 19th centurv, had
cons iderable impact on the cultural landscapes of some of the
towns, e . g . , Dhaka, Chittagong, Mymenshing, Rajshahi , Natore,
Ishurdi , Kushtia, Jessore, Khulna, Sy lhe t , Ashuganj, Laksham,
Feni, e tc . The ra i lway stations were genera l l y built away from
town centers which induced growth in the outlying areas. It was
near the stations that the ra i lway colonies sprang UD which later-
on became parts of the towns. Such ra i lway colonies developed
near the Kamal^pur area in Dhaka and Paharta l i in Chittagong
and are examples of the urban dynamici caused by Ra i lway .
L ike ra i lway , the roads were no less important in the
areal expansion of the towns. It may be s i gn i f i cant ly noted that
the nodal situation of the towns l i k e that of Rangour, Bogra,
51
Jamalpur, Mymensingh, Pabna, Jessore, Dhaka, Sylhet, Comilla,
Feni and Chittagong created by the radiating roads was the raison
d ' e t re of or ig in as wel l as the growth of the towns.
Introduction of p r i va te buses on the roads had started from
beginning of the Pakistan per iod and i t modif ied the towns'
landscapes b y the establishment of the 'Bus Stat ions ' . These bus
stations generated growth round them. Such was the case in
Saidabad, Gabtol i , Mohakhali and Dhaka where bus stations have
cons iderab ly increased the metropolitan geographical area. Bus
station generated the centrifugal fo rces , which attracted quite
a la rge number of tea s ta l ls , hote ls , restaurants, o f f i c e s and
workshops which in their turn caused further urban growth.
Steamer Ghats (harbour) and A i rpor t s also played a v i ta l ro le
in urban expansion. Naravansanj and Badamtoli in Dhaka, S ira jgonj
in Pabna and Barisal steamer ghat did contribute to urban
expansion. New Zia International A i rpor t of Dhaka is the recent
instance of urban growth dynamism in Bangladesh.
Now-a-days, the vacant spaces of the urban areas have
begun to disappear fast bv the establishment of educational
inst i tut ions, banks, clubs, etc. Schools and co l leges are general ly
located out s ide the congested parts of the towns due to the
a v a i l a b i l i t y of adequate soaces. These educational institutions
have a lways worked as the centr i fugal forces in the areal
expansion as we l l as in f i l l ing the open spaces. The part p layed
52
by the Jahangir Nagar Univers i ty in Savar, Islamic Univers i ty
in Santidanga of Jessore, Agricultural Univers i ty in Mymensingh,
Chittagong Univers i ty and i t ' s a f f i l i a t e d col leges i s quite
s ign i f i cant . In addit ion to these, housing schemes and refugee
colonies have also he lped the increase of the built up areas.
The re fugee colonies have been the character is t i c features of the
big town l i k e - Dhaka, Khulna etc . The housing schemes taken
up by the government and p r i va t e bodies have been quite
s igni f icant in the planned expan,'5ion of the urban areas. Among
Ihe housing schemes mention can be made of the new urban
settlement of western s ide of Mohammadpur and Mirpur, Northern
part of Tongi Municipal Area and eastern s ide of Gulsan of Dh^ka.
In a l l these cases there was an over a l l urbanization and
expansion urban landscape. Bangladesh House Building Finance
Corporation (BHBFC) has been financing the government a.oproved
housing soc ie ty a l l o v e r the country.
Furthar, the increasing public ut i l i t y s e r v i c es , e . g . ,
water supply , sewarege, sanitation and e l e c t r i c i t y , have been
respons ib le f o r the growth of urban centers both in area and
population. The industr ial development has also played a very
s igni f icant ro l e in tho areal spread of urban centers. Ta jgonj
industr ia l area in Dhaka, eastern r e f ine ry in Chittagong,
Khol ishpur industrial zone in Khulna are examples of urban growth
result ing from industrial a c t i v i t y .

53
In general , ea r l i e r growth of urban centers was the
outcome of ' p o l y nuclear expansion' and the la te r growth took
p lace under the process of accret ion. The g rowth of towns, thus,
i s essent ia l ly the result of the dual act ion of the centripetal
and the centr i fugal fo rces . Cit ies or ig inate at the i r most
convenient point of contact with the outer wor ld and grow ilong
the l ines of least resistance. Growth in c i t i e s consists of
movement away from the point of o r ig in in a l l d i rect ions , except
where topography h inders i t , this movement being due both
to aggregation at the edges and pressure from the center (Berry ,
1970). This ho lds good for towns of R^ngiadesh a l co .
2.2 FACTORS OF URBAN DYNAMICS
Urban dynamics of a part icular area e v o l v e s through the
in terp lay of phys i ca l , demographic, social and economic conditions
of the area during a part icular time span.
Phys ica l factors l ike , s i te and situation, location,
environmental condit ions, prov is ions of water bodies and climatic
condition of a places are playing an important ro le in urban
dynamics. Phys ica l factors play an important ro le in the
horizontal expansion, form and structure and shape of urban ^reas.
Demographic factors l i ke - natural increase of population,
net migration, dependency rat io , sex composit ion, age structure,

54
occupational structure, are among the bas ic components of urban
dynamics (NIUA, 1988).
Social factors and economic status, are also importan:
fac tors in the urban dyai^mics, they operate through technolog-.-
a va i l ab l e and through the economic structure of the area . Social
institutions are v e r y mu::h a part of urban dynamics. Moreover ,
socia l conditiDTis -wYiich iTiclutie tra:1ition, customs, re l ig ior i .
segregat ion, po l i t i ca l ideas inf luence Ihe growth and developmen:
of r e l i g ious , cultural .and admin is t ra t i ve towns.
Urban dyanmics i s a lso v e r y much associated with the
s i ze o f towns, the i r adminis t rat ive status, functions, locatior.
in respect of road and r a i l , structure of towns, l e v e l of
urbanization, spacing of towns and agricultural p roduc t i v i t y of
areas of the i r hinterland. Population i s an important component
in urban dyanmics. I d ea l l y , the population of the urban area
grows through immigration in response to a growing economy. This
population has to be housed and p rov ided with other amenities
and th i s means that the phys ica l extent of the town has to expand
" in one direct ion or another - up, down, or from the center
outward" ( P h i l i p and Rees, 1979).
Moreover , the exact pattern of urban dyanmics that
mater ia l i zes in a community i s the result of manv ind iv idua l
dec is ions and factors - a manufacturer dec ides where the plant

55
wi l l be setup, a merchant dec ides what t ype of store can be
stabl ished, a government agency dec ides where to re locate, a
fami ly decides where to rent or buy a house with the better
f a c i l i t i e s . The f ina l decision in a l l such cases depends upon the
al ternat ives a va i l ab l e at any given time (Voorhees , 1970).
In decis ion making, may other factors operate . A family
V i i i examine t ype , s ize and kind of house, f inancial cost,
neighbour - hood amenities, distance of the s tores and educational
institutions, job opportunity , and other s e r v i c e s and f a c i l i t i e s .
2.3 URBAN POPULATION DYNAMICS AND IT 'S IMPLICATIONS:
Many factors influence urban population growth and its
components. Many demographic and socio-economic var iab les are
lo t independent of each other . This requires care fu l examination
of the relat ion between dependent va r iab l es and the explanatory
var iab les on the basis of log ical and empir ica l e v idence .
However, the wave of urban population dynamics neither
occurs at a uniform rate nor it shows the same pattern of
distr ibution throughout the country. I t i s neve r an even process
an i the rate has undergone changes ( p o s i t i v e o r negat ive ) from
time to time with relat ion to socio-economic and demographic,
push and oul l factors .
-Factors of urban population growth ( p o s i t i v e or negat ive ) for the d i f f e rent censuses per iods since 1901 has been discussed by the author in h i s M .Ph i l , dissertat ion pages 63-95.

3 r-l O CO S-I CO-
c g a X
CO m Pi w
0
(D s C CD c n
t-i c
•(- ( £ c (J 0 L, •rH CD CD CX U -D .—f CD C
CD CD
> C CD +-»
0
C C
CO
D C. o CL
CD
c CO JD U t=>
CO o H
s D Di
CO
C CD n
CD 4-» o £-
w Z3 W W tn g s u >
o o o o CD
CO o;
uo CO
n r
I> CO
o o o oo CO
o o o lO o
o o o CO in o
rO LO
CD
o o o CO
o 0-3
o „
CO
o o o o o (N CO
0 0 ^—~ 0 0 '—•
0 ro 0 LO 0 - 0 m 0 CO
CSI • • •
0 r-- C<1 CO l> •—• 0 • — ' 0 ' — '
CO CO
c 0 0 0 0 0 0 0 0 _ «>
CN: 00 CI 0 CO CO (N
-
CO ro r ro ro
1-1 0 T—1 -J)
r-i
CO CO 10
o o ro CO
oo CO ts
o „
CM <M
0 0 •—•
0 CO TH 0
CO • 0 CO 0 T-l ^
^— ' CO CO CM
CO O
O O O
in
CO
o o O ro LO LO ro
CO CD
O O O r-CD cn
CD
O o o o ro O csi
m en
o o o
CO CO
o in
to CTJ
o o o
m
o cn
rH CD
LO 0 05 CO in CM l> CO 0 in CD 0 CD cn 0 (N 00 TH ro to 0
rH
ro 00 in 0 CM CS3 CO 10 CO CD 0 CD CD ro 0 0 TH 0 rH CM CS!
0 C 0 0 0 0 0 0 0 0 0 0 0 0 '—^ 0 0 00 0 ^—. 0 , • 0 •—•
CO CT) CO 0 CM 0 cn (N •• 0 to 0 in 00 rH • 0 CD 00 CD m rH Irt i c • aj [> > 00 • <T> * ro •
in in 0 CO CD T-l 0 0 in 0 00 ^^—' ^ — ' m 1 - rH CD ro - rH
r-H csi in c ^ — ' CO rH — ' CO — '
0 0 ^—^ ,—, / s — » 0 /—. 0 •—»
CO 0 , s 0 TH 0 0 TH 0 rH 0 CO 0 cn 0 05 0 r<i 0 CM 0 0 rH r- in - CO
0 0 0 • 0 • 0 • 0 • 00 • in •
<< - CSI ro CX3 m OO LO 0 rH x-H CO in (M 0 ro T-( rH CD 00 CT: rH > • r- CD 00 CO — ' CO ' — ' rH - rH
TH CO ro •—• CD •—•
0 0 0 0
' — • 0 '—^ 0 • •
CD 00 LO 0 CSI cn CD
• • 00 •
rH in 0 CO rH C<1 CM ' — 0'
CM — ' in
rH ' — '
0 0 0 0 0 0 0 0 0 0 0 0 0 0 0 0 0 0 0" 0 0' 0 0 0 t> CD rH CO rH
CM CSI rH CD w w •• —
0 0 CO m 00 CO CD
0 0 0 0 0 0 0 0 0 0 0 0 0 0 ' — - 0 ' — ' 0 ' — - 0 0 CM CD ro CJ) * s CO CO ro 0 0 to 0" 00 rH rH CO CSI rH 0 • ro • CSI • * r- r- CO •
0 00 LO CO CO to m CSI LO % < • ' * • - - CO 00 rH
rH rH rH CSI CD rH
o o o CO ro
C--CO
CO CT) rH
c o
• r - l 4—' CO I—t D a o D-
x: CO o •a CD I—I CC' c CO CQ
x: CO
56
0 •a rH CO rH 1—1 CO . c CO Q. ca Cw CO 0 CD rH
_ > ra 0 a 0 < CO c C3 •P £3 C (H c a f-H c- c 0
•w 0 LI 0
>, a 0 4-1 K CO •H c •a •a c CO
CO 00 CO m EQ
D,
o s >
Cfl a
CO 2
cyo a
i s
CQ u o
JC « ^ o c: CD CO -I D CO CO c c CO (D cn o
o u u 3

57
Rannants of the ext inct urban centers of Bangladesh speak
of a long h is tory of urban population dynamics. Pundra, Vagna,
Mahasthan, ^4ainamati etc . ( F i g . 2 .1 ) a r e examples of ruined urban
centers of the country and of the demographic changes. But
modern urbanization process has started late in h i s to ry . From
table 2.1 which shows the urban, rural and national growth
var iat ions of population, i t can be noted that urban population as
compared to rural has increased fast during the recent decades.
The urban-rural corre lat ion coe f f i c ient ( r = 0.75) is expressing a
v e r y h igh degree of pos i t i v e corre lat ion, the degree of coef f ic ient
of determination being 56 per cent and it is s tat is t ica l ly
s igni f icant a lso. A comparative growth of urban and rural
population may be seen in the regress ion equation of f igure 2.3
(A and B ) . The fact i s that the high rate of urban populatioin
growth has been achieved mostly by rural-urban migration.
2.3.1: Growth Trends
Table 2.1 shows the intercensi^ l growth rate of urban,
rural and national population from 1901-1981. During the last 80
years (1901-81) the urban population of country has increased from
0.70 mi l l ions to 13.23 mil l ions. The increase rate was 1790 per
cent. The table also shows the total urban population with i ts
decadal variat ion and this r evea l s , notwithstanding some
intercensual f luctuations, that growth has been accelerated tho urban
pcpulaticn. Except in the decade 194J-51 which reg i s t e red a decl ining trend.

58
GROWTH OF POPULAT ION IN BANGLADESH
13
12
n
in 10 z: o
2
z
z o
3 Q. o a.
9
8-
7-
6
5
i+-
3
2
1
URBAN
Qi— 1901
_L I / I I I
Millions
100
90
80
70
60
50!
t+0
30
20
1 0 ,
J 0
R U R A L
r = +0.71
1911 1921 1931 19M 1951 1961 1971+ igei 1991 1901 '11 "21 '31 "W "51 '61 Ik '81
Y E A R S
Fig. 2.3 A Fig. 2."3 B - '
Re juan /^O

59
there has been an ove ra l l increase in the urban population. The
trend of growth can be d i v ided into two p e r i ods .
i . F i rs t hal f of the twentieth century (1901-1951).
i i . Latter hal f of the Twentieth century (1951-1981).
The First half of the Twenthieth Century (1901-1951): At the
beg inn ing o f t h e century a very low p e r c en t of the total
population l i v e d in urban areas which remained stagnant t i l l 1931
but s l i gh t urban growth has been found in 1931-41 decade. Again
1951 census shows the decreasing ra te of urban growth. The census
years 1911, 1921 and 1931 reg i s t e red v e r y low growth of urban
population, i t was 1.39 per cent, 0.85 per cent and 2.00 per cent
r e s p e c t i v e l y , whereas in 1941 a small increase of 3.59 per cent
was r eg i s t e r ed . The sudden f a l l has been found in 1951 census.
The urban growth rate was only 1.68 pe r cent.
For the f i r s t two decades, the country was ent i re ly
agr iculture based on there was no industr ia l a c t i v i t y . There was
meagre development of transportation. A l l th i s prosed to be great
handicap to urban growth. They were no important markets e i the r .
Rural to urban migration was of small magnitude (Zachariah, 1964),
except in case of Dhaka c i t y , which was l a rge enough to attract
s e r v i c e personnel from i ts hinter land. The natural increase of
urban population was also c lose to the ze ro l e v e l as high b i r th
rates were being cancellcd by equal ly high death rates.

60
However, the f a l l in urban population during these two
decades was due to h e a v y to l l of l i f e taken by plague in 1904
(Mishra, 1970), cholera epidemies during 1905-8 (Dav is , 1951)
and malaria in 1908 (Chr i s topher , 1911). Infact the whole of the
Indian subcontinent su f f e red by the natural calamit ies (Ghurye,
1962). Urban population started recover ing a f t e r 1921, There was
a l i t t l e gain of 22.2 pe r cent during 1921-31, and 43.2 per cent
by 1941 census.
Migration p layed a v e r y v i t a l ro le in the phenomenal
growth of urban population during subsequent two decades (1931
and 1941). The towns of the country exer ted greater pul l owing
to the i r access ib i l i t y by both ra i lway and road connection, and
the employment opportunit ies due to opening of some new o f f i c e s
jn the d is t r i c t headquaters further strengthened th is pul l . The
rural-urban migration emerged as a stronger fac tor during 1931-
1941. Small and medium scale industries (Dav i s , 1951), also
re in forced migrations.
Latter half of the Twentieth Century (1951-1981): According to
1961 census, an urban area i s that which includes - municipal i ty ,
c i v i l l ines, cantonment and any continuous co l lect ion of houses
inhabited by not less than 5,000 persons. In addi t ion, they should
meet the fol lowing condit ions:
i . areas having town committees;

61
i i . cocentration of population in a continuous col lect ion of
houses where the community maintains public u t i l i t i es
such as roads, s t ree t l i ght ing , vvaier supp ly , sanitary
arrangements, e t c . ;
i i i . urban centers having population character ized by high
l i t e racy rate .
But in 1981 census, Government of Bangladesh modi f ied
the urban def ination of 1961. The present de f in i t ion of urban area
includes places having municipality (Paurashava ) , a Town
Committee (Shahar committee) or a Cantonment Board. Under normal o
c r i t e r i a , an urban area must have a concentration of population
of at least 5,000 persons in continuous col lecr ion of houses where
the community sense is we l l deve loped and the area i s p rov ided
with publ ic u t i l i t i e s such as, roads, supply of e l e c t r i c i t y , s treet
l i gh t , water supply , sanitary arrangement, e tc . An area which
maintains urban character is t ics but has a population of l ess than
5,000 but has ' thana ( p o l i c e ) head quar te rs ' may also be treated
as an urban area. Moreover , some growth centers l i k e places of
trade and commercial importance, hats/bazars were a lso treated
as urban.
As a consequence of th is new def in i t ion of 1981, the
number of town increased to 492 (Rejuon, 1988). The percentage
of urban population was 5.19 during the decade 1951-1961. The

62
rate of urban growth increased during the per iod 1951-61 and
continued growing t i l l 1961-74.- During 1951 to 1961 there was a
45.11 per cent increase in urban population compared to the
prev ious d e cade ' s 18.41 per cent. Subsequently, the urban
population increase upto 8.78 per cent in 1961-74 with compared
to 5.19 in 1951-61. Urban population was 15.18 per cent during
1974-81. In las t two census per iods urban population increased
due to s l i ght improved health and sani tary codit ions and changing
cultural landscape of the towns by the introduction of water
supply , e l e c t r i f i ca t i on and educational f a c i l i t i e s . On the whole ,
there ex i s t s a pos i t i v e corre lat ionship of high degree between
the l inear regress ion, i . e . least square f i t and the actual growth
trend of urban population and the coe f f i c i en t of correlat ion being
r = + 0.86 ( F i g . 2.3 B ) . Moreover , the re la t ionship in the growth
of urban and total population of the country has been plot ted
on the scatter diagram ( F i g . 2 .4 ) .
The tab le 2.1 also shows the fluctuating character of
urban population in d i f f e r en t census pe r i ods . The growtth rate
fluctuated between a minimum of 0.85 pe r cent per annum in 1911-21
and a maximum 10.97 per cent in 1974-1981 per iod. Urban
population has been r ap id l y growing o v e r the years with the
except ion of the decades 1901-11, 1911-21 and 1941-1951. The
devastating Bengal Famine, Second World War and the part i t ion
of India in the 1940s may expla in the s lower growth of urban

63
R E L A T I O N OF T O T A L AND U R B A N
POPULATION G R O W T H , 1 9 0 1 - 1 9 8 1
c
t/i c o
121
10
8
V 6 Z
c
c o -t-* ro
Q. O CL
0 ' 10 20 30 i+O 50 60 70 80 90 100
Population in Mil l ions ( T o t a l )
F i g . 2 . if R e j u a n / ' 9 0

64
population in the decade 1941-1951. Consequently, there was a
v e r y low urban growth. In addit ion to above factors , the Br i t ish
per iod as such was noted f o r a de l ibe ra te po l i c y of the colonial
government to destroy subpress and even indigenous industries
and to build up massive indust r ia l ' commerc ia l agglomeration around
Calcutta ( I n d i a ) , which v i r tua l l y turned the whole of Bangladesh
into a raw material producing hinter land. The urban population
i s growing consistently at a fas ter rate than the rural population
since 1901. Th is d i spar i t y in growth rates further widened in
1951-61, 1961-74 and 1974-81 censuses. During 1951 to 1961 decade
there was an increase of 45.11 per cent in urban population.
Between 1961-74, the urban population grew at an average annual
rate ( exponent ia l ) of 6.62 per cent, wh i l e rural population grew
by 2.33 per cent. Again, urban growth rate was 10.97 oe r cent
and rural growth rate was 1.91 per cent during 1974-81 pe r i od .
Table 2.1 revea l s that the l e v e l of urban growth in
Bangladesh as measured bv per cent of total population l iv ing
in urban areas increased from 2.43 per cent in 1901 to 15.54 oe r
cent in 1981, a more than s i x fo ld increase . Certain developments
did take place that brought about th is t rend. A s i zeable migration
took place from rural to urban areas during 1951-1961. Bangladesh
urban population increased from 2.64 mil l ion in 1961 to 6.27
mil l ion in 1974 representing a growth of 137.57 per cent as
compared to 45.11 per cent during 1951-1961. An absolute increase

65
of 3.43 mil l ion during 1961-1974 was the second biggest urban
gain f o r any decade since 1901. The proDortion of urban population
in the tota l , however , rose by 3.59 per cent (5.19 per cent in
1961 and 8.78 per cent in 1974) in 1961 to 1974 per iod .
During 1961-1974, there was f a l l in death rate from 29.7
per thousand per annum, whi l e b i r th rate s l i gh t l y increased from
47.0 to 49.9 (BBS, 1986). I t gave a natural increase rate of 3.07
per cent per year , or of near ly 40 per cent during the pe r i od .
Actual growth rate of urban population being 137.57 per cent,
the natural increase was estimated to have contributed near about
one-th irds of the urban growth during 1961-1974.
Rural-urban migration accounting for about two - th i rd of
the urban growth invo l ved 2.42 mil l ion persons. This number was
double of that during the last decade. The increased intensity
of push factors in rural areas combined with the pull exer ted
by urban areas generated these urban ward migrations. Gradual
decreasing s i z e of agr icultural land holding was one of the v i t a l
Factor f o r rural-urban migration. Average s ize of land holdings
became uneconomical a decreased from 0.30 hectares in 1961 to
0.20 hectares in 1974 rendering more of agricultural population
surplus, easpec la l l y among small land holders who constituted
the bulk of peasantry.

66
Annual b i r th rate had decl ined from 49.9 to 34.6 and
death rate from 19.4 to 11.5 per thousand during 1974 to 1981
(BBS, 1986). So the natural growth rate was about 23 per thousand
per annum, or more than 20 per cent during the whole pe r i od .
The actual growth of urban population being 110.57 pe r cent, the
natural increase was deemed to have contributed, more than one-
f i f t h of the urban growth and res t f o u r - f i f t h of total growth rate
came through migration. So the rural - urban migration p layed a
v i t a l role in accelerating the urban growth during 1974-81.
There were some notable fac tors of urban growth during
1961-1974 and 1974 to 1981, spec ia l l y the per iod 1974-81,
emoloyment opportunit ies generated by te r t ia ry and secondary
sectors was an important f ac to r . A bulk of rural-urban migrants
entered the urban informal sectors , and engaged themselves in
pet ty reta i l ing, r ickshaw pul l ing, po r t e r i e s e tc .
Moreover , gradual abol ishing of jajmani system ( Jajmani
system is that the people use to pay paddy or any food grain
to the cobb lers , barbers , e tc . for the i r se rv i ces instead of
currency) is one of the major cause f o r rural to urban migration
during these per iod (1961-1974 and 1974-1981). Under the jajmani
system many v i l l a g e pr i es ts , barbers , carpenters, cobb l e r s , e tc .
were surv iv ing but now they could not be absorbed in the i r
ancestral occupation, and many of them had to move in to urban
areas for employment.

67
Some industr ia l develooment during the 1960s and 1970s,
and the emergence of Bangladesh as an independent country p layed
an important ro le in urban growth. The abrupt and dynamic
changes which fo l l owed the v i o l e n t po l i t i ca l change in 1971 had
the i r impact on urban growth and development. The high rate
of in f lat ion (Bose, 1973) in post l ibera ted Bangladesh, a va i l ab i l i t y
of statutory rationing in the major c i t i e s , deter iorat ing law and
order situation in the rural areas and wage d i spar i t i es between
rural and urban reas (A lamgir , 1974) may have dr i f t ed large
number of people from rural to urban areas (Chowdhury, et a l .
1976).
0
Higher rate of rural education also moved peoo le to towns
for employment. The v i l l a g e soc ie ty wanted i t s educated young
man to manage a respectab le job in the urban areas.
In the second and third f i v e y ea r plans industr ial izat ion
rece i ved a great f i l l i p . Agrobased industr ies with the he lp of
foreign investment and indigenous raw material technology
deve loned throuohout the country. Some of the new industr ies
were establ ished in d i f f e r en t urban areas.
Expansion of adminis t rat ive machinery also created new
employment opportunity in newly designated d i s t r i c t and upazi l la
headquaters al l through the cotmtry and thus speeded up
nrbanizatinn.

68
Af ter the new def ination of urban areas, 384 new urban
centers of f o u r - f i f t h of total ' urban centers were r eg i s t e r ed a l l
o v e r the country in 1981 census. Present ly there are 492 urban
centers. So, the spurt in urban growth during last two census
were a cumulative product of rural-urban migration, natural
increase, emergence of new towns through modi f ied de f in i t ion of
towns and extension of the t e r r i t o r i a l I'uridiction of many existing
tov/ns of the country. The area of urban settlements had notably
increased from 1807 sq . km in 1974 to 5234 s q . k m . in 1981
':ensus.
2.4 GROWTH OF URBAN SETTLEMENTS IN niFFERENT SIZE-CLASS
(1901-1981):
On the basis of 1981 census, 492 urban centers have been
i d en t i f i ed . The largest urban center is Dhaka Statist ical
Metroool i t ian Area (SMA) with a total pnoulatinn of 3,440,0nn,
wh i l e the smallest urban center i s Barkal Thana Headquarter with
only 76fi persons in 1981 . These extreme examples conceal the
real oictMre. Thus to v i sua l i z e the true picture, urban centers
have beai grouped into a number of c lasses according to their
s i z e . The distributional pattern of these towns va r i e s from random
to uniform.
2.4.1: Size and Distribution of Urban Centers
According to s i z e , the towns have been c l a s s i f i e d into
s i x c lasses. Which have been adoptted by the census commission

69
of Bangladesh. The fo l lowing table 2.2 shows the number of urban
centers in d i f f e rent c lasses in the var ious census years since 1901.
Table 2 .2 : Number of Towns in Different Classes During 1901-1981
Classes of Towns
1901 1911 1921 1931 1941 1951 1961 1974 1981
Class I 2 2 2 2 2 2 4 6 13
Class I I - - - - 2 2 5 14 23
Class I I I - - 5 7 13 14 16 23 45
Class IV 21 23 20 21 20 20 23 49 114
Class V 15 13 13 17 19 18 20 12 129
Class VI 10 10 10 11 3 7 10 4 168
A l l Classes 48 48 90 58 59 63 78 108 492
Source: BBS (1987), Report on Urban Area: Bangladesh Population Census 1981, GOB, p. 15.
It emerges from the table that urban centers in Bangladesh
are d istr ibutted asymmetr ica l ly under d i f f e r en t s i ze c lasses , and
the urban centers began to f lour ish at a fas te r rate from 1961.
Number of urban centers remained almost stat ic during the per iod
1901 to 1951 when only 15 new centers were deve l oped . The
increase rate was 31 p e r cent. But the number of urban centers
began to increase s i gn i f i cant ly from 1961. There number increased
from 78 in 1961 to 108 in 1974 and 492 in 1981.
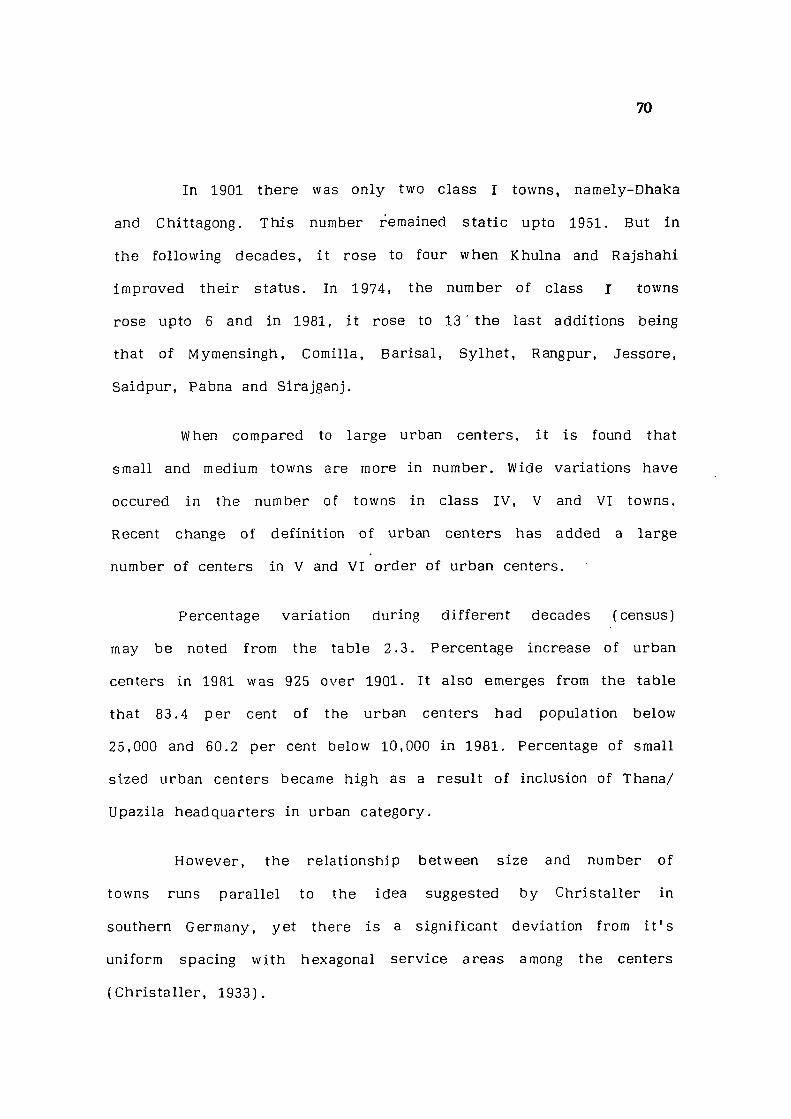
70
In 1901 there was only two c lass I towns, namely-Dhaka
and Chittagong. Th is number remained s ta t ic upto 1951. But in
the fo l lowing decades, i t rose to four when Khulna and Rajshahi
improved the i r status. In 1974, the number of class I towns
rose upto 6 and in 1981, i t rose to 13 ' the last addit ions being
that of Mymensingh, Comilla, Bar isa l , Sy lhe t , Rangpur, Jessore,
Saidpur, Pabna and S i ra jganj .
When compared to l a rge urban centers , i t i s found that
small and medium towns are more in number. Wide variat ions have
occured in the number of towns in c lass IV, V and VI towns.
Recent change of de f in i t ion of urban centers has added a la rge
number of centers in V and VI order of urban centers.
Percentage variat ion during d i f f e r en t decades (census)
may be noted from the table 2 .3 . Percentage increase of urban
centers in 1981 was 925 over 1901. It also emerges from the table
that 83.4 per cent of the urban centers had population below
25,000 and 60.2 per cent below 10,000 in 1981. Percentage of small
s ized urban centers became high as a result of inclusion of Thana/
Upazila headquarters in urban category .
However , the re lat ionship between s i z e and number of
towns runs para l l e l to the idea suggested by Chr is ta l l e r in
southern Germany, ye t there i s a s igni f icant deviat ion from i t ' s
uniform spacing with hexagonal s e r v i c e areas among the centers
(Chr i s t a l l e r , 1933).

m
CO C75
I> 05
CD CD tH
LO CT)
CD
ro CD
CN] O)
o 03
(D N cn
w w cts .—I O
CM CM O CM a> ro CD
CM CM CO
CO CO CT) ,—. • • o LD
I> c-g ro ID 1 o t> TH CM 00 CM rH
O LO o CO o CO • • • O O
ID ro O UT rW fO O TH T-l CM ^ TH ^
O TH LD u-j CD CO •
• • • o CO m CO O cn LD (N o o
CM rg CM — ' TH •—•
CM CM CO O CD ro ro (M CO
CO CM
o CT) CM oo CO CM n CO
00 ro ro
1 tH CM oo o ro CM CD cn O)
T—1 ro CM iH
O 1 O O o CO o O CD O TH CM CO
rsi 1 CD O) 00 t> o
CM OJ
00 1 00 CM CO ^ ro TH CD
ro CM
1—t t-H t-H h-1 HH ( 1—1 < > > t/) w tn CO cn cn tn Cfi cn cn w cn CO CO CO CO CO CO r-H .—1 i-H r—i r—t (-H u u o o u u
o ^ • oq o cr> O rH ^
71
o o
o o
o o o
o o o
ro UD
Oi ID
CO lO
o in
O CO o tH
o o
CO
LD T-i
D.
r-OD CT)
CO 4-» o E-
co O)
CD m OQ
Q) 0
1 CD
CO CO a) CO c CO n
u (D £
t3 K CO w cr
CO d CO H DO C -r-l X> i—I o X CD W
3 cn 0 tj >> j-co c e Q) a,
c o
(D •a •o (D •a c Q)
(U tl o •a c D •a (D u CD > o u
CO cr X >« c CO SZ H F 1 CO a u •IH d D E I d o d o w i CO 03 (D •a D ^ U c
m

72
The nearest-neighbour analys is was outlined by Clark and
Evans (1954) and by King (1961) has been employed to examine
the pattern of urban centers in Bangladesh. I t i s based on the
measurement of actual straight l ine distance separating a point
and i t s nearest neighbour point, and comparison of these distances
w i t h that which might be expected of the points distributed in
a random manner within the same area. Comparison can be
measured by the fo l lowing method.
A R
n E r
A V r Where, r = ' -rr- i s the observed mean nearest
N E 1
neighbour distance, r is 2./^ ' expected nearest neighbourhood
distance. Here p denotes the dens i ty of urban centers per unit
area. In an other way it can be measured, i f the mean value f o r
a random dis t r ibut ion, D by apply ing the formula D = 0 . 5 ran t t" j' & ran yA/N
Where, N = number of urban centers
A = area of Bangladesh (143,998 sq . km . )
The values of R^ ranges from zero (where al l the points
are c lustered together at one p l aces ) to 2.15 (where the points
are as f a r away as poss ib le from each other and, form a regular
hexagonal d i s t r ibu t i on ) . When R^ has a value of one, the
d is tr ibut ion of points is random in nature. Region wise result of
the R s tat is t ics i s shown in Tab l e 2 .4 and pattern of urban n

o c Q) U (D
3 ^ nj ro cx
I z CO •iH
u
U3 q;
c o ® t 2 C 03 •r-i TH T) "O (U o U c ^ " I
«'-S £ .S
w
I L -i W UJ < X3 •H U o -a ^
c ^ o (0
••-I O 0) C (U 1-1 a o
E M
u • (U cr D, u>
iw C £ C o o w E 03 ^ .
< Q c c to .5 CQ ^
o w
a o Z H
c o 0] •iH > Q c o •rH 00 Q) OS
3 OC OS OS <
Ol r-l 05 m O T-l rH CO
CN
(M (M
LO CO ro CM
c u x: u o z
1-1 csi
c u a) s: ^ u 3 O
CNl 00
•SJI CD o CM CS) CSI CO CD LO CO CM CM CM LO
CS) ro 05 •"a* lO •<11 lO CM O o O o s o o o o o o o o o o
rH CO 00 t T-l Csl in 00 O LO ro ro ro
C <U
£ 0) 0) (0
tn O lil IS6I
DS
csi
CJ)
CSI
CO ro O ro
O O O O
CD CT) 05 ro
O CD
x: U1 OJ •o nj r-H 00 §
ff)
D CC K QC <
CO O r-o
o oo
CO CNJ in o o o
c t. Q £
O z
<yi o
CT) tn
ro ro !N (N
CD fO to O o o o o
c
£ 3 o
ro 1>
O csj
o CO (M
LO CO
CO O o o
LO
CO
ro O o O
TH CO CO [ > tH CM m ro o LO ro 00 OO
00 CO 05 ^
ro E
g 03 (0 o u
T96X
CO (M
OO
CSI CM
r-CSJ CJ5 CN
05 [> O O O
00 C75 05
05 CD
S CO 03 X3 (0 ^ OO § m
3 OS PS K <
O ro CD CJ5 o
LO 00
o
CO OO
o CO o o o
cn OO
S £ (U (U
u o 2
CD ro
CO CO CSI ro 00 CD
CJ) 00
l>-00 o O O
O O 05 (M
o LO LO
o o o o
•cji rH OO ro t> rH CM cn C-ro o LO ro 00 OO
LO rji [> lO r-o cs) (NJ i>3
E 03 03 (0 8 U td
f l B l
OS
73 D P 3 < < OS <
ro lO
o
LO CD
CSI CD
O ro CSI O o
O) r-
u o
o ro
rH O
rti O CSI o O
<N
O O o o
rH 00 co r [ > rH CM LO OO O lO 00 OO CO
CJ3 00 00
C C fe i •p. -C
p> <
CSI CO T-l CO LO
(M CO
o
I>
T-i CSI
CSI CO 05 rH CO C75 (M
tH LO
lO 00 CSI CSI o o
CO 05 05 OO
m CSI 00
E 0) 03 C3 3 O U W
T86T
(1) •a CO
00
03

74
centers of 1951, 1961, 1974 and 1981 can be observed in f igures
2.5, 2.6, 2.7 and 2.8 r e spec t i v e l y . Class wise nearest neighbour
pattern is presented in table 2.5.
In Bangladesh, urban centers of d i f f e rent classes have
a random pattern ( t ab l e 2 . 5 ) . The i r R^ values l i e v e r y c loser
to one. So the distr ibutional pattern of urban centers i s random" .
Moreover , their spatial pattern on the map also shows the random
pattern with re ference to roads and ra i lways . An overwhelming
major i ty of the c i t i e s are scattered, based on connect iv i ty ,
throughout the country. So the analysis shows a d irect
relat ionship between urban dynamics and connect iv i ty .
2.4.2: Size and Proportion of Population in Different Classes
The l e v e l of urban growth can be determined by the
distr ibution of urban population at d i f f e rent points of t ime by
s ize classes of urban centers. It appears from the table 2.6 that
in most of the censuses a larger proportion of population were
found in the larger urban centers having population 100,000 and
above . This proportion has been growing at a faster rate from
1961. In 1961 about 46 per cent of the urban population was
reported in th is s ize c lass and the proport ion reached 73.3 per
cent in 1981 for the 77 pourashava (munic ipa l i ty ) . This
- D e t a i l e d technique of nearest neighbour stat is t ics and analysis can be found in M.Ph i l dissertation of the author.

75
•n T T T
f
I \
V J
L-
v..
BANGLADESH
D I S T R I B U T I O N P A T T E R N OF U R B A N C E N T E R S A .
1 9 5 1
0 20 40 60 80 100 , I . I , j
Ki lometers
;• A r
1/ \
INDIA
• Town over 5 ,000 P o p u l a t i o n
9,0° E
^ i g . 2 . 5 R e j u a n / '88

76
BANGLADESH ^ ^ ^ I
D I S T R I B U T I O N P A T T E R N OF URBAN C E N T E R S • ^ A
( f
i
v. .
o
r-
4. \
• (
\ i
. ' / t
1 9 6 1
0 20 kO 60 80 100 ! I . I . I . I . 1
K i l o m e t e r s
e
1 / ) [ \ \ \ • ^ )
J
u (
) s )
S
i
V-V
/ O . f - '
r'
i-v.r-v
c" I N D I A .
) \
1 NDIA
H
\ } \
\
\
V-i
Jown over 5 ,000 P o p u l a t i o n
F i g . 2 . 6 R e j u a n / 1 9 8 8
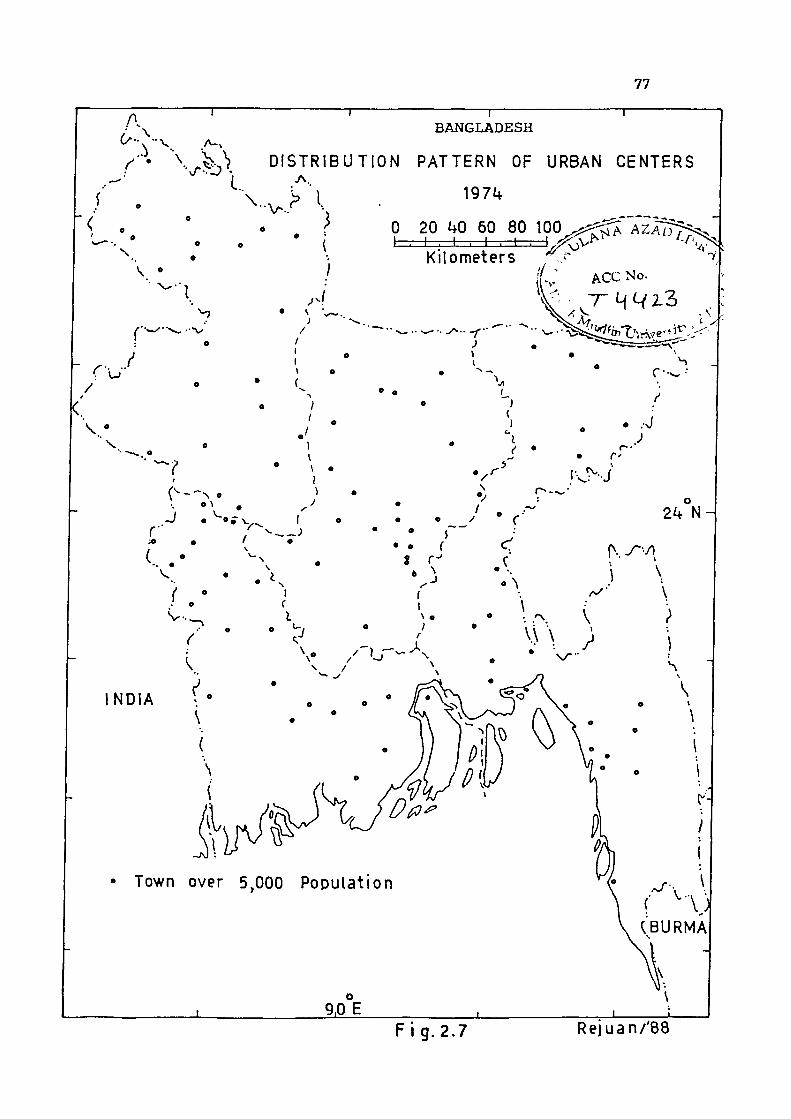
77
BANGLADESH
D I S T R I B U T I O N PATTERN OF URBAN CENTERS I A..
< , I )
N
0 20 kO 60 80 100 t . I . I . I • I
J • s
) /
Kilometers { L ACC No.
r t . / \ •
INDIA
• Town over 5,000 P o p u l a t i o n
9,0°E F i g . 2 . 7 R e j u a n / ' 8 8

78
BANGLADESH
/
DISTRIBUTION PATTERN OF URBAN C E N T E R S
1981 O O v . . !>° V
I . . . -
e
e
» o
• • " I ' .
• - s . . -J a
-o- - ^
C O . - \ O o .1
0 20 kO 60 80 100 1 . I . I . I . I • I
K i l o m e t e r s
• / o • /• o
/ •
V.
• e o e •
a
V
Y e OS
, \ •
r-'
INDIA
• Town over 5,000 P o p u l a t i o n
I 9,0°E
(BURMA
\ F r g . 2 . 8 R e ) u a n / ' 8 8

CD
« O B X a o c s
c s o
cc u c ^ c c CJ c c: jc u
cc •r-K
I
C n x: cc c z
u: c L. s Z
vn CN o S
o c S-I
ro z
c o -t-t cc a
5-. C
QC •H CD Z
< cn f j u
w
(fj d) 03 03 (D Z Cfl
M C
c (B a 05 e c (D •rH Sj -n - " f= ' " S CO
W 13
-a c ^ cd U
•a CD >
o % 0) ° ^
C/) < d3 •rH £-4 •a ' — •
H-r U O CD a
> 4-' t ! c CO
^ E c c • ca CD CT G D CJ C/3
c •f-i c cc o •
t-. CT < Cfl
cn tj o c CO . o c c CD
z ^ o
I-, CD x: 4-1
c CD CJ
o c o CO N n •r-H u r!
cc Di. a
ro CO CO cn o CO ro cn o o rH rH
o rH TH rH rH
CM CO 00 O o CO in CQ r- o CO CM
• • •
CM CT) CO i> CO •
m ro CM rH rH rH l>
rH CO CO cr> CO O 00 ^ ro CM ^
o O CD CO CO o CO ro rH rH rH
CO rH CD O) l> o r-l ro O CO rH o O o o O rH o O o o O O o O o o O O
o O o o O o
CO 00 CO CO 00 CO CD CD CD CD CD CJ) CD CD CD CJi CD
ro ro ro (D ro ro ^ ^
rH rH rH rH rH rH
CD ro ro LO rH CM rH CM rH rH
O) CD CD CD CD CD D ^ C33 CD CT) CD
- - CD CD CD CD E CD pvl -
CD u O o o c •4-' O O O o o O o o o o o o o o O •> o O o LO o -rH lO c-<) rH m
H HH t—( > l-H t-H •-H >
00 CO
o o o
c CD
C/J CO 03 J
79 Pi
lO
m CO CO
CO ^ CO o o
CO 05
ro
CM CD
in CD C/) C/3 CO f—t u
u. o
D <
O u Li 3

CO O) H I
H 0 01 H
M U a> •1-1 s u
€ p
03 u t o 00 C3 •M CO O
W 3 O t ra >
.5 00
.5 >
c o •r( +-I ra 1—1 3 a o Ou
c o T3 o a
e (X,
U3
cs
0) i-H « H
CD •o CO u CP T3 Cfl
w c (V o
c o
CD D D. O a.
CD -f-J o
(D x :
c o
=) a o
o DO CD •i-J c D u
o
CO O)
o CD
CO O)
LO CD
CD
cn CD
CSI CD
CD
O CD
CD N •rH CO
cn (/> CD
U
CD ro CO o CO , • • •
CO i-H rH ro CO IS CNl T-t rH rH CM
ro rH rH un rH
ro ro O 00 o 1 l> rH r-H
CO LO lO CO m ^ CM m CO CO LO rH
LO CS] CSJ rH o LO rH rH rH
CO CO O CO LO CS] CO rH CO LO ro
LO rH O CO rH rH (Nl rH
CD CO ^ ro CSI CO rH CO rH CO
• « • •
^ CO rH r- rH ro CM CM
Ln , ro o rH CO ^ CO 00 O CO m
ro l> CO O OO o cn CM CSI
CSI r-H rH rH 1 CO OO CD
CD TH o ro ro TH ro rH
CSI CO CSI CO ro CO 1 CO rH CSI
ro ^ r- o ro rH 00 rH
uo
m
CO o
CD
O m
O CO CO
1 1 ^ ro ro
ro ro r-l
t—tt—ip^
m CO CD LD ro lO fO T-t
o o o LD ro 00 CD
m o CD 00
CS) CO
to (N r -o CO CSI
ro t> o CD
CM o oo Ln
CD CO ^ CD o
o CO CO r -CO
CSI o o CO
uo ro O cs o t>
c CD
U o
o o o o
o o
o o
o o o
o
o o
o o
o o rM
o o
o o
o o
CD t-H D a o cu
(D CO CD c o o u o
A w 0) •o rH CO 00 §
m
CO CD
cn m CQ
(fl
s g u §
•H
CO I—I fl a o a,
w 03 •a
80
o CO
I-H § ^
m _ tli
. 03 , ^ I 1
J3 r - CO CD H
CD i f ) C ffl .2 CQ ^
CD . z
CM n
. c ^ CD o
o
i3 oi w r-* V CO cu zi >>
° c CO < D C W
" i
- g CD .S rH -f — CO
I—I
° p o cu
03 o u
0) •M c 0 u
c
CD
3
C O
<D •a
CO cu
g 1 U 3
•o O •o C 03 •M X 03
C o •rH CO 3 (—I U c
c o
CO CD
O -rH tJ CD
- I CJ (D X x: 0) J--CO CO -rH -rH
< (0

81
percentage obtained be fo re the appl icat ion of extended de f in i t i on
of urban centers, but the proport ion decreased to only 28.7 a f t e r
the appl icat ion of the new de f in i t i on .
A decreasing trend in the proport ion of population i s seen
in urban centers having population less than 10,000. The
proport ion fo r the s i ze c lass decreased from 18.7 in 1901 to l ess
than 1 per cent in 1981. The f i gure comes to 6.7 i f the new
def in i t ion of urban areas i s app l i ed . A decreasing rate in the
p ropo r t i on of population i s also observed in the categor ies of
urban areas having population of 5,000-25,000. The proport ion
has decl ined from 62 per cent in 1901 to 3.6 per cent in 1981.
In case of new def in i t ion the percentage comes to 20.3. In s i z e
class 50,000 to 99,999 the proport ion, on the other hand, has
increased from 7.43 per cent in 1941 to 13.1 per cent in 1981.
A f t e r the new de f in i t ion, the f igure has decreased to 11.9 per
cent.
It is , there fo re , qui te apparent that the large c i t i e s are
dominating the ove ra l l growth of urban population in Bangladesh,
Dhaka Stat ist ical Metropol itan Area (SMA) alone has accounted fo r
26 per cent of total urban population. A s imi lar pattern of
dominance of the big c i t i es in urban growth i s a lso not iced in
India and Pakistan (Bose, 1978; Helbock, 1975).
The dominance of Dhaka SMA o v e r al l the other urban
centers i s wel l es tab l i shed . It has much greater population than

82
normally expected , exceeding 19 lakh in 1974 and 35 lakh in 1981
census. Over the decade , s eve ra l extra function such as big a i r
port , educational inst i tut ions, d i f f e rent types of .new industr ies
have been added to the c i t y . Fourty per cent of the major
industr ies , have been set-up in the publ ic sector in Dhaka SMA.
It i s found that there i s a c lose l ink between concentration of
industries and urban growth of an area. However , the rank-s i ze
rule i s v e r y poor l y f i t t ed in the case of Bangladesh ( F i g . 2.9
and table 2.7) " ' .
2.5: SPATIAL INTERACTION AND URBAN POPULATION GROWTH BY
REGION
Spatial interact ion p rov ides rec iproca l re lat ions between
f.vo places (Rejuan, 1988). There i s greatest attraction between
Dhaka and Khulna, and next between Dhaka and Chittagong. The
least attraction is between Dhaka and Saidpur and th is i s due
* to the greatest distance ( F i g . 2.10) .
However, spat ia l d is tr ibut ion and urban population growth
are dependent on phys i ca l , cultural, demographic and
socio-economic cor re la tes of the part icular reg ion. In addit ion
to these factors the dominance of the primate c i t y , exp la ins the
Note: Detail appl icat ion of the rank-size rule and spatial interaction have been discussed in the author ' s unpublished dissertat ion, t i t l ed , "Demographic Corre lates of Urban Dynamics: A Case Study in Bangladesh, pp. 148-52, 96-99.

§ u u (D a
ro -r-i cn
0 u ^ C CO (D p u S " 1-1 CD •H o-j a o
-a C m ^ 0 o % 03 03 X J3 (D 'O
CD U C 03 03 CD 03
CD cn
•a c 03 o - r - l O 03 CO
2 & CL
- 2
- iS < D.
o CL
CD U O o « D- O
03 (D CC IX
§ CD
^ 3 c a CD O d; a.
•rH u
CT) CD CO O) (M o O O O CD CD CD fO LO -a- CO O LO 00 CO
CO LO 00 o o o lO cn rH rH CO r- en CD TH CO LO CO CD
CM CM CSl 1-1 rH rH rH rH rH rH
O CT) rH CO CM co o CO CO LO I> CD CD rH rH cr3 cn CO CO O CO C CO LO ro rH LO CD CD o O CD
^ r. ^ ^ •• •>
CT> OO CD CO LO rH CO LO ro CD CD O) 00 rH CO CSl CO CO LO
ro CO OO OO CM Cvl rH rH rH rH
+ + + + -1- + + + + + + +
o
CO
t>
o •"a-
o o CD CM [>
c n cn rH CO CD LO ro CO ro CM CO O rH LO rH rH LO O o CD LO O CO O CD
lO o CO rH CT) o rH 'J" cr>
CD 00 O CO ro CO CD
rH CO CD lO ro CO CO
ro ro in
in CO csi
LO
CO CSl
CO CO CD m CO
CD CO rH r<i LO rH O CO LO o CM rH CO o r<i CD CD o CD rH CJ3 ro rH cn CO O
CS] CO o ^ CM CO CO CO CO CT3 CO LO LO CD CO I> CD LO CM O o CD CSl rH rH rH rH rH rH rH rH rH
o o ro O o CO CM LlT r^ O O CO CO o o ro lO o CO rH O CD 00 O LO CO CSl CsI rH rH rH rH rH O o o
r-l o CD O o O O O O O O o o
CO 00 02 O CO
CD ro
D
CO c o 00 CD
JC u
CD c
r
sz CD £ w —\ CD Oi
JZ CO c
• r H
x: 03 c 03
£ >> 2
CD
e o u
CD cn •rH u CD m
03 x: > tn
u o c. CO c CD
03 U O to cn 03 n
Sh D a •a • rH CO CO
CD c r> CD a.
c CD OO •'—I CD
• r H
CD
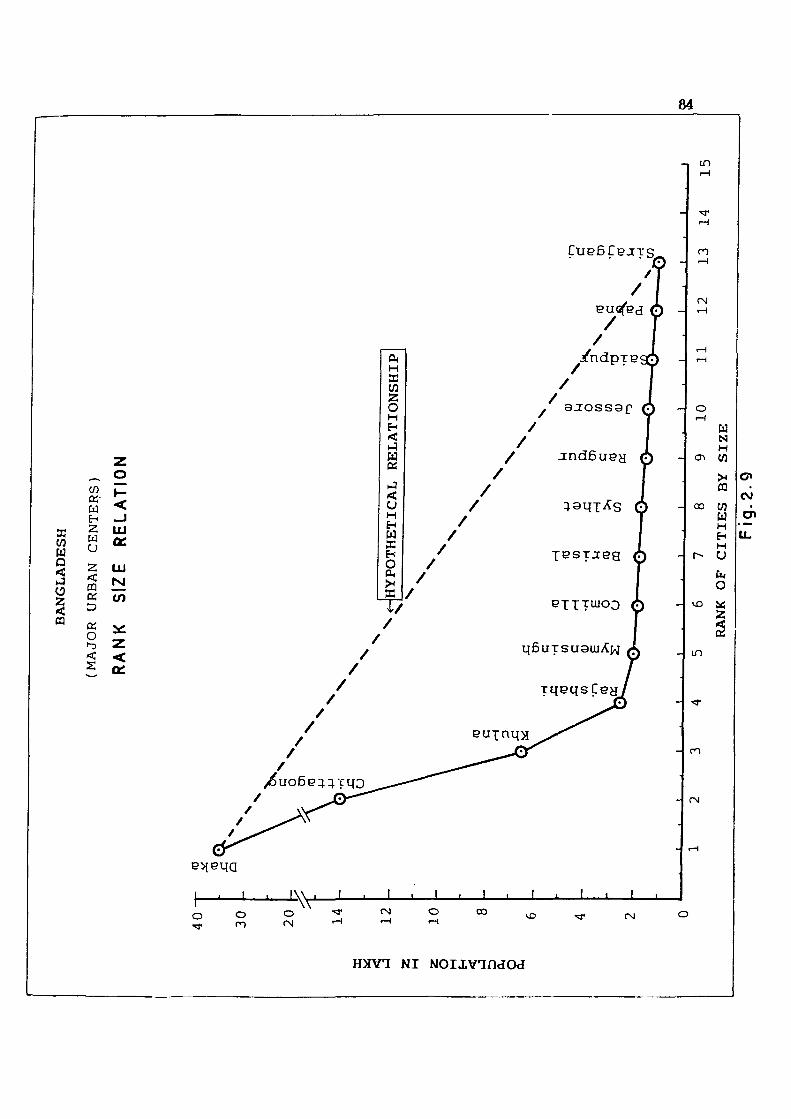
84
a: w g
CQ
CO 05-W Eh 2 W u 2 < m K O)
tu
O s
cx o < 2 <
a:
n
OJ
W N H
o\ M
00 C/J (4
vO
ID
n
rN
o o n
A V o (N
CN 00 vD (M
HMV7 N I NOIXVandOd
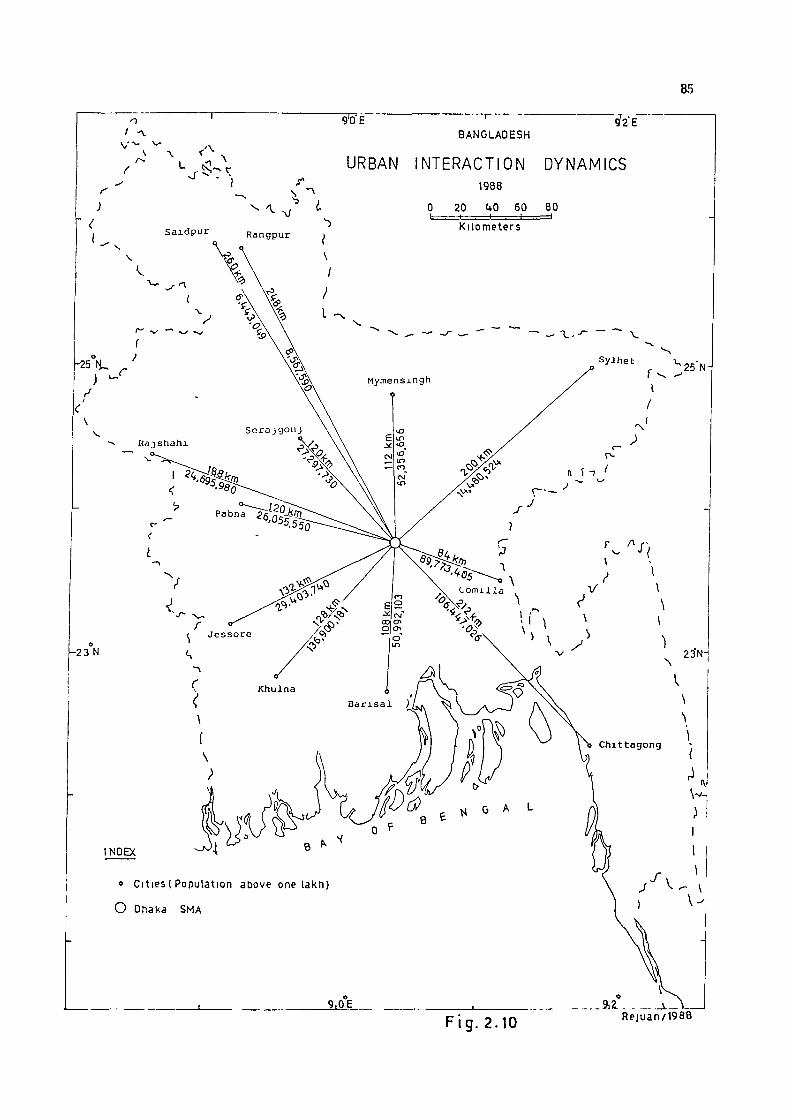
85
2'E
S a i d p u r R a n g p u r ( \
) \ 1 ^ \ 1
A \ ) I
BANGLADESH
URBAN INTERACTION DYNAMICS 1988
0 20 ttO 60 80 Ki lometers
[-25
) ^
h23 N
INDEX
V
Sylhet 25 NH
-N
N 23'N1
Chittagong
o C i t ies{Populat ion above one lakh)
O Onaka SMA
9,0E ^iZ _ F i g . 2.10 Reiuan/198e

86
BANGLADESH
REGIONAL DIVISION Northern Region
C e n t r a l Region
^ ^ Eastern Region
Southern Region
J ^ h i t t a g o n g - ^
F i g . 2 . 1 1 R e j u a n / ' 8 8

87
Fig . 2. 12

88
W B A N G L A D E S H
DISTRIBUTIONAL PATTERN OF URBAN POPULATION SIZE
1961
U.OO^OOO Populat ion 3,00,000
-24
- 2 3
-22
Nor thern Regioq
Centra l Region
Ea s te rn Region
S o u t h e r n Reg ion
8|9 E 9l0
0 20 kO 60
Kilometers
9,1 9|2
F i g . 2. n

89
F i g . 2.\k Rejuan/ '88

90
iTT B A N G L A D E S H
DISTRIBUTIONAL PATTERN OF URBAN POPULATION SIZE
1961
p t to , 00,000 popu l a t i on
- 20. 0 0 , 0 0 0
- 5 , 0 0 . 0 0 0
261 N
25-i
— ^ > \ \ \
2H
^2 3
o 1' V o
r:-. ° o ' 1 A ' \
O f' o^ 4 o
i '' ( •
lo ' j I ^ ' v o
1 KlIUCJA • t
C o 1 ( ; ) ' i' \ 1 0 \ '
' t • b
k22
21 N
Nor thern Reg ion
Central Region
Ea s te rn Reg ion
Southern Region
ag's 9|0' 9.1
F i g . 2.15
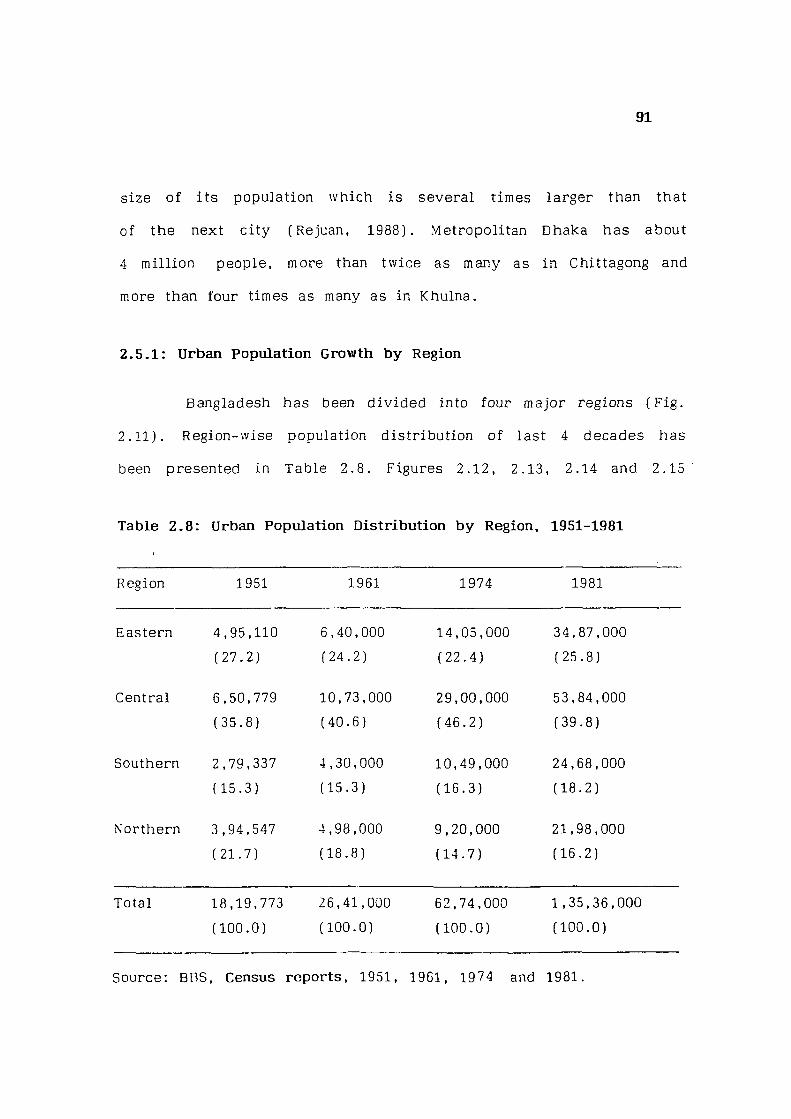
91
size of i t s population which i s severa l times larger than that
of the next c i t y (Rejuan, 1988). Metropolitan Dhaka has about
4 mi l l ion people , more than twice as many as in Chittagong and
more than four times as many as in Khulna.
2.5.1: Urban Population Growth by Region
Bangladesh has been d i v i d ed into four major regions ( F i g .
2 .11 ) . Region-wise population distr ibut ion of last 4 decades has
been presented in Tab le 2.8. Figures 2.12, 2.13, 2.14 and 2.15
Table 2.8: Urban Population Distribution by Region, 1951-1981
Region 1951 1961 1974 1981
Eastern 4,95,110 6,40,000 14,05,000 34,87,000
(27 .2 ) (24 .2 ) (22 .4 ) (25 .8 )
Central 6,50,779 10,73,000 29,00,000 53,84,000
(35 .8 ) (40 .6 ) (46 .2 ) (39 .8 )
Southern 2,79,337 4,30,000 10,49,000 24,68,000
(15 .3 ) (15.3 ) (16 .3 ) (18 .2 )
Northern 3,94,547 4,98,000 9,20,000 21,98,000
(21 .7 ) (18 .8 ) (14 .7 ) (16 .2 )
Total 18,19,773 26,41,000 62,74,000 1,35,36,000
(100.0) (100.0) (100.0) (100.0)
Source: BBS, Census repor ts , 1951, 1961, 1974 and 1981.

92
f o r the censuses yea r of 1951, 1961, 1974 and 1981 r e spe c t i v e l y ,
shov/ the regional pattern of urban population s i z e . It i s observed
that the urban population of Bangladesh during 1951-1981 increased
by 643 per cent. The rate of increase in the d i s t r i c t s o v e r the
per iod ranges from 271 per cent in Dinajpur to 1892 in Noakhal i .
Noakhaii is f o l l owed by Potuakhaij (1505 pe r cent ) , Khulna (1312
per cent ) , Jessore (1078 per cent ) , Dhaka (848 per cent ) , Tangail
(765 per cent ) , Kushtia (697 per cent ) , Chittagong H i l l Tracts
( 1978 per cent) and so on. Urban population of Chittagong and
Khulna d iv i s ions increased more than that of Rajshahi and Dhaka
di\"ision. This i s due mainly to the inclusion of Thana
headquarters which were not prev ious ly recognised as an urban
center.
Table 2.9 shows the growth of urban pop ulation in
last three decades. Figures 2.16, 2.17 and 2.18 indicate the
d i s t r i c t wise urban population increase in d i f f e r en t ca tegor ies .
The regional pattern of growth shows that during 1951-1961 onlv
in tv, 0 (9 .5 per cen t ) , d i s t r i c t s ' the growth rates were between
10?-199 per cent; d i s t r i c t s were ent i re ly rural in character is t i cs ,
i . e . , Bandarban and Chittagong H i l l Tracts . On the o ther hand
two d i s t r i c t s had decreased the i r growth rate ( Tab l e 2 .11 ) .
Table (2 .10 ) shows that growth rate var i es
considerably from 300 per cent and above to less than 25. In some

93
f\ 89'E 90*
^ V B A N G L A D E S H
W
g r o w t h of u r b a n p o p u l a t i o n w. 1951-1961
- S
'v.,
0 20 ifO 60 I . I .
KM.
26N-
r - 3
T
v..
-2k' r INDIA ^•(Tripura) ^ ^
h22'
I N DIA (West Bengal)
- 2 2 ' N
R
3 0 0 and above "/o 2 0 0 - 299 1 0 0 - 199
5 0 - 99 — 25 - i+9 less than 25 D e c r e a s e Entifely Rural 9 p E
-•-National Average 51.5
F i g . 2 . 1 6 Rejuan/ '88

94
F i g . 2 . 1 7 Rejuan/ '88

90 B A N G L A D E S H 9 2 E
GROWTH OF URBAN POPULATION 197if-1981
h23
I NDIA (West B e n g a l ) ^
-22'N
0 20 kO 60 1 = 1
26 N-
300 a n d above 200 - 2 9 9
^ 1 0 0 - 1 9 9 50 - 99 25 - k9 Less t h a n 25 D e c r e a s e
N a t i o n a l A v e r a g e 183
R E n t i r e l y R u r a l 9 0 E 9.1
F I g . 2 . 1 8 R e j u a n / '88

96
I'lihlii /A): MiiiiHliHloMh: Hrowlli cif llrlxiii l>o|)uliiUiiii 1lir>1-1!l(i1 , 1l)(n-1!)74, mill 1!l74-1lini
{Dotn by Ointrlcl)
Ui vlBlon/ 1U51-1UG1 1'J51-1974 1974-190]
incrcnsod in incrooBocl In incrooBOd in
Number Percent Number Percent Number percent
Bangladesh 8,20,953 45.1 3,633,000 138 7261,000 116
Chittagong Div is ion 1,44,414 16.1 765,000 120 2082,000 149
Bandarban R R R R 24,000 184 C t g .H i l l T rac t R R 15,000 68 141,000 374 Chittagong 76,778 25.6 533,000 143 856,000 95 Coniilla 22,353 19.2 108,000 77 339,000 137 NoaKhnIi 12,050 511.0 35,000 103 301,000 529 SylUct 9,029 I G . l G1,000 BG 361,000 274
Dhnkn Dlvlnloii 4,22,007 04.1) 1 ,82 7 ,000 170 2483,000 85
Dhaka 2,20,784 65.7 1,496,000 199 1650,000 73 h'nrldpur 20,931 30.3 39,000 51 291,000 249 Jnmnlpur 10,698 30.1 33,000 52 127,000 132 Myrncnsingh 39,777 34.9 174,000 113 339,000 105 •I'nngnil 2,175 10.1 85,000 300 70,000 70
Klmlnn iJlvlsion 1 ,51 ,079 54.1 019,000 144 1475,000 161
UnriKdl - 10,291 -15.(1 47,000 44 411,000 207 Jcssore 37,098 101.3 100,000 140 260,000 143 Khulna 1,03,461 150.0 347,000 202 454,000 88 K\iRhtin 22,730 50.1 94,000 147 166,000 106 I'liUmkhiill 13.2 2'•.,000 204 12f>,0TO
Rajshahi Div is ion 1,03,453 26.2 422,000 G5 12 76,000 139
Bogra 10,551 +29.0 30,000 70 120,000 145 Dinajpur - 4,592 - 6.0 41,000 58 171,000 251 Pabna 30,041 43,2 115,000 116 185,000 188 Rajshahi 35,034 42.1 127,000 105 325,000 132 Rangpur 31,819 24.9 103,000 65 473,000 181
Sourcc: BBS, Census , 1951, 1961, 1974 and 1981 national volume and urban ccnsus 1987, Government ol Bangladesh, Dhaka.
Rural character
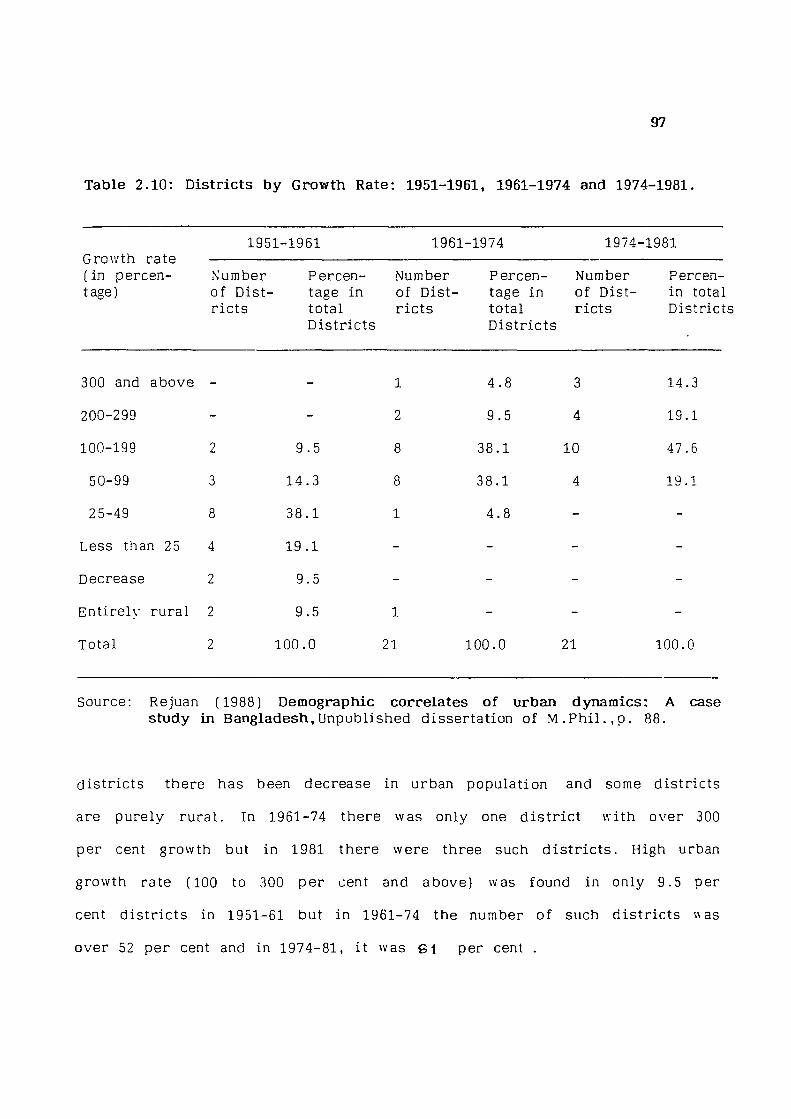
97
Table 2.10: Districts by Growth Rate: 1951-1961, 1961-1974 and 1974-1981.
1951-1961 1961-1974 1974-1981 Growth rate ( in percen-tage)
Number of Dist-r i c t s
Percen-tage in total D is t r ic ts
Number of Dist-r i c t s
Percen-tage in total D is t r i c ts
Number of Dist-r i c t s
Percen-in total Districts
300 and above - - 1 4.8 3 14.3
200-299 - - 2 9.5 4 19.1
100-199 2 9.5 8 38.1 10 47.6
50-99 3 14.3 8 38.1 4 19.1
25-49 8 38.1 1 4.8 - -
Less than 25 4 19.1 - - - -
Decrease 2 9.5 - - - -
Entirely rural 2 9.5 1 - - -
Total 2 100.0 21 100.0 21 100.0
Source: Rejuan (1988) Demographic correlates of urban dynamics: A case study in Bangladesh,Unpublished dissertat ion of M . P h i l . , p . 88.
d i s t r i c t s there has been decrease in urban population and some d is t r ic ts
are purely rural . In 1961-74 there was only one d i s t r i c t with over 300
per cent growth but in 1981 there were three such d i s t r i c t s . High urban
growth rate (100 to 300 pe r cent and above ) was found in only 9.5 per
cent d i s t r i c t s in 1951-61 but in 1961-74 the number of such d i s t r i c t s u as
ove r 52 per cent and in 1974-81, i t was S I per cent .

98
The regional pattern of urban growth also exh ib i t -
considerable var iat ions. Among the four regions the central
region has the Highest percentage of urban population. In 1951,
central region acccounted for 35.9 per cent urban population
which rose 46.2 per cent in 1974, but the proportion s l i ght ly
decreased in 1981 and came down to 40 per cent. Eastern region
of ranks second in the country. It has twenty seven per cent
urban population in 1951 but i t decreased in 1961-1974 and
s ight ly increased in 1981 (25.8 per cent ) . Southern and Northern
regions were least developed among the four regions of
Bangladesh.
Spatial variat ions in the degree of urban population
growth is measured by percentage of urban population in the
total in each d i s t r i c t . Table 2.11 and Figure 2.19 reveals
interesting facts . In 1951, only 4.34 per cent of population
was urban and two d i s t r i c t s were without any urban population.
In 12 d i s t r i c t s the urban population was less than the national
average, and only 7 d i s t r i c t s had a percentage more than the
national average . Chittagong d is t r i c t had the highest percentage
of urban population i . e . 11.78 per cent. Lowest was in Noakhali
d is t r i c t , 1.04 per cent.
In 196". the urban population increased from 1.82
million t(j 2.64 mill ion, attaining a growth rate of 45.1 per cent.

CO
'I' O)
<a m
m O)
g •e °
o 3 a, (0
I CO £1 a, c i:; ° .2 3 a. rJ
CO ,-H S D. c
S c 1
I CO £1 a c
CO 3
S.OS.-B
I CO c CO . . u a c 3 ° -2 Ou ^
r - l I CO CO 4-' f—1 O 3 __ H a g
- g ffi u P u a u o Du o cu ::
1 e S CO p £) a c 3 a. ^
1 ri CO CD o a. c H o o Q. 'Z
<u
<u a irt CO iC Q
CO m O r-i
r-ro
O O O O CO
CN r-O)
o o o
2 o 2 o o o
CO CM CO CO rH rH CO CM [> CO CM 00 rH 03 00 CO 00 rH ro Q o O O o Q o O O o o o o O o CM CO o ro o CO CO CO CD O
lO CJ)
o
o o => 2 o o ro m
CO ai <j] d CM o o o CD o O)
g 8 o o o m CO rH CO CO CO ro
cn o O o o ° S-- (J> O CO • o CO o lO rH
CD CO
O O O CO O
O O O CO CD r-
O CM CO rH CO 00 rH rvi o CO rH 05 ro CN Oi CO C-J d C-J CO CO
o o o CTJ IN
o o o CO Tf CM
O O o o o o O o o O o o o o o O o o o o o o o o O o l> CO LO rH ro LO ro ^ to CO CO c- CN CD O CO H CO Ol ro rH CN CM o O o 8 o o O o Q o O o 8 o O O o Q o O o o o o O o o ro CO CD CM ro O CO CO rj CO rH lO r- lO rH CD lO CD O CO IN CO r- rH CD CN 'J' CM rH CN ro
CN CO lO CO CO CO lO rH CD rH LO rH rH rH rH o O O O O O O O O O O O
- - - CD CN lO ro O ro lO - - ro lO r-- rH
o o 8 o o o o o o o o " - rH CO ro o CD rH CD •• •• * o CM ri' CO to CO CO
CO ro CO CO CO CO CO CM tj' CM ro r O lO CM rH > LO CO CD cn CM C7) CD ro tf Tf CO tl' CN CM oi CN •ct' lO LO ro irj CO CM ro
o s l> CM
05 CO
o o o c ro rH
O O O O CO CM CM
o o o o o o
CO 05
o o o C31 o
o o o lO
o o o o o o
o o o CO CM m ro
o o o ro CO
o o o s o
ai i-
o o o
CO tf'
CM CD
O o o
o o o C--
s n u CO •a s CD
CM CM ro
o o o o O o o o O o o o o o O O o o o O o o O o o o o O O o o o o o O O o o o o o o o o o CO o O o o o o o o O O o o o o o o o CD CN LO C31 cn CM o O) CO CO CO C 'J' <J> rH rH LO CO rH CJ) rH rH ro CO TH CO CO o r- CM CM CO CO a> CO O rH CO
CO ro CO CN CO o o lO o CD CO lO CO rr CN CO CO CN ^ lO ro l> CM lO IN ro CO ro rH rH CM CN CN rH C- CO ro o LO to CN CO ro c O CN C7> rH rH t C LO rH O CO ro t CO ro o rH ai CM rH CM ro CN ro rH CM CM ro rH CO ro CO rH CM •<a< lO Tf
r-
lO
o o o ro
o o O O o o o o o o o o o o o o o O o o o o o o o o o o o o o o O o o o o o o o o o o o o cn ^ rH CO CO ro ro OJ t- IN ro ro t> LO t> CO CO •cf o c- CD rH
O O O O O
O O o o o o o CN
o o o o o o o o o o o o o O O o o o o o o o o o o o o o o o o O O o Q o o o o o o o o o o o o o o o o O O O o o o o ^ ro (y> o CD <r> cn •a' CO O cn CO CO O CJ) rH CO CO CO CO CO cn Ol 00 CO OD cn CO t> LO rH cn CM - O) ro ro o rH o rH rH rH O lO O cn CO t> CO IN IN ro CO CO rH rH ro CM CM rH rH rH rH rH CM CO
CO t^
CO O
•>3' O s o o
CO o ro O ro CO o CM •'I' CO
CM CM CO
CO lO rH CO
rH rH CO rH CM o rH rM ro rH CM ro rH CM
2 ° 2 ° o O CD r 05 rH
o o o CN) CM
2 ° 2 ° O O O O r-> O o o 2 o o o g o CO CO CM LO ^ CM
s o o CD o O o o
s o o O o o o o o o o O o o o o
CJ) rH o CO r- cn l O r o CD rH ro t> CD CO
lO CO ro CO CD ro CO CO
o o o 00 CM
o o o O o O o o o o o O o o o o o C-- CvJ CM T-i Q) CO rH rH cn to r-CM CO t o o C CS) ro CN ro rf
o o o o o o o o o o O - J o o o to CNl
o o o
00 c 00 ro ii ^ 2 u
I
c-CM
u 3 a T3 u CO
ro
£ 00
•S fi s
CM CO ro CM
o o o o o o
o o o o g O O O
O o o O O O
o o o LL- lO
CO CJ< to
c ^ M' to CO
lO o to rH o CM
CO oo' CM rH ro rH to rH CM CN
CT) CN
CO 00 c
CO 5 3 £
CO JC a; CO CO CO tt.
00 o CQ
a CO c
£ CO r w CO d;
a 00
s cc
00 J> rH m lO tD c* 00 CD o r-1 rHrHrHrHrHrHrHCMCN
s
o o o e'-
en
o CN
O O O
to CM o o o o co" o
ro
o o o CM
CO
o o
ro IT)
X CD W Q < J O y. < m

1. 100
F i g . 2.19 Reiuan/19e8

101
Bandarban d i s t r i c t was s t i l l l a rge l y rural in character. National
average of urban population was 5.20 per cent. Kushtia, Khulna,
Chittagong and Dhaka d is t r i c ts were above national average Vifith
.7 .07 , 12.51 whi le other 16 d i s t r i c t s were below the national
ave rage .
In 1974, the national average urban population vjas
8.78 per cent. Only 5 d is t r i c ts were above the national average .
They were Bandarban (11 per cen t ) , Chittagong Hil l Tracts (10
per cent ) , Chittagong (21 per cent ) , Dhaka (30 per cent) and
Khulna (15 per cent ) ; but a l l other 16 d i s t r i c t s were below
the national average (Table 2 .11 ) .
In 1981, the national average was approximate ly 15
per cent. Again as 1974, the same f i v e d i s t r i c t s were above
national average . The highest percentage was Dhaka about 39
per cent of total population, f o l l owed by Chittagong (32 per
cent ) , Chittagong Hi l l Tracts (30 per cent ) , Khulna (22 per
cent ) , and Bandarban (21 per cen t ) .
2 .5 .2 : Densit ies of Urban Population
The density of urban population, about in Bangladesh
in 1981 was 2060 persons per s q . km. Density in Dhaka SMA
was v e r y hiqh, being 6047 persons per sq . km. fo l lowed by
Khulna, Comilla, and Pabna with 2798, 2733 and 2168
r e s p e c t i v e l y . Lowest density has been found in Bandarban

102
d i s t r i c t , where it was only 116 persons per sq . km. In the
other 17 d i s t r i c t the densi ty was l ess than national average
( Tab l e 2 . 12 ) .
2.6 FLUCTUATIONS IN THE RANK OF URBAN CENTERS
Rank fluctuation depends upon the vary ing growth of
population which in turn is largel\- the result of rural-urban
migration. Push factor of rural areas and pull factor of urban
areas, both are v e r y much inter l inked with urban dynamics.
But the centri fugal f o rce is the main cause for rural-urban
migration in developing countries. Demographic and
socio-economic backwordness of the rural Bangladesh are the
main fac tors as a result of which rural people are pushed out
from the i r v i l l a g e s . Among the urban in migrant more than 80
per cent are from rural areas .
The i l lustrat ion (F igure 2.20) c l ea r l y indicates that
two urban centers, namely, Dhaka and Chittagong, maintained
the i r f i r s t and second rank r e spec t i v e l y throughout the period
1901-81. S i ra jgon j , the 3rd ranking urban center, could maintain
i ts o rde r in the rank only upto 1911; in the year 1921 i t was
ranking 5th and f e l l down into 10th posit ion in 1951, and to
12th rank in 1981. The present 3rd ranking c i t y Khulna was
on the 22nd step of ranking in 19C1. It secured 3rd position
in 1961 and continued to maintain i t . The 4th rank c i ty was
Rajshahi . It f e l l down to 8th rank in 1921 but gradual ly gained

103
FIG. 2.20-- RANK f l u c t u a t i o n OF URBAN CENTERS , 1901 - 1981
36 Banyachang
J7 Shrrpur
3B PaluaKha.i
21 31 C E N S U S
51 61 71+ 1981 Y E A R S
o a> ^ c nj
0/ IX

Table 2.12: Density of Urban Population (District Wise)^ 1091
104
1981-
SI. No.
Name of the Distr icts
Area of the d i s t r i c t s ( in s q . km . )
Total urband population
Density of urban population
1. Bandarban 317.98 363953 116
2. Ctg. H.T . 745.95 1,76,683 237
3. Chittagong 920.60 18,62,000 2022
4. Comllla 204.69 5,59,483 2,733
5. Noakhali 242.10 • 4,11,656 1,700
6. Sylhet 270.50 4,94,433 1,8288
7 . Dhaka 573.80 38,56,896 6,047
8. Farldpur 261.20 3,30,387 1,265
9. Jamalpur 115.40 2,14,491 1,859
10. Mymensingh 374.50 6,59,212 1,760
11. Tangail 114.10 1,84,781 1,620
12. Barisal 307.60 5,58,363 1,815
13. Jessore 281.50 4,34,949 1,548
14. Khulna 346.70 9,70,200 2,798
15. Kushtia 283.10 3,33,384 1,178
16. Patuakhali 132.80 1,65,524 1,247
17. Bogra 100.40 2,02,919 2,021
18. Dinajpur 201.40 2,73,784 1,359
19. Pabna 148.00 3,98,822 2,168
20. Rajshahi 297.90 5,45,070 1,830
21. Rangpur 410.80 7,09,797 1,728
BANGLADESH 6,446.18 1,32,79,897 2,060
Source : BBS, Census report, 1981
*Area wise data are not ava i l ab l e of 1951, 1961 and 1974 urban centers.
105
i t ' s previous position in 1974 and continues to occupy it t i l l
today.
The rank of two c i t i e s , namely Khulna and Jessore is
worth noting. Both are ascending the rank o rde r . Khulna acquired
3rd posit io in from 22nd and Jessore obtained 8th rank from 28th
posit ion in 1901. On the other hand, there has been a surprising
degree of turbulence among the smaller centers - espec ia l l y those
with populations of less than 50,000. Centers have been promoted
or demoted in rank by v e r y s igni f icant margins whi le a quite
substantial number of towns have fa l len out al together (dropping
below the qual i fy ing populations of 5,000 or more ) ; manny others,
of course have taken their p lace .
However, in ind iv idual cases, a v e r y high fluctuation in
the rank order i s observed in the case of Nawabganj; it was
ranking 11th in the year 1901, but in next census year it v. as
ranking 5 th, immediately in the next census year it was
shi f ted to 23rd rank. Again it c l imbed to 20th position in 1931
and to 16th position in 1981.
Small towns ( l ess than 25,000 inhabitants) in the studv
area indicate a frequent fluctuations in the i r rank with generally
a declining tendency. Town l i ke Sherpur which was ranking 19th
in 1901 was placed in 37th rank in 1981. Other towns in this

106
category were Kotchandpur, Natore, Noakhal i , Meherpur, Debhata,
Muktagacha, Satkhira, Ba j i tpur , e tc . (F igure 2 . 20 ) .
Some of the new towns which have energed on the scene
recenti\' have secured a v e r y high rank in a short span of time.
The town (Jhuadanga in 1974 was ranking 27th but ascended to
20th rank by 1981. The toun Naogaon which was ranking 37th
in 1941 gradually secured 33rd rank in 1981.
The town Khulna, an industr ial as we l l as a port town,
has rap id ly attained the higher rank a f t e r immerse of 'Chains
Sea Por t ' in Khulna d i s t r i c t in 1951. In 1901 i t was on 22nd
rank but reached 3rd rank by 1961 and is maintaining i t t i l l
date .
The rank-s ize fluctuation indicates that nine urban
centers. namely - Dhaka, Chittagong, Ra jsheh i , Potuakhali,
Ishurdi, Companiganj, Chowmohani, Palash, Rupganj and
Banyachang, are v e r y s tab le and have maintained the i r or ig inal
rank from the per iod of c lass i f icat ion of towns. There were
however a few occassions of fluctuations in the i r ranks in the
transitional per iod , but in the f inal year (1981) , they have
secured thier or ig inal ranks ( Tab l e 2 .13 ) . A pos i t i v e (upward)
variati?.'-: in the ranking (between 1 t o 5) has been experienced
by Barisal , Mymensingh, Dinajpur, Bogra, Narshingdi , Naogaon
urban c ent(;rs of Bangladesh. High (6th to 10 th rank) and ver\'
high ( n t h to 23rd rank) fluctuation has been exper ienced by

1017
Tablo 2.13: Kank Fluctuation of Urban Centers of Bangladesh^ 1901-1981
SI. No.
Name of Urban centers
'f Net variation of rank from 1901 to 1981
Sum of variation of rank
Maximum variation
1. Dhaka 0 0 0 2. Chittagong 0 0 0 3. Sirajgonj -9 8 -9 4. Rajshahi 0 9 -4 r,. D' baria -12 12 -12 6. Comilla -4 9 -6 7. Barisal 1 8 4 8. Pabna -5 11 -6 9. Jamalpur -6 14 -8 10. Madaripur -20 41 -28 11. Navabganj -5 38 -18 12. Tangail -5 29 -13 13. Kishoreganj -22 26 -24 14. Rangpur 7 19 9 15. Mymensingh 4 17 11 16. Perojpur -20 25 -20 17. Sylhet 12 29 13 18. Dinajpur 4 20 7 19. Sherpur -18 26 -23 20. Faridpur -7 19 -9 21. Netrakona -17 21 -19 22. Khulna 19 19 19 23. Bajitpur -15 15 -15 24. Ch andpur 6 26 16 25. Kotchandpur -13 13 -13 26. Natore -12 23 -12 27. Satkhira - 8 29 -11 28. Jessore 20 20 20 29. Bogra 3 21 12 30. Noakhali - 1 19 9 31. Muktagacha - 7 7 -7 32. Saidpur 23 43 28 33. Meherpur - 5 7 - 5 34 . Debhnln - 4 6 - 4 35. Kushlia 14 27 14 36. lloUigonJ - 3 8 - 5 37. Jhalakati - 1 14 - 4 38. Patuakhali 0 18 - 6 39. Narshingdi 3 3 3 40. Ishurdi 0 0 0 41 . Companiganj 0 0 0 42. Chowinohani 0 0 0 43. lihnlrnb - 9 9 - 9 44. Polash 0 0 0 45. Rupganj 0 0 0
. NnoHnon 4 a 8 47. lUiny.ichang U 0 0 40. Cliuadanga 7 7 7
Notes: " T h e "net variation" of rank shows the d i f ference between the rank of an urban center from 1901 (or the year when it becomes urban) to 1981.
* * The "sum of variation" of rank shows the sum of all the fluctuations of the rank of an urban center from 1901 (or the year when it becomes urban) to 1981.
* * * "Maximum variation" shows the d i f ference between the highest and lowest rank of an urban center during any period between 1901 to 1981.

108
eight urban centers. They are Rangpur, Sylhet, Khulna,
Chandpur, Jessore, Saidpur • and Chuadanga. Their fluctuation
ranges between 6 to 23 t imes. Out of 48 urban centers only 13
towns observed pos i t i ve var ia t ion in the i r rank order . Other
24 urban centers have epxer ienced a negat ive var iat ion in the ir
rank orders . Nine towns, namely, Coir.illa, Pabna, Nawabganj,
Tangai l , Noakhali, Meherpur, Debhata, Hobiganj and Jhalakati
show a negative fluctuation ranging between -1 to -5 t imes. Rest
of the 15 exper ienced a negat ive fluctuation between -5 to -22.
They are S ira jgonj , Brahmanbaria, Jamalpur, Madaripur,
Kishoreganj , Pero jpur , Sherpur, Far idpur , Netrakona, Baj i tpur ,
Kotchandpur, Natore, Satkhira, Muktagacha and Bairab Bazar
towns have high and ve ry high negat ive var ia t i on .
It w i l l be worthwhi le to invest igate the urban dynamics
of urban rank fluctuation. In f igure 2.20 ranks of towns have
been plotted. A change in posit ion o v e r the period does not
necessar i ly mean that a spec i f i c town has lost or gained
population. Other urban centers ranked above or below i t may
have performed more poor ly or better to bring about a change
in r e l a t i v e posi t ion. In a h i gh l y s impl i s t i c sense these rank
re lat ionships demonstrate one aspect of the urban dynamics -
the r e la t i ve position of urban centers being dependent upon
what is happening to o thers in the urban system. However ,
there are some obvious changes in rank which are c l ear l y
d iscerni b le .

109
Industrial and sea port c i t y Khulna and small scale
industrial c i t y Saidpur have exper ienced rap id promotion through
suburban expansion. Natural resource or iented towns such as
Sy lhet , Comilla and Mymensingh have gained the i r status because
of mineral exp lo i ta t ion. It is important to note that it does
not r equ i re a v e r y signif icant increase or decrease in population
to rad i ca l l y change the rank of a l owe r - o rde r urban centers,
whi le at the top end of the scale qui te substantial increase
may be required be fore a change in rank can be ach i eved .
2.7 MEAN SIZE OF URBAN CENTERS:
In f igure 2.21 and table 2.14 the average s i z e of urban
centers is shown in d i f f e rent c lasses in Bangladesh. Howe\"er,
besides the changes in the status of urban centers in d i f f e rent
c lass -o rders , the study of mean s i z e of urban centers in
d i f f e rent class o rders during the per iod 1901 to 1981 indicates
that the general trend of mean s i ze of urban centers shows
continuous growth in the mean s ize of a l l urban centers .
Indiv idual c lass-order analysis shows that c lass I urban
centers have increased the i r mean s i z e cons iderably upto 1974
and a f t e r that the trend has become downword. There were no
class II urban centers, upto 1931. In 1941 to 1981 the trend
changed and there emerged class I I urban centers. A ve rv high
fluctuation has been found in class IH urban centers . It starts

O ro CO rsi un
oo CO tn ro TH CD ro CD 1> TH ro T-i o O CD o ro
CD CD
Cv] rH
n o
o 00 CT) LO
csi CO CO CD CO
o ID o LD 00
CT) O IN CO
C35 O) cn t>
CD CD rH (N
05 00 O 00 in
CI CJ) LO o o CO
o cn o CD
o CT) 0-3 CO LO ro rH
'a' 00 ro 00
O LD o 00
in in 00 oo oo
L.O CD
o rH cn CN
o <NI an o vH
CO CO CO CD
CD CS) c-
rH cn CD OO
in CO CO 00 CSJ
r-f I
O CI
X L, o •o L, c X X
u
•iS-ro CO CM o CO CSl
CO CO
CD CO CO O CO TH rH o CD O LO LO oo rH
CO CO o o oo
-LO o o CO
CO o o o
CD CO CO CD
o CO I> O-l
00
00 00
LO m o CD CM
00 o LO CO
c CJ o
CS CD
cn ro
o lO t> tn rsi
LO O 00 CD
ro ro cn CO
cn CO ro
O o LO
X u 3
3 cri
CO
•y> ro
cn
r--r-o
00 o ro
CO CO
CM CC
CO ro C7) in
O <N C--to
Ln o o ro
lO CM CO
oo
CM (D r-H o CO
s X c 3
CM
O 3
X L C >
N X
o CO CD U, CD >
<
>
tn CD (D E CO cn
0) u
ts

I l l
MEAN SIZE OF URBAN CENTERS IN D I F F E R E N T CLASS ORDER (1901-81)
6,00,000
5,00,000
4.00.000
3,00.000
2 , 0 0 , 0 0 0
1,00.000
50,0001
/
^
c o
TO
A 5,000
4 0 000
35,000
Q. O Q. 300001
25.000:
. .on i
2 0 , 0 0 0
15.000
lO.OOO:
5000
- - - V
VI J L
1901 11 21 J L
31 41 51
CensTus Years
Fig: 2 .2 ]
61 74 1381
Re]uan/"90

112
from 1921 and come to a high posit ion in 1941 but drops by
1951 but again r i s es t i l l 1981. Except in 1951 v e r y l i t t l e
fluctuation has been observed in class IV towns. A small
fluctuation in class V and class VI have been i d en t i f i ed .

113
REFERENCES
Alamgir , M. (1974), "Some Ana lys is of Distribution of Income, Com'sumption, Saving and Pove r t y in Bangladesh"- The Development Studies, Vo l . 2 ( 4 ) pp . 737-818.
BBS (1986) , Stat ist ical Year Book of Bangladesh, Government of Bangladesh, Dhaka, pp . 125-137.
B e r r y , B . J . L . and Horton, F .E . (1970) , Geographic pe rspec t i ves on urban systems; wi th Integrated Readings, Prent i c -Hal l , Inc. New Jersey , p . 12.
Bose, A. (1978), Ind ia ' s Urbanization 1901-2001, Tata McGraw Hi l l Publishing Company, L t d . , New De lh i , pp. 72-110.
Bose, S .K. (1973), "The Pr ince Situation in Bangladesh - A Pre l iminary Ana lys i s : , Bangladesh Economic Rev i ew ,
Vol . 3 ( 2 ) , pp. 243-68.
Census of India (1921), Report , Vo l . 1, Part I PP . 11-12.
Chaudhury, R.H. (1980), Urbanization in Bangladesh, Center for Urban Studies, Dhaka, pp . 1-10.
Chr i s ta l l e r , W. (1933), Central places in South Germany, Translated by C.W. Baskin, New Jersey , Pre i i t i c Hal l , 1966, pp. 1-14.
Chr is topher , S.R. (1971), Malaria in the Punjab, Government of India, Calcutta, pp. 15-35.
C lark , P . J . and F.C. Evans (1954), "Distance to Nearest Neighbour as a measure of spat ial Relationships in Population", Ecology, Vo l . 35, pp . 445-53.
Chaudhury, R .H . , N.R. Ahmed and S. Huda (1976), "Management of Immigrants to Urban Regions of Bangladesh", in National Report on Human Settlements in Bangladesh, Presented at Habitat United Nations Conference on Human settlements, Vancouver, May 31-June 14, pp . 87-114.
Chr i s ta l l e r , W. ( 1933), Die Zentralan Orte in Suddeuschl Gustar f ' i scher Varag, Jeva.
Dav is , K. (1951), The Population of India and Pakistan, Princeton Univers i ty Press , Princeton, p. 48, p. 51.

114
Elahi , K.M. (1985) "Urbanization in Bangladesh: A h is tor ica l Background", Souvenir, BNGA, Dhaka, pp . 16,17.
Ghurye, G.S. (1962), C i t i es and C iv i l i za t i on , Bombay, pp. 63-75.
Helbock, R.W. (1975), "Urban Population Growth in Pakistan, 1961-1972", Pakistan Development Rev i ew , Vo l . 14 (3 ) , pp. 315-333.
King, L . J . (1962) , "A Quantative express ion of the Pattern or urban settlements in selected areas of United States", TESG, January, pp . 1 -7 ,
Majumder, R .C. (1924), The History of Bengal, Dhaka Univers i ty , Dhaka.
Mishra, R .P . (1970), Medical Geography of India National Book Trust, New Delhi , p . 85.
NIUA (1988), State of I nd i a ' s Urbanization, Govt , of India New Delhi, p . 27.
o
P h i l i p , H. and Ress (1979), Residential Patterns in American Cit ies : 1960, The Univers i ty of Chicago, Dept. of Geography, Research paper no. 189, pp . 153-54.
Prasad, I . (1939) , A Short His tory of Muslim Rule in India, Al lahabad, India.
Rashid, H. (1977), Geography of Bangladesh, Univers i ty Press Ltd, Dhaka, pp. 160-82.
Rejaun, H.B. (1988) , Demographic corre la tes of Urban Dynamics: A Case study of Bangladesh: Unpublished M.Ph i l , d issertat ion, Al igarh Muslim Univers i t y , A l i garh , p. 78.
Voorhees, Alan M. (1970), "Urban Growth Charac te r i s t i c s " , in the Putnam et al ( e d s . ) , A Geography of Urban P laces : Selected Readings, Mathuen, London, p. 81.
Zachariab, K.C. (1964), A Histor ica l Study of Internal Migration in the Indian sub-continent, 1901-1931, Asia Publishing House, Bombay, p. 262.

CHAPTER - I I I
SPATIAL AND TEMPORAL DIMENSION OF URBAN DYNAMICS
In chapter two elements of urban dynamics in
Bangladesh were presented in re lat ion to genesis of urban p laces ,
factor of urban growth, spacing of urban centers, spat ia l
interaction, s i ze -c lass of urban centers, rank-order fluctuation
and mean s ize of urban centers. The study covered a period from
1901 to 1981. The Demographic and socio-economic conditions of
the selected urban centers are also important in
understanding the urban dynamics. The study cover the per iod
of last three censuses. The present chapter attempts to deal wi th
selection of urban centers and some of the important components
of population, e . g . , growth, age, sex and occupational
structure of population. These components help to understand
the o ve ra l l demographic and socio-economic conditions and lead
to the certain conclusion which he lp in the ident i f icat ion of urban
dynamics var iab l es , used in the Pr incipal Component Analys is
(FCA) in next chapter .
3 . 1 SPATIAL DISTRIBUTION OF SLECTED URBAN CENTERS
There are 492 urban centers randomly distr ibuted in about
144,OUU sq.km area having 13.54 mil l ions population (under the
new def in i t ion in 1981). Urban area includes places having

116
Municipal i ty (Paurashava} , a Town Committee (Shahar Committee)
or a Cantonment Board. Under" normal c r i t e r ia , an urban area must
have a concentration of population of at least 5,000 persons in
continuous col lect ion of houses where the community sense is
deve loped and the area i s p rov ided v^ith publ ic u t i l i t i e s such
as, roads, e l e c t r i c i t y with street l i gh t , water supply , sanitary
arrangemen+, etc. An area which maintains urban character is t i cs
but has a population of less than 5,000 and the Thana head
quarters may also be treated as an urban center.
The noteable thing about this def ini t ion is that the thana
headquaters are treated as urban i r r e spec t i v e of the i r l e v e l of
urban character is t ics . Moreover, some growth centers l i ke places
of trade and commercial importance, hats ( pe r i od i c market) and
bazars (regular markets) were also treated as urban. But the
sample has been drawn on the basis of 1961 census. At that time
the total number of urban center was 78 and it rose to 108
in 1974. Out of 78 urban centers in 1961, 40 centers (F i f t yone
per cent) have been selected f o r the study ( F i g . 3 . 1 ) . These
40 urban centers have been se lected through s t ra t i f i ed random
sampling from 4 d iv i s iona l headquarters v i z , Dhaka, Chittagong,
Khulna and Rajshahi . Ten urban centers have been se lected from
each of the four d i v i s i ons .

117
Fig- 3-1 RE JUAN,'?:

m
3.2 SPATIO-TEMPORAL DIMENSION OF URBAN POPULATION OF
SELECTED URBAN CENTERS
Urban centers ca r ry a l l t ypes of secondary and t e r t i a ry
ac t i v i t i e s and act as areas where i t i s functioning demographic
and socio-economic components interact with each other .
Demographic structure i s one of the basic dimensions of urban
settlement systems and there fore i t w i l l be worth wh i l e to study
it in some deta i l .
3 .2 .1 : Population Growth Character is t ics of the Selected Urban
Centres
Column 2 of the table 3.1 shows the growth rate of
selected fo r ty urban centers during a per iod of 30 years from
1951 to 1981. Column 3 and column 4 show the annual growth rate .
Column 3 i s based on 1951 census and the column 4 i s based on
1974 census. On the other hand colmumn 5 shows the growth
character is t ics of urban centers.
During the per iod 1951-81, the rate of growth of Khulna
was 44.15 per cent, Jhenaidh 31.75 per cent, and Dhaka 30.81
per cent \>fhich was high as compared to 21.46 pe r cent average
annual Rro\ifth rate f o r the urban population. But be fore the
introduction of new de f in i t i on of urban centers in some census
in 1981 the national average growth rate was 13.65 per cent and

m
Table 3.1: Urban Growth Character of the Selected Urban Gaiters
SI. Urban Population Annual rate of growth Nature of Urban No. Centers growth in _ — dynamics
per cent 1951-1981 1974-81-1951-81
1. Dhaka 924 30.81 15.00 Extra ordinary Faridpur 163 5.44 5.29 Normal
3. Tangail 260 8.68 7.06 Normal 4. Jamalpur 240 8.02 7.48 Normal 5. Manikganj 218 7.27 5.61 Normal 6. Narsingdi 414 13.80 12.85 Dynamic 7. Muktagacha 133 4.45 5.25 Normal 8. Netrokona 195 6.50 5.93 Normal 9. Modhupur 19 0.63 2.25 Declining 10. Mirzapur 15 0.50 1.58 Declining 11. Comilla 290 9.67 16.14 Extra ord inary 12. Sylhet 413 13.79 26.10 Extra ordinary 13. Noakhali 254 8.48 11.68 Dynamic 14. Rangamati 467 15.58 11.12 Dynamic 15. C o x ' s Bazar 404 13.47 12.62 Dynamic 16. Feni 473 15.77 11.87 Dynamic 17. Lakhmipur 87 2.91 , 10.12 Dynamic 18. Sunamganj 121 4.05 4.20 Static 19. Fat ikchar i 15 0.50 1 .82 Declining 20. Derai 13 0.45 1.71 Declining 21. Khulna 1474 44.15 7.01 Normal 22. Bar isal 94 3.12 10.88 DvTiamic 23. Jessore 524 17.47 11.40 Dj-namic 24. Patuakhali 368 12.27 11.01 Dynamic 25. Bhola 430 14.33 22.43 Extra ordinary 26. Barguna 91 3.05 8.93 Dynamic 27. M eherpur 229 7.64 6.84 Normal 28. Jhenaidh 952 31.75 5.85 Normal 29. Bheramora 14 0.48 1.63 Declining 30. Mirzaganj 11 0.37 1.27 Declining 31. Bogra 112 3.73 1.76 Declining 32. Dinajpur 182 6.07 8.05 Dynamic 33. Pabna 241 8.05 10.75 Dynamic 34. F^angpur 402 13.41 15.76 Extra ord inary 35. Naogaon 371 12.36 7.72 Dynamic 36. Sherpur 162 5.42 7.75 Dynamic 37. Thakurgaon 239 7.97 16.46 Extra ord inary 38. Gaibandha 187 6.24 6.34 Normal 39. Ishurdi 524 17.45 9.34 Dynamic 40. Porsha 21 0.71 2.04 Declining
^Coefficient of Correlation ( r ) = U.22

120
Rangamati (15.58 per cen t ) , Ishurdi (17.45 per cent ) , Jessore
(17.47 per cent ) , Feni (15.77 per cent ) , Bhola (14.33 pe r cent ) ,
Narshingdi (13.80 per cent) and Sylhet (13.79 per cent) were
also above the average l e v e l of urban growth. However , other
31 centers are below the national average l e v e l of urban growth.
The dynamics of urban growth i s shown in F ig . 3 .2. The s ize
of the c i rc l es i s based on the per cent of growth of population
during the per iod of 30 years from 1951 to 1981. Again, on the
basis of 1974-81, an annual grov/th rate and nature of urban
dynamics of e v e r y ind iv idua l urban centers have been presented
in column 4 and 5 r e spec t i v e l y in table 3.1. The tab le shows
that out of 40 urban centers only 6 are growing rap id ly
( e x t r a o r d i n a r y ) . The i r annual mean growth rate i s 18.65 per cent.
The centers are Dhaka (15.00 per cent ) , Comilla (16.14 per cent ) ,
Sy lhet (26.10 per cent ) , Bhola (22.43 per cent ) , Rangpur (15.76
per cent ) , and Thakurgaon (16.46 per cent ) .
Fi f teen urban centers show a moderate (Dynamic) rate
ranging between 7.5 per cent and 15.0 per cent. The towns in
this range category are Noakhal i , Rangamati, C o x ' s Bazar, Feni
and Lakhmipur ( in Chittagong d i v i s i on ) , Bar isa l , Jessore,
Patuakhali and Barguna ( in Khulna d i v i s i on ) , Dinajpur, Fabna,
Nae^oan, Sherpur and Ishurdi (in Rajshahi d i v i s i on ) and Narsingol i
( in Dhaka d i v i s i o n ) . Fr idpur , Tangail , Jamalpur, Manikganj,
Notrikona, Khulna, Meharpur, Jhenaidh . Muktagacha, and

Fig.3.2 Rejuan /"so

122
r
r
9'O'e
BANGLADESH
\
• yj
. A
STATUS OF URBAN DYNAMICS 1990
X) 0 20 AO 60 Kelometers
© • f
\e e /
rJ V
^ ' ^ / >
23N
I N D I A e ^
INDEX ^ ^ Declining Urban Centers
^ndnt Urban Centers
Q Normal/Slowly Growing Urban Centers
*^^Dynamic/Moderately Growing Urban Centers
• ^ ^ E x t r a Ordinary/Rapidly Growing Urban Centers 9,0 E
123
Gaibandha are normal growing urban centers, the i r growth rate
ranging between 5.0 to 7.5 pe r cent. Settlements with a rate of
growth of 2.5 and 5.0 per cent per annum have been grouped
as stat ic urban centers . But only one urban center f a l l s under
this group. This is Sunamganj in Chittagong d i v i s i on . There are,
l as t l y , declining urban centers, namely Modhupur, Fat ikchar i
and Mirzapur, two adminis t rat ive urban centers i . e . Bheramara
and Boyra, and three upgraded thana, i . e . Derai , Mirzaganj,
and Porsha. However , the o v e r a l l status of urban dynamics as
measured by urban growth indicates a signi f icant re lat ionship
between s ize of c lass and rate of urban growth ( t ab l e 3 . 2 ) .
The map 3.4 shows the quantity of urban population
change from 1951 to 1981 in each urban center. Except f o r few
centers (Dhaka, Khulna and Jhenaidh) , the growth rate was slow
to moderate. U n d e r ^ d e v e l o p e d economy is the main cause of
stagnancy of the urban centers. Moreover , i l l i t e r a cy or rural at'ea
and lack of other centr ipeta l factors l i ke - i l l drained phys ica l
s i tes , unhygenic condit ions, inadequate urban amenities are
af fect ing the pace of urban growth. The causes of high growth
rates in Dhaka, Khulna and Jhenaidh are bet ter health and
education f ac i l i t i e s , bet ter job opportunit ies, bet ter environmental
conditions due to proper sanitation and development of industrial
and commercial stabl ishments. For the same reason some of the
uld as well as new d i s t r i c t ht;adquarters have been growing at

124
F ig . 3.if Rejuan/'90

125
Tablo 3 .2 : Dynamics of Selected Urban Centers
Size of Number of Settlement
Size of class
Total Declining Static Normal Dynamic Extra ordinary less 2.5-5.0 5.0-7.5 7.5-15.0 15 and above 2.5% growth growth growth growth growth rate rate rate rate rate
I 9 0 0 1 4 4
II 8 1 0 3 4 0
I I I 14 1 0 4 7 2
IV 7 4 1 2 0 0
V 2 2 0 0 0 0
V I - 0 0 0 0 0 0
Al l 40 8 1 10 15 6
= 72.94-40 = 32.94 with d . f . ; s ignif icant 0.01 l e v e l
-Less than 5,000 inhabitants urban centers have been excluded from the study, which is under new de f in i t ion.

126
a slow to moderate ra te . Migration has not p layed an important
ro le in the urban deve lopment . It is much less when compared
with deve loped wor ld and even some developing countries. Most
of the urban population is the result o f natural growth, except
in some d i s t r i c t headquaters and r i v e r port oriented centers,
where immigration v/as f a i r^ l y h igh .
3 .2 .2 : Spat io-Temporal Patterns of Population Density in the
se lected Urban Centers
For better planning and development of urban centers,
the intra-urban pattern of density d istr ibut ion with relation to
spatial and temporal var iat ion is of great geographical
s igni f icance. The causcs and factors of concentration of urban
population are of great importance in the understanding of urban
dynamics.
A number of Western geographer as wel l as Indian
oeooraphers ha\'e attempted to formulate a 'dynamic mathematical
model ' to v i sua l i z e the internal and external mechanism of the
dynamics of density of the c i t i es . The contributions of Rees
(1979), Chapin and Stewart (1959), Be r r y , Simmons, and Tennant
(1963), Clark (1951), Hrush (1968) and Newling (1966) on the
spatial d istr ibut ion of population densit ies have descr ibed several
empir ical functions. Dutt ( 1987) has done an outstanding work

127
on desnity Gradient of Calcutta c i t y . On the other hand Brush
has pointed out four types of density d istr ibut ion in Indian c i t ies
through regression analys is . Subsequently, he had suggested an
application of new model to the analysis of population
distr ibution. However , the present attempt is the measuring of
population density and i t ' s var iat ion in the se lected 40 urban
centers of Bangladesh. The table 3 .3 . shows the spatio-temporal
var iat ions of dens i ty . The gross density of population per sq.km.
va r i e s among the urban centers. It va r i e s between - 1379 to
+ 5172 in 1961-74 and -2,586 to + 5,851 persons .per sq. km.
in 1974-81 per iod . National gross densi ty of urban population
is 3,592, 4,619 and 5,503 fo r the census year of 1961, 1974 and
1981 r e s p e c t i v e l y . It has been observed that the urban centers
with less than the average density were 52.5, per cent of the
total urban centers in 1961, 37.5 per cent in 1974 and 40.0 per
cent in 1981.
The temporal change revea ls that the density of
population had been increasing during 1961-74 and 1974-81. There
were few cases of decreasing population. This was so in some
small urban centers. Decreasing density of urban population has
been exper ineced in Jamalpur, Modhupur, Mirzapur, Cox ' s Bazar,
Lakshmipur, Bar isa l , Barguna, Meherpur, Bheramara, Mirzaganj,
Thakurgaon, and Porsha in 1961-74 period and Faridpur,
Mirzapur, K.it ikchnri, l)f3rai, Fatuakhali , Bheramara, Mirzaganj,
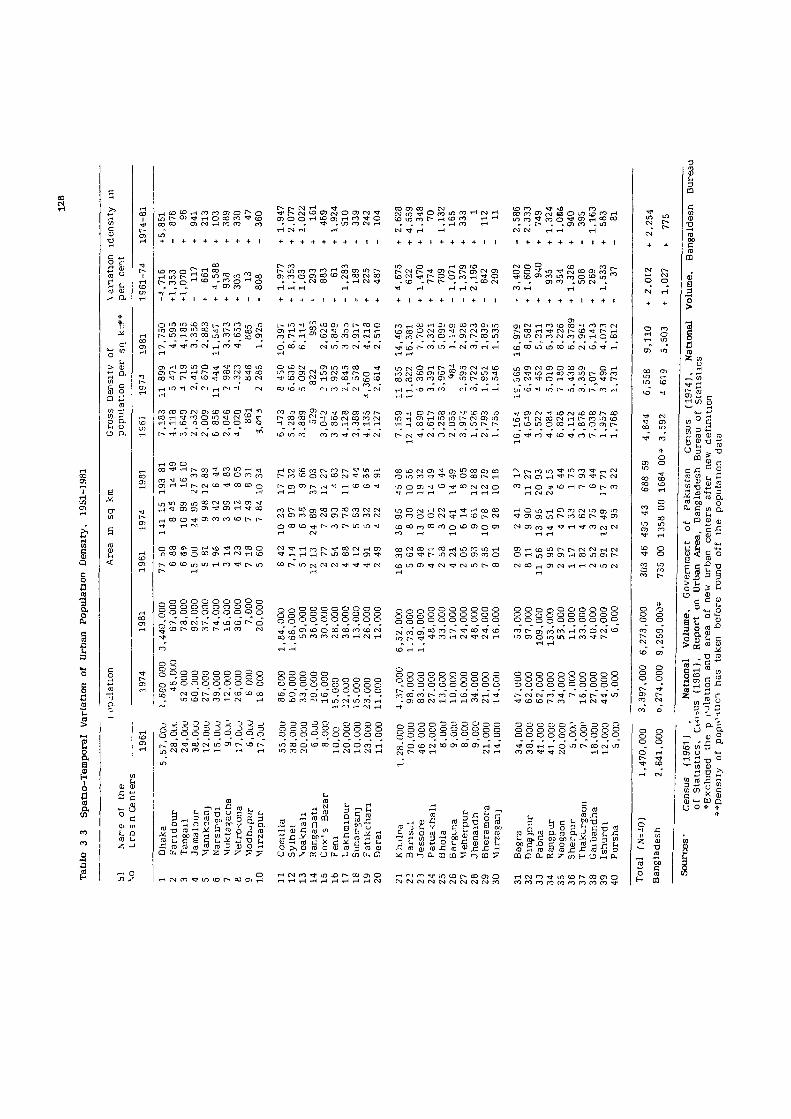
g 13
t-. t. tU QJ a
ti
& Q
C O o a
B M
L f j o o i ^ ^ o c o m - ^ C D COK) 01(Mr-(r0tr) CO
O »n to uD fO fO ro o lO CD CO to CO ^ lO [g CN
c-T-^a'-' 'fOCN^rOTji ^
CnOf-lr-ft^-^COOlxpCO 00' to^ a)rococM ^ lO 'I CM r-i ^ CV| -I cs,
rocoa?rvo>tDcoo; CO tH CO O lO -<.1 CN] J rHrHCO OOCOOO^
C r- (N rH rf ^ r^cM ioOo jOocN "^ - • , . If) no CN r-I
r ro fo c^mrofOfOj^oDCTjior^ cnroocnoococvjoocvjco . . . CM CO . rH (N
"o "I ^ to o) n I-'. CO o Ol'HtHjilCN^I nrHrHrH <r)r-«rH' tOCOCOCDrH«/) ocoto CMinrocMrPcM o to CM O) in <o CO ^ mcocyjOi ID c^vTOa^ •^toogTHcnooio^o^o CO <o If) r I fo cN r'l c j
^ o O} T) CO a> ir> l'>-C0C0f -l CDCMCOrOCM -H CMCO' OCOtHfOtHrH
C0O)00_CM rvJt/J'tf'OfrjUOrOr-tfsJrH COlDfOt^rHCOm tH«H . . . . rH rO 1-1 CS) rji r-f rH
U3 O tH O) CO
.«£) -r^t^ , . -copsj n rH rH rH CJ
ooco'^c^aomiDfOr^ inco^coO^O'y^coco - .r^ . -cnco .If) CM CnJ rH rH rH
I I
CM o 2 lO CO r - . O) CO . If) CM .
CO tH + I I I + I i + + + + I + +
ro tH O) CO CO O) If) UDCOCDfSJO'l CMCNCOfO rrmc^fOOrHcnt^coio la" to ^ rH rH
CO CO fo fo o lo r<» o> lo THt-IlOfOfO cirOr^rH
O? -r/ O CO U? fO O in cn rH lO lO l'"- CM C7) to 1-1 c o t o c v j o o i n o r -
o, tv>rHcoioco"(<*5fr>rM 0>ioc^icocMroo)*HOco
tCMCOr-lrH toCOmtDCOCDCMCO^rH
LDCDCNCDOCOCT) OrH a3'^4OrH00r0J/)r-C7>f0 lO'^l'^OrHTjiCOO'^t^ O) -I lO lO <n l- CO rH
•el a> ^ lo i£> CO i-^ CO (D -I 04 CO CM rH r- CO 10 UD ^tOLnOCOrHCOOO)! r-TCOCNCMUaCMTl ^ coioro fOCOTrCMrfrM t^cM'^OJt^'NCOrHCMrH lO^COrJ'CO««a'COC^THrH
rH CD O CO- rHc -CO" COLOrH^ fo CO CO O CO ro fO UD CnrHrHr-.CMtO' COCOo rH CM rH rH
^cooTro^cocotoc^r-"
nCO^O®«r>rHCMrHCD rv.CO<£)i/5iOrHCOr}<|>if) r-. rH
^OOOOOOOQo S o o o o o o o o o gOOOOOOOOo tOC CDCOOrHCO CS]
o y oOOOOOOOOo ^ - O O O O O O O o c-jtOOOOOOOOo m . . . • -Jo CMOt--a)£NU3COcO IT) CD CM CO rH CM r-t
rHCM^COt^COO^lTtrH r-»CO<^OfNlCOcM'3
r t-t rO rH
coi>coo>cocooorocMCM
COC£)cmo)5.O)'£?COO)CO Oir)CO'rf'T-3'OCOt>.rH mocnrl OrfCOcMCSJO
r-) r-f r-» rH rH rH rH lOOcM'^lC^rH'^'-^COCO 0)'^OOCMvf'-HC0[>.CM
r-f CM fSJ rH
rHOLf)rHO)rOC^Jlf)0)^
OCO rft' fOr lOin' t' CMO)fOT}''*l'rHTj'COcMf ^ —J I I I - I
CM-^r-frot^rTCOCSrHO) COC^COrHOOrrtincOlOrH (r)t0' l>L0CMO0)CV)O CDrHtD' Or-CMCMrHCN OrHif)0)cnTHcoino)c~' COr^tf)fsiCMCM'3''g'TrcvJ CMCO^O)CMTHrHCMm(N ^ ^
o o O o o o o o o o o o O o o o o o o o O o O O O O O O O O ^COO)<£>OCOCOfOU3CM C0to»^fOfOC^fOrHCMrH
o o o o o S S 2 S 2 0 0 0 0 0 OOOOOOOOOO a?' O ro' o' (15' ° ° C0c£>CO-- '«rHmrv}tOCOrH
" I .-I 'SI w
f - i f - ^ r - i O O O O O O O g g g o o o o o o o CM CO O) ® ^ ^ ^
o OOOOOOOOOO OOOOOOOOOO -OOOOOOOOO
O O O O O O O O O O O O O O O O O O O O o o o o o o o o o o
mo)oi f ) i r » rHco^c^
o o o o o o o o o o O O O O O Q O O O O o o o o o O o o o O ^ CM CM Co' CO c--' rr
- tCOCOC- CD rHCM'eJ'
^ 05 D CO s £ ™ u 3 > -O
C ^ s
ro w r XH
0 10 3
. s ' s : sS c'S
U1 0) a! £ c
O m L a CO L. -J
^ -o ^
QOOOOOOOOO
2 C a a u.
o o o o c d o o 2 2 O O O O O O O O O O o O O O O lOCOO^OOOOOcOrH IT) CO r-l ^ CM rH CM rH
c 3 S g ^ ^ ra tin « O a 3 ^ o. J <0
S*- O C 3 M „ ra ni, M o O 3 m OOtDrHtfl^r,-*-!,! —1
c S S u ^ S x j J : B H r) ^
— 4-1 w 3 0) o ..
~ 0) b 5 o >> o in
ra •H a " iS -•ram
2 Q j:; (u I/)
00- ,, g § g S CE: U CJU J (O
3 D M a
« c • (J
ca (D Ll. Q
T-4CMCOrfif)tOt OOa}r-l r-fr^rHrHf-lrHrHrHrHCM
r ^ j O O O O O O O o o § 8 8 8 8 8 8 S g g trCOCOCMCOOCOOTrHrr
0) £ U. V O (0 <0 I S i l
rsjCMClCMCMCMCMCMCMrO
o o o o o o ^ o o Q O O O O O O O O O O o o o o o o o o o o ^COrHrHOtOOCOCMlO CO CO TP Tj- CM rH rH
O CO
u ^ B H C ^ rH
U nvC 00 CO U £3 -J w 00 c: o (u 2 -H ^ ^ OrWflJflJm^-CdtSO cQQa.a -tnHOwOu
rHCMfOT}<if)cor cocr>o COCOCOCOfOfOCOCOCO'
^ iJ -D ° >>
C X 0) 0)»-. a Q U O tt tt

CO
CD
•a c c •c CI
H CS C2
c c
c o
o c-o CO re u CJ > < •a § o N
w w re
r-H u
TT
ro
S re H
rv, <n
vD <r>
03 CO CO I—I
" > " > §
< - 0 0
o c/; CD 4-' c 0) u
CO CO CO 1—1
> (D < - 0 0
O C CO
o-S Z 3
W u CD c o o
CO CO CD I—I u
(D >, CC J-. u CO -w I-L, CO in O C > CD < -a O
O c CD
• SD O I-, 2: D
CO u CD c 0 u
£/: tr CO CJ o N
•r-t 'S)
r- c CO cn O CO T—1 cn r CO cn CO o rH LC
- •• in o CO fO •
rH o o
CD
CO CO
o o
t-o
3 3
en
CO
CJ)
I> CO CO IN n cn C7) CSl CD LO CD CD CO CSI (M
CO
ro
CO UO oo r-3 O LO LO CO cn ^
CO o ^ OT cn un oo csi CM
cn oi CD cn CD cn cn CJ) cn - cn cn cn cn CSI -
cn o o o 4-' -t-j o
+-»
O o o o o 3 o O o O
- - O o LO o '
lO CM i-H ID
t .—1 > 1—( >
O O O
c CD
OT CO CD
>
o
CO ro
O
O) CM
o
CD
3
C o
CO I—I
CD U U O U
CD CD
Xi Q
CO a
CO 4-J 00
D CO CD U P
ra x:
CO 0) •a CO I—I
CJO c CO m
re E re c re £3 u
G
u o a o cu
CO CD
w 3 CO
c CD
U
•J U C-i
cS
CD >
(U
m o
re
c CO CJ
c CO
•J1
129

130
Bogra , Thakurgaon, Gaibandha and Porsha in 1974-81 pe r i od . The
negative var ia t ion i s the result of horizontal expansion of urban
centers.
In a l l the three census per iods , i t has been found that
only a few urban centers appear in the high density group,
whereas a cons iderable number of urban centers are in the lower
density group ( F i g . 3 . 4 ) . Only one small urban center (Nars ingdi )
has appeared in high density group v;ith a population density
of 11,547 per s q . km. It can be pointed out that this urban center
is based on small and cottage industr ies and is v e r y near to
Dhaka stat is t ica l Metropol itan Area and i s surv iv ing as a sate l l i t e
town. Sylhet , Noakhal i , Feni, Jassore, Bhola, Dinajpur, Pabna,
Rangpur, Naogaon, Sherpur, Gaibandha, f a l l in medium density
group with the population density 5000 to 10,000 persons per
sq .km. ( tab le 3 . 5 ) . The reason respons ib le f o r these medium
densit ies i s that these centers are bas i ca l l y , prominent d is t r i c t
l e v e l headquaters, have some natural resource and large scale
industries l i ke sugarcane, food process ing, chemical industries
etc. There are two exceptions in the case of Sherpur and
Gaibandha. Sherpur and Gaibandha are located in the pe r iphe r i e s
of big c i t i es and densely populated urban centers of Rangpur
and Bogra (F i g . 3 . 4 ) .
Less than 5,000 persons per sq .km. has been designated
as the low dens i ty . It i s ubiquitous in nature. But the spatial

131
pattern indicates that the south-eastern part of the country i s
r e l a t i v e l y dominated by less densely populated urban centers
and it i s c losc ly re lated to the average density of population
in the country. On the other hand^ urban centers l i ke Dhaka,
Nars ingdhi , Comilla, Khulna, Bar isa l , and BQgra are in the high
density group (table 3 . 5 ) .
Table 3.5:Urban centers of D i f f e rent Population Sizes Grouped
According to Density, 1981
Urban No. of Density per sq . km. s i z e class
Urban Centers 10,000
above (High)
10,000 5,000
(Medium)
Below 5,000 (Low)
Average density to the class
I • 8 4 4 0 10,871
II 9 2 3 4 7,587
I I I 12 0 3 9 3,810
IV 9 0 1 8 2,718
V 2 0 0 2 1,349
Total 40 6 11 23 5,703
Source (1981): Report on Urban Area, Bangladesh Bureau of Stat ist ics
There are s ix c i t i e s , four in class I and two in class II
category which have a high density of population. There high
densi t ies an; dun e i ther to the ir being tfie national ca[3ital or
d iv i s iona l head(iuarter, r i v e r por t , p laces of industrial a c t i v i t y

132
or due to the i r being o ld centers. Towns located on the main
redd or ra i lway or at the i r convergence or towns on r i v e r s or
sea ports have r e l a t i v e l y higher densit ies than the towns away
from these communication l ines. A v e r y interest ing and signif icant
relat ionship has been ident i f i ed between dens i ty of population
( r = 0.79) and the time of origin of towns.
A v e r y common wor ld -w ide thing obse rved is that the
big urban centers are more density_^ populated than smaller urban
centers. Harr is (1956) has ident i f i ed the pressure of res ident ia l
and industrial landuse, and has proved the statement. Another
character is t ic i s that the big c i t i es of the wor ld have also high
proport ion of housing types (through v e r t i c a l development of
houses) , and th is is re lated with the high density of towns.
Subsequently^ it i s also observed that dwel l ing density and
density of population were highest at the center of the c i ty and
that i t decl ined outwards: d is tance-decay is in operation (Clark, '
1951, Newling, 1969, Simeon, 1970 and Datt and D'Sa, 1987).
So, i t means, the smaller urban centers would have the less
agglomerative e f f e c t than the big c i t i e s and, the re f o re , lower
densit ies would be found, in 1961 , US census proved the above
re lat ionship. The corre lat ion between urban centers and density
of population have also supported the re lat ionship ( tab le 3 .6 ) .
In 19G1 the r value was 0.41 and it s l i gh t l y increased in 1974
( r = 0 .43 ) . In 1981 the r value further rose to 0.55, indicating

133
a moderately high relat ion among the var iab les and these are
tested in one per cent s igni f icant l e v e l . Thus, temporal sh i f t
of urban center on the basis of density group has been shown
in table 3.6.
Table 3 .6 : Urban Centers of D i f f e rent Density Groups in 1961,
1974 and 1981
Census Years
Density per sq .km.
10,000 and above (High)
10,000 to 5,000 (Medium)
Below 5,000
(Low)
1961
1974
198]
2
5
6
7
10
11
31
25
23
Source: Sane as of table 3.3.
The table shows that there were only two urban centers
in high density category in 1961 and the i r number has gradual ly
increased to f i v e and s ix in 1974 and 1981 r e s p e c t i v e l y . In the
same way, medium group (10,000 to 5,000 population density per
sq. km. there were seven urban centers in 1961 but the i r number
increased to ten and eleven in 1974 and 1981 r e s p e c t i v e l y . In
the lov, density category the situation i s r e v e r s ed . There \/ere
31 urban centers in th is category in 1961 but the number duclinod
to 25 and 23 in 1974 and 1981 r e spec t i v e l y .

134
3.2 .3 : Age Composition
The age composition d isp lays important demographic
character is t ics of urban population. Its b io log ica l and physica l
elements a f f e c t the urban dynamics. Growth or dec l ine of a c i t y ,
in fact , depends upon f e r t i l i t y , mortality and migrations. But
''a part icular age-sex distr ibution in e f f e c t sets certain l imits
on the l e v e l s of f e r t i l i t y and mortal i ty in a population, and by
extension of the argument, on the growth or dec l ine of a c i t y .
For example, a c i t y with a substantial share of i t s population
over f o r ty is l i k e l y to have a lower rate of natural increase
than a c i t y with proport ionate lv more people in the young adult
ages (Browning, 1961). The impact of such rate, is carr ied on
throughout the generations.
Age composition also determines the nature of
migrations. It encourages or discourages the movement Spec ia l i ze
of people for s e l e c t i v e employment or for higher education.
Because of migrations, young adults decrease in areas from where
they emigrate and increase in areas where they immigrate. Young
adult age group also inv i t es ac t i ve male population from rural
area as a chain migration. So age i s v e r y important factor for
urban dynamics. However, on account of the l imitat ions of
detai led census data f o r euch urban area, only four categories
of age groui) are considered and on that basis median age
population has bc.c.n calculated. Temporal changing pattenrs of

135
median age population of the se lected 40 urban centres is worked
out in the table 3.7 and the age composit ion categories with
the median age calculation technique are shown in appendix 3.1.
Median age is an important index to measure the urban
growth dynamics of part icular urban p lace . Bas ica l ly , i t he lps
to explain the young or old character i s t i cs of population.
However , a l l the three census years indicate the young character
of population. The temporal ana lys is in tab le 3.7 shows the
gradual decrease of median age, but the condition in lower l e v e l
urban centers i s s ta t i c . Age composition var iat ion in the urban
centers shows a c lose and pos i t i v e relat ion with the s i ze of
the town as shown in table 3.7. The analys is states that the
adolescent migration i s gradual ly increasing in the higher order
urban centers for jobs and education.
3 - 2 . 4 Sex Composition
Sex rat io is an another important aspect of demographic
structure in the urban dynamics. Imbalance in sex-ra t io a f f e c t s
the growth tests of urban populations. The imbalance is caused
e i ther by d i f f e r en t i a l b i r th rates or by d i f f e r en t ia l death rates .
Centipetal or centri fugal factors of migration is another cause
of imbalance in urban sex rat io . Youthful male group migrate
in urbann area tor better j ob opportunit ies or for h igher
education in the developing economy. Imbalance in sex
composition Uvuis to certain adve r se e f f e c t s spec ia l l y in soc ia l .

136 Table 3 .7 : Median Age of Urban Population in Selected 40 urban
centers, 1961, 1974 and 1981.
Name of Urban Centres
1961
Median Age
1974 1981
1. Dhaka 20.37 19.9 18.7 2. Far idpur 18.13 17.4 17.2 3. Tangail 19.25 19.1 16.9 4. Jamalpur 18.87 18.0 16.6 5 . Manikganj 18.65 18.6 17.5 6. Narsingd/7? 19.42 19.3 18.9 7. Muktagacha 17.36 17.0 16.3 8. Netrokona 17.75 17.4 16.5 9. Modhupur 17.38 17.5 17.4 10. Mirzapur 17.89 17.9 16.9 11. Comilla 18.97 18.5 17.9 12. Sy lhet 17.63 17.3 17.5 13. Noakholi 17.47 17.1 16.8 14. Rangamati 21.04 20.1 17.0 15. Cox ' s Bazar 18.08 17.6 16.9 16. Feni 21.38 17.5 16.7 17. Lakhmirpur 17.54 17.5 16.9 18. Sunamganj 17.16 17.0 17.2 19. Fat ikchar i 17.87 18.1 16.7 20. Derai 17.05 17.1 17.2 21. Khulna 19.95 19.4 18.6 22. Barisal 19.34 19.6 17.0 23. Jessore 17.59 17.3 17.0 24. Patuakhali 18.83 18.2 16.8 25. Bhola 18.07 18.9 17.5 26. Barguna 18.98 18.7 16.9 27. Meherpur 17.82 17.5 16.7 28. Jhenaidh 21.35 20.0 19.6 29. Bheramara 27.66 17.1 16.7 30. Mirzaganj 17.21 17.2 16.2 31. Bogra 17.13 17.3 16.8 32. Dinajpur 17.49 17.3 17.0 33. Pabna 18.43 17.4 16.5 34. Rangpur 17.99 17.4 17.1 35. Naogaon 20.34 17.6 16.7 36. Sherpur 16.94 16.8 16.2 37. Thakurgaon 16.19 18.0 17.0 38. Gaibandha 17.92 17.5 16.8 39. Ishardi :J.14 19.9 17.2 40 Porsha 16.85 16.9 16.4
Coe f f . of c o r r ( r ) 0.28 0.41 0.58
Source: Same as table 3. 3, but subsequently computed from the or ig ina l age group data.

137
economic and community l i f e . Increase of adolescent male group,
subsequently a f f e c t s the natural growth rate and as we l l as leads
the immigration in urban centers. F ina l ly , s ex - ra t i o influences
the reproduct ive performance, and determines the migratory
character .
The tab le 3.8 shows the sex rat io of the se lected for ty
urban centers in Bangladesh. The comparative data of the three
censuses ( i . e . , 1961, 1974 and 1981) shows that female sex rat io
increased in 1974 over the 1961 and s l i gh t l y decreased in 1981
in most of the urban centers. Big urban centers l ike-Dhaka,
Comil la, Sylhet e tc . a re character ized low female sex rat io
but small urban centers show a v e r y small male-female d i f f e rence
( t ab l e 3 . 8 ) . This may due to high rate of male immigrants
in big c i t i es . The table also shows that the female populations
have increased in 1974 and 1981 compared to 1961. Due to the
high rate of male death in the l iberat ion war of 1971, the
number of females has r isen-up. Moreover, low rate of m^erna l
mortal i ty in recent decades and high rate female immigration
to c i t i es in garment fac tor i es and other assembling job have
inf lated the rural-urban migration. In 1974-75 there was nation
w ide famine and during that time mostly males migrated in urban
areas for subsidized rationing, job opportunit ies , deter iat ion
of law and o rder situation in rural areas that resulted in the
reduction of female sex rat io again in the subsjgquent census,
1981.

138
Table 3.8: Sex composition of selected 40 urban center^38of Bangladesh (Number of Females per 1000 Males)
Urban Centers Number of Females pe r 1000 Males
1961 1974 1981
1. Dhaka 617 725 718 2. Faridpur 807 891 888 3. Tangail 896 890 879 4. Jamalpur 901 900 884 5. Maniksani 918 893 841 6. Narasingdhi 855 633 785 7. Muktagacha 899 917 886 8. Netrokona 779 795 835 9. Modhupur 932 951 905 10. Mirzapur 986 954 861 11. Comilla 735 834 779 12. Sylhet 733 758 794 13. Noakholi 808 752 803 14. Rangamati 441 689 717 15. Cox 's Bazar 734 783 886 16. Feni 583 584 852 17. Lakhmipur 797 858 831 18. Sunamganj 735 784 865 19. Fatikchari 825 856 855 20. Derai 870 948 939 21. Khulna 625 745 762 22. Barisal 676 825 719 23. Jessore 637 791 869 24. Patuakhali 734 828 775 25. Bhola 691 745 795' 26. Barguna 753 755 885 27. Meherpur 903 934 885 28. Jhenaidh 757 853 835 29. Bheramara 831 877 861 30. Mirzaganj 859 894 915 31. Bogra 857 888 788 32. Dinajpur 787 906 860 33. Pabna 882 920 903 34. Rangpur 768 863 865 35. Naogaon 876 893 795 36. Sherpur 906 951 865 37. Thakurgaon 742 799 845 38. Gaibandha 821 884 825 39. Ishardi 819 724 815 40. F'orsha 990 952 921
Coef f ic ient of c o r r ( r ) -0.32 -0.24 -0.43
Source: Same as table 3.3.

139
Out of 12,536,000 urban population 7,527,000 are males
and 6,009,000 are females. The sex rat io i s 789. But the
o ve ra l l national sex rat io is 942. The table 3.8 shows the
imbalanceness in the sex - ra t i o in the urban centers of Bangladesh
since 1961. Sex-rat io genera l ly va r i e s with the s i ze of urban
centers. Big c i t ies have a dominance of adult males. The s i ze
of c i ty and the sex - ra t i o inve rse l y corre lated with the female
sex and th is general ized phenomenon has been proved in
Bangladesh c i t i es , by the coe f f i c i ents of correlat ion ( r ) . The
re lat ionship between s ize of the c i t i es and sex ra t io for 1961
( - 0 . 3 2 ) , 1974 ( -0 .24 ) and 1981 ( - 0 . . 4 3 ) show the medium degree
of negat ive re lat ionship . Th i s trend r e f l e c t the migratory
character of male population in b igger urban centers . Young
males migrate to big c i t i es for better opportunit ies of job,
education, and other f a c i l i t i e s . Never the less , a great deal of
imbalance in female element in the composition of population,
i s associated with the mechanism of urban dynamics through
invi tat ion of young male group that helps to boost the urban
population.
The analysis of sex composition r evea l s that in none
of the urban centers in any decade since 1961, the females
outnumbered the males. The background study s i gn i f i e s that
men are migrating to urban centers to supplement the i r fami ly
income from non-agricultural sources, and the females counterpart
are l e f t in the v i l l a g e s to look a f t e r the fami ly and the
agricultural a c t i v i t y . The system of joint family in v i l l a g e s .

140
some social norms and taboos, and housing shortage and rental
costs in urban areas mitigate against women's migration are also
to c i t i es , and result a low female sex ra t io . Young male of
the cit ies/towns inv i tes the rural peoples for bet ter j ob ,
uducalion and other f a c i l i t i e s in urban ccnters. As a result
a certain l e v e l of accelerat ion of urban dynamics can be
v i sua l i zed with re lat ion to s i ze and s i te of urban centers in
Bangladesh.
3 .2 .5 Dependency Ratio
Dependency rat io measures the number in the ac t i v e
ages compared to those in the dependent age groups (Browning,
1961). The dependency rat io i s important economic index to
i d en t i f y the burden on the economical ly ac t i ve age group of
the population. The normal procedure of calculation of
dependency rat io for the developing countries is :
Dependency ratio = - ^ ^ ^ i ^ s f s V y r s f ^ ^ ^
I'hu table 3.9 enables us to have an idea of s ize class
of urban settlements and dependency rat io of population. The
temporal patterns of dependency rat io shows the gradual
increase of dependency in a l l urban centers except Sylhet .
Th i s i s due to v e r y high rate of in-migrat ion in the lower l e v e l
age group. The results of cnef f ic ient of correlat ion ( r ) indicate

141
Table 3.9: Dependency rat io and s i ze - of urban centers 1961,
1974, 1981.
Size class Average dependency rat io Size class
1961 1974 1981
I 83 86 102
I I 84 94 103
I I I 89 92 106
IV 92 90 109
V 94 105 104
VI 102 - -
jjj Coef f . of c o r r ( r ) - 0.35 -0.45 -0.35
Coef f ic ient of corre lat ion has been calculated between indiv idual urban centers and dependency rat io .
a low degree of negat ive relation between dependency ratio and
s i ze of the urban centers. It again s i gn i f i e s high rate of
migration in age group 15-59. Overa l l dependency rat io was
low in 1961 (91 .1 ) and 1974 (93.4) as compared to 1981 (105.1 ) .
But the dependency rat io increased with the decrease in the
h ierarch ica l status of the urban centers. Big urban centers
are character i zed by high rates of immigrant, i . e . , young
poo[)lc;s are migrating more towards urban centers to supplement

142
the i r fami ly income from non-agricultural sources. So, the
dependency rat io is gradual ly decreasing with increasing the
s i z e of towns. But the • dependency rat io is increasing with
re lat ion to t ime ( tab le 3 .9 ) in a l l t ypes of urban centers
except 1974 in class IV tov/n, i . e . , s i z e of the towns are
inve rse l y corre lated wi th dependency ra t i o . So, the dependency
rat io i s playing a v i t a l ro le to ident i f i cat ion the nature and
character of accounting of urban dynamics.
3 .2 .6 L i t e racy
L i t e racy p lays a v e r y s igni f icant ro le in dynamics.
Def init ion of l i t e racy has been changing from census to census.
In 1981 census a person was considered l i t e ra te if he/she could
" w r i t e a l e t te r in any language". On the other hand "a person
can read, w r i t e and understand in any language has considered
as a l i t e ra te in 1961 and 1974 censuses". The National urban
l i t e racy is 40.30 per cent for both sexes , and 48.28 per cent
and 29.96 per cent males and females r e s p e c t i v e l y . But the
l i t e racy rate i s considerably h igh in urban areas. Sunamganj
(51.7 per cent ) , Fat ikchar i (61.6 per cent ) , Bogra town (60.1
per cent) have the highest l i t e racy rates, fo l lowed by Barisal
(57.7 per cent ) , Feni (55.1 per cent ) , Sunakganj (51.7 per cent ) ,
Patuakhali (51.6 per cent) , Faridpur (51.3 per cent ) ,
Gaibandha (51.1 per cent ) , Rangamati (50.0 per cent ) , e tc . in
the 1981 census. But the male l i t e racy rate is h igher than the
female l i t e racy rate in al l cases.

143
According to 1974 census, 30.8 per cent males and
13.2 per cent females of age 5 years and above are reported
to be l i t e ra te in the rural areas (BBS, 1977}. The comparable
f igures in urban areas were 52.0 per cent and 33.7 per cent
r e s p e c t i v e l y .
Tab le 3.10: Average l i t e racy rate and s ize of Urban Centers
1961, 1974, 198l '^
Size and c lass Percentage of l i t e rates to the total population
1961 1974 1981
Case I
Above 1,00,QUO 41.1
Class II
50,000-1,00,000 39.9
Class I I I
25,000-50,000 39.2
Class IV
10,000-25,000 31.3
Class V
5,000-10,000 34.1
Class VI Below 5,000 22.1
45.9
4^.0
48.9
35.9
28 .6
47.8
45.2
43.4
38.7
24.8
Cootf. of c o r r . ( r )
0.19 0.14
Purcontagu uf pc)[)ulation 5 to 24 years attending school .
Coclticient of correlat ion ( r ) but\^e(jn indi\"idual urban ccmters arui rate at literacy has been ra lcuiated.
144
The table 3.10 p rov ides l i t e racy rate (5 years'^] of
urban population by s i ze class of urban centers. It appears
frora the table that the i r i s v e r y close re lat ionship between
s i ze of urban center decreases, the percentage of l i t e ra tes also
decreases. The temporal pattern shows that l i t e racy is
increasing with e v e r y census per iod , except in class V towns
which show an opposite trend. But the coe f f ic ient of correlation
between ind iv idua l urban center and rate of l i t e racy shows
a v e r y low pos i t i v e re la t ionship . The analysis r evea l s that
the l i t e racy rate is having influence on urban dynamics but the
influence is poor.
There are a few factors responsib le for h igher l eve l
of l i t e racy in the urban centers of h igher s i ze -c lass .
i . Higher the s i ze -c lass , greater the concentration
of learning places such as schools, co l leges , un ive rs i t i es .
i i . Higher the class h i e ra rchy , h igher is the
p robab i l i t y of jobs and hence need for education.
i i i . Highly educated parents also want the i r chi ldren
to get h igher education and natural ly the h igher l e ve l of
educational institutions are ava i l ab l e in h igher o rder urban
centers.
The factor of education thus influences the urban
dynamics.

145
3.3. OCCUPATIONAL STRUCTURE
Th is section of the chapter t r i es to analyse the
economic ac t i v i t i e s which have made urban centers dist inct from
rural areas . D i f f e rent ac t i v i t i e s have employed vary ing
percentages of peop le in d i f f e rent urban centers . Depending
upon the economic character , urban centers appear spec ia l i zed
or d i v e r s i f i e d . Variat ion in economic character are caused
by d i f f e rent phys ica l , demographic and socio-economic conditions
of the urban centers.
D i f f e rent t ypes of employment opportunit ies o f f e r red
and wide range of poss ib l e earning are charac ter i s t i c features
of the urban environment (Gamier and Chabot, 1967). Here
an attempt has been made to study the above mentioned aspects
through analysing the occupational pattern, .employment and s ize
of urban centers, changes in occupational structure, and fu-
nctional c lass i f i cat ion of urban confers.
3 .3 .1 Def init ion of Occupation
A great v a r i e t y of ac t i v i t i e s are spa t ia l l y d is tr ibuted
o ve r the ( jar th 's surface in rural and urban p laces . There
ac t i v i t i e s engage peop le as an ac t i ve gainful work force and
provide:', the.r.i with the moans of their l i v e l i h o o d . The gainful
ectinomir ; i ( , t ivity not only bring money to the; ac t i ve \.i)rk toree
for mecitiii); the i r basic needs rather p rov ide thorn a social
146
status. Mukherjee and Singh (1954) have def ined occupation
as " the name of the function which a person performs by
engaging himself in that part icular branch of gainful economic
which is h is industry " .
3 .3 .2 Employment and Town Size
Size of the tovm p lays an important ro le in shaping
the character is t ics of urban centers as is ev ident from the table
3.1 1. The maximum percentage of workers to the total
population is noticed in the class I c i t i es , i . e . 35.11 per cent
of total population. I t shows that the large urban centers
encourage the movement of people for better job opportunit ies .
As a result the male adult population increases in high order
urban areas, and the dependency burden goes down. The
situation of dependency burden is reversed in lower order urban
centers. Undoubtly, some of the jobs are res t r i c ted for l i t e rate
person only and due to that a pos i t i v e corre lat ion ( r = 0 .52 '
has been found in coe f f i c i ent of corre lat ion between l i t e racy
and pcrcfint of [jopulation in t e r t ia ry a c t i v i t y . On the other
hand uncmpUiy tnent rate is playing a negat ive ro l e with the
s i ze of the tov/ns, i . e . , the percentage of unemployment
dec:rc!r!si;s as the c i t i es got l a rger . The coe f f i c i ent of
/9 7V
corre lat ion is -0 .2 -0.31 and -0.19 for the year 1961,^ anc
19nl r( ' ; ; [ )ccti\'ely.

10 V m s s u 00 m 13 §
la CD
T3 ra
m O
t
s u
o IH 3
r-H
9
£ 3 O ?
(1) in
u CO
u 0) H
CJ Q) CD
>. U CO •a c o u CD If)
cororo^>OcoaDtHroo coro 'OrHa*r--poincN)ocOu3tH(OoocorHcr»r
rr
lo in -r *-}' CO lO in --i' ro 'i' ro (r> t^Mo lO in 'O ro ro ro iJO ir> lo in in f'l ro n cn
VJ iw r-- a> CD "T CC CO U ro rH C" OD rsl CNJ O) CO O O lO CT) rH r ^
<^(^CNiMcv]cocN3CN]c^THrHroroc^fnfOT-(roc<j Tj'roroc^Jcsroc^jrocvJrHCNrocNJCNJCsjcNJC^c^icsi
• -xj' V--1 VJ- J -"J- k. I -
csi csj CNJ (N ro ro csj csj rH ro rn ro CNJ csj CN CS3 » •••J V1 -VJ' \ - Wl \JI ^ \ \" J V -—J » —V T—> \ J \4-< J f )rocNTHrororofN)rHror^CN3rsiCNCNiroforO(>]CNC^CNCN
in rji (TO th in ro CO w o oD 03 rH lo a? tM CO CO <n 'n lo o in CO ro CO t* O t O in ^ fO M (>i to in in csj 03 (O rH c CO O) cn ro O CO CO (X) t- CO r ' ^ • f o r owro ro rocNCNrH fO fO fo roc^ fO tH fncs rQfr3fOcscMmf>qfocsi-4rororomrNrjCN<r>cs)
cocoowmo'^OrHroo'^a^cncDcsjrHcocDrf «30cNjLncorrc>Jor^c^^roincr)coroCT)inco
rHfNrOrHC^lfNOJ'^l'TH r-<T-<THrHin(NrOUDrJ' rHrHCNfOCNrO^' tHTHrOCOrOCNCNU^
(o ri rH ri CO CO CO ^ m fo CO 'O -t' O") -i' m m -r CO ro ( - ro -I' I - lo 'G -f ' ? J, -!• ' J <u • • h <r, -I' 'O ( - '7M - ro ir •jj in in »"« r-t r" -r T o »
^ J, T-
t>l rsi -t' r- i -J -}. O ^O .
in -n -f r r- rn 'O r- T) rM f>} ro "-f C J ^ g 'U
ccOcomrsJcoc cNcn.-oco • -- — - ^ ^ I ^ I T—1 \ - -J! I. -I f-H fN ro r cs CO
a o •d ra a B S
m
0) a
u Q) U. t: (0 S O r-5 g S S --> ! J
_ O (n a:
Q.:; a a m •r-t oo ™ raL.cE ti ro ra . ^ I-,
CD 'C'—i -fi ra r: -o u c ra on o DO g" 00
M
bo S tn u
ra ra (0 3 CJ
y
3 kj
-O c. O o u
ra « ra E: 0) -C n) x: y. ai
> Q OJ if) ^ X
ra N ra CQ
e ?P
i ra ra 4) C ra
Q) L. ra r. ra
r.
•J n.
J: •o ft r c ra L.
Q. u ra ra D 01 ra (0 ra ••0 c/} oj: 01 c i.4 ,-0 L ra c; c <A o t. r: OJ 0! 1-or ra c; a iJ ra .ra x: JS CO ra a. a CC m 2> 03 a a.
x: ' J
iB fU -rH
r -c b. ^ ou an C, O . . y ...
fo x: ifi o ce (/) H o w 0-
r-«

148
3.3 .3 Basic Occupational Classi f icat ion
The three basic occupational components of an urbar.
center can be stated, as pr imary , secondary and t e r t i a r y .
Eve r y urban center has certain socio-economic character is t ics
resulting from the phys ica l landscape and resources of the
area, which together lead to d i v e r s i f i c a t i on of economic
a c t i v i t i e s and to occupational pattern. The author has accepted
the Indian census' c lass i f icat ion of workers ; which d i v i d e s
the occupations into three basic groups: pr imary , secondary
and t e r t i a ry and further d i v i d e s these into nine industrial
categories (census, 1986):
I - Pr imary sector
1. Cul t ivators ;
2. Agr icultural labourers;
3. L i v e s t ock , f o r es t l y , f ishing, hunting, plantation, orchards
and a l l i ed ac t i v i t i e s ;
4. Mining quarrying;
n - Secondary sector
5. Manufacturing, processing, serv ic ing and repa i rs -
a. Household industry;
b . CKher than household industry;
t). Con;; true I ion;

149
I I I - T e r t i a r y sector
7. Trade and commerce;
8. Transport , storage and communication;
9. Other s e r v i c e s .
3 .3 .4 Urban Occupational Structure
In o rde r to apprec ia te the changing pattern of
occupational structure, three consecutive census (1961, 1974
and 1981) data f o r the occupational structure have been
presented in tab le 3.12. The data shows the percentage of
workers in p r imary , secondary and t e r t i a ry a c t i v i t i e s . Three
separate graphs for the year of 1961, 1974 and 1981 and a map
fo r 1981 has been drawn to show the real p ic ture of pr imary ,
secondary and t e r t i a r y sectors , f o r the se lec ted f o r t y urban
centers. A l l the three graphs ( 3 . 5 l , 3 .S i 8 3 . 7 ) show the
large s i ze urban centers have a h igher percentage of population
in secondary and t e r t i a ry sectors , whereas small urban centers
show a dominance of people in pr imary sector ( t a b l e 3 .11 ) .
P r imary sector
Pr imary sec tor , includes the cu l t i va tors , agricultural
labourers <ind the persons cjngaged in quarry ing , mining,
l ivust( ,ck and f o r e s t r y . It is s igni f icant in Forsha (61.28
per ( i -nt ) ; Lakhmi[Tur (54.11 per cent ) , Mirzapur (41.23 per
ccMit), Fa t ik rhar i (39.99 per cent) and Mir/.aganj (37 .09 ) . Hut
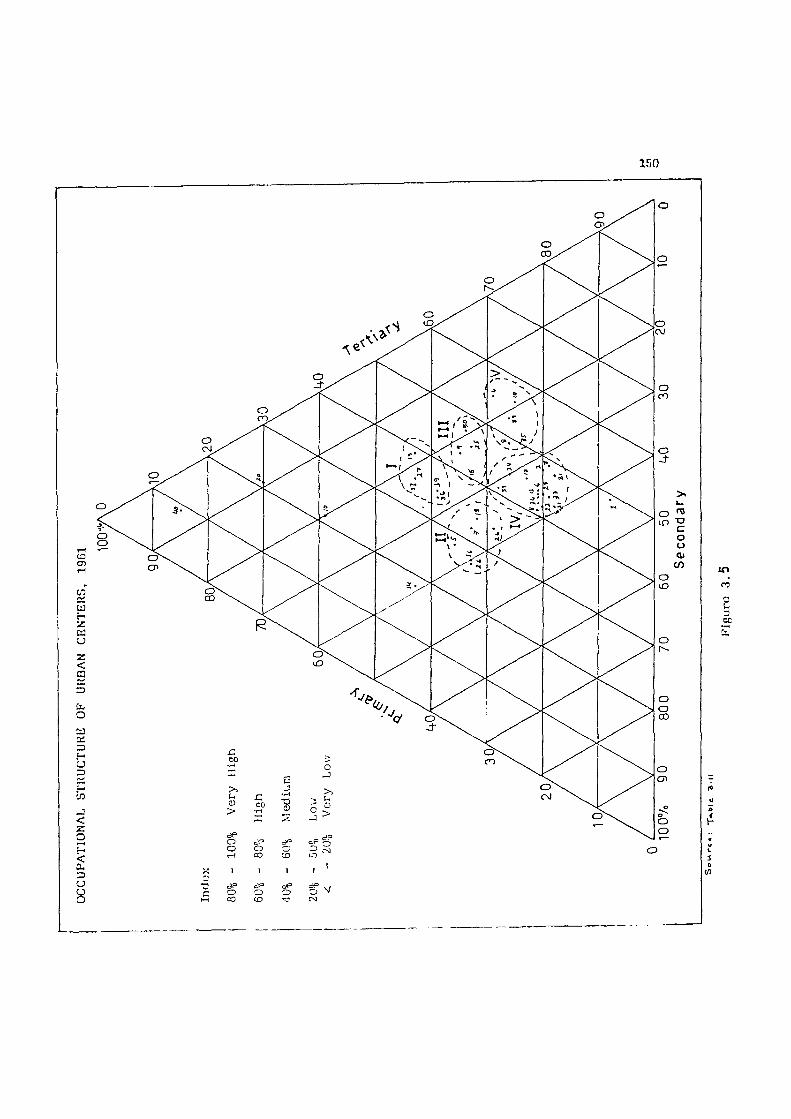
150
o O)
u H 'Z. Cd U 2 < ffl
ta O a Qi P H O c; in J < z: o <
a-CJ 8
£ 00
>1 l-l a) >
•C df p - ( C O
j:; 00
o CO
o CO
•a o
o CO
dp o
o J
o CJ
o CO
o J-
O ™ ir> ^
o 0 01
CO o iD
O
o o CO
o cn
o o

151
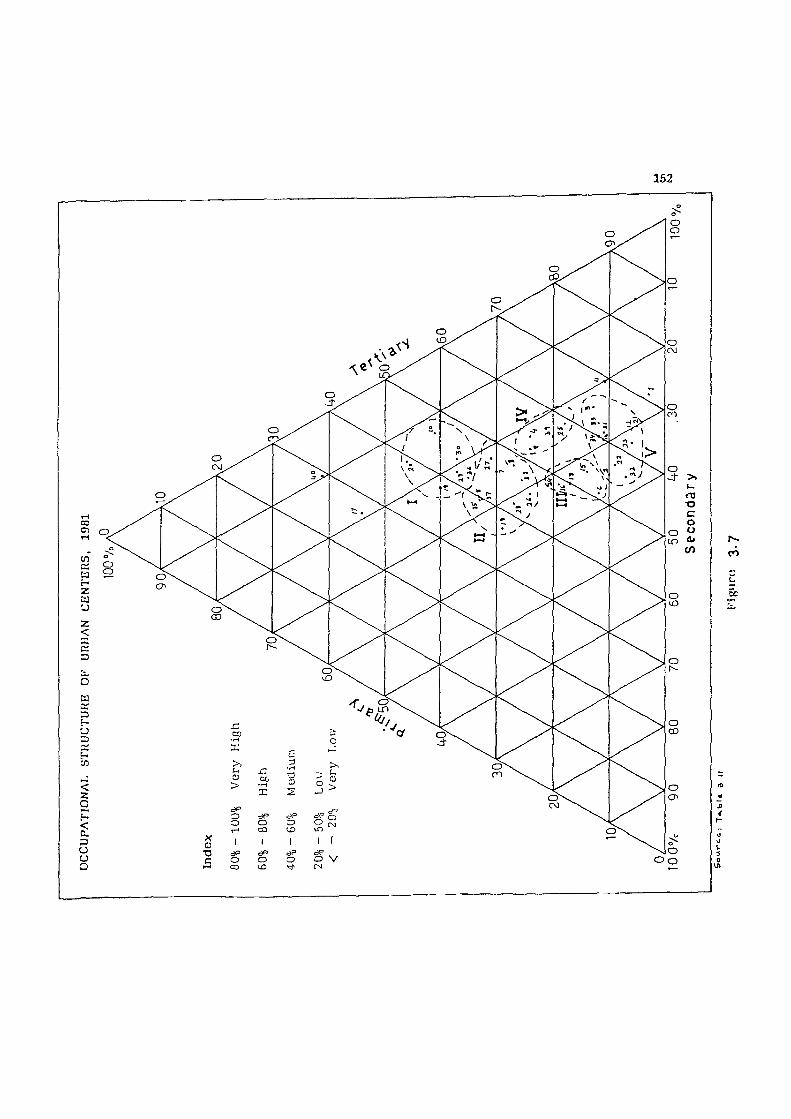
152

153
on the other hand the agricultural w o r k e r ' s percentage i s v e r y
low in Dhaka (2.68 per cen t ) ; Khulna (4.69 per cent) and
Sylhet (5.64 per cent ) .
Tab le 3.12: Urban Centers on the Basis of Workers Engaged
in Primary Sector by Size-Class, 1981.
Class Size of Urban Centers
Percentage of workers engaged in Pr imary Ac t i v i t i e s
Total 20 20-40
Very Low low
40-60 Medium
60-80 80-100 High Very
High
I
I I
I I I
IV
V
VI
5
5
4
6
7
1
1
2
9
12
9
2
Total 18 18
Coef f ic ient of correlat ion ( r ) =
0 40
- 0 . 2 8
Tab l e 3.12 shows that class I , c lass I I and class I I I urbar.
centers have v e r y low percentage ( l e s s than 20 per cent) of
workers in pr imary sector . Within the higher c lass on]>
Lakhmipur ((Jlass I I I town) shows a medium percentage ir.

154
pr imary a c t i v i t i e s . Another two urban centers (M i r zapur and
Dora i ) in c lass IV a lso f a l l in the medium t ype , 40 to 60% in
p r imary a c t i v i t y . High dominance (60 to 80 pe r cent ) of
p r imary a c t i v i t y i s found in Porsha town. None of the urban
center , i s in v e r y h i gh (80 to 100 per cent ) ca tegory of
p r imary a c t i v i t y .
Secondary sec tor
Secondary sector comprises
household industry and manufacturing.
of construction,
Tab l e 3.13: Urban Centers on the Bas is of Workers Engaged
in Secondary Sector by s i z e - c l a s s , 1981.
Class s i z e of Urban C a t e r s
20 Very Low
Percentage o f w o r k e r s engaged in the Secondary A c t i v i t i e s
20-40 Low
40-60 Medium
60-80 High
-Total 8 0 - 1 0 0 Very High
I
I I
I I I
IV
V
VI
1
3
1
/
9
11
6
1
Tota l 6 34 Cof j f f i c iunt of ccjrrelation ( r )
8
9
12
9
2
40 3.02

155
There is no town in the medium, h igh and v e r y h igh category
of economic ac t i v i t y ( tab le .3,13). Out of total 40 urban centers
in secondary a c t i v i t y , 6 centers have v e r y low and 34 have
low dominance of secondary a c t i v i t y . But within the low
dominance in 34 urban centers, 7 are class I , 9 class I I , 11
class I I I , 6 class IV and only one in Comilla, shows a low
dominance of secondary a c t i v i t y . Three towns from class IV
category and one c lass V have v e r y low secondary a c t i v i t y .
There i s s igni f icant re lat ionship between s i ze of the^ urban
centers and secondary a c t i v i t y . The coe f f i c ient of correlat ion
i s 0.02 only (Tab le 3 .13 ) .
T e r t i a r y sector
Ter t i a ry sector includes a l l those a c t i v i t i e s which
deal with the co l lect ion, transport and storage of goods and
a l l types of s e r v i c e s . Occupational patterns of 40 urban centers
i s dominated by the t e r t i a ry a c t i v i t y . A large major i ty of
urban centers have more than 50 per cent of the total workers
engaged in the t e r t i a ry a c t i v i t y .

156
Table 3.14: Urban Centers on the Basis of Workers Engaged
in Ter t iary Sector by Size-Class, 1981.
Size class of Urban Centers
Percentage of workers engaged in the Ter t iary Ac t i v i t i e s
20 Very
20-40 Low
40-60 Medium
60-80 High
80-100 Very High
Total
I
I I
I I I
IV
V
VI
2
2
1
1
7
9
7
1
7
2
1
1
9
12
9
2
Total - 5 25
Coef f ic ient of correlation ( r ) =
10 40
0.38"
Significant at 0.05 l e v e l .
Very low and v e r y high dominance of ter t iary ac t i v i t y i s not
observed in any town ( table 3 .14) . Large urban centers are
characterized by larger percentages in t e r t ia ry a c t i v i t y , and
small towns are dominated by low percentages of workers.
Total number of urban center i s 40. Of them 5 low dominance
of ter t iary a c t i v i t y : twc towns are in class I I I , namely -
Lakhmi{)iir and Fat ikchar i , and another two towns in class IV
group Sunamp,anj and Derai, and one in class V town, whicl'

157
i s dominance of low (20-40 pe r cent) percentages of worker .
Again the t e r t i a ry occupations indicates that out of rest 35,25
urban centers have a medium dominance of t e r t i a ry a c t i v i t y
and 10 urban centers have high dominance of t e r t iary a c t i v i t y .
Out of 9 class I I towns, Seven towns have medium and two towns
Tangail and Bogra, have high dominance of t e r t i a ry a c t i v i t y .
Class I c i t y includes 8 urban centers, medium category is
observed in only one (Ba r i sa l ) , 7 c i t i es are included in high
percentages of t e r t ia ry a c t i v i t y . More than 50 per cent urban
centers show a medium dominance of t e r t i a ry a c t i v i t y . It
includes one town from class I , 7 from class I I , 9 from class
I I I , 7 from class IV,and one (Modhupur) from class V category .
A s igni f icant re lat ionship has been found between s i z e of the
town and percentages of workers in t e r t i a ry a c t i v i t y . The
corre lat ion value is 0.35.
3.3.5 Changing Pattern of Urban Occupational Structure
To understand the changes in occupational structure
based on pr imary , secondary and t e r t i a ry sectors data of
the 40 urban centers f o r the year 1961, 1974 and 1981 have
been plotted on t r i l inear graphs ( F i g s . 3 . 5 . , 3 . 6 and 3 . 7 0 •
The t r i l inear graph shows the triangular re lat ionship with the
three working va r i ab l e s , i . e . , p r imary , secondary and ter t iary
a c t i v i t i e s of working population in the selected 40 urban centers
of Bangladesh. Thu graph is competent to focusing the three
158
working va r i ab l e s expressed as percentages adding upto 100
and helps to process and compare the data (Mul ik, 1989).
Tr i l inear graph also he lps to v i sua l i z e the changing pattern
of occupational structure of the towns. Locational position of
urban centers indicate the nat ive character is t ics of occupational
structure. I f the posit ion of a urban centers comes to one of
the apexes of the t r i l inear graph, it indicates that one
component wi th in the occupational structure i s v e r y high (F ig .
3. 8 J. Again, i f the position of the point (urban center) is
near the arm of the t r i l inear graph, i t indicates that the
r espec t i ve component i s v e r y l ow . However , the extreme point
value d istr ibut ion may be shown in f i gure 3 . 8 . For showing
the changing direct ion of occupational strucutre, e v e r y tr i l inear
graph is d i v i d e d into 100 equi latera l tr iangles at 10 per cent
interva l and changing character of urban centers have been
indicated in i t through areal grouping. ' So the ind iv idual group
w i l l represent the nature of occupations, character ist ics of
internal structure and direct ion of urban dynamics.
Locational Ana lys is through Areal Groups 1961: In 1961, identical
groups have been recognized according to sameness of
character is t i cs , where out of the total 40, f i v e urban centers
Porsha, Derai l » Lakhmipur ,Rangamati and Dhaka, cannot be
included in any group. Except Dhaka, other four urban centers
are character ised by a large rural base. Porsha and Derai
are upgraded thana headquarters and Lakhimpur and F<angamati
are new d i s t r i c t headquarters. Dhaka is the capital of

159
s
LJJ O O
UJ a :
3 l -O 3 o : h-c/>
< o
h -<
a. ZD o o o UL o
e
m
a: h -
U)
a
UJ 3 —I <
>
CO
CO o

160
Group IV : This group includes twe l v e medium to small urban
centers and character is t i ca l l y trade and commerce, transport
and miscellaneous se rv i ces or iented. Manikganj, Cox ' s Bazar,
Feni, Netrokona, Gaibandha, Modhupur, Jamalpur, Patuakhali,
Far idpur, I shurd i , Naogaon and Bhola belong to this category .
V^ithin these, Ishurdi , Naogaon, Jamalpur, Faridpur and
Manikganj have dominance of large to small scale industries
including sugarcane, cotton t ex t i l e and other agro-based
industr ies. Cox ' s Bazar has a bas i ca l l y sea-beach dominated
economy based on tours and t rave ls and related occupations.
Group V: Eleven towns have the ir economy based on v e r y close
character is t i cs in industr ial and commercial ac t i v i t i e s . Th is
group is h i gh l y dominated by secondary a c t i v i t i e s . Big c i t i e s -
l i k e Dhaka, Sy lhe t , Comilla, Pabna Jessore and Rangpur are
v e r y wel l recognized industrial ( l a r ge and small) d is t r i c t
headquarters . Dhaka, the capital has specia l ised in jute,
cotton tex t i l e^ , synthet ics , s i lk and handloom industries and
is also an important e l e c t r i c i t y generating centre. A ser ies
of iron and stee l industries, small to medium have also come
up here. These medium to small scale iron and steel industries
support the modern ra i lway , bus and other manufacturing and
assembling centers.

161
Group V : : In this group of towns there i s medium dominance
of both ter t iary and secondary a c t i v i t i e s . It includes Jamalpur,
Ketrokona, Mirzapur, Naogaon and Ishurd i .
Locational Analys is through Area l Groups (1974): In 1974, these
groups declared d i v e r s i f i e d character . Four urban center don ' t
come under any group. These are Lakhraipur, Barguna, Noakhali
and Narsingdi . Lakhnipur however s t i l l has dominance of
pr imary types of occupational but trie rest of the three are
character i zed by both secondary and ter t iary ac t i v i t i es but
d i f f e r between them by considerable va lue.
Group I : It includes only two urban centers, namely-Derai and
Porsha which are highly dominated by pr imary ac t i v i t y . These
urban centers are bas ica l ly rural in character and can v e r y
we l l be cal led urban v i l l a g e s . The i r economy fu l ly based on
agr iculture and agro industr ies.
Group I I : The towns have v e r y high dominance of pr imary
a c t i v i t y with some te r t ia ry character . These towns are
Mirzaganj , Thakurgaon, Bheramara, Meherpur, Mirzapur,
Fat ikchar i , Rangamati, Jenaidha Sherpur. A l l these are
c lass I\' and c l a w V towns.
Group I I I : Only two towns have been grouped and designated
as multifunctional towns. They have no occupational dominance.
These are Muktagacha and Sunamganj.

162
Bangladesh and there i s dominance of secondary and ter t iary
a c t i v i t i e s .
Group I : F i rs t group includes Thakurgaon, Meherpur Fat ikchari
Sherpur and Bheramara. In these, there i s a high dominance
of both pr imary and t e r t i a ry a c t i v i t i e s »
Group I I : Six towns' , namely- Jhenaidh, Feni, Manikganj,
Muktagacha, Sunamganj, and Barguna, show a medium dominance
of pr imary a c t i v i t i e s . Here the economy is rural serv i ce
based.
Group I I I : It includes, Cox ' s Bazar, Modhupur, Bhola and
Mirzaganj . Th is group is pa r t i a l l y dominated by Ter t iary
a c t i v i t y . But secondary and t e r t i a ry influence also p r eva i l s in
these urban centers.
Group rV: It is par t i a l l y incl ined towards secondary a c t i v i t y ,
but bas ica l ly i t has agriculture based economy. This group
includes f i f teen urban centers namely-Gaibandha, Patuakhall,
Noakhali , Faridpur , Tangai l , Bogra, Comil la, Rangpur, Dinajpur,
Sy lhet , Narsingdi , Bar isa l , Jessore, Pabna, and Khulna. These
were the towns with a potential to sh i f t the i r economy from
agriculture to manufacturing. These are mostly old d is t r i c t
headquarters except (jaibandha , Gaibandha is a new d is t r i c t
headquarter with the dominance of primary a c t i v i t y .

163
Locational Ana lys is through Area l Group (1981) : In 1981, urban
centers are c lass i f i ed into . f i v e major groups with four isolated
urban centers. Among the four isolated urban centers, Dhaka
is heav i l y biased towards secondary a c t i v i t y and also inclined
towards l e r t i a r y a c t i v i t y . Di f ferent government,
seni-go\ 'emDent, autonmous corporation and other pr i va te
organization have g iven a multidimensional character to t e r t ia ry
a c t i v i t y . On the other hand, heavy to small scale industries
are functionLng with s i zeab le of workers in the secondary
sector . Comilla i s another c i t y , v^here both secondary and
t e r t i a ry a c t i v i t i e s are wel l deve l oped . But Lakhmipur and
Mirzaganj are s t i l l dominance by pr imary ac t i v i t i e s .
Group I : Six towns are included in this group. A l l of these
are character ized by primary a c t i v i t y . It includes, Derai,
Mirzapur, Fat ikchar i , Bheramara, Mirzaganj, and Sherpur.
Towns of this group are inclined towards t e r t i a ry a c t i v i t y .
But basic occupational structure is pr imary a c t i v i t y .
Group I I : Th is group is categorised by multi-functional
character . The signs of pr imary ac t i v i t y are p reva i l ing , but
medium docinance of secondary and t e r t i a ry a c t i v i t i e s i s also
there . It includes ten urban centers, namely - Naogaon,
Manikganj, Thakurgaon, Sunamganj, Muktagacha, Meherpur,
Jhe.aaidh, Netrokona, Ishardi and Barguna. .Most of these are
c lose ly Ic ;ated in the center of the tr iangle ( F i g . 3 . 7 ) . Most
of thom are newly recognized d i s t r i c t headquarters, except
164
Muktagacha, and Ishurdi . These two are more inclined towards
t e r t i a ry and secondary a c t i v i t i e s .
Group I I I : A medium dominance of t e r t i a ry and secondary
ac t i v i t i e s are associated with Patuakhal i , Feni, Noakhali, Cox ' s
Bazar, and Narsingdi town. C o x ' s Bazar is famous for tourism
industry and based on that a number of shel l and other cottage
industries have deve loped g iv ing the city a dominance of tert-
a ry to secondary a c t i v i t i e s . Others are administration based hence
te r t ia ry a c t i v i t y dominance is there .
Group IV: A medium to high dominance of ter t iary ac t i v i t y
i s found in this group. The towns in the group are Modhupur,
Jamalpur, Ishurdi and Bhola towns.
Group V: This group includes a large number of urban centers
where secondary a c t i v i t y i s the a c t i v e and ter t iary a c t i v i t y
i s the pass i ve occupation. Th is group includes al l c lasses of
urban centers. There were only 13 c i t i es in Bangaldesh in
1981 census, out of which seven are in this group and a l l have
a dominance of secondary a c t i v i t y but also have a part ial
inclination towards t e r t i a ry a c t i v i t i e s . Khulna is character ized
by the Pulp, Paper and Board industr ies . It has, there fore ,
daninonce of secondary ac t i v i t i e s and then of t e r t ia ry a c t i v i t i e s .

165
3 - 3 . 6 Changing Features in Occupational Structure
The occupational structure f o r the year of 1961, 1974
and 1981 can be v isua l i zed through comparative study with the
he lp of t r i l inear graphs in F igs . 3.5:, and 3 . 6 r e spec t i v e l y .
Salient features of the comparat ive situation of occupation
structure are g iven below:
i . The comparat ive study shows that there is a
considerable magnitude of change in the occupational structure
in a l l types of urban centers, spec i a l l y , f i r s t , second and third
c lass urban centers.
i i . In 1961, v e r y high pr imary a c t i v i t y had been
found in Rangamati, Lakhmipur, Thakurgaon Derai, and Porsha.
These urban centers were bas ica l l y rural in character but they
have upgraded from thana headquarter to upazila (Derai and
Porsha) and subdiv is ional headquarter to new d is t r i c t
headquarter status (Thakurganj , Rangamati and Lakhmipur) in
1981 census. A l l of these towns, there fo re , are now in the
take-o f f stage of urbanization. So, the rate of change in
occupational structure i s though s low, but v e r y much there,
i . e . , from priamry to secondary or t e r t ia ry or both.
i i i . Meherpur, Fat ikchar i , Bheramara Naoganj,
Sherpur, Mirzaganj, Mirzapur and Sunamganj have not changed
the i r occupational structure and remained stat ic in the primary
medium category .
166
i v . Some of the urban centers had medium dominance
of pr imary a c t i v i t i e s in 1961 and they remained static in
pr imary sector upto 1974 and s l i gh t l y improved the position
towards t e r t i a ry ac t i v i t y in 1981. These are Muktagacha,
Gaibandha and Jhenaidh towns.
V. Another notable feature of occupational structure
i s that the some of urban centers were in the medium category
of pr imary a c t i v i t y in 1961, which s l i g h t l y declined in 1981
but the secondary ac t i v i t y posit ion was s ta t i c . The rate of
change was high in t e r t i a ry sector . The towns in this category
are Tangail, Manikganj, Narsingdi , Netrokona, Modhupur,
Patuakhali and Ishurdi towns. Except Patuakhali , a l l the urban
centers are in c lose prox imi ty to c lass I c i t i es namely Dhaka
and Mymensingh.
v i . In pr imary occupation, a medium dominance ( in
1961) to low dominance ( in 1981) and medium to high dominance
has been iden t i f i ed in t e r t ia ry a c t i v i t y in s ix urban centers,
namely-Jamalpur, Noakhali , C o x ' s Bazar, Feni , Borguna, Bogra
and Far idpur.
v i i . Dhaka, Comil la, Sylhet , Khulna, Bar isa l , Jessore,
Dinajpur, Fabna and Rangpur have e xh ib i t ed a low to medium
chanse in secondary a c t i v i t i e s and medium to high rate of
pos i t i v e change in ter t iary occupational structure.

167
v i i i . The nev. upgraded thana l e v e l urban centers
have been transfering their degree of urbanization and changing
the growth rate a moderate percentage [ t ab l e 3 .1 ) but the
shiftment of working population is not so s igni f icant in primary
to secondary and/or ter t iary a c t i v i i i e s . The working population
in secondary sector had been found static but change had been
observed in t e r t i a ry sector, which has been caused by the
establishment of new o f f i c e s in new upazi la and the new
d i s t r i c t s . People are migrating from higher o rders . So the
seconary sector i s not playing a v i t a l ro le in urban dynamics,
and due to that a fa lse urbanization is occurring in the class-
IV, V and VI categorised urban centers . Due to change of
de f in i t ion of urban centers. The total number of people in
pr imary sector is increasing.
i x . A v e r y close s imi la r i t y has been observed with
the population s i z e in urban centers and share of tert iary
population. But a v e r y low pos i t i v e re lat ionship with secondary
sector has been found. On the other hand, pr imary occupation
sho\/s a r eve rse re lat ionship.
X. A c lear indication i s there that the v e r y high
dominance in pr imary sector is gradual ly decreasing.
x i . The dominance of both t e r t i a ry and secondary
sectors are gradually increasing and these w i l l help to develop
the trade and comr.erce, transportation and communication^ and

168
large and small industr ies for economic and ove r al l development
in Bangladesh,
3.4 FUNCTIONAL CLASSIFICATION OF URBAN CENTERS
Urban centers d i f f e r a great deal in this character .
People are rating them according to a sub jec t i ve , intangible
factor cal led qual i ty (Murphy, 1966), There fore there are number
of ways and c r i t e r ia on the bases of which they can be
c l ass i f i ed , l i k e - s i z e , s i t e , age, qua l i ty of l i f e , function e t c .
But, in order to understand the nature of an urban center v i s -
a - v i s socio-economic status, a functional c lass i f icat ion i s v e r y
essent ia l .
3 .4 .1 Method App l i ed f o r Functional Class i f icat ion f o r Urban
Csnters
Ne lson 's method"^ of standard deviat ion has been
appl ied in the functional c lass i f i ca t ion of se lected 40 urban
centers of Bangladesh f o r the years 1961 and 1981. In the
appl icat ion of method, the standard dev iat ions ( S . D . ) from the
mean percentage of workers were considered signi f icant f o r
comparing the functional character of indiv idual urban centers.
Urban centers with mean plus one standard dev iat ion values
For deta i l of Ne lson 's Method, p lease r e f e r to-Nelson, H.J . ( 1955), "A Serv ice Class i f icat ion of American C i t i e s " , Economic Geography, Vol . 31 (3 ) , pp . 189-210.

169
in an a c t i v i t i e s were designated as SD^ towns in that a c t i v i t y ,
those wi th mean plus two standard dev iat ion values were SD2
towns and the tov/ns where mean plus three standard dev iat ion
values obtained were designated SD^ towns. In this way, the
rating of urban centers served as an indicator of the r e l a t i v e
spec ia l isat ion of a town. A comparat ive analysis of changes
in the seven categories can be noted in the tables 3.15 and
3.16 r e s p e c t i v e l y for the years of 1961 and 1981, v/here the
mean and S.D. values for agr icultural a c t i v i t y , household
industry , manufacturing, construction^ trade and commerce,
transport, storage and communication and other s e r v i c es are
presented.
Based on Nelson's method, standard dev iat ion for
seven categor ies of ac t i v i t i e s for the selected urban centers
of Bangaldesh for the years 1961 and 1981 were calculated
( t ab l es 3.17 and 3 .18) . The notations in the table are :
Ag . = Agricultural A c t i v i t y
HI = Household Industry
Mnf. = Manufacturing (other than household industry )
Cons. = Construction
TC = Trade and Commerce
TSC = Transport , Storage and Communication
OS = Other Serv ices

u o
x:
w CD O > S-,
O CD
^ I c S a o w u c CO -a
H CD
CO CO U 0) X3 CO H O
1
CJ g
tfi c o o
I o CO U-i D C CO
DC c
o 0) Cfl W 3 3 -a
CD
(-> >
•jH .rt
C30 o < <
cn O
o IX)
o H
•l-J CO CO cs o c CO CSI to CD CM a • • •
a CSl TH ro to
U <
C3 o •J:
CO LTJ CO CT) CO CM LO
• • • CO CSl r- o o •
CM CO
00 CM CO o i n CO CO o CO
CO Csl LO 00_ o •H
in CD TH o CO CS) o o I> lO CO CO TH I>
T-l T-l c
CM LO c- CO o lO CD ^ CO lO CO rH CO T - l CO CO CO
CO lO O m o LO O in T-i
CO O LO r-t CM CO
rH CO CO in 00 Cl CD
rH LO o CO rH 'd' CD t>
c CD (U D
cn
P
c CO 0
2
Q cn <M +
C CO (D 2
Q cn ro +
C s 2
170
TD O x: CD
2 w c o (fl CD z c o TD (D W CO m
CD 4-' o z

CD
w u > S-,
O cn cn O
ro o ro CD ID t-H CN CO CD O CO oo cs CO CO
171
o G a o w u c CO -a }-> c f-i CO
u CD H
CSl ro ro CD cn ro CO CO to • . • •
in CSl CO T-l •
r
CCT CD TD CO U H
ID CJ u (D E E o u
U H
CSl LO t> (N c-ro rH CO o O CO CO CO CS3 CM ro
u g 4-' w c o CJ
c o CJ
o (J) cn CO o rH T-l CSl CD
• • • • A
CM CD CO o TH
u CO
It-I D c CO
00 c • r-f u a
c
00 CO TH CJl T-i CD CD
CO CD vH CO r o o o
X3 >> C-I
x: CD w W D 2 "o ° C X k-l
LO CD TH [> CO ro CO T-l LO CO CO cn T-(
T-l
CD I-D
•a o x :
(D
3 <-> >
00 CJ < < u <
CO I > r o O ^ T-l CD CO (j>
r o LO CO r o CO CSl T-l r o LO CD
CO
c o (n
r—i CD Z
c o
(D
CO u tn
c CO CD
Q
CO
Q a Q
cn cn cn
rH CSl r o
+ + +
c c C CO CO CO CD CD CD 2 s 2
- a o CO CO cn
CD
o
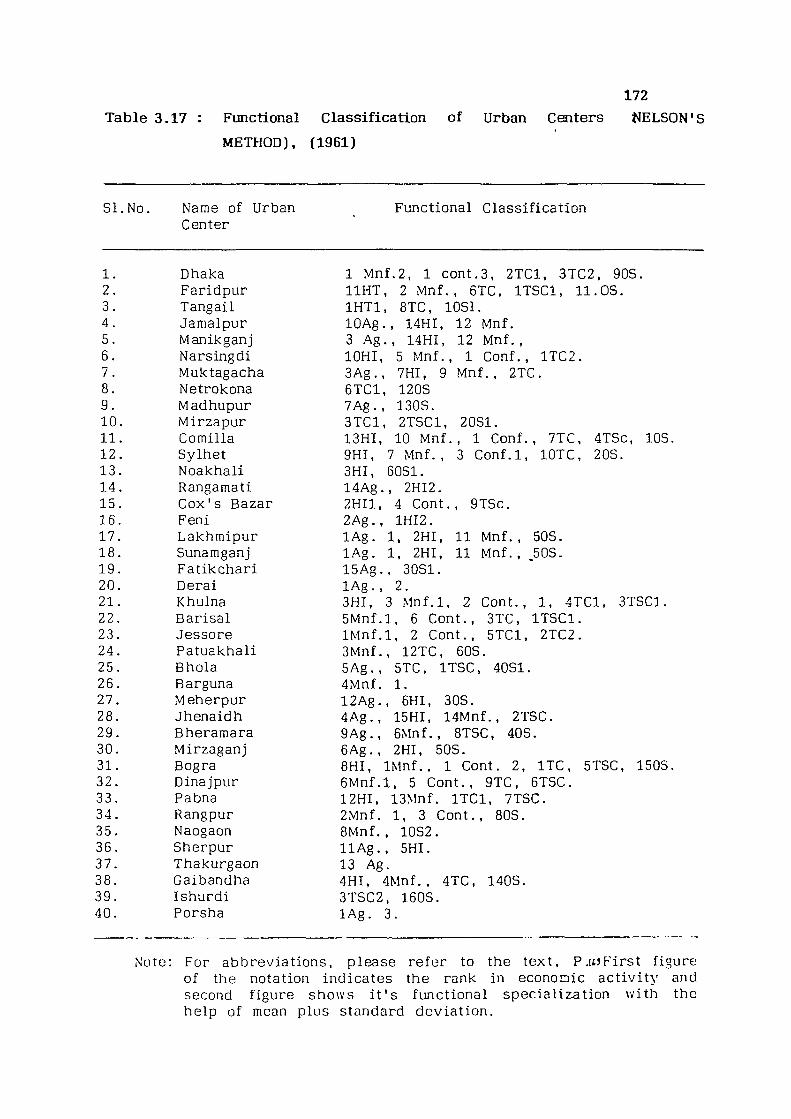
Tab le 3.17 : Functional Class i f icat ion of Urban Centers
METHOD), (1961)
172
t^ELSON'S
SI .No . Name of Urban Center
Functional Classi f icat ion
1. Dhaka 1 Mnf.2, 1 cont.3, 2TC1, 3TC2, 90S. 2. Faridpur I I H T , 2 Mnf . , 6TC, ITSCl , 11.OS. 3. Tangail I H T l , 8TC, lOSl. 4. Jamalpur lOAg . , 14HI, 12 Mnf. 5. Manikganj 3 A g . , 14HI, 12 Mnf. , 6. Narsingdi lOHI, 5 Mnf. , 1 Conf. , 1TC2. 7. Muktagacha 3Ag . , 7HI, 9 Mnf . , 2TC. 8. Netrokona 6TC1, 1205 9. Madhupur 7Ag . , 130S. 10. Mirzapur 3TC1, 2TSC1, 2081. 11. Comilla 13HI, 10 Mnf . , 1 Conf. , 7TC, 4TSc, lOS. 12. Sylhet 9HI, 7 Mnf. , 3 Con f . l , lOTC, 20S. 13. Noakhali 3HI, 60S1. 14. Rangamati 14Ag., 2HI2. 15. Cox ' s Bazar 2HI1, 4 Cont., 9TSc. 16. Feni 2Ag. , 1HI2. 17. Lakhmipur l A g . 1, 2HI, 11 Mnf. , 508. 18. Sunamganj l A g . 1, 2HI, 11 Mnf. , 508. 19. Fat ikchar i 15Ag. , 3081. 20. Derai l A g . , 2. 21. Khulna 3HI, 3 Mn f . l , 2 Cont., 1, 4TC1, 3T8C1. 22. Barisal 5Mnf . l , 6 Cont., 3TC, I TSC l . 23. Jessore I M n f . l , 2 Cont., 5TC1, 2TC2. 24. Fatuakhali 3Mnf., 12TC, 60S. 25. Bhola 5Ag . , 5TC, ITSC, 4081. 26. Barguna 4Mnf. 1. 27. Meherpur 12Ag. , 6HI, 308. 28. Jhenaidh 4Ag . , 15HI, 14Mnf., 2TSC. 29. Bheramara 9Ag . , 6Mnf., 8T8C, 408. 30. Mirzaganj 6Ag . , 2HI, 508. 31. Bogra 8HI, IMnf . , 1 Cont. 2, I TC , 5T8C, 1508. 32. Dinajpur 6Mnf . l , 5 Cont., 9TC, 6T8C. 33. Pabna 12HI, 13Mnf. I T C l , 7TSC. 34. Rangpur 2Mnf. 1, 3 Cont. , 808. 35. Naogaon 8Mnf. , 1082. 36. Sherpur 11Ag. , 5HI. 37. Thakurgaon 13 Ag. 38. Gaibandha 4HI, 4Mnf., 4TC, 140S. 39. Ishurdi 3TSC2, 1608. 40. Forsha l A g . 3.
N'oto: For abbrev iat ions, plejase r e f e r to the text , P.i£)First f igure of the notation indicates the rank in econonic ac t i v i t y and second f igure shows i t ' s functional spec ia l i zat ion with the help of mean plus standard dev ia t ion .

173 Table 3.18: Functional Classification of Urban Centers (NELSON'S
METHOD), 1981.
SI .No. Name of Urban Functional Classi f icat ion Center
1. Dhaka SMnf . l , 8Cont . l , 3TC1, 6TSC. 2. Far idpur 4HI, 2Mnf . l , 7TSC, 1008. 3. Tangail 4HI, BCont. 2TC1, 4TSC1, 90S. 4. Jamalpur 3Ag. , 8Cont. 8TC, 120S. 5. Manikganj lOAg . , 13Cont,, 3TSc. 6. Narsingdi 6Mnf . l , I I T C , 2TSC. 7. Muktagacha 8Ag. , 5HI1, 70S. 8. Netrokona 6Ag. , 20S1. 9. Madhupur 2Ag. , 2HI2, 20S2. 10. Mirzapur 2 A g . , l , 5TC, 2TSC. 11. Comilla l l C o n t . , 4TC, 7TSC1, 170S. 12. Sylhet 7Mnf. , 2Cont. 1, 6TC1, 5TSC. 13. Noakhali 12Mnf . l , 2Cont., 3TC, 505. 14. Rangamati 1HI2, 4TSC, 10S2. 15. Cox ' s Bazar 6HI1, IMnf . , 9Cont., I T C l , I I T C . 16. Feni 3HI1, 2Mnf., lOCont., 1505. 17. Lakhmipur 4 A g . l , 6HI, 3 Cont. 18. Sunamganj 2Ag. 1 Mn f . l , 12 Cont. 19. Fat ikchar i l A g . l , 3HI, 1105. 20. Derai 2Ag. 2. 21. Khulna IMnf .2 , ICon t . l , 9TC, 9TSC. 22. Bar isal 9Mnf. , 4Cont. l , 6TC, 5TSc, 80S. 23. Jessore 3Mnf . l , 7Cont . , l . 12 TC, ITSC. 24. Patuakhali 6Mnf., 4TC, 305. 25. Bhola 15TC, 1305. 26. Barguna l A g . , 11 Mnf. , 4 Cont., 205. 27. Meherpur 9Ag. , IHI , 1605. 28. Jhanaidh 5Ag. , lOMnf. , 5Cont. l , 7TC, lOTSC. 29. Bheramara 14Ag. , ITSC. 30. Mirzaganj 3 A g . l , 2HI1, 105. 31. Bogra 2HI, 5Cont., lOTC, 3T5C, 1405. 32. Dinajpur 4Mnf. 1, 3Cont., 14TC, 6TSC. 33. Pabna 7Cont., 6TC, 12 T5C. 34. Rangpur 3Mnf. , 5 Cont . l , 13 TC, 8T5C, 405. 35. Naogaon 12Ag. , 5Mnf., 2TC, 505. 36. Sherpur 13Ag. , I H I l , lOSl . 37. Thakurgaon l l A g . , 8Mnf. 38. Gaibandha 4Ag. , SHI, 4Mnf. , I TC . 39. Ishurdi ICont . , 16TC, ITSC. 40. Porsha l A g . 2.
Note: For abbrev iat ions, p lease r e f e r to the text , P . ioF irs t f igure of the notation indicates the rank in economic ac t i v i t y and second f igure shows i t ' s functional specia l izat ion with the help of mean plus standard dev ia t i o in .

174
The numbers preceding abbrev ia t ions indicate the rank
of urban centers, within the r e s p e c t i v e standard dev ia t ion .
The numbers fo l lowing abbrev iat ions are standard dev iat ion
values indicating intensity of spec ia l i zat ion of r espec t i v e
a c t i v i t y for the part icular urban center.
Dhaka 5 Mnf^
The above i l lustrat ion indicates that the Dhaka has
been ranked 5th in manufacturing a c t i v i t y and i t s functional
spec ia l i zat ion i s mean plus one standard deviat ion ( tab les 3.17
and 3 .18) .
As ev ident from the tab le 3.15 mean and standard
dev iat ion value of agricultural a c t i v i t y for the year 1961 was
31.41 and 14.42 r e spec t i v e l y . The f igure decreased by a
considerable amount in 1981. The f igures are 23.46 and 15.17
fo r the mean and S.D. r e s p e c t i v e l y . A v e r y high rate of
decrease has been observed in the household industry in 1981.
The values f o r manufacturing are 1981 but the corresponding
f igures were 15.52 and 6.46 for the year 1961. Here a l i t t l e
increase has been exper ienced. A pos i t i v e change is also found
in the construction a c t i v i t y , the mean and S.D. were 2.36 and
1.28 r e spec t i v e l y for the year of 1961. On the other hand
the value were 4.10 and 2.19 for the same stat is t ica l dev i c e
in 1981. A v e r y high rate of increase in value was observed

175
in trade and commerce. The values 22.97 and 7.28 fo r mean
and S.D. in 1961 for other se rv i ces , whereas the corresponding
f i gures were 23.64 and 6.53 fo r the yea r of 1981. The
transport, storage and communication shows pos i t i v e gain (tables
3.17 and 3 .18) .
3.4.2 Functional Categories of Urban Centers
Functional categor ies have been made fo r the two
dist inct per iods 1961 and 1981. The analys is is based on the
dominancy of a c t i v i t i e s , d i v e r s i f i e d character and the i r changing
pattern.
Agricultural Activity: The table 3.17 shows, 18 urban centers
with dominance in agricultural a c t i v i t y . Amongst them, 15 towns
are only above mean, and next e v e r y steps i . e . mean plus one
standard dev iat ion, mean plus two standard dev iat ion and mean
plus three standard dev iat ion have been secured one urban
centers in each category . The range of above mean is 32.17
to 84.42 per cent. F i f t y per cent urban centers had an above
mean l e ve l in 1981. The dominance of agricultural ac t i v i t y
remained constant for Derai and Porsha towns. Three urban
centers (Bhola, Rangamati and Feni ) lost the i r dominance in
agricultural a c t i v i t y , on the other hand f i v e new towns acquired
the dominance in agricultural a c t i v i t y in the year 1981. These
are Netrokona, Mirzapur, Barguna, Kaogaon and Gaibandha. In
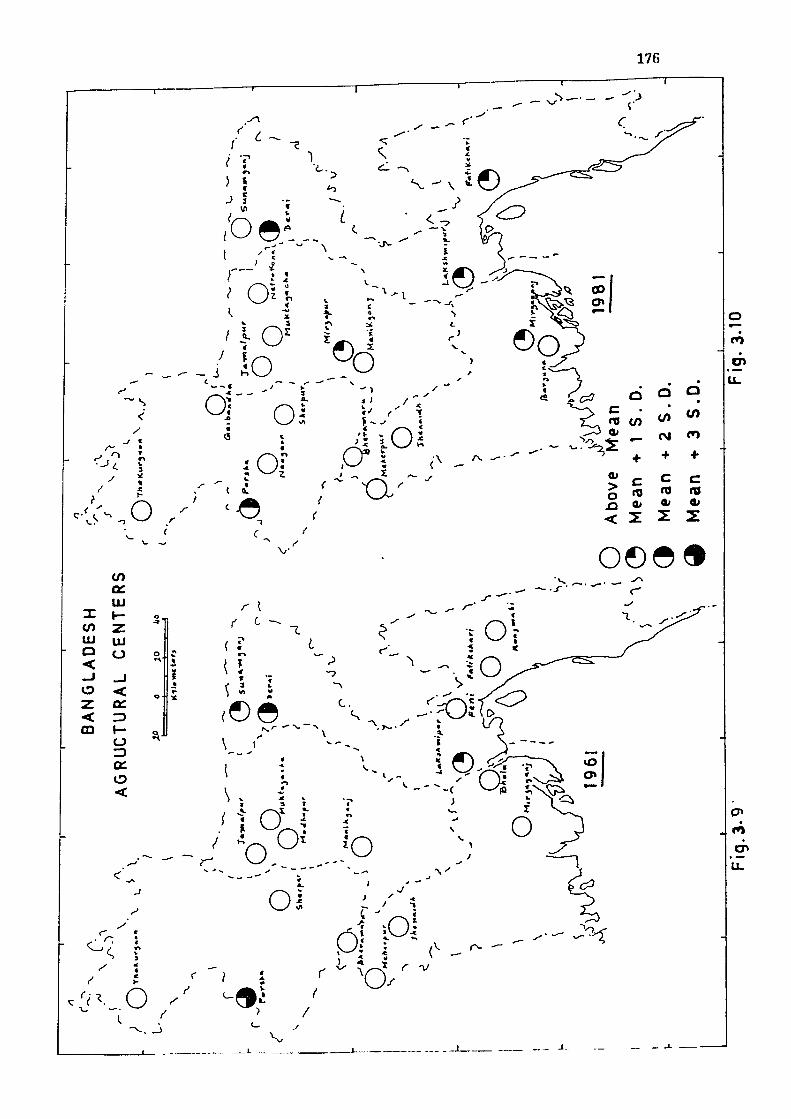
176
/
o
d o o •
</> O)
CM m
+ + +
c c c nj to n> a> a> a* Z Z Z
0099 if) c r UJ r
X h-r
cn z f lU UJ ( ? D o O w ( ? < «
f ( I t o < o-z <
oc
m 1 - o, o
a: I o I
< \.
T.
P r-"
C.
O ?
< J
a O .
' of ' O
y o i
o 01 ^ t
i O
IP" ro CP iZ
o" r V /

177
general, the percentage of workers in agricultural a c t i v i t y shows
a considerable decrease in- the year 1981. The intensity of
specia l izat ion and ranking of the towns is shown in tables 3.17
;;nd 3.18 and depic ted in f i g s . 3 . 9 and 3.10 for the years 1961 and
1981 r e spec t i v e l y .
Household Industry : F i f t y per cent or 20 towns of the total
are recognized as household industry dominance towns according
to standard dev iat ion computations. The f igure decreased to
13 (35 per cent) towns in 1981. The dominance in household
industry was found in Far idpur , Tangai l , Manikganj, Narsindi,
Muktagacha, Comil la, Sy lhet , Noakhali , Rangamati, C o x ' s Bazar,
Feni, Sunamganj, Khulna, Meherpur, Jhenaidh, Mirzaganj, Bogra,
Fabna, Sherpur, and Thakurgaon, towns in 1961. The f i r s t
ranking twon Rangamati has 22.77 per cent workers in household
industry and least ranking Mirzaganj has 11.52 per cent
workers . In 1981, ten towns, Manikganj, Narsingdi , Comilla,
Sylhet , Noakhali , Sunamganj, Fa t i ckcher i , Khulna, Jhenaidh and
Fabna have dropped the i r posit ion in this category('"'•>'3.11 and
3 .12) . Rangamati has lost i t s f i r s t rank and went down to
second posit ion and Modhupur secured f i r s t posit ion with 11.15
per cent workers in household industry . But the overa l l
percentage of workers in this ac t i v i t y has been reduced to 4.45
per cent. The lowest ranking town is Meherpur with only 4.79
per cent workers in household industry in 1981.
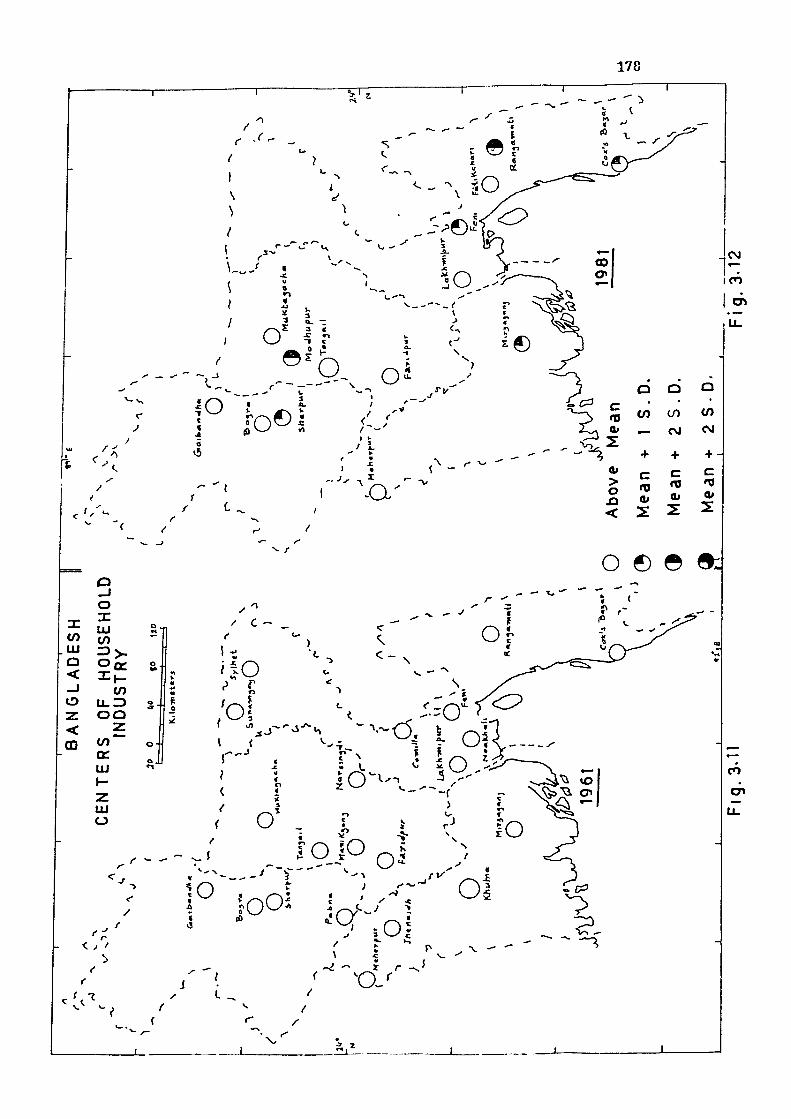
178
c
/
o o o
cn CO tn
— CNJ OJ
+ + + c c c Ol ro TJ Oi a« Z Z
o e e
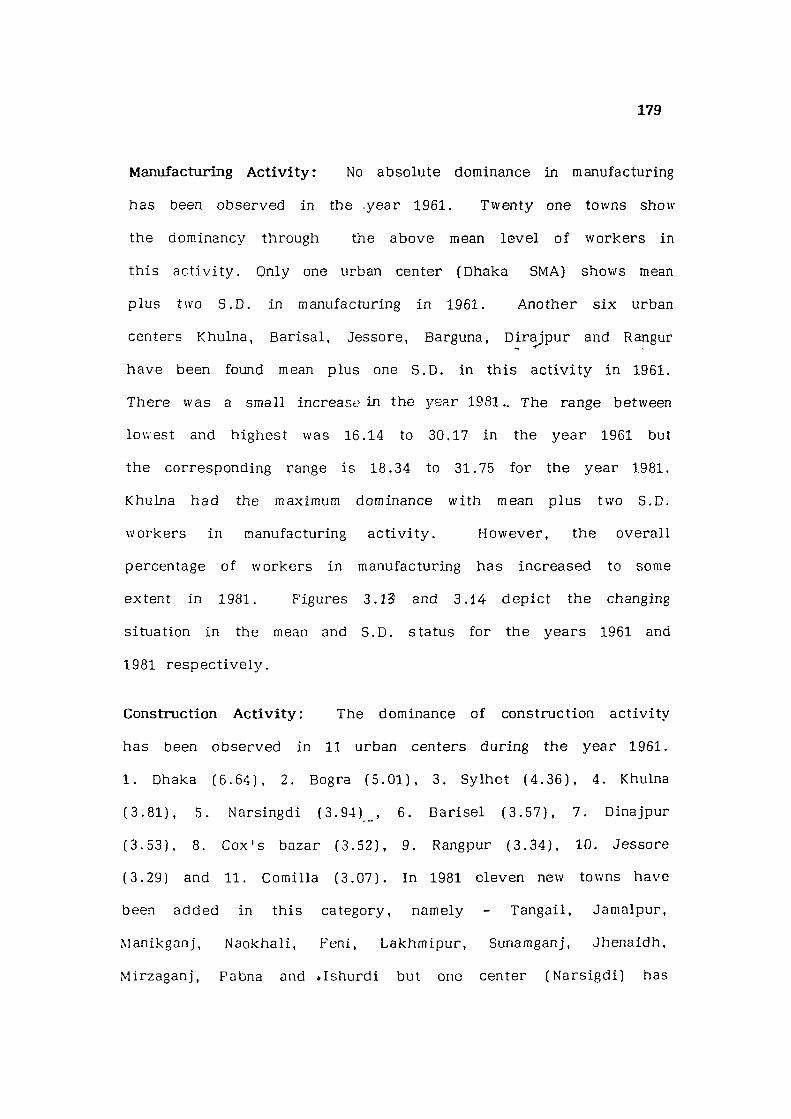
179
Manvifacturing Activity: No absolute dominance in manufacturing
has been observed in the .year 1961. Twenty one towns show
the dominancy through the above mean l e v e l of workers in
this a c t i v i t y . Only one urban center (Dhaka SMA) shovifs mean
plus two S.D. in manufacturing in 1961. Another s i x urban
centers Khulna, Bar isa l , Jessore, Barguna, Dira jpur and Rangur
have been found mean plus one S.D. in th is a c t i v i t y in 1961.
There was a small increase in the year 1981.. The range between
lowest and highest was 16.14 to 30.17 in the yea r 1961 but
the corresponding range is 18.34 to 31.75 for the year 1981.
Khulna had the maximum dominance with mean plus two S.D.
workers in manufacturing a c t i v i t y . However , the ove ra l l
percentage of workers in manufacturing has increased to some
extent in 1981. Figures 3.13 and 3.14 dep ic t the changing
situation in the mean and S.D. status for the years 1961 and
1981 r e s p e c t i v e l y .
Construction Activity: The dominance of construction ac t i v i t y
has been observed in 11 urban centers during the year 1961.
1. Dhaka (6 .64 ) , 2. Bogra ( 5 .01 ) , 3. Sylhet ( 4 . 36 ) , 4. Khulna
( 3 .81 ) , 5. Narsingdi ( 3 . 9 4 ) _ , 6. Bar ise l ( 3 . 57 ) , 7. Dinajpur
(3 .53 ) , 8. Cox ' s bazar (3 .52 ) , 9. Rangpur (3 .34 ) , 10. Jessore
(3 .29) and 11. Comilla ( 3 .07 ) . In 1981 e leven new towns have
been added in th is category, namely - Tangai l , Jamalpur,
Manikganj, Naokhali , Feni, Lakhmipur, Sunamganj, Jhenaidh,
Mirzaganj , Fabna and » Ishurdi but one center (Na r s i gd i ) has

180
d.. /
' I © T
O F
C.-
r- —
< S;
/ § O :
<1 -C
' « s v5 0
< 1 - • 5 A. r( . " T
/ •
< c.'
Q o o
cn to w CM n
+ + + c c c CO ro nj Oi a« a<
Z Z
CO CJl tZ

181
' c-
3 , •
I o r-* >
< r
S
o
cc I -co
f a
o
s
r
lO
ro i
•J' O ® © »
X CO UJ o < _ J o z < CD
O O
t/) Q:
UJ CJ
/•J r' c-
z.
O '
S
r I © -
©
/
ir>
CO
cn
V f"
"N

182
dropped her pos i t ion. A v e r y h igh dominance of construction
ac t i v i t y has increased the mean from 2.36 to 4.10. The f igures
3.15 and 3 . i 6 dep ic t the changing situation in construction
a c t i v i t y .
Trade and Commerce Activity: Trade and commerce seems to
go with manufacturing and other t e r t i a r y a c t i v i t i e s . Figure
3.17 shows the urban centers with dominance in trade and
commerce i i l961. There are ninteen towns with special isat ion
in this a c t i v i t y and the i r ranking can be seen in table 3.17.
Narsingdi can be recognized as v e r y high dominance (mean plus
two S .D . ) in trade and commerce a c t i v i t y . The above mean
i s ranging between 13.68 to 23.95 pe r cent, in 1961, whereas
the f igures were 20.69 to 35.97 for the year 1981. I t shows
a considerable amount of increase in the workers in trade and
commerce. Three new urban centers have been added in this
category in 1981 (F igure 3 .18 ) .
Transport, Storage and Communication Activity: Fi f teen urban
centers had dominance in transport storage and communication
a c t i v i t y with Ishurdi (9.86 per cent) and Bhola (3.78 per cent)
as the highest and lowest ranking urban centers f o r the year
1961. The corresponding f igures were 11.58 (Jessore ) and 6.16
(Bheramara) for the year 1981. On the other hand, f i v e new
urban centers have been added to the ea r l i e r f i f t een in this
category of dominance in transport , storage and communication.

183

184
^ J
\ o%
0 K 1 S.
T O -
X O
" 7
C'
\
e
I
i O
o « c •c
O i O l
o
a OT
P CO cn:
C +
o CM
d>
itZ
w
J c 2 < c
< o 2 3
o o p
< ClI a < a: 0 E-< 'Si
1 VJ
5 ..
<
0
/'I
i
J
a v9
v p
/
%o
- . 3
<1.
vJ
-t O 5
S O i o! O i © ^ e
I ® L O
C7>
ro
o»
I'lZ
r- o'

185
The situation for the years 1961 and 1981 i s shown in f i g s .
3.19 and 3.20.
Other Se r v i c es : More or less stat ic condition has been
observed in other s e r v i c e s for the years 1961-81. High
dominance has been found in twenty three urban centers in 1961
including two major urban centers (Dhaka and Khulna). Total
of e ight urban centers lost the i r posi t ion, whereas new f i v e
towns have been added in the other s e r v i c es . It can be noted
that only one tovm (Naogaon) v;as found in mean plus two S.D.
in 1961 but the position s l i gh t l y improved in 1981 a f ter addit ion
of another two urban centers namely Modhupur and Rangamati.
Naogaon exper ienced decrease in her posit in from mean plus
two S.D. to mean plus zero S.D. status in 1981. The ove ra l l
f l uc tua t i on is depicted in f igures 3.21 and 3.22 for the years
1961 and 1981 r e spec t i v e l y .
However , the o v e r a l l situation indicates that workers
are shi f t ing the i r a c t i v i t i e s from agricultural and household
industry to manufacturing, construction, trade and commerce,
and transport, storage and communications for h igher order urban
centers l i ke Dhaka, Khulna, Sy lhet , Pabna, Rangpur, Jessore,
Barisal , Commila etc . The comparat ive analys is of 1961 and
1981 stat is t ics c lear ly r evea l s that in the small urban centers
there is a shi f t of workers from pr imary to t e r t i a ry ac t i v i t y ,
spec i a l l y other se rv i ces . *This i s barne by the two new small

200

187
towns Borguna and Sherpur which appeared wi th high dominance
in other s e r v i c e s in 1981. These two centers were high
dominance in pr imary ac t i v i t y in the y ea r 1961.
According to 1961 c lass i f i ca t ion of urban centers, 4
towns were mono-functional in character , 9 centers were
dominated by two functions, 9 towns by three functions, 12
towns v/ith four functions, 3 towns w i th f i v e functions and rest
3 towns were functioning with s ix functions and thus can be cal led
as d i v e r s i f i e d in nature. But this functional association has
changed considerably in the year 1981. Two towns have been
ident i f i ed as a mono-functional in 1981, 4 were dominated by
two functions, 15 by three functions, 13 by four functions, s ix
by f i v e functions. Not a s ingle urban centers has been
ident i f i ed beyond the f i v e functions in 1981.

188
REFERENCES
Alexander, J.W. (1954), "The Basic-Nonbasic concept of Urban Economic Functions", Economic Geography, Vol . 30(3 ] , pp . 246-261.
Alexandersson, G. (1956), Industrial Structure of American Cities, Nebraska, pp. 14-22.
Aurousscace, M (1921), "The Distribution of Population: A constract ive Prob lem" , Geographical Review, Vo l . X I ( 4 ) , p . 572.
BBS (1977), Statistical Pocket Book of Bangladesh, Ministry of Planning, GOB, p. 205.
Browning, Har ley L . (1961), "Method fo r Describing the age-sex structure of c i t i e s " , in J. P. Gibbs ( e d s ) , Urban Research Methods East-West student Edit ion, New Delhi , p . 30, 136.
Brush, John E. (1968), "Spat ia l Pattern of Population in Indian C i t i e s " , Geographical Review, 58 (3 ) , pp . 362-391, p. 371, p. 376.
Census of India (1986), Study on Distribution of Infra structural Facilities in Different Regions and Level and Trends of Urbanization, Occasional Paper 1, Social Studies Div is ion, GOI, New Delhi , p . 5.
Chaudhury, R.H. (1980), Urbanization in Bangladesh, CUS, D.U. Dhaka, p . 36.
Chapin, S.J . and Stewart, P .H. (1959) , "Population Densities around the c l ock " , Reading in Urban Geography, ( e d ) by Mayer and Kohn, Chicago, pp . 180-182.
Clark, Colin, (1951), "Urban Population Densi t ies" , Journal of the Royal Statistical Society, Ser. A. CXIV(4 ) , pp. 490-496.
Davis, K. (1951), The Population of India and Pakistan, Princeton, New Jersey , 1951, p. 139.
Dickinson Robert , E. (1902), West European City, London, p. 267.

189
Duncan, Otis, D. and A lber t J. Reiss (1956), "Social Characteristics of Urban and Rusal Communities, New York , John Wiley and Sons, pp . 12-16.
Dutt, Ashok K. and Gerardine D'Sa (1987], "Density Gradients of Calcutta C i t y " , Contemporary City Ecology, ed by C.S. Yadav . Concept, New Delh i , p p . 278-286.
Ed i tor ia l (1945), "Urban Functions", Economic Geography, , Vo l . 21 (2 ) , p . 79.
Gamier , J .B. and Chabot, G. (1967). Urban Geography, Longmans, London, p. 385.
Garrison, Will iam L . (1956), Some confusing Aspects of Common Measurements", The Professional Geographer, Vol . V I I I ( l ) , pp. 4-5.
Gist, Noel P , and L . A . Halbert (1933), Urban Sociology, New York , p . 18.
Gist, N . P . and Hoyt, H. (1954) , Urban Sociology, New York , p. 8.
Hal l , R .B. (1934) , "C i t i e s of Japan: Notes on Distribution and Inher i ted Form", AAAG, Vo l . 24, p . 183.
Harr is , C.D. (1943), "A functional c lass i f icat ion of c i t i es in the United States" , Geographical Review, Vo l . 33 ( 1 ) , pp . 89-99.
Harr is , C.D. and Ullman, E . L . (1945), "The Nature of C i t i es " , Annals of Association of American Academy of Political and Social Sciences, Vo l . 252, p. 7.
Hart, John F. (1955), "Functions and Occupational Structure of C i t i es of the American South", Annals of the Association of American Geographers Vo l . 45 (3 ) , pp. 269-86.
James, H .E . (1930), "Urban Geography of Ind ia" , Bulletin of the Geographical Society of Philadelphia, p. 108.
Janaki, V . A . (1954), "Functional c lass i f i cat ion of urban settlement in Ke ra l " , Journal of M.S. University, Baroda, pp. 81-114.
Jones, V ictor (1954), "Economic Class i f icat ion of c i t i es and Metropol itan Areas " , The Municipal Year Book, Chicago, The International Ci ty Managers' Asson. , pp. 62-70, 8 1 - 1 0 8 .

190
King, L . J . (1961), "The Functional Role of Small Towns in Canterbury" , Proceedings of the 3rd New Zealand Geographical Conference, pp . 139-149.
Kneedler , G.M. (1945), "Economic c lass i f i ca t ion of c i t i e s " , The Municipal Year Book, Chicago, The International City Managers, Asson. , pp. 30-38, 48-68.
La i , A . (1959) , "Some aspects of functional c lass i f icat ion of c i t i es and a proposed scheme for c lass i fy ing Indian C i t i e s " , National Geographical Journal of India, Vol . 5, pp . 12-24.
McKenizie, R .D. (1925), "The Ecolog ica l Approach to the study of Human Community", The City, by Clark, R .E . , Bmurgess, E .W. , and Mckenzie, R .D . , Chicago.
McKenzie, R.D. (1934), Readings in Human Ecology, Chicago, pp. 44-45.
Mukharjee, M. (1970), "Functions and functional c lassi f icat ion of towns in B iha r " , Deccan Geographer, Vo l . 8, pp. 56-65.
Murphy, R .E . (1966), The American City: An Urban Geography, McGraw-Hil l Book Company, New York , p . 113.
N'ath, V. (1954), "Urbanization in India, with spec ia l reference to the growth of c i t i e s " . World Population Conference, Rome, Mimeographed, p. 4.
Nelson, H.J. (1955), "A s e r v i c e c lass i f i cat ion of American C i t i e s " , Economic Geography, Vo l . 31 ( 3 ) , pp . 189-210.
Nelson, H.J. (1957), "Some character i t i cs of the population of c i t i es s imilar s e r v i c e c l ass i f i ca t i ons " . Economic Geography, \o l . 53, pp. 95-108.
Newling, B .E . (1964), "Urban population densi t ies and intra-urban g rowth" . Geographical Review, Vo l . 54, pp . 440-42.
Newling, B.R. (1966), Urban Growth and Spatial Structure: Methematical Models and Empir ical Evidence, Geographical Review, 56 (1 ) , pp . 213-225.
Newling, B .E . (1969), "Spatial var ia t ion of Urban Population Densi t ies" , Geographical Review, 59 (2 ) , American Geographical Soc iety , New York , (1968), pp . 440-442.

191
Ph i lb r i ck , Al len K. (1957), "Pr inc ip les of Areal Functional Organization in Regional Human Geography", Economic Geography, Vo l . 33(4) , pp . 299-337.
Pownall, L . L . (1953), "The Function of New Zealand Towns", Annals of Association for American Geography, Vol . 43, pp. 332-350.
Rafiul lah, S.M. (1965), "A new approach to functional c lassi f icat ion of towns". The Geographer, Al igarh Muslim Univers i ty Geographical Society, Vol . 12, pp. 40-53.
Rees, P .H. [1979), Residential Pattenrs in American Cities: 1960, Chicago Research Paper no. 189, p . 10.
Reiss, A lbort J. Jr. (1957), "Functional Specialization of Ci t ies" , in Paul K. Hatt and Albert J. Reiss, Jr . ( e d s ) . Cities and Society, Glencoe, I I I : The force Press, pp. 562-572.
Simeon, D. (1970), "The Rate of Change of Population Densities in the Concentric zones of a Metropo l i s : , Ekistics, 30(1 ) , pp . 8-13.
Singh, K.N. (1959), "Functional and functional c lassi f icat ion of towns in U . P . " , National Geographical Journal of India, Vol . 5, pp. 121-148.
Steigenga, W. (1955), "A comparative analysis and a c lassi f icat ion of Netherlands towns", T i j s ch r i f t voor Economische as sociale Geograf ic, Vo l . 46, p . 108.
Webb, John W. (1959), "Basic Concepts in the Analysis of S small Urban Centers in Minnesota", A AAG, Vol . 49 (1 ) , pp. 55-71.
Weimier, A .M. and Hoyt, H. (1948), Principles of Urban Real Estate, New York, p. 107.

CHAPTER - IV
FACTORIAL ECOLOGY OF URBAN DYNAMICS
The study in the , prev ious chapters of urban centers
in Bangladesh, he lped to se lect the var iab l es in relation to
urban dynamics. In this chapter an attempt has been made to
i d en t i f y the nature and magnitude of urban dynamics in relation
to time pe rspec t i v e . The main e f f o r t of the present study is
urban dynamics analysis through factor ia l ecology i . e .
ident i f i cat ion of strong var iab l es , and secondly , the identi f icat ion
of the magnitude of urban dynamics.
'Urban' i s mult i -character in nature, so i t becomes
necessary to know as to what are basic eco log ica l d i f ferences
that ex is t among the urban centers? What are the main factors
of urban system change? A w ide number of corre lates arc
demographic and socio-economic. Questions regarding the
s igni f icance of var ious fac tors may be r e so l v ed by the
appl icat ion of the fac tor ia l ecology techniques in urban analysis.
However , the main purpose of the present investigation
i s to get more insight the mechanism of urban dynamics, which
manifests i t se l f as processes of urban growth or dec l ine. The
prev ious chapters assumes that urban d^Tiamics spr ings pr imar i ly
193
from changes in technology, social system economic conditions,
and demography. The phi losophy i s that the changing nature
and magnitude of urban dynamics can be iden t i f i ed with the help
of factor ia l eco logy . Factor ial eco logy i s the term now used
to character ize studies involv ing the application of factor
analysis to ecological study. However, the present study has
appl ied Pr inc ipa l Components Analys is ( P C A ) , which i s more or
less on the same pr incipal as factor analys is .
To iden t i f y the strong var iab les in urban dynamics
study for the per iod 1961, 1974, and 1981 in every cases the
same var iab l es have been considered f o r 40 selected urban
centers. Twenty seven va r i ab l e s have been chosen f o r measuring
the nature and magnitude of urban dynamics in 1961-1981 per iod .
Use of certain other var iab les has been hamper^ed for
nonavai lab i l i ty of data and the l imitat ion of the computer
programme, where, the number of va r i ab l e s should not exceed
the number of observation (urban cen te r ) . In e ve ry case,
correlat ion matrices of the working va r i ab l e s have been computed
with mxm dimensions (see methodology in chap t e r - I ) , which
explains the re lat ionship of one va r i ab l e with the other . From
this mxm matrix another matrix of equal dimensions has been
computed which shows the re lat ionship of a l l the var iab les with
d i f f e rent fac tors . Along with this matr ix , factor loading of
rotated factors , eigenvalues, cummulative percentages of eigen
value's and communality have been computed.

194
4.1 FACTORIAL ECOLOGY: CROSS SECTIONAL ANALYSIS OF 40
URBAN CENTERS
A comparative position of 40 urban centers at three
points of time, in tab le 4.1, indicates a genera l ly static position
in the ecolog ical dimension in 1961, 1974, and 1981. The table
has incorporated the factors and per cent of total variance
explained by each factor in the cross-sect ional analysis of
three time per iods . A number of environmental dimoisions have
changed during the last three census per iods . ' However, a br ie f
discussion may be focused in three cross-sect ional point of v iew
rather than longitudinal analys is .
It is v e r y c lear from the table 4.1 that there is almost
no change in ov^eral l ecological conditions in last three decades.
In both 1961 and 1981, the high urbanization dimension
summarizes the largest proport ional of the total var iance, thereby
attesting to the fundamental importance of this factor in
describing the changing structure of urban dynamics of the 40
urban centers of Bangaldesh. In contrast to the ove ra l l situation,
there i s some invariance noticeable in the per iod under study.
The t e r r i t o r i a l stress factor shows a decrease in importance
between 1961 and 1974, whi le the urban amenities and high
economic urbanization factor increased in importance in the same
period but again lost the importance in 1981. Demographic and
economic attr ibutes of urbanization indicate a v e r y l i t t l e change
from 1961 to 1981.

195
Table 4.1: Ecological Structure of 40 selected urban centers:
1961, 1974 and 1981
Factors Per cent of total variance explained
1961 1974 1981
1. High Urbanization
2. Te r r i t o r i a l stress and
Housing condition
3. Demographic Attr ibutes
of urbanization
4. Urban Amenities and
High Economic Urbanization
5. Deurbanization
6. Demographic deurbanization
26.60 26.50
19.90 10.10
16 .00
7.20 25.50
17.90
15.50
17.10
1 6 . 0 0
Per cent of total variance
explained by four factors
in 1961 and 1974, and three
factors in 1981.

196
A large proport ion of the total variance of many
var iab les is accounted for by the four factors in 1961 namely high
urbanization, t e r r i t o r i a l s tress , demographic attributes, and urban
amenities. In 1974 the four fac tors which explain the total
variance are , t e r r i t o r i a l s tress , urban amenities, deurbanization
and demographic deurbanization. in 1981 only three factors^ high
urbanization, demographic attr ibutes and urban amenities explain
the variance. In all cases sex'enty per cent of the total variance
is explained for about f i f t y per cent of the var iab les . A
markedly s imi lar value has been observed in a l l the three cross-
sectional communalitics of the v a r i a b l e s . The observation is
confirmed by the coe f f i c i ent of congruence of two sets of thre-.-
groups communalities, i . e . , 0.520 (1961-1974), 0.511 (1961-1981)
and 0.539 (1974-1981). The va r i ab l e s which have high
communalities include these measuring demographic structure,
economic attr ibutes, urban amenities, housing conditions and
materials. on the other hand, va r i ab l e s least wel l accounted for
by the factor structure includes the c i v i c l i f e amenities l ike-park
and playground, street l i gh t , m i d - l e v e l educational institution.
communality is the sum of squared factor loadings for each
va r i ab l es .
197
4.2 ECOLOGY OF URBAN CENTERS OF BANGLADESH: CROSS
SECTIONAL ANALYSIS OF DIFFERENT DIMENSIONS OF
VARIATIONS (SELECTION OF STRONG VARIABLES), 1961
By appl icat ion of pr inc ipa l components analysis, where
normal var imax rotation of a l l factors with eigen-values exceeding
2.0 was used to analyze the 40 urban centersX39 var iab les data
matrix, was prepared . An indiv idual value has been found fo r
each va r i ab l es . Where 39x39 corre lat ion matrix R^ (appendix-
4. 1) , factor loadings for four factors ( tab le 4 .2 ) , and eigenvalues
have extracted. The four factors reproduced 69.60 per cent of
the total variance ( r es t 30.40 per cent of the total variance is
explained by the other twenty six f a c t o r s ) , and orthogonal factor
scores or each urban center has been presented in table - 4 . 3 .
The computed eigen\-alues denote that the f i r s t four factors are
important and influence the ove ra l l p r o f i l e of urban environment
for the year 1961. Percentage of var iance explained by each
factor has decreased in a descending o rde r . Variables which
show a high loading { + 0.50 and above ) in table 4.2 and appendix
- 5.1 with 4 factors are designated as strong var iab l es in urban
dynamics. The factor loadings measure the association of the
or ig inal var iab les with each factor and may va ry between + 1 . 0
and -1 .0 , the extremes of per fect correlation amongs the
va r i ab l es . Converseh' , zero factor loading indicates no association
between that va r i ab l e and corresponding fac tor .

Tublo A.2: SIroiiB Vurlubloa 1!)(>1 l a o
SI. No.
Notations Factor - I Factor II Factor I I I Factor IV
High UrbQ'.ilzatlon Te r r i t o r i a l Stress and Housing Condition
Oomogroplilc and Urban Amenities Economic A t t r i b utes of Urbanization Communality
1 . TOPPOPULATION 0.956 .1.117 0.033 0.002 0.929
2. DEGURBANIZAT 0.882 0.348 0.086 0.003 0.907 3. MEDIANAGE 0.269 -0.055 0.803 -0.140 0.740 4. FOPGROWTHRAT 0.320 -0.306 0.671 -0.242 0.706 4. POPULDENSITY 0.215 0.758 -0.027 0.031 0.623 R. nEPENDKRATIO -n .326 -0..509 -0.562 0.215 0.727 7. NETMIGRATION 0.353 -0.178 0.761 -0.205 0.77U 8. SEXRATIO -0.303 0.034 -0.509 -0.261 0.419
9. AREA 0.944 0.006 0.087 -0.005 0.899 10. AREACIIANGE 0.004 0.058 0.053 0.909 0.040 11. POSTOFFICE -0.057 0.502 0.226 0.541 0.685 12. GOVERNOFFICE 0.844 0.398 0.201 0.119 0.924 13. PARKPLAYGROU 0.085 0.534 -0.076 0.144 0.318 14. CINliMAHALL 0.251 0.657 0 .096 -0.011 0.503 15. NEWSPAPERCIR 0.476 0.662 0.311 0.131 0.777 IB. STREF.TMGHT -0.011 0.078 0.532 0.193 0.326
17. IIOHI'ITAI.HMU 0.5()(i U.369 0.570 0.135 0.736 18. RANK 0.182 0.543 0.270 0.179 0.433 19. UUS 0.947 -0.007 0.047 -0.029 0.900 20. FPCfiMCWC -0.124 0.166 0.602 0.068 0.410
21. ELECTRICITY 0.020 0.286 0.319 0.060 0.859 22. WATER 0.952 0.127 0.069 0.027 0.928 23. TEI.liVISTON 0.11 n 0 .055 -0.015 0.915 0.052 24. TE 1,1';PHONE 0.727 0.496 0 .300 0.108 0.876 25. IIOUHUllOl.iJIiN 0 .430 0.725 0.100 0.024 0.753 26. KUTCHAHOUSE -0.153 -0.77G -0.208 -0.119 0.604 27. PUCCAROAD 0.653 0.543 0.150 0.063 0.751 28. ROADCONVI'.RGE 0.753 0.462 0.290 0.056 0.869 29. ROADDENSITY 0.299 0.739 -0.017 0.051 0.639 30. LITERACYRATE 0 .106 0.513 0.616 0.199 0.694 31. SECONDSCHOOL -0.184 0.490 0.375 0.012 0.415
32. COLLEGE -0.182 0.328 0.295 -0.012 0.227
33. UNIVEREQUINS 0.714 0.174 0.029 0.511 0.802 ' i4. '"-IfMlM OYMKMT -0.1'17 - ' ) . lO'l -0.705 n . rm 0.B27 35. PRINACTIVITY -0.269 -0.758 -0.257 -0.015 0.713 36. SECOACTIVITY 0.223 0.366 0.672 0.245 0.695 37. TERTACTIVITY 0.114 0.546 -0.300 -0.200 0.441
38. PERCAPITINC 0.657 0.396 0.468 0.140 0.827 39. ANNUALEXPEND 0.636 0.317 0.592 0.026 0.856
Percent Variance 26.60 19.90 16.00 7.20 Explainos
Ciiiriulnlivo PoPContQgo 26.60 46.50 62.50 69.70
h^ = sum of squared factor loadings for each va r i ab l e ; Total var iance = = sum of squares of each factor d i v ided number of va r i ab l es .
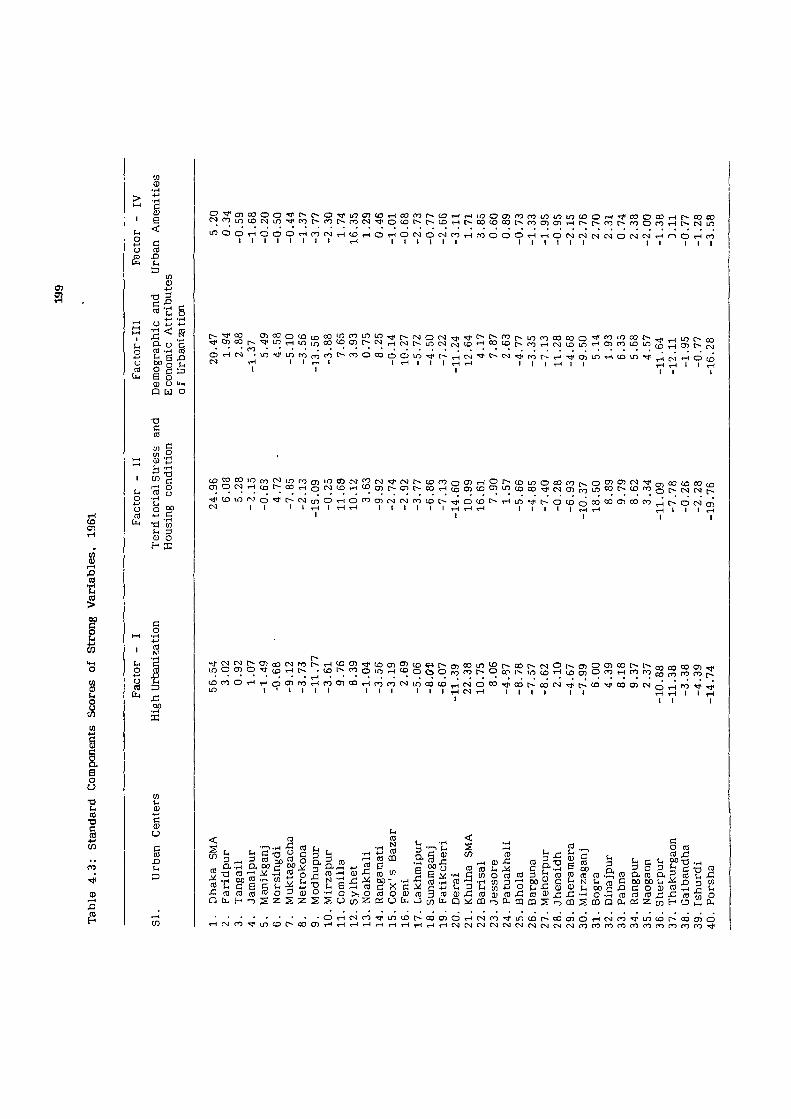
£
w w
B E <
g (-u) (a
lis ut;-;:! S < s
u (0 (JU
DO O 9 c s B o (U U «H Q [d o
T3 C (0
.2
I cn ^ t T;! ° i-4 CO (J 2 u o op (0 c -dw
fe g H X
o
o IS CL,
w I-01 •w
§ o c (0 a u 3
> I I I I I I I I I I I I I I I I I I I I I I I I
ro ^ I I I I I ( I I I , 1 . . . . . . I. J ' ' u-i I H I I I ^ r-l I I I I
I I l l ^ l r H ^ l l l l l l ^ ^ ^ l l l l l S ^ S i T i S I I I I I
LoOcnOrfiorHt^ CO ro o in iH O CTl (T) rH fO CD ) ' 1 1 I
00 CO 00 O ) CO cry rr} rrj o ^ o lO r-f O o O I> ^ 00 lO ID <H ua O) o crj rO m
s ; : ; , ! ; ^ ; I I I I
< s CO
ra
^ CU.H ftob^ooj/ .[-I 00 to -H m u
J-tntOffl'ooj^aj
to u 3 a CO N'd x: u eii
0)
« <a CQ CO g'-x (0 o
•M
e
® (0
s ® s g
< s cn
2 (0 c , 0) •HwpTiooJJc^, NtinjCooooui^jDau)
Qti-H'TiSzSzssotozoiOfcJt/jbHQi^mriO-cDmS'oiBSmQa.oJzSHo^DL,
a o u ^ o nj « "J P o cfl ^ 2 0) (0 x:
to tj c 3 £ (U e-2 S (0 «
C I-u, x: ® Qj
t, S CO 00 , U c <-i 3 O 3 _ ^ ra a CO D. 3 CO C 00 00 ^ X3 - c O IB CO .rt
rHCSrO- inCOC COCDT- T-lr-l THrHrHTHrHrHrHcsjCNicsic jrvJCNic csiCNJcsirOfOrOfnrnrornrororo
200
However , the f i r s t - s t ep cross-sect ional analysis included
a l l th i r t y nine va r i ab l e s and produced four interpretab le factors.
These are designated:
i ) High Urbanization,
i i ) T e r r i t o r i a l stress and housing condition,
i i i ) Demographic and Economic Attr ibutes of Urbanization,
and
i v ) Urban Amenities.
The four factors are confirming the general var iance
on socio-economic and demographic status of d i f f e r en t urban
centers. Factor scores of 39 var iab l es were computed and 4
composite maps were drawn to show the spat ia l var iat ion of the
d i f f e r en t dimensions of va r i ab l es , which showed a high degree
factor loading to v i sua l i ze the supremacy in the i r r espec t i ve
dimension.
4.2.1 Factor-I: High Urbanization
Factor - I expla ins 26.60 per cent of total var iance in
normal var imax rotated factor matrix, which is mainly contributed
by the fourteen pos i t i v e strong va r i ab l es ( p o s i t i v e factor loadings
equal or more than 0.50 per cent va r i ance ) . According to Factor-
I, only Dhaka and Khulna are character ized by high urbanization
and a high dynamic nature.

201
High urbanization can be grouped into four micro - leYal
categor ies :
a ) Demogrpahic and spat ia l expansion with high urbanization
i ) Urban population (P and H)
i i ) Urban area (P and H)
i i i ) Degree of urbanization (P and H)
b ) Urban f a c i l i t i e s and amenities
i ) Water supply (P and H)
i i ) E l ec t r i c i t y ( P a n d H)
i i i ) Telephone (P and H)
i v ) Hospita l (P and H)
V) Government o f f i c e (P and H)
v i ) Educational institution (P and H)
e) Urban transportation
i ) Bus (P and H)
i i ) Pucca road and road (P and H)
convergence
d ) Material status
i ) Income (P and H)
i i ) Expenditure ( P and H)
High = factor loading above ± 0.75, Medium ± 0.50 to t V.75 P = Pos i t i v e and N = Negat ive d i rect ion; H = High and M = Medium magnitude.

202
Highest pos i t i v e loading is accounted in the size of
urban population (0.95630), f o l l owed by 'urban area ' (0.94432)
and degree of urbanization (0.88237). It can be recognized in
terms of demographic and spat ia l expansion with high degree of
urbanization. Urban f ac i l i t i e s and amenities can be further
separated into water supply (0.95209), e l e c t r i c i t y consumption
(0.81961), telephone (0.72698), Hospital beds (0.50633),
government o f f i c e s (0.84358) and higher educational institution
(0.71352). Urban f a c i l i t i e s and amenities are a v e r y important
c r i t e r ia for growth of urban s i ze and expansion of urban area.
These var iab l e are being used as pul l factors in urban dynamics.
Transport and communication p lays a v i t a l r o l e in urban
growth and development of spec ia l i zed a c t i v i t i e s . Their spat ia l
•pattern i s iniiuenced by the f a c t o r s of complementarity, intervening
opportunit ies and t rans f e rab i l i t y . As the degree of connectivity
i s character ized by var ia t ions , the l inkage patterns have been
examined both by number of buses and road convergence in an
unit area. These have accelerated the growth of urban
populations and landuse intensi ty . There i s a signif icant pos i t i ve
factor loading by bus serv i ces (0.94699), pucca road (0.65269)
and road convergence (0.75385) . Dhaka, Khulna, and Comilla
fo l lowed by Pabna and Rangpur, are the c i t i e s where signif icant
convergence of road is obse rved .

203
Mater ia l status is character ized by medium type of
pos i t i v e loading in income (0.65729) and annual expenditure
(0.63599). Both the indicators are v e r y important to understand
the var iat ion of urban growth dynamics. Big c i t i e s ' expenditure
and income both are h i gh l y loaded in material status dimension.
Spatial pattern of high urbanization as revealed by
Factor- I can be best analysed with the help of f i gure 4.1, where
composite factor scroes of Factor- I have been plotted for the
f o r t y selected urban centers of Bangladesh ( t ab l e 4.3. J • Highest
pos i t i v e score i s 56.54 for Dhaka, fo l lowed by Khulna (22.38) .
Occurrence of v e r y high scores rovea ls that they are the most h igh ly ,
urbanized c i t i e s of the country. Overa l l composite scores range
between + 56.54 to -14.74. The least urbanized towns are Parsha,
Modhupur, Derai and Thakurganj, and the ir negat ive factor scores
are -14.74, -11.77, -11.29, and -11.36 r e s p e c t i v e l y . A large
number of urban centers are grouped in medium type (X + 0.5
S.D. to X -0 .5 S .D . ) of urbanized centers. These are Faridpur,
Tangail , Jamalpur, Manikganj, Narsingdi, Netrokona, Mirzapur,
Noakhali , Rangamati, Cox ' s Bazar, Feni, ' Lakhmipur, Sunamganj,
Patuakhali , Jhenaidh, Bheramera, Dinajpur, Naogaon, Gaibandha,
and Ishurdi , Comilla, Sy lhet , Bar isa l , Jessore, Bogra, Pabna,
and Rangpur, have emerged as high urbanized urban centers and
the factor scores have been found betv/een 5.93 to 17.79 ( tab le
4 .3 . ) .

i \
/>j
fi'S^E W - w B A N G L A D E S H
204
I T F "
O? o V COMPONENT SCORES ( X = 0 00 . SD =11 86J)
V . > ?
HIGH U R B A N I Z A T I O N COMPONENT - I 1961
C L i
— U
s jO
©
^ X »1 55D:
^ X»0 55D,
! X-0 5SD;
-1 5SD
VERY HIGH .17 791
HIGH . 5 930
MEDIUM - 5 3 3 0
LOW -17 791
VERY LOW
2CJ
O O
o ©
© S 2 1
/ I
N
ii'N
INDIA
U3=
U2-
cO
24_
B A ' P O P U L A T I O N S IZE OF T O W N S
PERSONS 100,000
75,000 --50.000 — 25.000
10.000 5,000
10 0 20 40 60 I I I I I r I I KM
eifE
Above 50( 000
I 100000-499,999
?
i 2d
©
910° .SJL FIG.if . l R£A)AN/90

205
4.2.2 Factor-I l : Territorial Stress and Housing Condition
High t e r r i t o r i a l pressure and low qual i ty of housing
condition have been ident i f i ed in larger c i t i es and smaller towns
r e spec t i v e l y . Fac to r - I I explained about 20 per cent of total
variance. In Fac to r - I , fourteen var iab l es appeared as strong
correlates on urban dynamics. Here, eleva:i v a r i ab l e s are found
to be po s i t i v e l y corre la ted vrith urban environment but the rest
of the three are inve rse l y correlated with s i ze of urban centers,
these are Dependency rat io ( - 0 .509 ) , Kutcha house ( -0 .776 ) and
Primary a c t i v i t y ( - 0 . 7 5 8 ) . .-Ml of these are i nve r s e l y correlated
with large urban centers. Conversely , related to high t e r r i to r ia l
stress are the high loading of population densi ty (0 .758) , park
and playground ( f a c to r loading 0.534) , household density (0 .725) ,
road density (0 .739 ) , and pucca road (0 .543 ) . Moreover, post
o f f i c e (0 .582) , cinema ha l l (0 .657) , newspaper circulation (0 .668) ,
bank (0 .543) , and ter t iary ac t i v i t y (0 .546 ) , showed a
considerably h igh factor loading in urban dynamics. The loading
of l i t e racy rate i s also high (0 .513) .
For bet ter understanding of the t e r r i t o r i a l stress and
housing condit ion, the fol lowing notations" have been used with
the help of factor loading in s ix categor ies :
a ) Population and congestion
i ) Population densi ty (P and H)
i i ) Household density (P and H)
= Pos i t i v e and N = Negative d i r e c t i o n magnitude, H = High, M = Medium and L = Low magnitude of urban dynamics.

206
i i i ) Parks and ^ o v ^ d (P and MJ
b ) Transportation
i ) Pucca Road ( L e n S ^ ^ ^ ^^
i i ) Road density ^^
c ) Housing condition
i ) Kutcha house and H)
d ) Urban aoa i i t i e s
i ) Post o f f i c e (P M)
i i ) Cinema hal l (P and M)
i i i ) Bank (P and M)
i v ) Newspaper (P and M)
e ) Economic status
i ) Pr imary a c t i v i t y (N and H)
i i ) Te r t i a ry a c t i v i t y (P and M)
f ) Other
i ) Dependency rat io (F/M) (N and M)
Populatioin density and congestion category has formed
with the help of population densi ty (0.75813), household density
(0.72500) and parks and playground (0.53346). Density and
congestion factor g i ves a clear indication of high pressure in the

207
large c i t i e s . Congestion is found to be gradual ly decreasing with
the s ize of towns. Pucca road (0.54134) and road density
(0.73944) a re having a high pos i t i v e loading and this can be
explained in terms of transportation. Road density i s h igh ly
corre lated wi th population density ( r = 0.89) and i t is v e r y close
association with large c i t ies ( see appendix 4 . 1 ) . On the other
hand, kutcha house concentration is i nve r se l y related v;ith large
c i t i e s ( r = - 0 . 2 8 ) .
Medium types of pos i t i v e loading of post o f f i c e
(0.58162), cinema Hall (0.65651), bank (0.54318) and newspaper
circulation (0.66193) have formed urban aminit ies group. An
insight into the var iab les of this group revea ls that urban
amenities and t e r t i a ry ac t i v i t y (0.54613) are signif icant in
determining the socio-economic environment of urban centers, and
converse ly pr imary ac t i v i t y ( -0.75783) shows the negat ive
loading. A l l these factors r e vea l that they behave in a certain
consistent fashion. High pos i t i v e loading i s the indicator of high
s tandard o f 1 i v ing and people are immigrating in big urban centers
as a pull f ac to r . While the negat ive loading shows just the
r eve rse condit ion. Negat ive dependency rat io ( -0.50851) indicates
that the de f i c i ency of e lders and ch i ldren , i s the indicator of
rapid growth of urban centers. Factor scores are shown in f igure
4 .2 . Centers with pos i t i v e l y v e r y high scores are noted for
maximum degree of t e r r i t o r i a l s tress , wh i l e the occurrence of
negat ive ly high scores indicates low t e r r i t o r i a l stress and poor

8'9°E "gltf ^ gTf" B A N G L A D E S H
TERRITORIAL STRESS AND HOUSING CONDITION COMPONENT - 11". 195 1
U5 O
s .
s . N
o
• X-05SD I \ X-15SD
, n COMPONENT SCORES ( X= 0 00 ; 50= 9 500) 1 f I I \
VERY HIGH • K .250
HIGH • A .750
MEDIUM -A 750
LOW -14 250 VERY LOW
o o
o •s
INDIA
-V rO
INDIA 24
B A 0 F
^ I P O P U L A T I O N S I Z E OF T O W N S PERSONS
100,000 75,000
Above SOaOOO
---5 0.000 ---25 000 ---10.000
5.000
I 100000-499,999
10 0 20 60 60 ' • I ' I " I 'KM
eifE 910 _9/ FIG. k2 REJUAN/90

209
housing condit ion. Here, fac tor scores more than 4.25 are noted
in the three urban centers. A l l these urban centers are located
on the main road and ra i lway routes ( excep t Ba r i sa l ) . Barisal
is connected with main road and waterways but no ra i lway
routes. Modhupur, Derai and Porsha have v e r y low l e v e l of
t e r r i t o r i a l stress and poor housing condition ( fac tor scores - 14.25
and more ) .
4.2.3 Factor - in : Demographic and Economic Attributes of
Urbanization
This factor explains 16.00 per cent of the total
var iance . It i s mainly contributed by the ft)llo\.'ing twe l ve strong
va r i ab l e s . Within the 12 strong va r i ab l e s , three are negat ive ly
loaded and rest nine corre lates are pos i t i v e l y working in
mechanism of urban system change in Bangladesh. Here, three
ident i f i ed sub-groups explain three d ist inct character is t ics of
urban dynamics. Although the contribution of Fac to r - I l l i s not
v e r y h igh . Though i t i s important because i t has incorporated
an important demographic and economic va r i ab l e s of urbanization.
Out of the twe l v e var iab l es , s ix of them re f e r to demographic
typo logy of urban centers of Bangladesh. Out of which four
va r i ab l e s have pos i t i ve re lat ionship with Fac to r - I l l whereas the
other two var iab l es sex rat io (Female per 1000 male) and
dependency rat io are negat ive ly re lated with the factor .

210
Fac to r - I l l : Demographic and Economic Attr ibutes of Urbanization.
Category Magnitude
( a ) Demographic typo logy
i ) Net migration P and H
i i ) Population growth P and M
i i i ) Median age P and H
i v ) Sex rat io N and M
v ) Dependency rat io N and M
v i ) L i teracy rate P and M
( b ) Economic
i ) Unemployment N and H
i i ) Secondary a c t i v i t y P and H
i i i ) Annual expenditure P and M
( c ) Health and Family Planning
i ) FPC and MCWC P and M
i i ) No. of Hospital bed P and M
( d ) Other
i ) Street l ight P and M
P is pos i t i v e and N is negat ive direct ion of magnitude; H is h igh, M is medium and L is low magnitude of urban dynamics.
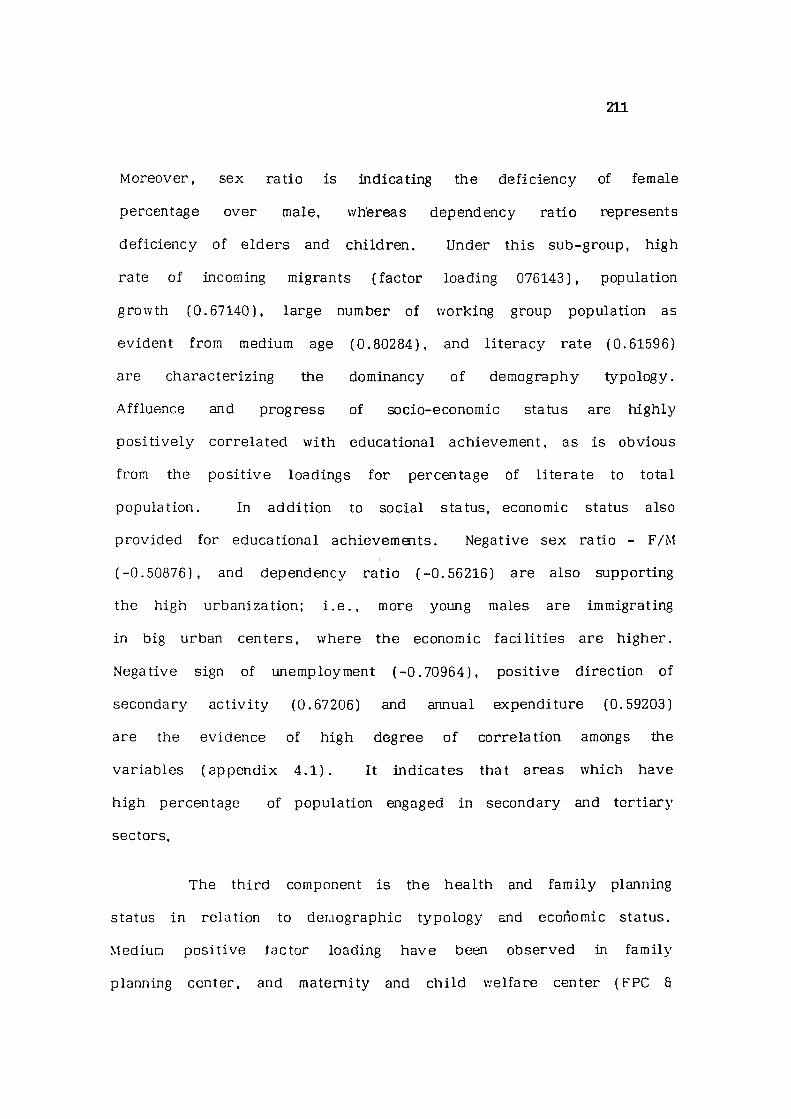
211
Moreover, sex rat io is iadicating the de f i c i ency of female
percentage over male, whereas dependency rat io represents
de f i c i ency of e l d e r s and chi ldren. Under this sub-group, high
rate of incoming migrants ( factor loading 076143), population
growth (0.67140), large number of working group population as
evident from medium age (0.80284), and l i t e racy rate (0.61596)
are characteriz ing the dominancy of demography typo logy .
Aff luence and progress of socio-economic status are highly
pos i t i v e l y corre la ted with educational achievement, as is obvious
from the pos i t i v e loadings for percentage Of l i t e ra te to total
population. In addit ion to social status, economic status also
prov ided for educational achievements. Negative sex rat io - F/M
( -0 .50876) , and dependency rat io ( -0.56216) are also supporting
the high urbanization; i . e . , more young males are immigrating
in big urban centers, where the economic f a c i l i t i e s are h igher .
Negative sign of unemployment ( -0 .70964) , pos i t i v e direct ion of
secondary ac t i v i t y (0.67206) and annual expenditure (0.59203)
are the ev idence of high degree of correlat ion amongs the
var iab les (appendix 4 . 1 ) . It indicates that areas which have
high percentage of population engaged in secondary and ter t iary
sectors.
The third component i s the health and fami ly planning
status in relation to demographic typo logy and economic status.
Medium pos i t i ve factor loading have been observed in family
planning center, and maternity and ch i ld wel fare center (FPC 8

212
MCWC, 0.60196], and concentration of hospital bed (0.56026).
This sub-factor r e f l e c t s a low pos i t i v e health fac i l i t i es of the
country. FPC a MCWC and hospita l f a c i l i t i e s are associated with
nedica l f a c i l i t i e s , l i k e pre-natal and ante-natal mother care and
c h i l d hea l th serv ices .The poor economic conditions account for lack
of health f a c i l i t i e s .
Figure 4.3 shows the spatial var iat ions of demographic,
economic and health status of urban centers of Bangladesh. Factor-
I l l may be best analysed v/ith the help of f i gure 4.3, where the
composite factor scores of Fac tor - I l l have been plotted for a l l
40 urban centers. It i s observed that the urban centers are
character ized by both high pos i t i v e and high negat ive scores.
S imi lar ly large urban centers are associated with high pos i t ive
and small towns to high negative factor scores . Most of the small
towns are located near to the large c i t i e s . The i r pecul iar location
is responsib le for medium pos i t i v e to h igh negat ive composite
scores . This is because large c i t i es have bet ter job opportunities
but high rent of houses, due to which peop le from small towns
more to the large towns leaving behind the i r f ami l i es .
Dhaka secured the highest factor score (20.47) fol lowed
by Khulna (12 .64 ) . Th is is a v e r y high ranking group in
demographic and economic urbanization. Manikganj, Marsingdi,
Comil la, Sy lhet , Rangamati, Feni, Bar isa l , Jessore , Jhenaidh,
Bogra, Pabna, Rangpur and Naogaon belong to high leve l of
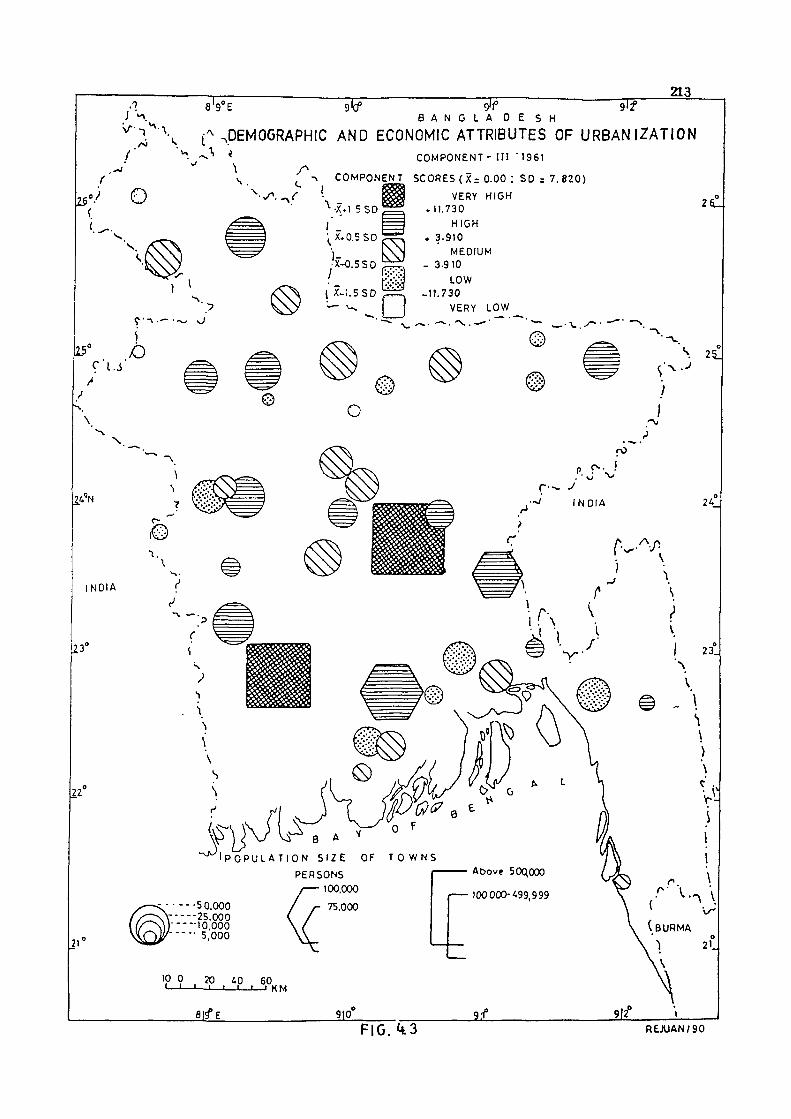
8 '9 °E .1 I H
^DEMOGRAPHIC AND ECONOMIC ATTRIBUTES OF URBANIZATION B A N G L A D E S H
w 213
COMPONENT- I I I "1951
o ^ -N COMPONENT SCORES ( X : 0.00 : SO = 7 .820 )
f ^ ygPY H I5H -X.l 5 SO
I _ X.0.5 SO
yX-0.5S0
I X-1.5SD
•
A
i
r ' l - i ' I
I'' ^
• 11.730 H IGH
• 3.910 MEDIUM
- 3.910 LOW
-11.730 VERY LOW
2CJ
©
s 2l1
) \
o 'V \
r-. ! •V
H 'N r - y
I N D I A
INDIA
123°
tO
2'L
23J
L2I'
- -50.000 --25.000
--10.000 -- 5,000
^ P O P U L A T I O N S I Z E OF T O W N S PERSONS
100,000
75.000
Above 50C\000
100 000-«99,999
'P 9 , 20 iO 60 ' ' I I ' I ' ' K M
fllf E 9|0 FIG. RE JUAN/90

214
demographic and economic development and composite scores range
between 3.91 (X + 0.5 S .D. ) and 11.73 (X + 1.5 S . D . ) . On the
other hand, medium group ranges between 3.91 (X + 0.5 S .D. )
and -3 .91 ( X + 0 . 5 S . D . ) . Faridpur, Tangai l , Jamalpur, Netrokona,
Mirzapur, Noakhal i , Cox ' s Bazar. Patuakhal i , Barguna, Dinajpur,
Gaipandna and Ishurdi are in medium range group.
Low l e v e l of demographic and economic development
is observed in Muktagacha, Lakhmipur, Sunamganj, Fat ikchari ,
Derai, Bhola, Meherpur, Bheramara, Mirzaganj and Sherpur.
There values range between -3.91 to -11.73. Only three urban
centers (Modhupur, Thakurganj, and Forsha) f a l l into the groups
of v e r y low l e v e l of demographic and economic attributes of
urbanization. Small towns have predominance of primary and
ter t iary a c t i v i t i e s and have low negat ive scores .
4 .2 .4 . Fac t o r - r v : Urban Amenities
Urban functional ac t i v i t i e s are d i r e c t l y related to urban
amenities and f a c i l i t i e s ava i l ab l e . Factor- IV explains only 7.20
per cent of the total variance which is mainly contributed by
four strong va r i ab l e s . Out of four, 'area change' ( factor loading
0.90947) i s a d i f f e rent type of v a r i ab l e than the urban amenities
va r i ab l e s . Post o f f i c e (0.54055), Univers i ty (0.51116) and
Radio/Telev is ion (0.91478) per lakh population indicate high
pos i t i v e corre lat ion between fourth factor and the other var iab les .

215
• I t does not mean that the contribution of other var iab le is zero.
But they have poor pos i t i ve or negat ive relat ionship with this
fac tor .
To summarize the urban amenities pattern of selected
f o r t y urban centers in Bangladesh, composite factor scores have
been computed and are plotted on the map ( f i gure 4 .4 ) . Urban
centers with v e r y high scores have maximum urban fac i l i t i e s l ike
- Dhaka and Sylhet , whose values exceed the X + 1.5 S.D. (more
than 4.911 factor s co res ) . Converse ly , the occurrence of low
scores indicates poor urban f a c i l i t i e s . Lowest f ac i l i t i e s have
been found in Jamalpur, ( -1 .681 ) Madhupur ( - 3 .769 ) , Mirzapur
( - 2 .295 ) , Lakhmipur ( - 2 .733 ) , Fat ikchar i ( - 2 .660 ) , Derai ( -3 .114) ,
Meherpur ( - 1 .948 ) , Bheramara ( - 2 . 147 ) , Mirzaganj ( -2 .756 ) ,
Naogaon ( -1 .996 ) and Porsha ( - 3 . 5 7 7 ) . Re la t i v e l y high urban
f a c i l i t i e s are found in Comilla, Khulna, Bar isa l , Bogra, Dinajpur
and Rangpur. These factor scores range between 1.637 to 4.911
(X + 0.5 S.D. to X + 1.5 S . D . ) . Rest twenty urban centers
belongs to group having moderate f a c i l i t i e s . Values l i e between
1.637 to -1.637 (X + 0.5 S.D. to X -0 .5 S . D . ) .
4 .2 .5 Strong Var iables in Four Factors , 1961
Except Dhaka, Khulna and Chittaganj c i t i es almost al l
urban enters have strong v i l l a g e charac te r i s t i cs and many of
them grade into v i l l a ge quite impercept ib ly (Rash id , 1977). Even
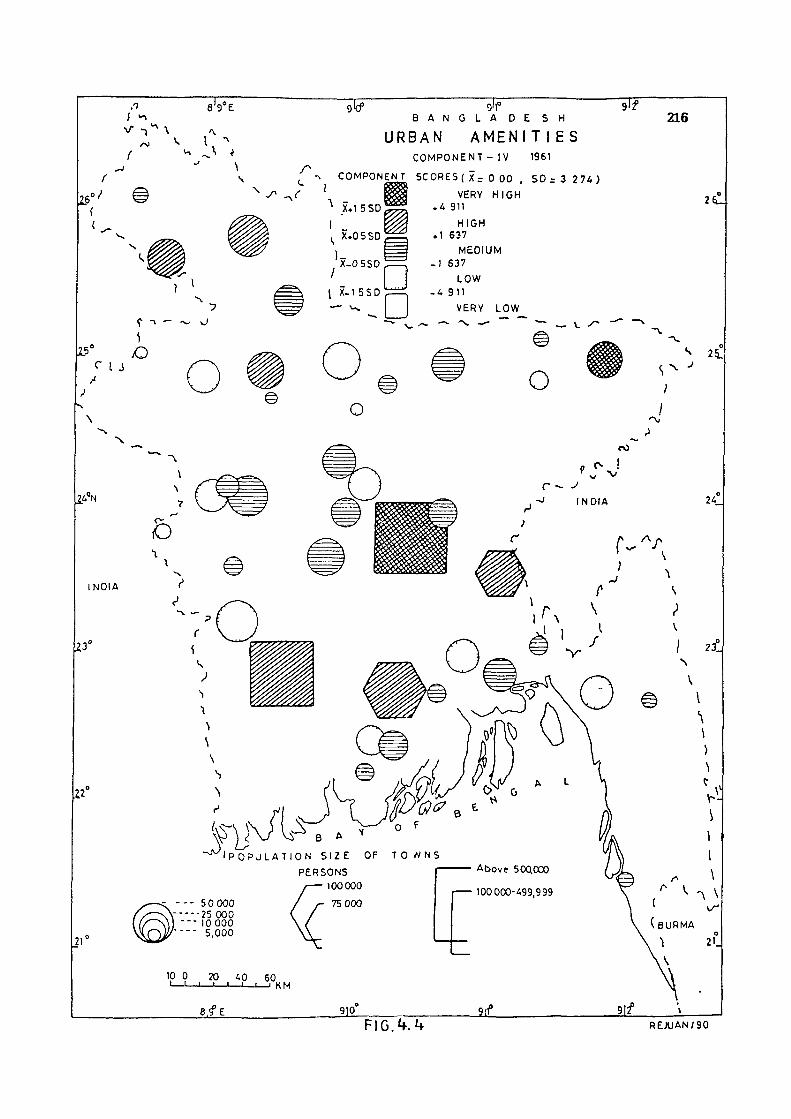
a^E
\
.1 I ^ B A N G L A D E S H
URBAN A M E N I T I E S C O M P O N E N T - I V 1961
w 216
s r
U-5'
1 S
U5° <~ I i
9 -X -
o
J •N
X»15SD
X.0 5SD
' COMPONEN T S C O R £ S ( X = 0 0 0 , S D = 3 2 7 4 ) ^ I VERY H IGH
• A 911 HIGH
.1 637 medium
- ) 637 LOW
-4 911 VERY LOW
/ X-0 5SD
1 BSD
© o
O
INDIA
B A I P 'OPJLAT ION SIZE OF T O W N S
PERSONS 100 000
50 000 / r- 75 000 ---25 000 --- 10000 --- 5,000
10 0 20 40 60 I——I—I—I—I—I—I km
e . f E
Above SOaOOO
I 100 000-A99,999
s
V
22A ^
9|0 REA)AN/90

217
l a rge towns l ike -Comi l la , Sy lhet , Rangpur e tc . had a rural
atmosphere upto 1961. So, i t i s v e r y wise to ident i fy the strong
va r i ab l e s , those which accelerated the urban dynamics mechanism.
However , the commonality shows a wide range of
var iat ion in the factor loading value f o r each var iab le .
Communality value exceeding 0.50 i s designated as a strong. In
th is connection, out of 39 va r i ab l e s , 31 var iab l es have been
ident i f i ed as strong var iab les for urban system change and as
k inet ic agents of urban dynamics in Bangladesh in 1961. List
of va r i ab l e s and the values of communality for strong var iables
can be found in table 4.2.
'communality (h ) is the sum of squared factor loadings for each
va r i ab l e .
218
4.3 ECOLOGY OF URBAN CENTERS: CROSS SECTIONAL ANALYSIS
OF DIFFERENT DIMENSIONS OF VARIATION, 1974
For a l l the selected 40 urban centers of Bangaldesh,
39 var iab les pertaining to demographic and socio-economic
infrastructure for 1974 were chosen and subjected to principal
components analysis ( see appendix 1 . 1 ] . A var imax rotated factor
matrix was obtained which contains four factors ( tab le 4 .4 ) .
A 39 X 39 corre lat ion matrix was prepared , see appendix - 4.2.
Examination of the rotated factor loadings on these factors
rendered them to be labe l led as high economic urbanization with
high urban functions (urban amenit ies ) , deurbanization,
demographic deurbanization, and h igh t e r r i t o r i a l stress. With
regard to contribution of these factors in total variance, i t was
observed that high economic urbanization with high urban functions
accounts for 25.50 pe r cent, deurbanization f o r 17.90 per cent,
demographic deurbanization for 15.50 per cent and high terr i tor ia l
s tress for 10.10 per cent of total var iance of strong var iab les
f o r urban dynamics. Put together, these four factors account for
69.00 per cent of the total var iance of the 39 va r i ab l e . Factor
scores were also calculated to judge the spat ia l variat ion of urban
functions and economic v a r i ab i l i t y in d i f f e r en t centers (Tab le 4 .5 ) .
The communalities are shown in table 4 .4 . Each factor w i l l be
discussed in turn.

o w f^ U -C
v s . Q QJ •
oo a o ••-I -r-i
I t, « s I .y
O -S i s Q
n) Cl
I CO N
S £ (J (0
OJ
o z o s ' s S o o C •
o w LJ U x: I x; OT oo-Q DC
a: s D:
^ o OD 2
CO Q (O n CO 00 CO 6 H CO CO CO 00 m cs > fO w o 1-1 Tp CO (O N CJ) m cs CO lO CO w CD CO in o d d d d d d d o d d
CO CO o m CO CO CO in (O oo O) SI H fo TH CO oo CO TH (O ro (O o CO in ^ c r-i f^ ^ w in CO (O cn N fO CO in o cn ir> i/3 CO CO ^ CO o (O d d d d 6 O o CO d o o d d
m TH frt (NJ CO c c lo o CO CD CD C fO fO r>j ^ O O o O O O o o O I
( I
u THoOTro>inf»roc7)a>ro{j)o:)OOiHt-<ir50cDcot--ooc CNiu:>cooorHOO m CO 00 rH o o CO CO CM CO rt in in CO CM c 00 in cn m in m W ro CO CM ro in ^ O O t-4 1-1 CM TH ro CO o O O o o O O d
CO ro in CO CM M CD CO in o CSJ CO CO m CM CD CO CO o rH o o in ro CD m CJ) CM 00 rH ^ m rH o> H CO l/> CM <7) CO CD CO r-l CO r- rH ro CO rH 05 m 00 TJ1 CO O CO r-l ro CO rH m O) T-t cr> CM CO CM CM CM r CM CO ro CO CO ro cn CO m co O CO CM ro CM CO CO ro CO CM ro o in in CM CO CO o o Cl CD cr> m in CO in ro CO m ro CO CM u ro r-- ^ m TT CD O) CO o CO in rH tn CO CO <a m cn CM CM CO rH CO CO m ro CM o CM rH o O ro ro rH rH O O O r-i CM -M CM rH o CO CM rH o in o m
CD O 1
d 1
d 1
O d d d 1
O d 1
o d 1
d o o o 1
o 1
o 1
O o 1
O 1
O 1
d t
o o O 1
o 1
O o 1
O 1
o 1
O 1
d o CD 0 1
d 1
o in rH
CO tn
in ro rH CM ro ro CO <D CD H in 00 CD 'a' CD m m rH o CM a> CM o m in cn ^ CM CO ro ^ o CM cn CM CO O) CO o CM C7) o CO CO in CM CT) CM ro o> ^ CO ro fO TJ- CM O) CO ro CO Tf rH rH O) 00 CM ro o> 00 CO CO s ro rH 0) CJ cn m CM CD ro c a> O) CO i£J m o CO rH tn ro CO CO CM CO ro o o CO in O o in CO rH o CT)
CO ro CO O) rH in CM > Tt m ro CO CO CO cn CM ro cn rH TH rH CO CO o CO O) Q) O) CM CM rH CM rH o CT) C rH CO o rH O rH CM CM CM in OO in in in rH CM ro O CM CM rH rH rH CM CM rH
O) ro o
J o )
o J
o 1
o 1
O o d 1
d 1
o 1
O 0 1
o O o 1
o O 1
o d J
O 1
d 1
d I
d d 1
d I
O O J
O 1
O t O 1
O O o O d O 1
d 1
O 1
O J
rH ro
CO «N rH CO in ro O) CD rH o o o o o 05 o rH rH CM o o> o> O) M CM o CO H O CO m LO ro CM CM o a> o> CO t CO M CO CO o CO ro fO CN O ro CO CM CO in in Tf c o CO cr> CM CD H O CM in CM in ro ro CO CM CO CO rH > O rH ro o CM CO fO (O o rH Oi O rH rr CD ro CD CM cn CO rH CO o CO oo CM CM CM m o CO CO CO rH 'J' CO O) H CM O m o O O o rH (O ro O c> 03 rH CO -J" O m CO rH f> in in m ro in in O d o o o o o d O d d d O o O d d O O d d d d O d o d d d O d o d d d o
o H < t-H flj -J ^ O -J < tn ^ o S < :_) i-H H o a O 111 w (- Q S
a: 7 H d IlJ UJ O Q Q n; J o w a. Du a, O O M Ph ou a
2 W H f Ss 3 O 1- 3-TK a: < < (-. X u w u w o; o; 2 in < <
u 9 til K [M lu o y u. li, o < U, J o tK D-, [- u y; U5 > Q; o o 3 CL o a.
q; H Q >< X CU H z O 3 u U o H UJ
< fc; u 2 H ce m >
CiJ E to U UJ U] a: C/5 z i/y o W H o < CL _] < u (f) r tn tn II. ti] H
z u cu D en w U J S H O
(/3 Z >. >• z u H f- fc:
IOKWOZZKUW
Q
EQ ^^ u u o; z u z cu <
OrHC ( ' ir5COC COCT)OrHCSir0 incDr COa)OTHCslfOrj'inCDC COa)
a> u s •c ra >
Q) •J c c « OJ nJ Soj CD X Ou u

I-l a •*-> u nj
(0 •H ti <0
I-l o o (0 Du
U o
u « 0-.
L, o u ct)
i s
oof •H U DC tJ
o •H t;
ooja 2 B 3 (B Q) a Q
c o •t-H
(0 N •rH c (0 I-l s Q
s to N
t, S CD
o -p •H ^ B 3 o E •c , R op S.2P2
w X i:!
X 2 <
rt o
' I I I ) 1 1 ) 1 1 ^ , ^
lo "(I in to -1' I'" o (o CM ^ o - -- •—1 rn m o CO o Ti. M I I 1 1 I lH I I JiJ I
in -I' IM tvi O) lo " lO I- -|| lo ^ ocriTHOc c 'J^^mt' tO' J'CD .t • . rm .—. .'. .—.
I
S 9 3' is '.2 O' ^ PM <a 'O to M
r H I l " I I I I r H l ^ r H I t
" ' ' ' ' I I Tf I I I I I I I I I
1—1 VH I-- I'J U J <U I Q U J UJ aj LOTjio^mtocn^-^irjtoc^ocoo-^c^c^^iSto I I I I rt I rH rH I I I ^ I 1 I
COrHtOOrH-«<tSlt CMOtDr-lrHOrHrO ,.rHt-lrHrH | I | ^^oJ^rHrH I I I I
lO cs CN) rH to m cs •51' N to m 1 1 •cr
rH CM 'I
B Ih C 3 3 tD a H a 00 •a rH is 00 to -H
to •of S ^ t,
to I is § i s Q u. H " S
•3™o?ltorHa)-Cto lA LJ -G M -M V/ r:r 3 0 O
Ih to •rH N iH to to CQ
U)
U _ I s
00
< s: to
: 2c s
to ^ rH li) to 3 :5 "'0 S
S S) to ra to to
o to to £ fcj r Ih OO-a 3 o 3 b; 1 -O ™ a to a 3 a t; r 00 OO t-i a 3 W P 2 'r X
rHCMtr) lOg >COO r r rHrHrHr rHr rHrHcscscMcscNcgcMCNicNirsjcofororofOfororoforoi ,!

221
The interpretat ion of the fac tors needs caution in
explanation S r e q u i r e s deta i led examination of push factors in
surrounding rural areas and pull factors in urban centers. In this
section of the chapter an attempt has been made to ident i fy
the strong va r i ab l es (± 0.50 or more factor loadings va lue ) in
the l ight of h igh economic and demographic factor scores Vv'ith
urban functions. The fo l lowing character is t ics of urban ac t i v i t y
show strong va r i ab l e s , which are contributing main k inet ic energy
f o r urban growth and development in Bangladesh:
Factor-I: High Economic Urbanization with High Urban Amenities
a ) i ) Te r t i a ry Ac t i v i t y (P and H)
i i ) Pr imary A c t i v i t y (P and H)
i i i ) Secondary A c t i v i t y (P and M)
i v ) Unemployment (N and M)
V) Income (P and H)
b ) Transportation
i ) Road Convergence (P and H) •
i i ) Buses (P and H)
c ) Urban Functions
i ) Post Of f i ces ( P and M) i i ) Cinema Halls (P and H)
i i i ) News Paper Circulations (P and H)

222
i v ) Telephones (P and M)
V ) Te lev is ions • (P and H)
d ) Functional Institutions
i ) Secondary School (P and M)
i i ) Col leges (P and M)
e ) Housing
i ] Kutcha Houses (N and H)
f ) Density Var iables
i ) Population Density (P and M)
i i ) Household Density (P and M)
Factor--II: DairbanlT-^tion
a ) Demographic
i ) Urban Population (N and H)
i i ) Degree of Urbanization (N and H)
i i i ) Household Density (N and M)
b ) Urban Amenities
i ) Government O f f i c es (N and M)
i i ) Te lev is ions (N and M)
i i i ) Telephones (N and M)
i v ) E l ec t r i c i t y (N and M)
V ) Water (N and H)
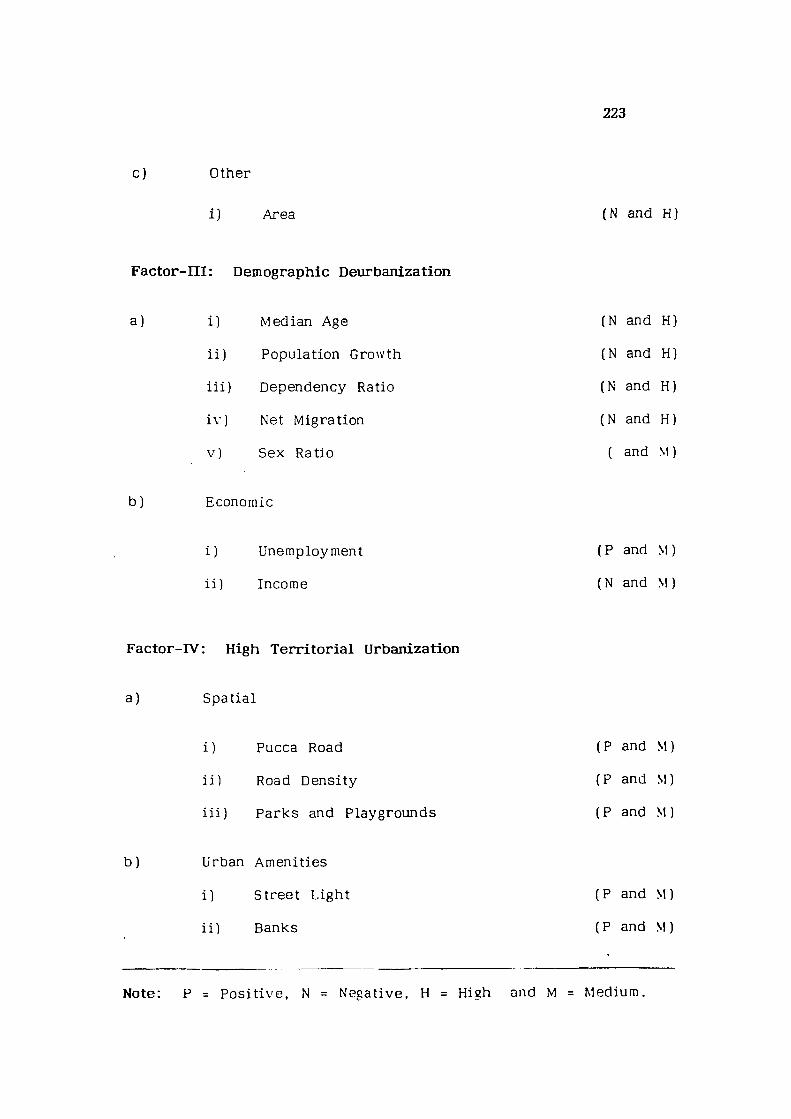
223
c ) Other
i ) Area (N and H)
Factor -ni : Demographic Deurbanization
a) i ) Median Age (N and H)
i i ) Population Growth (N and H)
i i i ) Dependency Ratio (N and H)
i v ) Net Migration (N and H)
V) Sex Ratio ( and M)
b ) Economic
i ) Unemployment (P and M)
i i ) Income (N and M)
Factor-IV: High Territorial Urbanization
a ) Spatial
i ) Pucca Road (P and M)
i i ) Road Density (P and M)
i i i ) Parks and Playgrounds (P and M)
b ) Urban Amenities
i ) Street Light (P and M)
i i ) Banks (P and M)
Note: P = Pos i t i v e , N = Negative, H = High and M = Medium.

224
4.3.1. Factor-I: High Economic Urbanization with High Urban
Functions (Urban Amenities)
The f i r s t factor accounts for the largest proportion
of total variance (25.50 per cent) which determines the l eve l
of economic urbanization of the towns: Economic ac t i v i t i es ,
transportation fac i l i t i e s , urban functions, educational institutions,
housing, and the l i k e . Amongs the 39 var iab l es , 19 var iab les
have been found as strong var iab l es in the l ight of high
economic urbanization with high urban functions. It may be
noted that a l l the 19 strong va r i ab l e s of this component have
uniformly moderate factor loadings and are al l pos i t i v e l y
corre la ted , except Kutcha houses ( -0 .72387) , unemployment rate
( -0 .54009) , and primary a c t i v i t y ( -0 .78234 ) . Basical ly these
three negat ive signs in these va r i ab l es are playing pos i t i v e role
in urban dNTiamics and does not a f f ec t the ove ra l l interpretation
of the factors , rather conf irms a de f in i t e trend towards better
ut i l izat ion of urban amenities for the improvement and expansion
of urban functions.
In the context of developing countries, the high
corre lat ion of var iab les relating to household amenit ies, urban
f a c i l i t i e s and other economic ac t i v i t i e s h igh l i ghts the accelerating
nature of urban growth and development.
On one end, the factor loading has occupied the medium
l e v e l of educational f a c i l i t i e s and high density of population

225
and household but on the o ther , Kutcha house (-0.72387) shows
the high negat ive association in small urban centers. Again the
transportation functions l ike road convergence (0.70761) and buses
(0.76280) show a high communication development. Other urban
functions i . e , post o f f i ce (0.69934), Cinema hall (0.74123),
Newspaper circulation (0.82129), Telephone (0.57274), and
Te l ev i s i on (0.72390) are also found a high l e ve l of
infrastructural development.
Central places functions are l inked a great deal with
geographical factors , but the country does not posses any rich
phys ica l resources, and, there fo re , the growth of specia l ized
s e r v i c e s has not taken place much. The country s igni f icant ly ,
lack in mineral wealth for industr ia l development except natural
gas in the northeastern side of the country including c i t y .
Even the Sy lhe t c i t y ' s functional and occupational character
c l ea r l y shows a d i v e r s i f i ed pattern where special ization of
manufacturing is absent ( tab le 3.17 and 3 .18 ) . The c i t i es lack
in spec ia l i zat ion, even c i t i es as transport foc i and break of
bulk points are also lacking. The inland water routes are
dominant as against roads and ra i lways . Nature of functions
can be seen in spatial d i f f e rent ia t ion of high economic
urbanization represented by f i r r t ccnp-'nent of factor scores in
F ig . 4.5.
226
Unemployment (-0.54009J and pr imary ac t i v i t y ( -0.78234)
sho\/ v e r y high l e v e l inve rse re lat ionship to other economic
a c t i v i t i e s l i k e - ter t iary a c t i v i t y (0.74313), secondary ac t i v i t y
(0.59889) and per capita income (0.71622). Because of i t s close
association with measures of educational l e v e l , occupational, and
income, Factor - I would appear to be the dimension of economic
status and high l eve l of urban function in urban dynamics. This
was hypothes ized by Shevky and Bel l (1955) and later confirmed
in factor analysis studies of d i f f e r en t l e v e l s in North American
and European Ci t ies . This situation indicates that areas which
have high percentage of population in secondary and te r t ia ry
sectors are more deve loped . Myiat (1967) has stated that
industr ia l izat ion is popular ly regarded as synonymous with
economic development by the people of the developing countries.
It p roves that high per capita income oriental urban centers
have a la rger proportion of the ir labour in secondary and
t e r t i a ry sectors , converse ly , the urban centers with low pe r -
capita incomes have a la rger proportion of the ir labour in
pr imary a c t i v i t y (Bauer and Yamey, 1951).
Again, the f i r s t factor (high economic urbanization with
high urban amenit ies) shows a v e r y high factor loading in
t e r t ia ry a c t i v i t y that indicates a l op -s ided economic progress
of the urben centers. Moreover , the heavy dominance of the
t e r t i a ry sector also indicates that a few people are engaged in
whi te co l lar jobs and a high proport ion i s engaged in menial

227
type of works . It further indicates that there is a high rate
of unemployment, underemployment, misemployment, etc. in the
small and medium sized urban centers. The general
developmental hypothes is is that the percentage of primary
sector workers should be l ess and secondary sector worker
should be h igher fo l lowed by t e r t i a ry sec tor . But the f i r s t
factor shows the v e r y high negat ive loading f o r primary sector
workers associated with high pos i t i v e loading for tert iary sector
workers and medium pos i t i ve loading in secondary sector
workers . It i s because of this that urban centers are lacking
behind in economic progress. There are some exceptions l i ke
Dhaka, Chittagong, Khulna, Sylhet etc .
Educational development and af f luence are d i rec t ly
corre lated with each other (appendix 4 . 2 ) . Due to that a high
pos i t i v e loading has been observed in income, high school, and
co l leges ( t ab l e 4 . 4 ) . So i t i s supporting the overlapping
condition of economic development and educational l e ve l of urban
h ie rarchy (Rao, 1981).
Figure 4.5 show the spat ia l d i f f e rent ia t ion of high
economic urbanization with high urban amenities l e v e l in d i f f erent
urban centers of Bangladesh. The factor scores have been
d i v i d ed in f i v e classes with the he lp of mean and 1/2 standard
deviat ion technique and the in terva ls ranging from ve r y high
pos i t i v e to \'ery high negat ive . Here, e v e r y high pos i t i ve

228
.o S l 9 ° E 9l)° 9 ] ? B A N G L A D E S H
^IGH ECONOMIC URBANIZATION WITH HIGH URBAN AMENITIES
COMPONENT - I : 1974
'•I C ^COMPONENT SCORES ( X 3 0 0 0 ; S D =11.60)
FIG. R E J U A N / 9 0

229
score indicates v e r y high l e ve l of economic environment { pos i t i v e
factor loadings ) and converse ly , v e r y high negat ive scores show
v e r y low l e v e l of economic status (negat i ve factor loadings) of
the r e spec t i v e towns.
The spatial d i f ferent iat ions of the 1974 high economic
urbanization dimension shows v e r y h igh economic status only
in two c i t i e s (Dhaka and Bogra ) . On the other hand three
smaller centers belong to v e r y low l e v e l of economic
development. They are Modhupur, Derai and Porsha. High l eve l
of economic status ( f ac to r scores range between 5.08 to 17.40)
Far idpur , Tangai l , Narsingdi, Comilla, Sy lhe t , Noakhali , Khulna,
Bar isa l , Jessore , Dinajpur, Pabna, Rangpur and Ishurdi . Khulna
is indust r ia l l y deve loped, and has come to occupy second rank
of economic status. The medium group ( f a c to r scores + 5.80
to -5 .80 ) o f economic status of urban centers are Jamalpur,
Manikganj, Netrokana, Rangamati, C o x ' s Bazar, F a i i , Patuakhali,
Bhola, Barguna, Jhenaidh, Naogaon, Thakurgaon, and Gaibandha.
Muktagacha, Mirzapur, Lakhmipur, Sunamganj, Fat ikehari ,
Meherpur, Bheramara, Mirzaganj and Sherpur have fo l len low
economic status.
4.3.2 FActor - I l : Deurbanization
A v e r y interesting thing i s to be noted about second
factor (deurbanizat io in ) . Both demographic and urban amenities

230
shov.- a negat ive relat ionship in urban dynamics. Due to that
i t is designated as "Deurbanization". The second factor
accounts for 17.90 per cent of the total var iance.
The factor indicates that urban serv i ces and social
f a c i l i t i e s l i k e per capita water supply ( -0 .87435) , government
o f f i c e s per lakh population ( -0 .66914) , te lev is ion per lakh
population (-0.58001) and telephone per lakh population
( -0.56997) are higher in small urban centers than large c i t ies
( in per unit f a c i l i t i e s ) . It means that some of the var iab les
may be strong in small urban centers also ( tab le - 4.4, F - I I ) .
To summarise the deurbanization of towns composite
Scores f o r Factor- I I have been computed and are plotted in
f igure 4 .6 . According to the deurbanization mechanism of factor
loadings, pos i t i v e high factor scores are seen in sna i l urban
areas and negative high factor scores are found in large urban
centers. Very high negative scores of more than -11.043 have
been noted in Dhaka and Khulna. Occur ence of high negative
scores r evea l s that they are high deurbanized c i t i es with
relat ion to the va r i ab l es of Fac to r - I I loadings. Converse ly ,
Muktagacha, Modhupur, Mirzapur, Lakhmipur, Sunamganj,
Fa t i cher i , Derai, Bhola, Barguna, Meherpur, Bheramara,
Mirzaganj , Sherpur and Porsha have been carry ing high pos i t i v e
factor scores between 3.855 to 11.566. The deurbanization index
( F i g . 4 .6 ) indicate that the above mentioned urban centers are

2 3 1
FIG. RE JUAN/90

232
deve loped with relat ion to water supp ly , government o f f i c es ,
te lev is ion and telephone f a c i l i t i e s . Other urban center are lying
between extreme posit ions, Factor - I I ( t ab l e 4 .4 , F - I I ) .
4 .3 .3 Factor-III: Demographic Deurbanization
Fac to r - I l l also g i v e s a negat ive result in urbanization
with relat ion to demographic v a r i a b l e s . So the factor i s
designated as "Demographic deurbanizat ion" , It accounts for
15.50 per cent of total var iance.
Out of 39 var iab les in Fac t o r - I l l (demographic
deurbanizat ion) , only seven indicators have been extracted as
strong corre la tes . Among them four va r i ab l e s are negatively
corre lated with the factor i . e . , median age ( -0 .87145) , population
growth rate ( -0 .79907) , net migration ( -0 .88212) and monthly
income ( -0 .57318) . On the other hand rest of the 3 var iables
are po s i t i v e l y corre lated with the fac tor , but the nature of
va r i ab l es is neverse , which are sex rat io ( f emale over male),
unemployment rate and dependency ra t io . The factor loadings
are 0.55282, 0.67014 and 0.85397 fo r sex rat io , unemployment,
and dependency rat io r e spec t i v e l y .
The f igure 4.7 shows the spat ia l variation of
demographic corre lates of strong va r i ab l e s for the year of 1974.
Rangamati, Sherpur, and Porsha have been found in v e r y high
pos i t i v e factor scores but Dhaka and Ishurdi show a ve ry high

~8l9°E "glo" gli"
A .
25'
B A N G L A D E S H
DEMOGRAPHIC DE URBANIZAT ION ^ COMPONENT-I I I .1974
C COMPONENT SCORES ( X : 0.00; 5 0 = 7. 362 ) ^ ^ • J ^ ^ VERY H IGH
? X.1.5 SO ^ ^ » 11.0A3 ^ ^ ' h i g h
\ Lo.sso ^ » 3.581 ') MEDIUM
X-0.55D ^ - 3 581 < g > LOW
: X-1.5S0 p < -11.043
912°
O VERY LOW
.J
24-
INDIA
I 2 2 "
^ B A POPULATION S I ZE IN T 0 W NS { P ERSONS )
50,000 ^100.000 25,000 / ^ 50,000 -99,999
121 N 5.000
'0 0 20 40 60 t. I 1 . i—rKM
_ _ 819° £_
r INDIA 24
J
H G
G"F -1.600,000 AND ABOVE
400,000
23
_9i0° 9ill FIG. h j
912 RE JUAN/90

234
nega t i v e f ac to r scores . Th is c ircumstance conf i rms that smal ler
s i z e of the tov/ns i s associated wi th some strong var iab les ( t a b l e
- 4 .4 , F - I I I 3 . Of the 5 groups o f fac tor scores , three have
v e r y h i gh factor scores 11.043; ten have h igh pos i t i ve scores
3.681 to 11.043; e ighteen h a v e be tween -3 .681 to + 3.681. The
nega t i v e h i gh factor scores r e l a t ed urban centers on Fac t o r - I l l
a re s p a r s e l y d is t r ibuted throughout the country ( F i g . 4 . 7 ) .
The most s t r ik ing point r e v ea l ed b y the aap i s that, a l l towns
w i th h igh scores are of medium and small s i z e and th is may
be due to demographic fac tors .
4.3.4 Factor -rv : High Territorial Urbanization
T h i s factor acccounts f o r on l y 10.1 per cent of total
var iance of the 39 v a r i a b l e s , and h i g h l i g h t s the towns which
have a h i ghe r percentage of spa t i a l v a r i a b l e s and urban
f a c i l i t i e s . Seven v a r i a b l e s h a v e been i d en t i f i e d as 'Strong
v a r i a b l e s ' in urban dynamics. Pucca road (0.65646), road
dens i ty (0 .59068) , and Park and p layground (0.69597) contribute
to h igh t e r r i t o r i a l urbanizat ion. T h e y are contributing as a
p o s i t i v e f ac to rs in urban dynamics . Interconnections of towns
l eads to the i r growth and deve lopment of spec i a l i z ed a c t i v i t i e s .
Degree of a c c e s s i b i l i t y i s a f f e c t ed b y the l inkage patterns.
Road dens i t y p l ays a v e r y important r o l e in determining
urbanizat ion in re lat ion to spa t ia l d imension. Street l ight a lso
shows the extent of urban deve l opment . Banking has now
es tab l i shed i t s posi t ion in the urban s o c i e t y . There has been

235
an unprecedented gro^vth in the number of banks in Bangladesh
during the last decade. The ra t e of increases of bank i s
d i r e c t l y corre lated with l a rge urban centers. The factor of
park and playground i s also an important determinant, which
determines not only the s i z e but also the recreational and
functional status of towns.
To summarize the t e r r i t o r i a l urbanization of in
Bangaldesh towns, composite scores for factor IV have been
computed and are plotted in f igure 4.8. Highest pos i t i ve scores
of more than 8.380 have been noted for Dhaka, Barisal and
Bogra. Occurrence of high scores revea l s that they are most
industr ia l and administrat ive based urban centers. High factor
scores (2.784 to 8.380) have been found in Faridpur, Comilla,
Sy lhet , Noakhali , Cox ' s Bazar, Feni , Jessore, Dinajpur, Rangpur
and Gaibandha. The spatial var iat ion of mid l e v e l factor score
i s pos i t i v e 2.784 to negat ive 2.784. Tangai l , Narsingdi,
Netrokona, Rangamati, Sunamganj, Khulna, Patuakhali, Bhola,
Borguna, Meherpur, Jhenaidh, Pabna, Naogaon, Thakurgaon, and
Ishurdi ha\'e been found in th is group. Low l e v e l ( -2.784 to
-8 .380) of development have been found in Jamalpur, Manikganj,
Muktagacha, Mirzapur, Lakhmipur, Fat ikehar i , Bheramera, and
Sherpur. Modhupur, Derai, Mirzaganj , and Porsha are the least
deve loped urban centers. Because these urban centers are in
v e r y bec-'-ii^'in^ sla^e ':f urbanization.

FIG t . 8 REJUAN ISO

237
4.3.5 Strong Variables in Four Factors, 1974
The interpretat ion ' of urban dynamics i s not quite easy
because the po l i t i ca l factors are d i r e c t l y operating both at local
and national l e v e l . For instance the o f f i c i a l data i s being
manipulated to the need ( p o l i c y ) . Negat ive var iat ion in the
results may be due to crudeness of some of the data of the
1 *
medium and small towns. However, the communality (h ] shows
that the fo l lowing 17 va r i ab l e s have p layed an important ro le
in urban growth and development of Bangladesh towns. The
var iab les are urban population (0.94062), degree of urbanization
(C.92252), median age (0.84517), dependency rat io (0.76077),
net migration (0.86026), area change (0.92309), government o f f i ces
(0.77217), newspaper circulation (0.91366), e l e c t r i c i t y (0.81005),
water (0.88462), te lev is ion (0.89033), telephone (0.78645), house
hold density (0.82393), road convergence (0.75647), l i teracy
rate (0.80110), unemployment (0.77486), and per capita income
(0.90768). Mapping of factor scores r evea l s a c lear re lat ionship
between the exist ing socio-economic structure and total urban
population as wel l as degree of urbanization. The f i r s t principal
component and communality have been found c lose re lat ionship
between them. The var iab les which have the highest loadings
r "2.
Communality (h ) i s the sum of squared factor loadings for each va r i ab l e .

238
( i r r e s p e c t i v e of the i r sign +ve or - v e ) have been noted. High
negat ive association of pr imary ac t i v i t y and pos i t i v e association
of secondary and t e r t i a ry ac t i v i t i e s are ident i f i ed as the most
power ful urban dynamics va r i ab l e s . These urban functions can
be suitably improved for the development of urban centers of
Bangladesh.
4.4 ECOLOGY OF URBAN CENTERS OF BANGLADESH: CROSS
SECTIONAL ANALYSIS OF DIFFERENT DIMENSIONS OF
VARIATION (BASED ON SELECTION OF STRONG VARIABLES),
1981.
An attempt has been made here to determine the
strength of d i f f e r en t va r iab l es within the 39 demographic and
socio-econor.ic corre lates of Bangladesh. For th is purpose the
39 var iab les have been used in factor ia l analys is . A l l these
va r i ab l es descr ibe the urban dynamics character is t ics
demographic, t e r r i t o r i a l , urban f ac i l i t i e s and education, material
status, transportation and communication. Complete l i s t of the
var iab les is g iven in appendix 1.1. A corre lat ion matrix has
been comp'^Jted with mxn dimeisions of 39 va r i ab l es (appendix
4 . 3 ) . F ro r th is mxn matrix another matrix of equal dimensions
has been computed which shows the re lat ionship of a l l the
var iab l es v. i th d i f f e r en t factors . Along with th is matrix of
factors locdings, e igenvalues and cumulative percentage of the
eigenvalues have been computed. pr inc ipa l component analys is

239
of 39 va r i ab l e s related to the dimensions of demographic and
socio-economic character is t ics have y i e l d 3 factors ( t ab l e 4 . 6 ) ;
which together account for 59.63 per cent of the total variance
in the demographic and socio-economic dimension of urban
dynamics. Among these var iab l es the percentage of variance
explained by each factor has decreased in a descending order .
However , examination of the normal ver imax rotated factor
loadings on these factors rendered them to be label led as high
urbanization, demographic and socio-economic development and
urban functions. In this section, an attempt to search the
important va r i ab l es in urban dynamics for the year of 1981 has
been made.
Factor-I: High Urbanization
a) Demographic
i ) Urban population (P and H)
i i ) Degree of urbanization (P and H)
i i i ) Median age (P and M)
i v ) Population density (P and H)
V) Sex rat io ( F per 1000 m) (P and M)
v i ) Dependancy rat io (N and M)
b ) T e r r i t o r i a l
i ) No. of person per house (N and H)
i i ) Area (P and H)
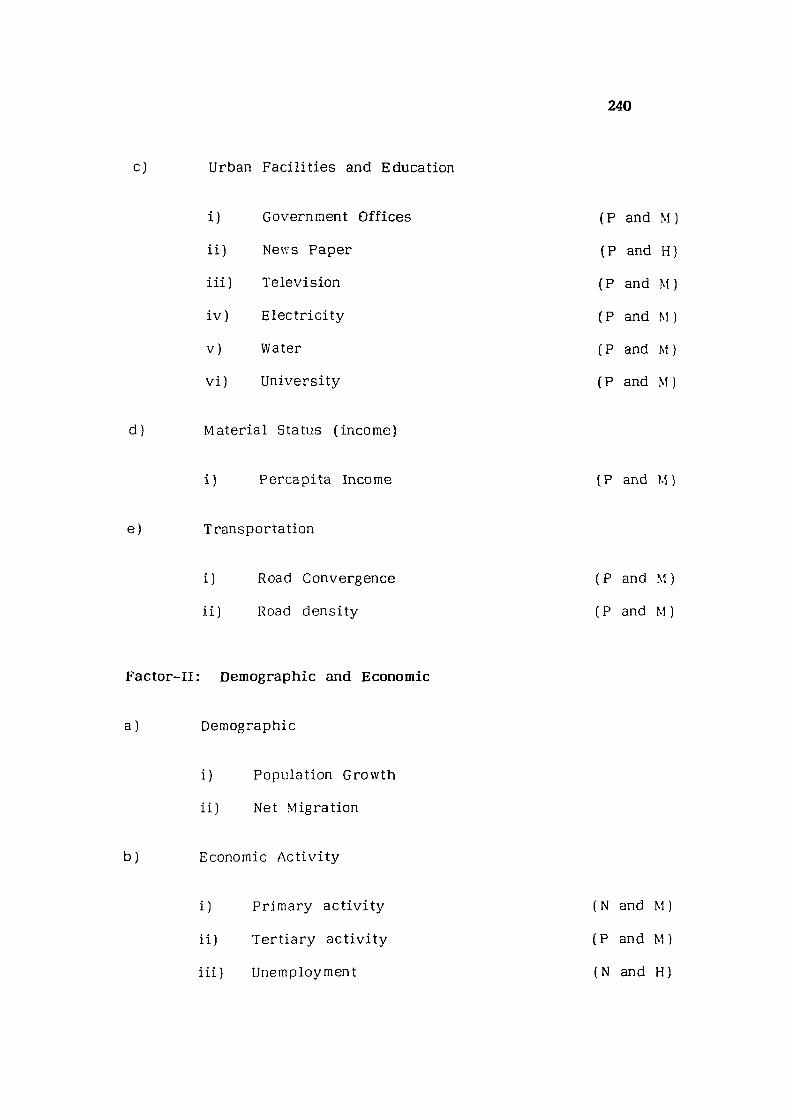
240
c j Urban Fac i l i t i es and Education
i ) Government Of f i ces (P and M)
i i ) News Paper (P and H)
i i i ) Te lev is ion (P and M]
i v ) E l ec t r i c i t y (P and M)
V) Water (P and M)
v i ) Univers i ty (P and M)
d ) Mater ia l Status ( income)
i ) Percapita Income (P and M)
e ) Transportation
i ) Road Convergence (P and M)
i i ) Road density (P and M)
Factor-II: Demographic and Econoinic
a ) Demographic
i ) Population Growth
i i ) Net Migration
b ) Economic A c t i v i t y
i ) Pr imary a c t i v i t y (N and M) i i ) T e r t i a r y a c t i v i t y (P and M)
i i i ) Unemployment (N and H)

241
c) Urban Faci l i t ies
i ) Street l i ght ' P and M)
i i ) Buses (P and M)
d) Communication and Ter r i t o r ia l
i ) Road convergence (P and M)
i i ) Pucca road {P and M)
i i i ) Area change (P and H)
Factor - I l l : Urban Functions
a) Infrastructural f ac i l i t i es
i ) Kutcha Road ' (P and M)
i i ) Post Of f ice (P and M)
i i i ) Cinema Hall (P and H)
i v ) Hospital (P and M)
V) Television (P and M)
v i ) Bank (P and H)
v i i ) Telephones (P and )
v i i i ) FPC 8 MCWC (P and M)
b ) Others
i ) Literacy rate (P and H)
i i ) Annual Expenditure (P and M)
Note: N = Negative, P ^ Pos i t i ve , M = Medium and H = High.

242
'i.4.1 Factor-I: High Urbanization
This factor exp la ins 26.50 per cent of the total
var iance and i s composed of the elements of urban growth
d\Tiamics, which determine the degree of urbanization of the
tov.ns. However, i t is mainly contributed by the seventeen
strong va r i ab l e s , shown in tab le 4 . 6 . These var iab les have
the highest factor loadings under f a c t o r - I and the factor loadings
indicate the correlat ion between the or ig inal var iab les and the
factor under consideration. It does not mean that the contribution
of other va r i ab l es i s zero , i t only means that other va r iab l es
have poor re lat ionship among them.
Neverthe less the contribution of Factor- I i s not v e r y
high. Though it is important, because i t has condensed a number
of s imi lar types demographic, t e r r i t o r i a l , urban f ac i l i t i e s
transportation and material status under Factor- I , which i s
designated as "high urbanizat ion".
Out of 39 va r i ab l e s , 17 v a r i a b l e s have been found
Important in Factor- I , out of which 16 var iab l es have pos i t i v e
re lat ionship with Factor - I , whereas one va r i ab l e of dependency
rat io is negat ive ly related Vv ith i t . Very high correlat ion has
been found in two demographic v a r i ab l e s , namely - total urban
population (0.91803) and degree of urbanization (0.91801),
coupled with the pos i t i v e loadings for per capita e l e c t r i c i t y
consumption (0.60379), water supply (0.85073), te lev is ion

•a ca o J
.o n
I B ,3 cn <o
s
a fi
H E
8
e •c
I n ' u 3 e
c l , CO TO 1 n o u
' S-" ) 03 -rH ' ^ pi l o g ' s o <L U
.r.
^ o cn 2
OOOOOOOOOOOOOOOOOOOOOOOOOOOOOOOOOOOOOOO
^•THrHCDCMir5CNO)Ln
o o o o o o o o o o o o o o o o o o o o o o o o o o o o o o o o o o o o o o o I I I I I t I I < I I
inr^TtCOtNJCD^rHOO
fOOJCSIlOtOCNjCOCMOJ Or-i' 'COC I-tHCOTj'O o o o o o o o o o
CDO'C lC CnCOTHtOPOC THUOrHrHODt rOlO rHrNrrHCOC OCOC tOCJ
OOOOOOOOOOOOOOOOOOOOOOOOOOOOOO t I I t I ( I
O H
-1 2 a < s s a. tJ H O O UJ H Q
o:
z; O rf 02 J o a a. w o S 0-
>- o V H P O in < H Z 02 < u u 2 3 U S ou a, O CiJ w 0. Q Z
U [J « Oi J u ? O H o J 02 O zidtx-^^wS
< Uo' 'l'5'Cl.UJ QO:D200<6W(-cn<<a.oa.ozu5
Q w m J < fc CL, ^ s i I CD
W u J 10 u O O
s y 55 o o ^ o u
iDuWujucnuugguo cDti-w3Hf-Xi<;a.o2QS-i(n
H in z u
J s w o z z O 3 =3
H H > >
P P
S 8 02 uj CL in
Spfe H n u U D, O < < < H U 3 02 02 Z U] U Z H O. <
I C s i m - ^ l ^ l O l ^ a J C n T H r H T H r H r H r - ^ r H T H r H r H l N J N N C ^ C S J M l N C v I M C ^ r o r O C ^ f O r r j l ^ r O f O f O r O
tl> U g •C
C-S (U (0 " Qj a. u

g a < c
- S U X > (0 u
l u D
o
u •H e o g o
M U t—4
" c
I -DO O e 0) p
c o
" a CO ^ ^ (r. x:
CO
U1 u (D s u C m jO I-, 3
^ o cn z
l l l rH lM ' I ' 1
' ' llrHlWCM ( l l ^ ^ r t I I ( E H I I I I
I I W l l l r H r H I I I I I ^ N ^ H l l l l l l f - l r H l l l l l ^
<
TH do to -H
S is S ^ § Q Ll, H 7!
<0
" H M
•a y C 00 S, °
3 <D O
u, CD
*-< CTJ -I (0 ca CD X - CD t/)
x : o o -i J CO c X > , O CD o
e r C M (U CD
£ CD r -
§ »
<
CO
•rt C Q) x:
CO 0 )
CD
^ S ' e--H G g, i s CO n ) CO CO -I
ii O S fe tJ CD £ ! CO ^ j C J C O
CO 0) -c U X O CD <0 W 3 V)
C O CD CO £
1h c L, pOT3 3 O 3 C - a CO
2 CO
•O u, E O - H o
,2Q.C0Q,RcDt,X; CcjocjoLi-^XDain CDtDCOXIXJcDinO
245
(0.56091), news paper circulation (0.84042), University
(0.62037), road density (0.68334) and road convergence
(0.66536). The centers having high factor scores of the above
var iab les are designated as dynamic urban centers. Such areas also
show a concurrent improvement in the a v a i l a b i l i t y of urban
f ac i l i t i e s . Converse ly , areas with low proport ion of urban
population are considered as under deve loped .
Degree o f , urbanization is a product of socio-economic
condition of an urban center. But post socio-economic conditions
push the peop le from rural areas to urban center f o r better
employment or source of earnings. A bengali p r o v e r b is that
"Haraya maraya kushto Kesraya joy shahara" ( a f t e r destitution
people move to c i t y ) . With their accommodativeycapacity, urban
center welcomes the ruined people from the v i l l a g e . Push factor
of the v i l l a g e is not the only cause for migration, pull factor
of town is also v e r y important. Urban areas should have "a few
pronounced urban character is t i cs " and should be se rved by "C iv ic
amenities" (Bose, 1978). It should be noted that s i x var iab les
of this component have uniformly high factor loading (above 0.5
factor loadings) and are a l l pos i t i v e l y cor re la ted , which confirms
a de f in i te trend towards bet ter urban f a c i l i t i e s .
Urban growth, development, improvement and expansion
depend upon proper ut i l izat ion of urban functions and material
use. In the context of developing countries, the h igh correlation

246
of va r iab l es relating to domestic material , communication and
transportation, industr ia l , e l e c t r i ca l and water supply h igh l ights
the r e l a t i v e development of urban soc i e t y .
Higher loadings of the road convergence and road
density are indicating v e r y h igh l e v e l s of development with
re lat ion to communication and transportation. High loadings of
government o f f i c es , news paper c irculat ion, te lev is ion, e l e c t r i c i t y
consumption, water supply and un ive rs i t y are all indicating a
v e r y high degree of urbanization. Per capita income i s the
another important determination fo r high l e v e l development and
modernization of town/city.
Figure 4.9 shows the spat ia l pattern of the urban
dynamics as expressed by the dimension of high urbanization.
I t can be noted that the composite factor scores range between
-16.968 to plus 49.009. Very h igh pos i t i ve values have been
recorded for two c i t i es , but in none of the towns there are v e r y
high negat ive values. It i s because, out of important 17
va r i ab l e s sixteen va r i ab l e s have a v e r y high correlation with
Fac tor - I , and one negat ive ly co r r e l a t ed . Another point requiring
due emphasis i s the fact that composite factor scores have not
been computed on the basis of the seventeen var iab les , but a l l
the th i r t y nine var iab les have been taken into account for spat ia l
ana lvs is .

247 TIFT 9h=
L A D E S H
HIGH u r b a n i z a t i o n
COVFCNENT - I 1981
^ component SCORES X = 0 00 , SO = 11 A7 ) / ^
VERY HIGH . 17 212
HIGH . 5 737
MEDIUM - 5 737
LOW - 17 212
VERY LOW
FlG.^t.Q REJUAf,/90

248
Map 4.9 shows the distr ibut ion of composite factor
scores. Dhaka and Khulna show v e r y h igh pos i t i ve factor
scores. They are fo l lowed by towns of Narsingdi, Comilla,
Sy lhet , Bar isa l , Jessore, Bagra, and Rangpur. Reasons
responsible f o r v e r y high pos i t i ve scores in these towns vary
from one town to another. Dhaka c i t y obtained a v e r y high
pos i t i ve fac tor score (49.009) f o r the main administrative
functions, industr ia l development, h igh number of ra i lway and
road convergence, and trade and commerce. Khulna is recognized
as a adminis trat ive and industrial c i t y . It has scored 21.645 .
Direct link with d i f f e r en t part of the country has increased their
importance as trading and industrial centers in the neighboured
area. They attract people from other areas to change the urban
environment. Dhaka is capital of Bangladesh, so al l the higher
o rder functions and f a c i l i t i e s are a va i l ab l e and i t helped to
increase the factor scores . Moreover, Dhaka c i ty has malitary
contoments which has a f fected the age group and reduced the
dependency burden. Khulna being a sea port and also
industr ia l ly d e v e l oped , has recorded a v e r y high l eve l of
development.
Factor scores ranging between -5.737 to plus 5.737 have
been found in Far idpur , Jamalpur, Tangai l , Manikganj, Netrokora,
Noakhali, Rangamati, Cox ' s Bazar, Feni, Potuakhali , Bhola,
Dinajpur, Pabna, Naogaon. Sherpur, Thakurgaon, Gaibandha and

249
Ishurdi , A low l e v e l of development ( -5 .737 to -17.212) has
been ident i f i ed in Muktagacha, Modhupur, ^4i^zapur, Lakhmipur,
Sunamganj, Fa t ikcher i , Derai, Borguna, Meherpur, Jenaidh,
Bheramara, Mirzaganj, and Porsha ( f i g . 4 . 9 ) .
Small towns with ' negative composite scores occupy
unique posit ions in the region espec ia l l y in the v i c in i t y of the
large towns. Other locations occupied by them are in the
agricultural be l t of southern part of Bangladesh, excluding
Chittagong and Chittagong Hi l l Tracts. This is because
agricultural a c t i v i t y i s incapable of supporting large population
densit ies as it requires vast areas of cu l t i vab l e land. It w i l l
be observed that small towns have a predominance of ter t iary
ac t i v i t i e s with low pos i t i v e factor scores (F i gure 4 . 9 ) .
4 .4 .2 Factor I I :Deraographic and Economic Urbanization
The second component was iden t i f i ed mainly with
demographic and economic status and it exp la ined 17.1 per cent
of total var iance. The component i s h i gh l y associated with the
var iab les of per cent of urban population growth, net migration,
area change and unemployment ( t ab l e -4 . 6 . ) . Relationship between
demographic character is t i cs and economic status can be seen in
appendix 4.3. The rotated factor analys is shows that the
highest loading is by net migration (0 .86074) , which is
fo l lowed by urban population rate (0.85458).

250
In the l i ght of economic urbanization, ter t iary ac t i v i t y
(0.56273) has secured the h igh factor loading. Street l ight
(0.58818) and bus (0.52722) a lso rate high factor loading in
the same factor . High factor loadings are also found in
communication and t e r r i t o r i a l va r i ab l e s , l i k e - r oad convergence
(0.51546), pucca road (0.50569) and area change (0.63667).
Converse ly , pr imary a c t i v i t y (0.60506), and unemployment ra te
( -0.75174) are loaded nega t i ve l y . Most of h igh loaded var iab les
are re lated to demographic economic status, so, i t may be cal led
demographic and economic aspect of urban dynamics.
Among the three important var iab les relating to economic
a c t i v i t y , two e xh ib i t negat ive loading, i . e . , primary ac t i v i t y
and unemployment rate . The high negative loadings for pr imary
ac t i v i t y ( -0.60506) coupled with the high pos i t i v e loadings for
percentage of t e r t i a ry workers to total workers (0.56273) and
persons unemployed p e r lakh population ( -0 .75174) indicate that
urban centers have high percentage of population engaged in
t e r t ia ry sector . Th i s sector i s more predominant in urban
areas as has been revea led by v e r y high loading for urban
population growth (0.85458) and net migration (0.86074). The
economic structure of the country i s character ized by a large
proport ion of total working fo rce in pr imary sector , and i t i s
somewhat lopsided and unbalanced in secondary sector. High
percentage of employment in the ter t iary sec tor , can be taken
as a key to development only i f the income earned is high and

251
the working hours low, but this i s not the case in urban centers
under study.
Spatial pattern of demographic and economic
character is t ics of the c i t y have been p lo t ted in f igure 4.10.
Highest pos i t i v e scores more than 12.89 have been noted for
Dhaka and Sylhet . Occurrence of high scores reveals that they
are character ized with high rate of net migration and natural
growth of population. High rate of employment opportunity exists
through large, and medium s ize of industr ies . Most of the class
I and class I I c i t i es have fa l len under the second rank of factor
scores (4.30 to 12.89) . These are Nars ingdi , Comilla, Khulna,
Bar isa l , Jessore, Bogra and Rangpur. Except Barisal , a l l these
centers are located on the main road and ra i lway routes. The
Barisal c i ty i s v e r y we l l connected with water transport and
has easy access to the rest of the country. Their (Narsingdi ,
Comilla, Khulna, Bar isa l , Jessore, Bogra and Rangpur) large size
has prov ided them with a market f o r the consumption of goods.
They are also getting sk i l l ed and unski l led labour force from
the i r hinterlands.
A large number of towns have appeared in class I I I ,
where composite scores range between -4 .30 to plus 4.30. These
are the poor ly industr ia l i zed but t e r t i a ry sector is prominant
in them. Faridpur, Jamalpur, Tangai l , Manikganj, Netrokona,
Naokhali , Rangamati, C o x ' s Bazar, Feni , Patuakhali , Dinajpur,

I W 110° 11? 252
B A N G L A D E S H
• DEMOGRAPHIC AND ECONOMIC URBANIZATION COMPONENT-U ; 1981
> COMPONENT SCORES ( X = 0.00 ; SO = 8.594) 25
r - v -
25'N
24
I N O I A
; X. 1.5 SD
X.0.5 SD
/ X-0.5 SD
S X-I.5 SD
VERY HIGH . 12.89
HIGH • 4.30
MEDIUM - 4.30
LOW - 12.89
VERY LOW
rv'
) INDIA
U.'
10 0 20 , 4 0 , 60 t I I I I I I ' KM
A POPULATION SIZE OF TOWNS(PERSONS )
100.000-599,999
50.000 -99,999 r— 500.000-3.499.999
V. .-
BURMA
21 I
FIG.^iJO ill
REJUAN/90

253
Pabna and Naogaon have come the medium category.
F i f teen urban centers have been c lass i f i ed ( factor scores
minus 4.30 to minus 12.89) in group IV. They are basica l ly small
urban centers, namely - Muktagacha, Modhupur, Mirzapur,
Lakhmipur, Sunamganj, Fat ikchar i , Borguna, Meherpur, Jhenaidh,
Bheramara, Mirzaganj, Sherpur, Thakurganj, Gaibandha and
Ishurdi . The i r factor scores r e vea l the i r under developed
industrial structure where industries do not ex i s t , and they have
fa i led in industr ia l iz ing themselves . Most of the towns are
located in the newly designated d is t r i c t headquarter .
Only two towns (Derai and Forsha) f a l l in the group
V, where negat ive composite scores are more than -12.89. These
are the newly recognized upazila headquarter and there is
predominance in agr icultural economy.
4.4.3. Factor-I l l : Urban Functions
The number and complex i ty of the functions vary with
the s ize of the city and with other va r i ab l e s including the nature
of the areas which are s e r v ed . large urban centers are mostly
spec ia l i zed in some functions but small towns are d i v e r s i f i e d
in nature.
Fac to r - I l l exp la ins 16.0 per cent of the total variance
which is mainly contributed by thirteen va r i ab l e s . They have

254
the highest factor loadings under F a c t o r - I l l as is shown in column
3 in table 4.6 . The rotated factor matrix shows that the
highest po s i t i v e loadings have been recorded by l i teracy rate
(0.77561), which is fo l lowed by cinema ha l l seats (0.75740),
banks per lakh population (0,75651) , col leges (0.71619),
telephones (0.67679), FPC 6 MCWC (0.61635), post o f f i c e s
(0.61284), te lev is ions (0.59713), hospi ta l beds (0.52208) and
annual expenditure (0.50939). Only Kutcha house shows negative
factor loading.
To summarize the urban functions of the Bangladesh
c i t i es , composite factor scores have been computed and plotted
in f igure 4.11 for this factor , taking into account the contribution
of each va r i ab l e i r r e spec t i v e of the i r highest factor loadings.
Since the va r i ab l es explained by Fac t o r - I l l mostly relate to urban
functions, i . e . , cinema hal l seats, banks, FPC 8 MCWC,
te lev is ions , hospital bed,telephone and, c i v i c expenditure on public
works, the h igher pos i t i ve scores are associated with large s ize
c i t i es and lower scores with medium size towns. The negat ive
factor scores are all associated with small towns.
Out of f o r t y urban centers, only Bogra town exh ib i ts
v e r y high factor scores ( > 1 0 . 5 1 ) . On the contrary, a l l the
up.Qraded thanas (upaz i la ) have come under v e r y low factor
scores ( < 10.51) . These are Modhupur, Fat ikchar i , Derai,
Mirzaganj and Forsha. Other th i r t y four urban centers exh ib i t

F I G ^ . 1 1 REJUAN/90

256
high, medium and low factor scores between -10.51 to plus
10.51.
4.4.4 Strong variables in three factors, 1981
The number of s igni f icant va r i ab l es in the f i r s t
pr inc ipa l component was seventeen. Among the seventeen
important var iab l es , seven were most strong var iab les , which
exceeded factor loadings ± 0.75. The va r i ab l es are total urban
population (0.51803), area (0.88124) , degree of urbanization
(0.918081), population densi ty (0.77498) house hold density
(0.78698), news paper circulat ion per lakh population (0.84042),
and per capita water supply (0 .85073) .
In second component, 30 pe r cent var iab les have been
found as strong va r i ab l e . Within the twe l v e important va r iab l es ,
three were found to be v e r y strong which are population growth
rate (0.85458), dependency ra t i o (0.86074) and unemployment rate
( -0 .75174) .
Among the ten strong va r i ab l e s ( t ab l e 5.6 column-3),
three va r i ab l es were iden t i f i ed as v e r y strong, namely cinema
hal l seat per lakh population (0.75740), banks per lakh
population (0.75651) and l i t e racy rate (0 .77561) .
But in the to ta l i ty , the communality indicates more or
less same var iab les in f i r s t component. Few var iab les are also

257
corre lated with second and third component. According to
communality degree of urbanization (0.88478) has got the highest
load, among the th ir ty nine var iab l es , fo l lowed by total urban
population (0.85819), news paper circulat ion (0.84824), l i teracy
rate (0.81123), area (0.80584), household density (0.80018), etc.
The lowest communality has been found in park and playground
(0.14155).
4.5 URBAN DYNAMICS: 1961-1981
Now that the main patterns of changes in Bangladesh
c i t i e s have been outlined a more detai led analys is of demographic
and socio-economic d i f f e rent ia t ion and change during the 1961-
1981 per iod can be undertaken. This section of the study
undertake-s a detai led examination of the factor ia l ecology of forty
urban centers by considering the analyt ical approach. Instead
of th ir ty nine var iab l es , only twenty seven indicators are used,
\.Aiich ho^'c been i d e n t i f i e d as strong va r i ab l e s in urban dynamics
change.
As a mult ivariate stat ist ical technique, principal
component analys is was used to reduce the large number of
va r i ab l e s , many of them interre lated, to the few independent
underlying dimensions, cal led components ( f a c t o r s ) , which were
respons ib le for the changes and variat ions among the var iab les .
Detai led d e s c r i p t i v e names are given in appendix 1 .1 .
258
For the appl icat ion of pr incipal component analysis ,
a group of indiv idual var iab les wi th some common attr ibutes are
requ i red . Here twenty seven var iab l es have been chosen. With
thes-3 var iab les , corre lat ions among a l l the var iab les are
computed (Tab le 4 .8 ) a f ter calculating means and standard
deviat ions. Subsequently, correlat ions are reproduced and are
knoivn as factor loadings. They measure the degree of
genera l i zab i l i t y between each va r i ab l e and each factor . Factor
loadings are equivalent to correlat ions between the factors and
the o r i g ina l , va r i ab l e s . L ike correlation coe f f i c i ents these
loadings may take on values between + 1.0 and - 1.0. These
leadings re f l ec t quantitat ive re lat ionship of the va r i ab l e s .
Again the factor loadings for each factor are squared
and sum of the squared factor loading for each factor are called
eigenvalues and indicate the amount and proport ion of the total
var iance in the or ig ina l data accounted for by each fac tor .
Factors are extracted in descending order of magnitude and are
orthogonal or essent ia l ly uncorrelated with each o the r .
One of the tedious job in principal component analysis
i s the ident i f icat ion or meaningful naming of the newly produced
factors in the l ight of the or ig inal data.
Pr incipal Component Analys is (PCA) of the twenty seven
va r i ab l es related to the dimensions of demographic, social and
economic character is t i cs has produced 4 fac tors ( t ab l e 4 . 9 ) ,

s I Q
f.
o b f-t o
§lO fO O O rH CM f-t O O O
I I
rH O O O O
I O fO CM O H U O U O O
Sio pN Til pv *}• r^
o o c o o o tH o O O O u> o
Sat o CO CO CT) iQ ip (SJ CM rH iH O O r H O O o d d o d
I
Ot^OOfOHUSOro rHOOodoOOO
^ Jr-lCNJilir-tlOTTCNCOCN OM'roOHrHOinoO
^ CN lo cs a> tH lo CO CO "ji OrMroroOi-t'l'OroOH H o o o o d d o o d d
§OCOfOtOlOO>fMfnU3<MCvJ
THOOOOOOOOOOO 00>cr)oootnr-.u:»csjrH«HiO'«ai OtNrHO^COOCMCOOtOOCM r-IOOpOOOOOOOOO
O «ri fsi CO I'- U3 lo M" CO o fo CO OrsJCSOnfOfOrHrH£NOU3<NirS T H d d d d d d d d d d d d d
I I
THOOOOOOOOOOOOOO
rHOOOOOOOOOOOOOOO
THOOOOOOOOOOOOOOOO
THOOOOOOOOOOOOOOOOO
r^OOOOOOOOOOOOOOOOOO
OC0rHf0<SlT-lt-(f»5OCNJOr-ir-lf-ICMt0«-Hr0CNJiH » - ( 0 0 0 0 0 0 0 0 0 0 0 0 0 0 0 0 0 0 0
r - » o o o o o o o o o o o o c > o o o o o o o
"(OOOOOOOOOOOOOOOOOOOOO
OiHrHfOOr- iOOOi- lO o o o o o d d o o o o
259
o o o o o o o o o o •4tOOr-»fO COiHCO»-4iHCO rrOr^COtOOr-ifOrHtOiHO
tOOOOOOOOOOOOOOOOOOOOOOO . O c > rH CM ( r O) rH r-l CO 2 O O O O rH rH r O 02 CO ^ CM rH O H CO O
«-iOOOOOOOOOOOOOOOOOOOOOOOO
rt O O O O CM CM fO O CM ro CM OOOOOOOOOO
J" ro O) CO CO O O O CO CO CO t r O) rH CM CM CO rH ^ CM CM OOOOOOOOOOO
3 ° r-H O ^OOOOOOOOOOOOOOOO
«0 O CO vo ^ O CD CM ^ r O CO ">» fo o d d d o o o
u u u ) Q- 2 Z Z o < < u a. £ q Q z u 2 J < < 3 3 CP iij o cu ci; ft; uj o J < Q a.
2 j S S z
WUOuj-J '^ '^wO- 'K-. t- .OUJ-T^fxJuj
H H
u o < <
>• g > u a. H
g g s s H W > U w DS ^ tiJ H W UJ -J H H < W ss
cMcoTfioirjp cdcn rHrHrHrHrHtSrHrHrHCMfMCMCSCMCMCMCM

260
which together account for 63.02 per cent of the var iance,
eigenvalues exceeding unity. Whereas only 36.98 per cent of
the total var iance i s explained by the other twenty three
factors . Maximum variance i s expla ined by the f i r s t factor ,
i . e . , 24.72 per cent. It is fo l lowed by second (18.85 per cent ) ,
th i rd (10.81 pe r cent) and fourth (8 .64) fac tor . These four
factors have been discussed in deta i l to summarize the magnitude
of urban dynamics of Bangladesh c i t i es .
4.5.1 Factor-I: Demographic and Infrastructural Dynamics
Factor I expla ins 24.72 pe r cent of the total var iance.
It is c lose ly related with demographic infrastructure of urban
dynamics. The urban dynamics character i s we l l def ined with
v e r y high pos i t i ve loadings of change in percentage in population
density (C.89178), te lev is ion (0.85686), and park and playground
(0.82181). High loading has been recorded by secondary schools
(0.73450). pucca houses (0.71871), univers i ty (0.65247), per
capita annual expenditure (0.64700), co l lege (0.61753), bank
(0.59641), telephone connection (0.57425), percentage of urban
population change (0.52198) and buses (0.51878). There i s no
va r i ab l e v. ith v e r y high and high negative factor loadings of
Factor I . So, these var iab l es can be designated as the pr inc ipa l
indicants cf the demographic and infrastructural dynamics. Again
a l l the signif icant va r iab l es v i ewed in a general pe r spec t i v e
point to the factors which may be considered as infrastructure

in o •H B c CO
Q S XI u
to DO c •iH •a (0 o hJ
o •M u <0 tL,
•a <D
o a;
X CO e t. (U >
CO E Li O z
I CO c
!>>
^ to S ^ N I 3 C -rl Iv, c U (0 u p If! n a <-1 0) -
o w t, -
£ £
^ w c in 3 Q) O
^ O fggS . ^ C cn 2 ^ ^
<u " S "O CO £ 05 » E • •? r I-" u
I !-, O CJ CO
(D „ Q 3
c o
CO (-.
K O 'H
•M
y c
a
•a ' s CO k " O -rH
£ -
S i„-H "a &
Q
cn o o B u Q
in c o
o z
rl O M Z
CO CD CO in Q c- O CO CO C7> CO o o (O rH rH in CO CO CO TH ro (J) iH O cn CO in iH to T-t ro ro CJ) o c- ro ro in cn in r-i TH ro 00 CO O) •sr CJ o CO CM ar> m CD ID CM CM CO m cn lO cs H CO C31 t3> rvj a> CD 03 t- t- cn TH m TH TH CD rH TH •sf 00 lO 01 CO in o CO to CD m in CD cs CD C--m CM TT CO ro CJ O o O o d o o o O o d O o d d d d O d o o d o o O d
CO c2ir)cnocnooinLnomcocNa)cDt>i>rH'3'Ttiino'3'tHoc35CT)05 cj)^. r-)cnHcOT)<t--roi>c-)csioocT)CNiinOTiitDc~cocr)-5)icMC-mo T-jc02"3vHN500COa)ir>t>COiMCJ5rHinCSI>ts>C3DinCT)COOOCO t-)oO^Tj(ror5roc--coooix)i7)<x>-t3<r.)CONioo>rorr)iOrHionQ
O o O O O O O O O O O O O O O O O O O O O O O O O O O I I I I I I I I I
^ <o o o
in TH CO in iH CM •a" •ti' o o ai to in CD O o lO LO CO CD c Tf CD o CD C3) i-H CO o CM O in CO rH o oy CO tn o o CD CO ro TH o TH o o o o O o d O O o o o O m
OfO-a'rocDCO-^oOr^r-iDTiiouD rr r^ rvi rT\ r^ r r^ rt^ i (OO^JOt-^O'C^T- IC-CNmCOCDr-NCDrOCOinr^CMOfOCMDOJ^ iOirjO'-iOM<T-(t^(ocNtOPOcsitNtocsimocN^orooOrHiDor)in O o O O O O O O O O O o O O O O O O O o O O O o O O O J I I I 1 I ) J I I I J ) ) I ) ) ) T I I I \ I I
O O O O O O O O O O O O O O O O O O O O O O O O O C O O ) I I I
< X M CJ o a, z o < a. I z u < < m w ac. OS D <
H >< < H to HH w cn z z < Id §s D a O Dl, Cd O Q O.
^ M m < tn S a: y W O tL. Q 5 u. CU C_) H a, o U 3 O Q a, cu
2 o H (22 < < 02 U X o Cd 3 CD a.
CL CU
02 Cd < z tt. 3
_3 o o X w td Q CJ Z Cd o -3
ttl o tn CJ
2 > J 5 o < y Id X -1 a; < H Cd S Cd > Cd Cd 5 Z Qi ^ hH E-=> O CD
Q Cd z CQ J o < 00 H k—) > Q, Cd y: CD _) z CO O Cd < I H m CD
t CO CD d rH rH rH CM
> >
Q z H > Cd w
Ol, H KH z X (J l-H o Cd (J l-H u X -J D; < (X < f- 02 fx Cd u td K J z Cd f-Id Cd z J < H E-< Cd 3
CO CN o rO lO
to £ CO in u • • to CO ro <D rH <D
U O
cn 00 c •fH •o to o ^
tn O u
CM CM t--tl' •o CM CM CD t-, <0 3
I-l CO > cn (U p % "3 I-. Q. !U X cu w
cu cc
u Q) a. >

•t-' J U V «
U) <n I 0) -rH 1-l C oo CO 2-g 3
i. C <U t -rH N
VH 00 , •rt W d) < 0 3 .2-as s r 4-1 m 0) L. S P D £
UH ^ O 2 U OJ U)
2
fe o a) u "
e XI u .
•o t-M <0
o t;
o a p u ^ U I-l •(-. -M ro 00 (« c u> u
g o c (0 XI
O CD
' ' ' ' ' I I I I I I I I I I I I I cn o I
irHCOCSOCOMM'OOtDrH
OrHONloMO'^roOrOOCSlTHOCsltNrHrJic^i-liH^OtHO'a'r-l'^rOrHeNIOO'Hrl' I I I I I I 1 I I I I I I I I
I tN I ^ o
mTHcsoi'^coc^'Jir^c^ocoO^cnOT-^'^'^ooofOtocD-^csioO'^cofO'^oO
rH I I I I I I I I ^ I I I I I I I I I I I
o K) o CX3 CD o to m rH CO CD r c-g r-i
. . . 1 1 . I I I I I I rH . . . . . . I . . rOT-^OrOr^tOint^-^rrrHT-l fOCNrr I I I I I I I I I 1 ^ ^ r I I
< S w (0
ra x: Q
CO
., x: S •a CO OQ TO a-H a. 00 c ^ •a ffl - -v. -S CO I 3 •rH OO 2 tn c e
CO CO to
CO ^ N -p j (-, e O D (1) O -r-l o
CO x: M CO >> O
^ CO CO CQ
CO cn oo-C X CO o
e x;
c ^ 0) nj
1-1 -H g —1 ij
u 00
CO - H
c t; 3 <0
< s to
CO ' c CO
CO
0) x: ^ ^ n, o CO CO
? n cn 5 2 03 CO x;
CD
^ p 03 C-c CO 5 P CO CO
!-i Q) CD !-, 00 g CO oj r x: o -rt
s u
. 2 ; CO
ro e
c O to CO s:
C U, 00x3 3 O 3 fa c Q . CO Q . a a 00 00 I-. n
XI c O O to .rt CO to ro x: £ CO
^ J. J. - .J. •••°'-^cvjtn"3'incot~«coo50wcNcov)<intDt>coa)OrHcsirr)-trincoc~-coc3)0

263
with demographic dimension.
Table 4.11 shows the internal re lat ionship and magnitude
of urban dynamics of d i f f e rent var iab les with the f i r s t factor .
An insight into the var iab les for Factor I r e vea l s that the higher
educational institution and employent are significant in
accelerating the rapid urban population growth but do not ens j re
change of area of the urban centers. Due to that, large urban
centers are becoming high population densi ty areas and are
causing presence on the c i v i c f a c i l i t i e s l i k e , bus serv i ces , bank,
park and playground, and houses. Pos i t i v e factor loadings have
been recorded for most of attr ibutes which are responsible for
rapid urban population growth, whi l e negat ive factor loadings
shows v e r y low or stagnant urban population in small urban
centers, spec i a l l y the newly upgraded thana (upaz i l a ) l eve l urban
centers. Sub-categories of the Factor I are g iven below :
Table 4.11 Factor I : Demographic and Infrastructural Dynamics
Dynamic Var iab les Magnitude of Var iables
(1) (2}
a) Urban dynamics in Demographic
Structure
i ) Urban population cliange (P and M)
i i ) Changes in population density (P and H)

264
b ) Housing and Expendi ture
c )
i ) Pucca houses (P and H)
i i ) Annual expendi ture (P and M)
Urban Fac i l i t i e s
i ) Parks and playgrounds (P and H)
i i ) Secondary Schools ( P and H)
i i i ) Colleges (P and M)
i v ) Univers i ty (P and M)
V ) Te lev is ions (P and H)
v i ) Banks (P and M)
v i i ) Buses (P and M)
v i i i ) Telephones ( P an M)
Note: P = Pos i t i v e , H = High, and M = Medium
The high demographic and infrastructural dynamics i s
associated with high p o s i t i v e loadings of the va r i ab l e s which
character ize high accelerat ion of population growth and change
of population dens i ty . On the contrary, negat ive loadings are
representing low l e ve l growth rate of population and low density
of population with stat ionary infrastructural f a c i l i t i e s . Higher
pos i t i v e loading has been found in urban population growth
(0.52198) and density o f population (0.89178), housing (0.71871)
and expenditure (0.64700) .

265
Growth of urban population and its affluence and
improvement of infrastructural f a c i l i t i e s are highly pos i t i v e l y
correlated v;ith educational institution and is very clear from
the pos i t i v e loadings f o r secondary schools per lakh population
(0.73450), co l lege per lakh population (0.61753) and univers i ty
per lakh population (0.65247). The intervar iab les relat ionship
also indicate that urban f ac i l i t i e s attract rural people, spec ia l l y ,
those who are educated and capable of doing job . Recreational
f ac i l i t i e s l i k e parks and playgrounds per lakh population
(0.87187), t e lev is ions per lakh population (0.85686), etc . also
pull the rural peop le . Special ized banks (0.59641) play an
important ro l e in .rural-urban migration. Credit f ac i l i t i es , general
savings and security of wealth can be insured through the banks,
and large urban centers are pos i t i v e l y correlated with the
banking f a c i l i t i e s .
Better housing f ac i l i t i e s (0.71871) and per capita annual
expenditure (0.64700) are pos i t i v e l y loaded with urban population
change and urban population densi ty .
High pos i t i v e urban population growth (0.59198), coupled
with the pos i t i v e loadings for pucca housing (0.71871), annual
expenditure (0.64700), telephones (0.57425), bus (0.51878), banks
(0.59641), te lev is ions (0.85685) and parks and playgrounds
(0.82181) indicates that the areas which record a high leve l
of urbanization in the i r demographic dimension, are dynamic
266
areas. They must show a concurrent iniprovement in the
a v a i l a b i l i t y of urban f a c i l i t i e s . Conversely , areas with low
proport ion of urban population growth have a lovi loadings of
urban f a c i l i t i e s . The magnitude of urban dynamics can be seen
in tab le 4.11. Large urban centers have a large absorpt i ve
capaci ty for white co l lar employees rather than for menial labour
but the small urban centers are character ized by an inverse
trend.
Figure 4.12 revea l s the spatial dimensions of the
demographic and infrastructural dynamics of Bangladesh during
the per iod 1961 to 1981. The factor scores, which are
standardised measure the urban centers on each factor . They
ha\-e been d i v ided into 5 'c lasses, ranging from v e r y high
pos i t i v e to v e r y high negat ive from the mean (where mean i s
z e r o ) . Factor scores more than x + 1.5 standard deviat ion
(SD) indicate v e r y high demographic and infrastructural growth
of urban centers. On the other hand, urban centers showing
factor scores more than x -1 .50 SD indicate v e r y low demographic
and infrastructural dynamics. Urban centers with moderate
dxTiamics show values within x + 0.5 and x -0 .5 standard
de\-iation.
Spatial pattern of urban centers of factor I (demographic
and infrastructure) can be observed in f igure 4.12. The map
shows that Dhaka SMA, Khulna SMA and Sylhet c i t y have secured

9To° 9]? B A N G L A D E S H
-267-
r 'J > DEMOGRAPHIC AND 1 NFRAST^UCTURAL DYNAMICS
/A COMPONENT-i : 1961-1981
"^COMPONENT SCORES( XrOOO >SD = 6 238 )
FIG. ' i .12 REJUAN/90

268
v e r y high posit ion ( f ac to r score >9 .357 ) . These towns are
scattered in town terr i tor ia l iy '^ iT i -Bangladesh. A f t e r the l iberat ion
of Bangladesh in 1971, Dhaka has become the capita l of
Bangladesh. Be fore l iberat ion , Dhaka was prov inc ia l capital
of Pakistan. It was not getting optimum fac i l i t i e s during that
t ime. A f ter independence Dhaka has been f lourishing v e r y fast .
Both the push factors of rural areas and pull factor of Dhaka
SMA have resulted in a high rate of migration from a l l over the
country into Dhaka. The recent migration rate recorded i s 16.59
per cent. However , the highest factor scores and high migration
is due to high employment opportunity and urban f ac i l i t i e s .
Regarding urban f a c i l i t i e s highest concentration have been
observed in educational institution, cinema hal l seats, news paper
circulation, banks, government o f f i c es , t e l ev is ions , hospitals,
telephones, parks and playgrounds^ pucca houses, annual
expenditure, e l e c t r i c i t y consumption and water supp ly . The:
ddvantages accuring from these idCtors have revo lut ionized the
l i f e of the urban centers and introduced dynamigm in them.
Dhaka has become a c i t y having great advantages and
opportunit ies in Bangladesh, fo l lowed by the Khulria and Sylhet.
khulna is character i zed by heavy industry and i s the second
largest sea port of the country. Sylhet has spec ia l i zed in trade
and commerce, and natural gas f i e l d . It was noted in the
chapter^ that the Dhaka, Khulna, and Sylhet have extra ordinary
urban growth and once again it i s proved here . Th i s has caused

269
ve r y high factor scores ( > 9.357) in demographic and
infrastructural dynamics. On the other hand, not a single urban
center has come under v e r y lov/ factor scores ( < -9 .357 ) .
Urban centers having high factor scores (3.119 to 9.357)
comprise Naringdi, Comilla, Rangamati, Jessore, Jhenaidh,
Rangpur and Ishurd i . Among these, Comil la, Jessore and Rangpur
are c lass I c i t i e s , Narsingdi and Ishurd i are c lass 11 and
Jhenaidh and Rangamati class I I I towns. However, a l l of these
are v e r y dynamic urban centers. Due to the backwardness of
Chittagong h i l l tract area, government has taken nummber of
development programmes in Rangamati town and shi f t ing the plain
people in h i l l t racts area with some land as an incent ive. Class
I I I c i ty Jhenaidh is f lourishing because of the newly constructed
road from Dhaka to North Bengal and because of upgrading the
administration h ie rarchy from subdiv is ion to d i s t r i c t l e v e l .
A f t e r renovation of the Jessore a irport and decentral izat ion po l i cy
of the government, Jhenaidh has been growing fast . Narsingdi
i s rising as an sa te l l i t e town of Dhaka SMA. Tex t i l e industries
and subsid iary business are helping the growth of the town.
Comilla, Jessore and Rangpur c i t i es have secured high factor
scores due to the i r being old d i s t r i c t headquarter and multi-
dimensional urban a c t i v i t i e s . However , most of these urban
centers under the category high scores , have been recognized
as a dynamic urban centers.

270
There i s a la rge number of urban centers in medium
group factor scores (minus 3.119 to plus 3.119) of demographic
and infrastructural dynamics. Manikganj, Netrokona, Cox ' s Bazar,
Feni, Bhola and Meherpur are newly c lass i f ied d istr ic t
headquarters and res t are o ld d i s t r i c t headquarters, nanely
Far idpur , Tangai l , Jamalpur, Noakhali , Barisal , Patuakhali,
Dinajpur and Pabna. These c i t i e s have a normal population
growth. ( T a b l e 4 . 1 ) .
Urban centers grouped in low factor scores have factor
score values ranging between -3.119 to -9.357. These are newly
designated upazi la or upgraded thana headquarters or new d is tr ic t
headquarters and include Muktagacha, Modhupur, Mirzapur,
Lakhmipur, Sunamganj, Fat ikcher i , Derai, Borguna, Mirzaganj,
Bogra, Sherpur, Gaibandha and Forsha (F igure 4 .12 ) . Within
these, Forsha, Mirzaganj , and Derai are at the lower most l eve l
of demographic and infrastructural dynamics in Bangladesh (Table
4 .10 ) .
4.5.2. Factor II : Urban Deterioration with Demographic and
Employment Dynamics
Urban deter iorat ion is the second most important
component explaining 18.85 p e r cent of total var iance . It is
mainly contributed by the fo l lowing s i x v a r i ab l e s in tab le 4.12.

271
Table 4.12 : Urban Deterioration (1961-1981) with Demographic
and Employment Variables
Dynamics var iab les Magnitude of va r iab l es
a ) Demographic and t e r r i t o r i a l
i ) Urban population change (N and H)
i i ) Sex ratio (No F/1000 M) (N and H)
i i i ) Area change (N and M)
b ) Employment and other urban f a c i l i t i e s
i ) Unemployment (N and M)
i i ) Pucca road (N and M)
i i i ) Cinema hall (N and M)
i v ) Ter t ia ry ac t i v i t y (N and M)
v ) Annual expenditure (N and M)
v i ) Water supply (N and M)
Note: N = Negat ive , H = High and M = Medium magnitude of urban
d^Tiamics.
A v e r y interesting feature not iceable in table 4.12 i s
that a l l the var iab les are negat i ve ly corre lated with component
I I . The rotated factor matrix shows that the highest negat ive
272
loading has been recorded in percentage change of t e r t i a r y
a c t i v i t y ( -0 .83175) , fo l lowed by sex ra t io (F per 1000 M)
( -0 .74983) . Moderate negat ive loading has been recorded for
unemployment rate ( -0 .69869) , percentage change of pucca road
( -0 .67743) , percentage of urban population change ( -0 .66309) ,
percentage change of annual expenditure ( -0 .63229) , change of
cinema ha l l seat in percent ( -0 .62009) , percentage of water
supply change ( -0.54438) and percentage of area change
( -0 .50031) . A l l the high loading var iab les are negat i ve l y
corre la ted , with factor I I , due to that the factor has been
designated as urban deter iorat ion.
The high negat ive loading f o r percentage change of urban
population ( -0,66309) indicates that large changes of population
during the 20 years (1961 to 1981) per iod have taken place
through rural to urban migration which is not conducive to the
development of urban infrastructure l i ke pucca road ( -0 .66309 ) ,
cinema hal l ( -0 .62009) , water supply ( -0.54438) e tc . The large
number of migrants who move into urban areas contribute to the
ever increasing f o rce of unemployed and underemployed ( -0 .69869)
people thus contributing to urban deter iorat ion in demographic
and as we l l as socio-economic sphere . As evident from the table
4 - 1 2 , sex rat io i s indicating a v e r y high negat ive factor loading
( -0 .74983) . It means v e r y high rate of male migration from rural
areas to urban areas . As a result urban f a c i l i t i e s and job
273
opportunities are gradual ly decreasing. Government can not
p rov ide the incoming people with urban amenities. So the people
in t e r t ia ry sector ( -0 .83175) , spec i a l l y , in menial labour force
are pressuriz ing the normal urban a c t i v i t y and forming urban
quarter areas (CUS, 1976) and slums (CUS, 1978) along the
ra i lway l ines and in pocket settlements in the vaccant places
of middle class res ident ia l areas and inner -c i t i es .
Figure .if.13 dep ic ts the spat ia l aspects of demographic
and employement dynamics of Bangladesh (Factor I I ) . It is
interesting to note that the composite factor scores range between
minus 10.69 to plus 8.16 ( t ab l e 4 .10 ) . As the map revea l s ,
a few of the urban centers of Bangladesh have recorded v e r y
high negat ive scores , i . e . , Dhaka, Sy lhet , Rangamati, Khulna and
Jhenaidh. Three large c i t ies are h i gh ly dominated by ra i l and
road network, trade and industry but poor rate of increase in
area, cinema ha l l , annual expa id i tu re etc . Due to that Dhaka,
Khulna and Sylhet theciseh-es are contributing high negat ive scores,
whi le two smal ler urban centers have accounted f o r v e r y high
pos i t i v e \-alues. These are Mirzaganj and Porsha (F igure 4.13
and table 4 .10 ) . It is because out of twenty seven va r i ab l e s
'na\-ing high corre lat ion with Fac to r - I l l , twa i t y f i v e are
negat ive ly corre lated and among them nine are h i gh l y negat i ve l y
corre la ted .

274 ,1
•J- \ / .'Vj N V •
B A N G L A D E S H I
URBAN DETERIORATION WITH DEMOGRAPHIC & ECONOMIC DYNAMICS , ^ COMPONENT - II 1961-19 81 274
> COMPONENT SCORES( X : 0.00 ; S D = 5 . 3 5 A )
F I G A . 1 3 REJUAN/90

275
The distr ibut ion of composite factor scores on the map
c l ea r l y depict that Narsingdi , Comilla, Jessore, Rangpur,
Thakurganj and Ishurdi towns have high negat ive ( -9.046 to -
-2 .682) factor scores. They are fo l lowed by medium (minus
2.682 to plus 2.682) factor scores in the towns of Far idpur ,
Tangai l , Jamalpur, Xetrokona, Manikganj, Noakhali , Cox ' s Bazar,
Feni, Bar isa l , Patuakhali , Bhola, Barguna, Meherpur, Dinajpur,
and Pabna. Reasons respons ib le for high negat ive and medium
(both negat ive and p o s i t i v e ) scores in these towns v a r y from
one town to another. They ca r ry trading, commerce, industr ies
and other urban functions, which is attracting people from other
areas and is changing the pattern of these urban centers and
of other towns in the country from where the people have moved.
No spec i f i c regional pattern has been observed but highest
negat ive category of towns are mainly in central to northern part
of Bangladesh.
High pos i t i v e scores ( 2.682 to 8.046) have been found
in small s i ze new d i s t r i c t or upa^.ila l e v e l urban centers, which
are Muktagacha, Modhupur, Mirzaganj , Lakhmipur, Sunamganj,
Fa t ikcher i , Derai, Bheramara, Bogra, Naogaon, Sherpur and
Gaibondha. They do not have so much kinet ic force which can
attract bulk of migratory peop le and g i v e them urban opportunity .
However the rate of grov.th of va r i ab l es in factor I l i s o f v e r y
high magnitudes.

276
A deeper study of component scores h igh l i ghts a
re lat ionship between the s i ze of urban centers and Fac to r - I I .
Negat ive scores are more pronounced fo r the large tovms/cit ies,
vi/hereas pos i t i v e scores dominate the pattern of small towns.
4.5.3. Factor II I : Deterioration Urbanization with the decline
of primary sector
Th is component accounts for 10.81 per cent of the total
var iance . It i s d i v e r s i f i e d in nature, the re fo re , i t i s d i f f i cu l t
to designate any sat i s fac tory nomenclature. This component is
character ized by negat ive factor loadings. Out of twenty seven
va r i ab l e s , twenty two are negat i ve ly loaded with the Factor I I I .
The th i rd component r e f l e c t s deter iorat ing urbanization of
Bangladesh urban centers re lated to population change during the
pe r i od , 1961 to 1981 ( -0 .67595) , as a result of in-migration to
the urban centers, but v e r y high negat ive loading has been
rocordod for pr imary a c t i v i t y (-0.7525G) and moderate negat ive
loadiiiR for strnul Jlghl ( tahln 4.i;-l ) .
Tablo 4-13 Dotorioration Urbanization, 1961-1901
Dynamic va r i ab l e s Magnitude of va r i ab l es
a) DivurtiifiuU Urbani/.filluu
i ) Degree of urbanization N and M)

277
i i ) Hlroot l ight (N and M)
111) Primary a c t i v i t y (N and H)
Note: N = Negat ive , M = Moderate and H = High
The high negat ive loading of pr imary a c t i v i t y ( -0 .75256)
vHth modoratu uoKutivo loading of degree of urbanization
( -0.67595) revea l that the increase of urban population is
associated with the decrease of pr imary a c t i v i t y . As a result ,
urban f a c i l i t i e s are going down r a p i d l y , e . g . , s t reet l ight ( -
0.62539), e l e c t r i c i t y consumption ( -0.40604) etc . in large urban
centers. Small urban centers are getting bet ter f a c i l i t i e s re lated
to street l i ght and e l e c t r i c i t y consumption.
Factor scores for this dimension are presented in f igure
4.14. Out of twenty seven va r i ab l e s , twenty two are negat ive ly
loaded. Negat ive scores are associated with large c i t i e s and
pos i t i v e scores are re lated to small towns. Dhaka .Khulna and
Sylhet have high negat ive component scores ( > -4 .614) and small
towns l i k e Porsha, Mirzaganj , Derai , e tc . have pronounced high
pos i t i v e component scores ( > 4 .614) . In between these are
moderate factor scores . Far idpur, Tangai l , Jamalpur, Netrokona,
Comil la, Noakhali , C o x ' s Bazar, Feni , Fat ikchar i , Bar igal ,
Jessore, Bhola, Meherpur, Bheramara, Dinajpur, Rangpur, Naogaon
and Sherpur have moderate l e v e l of deter iorat ing urbanization.

SFE ~ "91? ~ ^If
B A N G L A D E S H
f-DETERIORATING URBANIZATION WITH DECLINE OF PRIMARY ACTIVITY ; ^ COMPONENT-UI :1961-198I
^ ^ COMPONENT SCORESC X : 0.00 ; SD = 3.075)
> ^ VERY HIGH X^I.SSD ^
I ^ HIGH
^ MEDIUM / X - 0 . 5 S 0 ^ -1.538
^ LOW \ X-1.5 50 X -A.61A
-V. VERY LOW
26
• N
v.
I NDIA
•2J
V~ -
INDIA
Ik.
a-
\
POPULATION 5:2£ C* " ; A-NSCPERSONS )
100,000-599,999 50,000 - 99,999
11 0 20 , iO . 60
— 500,000-3.499,999
\ 0. 21.
^ A
BURMA
21
9|0 _9|1_ 9|2° REJUAN/90
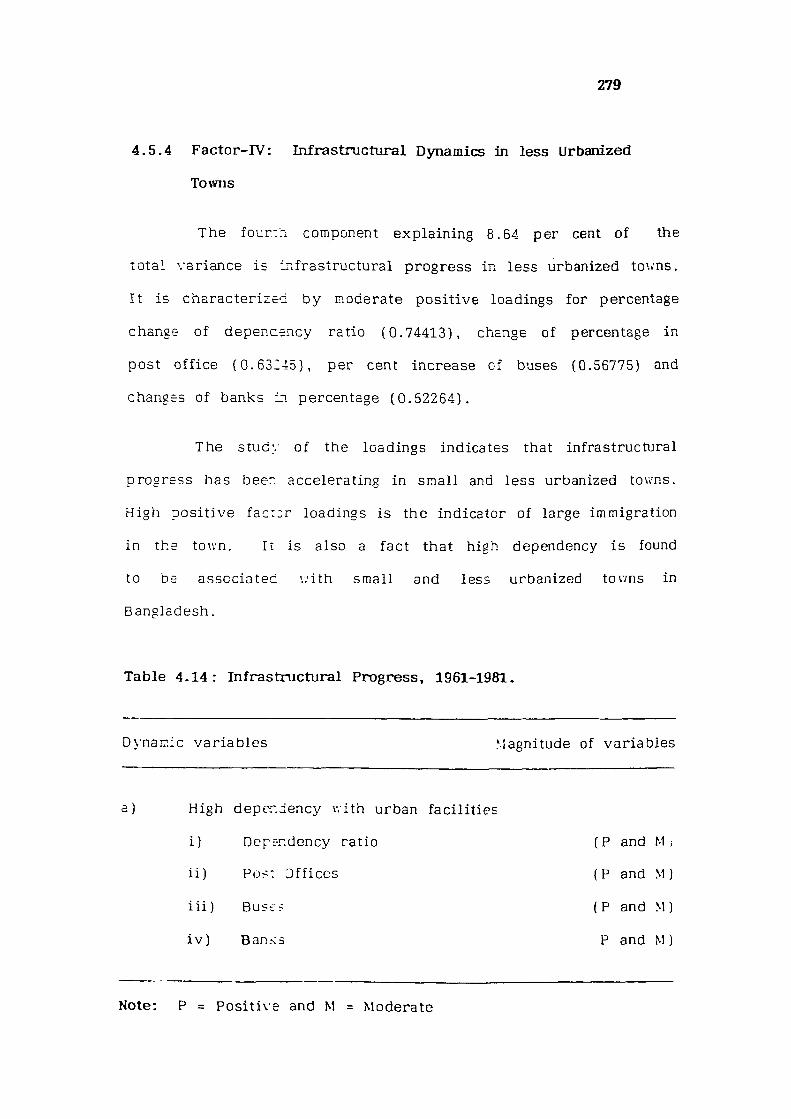
279
4,5.4 Factor-rV: Infrastnictural Dynamics in less Urbanized
Towns
The four::-! component explaining 8.64 per cent of the
total var iance is Infrastructural progress in less urbanized to\.'ns.
I t is character i zed by moderate pos i t i v e loadings for percentage
change of dependency rat io (0 .74413) , change of percentage in
post o f f i c e (0 .63245) , per cent increase of buses (0.56775) and
changes of banks in percentage (0 .52264) .
The stud:-- of the loadings indicates that infrastructural
progress has beer, accelerating in small and less urbanized towns.
High pos i t i v e f a c : : r loadings is the indicator of large immigration
in the town. It is also a fact that high dependency i s found
to be associated v.'ith small and less urbanized towns in
Bangladesh.
Table 4.14: Infrastructural Progress, 1961-1981.
Dynamic va r i ab l e s Magnitude of var iab les
a ) High dependency with urban f ac i l i t i e s
i ) Dependency rat io (P and M;
i i ) Pos: O f f i c es (P and M)
i i i ) Buscf (P and M)
i v ) Ban.<3 P and M)
Note: P = Pos i t i v e and M = Moderate

280
Tab le 4.14 sho\. s that the magnitude of infra structural
progress in urban dynamics character ized by pos i t i ve growth
and development in urban functions but they are moderate ly
associated in the factor ial re la t ion . A balanced dependency ratio
i s found in small town and they are character ized by slow
gro\;th of urban f ac i l i t i e s .
Figure 4.15 Factor-IV records v e r y high scores of this
component f o r Dhaka, Comilla and Jessore. however , the small
urban centers l i k e Rangamati, C o x ' s Bazar, Bhola, Jhenaidh',
Naogaon and Ishurdi are gradual ly developing with respect to
urban f a c i l i t i e s (F igure 4.16 and table 4 .9 ) . The
decentral izat ion po l i cy has g iven new impetus to urban gro\/th
in Bangladesh. Ho\^ever, i t i s v e r y hard to make any concrete
comment on factor IV, because it deals with only one dimension
of urban dynamics.
4.6 FACTORIAL RELATIONSHIPS OF URBAN DYNAMICS
Based on urban dynamics factor s co res , a corre lat ion
matrix has been calculated and presented in table 4.15.

B A N G L A D E 5 H
281 w
^ X C > I N F R A S T R U C T U R A L DYNAMICS IN LESS URBANIZED TOWNS ^ s j^-J >
\ ^ COMPONENT-IV 1961-19S1
^ ^ COMPONENT S C O R E S ( X = 0 0 0 ; S D = 2 595 ) •^'v-, f \
VERY H IGH • 3-892
H I G H .1 297
F I G A , 1 5 REJUAN/90

282
Table 4.15 Correlat ion matrix. 1961, 1981
Factors
1. Demographic 1.000
infrastructure
2. Demographic -G.721 1.000
unemployment
3. Economics -0.896 0.817 1.000
demographic
4. Demographic 0.822 -0.572 -0.772 1.000
urban f a c i l i t i e s
The above table sho'..s the re lat ionship among the four
factors of urban dynamics of Bangladesh. A negat ive correlation
has been found in demographic infrastructure and demographic
unemployment ( r = 0.721) , and the same situation is also
observed in factor I and factor I I ( r = - 0 .896 ) . But strong
v e r y high pos i t i v e correlation is found in demographic
infrastructure and demographic urban f a c i l i t i e s . Again the
corre lat ion betv. eon demographic unemployment and demographic
Economic (p r imary ac t i v i t y ) have a high pos i t i ve
unemployment and demographic - urban f a c i l i t i e s are correlated
and a moderate negat ive correlation has emerged ( r = -0 .572 ) .

283
When demographic and primary a c t i v i t y correlates with
demographic and urban f ac i l i t i e s , i t y i e l d s negative correlation
among the var iables ( r = -0 .772 ) .
The above analysis r evea l s that urban population growth
i s d i r e c t l y correlated with urban f a c i l i t i e s and employment
opportunit ies.
4.7 CHANGES IN URBAN STATUS
In the f inal stage this study an attempt is being made
to analyze inter-urban d ispar i t y and change of direct ion (pos i t i v e
or negat ive ) grouping analysis on the d i f f e r en t dimensions of
urban dynamics as revealed by the pr inc ipa l component method.
To analyse the changes in o v e r a l l status of urban
centers in Bangladesh, component scores data of 1961 and 1981
have been considered and is depicted in f i gu re 4.16 (A and B)
and 4.17 (A and B ) . The urban growth dynamics has beon shov;n
in f igure 4.10 A and B ) .
4.7.1 Grouping of High Urbanization, and Territorial Stress and
Housing Condition, 1961
Within the four components, two factors are of major
signi f icance as they explain about 50 per cent of the total
var iance . An attempt has bet^n made to determine the r e l a t i v e


cn
t -< to
O
S o z o o 0
UJ •6
o J z
J < y
E 0
o c 0
X w a . ^ < V o : u.
c
o o 00
c t
u £ 2 : CP a UJ D 0 r ^ fc X T '''
- -
z 0 z r
Ul Ul
H -< z SL' s
N I 0
1 0
Z ( J U
< m Q:
X 0
X
I I - t4 io:>$ iu^uodvuo^

286
posit ion of the urban centers as revea led b y a combination of
Factors I and I I , because these two components are most
s igni f icant .
The resul ts of the grouping ana lys is i s presented in
f igure 4.16 (A and B ) for 1961, where urban center scores on
high urbanization, and t e r r i t o r ia l stress and housing condition
are p lo t t ed . The stepwise grouping of urban centers according
to s imi lar i ty of urban ilynamics, or p rox imi ty on the graph has
been categor ized with the formation of the four groups i . e . ,
A, B, C and D ( f i gure 4 .16 ) , as shown in tab le 4 .3 . Each of
these groups is character ized by the dynamic nature with respect
to the two leading dimensions of urban dynamics. Group-A
includes urban centers with r e l a t i v e l y good performance on both
the demographic and urban amenit ies. Here, a l l have pos i t ive
( i . e . , above mean) scores on both the component I and I I . This
includes the urban centers of Dhaka SMA, Far idpur , Tangail,
Comil la, Sy lhet , Khulna SMA, Bar isa l , Jessore , Jhenaidh, Bogra,
Dinajpur, Fabna, Rangpur and Naogaon. The towns in Group-B
do better on demographic urbanization than t e r r i t o r i a l stress
and housing conditions for a l l have pos i t i v e scores on component
I and negat ive (be low mean) scores on component I I . The towns
of Group A are d i v e r s i f i e d in nature with some agr icul ture based
industrial establ ishments and administrat ive function* Group B
i s character ized by small and cottage industr ies . Group B
consists of towns Jamalpur in north and Noakhali and Feni in

287
in southern part of Bangladesh. Only two towns belong to Group
C, namely - Narsingdi and Patuakhali . It is pos i t i v e ( i . e . ,
above mean) scores on t e r r i t o r i a l stress and housing conditions
(component I I ) . Out of f o r t y urban centers, more than f i f t y
percent belong to Group D. Both the components have negat ive
( i . e . . belov/ mean) scores . Under group D, fo l lowing towns can
be noted - towns are Mankiganj, Muktagacha, Netrokona,
Modhupur, Mirzapur, Rangamati, Cox 's Bazar, Lakhmipur,
Sunanganj, Fat ikchar i , Derai, Bhola, Barguna, Meherpur, and
Bheramara (F igure 4.16 A and B ) . «
4.7.2 High Urbanization, and Demographic and Economic Status,
1981
Among the three components, f i r s t two factors have
been chosen fo r grouping analysis and these two components
explain 46.60 per cent total var iance. Third component has been
excluded due to. i t s ambiguous nature. For grouping analys is
a quadrangular graphic method has been app l i ed . Abscissa
indicates the component-I and ordinates the component-II. In
this method the scores for the urban centers o f Bangladesh on
the f i r s t two components have been plotted g raph ica l l y and
regional var iat ion is dep ic ted in f igure 4.17 (A and B ) .
F i rs t quadrant (Group A ) includes forteen urban centers,
namely - Dhaka, Tangai l , Narsingdi , Comilla, Sy lhe t , Noakhal i ,

288
Feni, Khulna, Bar i sa l , Jessore, Bogra, Dinajpur, Pabna, and
Rangpur. Group A indicates a good performance in both the
factors (components I and I I ) which have pos i t i v e ( i . e . above
mean] scores. No urban center has been found in quadrant four
(Group B ) . It indic iates that demographic urbanization i s more
prominant than urban f a c i l i t i e s . Quadrant two (Group - C) shews
the higher demographic progress than urban f a c i l i t i e s and has
negative scores (be low mean) on component-I. The quadrant-II
has incorporated seven urban centers, namely - Faridpur,
Rangamati, C o x ' s Bazar, Patuakhali, Bhola, Thakurganj, and
Ishurdi . Both the components are negat i ve l y associated in Group-
D (Quadrant- I I I ) . Jamalpur, Manikganj, Muktagacha, Netrokor.a,
Modhupur, Mirzapur, Lakhmipur, Sunamganj, Fat ikcher i , Derai,
Barguna, Meherpur, Jhenaidh, Bheramara, Mirzaganj, Naogacn,
Sherpur, Gaibandha and Forsha are in Group D.
4..7.3 GROUPING OF DEMOGRAPHIC AND INFRASTRUCTURAL
DYNAMICS, 1961-1981
Among four factors, Factor I and IV have been taken
for grouping analys is of urban dynamics of Bangladesh for 1961
to 1981 pe r i od , because other two factors (Factor I I and I I I )
are ambiguous in nature and negat ive ly corre la ted with size of
the urban centers . These two factors exp la ined more than one
third of the total var iance. The result of the grouping anah'sis
i s shown in f igure where urban center scores on

289
Demographic situation of urban dynamics and on Infrastructure
are p lo t t ed . The s tepwise grouping of urban centers have been
c lass i f i ed according to s imi lar i ty of urban dynamics, or
prox imi ty on the graph, was terminated with the formation of
the four groups shown in quadrant A, B, C, and D ( f i gure 4.18)
based on the table 4.10. It i s showing demographic and
infrastructure of urban dynamics.
Group A includes the urban centers with r e l a t i v e l y
good performance on both demographic situation and
infrastructural progress . It includes Dhaka SMA, Khulna SMA,
Sy lhet , Bar isa l , Comilla, Rangamati, Patuakhali, Jhenaidh,
Dinajpur, Rangpur, and I shurd i . Al l have pos i t i v e ( i . e . , above
average ) scores on Factor I and 11/ The urban centers in
Group B have better posit ion with regard to demographic status
than on infrastructural progress , f o r one has pos i t i ve scores
on Factor I and f i v e have negat ive (be low average ) scores on
Factor IV.
Urban centers in Group A tend to be h i gh l y urban and
industr ia l ly deve loped with better urban f a c i l i t i e s , whi l e the
urban centers in Group B, i . e . , Far idpur, Netrokona, C o x ' s
Bazar, Bhola, Thakurgaon etc . along the mid-northem s ide
( except Chittagong region) of Bangladesh form the main
agricultural area. Group C, consists of the towns of Manikganj,
Pabna and Noagaon and they are character ised by negat ive scores

290
on demographic status (component I ) and pos i t i ve scores on
infrastructural progress (Factor I V ) . These towns are worse
than A and B group towns wi th respect to demographic status,
but on an average s l ight ly p r og r e s s i v e than B though obv ious ly
worse than A on demographic status. Group D is the most
r e g r e s s i v e among a l l , with consistent ly negat ive scores on both
the Factors I and IV. Out of f o r t y , f i f t een belong to this
group i . e . , Muktagacha, Modhupur, Mirzaganj, Lakhmipur,
Sunamganj, Fat ikchar i , Deria, Barguna, Meherpur, Bherama,
Bogra, Sherpur, Gaibandha and Porsha. Except Bogra, other
forteen towns are newly deve loped with v e r y low rate of
immigration and poor urban f a c i l i t i e s . Urban centers comprising
these four groups have been mapped in f igure 4.18.
4 .7 .4 Comparative Analysis of 1961, 1981 and 1961-1981
A comparative analysis of f i gures 4.16, 4.17 and 4.18
shows that the urban centers in Bangladesh have gone through
a cons iderab le change in urban dynamics. In the year 1961,
Group A had fourteen urban centers, which were character ized
by pos i t i v e scores in both comparat ive and same number of urban
centers have been found in 1981 ( for teen urban centers ) .
However , three towns were added between 1961-1981, namely
N'oakhali and Feni from Group-B and Narsingdi from Group-
C. A s imi lar same number of urban centers dropped out l i k e

291
- Far idpur from Group-C and Jhenaidh and Naogaon from Group-
D. E v e r y y ea r , due to high ra te of bank erosion of Padma
r i v e r , thousands of people become homeless in the d i s t r i c t of
Pabna, Rajshahi , Faridpur and Kusht ia . Subsequently, the
homeless peop l e take shel ter in the nearby urban center i . e . ,
Far idpur, Jhenaidh, Pabna etc . But the component I I shows
that the i r f a c i l i t i e s are not increasing with re lat ion to population
growth.
A big of peop le takes place f low into Dhaka from
Comilla, Noakhali , Mymensingh, Far idpur, Bar isa l , Rajshahi
Manikganj and Pabna, Distr ic ts (Rash id , 1977; Rejuan, 1988).
So, the urban f ac i l i t i e s and amenities are on the downward s ide
in Dhaka SMA. Sylhet c i ty has increased her socio-economic
status through the presence of natural gas. The other reason
for the increase in the socio-economic status of Sylhet i s that
members of e v e r y fami ly are working out s ide the country.
The fore ign money i s being ut i l i zed for the improvement of
qual i ty of urban l i f e .
Figure 4.18 A shows s imi la r i t y with f igure 4.17 A
(1981). The urban growth dynamics shows that large urban
centers are growing f as t by both demographic and infrastructural
dynamics. Dhaka and Khulna are acconTnodating a large number
of immigrants from r ivera in area of Bangladesh, but Comilla and
Jessore have improved the ir status through introduction of new

292

293
infrastructural f a c i l i t i e s as we l l by development of small and
cottage industr ies.
Urban dynamics grouping also shows that small towns
near to large c i t i es are growing f a s t with relation to
demographic context. Tangail , Manikganj, and Narsingdi have
been f lourishing as sate l l i t e towns. Dinajpur, Jamalpur,
Noakhali, Rangamati, Patuakhali , Jhenaidh and Ishurdi have been
contributing high rate of urbanization both in demographic and
infrastructural f a c i l i t i e s and urban amenities. Bar isa l , Dinajpur,
Khulna are the surplus r ice producing d i s t r i c t s and they have
largest number of r i c e milling units, f lour mi l l and modern
biscuit factor ies (Rashid, 1977). Jamalpur and Ishurdi towns
f lourished due to sugar mil ls and i t s ' by product industries.
Graph 4.17 shows that not a s ing le urban center i s
in quadrant IV (Group-B) . However in 1961, Jamalpur, Noakhali
and Feni were found in the group-B. These three urban centers
are character ized by higher rate of population increase than
urban f a c i l i t i e s . Urban dynamics grouping (Group-B) shows that
a v e ry high rate of population growth rather than
infrastructural dynamics (F i g . 4.18 A ) .
As ev ident from quadrant-II (Group-C) , Faridpur,
Rangamati, Cox ' s Bazar, Patuakhali , Bhola, Thakurganj, and
Ishurdi are under pressure from immigrants from the surrounding
d i s t r i c t s . Here the centri fugal factors are more prominant than

294
centripeutal f o rces . Group-C ( f i gure 4.18) shows that only three
towns Manikganj, Pabna and Naogaon have deve loped considerably
in relat ion to socio-economic and infrastructural dynamics. A l l
the urban centers in Group-D (quadrant - I I I ) have been
handicapped by both demographic and socio-economic dimensions
of urban dynamics. Except Bogra town, other fourteen towns
of this groups per form functions mostly based on primary and
white - co l lared adminis t rat ive t e r t i a ry a c t i v i t i e s . Bogra town
f lourished during the 1901 to 1961, but a f t e r that i t declined
gradually (F igure 2 .12 ) .

295
REFERENCES
Bose, A .N. (1978), Calcutta and Rural Bengal, Calcutta.
Bauer, P . T . and Yamey, B .S . (1951) , "Economic Progress and occupational Dis t r ibut ion" , Economic Journal, LXI , pp. 741-55.
^.lyers, G.C. (1967), "Migrat ion and modernization: the case of Puerto Rico, 1950-60", Social and Economic Studies, Vo l . 16 (4 ) , pp . 425-431.
Rao, R .R.M. (1981), Growth of Cities, De lh i .
Rashid, H. (1977), Geography of Bangladesh, Dhaka, pp . 496-515.
Rejuan, B. (1988), Demographic Correlates of Urban Dynamics: A Case Study of Bangladesh, Unpublished M.Ph i l d issertat ion, AMU, A l i ga rh .

CHAPTER V
CONCLUSIONS
The main purpose of the study was to i d en t i f y the
nature and magnitude (Kinet ic direct ion of strong va r i ab l e s ) of
urban dynamics in Bangladesh. To attain the ob j e c t i v e , some
background study has been done for understand the s i te and
situation, and as we l l as to get insight into the problem. The
sectors of invest igat ion were dynamics of urbanization in the
third wor ld , evolution and c lass i f i cat ion of urban settlements
in Bangladesh, and spat ia l and temporal dimension of urban
dynamics of f o r ty selected urban centers of Bangladesh.
The study has tr ied to understand the urban dynamics
through fac tor ia l e co logy . The conclusion of fac tor ia l ecology
are confined within the frame work of f o r t y urban centers of
Bangladesh. Major f indings of the f ac to r ia l eco logy of urban
dynamics are g iven in the fol lowing paragraphs.
To iden t i f y the strong va r i ab l e s in urban dynamics
study for the per iod 1961, 1974 and 1981, in e v e r y cases same
corre lates have been considered for f o r t y selected urban
centers. Here corre lat ion matrix of the working var iab l es has

297
been computed with mxm dimensions, which explains the
re lat ionship of one va r i ab l e with the o the r . From th is mxm
matr ix, another matrix of equal dimensions has been computed,
which shows the relationship- of a l l the v a r i a b l e s with d i f f e rent
factors . Along with this matr ix , fac tor loading of rotated
factors, e igenvalues, communality, and cummulative percentages
of e igenvalues have been computed. In a l l , four major
components in 1961 and 1974, and three components in 1981
summarising more than ' three score ' of the total var iance were
explained in each of three cross-sect ional ana lys i s .
A number of ecological dimensions and ac t i v e var iab les
have changed during the last three census p e r i ods . A l i s t of
strong va r i ab l e s is g iven in appendix 5.1.
On the basis of strong va r i ab l es , p r inc ipa l component
analysis of urban dynamics study has incorporated twenty seven
var iab l es ( excep t rat io type ind ica tors ) . It has y i e l d ed four
dimensions of urban dynamics with 63.02 percent of total
var iance. However, the dynamics analys is f a i l ed to account
for as much of the total variance as the three cross-sect ional
analysis . The most important dimension of eco log ica l change
is the demographic and infrastructural dynamics, which was
fo l lowed by urban deter iorat ion with demographic and employment
f a c i l i t i e s . Deteriorating Urbanization with the dec l ine of primary
sector , and Infrastructural progress in less urbanized towns, where

298
the v a r i a b l e s explained 24.72, 18.85, 10.81 and 8.64
r e s p e c t i v e l y .
Study of the f i r s t component r e v ea l s that large urban
centers ( s p e c i a l l y primate c i t y ) a r e character ized by para l l e l
development of demographic dynamics and urban dynamics with
some except ions l ike - Bogra, Pabna, Bar isa l , etc . These are
large to medium sized urban centers but they are getting low
urban f a c i l i t i e s (component-I ) . On the other hand, medium s ize
urban centers l ike-Jhenaidh and Ishurdi scored high in the same
component. Both the towns have f a c i l i t i e s o f good roads and a i r
routes. It revea ls that access ib i l i t y p l ayed an important ro le
in the growth and development of the towns. From regional
point of v i e w , most of the urban centers with high scores are
located in the northern d i v i s i on , along the main road and
ra i lway routes, but this region i s most backv.ard. The score
has become high due to recent development programme under
operation both in towns and rural areas. But the low scores
oriented towns did not fo l low any par t i cu lar pattern of regional
grouping ( F i g . 4 .12 ) .
D i f f e rent character ist ics are found in component-II in
map 4 .13. Here demographic dynamics and urban functions are
negat ive ly associated. Some of the urban functions (component-
I I ) a r e r ap i d l y developing more in small towns than larger
c i t i es , where population growth and area l expansion is also v e r y
299
fast and in r e v e r s e relat ion with s i ze of the c i t y . Here, small
urban centers are scoring high and do not fo l low any regional
pattern. The same character is t ic i s observed in component-I l l ;
i . e . , degree of urbanization, street l i gh t and pr imary ac t i v i t y
are negati\'ely corre lated with the component (appendix 5 . 2 ) .
So the analys is corroborates that la rge urban centers are not
a lways associated with f i r s t growth in a l l urban functions, they
have slow progress or are stagnent in some functions as compared
to medium and small towns ( F i g . 4 .14 ) .
High dependency has been found in small or less
urbanized towns. Sometimes small urban centers are
character ized with medium to high magnitude in urban dynamics
va r i ab l es , l i ke -Pos t O f f i ce , Bank, Bus, e tc . Cox ' s bazar, Feni,
Naogaon, Thakurgaon, Gaibandha, Ishurdi and Rangamati have
high component score but s i z e of these towns are small to
medium ( F i g . 4 .15 ) . In regional context, high score urban
centers are spread out hor izonta l ly through the country.
The grouping analys is of component I and II proved
that Primacy of Dhaka c i ty i s doubtless. Rangamati is a small
town but got p lace in Group A ( F i r s t Quadrant) due to high rates
of infrastructural development. It Government is looking a f ter
upliftment of i ts environmental conditions and qual i ty of urban
l i f e . It indicates that urban dynamics also depend upon

300
government p o l i c y . Jhenaidh is also found in the same group
for h igher a c c e s s i b i l i t y . Bogra is a la rge urban center, but
i s character ized by deteriorat ing urban condit ions. It again
proves that s i ze of urban center i s not main c r i t e r ia for higher
magnitude in urban dynamics. Correlation matrix of four urban
d\Tiamics components again dictates that demographic dynamics
i s moderate ly corre lated with urban f a c i l i t i e s and employment
opportunit ies. That, i s , that urban dynamics does not always
fal low the path of population dynamics, but the population
dynamics genera l ly f o l l ows the s ize of the urban center with
some except ion, l ike -Bar i sa l , Pabna, Dinajpur.
Population h ierarchy and urban functions hierarchy
are not moving pa ra l l e l y . Except Dhaka and Khulna in top and
Mirzagong, Derai and Porsha in bottem. According to
character is t i cs of primate c i t y , Dhaka a lways belonged in top
order of h i e ra rchy ( see Photos) f o l l owed by Khulna. Some
changes of h ierarchy have been found in medium class urban
centers but small towns are more or less stable in the lowest
order of h i e ra r chy .
In t o ta l i t y , urban dynamics analysis revea ls that
demographic dynamics is moderately corre lated with urban
f a c i l i t i e s and employment opportunit ies and that the urban
dynamics does not a lways fo l low the path of population
dynamics. Population dynamics genera l ly f o l l ows the s ize of
urban centers, though there some except ion, l i ke -Bar i sa l , Pabna,

301
Partial view of Dhaka city: Commercial Area.
Partial view of Dhaka city: Residential Area.

302
and Dinajpur, They are la rge in s ize but population dynamics
i s less than what it i s in Thakurgaon, Cox 'Bazar , e tc .
The synthesis of urban dynamics analysis r evea l s that
the large urban centers of Bangladesh a r e character ized by
r e l a t i v e l y h igh ra te of t e r r i t o r i a l expansion, greater change
of access ib i l i t y , great progress in urban f a c i l i t i e s l i ke -park
and playground, educational institution, t e l ev i s ion/rad io , bank,
bus and te lephone. The fact that large c i t i es have great
access ib i l i t y i s quite s igni f icant in the context of system of
c i t i es , which, according to Ber ry (1964) , are " ent i t i es of
interacting, interdependent par t s " , f o r i t means that the larger
c i t i es play more central ro l es in these system in accordance
wi th the ir s i z e . Th is re lat ionship may be seen v i v i d l y , in
V^estern countries but in the case of Bangladesh i t i s pact ia l ly
app l i cab le . According to Duncan (1957], " The la rger the SMA,
the more l i k e l y i t is to have a d i v e r s i f i e d , i . e . , less
spec ia l i zed , industr ia l s tructure" . This observat ion seem to
have va l i d i t y in the context of urban dynamics of Bangladesh
as we l l . In par t icu lar , Dhaka and Khulna SMAs have a
considerable industrial base.
The v/eakness, observat ions, and suggestions of the
study can be depicted in the fo l lowing sect ions.
Weakness:
I t must be said that th i s study has few
shortcomings.

303
i . Units of observat ion are not l a rge . Because of
l imitations of time and resources on ind iv idua l researcher can
not manage a large sample. The author, the re fo re , has taken
only f o r t y urban centers f o r f ina l study in d i f f e r en t s i ze
groups. As a result , regional analysis is weak in the study.
i i . Scarc i ty of des ired data has a f f ec ted the quality
of the stat ist ica l interpretat ion.
Observations:
Some observat ions car. b e made at the conclusion
of the study:
i . On the basis of nair. o b j e c t i v e of the thes is , i t
can be said that some of the va i rab l e s are strong with high
and medium magnitude of urban d>Tiamics ( F - I and F - IV , in
appendix 5 .2 ) in large urban centers ( F i g . 4.12) but inverse
relation is also noted in some s c a l l urban centers. They are
progressing and have a high role of per unit urban amenities
and f a c i l i t i e s ( F - I I and F - I I I in appendix 5 . 2 ) .
i i . T h e study p roved that nost of the urban fac i l i t i e s
and amenities are prominent ( pe r unit f a c i l i t i e s ) in large urban
centers, l i k e - spec ia l i zed post o f f i c e , un i ve rs i t y , good quality
school and col lege, bank f a c i l i t i e s , bus se rv i ces ,and telephone
f a c i l i t e s . They are also corre la ted with employment rate.
The study also revea ls that these va r i ab l e s have p layed ve ry
insignif icant ro le in small and :aedium s i z e urban centers and
have on inverse re lat ion wi th th en . Some urban centers are

304
a lso noted f o r s l i ght p rog ress of pucca houses and per capita
expend i ture than is found in large urban centers .
i i i . I t has been noted that l a rge centers , s p e c i a l l y the
'P r imate C i t y ' are charac te r i zed by a h i gh ra t e of populat ion
dynamics, where some of the urban f a c i l i t i e s l i k e area , cinema
h a l l , pucca road, and s t ree t l i gh t are not growing fas t in
r e la t i on to population g rowth . Due to that the pr imate and large
c i t i e s l ike-Dhaka and Khulna r e s p e c t i v e l y are losing the i r
environmental qua l i t y . Slums and squatter co lon ies a re g radua l l y
increasing in these urban centers .
i v . Another important observat ion i s whether agr icul tura l
towns should be encouraged or not. Agr icu l tura l towns do not
conf i rm to the true nature of urbanization, because the pr inc ipa l
component ana lys is of urban dynamics has sco red h igh magnitude
of negat ive component loading in p r imary a c t i v i t y ( - 0 .75256 ) .
V. Yet another point to be emphasized i s that the two
c i t i e s , i . e . , Dhaka and Khulna are growing constant ly and the i r
unusual growth is l i a b l e to create prob lems of housing,
t ranspor t , urban amenit ies and f a c i l i t i e s , and industr ia l
deve lopment .
v i . The central region has been i d e n t i f i e d as a h i gh urban
dynamics reg ion and northern region as low wi th re la t ion to
demographic and in f ras t ructura l dynamics ( f i g u r e 4.12 and table

305
4.10 in component-I). This regionalization i s supported by the
figures 4.16 (A and B ) , 4.17 (A and B ) , and 4.18 (A and B ) .
Suggestions:
On the basis of preceding study, some suggestions
seems appropr ia te :
i . For a successful implementation of any developmental
plan of the urban centers, the ident i f icat ion of strong va r i ab l e s
are necessary . With the i r help proper guide l ines f o r optimum
accelerat ion of urban dynamics at a l l l e v e l s ; i . e . , large,
medium, and small urban centers can be suggested.
i i . F i rs t and second observat ion, made be fore , indicate
that it i s necessary to increase such f a c i l i t i e s in small and
medium urban centers, which have p layed s igni f icant r o l e for
urban growth in large c i t i es as reveated by va r i ab l e s .
i i i . T h e observations also suggest that at least
neighbourhood towns of large urban centers as we l l as half of
the hinterland area of a l l the urban centers should be treated
as part of the town and a l l the urban amenities and f a c i l i t i e s
(which have ident i f i ed as strong indicants) should be extended
to them. Such an extension of urban amenities and f a c i l i t i e s
w i l l not only so lve the problems of squatter sett lements and
slums but w i l l also reduce the uneven and haphazard growth
and high r a t e of immigration in large c i t i e s .

306
i v . For preventing h igh rate of in-migrat ion, sa te l l i t e
or umbrella towns should be deve l oped . For the checking high
rate of migration in Dhaka SMA, towns l ike Narsingdi,
Munshiganj, Manikgonj, Dhamri, Savar, Joydevpur , Kal iakair ,
Kal iganj , Kapasia, Sr ipur , Daulatpur, Ghior, Singair, Bandar,
and Navrabganj should be deve loped and proper urban f a c i l i t i e s
and amenities, which have been ident i f i ed as a strong var iab les
in urban dynamics in pr inc ipa l component analys is , be p rov ided .
V. It is true that agricultural towns do not conform
to the real nature of urbanization, yet the ir growth should be
encouraged as they extend a number of urban amenities to the
rural se t t lers and they make them better o f f than the se t t l e rs
of the large v i l l ages .
v i . The study suggests that town planners and the
government take timely steps for p roper planning with the he lp
of strong var iab les , those which have been ident i f i ed as
important in small and medium urban centers.
v i i . The predominance of young males in sex rat io
suggests that working class i s growing fast and w i l l a f f ec t the
employment opportunity. So, the governmait should help the
development of new towns which should have an industrial
sector for providing more job opportunit ies; th i s w i l l lessen
the burden on the primate and other large c i t i e s .

307
\'ii\. A large number of urban centers l ike-Khulna,
Jhenaidh, Jessore, Ishurdi , Comilla, Dhaka, Bhola, Thakurgaon,
and Sylhet are growing fast . In o rde r to check the immigrants
in these c i t i e s and also halt the unwanted growth of the c i t i es
both phys i ca l and demographic, it is essential to deve lop
planned sa t t e l i t e towns within the reasonable distance.
i x . Coordination among the urban development agencies
l ike-Urban Development Directorate (UDD), Rural Development
Department (RDD), Ministry of Urban Development and
riehabitation (MUDR), Ministry of Industr ies (MD) , Directorate
of Towns Planning (DTP ) , Capital Deve lopmai t Authority (CDA),
and Municipal Authori t ies etc. is essent ia l for the development
of new urban centers and implemaitation of any developmental
plan in the ountry.
F ina l l y , the stat ist ica l interpretat ion, notwithstanding
some weaknesses, has prov ided a h igh qual i ty of geographic
work through the identi f icat ion of strong va r i ab l e s and magnitude
of urban dynamics.
Further study is needed for Large, Medium and Small
urban centers separate ly on meso-region (D iv i s iona l L e v e l ) or
micro-region (D is t r i c t L e v e l ) basis , which would y i e ld better
results .

Appendix 1.1: List of Virables
308
Notation/ Abbrev ia ted name
Operational Def in i t ion
1. TOTPOPULATION Total population
2. DEGURBANIZAT Percentage of urban population.
3. MEDIANAGE Median age
4. POPGROWTHRAT Population growth rate (percentage )
5. POPULDENSITY Population dens i ty (Gross )
6. DEPENDERATIO Dependency rat io per 1000
7. NETMIGRATION Net migration ( p e r cent)
8. SEXRATIO Females per 1000 females
9. AREA Total geographica l area
10. AREACHANGE Area change ( Intercensal )
11. POSTOFFICE Post o f f i c e per 100,000 populations.
12. GOVERNOFFICE Government o f f i c e s per 100,000 populations
13. PARKPLAYGROU Parks and playgrounds per 100,000 population
14. CINEMAHALL Cinema ha l l seats per 100,000 population
15. NEWSPAPERCIR Newspaper c irculat ion per 100,000 population
16. STREETLIGHT Street l ight per 100,000 population
17. HOSPITALBED Hospital bed per 100,000 population.
18. BANK Banks per 100,000 population
19. BUS Buses per 100,000 population
20.
21.
FPC8MCWC
ELECTRICITY
Family planning center, and Maternity and chi ldren we l f a r e centers per 10,000 pop l . Per capita e l e c t r i c i t y consumption.
22. WATER Per capita vjater supply
23 TELEVESION Te lev is ion per 100,000 population.

309
24. TELEPHONE Te lev is ion per 100,000 population.
25. HOUSEHOLDDEN Households pe r s q . km.
26. KUTCHAHOUSE Percentage of Kutcha House.
27. PUCCAROAD Length of road per 100,000 population
28. ROADCONVERGE Road convergence
29. ROADENSITY Road density ( p e r s q . k m . )
30. LITERACYRATE L i teracy rate (population 5yrs and above )
31. SECONDSCHOOL Secondary school per 100,000 population.
32. COLLEGE Col lege per 100,000 population.
33. UNIVEREQVINS Univers i ty pe r 100,000 population.
34. UNEMPLOYMENT Unemployment rate.
35. PRIMACTIVITY Percentage worker in pr imary a c t i v i t y .
36. SECOACTIVITY Percentage of worker in secondary a c t i v i t y .
37. TERTACTIVITY Percentage of worker in t e r t ia ry a c t i v i t y .
38. PERCAPITINC Per capita income
39. ANNUACEXPEND Per capita annual expendi ture .

310
Appeaidix - 3.1
The follovving formula has been app l i ed for calculating
the median age population:
- fc 2 Median Age (Ma.) = L +
Where L^ = Lower l imit of median group
L^ - Upper l imit of median group
N = Total frequency
fm = Frequency of median groups,
fc = Cumulative frequency of lower median group.
The fol lowing age groups have been considered for the
calculation of 1961, 1974 and 1981 censuses of the selected 40
urban centers of Bangladesh.
Adjusted Age Group: 0 - 1 5
15 - 35
35 - 60
60 +
Example:
The above formula has been app l i ed to calculate the
median age of population of Far idpur town for the year of 1981.

311
Age group Frequency of Population
Comulative frequency of Population
0 - 15 30979 30979
15 - 35 20799 51778 Median Group
35 - 60 12225 64003
60" 2573 66579
_N+1 2 •
66579+1 = 33290 which w i l
l i e in between 51778, i . e . , in the age group of 15-35 where
15 is lower l imit = L^ and 35 is upper l imit = L2.
66579+1 - 30979 Thus the Median Age (Ma) = 15 +
20799
15 = 33290 - 30979 20799
15 X 20
X (35-15)
X 20
20799
15 + 2.22
17.22
So, the Median age of population of Far idpur town is
17.22
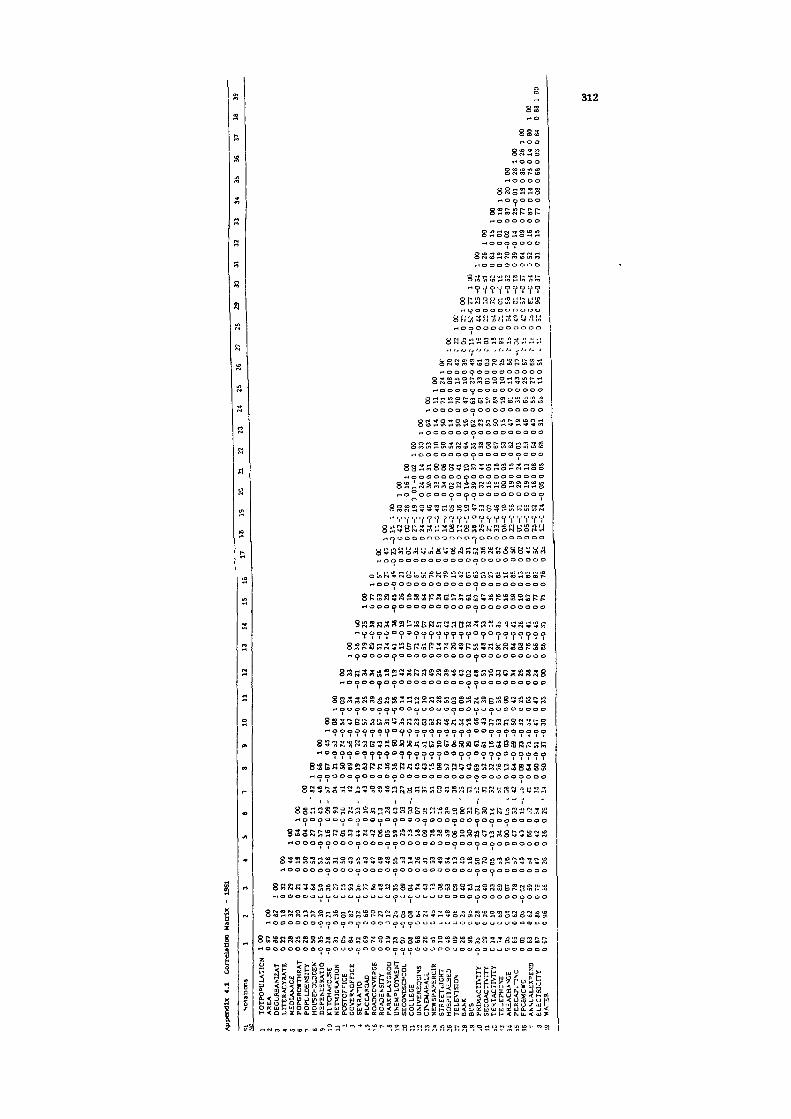
Ji i
312
O
gsa i-» o o
gu> ^ m t-i i-> o O o o
SSSKS IH o o o o
O C3 O) '4' » O N O -H O H O ^ O O O
SSSSRSP •H O o o o o o
F^OOOOOOO 8S3SSSSKS rIOOOOOOrtO
8 IS « S13 S K fi '^fVfVfYV'i'?
ssasfissuisua H t O O O O f) o o o
H O O O O O O O O O O O
• H 0 0 0 ? 0 0 0 0 0 0 0 0 0
- H O O O O C p O O O O O O O O O
HOOOOOOOOOOOOOOO
rHOOOOOOOOOOOOOOOO
S^KSSSSJSSSSESSSKSS rHOOOOOOOOOOOOOOOOO
S S ^ S S S g S S K S S S S S S S S o «HOOOOOOOOOOOOOOOOOO
ssAssssssissssgssass tho°ooooooooooocsooooo
" V 'i' V V 7 7 f 7 Y V ° V V Y V Y Y Y Y Y SflSSKiSsaassassusiswysiqu
nrjoooor^oooooi^ooociooooo
t - i o o o o o o o o o o o o o o o o o o o o o o * - ( O o o o o o o o e o o o o o o o o o o o o o o
gPKR'iSSSaPSGSRSiSiilSISSSSISPf? H o o o i ^ o o o o o o o o o O ( ^ o o o o o e o o o
sssssssneKsp^sssPsssiiisassss tHi^OOOO<j>OOOOOOOOOOc^OOOOOOOOO
f o e o o e o o o o o o o o o o o o o o o o o o o o o o
•HOOOOOOOC^OOOOOOOOOOOOOOOOOOOO
•^OOOi^OOOOO^OOOOOOOOOOOOOOOOOaO
rtOOOOOOOOOOOOOOOOOOOOOOOOOCJOOOOO
fHoOOOOOOi OOoOOOOOoOOOOOOOOOOOOOOOO
HOOOOOOOOOOOOOOOOOOOOOOOOOOOOOOOOOO
•HOOOOOOOOOOOOOOOOOOOOOOOOOOOOOOOOOOO
f H O O o o o o o o o c i o o n o o n o a o o u t s ^ i - j o o i ^ v o u c j i ^ e o o c i o
•HOOOOOOOOOOOOCSCIOOOOOUOOOOOOOOOOIPOOOOOOO
^rAmfiniOt^'Otn.-'r-' < r- i r H r i n r i P i n r l M M r l l ir-li-.-on*"

8\a rt o 313
HMjm ito o o
83S!KtS o o o o
So r» f oi flo rt rH O o o o o
tiJ N lo rt In 13 S H O O C5 O O O
HOOOOOOO S'tl'QOfflH'OfOr'
^ O O O O O O O O
SinSSnSl SinM r J O O O O O O O O O
S S L O t S i o ^ S c o ^ ^ r n r H O O O O O O O O O O
8 SI ^ 5! R S S tC! s S S
• - 4 0 0 0 0 0 0 0 0 0 0 0
r - ^ O O O O O t J O O O O O O 8 ri 3 PI 3 a n .gr^ f - < C 3 0 0 0 f - ) 0 0 O Q 0 f 3 0 0
B'SKS.SSKSSSSSSSK rHOOOOOOOOOOOOOO
8 Pi s s s s s s a s s 3 s s r^OOOOOOOOOOOOOOO
• > « o o o o o o o o o o o o o o o o
gaSgRKSSSSifiSJSRSg?, : nOOOOOODOOOOOOOOOO
• H O O O O O O O O O O O O O O O O O O
HOOOOOOOOOOOOOOOOOOO
-HcpOOOOOOOOOOOOOOCDOOOO
h o o o o o o o o o o o o o o o o o o o o o
gss; •HOOOOOOOOOOOOOOOOOOOOOO
r H O O O O O O O ^ O O O O O O O O O O O O O O O
p i ] 0 Pi M Fi 11 ["i n I. h11 / J fl L; ; 1H H13.11,1 f - < a o u o o o u o o o o o o o o o o o o o o o o o
t H O O O O O O O O O O O O O O O O O O O O O O O O O
H O O O O O O O O O O O O O O O O O O O O O O O O O O
• H 0 0 0 0 0 0 0 0 0 0 0 0 0 0 0 0 0 0 0 0 0 9 0 0 0 0 0
•-•OOi^OOOOOOOOOOOOOOOOOOOOOOOOO
• lOOOOpOOOOOOOOeOOOOOOOOOOOOOOO I I I T i l l I I I I I I I I I I I I I I I I I t I
t i e o o o o o o o o o o o o o o o e o o o o o o o o o o o o o
gSSSSSRSSSSSSSSSPSSPSgSSSPIS^ r ^ 0 0 0 0 0 0 c 9 0 0 0 0 0 0 0 0 0 0 0 0 0 0 0 0 0 c 3 0 0 0 0 0 0
I t I I I
• H o o o o o o o o o o o o o o e o o ' s o o o o o o o o o o o o o o I I I I
W O O O O O O O O O O O O O O O O O O O O O O O O O O O O O O O O O
H O O O O O O O O O O O O O O O O O O O O O O O O O O O O O O O U O O O r « 0 0 0 0 0 0 0 0 0 0 0 0 0 0 0 0 0 0 0 0 0 0 0 0 0 0 0 0 0 0 0 0 0 0 0 0
f H O O O O O O O O O O O O O O O O O O O O O O O O O O O O O O O O O O O O O
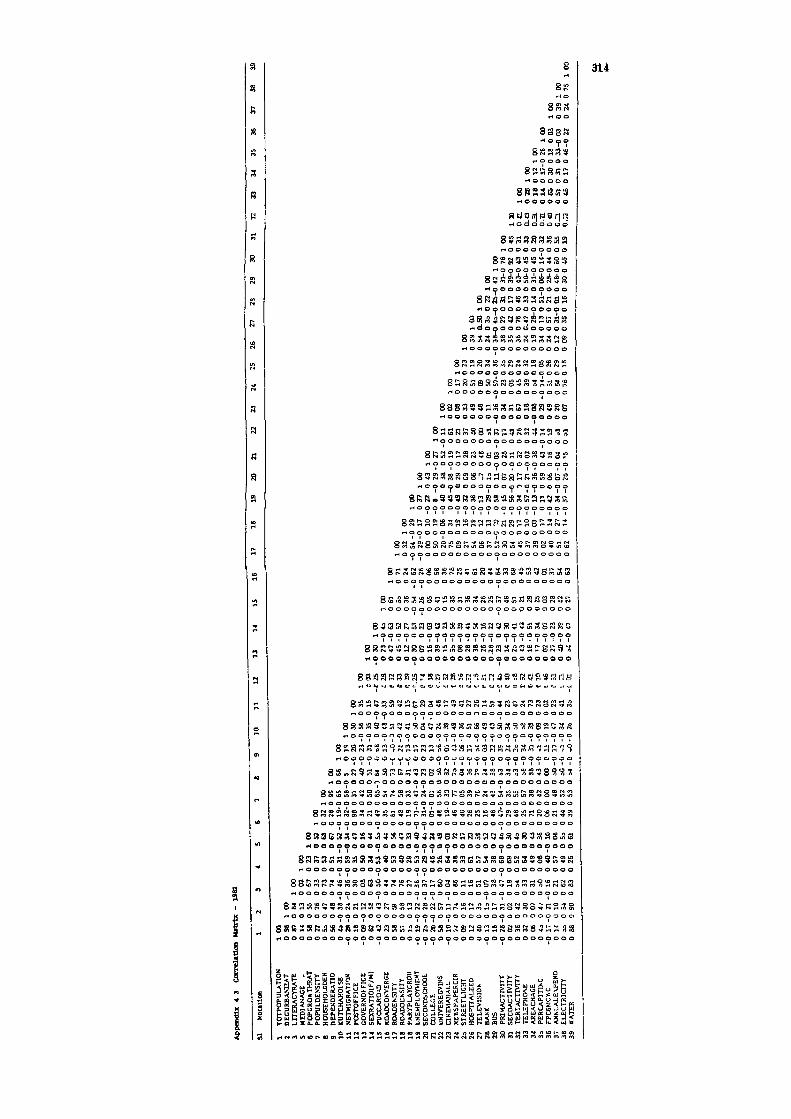
s 314
R
S
S
(M
iq
a
a
s
a
8S tH O
SS j rH O O
S iH
S3 rt o
!RR O O
t- o i-t ri o o
38
8ie H O
iH O O sssa
o ^ o ssss^ H O o O O
saussjs O O O o o
H o o o o o o ROOfrii gfiri H o d o o o o o
S'SFtmssi^^ss r - t O O O O O O O O
ssggssassis HOOOOOOOOO
H e o o o o o o o o o
no^ooooooooo r ^ c i o ^ o o o i ^ o o o o o
HOOOOOOOOOOOOO
• - • o o o o o o o o o c o o o o 8 S K 8 S K s s s s-s i S S js HOOOOOOOOOOOOOOO
sasassssssGSsassB Hoooooooooooeoooo I t sasnKSS'SKSusassa-s'; * ^ o o o o o o o o o o o o o o o o o
K a S S S S 5 e 3 S a C! 3 3 3 S 3 ? OOOOOOOOoOOOOOOOOO
asssss'^flaeasnisssBS o o ^ o o o o o o o i ^ n o ^ e o o ^
»3SJ3Ci{S!aRS3SSGaa!3SR OOOOOOOOOOOOOOOOOO I I I I I I I I I I asssssssnsssasssas OOOOOOOOOOOOOOOOOO I i
OOOOOOOOOOOOOOOOOO
8PS!2S8SSSS3GS5S3SSS5ISl;S3 •HOOOOOOOOOOOOOOOOOOOOOOO I I •
rHOOOO(^OOOOOOOOOOOOpOOOOOO
SJiaaRscissasssasacjasasaBsas
f H O o e o o o o o o o o o o o o o o o o o o o o o o
Hooeooooooooooooooeoooooooo t I I esaRnRRi-'jrsfiPiasi 'iBnas'sisoasRriG
I I I I
t - « o o o o o o o o o o o o o o o < ~ i o o o o o o o o e o o o
r H o o o o o n o o o o o o o o o o o o o o o o o o o o o o o saaas'sa^sasaa'Ss^ssa-^SFisarismnKT? rtOOOOOOUUUOOOOOUOQOOOOOOOOOOOOO I I I I I I I I I I I I I I I I I I I I I I
f ^ o o e o o n o o o o o o o o o e o o o o o o o o o o o o o o o
•NOOOOOOOOOOOOOOOOOOOOOOOOOOOOOOOO
•HOOOOOOOOOOOOOOOOOOOOOOOOOOOOOOOOO
Hoeoooooooooaoooooooooooeooeoooeooo
n o o o o o o o o o o o o o o o o o o o o o o o o o o o o o o o o o o o
r^OOOOOOOOOOOOOOOOOOOOOOOOOOeOOOOOOOOO » 4 I » i t » I I »
H o o e o o o o o o o o o o o o o o o c j i o o o o o o o o o o o a o o o o o o
HOOOOOOOOOOOOOOOOOOOOOOOpOOOOOOOOOOOOOO
O S J p s S s

315
Appendix 5.1: Strong Var iab les
and 1981
of Urban Dynamics, 1961, 1974.
SI. Name of vnrlQblos Census year
No. 1961 1974 1981
1 2 3 4 5
1. Total Urban Population
2. Degree of Urbanization
3. Medium Age
/l. l'0[JUlaUun (Jruwlh Koto
5. Population Density
6. Dependency Ratio
7. Net Migration
8. Sex Ratio
9. Area
10. Area Change
11. PoRt nfrinriR
12. Government Of f i cos
13. Parks 6 Playgrounds
14. Cinoma Hall Soats
15. News Paper Circulation
16. Street L ights
17. Hospital Beds
I f l . RonkR
19. Bus
2U. FPC G MCWC
Jtf
itit •f
If
*
*
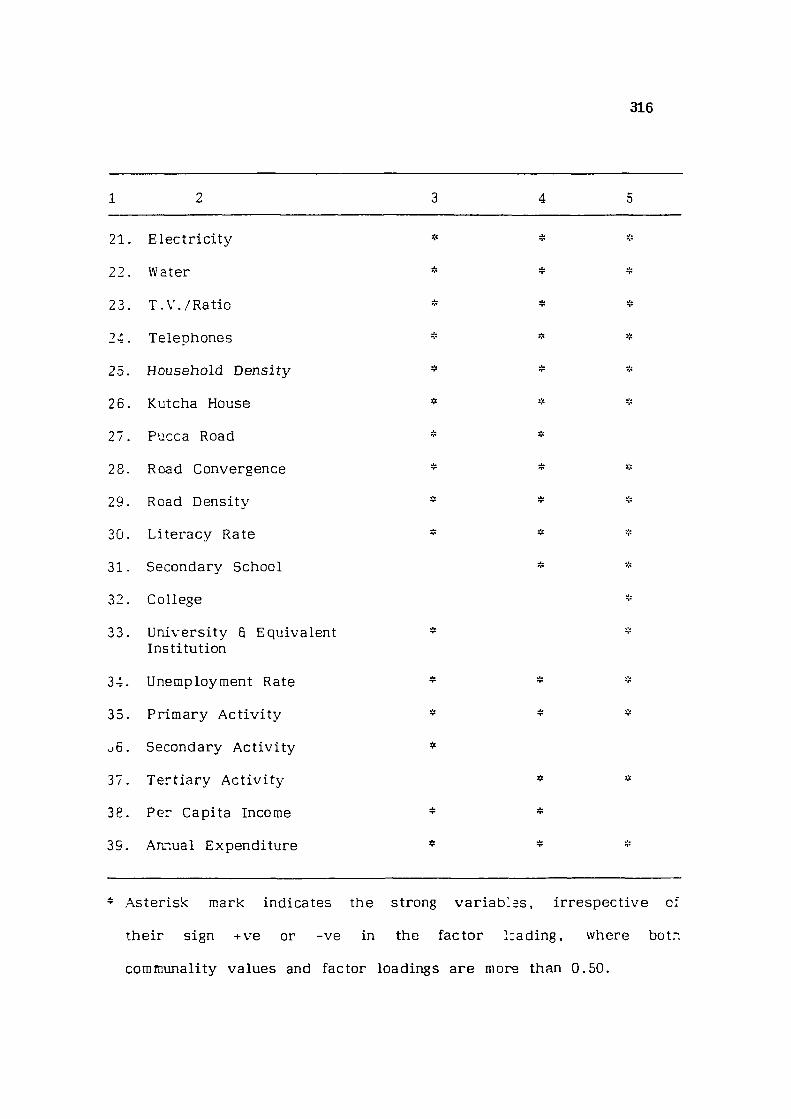
316
1 2 3 4 5
21. Electr ic i ty- =!= *
22. Water 'f
23. T .V ./Rat io is *
'> 1 Telephones *
25. Household Density K*
26. Kutcha House * *
27. Pucca Road f f
28. Road Convergence ^
29. Road Density A: -1'
30. L i t e racy Rate - •t'
31. Secondary School »»*
32. Col lege
33. Univers i ty 6 Equivalent Institution
*
34. Unemployment Rate *
35. Pr imary A c t i v i t y
o6. Secondary A c t i v i t y
37. Te r t i a ry A c t i v i t y V
38. Per Capita Income *
39. An-iual Expenditure
- Aster isk mark indicates the strong va r i ab l e s , i r r e spec t i v e of
the i r sign +ve or - v e in the factor leading, where botr.
comfnunality values and factor loadings a re more than 0.50.

317
Appendix 5.2: Magnitude of Variables (1961-1981)
SI . No.
Magnitude of Four Factors Name of Var iab les
F - I F - I I F - I I I F- IV
1. Urban Population change +M -M (Population Dynamics)
2. Change of Area -M
3. Degree of Urbanization -M
4. Population Density +H
5. Dependency Ratio -M
6. Pucca House +M
7. Post O f f i ce -M
8. Se i Ratio -M
9. Pucca Road -M
10. Park and Playground +H
11. Unemployment -^4
12. Secondary School +M
13. College f M
14. University-g equivalent institution
15. Cinema Hall -M
16. Street l ight -M
17. Hospital Bed
18. Te lev is ion/Radio +H
19. Bank +M -M
20. Bus -M
21. Primary A c t i v i t y -M
22. Secondary A c t i v i t y
23. Ter t ia ry A c t i v i t y -M
24. Telephone +M
Annual Expenditure +M -M
26. E lec t r i c i t y Consumption
27. Water Supply -M
+ v e or - v e sign is indicating the d i rect ion of magnitude.
H is the high magnitudee and M i s the medium magnitude of urban
dynamics.

Abbreviations
318
AMU = Al igarr . Muslim Univers i ty
BBS = Hanglaaesh Bureau of Stat ist ics
CDA = Capital Development Authority
CUS = Tenter for Urban Studies
FPC = Family Planning Center
MCWC = l-laternity and Chi ld Wel fare Center
NILG = -'vational Institute of Local Governir.ent
NIPORT = National Institute of Population Research and Training,
PCA = Pr inc ipa l Component Analys is
SMSA = Standard Metropolitan Stat is t ica l Area
SMA = Stat ist ical Metroplitan Area
UDD = Vrban Development Directorate

319
BIBLIOGRAPHY
BOOKS
Abedin, M. Jainul (1966 . Our Cities and Towns, N'siional Institute of Pi : : l ic Administrat ion, Dhaka, N'lPA and BDLGD, Gov: , c: E . P . , Dhaka, S. S ira judcin, Dhaka.
Ahmed, K.H. (1980], Traffic Problems in Dhaka City, Dhaka.
Ahmad, N. (1976), A New Economic Geography of Bangladesh, Nev/ Delhi .
Ahmad, Q. (1965), Indian Cities: Characteristics and Correlates, Chicago.
Alam, S.M. and Pokhishevsky, V . V . (1976), Urbanization in Developing Covintries, Hyderabad.
Arefeen, H.K. (1983), Urbanization in Bangladesh, Dhaka.
Ayeni , Bola, (.1979), Concepts and Techniques in Urban Analysis, New York.
Barc lay , G. (1958), Techrique of Population Analysis, New York .
Beaujeu - Gomie r , J. (1966 . Geography of Population, Lcr.dcn.
B e r r y , B . J . L . (1971), "City s i z e and Economic Development" , in L . Jakobscr. and Prakash, ( e d s ) , Urbanization and National Development, Englewood C l i f f s .
Bhat, L .S . et al./Micro Level Planning: A Case Study of Komal Area, New Delhi.
Blochmann, H. (1968), Contributions to the Geography and History of Bengal. Calcutta.
Blumenfield, H. (1967), The Modem Metropolis: Its Origins, Growths, Characteristics and Planning, England.
Bogus, D.J. 5 Zachariar. K .C . (1962), "Urbanizaticn and Migration in India ' , p p . 27-54, in Roy Turner ( e d ) , India 's Urban Futu-e, Bombay.
Bose, A . (1967), Patterns 3f Urban Growth in India, 1951-61 in : Ashish Ecse ( e d . ) . Patterns of Population Change in India, 1951-61, New Delhi .

320
Bose, A . (1973), Studies in India 's Urbanization, 1901-71, New Delhi.
Boume, L .S . (1975), Urban Systems: Strategies for Regijlation, Ox fo rd .
Breese, G. (1966), Urbanization of Newly Developing Countries, London.
Breese, G. (1969), Urbanization in Newly Developing Countiries, New Delhi .
Brush, J .E . (1962), "Morphology of Indian C i t i e s " , in Roy Turner, ( e d . ) , India 's Urban Future, B e r k e l e y .
Chandna, R .C . (1986), A Geography of Population, New Delhi . Chamber (1965), Chamber's Twentieth Centuiry Dictionary,
Bombay.
Chapin, F .S. Jr . a Weiss, S . F . , (1962), Urban Growth Dynamics in a Regional Cluster of Cities ( e d . ) . New York .
Chaudhury, R .H. (1980), Urbanization in Bangladesh, A CUS Research Monograph, CUS, D.U. Dhaka.
Coates, B . E . , R .J . Jhonston 8 P . L . Knox, (1977), Geography and Inequality, De lh i .
CUS, (1979), The Urban Poor in Bangladesh: Comprehensive Summary Report , Research f o r UNICEF, Dhaka.
Davis, K. (1951), Urbanization in India: Past and Future, In : Roy Turner ( e d . ) , I nd i a ' s Urban Future: Selected Studies from an International Conference on Urbanization in India, Ba rke l e y .
Deshpande, C .D . , B. Arunachalan, L .S . Bhat (1980) , Impact of a Metropolitan City on the Surrounding Region: A Study of South Kolaba, Maharashtra, New Delhi .
Dubey, R.M. (1981), Population dynamics in India: with Reference to U . P . , De lh i .
Dickey, J.VV. S Watts, T . M . , (1978) , Analytic Techniques in Urban and Regional Planning, New Yo rk .
Ebcon, D. (1977), Statistics in Geography: A Practical Aproach, Ox fo rd .

321
Elahi , K.M. (1981), "Spatial Distr ibution of Population Structures in Bangladesh", Studies in Bangladesh Geography, BNGA, Dhaka.
Encyclopedia C1989), The Cambridge Eiicyclopedia of India, Pakistan, Bangladesh and Srilanka, New Yo rk .
Everson, J .A . (1981), Concepts in Geography: 3 - Inside the city, Hongkong.
Ford, T . R . a JOng, G .F .D . , (1970), Social Demography, New Je r sey .
Forres ter , J .N . (1969), Urban Dynamics, Cambridge.
Fruchter, B. (1954), Introduction to Factor Analysis, New Je r s ey .
Ghosh, B .N . (1987), Fundamsitals of Population Geography, New Delhi .
Ghosh, M. Dutta, A .K . 8 Roy, B. (1972) , Calcutta: A Study in Urban Growth Dynamics, Calcutta.
Gibbs, J. P. (1961), Urban Research Methods, New Delh i .
Girst N .P . and Hoyt, H. (1954), Urban Sociology, New De lh i .
Harman, H.H. (1960), Modem Factor Analysis, Chicago.
Harman, H.H. (1961), Modem Factor Analysis, Chicago.
Hort, T . (1975), The Factorial Ecology of Johannesburg, Johnnesburg.
Hasan, A .D. (1956), Dhaka - A Record of its Changing Features, Mrs. Safia KhatutiDhaka.
Hasnath, S .A . (1974), "Growing Urban Centers in Bangladesh", National Geographical Association of Bangladesh, Dhaka.
Hoyt, H. (1939) , The Structure and Growth of Residential Neighbourhoods in American Cities, Washington.
Harman, H.H. (1967), Modem Factor Analysis, Chicago.
Hong, S. (1980) , Demographic Characteristics of Bangladesh, USAID, Dhaka.
322
Horton (1970), Geographic Perspectives on Urban Systems, Englewood Cli f fs ( e d s . ) , New Jersey .
Hossain, S. (1972) , Urban Af fa i rs : Collection of Papers, Dhaka.
Ibrahim, R. (1984) , Market Centers and Regional Development: A case study of Delhi - Jaipur - Agra Triangle, Delh i .
ICSSR (1972), A Survey of Research in Geography, Bombay.
Islam, N. (1978), Development Strategy of Bangladesh, Ox fo rd .
Islam, N. (1982), The People of Dhaka: A Demographic and Socio-Economic Survey with Special Reference to Migrants Population of Dhaka Metropolitan Region (Dhaka Ci ty , Mirpur, Tongi and Narayanganj) , Dhaka.
Islam, Begum, N. (1981), Housing in Bangladesh: A B ib l i og raph ic Study; Monograph. No. 8 Rev ised, Dhaka.
Islam, N. and Begum, N. (1982), Bibliography on Bangladesh Urbanization, Dhaka.
Islam, N. A l l K. and Huq, S. (1981), A Survey of Housing in a Bangladesh Village, Dhaka.
Jensen, C.G. (1969), "Some Problems of Ecological Factor Ana l ys i s " , in M. Dogan and S. Rokkan ( e d s . ) , Quantitative Ecological Analysis in Sciraice, Cambridge.
Johnson, J.H. (1974), Suburban Growth; Geographical Processes at the Edge of the Western City ; Lor.jon.
Johnston, R .J . (1980), Multivariate Statistical Analysis in Geography, London.
Kumra, S. (1982) , Indian Towns in Transition: A Study in Social Eco logy , New Delhi .
Kendal l , M.G. (1956), A Course in Multivariate Analysis, London.
Khan, A . A . (1931) , Memoirs of Gaur and FHindra, ed. Revised by H.E. Stapleton, Calcutta.
King, L .J . (1969), Statistical Analysis in Geography, C l i f f s .

323
Koutsoyiannis, A . (1984), Theory of Econometrics, London.
Knox, P . (1982), "Overv i ew of Spatial D i f f e rent ia t ion" , Urban Geography, London.
Law ley , D.N. and Maxwel l , A .E . (1963), Factor Analysis as a Statistical Method, London.
Mahadev, P .D . (1986), Urban Geography, New Delh i .
Mahmood, A. (1977), Statistical Methods in Geographical Studies, New Delh i .
Mayer , H.M. and Clyde F. Kohn (1959), Readings in Urban Geography, Chicago.
Misra, H.N. (1988), Urban System of a Developing Economy: A Study of Allahabad City - Region, New De lh i .
Mi t ra , A . S et al (1980), Indian Cities: The ir Industrial Structure Immigration and Capital Investmait 1961-1971, New Delhi .
Moser, C .A . , S Scott, W. (1961), British Towns: A Statistical Study of their Social and Economic Differences, Edinbiurgh.
Mukher j i , S. (1978) , Quantitative Methods in Geography, New De lh i .
Mulik, A .D. (1989), Dynamics of Urlianization - A Geographical Perspective, De lh i .
Murdie, R .A . (1969), Factorial Ecology of Metropolitan Toronto 1951-61, Chicago.
Murphy, R .E . (1966), The American City: An Urban Geography, London.
Mayer , H.M. and Koln, C .F . (1959), Readings in Urban Geography ( e d . ) Chicago.
Narain, V. and Prakasam, C .P . (1983), Population Policy Perspectives in Developing Countries, Bombay.
NGA, B (1981), Studies in Bangladesh Geography, ( e d ) , Bangladesh National Geographical Associat ion, Dhaka.

324
NIPORT (1984), Basic Methods of Evaluation and Action Research: Dhaka.
Pae l inck, J .H .P . (1972), "A l t e rnat i ve Methods for the Study of Urban Dynamics", in R. Funck ( e d . ) Recent Development in Regional Science, pp . 33-49.
Po l l a rd , H.H. , Yusuf, F . and Po l lard G.N. (1981), Demographic Techniques, Sy dney.
Prabha, K. (1979), Towns: A Structural Analysis: A Study of Pan jab, Delhi .
Pressat , R. (1972), Demograpnic Analysis: Methods, Results and Applications, Chicago.
Rahman, M. (1990), Bangladesh Pourashava (Municipality) Statistics, Dhaka.
Rao, H. (1984), Regional Disperities and Development in India, New Delhi .
Rao, R. (1981), Growth of Cities: A Case Study of Warangal, Delh i . i
Rashid, H. (1977), Geography of Bangladesh, Dhaka.
Ress, P .H. (1979), Residential Patterns in American Cities: 1960, Chicago.
Robson, B .T . (1969), Urban Analysis: A Study of City Structure with Special Reference to Sunderland, Cambridge.
Roberts , M. (1977), An Introduction to Town Planning Techniques, L on d on.
Robson, B .T . (1973), Urban Growth : An Approach, London.
Robinson, E .A .G . and Gr i f f in K. (1974), The Economic Development of Bangladesh within a Socialist Framework: Proceedings of a Conference held by the International Economic Association of Dhaka, London.
Salahuddin. A . T . M . (1977), Modem Demography, Dhaka.
Shafer , T . V.. (1977), Urban Growth and Economics, V i rg in ia .
Sharma, A .N . (1981) , Spatial Approach for District Planning: A Case Study of Kamal District, New Delhi.

325
Singh, R .L . (1973), Urban Geography : In Developing Countries Varanasi.
Singh, J. P . (1979), Urban Land Use Planning In Hill Areas: A Case Study of Shillong, De lh i .
Singh, H . P . (1979), Resource Appraisal and Planning in India: A Case Study of a Backward Region, Nev, De lh i .
Sinha, B .N. (1970), S irs i : An Urban Study in Application of Research Models, Mysore .
Sinha, V .N . P. (1976), Chota Nagpur Plateau, New De lh i .
Sovani, N.V. (1966), Urbanization and Urban India, Delhi .
Shyrock, H.S. at al (1976), The Methods and Materials of Demography, New York .
Sundram, K .V . (1977), Urban and Regional Planning in India, New Delhi .
Thakur, B. (1980), Urban Settlements in Eastern India; Entropy Changes and pattern Analysis, New Delh i .
Thomlison, R. (1969), Urban Structure: The Social and Spatial Characters of Cities, New Yo rk .
Timms, D. (1975), The Urban Mosaic: Towards a Theory of Residential Differentiation, Cambridge.
Turabian, K . L . (1967), A Manual for Writers; Chicago.
Turner, R. (1962), India ' s Urban Future, Burke ley .
Vianmali, 5. (1970), Regional Planning for Social Facilities, An Examination of Central Place Concepts and their Application: A Case Study of Eastern Maharashtra, NICD, Hyderabad.
Yadav, C.S. (1979), Land Use in Big Cities; A Study of Delhi, Delh i .
l a d a v , C.S. (1987), Contemporary City Ecology; Perspectives in Urban Geography, New Delh i .
Zachariah, K.C. (1962), A Historical Study of Internal Migration in the Indian Sub-Continent,1901—31, New Yo rk .

ARTICLES
326
Ze l insky , V,. (1962), B ib l i og raph ic Guide to Population Geography, Chicago.
Ze l insky , W. (1966), A Prologue to Population Geography, Washington.
Abiodun, J. A. (1967), "Urban Hierarchy in a Developing Country".; Economic Geography. Vo l . 43, pp. 347-367.
Abu-Laghod, J. (1969), Testing the Theory of Social Area Analys is : The Case of Ca i ro . American Sociological Review, Vo l . 34, pp . 198-212.
Ahmad, Q.S. (1967), "Distr ibut ion of City Sizes in Pakistan", Pakistan Geographical Review, Vo l . 22 (2 ) , pp. 77-85.
Ahmed, Enayat, (1952), "Town Study with Special Reference to India" , Geographer, Vo l . 5, pp. 1-26.
Ahmed, E. (1956), "Distr ibut io in of Cit ies in Pakistan", Geographical Outlook, Vo l . 1.
India and
Ahmad, E. (1962), "Si te Factors in Town Planning; , Journal of Social Science Research, Ranchi Univers i ty , Vo l .5 .
Ahmed, E. (1956), "Or ig in and Evolution of Towns of the Uttar Pradesh" , Geographical Outlook, Vo l .1 , pp. 38-58.
Ahmed, K.S. (1966), "Urbanization trend in Pakistan", Geographical Review, Vo l . 21, pp. 15-16.
Alam, J. (1979), "Sthabir Shahar Dhaka" ( "Dhaka: Stagnant C i t v " , In Bangla) , Bichitra, Vo l . 9 ( 48 ) , pp . 19-25.
Amrit L . (1959), "Some Aspects of Functional Class i f icat ion of Cit ies and a Proposed Scheme for C lass i f y ing Indian C i t i e s " , National Geographical Journal of India, V o l . 5 ( 1 ) , pp. 12-24.
Anderson, T . R . and Egeland, J .A . (1961), "Spat ia l Aspects of Social Area Ana lys i s " , Am. Social Rev. , Vo l . 26, pp . 392-9.

327
Anantapadmanabham (1965), "Functional Classi f icat ion of Urban Centers in Madras State" , Bombay Geographical Magazine, Vo l . 13.
Az i z , A. (1973), "Urban Gradients Around A l i garh " , The Geography, Vo l . 20 (3 ) , pp . 134-150.
Beckraan, M.J . (1958), "C i t y H i re rarch ies and the Distribution of C i ty Size, "Economic Development and Cultural Change^ Vol . 6, pp . 243-48.
Beckmann, M . J . , McPherson, J .C . (1970), "C i t y Size Distribution in a Central Place H ie rarchy : An Al ternat ive approach" . Journal of Regional Science, Vo l . 10 (1 ) , pp . 25-33.
B e r r y , B . J . L . (1958), "A note concerning methods of c lass i f i ca t i on " , AAG, Vo l . 48, p p . 300-3.
B e r r y , B . J . L . (1961), "C i t y -S i z e Distribution and Economic Development" , Economic Developmait and Cultural Change, Vol . 1 ( 4 ) , pp . 573-588.
Be r r y , B . J . L . (1964), "C i t i e s as Systems within Systems of C i t i e s " , Regional Science Association (1964), Vol . 13, pp. 147-163.
Be r r y , B . J . L . (1964), "Approaches to regional analys is : A Svnthesis, Ann. Assoc. Ame. Geog., Vo l . 54, pp . 2-11.
Ber r y , B . J . L . (1969), "Relat ionship Between Regional Economic Development and the Urban Systems", Ti jdschriftvoor Economische en Sociate Geographic, Vo l . 60, pp. 283-307.
Be r r y , B . J . L . S Bamum, H.G. (1962), "Aggregate Relations and Elemental Components of Central Place Systems", Journal of Regional Science, Vo l . 4 (1 ) , pp . 34-68.
Be r r y , B . J . L . 5 Garrison, VV.L. (1958), "A l ternat ive Explanations of Urban Rank S ize Relationship, Ann. Asio. Ame. Geog. Vol . 48, pp . 83-91.^
B e r r y , B . J . L . and Rees, P .H . (1969), " The Factor ial Ecology of Calcatta, American Journal of Socio logy, Vol . 74, pp . 283, 326.

328
B e r r y , B . J . L . and H. Spodek, (1971) , "Comparative Ecology of Large Indian C i t i e s " , Economic Geography, Vol . 47, pp. 266-85.
B e r r y , B . J . L . and Tennant, R .J . (1963), "Urban population densi t ies : Structure and Change", Geographical Review, Vo l . 53, pp . 389-405.
Bhatia, S.S. (1962), "A reconsiderat ion of the concept of the Primate C i t y " , Indian Geographical Journal, Vol . 37, pp. 23-24.
Bisv/as, S .K . (1977), "An Appra isa l of the Method of Functional Class i f icat ion of Urban Centres", Geographical Review of India, Vo l . 39 (3 ) , pp. 259-65.
Borcher t , J .R . (1961), "The Town C i t i es Urbanized Area : Past Present and Future", Geographical Review, Vol . 51, pp. 47-70.
Bose, A . (1963), "S ix decades of urbanization in India, 1901-61", Indian Economic and Social History Review, 2 ( 1 ) , Jan. pp . 23-41.
Bose, A . (1968), "Urban Character is t ics of towns in India stat is t icca l study" , India Journal of Public Administration, 14 (3 ) , pp . 457-65.
Bourne, L .S . and G.M. Barhor, (1971), "Eco log ica l Patterns of Small Urban Centers in Canada", Economic Geography, Vo l . 47, pp. 258-65.
Bourne, L .S . 5 Murdie, R .A . (1972), " Interre lat ionship of Social and Phys ica l Space in the C i ty ; A Mult ivar iate Analys is of Metropolitan Toronto", The Canadian Geographer, Vol . 26 (3 ) , pp . 211-29.
Bowman, R .A . (1969), "Factoring the Factors: Factorial Ecologies and Ethmic Research" , Australian and New Zealand Journal of Sociology, Vo l . 14.2, pp . 191-193.
Breeze , G. (1963), "Urban Development Problems in India" , Annals of the Association of American Geographers, Vol . 53, pp . 253.
Brown, L . A . and Horton, F .E . (1970), "Social Area Chrmge:" An Empir ica l Analys is , Urban Studies, Vo l . 7, pp . 271-88.

329
Carrothers, G . P . (1956), "An h i s t o r i c r ev i ew of the g rav i t y and potential concepts of helman interact ion, Journal of American Institute of Planners, Vo l . 22, pp . 94-102.
Clark, P .J . (1954), "Distance of spatial re lat ionship in populations", Ecology, Vo l . 35, pp. 445-53.
Clark, D . , Dav ies , W.K.D. and Johnston, R .J . (1974), "The Appl icat ion of Factor Analysis in Human Geography, The Statistician, Vol . 23, pp . 259-81.
Chojnicki , Z. and Czyz , T . (1976), Some Problems in the Appl icat ion of Factor Analysis in Geography, Geographical Analysis, Vo l . 8, pp. 416-27.
Clark, P . J . and Evance, F .C. (1954), "Distance to nearest neisiibour as a measure of spat ial re lat ionships in populations", Ecology, Vo l . 35, pp . 445-53.
Cloke, P .J . (1971), "An Index of Rural i ty f o r England and Wales" , Regional Studies, Vo l . 11, pp . 31-40.
C l i f f o r d , E . T . (1968), "On the Class i f icat ion of Cit ies into equal s ize ca tegor ies " , Ann. Ass. Ame. Geog., Vo l . 58, pp. 775-786.
Datt, J .N. (1956), "Urbanization in Bengal", Geographical Review of India, Vol . 18, pp. 19-23.
Datta, J.M. (1956), "Urbanization in Bengal" , Geographical Review of India, Dec. 1956, pp. 19-23.
Deshpande, " c .D . (1941), "C i t ies and Towns of Bombay Prov ince : Aspects of Urban Geography" , Indian Geographical Journal, Vo l . 16.
D ix i t , K .R . (1961), "The Concept of Functional Zones", National Geographical Journal of India, Vo l . 7, pp . 191-200.
Dutt, A .K . (1969), " In ter -C i ty Hierarchy of Central Places, Calcutta as a Case Study" , Professional Geographer, Vol . 21, pp. 18-23.
Dutt, A .K . and Amin, R. (1986), "Toward a Typo l ogy of South Asian C i t i es " , The National Geographical Journal of India, Vo l . 32 (1 ) , pp . 30-39.

330
Form, W.H. et al (1954), "The Comparability^ of a l ternat ive approaches to the del imitat ion of urban sub-areas" , Amcricsin Sociological Review, Vo l . 1°, pp . 434-40.
Gandhi, I . (1975) , "Haphazard growth of our C i t i e s " , Yojana, 19 (20 ) , pp. 5-8.
Garrison, VV.L. (1956), " App l i c ab i l i t y of Stat ist ical inference to geographical research" , Geographical Review, Vo l . 46," pp . 427-429.
Haynes, K .E . (1971), "Spat ia l Change in Urban Structures: A l t e rnat i ve Approaches to Ecological Dynamics, Economic Geography, Vo l . 324-35.
Hose l i tz , B . F . (1959), "C i t i es of India and the i r prob lems" , Annals of the Association of American Geographers, 4 9 ( 2 ) , pp. 223-31.
Hotel l ing, H. (1933), "Ana lys is of a Complex of Stat ist ical Var iab les into Pr inc ipal Components", Journal of Educational Psychology, Vo l . 24, pp. 417-441, 498-520.
Hunter, A .A . (1971), "Fac tor ia l Ecology - a cr i t ique and some suggestions. Demography, Vo l . 9, pp . 32-49.
»
Islam, N. (1980) , "Planning Problems in Dhaka C i t y " , Local Government Quarterly, Vo l . 9(3 5 4 ) , p p . 1-12.
Jauhari, (1972), "Urban Settlements of the Sutlej-Yamuna D i v i de " (C i r ca 947 A .D. 1947)" , The National Geographical Journal of India, Vo l . 8, No. 2, June.
Jef ferson, M. (1939), "The Law of Primate C i t y " , The Geographical Review, Vo l . 29 (2 ) , pp. 226-32.
Johnston, R .J . (1965), "Mult ivar iate Reglcns: a further aporoacn" , Professional Geographer, Vol . 17, pp". 9-12.
Johnston, R .J . (1973), "Poss ib l e Exte is ions to the Factor ia l Ecology Method: A Note, Environment and Planning, V o l . 5, pp. 719-34.
Johnston, R .J . (1973), "Social Area Change in Melbource, 1961-66", Australian Geographical Studios, Vol . 11, pp . 79-38.

331
Johnston, R .J . (1979), "The Characterizat ion of Urban Social A reas ,T E S G, Vo l . 70, pp . 232-38.
Josephine, 0 . (1967), "Urban h ierarchy in a developing country" , Economic Geography, Vo l . 43 (4 ) , pp . 347-67.
Kamersche-:, D.R. (1967), "Socio-Econpmic Determinants of F e r t i l i t y Pat terns" , Population Review, Vo l . 1 1 ( 1 ) , p . 24.
K e y f i t z , (1971), "On the Momentum of Population Growth", Demography, Vo l . 8 ( 1 ) , pp . 71-80.
King, L . J . (1961), "A mult ivar iate analys is o the spacing of urban settlements in the United States" , Ann. Ass . Ame. Geographer, pp. 222-223.
King, L . J . (1966), "Cross-Sect ional Analys is of Canadian V,ban, Dimensions: 1951 and 1961", Canadian Geographer, Vo l . 10, pp. 205-224.
Kr ishan, G. S Bala, R. (1982), "Urbanization in Border Regions: A Case Study of I n d i a ' s Border B is t r i c ts Adjoining Pakistan", The Geographical Journal, Vol . 148, pp . 43-49.
La l l , A . & Jhir tha, R. (1971), "Spat ia l analysis of urbanization in India, T E S G, 62 (4 ) , pp . 234-48.
L e s l i e , G.R. 8 Richardson, A .H. (1961), " L i f e - C y c l e , Career Pattern and the Decision to More, "American Sociological Review, Vo l . 25, pp . 894-902.
Mackay, J.R. (1958), "Chi-Square as a tool for regional s tudies" , Ann. Ass. Ame. Geog. Vo l . 48, pp. 164.
Mahmood A. (1986), "Stat is t ica l method of Regional izat ion" , •The Geographer, Vo l . 33 (1 ) , pp . 15-22.
McCarty , H.H. (1956), "Use of certain s ta t i s t i ca l procedures in geographical ana lys i s " . Am. Ass. Anne. Geog., Vol . 46, p p . 263.
Mehta, S.K. (1961), "Some Demographic and Economic Corre lates of Primate Ci t ies : A Case for Revolut ion", Demographic, Vo l . 1 ( 1 ) , pp. 136-47.
Mishra , B. (1967), "Optimum s i ze of Indian C i t y " , Urban and Rural Planning Thought, 10 (3 ) , p. 63.

332
Mookher j i , D. (1963) , "Urbanization Pattern in India: 1951-61", Professional Geographer, Vo l . 21, pp . 308-314.
Nath, V . (1966), "Planning f o r urban g rowth " , Indian Journal of Social Work, 27 (2 ) , pp . 119-45.
Narain, V . (1976), "Demographic aspects of urbanization", Indian Journal of Social Work, 36 (3-4 ) , pp . 233-58.
Nelson, H.J. (1955) , "A Serv ice Class i f icat ion of American Ci t ies , Economic Geography, Vo l . 31(3) , pp. 189-210.
Nelson, H.J . (1957) , "Some Character is t ics o f the population of c i t i e s s imi lar s e r v i c e c lass i f i ca t ions" , Economic Geography, Vol . 33, pp . 95-108.
Nigam, M.N. (1968) , "Urbanization in Ind ia" , Quarterly Journal of Indian Studies in Social Sciraices, 2 (1-2 ) , pp. 93-102.
Orishoma, I . (1987), "An Approach to Urban Dynamics" Geographical Analysis, Vo l . 19 (3 ) , pp . 220-204.
Palm, R. (1973), "Fac tor ia l Ecology and the communality of out look" , Annals, Association of American Geographers, Vo l . 63, pp. 341-46.
Pa in , R. and D. Caruso, (1972), "Factor Label l ing in Factorial Eco logy " , AAAG, Vo l . 62, pp. 122-37.
Parr , J.B. (1969), "C i ty Hierarch ies and Distr ibution of City S i ze " , Journal of Regional Science, Vo l . 9, pp . 239-253.
Raf iul lah, S.M. (1965), "A New Approach to F\inctional Class i f icat ion of Towns", Geographer, Vol . 12, pp. 40-53.
Rees, P .H . (1971), "Factor ia l Eco logy : An Extended Defination, Survey, and Cri t ique of the F i e l d " , Economic Geography, Vol. 47, pp. 220-33.
Rele, J .R . (1976), "Demographic asnects of Urbanization", Indian Journal of Social Work, Vol. 36 (3 -4 ) , pp. 259-61.
Reynolds, R.B. (1956), "Stat is t i ca l methods in geographical r esearch " . Geographical Review, Vo l . 46, pp . 129-32.

333
R i z v i , S .Q .A . (1956-57), "The Role of R i v e r s in the Evolution of Urban Centers", Geographer, Vo l . 8-9.
Roy, B.K. (1986), "Recent Urbanization in India: A Scenario". The National Geographical Journal of India, Vol . 32 (1 ) , pp . 17-29.
Sarkar, A. (1989), "A study of urban growth in West Bengal during the per iod 1901-1981", GRI, Vol. 51(41. pp . 65-74.
Shaf i , M. (1969), Can India Support F i v e Times Her Population". Science Today, Vo l . 3 ( 9 ) , pp . 41-48.
Singh, A. (1986), "Agr icul tural Population i s the Urban Centers of Varanasi City Region - A Geographical Ana lys is " . The National Geographical Journal of India, Vol . 32 (1 ) , pp . 40-48.
Stewart , J .Q. (1947), "Empir ica l Mathematical Rules Concerning the Distribution and Equil ibrium of Population". The Geographical Review, Vo l . 37 (3 ) , pp. 451-485.
Stewart, C .T . Jr . (1958), " T h e Size and Spacing of C i t i e s " . The Geographical Review, Vo l . 48, pp . 222-245.
Suri, K.B. (1968), "Towns: Size: Economic Structures ani Growth" , Economic and Political Weekly, Vol . 3(321. pp. 1247-51.
Sweetser , F . L . (1965), "Fac tor ia l Ecology Helsinki, 1960". Demography, Vol . 2, pp . 372-385.
T i w a r i , P .S . (1968), "Functional Pattern of Towns in Madh\-3 Pradesh" , National Geographical Journal of India, Vo l . 14, pp. 41-54.
Ullman, E . L . (1941), "Theory of Location of C i t i e s " , American Journal of Sociology, Vo l . 46 (6 ) , pp . 853-64.
Wanmali, S. (1975), "Rural Serv i ce Centers in India, Present Ident i f icat ion and the acceptance of extension". Area, Vo l . 7 (3 ) , p p . 167-170.
Z ip f , G.K. (1946), "The I j P o ' ^ Hypothesis on the Inter -Ci ty Movement of Person" , American Social Review. Vo l . 11.

334
Ph.D. THESIS
Ahmed, Q. (1964), Indian Cities: Characteristics and Correlates. Department of Geography, Chicago un ive rs i t y .
Ahsan, R . (1979), Household Mobility in the Upper-Income Residential Areas of Dhaka City, Bangladesh, 1960-1974, Unpublished Ph.D. Dissertation, Univers i ty of Hawaii, Hawai i .
Begum, R . A . (1981), Urban Influence of Lucknow on the Surrounding Vil lages, Ph .D . Thesis (Unpubl ished) , Department of Geography, .AMU, A l igarh, India.
Bose, A . (1 959), The Process of Urbanization in India, 1901-51, Delhi School of Economics, Delhi Univers i ty , Unpublished Thes i s , De lh i .
E lahi , K .M . (1971), Patterns of Population Structure and Growth in East Pakistan, Unpublished doctoral thesis, Durham Un ive rs i t y , U.K.
Fakhruddin (1984), Residential Structure of Lucknow: A Study in Quality of Urban Li fe , Ph .D. Thesis , AMU, A l igarh.
George, M .V . (1965), Internal Migration in Assam and Bengal, 1901-61, Austral ia, Australian National Univers i ty , Unpublished Ph .D . Thes is , Austral ia.
H i f t , H . F . (1955), AUgarh, Uttar Pradesh: A Geography of Urban Growth, Syracuse Un ive rs i t y .
Karimi, S .M. (1968), Urbanization of Bihar Plain, Ph .D . Thes is , Al igarh Muslim Un i ve r s i t y , A l i garh .
La i , A . (1953) Some Characteristics of Indian Cities of over 100,000 Inhabitant in 1951 with Special Referoice to their Occupational Structure and Functional Specialisation; Unpublished Ph.D. Thes is , Univers i ty of Indiana.
Mathur, P . C . (1961), Internal Migration in India, 1941-51, Unpublished Ph.D. Thes i s , Univers i ty of Chicago, Chicago.
Pethe, V . P . (1957), Population and Fertil ity in Sholapur City: a Survey, Ph.D. Thes is , Poona.

335
Singh, R . L . (1955), Banaras: A Study in Urban Geography, Ph.D. Thes is , Univers i ty of London, London.
Wanmali, S. (1978), Periodic Markets in South Bihar, India, Unpublished Ph.D. Thes is , Univers i ty of Cambridge.
OTHER PUBLICATIONS
BBS (1974), Population Census 1974, Bulletin-2, Bangladesh Population Census, 1974, BBS, Dhaka.
BBS (1981), Bangladesh Population Caisus, 1981, Bangladesh Bureau of Stat ist ics , Dhaka.
BBS (1981), District (Zi la ) Statistics, GDB, Vo l . 1-21.
BBS (1985), Upazila Statistics - (1979-80 to 1982-83), Vo l . 1: Basic Stat ist ics , Land Uti l isation and Irr igat ion. BBS, Dhaka.
BBS (1986), Socio Economic Indicators of Bangladesh, Bangladesh Bureau of Stat ist ics, Min is t ry of Planning, Dhaka.
Curry, L. S Mackinnon, R.D. (1974) , "Aggregat i ve Dynamics Urban Models Oriented Towards P o l i c y " , Report to Ministry of State for Urban Af fa i rs by the Center f o r urban and community studies. Universi ty of Toronto, reprint as repor t C-75-12, (External ) , May, 1975.
GOP (1951), Population Census, 1951, Pakistan Census Commission.
GOP (1961), Population Census - 1961, Pakistan Census Commission.
Khan, W. and Wanmali, S. (1972) , "Impact of Linguistic Reorganisation of States on C i t y -S i ze Distr ibution", Economic and Socio-Cultural Dimaisions of Regionalisation, Office of the Registrar General of Bidia, pp . 452.
Copyright © 2022 FDOKUMEN