JIENIC AND SOCIO-ECONOMIC DIMENSIONS OF STREET ...
147
9 MW3 NC8201 0951 2002-02 -18 GA JIENIC AND SOCIO-ECONOMIC DIMENSIONS OF STREET FOODS IN URBAN AREAS The case of Nairobi Alice Mboganie Mwangi
-
Upload
khangminh22 -
Category
Documents
-
view
2 -
download
0
Transcript of JIENIC AND SOCIO-ECONOMIC DIMENSIONS OF STREET ...
9 MW3 NC8201 0951 2 0 0 2 - 0 2 - 1 8
GA
JIENIC AND SOCIO-ECONOMIC DIMENSIONS OF STREET FOODS IN URBAN AREAS
The case of Nairobi
Alice Mboganie Mwangi

PROPOSITIONS
1. Street foods are an innovation in response to economic constraints by the urban poor and are gradually adopted by higher socio-economic classes as a way of urban food consumption (This thesis).
2. Street foods as provided and served by vendors are not nutritionally adequate, but when there is ready income among consumers, female vendors can provide nutritionally better quality foods than their male counterparts (This thesis).
3. When food is relatively expensive due to taxing regulations, both quality and quantity of the food available to the urban poor will decline and the nutrition and health status will continually dwindle.
4. Universal advocacy of exclusive breast-feeding for six months is unrealistic because it is impossible and out of reach for mothers among poor communities.
5. The poor are not passive victims of poverty because, within the constraints they face, they do their best to cope, to make ends meet, to protect their livelihoods and meet their basic requirements (Rephrased from Maxwell D, 1999. World Development 27 (11): 1939-1953).
5. A dream brought to reality is a great accomplishment but achieving somebody else's dream is a much greater accomplishment.
7. Knowledge looses its worth when one lacks the facilities to translate it into practice.
8. The world does not have a food production problem but it does have an income entitlement problem.
Propositions pertaining to the thesis 'Nutritional, hygienic and socio-economic dimensions of street foods in urban areas: The case of Nairobi'.
Alice Mboganie Mwangi
Wageningen, 5 March 2002

N U T R I T I O N A L , H Y G I E N I C A N D S O C I O - E C O N O M I C D I M E N S I O N S O F S T R E E T F O O D S I N U R B A N A R E A S :
THE CASE OF NAIROBI
Alice Mboganie Mwangi
CENTRALE LANDBOUWCATALOQUS
Promotor Prof. Dr. W.A. van Staveren Hoogleraar in de Voeding van de Oudere Mens Afdeling Humane Voeding en Epidemiologie, Wageningen Universiteit
Co-Promotoren Dr. A.P. den Hartog Universitair hoofddocent Afdeling Humane Voeding en Epidemiologie, Wageningen Universiteit
Dr. D.W J. Foeken Senior-onderzoeker Afrika-Studiecentrum, Leiden
Promotiecommissie Dr. Ir. Inge D. Brouwer Wageningen Universiteit
Prof. Dr. Jasper K. Imungi University of Nairobi
Prof. Dr. Anke Niehof Wageningen Universiteit
Prof. Dr. Ir. Frans M. Rombouts Wageningen Universiteit
N U T R I T I O N A L , H Y G I E N I C A N D S O C I O - E C O N O M I C D I M E N S I O N S O F S T R E E T F O O D S I N U R B A N A R E A S :
THE CASE OF NAIROBI
Alice Mboganie Mwangi
P r o e f s c h r i f t
Ter verkrijging van de graad van doctor op gezag van de Rector Magnificus
van Wageningen Universiteit, Prof. Dr. Ir. L. Speelman,
in het openbaar te verdedigen op dinsdag 5 maart 2002
des namiddags te vier uur in de Aula
Alice Mboganie Mwangi
Nutritional, hygienic and socio-economic dimensions of street foods in urban areas: the case of Nairobi. Thesis Wageningen University - With references and summary in Dutch and Swahili.
Subject headings: Street foods, urban areas, nutrient adequacy, hygiene knowledge, livelihood
ISBN 90-5808-582-1
©2002 Alice Mboganie Mwangi.
To my husband Ken and beloved sons Ben, Lemy and Robby, who were a source
of encouragement. - And to all street food vendors and consumers.

A B S T R A C T
N U T R I T I O N A L , H Y G I E N I C A N D S O C I O - E C O N O M I C D I M E N S I O N S O F S T R E E T
F O O D S I N U R B A N A R E A S : THE CASE OF NAIROBI.
Ph.D. thesis by Alice Mboganie Mwangi, Division of Human Nutrition and Epidemiology, Wageningen University, The Netherlands, March 05, 2002.
Exceptionally high rates of urbanisation in developing countries have been coupled with lack of employment and increasing urban poverty and undernutrition. Urban populations are thus utilising a variety of initiatives to enable them to survive. Street food vending is one such initiative. It is believed to have a double function in that it addresses the two increasing problems of urban poverty and undernutrition in developing countries. In Kenya, little information is available about street fo^d vending. The sector is not officially permitted and vendors are often harassed. This study describes the scope of street food vending and buying in Nairobi and quality of street foods in terms of! food group variety and energy and nutrient provision. It also assesses basic food hygiene knowledge and practice of vendors as well as the extent to which street foods are a source of livplihood for vending households.
We found that street food vending in Nairobi is wide spread especially among the urban poor. Its growth reflects trends in economic and urban population growth. Although the sector offers products from all food groups, most vendors are one-food group sellers with cereals as the prominent group. In addition, major meal servings especially in working areas are able to provide mttire than adequate protein and iron, but their ability to provide adequate energy is limited. Meals are also poor in Vitamin A. However, where there is an income, particularly female veftdors are able to sell foods of better nutritional quality than their male counterparts. Knowledge of general aspects of basic hygiene is well established while knowledge of specific issues is less spread among vendors. Nevertheless, vendors do not translate basic hygiene knowledge into safe food practices. Majority of vendors earns above the official minimum wage for Nairobi. For half of the vending households, street food vending is the main income provider. Subh households are associated with the lowest socio-economic index and vendors as household he&ds. The vast majority of vending households feeds from the street food pot on a daily basis and obtains substantial amounts of the daily energy requirement.
Therefore, street food vending (and consumption) is growing with increasing urban population. The foods, however, need improvement in terms of variety and nutrient harmonisation. Vendors are not completely ignorant of basic food hygiene practices but consumers probably do not demand safe food. Poverty and insecurity may also contribute to lack of Investment of vendors into safe practices while absence of sanitation amenities at the vending sit^s makes it impossible to practice. Vending of street foods is a livelihood strategy for most veiiding households, hence banning it would strip them of a means of survival. What is needed is to (officially recognise the sector, reconstruct and organise it with provision of sanitation amenities and put in place vendor training and consumer sensitisation programmes to ensure food safety and nutritional quality.

C O N T E N T S
N U T R I T I O N A L , H Y G I E N I C A N D S O C I O - E C O N O M I C D I M E N S I O N S O F S T R E E T
F O O D S I N U R B A N A R E A S : THE CASE OF NAIROBI.
Chapter 1 General Introduction 11
cLapter 2 The ecology of street foods in Nairobi 27
cjiapter 3 Do street food vendors sell a sufficient variety of foods for a 47 healthy diet? The case of Nairobi.
Chapter 4 Street foods in Nairobi: A matter of quantity or quality? 63
Chapter 5 Basic hygiene knowledge and practice of street food vendors: 79 The case of Nairobi
ciiapter6 Street foods as a source of livelihood for vending households: 95 Income, food and links with socio-economic aspects in Nairobi.
Chapter 7 General Discussion 115
Siimmary 125
Ssmenvatting (Summary in Dutch) 129
Muhtasari (Summary in S wahili) 133
Acknowledgements 137
About the author 141

GENERAL INTRODUCTION
C h a p t e r 1
I N T R O D U C T I O N
The issue of urban food supply in developing countries is of growing concern especially due to unprecedented high rates of urbanisation in the recent decades. Urban population shares in low-and middle-income countries increased from 24% in 1965 (von Braun et al, 1993) to 40% in 1997 (World Bank, 1999) and is expected to be more than 50% by 2030 (UN, 2001). Countries in sub-Saharan Africa had the highest and increasing urban population growth rates reaching a share of 38% in 1999 (UNICEF, 2000). Rapid urbanisation has been coupled with declining economies and lack of employment. Recent reviews imply increasing urban poverty and undernutrition with increasing urban population in developing countries (Haddad et al, 1999; Menon et al, 2000; Amis, 2001).
Rapid urbanisation creates new and hasty demands for food in the urban areas (Pearce, 1991) and poses new challenges to food security for urban households and food and nutrition policies. As the urban population grows at high rates, food marketing facilities and channels must also grow fast (FAO, 1985). For many developing countries this is beyond financial resources, civic institutions are not strong enough to deal with it and the political will is often absent. In addition, increasing urban poverty creates the need for sources of cheap, accessible, safe and nutritious food in urban areas. The poor urban populations need adequate food at prices they can afford. At the same time, agricultural food production should not be discouraged by low food prices (Pearce, 1991). It is therefore important to consider ways in food markets that channel resources more effectively to the most deprived sections of the urban community.
The urban poor have been reported to utilise a variety of coping initiatives to enable them to survive, improve their welfare, and most of all, to obtain food (Verbeek, 1975; Undugu Society, undated; Bibagambah, 1992; Drakakis-Smith, 1992; Gefu, 1992; Holm, 1992; Mozi et al, 1992). Most of these strategies fall under what has been categorised as the informal sector of the economy, whose growth has been corresponding to the lack of growth in employment opportunities (Pearce et al, 1988). One such strategy is the vending of street foods, on which this thesis focuses.
U r b a n i s a t i o n a n d S t r e e t F o o d C o n s u m p t i o n
In urban areas, people loose, as far as the food system at household level is concerned, essential functions, particularly most of their food production, gathering, preservation and storage. Urbanisation is characterised with considerable distances between home and work place, tight time schedules, long working hours, small housing conditions not conducive for cooking and lack of knowledge of cooking by migrants without family (Arambulo et al, 1994). In response, people tend to take on food consumption outside the household and buy ready-to-eat foods into the homes.
Urbanisation directs more food production to the urban market and this leads to greater availability of diverse types of foods. If these foods are sold at accessible prices the
12
G e n e r a l I n t r o d u c t i o n
heterogeneity of food consumption by urban dwellers can improve and maintain the quality of the urban diet. This is because the quality of diet not only depends on the sanitary state of the urban environment but also basically on the purchasing power of the consumer (den Hartog et al, 1995).
Income levels are a major determinant of the degree of an urban population's access to food and of the nature of their choice of foods (Gopalan, 1994). Low income forces people to buy small amounts of food, often on a daily basis, which are more expensive than larger amounts. Furthermore, low-income people in urban areas live in spontaneous settlements or shantytowns generally situated far from central markets where cheaper foods and other commodities can be bought. Because of the public transport involved, these markets are less accessible to them. In addition, fuel for cooking is a relatively high burden for low-income households (Brouwer et al, 1996) and cheap ready-to-eat foods become handy. Ready-to-eat ifoods sold in licensed establishments are expensive and out of the reach of the urban poor.
There are indications in the literature that street foods are of great importance for the jurban diet and that many low-income families would be worse off if there were no street food ivendors to serve fast and relatively inexpensive foods (FAO, 1987, 1989, 1990, 1991; Pearce, 1991; Streetfood Project, 1992a). Further indications are that street foods are of importance in ichildren's diets (FAO, 1991, 1992: Chauliac and Gerbouin-Rerolle, 1994). Of the number of meals consumed by children in Cotonou, Bénin, 46% are street foods (van Loon and Ottens, 1996). In Bogor, Indonesia, it was shown that street foods contributed about 30% of energy, 50% of protein, 59% of iron and 2-10% of vitamin A and C for babies (Streetfood Project, 1992b). They have been reported to provide substantial energy and protein in the diets of different urban population groups (Webb and Hyatt, 1988; Streetfood Project, 1989; Oguntona land Kanye, 1995; Sujatha et al, 1997; Ag Bendech et al, 1998; Korir et al, 1998; Oguntona land Telia, 1999). Available literature also suggests them as cheap and tasty (Chakravarty and iCanet, 1996; Winarno and Allain, 1991; Tinker, 1997).
For a better understanding of the complex interaction of urban eating practices and street foods in the tropics, Bricas (1994) points out that the dynamics of styles of consumption are (activated simultaneously by three types of references, which are of a complementary nature: 1. Traditional rural background: many dishes and consumption practices in urban areas are
anchored to rural origins. However, more often, preparation of traditional foods is usually time and fuel consuming for the urbanite. Hence people will tend to buy traditional ready-to-eat foods from sources such as street food vendors.
|2. Urban socialisation: in the urban areas new products, dishes and practices arise, fitted to the urban way of life in terms of school, work and other types of income-generating activities and leisure. Hence influences outside the home, at places of work and other places of outside activities play an important role in street food consumption.
3. Individualism: the city allows people to evade the constraints of family meals. Individual
13
C h a p t e r 1
food choices can be made due to the freedom offered by the urban framework Nevertheless, one reference that Bricas does not mention is purchasing power, which might be fundamental to the three references above.
N u t r i t i o n a l Q u a l i t y o f S t r e e t F o o d s
Street food vending has been viewed as undesirable by some governments as it is seen to portray a disorderly appearance in the cities. Yet, it is a common source of food eaten outside the home especially by the low-income population in urban areas of developing countries. The potential contribution of street foods to daily nutritional requirements, however, has not been adequately assessed. In addition, it is not clear whether individual vendors are in a position to provide adequate food variety for a healthy diet.
In Africa street foods are said to offer a wide variety of traditional dishes hardly served in western-styled restaurants and at fairly low prices (Lape, 1992). Although these dishes are thought to be highly nutritious, their nutritional quality is less documented. An attempt to document the nutritional quality of street foods in Africa was carried out in Ibadan, Nigeria, in 1986 - 1987 (FAO, 1987). Food composition analysis of street foods for some nutrients revealed that the foods were all good sources of energy and fairly good sources of protein and minerals especially when the foods were combined. Nevertheless, whether individual portions (as consumed by clients) contributed significantly to their recommended daily allowances was not clear. Only one study in Kenya documents the proximate composition of street foods and their energy and protein contribution to the nutrition of manual workers in Nairobi (Korir et al, 1998). The study, unfortunately, did not include the micronutrient quality of street foods.
S a f e t y o f S t r e e t F o o d s
The idea that street foods present a health hazard has been used widely by governments to defame street foods and remove traders from the streets (Atkinson, 1994). This is because the safety of street foods in many countries is not assured. Disadvantages of the street food industry usually listed in technical publications, for instance, are that street foods are thought to be a source of microbiological and chemical contamination and undergo unhygienic or improper food preparation and/or handling practices (Jayasuriya, 1994). However, studies in Minia -Egypt, Manikganj - Bangladesh and lloilo, Philippines, indicated that street foods are as safe as or safer than food prepared in the homes of most customers (Tinker, 1987; Tinker and Fruge, 1982; Tinker, 1997). Gopalan (1994) also reckons that street foods in urban slums of Asia are generally fresh and hot. Some authors reason that sanitary conditions in many poor urban homes (believed to be the main consumers of street foods) are little different from those of street food vendors, and neither vendors nor buyers will perceive any problems with street food hygiene (Cohen and Tinker, 1985). Lack of basic sanitation, like in the unfavourable conditions that exist in slums of cities in many developing countries, can lead to food contamination at home
14
G e n e r a l I n t r o d u c t i o n
(Mortarjerni et al, 1993). A study comparing microbiological quality of traditional street foods vrith home-prepared and tourist hotel foods revealed that although some street foods were heavily contaminated, the microbiological quality of some of the foods was comparable to those prepared at home and tourist hotels (van Kampen et al, 1998). Other studies on street foods also rjsveal that not all foods are unsafe (FAO, 1991; Nasinyama, 1992; Streetfood Project, 1992a). Iji addition, there appears to exist no convincing evidence that street foods are more implicated ui the transmission of infection and intoxication than foods obtained elsewhere (Abdussalam and Kaferstein, 1993). However, there is generally incomplete notification of foodborne iiifections in developing countries. Nevertheless, if a community is to have full benefits of the street-vended foods, they should have minimal risk of foodborne disease. Hence intervention is required to ensure that the standard of safety for such food is the best attainable in the context of the prevailing local situation (WHO, 1996). In fact, it has been shown that with some inexpensive adjustment of the processes involved in the preparation of some heavily contaminated street foods, significant improvement in the microbioligical load can be achieved (^treetfoods Project, 1992a).
It is reported that although street food vendors can cook well, they lack the training in public catering, are unaware of the level of hygiene required and have poor hygienic habits apd/or health (Lape, 1992). Although literature suggests that vendors are completely unaware of hygienic practices, vendor hygiene knowledge has not been adequately assessed. There is evidence of increasing involvement of educated street food vendors implying that they may not be totally ignorant of basic food hygiene (Dawson et al, 1996). Hence the question arises whether vendors transform the basic hygiene knowledge they have into practice.
S o c i o - e c o n o m i c R o l e o f S t r e e t F o o d V e n d i n g
Street food vending has been reported to be one of the important urban activities in the informal sector of many developing countries (Bricas, 1994: FAO, 1990, 1991, 1992; Nago et al, 1990) and appears to be an important category of economic street activities. A study in 1988 in West Java, Indonesia, indicated that sale of prepared foods made up to 44% - 78% of the economic street activities (Streetfood Project, 1989). Another study in Bogor, (Streetfood Project, 1992a) showed that this proportion was 39% - 84%, depending on whether the vending sites were strategic locations, residential areas or ambulatory units. Vending of street foods in developing countries is said to be expanding with the growth of urban population (FAO, 1990,1991,1992). Consumers of goods and services from this economy have probably also increased due to relatively low prices and decreased purchasing power of many people. According to Tinker (1987), far from disappearing as cities grow and become more modern, the number of street f o o d vendors increases as city size increases.
Street food vending is said to supply a large number of people with relatively inexpensive food. It is thought that vendors can buy the raw food and the cooking fuel in bulk
15
C h a p t e r 1
at low prices (wholesale prices), thus minimising the cost of cooked food, and be able to sell it at relatively low prices due to economies of scale (Pearce et al, 1988). This makes such food accessible to the urban poor who probably earn only for the days' living. Their income pattern is such that wages are earned and spent daily, which often compels them to buy their food in small quantities from the neighbourhood rather than central markets which although inexpensive, are not so convenient. (Pearce et al, 1988). In addition, their social support networks are less developed and homeless families and children present a special challenge (Garret and Haddad, 1995).
In Africa, revenue from street foods is thought to serve mainly as a complement to household income. Women tend to use it for direct family improvement, supplementing family income to meet basic needs of the household or for re-investment in their businesses (Lape, 1992). However, there is hardly any data on the socio-economic role of street foods for vending households in Africa.
T h e F o o d a n d N u t r i t i o n S i t u a t i o n i n U r b a n K e n y a
Like many other sub-Sahara African countries, Kenya has experienced high rates of urbanisation in the recent decades in the midst of declining economic growth and high fluctuations in inflation rates. Kenya's urban population share increased from 7.4% in 1960 to 24% in 1990 (CBS, 1992,1993,1994,1995; Courier, 1996). The 1999 census showed that the total urban population share had increased to 34.5% with Nairobi holding 22% of the urban population (CBS, 2000).
Economic growth rate fell from 5% in 1989 to a mere 0.2% in 1993 (CBS, 1992,1994). It improved to 4.4% in 1995 but steadily decreased to -0.3% in 2000 (World Bank, 2001). In addition, there has been lack of growth in employment opportunities in the face of rapid labour force growth. Towards the end of the 1990s, Kenya experienced redundancies in industry and retrenchment in the public sector. Hence unemployment has gone up in the urban areas and real wages have gone down. Absolute poverty1 in Kenya grew by more than double between 1994 (22%) and 1997 (50%) and is presently estimated to be 52%. Urban absolute poverty (49%) is almost equal to the national poverty level while urban food poverty2 is estimated to be 38% (Kenya, 2000; 2001). These trends have been accompanied with a corresponding growth of the informal sector of the economy in the country, especially in the urban areas, as a response of people striving to meet their basic needs.
One particular characteristic that has an impact on the health and nutrition of people in the urban environment is the ability to obtain an adequate monetary income. A survey by the
1 The absolute poverty line is the minimum amount of money necessary to afford an adult equivalent their basic minimum food and non-food requirements.
The food poverty line is the amount of expenditure that would, on average, meet the recommended daily (Note continues next page)
16
-General Introduction
ienya Consumer Organization (KCO) in 1992 found that the rate of growth of income for the ban poor in Nairobi had been lower than the rate at which prices of basic commodities had
increased between 1987 - 1991 (KCO, 1992). This, of course, has detrimental implications on household health, food accessibility and the nutritional status of the urban poor. It means that for fjie poor population, the ability to pay for food and health services is severely limited and unless tjiey can generate adequate funds, their dietary intake is limited not only in quantity but also in ^ariety. Alternative sources of cheap foods, such as street foods, could possibly be very important for the urban poor in Kenya.
Chronic under-consumption of energy and protein is the most common and most devastating form of malnutrition among low-income urban populations in Kenya (CBS, 1992, 1995; Kenya 1994; Kenya 1998; Kenya/UNICEF, 1998; Kenya/UNDP, 1999). Studies on urban nutrition in Kenya indicate malnutrition levels among the urban poor that match or are even higher than the national rural averages. A Nairobi survey covering nine settlements of low socio-economic status revealed a wasting level of 3% - 13% and a stunting level of 10%-57% among the samples of children below five years of age (Kenya/UNICEF, 1992). The extent to which micronutrient deficiencies affect the population in urban Kenya is not clearly known. Data from localised surveys suggest that at least one-third of all Kenyan children, and probably a! bigger proportion of adult women, may be anaemic most being due to iron deficiency (WHO/FAO, 1992). Vitamin A deficiency prevalence, incidence and geographical distribution a e essentially unknown but deficiency is thought to be of public health importance (Kenya, 1994; Kenya/UNICEF, 1998). Available data from scattered surveys show that adequate levels qf vitamin A intake range from as low as 5% in Eastern Province to less than 60% in Central Province while other studies report that the problem is not prevalent in Kenya (WHO/FAO, 1992). Iodine deficiency is no longer a problem as it is a government requirement that all salt in the country be iodised. By 1996 iodised salt was reported to be used in more than 90% of households in Kenya (UNICEF, 1997). As a matter of fact, the role of street foods in the provision of energy and the above mentioned nutrients (which are important as far as the Kenyan food and nutrition policy is concerned) for urban populations is not known.
Street Foods in Nairobi Recording to Drakakis-Smith (1992), the principal components in any urban food supply system for the poor are three: urban food subsistence, the petty commodity retail sector and the fully commercialised retail sector. With rapid urban development in Nairobi, the amount of land available for subsistence food production keeps reducing and poor people are pushed into commercial food marketing systems. In addition, food gifts are no longer popular in the urban setting and social support networks are less developed. As such, it is no surprise that many low-
e&ergy allowance for an adult equivalent.
17
C h a p t e r 1
income people in Nairobi try different ways of supplementing their food supply. A study in 1995 (Mwangi, 1995; Mwangi and Foeken, 1996) revealed that low-income households in Nairobi were unable to adequately feed themselves on their earnings and many tried to supplement their food supply by growing subsistence food. However, for many households, this option was out of reach because of the lack of access to urban land.
In the petty commodity retail sector, street food vending appears to play an important role in the Nairobi urban food supply system especially for the low-income earners. The phenomenon of street food vending in Kenya became more noticeable during the 1990s. From personal observation, there have been indications of an expanding supply of street foods in Nairobi, which may imply an equally growing demand. This is expected given the recent trends in the economy of the country. The study by Mwangi (1995) also revealed that part of the food harvested by urban farmers was sold out, presumably in the form of street foods. Maize and beans were occasionally harvested prematurely (to avoid theft), boiled and then sold. The mode of sale was, however, not investigated.
S t u d y R a t i o n a l e
There is increased stress by international agencies to give more attention to urbanisation and problems related to food security of the urban poor. Street food vending in urban areas is a world-wide phenomenon and has been incorporated in the agenda of international organisations, particularly the FAO and the WHO. Most studies on street foods have focused on their microbiological quality, energy and protein contribution to daily intake by consumers and the level of income obtained from vending. Despite this, information on the nutritional dimensions, hygiene knowledge and practices of vendors and the role of street foods as a source of livelihood for vending households remain scanty. Given the fact that the street foods sector may be an important source of nutrition for low-income urban populations and employment in the midst of lack of formal employment opportunities, more insight is needed to underscore its benefits for official recognition. In spite of the obvious presence of street food vending in Kenyan cities no information is available about its scope and its nutritional, hygienic and socioeconomic dimensions. Only one study (Korir et al., 1998) has assessed the proximate composition of street foods served to low manual workers in Nairobi. In addition to being less studied and documented, the phenomenon is less officially recognised and controlled.
In view of these gaps, a project on street foods in Nairobi was initiated. Because of the complex nature of street foods and of carrying out research in the urban environment, the project consisted of two Ph.D studies. The present study focuses on the socio-economic, nutritional and hygienic dimensions of street food vending. The other study by van't Riet (2002) pays attention to the relevance of street foods in the diet of low-income urban residents. The two studies are complementary to one another in that the present study centres on vendors and the foods while van't Riet's study concentrates on the consumers of street foods. Both studies were
18
G e n e r a l I n t r o d u c t i o n
undertaken at the Division of Human Nutrition and Epidemiology of Wageningen University, in c|lose collaboration with the Unit of Applied Human Nutrition of the University of Nairobi and tjie African Studies Centre, Leiden. The results can be of use for planning and implementation of health and nutrition intervention. They give insight to the policy makers of Kenya and other East African countries on the significance of street foods for the urban poor.
We defined street foods as "ready-to-eat foods and beverages, processed or fresh, which are sold at stationary locations or by mobile vendors in streets and open places, as opposed to scores and licensed establishments". They include foods like fruit bought and consumed in the street and ready-to-eat foods bought in the street but eaten at home. Excluded are foods sold in restaurants and similar places.
O b j e c t i v e s
Tjhe overall aim of this study is to get insight in the nutritional, hygienic and socio-economic dimensions of street foods in Nairobi as a prerequisite to providing nutritious and hygienically s fe food for consumers, while sustaining their socio-economic role for urban populations. The objectives are to: 1. Assess the scope of the street food phenomenon in Nairobi, both in the past and present,
with the aim of estabhshing circumstances surrounding its practice and its function in urban food supply.
2. Determine whether street food vendors provide sufficient food group varieties for a healthy diet, with special reference to Nairobi.
3. Assess the nutritional quality of street foods with special reference to Nairobi and the nutrition situation in Kenya.
4. Assess street food vendor's general knowledge of basic food hygiene and how it relates to practice.
5j. Determine the extent to which street foods are a source of livelihood for vending households, and its links with socio-economic aspects of the households, in different areas of Nairobi.
M e t h o d o l o g i c a l D e s i g n
The study was based on interviews by means of a key informant guide and structured questionnaires, as well as on observation of the research population. The field work for this shidy was carried out in several phases between October 1997 and April 1999. First, a key informant guide was used to establish the genesis of and subsequent trends in street food vending in Nairobi in October 1997. This was followed by a phase of vendor mapping to determine the extent of street food vending in the city. The vendor mapping involved exploration of different districts of the city at different hours of the day. It was established from the vendor mapping that street food vendors frequented very-low income areas (slums), low-
19
C h a p t e r 1
middle income settlements and working areas especially those frequented by low-income workers. Three study areas were selected representing each of the areas frequented by street food vendors. Cross-section surveys were conducted among street food vendors in the selected areas, in three phases, to address objectives 2-5 above.
S t u d y A r e a
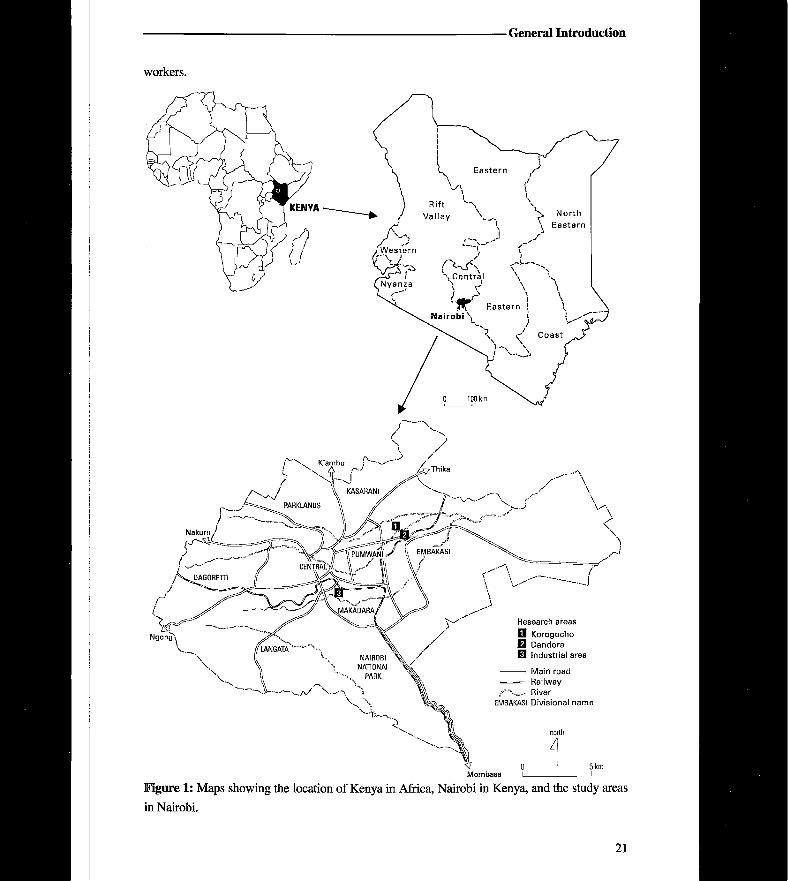
The study was carried out in Korogocho slum settlement, Dandora residential area and the Industrial Area of Nairobi, the capital city of Kenya (Figure 1). Nairobi was founded in the late 1890s. At present, Nairobi covers an area of 680 Km2 at an average altitude of 1675m (5495 ft) above sea level. Its population has increased tremendously since Kenya became independent in 1963. Nairobi is considered to be one of the largest and fastest growing cities in Africa. The city population in millions was estimated at about 0.27 in 1962, 0.5 in 1969, 1.3 in 1989 (Obudho, 1997; Maxon, 2001) and 2.1 in 1999 (CBS, 2000). Nairobi's residential areas still reflect the cities colonial past when residence was determined largely by race and income. Racial barriers disappeared after Kenya became independent in 1963, but the city's residential pattern continues to be determined by income (Maxon, 2001). Generally, the wealthier residents live in neighbourhoods to the west of the city centre, while the least wealthy residents live in the east. Rapid growth of Nairobi has been associated with increasing urban poverty and the proliferation of slums and squatter settlements adjacent to some of the residential and industrial areas (Obudho, 1997).
Korogocho is a sub-location about 8 Km to the Northeast of the city centre. It is mainly a slum settlement made of 8 villages and was estimated have a population of more than 60,000 in 1995 (Atema and Panayiotopoulos, 1995). Most of the residents were settled here from various locations in Nairobi, where they lived as squatters. They were required to build temporary structures because they were basically still considered as squatters (UNICEF/ODA, 1994). Many of those who were settled in the area have with time put up temporary rental structures, mostly single rooms with an average area of 6 m2. The slum has planned earthen roads with numerous footpaths. Rated according to household income, Korogocho is one of the very-low-income districts in Nairobi (World Bank, 1995).
Dandora is a planned residential area built in four phases for low-income people. It is also located to the Northeast of the city centre and is separated from Korogocho by the Nairobi River and a big dumpsite. Due to increasing costs of living, it has become residence for mainly low-middle income people. Several squatter settlements have sprung up in the open spaces around the estate. Construction of illegal buildings, mainly single rooms, by landlords has also encroached in the estate.
The Industrial Area of Nairobi is designated as a general business area. It covers an area of 8 Km2, with residence estimated at more than 21,000 in 1989 (Kenya, 1989). The residential areas around the Industrial Area are mainly slum settlements occupied by low-income factory
20
G e n e r a l I n t r o d u c t i o n
Corkers.
Mombasa I 1
F i g u r e 1: Maps showing the location of Kenya in Africa, Nairobi in Kenya, and the study areas in Nairobi.
21
Chapter 1
Outline of the Thesis.
In Chapter 2, the scope of the street food phenomenon in Nairobi, both in the past and at
present, is described. Chapter 3 describes the different food group varieties sold by individual
vendors with regards to provision of a healthy diet. In Chapter 4, the nutritional quality of street
foods in Nairobi is described in the light of recognised nutrition deficiencies in Kenya. Chapter
5 presents street food vendor's knowledge of basic food hygiene in Nairobi and its relation to
hygienic food practices. Chapter 6 describes street foods as a source of livelihood for vending
households. Finally, in Chapter 7, the different methods used in the studies are discussed, the
main findings are summarised and the implications of the main findings for urban policy are
presented.
REFERENCES Abdussalam M, Kaferstein FK (1993). Safety of street foods. World Health Forum, 14:191-194.
Ag Bendech M, Chauliac M, Malvy DJM (1998). Assessment of dietary intake at home and outside the
home in Bamako (Mali). Ecology of Food and Nutrition, 37: 135-162.
Amis P (2001). Attacking poverty: But what happened to urban poverty and development? Journal of International Development, 13: 353-360.
Arambulo m P, Almeida CR, Juan Cuellar S, Belotto AJ (1994). Street food vending in Latin America.
Bulletin ofPAHO, 28(4): 344-354.
Atema J, Panayiotopoulos P (1995). Promoting urban informal enterprises: A case study of the Action Aid Kenya Kariobangi Savings and Credit Programme. Papers in International Development
Nol5. University of Wales, Centre for Development Studies, Swansea.
Atkinson SJ (1994). Food security and poor urban populations. In Biswas MR, Gabr M (eds.), Nutrition in the nineties: Policy issues. Oxford University Press, Delhi, p. 55-81.
Bibagambah JR (1992). Macro-level constraints and the growth of the informal sector in Uganda. In
Baker J, Pedersen PO (eds.), The rural-urban interface in Africa: Expansion and adaptation. The Scandinavian Institute of African Studies Centre for Development Research, Copenhagen.
Seminar Proceedings 27:303-313.
Bricas N (1994). Street food and trends in urban eating patterns. Children in the Tropics, 213: 36-39
Brouwer ID, den Hartog AP, Kamwendo MOK, Heldens MWO (1996). Wood quality and wood
preferences in relation to food preparation and diet composition in central Malawi. Ecology of Food and Nutrition, 35:1-13.
CBS, Central Bureau of Statistics (1992; 1993; 1994; 1995). Economic Survey 1992-1995. Ministry of
Planning and National Development, Nairobi.
CBS, Central Bureau of Statistics (2000). Kenya population census 1999. Ministry of Planning and
National Development, Nairobi.
Chakravarty I, Canet C (1996). Street foods in Calcutta. Food, Nutrition and Agriculture, 17/18: 30-37.
Chauliac M, Gerbouin-Rerolle P (1994). Street food: a comprehensive approach. Children in the
Tropics, 213: 5-20
22
• G e n e r a l I n t r o d u c t i o n
23
(hohen M, Tinker I (1985). Street foods: Opportunities for female employment in the food system.
In Bisilliat J, Courade G, Diallo-Leguen Y, Morel A (eds.). Femmes et politiques alimentaires. Actes du Séminaire International ORSTOM-CIE, Collection Cooloques et Séminaires, Paris.
p.534-547.
Courier, The (1996). Kenya, beating poverty with growth. Country report, 157: 19-36.
IDawson R, Liamrangsi S, Boccas F (1996). Bangkok's street food project. Food, Nutrition and Agriculture, 17/18: 38^16.
cen Hartog AP, van Staveren WA, Brouwer ID (1995). Manual for social surveys on food habits and consumption in developing countries. Margraf Verlag, Weikersheim.
Drakakis-Smith D (1992). Strategies for meeting basic food needs in Harare. In Baker J, Pedersen PO
(eds.), The rural-urban interface in Africa: Expansion and adaptation. The Scandinavian
Institute of African Studies Centre for Development Research, Copenhagen. Seminar
Proceedings 27: 258-283.
FAO (1985). The state of food and agriculture 1984. World Review: the ten years since the World Food
Conference. Urbanisation, Agriculture and Food Systems. Agriculture Series, 10:102-105.
FAO (1987). Study on street foods in Ibadan, Nigeria. Characteristics of food vendors and consumers -implications for safety and quality. FAO, Rome and Department of Human Nutrition, University of badan, Nigeria.
FAO (1989). Urbanization, food consumption patterns and nutrition. Committee on Agriculture. 10*
Session, 26 April-5 May 1989, FAO, Rome.
FAO (1990). Street foods. Report of an FAO Expert Consultation Jogjakarta, Indonesia, 5-9 December
1988. FAO Food and Nutrition Paper, 46. IfAO (1991). Study on street foods in Nigeria. Comparative study of the socio-economic characteristics
of food vendors and consumers in Ibadan, Lagos and Kaduna, Nigeria. FAO, Rome and Food
Basket Foundation International, Ibadan.
FAO (1992). Intercountry workshop on street foods in Africa. FAO, Regional Office for Africa, Accra.
Garret JL, Haddad L (1995). Food, nutrition and agricultural implications of urbanization: a proposed multi-country research programme. JFPRI, Washington, D.C.
Gefu JO (1992). Part-time farming as an urban survival strategy: A Nigerian case study. In Baker J,
Pedersen PO (eds.), The rural-urban interface in Africa: Expansion and adaptation. The
Scandinavian Institute of African Studies Centre for Development Research, Copenhagen.
Seminar Proceedings 27:295-302.
(popalan C (1994). Trends in food consumption patterns: Impact of developmental transition. In Biswas
MR, Gabr M (eds.), Nutrition in the nineties: Policy issues. Oxford University Press, Delhi, p.
34-54.
I^addad L, Ruel MT, Garrett JL (1999). Are urban poverty and undernutrition growing? Some newly
assembled evidence. World Development. 27(11): 1891-1904.
Holm M (1992). Survival strategies of migrants to Makambako - an intermediate town in Tanzania. In
Baker J, Pedersen PO (eds.), The rural-urban interface in Africa: Expansion and adaptation. The Scandinavian Institute of African Studies Centre for Development Research, Copenhagen.
Seminar Proceedings 27: 238-247.
Chapter 1
Jayasuriya DC (1994). Street food vending in Asia: some policy and legal aspects. Food Control, 5:
222-226.
KCO, Kenya Consumer Organization (1992). Basic needs survey of the urban poor: base-line survey of Nairobi. KCO, Nairobi.
Kenya, Government of (1989). Government of Kenya Development Plan 1989-1993. Ministry of
Planning and National Development (MPND), Nairobi.
Kenya, Government of (1998). Poverty in Kenya. Vol. U: Poverty and Social Indicators. Ministry of
Planning and National Development (MPND), Central Bureau of Statistics (CBS), Human
Resources and Social Services, Nairobi.
Kenya, Government of (2000). Second report on poverty in Kenya, Volume 3: Welfare Indicators Adas.
Ministry of Finance and Planning (MFP), Nairobi.
Kenya, Government of (2001). Poverty reduction strategy paper for the period 2001-2004 prepared by the people and government of Kenya, Volume 1. Ministry of Finance and Planning (MFP),
Nairobi.
Kenya, Government of/UNDP (1999). Kenya Human Development Report, Vol. II: Poverty and Social
Indicators. United Nations, Nairobi.
Kenya, Government ofTUNICEF (1992): Children and women in Kenya: A situation analysis. Government of Kenya/UNICEF, Nairobi.
Kenya, Government of/UNICEF (1998). Situation analysis of women and children in Kenya. UN,
Nairobi
Kenya, Republic of (1994). National plan of action for Nutrition. Ministry of Planning and National
Development, Nairobi.
Korir SCR, Imungi JK and Muroki NM (1998). Proximate chemical composition of street foods and
their energy and protein contribution to the nutrition of manual workers in Nairobi. Ecology of Food and Nutrition 37:123-133.
Lape MI (1992). Street foods in Cameroon. Unpublished paper prepared for FAO Intercountry
Workshop on street Foods in Africa, held in Accra, Ghana.
Maxon RM (2001). Nairobi: Population and culture. In Microsoft Encarta Online Encyclopedia 2001. Microsoft Corporation.
http://encam.msn.comfmd/prmt.asp?&pg=8&ti=^6310000&sc^&pt==l
Menon P, Ruel MT, Morris SS (2000). Socio-economic differentials in cliild stunting are consistently
larger in urban than in rural areas. Food and Nutrition Bulletin, 21(3): 282-289.
Mozi MRS, Lupanga U, Mvena ZSK (1992). Urban agriculture as a survival strategy in Tanzania. In
Baker J, Pedersen PO (eds.), The rural-urban interface in Africa: Expansion and adaptation. The Scandinavian Institute of African Studies Centre for Development Research, Copenhagen.
Seminar Proceedings 27: 284-294.
Mortarjemi Y, Kaferstein F, Moy G, Quevedo F (1993). Contaminated weaning food: a major risk factor
for diarrhoea and associated malnutrition. Bulletin of the World Health Organization, 71(1): 79-
92.
Mwangi AM (1995). The role of urban agriculture for food security in low income areas in Nairobi. Food and Nutrition Studies Programme Report No. 54. Ministry of Planning and National
24
G e n e r a l I n t r o d u c t i o n
J Development, Nairobi/African Studies Centre, Leiden.
Mwangi AM, Foeken DWJ (1996). Urban agriculture, food security and nutrition in low-income areas
of the city of Nairobi, Kenya. African Urban Quarterly. Special issue: Urban Agriculture in Africa 11(2,3): 170-180.
^ago CM, Devatour H, Muchnik J (1990). Technical resources of food processing micro-enterprises in
Bénin. Agritrop 14(3): 7-11 Sfasinyama GW (1992). Study on street foods in Kampala - Uganda. Unpublished paper prepared for
FAO. Makerere University, Kampala. Obudho RA (1997). Nairobi: National capital and regional hub. In Rakodi C (ed.), The urban challenge
in Africa: Growth and management of its large cities. United Nations University Press, Tokyo.
Oguntona CRB, Kanye O (1995). Contribution of street foods to nutrient intakes by Nigerian
adolescents. Nutrition and Health, 10: 165-171.
Pguntona CRP, Telia TO (1999). Street foods and dietary intakes of Nigerian urban market women.
International Journal of Food Sciences and Nutrition, 50: 383-390.
Pearce R (1991). Urban food subsidies in the context of adjustment. The case of Zambia. Food Policy, 16(6): 436^50
Pearce TO, Kujore OO, Agboh-Bankole VA (1988). Generating an income in the urban environment:
the experience of street food vendors in fle-Ife, Nigeria. Africa, 58 (4): 385-400.
Streetfood Project (1989). Street foods in West Java. Abase line survey. Working paper No. 1. Bogor
Agricultural University (IPB), Netherlands Organisation for Applied Scientific Research
(TNO), Amsterdam Free University (VU). VU, Amsterdam.
Streetfood Project (1992a). Production and distribution of street foods: a socio-economic survey in Bogor, West Java. Working paper No. 5. Ministry of Research and Technology - Indonesian
Agency for the assessment and Application of Technology (BPPT), Netherlands Directorate
General of International Cooperation (DGIS), Netherlands Organisation for Applied Scientific
Research (TNO), Bogor Agricultural University (IPB) and Amsterdam Free University (VU).
VU, Amsterdam.
Streetfood Project (1992b). The role of street foods in household food consumption: A survey in Bogor, West Java. Working paper No. 6. Ministry of Research and Technology - Indonesian Agency
for the assessment and Application of Technology (BPPT), Netherlands Directorate General of
International Cooperation (DGIS), Netherlands Organisation for Applied Scientific Research
(TNO), Bogor Agricultural University (IPB) and Amsterdam Free University (VU). VU,
Amsterdam.
^ujatha T, Shatrugna V, Rao NGV, Reddy CKG, Padmavathi KS, Vidyasagar P (1997). Street food: An
important source of energy for the urban worker. Food and Nutrition Bulletin, 18(4): 318-322.
Tinker I (1987). The case for legalizing street foods. Ceres, 20(5): 26-31.
Tinker I (1997). Street foods. Urban food and employment in developing countries. Oxford University
Press, New York-
Tinker I, Fruge M, (1982). Street food project. Assignment Children. 57/58: 191-193.
Undugu Society (Undated). Despair and hope in the slums of Nairobi. Undugu Society of Kenya,
Nairobi.
25

C h a p t e r 1
UNICEF (1997). The state of the world's children 1998. UNICEF, New York.
UNICEF (2000). The state of the world's children 2001. UNICEF, New York.
UNICEF/ODA (1994). A participatory poverty assessment study-Kenya. UNICEF, Nairobi.
UN, Population Division (2001). World Urbanization Prospects: The 1999 Revision. United Nations,
New York.
van Kampen J, Gross R, Schultink W, Usfar A (1998). The microbiological quality of street foods in
Jakarta as compared to home-prepared foods and foods from tourist hotels. International Journal of Food Sciences and Nutrition, 48:17-26.
van Loon S, Ottens L (1996). The role of street foods in the daily urban diet: a pilot study in Cotonou, Bénin. Wageningen University, Department of Human Nutrition, Wageningen.
van't Riet H (2002). The role of street foods in the diet of low-income urban residents, the case of Nairobi. Ph.D Thesis, Wageningen University. Ponsen & Looijen, Wageningen.
Verbeek G (1975). Parking boys research project. Undugu Society of Kenya, Nairobi,
von Braun J, McComb J, Fred-Mensah BK, Pandya-Lorch R (1993). Urban food insecurity and malnutrition in developing countries: trends, policies and research implications. IFPRI,
Washington, DC.
Webb RE, Hyatt SA (1988). Haitian street foods and their nutritional contribution to dietary intake.
Ecology of Food and Nutrition, 21: 199-209.
WHO (1996). Essential safety requirements for street-vended foods. Food safety unit, Division of Food
and Nutrition, WHO, Geneva.
WHO/FAO (1992): Kenya country position paper on Nutrition. International Conference on Nutrition
a c N ) . Winarno FG, Allain A (1991). Street foods in developing countries: lessons from Asia. Food Nutrition
and Agriculture, 1: 11-18.
World Bank (1995). Kenya Poverty Assessment. World Bank, Population and Human Resources
Division, Eastern Africa Department, Africa Region.
World Bank (1999). World development indicators. International Bank for Reconstruction and Development, Washington, DC.
World Bank, 2001. htto:devdata.worldbankorg/query/mdex.asp?RMDK=82558&smdk=l
26
THE ECOLOGY OF STREET FOODS IN NAIROBI Alice Mboganie Mwangi, Adel P. den Hartog, Dick W.J. Foeken, Hilda van't
Robert K.N. Mwadime and Wija A. van Staveren
ecology of Food and Nutrition (2001), 40:497-523.
C h a p t e r 2
A B S T R A C T
Very little is known about street foods in sub-Sahara Africa. We investigated the scope of the street food phenomenon in Nairobi, both in the past and present, with the aim of establishing circumstances surrounding its practice and its function in urban food supply. We found that street food vending and consumption in Nairobi rapidly increased during the previous two decades, instigated by the need for affordable food among low-income urban dwellers and the need for employment. It is an expanding and thriving phenomenon especially among the urban poor and climbs up the socio-economic ladder due to increasing monetary demands. In addition to being a food supply channel for the urban poor, street food vending in Nairobi provides employment opportunities to a labour force that would otherwise be unemployed. There is need to legitimise the sector with simple regulations that make the food safe but not expensive. Key w o r d s : Street foods vending, Nairobi, Urban poor.
I N T R O D U C T I O N
Recent unprecedented high and increasing urban population growth rates in sub-Sahara Africa create new demands for food in the urban areas while posing new challenges to urban food security and nutrition policies (World Bank, 1990, 1999; Von Braun et al, 1993; Pearce, 1991). As the urban population grows at high rates, food supply facilities and channels must also grow to ensure that the population has access to adequate food (Hussan, 1990; FAO, 1985). Moreover, rapid urbanisation has been taking place amid low, stagnant or declining economies, high rates of inflation and increasing costs of living in the advent of lack or diminished growth in employment opportunities (World Bank, 1990, 1999). The result is loss of purchasing power for increasingly more people in urban areas and the need for sources of cheap, accessible and safe nutritious food.
Research suggests that street foods in developing countries play an important role in the diets of many urbanites, especially those of low income. Webb and Hyatt (1988) showed that street foods contributed a substantial proportion of energy (15%) and protein (18%) toward the recommended daily allowance for secondary school children in Haiti. Higher contributions (25% and 50% respectively) were found among adolescents attending school (Oguntona and Kanye, 1995) and urban market women in Nigeria (Oguntona and Telia, 1999). Most (91.5%) primary school children in Bamako, Mali, have also been shown to buy food from street vendors (Monnier and Chauliac, 1994). Furthermore, street foods played a considerable role in the daily diet of low-income male urban workers in Hyderadad (Sujatha, et al, 1997), urban construction workers in Nairobi (Korir, et al, 1998) and Calcutta street traders (Chakravarty and Canet, 1996).
Other reports suggest that street food vending forms an integral part of urban economies in the informal sector in many Asian, Latin American and African countries (Bricas, 1994; Jayasuriya, 1994; FAO, 1990, 1991, 1992; Tinker, 1987a). A study in West Java, Indonesia (Streetfoods Project, 1989) indicated that sale of prepared foods made up 44 -
28
E c o l o g y o f S t r e e t F o o d s
78% of the economic street activities. Although started with minimum capital and requiring little education, street food vending is said to contribute a relatively good and reliable income, well above the niinimum wage in many countries (FAO, 1997, 1990; Chauliac and Gkrbouin-ReroUe, 1994; Nasinyama, 1992; Streetfood Project, 1992; Tinker, 1987b; Winarno and Allain, 1991). Street food vending might therefore be an occupation and a source of employment for many urban dwellers as it supplements marketing facilities and channels for urban food supply.
In this paper street foods are defined as "ready-to-eat foods and beverages, processed or fresh, which are sold at stationary locations or by mobile vendors in streets and open places as opposed to stores and licensed establishments". Street foods are obviously present in many Kenyan towns but very little is known about them. Only one study (Korir, et ah, 1998) known to the authors has attempted to document the proximate chemical composition of street foods and their energy and protein contribution to the nutrition of manual workers in Nairobi. The study focused only on vendors selling foods at construction sites and did not lopk at the spread of vending in the city. Street food vending is not officially permitted in Kenya and no regulation exists in terms of safety of the foods or other matters. Few studies (if any) have examined the history of the vending practice in large cities and the metamorphosis that has occurred over time, yet this is important when considering ways of regulating street food vending. Therefore, we investigated the scope of the street food phenomenon in Nairobi, both in the past and present, with the aim of establishing circumstances surrounding its practice and its function in urban food supply. This knowledge cafl contribute to information required for the development of a suitable legislation specific to tb|s service and could be used as an example for other large cities (in the developing world) experiencing a similar phenomenon. This study is part of a wider project that addresses the socio-economic, nutritional and hygienic dimensions of street foods in Nairobi.
S T U D Y S E T T I N G , D E S I G N A N D M E T H O D S
The study was carried out in Nairobi City between October and November 1997. It had been reviewed and approved by the Research Authorising Board in the Office of the President, K^nya, in August 1997. Street foods are also found in other large and small cities in Kenya, bi|t Nairobi was selected because, being the capital city, it housed people from all ethnic groups and races in Kenya. In addition, differences in history, intensity and types of food vending in Nairobi compared to other large (metropolitan) cities such as Mombasa and Nakuru were not expected to be significant. This is not necessarily the case with smaller towns like Machakos and Kakamega. Resources, however, did not allow for comparisons.
The study consisted of three phases:
29
C h a p t e r 2
30
H i s t o r i c a l P r o f i l e o f S t r e e t F o o d V e n d i n g a n d C o n s u m p t i o n
To establish the genesis of and subsequent trends in street food vending in Nairobi, a key informant guide was administered to nine adults (four men and five women) living in the city for at least 10 years to over 30 years. They comprised four street hawkers, one village elder, one non-governmental organisation (NGO) worker, one housewife, one senior civil servant and one middle-income civil servant. This was in attempt to gather information from as varied a type of urban dweller as possible. Selection of key informants within each type of urban dwellers was spontaneous provided they met the criteria of years of stay in Nairobi, were adults and were willing to participate in the study. The principal researcher, in the company of a field assistant, visited key informants at home or at their place of work and led the discussions. Each key informant was asked to reflect back from the time s/he moved to Nairobi and only qualitatively describe observed trends in the development of the street foods phenomenon over the period of stay in Nairobi. Information collected included the origination of street food vending, trends in the kind of street foods sold and distribution over the city, place of cooking and selling, and the number and characteristics of vendors and consumers. Informants also gave their views on the importance of street foods in urban food supply. Both the principal researcher and the field assistant recorded the information by making notes during the discussions. The notes were reviewed, compared and summarised at the end of each discussion. Key informant discussions were terminated after the ninth respondent because there was already clear consistence in responses.
V e n d o r M a p p i n g
This phase was used to determine the extent of street food vending in Nairobi through identification of districts frequented by street food vendors and the kind of ready-to-eat foods and premises specific to different districts. The principal researcher and a field assistant explored two areas each from high-income, upper middle-income, lower middle-income and low-income residential areas, as well as the central business district (CBD), office areas on the outskirts of the CBD, public service vehicle stations, open markets, construction sites, and the industrial Area. School sites found within these areas were included. Each area was explored for one day at three different times: early morning (7-10 am), mid-day (12 noon-2 pm) and evening (4-7 pm). Information was gathered through observation and was recorded and treated as in the historical profile phase. Collected information included: the presence and density of street food vendors and other premises serving ready-to-eat foods (indicated as many, medium, few and absent) and available types of street foods (by listing and qualitatively indicating the density) at different times of the day. Informal conversations with encountered residents, NGO workers, village heads, street vendors and buyers in the area were conducted to verify the observations.
E c o l o g y o f S t r e e t F o o d s
S u r v e y P h a s e
This was a follow-up to the vendor-mapping phase. Its purpose was to identify in selected
areas some demographic characteristics of street food vendors, the operational characteristics
of their units as well as types of food products sold. Three areas, namely a very-low-income
residential (slum) area (Korogocho), a lower-middle-income residential area (Dandora) and
the general business area (Industrial Area) were selected on the basis of street food vendor
presence. Rated according to household income, Korogocho is one of the very low-income
districts in Nairobi (World Bank, 1995). Dandora is considered to be a lower-middle income
district, while the Industrial Area is the only one designated as the general business area of
Nairobi. These areas were thought to be representative since the exploration phase indicated
similarities in the type of street foods sold in corresponding income areas within the city.
With the help of field assistants, all street food vendors in the study areas were counted
against other street activities during three different times of the day, (7-10 am, 12 noon-2 pm
arjd 4-7 pm). For each time period, counting was done twice, in the first and the last hour of
thb period. With a small pre-tested questionnaire, all street food vendors were interviewed.
Vending sites were visited at least three different times (as above) to ensure that vendors who
wbrked only part of the day were included. The highest counts of vendors were 229 in
Korogocho, 153 in Dandora and 264 in the Industrial Area. However, the respondents to the
questionnaire were less: 177 in Korogocho, 150 in Dandora and 253 in the Industrial Area,
either because some vendors refused to co-operate or were unable to respond correctly. The
higher proportion of non-participation in Korogocho was because some vendors feared that
thp study would work against them since it would make public the unhygienic aspects of their
folods. Although the field assistants tried their best to explain that it was not the case, some
vendors still refused to co-operate. It was assumed that such vendors were spread over the
stjidy area and they were not different from the respondents in terms of the types of food they
sold hence their exclusion from the study was not expected to considerably affect the
outcome. Information gathered included food types in terms of items, meal type and
preparation, number of food varieties sold, vendor mobility, age of the operation, operating
days and hours, number of workers, importance of street food vending in terms of
employment and income and some demographic characteristics of the vendors.
Data were cleaned and analysed using SPSS for Windows. Frequencies were run to
determine distributions. The density of street food vending in the economic street activities
(such as vending of second-hand cloths, utensils, raw foods) was determined as the ratio of
the highest count of street food vendors to the highest total count of street activities in the
study areas. Distribution of street food vendors according to types of food vended, the
irhportance of street foods, the demographic and operating characteristics were determined
using frequencies. To compare the study locations according to these variables, the %2 as well
as 0 and Cramer's V statistics were used. Only the first 10 food products most frequently sold
31
Chapter 2
in each study area were used to determine association of specific street food products with
study locations. To assess the progress of street food vending units, the Pearson correlation
was run between age of business on the one hand and the number of street food varieties as
well as the number of people working on the business. Differences in means between study
locations were determined using the one-way analysis of variance. The level of significance
in all cases was set at p=0.05.
R E S U L T S
Trends in Street Food Vending since the 1960s It was of general agreement among the key informants living in Nairobi for at least 30 years
that in the early 1960s there were no street foods in the city. A few food kiosks and
restaurants were present in market places, bus terminuses, the Industrial Area and generally
areas where people concentrated. At the end of the 1960s roasted fresh maize, consumed only
as a snack, started appearing in some streets and bus stops, especially in the central-east parts
of the city, which were populated mainly by low-income people. It was rarely found in the
CBD. Vendors were said to be few, mostly uneducated and shabbily dressed males. There
were no female vendors at that time. The consumers were also few and mostly males of low
income. Roasting was done at the vending site. The maize was consumed either at the
vending site or while walking.
In the late 1970s and early 1980s, maize roasting became more common in Nairobi.
B y this time, it was increasingly seen in residential areas and in the CBD. A few cooked
foods, such as boiled sweet potatoes, boiled maize, githeri (dish with maize and beans as the
basic ingredients), chapati (pan-fried wheat bread), uji (cereal porridge), tea and processed
foods started appearing in the back streets and working places. The latter areas included the
Industrial Area, construction sites and sites where informal sector activities were
concentrated. During this time cooked street foods started being used as whole meals
(specifically as lunch) at working places but were not found in residential areas. It was clear
from the key informants that by the early 1980s, only roasted maize was prepared at the
vending site while the rest of the foods were brought to the site when ready-to-eat. The
number of vendors started to increase in the 1980s as the number of female vendors relative
to men was increasing. Differentiation between males and females in the type of foods sold
was seen, with females selling mainly cooked foods while males sold either roasted maize or
processed foods like bread and soda. The number of consumers was increasing, especially
casual labourers and workers in the informal sector.
During the second half of the 1980s, roasting of maize continued, processed foods
increased, fruits (previously only sold at market places) came in and the variety of cooked
foods grew. Apart from the staple foods, deep-fried fish and roasted meat came into the
picture. Cooked foods had extended to residential areas and whole meals were increasingly
32
E c o l o g y o f S t r e e t F o o d s
b^ing consumed at working places. It was indicated that cooked foods in residential areas
smarted with the frying of fish and roasting of meat in low-income residential areas, especially
iri the Eastlands. These were seen mainly late in the evenings. Later on, mandazi (a kind of
doughnut) and chapati started to be seen, mainly early in the mornings. In lower middle-
income residential areas, mostly snacks were found. More female vendors joined and started
olutnumbering the males. Differentiation between males and females in type of foods was still
c anspicuous. As females sold mainly cooked foods and deep-fried fish, males sold roasted
maize, processed foods and roasted meat. However, some females started taking up maize
roasting especially in low-income residential areas. The number of consumers seemed to be
rising. Increasingly, low-income civil and private employees started to consume street foods.
Some of the foods were taken into homes as whole or part of meals.
Between 1990 and 1993, the number of street food vendors and varieties escalated. In
addition to already existing food varieties, fried meat and fruit salads came into the picture.
There was a tremendous increase in filling meals. Street foods spilled over to some middle-
income residential areas and parts of office areas. Female vendors became the majority and
niale vendors started selling cooked foods that were previously the domain of females. The
nlimber of consumers increased. At the time of this study, the key informants thought that the
numbers of street food vendors were still increasing among sexes. Moreover, increasingly
educated vendors were involved.
D i s t r i b u t i o n o f S t r e e t F o o d s i n N a i r o b i
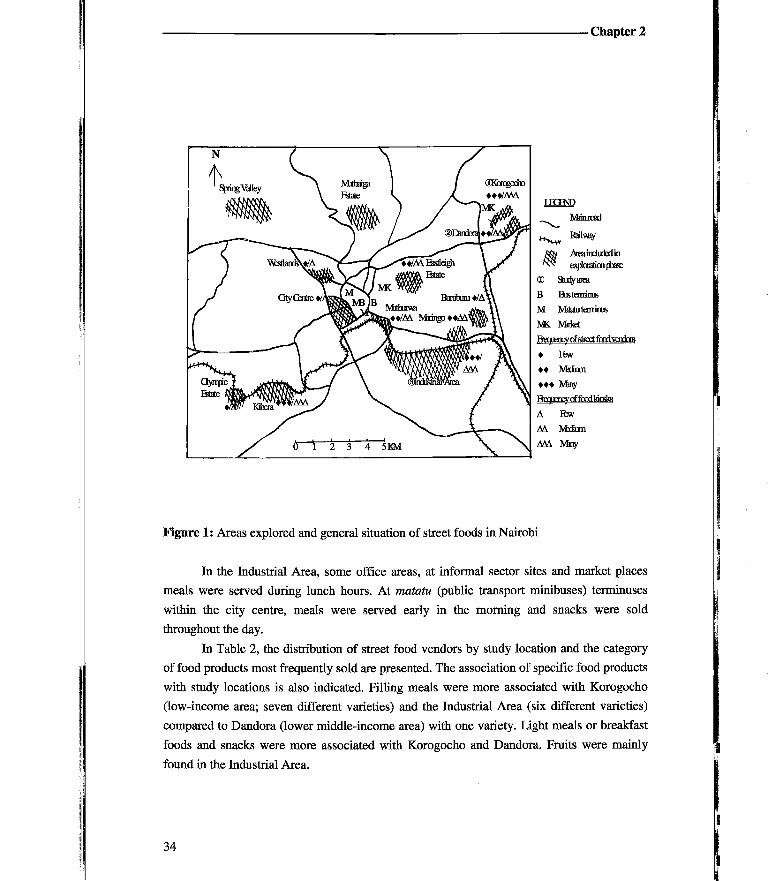
From the exploratory phase of this study it appeared that the concentration of street foods,
and to some extent also the food types, varied from one area to the other (see Table 1 and
Figure 1). In high-income residential areas, street food vending was absent except for very
rare roasting of maize at isolated bus stops. Food kiosks were also absent but restaurants and
snackbars were found at shopping centers in the residential areas. In the middle-income
residential areas, there were more street food vendors (though less in the upper-middle
income areas) more food varieties and food kiosks. The density of vending was highest in the
lpw-income residential areas. Of all the economic street activities, street foods accounted for
23% in Korogocho and 15% in Dandora residential areas. In the market areas and bus
terminuses, it accounted for 8% in Korogocho and 5% in Dandora.
The number of vendors in residential areas was highest early in the morning (before
10 am) and in the evenings (after 3 pm). In the morning, the most common foods were
nïandazi while in the evening, fried meat and fish were common. At night, vendors selling
nkainly tea, bread and mandazi were many at major bus stations and stops. There were no
vendors at secondary school gates. Processed sweet snack vendors were located at some
ppmary school gates during the mid-morning and lunch hours.
33
C h a p t e r 2
Manroad
AeaiDdufedin
eqfaatiaijiBse Stafyatea
Bustsnmus
MtatuteminiB
MC M i t e
rfstiFrtfrinrltyiTinrj
• BSV
• • Mrium
• • • Mil?'
Hprjiimryrftxidldofe
A ftw
M M*Sum
MA Mny
F i g u r e 1: Areas explored and general situation of street foods in Nairobi
In the Industrial Area, some office areas, at informal sector sites and market places
meals were served during lunch hours. At matatu (public transport minibuses) terminuses
within the city centre, meals were served early in the morning and snacks were sold
throughout the day.
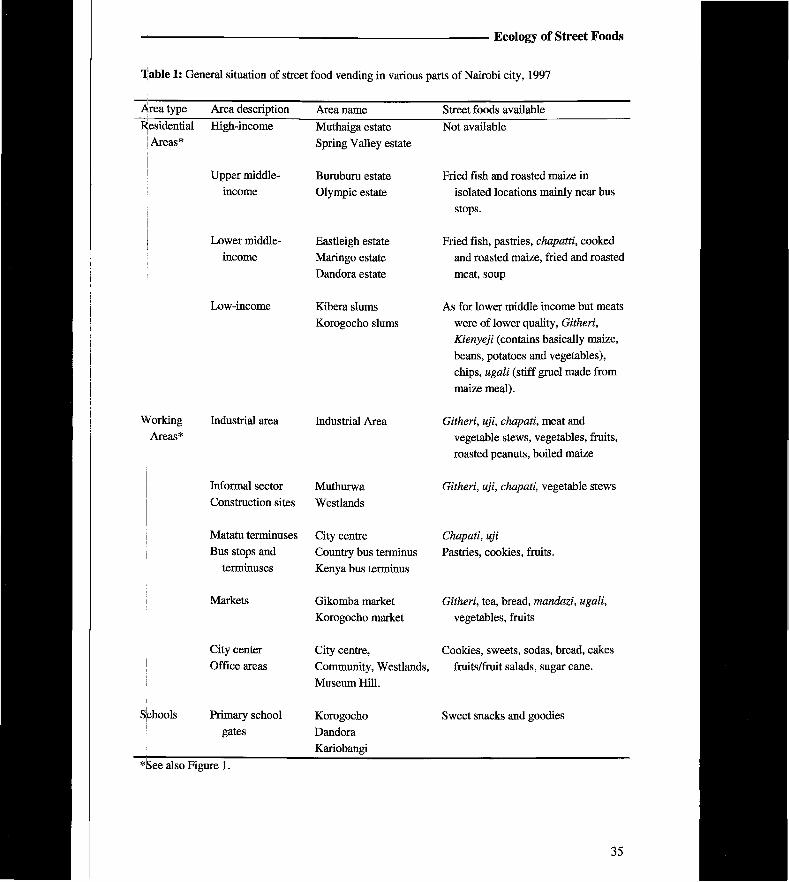
In Table 2, the distribution of street food vendors by study location and the category
of food products most frequently sold are presented. The association of specific food products
with study locations is also indicated. Filling meals were more associated with Korogocho
(low-income area; seven different varieties) and the Industrial Area (six different varieties)
compared to Dandora (lower middle-income area) with one variety. Light meals or breakfast
foods and snacks were more associated with Korogocho and Dandora. Fruits were mainly
found in the Industrial Area.
34
E c o l o g y o f S t r e e t F o o d s
T a b l e 1: General situation of street food vending in various parts of Nairobi city, 1997
Area type Area description Area name Street foods available Residential
Areas* High-income Muthaiga estate
Spring Valley estate Not available
Upper middle-income
Buruburu estate Olympic estate
Fried fish and roasted maize in isolated locations mainly near bus stops.
Lower middle-income
EasÜeigh estate Maringo estate Dandora estate
Fried fish, pastries, chapatti, cooked and roasted maize, fried and roasted meat, soup
Low-income Kibera slums Korogocho slums
As for lower middle income but meats were of lower quality, Githeri, Kienyeji (contains basically maize, beans, potatoes and vegetables), chips, ugali (stiff gruel made from maize meal).
Working Areas*
Industrial area Industrial Area Githeri, uji, chapati, meat and vegetable stews, vegetables, fruits, roasted peanuts, boiled maize
Informal sector Construction sites
Muthurwa Westlands
Githeri, uji, chapati, vegetable stews
Matatu terminuses Bus stops and
terminuses
City centre Country bus terminus Kenya bus terminus
Chapati, uji Pastries, cookies, fruits.
Markets Gikomba market Korogocho market
Githeri, tea, bread, manaazi, ugali, vegetables, fruits
City center Office areas
City centre, Community, Westiands, Museum Hill.
Cookies, sweets, sodas, bread, cakes fruits/fruit salads, sugar cane.
Schools Primary school gates
Korogocho Dandora Kariobangi
Sweet snacks and goodies
*See also Figure 1.
35
C h a p t e r 2
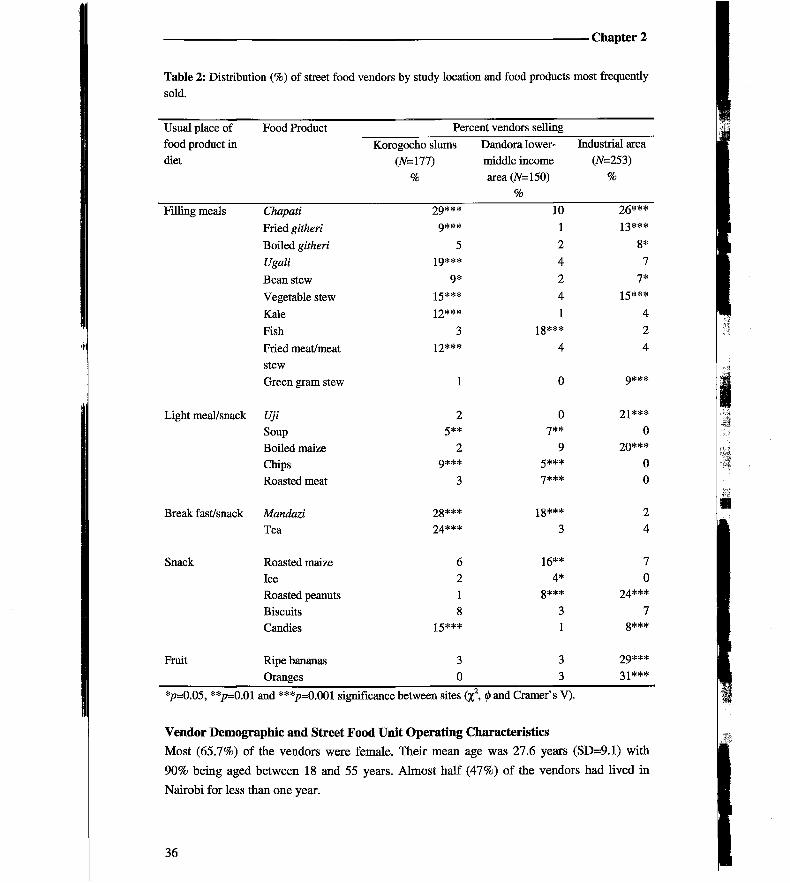
Table 2: Distribution (%) of street food vendors by study location and food products most frequendy sold.
Usual place of Food Product Percent vendors selling food product in Korogocho slums Dandora lower- Industrial area diet (#=177) middle income (7v=253)
% area (#=150) %
%
Filling meals Chapati 29*** 10 26***
Fried githeri 9 * * * 1 13***
Boded githeri 5 2 8*
Ugali 1 9 * * * 4 7
Bean stew 9 * 2 7 *
Vegetable stew 15*** 4 15***
Kale 12*** 1 4
Fish 3 Ig*** 2
Fried meat/meat 12*** 4 4
stew Green gram stew 1 0 9 * * *
Light meal/snack Uji 2 0 21***
Soup 5** 7 * * 0 Boiled maize 2 9 20***
Chips 9*** 5*** 0 Roasted meat 3 7 * * * 0
Break fast/snack Mandazi 28*** 18*** 2 Tea 24*** 3 4
Snack Roasted maize 6 16** 7 Ice 2 4* 0 Roasted peanuts 1 g*** 24***
Biscuits 8 3 7 Candies 15*** 1 g***
Fruit Ripe bananas 3 3 29***
Oranges 0 3 31 * * *
*p=0.05, **/7=0.01 and ***/>=0.001 significance between sites (%2, 0 and Cramer's V).
V e n d o r D e m o g r a p h i c a n d S t r e e t F o o d U n i t O p e r a t i n g C h a r a c t e r i s t i c s
Most (65.7%) of the vendors were female. Their mean age was 27.6 years (SD=9.1) with
90% being aged between 18 and 55 years. Almost half (47%) of the vendors had lived in
Nairobi for less than one year.
36
E c o l o g y o f S t r e e t F o o d s
More than three-quarters (78%) of the vendors were also the owners of the operation.
Some vending units belonged to close relatives (12%). In a few (2%) of the operations, the
vendor either owned the business with another person or was only standing in for a friend.
For the rest of the vending units (8%), the vendors were employees.
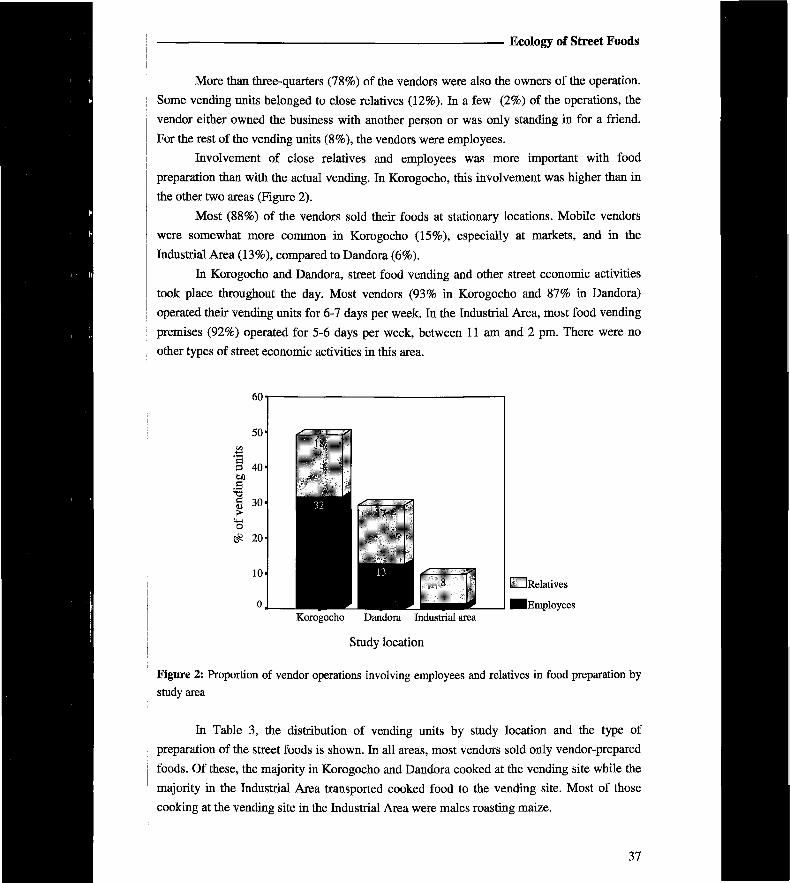
Involvement of close relatives and employees was more important with food
preparation than with the actual vending. In Korogocho, this involvement was higher than in
the other two areas (Figure 2).
Most (88%) of the vendors sold their foods at stationary locations. Mobile vendors
were somewhat more common in Korogocho (15%), especially at markets, and in the
Industrial Area (13%), compared to Dandora (6%).
In Korogocho and Dandora, street food vending and other street economic activities
took place throughout the day. Most vendors (93% in Korogocho and 87% in Dandora)
operated their vending units for 6-7 days per week. In the Industrial Area, most food vending
premises (92%) operated for 5-6 days per week, between 11 am and 2 pm. There were no
other types of street economic activities in this area.
Korogocho Dandora Industrial area
Study location
LTD Relatives
^•Employees
Figure 2: Proportion of vendor operations involving employees and relatives in food preparation by study area
In Table 3 , the distribution of vending units by study location and the type of
preparation of the street foods is shown. In all areas, most vendors sold only vendor-prepared
foods. Of these, the majority in Korogocho and Dandora cooked at the vending site while the
majority in the Industrial Area transported cooked food to the vending site. Most of those
cooking at the vending site in the Industrial Area were males roasting maize.
37
C h a p t e r 2
In the Industrial Area, foods that did not need preparation (mainly whole fruits) were
sold in almost one-third (32%) of the street food vending units. Processed foods (mainly
milk, bread, soda and candies) were more found in Korogocho (18%) and the Industrial Area
(11%). Some of the candies sold in Korogocho were factory rejects.
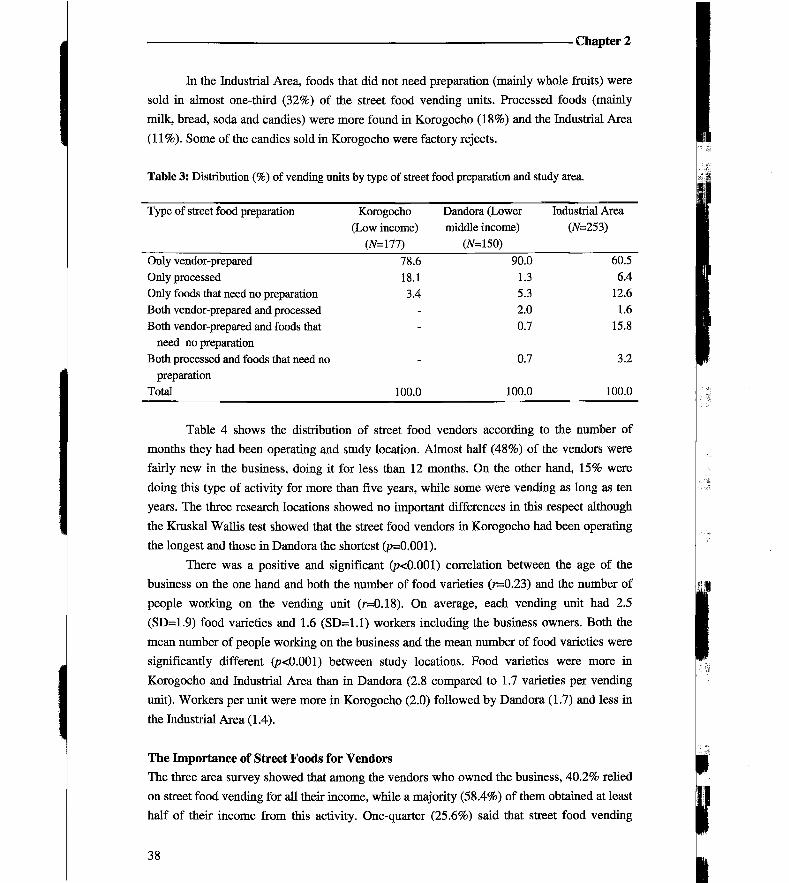
T a b l e 3: Distribution (%) of vending units by type of street food preparation and study area.
Type of street food preparation Korogocho Dandora (Lower Industrial Area (Low income) middle income) (#=253)
(#=177) (#=150) Only vendor-prepared 78.6 90.0 60.5 Only processed 18.1 1.3 6.4 Only foods that need no preparation 3.4 5.3 12.6 Both vendor-prepared and processed - 2.0 1.6 Both vendor-prepared and foods that - 0.7 15.8
need no preparation Both processed and foods that need no - 0.7 3.2
preparation Total 100.0 100.0 100.0
Table 4 shows the distribution of street food vendors according to the number of
months they had been operating and study location. Almost half (48%) of the vendors were
fairly new in the business, doing it for less than 12 months. On the other hand, 15% were
doing this type of activity for more than five years, while some were vending as long as ten
years. The three research locations showed no important differences in this respect although
the Kruskal Wallis test showed that the street food vendors in Korogocho had been operating
the longest and those in Dandora the shortest (p=0.001).
There was a positive and significant (p<0.001) correlation between the age of the
business on the one hand and both the number of food varieties (r=0.23) and the number of
people working on the vending unit (r=0.18). On average, each vending unit had 2.5
(SD=1.9) food varieties and 1.6 (SD=1.1) workers including the business owners. Both the
mean number of people working on the business and the mean number of food varieties were
significantly different (p<0.001) between study locations. Food varieties were more in
Korogocho and Industrial Area than in Dandora (2.8 compared to 1.7 varieties per vending
unit). Workers per unit were more in Korogocho (2.0) followed by Dandora (1.7) and less in
the Industrial Area (1.4).
T h e I m p o r t a n c e o f S t r e e t F o o d s f o r V e n d o r s
The three area survey showed that among the vendors who owned the business, 40.2% relied
on street food vending for all their income, while a majority (58.4%) of them obtained at least
half of their income from this activity. One-quarter (25.6%) said that street food vending
38
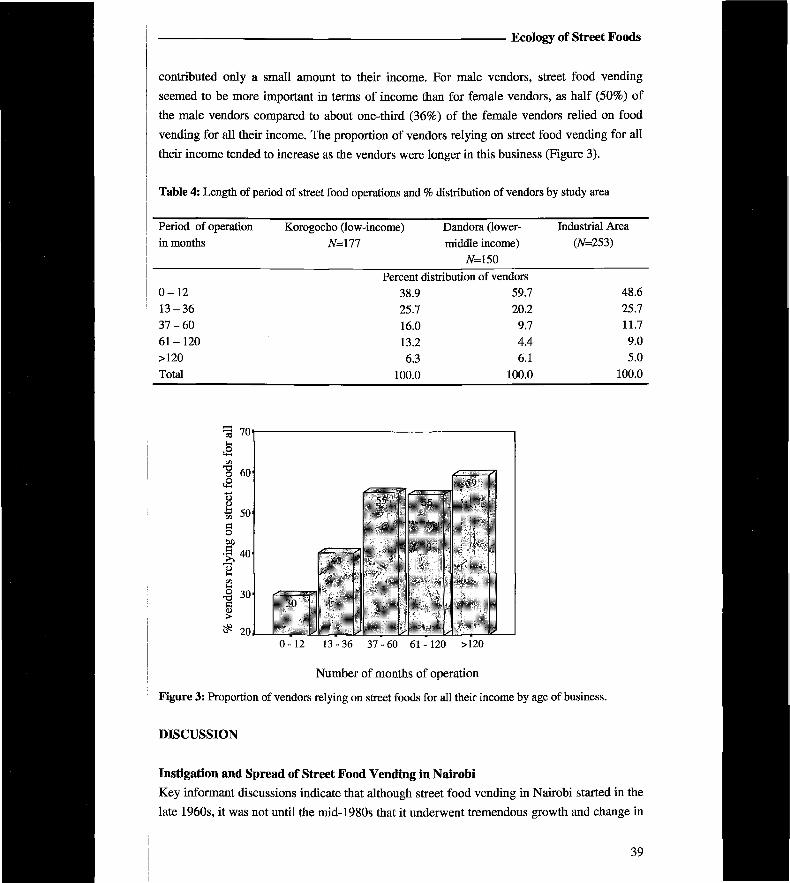
E c o l o g y o f S t r e e t F o o d s
contributed only a small amount to their income. For male vendors, street food vending
seemed to be more important in terms of income than for female vendors, as half (50%) of
the male vendors compared to about one-third (36%) of the female vendors relied on food
vending for all their income. The proportion of vendors relying on street food vending for all
their income tended to increase as the vendors were longer in this business (Figure 3).
Table 4: Length of period of street food operations and % distribution of vendors by study area
Period of operation Korogocho Qow-income) Dandora (lower- Industrial Area in months #=177 middle income) (#=253)
#=150 Percent distribution of vendors
0 - 1 2 38.9 59.7 48.6 1 3 - 3 6 25.7 20.2 25.7 3 7 - 6 0 16.0 9.7 11.7 6 1 - 1 2 0 13.2 4.4 9.0 >120 6.3 6.1 5.0 Total 100.0 100.0 100.0
•a 70
0 - 12 13-36 37-60 6 1 - 120 >120
Number of months of operation
Figure 3: Proportion of vendors relying on street foods for all their income by age of business.
D I S C U S S I O N
I n s t i g a t i o n a n d S p r e a d o f S t r e e t F o o d V e n d i n g i n N a i r o b i
Key informant discussions indicate that although street food vending in Nairobi started in the
late 1960s, it was not until the mid-1980s that it underwent tremendous growth and change in
39
C h a p t e r 2
characteristics. The phenomenon appears to have been initiated by uneducated males as a
form of employment. Trends in the growth of the economy and the urban population during
the previous two decades have contributed to the growth and changing nature of street foods
vending. The two decades were characterised by high urban population increases in
combination with declining economic growth, high rates of inflation, diminished growth in
employment opportunities and increasing poverty (Kenya, 1991-1995), causing many
urbanites to increasingly participate in informal activities such as street foods vending. Since
cooking is one of the customary tasks for African women, it is no wonder that female street
food vendors have tended to outnumber males with time. The present state of women being
the majority of street food vendors has also been observed in other countries such as
Guatemala, Peru, Philippines, Honduras, Thailand, Indonesia, Senegal and Nigeria (FAO,
1990). Selling of roasted meat is, however, dominated by males, a task that can also be traced
back, not only to the African cultural tasks for men, but also to the Western countries where
meat barbecue tasks were originally for men (oral conversations). The increase in street food
vending in Nairobi can therefore be said to be due to:
- increasing labour force resulting from rapid urbanisation and lack of formal employment
opportunities;
increasing economic stress and umeliabihty of incomes creating the need for income
diversification and increased demand for cheap sources of food.
Dawson and Canet (1991) mention a third reason namely increased demand for convenience
foods, especially ready-to-eat foods, due to the busy form of life in urban areas. In Nairobi,
this may apply only to a small extent since the need for employment and economic stress
seam to be more important. Hence street food vending in Nairobi can be said to be a survival,
coping and income diversification (income security) strategy driven by both demand (for
cheap and convenient food) and supply.
C o n v e n i e n c e o f S t r e e t F o o d s
Street food vending started at public places in low-income residential areas, spreading to
working places and eventually to middle-income residential areas. This means that vending
and consumption of street foods started among the urban poor as a strategy to cope with their
economic problems. Street foods could therefore be thought of as an innovation occurring in
times of economic stress, gradually moving up the social scale and being adopted by higher
classes (probably comparable to the Irish potato in Europe). It therefore falls in the
Emergency Innovation type of foods distinguished by Wiegelman in 1974 (cited in Den
Hartog, 1986) as one of the two basic types of food innovations. Food consumption
behaviour has been reported to be a result of five types of influences, namely the
physiological value, the socio-psychological value, the economic value, the availability and
the knowledge of the food products for the consumer (Myburgh, 1995). These influences are
constantly in interaction and variable in scope. Since employment and wages, along with
4 0
E c o l o g y o f S t r e e t F o o d s
prices and incomes, play a central role in food security of urban populations, the most
consequential influence in their consumption behaviour is likely to be the economic value of
the food products. The absolute and relative prices of products, i.e. relative to the income
flow of the consumer, are important here.
Street food vendors cluster logically where their customers are. Hence there appears
to be an inverse relation between the density of street food vending, particularly of filling
meals, and the income level of the residential areas concerned. This leads to two
; observations. Firstly, the poor in Nairobi are the main consumers of street foods and their
households use a lot of street foods. Secondly, street foods are not important in the diets of
people living in higher-income residential areas although they consume it to a smaller degree.
With increasing costs of living, the difficulty of procuring cooking fuel, and the inability of
the market to offer raw foods in small measures leave the urban poor with no food choices
other than ready-to-eat foods, which may be expensive. Street foods, being relatively cheaper
than other types of ready-to-eat foods, appear to be the best immediate option for low-income
urbanites given their amount of wages combined with the flow of their earnings in relation to
i their other needs. Those who manage to get access to a piece of urban land can start to
produce (part of) their own food (Mwangi 1995; Mwangi and Foeken, 1996; Foeken and
Mwangi 1998). This explains why street food vending started and is still mainly found in the
low-income districts of Nairobi. People living in high-income districts either can afford the
foods they prefer or their income flow enables them to spend on other types of food. The
issue of affordabihty and financial means has been observed elsewhere. In Bogor, Indonesia,
in the late 1980s a majority of students originating from lower and middle socio-economic
classes depended on street foods for most of their nutritional intake, mainly because their
| financial means were small (Streetfoods Project, 1989). In Haiti, Webb and Hyatt (1988)
observed significant differences in the average daily caloric and protein intake values from
street foods between socio-economic levels. For family heads and mothers in Bamako, the
frequency of buying street food increased with declining socio-economic levels (Ag Bendech
etal, 1998). Street foods are thought to be cheap. One consumer with a family of seven members
in Korogocho stated: "Whenever I cook githeri for my family, I make enough for two meals,
lunch and dinner. I usually spend about 120 Kenyan shillings on raw foods and cooking fuel.
But if I go to the street and buy ready githeri for two meals, I spend only 60 Kenya sliillings,
which is twice less expensive." Pearce et al. (1988) also suggest that vendors can buy raw
food and cooking fuel in bulk at wholesale prices and sell it cheaply due to economies of
scale. However, this is debatable since it is not clear whether those who practice vending are
able to buy in bulk or only afford what they can sell on a daily basis. In addition, street foods
may be cheap at the expense of the quality (ingredient quality and proportions).
Kennedy and Reardon (1994) state that change by urban dwellers to "convenience
foods" is influenced by women's opportunity cost of time. However, this may not fully apply
41
C h a p t e r 2
to the use of street foods, as in Kenya (generally) working women (if they can afford) employ
cooks and/or house-helps who take care of their children, prepare meals for the family and
run other domestic chores while the women are away. Hence, family food is most of the
times home prepared. Trends in street food vending in Nairobi suggest that street foods were
originally "convenient foods" for the low-income urban workers and the urban poor. This
indicates that street foods are not necessarily convenient due to women's opportunity cost of
time but mostly due to their affordability and the meagre earnings of the urban poor.
Certainly, households with single members and/or busy members may find the use of street
foods convenient but if financially able, they would probably opt for fast-food restaurants.
With long hours of continuous work at great distances from home and the
unavailabihty of a rapid transport system (or increasing costs of transport), it is logical that
the majority of urban workers cannot depend on food prepared at home (Sujatha et al, 1997).
However, urban workers will buy ready-to-eat food whose prices fall within their purchasing
power. Therefore, low-income workers and increasingly also the middle-income workers
with declining purchasing power cause an increase in the demand for affordable food in
working areas. In other words, coping strategies such as dietary change and change of eating-
places are employed (Maxwell, 1998). Substituting expensive foods (such as restaurant
foods) with cheaper ones (say street foods) can be observed. The absence of street foods at
some school gates in Nairobi is because the school authorities forbid it but school children
have been observed purchasing street foods in school neighbourhoods.
At working places vendors bring cooked food to the vending sites. Informal
interviews revealed that food vendors at the Industrial Area usually encounter harassment by
city authorities. Cooking at the vending site would require a licensed premise (a food kiosk).
Vendors would need more capital and have to sell their food expensively, which is not in the
interest of the low-income consumer. Transporting cooked food, on the other hand, requires
proper packing (of which most vendors do not have) to ensure food safety. It is no wonder
that a large proportion of vendors in the Industrial Area sell foods that do not need cooking.
Street food vending is thus illegal but sometimes bribes and protection money are paid. In
residential areas (especially in the low-income areas), majority of vendors cook at the
vending site, in the vicinity of their homes. They can afford to carry their cooking ware from
their houses to the site and back. It is possible for them to serve hot food to their customers.
Harassment is less common in these areas except when there is an outbreak of food or water-
borne diseases, like cholera, until the situation is brought under control.
I m p o r t a n c e o f S t r e e t F o o d s f o r E m p l o y m e n t a n d I n c o m e
Street food vending can be considered as a survival strategy for the poor and the unemployed.
Many vendors, especially males, rely on street food vending for at least half of their income
and often using family labour. Married women probably rely on their husbands for part of
their income. In addition, the vast majority of vendors are within the age that constitutes the
42
E c o l o g y o f S t r e e t F o o d s
labour force. Many vending units, especially in the slums, provide employment. Once started,
slum dwellers more or less settle to it and the business thrives. These vendors are
significantly older than vendors from the middle-income areas, and have lived in Nairobi and
operated the longest. They run the business by themselves, they increase the number of food
varieties and employ other people with time.
For vendors from lower-middle-income areas, street food vending appears to be a
form of temporary employment and constitutes most likely a supplement to the family
income. They are more recent migrants than vendors living in the slums. Their units are
youngest and have the least number of food varieties. They probably are involved in food
vending just for a while as they wait for better employment. Another possibility is that street
food vending pays better than casual labour or low-cadre forms of employment. A high
school graduate (who previously did casual work) vending only chapati in Korogocho said
that he was assured of earning 3,500-4,000 starlings per month while a casual labourer is
never sure. As a result, more people who previously worked as casual labourers or held low
cadre-employment opt to join street food vending.
The Industrial Area constitutes a mixture of vendors from both slums and the lower-
middle-income areas and street food vending may be both a survival strategy and a form of
employment.
C O N C L U S I O N
Street food vending and consumption in Nairobi has developed and rapidly increased during
the last two decades. The trend reflects increases in the economic situation and urban
population growth in the country. It has been instigated by rapidly growing and changing
urban food demands alongside the need to diversify and/or employ income sources in the face
of declining real incomes. Firstly, rapid urbanisation has led to increased unemployed labour
force, which ends up in low-income areas. Entry into food vending is easy since it needs no
special skills and little investment. It is a quick source of employment as one looks for an
alternative. Since women are more skilled and better competitors (given their social roles)
they enter into cooked food business and do better. Secondly, with increasing economic
stress, the earnings of the poor are no longer stable hence the need for diversified income
sources. In addition, daily earnings demand that they spend on what they can afford with
what they have (eroded purchasing power). They go for prepared foods, which might not be
their option if their earnings were more stable and came in lump sum. Hence, like the rest of
the informal sector, street food vending has grown with increasing inflation, unemployment
rates and costs of living.
It is expanding and thriving especially among the urban poor. Its convenience is
oriented to affordability (given the flow income for the poor) and not to time saving as it has
been considered in the past. It is a food supply channel for the urban poor and provides
employment opportunities. The phenomenon is therefore not likely to disappear as long as we
43
C h a p t e r 2
have poor and unemployed people. Furthermore, street food vending and consumption is in
fact climbing up the socio-economic ladder due to increasing monetary demands.
This underscores on the need to legitimise the sector with simple regulations that
make the food safe but not expensive to operate or buy. When food is in short supply or
relatively expensive due to taxing regulations, both quality and quantity of the food available
to the urban poor will decline and the nutrition and health status will continually dwindle.
Lack of some form of regulation also bears the risk that the food is unsafe for consumers.
Legitimising the operation and improving safety may increase the number of consumers,
which may subsequently improve local food production and consequently improve the
nutritional status of the urban poor. If indeed street foods are of importance, not only in the
diets of urban dwellers but also in the economic sense, there is need for more studies (to get
this phenomenon officially recognised).
The local urban authorities, in collaboration with the nutrition and health community,
therefore needs to consider the potential health hazards associated with the current state of
street food vending and consumption and undertake necessary actions to upgrade
performance. Sanitation and issues related to vendor knowledge and practices need to be
evaluated. There is also need to quantitatively assess the role of the sector in terms of
nutrition of consumers, employment, vendors' income and local food production for
conviction of a worthy cause.
A C K N O W L E D G E M E N T S
Our gratitude goes to the Netherlands Foundation for the Advancement of Tropical Research
(WOTRO), file number W V 96-153, for financing the research. W e also acknowledge the
support of Prof. J. Imungi (Department of Food Technology) and Dr. Wambui Kogi-Makau
(Unit of Applied Nutrition) both from the University of Nairobi. Thanks to the staff of
Provide International in Korogocho, Gospel Tabernacle Church - Dandora, the field assistants
and the street food vendors for their help and cooperation in the field.
R E F E R E N C E S
Ag Bendech M, Chauliac M, Malvy DJM (1998). Assessment of dietary intake at home and outside the home in Bamako (Mali). Ecology of Food Nutrition, 37:135-162.
Bricas N. (1994). Street food and trends in urban eating patterns. Children in the Tropics, 213: 36-39. Chakravarty I, Canet C (1996). Street foods in Calcutta. Food, Nutrition and Agriculture, 17/18: 30-
37. Chauliac M, Gerbouin-Rerolle P (1994). Street food: a comprehensive approach. Children in the
Tropics, 213: 5-20. Dawson, R.J., and C. Canet, (1991). International activities in street foods. Food Control (July): 135-
139. den Hartog AP (1986). Diffusion of milk as a new food to tropical regions: the example of Indonesia
1880-1942. Ph.D Thesis. Sticking Voeding Nederland, Wageningen.
44
E c o l o g y o f S t r e e t F o o d s
FAO (1985). The state of food and agriculture 1984. World Review: The ten years since the World Food Conference. Urbanisation, Agriculture and Food Systems. Agriculture Series, 10: 102-105.
FAO (1990). Street foods. Report of an FAO Expert Consultation Jogjakarta, Indonesia, 5-9
December 1988. FAO Food and Nutrition paper, 46. FAO (1991). Study on street foods in Nigeria. Comparative study of the socio-economic
characteristics of food vendors and consumers in Ibadan, Lagos and Kaduna, Nigeria. FAO, Rome and Food Basket International, Ibadan.
FAO (1992). Intercountry workshop on street foods in Africa. FAO, Regional Office for Africa, Accra.
FAO (1997). Street foods. Report of an FAO technical meeting on street foods, Calcutta, India, 6-9 November 1995. FAO Food and Nutrition paper, 63.
Foeken DWJ, Mwangi AM (1998). Does access to land have a positive impact on the food situation of the urban poor? A case study in Nairobi. Eastern Africa Social Science Research Review. OSSREAXXV(l): 19-32.
Hussan MA (1990). Nutrition policy and the urban poor in developing countries. Food Policy (June): 186-192
Jayasuriya DC, (1994). Street food vending in Asia: some policy and legal aspects. Food Control, 5: 222-226.
Kennedy E, Reardon T (1994). Shift to non-traditional grains in the diets of East and West Africa: role of women's opportunity cost of time. Food Policy, 19(1): 45-56.
Kenya, Republic of (1991). Economic survey 1991. Ministry of planning and National development (MPND), Central bureau of statistics (CBS), Nairobi.
Kenya, Republic of (1992). Economic survey 1992. MPND, CBS, Nairobi. Kenya, Republic of (1994). Economic survey 1994. MPND, CBS, Nairobi. Kenya, Republic of (1995). Economic survey 1995. MPND, CBS, Nairobi.
Korir SCR, Imungi JK, Muroki NM (1998). Proximate chemical composition of street foods and their energy and protein contribution to the nutrition of manual workers in Nairobi. Ecology of Food Nutrition, 37: 123-133
Maxwell D, (1998). The political economy of urban food security in Sub-Saharan Africa. Food Consumption and Nutrition Division discussion paper 41. IFPRI.
Monnier T, ChauliacM (1994). Street food and school children in Bamako. Children in the Tropics, 213:40-51.
Mwangi AM (1995). The role of urban agriculture for food security in low- income areas in Nairobi. Food and Nutrition Studies Programme, Report no. 54. Ministry of Planning and National Development, Nairobi/African Studies Centre, Leiden.
Mwangi AM, Foeken DWJ (1996). Urban agriculture, food security and nutrition in low-income areas of the city of Nairobi, Kenya. African Urban Quarterly. Special issue: Urban agriculture in Africa, 11(2,3): 170-180.
Myburgh AS (1995). Consumer behaviour of newly urbanised low-income communities on the Cape flats. Agrekon, 34(4): 260-264.
Nasinyama GW (1992). Study on street foods in Kampala - Uganda. Unpublished paper prepared for FAO, Makerere University, Kampala.
45

C h a p t e r 2
Oguntona CRB, Kanye O (1995). Contribution of street foods to nutrient intakes by Nigerian
adolescents. Nutrition and Health, 10: 165-171. Oguntona CRB, Telia TO (1999). Street foods and dietary intakes of Nigerian urban market women.
International Journal of food Sciences and Nutrition, 50: 383-390. Pearce R (1991). Urban food subsidies in the context of adjustment. The case of Zambia. Food Policy,
16(6): 436^150. Pearce TO, Kujore OO, Agboh-Bankole VA, (1988). Generating an income in the urban environment:
the experience of street food vendors in Ue-Ife, Nigeria. Africa, 58(4): 385-400. Streetfood Project (1989). Street foods in West Java. A base line survey. Working paper No. 1. Bogor
Agricultural University (1PB), Netherlands Organization for Applied Scientific Research (TNO),
Amsterdam Free University (VU). VU, Amsterdam. Streetfood Project (1992). Production and distribution of street foods: a socio-economic survey in
Bogor, West Java. Working paper No. 5. Ministry of Research and Technology - Indonesian Agency for the assessment and Application of Technology (BPPT), Netherlands Directorate
General of International Cooperation (DGIS), Netherlands Organisation for Applied Scientific
Research (TNO), Bogor Agricultural University (IPB) and Amsterdam Free University (VU).
VU, Amsterdam. Sujatha T, Shatrugna V, Rao NGV, ReddyCKG, Padmavathi KS, Vidyasagar P (1997). Street food:
An important source of energy for the urban worker. Food and Nutrition Bulletin, 18 (4): 318-322
Tinker I (1987a). Street foods: testing assumptions about informal sector activity by women and men. Current Sociology, 35(3): 1-110.
Tinker I (1987b). The case for legalizing street foods. Ceres, 20(5): 26-31. von Braun J, McComb J, Fred-Mensah BK, Pandya-Lorch R (1993). Urban food insecurity and
malnutrition in developing countries: trends, policies, and research implications. I F P R I ,
Washington, D.C. Webb RE, Hyatt SA (1988). Haitian street foods and their nutritional contribution to dietary intake.
Ecology of Food and Nutrition, 21: 199-209. Winarno FG, Allain A (1991). Street foods in developing countries: lessons from Asia. Food
Nutrition and Agriculture, 1: 11-18. World Bank (1990). Poverty: World Development Report 1990. World development Indicators.
Oxford University Press, New York. World Bank (1995). Kenya Poverty Assessment. World Bank, Population and Human Resources
Division, Eastern Africa Department, Africa Region. World Bank (1999). World development Indicators. International Bank for Reconstruction and
Development, Washington DC:
46
3 DO STREET FOOD VENDORS SELL A SUFFICIENT VARIETY OF FOODS FOR A HEALTHY DIET? THE CASE OF NAIROBI.
Alice Mboganie Mwangi, Adel P. den Hartog, Robert K.N. Mwadime, Wija A. van
Staveren, Dick W.J. Foeken.
In P r e s s : Food and Nutrition Bulletin
C h a p t e r 3
A B S T R A C T
This paper determines whether street food vendors sell sufficient food varieties for a healthy diet.
It is hypothesised that vendors sell only cheap food groups to enable buyer affordability while
vendors also make a profit. A structured questionnaire was administered to 580 vendors in three
selected locations. Data included product names, ingredients, preparation methods and vendor
gender. Most (53%) vendors were one-food group sellers with 44% selling cereals. Overall, 36%
vendors, mostly males, sold only carbohydrate-rich products. Sellers of foods rich in mixed
nutrients were more in a working area (53%) than a slum area (43%, p<0.05), who were more
than at a lower-middle income area (21%, p<0.001). Micronutrient and mixed-nutrient rich
products were associated with female vendors. Therefore, most street food vendors in Nairobi are
one-food group sellers. However, female vendors are capable of supplying sufficient food group
variety where consumers can afford. It appears that consumer purchasing power dictates the food
groups provided by vendors, especially cereal-based-foods. A policy on fortification, with
inadequate micronutrients, of cereal flours and fats used in popular street food preparation needs
to be considered. This could be coupled with consumer and vendor education programmes
focusing on the importance of healthy diets.
I N T R O D U C T I O N
The majority of urban dwellers in sub-Saharan Africa countries remain highly disadvantaged
with very limited purchasing power. Guaranteeing the efficient distribution of low-cost but
nutritious food for them is, therefore, a pressing concern (FAO, 1997a). The FAO has
indicated that street food vendors provide nutritious and tasty ready-to-eat food at low prices
(FAO, 1997b; 1997c). In Calcutta, for instance, an average (500 gram) meal containing 20-30
g protein, 12-15 g fat, 174-183 g carbohydrates and providing approximately 1 000 calories
could be purchased for only US$0.25 on the street (Chakravarty and Canet, 19996). Literature
indicates that many low-income families would be worse off if there were no vendors to serve
fast and relatively inexpensive foods (FAO, 1990; 1991; 1992; Pearce, 1991; Streetfood
Project, 1992). Street foods have been shown to contribute a substantial proportion of energy
and protein (25% - 50%) of the recommended daily allowance for adolescents attending
school (Oguntona and Kanye, 1995) and urban market women (Oguntona and Telia, 1999) in
Nigeria. Furthermore, they played a considerable role in the daily diet of low-income male
urban workers in Hyderadad (Sujatha et ai, 1997), urban construction workers in Nairobi
(Korir et el, 1998) and Calcutta street traders (Chakravarty and Canet, 1996). Children are
also said to benefit from the sector. In Cotonou, for instance, of the number of meals
consumed by children, 46% were reported to be street foods (van Loon and Ottens, 1996). In
addition, street food vending is said to be a source of employment in many developing
countries. One can start with minimum capital and low education, yet it contributes good and
reliable income (Bricas, 1994; Chauliac and Gerbouin-Rerolle, 1994; Tinker, 1987). As such,
48
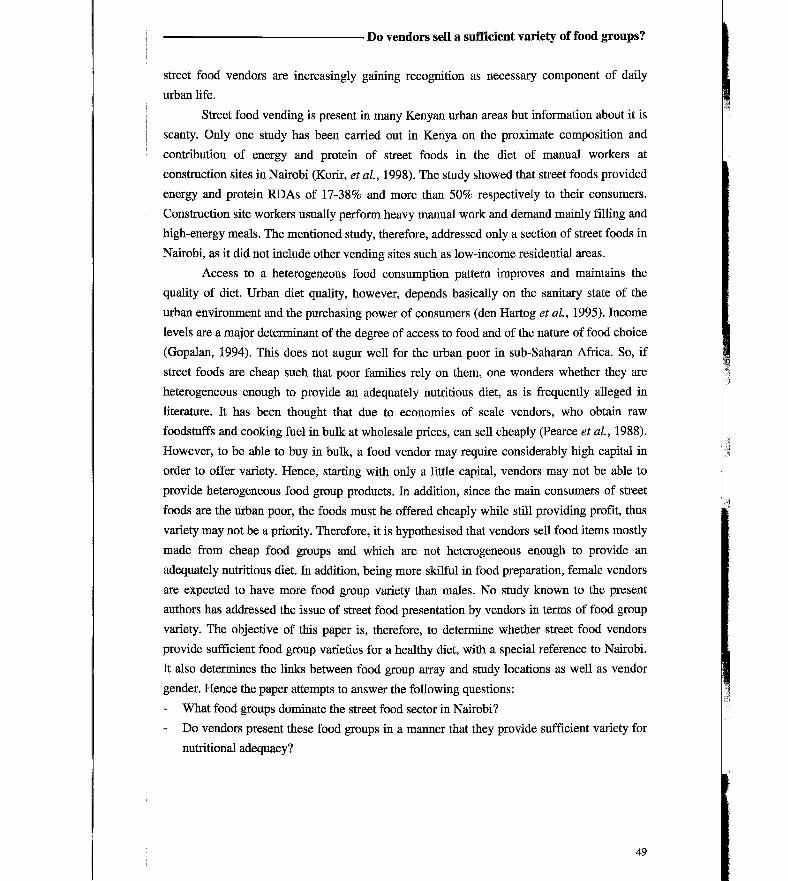
D o v e n d o r s sell a s u f f i c i e n t v a r i e t y o f f o o d g r o u p s ?
street food vendors are increasingly gaining recognition as necessary component of daily
urban life.
Street food vending is present in many Kenyan urban areas but information about it is
scanty. Only one study has been carried out in Kenya on the proximate composition and
contribution of energy and protein of street foods in the diet of manual workers at
construction sites in Nairobi (Korir, et al, 1998). The study showed that street foods provided
energy and protein RDAs of 17-38% and more than 50% respectively to their consumers.
Construction site workers usually perform heavy manual work and demand mainly filling and
high-energy meals. The mentioned study, therefore, addressed only a section of street foods in
Nairobi, as it did not include other vending sites such as low-income residential areas.
Access to a heterogeneous food consumption pattern improves and maintains the
quality of diet. Urban diet quality, however, depends basically on the sanitary state of the
urban environment and the purchasing power of consumers (den Hartog et al, 1995). Income
levels are a major determinant of the degree of access to food and of the nature of food choice
(Gopalan, 1994). This does not augur well for the urban poor in sub-Saharan Africa. So, if
street foods are cheap such that poor families rely on them, one wonders whether they are
heterogeneous enough to provide an adequately nutritious diet, as is frequently alleged in
literature. It has been thought that due to economies of scale vendors, who obtain raw
foodstuffs and cooking fuel in bulk at wholesale prices, can sell cheaply (Pearce et al, 1988).
However, to be able to buy in bulk, a food vendor may require considerably high capital in
order to offer variety. Hence, starting with only a little capital, vendors may not be able to
provide heterogeneous food group products. In addition, since the main consumers of street
foods are the urban poor, the foods must be offered cheaply while still providing profit, thus
variety may not be a priority. Therefore, it is hypothesised that vendors sell food items mostly
made from cheap food groups and which are not heterogeneous enough to provide an
adequately nutritious diet. In addition, being more skilful in food preparation, female vendors
are expected to have more food group variety than males. N o study known to the present
authors has addressed the issue of street food presentation by vendors in terms of food group
variety. The objective of this paper is, therefore, to determine whether street food vendors
provide sufficient food group varieties for a healthy diet, with a special reference to Nairobi.
It also determines the links between food group array and study locations as well as vendor
gender. Hence the paper attempts to answer the following questions:
- What food groups dominate the street food sector in Nairobi?
- D o vendors present these food groups in a manner that they provide sufficient variety for
nutritional adequacy?
49
C h a p t e r 3
S T U D Y S E T T I N G A N D M E T H O D O L O G Y
The study took place in October-November, 1997 as part of a larger survey on street foods in
Nairobi. It had been reviewed and approved by the Research Authorising Board in the Office
of the President, Kenya, in August 1997. Nairobi was selected because, being the capital city,
it housed people from all ethnic groups and races in Kenya and was thought to be more
representative than any other city.
Three areas representing a very low-income slum settlement (Korogocho), a lower-
middle income (LMI) residential area (Dandora) and a working area (the Industrial Area)
were selected on the basis that they were frequented with street food vendors. Rated
according to household income, Korogocho is one of the very low-income districts in Nairobi
(World Bank, 1995). Dandora is considered a lower-middle income district while the
Industrial Area is the only one designated as the general business area of Nairobi. These areas
were thought to be representative enough since a prior exploration of Nairobi had indicated
similarities in the type of street foods sold in corresponding income areas within the city.
Higher income residential areas were not frequented with street food vendors and hence were
not included. A cross-sectional general survey of all vendors found in the selected areas was
carried out. To incorporate vendors selling foods for only part of the day vending sites were
visited at three different times (7am-10am, 12noon-2pm and 4pm-7pm). Out of 229 vendors
in Korogocho slums, 153 in Dandora LMI area and 264 at the Industrial Area, there were 177,
150 and 253 respondents, respectively, included in the study. Non-response was due to
vendor inability to respond correctly or refusal to cooperate. The higher proportion of non-
participation in Korogocho was because some vendors feared that the study would work
against them since it would make public the unhygienic aspects of their foods. Although field
assistants tried their best to explain that it was not the case, some vendors still refused to co
operate. It was assumed that such vendors were spread over the study area and they were not
different from the respondents in terms of the types of food they sold hence their exclusion
from the study was not expected to considerably affect the outcome. Trained field assistants
administered a structured and pre-tested questionnaire to the respondents. Data on street food
products included the names, ingredients and method of preparation. Vendor gender was also
recorded.
Based on the ingredients, street food products were classified according to, firstly, the
modified FAO food commodity grouping system and, secondly, the key nutrients. The FAO
food commodity grouping system was based on commercial value system that groups foods
into cereals, starchy roots & tubers, legumes & nuts, animal products, fruit & vegetables and
beverages. Although fruit and vegetables belong to one group, they are separately presented in
the results to show study location and vendor gender differences. The mixed dishes group
consisted of food items containing more than one food group ingredients. The key-nutrient
grouping included carbohydrate (cereals, starchy roots and tubers), protein (animal products,
50
D o v e n d o r s sell a s u f f i c i e n t v a r i e t y o f f o o d g r o u p s ?
legumes and nuts), micronutrients (fruits and vegetables) and mixed nutrients (mixture of the
key-nutrients) in dishes.
To determine the nutrient contribution of some typical dishes sold by 'one-food-group'
and 'multiple-food-group' sellers, two vendors for each of the three most common dishes per
category were selected and a modified list-recall method (Gibson, 1990) was used to estimate
the quantities of ingredients used. Following the list of ingredients provided for each product
or dish, vendors were asked to recall the usual quantities of each ingredient they used and the
number of servings (including those consumed by family members) obtained per pot. The
quantities were reported in terms of weight and household or market measures. The
household and market measures were converted to weights. This was done through taking
weights of at least two of each of the various food ingredients according to the recorded
measures. It was assumed that the ingredients used per pot were evenly distributed among the
servings. Energy and nutrients provided per serving were calculated using the Kenya food
composition table and compared to the recommended daily allowances of an average Kenyan
adult male (weighing 65Kg) doing light work, referred to as Adult Equivalents (AE) (Sehmi,
1993). The references used were 2600 Kcal energy, 50g protein, <30% energy from fat, lOmg
iron, 750jig retinol equivalents (RE) for Vitamin A, 500 mg calcium, 1.2mg thiamine and
1.8mg riboflavin (Sehmi, 1993). W e focused on energy and the listed nutrients because
protein-energy malnutrition (PEM) is the most devastating nutritional problem in Kenya
while Iron and vitamin A deficiencies are reported to be major public health problems
(Kenya, 1994). The extent of calcium, thiamine and riboflavin deficiencies are not known in
Kenya but they could be a problem where the diet is dominated with cereal grain and
especially if the grain is refined. Provitamin A carotenoids were converted to RE using the
6:1 ratio (Sehmi, 1993) and not the conversion ratio of 12:1 newly proposed by the Institute
of Medicine (2001).
Data were analysed using SPSS for Windows. Frequencies were run to determine
distributions. Proportions were compared using the %2 as well as 0 and Cramer's V statistics.
The level of significance was set at p=0.05.
R E S U L T S
S t r e e t F o o d P r o d u c t s a n d F o o d G r o u p s
There were 77 different street food products recorded in the study. Table 1 is a list of the most
common products (sold by at least 30 vendors) and their food groups by the selling vendors in
Nairobi. Except for the section on energy and nutrient contribution of typical one- and
multiple-food group dishes, the rest of the results are based on all the 77 different products
recorded in the study. Most of the foods belonged to the cereals food group and they were
mainly wheat or maize based.
51
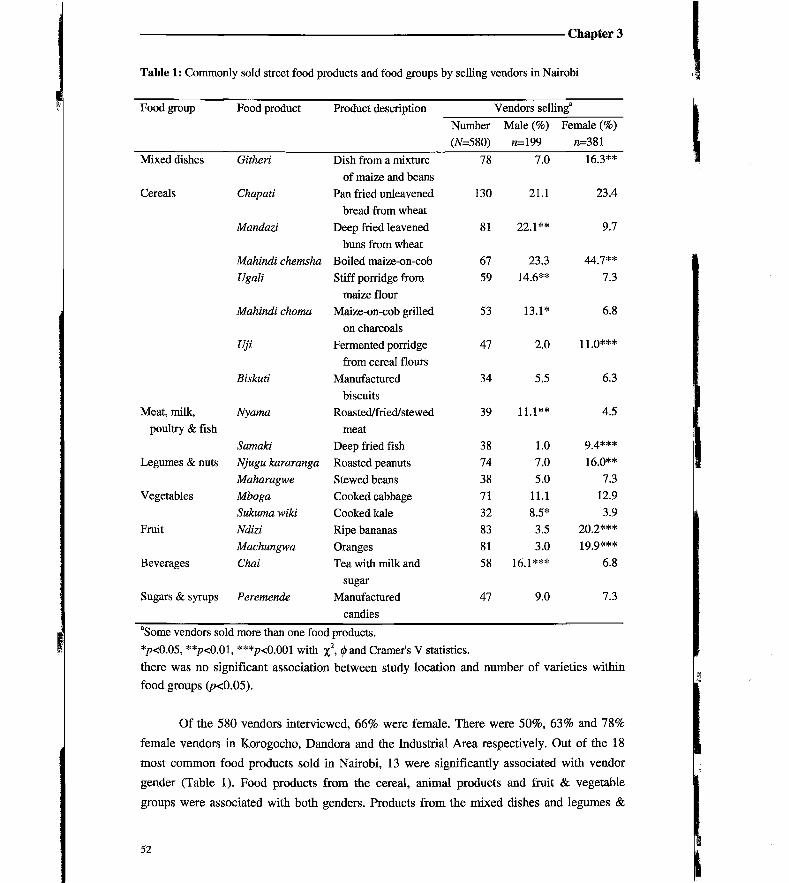
C h a p t e r 3
Table 1: Commonly sold street food products and food groups by selling vendors in Nairobi
Food group Food product Product description Vendors selling8
Number Male (%) Female (%) (#=580) «=199 n=381
Mixed dishes Githeri Dish from a mixture of maize and beans
78 7.0 16.3**
Cereals Chapati Pan fried unleavened bread from wheat
130 21.1 23.4
Manaazi Deep fried leavened buns from wheat
81 22.1** 9.7
Mahindi chemsha Boiled maize-on-cob 67 23.3 44.7**
Ugali Stiff porridge from maize flour
59 14.6** 7.3
Mahindi choma Maize-on-cob grilled on charcoals
53 13.1* 6.8
Uji Fermented porridge from cereal flours
47 2.0 11.0***
Biskuti Manufactured biscuits
34 5.5 6.3
Meat, milk, Nyama Roasted/fried/stewed 39 11.1** 4.5 poultry & fish meat
Samaki Deep fried fish 38 1.0 9 4 * * *
Legumes & nuts Njugu kararanga Roasted peanuts 74 7.0 16.0** Maharagwe Stewed beans 38 5.0 7.3
Vegetables Mboga Cooked cabbage 71 11.1 12.9 Sukuma wiki Cooked kale 32 8.5* 3.9
Fruit Ndizi Ripe bananas 83 3.5 20.2***
Machungwa Oranges 81 3.0 19 9 * * *
Beverages Chai Tea with milk and sugar
58 16.1*** 6.8
Sugars & syrups Peremende Manufactured candies
47 9.0 7.3
"Some vendors sold more than one food products.
*p<0.05, **/7<0.01, **V<0.001 with X2, 0and Cramer's V statistics.
there was no significant association between study location and number of varieties within
food groups (p<0.05).
Of the 580 vendors interviewed, 66% were female. There were 50%, 63% and 78%
female vendors in Korogocho, Dandora and the Industrial Area respectively. Out of the 18
most common food products sold in Nairobi, 13 were significantly associated with vendor
gender (Table 1). Food products from the cereal, animal products and fruit & vegetable
groups were associated with both genders. Products from the mixed dishes and legumes &
52
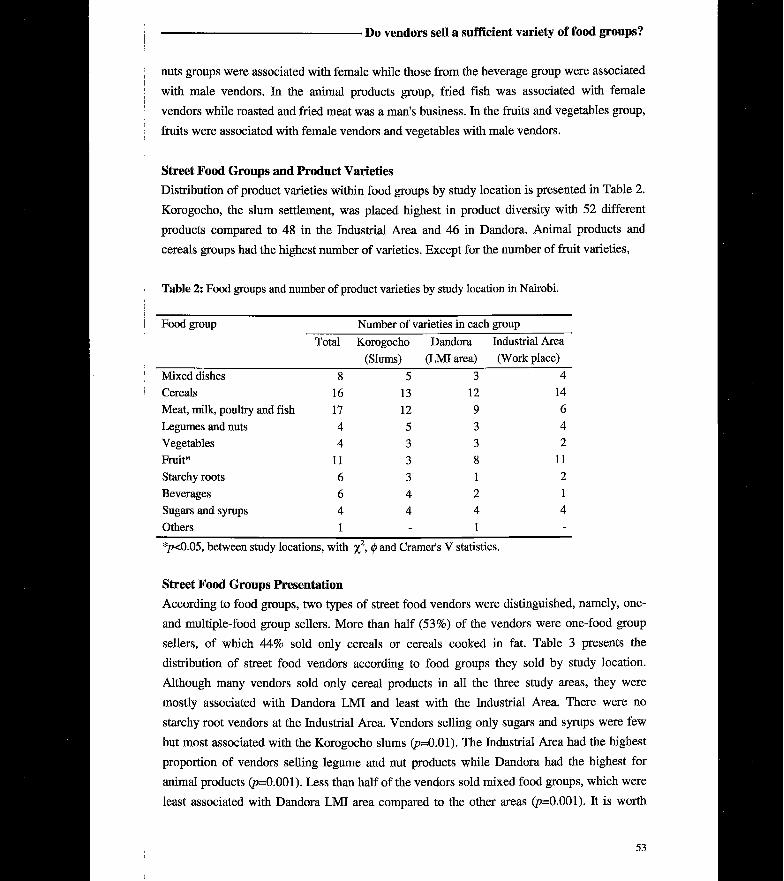
D o v e n d o r s sel l a s u f f i c i e n t v a r i e t y o f f o o d g r o u p s ?
Food group Number of varieties in each group
Total Korogocho Dandora Industrial Area
(Slums) (LMI area) (Workplace)
Mixed dishes 8 5 3 4 Cereals 16 13 12 14 Meat, milk, poultry and fish 17 12 9 6 Legumes and nuts 4 5 3 4 Vegetables 4 3 3 2 Fruit* 11 3 8 11 Starchy roots 6 3 1 2 Beverages 6 4 2 1
Sugars and syrups 4 4 4 4 Others 1 - 1 -
*p<0.05, between study locations, with %2, <p and Cramer's V statistics.
S t r e e t F o o d G r o u p s P r e s e n t a t i o n
According to food groups, two types of street food vendors were distinguished, namely, one-
and multiple-food group sellers. More than half (53%) of the vendors were one-food group
sellers, of which 44% sold only cereals or cereals cooked in fat. Table 3 presents the
distribution of street food vendors according to food groups they sold by study location.
Although many vendors sold only cereal products in all the three study areas, they were
mostly associated with Dandora LMI and least with the Industrial Area. There were no
starchy root vendors at the Industrial Area. Vendors selling only sugars and syrups were few
but most associated with the Korogocho slums (p=0.01). The Industrial Area had the highest
proportion of vendors selling legume and nut products while Dandora had the highest for
animal products (p=0.001). Less than half of the vendors sold mixed food groups, which were
least associated with Dandora LMI area compared to the other areas (p=0.001). It is worth
53
nuts groups were associated with female while those from the beverage group were associated
with male vendors. In the animal products group, fried fish was associated with female
vendors while roasted and fried meat was a man's business. In the fruits and vegetables group,
fruits were associated with female vendors and vegetables with male vendors.
S t r e e t F o o d G r o u p s a n d P r o d u c t V a r i e t i e s
Distribution of product varieties within food groups by study location is presented in Table 2.
Korogocho, the slum settlement, was placed highest in product diversity with 52 different
products compared to 48 in the Industrial Area and 46 in Dandora. Animal products and
cereals groups had the highest number of varieties. Except for the number of fruit varieties,
Table 2: Food groups and number of product varieties by study location in Nairobi.
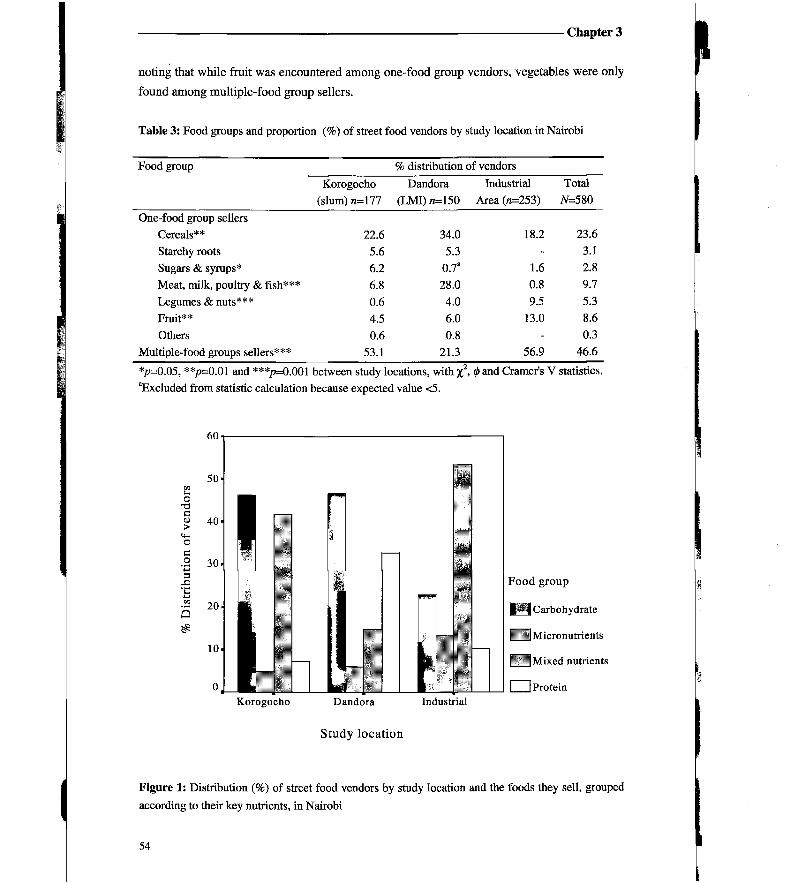
C h a p t e r 3
noting that while fruit was encountered among one-food group vendors, vegetables were only
found among multiple-food group sellers.
Table 3: Food groups and proportion (%) of street food vendors by study location in Nairobi
Food group % distribution of vendors Korogocho Dandora Industrial Total
(slum) «=177 (LMI)«=150 Area («=253) A/=580
One-food group sellers Cereals** 22.6 34.0 18.2 23.6 Starchy roots 5.6 5.3 - 3.1 Sugars & syrups* 6.2 0.7" 1.6 2.8 Meat, milk, poultry & fish*** 6.8 28.0 0.8 9.7
Legumes & nuts*** 0.6 4.0 9.5 5.3 Fruit** 4.5 6.0 13.0 8.6 Others 0.6 0.8 - 0.3
Multiple-food groups sellers*** 53.1 21.3 56.9 46.6
*p=0.05, **p=0.01 and ***p=0.001 between study locations, with %2» 0 and Cramer's V statistics. "Excluded from statistic calculation because expected value <5.
60
50
Korogocho Dandora Industrial
Study locat ion
Figure 1: Distribution (%) of street food vendors by study location and the foods they sell, grouped
according to their key nutrients, in Nairobi
54

D o v e n d o r s sell a s u f f i c i e n t v a r i e t y o f f o o d g r o u p s ?
Food group in terms of key nutrient ' 7c Street food vendors
Male («=199) Female («=381) Total (#=580) Carbohydrate 487*** 29.1 36.1 Protein 17.6 13.9 15.2 Micronutrients 5.0 10.8* 8.8 Mixed nutrients 28.6 45.8*** 39.9
!p<0.05, ***p<0.001 with x2, 0 and Cramer's V statistics.
E n e r g y a n d N u t r i e n t C o n t r i b u t i o n o f T y p i c a l o n e - a n d m u l t i p l e - F o o d g r o u p D i s h e s
Table 5 shows the proportion of energy from fat and the percent of A E for energy, protein,
iron, calcium, vitamin A, thiamine and riboflavin contributed per serving of some typical
dishes sold by one- and multiple-food group sellers. Except for a few dishes served with
vegetables, energy from fat was below 30% of the total energy per serving. The amount of
energy and iron per serving were comparable in both one- and multiple-food group dishes
except for mandazi & uji, which contributed a rather low amount of energy and chapati & sukuma wiki whose iron contribution was also low. The multiple-food group dishes that were
served with vegetables contributed half or more of the A E for vitamin A. The one-food group
dishes and the multiple-food group dishes without vegetables contributed either negligible
proportions or only up to 10% of the A E for vitamin A. In general, one-food group dishes
55
Figure 1 presents the percent distribution of vendors by the key food nutrients sold
and study location. The proportion of vendors selling carbohydrate-rich foods was
significantly lower in the Industrial Area than the other two areas (p<0.001) while the reverse
was true for the proportion selling micronutrient-rich foods (p<0.05). Vendors selling only
protein-rich foods were significantly more in the Dandora LMI area (p<0.001) compared to
both Korogocho slums and the Industrial Area. The proportion selling mixed-nutrient foods
was higher in the Industrial Area than in Korogocho (p<0.05) which was higher than in
Dandora (p<0.001).
S t r e e t f o o d g r o u p s a n d v e n d o r g e n d e r .
The proportion (61%) of male vendors selling single food groups was significantly higher
than that (49%) of female vendors. Table 4 presents the distribution of street food vendors by
sex and food groups in terms of key nutrients. Carbohydrate-rich foods were associated with
male vendors while mixed nutrient foods and foods rich in micronutrients were associated
with female vendors. Protein-rich foods were equally distributed across gender. However, as
earlier shown in Table 1, fried and roasted meat was a male job while deep-fried fish and
legumes and nuts were female oriented. Similar gender differences were observed in the
Industrial Area but not in the other study areas.
Table 4: Food groups in terms of key nutrients and distribution (%) of vendors by gender in Nairobi
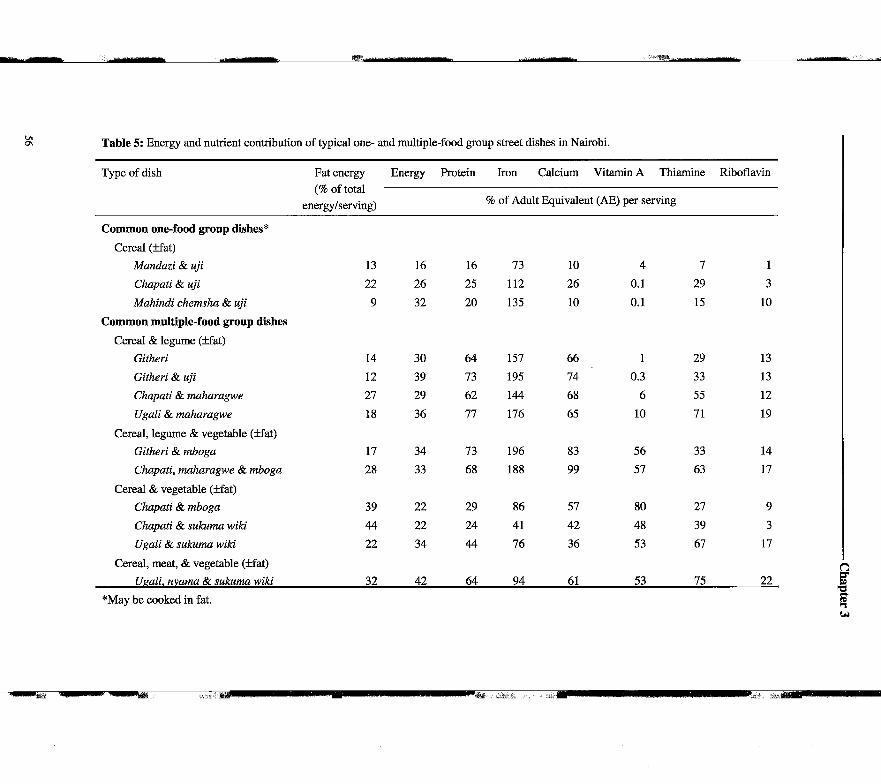
U i Table 5: Energy and nutrient contribution of typical one- and multiple-food group street dishes in Nairobi.
Type of dish
C o m m o n one-food g r o u p dishes*
Cereal (±fat)
Fat energy Energy Protein Iron Calcium VitarninA Thiamine Riboflavin (% of total
energy/serving) % o f A d u l t ^ v a l e n t (AE) per serving
Mandazi & uji 13 16 16 73 10 4 7 1
Chapati & uji 22 26 25 112 26 0.1 29 3
Mahindi chemsha & uji 9 32 20 135 10 0.1 15 10
C o m m o n multiple-food g r o u p dishes
Cereal & legume (±fat)
Githeri 14 30 64 157 66 1 29 13
Githeri & uji 12 39 73 195 74 0.3 33 13
Chapati & maharagwe 27 29 62 144 68 6 55 12
Ugali & maharagwe 18 36 77 176 65 10 71 19
Cereal, legume & vegetable (rfcfat) Githeri & mboga 17 34 73 196 83 56 33 14
Chapati, maharagwe & mboga 28 33 68 188 99 57 63 17
Cereal & vegetable ( i f at)
Chapati & mboga 39 22 29 86 57 80 27 9
Chapati & sukuma wild 44 22 24 41 42 48 39 3
Ugali & sukuma wiki 22 34 44 76 36 53 67 17
Cereal, meat, & vegetable (±fat)
Ugali, mama & sukuma wiki 32 42 64 94 61 53 75 22
*May be cooked in fat.
D o v e n d o r s sel l a s u f f i c i e n t v a r i e t y o f f o o d g r o u p s ?
57
provided less thiamine and riboflavin compared to the multiple-food group dishes. A notable
observation is that riboflavin was generally low in all the dishes.
D I S C U S S I O N
S t r e e t F o o d P r o d u c t s a n d F o o d G r o u p s
Street food items sold in Nairobi represent all the FAO food groups. The cereals group is,
however, dominant among street foods as these are known to be generally cheaper than other
food groups. This supports the hypothesis that street food vendors sell mainly foods from
cheap food groups. The FAO food grouping, however, has some limitations as it masks the
fats and oils used in the products. Grouping such products as mixed dishes can also give the
wrong impression.
There is absence of traditional coarse grains (like sorghum and millet), roots and
tubers (such as taro, sweet potato and cassava) and vegetables (such as amaranth) among the
list of foods commonly sold in Nairobi. This suggests a tendency towards adopting the
nutrition transition trend associated with increasing income and urbanisation (Vorster et at,
1999; Drewnowski and Popkin, 1997). As Kennedy and Reardon (1994) correctly state, this
tendency is worrisome as it poses potential adverse effect on rural production of indigenous
foods, some of which (e.g. millets and amaranth) are rich sources of micronutrients. In
addition, the production of wheat as opposed to local grains might be expensive and may not
augur well for the poor.
P r e s e n t a t i o n o f F o o d G r o u p s
Food product diversity offered depends on the local food preferences, purchasing power being
the limiting factor. Except for fruit varieties, study locations in Nairobi are similar in the
number of product varieties within food groups. Generally, cereal and animal-origin products
are the most varied. This was expected of cereals as they can be modelled into different
products and are generally cheap. Animal products can be modelled into different varieties as
well and, moreover, are made from a varied number of animal parts. The presence of more
fruits at the Industrial Area and secondly in Dandora, is a reflection of consumer preferences.
Fruit are generally expensive, contain a lot of water, are not stomach filling and hence not in
the interest of the urban poor.
In general, a high proportion of individual vendors is lacking in food group variety.
This is especially so in the Dandora LMI residential area where vendors major in cereal
products mostly consumed as petty snacks and animal origin products commonly consumed
as part of home prepared dinner and/or lunch. The association of animal origin products with
the Dandora LMI area compared to the other areas is probably due to differences in the ability
for consumers to afford certain food groups. The cost of animal-origin products is known to
C h a p t e r 3
be high and only those who can afford buy them. Hence, although this study does not address
street food consumer characteristics the links between food group array and study location is
indicative of the type of consumers found in the study areas. This contradicts Blair's (1999)
assertion that street foods are democratic in that everybody consumes the same food. It is
clear that the higher-income people are better able to afford animal-origin street food items
hence the higher supply. The aspect of purchasing power of consumers is well reflected here.
Differences are found in the proportions of vendors selling single-key nutrient foods
between the residential areas and the Industrial Area. The proportion of vendors selling only
energy-rich foods is high in both Korogocho slums and Dandora LMI and that selling only
micronutrient rich foods (only fruit in this case) is equally low in both areas. Vegetables are
never consumed on their own hence they are only sold by vendors selling mixed-nutrient
dishes. Although the proportion of vendors selling mixed nutrient foods is significantly higher
in Korogocho slums than Dandora LMI, it does not exceed the proportion selling only energy-
rich foods. These results support the hypothesis that vendors sell food items mostly made
from cheap food groups and do not include sufficient variety to provide an adequately
nutritious diet. The significant differences observed between Korogocho slums and Dandora
LMI area may be due to a higher reliance on street foods for meals in the very low- income
area compared to the LMI area. Nevertheless, it appears that the call for mixed nutrient foods
in Korogocho is not higher than that for energy-rich foods because, most likely mixed nutrient
foods cost higher. Hence, although FAO (1997c) reports that street foods may be the least
expensive and best method of obtaining a nutritionally balanced meal outside the home, the
consumer's choice, influenced by knowledge on proper food combination and ability to
purchase, is supreme. The present study does not address ways in which consumers combine
their foods when buying from vendors but it shows that a large proportion of vendors are one-
food group sellers. It is unlikely that consumers buy from different vendors to make proper
food combinations for their meals because it might be expensive to buy ready-to-eat food in
this manner. In fact, serving dishes of one-food group to consumers has been observed and
the results on the energy and nutrient contribution of some typical one- and multiple-food
group dishes show wide gaps in the provision of protein and important micronutrients. The
one-food group dishes are mainly made of cereal flours, which are especially poor in vitamin
A and riboflavin, while dairy products are absent as street foods. However, the results show
that adequate iron intake can be achieved through typical street food dishes.
Individual vendors in the Industrial Area are more abounding in food group (and also
product) diversity compared to the other areas. Most of them sell multiple food groups
providing mixed nutrients. Hence, with proper combinations, street food consumers in the
Industrial Area can be able to obtain a healthy diet from street food vendors. This does not
support the fore-stated hypothesis that vendors' foods are not heterogeneous enough to
provide an adequately nutritious diet. It appears that in working areas people are able to
58
D o v e n d o r s sel l a s u f f i c i e n t v a r i e t y o f f o o d g r o u p s ?
59
afford mixed nutrient foods and want to have a proper meal for their lunch. In addition,
Bricas' (1994) idea of individualism as one of the frames of reference that activates the
dynamics of food habits may be active in working places. In other words, while away from
household members, consumers can make individual food choices and eat what they like
provided it is within their means of purchase.
S t r e e t F o o d G r o u p s a n d V e n d o r G e n d e r
The association of more product and food group variety with female vendors is a reflection of
women's cultural tasks. They know how to cook and are used to preparing different types of
food. As such, they have a competitive advantage over men in that they can prepare foods
from different food groups. They are, hence, in a position to provide nutritionally better foods
than their male counterparts and probably make more profit. Females comprise, therefore, a
large majority of vendors where there is call for proper meals. The finding that females go
away from their homes to search for better paying markets is contrary to logical expectation.
Normally, women stay at home and men search for better paying markets. This observation
indicates the willingness and ability of women to compete using their "competitive
advantage" of being skilful in cooking the type of meals that would provide adequate
nutrition. Male vendors venture in single food group items probably due to their
incompetence unless backed by a female counterpart. This study does not investigate the role
of female spouses or labour in male vending units and how it affects food group variety.
General observations in residential areas, however, indicated that in many male vending units
with multiple food group items, females were involved in food preparation. The association
of meat products with male vendors also reflects their cultural roles.
C O N C L U S I O N S A N D P O L I C Y I M P L I C A T I O N S
Although the street food sector in Nairobi offers products from all food groups, most vendors
are one-food group sellers with cereals as the prominent group. Therefore, a high proportion
of individual vendors is lacking in food group variability for a healthy diet. The presentation
of street foods in working areas, however, implies that particularly female vendors are
capable of supplying foods in a manner that they provide variety for nutritional adequacy. But
the consumers' ability to buy dictates what is offered.
There is, therefore, the need to improve the street food group array if adequate nutrient
supply is to be realised. This is important especially in the urban poor settlements where
reliance on street foods might be high. While basic nutrition education of vendors
emphasising the need for the use of multiple food groups might help to achieve this,
consumers also need to be educated on how to achieve proper food combinations and made
aware of the benefits of healthy diets. Street food preparation processes and how these affect
the nutrient content of products need to be assessed so that bad preparation habits could be
Chapter 3
pointed out in the education package. However, there is a risk that improvement of street
foods for nutrient supply may increase prices of the foods, putting them out of reach of
consumers. Hence, a policy on fortification of cereal flours used in the preparation of popular
dishes with the deficient micronutrients without necessarily passing the cost of fortification to
the consumer is desirable. Although there are claims of fortification of some brands of
cooking oil in Kenya with vitamin A, there is no governing legislation on this and the
quantities are not regulated. In addition, introduction of energy saving cooking techniques
could also help reduce costs. For example, there is a project going on in Kenya that has
established a firewood-cooking stove that can save energy by as much as 50%. The nutrition
and home economics staff, in collaboration with poverty alleviation agencies, needs to
venture into developing such cooking technology, appropriate to street food vendors. The use
of local food crops can also prevent increase in prices. The agriculture and nutrition staff
therefore needs to encourage the use of such foods by educating both consumers and vendors
on their benefits. Although food safety and water issues are not addressed in this paper,
vendors generally lack enough water and have to buy from water vendors, thus increasing the
costs of street foods. The health staff, city authorities (especially planners and economists),
interested NGOs and the street food vendors should collaborate so as to develop a better
system with necessary amenities such as safe water supply to vending sites.
ACKNOWLEDGEMENTS Our gratitude goes to the Netherlands Foundation for the Advancement of Tropical Research
(WOTRO), file number W V 96-153, for financing the research and to the Unit of Applied
Nutrition, University of Nairobi, Kenya, for collaborating in the research.
R E F E R E N C E S
Blair D (1999). Street food vending and nutritional impact. Agriculture and Human Values, 16: 321-
323.
Bricas N (1994). Street food and trends in urban eating patterns. Children in the Tropics, 213: 36-39.
Chakravarty I, Canet C (1996). Street foods in Calcutta. Food, Nutrition and Agriculture, 17/18: 30-
37
Chauliac M, Gerbouin-Rerolle P (1994). Street food: a comprehensive approach. Children in the
Tropics, 213: 5-20. den Hartog AP, van Staveren WA, Brouwer ID (1995). Manual for social surveys on food habits and
consumption in developing countries. Magraf Verlag, Weikersheim.
Drewnowski A, Popkin BM (1997). The nutrition transition: New trends in the global diet. Nutrition Reviews, 55(2): 31-43.
FAO (1990). Street foods. Report of an FAO Expert Consultation Jogjakarta, Indonesia, 5-9
December 1988. Food and Nutrition Paper, 46.
FAO (1991). Study on street foods in Nigeria. Comparative study of the socio-economic
60
D o v e n d o r s sel l a s u f f i c i e n t v a r i e t y o f f o o d g r o u p s ?
61
characteristics of food vendors and consumers in Ibadan, Lagos and Kaduna, Nigeria. FAO, Rome and Food Basket International, Ibadan.
FAO (1992). Intercountry workshop on street foods in Africa. FAO, Regional Office for Africa, Accra.
FAO (1997a). Agriculture food and nutrition for Africa - A resource book for teachers of agriculture. FAO, Rome.
FAO (1997b). Street foods. Report of an FAO technical meeting on street foods, Calcutta, India, 6-9
November 1995. FAO Food and Nutrition paper, 63. FAO (1997c). Street food: small entrepreneurs, big business. FAO maps out future activities in
nutrition, hygiene. FAO, Rome, http://www.fao.org/news/1997/970408-e.htm Gibson RS (1990). Principles of nutritional assessment. Oxford University Press, New York. Gopalan C (1994). Trends in food consumption patterns: Impact of developmental transition. In:
Biswas MR, Gabr M (eds.), Nutrition in the nineties: Policy issues. Oxford University Press, Delhi, p.34-54.
Institute of Medicine (2001). Dietary reference intakes for vitamin A, vitamin K, arsenic, boron, chromium, copper, iodine, iron, manganese, molybdenum nickel silicon, vanadium and zinc. http://www.nap.edu/books/0309072794/html, National Academy Press, Washington.
Kennedy E, Reardon T (1994). Shift to non-traditional grains in the diets of East and West Africa:
role of women's opportunity cost of time. Food Policy, 19 (1): 45-56. Kenya, Republic of (1994). National plan of action for nutrition. Ministry of Planning and National
Development, Nairobi.
Korir SCR, Imungi JK, Muroki NM (1998). Proximate chemical composition of street foods and then-energy and protein contribution to the nutrition of manual workers in Nairobi. Ecology of Food and Nutrition, 37: 123-133.
Oguntona CRB, Kanye O (1995). Contribution of street foods to nutrient intakes by Nigerian adolescents. Nutrition and Health, 10:165-171.
Oguntona CRB, Telia TO (1999). Street foods and dietary intakes of Nigerian urban market women. International Journal of food Sciences and Nutrition, 50: 383-390.
Pearce, R (1991). Urban food subsidies in the context of adjustment. The case of Zambia. Food Policy, 16(6): 436-450.
Pearce TO, Kujore OO, Agboh-Bankole VA (1988). Generating an income in the urban environment: the experience of street food vendors in De-Ife, Nigeria. Africa, 58(4): 385-400.
Sehmi JK (1993). National food composition tables and the planning of satisfactory diets in Kenya. Ministry of Health/National Public Health Laboratory Services, Nairobi.
Streetfood Project (1992). Production and distribution of street foods: a socio-economic survey in Bogor, West Java. Working paper No.5. Ministry of Research and Technology - Indonesian Agency for Assessment and Application of Technology (BPPT), Netherlands Directorate General of International Cooperation (DGIS), Netherlands Organisation for Applied Scientific Research (TNO), Bogor Agricultural University (IPB) & Amsterdam Free University (VU). VU, Amsterdam.
Sujafha T, Shatrugna V, Rao NGV, Reddy CKG, Padmavathi KS, Vidyasagar P (1997). Street food:
C h a p t e r 3
An important source of energy for the urban worker. Food and Nutrition Bulletin, 18 (4): 318-
322.
Tinker I (1987). The case for legalizing street foods. Ceres, 20(5): 26-31.
van Loon S, Ottens L (1996). The role of street foods in the daily urban. A pilot study in Cotonou, Bénin. Wageningen University, Department of Human Nutrition, Wageningen.
Vorster HH, Bourne LT, Venter CS, Oosthuizen W (1999). Contribution of nutrition to the health
transition in developing countries: A framework for research and intervention. Nutrition
Reviews, 57(11): 341-349. World Bank (1995). Kenya Poverty Assessment. World Bank, Population and Human Resources
Division, Eastern Africa Department, Africa Region.
62
STREET FOODS IN NAIROBI: A MATTER OF QUANTITY OR QUALITY?
Alice Mboganie Mwangi, Adel P. den Hartog, Hilda van't Riet, Robert K.N. Mwadime,
Dick W. J. Foeken, Wija A.van Staveren
Submitted for publication
C h a p t e r 4
A B S T R A C T
O b j e c t i v e s : To determine the nutritional quality of street foods in Nairobi, in light of recognised
nutrition deficiencies in Kenya.
S e t t i n g , s u b j e c t s a n d m e t h o d s : A survey of 89 vendors and 240 consumers in a very low-
income slum (Korogocho), low-middle income settlement (Dandora) and work place (the
Industrial Area). The list-recall method and food composition tables were used to estimate
ingredient and nutrient quantities in food items sold by vendors. Daily adult equivalent (AE)
requirements were used to estimate nutrient adequacy.
R e s u l t s : Street foods were commonly used for breakfast, lunch, major afternoon snack and petty
snacks. Mean energy, protein, iron and vitamin A per serving of breakfast and snack foods was 2
- 20% of AE. Major meals (lunch), which were hardly served in Dandora, provided significantly
higher vitamin A per serving in the Industrial Area than in Korogocho slums (p=0.001). A
deduced consumption pattern of a breakfast, major snack, petty snack and lunch per day from the
streets did not give adequate daily energy (<70% of adult equivalent). Protein was more than
adequate if the major meal was animal- or legume/pulse-based. Iron adequacy was achieved with
all major meal types. Vitamin A adequacy was not reached in Korogocho but was achieved with
vegetable-based meals in the Industrial Area.
C o n c l u s i o n s : Street foods in Nairobi provide less than adequate energy and vitamin A, but more
than adequate protein and iron. Trading off the extra protein with energy dense ingredients in
street foods is desirable. A clear policy on vitamin A fortification of commonly used street food
ingredients needs to be addressed.
Descriptors: street food quality; Nairobi; urban poor; nutrient adequacy.
I N T R O D U C T I O N
Increased reliance on street foods has been identified as one of the characteristics of urban
food distribution systems driven by changes in the urban way of life and poverty in
developing countries (FAO, 1998). Factors contributing to increased reliance on street foods
include constraints on time, the need to substitute labour-intensive foods for more readily
available foods and the need for affordable ready-to-eat food (Levin et al, 1999; Argenti,
2000, Mwangi et al, 2001). It is estimated that poor households in some Asian cities spend as
much as 25-30% of their household expenditure on street foods (FAO, 1990; Sujatha et al,
1997). Hence street foods can assure food security for low-income urban populations who
find the foods cheap compared to those from other ready-to-eat food sources (WHO, 1996).
Yet, it is not clear whether street foods are only a matter of satisfying energy needs or they
are also complementary in protein and micronutrient supply.
The micronutrient quality of street foods has been questioned albeit being reported to
provide substantial energy and protein in the diets of urban population groups (Webb and
Hyatt, 1988; Streetfoods Project, 1989; Monnier and Chauliac, 1994; Oguntona and Kanye,
1995; Sujatha et al, 1997; A g Bendech et al, 1998; Korir et al, 1998; Oguntona and Telia,
1999), whilst available literature suggests them as cheap and tasty (Chakravarty and Canet,
64
•Street f o o d s : Q u a n t i t y o r Q u a l i t y ?
1996; Winarno and Allain, 1991; Tinker, 1997). According to Levin et al (1999), street foods
in Accra, Ghana, contributed mainly to dietary bulk than quality, while Mwangi et al. (in
press) reported most food sold in parts of Nairobi, Kenya, as lacking variety in terms of food
groups and mainly based on cereal products.
International organisations like the FAO have paid particular attention to the safety of
street foods and much less to the composition and the preservation of their nutritional quality.
When studies take nutritional quality of street foods into account, they have mainly focused
on their contribution to energy and protein intake while their micronutrient quality is less
studied. This is true in studies conducted in Kenya. The only study which has assessed the
nutritional value of street food meals served to manual construction workers in Nairobi (Korir
et al, 1998), unfortunately, did not include snack foods and meals served to other types of
consumers and it focused only on the proximate chemical composition of the foods. Given
the devastating and increasing malnutrition rates among Kenyan low-income populations
(Mwangi, 1995; Kenya and UNICEF, 1998; Kenya, 1998; Kenya and UNDP, 1999),
understanding the micronutrient accessibility through the major food systems of the poor is
paramount (WHO/FAO, 1992; Kenya, 1994; Mwadime and Oyunga, 1998).
The objective of this study is to determine the nutritional quality of street foods with
special reference to Nairobi and the nutrition situation in Kenya. The study attempts to
answer the following two questions: D o street foods satisfy only energy needs or are they
more complementary in terms of supplying protein and micronutrients, particularly vitamin A
and iron? D o street foods in Nairobi provide adequate energy and nutrients? This study
focuses on energy, protein, vitamin A and iron because they are the recognised public health
nutritional deficiencies in Kenya (Kenya, 1994). W e hypothesise that protein and
micronutrient dense foods would be generally more expensive in urban areas and may not be
adequately incorporated in street food products in order to maintain low prices. This might
place most users of these foods at increased risk of low protein intake and micronutrient
deficiency.
M E T H O D S
A survey was conducted in a very low-income slum settlement (Korogocho), a lower-middle
income residential area (Dandora) and a working area (the Industrial Area) of Nairobi, in
February and March 1999. Preliminary exploration of the City of Nairobi (Mwangi et al,
2001) revealed that higher income residential areas were not frequented with street food
vendors hence not represented in this study. Selection of vendors involved a 2-stage sampling
method. A systematic cluster technique was used to create a sampling frame of the vendors.
Korogocho had two main earthen-roads frequented by street food vendors while Dandora had
three previously tarred roads. The total length of the roads was approximately 1.5 Km in
Korogocho and 2.0 Km in Dandora. Each road was divided into approximately 50-metre
stretch clusters separated by roughly 100-metre stretches. The 50-metre stretches formed the
65
C h a p t e r 4
study clusters in the two areas. There were 8 and 11 clusters selected in Korogocho slums and
Dandora low-middle income area respectively. In the Industrial Area, there was one main
road (Enterprise Road) from which streets frequented by food vendors systematically
branched. Every alternate branch formed the study clusters, resulting in 5 selected clusters.
All vendors in the clusters were listed according to the type of food products they sold.
Because the sampling aim was to include all types of street food products encountered, at
least four vendors per type of food product were randomly selected from the lists. For some
food products, there were less than four vendors in the sampling list and such vendors were
automatically included in the study. The number of vendors selected was 34 in Korogocho
slums, 37 in Dandora low-middle income area and 18 in the Industrial Area.
D a t a C o l l e c t i o n
Using a structured pre-tested questionnaire and interviewers, the names of all food products
sold by each selected vendor and their ingredients were recorded. Methods of food
preparation, quantities of ingredients used per pot, number of pots prepared and average
number of portions (including those consumed by family members) obtained from each pot
were inquired from the vendors. In addition, the product serving combinations, the kind of
daily meal for which the servings were intended, the place of each food item in the meal and
the costs per serving were recorded. To ascertain the extent of the pattern of usage of street
foods for the various daily meals and snacks, 2 or 3 consumers per vendor were asked how
frequently (number of days per week) they used street foods for breakfast, morning snack,
lunch, afternoon snack and dinner. Most commonly consumed foods for the various meals
and snacks were also recorded. The consumers also identified foods they consumed as a
major snack or a petty snack. The number of consumers interviewed was 84 in Korogocho
slums, 102 in Dandora low-middle income area and 54 in the Industrial Area.
E s t i m a t i o n o f I n g r e d i e n t Q u a n t i t i e s
Although weighing and recording is the most accurate method of estimating food ingredient
quantities, it was too complicated to use this method in the urban context of street foods.
Many vendors, especially in the Industrial Area, prepared their foods at home and it was
difficult to trace their different homes for ingredient weighing. Hence, to estimate the
quantities of ingredients used per pot, the list-recall method (Gibson, 1990), modified to suit
the street food situation, was used. Following the list of ingredients provided for each food
product, vendors were asked to recall the usual quantities of each ingredient they used per
pot. The quantities were reported in terms of weight or other measures used in the local
markets, such as bunches, heaps, bags and containers of various sizes. Fruit and cabbage were
reported in terms of sizes according to food models presented to the vendors. The
interviewers then visited the local markets and weighed at least two of each of the various
food ingredients according to the recorded market measures and prices. Foods with inedible
66
•Street f o o d s : Q u a n t i t y o r Q u a l i t y ?
portions (such as potatoes, fruit and vegetables) were purchased in form of the recorded
market measures and the proportion of edible portions estimated.
D a t a T r e a t m e n t a n d A n a l y s i s
Preparation processes of food items were each summarised to give a brief description of
individual products. It was assumed that the ingredients used per pot were evenly distributed
among the number of portions obtained from each pot of cooked food. Energy and nutrients
provided by the foods were calculated using the Kenya food composition table (Sehmi,
1993). For a few foods that were not listed in this table the food composition table for foods
commonly eaten in East Africa (West et ai, 1988) was used. Proximate composition analysis
using official methods of analysis (AOAC, 1984) was carried out on deep-fried foods to
ascertain the quantity of fat absorbed by the products. This was achieved by buying two food
samples from each of the vendors selling the products, weighing and blending them together
before analysis. Vitamin A was expressed in terms of retinol equivalent (RE), using a ratio of
I 6:1 for conversion of provitamin A carotenoids to retinol (Sehmi, 1993).
The food products were assigned to meal or snack category if more than 25% of the
consumers reported to buy the particular food for the given meal or snack. However, the
results of only the most commonly sold food products are presented. The most commonly
sold foods within a category were considered to be those products whose frequency of
encounter was at least a third of the highest product frequency within the category. For
example, if the highest frequency of encounter of a product in the breakfast category was 9,
then all products whose frequency of encounter as a breakfast food item was less than 3 were
not considered to be common breakfast foods. In addition, if one-third or more consumers
reported to utilise street foods for a specific meal or snack for at least 4 days per week, then
\ street foods were considered to be important for that particular meal or snack.
To determine energy and nutrient adequacy, the recommended daily allowances
(RDAs) of an average Kenyan adult male (weighing 65 Kg) doing light work were used as
references known as adult equivalents (AE) (Sehmi, 1993). Adequacy levels were presented
as proportions of the AE. The references used were 2600 Kcal (1 Kcal = 4.18 Kj) energy, 50
g protein, 30% energy from fat, lOmg iron and 750fig retinol equivalent for vitamin A
(Sehmi, 1993). A deduced pattern of consumers obtaining a breakfast, a major snack, a petty
snack and one major meal (lunch) was used to determine the average energy and nutrient
adequacy of street foods because street foods were frequently consumed for the particular
meals and snacks. The foods were considered to be nutritionally adequate if the combined ! meals and snacks of the deduced consumption pattern provided at least 70% of the
corresponding AE. A parallel study in Korogocho and Dandora had revealed that breakfast,
snacks and lunch contributed about 70% of the daily energy intake of consumers while
breakfast and snacks alone contributed 40% of the daily energy intake in Dandora (van't Riet
67
C h a p t e r 4
et al, in press). Since only five meal observations were encountered in Dandora, the 40%
nutritional adequacy of only breakfast and snack foods was used.
The x2, 0 and Cramer's V statistic tests were performed to compare proportions. The
student's Mest and the one-way analysis of variance were used to test mean differences
where appropriate. Significance level of p = 0.05 was used in all the tests.
R E S U L T S
D e s c r i p t i o n o f t h e F o o d s
All the selected 89 vendors and 240 consumers participated in the study. The average number
of food items recorded per vendor was 1.3 in Korogocho slums and Dandora low-middle
income area and 3.1 in the Industrial Area. Out of a total of 148 food item records, 2.7% (3
records in Dandora and one in Korogocho) was discarded due to incomplete data.
Four main categories of street food products were identified. The categories were
breakfast, major snacks, petty snacks and major meals. Major meals were mainly lunch and
less often dinner. A fifth category, fruit salads, was encountered in the Industrial Area with
only three out of 89 vendors. In Table 1, the most common food products under each
category are described. Foods commonly consumed for breakfast were also commonly
consumed as major snacks. Mandazi, kaimati and chapati were mostly taken home and
consumed in combination with tea for breakfast. Hence they were more common at the
residential areas than in the working areas. Chapati was also sold for lunch with a side dish.
Petty snack foods were found in all three areas.
The major meals usually consisted of a main and a side dish. The main dishes
included cereals, starchy roots and mixed foods. The cereals and starchy roots were often
fried in fat. Many mixed foods also included fat. The side dishes were cereal-, animal-,
legume/pulse- or vegetable-based. Among the main dishes sold for lunch, chapati in the
Industrial Area was always served with a side dish but it was not necessarily so in Korogocho
slums and Dandora low-middle income area. Githeri, chips and kienyeji were commonly
consumed on their own. Ugali and mchele/wali were always served with a side dish. It was
possible to serve a main dish with any one or with different combinations of the (plant or
animal origin) side dishes. Combinations counted were as many as 25 in the Industrial Area,
12 in Korogocho slums and only 3 in Dandora. Fruit and fruit salads were occasionally
served in the Industrial Area but not always with a major meal.
Portion sizes of breakfast and major snack foods ranged between 42g (mandazi in
Korogocho slums) and 485g (chapati na chai in Dandora low-middle income area). Petty
snacks weighed between 9.3g (simsim in Dandora) and 108g (samosa vyazi in Korogocho).
N o significant differences across study locations were observed in the mean portion sizes and
the mean price per portion of breakfast, major snack and petty snack foods. Major meal sizes
ranged from 155g (chips in Korogocho and Dandora) to 1230g (githeri & uji in the Industrial
68
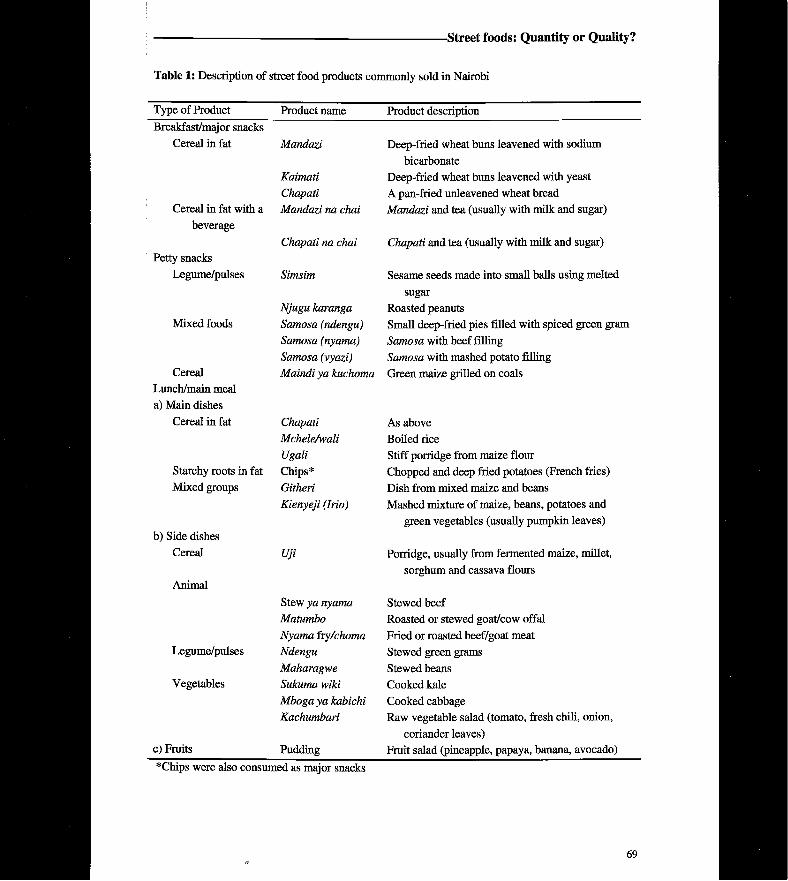
•Street f o o d s : Q u a n t i t y o r Q u a l i t y ?
Table 1: Description of street food products commonly sold in Nairobi
Type of Product Product ñame Product description Breakfast/major snacks
Cereal in fat Mandazi Deep-fried wheat buns leavened with sodium bicarbonate
Kaimati Deep-fried wheat buns leavened with yeast Chapan A pan-fried unleavened wheat bread
Cereal in fat with a Mandan na chai Mandazi and tea (usually with milk and sugar) beverage
Chapati na chai Chapati and tea (usually with milk and sugar) Petty snacks
Legume/pulses Simsim Sesame seeds made into small balls using melted sugar
Njugu ¡caranga Roasted peanuts Mixed foods Sarnosa (ndengu) Small deep-fried pies filled with spiced green gram
Sarnosa (nyama) Samosa with beef filling Sarnosa (vyazi) Samosa with mashed potato filling
Cereal Maindi ya kuchoma Green maize grilled on coals Lunch/main meal a) Main dishes
Cereal in fat Chapati As above McheleAvali Boiled rice Ugali Stiff porridge from maize flour
Starchy roots in fat Chips* Chopped and deep fried potatoes (French fries) Mixed groups Githeri Dish from mixed maize and beans
Kienyeji (Irio) Mashed mixture of maize, beans, potatoes and green vegetables (usually pumpkin leaves)
b) Side dishes Cereal Uji Porridge, usually from fermented maize, millet,
sorghum and cassava flours Animal
Stew ya nyama Stewed beef Matambo Roasted or stewed goat/cow offal Nyama ívj/choma Fried or roasted beef/goat meat
Legume/pulses Ndengu Stewed green grams Maharagwe Stewed beans
Vegetables Sukuma wiki Cooked kale Mboga ya kabichi Cooked cabbage Kachumbari Raw vegetable salad (tomato, fresh chili, onion,
coriander leaves) c) Fruits Pudding Fruit salad (pineapple, papaya, banana, avocado)
*Chips were also consumed as major snacks
69
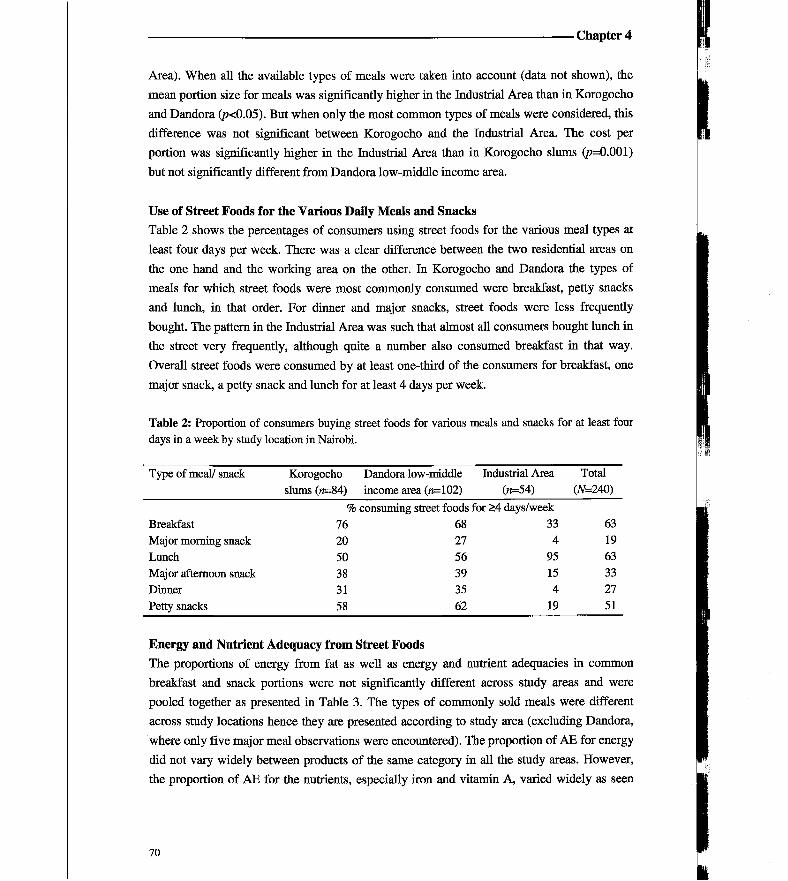
Chapter 4
Area). When all the available types of meals were taken into account (data not shown), the
mean portion size for meals was significantly higher in the Industrial Area than in Korogocho
and Dandora (p<0.05). But when only the most common types of meals were considered, this
difference was not significant between Korogocho and the Industrial Area. The cost per
portion was significantly higher in the Industrial Area than in Korogocho slums (p=0.001)
but not significantly different from Dandora low-middle income area.
Use of Street Foods for the Various Daily Meals and Snacks Table 2 shows the percentages of consumers using street foods for the various meal types at
least four days per week. There was a clear difference between the two residential areas on
the one hand and the working area on the other. In Korogocho and Dandora the types of
meals for which street foods were most commonly consumed were breakfast, petty snacks
and lunch, in that order. For dinner and major snacks, street foods were less frequently
bought. The pattern in the Industrial Area was such that almost all consumers bought lunch in
the street very frequently, although quite a number also consumed breakfast in that way.
Overall street foods were consumed by at least one-third of the consumers for breakfast, one
major snack, a petty snack and lunch for at least 4 days per week.
Table 2: Proportion of consumers buying street foods for various meals and snacks for at least four days in a week by study location in Nairobi.
Type of meal/ snack Korogocho Dandora low-middle Industrial Area Total slums («=84) income area (n=102) (n=54) (#=240)
% consuming street foods for >4 days/week Breakfast 76 68 33 63 Major morning snack 20 27 4 19 Lunch 50 56 95 63 Major afternoon snack 38 39 15 33 Dinner 31 35 4 27 Petty snacks 58 62 19 51
Energy and Nutrient Adequacy from Street Foods The proportions of energy from fat as well as energy and nutrient adequacies in common
breakfast and snack portions were not significantly different across study areas and were
pooled together as presented in Table 3. The types of commonly sold meals were different
across study locations hence they are presented according to study area (excluding Dandora,
where only five major meal observations were encountered). The proportion of A E for energy
did not vary widely between products of the same category in all the study areas. However,
the proportion of A E for the nutrients, especially iron and vitamin A, varied widely as seen
70
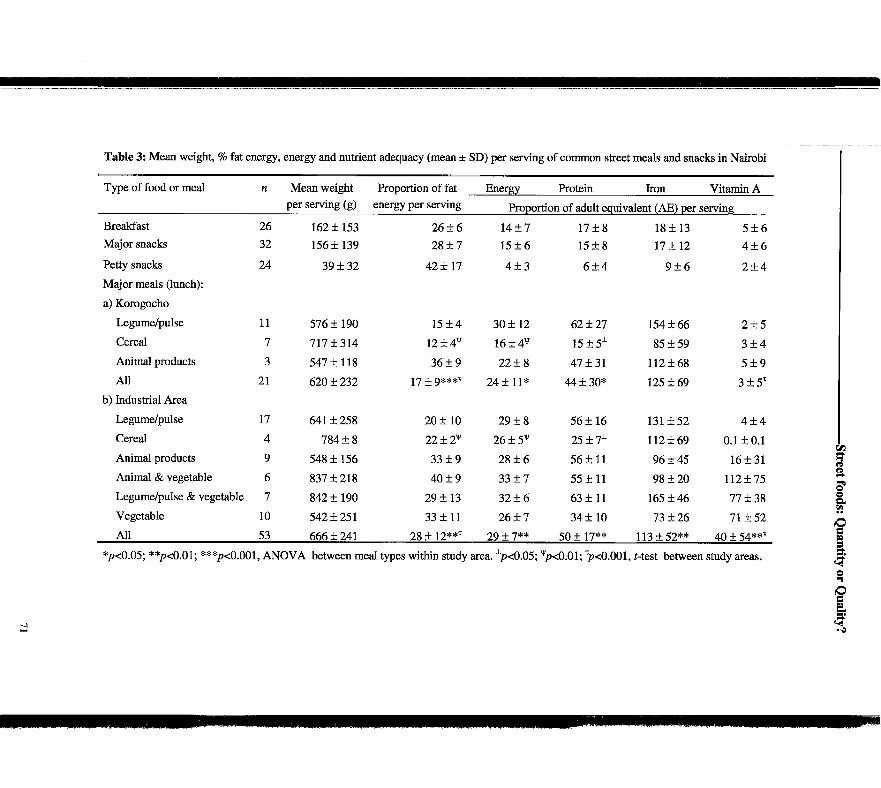
Table 3: Mean weight, % fat energy, energy and nutrient adequacy (mean ± SD) per serving of common street meals and snacks in Nairobi
Type of food or meal n Mean weight Proportion of fat Energy Protein Iron Vitamin A per serving (g) energy per serving Proporti an of adult equivalent (AE) per serving
Breakfast 26 162 ± 1 5 3 2 6 ± 6 1 4 ± 7 17 ± 8 18 ± 1 3 5 ± 6 Major snacks 32 156 ± 1 3 9 28 ± 7 15 ± 6 15 ± 8 17 ± 1 2 4 ± 6
Petty snacks 24 39 + 32 42 ± 1 7 4 ± 3 6 ± 4 9 ± 6 2 ± 4 Major meals (lunch):
a) Korogocho
Legume/pulse 11 576 ± 1 9 0 1 5 ± 4 30 ± 1 2 62 ± 2 7 154 ± 6 6 2 ± 5 Cereal 7 7 1 7 ± 3 1 4 1 2 ± 4 V 1 6 ± 4 V 1 5 ± 5 X 85 ± 5 9 3 ± 4 Animal products 3 547 ± 1 1 8 36 ± 9 22 ± 8 47 ± 3 1 112 ± 6 8 5 ± 9 All 21 620 ± 2 3 2 17 -|- 2 4 ± 1 1 * 44 ± 3 0 * 125 ± 69 3 ± 5 T
b) Industrial Area
Legume/pulse 17 641 ± 2 5 8 20 ± 1 0 29 ± 8 56 ± 1 6 131 ± 5 2 4 ± 4 Cereal 4 784 ± 8 2 2 ± 2 V 2 6 ± 5 V 2 5 ± 7 X 112 + 69 0.1 ±0 .1 Animal products 9 548 ± 1 5 6 33 ± 9 28 ± 6 56 ± 1 1 96 ± 4 5 16 ± 3 1 Animal & vegetable 6 837 ± 2 1 8 40 ± 9 3 3 ± 7 55 ± 1 1 98 ± 2 0 1 1 2 ± 7 5 Legume/pulse & vegetable 7 842 ± 1 9 0 29 ± 1 3 3 2 ± 6 63 ± 1 1 165 ± 4 6 77 ± 3 8 Vegetable 10 542 ±251 33 ± 1 1 2 6 ± 7 34 ± 1 0 73 ± 2 6 71 ± 5 2 All 53 666 ± 2 4 1 28 ± 12**T 29 + 7 * * 50 ± 1 7 * * 113 ± 5 2 * * 40 ± 54** T
sp<0.05; **p<0.01; ***/><0.001, ANOVA between meal types within study area. ^ O . O S ; v p<0.01; ><0.001, Mest between study areas.
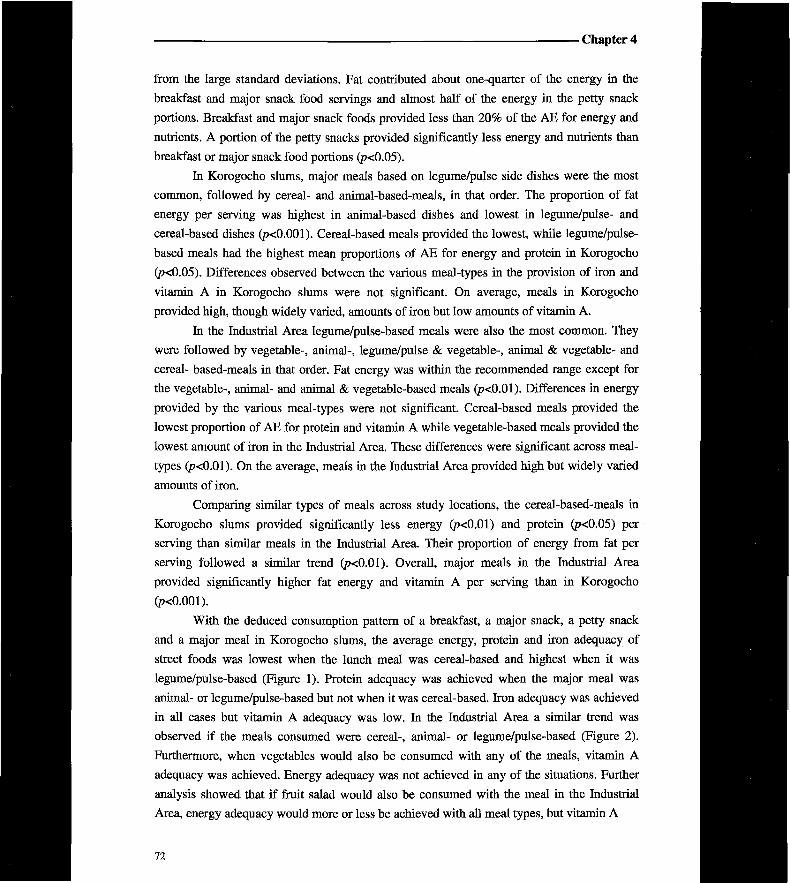
C h a p t e r 4
from the large standard deviations. Fat contributed about one-quarter of the energy in the
breakfast and major snack food servings and almost half of the energy in the petty snack
portions. Breakfast and major snack foods provided less than 20% of the AE for energy and
nutrients. A portion of the petty snacks provided significantly less energy and nutrients than
breakfast or major snack food portions (p<0.05).
In Korogocho slums, major meals based on legume/pulse side dishes were the most
common, followed by cereal- and animal-based-meals, in that order. The proportion of fat
energy per serving was highest in animal-based dishes and lowest in legume/pulse- and
cereal-based dishes (p<0.001). Cereal-based meals provided the lowest, while legume/pulse-
based meals had the highest mean proportions of A E for energy and protein in Korogocho
(p<0.05). Differences observed between the various meal-types in the provision of iron and
vitamin A in Korogocho slums were not significant. On average, meals in Korogocho
provided high, though widely varied, amounts of iron but low amounts of vitamin A.
In the Industrial Area legume/pulse-based meals were also the most common. They
were followed by vegetable-, animal-, legume/pulse & vegetable-, animal & vegetable- and
cereal- based-meals in that order. Fat energy was within the recommended range except for
the vegetable-, animal- and animal & vegetable-based meals (p<0.01). Differences in energy
provided by the various meal-types were not significant. Cereal-based meals provided the
lowest proportion of A E for protein and vitamin A while vegetable-based meals provided the
lowest amount of iron in the Industrial Area. These differences were significant across meal-
types (p<0.01). On the average, meals in the Industrial Area provided high but widely varied
amounts of iron.
Comparing similar types of meals across study locations, the cereal-based-meals in
Korogocho slums provided significantly less energy (p<0.01) and protein (p<0.05) per
serving than similar meals in the Industrial Area. Their proportion of energy from fat per
serving followed a similar trend (p<0.01). Overall, major meals in the Industrial Area
provided significantly higher fat energy and vitamin A per serving than in Korogocho
(p<0.001).
With the deduced consumption pattern of a breakfast, a major snack, a petty snack
and a major meal in Korogocho slums, the average energy, protein and iron adequacy of
street foods was lowest when the lunch meal was cereal-based and highest when it was
legume/pulse-based (Figure 1). Protein adequacy was achieved when the major meal was
animal- or legume/pulse-based but not when it was cereal-based. Iron adequacy was achieved
in all cases but vitamin A adequacy was low. In the Industrial Area a similar trend was
observed if the meals consumed were cereal-, animal- or legume/pulse-based (Figure 2).
Furthermore, when vegetables would also be consumed with any of the meals, vitamin A
adequacy was achieved. Energy adequacy was not achieved in any of the situations. Further
analysis showed that if fruit salad would also be consumed with the meal in the Industrial
Area, energy adequacy would more or less be achieved with all meal types, but vitamin A
72
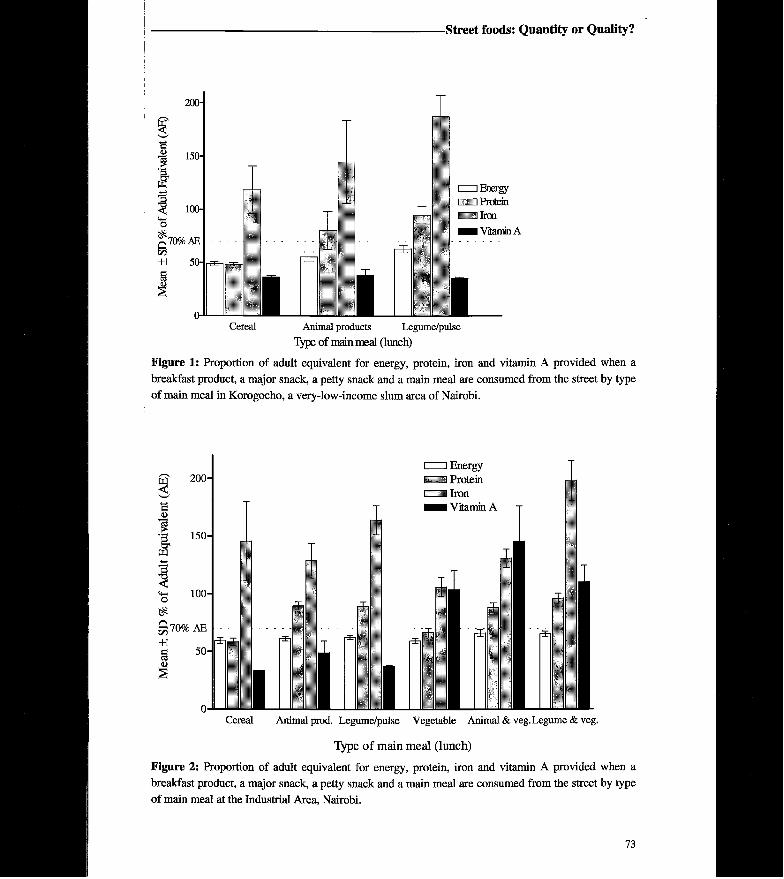
•Street f o o d s : Q u a n t i t y o r Q u a l i t y ?
1
200-
150-
< 100-1
1 g70%AE
+1 50- 1
1 Energy
i iTmn ^•Vitamin A
Cereal Animal products Legume/pulse Type of main meal (lunch)
F i g u r e 1: Proportion of adult equivalent for energy, protein, iron and vitamin A provided when a breakfast product, a major snack, a petty snack and a main meal are consumed from the street by type of main meal in Korogocho, a very-low-income slum area of Nairobi.
<U
200-
150-s I «4-1 O
§ 7 0 % AE
100-
+1 50- M
1 Energy Protein
i i Iron Vitamin A T
i ,
"rli
I
l i l
Cereal Animal prod. Legume/pulse Vegetable Animal & veg. Legume & veg.
Type of main meal (lunch)
F i g u r e 2: Proportion of adult equivalent for energy, protein, iron and vitamin A provided when a breakfast product, a major snack, a petty snack and a main meal are consumed from the street by type of main meal at the Industrial Area, Nairobi.
73
Chapter 4
adequacy remained low with cereal- and legume/pulse-based meals. On average, a serving of
fruit salad provided 7% and 20% of A E for energy and vitamin A respectively.
For Dandora low-middle income area, consumption of a breakfast, a major snack and a petty
snack would achieve the 40% adequacy for iron (45%) but not for energy (33%), protein
(38%) and vitamin A (11%).
DISCUSSION The results of this study indicate that street foods in Nairobi are not just a matter of satisfying
energy needs. While breakfast and major snacks are mainly cereal-based, lunch and most
petty snacks are more of varied composition. Lunch is mainly legume/pulse-based. One
reason for this may be that legumes and pulses are the cheapest sources of protein and are
relatively easily accessible. The filling nature of legumes and pulses also contributes to their
popularity. With the same amount of money, hunger satiation may be better achieved with
legume and pulse meals than with meals based on animal or vegetable products.
It is quite clear from the data that street foods are not commonly served as meals in
the low-middle income residential area. This is probably because most residents of such areas
usually work away from home during the day or they consume street foods less regularly than
those living in the very low-income areas (van't Riet et al, 2001).
Lunch meals are less varied in Korogocho slums than in the Industrial Area. None of
the common dishes in the Korogocho slums contain vegetables and dishes based on animal
products are the least encountered. Dishes in the Industrial Area generally have higher
amounts of cooking fat compared to those in Korogocho, a factor beneficial for the
improvement of the absorption of vitamin A. The tendency for major meals in the Industrial
Area to provide more energy per serving than meals in Korogocho could also be attributed to
their higher fat content. Further analysis (data not shown) revealed similarity in the cost of
energy per kilojoule from major meals across study locations although servings were more
expensive in the Industrial Area. This could be due to the more varied ingredients in major
meals in the Industrial Area, which may render food servings more costly in reference to fheir
energy content. Hence consumers in the Industrial Area are able to afford more varied types
of major meals than in Korogocho slums. The range of energy and protein content of street
meals in this study is comparable to the findings by Korir et al. (1998).
From the deduced pattern of consuming a breakfast food, a major snack, a petty snack
and a main meal (minus a main meal for Dandora) the results reveal that, on average, the
contribution by street foods to daily energy needs from single servings is low in all the study
areas. However, in the Industrial Area, a single lunch meal is reasonably adequate hence,
when a fruit salad is also consumed as part of lunch, the 70% of A E for energy is readily
attained. However, the small number of vendors selling fruit salad implies infrequent usage
or demand by consumers. Nevertheless, the street food energy adequacy from the deduced
consumption pattern in Nairobi is substantial. It is much higher than findings on energy
74
•Street f o o d s : Q u a n t i t y o r Q u a l i t y ?
contribution of street foods to the RDAs of consumers in Bamako (Ag Bendech et al, 1998)
but comparable to Oguntona and Telia's (1999) findings for market women in Nigeria, both
of which studies used actual food intake data. Bamako being less urbanised compared to the
cities studied in Nigeria and Nairobi, similarities between the more urbanised cities would be
expected. This is true from this study although the methods used are different. Nevertheless,
from our research data it was clear the most common pattern for street food consumption in
Nairobi was breakfast, lunch, major snack and petty snack. W e therefore used a theoretical
paradigm of this street food consumption pattern to measure energy and nutrient adequacy.
In both Korogocho slums and the Industrial Area, the deduced pattern implies more
than adequate protein if the main meal has a legume/pulse or animal-based side dish. In
Dandora low-middle income area, protein from street food breakfast and snacks is almost
adequate. Albeit most of the protein is of plant origin with a 50-60% quality, the protein
adequacy would still be achieved if a similar type and quantity of protein as eaten for lunch
were consumed during the evening meal for the consumers. Oguntona and Kanye (1995) also
found high intakes (>50% of RDA) of protein from street foods by Nigerian adolescents.
The deduced pattern shows that street foods in Nairobi are able to provide adequate
dietary iron, and even far in excess of its AE, irrespective of the type of the main meal.
Oguntona and Telia (1999) also found enormous contributions of street foods to the dietary
intake of iron among market women in Nigeria, often in excess of the RDAs. The high iron
adequacy is mainly due to its high content in legumes and nuts and in some of the animal
parts (particularly goat offal sometimes mixed with blood) that are sold as street foods. Also
worth mentioning is high iron content in sorghum flour, commonly incorporated in
preparation of fermented porridge (uji) and sold as part of a meal. However, the
bioavailability of iron in all these plant sources might be low (Hurrell, 1997).
According to the deduced consumption pattern, vitamin A adequacy is not achieved
by consuming street foods in Korogocho slums. This reflects the lack of fruit and leafy green
vegetables among the most commonly served street food dishes in Korogocho. It also implies
that poor urban people relying on street foods eat little fruit and vegetables. In the Industrial
Area, vitamin A adequacy is achieved if the main meal eaten for lunch has vegetables as one
of the side dishes. When a single serving of fruit salad would be included with an animal-
based main meal in the Industrial Area, then vitamin A adequacy would be achieved without
necessarily including a vegetable side dish. Apart from the use of fortified fats, the high
adequacy of vitamin A associated with vegetable dishes can also be attributed to the wide use
of kale (sukuma wiki) leaves, which have high levels of P-carotene (Sehmi, 1993). However,
recent findings that provitamin A carotenoids provide the body with half as much vitamin A
as previously thought (IOM, 2001) and the suggestion that the conversion factor could be
lower (West, 2000) imply low adequacies even when street food meals are vegetable-based.
A limitation of this study is that it looks into the overall portrayal of food adequacy
through street foods and does not venture into adequacies for individual consumers. Food
75
C h a p t e r 4
choice by consumers for the various meals and snacks tell more precisely the role of street
foods for adequacy. For instance, it is not unusual to encounter consumers who choose a meal
composed of only cereal products (e.g. chapati and uji), which does not provide adequate
protein. The average adequacy of nutrients obtained in this study is therefore indicative of the
general quality of street foods in terms of these nutrients. The variation in the energy content
of foods within the same category is not wide and the presented average energy adequacy can
be considered as more precise.
A further Umitation is that the bioavailability of the micronutrients in street foods has
not been addressed. Most of the iron present in street foods is non-haem and is considered to
have poor bioavaUability (Hurrell, 1997). Presence of high levels of vitamin C from fruit and
vegetables can enhance iron bioavailabilty of cereals and legumes. However, with meals
having hardly any fruit and vegetables, there may not be adequate vitamin C for this purpose.
Hence, this study may be an eye-opener to researchers to focus more on the dietary intake
levels of other micronutrients among the urban poor. Fermentation, as traditionally done with
uji, can improve the bioavailability of iron in the sorghum. Last but not least, apart from
boosting the energy content of the foods, the substantial amount of fat noted is good for
improvement of vitamin A absorption.
In conclusion, street foods in Nairobi are not just a matter of satisfying energy needs.
On the contrary, they are able to provide more than adequate protein and iron while their
ability to provide adequate energy is limited. In the very low-income areas, street foods are
also poor sources of vitamin A and the same applies to most meals in the working areas.
Hence in v iew of the Kenyan nutrition problems, inadequate vitamin A and energy are major
concerns as far as street foods' nutritional quality is concerned. Portion sizes are kept low and
fruit and vegetables are less utilised, so that the poor can afford. This prompts the need for
nutrition educators to organise and facilitate training programmes for vendors to improve and
harmonise as much as possible the nutrient content of street foods, and for consumers to be
able to make wise food choices. Trading-off the extra protein in the legume meals for energy-
rich ingredients, for instance, could be one way of improving energy adequacy. The use of
cheap vegetables such as kale needs to be emphasised while the possibilities for vendors
incorporating other cheaply available sources of micronutrients in their foods need to be
explored. While energy adequacy is of paramount importance, there is also need to focus
more on the assessment of levels of micronutrient deficiencies among the urban poor.
Exploring ways of fortifying foods commonly used as street foods in poor urban districts is
desirable. In addition, there is need for a clear policy on the fortification of fat with vitamin A
and to make such fat available and affordable to street food vendors and the poor at large.
A C K N O W L E D G E M E N T S
W e would like to thank Prof. JK hnungi and Dr. W Kogi-Makau, both of University of
Nairobi, for their support. W e also thank Provide International of Korogocho and Dandora
76
•Street f o o d s : Q u a n t i t y o r Q u a l i t y ?
Gospel Tabernacle Church for allowing us to use their premises. Our gratitude goes to all the
vendors who participated in this study for their cooperation.
REFERENCES Ag Bendech M, Chauliac M, and Malvy DJM (1998). Assessment of dietary intake at home and
outside the home in Bamako (Mali). Ecology of Food and Nutrition, 37: 135-162. AOAC, Association of the Official Analytical Chemists (1984). Official Methods of Analysis. 13 Edn.
Washington, D.C. Argenti O (2000). Feeding the cities: Food supply and distribution. In: Achieving urban food and
nutrition security in the developing world. Brief 5. IFPRI, Washington D.C. Blair D (1999). Street food vending and nutritional impact. Agriculture and Human Values 16: 321-
323. Chakravarty I, Canet C (1996). Street foods in Calcutta. Food, Nutrition and Agriculture, 17/18: 30-
37 FAO (1990). Street foods. Report of an FAO Expert Consultation Jogjakarta, Indonesia, 5-9
December 1988. FAO Food and Nutrition paper, 46. FAO (1998). The state of food and agriculture 1998. FAO, Rome. Gibson RS (1990). Principles of nutritional assessment. Oxford University Press, New York. Hurrell RF (1997). Bioavailability of iron. European Journal of Clinical Nutrition, 51 (Supplement
1): S4-S8. IOM, Instimte of Medicine (2001). Dietary reference intakes for vitamin A, vitamin K, arsenic, boron,
chromium, copper, iodine, iron, manganese, molybdenum, nickel, silicon, vanadium, and zinc. National Academy Press, http://www.nap.edu/books/0309072794/html.
Kenya, Government of (1998). Poverty in Kenya. Vol. II: Poverty and Social Indicators. Ministry of
Planning and National Development (MPND), Central Bureau of Statistics (CBS), Human Resources and Social Services, Nairobi.
Kenya, Government of and UNDP (1999). Kenya Human Development Report. Vol. II: Poverty and Social Indicators. United Nations Office, Nairobi.
Kenya, Government of and UNICEF (1998). Situation analysis of women and children in Kenya. United Nations Office, Nairobi.
Kenya, Republic of (1994). National plan of action for nutrition. Ministry of Planning and National
Development, Nairobi. Korir SCR, Imungi JK, Muroki NM (1998). Proximate chemical composition of street foods and their
energy and protein contribution to the nutrition of manual workers in Nairobi. Ecology of Food and Nutrition, 37:123-133.
Levin CE, Ruel MT, Morris SS (1999). Working women in an urban setting: Traders, vendors and food security in Accra. World Development, 27 (11): 1977-1991.
Monnier T, Chauliac M (1994). Street food and school children in Bamako. Children in the Tropics, 213: 40-51.
Mwadime RK, Oyunga AM (1998). A qualitative survey on issues related to VAD in Nyarongo Division, Homabay District. Sight and life, 4: 29-35.
Mwangi AM (1995). The role of urban agriculture for food security in low-income areas in Nairobi.
77
C h a p t e r 4
Food and Nutrition Studies Report 54/1995. Ministry of Planning and National Development/ African Studies Centre, Nairobi/Leiden.
Mwangi AM, den Hartog AP, Foeken DWJ, van't Riet H, Mwadime RKN, van Staveren WA (2001).
The ecology of street foods in Nairobi. Ecology of Food and Nutrition, 40:497-523. Mwangi AM, den Hartog AP, Mwadime RKN, van Staveren WA, Foeken DWJ (in press). Do street
food vendors sell a sufficient variety of foods for a healthy diet? The case of Nairobi. Food Nutrition Bulletin.
Oguntona CRB, Kanye O (1995). Contribution of street foods to nutrient intakes by Nigerian adolescents. Nutrition and Health, 10:165-171.
Oguntona CRB, Telia TO (1999). Street foods and dietary intakes of Nigerian urban market women. International Journal of Food Sciences and Nutrition, 50: 383-390.
Sehmi JK (1993). National food composition tables and the planning of satisfactory diets in Kenya. Ministry of Health/National Public Health Laboratory Services, Nairobi.
Streetfood Project (1989). Street foods in West Java. A base line survey. Working paper No. 1. Bogor Agricultural University (LPB), Netherlands Organization for Applied Scientific Research (TNO), Amsterdam Free University (VU). VU, Amsterdam.
Sujatha T, Shatrugna V, Rao NGV, Reddy CKG, Padmavathi KS, Vidyasagar P (1997). Street food:
An important source of energy for the urban worker. Food and Nutrition Bulletin, 18 (4): 318-322.
Tinker I (1997). Street foods. Urban food and employment in developing countries. Oxford University Press, New York.
van't Riet H, den Hartog AP, Mwangi AM, Mwadime RKN, Foeken DWJ, van Staveren W (2001). The role of street foods in the dietary pattern of two low-income groups in Nairobi. European Journal of Clinical Nutrition, 55: 562-570.
van't Riet H, den Hartog AP, van Staveren W (in press).Non-home prepared foods: contribution to energy and nutrient intake of consumers living in two low-income areas in Nairobi. Public Health Nutrition.
Webb RE, Hyatt SA (1988). Haitian street foods and their nutritional contribution to dietary intake. Ecology of Food and Nutrition, 21:199-209.
West CE, Pepping F, Temalilwa CR (1988): TTie composition of foods commonly eaten in East Africa. Wageningen Agricultural University for CTA and ECSA, Wageningen.
West CE (2000). Meeting requirements for vitamin A. Nutrition Review, 58 (11): 341-345. WHO (1996). Essential safety requirements for street-vended foods. WHO Food safety unit, Geneva. WHO/FAO (1992). Kenya country position paper on nutrition. International Conference on Nutrition
(ICN).
Winarno FG, Allain A (1991). Street foods in developing countries: lessons from Asia. Food, Nutrition and Agriculture, 1:11-18.
78
BASIC HYGIENE KNOWLEDGE AND PRACTICE OF STREET FOOD VENDORS: THE CASE OF NAIROBI
Alice Mboganie Mwangi, Emily W. Mwadime, Adel P. den Hartog, Robert KN
Mwadime, Dick WJ Foeken, Wija A van Staveren.
Submitted for publication
C h a p t e r 5
A B S T R A C T
We assessed street food vendors' knowledge of basic food hygiene in Nairobi and its relation to
hygienic practices. We hypothesised that high levels of formal education of vendors increased
knowledge on basic food hygiene principles and consequently led to better food hygiene
practices. A survey was conducted in a very-low-income slum settlement (Korogocho), a lower-
middle-income residential area (Dandora) and a working place (Industrial Area) of Nairobi.
Sixty-six street food vendors participated. Data included vendor gender, age, level of education
and whether vendors had received lessons in food hygiene and/or handling. Vendor's knowledge
of basic food hygiene was assessed using open-ended questions addressing food temperature
treatment, holding time, cross contamination and personal hygiene. Vendor practices were
assessed through interviews and observation. Knowledge of basic food hygiene did not vary with
vendors' level of formal education. However, vendors who had received lessons on food hygiene
and/or handling were 7 times more likely to attain above average scores on knowledge of basic
food hygiene than vendors who had not received lessons. Good hygiene practices were not
associated with vendors' knowledge of basic food hygiene but significantly varied between study
locations. Thus hygiene lessons are important for street food vendors' knowledge of basic food
hygiene. However, knowledge of basic food hygiene principles has no direct association with
street food vendor's level of safe food practices. Hence, consumer attitude towards food hygiene
and an enabling vending environment are probably more important factors in influencing vendor
safe food practices.
Key words: Street foods, knowledge and practice, food hygiene, food vendors.
I N T R O D U C T I O N
Street food vending in many developing countries has been viewed to provide cheap and
nutritious food for low-income people (Abdussalam & Kaferstein, 1993; FAO 1997a; 1997b).
Hence street foods have been thought to assure food security for low-income urban
populations as they also provide livelihoods for a large number of workers (WHO, 1996).
Studies assessing the safety of street foods, however, show that they are positive vectors of
foodborne diseases (van Kampen et al, 1998; Frees et al, 1998; Umoh & Odoba, 1999). In
Manila, it was found that some street vended foods were high risk factors in foodborne
cholera transmission (Lim-Quizon et al, 1994) while in Zambia, handling of cooked foods by
vendors remained a critical control point for safety (Jermini et al, 1997). Usually listed
disadvantages of street foods are that they undergo unhygienic or improper food preparation
and/or handling practices (Jayasuriya, 1994) because vendors are uneducated and lack the
appreciation of safe food handling (WHO, 1996; Taylor et al, 2000). The WHO (1993)
indicates that major hazards responsible for a large proportion of foodborne diseases include
prolonged holding at ambient temperatures foods that should be refrigerated or kept hot,
insufficiently re-heating food, people with poor personal hygiene handling food and cross
contamination of food.
80
H y g i e n e k n o w l e d g e a n d p r a c t i c e o f v e n d o r s
81
Unlike the industrialised world such as U S A (Taylor et al, 2000) and also Greece
(Matalas & Yannakoulia, 2000) where generally well-controlled food manufacturers and
restaurants (are said to) process street vended foods, most street foods in Kenya are vendor
processed without professional guidelines. Most studies on safety of street foods assess then-
level of microbiological contamination. Studies assessing vendors' knowledge and practices
of basic food hygiene are scarce. To our knowledge, only one study showed that food
vendors (in a PhiUppines university campus) were knowledgeable on topics that dealt with
health and personal hygiene, food contamination and good manufacturing procedures but a
significant gap existed between knowledge and practice on these topics (Azanza Ma, 2000).
The study, however, was conducted in an area where street-vending activities were controlled
by a campus board that issued vendors with permits upon meeting some minimum
requirements.
The purpose of this paper is to assess street food vendors' general knowledge of basic
food hygiene and how this relates to practice. This information could be useful in identifying
areas of importance for improvement of food hygiene among vendors. It is hypothesised that
vendors with higher levels of formal education have a higher level of knowledge on basic
food hygiene who consequently practice better hygiene than vendors with lower levels of
education and knowledge of basic food hygiene. In addition, female vendors being more
experienced in food preparation are likely to be more knowledgeable and to practice better
food hygiene than their male counterparts.
M E T H O D S
S e t t i n g a n d S u b j e c t s
A survey was conducted in a very low-income slum settlement (Korogocho), a lower-middle
income residential area (Dandora) and a working place (the Industrial Area) of Nairobi in
February and March 1999. Preliminary exploration of the City of Nairobi had revealed that
higher income residential areas were not frequented with street food vendors (Mwangi et al,
in press). Selection of vendors encompassed a systematic cluster technique. Korogocho had
two main earthen-roads frequented by street food vendors while Dandora had three
previously tarred roads. Each road was divided into approximately 50-metre stretch clusters
separated by roughly 100-metre stretches. The 50-metre stretches formed the study clusters in
the two areas. Out of 8 clusters in Korogocho and 11 in Dandora, 5 clusters each were
randomly selected. At the Industrial Area, there is one main road (Enterprise Road) with
streets frequented by food vendors systematically branching off. Every alternate branch was
included in the study and formed 5 study clusters. All vendors in the study clusters were
selected. The respondents were 28 in Korogocho slums, 22 in Dandora and 16 in the
Industrial Area. The respondents were thought to be representative enough as the clusters
were well spread over the study locations.
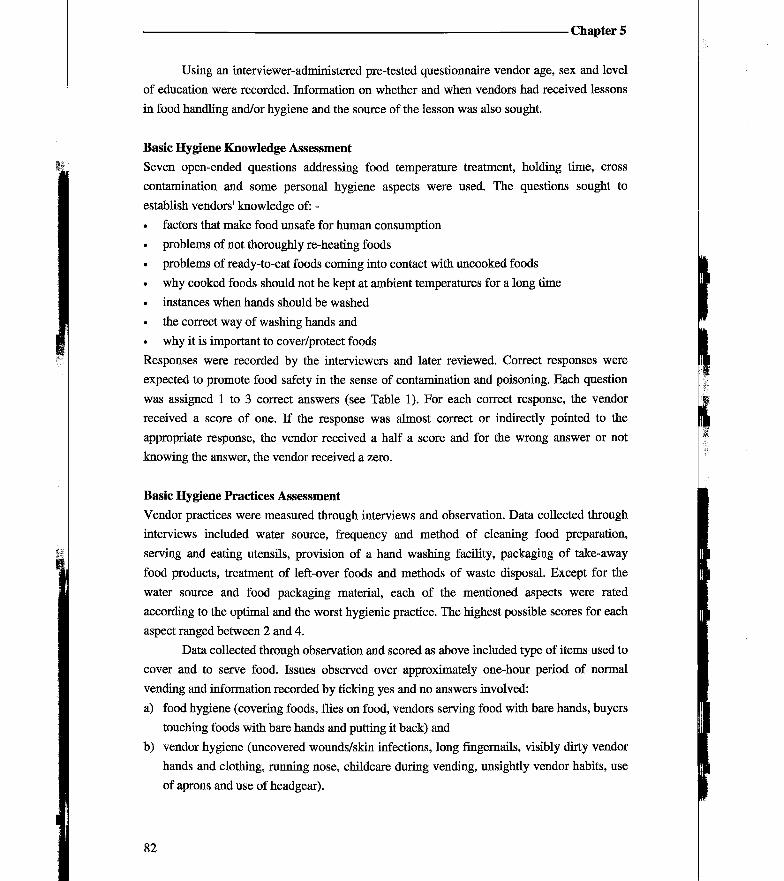
C h a p t e r 5
Using an mterviewer-administered pre-tested questionnaire vendor age, sex and level
of education were recorded. Information on whether and when vendors had received lessons
in food handling and/or hygiene and the source of the lesson was also sought.
B a s i c H y g i e n e K n o w l e d g e A s s e s s m e n t
Seven open-ended questions addressing food temperature treatment, holding time, cross
contamination and some personal hygiene aspects were used. The questions sought to
establish vendors' knowledge of: -
• factors that make food unsafe for human consumption
• problems of not thoroughly re-heating foods
• problems of ready-to-eat foods coming into contact with uncooked foods
• why cooked foods should not be kept at ambient temperatures for a long time
• instances when hands should be washed
• the correct way of washing hands and
• why it is important to cover/protect foods
Responses were recorded by the interviewers and later reviewed. Correct responses were
expected to promote food safety in the sense of contamination and poisoning. Each question
was assigned 1 to 3 correct answers (see Table 1). For each correct response, the vendor
received a score of one. If the response was almost correct or indirectly pointed to the
appropriate response, the vendor received a half a score and for the wrong answer or not
knowing the answer, the vendor received a zero.
B a s i c H y g i e n e P r a c t i c e s A s s e s s m e n t
Vendor practices were measured through interviews and observation. Data collected through
interviews included water source, frequency and method of cleaning food preparation,
serving and eating utensils, provision of a hand washing facility, packaging of take-away
food products, treatment of left-over foods and methods of waste disposal. Except for the
water source and food packaging material, each of the mentioned aspects were rated
according to the optimal and the worst hygienic practice. The highest possible scores for each
aspect ranged between 2 and 4.
Data collected through observation and scored as above included type of items used to
cover and to serve food. Issues observed over approximately one-hour period of normal
vending and information recorded by ticking yes and no answers involved:
a) food hygiene (covering foods, flies on food, vendors serving food with bare hands, buyers
touching foods with bare hands and putting it back) and
b) vendor hygiene (uncovered wounds/skin infections, long fingernails, visibly dirty vendor
hands and clothing, ranning nose, childcare during vending, unsightly vendor habits, use
of aprons and use of headgear).
82
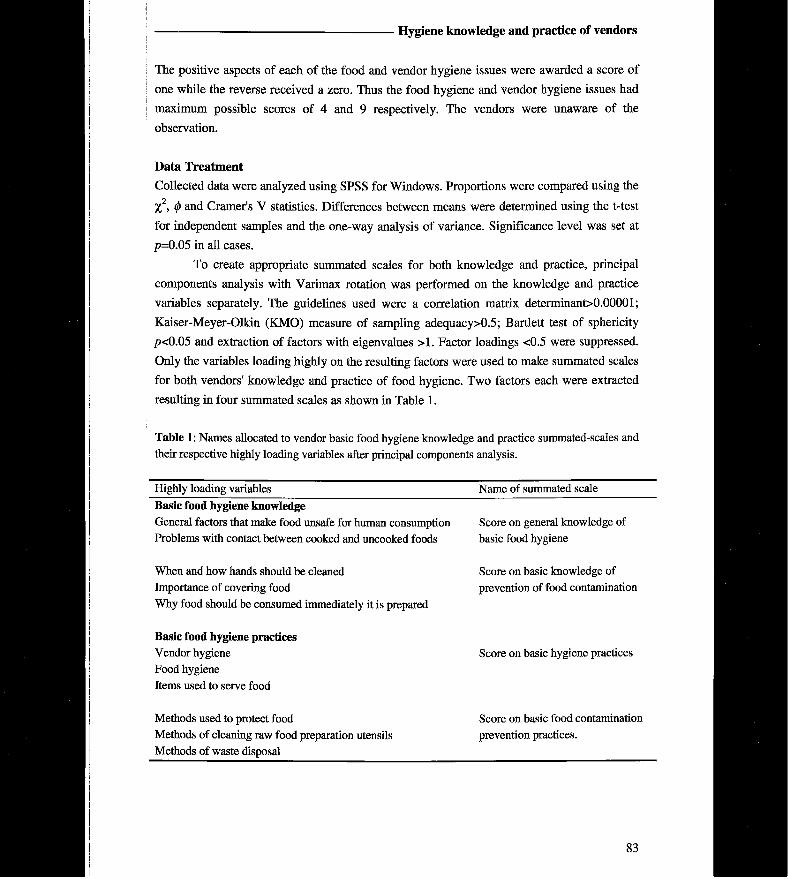
H y g i e n e k n o w l e d g e a n d p r a c t i c e o f v e n d o r s
The positive aspects of each of the food and vendor hygiene issues were awarded a score of
one while the reverse received a zero. Thus the food hygiene and vendor hygiene issues had
maximum possible scores of 4 and 9 respectively. The vendors were unaware of the
observation.
D a t a T r e a t m e n t
Collected data were analyzed using SPSS for Windows. Proportions were compared using the
X 2 , <j> and Cramer's V statistics. Differences between means were determined using the t-test
for independent samples and the one-way analysis of variance. Significance level was set at
p=0.05 in all cases.
To create appropriate summated scales for both knowledge and practice, principal
components analysis with Varimax rotation was performed on the knowledge and practice
variables separately. The guidelines used were a correlation matrix determinant>0.00001;
Kaiser-Meyer-Olkin (KMO) measure of sampling adequacy>0.5; Bartlett test of sphericity
p<0.05 and extraction of factors with eigenvalues >1 . Factor loadings <0.5 were suppressed.
Only the variables loading highly on the resulting factors were used to make summated scales
for both vendors' knowledge and practice of food hygiene. Two factors each were extracted
resulting in four summated scales as shown in Table 1.
T a b l e 1: Names allocated to vendor basic food hygiene knowledge and practice summated-scales and their respective highly loading variables after principal components analysis.
Highly loading variables Name of summated scale B a s i c food hygiene k n o w l e d g e
General factors that make food unsafe for human consumption Score on general knowledge of Problems with contact between cooked and uncooked foods basic food hygiene
When and how hands should be cleaned Score on basic knowledge of Importance of covering food prevention of food contamination Why food should be consumed immediately it is prepared
B a s i c food hygiene practices
Vendor hygiene Score on basic hygiene practices Food hygiene Items used to serve food
Methods used to protect food Score on basic food contamination Methods of cleaning raw food preparation utensils prevention practices. Methods of waste disposal
83
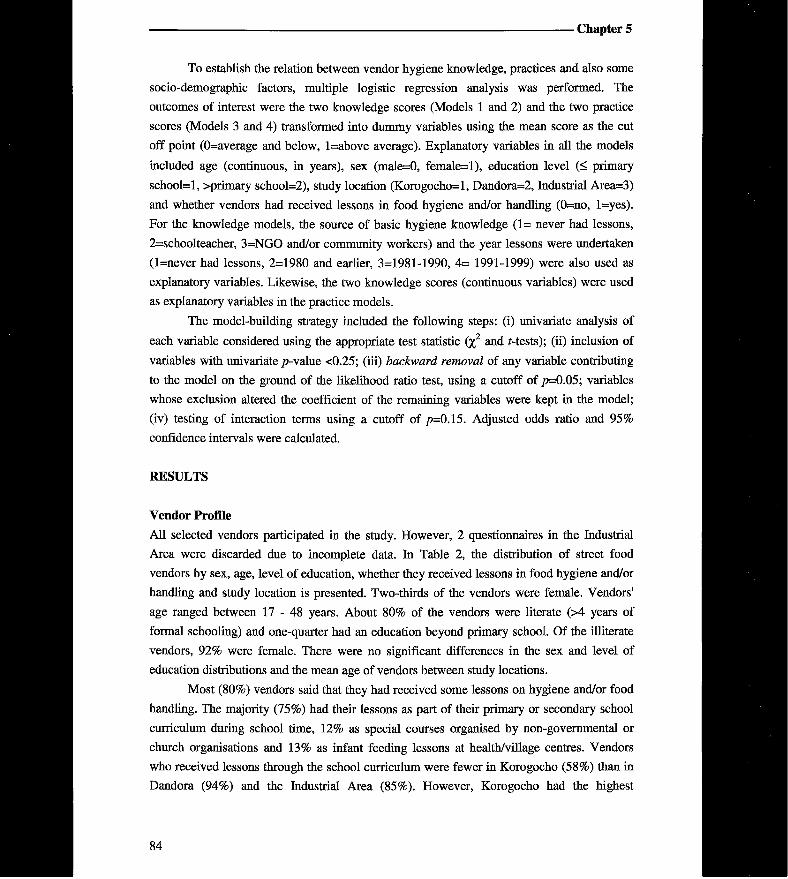
C h a p t e r 5
To establish the relation between vendor hygiene knowledge, practices and also some
socio-demographic factors, multiple logistic regression analysis was performed. The
outcomes of interest were the two knowledge scores (Models 1 and 2) and the two practice
scores (Models 3 and 4) transformed into dummy variables using the mean score as the cut
off point (0=average and below, l=above average). Explanatory variables in all the models
included age (continuous, in years), sex (male=0, female=l) , education level (< primary
school=l , >primary school=2), study location (Korogocho=l, Dandora=2, Industrial Area=3)
and whether vendors had received lessons in food hygiene and/or handling (0=no, l=yes) .
For the knowledge models, the source of basic hygiene knowledge (1= never had lessons,
2=schoolteacher, 3=NGO and/or community workers) and the year lessons were undertaken
( l=never had lessons, 2=1980 and earlier, 3=1981-1990, 4= 1991-1999) were also used as
explanatory variables. Likewise, the two knowledge scores (continuous variables) were used
as explanatory variables in the practice models.
The model-building strategy included the following steps: (i) univariate analysis of
each variable considered using the appropriate test statistic (%2 and <*-tests); (if) inclusion of
variables with univariate /rvalue <0.25; (iii) backward removal of any variable contributing
to the model on the ground of the likelihood ratio test, using a cutoff of p=0.05; variables
whose exclusion altered the coefficient of the remaining variables were kept in the model;
(iv) testing of interaction terms using a cutoff of p=0.l5. Adjusted odds ratio and 95%
confidence intervals were calculated.
RESULTS
V e n d o r P r o f i l e
All selected vendors participated in the study. However, 2 questionnaires in the Industrial
Area were discarded due to incomplete data. In Table 2, the distribution of street food
vendors by sex, age, level of education, whether they received lessons in food hygiene and/or
handling and study location is presented. Two-thirds of the vendors were female. Vendors'
age ranged between 17 - 48 years. About 80% of the vendors were literate (>4 years of
formal schooling) and one-quarter had an education beyond primary school. Of the illiterate
vendors, 92% were female. There were no significant differences in the sex and level of
education distributions and the mean age of vendors between study locations.
Most (80%) vendors said that they had received some lessons on hygiene and/or food
handling. The majority (75%) had their lessons as part of their primary or secondary school
curriculum during school time, 12% as special courses organised by non-governmental or
church organisations and 13% as infant feeding lessons at health/village centres. Vendors
who received lessons through the school curriculum were fewer in Korogocho (58%) than in
Dandora (94%) and the Industrial Area (85%). However, Korogocho had the highest
84
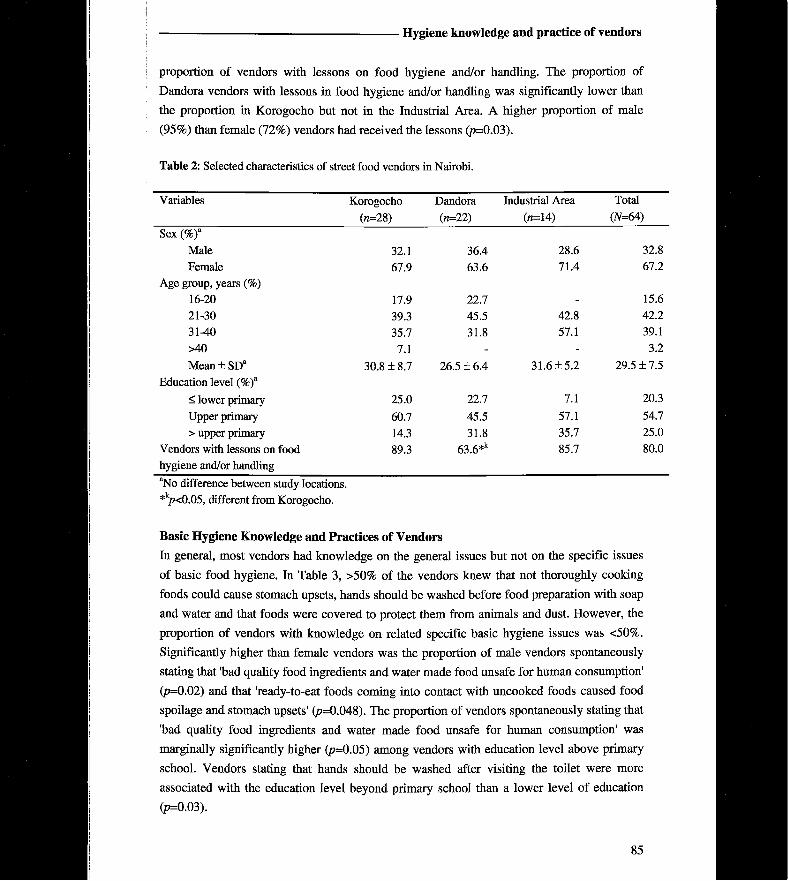
H y g i e n e k n o w l e d g e a n d p r a c t i c e o f v e n d o r s
proportion of vendors with lessons on food hygiene and/or handling. The proportion of
Dandora vendors with lessons in food hygiene and/or handling was significantly lower than
the proportion in Korogocho but not in the Industrial Area. A higher proportion of male
(95%) than female (72%) vendors had received the lessons (p=0.03).
Table 2: Selected characteristics of street food vendors in Nairobi.
Variables Korogocho Dandora Industrial Area Total
(ra=28) («=22) (n=14) (A/=64) Sex (%)"
Male 32.1 36.4 28.6 32.8 Female 67.9 63.6 71.4 67.2
Age group, years (%) 16-20 17.9 22.7 - 15.6 21-30 39.3 45.5 42.8 42.2 31-40 35.7 31.8 57.1 39.1 >40 7.1 - - 3.2
M e a n ± S D a 30.8 ± 8.7 26.5 ± 6.4 31.6 ± 5 . 2 29.5 ±7 .5 Education level (%)a
< lower primary 25.0 22.7 7.1 20.3
Upper primary 60.7 45.5 57.1 54.7 > upper primary 14.3 31.8 35.7 25.0
Vendors with lessons on food 89.3 63.6* k 85.7 80.0 hygiene and/or handling
"No difference between study locations. *kp<0.05, different from Korogocho.
B a s i c H y g i e n e K n o w l e d g e a n d P r a c t i c e s o f V e n d o r s
In general, most vendors had knowledge on the general issues but not on the specific issues
of basic food hygiene. In Table 3, >50% of the vendors knew that not thoroughly cooking
foods could cause stomach upsets, hands should be washed before food preparation with soap
and water and that foods were covered to protect them from animals and dust. However, the
proportion of vendors with knowledge on related specific basic hygiene issues was <50%.
Significantly higher than female vendors was the proportion of male vendors spontaneously
stating that Trad quality food ingredients and water made food unsafe for human consumption'
(p=0.02) and that 'ready-to-eat foods coming into contact with uncooked foods caused food
spoilage and stomach upsets' (p=0.048). The proportion of vendors spontaneously stating that
'bad quality food ingredients and water made food unsafe for human consumption' was
marginally significantly higher (¡5=0.05) among vendors with education level above primary
school. Vendors stating that hands should be washed after visiting the toilet were more
associated with the education level beyond primary school than a lower level of education
(p=0.03).
85

00 Table 3: Distribution (%) of street food vendors with positive answers on some basic food hygiene factors by sex and level of education in Nairobi.
Basic food hygiene factor Sex of vendors Education level of vendors Total Male Female <, lower primary Upper primary > Primary (N=64)
(71=21) (TZ=43) (71=13) (7i=35) (71=16)
Had lessons on hygiene and/or food handling 95* 72 39** 86 100 80 Factors that make food unsafe for human consumption
Presence of germs 33 51 62 40 44 45 Improper food storage/handling 52 54 54 54 57 55 Bad quality water/ingredients 29* 7 0 11 25 14
Problems with eating foods not thoroughly heated Stomach upsets 76 86 92 80 81 83 Diarrhea/vomiting 27 37 31 34 44 38 Worm infestation 27 28 23 31 25 28
Problems with ready-to-eat food coming into contact with uncooked foods Contamination with germs 43 51 54 51 38 48 Food spoils / stomach upset 48* 23 23 34 31 31
Instances when hands should be washed After visiting the toilet 31 40 31 31 69* 42 Before food preparation 71 67 62 71 69 69 After handling garbage/ money/ raw food 14 7 8 9 13 13
Correct way of washing hands Clean water and soap 86 88 92 83 94 86
Importance of covering food To protect from flies/dust/dirt 95 100 100 94 100 97
Advantages of eating food immediately it is prepared It has no germs 26 21 15 23 32 23 Good taste/texture/shape 67 77 92 71 56 59
*p<0.05; **p<0.01 (%, 0 and Cramer's V)
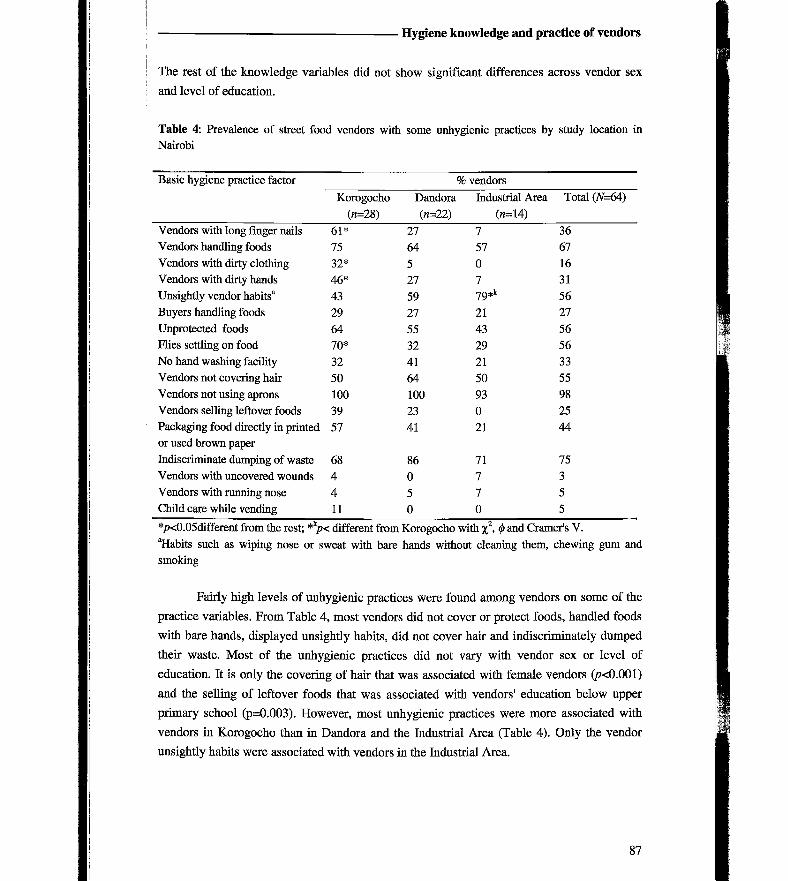
H y g i e n e k n o w l e d g e a n d p r a c t i c e o f v e n d o r s
T a b l e 4: Prevalence of street food vendors with some unhygienic practices by study location in Nairobi
Basic hygiene practice factor 9 9 vendors Basic hygiene practice factor
Korogocho (n=28)
Dandora («=22)
Industrial Area Total (/v=64) (n=14)
Vendors with long finger nails 61* 27 7 36 Vendors handling foods 75 64 57 67 Vendors with dirty clothing 32* 5 0 16 Vendors with dirty hands 46* 27 7 31 Unsightly vendor habits" 43 59 79* k
56 Buyers handling foods 29 27 21 27 Unprotected foods 64 55 43 56 Flies settling on food 70* 32 29 56 No hand washing facility 32 41 21 33 Vendors not covering hair 50 64 50 55 Vendors not using aprons 100 100 93 98 Vendors selling leftover foods 39 23 0 25 Packaging food directly in printed 57 41 21 44 or used brown paper ^discriminate dumping of waste 68 86 71 75 Vendors with uncovered wounds 4 0 7 3 Vendors with running nose 4 5 7 5 Child care while vending 11 0 0 5
*p<0.05different from the rest; *kp< different from Korogocho with %2, 0 and Cramer's V. "Habits such as wiping nose or sweat with bare hands without cleaning them, chewing gum and smoking
Fairly high levels of unhygienic practices were found among vendors on some of the
practice variables. From Table 4, most vendors did not cover or protect foods, handled foods
with bare hands, displayed unsightly habits, did not cover hair and mdiscriminately dumped
their waste. Most of the unhygienic practices did not vary with vendor sex or level of
education. It is only the covering of hair that was associated with female vendors (p<0.001)
and the selling of leftover foods that was associated with vendors' education below upper
primary school (p=0.003). However, most unhygienic practices were more associated with
vendors in Korogocho than in Dandora and the Industrial Area (Table 4). Only the vendor
unsightly habits were associated with vendors in the Industrial Area.
87
The rest of the knowledge variables did not show significant differences across vendor sex
and level of education.
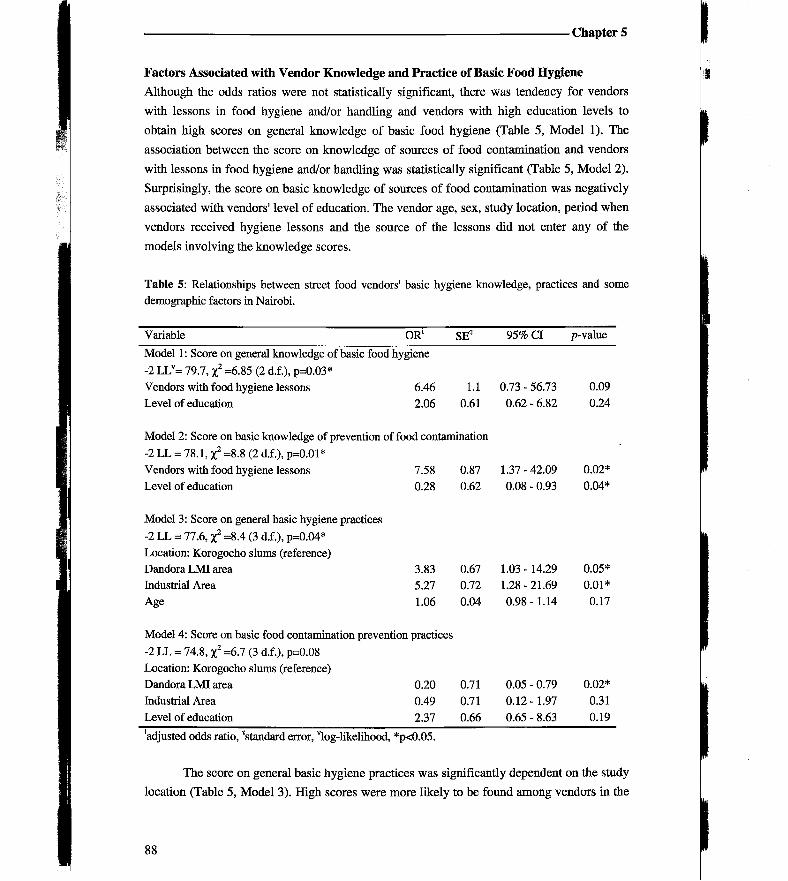
C h a p t e r 5
F a c t o r s A s s o c i a t e d w i t h V e n d o r K n o w l e d g e a n d P r a c t i c e o f B a s i c F o o d H y g i e n e
Although the odds ratios were not statistically significant, there was tendency for vendors
with lessons in food hygiene and/or handling and vendors with high education levels to
obtain high scores on general knowledge of basic food hygiene (Table 5, Model 1). The
association between the score on knowledge of sources of food contamination and vendors
with lessons in food hygiene and/or handling was statistically significant (Table 5, Model 2).
Surprisingly, the score on basic knowledge of sources of food contamination was negatively
associated with vendors' level of education. The vendor age, sex, study location, period when
vendors received hygiene lessons and the source of the lessons did not enter any of the
models involving the knowledge scores.
Table 5: Relationships between street food vendors' basic hygiene knowledge, practices and some demographic factors in Nairobi.
Variable OR1 SET 95% CI p-value
Model 1: Score on general knowledge of basic food hygiene -2 LLV= 79.7, x2 =6.85 (2 d.f.), p=0.03* Vendors with food hygiene lessons 6.46 Level of education 2.06
1.1 0.61
0.73 - 56.73 0.62 - 6.82
0.09 0.24
Model 2: Score on basic knowledge of prevention of food contamination -2 LL = 78.1, x2 =8-8 (2 d.f.), p=0.01* Vendors with food hygiene lessons 7.58 0.87 Level of education 0.28 0.62
1.37-42.09 0.08 - 0.93
0.02* 0.04*
Model 3: Score on general basic hygiene practices -2 LL = 77.6, x2 =8.4 (3 d.f.), p=0.04* Location: Korogocho slums (reference) Dandora LMI area Industrial Area Age
3.83 5.27 1.06
0.67 0.72 0.04
1.03 -14.29 1.28 - 21.69 0.98 -1 .14
0.05* 0.01*
0.17
Model 4: Score on basic food contamination prevention practices -2 LL = 74.8, x2 =6.7 (3 d.f.), p=0.08 Location: Korogocho slums (reference) Dandora LMI area 0.20 Industrial Area 0.49 Level of education 2.37
0.71 0.71 0.66
0.05 - 0.79 0.12-1.97 0.65 - 8.63
0.02* 0.31 0.19
'adjusted odds ratio, ^standard error, vlog-likelihood, *p<0.05.
The score on general basic hygiene practices was significantly dependent on the study
location (Table 5, Model 3). High scores were more likely to be found among vendors in the
88
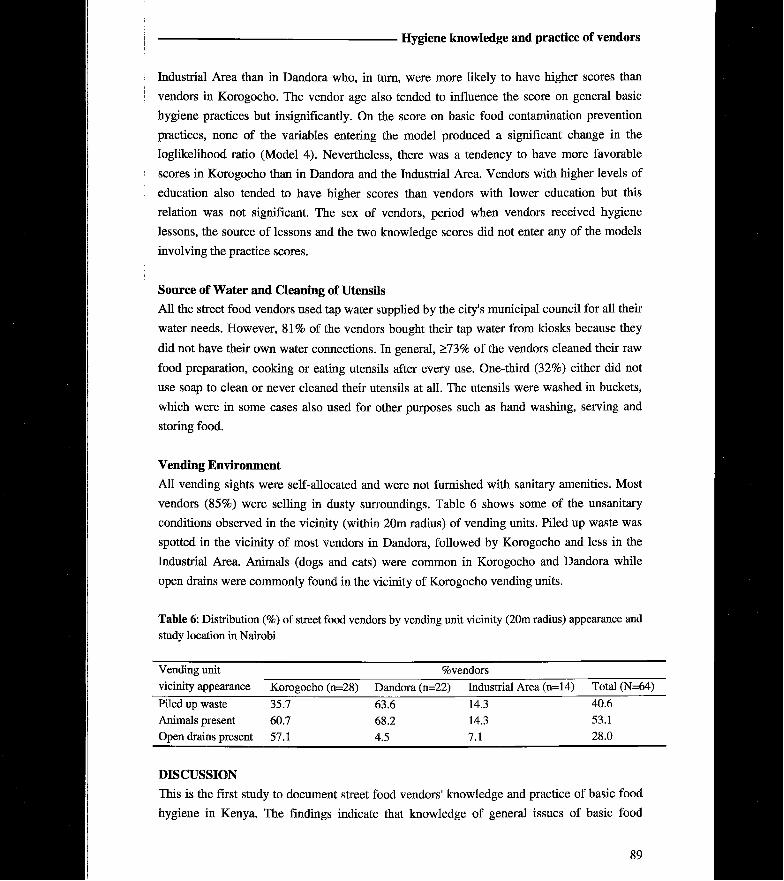
H y g i e n e k n o w l e d g e a n d p r a c t i c e o f v e n d o r s
T a b l e 6: Distribution (%) of street food vendors by vending unit vicinity (20m radius) appearance and study location in Nairobi
Vending unit vicinity appearance
%vendors Vending unit vicinity appearance Korogocho (n=28) Dandora (n=22) Industrial Area (n=14) Total (N=64)
Piled up waste 35.7 63.6 14.3 40.6 Animals present 60.7 68.2 14.3 53.1 Open drains present 57.1 4.5 7.1 28.0
D I S C U S S I O N
This is the first study to document street food vendors' knowledge and practice of basic food
hygiene in Kenya. The findings indicate that knowledge of general issues of basic food
89
Industrial Area than in Dandora who, in turn, were more likely to have higher scores than
vendors in Korogocho. The vendor age also tended to influence the score on general basic
hygiene practices but insignificantly. On the score on basic food contamination prevention
practices, none of the variables entering the model produced a significant change in the
loglikelihood ratio (Model 4). Nevertheless, there was a tendency to have more favorable
scores in Korogocho than in Dandora and the Industrial Area. Vendors with higher levels of
education also tended to have higher scores than vendors with lower education but this
relation was not significant. The sex of vendors, period when vendors received hygiene
lessons, the source of lessons and the two knowledge scores did not enter any of the models
involving the practice scores.
S o u r c e o f W a t e r a n d C l e a n i n g o f U t e n s i l s
All the street food vendors used tap water supplied by the city's municipal council for all their
water needs. However, 81% of the vendors bought their tap water from kiosks because they
did not have their own water connections. In general, >73% of the vendors cleaned their raw
food preparation, cooking or eating utensils after every use. One-third (32%) either did not
use soap to clean or never cleaned their utensils at all. The utensils were washed in buckets,
which were in some cases also used for other purposes such as hand washing, serving and
storing food.
V e n d i n g E n v i r o n m e n t
All vending sights were self-allocated and were not furnished with sanitary amenities. Most
vendors (85%) were selling in dusty surroundings. Table 6 shows some of the unsanitary
conditions observed in the vicinity (within 20m radius) of vending units. Piled up waste was
spotted in the vicinity of most vendors in Dandora, followed by Korogocho and less in the
Industrial Area. Animals (dogs and cats) were common in Korogocho and Dandora while
open drains were commonly found in the vicinity of Korogocho vending units.
C h a p t e r 5
hygiene is well established while knowledge of specific issues is less spread among street
food vendors. Food handlers should have knowledge of all the basic principles of food
hygiene.
Earlier studies on the education level of street food vendors were done in the context
of low literacy rates. Hliteracy rate among street food vendors in Ue-Ife was high with 60%
having no formal education (Pearce et al, 1988). On the contrary, most vendors in Nairobi
have attained primary school and higher levels of education. Indeed, increasingly more
educated people are joining the street food vending business probably due to lack of other
employment opportunities. This is also supported by relatively recent findings in Bangkok
(Dawson era/. , 1996).
In this study, the level of education is not significantly associated with the score on
knowledge of basic food hygiene rather it is the fact that vendors received lessons on food
hygiene and/or handling. Although most vendors received hygiene lessons in school, the
hypothesis that vendors with high level of formal education are more knowledgeable on basic
food hygiene is disputed. This probably has a bearing on the role of NGOs and community
workers who educate the community collectively, including vendors with no or little formal
schooling. However, NGOs and community workers efforts appear to have reached only a
small proportion of vendors and have been mainly directed to slums. The finding that male
vendors are more knowledgeable in some hygiene factors than female vendors disagrees with
the hypothesis that the experience of female vendors in food preparation renders them more
knowledgeable than male vendors in matters of basic food hygiene. This reflects the higher
proportion of male than female vendors that had received lessons on food hygiene.
N o significant association exists between any of the practice scores and either the
vendor education level or sex. In addition, one would expect the scores on safe practice to be
associated with the scores on knowledge of basic food hygiene but this is also not the case.
Hence all our hypotheses are disputed. The vast majority of vendors, for instance, know that
food should be covered to protect it from contamination by flies and/or dust but only few
vendors protect their foods. Many vendors do not cover food so as to allow air circulation
within the food and delay spoilage at ambient temperatures (informal discussions). Others
want the customers to see what they are selling because they do not have appropriate display
facilities. It implies that awareness of risks and knowledge of procedures to ensure levels of
food safety do not necessarily impact change in behaviour probably due to other factors in
play. This phenomenon has also been found in other studies among consumers and other food
handlers. Among consumers in the USA, knowledge of specific food-handling principles was
found to be more prevalent than the corresponding rates of safe hygiene practices (Altekruse
et al, 1996). In Italy, although food handlers had a positive attitude towards hygiene, it was
not supported by some of the self-reported practices of hygiene (Angelillo et al, 2000).
Despite the importance of knowledge and experience gained in basic food hygiene by
street food vendors, other issues must be addressed for its application. This is supported by
90
H y g i e n e k n o w l e d g e a n d p r a c t i c e o f v e n d o r s
the finding that street food vendors' safe practices are associated with the vending location
and not the knowledge of food hygiene. Differences in consumer expectations between study
areas may be one of the explanations. Street food consumers in the Industrial Area and
Dandora probably have regular income and means to exercise demands on food sellers while
it is the reverse for consumers in Korogocho. The Industrial Area vendors are obliged to take
demands into account because they have to sell their foods within a limited number of hours,
mostly during lunch (Mwangi et at, 2001) , while Korogocho and Dandora vendors can sell
for the whole day. Therefore, consumer attitude towards food hygiene and probably levels of
competition between vendors may affect hygienic practices among street food vendors. The
limitations of this study are that it did not address consumer attitude towards food hygiene in
the different study areas and how this affects their choice of food vendors. In addition, it does
not link given vendor knowledge aspects to specific practices, nor determine probable
economic reasons that could be behind the prevailing vendor practices. It however provides
an overall evaluation of food hygiene knowledge and practice of vendors in Nairobi.
The lack of amenities at the vending sites and low vendor economic power, are also
possible grounds for the missing association between the score on basic hygiene knowledge
and the score on hygienic practice. Vendors, for instance, may not wash their hands as
required because water is not available at the vending sites and they can only carry a limited
amount in containers. Proper means of garbage collection and disposal are lacking and
vendors have to put this in place on their own. If vendors do not have the economic power to
invest in betterment of the vending environment, then safe practices are hindered.
Additionally, the efforts of investing in safe food practices may only be visible to the vendor
and not the consumer because of the affability between quality and price. Hence, a modern
street food seller may not be appreciated due to the prices s/he may impose as a result of the
investment incurred in order to employ safe food practices.
The fact that street food vending in Kenya is not legalised could also contribute to the
lack of much investment by vendors. They may not be willing to risk their capital by
investing into a venture that the city authorities might demolish any time.
In conclusion, street food vendors' awareness of the basic safe food practices is at best
average in Nairobi. Their having received hygiene lessons influences their knowledge of
basic food hygiene. Efforts focusing on educating street food vendors are, however, clearly
absent. Public health and nutrition educators seem to have no responsibility for street food
vendors. Besides, neither the vendors' level of education nor knowledge of basic food
hygiene principles has a direct influence on their level of safe food practices. Consumer
attitude towards food hygiene and an enabling vending environment are probably more
important factors in influencing vendor safe food practices. Therefore, public health and
nutrition educators need to develop education programmes to improve vendor knowledge and
practices as well as street food consumer attitude towards food hygiene. Consumers need to
be helped to develop personal responsibility for the safety of the food they eat and be made
91
Chapter 5
more demanding. City authorities need to enact and enforce legislation specific to this sector
and allow vendors to put investment in place without introducing obstacles that would disturb
the informal system. Numerous appropriate places could be assigned for selling foods and
provided with basic sanitary facilities.
ACKNOWLEDGEMENTS Our gratitude goes to Gospel Tabernacle Church in Dandora and Provide International in
Korogocho for providing us with office space and assisting us to gain participant confidence.
Thanks to the Netherlands Foundation for the Advancement of Tropical Research (WOTRO)
for financing the research. W e also thank Dr. Cees de Graaf of Wageningen University for
his input in organising the article.
R E F E R E N C E S
Abdussalam M, Kaferstein FK (1993). Safety of street foods. World Health Forum, 14: 91-194. Altekruse SF, Street DA, Fein SB, Levy AS (1996). Consumer knowledge of foodborne microbial
hazards and food-handling practices. Journal of Food Protection, 59(3): 287-294. Angelillo IF, Viggiani NMA, Rizzo L, Bianco A (2000). Food handlers and foodborne diseases:
knowledge, attitudes and reported behaviour in Italy. Journal of Food Protection 63(3): 381-385. Azanza Ma PV, Gatchalian CF, Ortega MP (2000). Food safety knowledge and practices of streetfood
vendors in a Philippines university campus. International Journal of Food Sciences and Nutrition 51: 235-246.
Dawson R, Liamrangsi S, Boccas F (1996). Bangkok's street food project. Food, Nutrition and Agriculture, 17/18: 38-46.
FAO (1997a). Streetfood: small entrepreneurs, big business. FAO maps out future activities in
nutrition, hygiene. FAO, Rome. FAO (1997b). Street foods. Report of an FAO technical meeting on street foods, Calcutta, India, 6-9
November 1995. FAO Food and Nutrition Paper, 63. Freese E, Romero-Abal ME, Solomons NW, Gross R (1998). The microbial safety of typical
Guatemalan foods from street vendors, low-income homes and hotels. International Journal of Food Sciences and Nutrition, 49: 27-38.
Jayasuriya DC (1994). Street food vending in Asia: some policy and legal aspects. Food Control, 5: 222-226 <s
Jermini M, Bryan FL, Schmitt R, Mwandwe C, Mwenya J, Zyuulu MH, Chilufya EN, Matoba A,
Hakalima AT, Mwanza M (1997). Hazards and critical control points of food vending operations
in a city in Zambia. Journal of Food Protection, 60(3): 288-299. Lim-Quizon MC, Benabaye RM, White FM, Dayrit MM, White ME (1994). Cholera in metropolitan
Manila: foodborne transmission via street vendors. Bulletin of the World Heath Organisation, 72(5): 745-749.
Matalas AL, Yannakoulia M (2000). Greek street food vending: An old habit turned new. In: Simopoulos AP, Bhat RV (eds.), Street Foods: World Review of Nutrition and Dietetics, 86:1-24.
92
H y g i e n e k n o w l e d g e a n d p r a c t i c e o f v e n d o r s
Mwangi AM, den Hartog AP, Foeken DWJ, van't Riet H, Mwadime RKM, van Staveren WA (2001).
The ecology of street foods in Nairobi. Ecology of Food and Nutrition, 40: 497-523. Pearce TO, Kujore 0 0 , Agboh-Bankole VA (1988). Generating an income in the urban environment:
the experience of street food vendors in Ue-Ife, Nigeria. Africa, 58(4): 385400. Taylor DS, Fishell VK, Derstine JL, Hargrove RL, Patterson NR, Moriarty KW, Battista BA,
Ratcliffe HE, Binkoski AE, Kris-Etherton PM (2000). Street foods in America - A true melting pot. In: Simopoulos AP, Bhat RV (eds.), Street Foods: World Review of Nutrition and Dietetics, 86: 25-44.
Umoh VJ, Odoba MB (1999). Safety and quality evaluation of street foods sold in Zaria, Nigeria. Food Control 10: 9-14.
van Kampen J, Gross R, Schultink W, Usfar A (1998). The microbiological quality of street foods in Jakarta as compared to home-prepared foods and foods from tourist hotels. International Journal of Food Sciences and Nutritrion, 49: 17-26.
WHO (1996). Essential safety requirements for street-vended foods. WHO, Geneva.
WHO (1993). The golden rules for safe food preparation. WHO, Geneva.
93

o
6 STREET FOODS AS A SOURCE OF LIVELIHOOD FOR VENDING HOUSEHOLDS: INCOME, FOOD AND LINKS WITH SOCIO-ECONOMIC ASPECTS IN NAIROBI
Alice Mboganie Mwangi, Dick W.J. Foeken, Adel P. den Hartog, Wija A. van Staveren
Paper in preparation
C h a p t e r 6
A B S T R A C T
This study determines the extent to which street foods are a source of livelihood for vending
households, and its links with socio-economic aspects of the households, in different areas of
Nairobi. A questionnaire on income and socio-economic issues was administered to vendors
from 182 households in a very-low-income slum area (Korogocho), a lower-middle-income
residential area (Dandora) and the Industrial Area. A 24-hour recall of the quantities of foods
consumed from the street food pot was carried out in a sub-sample of 89 households. Street food
vending formed 63% of economic activities among household members, being higher in
Korogocho (71%) than in Dandora (57%) but not in the Industrial Area (63%), p<0.05. Most
(54%) vendors earned above the official minimum wage from vending and were more in the
Industrial Area (66%) than in Dandora (42%) and Korogocho (56%), p<0.05. Others earned at
least twice the official minimum wage and were more in Korogocho (42%) and the Industrial
Area (45%) than in Dandora (23%), p<0.05. More (54%) male than female (31%) vendors
earning at least double the official minimum wage, but male vendors operated for longer hours
compared to female vendors (/?<0.001). About half (46%) of the vending households relied on
street food vending as the major household income provider and were associated with a low
socio-economic index and vendors as heads of households. Mean energy supplied from (he street
food pot was 16 ± 12% of RDA for households selling snack and/or part of breakfast foods and
3 2 + 1 6 % of RDA for households selling main meal foods. Inconveniences most frequently cited
by vendors were difficulties of working in the open in all study areas and harassment by city
authorities particularly in the Industrial Area. Most vendors cited provision of income as an
advantage of street food vending. Therefore, street food vending is an important source of
livelihood especially for vending households in the very-low-income urban areas. Vendors,
however, operate under insecure circumstances due to lack of recognition.
I N T R O D U C T I O N
The role of street foods in the urbanisation process has been said to reflect some of the
survival strategies adopted in African cities (Canet and N'Diaye, 1996). In sub-Sahara Africa,
unprecedented high urban population growth rates have been taking place in the midst of
stagnant or declining economies and has outpaced general development (UNFPA, 1999).
Living costs have increased in the recent decades while growth in employment opportunities
has diminished (World Bank, 1999; FAO, 1998; von Braun et ai, 1993). A review of trends
in up to 14 developing countries revealed that urban poverty and undernutrition increased in
the majority of the countries during the previous 15-20 years (Haddad et at, 1999). These
trends create new demands on urban food supply facilities and channels in that, apart from
growing at least as fast as the overall population, they need to supply affordable, safe and
nutritious food. The poor sector of the urban population needs to be able to afford the food
while at the same time promotion of agricultural production must be sustained not at the
expense of farmers.
96
S t r e e t F o o d s a s a S o u r c e o f L i v e l i h o o d
Due to lack of employment opportunities, many urban dwellers are reported to utilise
a variety of initiatives, of which street food vending is one, to enable them to obtain an
income and food (Canet and N'Diaye, 1996). Street food vending attracts attention in that it
addresses the two reportedly increasing problems of urban poverty and undernutrition. Street
foods are said to provide a livelihood for a large number of workers who would otherwise be
unemployed while providing affordable food for the urban poor who would otherwise be
worse off if there were no street food vendors (WHO, 1996; Tinker, 1997). Nevertheless,
some governments have dismissed the phenomenon as marginal and transitory while others
view street food vending as an unnecessary nuisance in urban areas (Tinker, 1997).
In Kenya, street foods are illegal but they are tolerated. There is need to point out the
role of this sector to the authorities if the sector should be legally recognised. While many
studies have documented the nutritional role of street foods for consumers and few their
importance in the urban economy, no study known to the authors documents the role of street
foods both as an income and a direct food source for vending households. The objective of
this study is to determine the extent to which street foods are a source of livelihood for
vending households, and its links with socio-economic aspects of the households, in different
areas of Nairobi. The study addresses the following questions: To what extent are street foods
a source of income for vending households in different parts of Nairobi? Which socio
economic characteristics are associated with street food vending households? How do the
socio-economic characteristics relate to the reliance on food vending for income? To what
extent are street foods a direct source of food for vending households? What advantages and
inconveniences of street food vending do vendors perceive? Do answers on the above
questions differ for vending households in different areas of Nairobi?
M E T H O D O L O G Y
D e s i g n a n d H o u s e h o l d S e l e c t i o n
A cross-sectional survey was conducted in a very-low-income slum settlement (Korogocho),
a lower-middle-income residential area (Dandora) and a working area (the Industrial Area) of
Nairobi, in May and June 1998. Preliminary exploration of the City of Nairobi (Mwangi et al,
2001) revealed that higher-income residential areas were not frequented with street food
vendors hence not represented in this study. Selection of vendors involved a systematic
cluster sampling method. Korogocho had two main earthen-roads frequented by street food
vendors while Dandora had three previously tarred roads. The total length of the roads was
approximately 1.5 Km in Korogocho and 2.0 Km in Dandora. Each road was divided into
approximately 50-metre stretch clusters separated by roughly 100-metre stretches. The 50-
metre stretches formed the study clusters in the two areas. There were 8 and 11 clusters
selected in Korogocho and Dandora respectively. In the Industrial Area, there was one main
97
C h a p t e r 6
road (Enterprise Road) from which streets frequented by food vendors systematically
branched. Every alternate branch formed the study clusters, resulting in 5 selected clusters.
All vendors found within the clusters were included in the study (53 in Korogocho, 69 in
Dandora and 63 in the Industrial Area).
G e n e r a l Q u e s t i o n n a i r e
A structured and pre-tested questionnaire was administered to the vendors. Data included
demographic characteristics of vendors and their household members. Weekly expenditure on
ingredients, cooking fuel and transport, average amount of money from food sales per day,
number of days they operated per week and importance of the street food operation in
household income (reported as main provider, provides half, less than half or negligible
amount) were inquired. Vendors were also asked to state why they decided to vend street
foods, as well as advantages and inconveniences of street food vending. To develop a socio
economic status index for each household, data were collected on material ownership of the
household. These included land, houses, refrigerator, television set, sofa set, pressure lamp,
bicycle, radio, lantern lamp, bed, mattress and cooking stove. In addition, type of most
frequently used cooking fuel and the type of rental or owned housing in terms of material
used to build the floor, wall, and roof were recorded. If a vendor did not own the house, rent
paid per month was also established.
I n - d e p t h S t u d y
An in-depth study of a sub-sample of 89 vendors was carried out for the purpose of
assessment of the nutrient quality of street foods (Mwangi et al, see Chapter 4) and their role
as a direct food source for vending households. Data collected included whether vending
household members consumed food from the street food pot and why, the usual frequency of
consumption (number of days per week and times per day) and a 24-hr recall of the quantities
of foods consumed from the street food pot by household members.
D a t a T r e a t m e n t
Frequencies of demographic and socio-economic characteristics were run to determine
distributions. Proportions between groups of vendors were compared using the %2, 0 and
Cramer's V statistics. Mean differences were determined using the one-way analysis of
variance or the student t-test when appropriate. The level of significance in all cases was set
at p=0.05.
An index was developed as an indicator of variation in the socio-economic status of
vending households. This was achieved by assigning weighted scores to the various
household material ownership, type of cooking fuel most frequently used, type of housing and
rent paid per month. Factor analysis with Varimax rotation was performed on the resulting
98
S t r e e t F o o d s a s a S o u r c e o f L i v e l i h o o d
score variables in order to determine the variables for use in the development of the socio
economic status index. The guidelines used were a correlation matrix determinant>0.00001;
Kaiser-Meyer-Olkin (KMO) measure of sampling adequacy>0.5; Bartlett test of sphericity
p<0.05 and extraction of factors with eigenvalues >1 . Factor loadings <0.5 were suppressed.
Two factors were extracted. Variables highly loading on the first factor were house rent, type
of house building material and ownership of a television set, radio, sofa set and lantern lamp.
This factor thus contained variables from two domains, namely characteristics of the dwelling
and ownership of durable goods within the urban environment, as underlying variables in
socio-economic status of households. Variables loading on the second factor were ownership
of land, rural house and type of the house owned, reflecting mainly assets owned at the rural
home. The rest of the variables did not load highly on the factors. The first factor was used to
develop the socio-economic status index in form of a summated scale, as it was more reliable
than the second factor. The range of the resulting index was divided into three equal sub
ranges for classification of households into three groups of the socio-economic index (i.e.
lower, middle and upper).
To establish the relation between the role of street food vending in household income
and some vending-household socio-economic and demographic factors, multiple logistic
regression analysis was performed. The outcome of interest was the role of street food
vending in household income transformed into a dummy variable (0=provides half or less,
l=main provider). Explanatory variables included status of vendor in the household (ofher=0,
household head=l) , number of dependants, household size, number of other people with an
economic activity and the socio-economic states score (all continuous variables). The model-
building strategy included: (i) univariate analysis of each variable considered using the
appropriate test statistic (%2 and t tests); (if) inclusion of variables with univariate /?-value
<0.25; (iff) forward inclusion of any variable contributing to the model on the ground of the
likelihood ratio test, using a cutoff of />=0.05; (iv) testing of interaction terms using a cutoff
of p=Q.\5. Adjusted odds ratio and 95% confidence intervals were calculated.
Amount of energy per serving of different street food products were estimated as
described in Mwangi et al (see Chapter 4) . The extend to which street foods were a direct
source of food for members of vending households was expressed as the amount of energy
directly provided from the street food pot within the previous 24 hours as a proportion of the
recommended daily allowance (RDA). The total R D A for the household members consuming
foods from the street food pot was presented in consumer units (cu) based on Kenyan
recommendations where l eu = 2,600 Kcal (Sehmi, 1993).
99
C h a p t e r 6
R E S U L T S
S o m e S o c i o - d e m o g r a p h i c a n d S o c i o - e c o n o m i c C h a r a c t e r i s t i c s o f V e n d i n g H o u s e h o l d s
Of the 185 vendors included in the study, only one vendor from Korogocho refused to
participate. One questionnaire, each from Korogocho and Dandora was discarded for
incomplete data. Most vendors (80%) were female. Table 1 shows some household socio-
demographic and socio-economic characteristics of street food vendors involved in the study.
Mean household size was similar in the three study areas. Some households had only a single
member, the proportion not being significantly different between study locations. Dependency
ratio, the number of household members aged <18 and >60 years divided by the number of
household members aged 18-60 years, was approximately one in all the study areas. The
proportion of vendors who were also heads of households varied significantly with the study
location (p<0.001), the proportion of household heads in Korogocho being significantly
higher than in both Dandora (p=0.000) and the Industrial Area (p<0.05). The distribution of
female household-head vendors (excluding female heads of one-member households) also
significantly varied across study locations (p<0.001), the proportion in Dandora being
significantly lower than in the other study areas (p<0.01). Half of the heads of street food
vending households had been to secondary school or higher and were significantly more
associated with Dandora than Korogocho and the Industrial Area (p<0.05).
The socio-economic status index of vending households as described in the methods
ranged from a score of 2.00 to 27.00. In Korogocho slums, most vending households were
classified in the lower group of the socio-economic status index while in Dandora and the
Industrial Area, they were classified in the middle group. Overall, most of the vending
households were classified in the middle, one-third in the lower and one-quarter in the upper
group of the socio-economic status index. The mean score varied across study locations
(p<0.001), being significantly lower in Korogocho than in Dandora and the Industrial Area.
The mean score did not vary with vendor gender.
Asked for the main reason why they commenced vending of street foods, most
vendors in the three study areas cited lack of employment. This proportion did not vary
significantly with study location. Some vendors (all female) needed an own income while
some (96% female) needed to supplement their spouses' income. Vendors who wanted to
have their own income tended to be more in Dandora low-middle-income area and least in the
Industrial Area but the differences were not significant across study locations. The proportion
of vendors who wanted to supplement their spouses' income was significantly higher in the
Industrial Area than in Korogocho (p<0.05) but not in Dandora.
100
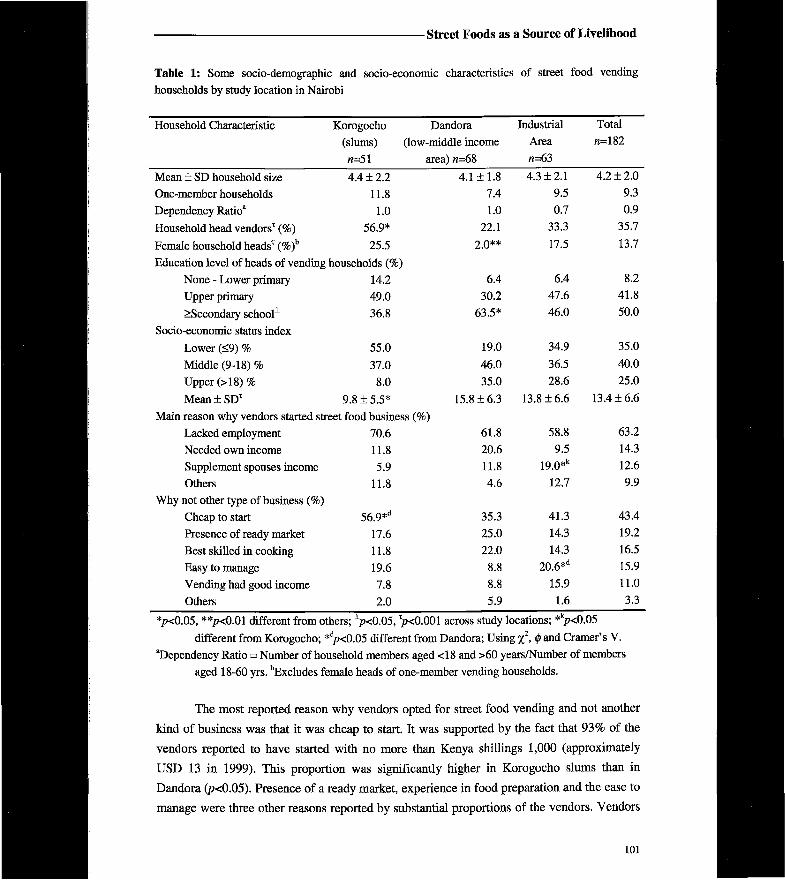
S t r e e t F o o d s a s a S o u r c e o f L i v e l i h o o d
Table 1: Some socio-demographic and socio-economic characteristics of street food vending households by study location in Nairobi
Household Characteristic Korogocho Dandora Industrial Total
(slums) (low-middle income Area «=182
«=51 area) «=68 «=63
Mean ± SD household size 4.4 + 2.2 4.1 ±1 .8 4.3 ±2 .1 4.2 ± 2 . 0
One-member households 11.8 7.4 9.5 9.3
Dependency Ratio" 1.0 1.0 0.7 0.9
Household head vendors* (%) 56.9* 22.1 33.3 35.7
Female household heads* (%)b 25.5 2.0** 17.5 13.7
Education level of heads of vending households (% ) None - Lower primary 14.2 6.4 6.4 8.2
Upper primary 49.0 30.2 47.6 41.8
>Secondary school 1 36.8 63.5* 46.0 50.0
Socio-economic status index Lower (<9) % 55.0 19.0 34.9 35.0
Middle (9-18) % 37.0 46.0 36.5 40.0
Upper (>18) % 8.0 35.0 28.6 25.0
Mean±SD T 9.8 ± 5 . 5 * 15.8 ±6 .3 13.8 ± 6 . 6 13.4 ± 6 . 6
Main reason why vendors started street food business (%) Lacked employment 70.6 61.8 58.8 63.2
Needed own income 11.8 20.6 9.5 14.3
Supplement spouses income 5.9 11.8 19.0* k 12.6 Others 11.8 4.6 12.7 9.9
Why not other type of business (%) Cheap to start 56.9* d 35.3 41.3 43.4
Presence of ready market 17.6 25.0 14.3 19.2
Best skilled in cooking 11.8 22.0 14.3 16.5
Easy to manage 19.6 8.8 20.6* d 15.9
Vending had good income 7.8 8.8 15.9 11.0
Others 2.0 5.9 1.6 3.3
*/><0.05, **p<0.01 different from others; VcO.05, ^O.OOl across study locations; *kp<0.05 different from Korogocho; * dp<0.05 different from Dandora; Using %2, <j) and Cramer's V.
"Dependency Ratio = Number of household members aged <18 and >60 years/Number of members aged 18-60 yrs. ""Excludes female heads of one-member vending households.
The most reported reason why vendors opted for street food vending and not another
kind of business was that it was cheap to start. It was supported by the fact that 93% of the
vendors reported to have started with no more than Kenya shillings 1,000 (approximately
U S D 13 in 1999). This proportion was significantly higher in Korogocho slums than in
Dandora (p<0.05). Presence of a ready market, experience in food preparation and the ease to
manage were three other reasons reported by substantial proportions of the vendors. Vendors
101
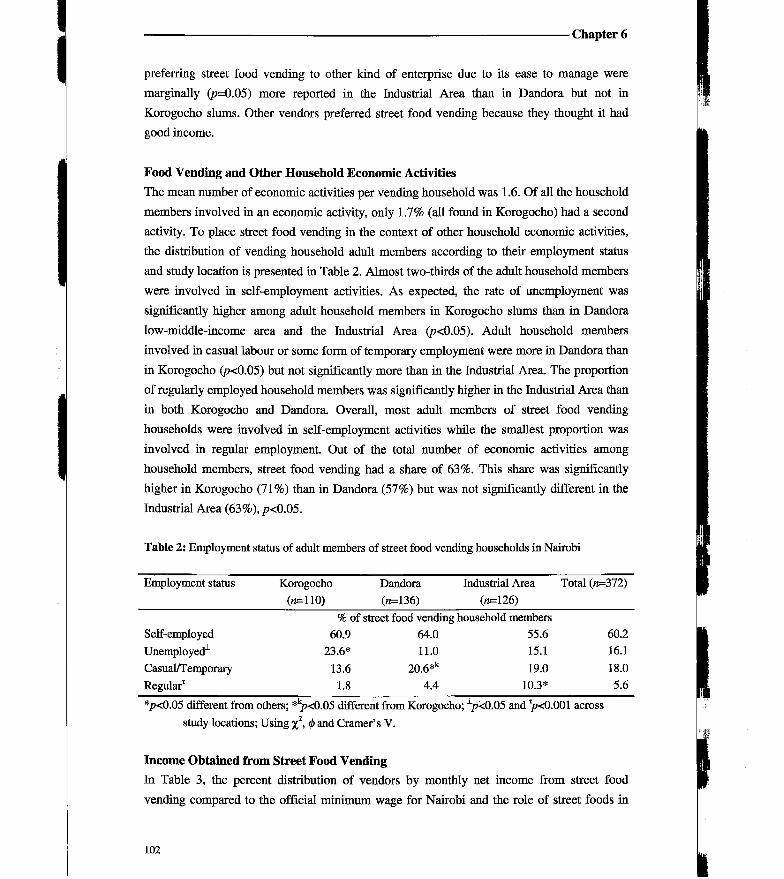
C h a p t e r 6
preferring street food vending to other kind of enterprise due to its ease to manage were
marginally (p=0.05) more reported in the Industrial Area than in Dandora but not in
Korogocho slums. Other vendors preferred street food vending because they thought it had
good income.
F o o d V e n d i n g a n d O t h e r H o u s e h o l d E c o n o m i c A c t i v i t i e s
The mean number of economic activities per vending household was 1.6. Of all the household
members involved in an economic activity, only 1.7% (all found in Korogocho) had a second
activity. To place street food vending in the context of other household economic activities,
the distribution of vending household adult members according to their employment status
and study location is presented in Table 2. Almost two-thirds of the adult household members
were involved in self-employment activities. As expected, the rate of unemployment was
significantly higher among adult household members in Korogocho slums than in Dandora
low-middle-income area and the Industrial Area (p<0.05). Adult household members
involved in casual labour or some form of temporary employment were more in Dandora than
in Korogocho (p<0.05) but not significantly more than in the Industrial Area. The proportion
of regularly employed household members was significantly higher in the Industrial Area than
in both Korogocho and Dandora. Overall, most adult members of street food vending
households were involved in self-employment activities while the smallest proportion was
involved in regular employment. Out of the total number of economic activities among
household members, street food vending had a share of 63%. This share was significantly
higher in Korogocho (71%) than in Dandora (57%) but was not significantly different in the
Industrial Area (63%), p<0.05.
T a b l e 2: Employment status of adult members of street food vending households in Nairobi
Employment status Korogocho Dandora Industrial Area Total (n=372) (n=110) (n=136) (n=126)
% of street food vending household members Self-employed 60.9 64.0 55.6 60.2 Unemployed 1 23.6* 11.0 15.1 16.1
Casual/Temporary 13.6 20.6* k 19.0 18.0 Regular* 1.8 4.4 10.3* 5.6
*p<0.05 different from others; *kp<0.05 different from Korogocho; xp<D.05 and Tp<0.001 across study locations; Using %2, 0 and Cramer's V .
I n c o m e O b t a i n e d f r o m S t r e e t F o o d V e n d i n g
In Table 3 , the percent distribution of vendors by monthly net income from street food
vending compared to the official minimum wage for Nairobi and the role of street foods in
102
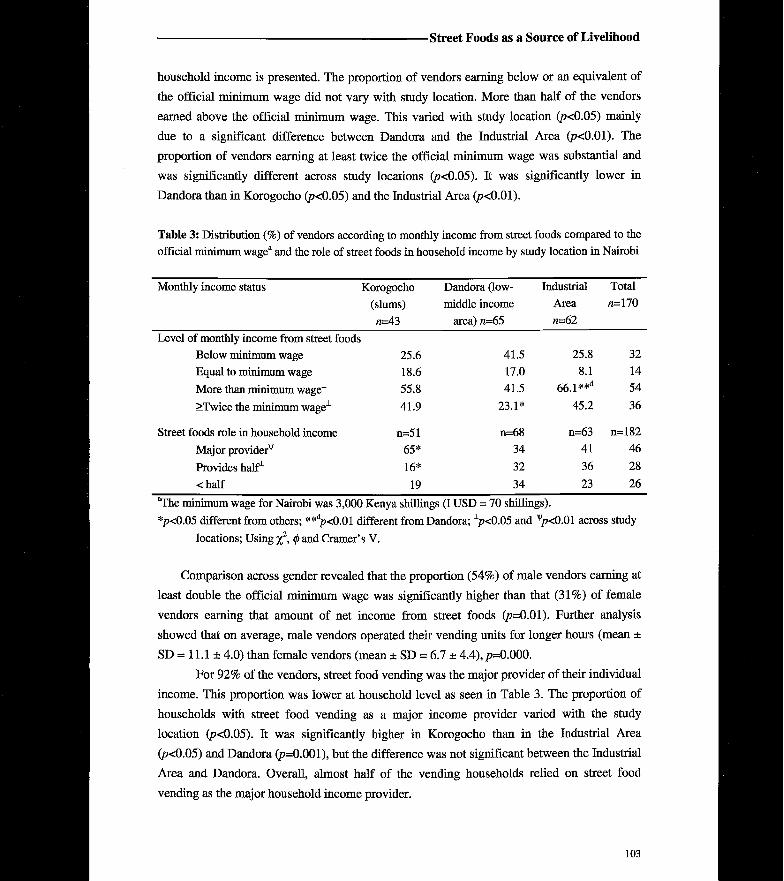
S t r e e t F o o d s a s a S o u r c e o f L i v e l i h o o d
household income is presented. The proportion of vendors earning below or an equivalent of
the official minimum wage did not vary with study location. More than half of the vendors
earned above the official minimum wage. This varied with study location (p<0.05) mainly
due to a significant difference between Dandora and the Industrial Area (p<0.01). The
proportion of vendors earning at least twice the official minimum wage was substantial and
was significantly different across study locations (p<0.05). It was significantly lower in
Dandora than in Korogocho (p<0.05) and the Industrial Area (p<0.01).
T a b l e 3: Distribution (%) of vendors according to monthly income from street foods compared to the official minimum wage" and the role of street foods in household income by study location in Nairobi
Monthly income status Korogocho Dandora (low- Industrial Total
(slums) middle income Area «=170
«=43 area) «=65 «=62
Level of monthly income from street foods Below miriimum wage 25.6 41.5 25.8 32
Equal to minimum wage 18.6 17.0 8.1 14
More than minimum wage x 55.8 41.5 66.1** d 54
>Twice the minimum wage 1 41.9 23.1* 45.2 36
Street foods role in household income n=51 n=68 n=63 n=182
Major providerv 65* 34 41 46
Provides half1 16* 32 36 28
<half 19 34 23 26
"The minimum wage for Nairobi was 3,000 Kenya shillings (I USD = 70 sellings). *p<0.05 different from others; **dp<0.01 different from Dandora; xp<0.05 and ><0 .01 across study
locations; Using %2, (j> and Cramer's V.
Comparison across gender revealed that the proportion (54%) of male vendors earning at
least double the official minimum wage was significantly higher than that (31%) of female
vendors earning that amount of net income from street foods (p=0.01). Further analysis
showed that on average, male vendors operated their vending units for longer hours (mean ±
SD = 11.1 ± 4.0) than female vendors (mean ± S D = 6.7 ± 4.4), p=0.000.
For 92% of the vendors, street food vending was the major provider of their individual
income. This proportion was lower at household level as seen in Table 3. The proportion of
households with street food vending as a major income provider varied with the study
location (p<0.05). It was significantly higher in Korogocho than in the Industrial Area
(p<0.05) and Dandora (p=0.001), but the difference was not significant between the Industrial
Area and Dandora. Overall, almost half of the vending households relied on street food
vending as the major household income provider.
103
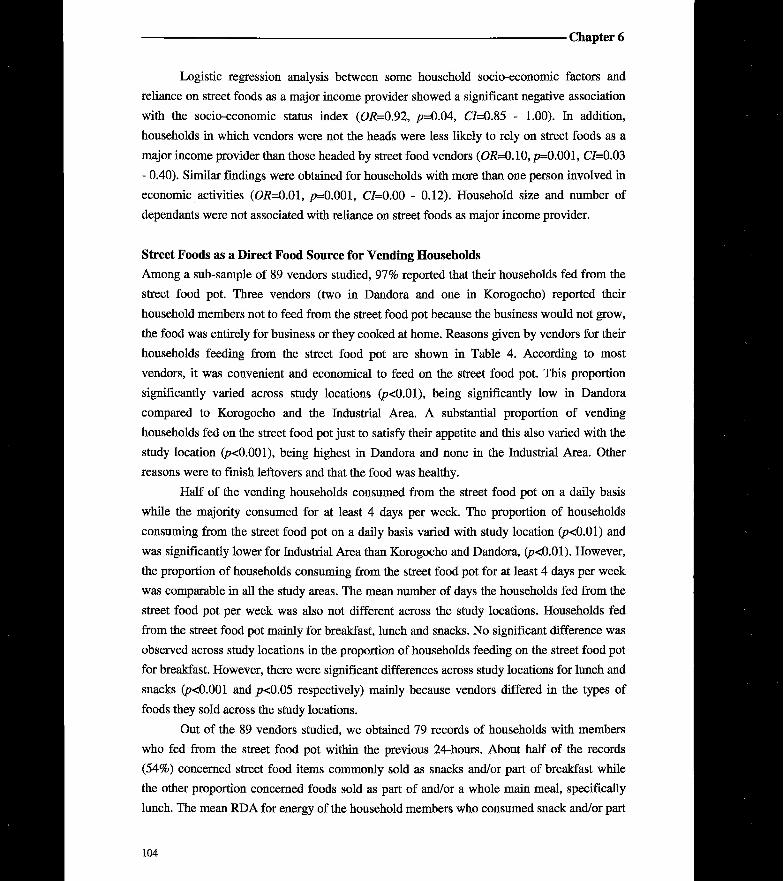
Chapter 6
Logistic regression analysis between some household socio-economic factors and
reliance on street foods as a major income provider showed a significant negative association
with the socio-economic status index (OR=0.92, p=0.04, C/=0.85 - 1.00). In addition,
households in which vendors were not the heads were less likely to rely on street foods as a
major income provider than those headed by street food vendors (OR=0.W, p=0.001, C/=0.03
- 0.40). Similar findings were obtained for households with more than one person involved in
economic activities (OR=Q.01, / ;=0.001, C/=0.00 - 0.12). Household size and number of
dependants were not associated with reliance on street foods as major income provider.
Street Foods as a Direct Food Source for Vending Households Among a sub-sample of 89 vendors studied, 97% reported that their households fed from the
street food pot. Three vendors (two in Dandora and one in Korogocho) reported their
household members not to feed from the street food pot because the business would not grow,
the food was entirely for business or they cooked at home. Reasons given by vendors for their
households feeding from the street food pot are shown in Table 4. According to most
vendors, it was convenient and economical to feed on the street food pot. This proportion
significantly varied across study locations (p<0.01), being significantly low in Dandora
compared to Korogocho and the Industrial Area. A substantial proportion of vending
households fed on the street food pot just to satisfy their appetite and this also varied with the
study location (p<0.001), being highest in Dandora and none in the Industrial Area. Other
reasons were to finish leftovers and that the food was healthy.
Half of the vending households consumed from the street food pot on a daily basis
while the majority consumed for at least 4 days per week. The proportion of households
consuming from the street food pot on a daily basis varied with study location (p<0.01) and
was significantly lower for Industrial Area than Korogocho and Dandora, (p<0.01). However,
the proportion of households consuming from the street food pot for at least 4 days per week
was comparable in all the study areas. The mean number of days the households fed from the
street food pot per week was also not different across the study locations. Households fed
from the street food pot mainly for breakfast, lunch and snacks. N o significant difference was
observed across study locations in the proportion of households feeding on the street food pot
for breakfast. However, there were significant differences across study locations for lunch and
snacks (p<0.001 and p<D.05 respectively) mainly because vendors differed in the types of
foods they sold across the study locations.
Out of the 89 vendors studied, we obtained 79 records of households with members
who fed from the street food pot within the previous 24-hours. About half of the records
(54%) concerned street food items commonly sold as snacks and/or part of breakfast while
the other proportion concerned foods sold as part of and/or a whole main meal, specifically
lunch. The mean R D A for energy of the household members who consumed snack and/or part
104
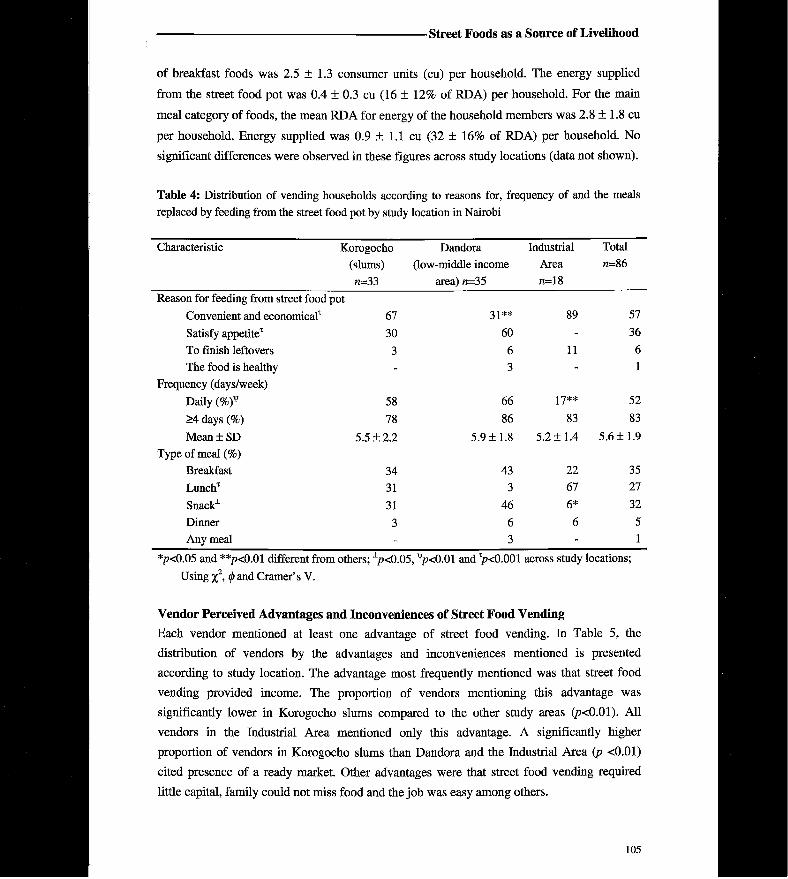
S t r e e t F o o d s a s a S o u r c e o f L i v e l i h o o d
of breakfast foods was 2.5 ± 1 . 3 consumer units (cu) per household. The energy supplied
from the street food pot was 0.4 ± 0.3 cu (16 ± 12% of RDA) per household. For the main
meal category of foods, the mean RDA for energy of the household members was 2.8 ± 1.8 cu
per household. Energy supplied was 0.9 ± 1.1 cu (32 ± 16% of RDA) per household. N o
significant differences were observed in these figures across study locations (data not shown).
T a b l e 4: Distribution of vending households according to reasons for, frequency of and the meals replaced by feeding from the street food pot by study location in Nairobi
Characteristic Korogocho Dandora Industrial Total
(slums) (low-middle income Area «=86
«=33 area) «=35 «=18
Reason for feeding from street food pot
Convenient and economical1 67 31** 89 57
Satisfy appetite* 30 60 - 36
To finish leftovers 3 6 11 6
The food is healthy - 3 - 1
Frequency (days/week)
Daily (%f 58 66 17** 52
>4 days (%) 78 86 83 83
Mean ± SD 5.5 ± 2.2 5.9 ±1 .8 5.2 ± 1 . 4 5.6 ±1 .9
Type of meal (%) Breakfast 34 43 22 35
Lunch* 31 3 67 27
Snack 1 31 46 6* 32
Dinner 3 6 6 5
Any meal - 3 - 1
*p<0.05 and **p<0.01 different from others; x /J<0.05, v p < 0 . 0 1 and > < 0 . 0 0 1 across study locations;
Using %2, 0 and Cramer's V.
V e n d o r P e r c e i v e d A d v a n t a g e s a n d I n c o n v e n i e n c e s o f S t r e e t F o o d V e n d i n g
Each vendor mentioned at least one advantage of street food vending. In Table 5, the
distribution of vendors by the advantages and inconveniences mentioned is presented
according to study location. The advantage most frequently mentioned was that street food
vending provided income. The proportion of vendors mentioning this advantage was
significantly lower in Korogocho slums compared to the other study areas (p<0.01). All
vendors in the Industrial Area mentioned only this advantage. A significantly higher
proportion of vendors in Korogocho slums than Dandora and the Industrial Area (p <0.01)
cited presence of a ready market. Other advantages were that street food vending required
little capital, family could not miss food and the job was easy among others.
105
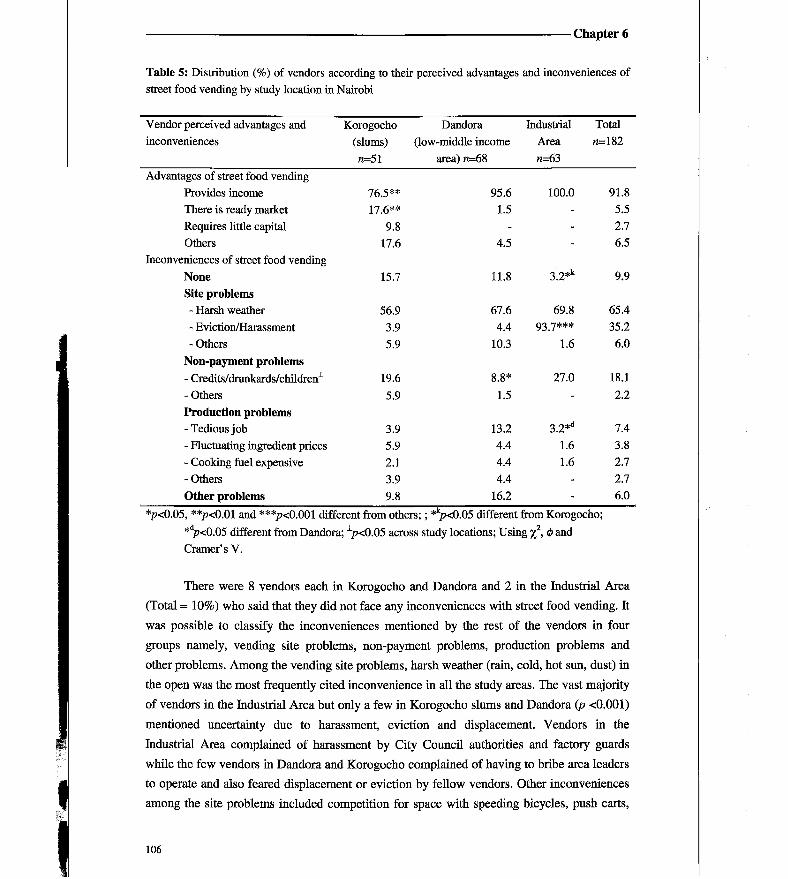
C h a p t e r 6
Table 5: Distribution (%) of vendors according to their perceived advantages and inconveniences of street food vending by study location in Nairobi
Vendor perceived advantages and Korogocho Dandora Industrial Total inconveniences (slums) (low-middle income Area «=182
«=51 area) «=68 «=63
Advantages of street food vending Provides income 76.5** 95.6 100.0 91.8 There is ready market 17.6** 1.5 - 5.5 Requires litde capital 9.8 - - 2.7 Others 17.6 4.5 - 6.5
Inconveniences of street food vending N o n e 15.7 11.8 3.2* k 9.9 Site problems
- Harsh weather 56.9 67.6 69.8 65.4 - Eviction/Harassment 3.9 4.4 0,3 7##* 35.2 - Others 5.9 10.3 1.6 6.0
N o n - p a y m e n t p r o b l e m s
- Credits/drankards/children1 19.6 8.8* 27.0 18.1 - Others 5.9 1.5 - 2.2 P r o d u c t i o n p r o b l e m s
- Tedious job 3.9 13.2 3.2* d 7.4 - Fluctuating ingredient prices 5.9 4.4 1.6 3.8 - Cooking fuel expensive 2.1 4.4 1.6 2.7 - Others 3.9 4.4 - 2.7 O t h e r p r o b l e m s 9.8 16.2 - 6.0
sp<0.05, **p<0.01 and ***p<0.001 different from others; ; *kp<0.05 different from Korogocho; *dp<0.05 different from Dandora; i p<0.05 across study locations; Using %2, </> and Cramer's V.
There were 8 vendors each in Korogocho and Dandora and 2 in the Industrial Area
(Total = 10%) who said that they did not face any inconveniences with street food vending. It
was possible to classify the inconveniences mentioned by the rest of the vendors in four
groups namely, vending site problems, non-payment problems, production problems and
other problems. Among the vending site problems, harsh weather (rain, cold, hot sun, dust) in
the open was the most frequently cited inconvenience in all the study areas. The vast majority
of vendors in the Industrial Area but only a few in Korogocho slums and Dandora (p <0.001)
mentioned uncertainty due to harassment, eviction and displacement. Vendors in the
Industrial Area complained of harassment by City Council authorities and factory guards
while the few vendors in Dandora and Korogocho complained of having to bribe area leaders
to operate and also feared displacement or eviction by fellow vendors. Other inconveniences
among the site problems included competition for space with speeding bicycles, push carts,
106
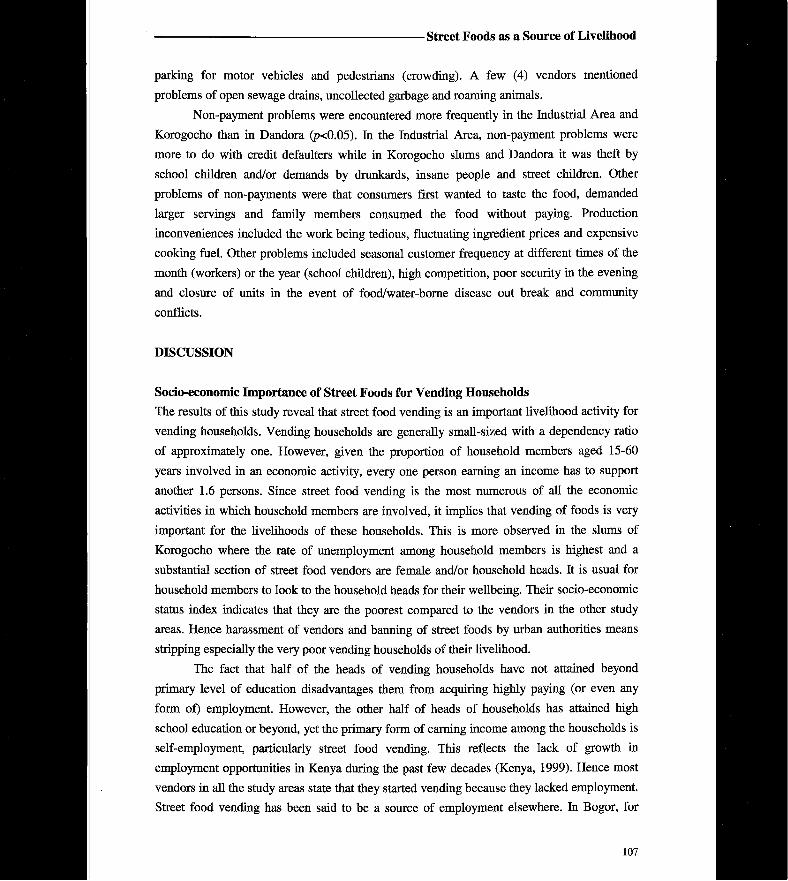
S t r e e t F o o d s a s a S o u r c e o f L i v e l i h o o d
parking for motor vehicles and pedestrians (crowding). A few (4) vendors mentioned
problems of open sewage drains, uncollected garbage and roaming animals.
Non-payment problems were encountered more frequently in the Industrial Area and
Korogocho than in Dandora (p<0.05). In the Industrial Area, non-payment problems were
more to do with credit defaulters while in Korogocho slums and Dandora it was theft by
school children and/or demands by drunkards, insane people and street children. Other
problems of non-payments were that consumers first wanted to taste the food, demanded
larger servings and family members consumed the food without paying. Production
inconveniences included the work being tedious, fluctuating ingredient prices and expensive
cooking fuel. Other problems included seasonal customer frequency at different times of the
month (workers) or the year (school children), high competition, poor security in the evening
and closure of units in the event of food/water-borne disease out break and community
conflicts.
D I S C U S S I O N
S o c i o - e c o n o m i c I m p o r t a n c e o f S t r e e t F o o d s f o r V e n d i n g H o u s e h o l d s
The results of this study reveal that street food vending is an important livelihood activity for
vending households. Vending households are generally small-sized with a dependency ratio
of approximately one. However, given the proportion of household members aged 15-60
years involved in an economic activity, every one person earning an income has to support
another 1.6 persons. Since street food vending is the most numerous of all the economic
activities in which household members are involved, it implies that vending of foods is very
important for the livelihoods of these households. This is more observed in the slums of
Korogocho where the rate of unemployment among household members is highest and a
substantial section of street food vendors are female and/or household heads. It is usual for
household members to look to the household heads for their wellbeing. Their socio-economic
status index indicates that they are the poorest compared to the vendors in the other study
areas. Hence harassment of vendors and banning of street foods by urban authorities means
stripping especially the very poor vending households of their livelihood.
The fact that half of the heads of vending households have not attained beyond
primary level of education disadvantages them from acquiring highly paying (or even any
form of) employment. However, the other half of heads of households has attained high
school education or beyond, yet the primary form of earning income among the households is
self-employment, particularly street food vending. This reflects the lack of growth in
employment opportunities in Kenya during the past few decades (Kenya, 1999). Hence most
vendors in all the study areas state that they started vending because they lacked employment.
Street food vending has been said to be a source of employment elsewhere. In Bogor, for
107
C h a p t e r 6
instance, it was estimated that street food trade absorbed up to 12.2% of the total labour force
in 1991 (Streetfood Project, 1992). But since most people opt to vend because they lack
employment, it could mean that should more employment opportunities arise, particularly (he
more educated vendors would probably abandon the vending activity. Nevertheless, the shift
to employment might depend on whether it pays better than street food vending and on other
aspects such us being one's own boss and job security. This aspect was, however, not
investigated in the present study.
For most forms of business, one always needs starting capital. From the results of the
present study, the main reason for opting to vend street foods other than undertaking another
type of activity is that street food vending is cheap to start. This is in line with the reports in
literature that street food vending is a source of employment that can start with minimum
capital and contribute a good and reliable income (Chauliac and Gerbouin, 1994; Streetfood
Project, 1992; Tinker, 1987b; FAO, 1990). According to the vendors, often other types of
economic activities require more money and investment. With street food vending, one can
start with cooking assets already owned by the household and only need money for
ingredients and cooking fuel. Frequently, raw food ingredients and the type of cooking fuel
(mainly firewood and charcoal) vendors use are cheaper than acquiring manufactured goods
for trade. In addition, everybody needs food on a daily basis unlike other goods such as
clothing and kitchen utensils that people buy probably once in several months. Hence there
are sales on a daily basis and bringing income is an advantage recognised by most vendors. It
implies that even poor unemployed urban dwellers can comfortably venture into street food
vending and make good income. Hence it is no surprise that more vendors in the very poor
area of Korogocho slums consider street food vending cheap to start than in the low-middle
income area of Dandora. Literature also reports that street food vending does not require
much education (Arambulo et al, 1994; Chauliac and Gerbouin, 1994; FAO, 1990) although
this does not come out in the present study as one of the motivating factors. Although vendors
do not mention this, we also think that the vending of street food does not require high levels
of education but an understanding of basic food nutrition and hygiene.
Vending of street foods in Nairobi provides a substantial amount of income for most
vendors. Most vendors earn an income above the official niinimum wage while a substantial
proportion of the vendors make twice or more of this amount. Given that people usually tend
to understate their income when asked, it is possible that income from street food vending is
actually higher. Although this study tried to reduce this error by using daily expenditures and
sales to calculate profit, vendors had no records and their word had to be relied on. Despite
this, the study shows that most vendors obtain a good amount of income. However, hours
spent on the enterprise per day and family unpaid labour are not accounted for when
determining the monthly income. Nevertheless, it has also been shown in other studies that
street food vendors earn more than official city or country rninimums most of them earning
108

S t r e e t F o o d s a s a S o u r c e o f L i v e l i h o o d
109
three to ten times the minimum wage of the country (Chauliac and Gerbouin, 1994; Tinker,
1987b; FAO, 1990; Tinker, 1997).
The results show that for half of the vending households, street food vending is their
main income provider. Such households are associated with a low socio-economic status
index, vendor-household head-ship and absence of other household members generating
income. These are found more among vending households in the slums of Korogocho than
the other study areas. Hence vending of street foods is their form of survival. It is worth
noting that the proportion of vendors earning more than double the official minimum is
significantly higher in the slum area of Korogocho and in the Industrial Area compared to the
middle-income area of Dandora. It may imply that the higher the income obtained from street
food vending, the more the household relies on it as main income source. It could also mean
that street food units on which vending households heavily rely are operated more rigorously.
In a study by Daniels (1999), it was found that almost half of micro and small enterprises in
urban areas of Kenya provided all of the household income. This underscores the importance
of micro and small enterprises such as street food vending for the livelihood of the
households involved. Another explanation could be that snack foods do not fetch as much
money as do main meals. Earlier studies revealed that vendors in Dandora lower-middle-
income area sold mainly snack foods while those in Korogocho slums and the Industrial Area
had more main meals (Mwangi et al, 2001).
Apart from being important for vendors, literature records the importance of street
foods also for their consumers. Vendors have been reported to provide inexpensive and tasty
ready-to-eat food for especially low-income people, not only close to their workplaces but
also other locations (FAO, 1997). They ease the problems of lack of establishments that
supply reasonably priced ready-to-eat foods, the busy urban form of life and long distances
between workplaces and home. Some studies have shown that street foods make substantial
contributions to the diets of different urban groups (Oguntona and Telia, 1999; Oguntona and
Kanye, 1995; Korir et al., 1998; Sujatha et al, 1997).
The most important inconveniences of street food vending touch on two areas namely
lack of shelter and uncertainty. While the shelter problem is common for all the study areas,
the uncertainty problem is more prevalent among vendors in the Industrial Area. City council
authorities appear to enforce their restrictions mainly in the areas thought to be economically
important for the city and occasional harassment of vendors in the Industrial Area causes
them to be insecure. This is linked to the lack of official recognition and the absence of any
form of policy governing the street foods sector. The vendors operate in a permanent state of
uncertainty, with little or no recourse to justice. Their vulnerability, as Boccas (1996)
suggests, inhibits investment and long-term development of their activities.
C h a p t e r 6
G e n d e r a n d S t r e e t F o o d V e n d i n g
Although most of the vendors in this study are female, a previous study of a larger sample
indicated a substantial proportion of male vendors with up to 50% in the slums of Korogocho
(Mwangi et al, 2001). Studies in other countries have also indicated high participation of
males in street food vending (Arambulo et al, 1994; Tinker, 1997). In Pune, India for
instance, 95% of the street food vendors are men while in Africa, the preparation and selling
of street foods is dominated by women (FAO, 1990; Tinker, 1987a; Tinker, 1997). Hence
street food vending is not gender-specific, although women are considered to be the majority
on a worldwide basis.
There is tendency for relatively more women vendors in the lower-middle-income
area to engage in street food vending because they want to have their own income to control.
Because it had been found in a previous study (Mwangi et al, 2001) that more male- than
female-vendors relied on street foods for all their income, it was hypothesised that female
vendors, especially those from low-middle-income areas undertook street food vending to
supplement their spouses' income. The present study, however, highlights the other reason of
women wanting their own income to control. This could be nutritionally beneficial for the
women. While studying the effect of women's work on their nutrition, Bisgrove and Popkin
(1996) found that women's work and income had positive effects on the overall quality of
their diet.
While a substantial proportion of women vendors in the Industrial Area and the lower-
middle-income area engage in street food vending to supplement their spouse's income, a
good proportion (25%) of female vendors in the slum area are also household heads. For such
households, and equally for households headed by male vendors, street food vending is very
important because they are looked upon as main household income providers.
There is a tendency for male vendors to make more money per month from street food
vending compared to their female counterparts. Daniels (1999) also reports higher profit
levels among male- than female-owned micro and small enterprises in Kenya. This could be
because women's roles as entrepreneurs are shaped by their family responsibilities. They are
required to be at home early, especially to prepare family dinner and take care of children.
They are also more vulnerable when it comes to personal security in the city at late hours.
Hence they usually work shorter hours, probably invest less money and earn lower returns.
However, returns on their investment (money and time wise) might equal or surpass that of
men (Tinker, 1997).
S t r e e t F o o d s a s a D i r e c t S o u r c e o f F o o d f o r V e n d i n g H o u s e h o l d s
Street foods do not only provide income for vending households but are also a direct source
of food for household members. The vast majority of vending households feed from the street
food pot. The proportion of vendors feeding on the street food pot on a daily basis in the
110
S t r e e t F o o d s a s a S o u r c e o f L i v e l i h o o d
Industrial Area is small because they operate for 5-6 days, according to the operating
schedules of the factories in the area. Considering that the majority feed for >4 days per week,
one can comfortably infer that they feed on the street food pot for the days they operate. It
appears that especially vendors selling main meals in Korogocho slums and the Industrial
Area find it convenient and economical for the households to feed from the street food pot.
Preparation can be done for the family and the business all at once. In addition, cooking in
bulk might be cheaper than cooking several times in small quantities. It saves on both time
and cooking fuel. Although the study does not prove this, it is possible that buying ingredients
in bulk or in big portions is more economical and that vendors take advantage of this to feed
their families. Feeding only to satisfy appetite is common in the lower-middle-income
residential area of Dandora. This could be because most foods sold in this area are snacks.
This is quite clear from the results on the meals replaced by feeding from the street food pot.
For Korogocho slums it is mainly breakfast, lunch and snacks; in Dandora it is breakfast and
snacks while in the Industrial Area it is breakfast and lunch. In general, dinner is less
important in the street food system.
The 24-hour recall results show that street foods play a substantial role as a direct food
source for vending households. Households vending breakfast and snack foods obtain almost
one-fifth while those vending lunch foods obtain about one-third of their R D A for energy
from the street food pot. Although this procedure of estimating usual food intake has
shortcomings in that it is only a one-day recall, it does reveal that street food vending is an
important food source for vending households. The wide standard deviations in the
proportion of energy provided from the street food pot and the fact that vendors were not all
interviewed on the same day shows that there are households obtaining substantial energy
from the pot and especially that most households consume on a daily basis.
Due to the high response rate among study vendors, we think that the findings of this
study can address areas with similar socio-economic characteristics within Nairobi and
similar large cities. However, generalisation to smaller cities with less intensity of street food
vending is not viable. We note some limitations in the methods used in the present study. An
in-depfh assessment of the role of income from street food vending against other economic
activities in the households would have revealed more details on the usefulness of street food
income for vending households. However, since the vending of street foods had the highest
share in all the household economic activities, w e think that the method used gives sufficient
indication of the importance of income from street foods for vending households. In addition,
an elaborate food intake record of vending households would have given more information on
how street foods affect availability of food variety in the household and the overall nutrient
intake among members of vending households. Hence our results should be treated as
indicative of the importance of street foods in the diet of vending households.
i l l
C h a p t e r 6
C O N C L U S I O N S
Street food vending is an important source of livelihood especially for vending households in
the very-low-income urban areas. It forms the highest share in all their economic activities
involving household members because it is cheap to start. Hence the households rely on food
vending as their main income provider. Street vended foods are also a direct food source for
vending household members. Vendors, however, operate under insecure circumstances due to
lack of recognition. Since there is increased awareness of the role of street foods not only in
the diets of urban dwellers but also in the economic circles, the sector needs to be set in a
realistic and effective institutional regulation.
A C K N O W L E D G E M E N T S
W e thank the Netherlands Foundation for Advancement of Tropical Research (WOTRO);
file number W V 96-153, for funding the research. Our gratitude also goes to Prof. J. Imungi
and Dr. Wambui Kogi-Makau of Nairobi University for their support; Provide International,
Korogocho and Gospel Tabernacle Church, Dandora for providing us with office space in the
field. W e also appreciate the help of field assistants and the cooperation of all the vendors
involved.
R E F E R E N C E S
Arambulo HI P, Almeida CR, Juan Cuellar S and Belotto AJ (1994). Street food vending in Latin
America. Bulletin ofPAHO, 28(4): 344-354. Bisgrove EZ, Popkin BM (1996). Does women's work improve their nutrition: Evidence from the
urban PhiUppines. Soc. Sci. Med., 43(10): 1475-1488.
Boccas F (1996). Codex Alimentarius: Control of street foods. Food, nutrition and Agriculture, 17/18: 70-72.
Canet C, N'Diaye C (1996). L'alimentation de rue en Afrique (Street food in Africa - Summary).
Food, nutrition and Agriculture, 17/18: 70-72.
Chauliac M, Gerbouin-Rerolle P (1994). Street food: a comprehensive approach. Children in the
Tropics, 213: 5-20. Daniels L (1999). The role of small enterprises in the household and national economy in Kenya: A
significant contribution or a last resort? World Development, 27(1): 55-65.
FAO (1990). Street foods. Report of an FAO Expert Consultation Jogjakarta, Indonesia, 5-9
December 1988. FAO Food and Nutrition paper, 46. FAO (1997). Street foods. Report of an FAO technical meeting on street foods, Calcutta, India, 6-9
November 1995. FAO Food and Nutrition paper, 63. FAO (1998). The state of food and agriculture 1998. FAO, Rome.
Haddad L, Ruel MT, Garret JL (1999). Are urban poverty and undernutrition growing? Some newly
assembled evidence. World Development 21'(11): 1891-1904.
Kenya, Government of and UNDP (1999). Kenya Human development Report. Vol U. United Nations
112
S t r e e t F o o d s a s a S o u r c e o f L i v e l i h o o d
Office, Nairobi.
Korir SCR, Imungi JK, and Muroki NM, (1998). Proximate chemical composition of street foods and
their energy and protein contribution to the nutrition of manual workers in Nairobi. Ecology of Food and Nutrition, 37: 123-133.
Mwangi AM, den Hartog AP, Foeken DWJ, van't Riet H, Mwadime RKM & van Staveren WA
(2001): The ecology of street foods in Nairobi. Ecology of Food and Nutrition, 40: 497-523.
Oguntona CRB, Kanye O, (1995). Contribution of street foods to nutrient intakes by Nigerian
adolescents. Nutrition and Health, 10: 165-171.
Oguntona CRB, Telia TO, (1999). Street foods and dietary intakes of Nigerian urban market women.
International Journal of food Sciences and Nutrition, 50: 383-390.
Sehmi JK, (1993). National food composition tables and the planning of satisfactory diets in Kenya. Ministry of Health/National Public Health, Laboratory Services, Nairobi.
Streetfood Project (1992). Production and distribution of street foods: a socio-economic survey in Bogor, West Java. Working paper No. 5. Ministry of Research and Technology - Indonesian
Agency for the assessment and Application of Technology (BPPT), Netherlands Directorate
General of International Cooperation (DGIS), Netherlands Organisation for Applied
Scientific Research (TNO), Bogor Agricultural University (IPB) and Amsterdam Free
University (VU). VU, Amsterdam.
Sujatha T, Shatrugna V, Rao NGV, Reddy CKG, Padmavathi KS, Vidyasagar P, (1997). Street food:
An important source of energy for the urban worker. Food and Nutrition Bulletin.lS (4): 318-
322.
Tinker I (1987a). Street foods: testing assumptions about informal sector activity by women and men.
Current Sociology, 35(3): 1-110.
Tinker I (1987b). The case for legalizing street foods. Ceres, 20(5): 26-31.
Tinker I (1997). Street foods: Urban food and employment in developing countries. Oxford
University Press, New York.
UNFPA (1999), The State of World Population 1999. New York.
http://www.unfpa.org/swp/1999/chapter2d.htm.
von Braun J, McComb J, Fred-Mensah BK, Pandya-Lorch R, (1993). Urban food insecurity and malnutrition in developing countries: trends, policies, and research implications. IFPRT,
Washington DC.
WHO (1996): Essential safety requirements for street-vended foods. WHO, Division of Food and
Nutrition, Food Safety Unit, Geneva.
World Bank (1999). World development Indicators. International Bank for Reconstruction and Development, Washington DC.
113

o I
GENERAL DISCUSSION

C h a p t e r 7
B A C K G R O U N D
The studies presented in this thesis aimed at providing insight in the nutritional, hygienic and
socio-economic dimensions of street foods in Nairobi. The results are intended to be of use
for organising the street foods sector for the purpose of providing nutritious and hygienicalfy
safe foods for consumers, while sustaining the socio-economic role of street foods for urban
populations. The ability to generalise the findings depends on the understanding of the
historical and the intensity of the urbanisation process of the cities in question. Therefore,
significant differences are not expected in large (metropolitan) African cities where
urbanisation processes have much in common with Nairobi. Generalising the findings in
respect to smaller towns, however, may require caution. In this chapter, the study
methodologies, the main findings and policy implications of the findings are discussed.
M e t h o d o l o g i c a l c o n s i d e r a t i o n s
Street food vending is observed in many large cities and small towns in Kenya. Nairobi was
selected because, being the capital city, it represents more people and is better to extrapolate
to other large cities in African countries.
In the absence of records on the growth of the street food sector in Nairobi, our
method of using key informants living in the city of Nairobi for many years (Chapter 2) was
the most suitable to establish the past trends in street food vending and consumption. Since
the key informants had different backgrounds, the consistency obtained in their responses by
only the fourth informant confirmed the rehability of the method. In addition, the literal
exploration of the city at different times of the day was the most accurate method to estimate
the scope of vending within the city.
The selection of the study areas was based on the fact that they were frequented by
street food vendors and were representative of other such areas in Nairobi. In the initial study
(Chapter 2), all vendors in the study areas were targeted making the study sample the most
representative. In subsequent studies, we tried as much as possible to randomise our sample
selection. Prior to the surveys, interviewers were rigorously trained and the questionnaires
pre-tested.
To determine street food quality in terms of food groups displayed by vendors, we
used the FAO commodity food grouping system. Although the FAO system masks variety of
foods within groups and excludes fats and oils, we overcame this oversight by presenting, in
Chapter 4, the actual energy and nutrient quality of the foods. The results in Chapter 4
confirmed what was found in Chapter 3 for the different study areas. W e presented the
quality of street foods in terms of the energy and nutrients that would be obtained from usual
servings of the food. This directly provides the level of adequacy of energy and nutrients
obtained from consuming street foods when served in the usual way.
W e assessed the energy and nutrient adequacy of street foods by inventory of the
foods served, although the way consumers choose their food also influences the potential to
116
G e n e r a l D i s c u s s i o n
117
obtain adequate energy and nutrients from street foods. Our aim was to provide the overall
quality of street foods as far as meeting energy and nutrient needs were concerned (Chapter
4). W e therefore addressed the issue of food choice by including all the possible food and
meal combinations as served to the consumers.
The method used in assessing level of basic hygiene knowledge in relation to practice
(Chapter 5) was adopted from available Uterature. Variables such as socio-economic status
(Menon et al, 2000), attitude (Angelillo et al, 2000) and food safety knowledge (Azanza et
al, 2000) have previously been rated by assigning scores. However, w e could not link given
vendor knowledge aspects to specific practices with this method but provided an overall
evaluation of the problem.
Our findings on street foods as a direct food source for vending households are only
indicative of their importance for the observed households (Chapter 6). A more detailed food
availability and intake method would be necessary to determine the effect of street food
vending and consumption on food varieties and overall nutrient intake of members of
vending households.
Research in urban areas is faced with several constraints. At the Industrial Area for
instance, w e had to conduct our surveys within three hours per day, when vendors were found
at the vending sites. In those three hours, vendors were very busy serving and w e had to wait
until they finished. B y the time one or two interviews were over, the rest of the vendors had
left their vending sites. Hence only a few interviews could be conducted in a day.
Furthermore, due to regulations, insecurity and harassment associated with many urban areas,
it takes a lot of effort to win trust from urban communities. Sometimes the environment,
particularly in the slums, is quite unfriendly and researchers who are new in the area may
need security. In addition, when the people learn that they may not get immediate benefit
from the research work, they loose interest. W e managed to win trust from Korogocho and
Dandora residents by being introduced to the communities through respected organisations
working in the two areas and by reporting to the various authorities. The government also
provided us with research permits, which became very handy. The use of local field assistants
living within the study areas was also beneficial as they also served as security. Nevertheless,
it is not always the case that people in the urban environment are unfriendly. Vendors in the
Industrial Area, for instance, were very friendly and receptive. Hence we did not need to be
introduced by any organisation.
M a m f i n d i n g s
Street food vending is an important food supply channel for the urban poor and a source of
employment for the unemployed. Women make the majority (about Iwo-thirds) of the street
food vendors in Nairobi (Chapter 2). The tendency of the phenomenon to tremendously
increase within the past decade reflects the trends in economic growth and rapidly growing
and changing urban food needs (Chapter 2 and Chapter 6). Declining economic growth and
C h a p t e r 7
increased urban poverty causes many urbanites to increasingly participate in informal
activities such as street food vending. In addition, increased economic stress creates need for
income diversification on the one hand, while it increases demand for cheap sources of food
on the other hand. With decreasing real incomes consumers are bound to employ strategies
such as dietary change and change of eating-places, by substituting expensive foods with
cheaper ones. A study in Greater Accra, Ghana, showed that change towards cheaper foods
and rationing money for street foods were the most common food consumption strategies
employed when households did not have enough food or money to buy food (Maxwell et al,
1999).
There is an inverse relation between the density of street food vending activities and
the income level of city areas (Chapter 2). This implies that the main users of street foods are
the urban poor. Contrary to the belief that the use of street foods is related to the convenience
of saving time by busy urban dwellers, the underlying drive is the affordability of street
foods, given the financial means and income flow of the consumers, mainly the urban poor.
In Hterature, street foods are said to be cheaper (in many cases) compared to home-prepared
meals, especially when time spent shopping and cooking and the cost of transport and fuel are
taken into consideration (Tinker, 1997). The poor, therefore, find street foods to be
economically beneficial. As such, the poorest have been shown to spend high proportions of
their total food expenditures on street foods, ranging from 16% in Manikgani, Bangladesh to
50% in He-Ife, Nigeria (Tinker, 1997; Ruel et al, 1999).
Presentation of foods by vendors in terms of food group variety depends on the city
location, which reflects the demands of consumers (Chapter 3). Female vendors are able to
provide more variety but this is offered only where consumers are able to afford. Hence the
socio-economic status of the street food consumers dictates what is offered. Literature shows
that nutritional quality of the diet and nutritional status is associated with the number of items
in the diet, measured as the food variety score (FVS) and number of food groups measured as
dietary diversity score (DDS) (McCrory et al, 1999; Hatl0y et al, 2000). Both the number
of food items and food groups in the diet have also been shown to be associated with socio
economic status of consumers. From our results it is clear that more food group diversity is
found among vendors in the working area (Industrial Area) while less variety is found among
individual vendors in the residential areas. Hence, variety is consistent with availability of
buyers who can afford. This was confirmed in Chapter 4 in which nutrient quality of street
foods appeared to be better in the Industrial Area than the slums and the low-middle income
residential area. In spite of this, in general most street food vendors are one-food group
sellers and the ability of the foods served to provide adequate energy and micronutrients is
limited.
It is not the lack of hygiene knowledge that hinders vendors from applying safe food
practices but probably the lack of an enabling environment, low economic power of vendors
and buyers, and consumer attitude towards food hygiene (Chapter 5). Street food safety risks
118
G e n e r a l D i s c u s s i o n
have often been associated with low level of education among vendors, implying lack of
knowledge among vendors concerning these risks (Ekanem 1998). Various studies have
shown microbiological contamination of some street foods, posing public health problems
(Freese et al, 1998; Umoh and Odoba, 1999; Muleta and Ashenafi, 2001). According to
Arámbulo et al, (1994), the little knowledge available about street food vendors in Latin
America is that their education is limited and their personal knowledge of hygienic food
handling practices is slight to nil. However, this had not been studied. In Chapter 2 we note
that some vendors from the slum area of Korogocho refused to participate because they
feared that the study would point out the unhygienic state of their foods. This means that they
knew about their unhygienic practices. The issue that emerges from our study is the question
of transforming knowledge into practice, and this also applies to other sources of ready-to-eat
foods. A study comparing the microbiological quality of street foods, home prepared foods
and five-star restaurant food found similar forms of contamination (van Kampen et al, 1998).
It has also been shown that types of pathogens found in street foods are similar to those found
in foods prepared and served indoors (FAO, 1990). More recent studies show that food sold
in streets are generally not more contaminated than foods sold in local restaurants but levels
of contamination in both establishments are clearly potentially harmful to the health of
consumers (Tinker, 1997). We found that although vendors had well established knowledge
on general issues of basic hygiene, their level of basic hygiene knowledge (and also level of
education) did not necessarily influence their practices of food hygiene. Hence other factors
such as consumer demands, lack of amenities and insecurity of their investment may have
contributed to the poor food handling practices. If consumers of street foods have poor
sanitary conditions at their own homes, they may not demand better conditions of street food
vendors. Thus it is difficult to improve standards without increasing health education of
consumers as well as vendors (Tinker, 1987). Furthermore, if the socio-cultural profiles of
consumers are generally similar to those of the vendors, preferences may not relate so much
to food safety or hygiene but to their personal tastes and the foods' affordability (Arámbulo et
al, 1994). In addition, the fact that investment can increase the cost of food may also play a
role on vendors not investing in food safety measures. They use operating equipment of the
least possible cost with no or little observance of sanitary standards. They generally lack the
facilities needed to hold food within adequate temperature ranges for long periods of time.
Hence existing microorganisms can reach high enough concentrations to produce foodborne
disease. Vendors rarely have access to safe running water for cooking, washing utensils and
cutlery, personal hygiene etc. Street food vendors typically use the same water over and over
throughout the day without changing, thereby providing an ideal medium for bacteria.
Safety of ready-to-eat foods also concerns chemical contamination and use of
unauthorised additives. They may include lead residues from vehicle exhausts, toxins from
excessive re-use of fats and oils as well as use of prohibited dyes, flavours and preservatives.
These problems may not be specific to street food vendors but may be found among other
119
C h a p t e r 7
120
ready-to-eat food sellers as well. What is needed is to monitor the use of such substances, set
aside suitable areas within districts of high demand and provide amenities. There is no
reliable information available on the incidences and/or implicating street foods as the main
source of foodborne diseases.
Street food vending provides substantial income, with more than one-third of the
vendors earning at least twice the official minimum wage (Chapter 6). For about half of the
vending households, street foods are their major income provider. High reliance on street
foods as a major income provider is associated with vending households in the poorer
districts of the city. Apart from the role of providing reliable income, street foods also
provide substantial energy for vending household members (Chapter 6). It is convenient and
probably cheaper for vending households to consume from the street food pot. According to
literature, both food and fuel costs are greater per capita when cooking for only a few people
(Ruel et al, 1999). It also avoids wastage from left-over food where refrigeration is not
available. The diet of vending household members may therefore be more diversified since
the money saved can be spent on other types of foods. In addition, they may have some
income left to spend on other household needs (such as health, shelter and school fees).
However, it is possible that street food vending households regularly eat from the street food
pot and their diet is less diversified since they repeatedly sell the same kinds of food.
Although they may have more income to spend on other household basic needs, the quality of
their diet may be compromised.
In conclusion, street food vending in Nairobi is a strategy driven by both demand (for
cheap and convenient food) and supply (due to the need for income). The urban poor and/or
low-income urban dwellers appear to be the main players in the street food phenomenon. The
phenomenon is not gender-specific but women make the majority of the vendors. It is
favoured by the low-income urban dwellers because of its relatively low entry and product
costs. Hence for most consumers, the convenience of street foods is not necessarily linked to
women's opportunity cost of time, but to the affordabUity of the foods. The vendors are not
able to put their hygiene knowledge into practice and the nutritional quality of the foods is
less than adequate. However, where there is an income, particularly female vendors are able
to provide nutritionally better quality foods than their male counterparts. Last but not least,
street food vending is an important source of livelihood for vending households in terms of
income and food, especially those households of low socio-economic status.
S u m m a r y F i n d i n g s o f t h e C o m p l e m e n t a r y s t u d y b y v a n ' t R i e t (2002)
The role of street foods in the diet of low-income urban residents, the case of Nairobi The study by van't Riet (2002) shows that it is common for people living in low-income areas
in Nairobi to buy non-home prepared foods instead of preparing all their foods at home.
Street foods are the major source of non-home prepared foods for poor urban residents. The
G e n e r a l D i s c u s s i o n
1 This section of the chapter has been written jointly with Hilda van't Riet and also appears in her thesis (van't Riet, 2002).
121
frequency of street food consumption is higher in the slum area (Korogocho) than in the low-
middle-income area (Dandora) included in the study. Both kiosk foods and street foods are
major sources of non-home prepared foods for residents of the low-middle-income area. The
main reasons for consumption of street foods are that they are cheap and convenient while the
main reason for non-consumption is that preparation and storage of the foods is unhygienic.
Street foods provide a substantial part of the daily intake of energy and nutrients in
the diet of 5-7 year old children living in a slum area in Nairobi, with a median contribution
to energy intake of 21%. Furthermore, non-home prepared foods provide substantial
proportions (13-36%, median) of daily energy and nutrient intake of men, women and 9 -14
year old children in a slum and a low-middle-income area of Nairobi. In the slum area, street
foods make more that 70% of the energy derived from non-home prepared foods. Men
consume larger proportions of their daily intakes from non-home prepared foods compared to
women and children. Consumers from the low-middle-income area derive larger proportions
of their daily food intake from non-home prepared foods compared to consumers from the
slum area. Non-home prepared foods provide relatively high amounts of fat and relatively
low amounts of vitamin A.
Therefore, non-home prepared foods are an important part of the diet of low-income
residents of Nairobi. Street foods, being relatively cheap, are especially important for the very
poor urban dwellers.
P o l i c y i m p l i c a t i o n s 1
People living in urban areas of the developing world are expected to increase rapidly and
particularly in the less developed regions (UN, 2001). There is a projected significant
increase in poverty, food insecurity and undernutrition in the urban areas unless these aspects
are reduced in direct proportion to the growth in urban population (Haddad et al, 1999;
Pinstrup-Andersen, 2000). In Nairobi, absolute poverty already more than doubled in only
three years, between 1994 (22%) and 1997 (50%) (Kenya, 2001).
With urbanisation, people loose the ability to produce their own food and rely heavily
on food purchases (Ruel et al, 1999). In addition, there is a general trend everywhere in cities
in the world that people are taking more of non-home prepared foods, due to the urban way of
life (Ruel et al, 1999; Solomons and Gross, 1995). With increasing urbanisation,
consumption of non-home prepared foods will also increase. However, increasing urban
poverty means that there will be need for cheap and nutritious food outiets in the urban areas.
Hence, the use of street foods in terms of intake and its economic importance will probably
increase with further urbanisation of Nairobi.
C h a p t e r 7
The problem is that many governments in sub-Sahara Africa persist in thinking about
urban food insecurity primarily in terms of aggregate food supply to the cities, rather than the
ability of poor households in urban areas to purchase food (Maxwell, 1999). In addition, most
programme and policy analyses rely on simple urban-rural comparisons, which mask
enormous differences between socio-economic groups in urban areas (Menon et al, 2000).
The current trends of increasing urban poverty and inequality in developing countries suggest
that household and individual empowerment of the urban poor are fundamental to their
access to food. For the urban poor formal social nets such as government price subsidies are
less evident and coping strategies have tended to be individualistic and household-based
(Atkinson, 1994; Maxwell , 1999). Their access to local political processes remains in
question. Frequently, municipal governments negatively impact on the poor by destroying
employment opportunities through harassment of the informal sector and non-provision of
infrastructure. Street food vending is one such informal activity that faces banning and lacks
official recognition in developing countries such as Kenya. The authorities in most cases fail
to see the positive aspects of these activities.
The results presented here and those by van't Riet (2002) show that street foods are
important in providing employment and food for the urban poor. Banning of street food
vending in Nairobi will therefore destroy jobs and rob the poor of a means of livelihood and a
cheap source of food. Authorities need to be convinced of the potential of street foods for
food and nutrition of the low-income urban consumers and of the role of street foods as a
source of livelihood for vendors. The lack of recognition of the street foods sector leaves its
operators in a state of uncertainty. Absence of some mode of control and monitoring exposes
street food consumers to health risks. The challenge to food policy is to provide an
empirically sound basis for policy and programme formulation in urban areas, particularly as
it relates to low-income people's ability to acquire food, health care, and other basic
necessities.
Hence, there is need to recognise and legalise eating out places for the urban poor,
such as street foods sites, without imposing tedious requirements that are not achievable by
the poor. The goal should be to ensure that the food is safe, nutritious and affordable to
consumers and profitable to vendors. This can be achieved when all parties, being the
vendors, the consumers and the city authorities, are involved in the process. Non
governmental organisations and academic institutions could also be included to facilitate
development and implementation of the necessary policies and programmes.
Efforts need to be directed into putting in place education programmes for street food
vendors and consumers on the importance of safe and nutritious food. The programmes
should aim at making vendors sensitive to food safety measures and the consumers should
also be made responsible for the safety of the food they eat and to make demands for safe
foods. Apart from education programmes, policies and programmes that would lead to the
122

G e n e r a l D i s c u s s i o n
123
improvement of the micronutrient quality of street foods need to be considered. Thus, the
potential role of street foods in nutritional intake and the scope for increasing nutritional
contribution needs to be explored and incorporated in the programmes.
City planning and infrastructure needs to cater for street food vending locations
especially in low-income areas. Providing vending locations will prevent the obstruction of
traffic by vendors. Such locations should be supplied with sanitation facilities such as running
water, toilets and garbage disposal facilities. Such amenities are essential for vendors to
comply with the necessary hygiene regulations. Vendors should be guided on how to invest
in safe food practices at minimum costs. This will involve development of cheap and
appropriate technologies that vendors can afford.
Implementation of any policies and programmes should incorporate evaluation and
monitoring of their effects on prices of street foods as well as on the socio-economic and
nutritional benefits for consumers and vendors.
Finally, one might argue that street foods are only associated with poverty and that
they will become less important or disappear when poverty decreases. However, we think
that with improved economic status, vendors are bound to develop the street foods business
into more than just serving the poor with affordable food. In the Philippines where street food
vending has been recognised for instance, vending and consumption of street foods cuts
through the cross-section of socio-economic profile of the population ranging from the more
affluent sector at one end of the spectrum to the disadvantaged at the other end (Azanza,
2000). Therefore, vendors are bound to adopt the sector to the prevailing clientele. Hence
policy measures in terms of legalising the sector and pursuing better street food quality
remain necessary.
R E F E R E N C E S
Angelillo IF, Viggiani NMA, Rizzo L, Bianco A (2000). Food handlers and foodborne diseases:
knowledge, attitudes and reported behavior in Italy. Journal of Food Protection, 63(3): 381-385.
Arambulo IU P, Almeida CR, Juan Cuellar S, Belotto AJ (1994). Street food vending in Latin
America. Bulletin ofPAHO, 28(4): 344-354. Atkinson SJ (1994). Food security and poor urban populations. In Biswas MR, Gabr M (eds.),
Nutrition in the nineties: Policy issues. Oxford University Press, Delhi, p. 55-81. Azanza Ma. PV, Gatchalian CF, Ortega MP (2000). Food safety knowledge and practices of
streetfood vendors in a Philippines university campus. International Journal of Food Sciences and Nutrition, 51: 235-246.
Ekanem EO (1998). The street food trade in Africa: safety and socio-environmental issues. Food Control, 9(4): 211-215.
FAO, 1990. Street foods. Report of an FAO Expert Consultation Jogjakarta, Indonesia, 5-9 December 1988. FAO Rome. FAO Food and Nutrition Paper, 46.
Freese E, Romero-Abal M, Solomons NW, Gross R (1998). The microbiological safety of typical
C h a p t e r 7
Guatemalan foods from street vendors, low-income homes and hotels. International Journal of Food Sciences and Nutrition, 49: 27-38.
Haddad L, Ruel MT, Garrett JL (1999). Are urban poverty and undernutrition growing? Some newly assembled evidence. World Development, 21'(11): 1891-1904.
Had0y A, Hallund J, Diarra MM, Oshaug A (2000). Food variety, socioeconomic status and nutritional status in urban and rural areas in Koutiala (Mali). Public Health Nutrition, 3(1): 57-65.
Kenya, Government of (2001). Poverty reduction strategy paper for the period 2001-2004 prepared by the people and government of Kenya, Volume 1. Ministry of Finance and Planning, Nairobi
Maxwell D (1999). The political economy of urban food security in Sub-Saharan Africa. World Development, 27(11): 1939-1953.
Maxwell D, Ahiadeke C, Levin C, Armar-Klemesu M, Zakariah S, Lamptey GM (1999). Alternative food-security indicators: revisiting the frequency and severity of 'coping strategies'. Food Policy, 24: 411-429.
McCrory MA, Fuss PJ, McCallum JE, Yao M, Vinken AG, Hays NP, Roberts SB (1999). Dietary variety within food groups: association with energy intake and body fatness in men and women. American Journal of Clinical Nutrition, 69: 440447.
Menon P, Ruel MT, Morris SS (2000). Socio-economic differentials in child stunting are consistently larger in urban than rural areas. Food and Nutrition Bulletin, 21(3): 282-289.
Muleta D, Ashenafi M (2001). Bacteriological profile and holding temperatures of street-vended foods from Addis Ababa. International Journal of Environmental Health Research, 11: 95-105.
Pinstrup-Andersen P (2000). Food policy research for developing countries: emerging issues and unfinished business. Food Policy, 25:125-141.
Ruel MT, Haddad L, Garrett JL (1999). Some urban facts of life: Implications for research and policy. World Development, 27(11): 1917-1938.
Solomons NW, Gross R (1995). Urban nutrition in developing countries. Nutrition Reviews, 53(4): 90-95.
Tinker I (1987). The case for legalizing street foods. Ceres, 20(5): 26-31. Tinker I (1997). Street Foods. Urban food and employment in developing countries. Oxford
University Press, New York. Umoh VJ, Odoba MB (1999). Safety and quality of street foods sold in Zaria, Nigeria. Food Control,
10: 9-14 UN, Population Division (2001). World Urbanization Prospects: The 1999 Revision. United Nations,
New York. van Kampen J, Gross R, Schultink W, Usfar A (1998). The microbiological quality of street foods in
Jakarta as compared to home-prepared foods and foods from tourist hotels. International Journal of Food Sciences and Nutrition, 49: 17-26.
van't Riet H (2002). The role of street foods in the diet of low-income urban residents, the case of Nairobi. Ph.D Thesis, Wageningen University. Ponsen and Looijen, Wageningen.
124
1
S U M M A R Y
S u m m a r y
Rapid urbanisation has been coupled with declining economies and lack of employment in sub-
Saharan Africa, Kenya being one of the countries. Recent reviews reveal increasing urban
poverty and undernutrition with increasing urban population in developing countries. The urban
poor have been reported to utilise a variety of informal coping initiatives to enable them to
survive, improve their welfare, and most of all, to obtain food. One such strategy is the vending
of street foods. Street foods are said to supply a large number of people with relatively
inexpensive food and that the urban poor would be worse off if there were no street food
vendors. However, street foods are also reported to undergo unhygienic or improper food
preparation and/or handling and vendors are thought to be completely unaware of hygienic
practices. Literature also indicates that street foods are a source of employment for many
unemployed urban dwellers, although the sector is not officially recognised in many countries
such as Kenya. Most studies on street foods have focused on their microbiological quality,
energy and protein contribution to daily intake by consumers and the level of income obtained
from vending. Despite this, information on the nutritional dimensions, hygiene knowledge and
practices of vendors and the role of street foods as a source of livelihood for vending households
remain scanty. Given the fact that the street foods sector may be an important source of nutrition
for low-income urban populations and employment in the midst of lack of formal employment
opportunities, more insight is needed to underscore its benefits for official recognition. This
study is one of two complementary Ph.D studies on street foods in Nairobi. W e defined street
foods as "ready-to-eat foods and beverages, processed or fresh, which are sold at stationary
locations or by mobile vendors in streets and open places, as opposed to stores and licensed
establishments".
The overall aim of this study was to get insight in the nutritional, hygienic and socio
economic dimensions of street foods in Nairobi as a prerequisite to providing nutritious and
hygienically safe food for consumers, while sustaining their socio-economic role for urban
populations. The study was based on interviews by means of non-structured and structured
questionnaires, as well as on observation of the research population. The fieldwork was carried
out in several phases between October 1997 and April 1999. First, a key informant guide was
used to establish the genesis of and subsequent trends in street food vending in Nairobi. This
was followed by exploration of different districts of the city to determine the scope of vending
activities in the city. Three study areas, Korogocho (a very-low-income slum settlement),
Dandora (a lower-middle-income residential area) and the Industrial Area were selected to
represent each of the areas frequented by street food vendors. Cross-section surveys were
conducted among street food vendors in the selected areas, in three phases. The surveys sought
to determine the nutritional quality of street foods as well vendor's general knowledge of basic
food hygiene and its relation to practice. Also studied was the role of street foods as a source of
livelihood for vending households and its links with socio-economic aspects of the households.
T r e n d s a n d S c o p e ( C h a p t e r 2)
W e found that street food vending and consumption in Nairobi rapidly increased during the previous two decades, instigated by the need for affordable food among low-income urban
126
Summary
dwellers and the need for employment. It was an expanding phenomenon especially found
among the urban poor, but was spreading up the higher socio-economic groups due to
increasing monetary demands. About one-third of the vendors were men.
Nutritional Quality and Adequacy (Chapters 3 and 4) Most (53%) vendors were one-food group sellers with 44% selling cereals. Overall, 36%
vendors, mostiy males, sold only carbohydrate-rich products. Mixed-food sellers were more in a
working area (53%) than a slum area (43%, p<0.05), who were more than at a lower-middle-
income residential area (21%, p<0.001). Micronutrient rich and mixed-nutrient products were
associated with female vendors. Street foods were commonly used for breakfast, lunch, major
afternoon snack and petty snacks. Mean energy, protein, iron and vitamin A per serving of
breakfast and snack foods was 2-20% of the adult equivalent. Major meals (lunch), which were
hardly served in Dandora, provided significantly higher vitamin A per serving in the Industrial
Area than in Korogocho slums (p=0.001). A deduced consumption pattern of a breakfast, major
snack, petty snack and lunch per day from the streets did not give adequate daily energy (<70%
of adult equivalent). Protein was more than adequate if the major meal was animal- or
legume/pulse-based. Iron adequacy was achieved with all major meal types. Vitamin A intake
adequacy was not reached in Korogocho but was achieved with vegetable-based meals in the
Industrial Area. However, the question of bioavailability was not addressed.
Hygiene Knowledge and Practice of Vendors (Chapter 5) Knowledge of basic food hygiene did not vary with vendors' level of formal education.
However, vendors who had received lessons on food hygiene and/or handling were 7 times
more likely to attain above average scores on knowledge of basic food hygiene than vendors
who had not received lessons. Good hygiene practices were not associated with vendors'
knowledge of basic food hygiene but significantly varied between study locations.
Street Foods as a Source of Livelihood for Vending Households (Chapter 6) Street food vending formed 63% of economic activities among household members, being
higher in Korogocho, a very-low-income area, (71%) than in Dandora, a lower-middle-income
area, (57%) but not in the Industrial Area (63%), p<0.05. Most (54%) vendors earned above the
official minimum wage from vending. They were more in the Industrial Area (66%) than in
Dandora (42%) and Korogocho (56%) residential areas (j?<0.05). Others earned at least twice
the official minimum wage and were more in the very-low-income settlement of Korogocho
(42%) and the Industrial Area (45%) than in lower-middle-income area of Dandora (23%),
p<0.05. About half (46%) of the vending households relied on street food vending as the major
household income provider and were associated with a low socio-economic index and vendors
as heads of households. Mean energy supplied from the street food pot was 16 ± 12% of
recommended daily allowance (RDA) for households selling snack and/or part of breakfast
foods and 32 ± 16% of RDA for households selling main meal foods.
Inconveniences most frequently cited by vendors were difficulties of working in the
127
Summary
open in all study areas and harassment by city authorities particularly in the Industrial Area.
Most vendors cited provision of income as an advantage of street food vending.
Conclusions and Policy Implications W e concluded that street food vending in Nairobi is a strategy driven by both demand (for cheap
and convenient food) and supply (due to the need for income). The urban poor and/or low-
income urban dwellers are the main players in the street food phenomenon. It is an important
food supply channel for the urban poor and provides employment to a labour force that would
otherwise be unemployed. The phenomenon is not gender-specific but women make the
majority of the vendors. It is a major source of livelihood especially for vending households in
the very-low-income urban areas. It is favoured by the low-income urban dwellers because of its
relatively low entry and product costs. Hence for most consumers, the convenience of street
foods is not necessarily linked to women's opportunity cost of time, but to the affordabihty of
the foods. Street foods as provided and served by vendors are not nutritionally adequate.
However, where there is an income, particularly female vendors are able to provide nutritionally
better quality foods than their male counterparts. Unhygienic handling of the foods is probably
due to absence of an enabling vending environment and lack of demand from consumers, but
not due to complete lack of hygiene knowledge of vendors. In addition, vendors operate under
insecure circumstances due to lack of recognition. Authorities need to be convinced of the
potential of street foods for food and nutrition of the low-income urban consumers and of the
role of street foods as a source of livelihood for vendors. The challenge to food policy is to
provide an empirically sound basis for policy and programme formulation in urban areas,
particularly as it relates to low-income people's ability to acquire food, health care, and other
basic necessities.
Hence, there is need to recognise and legalise eating out places for the urban poor, such
as street foods sites, without imposing tedious requirements that are not achievable by the poor.
Absence of some mode of control and monitoring exposes street food consumers to health risks.
The goal should be to ensure that the food is safe, nutritious and affordable to consumers and
profitable to vendors. Efforts need to be directed into putting in place education programmes for
street food vendors and consumers on the importance of safe and nutritious food. The
programmes should aim at making vendors sensitive to food safety measures and the consumers
should also be made responsible for the safety of the food they eat and to make demands for safe
foods. The potential role of street foods in nutritional intake and the scope for increasing
nutritional contribution needs to be explored and incorporated in the programmes. City planning
and infrastructure needs to cater for street food vending locations especially in low-income
areas. Such locations should be supplied with sanitation facilities such as running water, toilets
and garbage disposal facilities. Vendors should be guided on how to invest in safe food
practices at minimum costs. This will involve development of cheap and appropriate
technologies that vendors can afford. Finally, implementation of any policies and programmes
should incorporate evaluation and monitoring of their effects on prices of street foods as well as
on the socio-economic and nutritional benefits of consumers and vendors.
128
Samenvatting
SAMENVATTING
D e snelle urbanisatie in Afrikaanse landen ten zuiden van de Sahara zoals Kenia, hangt samen
met de verslechterende economie en toename van de werkeloosheid. Recente
overzichtsartikelen tonen aan dat toenemende stedelijke armoede en ondervoeding samengaan
met een toenemende stedelijke bevolking in ontwikkelingslanden. De arme mensen in de steden
gebruiken verschillende informele strategieën om te overleven, hun welzijn te verbeteren en
vooral om voedsel te verkrijgen. Eén van die strategieën is het verkopen van streetfoods. Street foods worden gezien als een relatief goedkope voedselbron voor een groot aantal mensen en de
stedelijke armen zouden slechter af zijn als er geen verkopers van street foods waren. Soms
blijken streetfoods echter op onhygiënische of onjuiste wijze klaargemaakt en/of behandeld te
zijn en het lijkt dat verkopers zich totaal niet bewust zijn van hygiënische praktijken. Uit de
literatuur blijkt tevens dat de handel in streetfoods werkgelegenheid biedt aan vele werkloze
stedelingen, hoewel de sector in vele landen -zoals ook in Kenia- niet officieel erkend wordt. De
meeste studies over street foods zijn gericht op de microbiologische kwaliteit, energie- en
eiwitbijdrage aan de dagelijkse inname van de consumenten en het inkomen verkregen uit de
verkoop. Niettemin is de informatie over voedingswaarde van street foods, de hygiënische
kennis en praktijken van de verkopers en de rol die streetfoods spelen als een inkomstenbron
voor huishoudens nog schaars. Gegeven het feit dat de street food sector een belangrijke bron
van voedsel kan zijn voor de stedelijke bevolking met laag inkomen en tevens kan bijdragen aan
werkgelegenheid, bij een gebrek aan formele werkgelegenheid, is er meer inzicht nodig om de
positieve aspecten van de handel te benadrukken om tot officiële erkenning te komen. Deze
studie is één van twee complementaire studies naar streetfoods in Nairobi. Wij definieerden
street foods als "kant-en-klare voedingsmiddelen en dranken, bewerkt of vers, die op straat
verkocht worden (in tegenstelling tot in winkels en etablissementen met een vergunning) vanaf
een vaste plaats of door ambulante verkopers".
D e overkoepelende doelstelling van deze studie was om inzicht te krijgen in de
voedings-, hygiëne en sociaal-economische aspecten van streetfoods in Nairobi, als een eerste
vereiste om de consumenten van hygiënisch en voedzaam voedsel te voorzien, terwijl de
sociaal-economische rol voor de stedelijke bevolking behouden blijft. De studie maakte gebruik
van interviews met behulp van vragenlijsten en observatief onderzoek. Het veldwerk vond
plaats in verscheidene fasen tussen oktober 1997 en april 1999. Allereerst werden met behulp
van sleutelinformanten de oorsprong en trends van de verkoop van streetfoods in Nairobi in
kaart gebracht. Vervolgens werd er een verkennend onderzoek gedaan naar de omvang van de
verkoopactiviteiten in verschillende wijken van de stad. Drie studiegebieden, Korogocho (een
sloppenwijk met zeer lage inkomens), Dandora (een wijk met lage en middelbare inkomens) en
het Industriegebied, werden geselecteerd als representatie van de gebieden waar de street food verkopers opereerden. De street food verkopers in de drie gebieden werden onderzocht in een
129
Samenvatting
cross-sectioneel onderzoek in drie fasen. De onderzoeken richtten zich zowel op de
voedingswaarde van het voedsel als op de algemene kennis van de verkoper aangaande hygiëne
van voedsel en de toepassing van deze kennis in de praktijk. Tevens werd de rol van streetfoods
als een bron van inkomen voor de huishoudens onderzocht en de relatie met de sociaal-
economische kenmerken van de huishoudens.
Trends en Omvang (Hoofdstuk 2) Wij vonden dat de verkoop en consumptie van street foods in Nairobi snel was toegenomen
tijdens de afgelopen twee decennia, aangespoord door de behoeftes aan betaalbaar voedsel voor
stedelingen met een laag inkomen en werkgelegenheid. Dit fenomeen was vooral zichtbaar
onder de stedelijke armen, maar door de toenemende financiële lasten had het zich ook verbreid
naar de hogere sociaal-economische groepen. Ongeveer eenderde van de verkopers was man.
Voedingswaarde en Aanbevolen Hoeveelheden (Hoofdstukken 3 en 4) De meeste verkopers (53%) verkochten één product, en bij 44% was dat een graanproduct.
Totaal verkochten 36% van de verkopers, vooral mannen, alleen koomydraatrijke producten.
Verkopers van gemengde producten waren meer te vinden in het Industriegebied (53%) dan in
de sloppenwijk (43%, p<0.05) en het minst in de laag-middeninkomen wijk (21%, p<0.001).
Producten die rijk aan micronutriënten en gevarieerd in voedingsstoffen waren, werden het
meest verkocht door vrouwelijke verkopers. Streetfoods werden algemeen genuttigd als ontbijt,
als lunch, als grote snack 's middags en als kleine snacks tussendoor. Het gemiddelde energie-,
eiwit-, ijzer- en vitamine A gehalte per portie van de ontbijt- en snackproducten was 2-20% van
de aanbevolen dagelijkse inname voor volwassen mannen. Volledige maaltijden (lunch), die
overigens bijna niet geserveerd werden in Dandora, bevatten significant grotere hoeveelheden
\dtamine A per portie in het Industriegebied dan in de sloppenwijk Korogocho (p=0.001). D e
consumptie van een ontbijt, grote snack, kleine snack en een lunch van op straat gekochte
producten bij elkaar op een dag, dekte de energiebehoefte niet (<70% van de aanbevolen
energie-inname voor volwassen mannen). Indien de lunch op basis van dierlijke producten of
peulvruchten was, was het eiwitgehalte meer dan toereikend. D e ijzerbehoefte werd gedekt door
alle lunches. Vitamine A was onvoldoende aanwezig in de street food lunches in Korogocho
maar voldoende in de op groenten gebaseerde lunches in het Industriegebied. De mate van
biobescbikbaarheid van de voedingsstoffen uit het voedsel is echter niet in de bepaling
meegenomen.
Kennis van Hygiëne en de Praktijk van de Verkopers (Hoofdstuk 5 ) De kennis van voedselhygiëne varieerde niet met het formele opleidingsniveau van de
verkopers. Verkopers die voorhchting ontvangen hadden over voedselhygiëne en/of het
behandelen van voedsel hadden echter 7 keer zoveel kans om bovengemiddelde scores te
130
Samenvatting
131
behalen met betrekking tot kennis van voedselhygiëne dan verkopers die geen voorlichting
ontvangen hadden. Goede hygiënische praktijken waren niet geassocieerd met de kennis van de
verkopers over voedselhygiëne, maar varieerden tussen de studielocaties.
Street Foods als Bron van Inkomsten voor de Verkopende Huishoudens (Hoofdstuk 6) De verkoop van streetfoods vormde 63% van de economische activiteiten van de leden van de
huishoudens. Dit was hoger in Korogocho, een gebied met zeer lage inkomens (71%), dan in
Dandora, een laag-middeninkomensgebied (57%), maar was niet verschillend van het
Industriegebied (63%), /><0.05. De meeste verkopers (54%) verdienden meer dan het officiële
minimumloon. Dit percentage lag hoger in het Industriegebied (66%) dan in de wijken Dandora
(42%) en Korogocho (56%) (p<0.05). Anderen verdienden tenminste twee keer zoveel als het
officiële minimum loon en dit percentage lag hoger in de sloppenwijk Korogocho (42%) en in
het Industriegebied (45%) dan in de laag-middeninkomen wijk Dandora (23%), p<0.05. Voor
ongeveer de helft van de verkopende huishoudens (46%) was de verkoop van streetfoods de
belangrijkste inkomstenbron. Dit was geassocieerd met een lage sociaal-economische index en
dat de verkopers het hoofd van het huishouden was. Het gemiddelde energiepercentage uit de
consumptie van de eigen streetfoods was 16 ± 12% van de aanbevolen dagelijkse inname voor
huishoudens die snacks en/of ontbijtproducten verkochten en 32 ± 16% voor de huishoudens die
hele maaltijden verkochten.
Ongemakken die het meest genoemd werden door de verkopers in alle gebieden waren
de problemen om buiten te werken. Vooral de verkopers in het Industriegebied ervaarden ook
het lastig worden gevallen door de autoriteiten als een probleem. De meeste verkopers noemden
inkomstenvoorziening als voordeel van de verkoop van streetfoods.
Conclusies and Beleidsimplicaties Wij concluderen dat de verkoop van streetfoods in Nairobi een strategie is die gedreven wordt
door zowel vraag (naar goedkoop en gemakkelijk verkrijgbaar voedsel) als aanbod (door de
behoefte aan inkomsten). De stedelijke armen en/of stedelingen met een relatief laag inkomen
zijn de belangrijkste spelers in het fenomeen van de streetfoods. Het is een belangrijk kanaal
van voedselvoorziening voor de stedelijke armen en het voorziet in werkgelegenheid voor
arbeidskrachten die anders werkloos zouden zijn. Het fenomeen is niet geslachtsspecifiek, maar
de meeste verkopers zijn vrouwen. Het is een belangrijke bron van levensonderhoud, met name
voor de street /oods-verkopende huishoudens in de wijken met zeer lage inkomens. De
stedelingen met lage inkomens geven de voorkeur aan het verkopen van streetfoods, omdat het
relatief makkelijk toegankelijk en goedkoop is. Daarom is voor de meeste consumenten het
gemak van streetfoods niet noodzakelijk verbonden met de tijd die vrouwen winnen door het
kopen van deze producten, maar vooral met de betaalbaarheid van het voedsel. Streetfoods die
gemaakt en geserveerd worden door de verkopers hebben een inadequate voedingswaarde.
Samenvatting
Wanneer er echter voldoende inkomen is, zijn vooral vrouwelijke verkopers in staat producten
met een betere voedingswaarde te bereiden dan de mannelijke verkopers. Het onhygiënisch
omgaan met het voedsel komt waarschijnhjk door het gebrek aan mogelijkheden op de plaats
van verkoop en gebrek aan vraag van de consument naar veilig voedsel, maar niet door een
gehele afwezigheid van kennis bij de verkopers. Daarnaast werken verkopers onder onzekere
omstandigheden doordat hun handel niet erkend is. Autoriteiten moeten overtuigd worden van
het potentieel van streetfoods voor voedsel en voeding van de consumenten met lage inkomens
en de rol die streetfoods spelen als bron van levensonderhoud voor de verkopers. D e uitdaging
voor het voedselbeleid is om in een empirische, solide basis te voorzien voor de formulering
van beleid en programma's in de stedelijke gebieden, vooral omdat het gerelateerd is aan de
mogelijkheden van mensen met een laag inkomen om voedsel, gezondheidszorg en andere
basisbehoeften te verkrijgen.
Daarom is het belangrijk om open eetgelegenheden voor de stedelijke armen, zoals
plaatsen waar streetfoods worden verkocht, te erkennen en te legaliseren, zonder hierbij eisen te
stellen die niet gehaald kunnen worden door de armen. Door het gebrek aan enige controle en
bewaking hiervan worden de consumenten van street foods aan gezondheidsrisico's
blootgesteld. Het doel zou moeten zijn om te verzekeren dat het voedsel veilig, voedzaam en
betaalbaar is voor de consumenten en winstgevend voor de verkopers. Er zou moeite gedaan
moeten worden om educatieprogramma's over het belang van veilig en voedzaam voedsel voor
street food verkopers en consumenten op te zetten. Deze programma's moeten gericht zijn op
het gevoelig maken van de verkopers voor maatregelen die de voedselveiligheid vergroten.
Daarnaast zouden de consumenten meer verantwoordelijkheid moeten leren nemen voor de
veiligheid van het voedsel dat ze eten en ook naar veilig voedsel leren vragen. De mogelijke rol
van street foods in de voedselinname en de ruimte om de bijdrage van street foods aan de
voeding te vergroten zouden onderzocht moeten worden en ingebed in programma's.
Stadsplanning en infrastructuur moeten plaats bieden aan verkoopplaatsen voor street foods, vooral in de arme gebieden. Dergelijke locaties zouden voorzien moeten worden van sanitaire
voorzieningen zoals stromend water, toiletten en afvalbakken. Verkopers moeten begeleid
worden bij het investeren in een veilige voedselpraktijk met minimale kosten. Dit houdt ook de
ontwikkeling in van goedkope en toepasbare technologieën die betaalbaar zijn voor de
verkopers. Uiteindelijk moet de implementatie van ieder beleid of programma gevolgd worden
door controle en evaluatie van zowel de effecten op de prijzen van de street foods, als de
sociaal-economische en voedingsvoordelen voor de consumenten en de verkopers.
132
MUHTASARI
Muhtasari
Ukuwaji haraka wa miji umekuwa ukiambatana na uporomokaji wa uchumi na ukosefu wa
ajira katika nchi za Afrika zilizo chini ya jangwa la Sahara, Kenya ikiwa mojawapo. Taarifa
za hivi punde zinaonyesha kukua kwa umasikini na lishe duni, ukiambatana na ukuaji wa
idadi ya watu katika miji ya nchi zinazoendelea. Maskini wa mijini wameripotiwa kutumia
mbinu tofauti zisizo za kirasmi za kuwafanya kuishi, kustawi na hasa zaidi kupata chakula.
Mojawapo kati ya mbinu hizo ni uchuuzi wa chakula mitaani (maarufu kwa jina 'mama
ntiliye' katika nchi jirani ya Tanzania). Chakula cha mitaani kinasemekana kutumiwa na
watu wengi mijini na kwa bei nafuu, kiasi kwamba, kina manufaa kwa watu wasio na uwezo
mkubwa kifedha, waishio mijini. Hata hivyo, chakula cha mitaani kimesemekana kutokuwa
na usafi wa kutosha ama kutotunzwa vya kutosha. Wachuuzi wanafikiriwa kuwa hawa
tambui masuala ya usafi wa chakula. Maandishi pia yanaonyesha kuwa chakula cha mitaani
ni chanzo cha ajira kwa watu wengi mijini, ijapokuwa hakitambuliki rasmi katika nchi
nyingi, kama vile Kenya. Masomo mengi juu ya chakula cha mitaani yamekuwa yakizingatia
ubora wa baiologia ndogo, nguvu na protini ipatikanayo kwa kila mlo kwa watumiaji na pia
yameangalia mapato wanoyopata wachuuzi wa chakuli hiki. Hata hivyo, madokezo juu ya
viwango vya Ushe za aina mbalimbali katika chakula cha mitaani, ufahamu wa usafi na
tamaduni za waandaji na pia umuhimu wa chakula cha mitaani kama sehemu ya maisha ya
waandaji hawo bado ni chache. Ukichukulia ukweli kwamba chakula cha mitaani chaweza
kuwa njia muhimu ya Ushe kwa wana miji wenye kipato cha chini, na pia chanzo cha ajira
hasa wakati huu ambao kuna ukosefu mkubwa wa ajira rasmi, ni vema kuwa na mfazamo
maradufu wa faida yake na kuwa na ufumo unaotambulika rasmi. Somo hili ni moja kati ya
masomo mawili yanayorandana, ya shahada ya filosofia ya udaktari (Ph. D), juu ya chackuli
• cha mitaani katika mji wa Nairobi. Tunatafsiri chakula cha mitaani Kama "chakula kilicho
tayari kwa kuliwa, pamoja na vinywaji vilivyoboreshwa au la, ambavyo vinauzwa katika
sehemu ambayo imetengwa au kwa kutembezwa na wauzaji mitaani au sehemu za wazi,
tofauti na vile vya mabohari au mijengo ya muda iliyo na vibali maalum".
Dhumuni kuu la somo hili ilikuwa ni kupata undani hasa juu ya swala zima la Ushe,
usafi na tofauti mbalimbaü za kijairui na kiuchumi za chakula cha mitaani katika mji wa
Nairobi, kama tangulizi muhimu katika utoaji wa chakula safi kilicho na Ushe bora kwa
wateja, wakati huo huo kikichangia ustawi wa maisha na uchumi kwa wakaazi wa mji wa
Nairobi. Somo hiU UUfanyika hasa kwa mahojiano kummia fomu maalum zenye maswaU ya
kujieleza na yasiyo ya kujieleza na pia kwa njia ya kutazama. Kazi za inje katika utafiti
ziUfanywa kwa hatua mbaU mbali kati ya Oktoba 1997 na Aprili 1999. Kwanza, mtoa taarifa
za ki-uchunguzi alitumika kujenga hoja asiUa na kujua mwenendo wa uuzaji chakula cha
mitaani katika mji wa Nairobi. Hii Uifuatiwa na uchambuzi wa wilaya mbaU mbali za jiji
kutazama ni kwa kiasi gani shughuU za uuzaji na utumiaji chakula cha mitaani zina fanyika.
Sehemu tatu ziüchaguUwa katika somo hiU: Korogocho (sehemu ya mabanda yenye watu wa
133
— Muhtasari
134
kipato cha chini), Dandora (sehemu ya watu wenye kipato cha hali ya sehemu-ya-chini-ya-
kiwango-cha-kati) na Industrial Area, sehemu ya viwandani kuwakihsha sehemu zote
ambazo shughuli za chakula cha mitaani zimekuwa maarufu. Uchunguzi huo uUtaka hasa
kuzingatia swala la ubora wa lishe katika chakula cha mitaani, na pia ufahamu wa waandaaji
juu ya usafi wa chakula na jinsi wanavyo tumia fahamu hiyo kwa vitendo. Pia lengo jingine
ilikuwa ni kuchunguza umuhimu wa chakula cha mitaani kwa jamii na uchumi wa famiha za
waandaaji.
Mwelekeo na Kiwango (Sura ya 2) TuHpata kuwa uuzaji na utumiaji wa chakula cha mitaani umekuwa ukiongezeka kwa kasi
katika kipindi cha miongo milili iliyopita, kutokana na mahitaji ya chakula cha bei rahisi
katika jamii ya watu wenye kipato cha chini mijini na kwa mahitaji ya ajira. Ilikuwa ni jambo
linalo kuwa na kupanuka hasa kati ya familia maskini ziishizo mijini, lakini likienea hata kwa
jamii iliyoendelea kiuchumi kutokana na ongezeko la mahitaji ya fedha. Thuluthi moja ya
waandaaji wa chakula cha mitaani walikuwa wanaume.
Ubora wa Lishe na Utoshelevu (Sura ya 3 na 4). Wauzaji wengi (53%) walikuwa wakiuza chakula cha lishe aina moja, 44% wakiuza aina ya
nafaka. Kwa ujumla, 36% ya wauzaji, zaidi wanaume, walikuwa wakiuza chakula cha
kuongeza nguvu mwilini {Carbohydrates). Wauzaji wa chakula chenye mchanganyiko wa
aina nyingi ya lishe walikuwa wengi zaidi kakita maeneo ya kazi (53%) kuliko sehemu za
makaazi za mabanda (43%, /?<0.05), nao walikuwa wengi kuliko sehemu za makaazi za watu
wenye kipato cha sehemu-ya-chini-ya-kiwango-cha-kati (21%, /?<0.001). Chakula chenye
Hshe mchanganyiko kiliuzwa zaidi na wanawake. Chakula cha mitaani mara nyingi
küitumiwa kama kifungua kinywa cha asubuhi, mlo wa mchana, kitafunwa au makubwe.
Katika vifungua vinywa vya asubuhi, vitafunwa na makubwe, nguvu, protini, madini ya
chuma {iron) na vitamini A vilipatikana kwa kiasi cha 2 - 20% cha mahitaji ya mtu mzima.
Milo kamili kama mlo hahsi wa mchana, ambayo ilikuwa ni haba mtaani Dandora, ilikuwa na
vitamini A nyingi mtaani Industrial Area kuliko ile iliyo patikana mtaa wa mabanda wa
Korogocho (p=0.001). Tukifuata mpango wa ulaji wa chakula cha mitaani wa watumizi
wengi, mchango wa Ushe wa hivi vyakula hautoshi mahitaji ya nguvu mwilini (<70% ya
mahitaji ya mtu mzima). Utoshelevu wa protini ulikuwa ni wa kutosha endapo mlo wa
mchana ulikuwa ni wa cha nyama au borohoa/choroko (jamii ya kunde au maharagwe).
Madini ya chuma {iron) ilikuwa ni ya kutosho katika milo ya mcha ya aina yote. Hata hivyo,
upatikanaji wa kiasi cha vitamini A kaitika milo mtaani Korogocho kilikuwa hafifu. Katika
eneo la Industrial Area, vitamini A ilipatikana kwa kiwango cha kutosha kwenye milo
ambayo ilikuwa na mboga za majani . Hata hivyo swala la uwezo wa mwili kutumia lishe,
hasa madini ya chuma {iron), katika hivi vyakula {bioavailability) halikutafitiwa.

Muhtasari
135
Ufahamu juu ya usafi wa chakula na desturi ya wauzaji (Sura ya 5) Ufahamu wa usafi wa msingi wa uuzaji wa chakula haukutofautiana kulingana na kiwango
cha elimu ya darasani ya wauzaji. Hata hivyo, wauzaji ambao wahsha pata mafunzo juu ya
utunzaji chakula kwa usafi walikuwa na uwezo mara saba zaidi kuzidi alama ya wastani juu
ya usafi wa kimsingi wa utunzaji chakula kuliko wale ambao hawakuwa na mafunzo juu ya
usafi. Desturi za usafi wa chakula hazikuwa na uhusiano na ufahamu juu ya usafi wa
kimsingi wa chakula waliokuwa nao wauzaji ila zilitofautiana hasa kati ya maeneo tofauti ya
utafiti huu.
Chakula cha mitaani kama chanzo cha kuishi kwa viambo husika (Sura ya 6) Uuzaji wa chakula cha mitaani ulichangia 63% ya shughuli za uchumi katika wanaviambo
vinavyohusikana shughuli hii, na hii ikiwa zaidi (71%) mtaani Korogocho, ambako kipato ni
cha hah ya chini, kuliko Dandora (57%), kwenye kipato cha hah ya sehemu-ya-chini-ya-
kiwango-cha-kati, isipokuwa maeneo ya Industrial Area (63%), p<0.05. Asilimia 54 ya
wauzaji wa chakula cha mitaani walipata mapato zaidi ya kiwango cha mshahara rasmi wa
chini jijini Nairobi, wengi wakiwa katika mtaa wa Industrial Area (66%), kufuatiwa na
Korogocho (56%) na Dandora (42%), p<0.05. Wengine walipata kipato angalau mara mbili
ya mshahara rasmi wa chini, hasa wale wa Korogocho (43%) na Industrial Area (45%) zaidi
kuliko wa Dandora, 23% (p<0.05). Karibia nusu (46%) ya viambo vilivyo fanya shughuli hii
vilitegemea uuzaji wa chakula cha mitaani kama sehemu yao kumbwa ya mapato na vilikuwa
zaidi kwenye maeneo ya chini katika ustawi wa maisha na uchumi na kama wauzaji ndiyo
walikuwa viongozi wa hivyo viambo. Chakula cha mitaani kilichangia 16+12% ya mahitaji
ya kila siku (RDA) kwa viambo vilivyo husika na uuzaji wa makumbwe na vifungua vinywa,
na 32+16% kwa vile vilivyo husika na milo halisi kama mlo wa mchana.
Vizingiti ambavyo mara kwa mara wauzaji hawa waliripoti kupata katika sehemu zote
za utafiti vilikuwa ni ugumu wa kufanya kazi kwenye sehemu za wazi na unyanyasaji
waliopata toka kwa baraza la mji wa Nairobi hasa katika sehemu ya Industrial Area. Wauzaji
wengi wahnukulu upatikanaji wa kipato tokana na uuzaji wa chakula cha mitaani.
Hitimisho na mchango katika sera Mwishoni tumehitimisha kwa kusema kuwa utumiaji wa chakula cha mitaani katika mji wa
Nairobi ni mbinu inayotokana na mahitaji ya chakula (cha bei ya rahisi na cha haraka) na
kande (kwa ajili ya mapato). Jamii maskini mijini ndio haswa na zoezi nzima la chakula cha
mitaani. Kwa kweli hii ni njia muhimu kwa jamii hizi ya kujipatia lishe na pia ni njia
mojawapo ya jamii kujipatia ajira binafsi. Hii taashira si ya watu wa aina moja ila wanawake
wameonekana kuchukuwa nafasi kubwa. Chakula cha mitaani ndio njia muhimu ya kipato
maeneo yenye kipato haba kwani rasilimali inayotakikana kuanzisha hii shughuli ni ya chini.
Wanunuzi wengi walivutiwa na bei nafuu ya hiki chakula. Kwa jinsi chakula cha mitaani
kinachotolewa, hakitosheleshi mahitaji ya lishe bora kwa wateja. Isipokuwa, endapo wauzaji
Muhtasari
136
hawa (hasa wanawake) wanapokuwa na kipato kizuri huwa wakitoa chakula bora
kinachoweza kukidhi mahitaji ya mwili. Ukosefu wa utunzaji usafi wa chakula pengine
hutokana na ukosefu wa mazingira safi na kwamba wateja wenyewe hawajali na sio kwamba
ni utovu kabisa wa elemu ya usafi kwa wauzaji. Zaidi ya hayo, wauzaji hufanya shughuli zao
katika hah ya mhangaiko kutokana na kutotambuUwa kirasmi. Wanamamlaka wa miji
wanapaswa washawishiwe juu ya umuhimu wa chakula cha mitaani kwa ajili ya wateja kama
lishe kwa wakaazi wa malipo duni na kama njia ya maishilio kwa wenye kuuza. Changamoto
kwa sera za chakula ni kutoa muongozo unaoeleweka kuhusiana na chakula katika sehemu za
mijini hasa kuzingatia uwezo wa watu wenye mapato duni kujipatia mlo wao, afya njema na
mahitaji mengine ya kimsingi.
Basi kuna haja kutambua na kuhalalisha maeneo ya milo ya watu duni mijini, kama
vile sehemu za uchuuzi wa chakula cha mitaani, bila kuweka masharti ambayo maskini
hawawezi kutimiza. Kutokuweko kwa usimamizi na mwongozo wa usafi wa chakula cha
mitaani ni hatari kwa afya za wateja wa hivi vyakula. Lengo linafaa Uwe ni kuhakikisha
chakula kipo katika hali ya usalama, kina lishe bora kwa watumiaji, ni cha bei ambayo
maskini wanunuzi waweza kulipa na pia kina faida kwa wauzaji. Wauzaji na wateja wao
wanafaa kuelimishwa juu ya umuhimu wa lishe bora na salama. Elimu hii inafaa ilenge
kuwaweka wauzaji wepesi wa kuchomwa moyo juu ya hatua za usalama wa chakula na
wateja wawajibike juu ya usalama wa chakula wanachokula. Umuhimu hasa wa chakula cha
mitaani katika lishe na haja ya kuongezeka kwa mahitaji ya lishe unapaswa kwa upana na
kuhusishwa kwenye mipango na sera. Utengenezaji wa ramani za miji na miundo-mbinu
inapaswa kuzindatia maeneo kwa chakula cha mitaani, hasa katika sehemu za mapato duni.
Maeneo hayo yanapaswa kuwekewa vifaa maalum vya usafi kama vile maji safi, vyoo na
mahali pa Imhifadhi takataka. Wauzaji wanastahili kupewa mwongozo juu ya kuweka desturi
za chakula bora kwa gharama ndongo. Hii itahitaji teknolojia rahisi na ya kufaa, ambayo ni
nafuu kwa wauzaji. Hatimaye, kutekeleza kwa sera na mipango yoyote kunahitaji kujihusisha
na ufahamu jinsi hizo sera zitakapoathiri ama kugeuza bei ya chakula, hali ya maisha na
uchumi wa jamii na pia hshe kwa wanunuzi na wauzaji wenyewe.
Acknowledgements
ACKNOWLEDGEMENTS
For the past 5 years within which this thesis was brought into being, I had to deal with the challenge of bearing the combined responsibilities of a pastors wife, a mother to toddlers and an infant as well as the responsibilities of a Ph.D. fellow. First and foremost, I am very grateful to God without whose continued grace, assurance, protection and provision I would not have completed this work. He also availed me a number of people who contributed to the success of this work in various ways.
I would not have been able to complete this work without the support of my husband Dr. K.M. Mbatia. He played the roles of both father and mother of our children at their tender age for the long periods I was away from home. I am also grateful for his constant encouragement and his confidence and faith that I was able to complete this work.
I am deeply indebted to my project partner, Hilda van't Riet, for her wide and varied ways of contribution to the success of this work. I have a long story to tell about the assistance I got from her but I will only shorten it. The first time I arrived at Wageningen I was not able to ride a bike and Hilda usually gave me a lift on her bike to and from work until I was able to cycle by myself. When I had newly learnt how to ride a bicycle, many times I was unable to make it up the Wageningen hill and Hilda would push me up to boost my strength. That made my life a bit easy during that cold winter of January 1997. Hilda also contributed a lot, both in the intellectual and logistic issues during my whole Ph.D period of 5 years and I am unable to put all she did in this document. I would like to greatly thank her for evei^thing.
Special thanks to my promoter Prof. W. A. van Staveren whose intellectual advice and guidance contributed greatly to the success of this thesis. I am sincerely indebted to my other promoter Dr. Adel P. den Hartog for his commitment to assist me as his student through out the entire 5 years. Adel always made time to attend to my problems. I also acknowledge the friendship I received from his wife Frida and the many times she went to a lot of trouble to accommodate me for dinner at their home.
My deepest gratitude goes to Dr. Dick W.J. Foeken for his tireless help and guidance. Many thanks too to his wife Marijeke for the many times she had to entertain me in their home. Special thanks are due to Dr. Robert K.M Mwadime who encouraged me to take up this study. I am very grateful for his invaluable and rational input during the preparation of the proposal, questionnaires and the thesis write up. I owe my gratitude to his wife Sonia for her friendship and encouragement to my family and me during the entire period of my studies.
Special thanks to The Netherlands Foundation for the Advancement of Tropical Research (WOTRO) and The Division of Human Nutrition and Epidemiology, Wageningen University, for funding the research as well as the Judith Zwartz Foundation for their financial support in the printing of the thesis.
I am deeply indebted to the street food vendors and consumers without whose cooperation the research would have been impossible. They willingly gave a lot of their time
137
Acknowledgements
to this work and made it possible to succeed. I would like to thank my field Assistants Henry Manene, Silivia Wanyakha, Christopher Kimani, Mufhoni Imungi, John Sime, Irene Wanjiru, Grace Mufhoni and Veronica Wanjiru for their tireless effort and enthusiasm during data collection. Sometimes they had to work under very difficult circumstances. I am indebted to Henry Manene for assisting in the computer data entry even very late in the night. A lot of thanks are due to Emily Mwadime for overseeing part of the field work at the crucial time that I really needed extra supervision in the field.
Much appreciation is due to Mr. Jonah Kitheka and the entire staff of Provide International for introducing me to the Korogocho community and allowing my field assistants and I to use their premises. I would like to extend similar appreciation to the Pastor and the care-taker (Irene) of Dandora Gospel Terbacle Church for introducing me to the Dandora community and providing us with office space.
At the Division of Human Nutrition, Wageningen University, many people contributed to my success in varied ways. M y appreciation goes to the Head of the Division, Prof. Frans Kok and the entire staff for their support, kindness, guidance and friendship. Special thanks to Grietje van der Zee for her outstanding kindness and for all arrangements she made such that I was always comfortable whenever I came to Wageningen. I would like to thank Jo Hautvast for his coaching in article writing; Jan Burema for his help in statistics; Kees de Graaf for his advice; Lidwien van der Heijden for her assistance in Komeet and many other matters; Eric van Munster and Riekie Janssen for their help in finances; Ben Scbolte and Dirk Joghems for their tireless help with computer matters; Fré Pepping for his help in VLAG issues as well as Marie Jansen and Gea Brussen for their assistance in office matters. I also appreciate the friendship, assistance and kindness of my fellow Ph.Ds and AIOs at the Division. In particular, I thank Hans Verhoef for willing to take time to answer some of my statistical questions; Siti Mustimatun for her useful criticism and views; Mark and Hilda for translating my Dutch mail; Marjanka for translating my thesis summary into a samenvatting; Young-Hee and Edine for being my paranimphs; Judith for organising coffee and tea; Elvina, Romain, André, Monika and all the John Snowers and Biotechnioners for being friends.
I would like to thank Prof. Jasper K. Imungi, Dean of Agriculture, University of Nairobi, for his contribution towards the collaboration between the institutions involved in this work. Many thanks to the head, Dr Wambui Kogi-Makau, and the entire staff of the Applied Nutrition Programme (ANP), University of Nairobi, for their support. I am indebted to Dr Abiud M. Omwega, whose support boosted my morale to undertake this work. Thanks to Prof. N. Muroki for his help on my questionnaires. I cannot forget Naomi, Gichia, Lydia, Wamuyu, Ruto, Mugo and Sophie for all the help they gave me at the ANP.
Sincere appreciation is due to Anthony Zozimus-sangenda and Benard Nyakundi Keraita for translating my thesis summary into a muhtasari. I also thank Ms. Nel de Vink for making the maps in my thesis and Danny Hooftman for his assistance in organising them.
I would like to extend my sincere thanks to the International Christian Fellowship (ICF) and Salem Church, Wageningen, for spiritual nourishment. In particular, I appreciate
138
Acknowledgements
Dortje, Agnes, Maria, Chakandas, Tabi, John, Wole, Karen, Benard and all the people who fellowshipped with me.
Thanks to Thika Deliverance Church members for the support they gave to my family especially when I was at Wageningen. I also thank my friends, Munas, Ngethes, Mwadimes, Waiganjos, Kimeres, Kurias, Ng'ang'as, Muriukis and those that I cannot remember for comforting m y family particularly during my absence. I am indebted to Judy who assisted in taking care of my children most of the time I was in Wageningen.
My deepest thanks go to my late father, Ben, and my mother, Naomi, who invested a lot in my primary, secondary and high school education without which I would not have been able to attain my present level of education. I also want to thank my sister Beatrice, my brother-in-law David, my sons Ben, Lemy and Robby as well as my entire family for their encouragement.
I find it impossible to adequately acknowledge everybody who has had a hand in this work within the space provided. I may have missed out many but I consider this achievement to be theirs too.
139
Acknowledgements
140
ABOUT THE AUTHOR
Alice Mboganie MwangL was born on 01 April 1963 in Kenya. Most of her education was
undertaken in Kenya. She completed her Ordinary Level (O-level) secondary school in 1980
and Advanced Level (A-level) secondary school in 1982. In 1983, she was employed as an
untrained teacher in an O-level secondary school for one year. She attended compulsory
National Youth Service Training for three months before joining the University of Nairobi in
1984. In 1987, she obtained a Bachelor of Science degree in Food Science and Technology
from the University of Nairobi. During her B.Sc. studies, she did industrial attachment at
Beecham (Kenya) Ltd within the processing and quality control sections for three months.
After graduation, she immediately joined Del Monte Fruit Processors (Kenya) as a Quality
Control Head of Department for two years. In 1993, she received her Masters Degree in
Human Nutrition from the Applied Human Nutrition Programme (ANP) of the University of
Nairobi. She got employed as a researcher at University of Nairobi and worked on a joint
project between the ANP and the Food and Nutrition Studies Programme (FNSP) of the
African Studies Centre, Leiden, for three years. During this time, she was also involved in
teaching at the university. She undertook short consultancy jobs with AMREF and research
projects within the ANP. Toward the end of 1996, she was the Assistant Co-ordinator and
Raporteur for the "Workshop on Training and Research to Improve Nutrition in the Eastern
and Southern African Region (ESAR)" organised by UNICEF and ANP. The workshop
resulted in the creation of a new Network on Nutrition Training and Research for the purpose
of improving nutrition in the ESAR. She joined Wageningen University in January 1997 and
will be returning to Kenya after completing her Ph.D.
PUBLICATIONS Mwangi AM (1993). Fertility, early child mortality and rate of reporting of child births and
deaths in Sigor division, Kericho. M. Sc. Thesis. University of Nairobi.
Kogi-Makau W, Mwita JW and Mwangi AM (1993). Nutritional status of Primary School
Children in Ndeiya, Kiambu. Unit of Applied Nutrition, University of Nairobi.
Mwangi AM (1995). The role of urban agriculture in food security for low-income
households in Nairobi. FNSP Report No. 55/1995. Ministry of Planning and National
Development, Nairobi, and African Studies Centre, Leiden.
Mwangi AM and Foeken DWJ (1996). Urban agriculture, food security and nutrition in low
income areas of the city of Nairobi, Kenya. African Urban Quarterly Journal.
141
Special issue. Urban agriculture in Africa, 11(2,3): 170-180
Foeken DWJ and Mwangi AM (1998). Does access to land have a positive impact on the
food situation of the urban poor? A case study in Nairobi. Eastern African Social
Science Research Review (EASSRR), XIV( l ) : 19-32.
Foeken DWJ and Mwangi AM (2000). Increasing food security through urban farming in
Nairobi. In Bakker N, Dubbeling M, Gtindel S, Sabel-Koschella U and de Zeeuw H
(eds.). Growing Cities, Growing Food: Urban Agriculture on the Policy Agenda.
Food and Agriculture Development Centre, Feldafing, Germany, p.303-328.
van't Riet H, den Hartog AP, Mwangi AM , Mwadime RKM, Foeken DWJ and van
Staveren W A (2001). The role of street foods in the dietary pattern of two low-income
groups in Nairobi. European Journal of Clinical Nutrition, 55: 562-570.
Mwangi AM, den Hartog AP, Foeken DWJ, van't Riet H, Mwadime RKM and van Staveren
W A (2001). The ecology of street foods in Nairobi. Ecology of Food and Nutrition, 40: 497-523.
Mwangi AM, Hartog AP, Mwadime RKM, van Staveren W A and Foeken DWJ (In press).
D o street food vendors sell a sufficient variety of foods for a healthy diet? The case of
Nairobi. Food and Nutrition Bulletin, 23(1).
142
The research was financially supported by the Netherlands Foundation for the Advancement of Tropical Research (WOTRO) and the Division of Human Nutrition and Epidemiology, Wageningen University.
Financial support for the printing of this thesis was obtained from the Dr. Judith Zwartz Foundation, Wageningen, The Netherlands and the Division of Human Nutrition and Epidemiology, Wageningen University.
The research described in this thesis was conducted within a collaboration project of the
Division of Human Nutrition and Epidemiology, Wageningen University (The Netherlands),
Applied Nutrition Programme, University of Nairobi (Kenya) and African Studies Centre,
Leiden, The Netherlands.
Cover: Alice Mboganie Mwangi
Printing: Grafisch bedrijf Ponsen and Looijen BV, Wageningen, The Netherlands.
© 2002 Alice Mboganie Mwangi