Socio-Economic report of Nagaon Forest Division - Assam ...
81
Assam Jurisdictional REDD+ Project: Stakeholder map Socio-Economic report of Nagaon Forest Division Lowering Emissions and Enhancing Forests (LEEF) in Nagaon, Assam
-
Upload
khangminh22 -
Category
Documents
-
view
4 -
download
0
Transcript of Socio-Economic report of Nagaon Forest Division - Assam ...
Assam Jurisdictional REDD+ Project: Stakeholder map
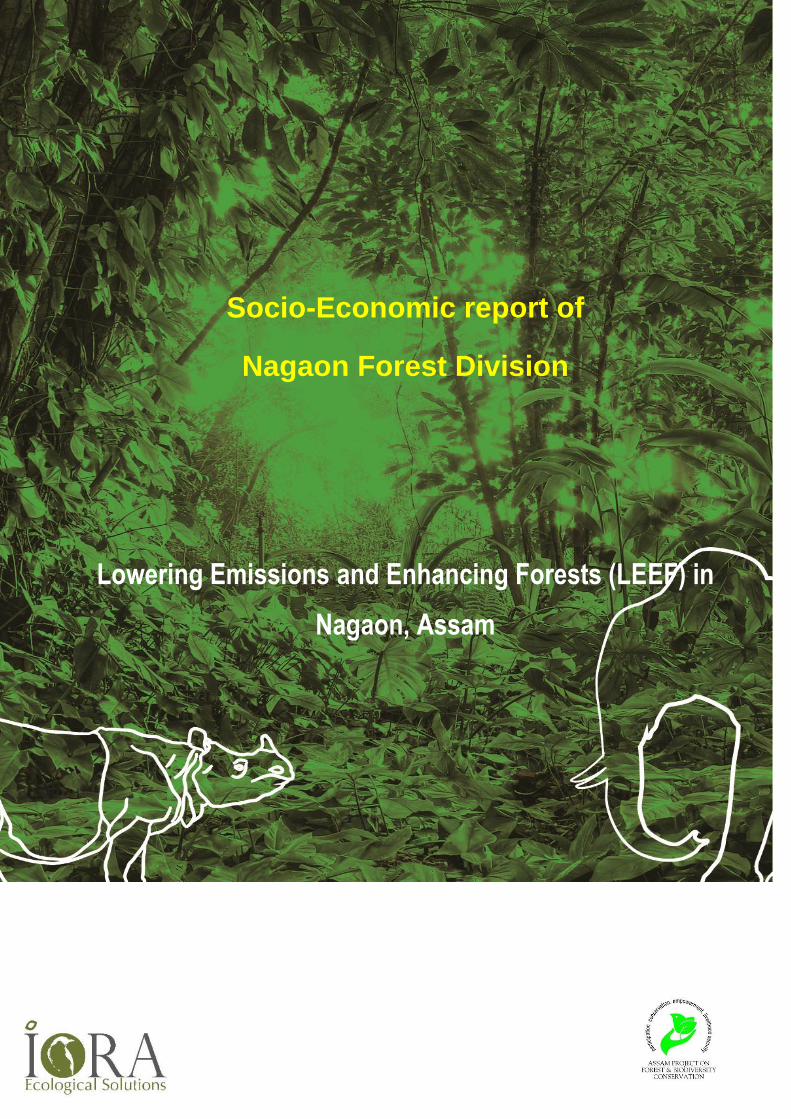
Socio-Economic report of
Nagaon Forest Division
Lowering Emissions and Enhancing Forests (LEEF) in
Nagaon, Assam
Socio-Economic report of Nagaon Forest Division
Lowering Emissions and
Enhancing Forests (LEEF) in
Nagaon, Assam
Socio-Economic report of Nagaon Forest Division
Assam Project on Forest and Biodiversity Conservation
&
IORA Ecological Solutions
pg. 3
Abbreviations
AEDA Assam Energy Development Energy
AFD French Development Agency
ANR Assisted Natural Regeneration
APFBC Assam Project on Forest and Biodiversity Conservation
BPL Below Poverty Line
CPT Cattle Proof Trenches
DoEF Department of Environment and Forests
EDC Eco Development Committee
EE Executive Entity
EPT Elephant Proof Trenches
ER Emission Reductions
FAO Food and Agriculture Organization
FGD Focus Grouped Discussions
GDP Gross Development Product
GHG Greenhouse Gas
ICS Improved Cook Stove
IPCC Inter-governmental Panel on Climate Change
JFMC Joint Forest Management Committee
LEEF Lowering Emissions, Enhancing Forests
MGNREGA Mahatma Gandhi National Rural Employment Guarantee Act
NDC Nationally Determined Contributions
NTFP Non Timber Forest Produce
PDD Project Design Document
QA/QC Quality Assurance/Quality Control
REDD Reducing Emissions from Deforestation and Forest Degradation
SAPCC State Action Plan for Climate Change
SDG Sustainable Development Goals
SHG Self Help Group
UNFCCC United Nations Framework Convention on Climate Change
VFC Village Forest Committee
Socio-Economic report of Nagaon Forest Division
Contents
ABBREVIATIONS ............................................................................................................................................................. 3
CONTENTS ....................................................................................................................................................................... 4
LIST OF FIGURES ............................................................................................................................................................ 4
LIST OF TABLES .............................................................................................................................................................. 5
EXECUTIVE SUMMARY ................................................................................................................................................... 6
1 INTRODUCTION ........................................................................................................................................................ 7
2 OBJECTIVE AND SCOPE ......................................................................................................................................... 9
3 OVERVIEW OF NAGAON DISTRICT ..................................................................................................................... 10
3.1 ADMINISTRATIVE ARRANGEMENT ............................................................................................................................... 10
3.2 DEMOGRAPHIC DETAILS ............................................................................................................................................ 10
3.3 PHYSICAL FEATURES OF NAGAON .............................................................................................................................. 11
3.4 LIVELIHOOD .............................................................................................................................................................. 14
3.5 OTHER GENERAL INFORMATION ................................................................................................................................. 15
4 METHODOLOGY AND APPROACH ...................................................................................................................... 15
4.1 DEFINING THE SCOPE ................................................................................................................................................ 15
4.2 LIMITATION OF THE SURVEY ....................................................................................................................................... 15
4.3 APPROACH TO THE SURVEY AND ANALYSIS ................................................................................................................. 15
4.4 TOOLS USED............................................................................................................................................................. 16
4.5 SAMPLING DESIGN .................................................................................................................................................... 18
4.6 TARGET POPULATION ............................................................................................................................................... 18
4.7 SAMPLING METHOD .................................................................................................................................................. 18
5 RESULTS AND DISCUSSIONS .............................................................................................................................. 22
5.1 BACK GROUND OF STUDY AREA ................................................................................................................................. 22
5.2 SOCIO ECONOMIC PROFILE ....................................................................................................................................... 23
5.3 FOREST DEPENDENCY .............................................................................................................................................. 27
5.4 DRIVERS OF DEFORESTATION AND THE FOREST DEGRADATION .................................................................................... 41
5.5 INTERVENTION DETAILS ............................................................................................................................................. 43
5.6 INTERVENTION PLAN ................................................................................................................................................. 44
5.7 INTERVENTION MATRIX ............................................................................................................................................. 45
6 ANNEXURE I: QUESTIONNAIRES ......................................................................................................................... 64
7 ANNEXURE II: ATTENDANCE SHEETS ................................................................................................................ 77
8 ANNEXURE III: PHOTOGRAPHS FROM THE SURVEY ....................................................................................... 78
List of Figures
Figure 1: Overview of REDD+ (Courtesy WWF) ............................................................................................................... 7 Figure 2: District map of Nagaon ..................................................................................................................................... 12 Figure 3: Forest cover map of Assam and circled portion represents Nagaon ............................................................... 13 Figure 4: Forest type of nagaon, 2015 ............................................................................................................................ 13
pg. 5
Figure 5: Household Survey ............................................................................................................................................ 17 Figure 6: Focus Group Discussions ................................................................................................................................ 18 Figure 7: Survey team orientation and field testing the questionnaires........................................................................... 21 Figure 8: Population in % age of Sampled Household .................................................................................................... 23 Figure 9: Census Classification ....................................................................................................................................... 24 Figure 10: Literacy status ................................................................................................................................................ 24 Figure 11: House type ..................................................................................................................................................... 25 Figure 12: Normal house structure in Nagaon ................................................................................................................. 25 Figure 13: Land holding pattern ....................................................................................................................................... 26 Figure 14: Primary and secondary occupation ................................................................................................................ 26 Figure 15: Source of energy for cooking ......................................................................................................................... 28 Figure 16: Fuelwood collection in the study area ............................................................................................................ 29 Figure 17: Source of fuelwood ......................................................................................................................................... 30 Figure 18: Range wise source of fuelwood ..................................................................................................................... 30 Figure 19: Frequency of Fuelwood Collection ................................................................................................................. 31 Figure 20: Cooking devices used in the study area......................................................................................................... 32 Figure 21: Traditional stoves used in study area ............................................................................................................. 33 Figure 22: Cattle feeding ................................................................................................................................................. 33 Figure 23: Fodder collection ............................................................................................................................................ 34 Figure 24: Timber collection from forests ........................................................................................................................ 35 Figure 25: Small timber used for fencing and agriculture activities ................................................................................. 35 Figure 26: NTFP Dekia (fern) and tuber .......................................................................................................................... 39 Figure 27: Arecanut drying using fuelwood ..................................................................................................................... 39 Figure 28: Raw Arecanut boiling...................................................................................................................................... 40 Figure 29: Fuelwood stored in Arecanut processing industries ....................................................................................... 40 Figure 30: FGD responses on drivers ............................................................................................................................. 41 Figure 31: Household responses on drivers .................................................................................................................... 41 Figure 32: Range wise responses on drivers .................................................................................................................. 42 Figure 33: Intervention activities to reduce fuelwood consumption ................................................................................. 44 Figure 34: Mango Plantation ............................................................................................................................................ 57 Figure 35: Jackfruit Plantation ......................................................................................................................................... 58
List of Tables
Table 1: Population data (Census 2011) of Nagaon district5........................................................................................... 11 Table 2: List of villages and number of households visited for survey ............................................................................ 20 Table 3: Population structure ........................................................................................................................................... 23 Table 4: Livestock details ................................................................................................................................................ 27 Table 5: Mode of fuelwood Transportation ...................................................................................................................... 30 Table 6: Average distance travelled to collect fuelwood ................................................................................................. 31 Table 7: Use of timber and source................................................................................................................................... 35 Table 8: NTFP collected in the sudy area ....................................................................................................................... 38 Table 9 : Estimation of fuelwood required for one arecanut industry .............................................................................. 40 Table 11: Intervention activities to reduce fuelwood consumption .................................................................................. 43 Table 12: Intervention activities to reduce fodder collection ............................................................................................ 44 Table 13: Intervention activities timber consumption....................................................................................................... 44 Table 10: List of interventions planned for Nagaon under the LEEF project ................................................................... 45
Socio-Economic report of Nagaon Forest Division
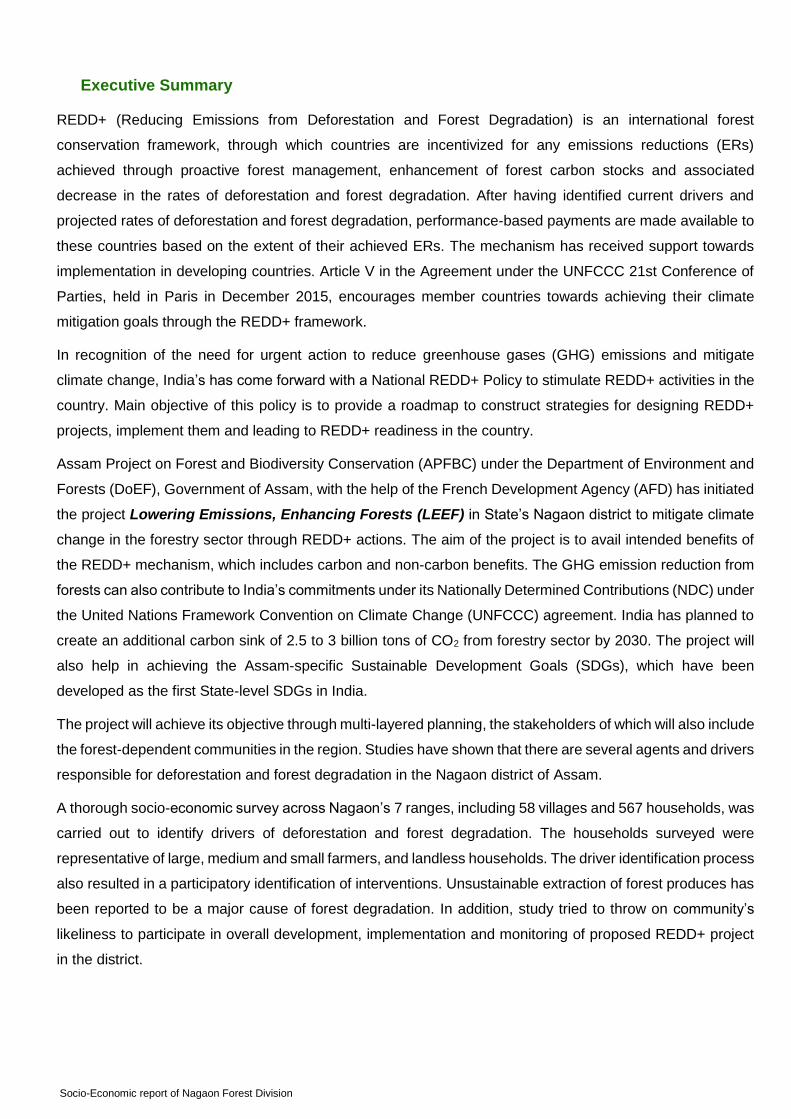
Executive Summary
REDD+ (Reducing Emissions from Deforestation and Forest Degradation) is an international forest
conservation framework, through which countries are incentivized for any emissions reductions (ERs)
achieved through proactive forest management, enhancement of forest carbon stocks and associated
decrease in the rates of deforestation and forest degradation. After having identified current drivers and
projected rates of deforestation and forest degradation, performance-based payments are made available to
these countries based on the extent of their achieved ERs. The mechanism has received support towards
implementation in developing countries. Article V in the Agreement under the UNFCCC 21st Conference of
Parties, held in Paris in December 2015, encourages member countries towards achieving their climate
mitigation goals through the REDD+ framework.
In recognition of the need for urgent action to reduce greenhouse gases (GHG) emissions and mitigate
climate change, India’s has come forward with a National REDD+ Policy to stimulate REDD+ activities in the
country. Main objective of this policy is to provide a roadmap to construct strategies for designing REDD+
projects, implement them and leading to REDD+ readiness in the country.
Assam Project on Forest and Biodiversity Conservation (APFBC) under the Department of Environment and
Forests (DoEF), Government of Assam, with the help of the French Development Agency (AFD) has initiated
the project Lowering Emissions, Enhancing Forests (LEEF) in State’s Nagaon district to mitigate climate
change in the forestry sector through REDD+ actions. The aim of the project is to avail intended benefits of
the REDD+ mechanism, which includes carbon and non-carbon benefits. The GHG emission reduction from
forests can also contribute to India’s commitments under its Nationally Determined Contributions (NDC) under
the United Nations Framework Convention on Climate Change (UNFCCC) agreement. India has planned to
create an additional carbon sink of 2.5 to 3 billion tons of CO2 from forestry sector by 2030. The project will
also help in achieving the Assam-specific Sustainable Development Goals (SDGs), which have been
developed as the first State-level SDGs in India.
The project will achieve its objective through multi-layered planning, the stakeholders of which will also include
the forest-dependent communities in the region. Studies have shown that there are several agents and drivers
responsible for deforestation and forest degradation in the Nagaon district of Assam.
A thorough socio-economic survey across Nagaon’s 7 ranges, including 58 villages and 567 households, was
carried out to identify drivers of deforestation and forest degradation. The households surveyed were
representative of large, medium and small farmers, and landless households. The driver identification process
also resulted in a participatory identification of interventions. Unsustainable extraction of forest produces has
been reported to be a major cause of forest degradation. In addition, study tried to throw on community’s
likeliness to participate in overall development, implementation and monitoring of proposed REDD+ project
in the district.
pg. 7
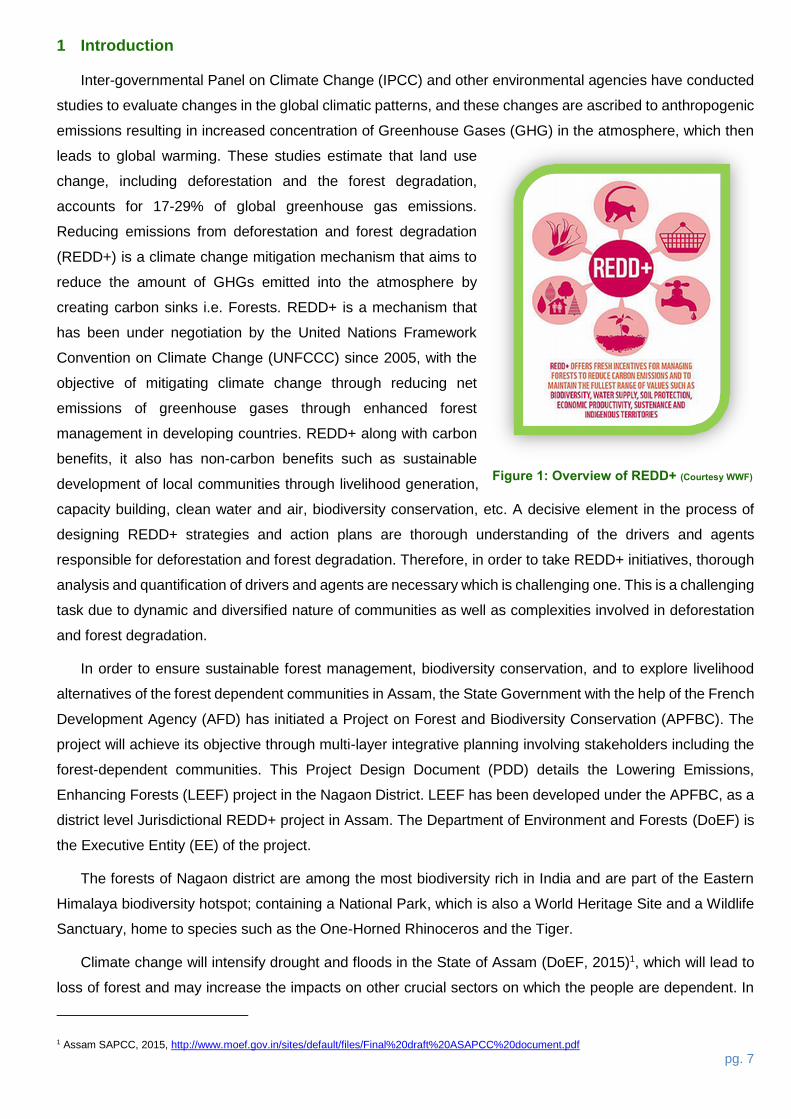
1 Introduction
Inter-governmental Panel on Climate Change (IPCC) and other environmental agencies have conducted
studies to evaluate changes in the global climatic patterns, and these changes are ascribed to anthropogenic
emissions resulting in increased concentration of Greenhouse Gases (GHG) in the atmosphere, which then
leads to global warming. These studies estimate that land use
change, including deforestation and the forest degradation,
accounts for 17-29% of global greenhouse gas emissions.
Reducing emissions from deforestation and forest degradation
(REDD+) is a climate change mitigation mechanism that aims to
reduce the amount of GHGs emitted into the atmosphere by
creating carbon sinks i.e. Forests. REDD+ is a mechanism that
has been under negotiation by the United Nations Framework
Convention on Climate Change (UNFCCC) since 2005, with the
objective of mitigating climate change through reducing net
emissions of greenhouse gases through enhanced forest
management in developing countries. REDD+ along with carbon
benefits, it also has non-carbon benefits such as sustainable
development of local communities through livelihood generation,
capacity building, clean water and air, biodiversity conservation, etc. A decisive element in the process of
designing REDD+ strategies and action plans are thorough understanding of the drivers and agents
responsible for deforestation and forest degradation. Therefore, in order to take REDD+ initiatives, thorough
analysis and quantification of drivers and agents are necessary which is challenging one. This is a challenging
task due to dynamic and diversified nature of communities as well as complexities involved in deforestation
and forest degradation.
In order to ensure sustainable forest management, biodiversity conservation, and to explore livelihood
alternatives of the forest dependent communities in Assam, the State Government with the help of the French
Development Agency (AFD) has initiated a Project on Forest and Biodiversity Conservation (APFBC). The
project will achieve its objective through multi-layer integrative planning involving stakeholders including the
forest-dependent communities. This Project Design Document (PDD) details the Lowering Emissions,
Enhancing Forests (LEEF) project in the Nagaon District. LEEF has been developed under the APFBC, as a
district level Jurisdictional REDD+ project in Assam. The Department of Environment and Forests (DoEF) is
the Executive Entity (EE) of the project.
The forests of Nagaon district are among the most biodiversity rich in India and are part of the Eastern
Himalaya biodiversity hotspot; containing a National Park, which is also a World Heritage Site and a Wildlife
Sanctuary, home to species such as the One-Horned Rhinoceros and the Tiger.
Climate change will intensify drought and floods in the State of Assam (DoEF, 2015)1, which will lead to
loss of forest and may increase the impacts on other crucial sectors on which the people are dependent. In
1 Assam SAPCC, 2015, http://www.moef.gov.in/sites/default/files/Final%20draft%20ASAPCC%20document.pdf
Figure 1: Overview of REDD+ (Courtesy WWF)
Socio-Economic report of Nagaon Forest Division
Nagaon, Very Dense Forest (VDF) account for only 5% while Open Forest (OF) is 51% of the total forest
area. The cause for this is mainly degradation in forest quality and quantity, encroachments, fuel wood
extraction, etc. The Assam State Action Plan for Climate Change (SAPCC) states, “If mechanisms could be
created to provide payments for mitigation benefits, these could add 5% to 10% to forestry GDP, based on
the relative value of net carbon sequestration, compared with commercial benefits from forestry”.
Socioeconomic survey is one of the widely used tools used to identify and quantify the drivers and agents,
which are responsible for deforestation and forest degradation. This tool provides an understanding of local
resource management systems, resource utilisation and the relative importance of resources for
communities, households and villages. They can also be used to call forth insights on interaction with
government decision-making systems, community perceptions of trends and priority issues, and community-
based institutions and their role in the sustainable use and conservation of natural resources. Use of such
tools is an important first step in engaging local communities.
The present Socioeconomic report gives an insight of current socioeconomic scenario in the region
(Nagaon district) and as well as a broad overview of main drivers of deforestation and the forest degradation.
The results presented here are based on desk literature studies and reviews, village level PRAs, focal group
discussions and household level socio-economic surveys. Also this report outlines the interventions proposed
by the communities during survey to address the drivers of deforestation and forest degradation.
pg. 9
2 Objective and Scope
The primary objective of the project is to develop a pilot jurisdictional REDD+ project in Nagaon district of
Assam, India.
The main objective of this study report is to have a detailed understanding of the drivers and agents
responsible for deforestation and forest degradation (D&D) in Nagaon district. The study includes generation
of baseline data on prevailing socioeconomic and livelihood conditions of the communities living in and around
the forests of Nagaon district.
Specifically, the objective of the study is to:
Identify the agents and drivers responsible for deforestation and forest degradation
Asses the direct and indirect causes behind deforestation and degradation
Map all the relevant stakeholders in the district and record the opinion on willingness to participate
in REDD+ project.
Develop a strategy and action plan for REDD+ implementation through participatory approach
The project will achieve its objective through multi-layered planning, the stakeholders of which will also include
the forest-dependent communities in the region.
Socio-Economic report of Nagaon Forest Division
3 Overview of Nagaon district
Nagaon (Now gong that is spelled by British) spreads across almost four thousand square kilometres of
fertile alluvial soils Bharamhaputra river plains and densely forested hills2. People of Nagaon have played an
important role in Quit India Movement3 and Mahatma Gandhi visited this place in the year 1921. Nagaon
history dates back to 3rd century when Bahauma Naraka Family believed to have ruled Assam about 355 AD.
Shankadeva a famous Vaishnavite reformer was born in the Bordowa Satara of the Nagaon district who
brought about a Renaissance in Assamese society with his preaching and through a famous play Ankia Nat.
Nagaon name has special historical importance in the history of Assam. During 16th century, Kacharis
attacked the Ahom kingdom which forced to people of Kaliabor and Raha to flee from the place. After the
expulsion of Kacharis in the region, an officer Momai Tamuli Barbarhua of Ahom kingdom has rebuilt this
area with new villages. The word ‘Na’ mean new and ‘Gaon’ means village. So this how this district has the
name “Nagaon”.
3.1 Administrative arrangement
The Nagaon4 district was carved out of Morigaon district and formed as a new district in the year 1989.
At present Nagaon has geographical area of 3,993 sq.km consisting of 10 revenue circles5. The total number
of revenue villages in the district is about 1,396. There are 18 development blocks in the district with 3
administrative sub-divisions, namely Nagaon, Kaliabor and Hojai. Recently Nagaon has been further divided
in August 2015 and formed new district Hojai out of it comprising of three thesils of Nagaon district named
Hojai, Doboka and Lanka.
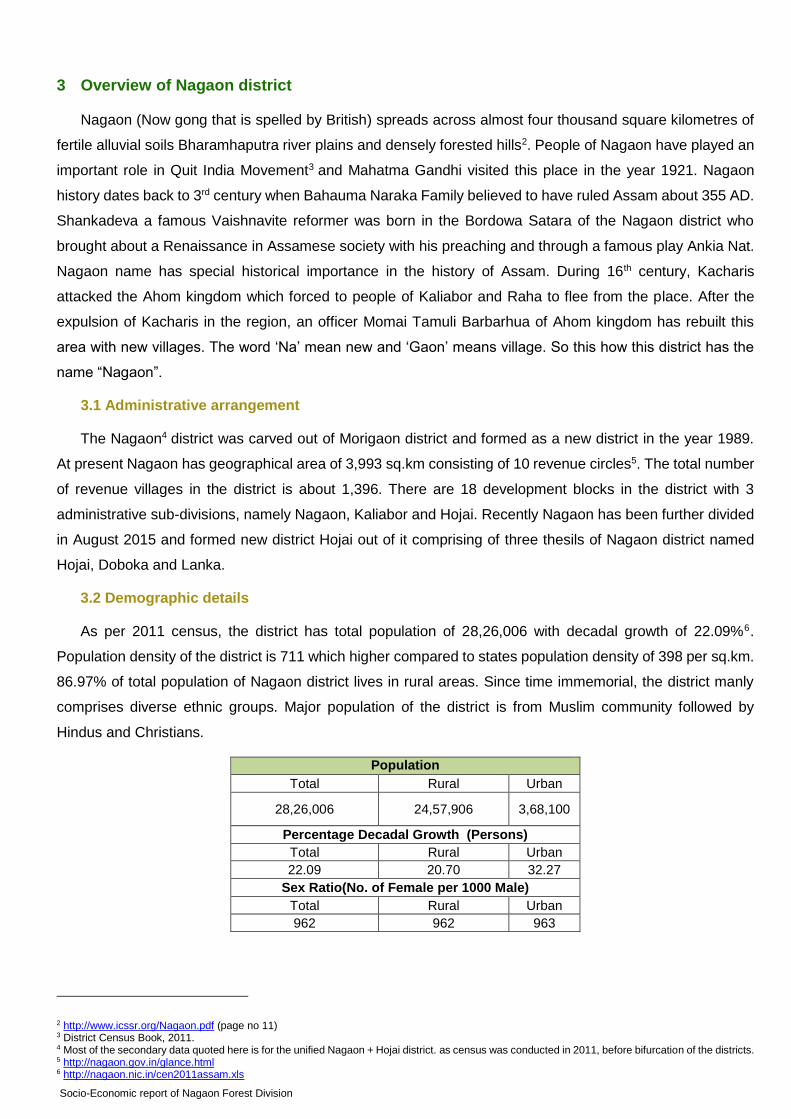
3.2 Demographic details
As per 2011 census, the district has total population of 28,26,006 with decadal growth of 22.09%6.
Population density of the district is 711 which higher compared to states population density of 398 per sq.km.
86.97% of total population of Nagaon district lives in rural areas. Since time immemorial, the district manly
comprises diverse ethnic groups. Major population of the district is from Muslim community followed by
Hindus and Christians.
Population
Total Rural Urban
28,26,006 24,57,906 3,68,100
Percentage Decadal Growth (Persons)
Total Rural Urban
22.09 20.70 32.27
Sex Ratio(No. of Female per 1000 Male)
Total Rural Urban
962 962 963
2 http://www.icssr.org/Nagaon.pdf (page no 11) 3 District Census Book, 2011. 4 Most of the secondary data quoted here is for the unified Nagaon + Hojai district. as census was conducted in 2011, before bifurcation of the districts. 5 http://nagaon.gov.in/glance.html 6 http://nagaon.nic.in/cen2011assam.xls
pg. 11
Table 1: Population data (Census 2011) of Nagaon district6
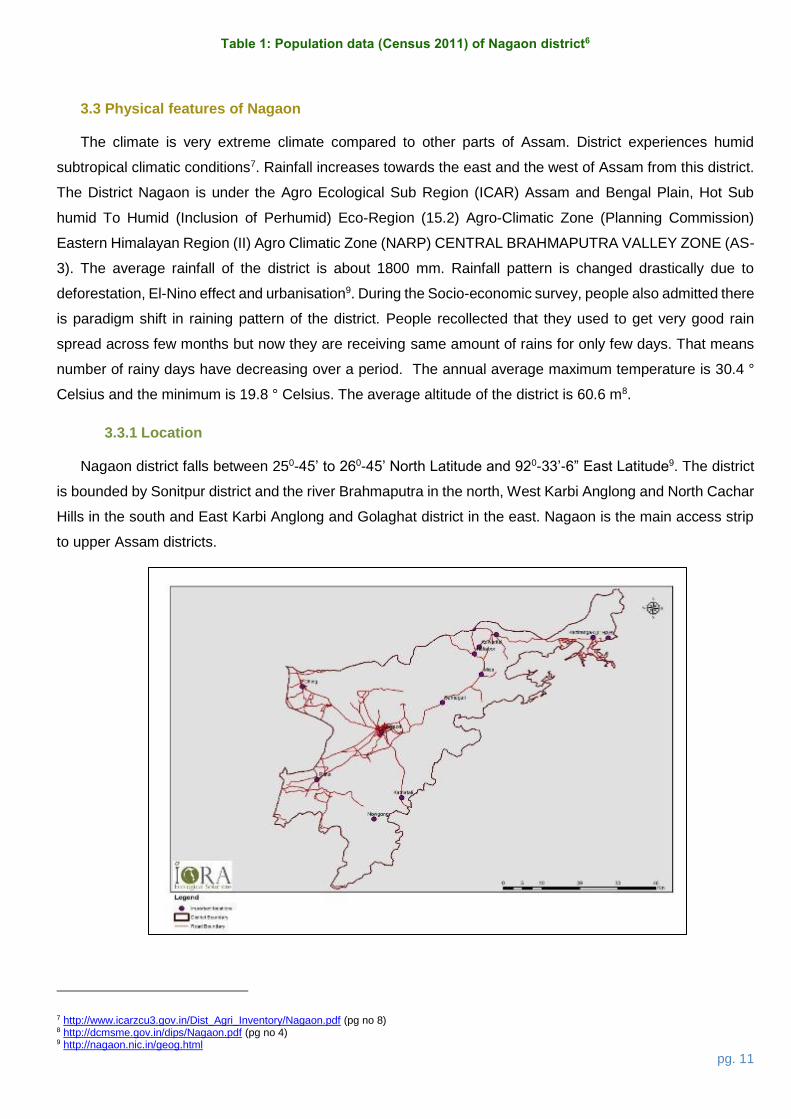
3.3 Physical features of Nagaon
The climate is very extreme climate compared to other parts of Assam. District experiences humid
subtropical climatic conditions7. Rainfall increases towards the east and the west of Assam from this district.
The District Nagaon is under the Agro Ecological Sub Region (ICAR) Assam and Bengal Plain, Hot Sub
humid To Humid (Inclusion of Perhumid) Eco-Region (15.2) Agro-Climatic Zone (Planning Commission)
Eastern Himalayan Region (II) Agro Climatic Zone (NARP) CENTRAL BRAHMAPUTRA VALLEY ZONE (AS-
3). The average rainfall of the district is about 1800 mm. Rainfall pattern is changed drastically due to
deforestation, El-Nino effect and urbanisation9. During the Socio-economic survey, people also admitted there
is paradigm shift in raining pattern of the district. People recollected that they used to get very good rain
spread across few months but now they are receiving same amount of rains for only few days. That means
number of rainy days have decreasing over a period. The annual average maximum temperature is 30.4 °
Celsius and the minimum is 19.8 ° Celsius. The average altitude of the district is 60.6 m8.
3.3.1 Location
Nagaon district falls between 250-45’ to 260-45’ North Latitude and 920-33’-6” East Latitude9. The district
is bounded by Sonitpur district and the river Brahmaputra in the north, West Karbi Anglong and North Cachar
Hills in the south and East Karbi Anglong and Golaghat district in the east. Nagaon is the main access strip
to upper Assam districts.
7 http://www.icarzcu3.gov.in/Dist_Agri_Inventory/Nagaon.pdf (pg no 8) 8 http://dcmsme.gov.in/dips/Nagaon.pdf (pg no 4) 9 http://nagaon.nic.in/geog.html
Socio-Economic report of Nagaon Forest Division
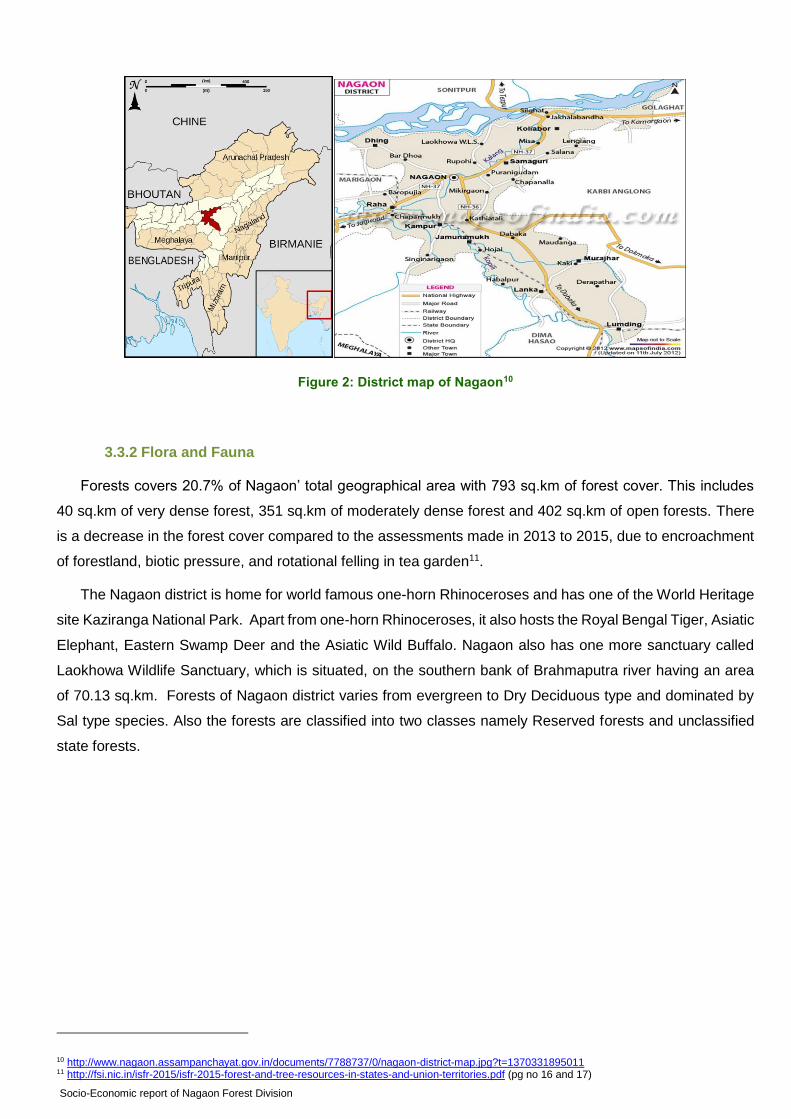
Figure 2: District map of Nagaon10
3.3.2 Flora and Fauna
Forests covers 20.7% of Nagaon’ total geographical area with 793 sq.km of forest cover. This includes
40 sq.km of very dense forest, 351 sq.km of moderately dense forest and 402 sq.km of open forests. There
is a decrease in the forest cover compared to the assessments made in 2013 to 2015, due to encroachment
of forestland, biotic pressure, and rotational felling in tea garden11.
The Nagaon district is home for world famous one-horn Rhinoceroses and has one of the World Heritage
site Kaziranga National Park. Apart from one-horn Rhinoceroses, it also hosts the Royal Bengal Tiger, Asiatic
Elephant, Eastern Swamp Deer and the Asiatic Wild Buffalo. Nagaon also has one more sanctuary called
Laokhowa Wildlife Sanctuary, which is situated, on the southern bank of Brahmaputra river having an area
of 70.13 sq.km. Forests of Nagaon district varies from evergreen to Dry Deciduous type and dominated by
Sal type species. Also the forests are classified into two classes namely Reserved forests and unclassified
state forests.
10 http://www.nagaon.assampanchayat.gov.in/documents/7788737/0/nagaon-district-map.jpg?t=1370331895011 11 http://fsi.nic.in/isfr-2015/isfr-2015-forest-and-tree-resources-in-states-and-union-territories.pdf (pg no 16 and 17)
pg. 13
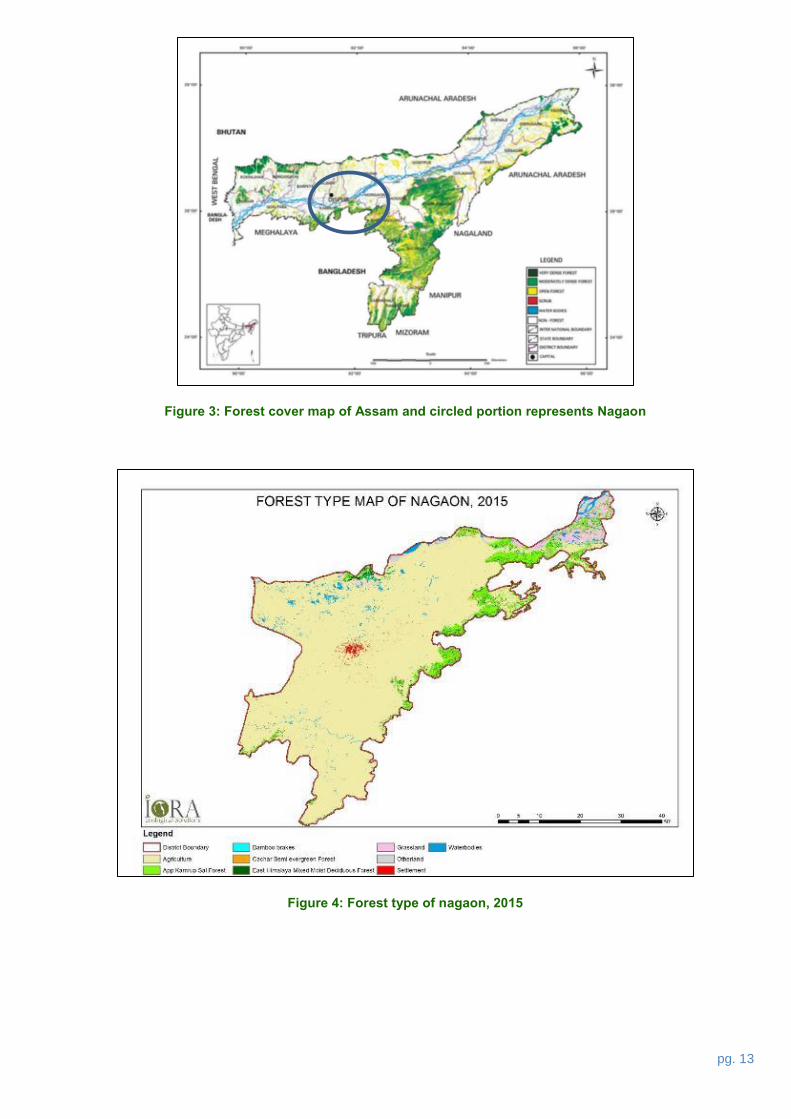
Figure 3: Forest cover map of Assam and circled portion represents Nagaon
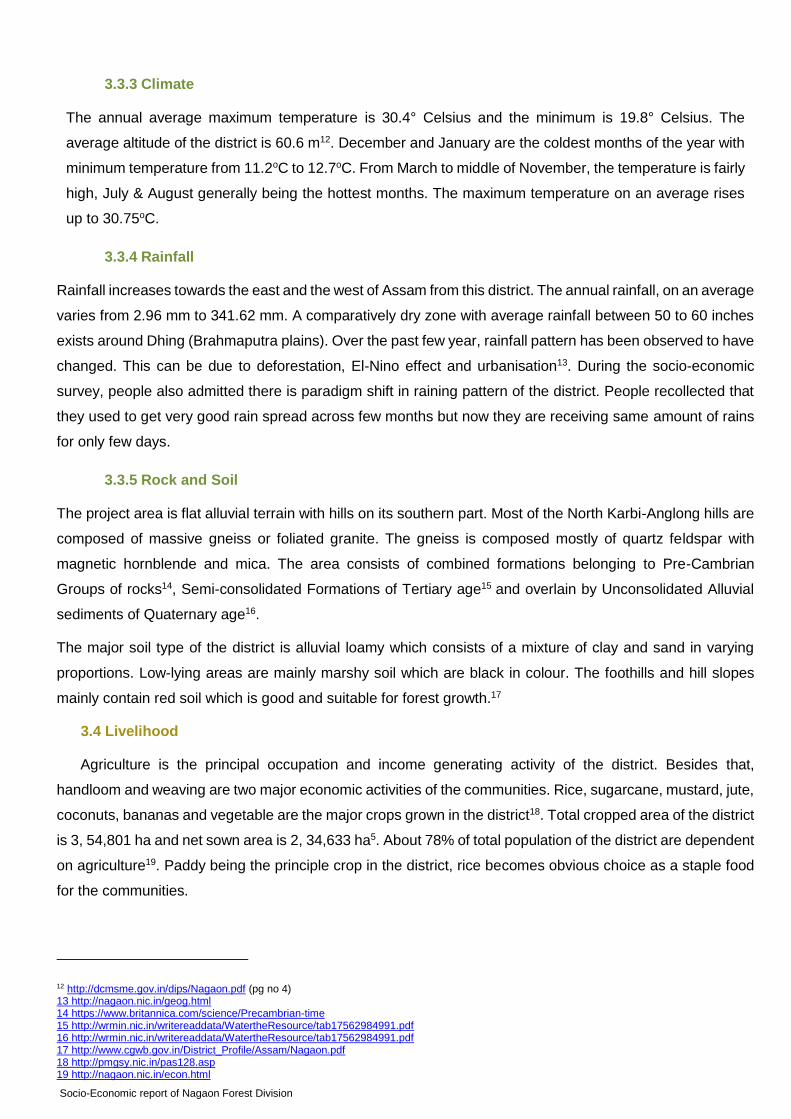
Figure 4: Forest type of nagaon, 2015
Socio-Economic report of Nagaon Forest Division
3.3.3 Climate
The annual average maximum temperature is 30.4° Celsius and the minimum is 19.8° Celsius. The
average altitude of the district is 60.6 m12. December and January are the coldest months of the year with
minimum temperature from 11.2oC to 12.7oC. From March to middle of November, the temperature is fairly
high, July & August generally being the hottest months. The maximum temperature on an average rises
up to 30.75oC.
3.3.4 Rainfall
Rainfall increases towards the east and the west of Assam from this district. The annual rainfall, on an average
varies from 2.96 mm to 341.62 mm. A comparatively dry zone with average rainfall between 50 to 60 inches
exists around Dhing (Brahmaputra plains). Over the past few year, rainfall pattern has been observed to have
changed. This can be due to deforestation, El-Nino effect and urbanisation13. During the socio-economic
survey, people also admitted there is paradigm shift in raining pattern of the district. People recollected that
they used to get very good rain spread across few months but now they are receiving same amount of rains
for only few days.
3.3.5 Rock and Soil
The project area is flat alluvial terrain with hills on its southern part. Most of the North Karbi-Anglong hills are
composed of massive gneiss or foliated granite. The gneiss is composed mostly of quartz feldspar with
magnetic hornblende and mica. The area consists of combined formations belonging to Pre-Cambrian
Groups of rocks14, Semi-consolidated Formations of Tertiary age15 and overlain by Unconsolidated Alluvial
sediments of Quaternary age16.
The major soil type of the district is alluvial loamy which consists of a mixture of clay and sand in varying
proportions. Low-lying areas are mainly marshy soil which are black in colour. The foothills and hill slopes
mainly contain red soil which is good and suitable for forest growth.17
3.4 Livelihood
Agriculture is the principal occupation and income generating activity of the district. Besides that,
handloom and weaving are two major economic activities of the communities. Rice, sugarcane, mustard, jute,
coconuts, bananas and vegetable are the major crops grown in the district18. Total cropped area of the district
is 3, 54,801 ha and net sown area is 2, 34,633 ha5. About 78% of total population of the district are dependent
on agriculture19. Paddy being the principle crop in the district, rice becomes obvious choice as a staple food
for the communities.
12 http://dcmsme.gov.in/dips/Nagaon.pdf (pg no 4) 13 http://nagaon.nic.in/geog.html 14 https://www.britannica.com/science/Precambrian-time 15 http://wrmin.nic.in/writereaddata/WatertheResource/tab17562984991.pdf 16 http://wrmin.nic.in/writereaddata/WatertheResource/tab17562984991.pdf 17 http://www.cgwb.gov.in/District_Profile/Assam/Nagaon.pdf 18 http://pmgsy.nic.in/pas128.asp 19 http://nagaon.nic.in/econ.html
pg. 15
3.5 Other general information
Nagaon district hosts place called Bordowa, the birthplace of Mahapurush Srimantha Shankaradeva, the
great artist, author and founder of Vaishnavism religion in Assam. Also consists of The Laokhowa Wildlife
Sanctuary is situated at Lowkhowa namely covering an area of 70.13 km². Nagaon is also known as Rice
bowl of Assam. The major rivers of the district include the Brahmaputra, Kalong, Sonai, Nanoi, Jamuna, Kopili
and the Barpani.
4 Methodology and Approach
Nagaon district has a population density of 711 per sq km as per 2011 census compared to states
population density of 398 per sq.km. In addition, 89% of total population live in rural parts of the district and
most of them dependent forests for their livelihoods. From this, one can imagine the amount of pressure
exerted by this population on forests resources to meet their day-to-day needs.
4.1 Defining the scope
The main objective of this study is to identify the original and leading drivers for deforestation and forest
degradation in Nagaon district. The effort is made through this study to identify possible intervention activities
through participatory approach, which could be taken up through Jurisdictional REDD+ project.
4.2 Limitation of the survey
Every study and research has its own limitations. This study is also not an exception from the limitations.
Lack of first hand data about the communities, household details, community structures and difficult in
approaching the remote areas due lack of road facilities as well as communication facilities are the major
limitations of the study. Efforts have been made to collect data from far reaching communities too. Data
collected during this study is completely based on communities’ responses to questions pertaining to forests
resource utilisation. The responses given by communities varied from person to person in a single village.
Utmost care has been taken in collecting the information without any bias towards the study objective and
communities perception.
4.3 Approach to the survey and analysis
The study involved structured approach to assess the drivers, agents and the underlying causes of
deforestation and degradation. An experience team with knowledge of local language to read, write and speak
was formed to conduct the study. Apart from this team, a team of experts from forestry, social, and energy
sectors from IORA Ecological Solutions were involved in sample design, questionnaire design and other
activities of the study. An inclusive desk based study was conducted to acquire socio-economic information
of the Nagaon district. The data was obtained from District profiles from different Government sources,
Government reports, and scientific studies.
The survey was divided into both quantitative and qualitative data collection. The former one gives specific
data, percentages and numbers to be gathered. The latter one gives us a more generalised view over a
greater number of people. The results of both qualitative and quantitative studies are presented in the
following sections
Socio-Economic report of Nagaon Forest Division
4.4 Tools used
The study implemented most commonly used scientific and statistical tools to collect socio-economic
information. The tools involved are in–depth interviews of individuals (Household survey), Focused Group
Discussions (FGDs) with communities, dialogues, local consultations with relevant stakeholders and personal
observation.
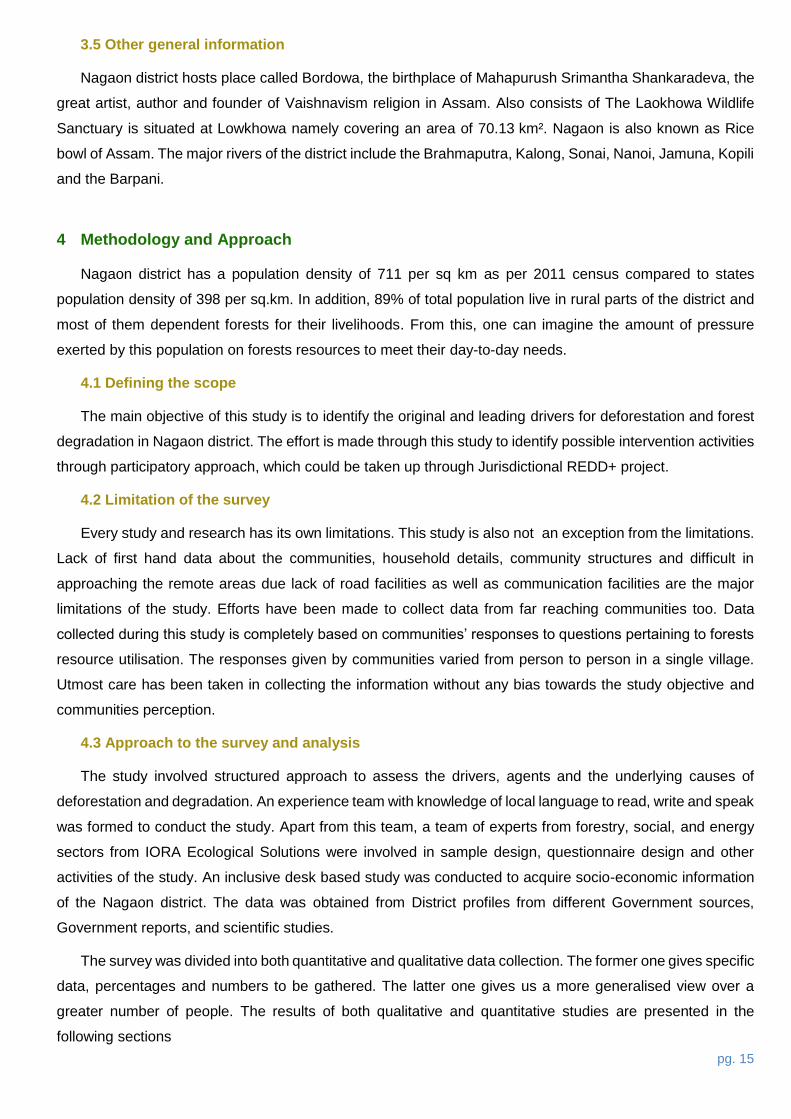
4.4.1 Household Survey
Questionnaire was designed in consultation with the forest department and field tested before
implementing at large scale data collection. Based on field studies the questionnaires was modified and fine-
tuned to the local conditions and it has been translated to local Assamese language for better understanding
of the questions for survey team and communities as well. A classroom session was held to the survey team
members to explain the objectives of the study and the questionnaires. Since this is a Jurisdictional REDD+
project activity, the villages were selected within the administrative boundaries of Nagaon district. The
households surveyed were representative samples from large, medium and small farmers and landless
households. The questionnaire adopted for the survey is included in Annex 1. The survey was conducted
between December 2016 and January 2017 months.
pg. 17
Figure 5: Household Survey
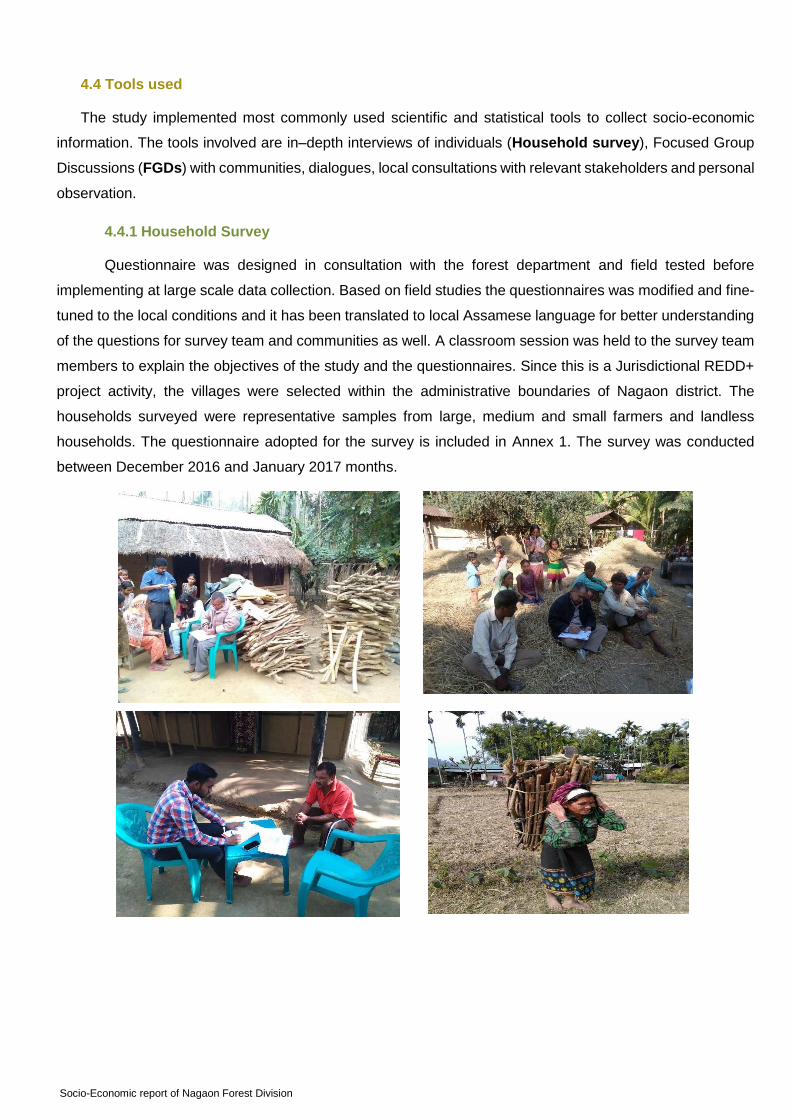
4.4.2 Focus Group Discussions
Villages in each range were selected randomly to conduct Focus Grouped Discussions (FGD). In total
26 FGDs at different villages were conducted during the study. FGDs included important and key informants
from the villages like JFMC members, Panchayat members and other prominent people of the village. Forest
department personal was also involved while conducting FGD.
Socio-Economic report of Nagaon Forest Division
Figure 6: Focus Group Discussions
4.5 Sampling Design
4.5.1 Determination of Sample Size
The sample size needed to be representative of a given population is based on the Krejcie, and Morgan
equation20:
S = X2NP(1− P) ÷ d2(N −1) + X2P(1− P).
Where:
S Required sample size.
X2 The table value of chi-square for 1 degree of freedom at the desired
confidence level (X2=3.841).
N The population size.
P The population proportion (assumed to be 0.50 since this would provide
the maximum sample size).
d The degree of accuracy expressed as a proportion (0.05).
As per Krejice and Morgon, the number of households (SS) to be surveyed for a population of about over
a million population is 384. Assuming overall response rate of 80% from the sampled households, it has been
decided to sample 384/0.8= 480 households. In this study, 567 households were surveyed for the REDD+
project to analyze the drivers responsible for deforestation and the forest degradation.
4.6 Target Population
The target population are the households and communities from the villages of 7 forest ranges whole
Nagaon Forest Division within Nagaon district boundaries.
4.7 Sampling Method
4.7.1 Assumptions
Nagaon district has 7 forest ranges under Nagaon forest division and whole of the district is covered
by these 7 ranges. For the survey, all 7 ranges were considered. The following methodological assumptions
were made to achieve the REDD+ project objectives.
a) Total population in the district is considered homogeneous for sample size calculations. However
sampling stratification is made on the basis of distance from forests, as adopted by FRI (1 km).
two more buffers at 1 km to 5 km and 5 km were also created for mapping foret resource utilization.
The fourth stratum consists of all the villages within the forests.
20 Krejcie, R.V. and Morgan, D.W. 1970. Determining sample size for research activities. Educational and psychological measurement 30: 607-610 and http://www.raosoft.com/samplesize.html
pg. 19
b) Households or villagers dependency on forest produce is inversely proportional to distance of
forest from the households or villages21.
c) We have assumed that many of the effects can have a compounding effect on the forest stock,
for instance; grazing and fuelwood extraction together can have a more detrimental effect on forest
stock. However in this study we have considered only the total stock removal under each activity,
as compounding effect needs more time for estimations and are location specific. Further, this
approach is also conservative.
4.7.2 Allocation of Samples
Households or villagers dependency on forest produce is inversely proportional to distance of forest
from the households or villages21. A list of villages from each range was sought from the forest department.
A random stratified selection of minimum 6 villages was done to represent all the Forest Ranges. Again, these
villages are segregated into 3 categories as described below.
They are,
a) Households (Villages) within 1 KM from forest
b) Households (Villages) within 1 to 5 KM from forest
c) Households (Villages) beyond 5 KM from forest
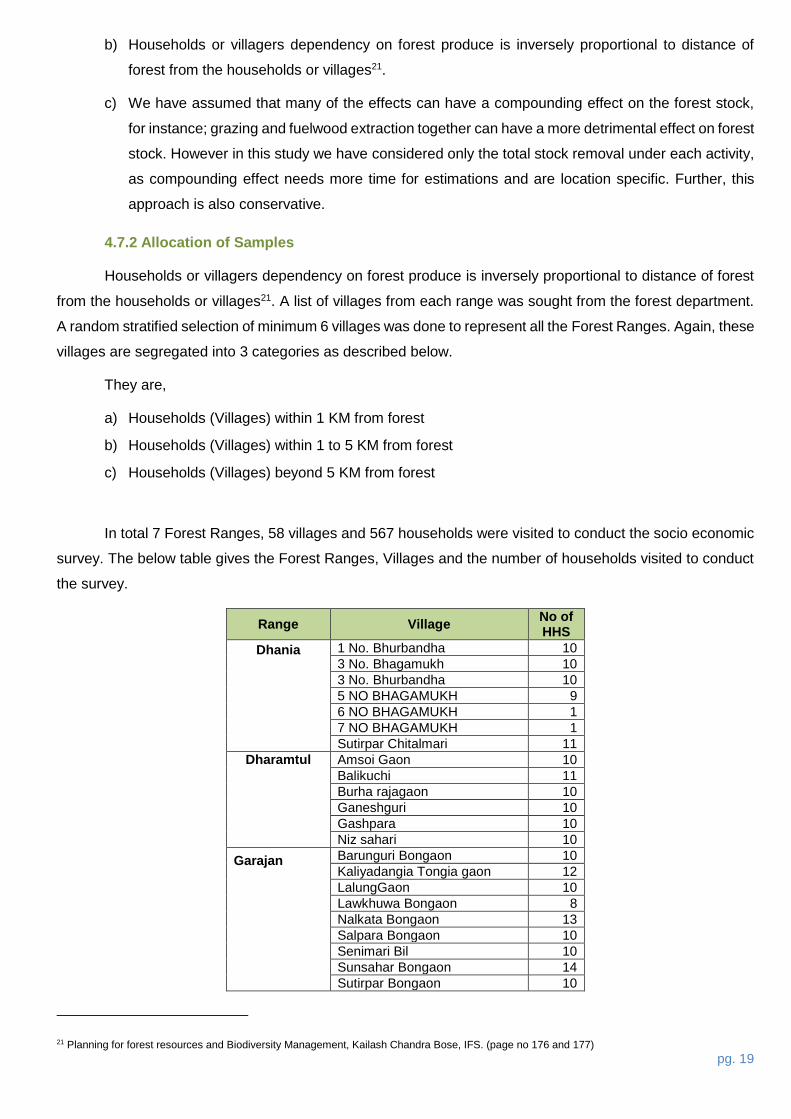
In total 7 Forest Ranges, 58 villages and 567 households were visited to conduct the socio economic
survey. The below table gives the Forest Ranges, Villages and the number of households visited to conduct
the survey.
Range Village No of HHS
Dhania
1 No. Bhurbandha 10
3 No. Bhagamukh 10
3 No. Bhurbandha 10
5 NO BHAGAMUKH 9
6 NO BHAGAMUKH 1
7 NO BHAGAMUKH 1
Sutirpar Chitalmari 11
Dharamtul
Amsoi Gaon 10
Balikuchi 11
Burha rajagaon 10
Ganeshguri 10
Gashpara 10
Niz sahari 10
Garajan
Barunguri Bongaon 10
Kaliyadangia Tongia gaon 12
LalungGaon 10
Lawkhuwa Bongaon 8
Nalkata Bongaon 13
Salpara Bongaon 10
Senimari Bil 10
Sunsahar Bongaon 14
Sutirpar Bongaon 10
21 Planning for forest resources and Biodiversity Management, Kailash Chandra Bose, IFS. (page no 176 and 177)
Socio-Economic report of Nagaon Forest Division
Range Village No of HHS
Kampur
1 No. Kuhimari 3
2 No. Kuhimari 7
9 no Kheroni (Tongia gaon) 18
Atigaon 7
Dakhin Jor Bagan 11
Jadupathar 12
Kuhimari 2
Lutumari Tapakuchi 9
Natun Garukhunda (Pilkhana1) 16
Sitalmari 13
Kathiatoli
2 No. Pilkhana Bongaon 2
Borkacharigaon 11
Garogaon 10
Garubandha 8
Manuhargaon 8
Rengbeng 4
Sarupathar 4
Tetelisara 10
Nagaon Sadar
Adarsha Gaon 12
Alitangani 13
Bejorgaon 12
Dagaon 12
Fuhaniati 13
Ghugar gaon 14
Rowmari 13
Uriagaon 15
Salona
Baghekhaiti 1
Balijuri Karbigaon 11
Bolhula karbi gaon 15
Bonbahoni 2
Hatimurah 15
Nalbari Kacharigaon 10
Namkamakhya 12
Samdhara 10
Sunarigaon 12
Uttar Borghat 10
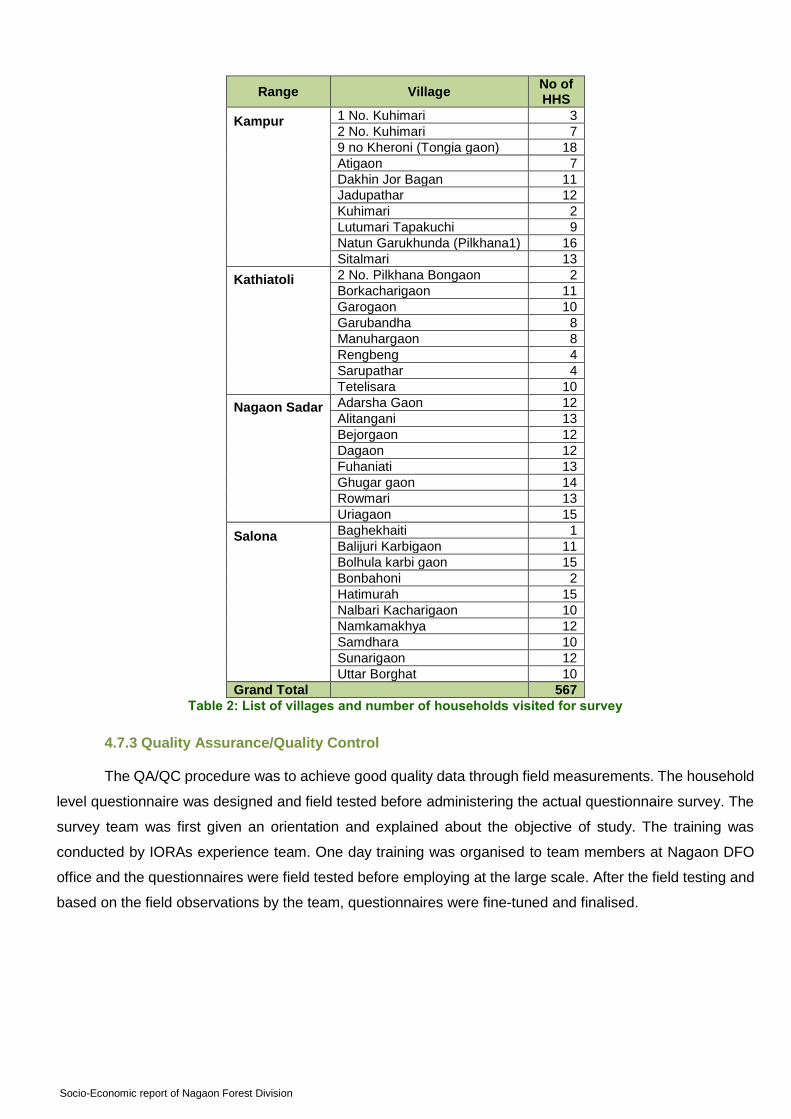
Grand Total 567
Table 2: List of villages and number of households visited for survey
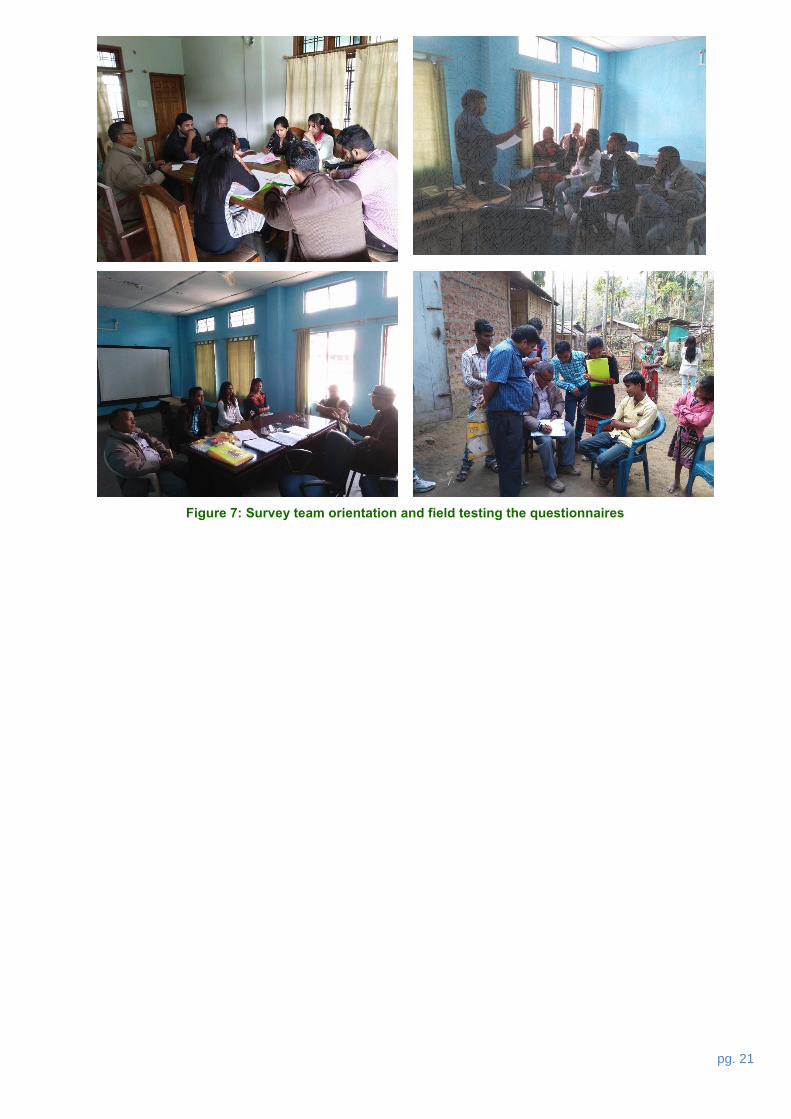
4.7.3 Quality Assurance/Quality Control
The QA/QC procedure was to achieve good quality data through field measurements. The household
level questionnaire was designed and field tested before administering the actual questionnaire survey. The
survey team was first given an orientation and explained about the objective of study. The training was
conducted by IORAs experience team. One day training was organised to team members at Nagaon DFO
office and the questionnaires were field tested before employing at the large scale. After the field testing and
based on the field observations by the team, questionnaires were fine-tuned and finalised.
pg. 21
Figure 7: Survey team orientation and field testing the questionnaires

Socio-Economic report of Nagaon Forest Division
5 Results and Discussions
We all know forests play an important role in livelihood generation of the communities especially who lives
in and around of the forests. The box below highlights the importance of forest role as summarised by Byron
& Arnold (1997).
5.1 Back ground of Study area
The present study was conducted in seven forest ranges of Nagaon forest division including 5 ranges
from territorial division and 2 ranges from wildlife division. The ranges are Dharamtul, Kampur, Kathiatoli,
Salona and Nagaon Sadar in territorial division and Dhania and Garajan ranges in Wildlife division. Nagaon
Sadar range of territorial division does not have any notified or reserve forests but communities still depend
forests of other ranges for fuelwood and Bamboo.
The Assam Forest department has identified few villages as forest villages. In earlier days to get the
labour supply, the forest villages were established inside the forests. In addition to Forest Village, there is
another type known as Taungya Village. The people from these villages are involved in plantations work such
as clearing the site, burning the debris, stacking, hoeing in strips, making planting holes, planting, sowing
seeds, weeding, cleaning & thinning etc. at present people from these villages do not provide any free
services department for forestry works.
Two month long study was conducted in the project area to assess the current scenario of the drivers and
agents responsible for deforestation and forest degradation. The study involves different stakeholder
consultations within the project area. The study revealed that majority of the people do not have any idea
about the alternatives available to replace fuelwood consumption and sustainable way of harvesting of
Concerning the importance of forests to livelihoods:
For millions of people living in forest environments, the forest forms such a dominant
part of their physical, material, economic and spiritual lives that its importance is not
most appropriately described and assessed in terms of the individual products or
services that the forest provides.
On the use of forests and forest products to supplement nutritional and medicinal needs:
Forests and forest trees are the sources of a variety of foods that supplement and
complement what is obtained from agriculture, of fuels with which to cook food, and of
a wide range of medicines and other products that contribute to health and hygiene.
About the use of forest products to meet seasonal food shortages:
Forest foods are most extensively used to help meet dietary shortfalls during particular
seasons in the year. Many agricultural communities suffer from seasonal food
shortages, which commonly occur at the time of year when stored food supplies have
dwindled and harvest new crops is only just beginning.
pg. 23
NTFPs. This is due to lack of awareness among the communities about the significance of forest resources.
The forests and communities of the district are inseparable. The way of life of communities are well imbibed
with forest. All of their cultural and religious activities and livelihood activities are dependent on forest
resources. Other than forest resources availability, basic health and education facilities are not up to the mark.
Villages lack health centres and school facilities. People also raised concerns about the reach of benefits to
villagers of prevalent government schemes. Man animal conflicts are common in project area.
5.2 Socio Economic profile
As discussed in above section, the survey took place in two modes – household surveys through
questionnaires and Focused Group Discussions village large people of the villages. The result is thus divided
in two segments accordingly. This chapter will cover the findings from household survey.
5.2.1 Population Structure
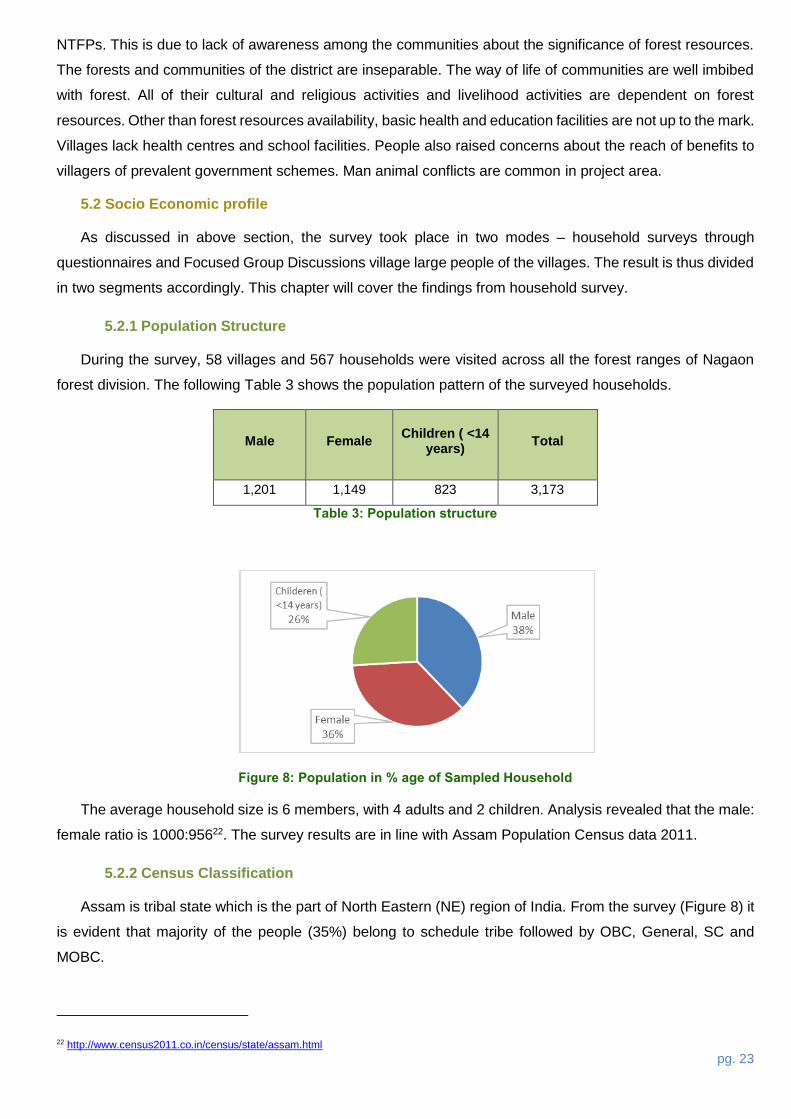
During the survey, 58 villages and 567 households were visited across all the forest ranges of Nagaon
forest division. The following Table 3 shows the population pattern of the surveyed households.
Male Female Children ( <14
years) Total
1,201 1,149 823 3,173
Table 3: Population structure
Figure 8: Population in % age of Sampled Household
The average household size is 6 members, with 4 adults and 2 children. Analysis revealed that the male:
female ratio is 1000:95622. The survey results are in line with Assam Population Census data 2011.
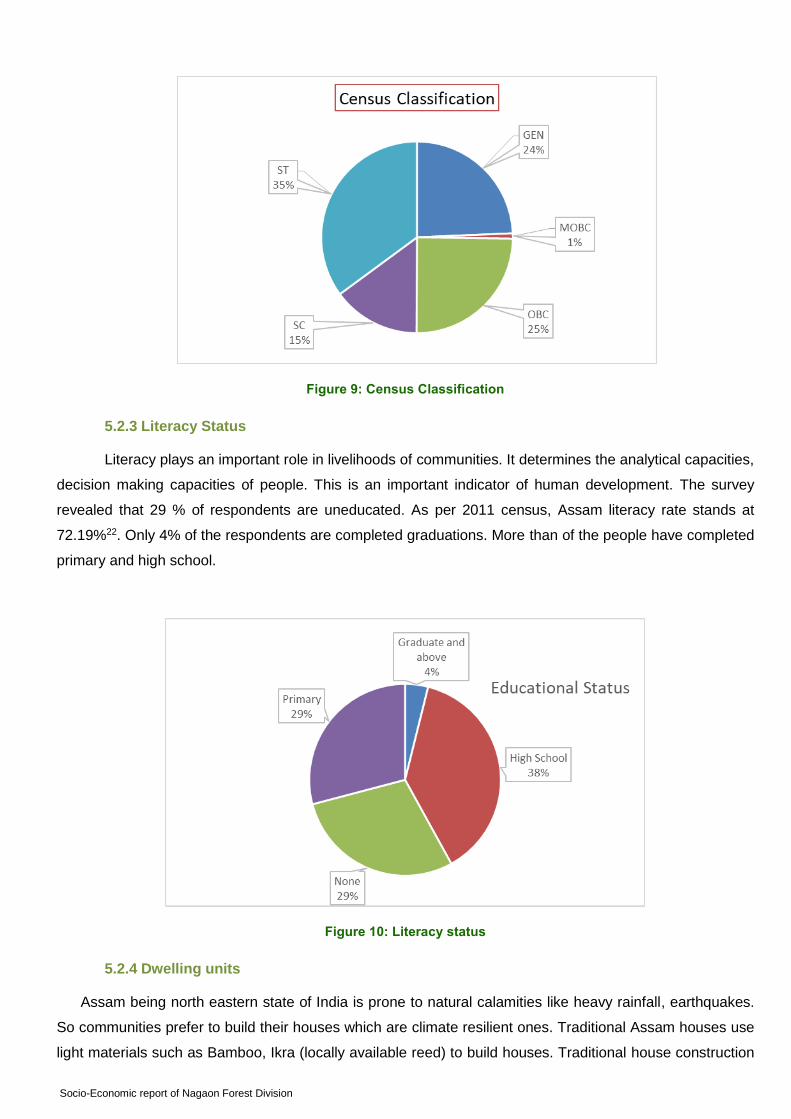
5.2.2 Census Classification
Assam is tribal state which is the part of North Eastern (NE) region of India. From the survey (Figure 8) it
is evident that majority of the people (35%) belong to schedule tribe followed by OBC, General, SC and
MOBC.
22 http://www.census2011.co.in/census/state/assam.html
Socio-Economic report of Nagaon Forest Division
Figure 9: Census Classification
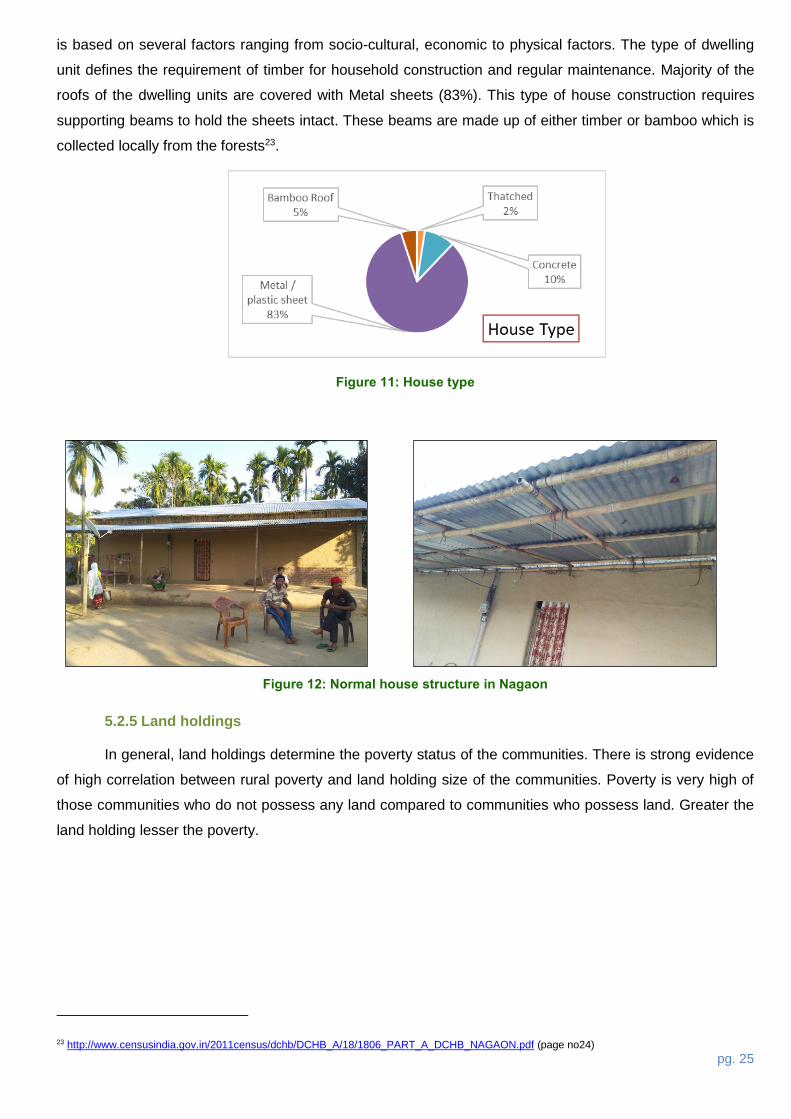
5.2.3 Literacy Status
Literacy plays an important role in livelihoods of communities. It determines the analytical capacities,
decision making capacities of people. This is an important indicator of human development. The survey
revealed that 29 % of respondents are uneducated. As per 2011 census, Assam literacy rate stands at
72.19%22. Only 4% of the respondents are completed graduations. More than of the people have completed
primary and high school.
Figure 10: Literacy status
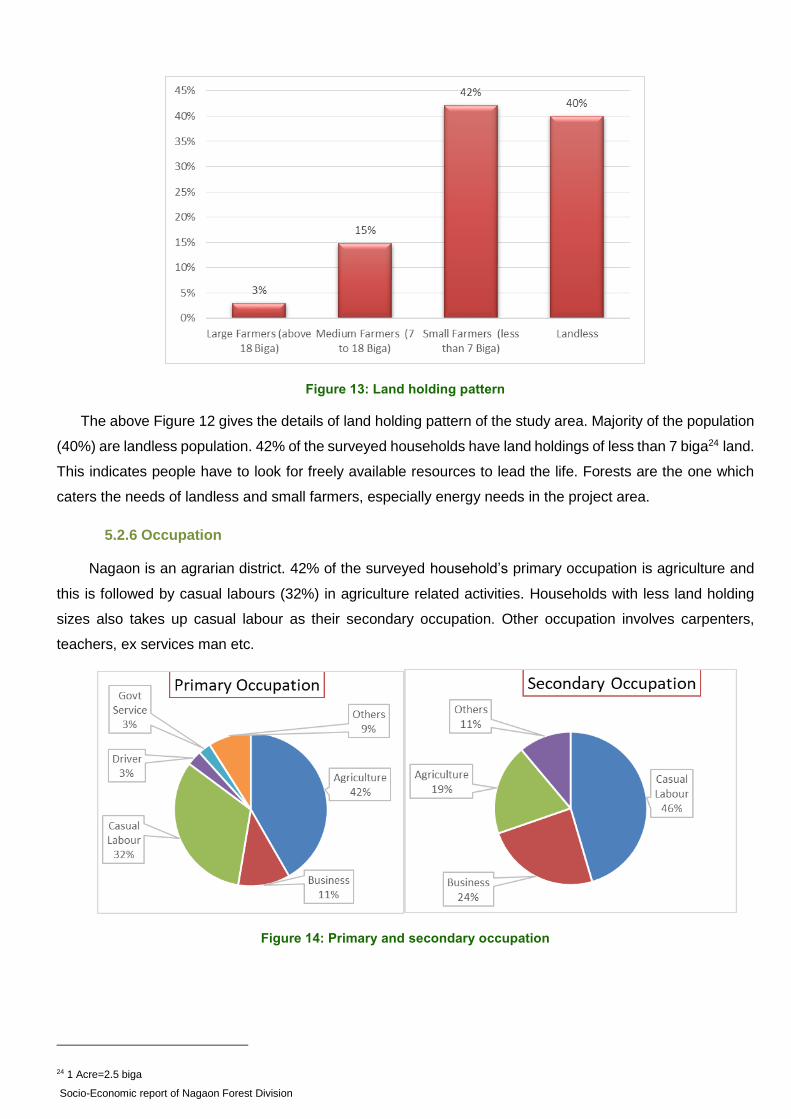
5.2.4 Dwelling units
Assam being north eastern state of India is prone to natural calamities like heavy rainfall, earthquakes.
So communities prefer to build their houses which are climate resilient ones. Traditional Assam houses use
light materials such as Bamboo, Ikra (locally available reed) to build houses. Traditional house construction
pg. 25
is based on several factors ranging from socio-cultural, economic to physical factors. The type of dwelling
unit defines the requirement of timber for household construction and regular maintenance. Majority of the
roofs of the dwelling units are covered with Metal sheets (83%). This type of house construction requires
supporting beams to hold the sheets intact. These beams are made up of either timber or bamboo which is
collected locally from the forests23.
Figure 11: House type
Figure 12: Normal house structure in Nagaon
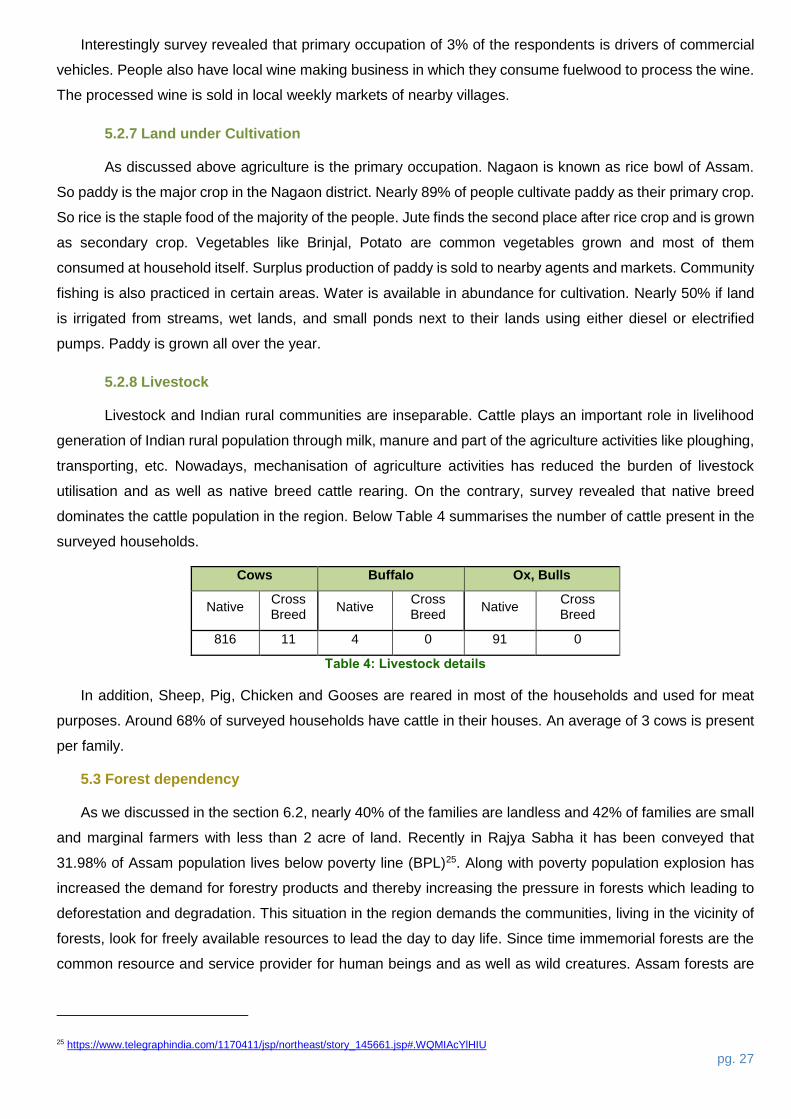
5.2.5 Land holdings
In general, land holdings determine the poverty status of the communities. There is strong evidence
of high correlation between rural poverty and land holding size of the communities. Poverty is very high of
those communities who do not possess any land compared to communities who possess land. Greater the
land holding lesser the poverty.
23 http://www.censusindia.gov.in/2011census/dchb/DCHB_A/18/1806_PART_A_DCHB_NAGAON.pdf (page no24)
Socio-Economic report of Nagaon Forest Division
Figure 13: Land holding pattern
The above Figure 12 gives the details of land holding pattern of the study area. Majority of the population
(40%) are landless population. 42% of the surveyed households have land holdings of less than 7 biga24 land.
This indicates people have to look for freely available resources to lead the life. Forests are the one which
caters the needs of landless and small farmers, especially energy needs in the project area.
5.2.6 Occupation
Nagaon is an agrarian district. 42% of the surveyed household’s primary occupation is agriculture and
this is followed by casual labours (32%) in agriculture related activities. Households with less land holding
sizes also takes up casual labour as their secondary occupation. Other occupation involves carpenters,
teachers, ex services man etc.
Figure 14: Primary and secondary occupation
24 1 Acre=2.5 biga
pg. 27
Interestingly survey revealed that primary occupation of 3% of the respondents is drivers of commercial
vehicles. People also have local wine making business in which they consume fuelwood to process the wine.
The processed wine is sold in local weekly markets of nearby villages.
5.2.7 Land under Cultivation
As discussed above agriculture is the primary occupation. Nagaon is known as rice bowl of Assam.
So paddy is the major crop in the Nagaon district. Nearly 89% of people cultivate paddy as their primary crop.
So rice is the staple food of the majority of the people. Jute finds the second place after rice crop and is grown
as secondary crop. Vegetables like Brinjal, Potato are common vegetables grown and most of them
consumed at household itself. Surplus production of paddy is sold to nearby agents and markets. Community
fishing is also practiced in certain areas. Water is available in abundance for cultivation. Nearly 50% if land
is irrigated from streams, wet lands, and small ponds next to their lands using either diesel or electrified
pumps. Paddy is grown all over the year.
5.2.8 Livestock
Livestock and Indian rural communities are inseparable. Cattle plays an important role in livelihood
generation of Indian rural population through milk, manure and part of the agriculture activities like ploughing,
transporting, etc. Nowadays, mechanisation of agriculture activities has reduced the burden of livestock
utilisation and as well as native breed cattle rearing. On the contrary, survey revealed that native breed
dominates the cattle population in the region. Below Table 4 summarises the number of cattle present in the
surveyed households.
Cows Buffalo Ox, Bulls
Native Cross Breed
Native Cross Breed
Native Cross Breed
816 11 4 0 91 0
Table 4: Livestock details
In addition, Sheep, Pig, Chicken and Gooses are reared in most of the households and used for meat
purposes. Around 68% of surveyed households have cattle in their houses. An average of 3 cows is present
per family.
5.3 Forest dependency
As we discussed in the section 6.2, nearly 40% of the families are landless and 42% of families are small
and marginal farmers with less than 2 acre of land. Recently in Rajya Sabha it has been conveyed that
31.98% of Assam population lives below poverty line (BPL)25. Along with poverty population explosion has
increased the demand for forestry products and thereby increasing the pressure in forests which leading to
deforestation and degradation. This situation in the region demands the communities, living in the vicinity of
forests, look for freely available resources to lead the day to day life. Since time immemorial forests are the
common resource and service provider for human beings and as well as wild creatures. Assam forests are
25 https://www.telegraphindia.com/1170411/jsp/northeast/story_145661.jsp#.WQMIAcYlHIU
Socio-Economic report of Nagaon Forest Division
rich in resources and at present these forests are catering services to the needs of the people. The following
section discusses the dependency of the communities on the forests.
5.3.1 Fuelwood
Due to lack of awareness and availability of clean energy sources such as LPG, Kerosene in the region,
communities are forced to use fuelwood as their major energy source for cooking, heating water, cattle food
preparation, etc. This creates a huge pressure on forests. Fuelwood is extracted daily by the communities
and is the major source of the energy in forest fringe villages.
Source of energy for cooking and heating
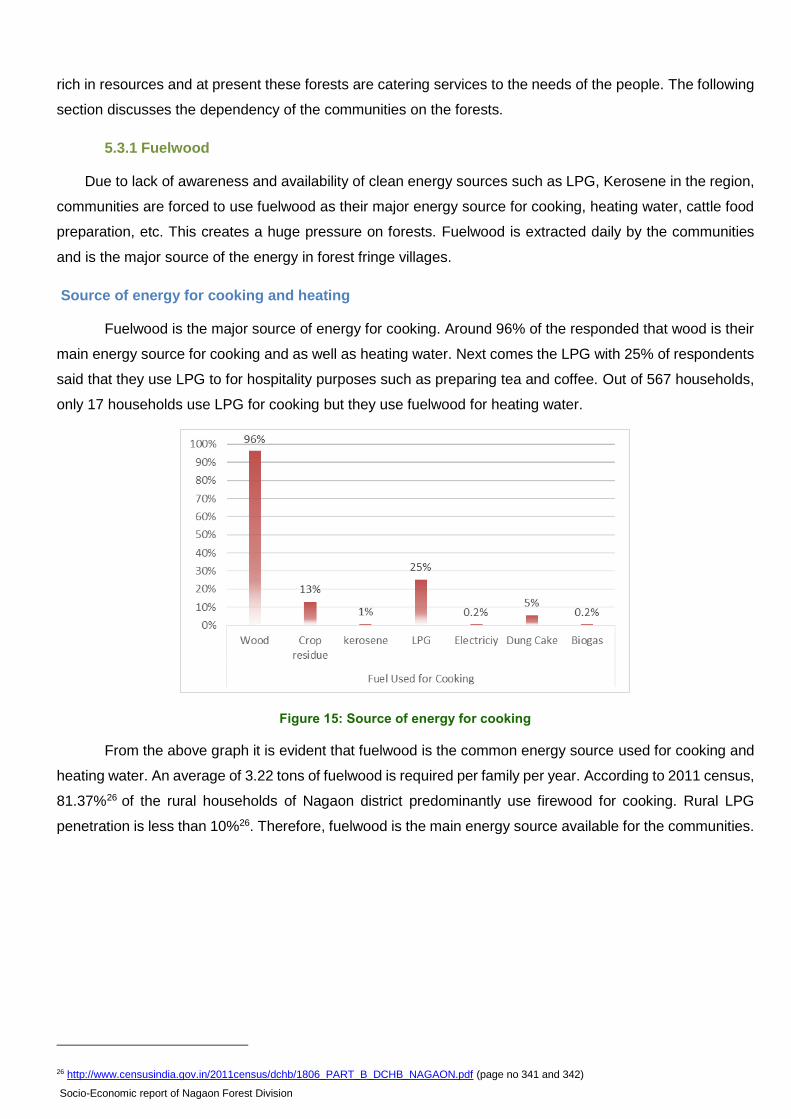
Fuelwood is the major source of energy for cooking. Around 96% of the responded that wood is their
main energy source for cooking and as well as heating water. Next comes the LPG with 25% of respondents
said that they use LPG to for hospitality purposes such as preparing tea and coffee. Out of 567 households,
only 17 households use LPG for cooking but they use fuelwood for heating water.
Figure 15: Source of energy for cooking
From the above graph it is evident that fuelwood is the common energy source used for cooking and
heating water. An average of 3.22 tons of fuelwood is required per family per year. According to 2011 census,
81.37%26 of the rural households of Nagaon district predominantly use firewood for cooking. Rural LPG
penetration is less than 10%26. Therefore, fuelwood is the main energy source available for the communities.
26 http://www.censusindia.gov.in/2011census/dchb/1806_PART_B_DCHB_NAGAON.pdf (page no 341 and 342)
pg. 29
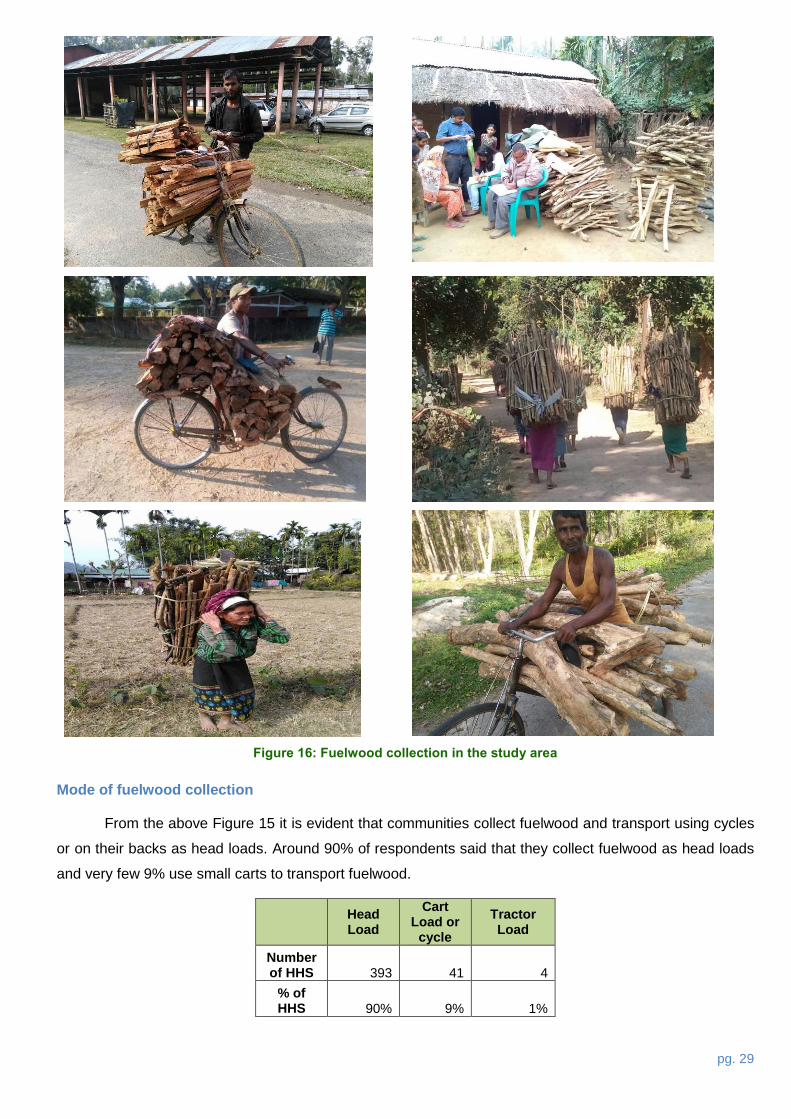
Figure 16: Fuelwood collection in the study area
Mode of fuelwood collection
From the above Figure 15 it is evident that communities collect fuelwood and transport using cycles
or on their backs as head loads. Around 90% of respondents said that they collect fuelwood as head loads
and very few 9% use small carts to transport fuelwood.
Head Load
Cart Load or
cycle
Tractor Load
Number of HHS 393 41 4
% of HHS 90% 9% 1%
Socio-Economic report of Nagaon Forest Division
Table 5: Mode of fuelwood Transportation
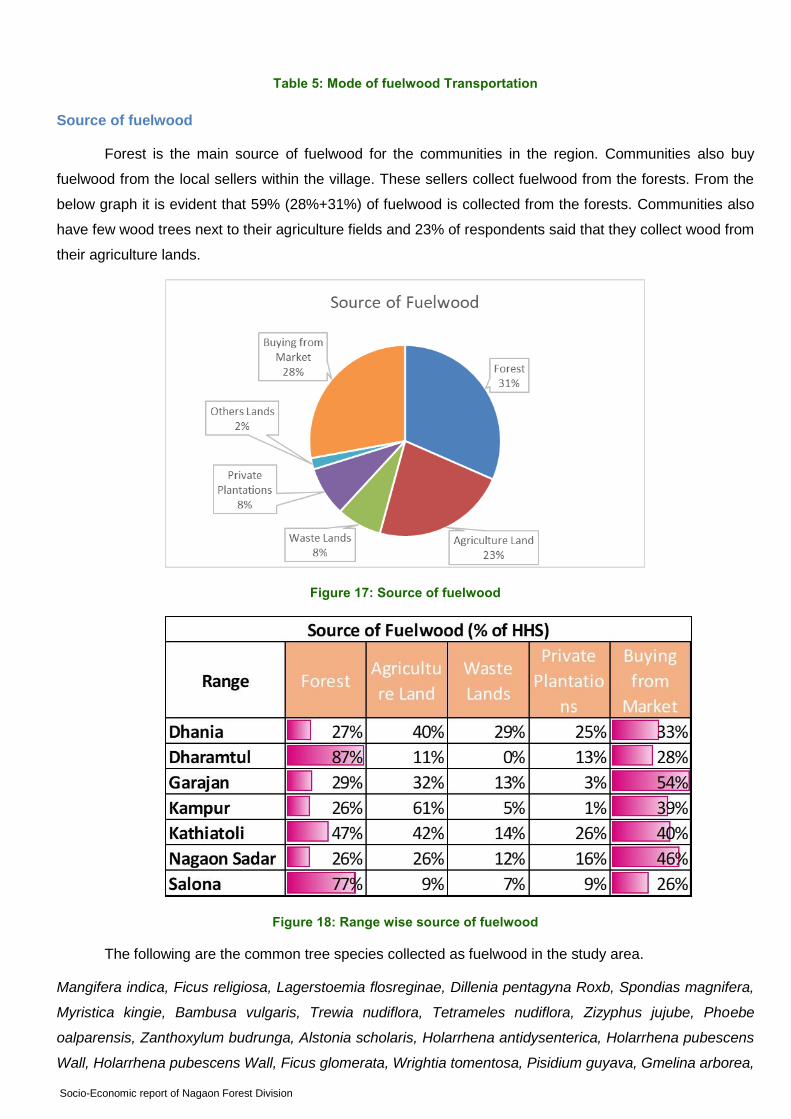
Source of fuelwood
Forest is the main source of fuelwood for the communities in the region. Communities also buy
fuelwood from the local sellers within the village. These sellers collect fuelwood from the forests. From the
below graph it is evident that 59% (28%+31%) of fuelwood is collected from the forests. Communities also
have few wood trees next to their agriculture fields and 23% of respondents said that they collect wood from
their agriculture lands.
Figure 17: Source of fuelwood
Figure 18: Range wise source of fuelwood
The following are the common tree species collected as fuelwood in the study area.
Mangifera indica, Ficus religiosa, Lagerstoemia flosreginae, Dillenia pentagyna Roxb, Spondias magnifera,
Myristica kingie, Bambusa vulgaris, Trewia nudiflora, Tetrameles nudiflora, Zizyphus jujube, Phoebe
oalparensis, Zanthoxylum budrunga, Alstonia scholaris, Holarrhena antidysenterica, Holarrhena pubescens
Wall, Holarrhena pubescens Wall, Ficus glomerata, Wrightia tomentosa, Pisidium guyava, Gmelina arborea,
pg. 31
Bombax Ceiba, Cassia fistula,Syzygium cuminii, Eupatorium odoratum, Garuga pinnata, Corchorus
capsularis, Saccharum spontaenum, Ipomoea aquatic, Bauhini spp, Anthoccphalus cadamba, Ipomoea
aquatic, Kayea floribunds, Artocarpus heterophyllum, Walsura robusta, Erythrina variegate, Zea mays,
Erythrina variegate, Albizzia lucida, Pterospermum acerifolium, Azadirachta indica, Stereospermum
chelonoides, Toona ciliala, Shorea robusta, Tectona grandis, Sapium baccatum, Lagerstroemia parviflora,
Bombax ceiba, Cassia fistula, Areca catechu, Gynandropsis pentaphylla.
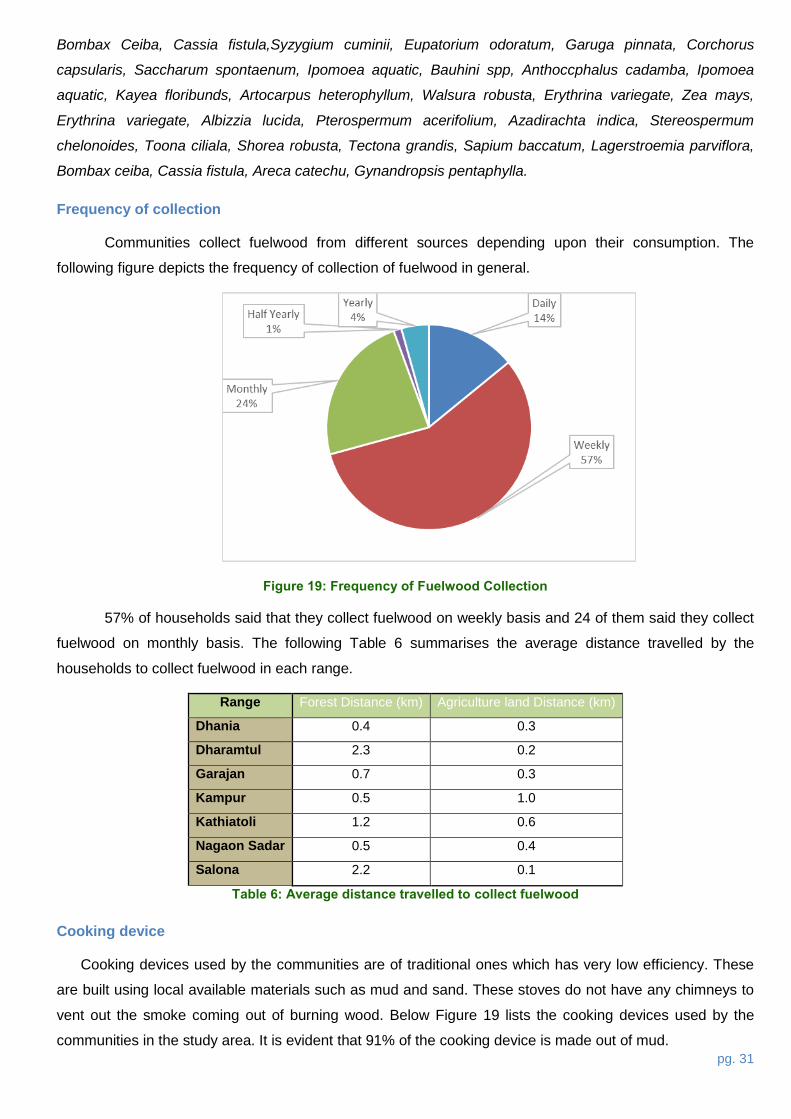
Frequency of collection
Communities collect fuelwood from different sources depending upon their consumption. The
following figure depicts the frequency of collection of fuelwood in general.
Figure 19: Frequency of Fuelwood Collection
57% of households said that they collect fuelwood on weekly basis and 24 of them said they collect
fuelwood on monthly basis. The following Table 6 summarises the average distance travelled by the
households to collect fuelwood in each range.
Range Forest Distance (km) Agriculture land Distance (km)
Dhania 0.4 0.3
Dharamtul 2.3 0.2
Garajan 0.7 0.3
Kampur 0.5 1.0
Kathiatoli 1.2 0.6
Nagaon Sadar 0.5 0.4
Salona 2.2 0.1
Table 6: Average distance travelled to collect fuelwood
Cooking device
Cooking devices used by the communities are of traditional ones which has very low efficiency. These
are built using local available materials such as mud and sand. These stoves do not have any chimneys to
vent out the smoke coming out of burning wood. Below Figure 19 lists the cooking devices used by the
communities in the study area. It is evident that 91% of the cooking device is made out of mud.
Socio-Economic report of Nagaon Forest Division
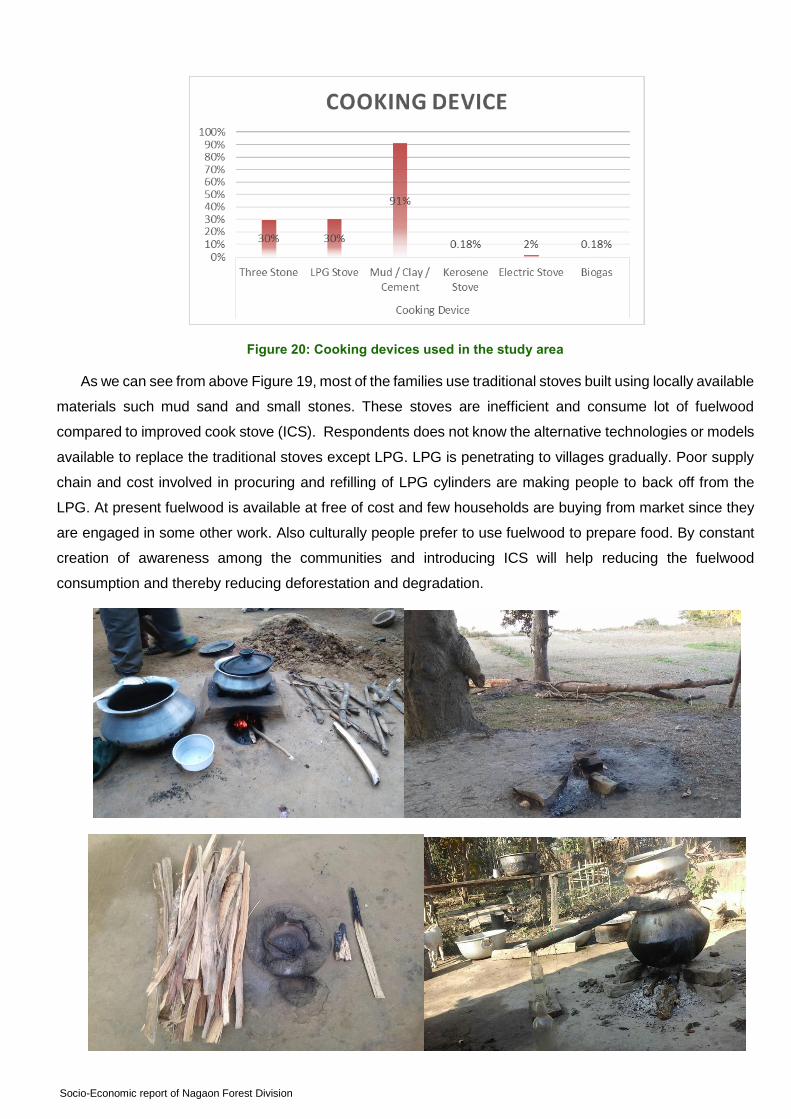
Figure 20: Cooking devices used in the study area
As we can see from above Figure 19, most of the families use traditional stoves built using locally available
materials such mud sand and small stones. These stoves are inefficient and consume lot of fuelwood
compared to improved cook stove (ICS). Respondents does not know the alternative technologies or models
available to replace the traditional stoves except LPG. LPG is penetrating to villages gradually. Poor supply
chain and cost involved in procuring and refilling of LPG cylinders are making people to back off from the
LPG. At present fuelwood is available at free of cost and few households are buying from market since they
are engaged in some other work. Also culturally people prefer to use fuelwood to prepare food. By constant
creation of awareness among the communities and introducing ICS will help reducing the fuelwood
consumption and thereby reducing deforestation and degradation.
pg. 33
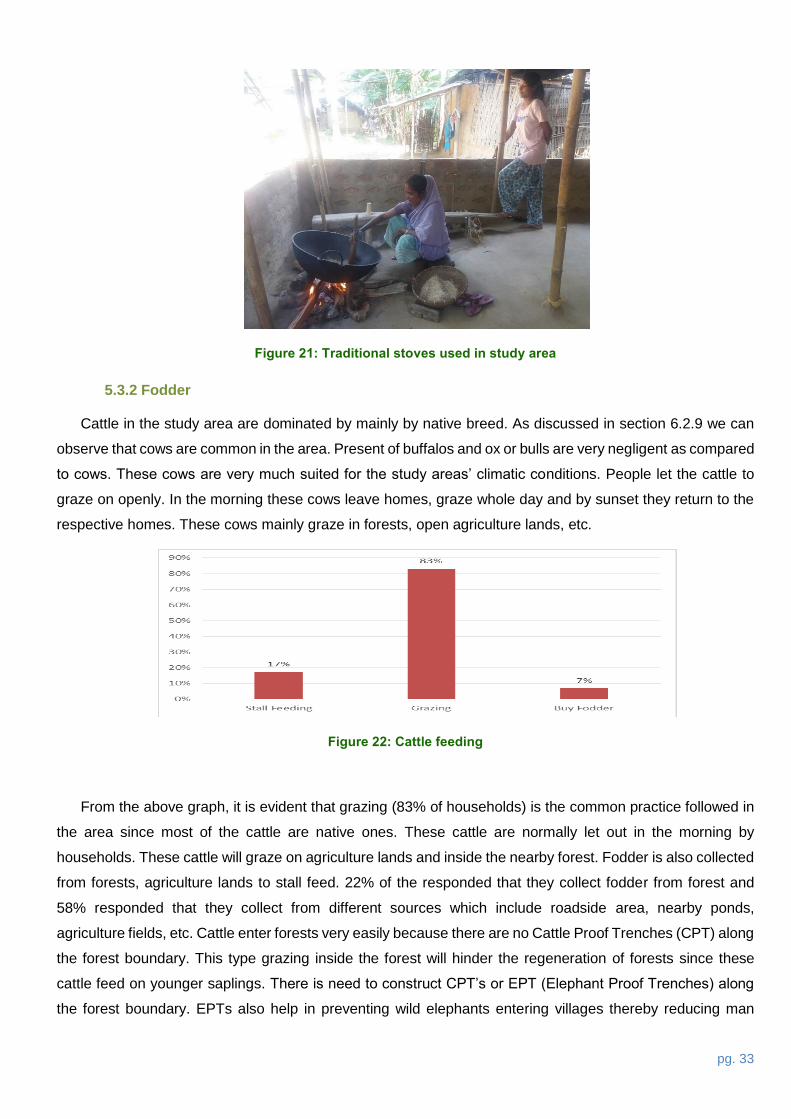
Figure 21: Traditional stoves used in study area
5.3.2 Fodder
Cattle in the study area are dominated by mainly by native breed. As discussed in section 6.2.9 we can
observe that cows are common in the area. Present of buffalos and ox or bulls are very negligent as compared
to cows. These cows are very much suited for the study areas’ climatic conditions. People let the cattle to
graze on openly. In the morning these cows leave homes, graze whole day and by sunset they return to the
respective homes. These cows mainly graze in forests, open agriculture lands, etc.
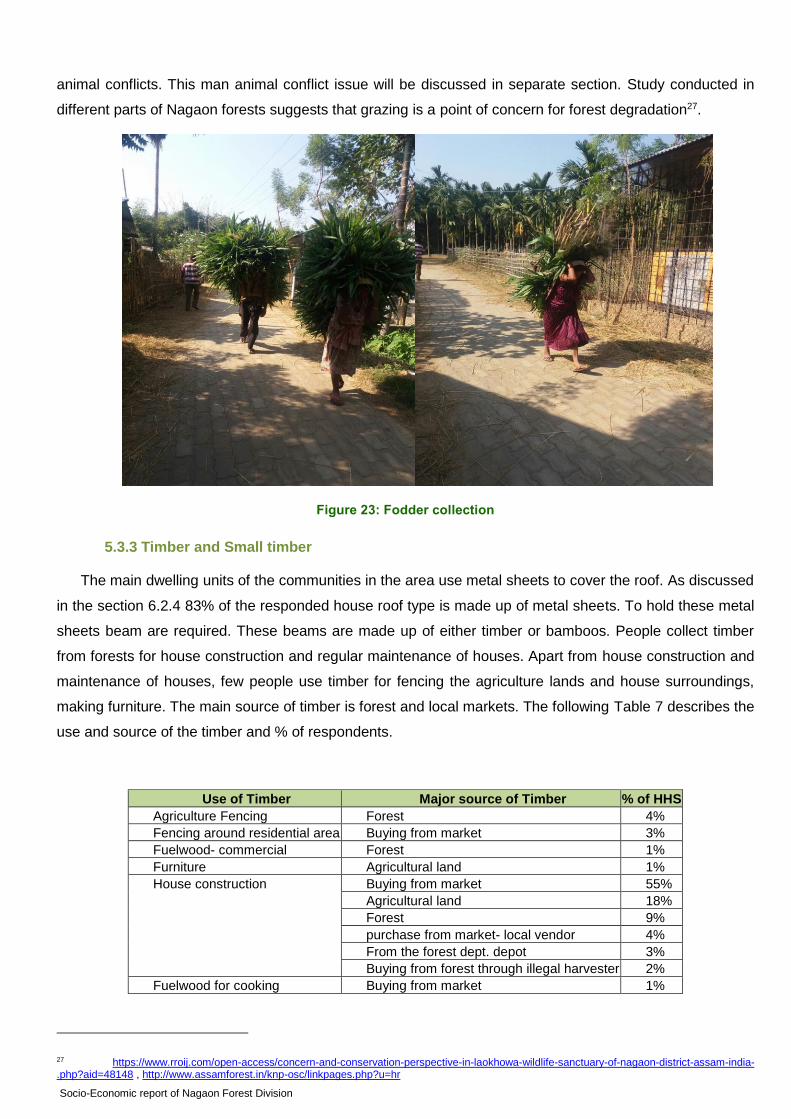
Figure 22: Cattle feeding
From the above graph, it is evident that grazing (83% of households) is the common practice followed in
the area since most of the cattle are native ones. These cattle are normally let out in the morning by
households. These cattle will graze on agriculture lands and inside the nearby forest. Fodder is also collected
from forests, agriculture lands to stall feed. 22% of the responded that they collect fodder from forest and
58% responded that they collect from different sources which include roadside area, nearby ponds,
agriculture fields, etc. Cattle enter forests very easily because there are no Cattle Proof Trenches (CPT) along
the forest boundary. This type grazing inside the forest will hinder the regeneration of forests since these
cattle feed on younger saplings. There is need to construct CPT’s or EPT (Elephant Proof Trenches) along
the forest boundary. EPTs also help in preventing wild elephants entering villages thereby reducing man
Socio-Economic report of Nagaon Forest Division
animal conflicts. This man animal conflict issue will be discussed in separate section. Study conducted in
different parts of Nagaon forests suggests that grazing is a point of concern for forest degradation27.
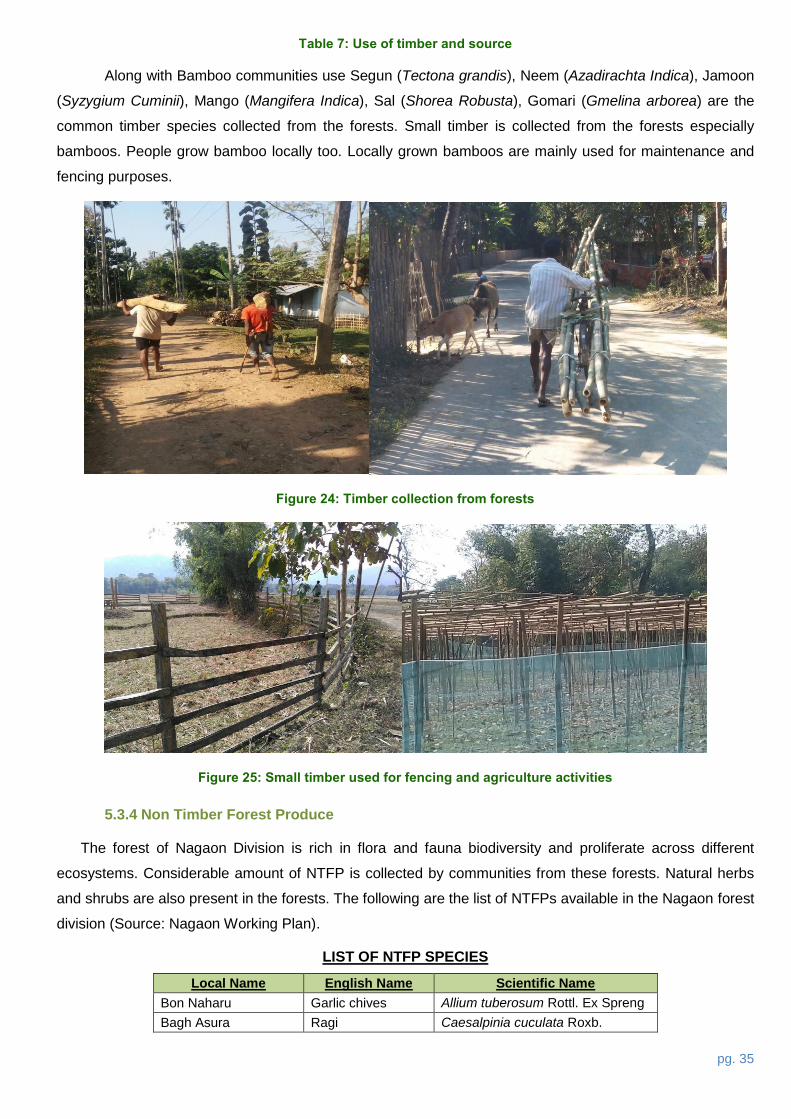
Figure 23: Fodder collection
5.3.3 Timber and Small timber
The main dwelling units of the communities in the area use metal sheets to cover the roof. As discussed
in the section 6.2.4 83% of the responded house roof type is made up of metal sheets. To hold these metal
sheets beam are required. These beams are made up of either timber or bamboos. People collect timber
from forests for house construction and regular maintenance of houses. Apart from house construction and
maintenance of houses, few people use timber for fencing the agriculture lands and house surroundings,
making furniture. The main source of timber is forest and local markets. The following Table 7 describes the
use and source of the timber and % of respondents.
Use of Timber Major source of Timber % of HHS
Agriculture Fencing Forest 4%
Fencing around residential area Buying from market 3%
Fuelwood- commercial Forest 1%
Furniture Agricultural land 1%
House construction
Buying from market 55%
Agricultural land 18%
Forest 9%
purchase from market- local vendor 4%
From the forest dept. depot 3%
Buying from forest through illegal harvester 2%
Fuelwood for cooking Buying from market 1%
27 https://www.rroij.com/open-access/concern-and-conservation-perspective-in-laokhowa-wildlife-sanctuary-of-nagaon-district-assam-india-.php?aid=48148 , http://www.assamforest.in/knp-osc/linkpages.php?u=hr
pg. 35
Table 7: Use of timber and source
Along with Bamboo communities use Segun (Tectona grandis), Neem (Azadirachta Indica), Jamoon
(Syzygium Cuminii), Mango (Mangifera Indica), Sal (Shorea Robusta), Gomari (Gmelina arborea) are the
common timber species collected from the forests. Small timber is collected from the forests especially
bamboos. People grow bamboo locally too. Locally grown bamboos are mainly used for maintenance and
fencing purposes.
Figure 24: Timber collection from forests
Figure 25: Small timber used for fencing and agriculture activities
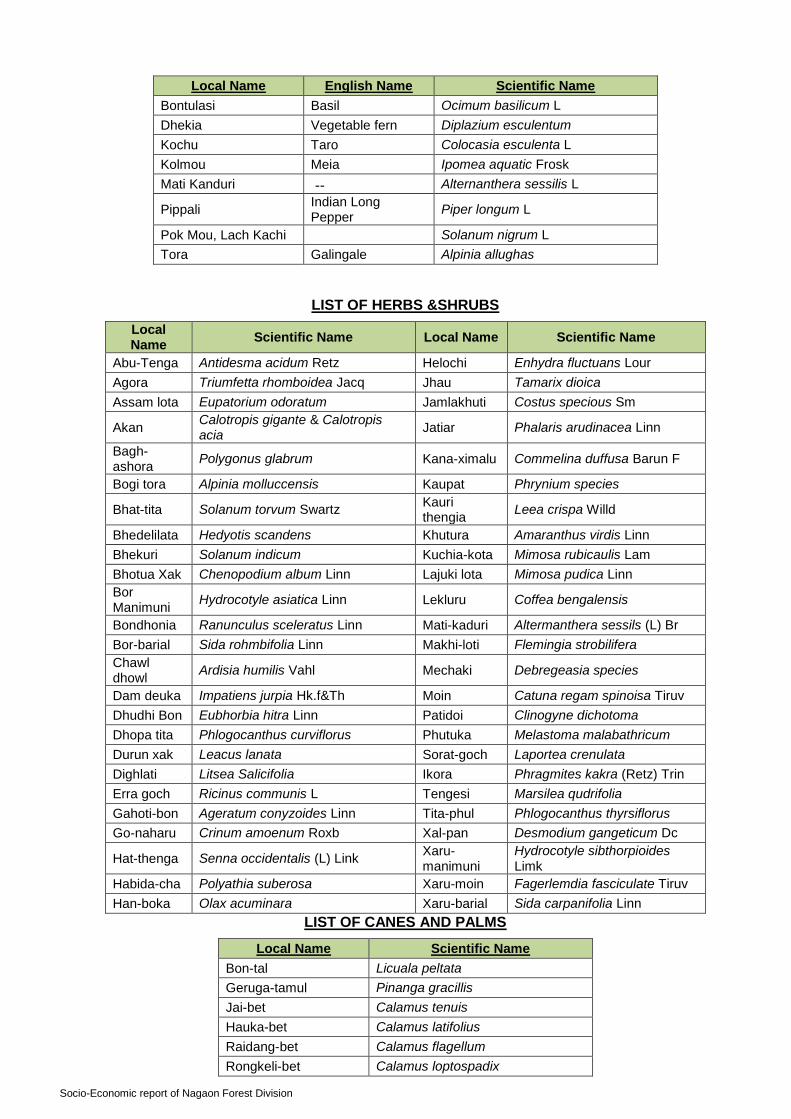
5.3.4 Non Timber Forest Produce
The forest of Nagaon Division is rich in flora and fauna biodiversity and proliferate across different
ecosystems. Considerable amount of NTFP is collected by communities from these forests. Natural herbs
and shrubs are also present in the forests. The following are the list of NTFPs available in the Nagaon forest
division (Source: Nagaon Working Plan).
LIST OF NTFP SPECIES
Local Name English Name Scientific Name
Bon Naharu Garlic chives Allium tuberosum Rottl. Ex Spreng
Bagh Asura Ragi Caesalpinia cuculata Roxb.
Socio-Economic report of Nagaon Forest Division
Local Name English Name Scientific Name
Bontulasi Basil Ocimum basilicum L
Dhekia Vegetable fern Diplazium esculentum
Kochu Taro Colocasia esculenta L
Kolmou Meia Ipomea aquatic Frosk
Mati Kanduri -- Alternanthera sessilis L
Pippali Indian Long Pepper
Piper longum L
Pok Mou, Lach Kachi Solanum nigrum L
Tora Galingale Alpinia allughas
LIST OF HERBS &SHRUBS
Local Name
Scientific Name Local Name Scientific Name
Abu-Tenga Antidesma acidum Retz Helochi Enhydra fluctuans Lour
Agora Triumfetta rhomboidea Jacq Jhau Tamarix dioica
Assam lota Eupatorium odoratum Jamlakhuti Costus specious Sm
Akan Calotropis gigante & Calotropis acia
Jatiar Phalaris arudinacea Linn
Bagh-ashora
Polygonus glabrum Kana-ximalu Commelina duffusa Barun F
Bogi tora Alpinia molluccensis Kaupat Phrynium species
Bhat-tita Solanum torvum Swartz Kauri thengia
Leea crispa Willd
Bhedelilata Hedyotis scandens Khutura Amaranthus virdis Linn
Bhekuri Solanum indicum Kuchia-kota Mimosa rubicaulis Lam
Bhotua Xak Chenopodium album Linn Lajuki lota Mimosa pudica Linn
Bor Manimuni
Hydrocotyle asiatica Linn Lekluru Coffea bengalensis
Bondhonia Ranunculus sceleratus Linn Mati-kaduri Altermanthera sessils (L) Br
Bor-barial Sida rohmbifolia Linn Makhi-loti Flemingia strobilifera
Chawl dhowl
Ardisia humilis Vahl Mechaki Debregeasia species
Dam deuka Impatiens jurpia Hk.f&Th Moin Catuna regam spinoisa Tiruv
Dhudhi Bon Eubhorbia hitra Linn Patidoi Clinogyne dichotoma
Dhopa tita Phlogocanthus curviflorus Phutuka Melastoma malabathricum
Durun xak Leacus lanata Sorat-goch Laportea crenulata
Dighlati Litsea Salicifolia Ikora Phragmites kakra (Retz) Trin
Erra goch Ricinus communis L Tengesi Marsilea qudrifolia
Gahoti-bon Ageratum conyzoides Linn Tita-phul Phlogocanthus thyrsiflorus
Go-naharu Crinum amoenum Roxb Xal-pan Desmodium gangeticum Dc
Hat-thenga Senna occidentalis (L) Link Xaru-manimuni
Hydrocotyle sibthorpioides Limk
Habida-cha Polyathia suberosa Xaru-moin Fagerlemdia fasciculate Tiruv
Han-boka Olax acuminara Xaru-barial Sida carpanifolia Linn
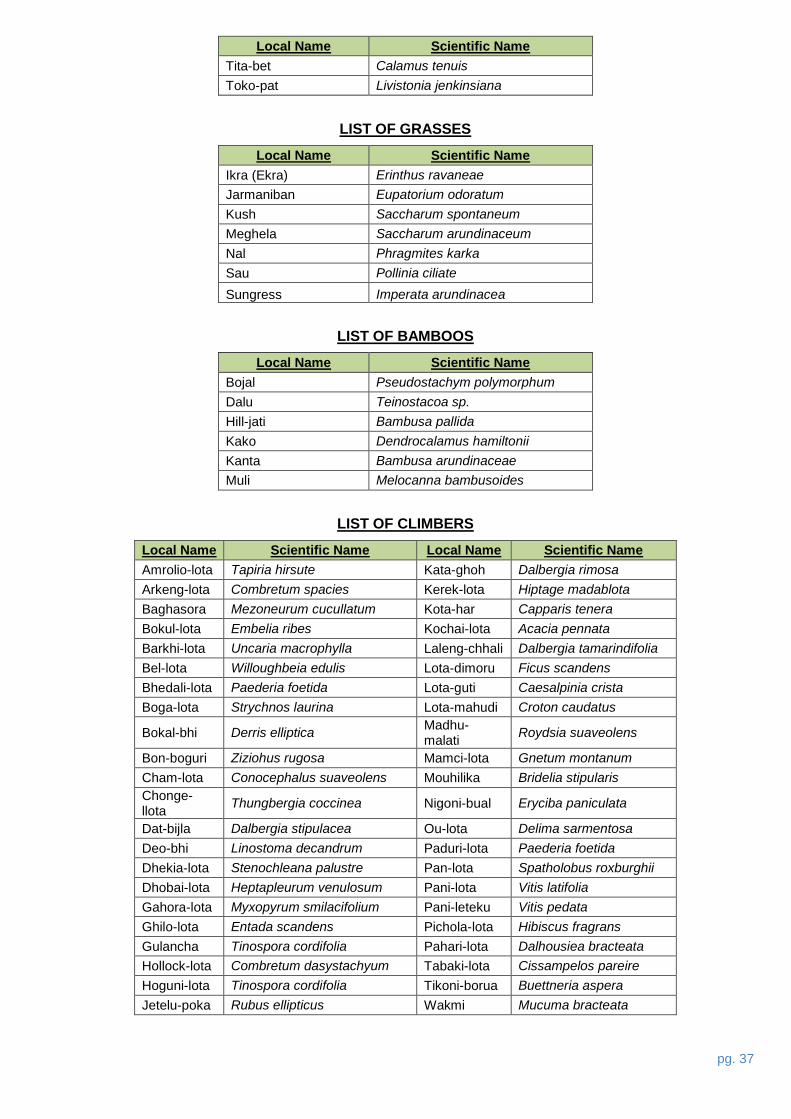
LIST OF CANES AND PALMS
Local Name Scientific Name
Bon-tal Licuala peltata
Geruga-tamul Pinanga gracillis
Jai-bet Calamus tenuis
Hauka-bet Calamus latifolius
Raidang-bet Calamus flagellum
Rongkeli-bet Calamus loptospadix
pg. 37
Local Name Scientific Name
Tita-bet Calamus tenuis
Toko-pat Livistonia jenkinsiana
LIST OF GRASSES
Local Name Scientific Name
Ikra (Ekra) Erinthus ravaneae
Jarmaniban Eupatorium odoratum
Kush Saccharum spontaneum
Meghela Saccharum arundinaceum
Nal Phragmites karka
Sau Pollinia ciliate
Sungress Imperata arundinacea
LIST OF BAMBOOS
Local Name Scientific Name
Bojal Pseudostachym polymorphum
Dalu Teinostacoa sp.
Hill-jati Bambusa pallida
Kako Dendrocalamus hamiltonii
Kanta Bambusa arundinaceae
Muli Melocanna bambusoides
LIST OF CLIMBERS
Local Name Scientific Name Local Name Scientific Name
Amrolio-lota Tapiria hirsute Kata-ghoh Dalbergia rimosa
Arkeng-lota Combretum spacies Kerek-lota Hiptage madablota
Baghasora Mezoneurum cucullatum Kota-har Capparis tenera
Bokul-lota Embelia ribes Kochai-lota Acacia pennata
Barkhi-lota Uncaria macrophylla Laleng-chhali Dalbergia tamarindifolia
Bel-lota Willoughbeia edulis Lota-dimoru Ficus scandens
Bhedali-lota Paederia foetida Lota-guti Caesalpinia crista
Boga-lota Strychnos laurina Lota-mahudi Croton caudatus
Bokal-bhi Derris elliptica Madhu-malati
Roydsia suaveolens
Bon-boguri Ziziohus rugosa Mamci-lota Gnetum montanum
Cham-lota Conocephalus suaveolens Mouhilika Bridelia stipularis
Chonge-llota
Thungbergia coccinea Nigoni-bual Eryciba paniculata
Dat-bijla Dalbergia stipulacea Ou-lota Delima sarmentosa
Deo-bhi Linostoma decandrum Paduri-lota Paederia foetida
Dhekia-lota Stenochleana palustre Pan-lota Spatholobus roxburghii
Dhobai-lota Heptapleurum venulosum Pani-lota Vitis latifolia
Gahora-lota Myxopyrum smilacifolium Pani-leteku Vitis pedata
Ghilo-lota Entada scandens Pichola-lota Hibiscus fragrans
Gulancha Tinospora cordifolia Pahari-lota Dalhousiea bracteata
Hollock-lota Combretum dasystachyum Tabaki-lota Cissampelos pareire
Hoguni-lota Tinospora cordifolia Tikoni-borua Buettneria aspera
Jetelu-poka Rubus ellipticus Wakmi Mucuma bracteata
Socio-Economic report of Nagaon Forest Division
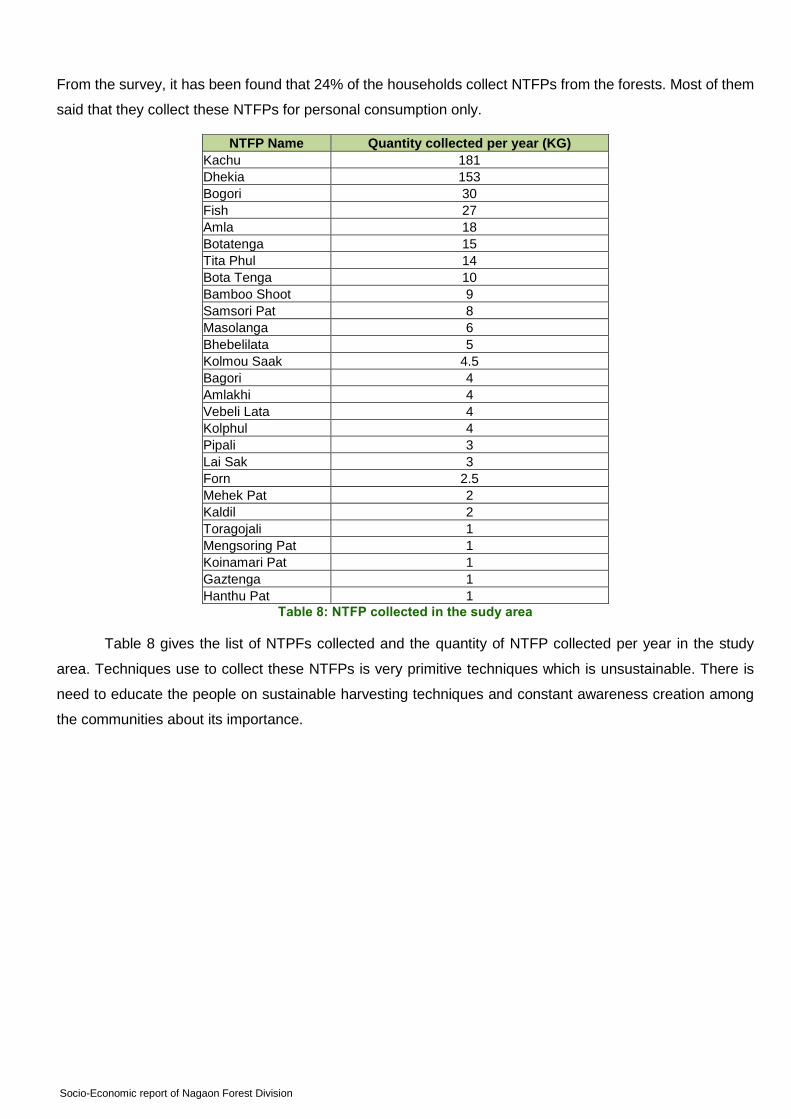
From the survey, it has been found that 24% of the households collect NTFPs from the forests. Most of them
said that they collect these NTFPs for personal consumption only.
NTFP Name Quantity collected per year (KG)
Kachu 181
Dhekia 153
Bogori 30
Fish 27
Amla 18
Botatenga 15
Tita Phul 14
Bota Tenga 10
Bamboo Shoot 9
Samsori Pat 8
Masolanga 6
Bhebelilata 5
Kolmou Saak 4.5
Bagori 4
Amlakhi 4
Vebeli Lata 4
Kolphul 4
Pipali 3
Lai Sak 3
Forn 2.5
Mehek Pat 2
Kaldil 2
Toragojali 1
Mengsoring Pat 1
Koinamari Pat 1
Gaztenga 1
Hanthu Pat 1
Table 8: NTFP collected in the sudy area
Table 8 gives the list of NTPFs collected and the quantity of NTFP collected per year in the study
area. Techniques use to collect these NTFPs is very primitive techniques which is unsustainable. There is
need to educate the people on sustainable harvesting techniques and constant awareness creation among
the communities about its importance.
pg. 39
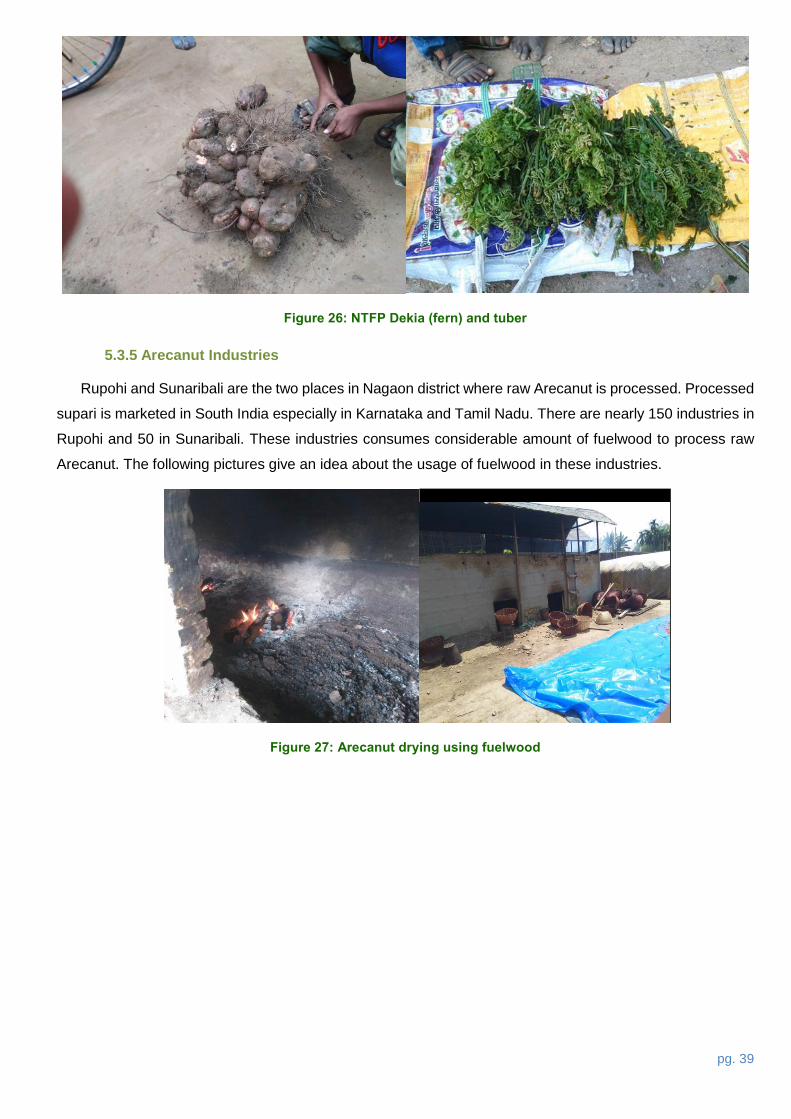
Figure 26: NTFP Dekia (fern) and tuber
5.3.5 Arecanut Industries
Rupohi and Sunaribali are the two places in Nagaon district where raw Arecanut is processed. Processed
supari is marketed in South India especially in Karnataka and Tamil Nadu. There are nearly 150 industries in
Rupohi and 50 in Sunaribali. These industries consumes considerable amount of fuelwood to process raw
Arecanut. The following pictures give an idea about the usage of fuelwood in these industries.
Figure 27: Arecanut drying using fuelwood
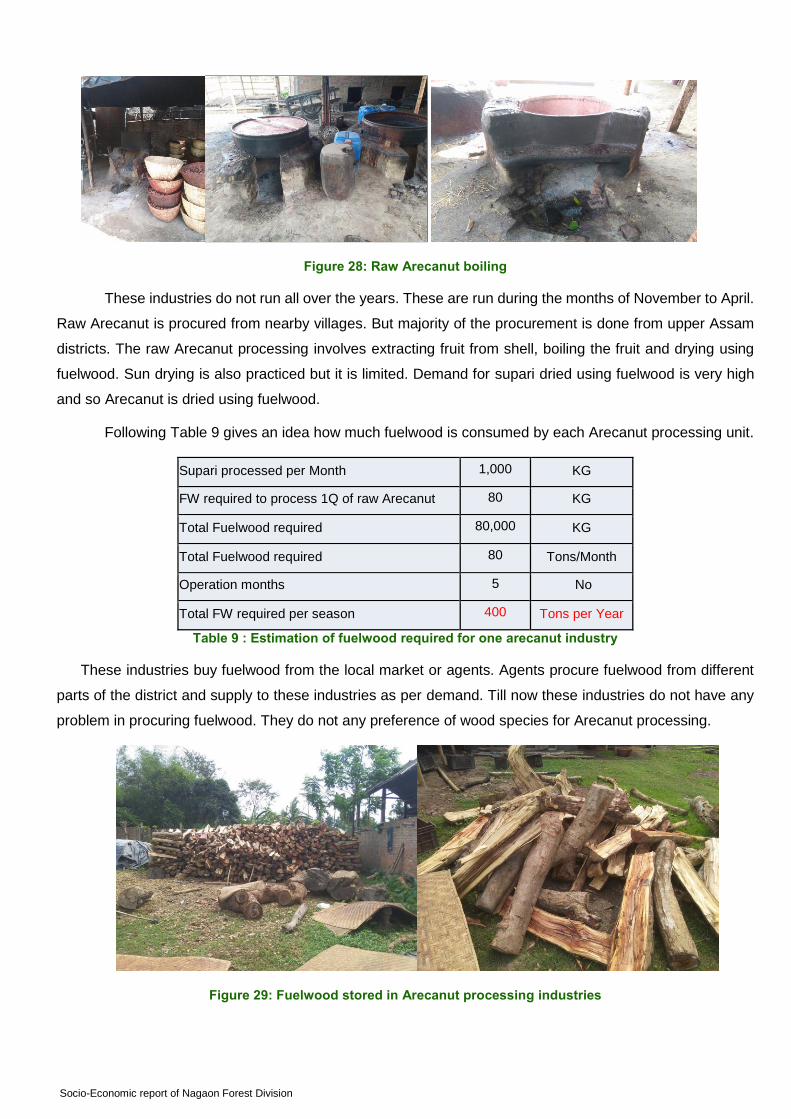
Socio-Economic report of Nagaon Forest Division
Figure 28: Raw Arecanut boiling
These industries do not run all over the years. These are run during the months of November to April.
Raw Arecanut is procured from nearby villages. But majority of the procurement is done from upper Assam
districts. The raw Arecanut processing involves extracting fruit from shell, boiling the fruit and drying using
fuelwood. Sun drying is also practiced but it is limited. Demand for supari dried using fuelwood is very high
and so Arecanut is dried using fuelwood.
Following Table 9 gives an idea how much fuelwood is consumed by each Arecanut processing unit.
Supari processed per Month 1,000 KG
FW required to process 1Q of raw Arecanut 80 KG
Total Fuelwood required 80,000 KG
Total Fuelwood required 80 Tons/Month
Operation months 5 No
Total FW required per season 400 Tons per Year
Table 9 : Estimation of fuelwood required for one arecanut industry
These industries buy fuelwood from the local market or agents. Agents procure fuelwood from different
parts of the district and supply to these industries as per demand. Till now these industries do not have any
problem in procuring fuelwood. They do not any preference of wood species for Arecanut processing.
Figure 29: Fuelwood stored in Arecanut processing industries
pg. 41
Supari or Arecanut industry owners do not aware of the better technologies to process Arecanut. So it is
very essential and important to educate these people about the consequences of using fuelwood at this rate
and ask them to move towards implementing sustainable technologies such as dryers, improved boilers, etc.
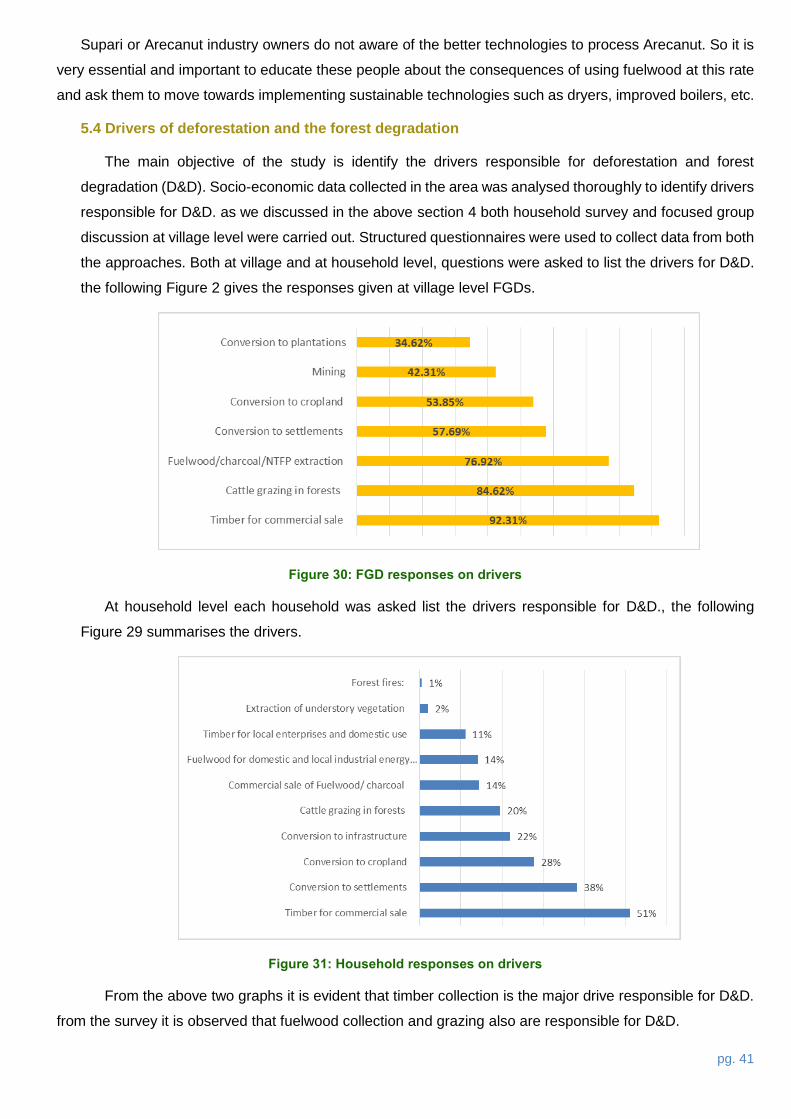
5.4 Drivers of deforestation and the forest degradation
The main objective of the study is identify the drivers responsible for deforestation and forest
degradation (D&D). Socio-economic data collected in the area was analysed thoroughly to identify drivers
responsible for D&D. as we discussed in the above section 4 both household survey and focused group
discussion at village level were carried out. Structured questionnaires were used to collect data from both
the approaches. Both at village and at household level, questions were asked to list the drivers for D&D.
the following Figure 2 gives the responses given at village level FGDs.
Figure 30: FGD responses on drivers
At household level each household was asked list the drivers responsible for D&D., the following
Figure 29 summarises the drivers.
Figure 31: Household responses on drivers
From the above two graphs it is evident that timber collection is the major drive responsible for D&D.
from the survey it is observed that fuelwood collection and grazing also are responsible for D&D.
Socio-Economic report of Nagaon Forest Division
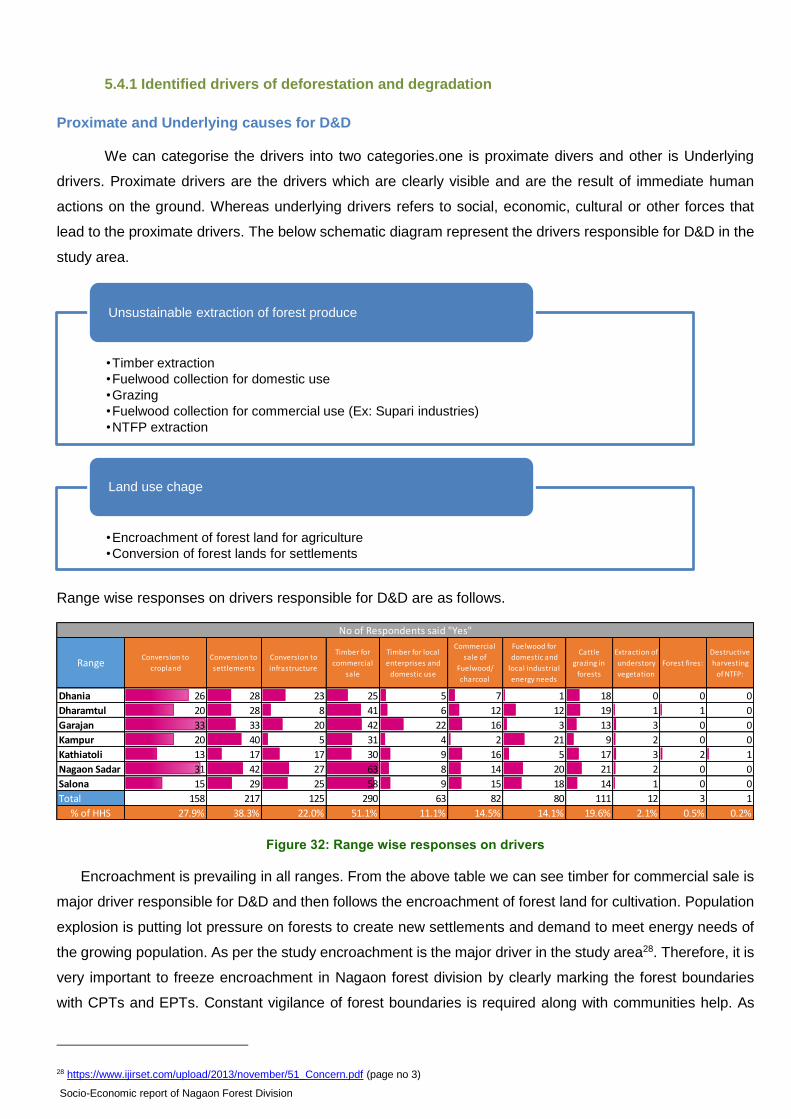
5.4.1 Identified drivers of deforestation and degradation
Proximate and Underlying causes for D&D
We can categorise the drivers into two categories.one is proximate divers and other is Underlying
drivers. Proximate drivers are the drivers which are clearly visible and are the result of immediate human
actions on the ground. Whereas underlying drivers refers to social, economic, cultural or other forces that
lead to the proximate drivers. The below schematic diagram represent the drivers responsible for D&D in the
study area.
Range wise responses on drivers responsible for D&D are as follows.
Figure 32: Range wise responses on drivers
Encroachment is prevailing in all ranges. From the above table we can see timber for commercial sale is
major driver responsible for D&D and then follows the encroachment of forest land for cultivation. Population
explosion is putting lot pressure on forests to create new settlements and demand to meet energy needs of
the growing population. As per the study encroachment is the major driver in the study area28. Therefore, it is
very important to freeze encroachment in Nagaon forest division by clearly marking the forest boundaries
with CPTs and EPTs. Constant vigilance of forest boundaries is required along with communities help. As
28 https://www.ijirset.com/upload/2013/november/51_Concern.pdf (page no 3)
•Timber extraction
•Fuelwood collection for domestic use
•Grazing
•Fuelwood collection for commercial use (Ex: Supari industries)
•NTFP extraction
Unsustainable extraction of forest produce
•Encroachment of forest land for agriculture
•Conversion of forest lands for settlements
Land use chage
RangeConversion to
cropland
Conversion to
settlements
Conversion to
infrastructure
Timber for
commercial
sale
Timber for local
enterprises and
domestic use
Commercial
sale of
Fuelwood/
charcoal
Fuelwood for
domestic and
local industrial
energy needs
Cattle
grazing in
forests
Extraction of
understory
vegetation
Forest fires:
Destructive
harvesting
of NTFP:
Dhania 26 28 23 25 5 7 1 18 0 0 0
Dharamtul 20 28 8 41 6 12 12 19 1 1 0
Garajan 33 33 20 42 22 16 3 13 3 0 0
Kampur 20 40 5 31 4 2 21 9 2 0 0
Kathiatoli 13 17 17 30 9 16 5 17 3 2 1
Nagaon Sadar 31 42 27 63 8 14 20 21 2 0 0
Salona 15 29 25 58 9 15 18 14 1 0 0
Total 158 217 125 290 63 82 80 111 12 3 1
% of HHS 27.9% 38.3% 22.0% 51.1% 11.1% 14.5% 14.1% 19.6% 2.1% 0.5% 0.2%
No of Respondents said "Yes"
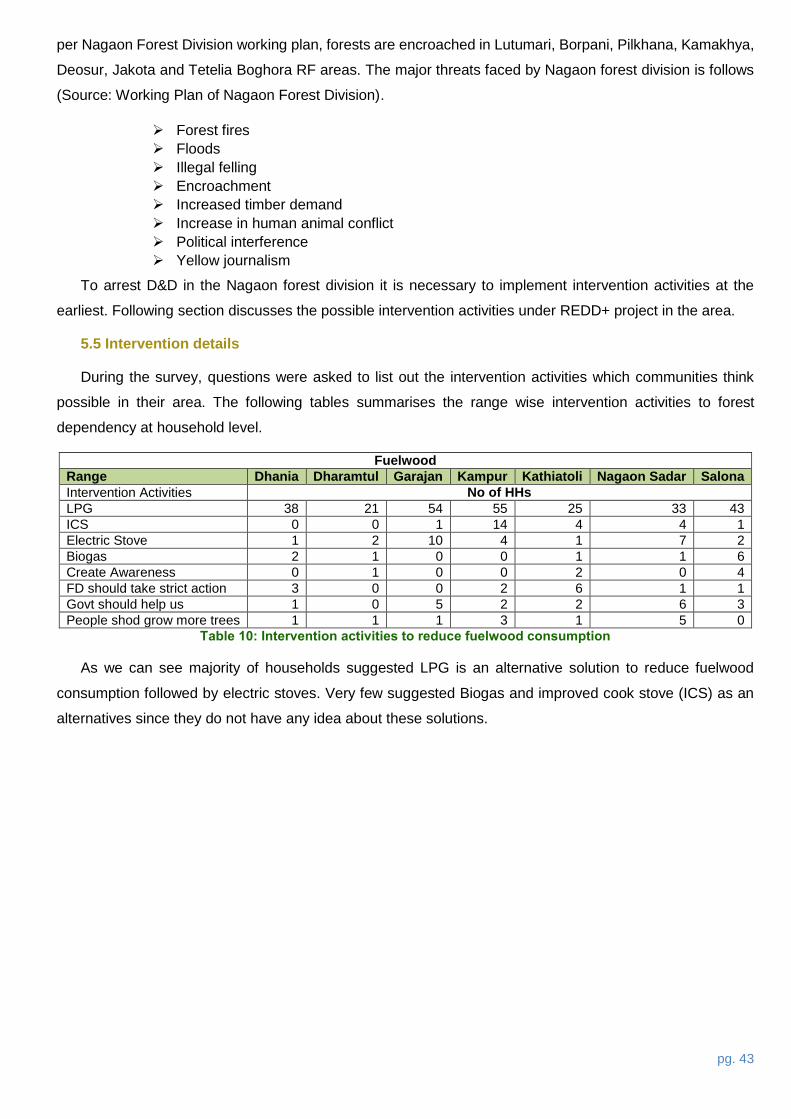
pg. 43
per Nagaon Forest Division working plan, forests are encroached in Lutumari, Borpani, Pilkhana, Kamakhya,
Deosur, Jakota and Tetelia Boghora RF areas. The major threats faced by Nagaon forest division is follows
(Source: Working Plan of Nagaon Forest Division).
Forest fires
Floods
Illegal felling
Encroachment
Increased timber demand
Increase in human animal conflict
Political interference
Yellow journalism
To arrest D&D in the Nagaon forest division it is necessary to implement intervention activities at the
earliest. Following section discusses the possible intervention activities under REDD+ project in the area.
5.5 Intervention details
During the survey, questions were asked to list out the intervention activities which communities think
possible in their area. The following tables summarises the range wise intervention activities to forest
dependency at household level.
Fuelwood
Range Dhania Dharamtul Garajan Kampur Kathiatoli Nagaon Sadar Salona
Intervention Activities No of HHs
LPG 38 21 54 55 25 33 43
ICS 0 0 1 14 4 4 1
Electric Stove 1 2 10 4 1 7 2
Biogas 2 1 0 0 1 1 6
Create Awareness 0 1 0 0 2 0 4
FD should take strict action 3 0 0 2 6 1 1
Govt should help us 1 0 5 2 2 6 3
People shod grow more trees 1 1 1 3 1 5 0
Table 10: Intervention activities to reduce fuelwood consumption
As we can see majority of households suggested LPG is an alternative solution to reduce fuelwood
consumption followed by electric stoves. Very few suggested Biogas and improved cook stove (ICS) as an
alternatives since they do not have any idea about these solutions.
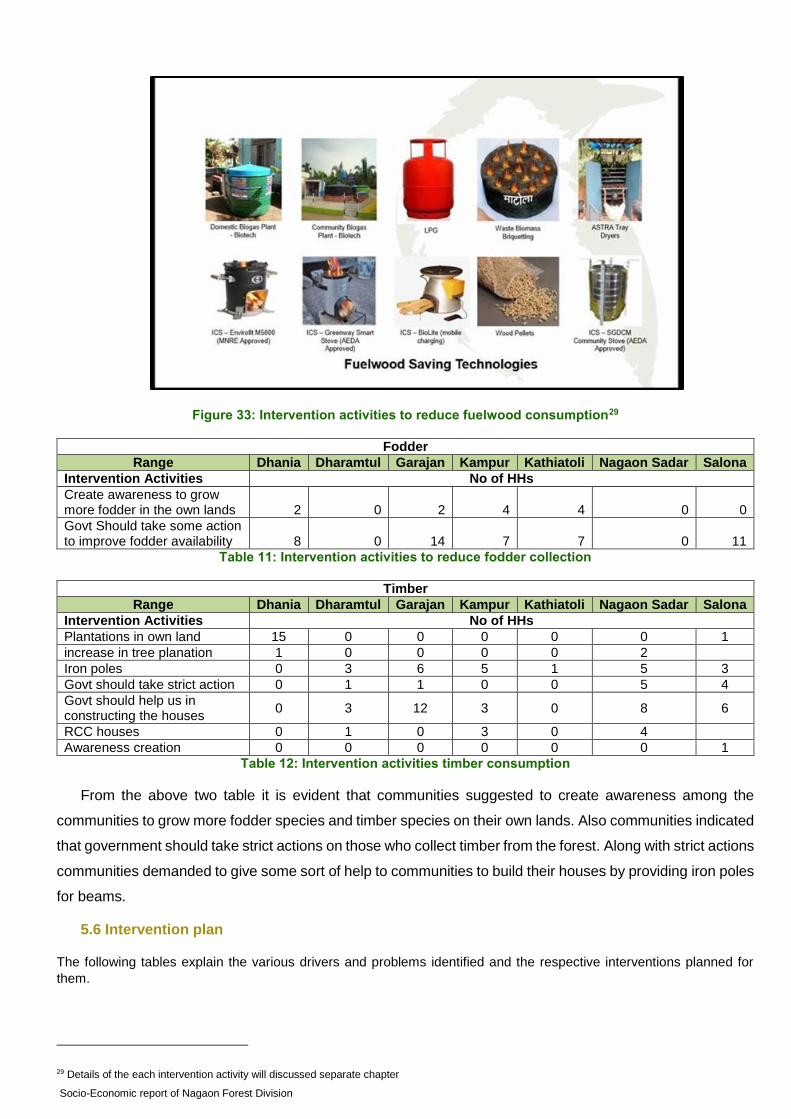
Socio-Economic report of Nagaon Forest Division
Figure 33: Intervention activities to reduce fuelwood consumption29
Fodder
Range Dhania Dharamtul Garajan Kampur Kathiatoli Nagaon Sadar Salona
Intervention Activities No of HHs
Create awareness to grow more fodder in the own lands 2 0 2 4 4 0 0
Govt Should take some action to improve fodder availability 8 0 14 7 7 0 11
Table 11: Intervention activities to reduce fodder collection
Timber
Range Dhania Dharamtul Garajan Kampur Kathiatoli Nagaon Sadar Salona
Intervention Activities No of HHs
Plantations in own land 15 0 0 0 0 0 1
increase in tree planation 1 0 0 0 0 2
Iron poles 0 3 6 5 1 5 3
Govt should take strict action 0 1 1 0 0 5 4
Govt should help us in constructing the houses
0 3 12 3 0 8 6
RCC houses 0 1 0 3 0 4
Awareness creation 0 0 0 0 0 0 1
Table 12: Intervention activities timber consumption
From the above two table it is evident that communities suggested to create awareness among the
communities to grow more fodder species and timber species on their own lands. Also communities indicated
that government should take strict actions on those who collect timber from the forest. Along with strict actions
communities demanded to give some sort of help to communities to build their houses by providing iron poles
for beams.
5.6 Intervention plan
The following tables explain the various drivers and problems identified and the respective interventions planned for
them.
29 Details of the each intervention activity will discussed separate chapter
pg. 45
S. No. Name of Intervention Drivers Addressed
1 Alternative energy cooking system in households (ICS, LPG, biogas)
Unsustainable fuelwood extraction from forests for cooking and heating purposes
2 Efficient fuelwood-based driers for arecanut processing in arecanut industries in Nagaon
3 Efficient fuelwood-based boilers for Arecanut boiling in Arecanut industries in Nagaon
4 Retrofitting existing brick kilns / Introducing new brick manufacturing technologies, for fuel efficient brickmaking
5 Smokeless Biomass briquettes as a fuelwood substitute
6 Smart patrolling to check unplanned extraction of forest resources and unplanned mining within forest land
Encroachment, unplanned felling
7 Construction of CPTs and EPTs for better defined boundaries to reduce encroachments
Grazing, illegal transport of forest produce, encroachment
8 Bio-fencing to reduce encroachment, illegal felling and man-animal conflicts
Encroachment, unsustainable fuelwood and NTFP extraction, man-animal conflicts
9 Plantation activities: 1) Afforestation and Reforestation in non-forest lands for tree cover. 2) Assisted Natural Regeneration in forests to stop degradation
Unsustainable extraction of fuelwood
10 Promoting agro-forestry in large scale in non-forest lands
Unsustainable extraction of fuelwood and timber
11 Cultivation of medicinal plants as a measure of alternative livelihood and income enhancement
Over-dependence on forest resources
12 Sustainable grazing and livestock management 1) Silvi-pastoral and Horti-pastoral models 2) Fodder densification and stall feeding 3) Vaccination of livestock
Unsustainable fuelwood extraction from forests and overgrazing in forest lands
Table 13: List of interventions planned for Nagaon under the LEEF project
5.7 Intervention Matrix
Alternative Energy for Households
Name of the Intervention
Alternative energy cooking system in households (ICS, LPG, biogas)
Code FW-ICSLPG-HH
Description of the problem
Extraction of fuelwood is the major driver in the Nagaon forest division. 96% of the surveyed households use fuelwood for cooking and water heating purposes. 25% households use LPG, but only for hospitality purposes like preparing tea and coffee. An average of 3.22 tons of fuelwood is required per family per year. According to 2011 census, 81.37%30 of the rural households of Nagaon district predominantly use firewood for cooking. 57% of the households said they collect fuelwood on a weekly basis. Rural LPG penetration is less than 10%26. So fuelwood is the main energy source available for the communities.
Description of the solution
Deployment of a mix of alternative energy solutions for rural households to regulate fuelwood requirements and ease pressures on forests for fuelwood. This mix would involve provision of ICS, biogas plants and solar cookers tailored towards specific requirements of each Range in Nagaon District. These measures are backed up by government commitments towards clean energy deployment in rural households across India. Under the Union Budget 2016-17, there are plans to extend cleaner energy solutions to 5 crore families in India over the next 3 years, with further plans to development induction cook stoves as well into this basket to enable cleaner cooking. Electric cook plates can also make use of solar power in remote rural areas of Assam, where LPG penetration may be low and solar energy be easier to provide31. In addition, biogas is a proven alternative renewable clean energy technology that can play a huge role in decreasing fuelwood demand. Biogas is a clean and renewable energy
30 http://www.censusindia.gov.in/2011census/dchb/1806_PART_B_DCHB_NAGAON.pdf (page no 341 and 342) 31 Panagariya, A., and Jain, A.K. (2016); Electricity and Clean Cooking Strategy for India; NITI Aayog, Government of India.
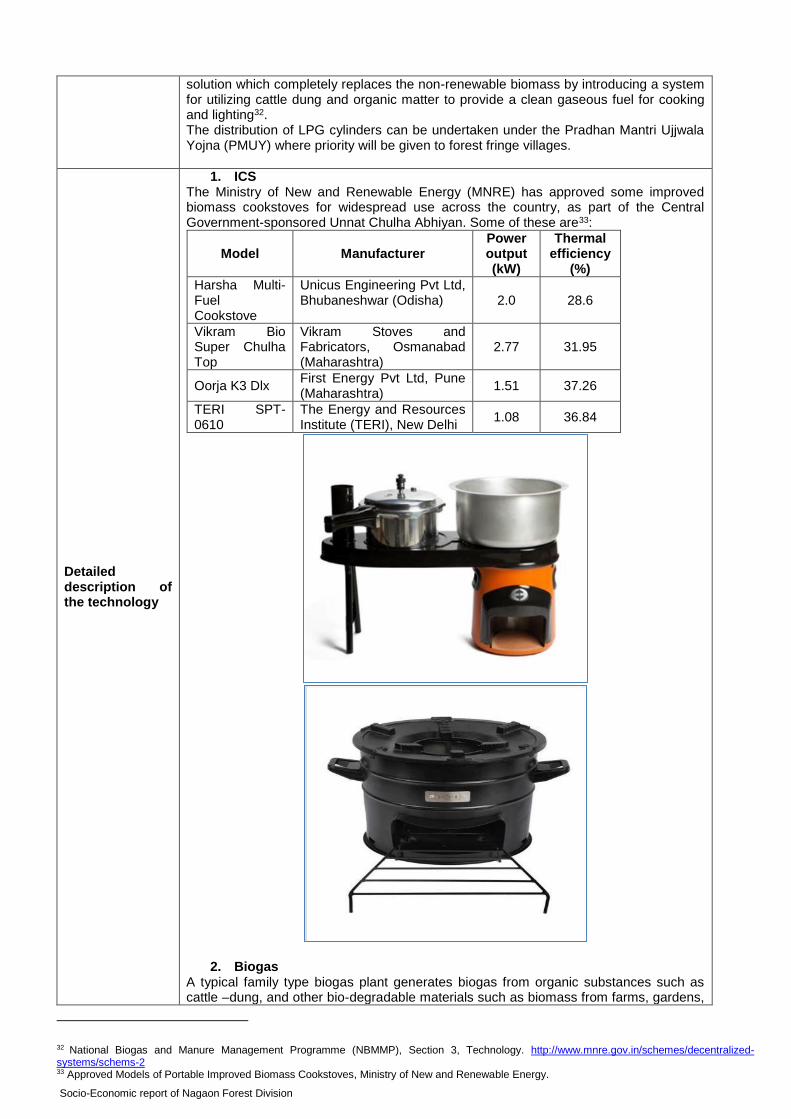
Socio-Economic report of Nagaon Forest Division
solution which completely replaces the non-renewable biomass by introducing a system for utilizing cattle dung and organic matter to provide a clean gaseous fuel for cooking and lighting32. The distribution of LPG cylinders can be undertaken under the Pradhan Mantri Ujjwala Yojna (PMUY) where priority will be given to forest fringe villages.
Detailed description of the technology
1. ICS The Ministry of New and Renewable Energy (MNRE) has approved some improved biomass cookstoves for widespread use across the country, as part of the Central Government-sponsored Unnat Chulha Abhiyan. Some of these are33:
Model Manufacturer Power output (kW)
Thermal efficiency
(%)
Harsha Multi-Fuel Cookstove
Unicus Engineering Pvt Ltd, Bhubaneshwar (Odisha) 2.0 28.6
Vikram Bio Super Chulha Top
Vikram Stoves and Fabricators, Osmanabad (Maharashtra)
2.77 31.95
Oorja K3 Dlx First Energy Pvt Ltd, Pune (Maharashtra)
1.51 37.26
TERI SPT-0610
The Energy and Resources Institute (TERI), New Delhi
1.08 36.84
2. Biogas
A typical family type biogas plant generates biogas from organic substances such as cattle –dung, and other bio-degradable materials such as biomass from farms, gardens,
32 National Biogas and Manure Management Programme (NBMMP), Section 3, Technology. http://www.mnre.gov.in/schemes/decentralized-systems/schems-2 33 Approved Models of Portable Improved Biomass Cookstoves, Ministry of New and Renewable Energy.
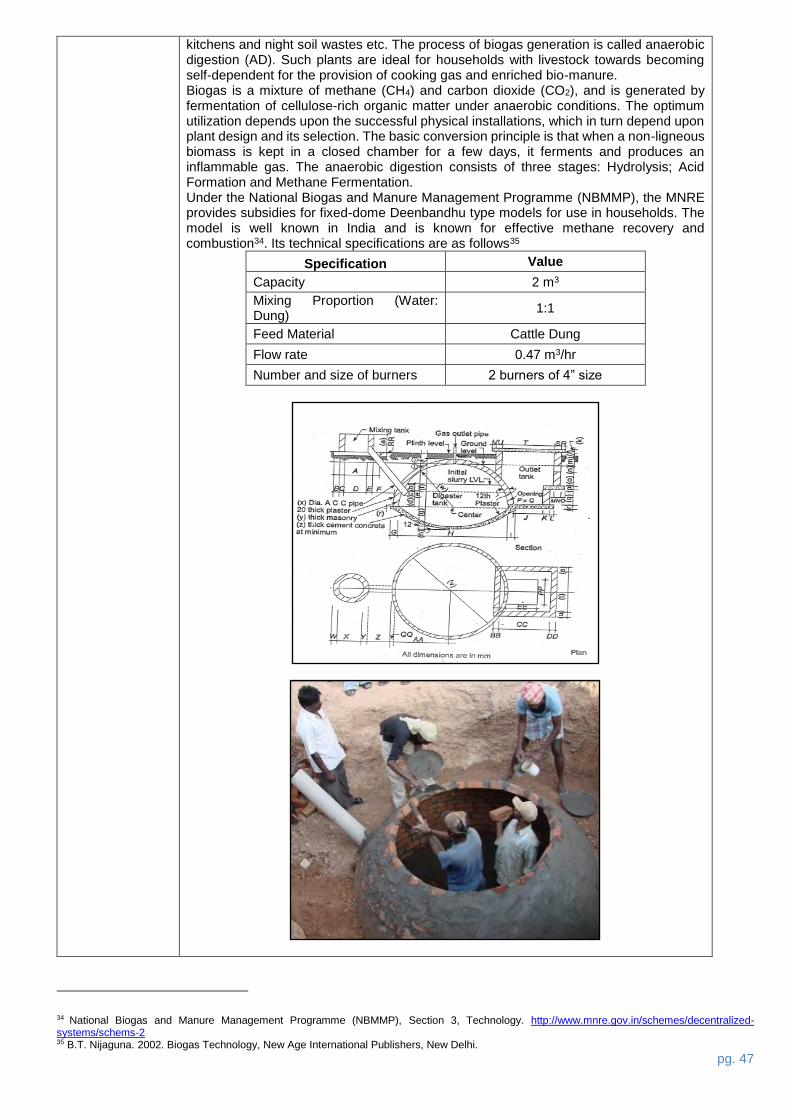
pg. 47
kitchens and night soil wastes etc. The process of biogas generation is called anaerobic digestion (AD). Such plants are ideal for households with livestock towards becoming self-dependent for the provision of cooking gas and enriched bio-manure. Biogas is a mixture of methane (CH4) and carbon dioxide (CO2), and is generated by fermentation of cellulose-rich organic matter under anaerobic conditions. The optimum utilization depends upon the successful physical installations, which in turn depend upon plant design and its selection. The basic conversion principle is that when a non-ligneous biomass is kept in a closed chamber for a few days, it ferments and produces an inflammable gas. The anaerobic digestion consists of three stages: Hydrolysis; Acid Formation and Methane Fermentation. Under the National Biogas and Manure Management Programme (NBMMP), the MNRE provides subsidies for fixed-dome Deenbandhu type models for use in households. The model is well known in India and is known for effective methane recovery and combustion34. Its technical specifications are as follows35
Specification Value
Capacity 2 m3
Mixing Proportion (Water: Dung)
1:1
Feed Material Cattle Dung
Flow rate 0.47 m3/hr
Number and size of burners 2 burners of 4” size
34 National Biogas and Manure Management Programme (NBMMP), Section 3, Technology. http://www.mnre.gov.in/schemes/decentralized-systems/schems-2 35 B.T. Nijaguna. 2002. Biogas Technology, New Age International Publishers, New Delhi.
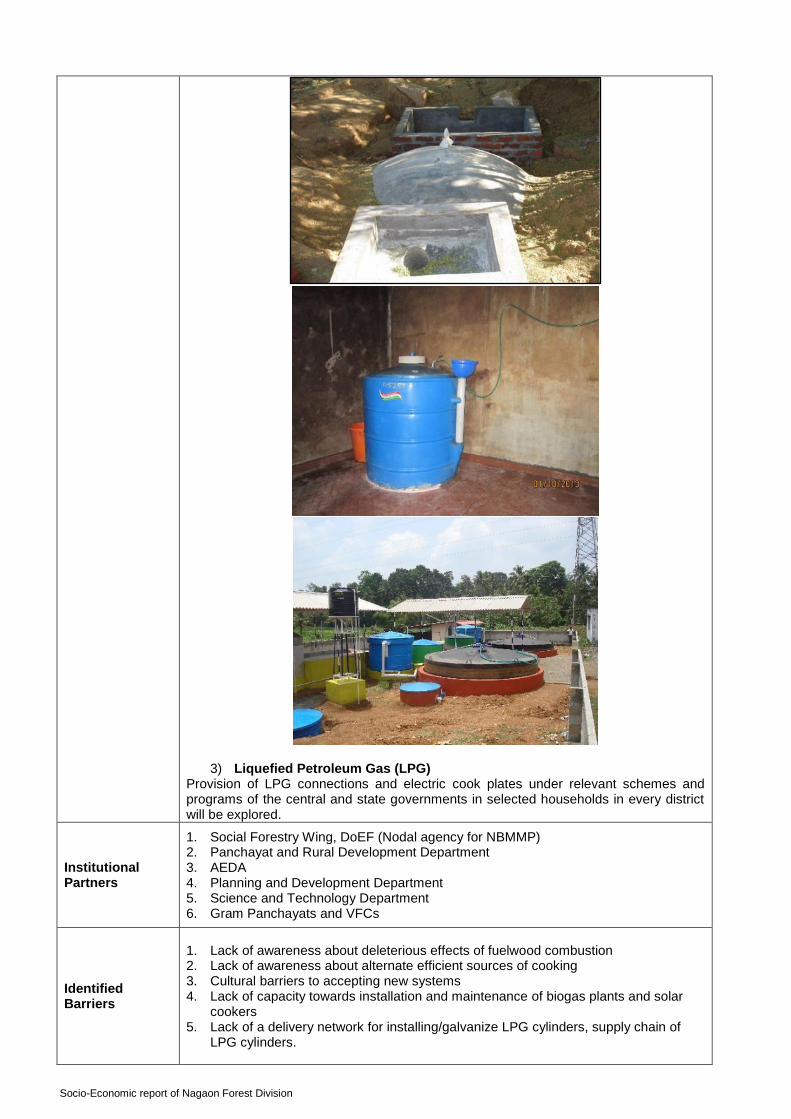
Socio-Economic report of Nagaon Forest Division
3) Liquefied Petroleum Gas (LPG) Provision of LPG connections and electric cook plates under relevant schemes and programs of the central and state governments in selected households in every district will be explored.
Institutional Partners
1. Social Forestry Wing, DoEF (Nodal agency for NBMMP) 2. Panchayat and Rural Development Department 3. AEDA 4. Planning and Development Department 5. Science and Technology Department 6. Gram Panchayats and VFCs
Identified Barriers
1. Lack of awareness about deleterious effects of fuelwood combustion 2. Lack of awareness about alternate efficient sources of cooking 3. Cultural barriers to accepting new systems 4. Lack of capacity towards installation and maintenance of biogas plants and solar
cookers 5. Lack of a delivery network for installing/galvanize LPG cylinders, supply chain of
LPG cylinders.
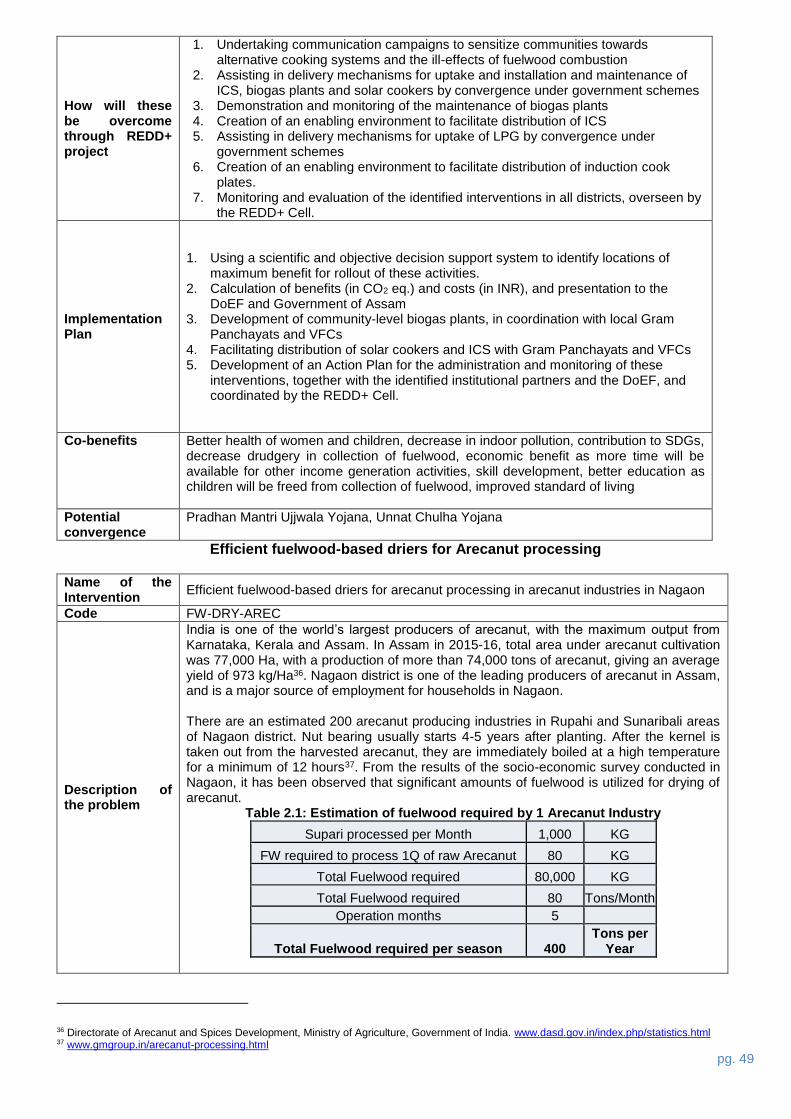
pg. 49
How will these be overcome through REDD+ project
1. Undertaking communication campaigns to sensitize communities towards alternative cooking systems and the ill-effects of fuelwood combustion
2. Assisting in delivery mechanisms for uptake and installation and maintenance of ICS, biogas plants and solar cookers by convergence under government schemes
3. Demonstration and monitoring of the maintenance of biogas plants 4. Creation of an enabling environment to facilitate distribution of ICS 5. Assisting in delivery mechanisms for uptake of LPG by convergence under
government schemes 6. Creation of an enabling environment to facilitate distribution of induction cook
plates. 7. Monitoring and evaluation of the identified interventions in all districts, overseen by
the REDD+ Cell.
Implementation Plan
1. Using a scientific and objective decision support system to identify locations of maximum benefit for rollout of these activities.
2. Calculation of benefits (in CO2 eq.) and costs (in INR), and presentation to the DoEF and Government of Assam
3. Development of community-level biogas plants, in coordination with local Gram Panchayats and VFCs
4. Facilitating distribution of solar cookers and ICS with Gram Panchayats and VFCs 5. Development of an Action Plan for the administration and monitoring of these
interventions, together with the identified institutional partners and the DoEF, and coordinated by the REDD+ Cell.
Co-benefits Better health of women and children, decrease in indoor pollution, contribution to SDGs, decrease drudgery in collection of fuelwood, economic benefit as more time will be available for other income generation activities, skill development, better education as children will be freed from collection of fuelwood, improved standard of living
Potential convergence
Pradhan Mantri Ujjwala Yojana, Unnat Chulha Yojana
Efficient fuelwood-based driers for Arecanut processing
Name of the Intervention
Efficient fuelwood-based driers for arecanut processing in arecanut industries in Nagaon
Code FW-DRY-AREC
Description of the problem
India is one of the world’s largest producers of arecanut, with the maximum output from Karnataka, Kerala and Assam. In Assam in 2015-16, total area under arecanut cultivation was 77,000 Ha, with a production of more than 74,000 tons of arecanut, giving an average yield of 973 kg/Ha36. Nagaon district is one of the leading producers of arecanut in Assam, and is a major source of employment for households in Nagaon. There are an estimated 200 arecanut producing industries in Rupahi and Sunaribali areas of Nagaon district. Nut bearing usually starts 4-5 years after planting. After the kernel is taken out from the harvested arecanut, they are immediately boiled at a high temperature for a minimum of 12 hours37. From the results of the socio-economic survey conducted in Nagaon, it has been observed that significant amounts of fuelwood is utilized for drying of arecanut.
Table 2.1: Estimation of fuelwood required by 1 Arecanut Industry
Supari processed per Month 1,000 KG
FW required to process 1Q of raw Arecanut 80 KG
Total Fuelwood required 80,000 KG
Total Fuelwood required 80 Tons/Month
Operation months 5
Total Fuelwood required per season 400 Tons per
Year
36 Directorate of Arecanut and Spices Development, Ministry of Agriculture, Government of India. www.dasd.gov.in/index.php/statistics.html 37 www.gmgroup.in/arecanut-processing.html
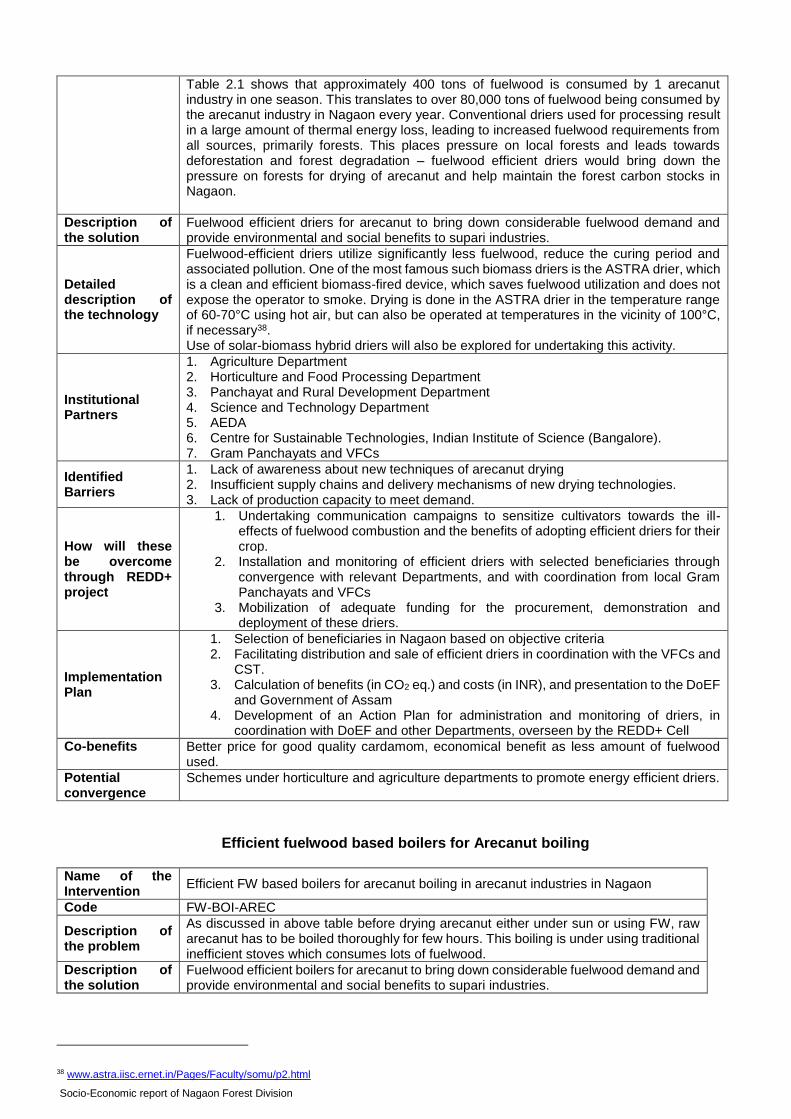
Socio-Economic report of Nagaon Forest Division
Table 2.1 shows that approximately 400 tons of fuelwood is consumed by 1 arecanut industry in one season. This translates to over 80,000 tons of fuelwood being consumed by the arecanut industry in Nagaon every year. Conventional driers used for processing result in a large amount of thermal energy loss, leading to increased fuelwood requirements from all sources, primarily forests. This places pressure on local forests and leads towards deforestation and forest degradation – fuelwood efficient driers would bring down the pressure on forests for drying of arecanut and help maintain the forest carbon stocks in Nagaon.
Description of the solution
Fuelwood efficient driers for arecanut to bring down considerable fuelwood demand and provide environmental and social benefits to supari industries.
Detailed description of the technology
Fuelwood-efficient driers utilize significantly less fuelwood, reduce the curing period and associated pollution. One of the most famous such biomass driers is the ASTRA drier, which is a clean and efficient biomass-fired device, which saves fuelwood utilization and does not expose the operator to smoke. Drying is done in the ASTRA drier in the temperature range of 60-70°C using hot air, but can also be operated at temperatures in the vicinity of 100°C, if necessary38. Use of solar-biomass hybrid driers will also be explored for undertaking this activity.
Institutional Partners
1. Agriculture Department 2. Horticulture and Food Processing Department 3. Panchayat and Rural Development Department 4. Science and Technology Department 5. AEDA 6. Centre for Sustainable Technologies, Indian Institute of Science (Bangalore). 7. Gram Panchayats and VFCs
Identified Barriers
1. Lack of awareness about new techniques of arecanut drying 2. Insufficient supply chains and delivery mechanisms of new drying technologies. 3. Lack of production capacity to meet demand.
How will these be overcome through REDD+ project
1. Undertaking communication campaigns to sensitize cultivators towards the ill-effects of fuelwood combustion and the benefits of adopting efficient driers for their crop.
2. Installation and monitoring of efficient driers with selected beneficiaries through convergence with relevant Departments, and with coordination from local Gram Panchayats and VFCs
3. Mobilization of adequate funding for the procurement, demonstration and deployment of these driers.
Implementation Plan
1. Selection of beneficiaries in Nagaon based on objective criteria 2. Facilitating distribution and sale of efficient driers in coordination with the VFCs and
CST. 3. Calculation of benefits (in CO2 eq.) and costs (in INR), and presentation to the DoEF
and Government of Assam 4. Development of an Action Plan for administration and monitoring of driers, in
coordination with DoEF and other Departments, overseen by the REDD+ Cell
Co-benefits Better price for good quality cardamom, economical benefit as less amount of fuelwood used.
Potential convergence
Schemes under horticulture and agriculture departments to promote energy efficient driers.
Efficient fuelwood based boilers for Arecanut boiling
Name of the Intervention
Efficient FW based boilers for arecanut boiling in arecanut industries in Nagaon
Code FW-BOI-AREC
Description of the problem
As discussed in above table before drying arecanut either under sun or using FW, raw arecanut has to be boiled thoroughly for few hours. This boiling is under using traditional inefficient stoves which consumes lots of fuelwood.
Description of the solution
Fuelwood efficient boilers for arecanut to bring down considerable fuelwood demand and provide environmental and social benefits to supari industries.
38 www.astra.iisc.ernet.in/Pages/Faculty/somu/p2.html
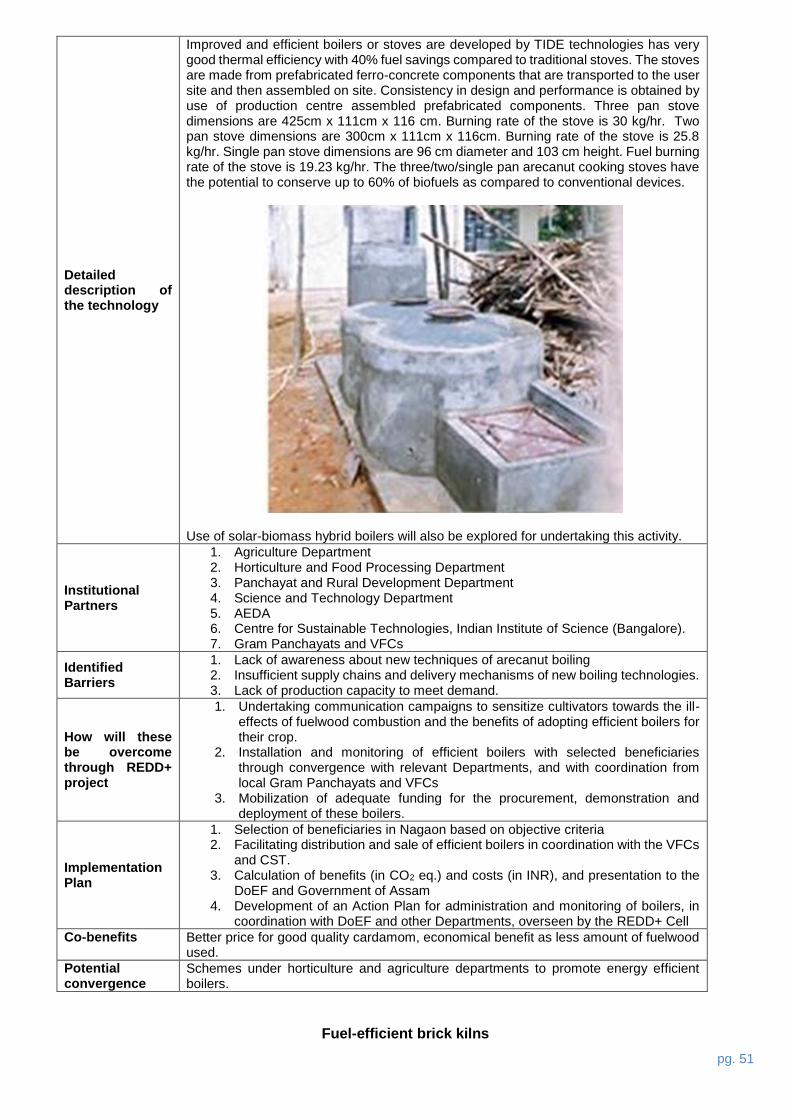
pg. 51
Detailed description of the technology
Improved and efficient boilers or stoves are developed by TIDE technologies has very good thermal efficiency with 40% fuel savings compared to traditional stoves. The stoves are made from prefabricated ferro-concrete components that are transported to the user site and then assembled on site. Consistency in design and performance is obtained by use of production centre assembled prefabricated components. Three pan stove dimensions are 425cm x 111cm x 116 cm. Burning rate of the stove is 30 kg/hr. Two pan stove dimensions are 300cm x 111cm x 116cm. Burning rate of the stove is 25.8 kg/hr. Single pan stove dimensions are 96 cm diameter and 103 cm height. Fuel burning rate of the stove is 19.23 kg/hr. The three/two/single pan arecanut cooking stoves have the potential to conserve up to 60% of biofuels as compared to conventional devices.
Use of solar-biomass hybrid boilers will also be explored for undertaking this activity.
Institutional Partners
1. Agriculture Department 2. Horticulture and Food Processing Department 3. Panchayat and Rural Development Department 4. Science and Technology Department 5. AEDA 6. Centre for Sustainable Technologies, Indian Institute of Science (Bangalore). 7. Gram Panchayats and VFCs
Identified Barriers
1. Lack of awareness about new techniques of arecanut boiling 2. Insufficient supply chains and delivery mechanisms of new boiling technologies. 3. Lack of production capacity to meet demand.
How will these be overcome through REDD+ project
1. Undertaking communication campaigns to sensitize cultivators towards the ill-effects of fuelwood combustion and the benefits of adopting efficient boilers for their crop.
2. Installation and monitoring of efficient boilers with selected beneficiaries through convergence with relevant Departments, and with coordination from local Gram Panchayats and VFCs
3. Mobilization of adequate funding for the procurement, demonstration and deployment of these boilers.
Implementation Plan
1. Selection of beneficiaries in Nagaon based on objective criteria 2. Facilitating distribution and sale of efficient boilers in coordination with the VFCs
and CST. 3. Calculation of benefits (in CO2 eq.) and costs (in INR), and presentation to the
DoEF and Government of Assam 4. Development of an Action Plan for administration and monitoring of boilers, in
coordination with DoEF and other Departments, overseen by the REDD+ Cell
Co-benefits Better price for good quality cardamom, economical benefit as less amount of fuelwood used.
Potential convergence
Schemes under horticulture and agriculture departments to promote energy efficient boilers.
Fuel-efficient brick kilns
Socio-Economic report of Nagaon Forest Division
Name of the intervention:
Retrofitting existing brick kilns / Introducing new brick manufacturing technologies, for fuel efficient brickmaking
Code: ALT-AFW-BRK
Description of the problem
Brick factories in the district consume a lot of fuelwood. On an average around 10 tons of fuelwood is used per kiln in a year for initial firing purpose. (FAO, 1988) There are around 300 brick kilns in Nagaon district (Sentinel Assam, May 2017), consuming more than 3,000 tons of fuelwood in a year.
Description of the solution
Introduction of alternate household fuels like efficient burners and driers. Retrofitting existing brick factories to make them more fuel efficient.
Description of the technology
Zig-zag kiln:
15-20% reduction in Specific Energy Consumption (SEC)
Upto 75% reduction in SPM emissions over FC-BTK
A higher percentage of Class I bricks are produced as compared to FC-BTK (80-85% Class I bricks as compared to 55-60% in FC-BTK)
Option for easy retrofit of FC-BTK to natural draught zig-zag kiln.
Like FC-BTK, zig-zag kilns also require solid fuels for firing.
Some of the fuels currently being used are saw dust, low and high grade coal, pet coke, agricultural residue etc. As zig-zag kiln is an energy efficient technology, it requires less fuel than FC-BTK.
Institutional partners
TARA, Development Alternatives, Shakti Foundation, Core Support Programme (Science and Society Division, Dept. of Science and Technology)
Identified barriers
Lack of awareness of other technologies – Knowledge barrier
Lack of finances to invest in clean technologies – Financial barrier
Untrained labour – Technical barrier
How will these be overcome through REDD+ project?
Organising workshops for brick kiln workers on efficient fuels and kiln retrofitting
Training workshops for kiln workers (e.g. for honeycomb layering of bricks, optimal size of bricks, etc.)
Development of a financing mechanism for retrofitting existing kilns.
Implementation plan
Adoption of improved feeding, firing and operating practices in existing Fixed Chimney Bull’s Trench Kilns (FCBTKs)
Retrofitting of kiln and converting into High Draft Kiln/ Fixed Chimney Bull’s
Trench Kiln with zig-zag firing.
Extensive Capacity Building Program
Effective policies and regulations required for implementing energy efficient technologies like Tunnel Kiln, Hoffman Kilns, TARA Eco Kiln, TARA BrickMek, etc.
Need for establishing the demand/market for resource efficient products like hollow and perforated bricks, and limiting the production of solid bricks in phases.
The technologies being capital intensive, requires mechanism for financial support before its replication on large scale.
Co-benefits Economic benefit as less amount of fuelwood used. Improved health of brick kiln workers due to proper training and less pollution.
Potential convergence
Initiatives by the Pollution Control Board of Assam (PCBA)
Smokeless Biomass briquettes as a fuelwood substitute
Name of the intervention:
Smokeless Biomass briquettes as a fuelwood substitute
Code ENE-BRQ-FW
Description of the problem
Unsustainable fuelwood extraction from forests (for household use, for fodder preparation and for use in small enterprises) to support rural communities is a major cause of deforestation and forest degradation in Nagaon. Illegal felling of fuelwood is reported in almost all ranges in Nagaon.
Description of the solution
Introduction of smokeless bio-briquettes using waste biomass and invasive species will help reduce fuelwood consumption, leading to the conservation and enhancement of Nagaon’s forest carbon stocks. In addition, they will lead to the following benefits:
pg. 53
- Check the breakout of invasive species causing deterioration of forest health - Provide an outlet for disposal of agricultural and animal feed wastes - Make available organic fertilizer and opportunities for non-farm based livelihoods - Reduce health hazards from smoke and high emissions from burning fuelwood and
biomass
Detailed description of the technology
About 400-500 gm of biodegradable waste is utilized for the production of 1 bio-briquette – 40-50 bio-briquettes can be manufactured per day. The processes involved in making bio-briquettes: - Collection and drying of bio-degradable waste and burning in a pit to make active
charcoal. - Production of biochar by leaving the charcoal overnight and airtight upto 12 hours. - Mixing biochar with fine mud in 3:1 ratio, and adding water to make a paste - Putting biochar-mud mixture in the briquette moulding frame and drying.
Identified barriers
1. Lack of awareness about deleterious effects of fuelwood combustion 2. Lack of awareness about alternate efficient sources of cooking 3. Lack of established bio-briquettes manufacturing and delivery systems 4. Lack of rural infrastructure to support bio-briquettes manufacturing 5. Lack of data on availability of invasive species as well as agricultural and animal feed
wastes 6. Cultural barriers for take-up of alternative systems
How will these be overcome through REDD+ project?
1. Building on existing communication campaigns to popularize the use of bio-briquettes across the state
2. Assisting in procuring equipment, providing training and setting up of small enterprises focused on manufacturing and use of bio-briquettes
3. Building on linkages and convergence with the government, public sector (NABARD) and private sector
Implementation plan
1. Training and awareness campaigns on bio-briquettes shall be organised in all the districts in such a way that at least 4 representatives from each village attend the training program.
2. One mould will be given to each village, the SHGs/JFMCs in each village can procure more moulds from wherever they prefer.
3. A market chain will be established to market the bio-briquettes.
Co-benefits Better health of women and children, decrease in indoor pollution, contribution to SDGs, decrease drudgery in collection of fuelwood, economical benefit as more time will be available for any income generation activity, skill development, better education as children will be freed from collection of fuelwood, improved standard of living
There is employment generation as well where SHGs can form a group together and market bio-briquettes.
Potential convergence
Pradhan Mantri Ujjwala Yojana, Unnat Chulha Yojana
Smart patrolling to check unplanned extraction of forest resources and unplanned mining within
forestland
Name of the intervention:
Smart patrolling to check unplanned extraction of forest resources and unplanned mining within forest land
Code: FML-PAT-MIN
Description of the problem
Few village communities extract small rocks from the forests and break them into small pieces (gravel) and sell. Over a period of time, this practice affects the forest soil and leads to forest degradation.
Description of the solution
Regular patrolling by forest personnel will discourage encroachers to illegally retrieve rocks from forests.
Institutional partners
Forest Department, Horticulture Department, National Horticulture Mission, Social Forestry Wing (Dept. of Environment & Forests, Govt. of Assam)
Identified barriers
Lack of capacity in JFMCs
Socio-Economic report of Nagaon Forest Division
Neglecting the need of local community while focusing on timber-only forestry could threaten the sustainability (ecological and social) of sal forests.
How will these be overcome through REDD+ project?
Integrating NTFPs could create the opportunity for local people to participate in forest management.
Increasing NTFP production like pepper & betel vine may contribute towards the economic opportunities and ultimately lead to the economic prosperity of local communities.
Implementation plan
Constitution of JFMCs and preparation of micro plans.
Nursery raising by JFMCs for creation of plantation and simultaneous raising of another people’s nursery by each JFMC for income generation from sale of seedlings.
Entry Point Activities like repairing of village road, construction of community hall, providing safe drinking water facility etc.
Training and capacity building of JFM communities as well as forest personnel.
Plantation over degraded forest by JFMCs.
Infrastructure Development of Forest Department for better service delivery
Exposure visit to other states.
Support to JFMCs for Medicinal and Aromatic Plantation on PPP mode.
Construction of CPTs and EPTs for better defined boundaries to reduce encroachments
Name of the intervention:
Construction of CPTs and EPTs for better defined boundaries to reduce encroachments
Code: FML-DBN-ENC
Description of the problem
The lack of artificial boundaries of a number of reserve forests leads to encroachment and regular felling and extraction of resources from the forest reserves. Ecological and social surveys conducted in the landscape indicate that Reserved Forests in Nagaon suffer from illegal encroachments due to lack of proper demarcation, unauthorized cattle grazing and lack of soil conservation leading to riverine and gully formations. Except for the Nagaon Sadar range, all ranges in Nagaon witness man-animal conflicts on a regular basis. Most of these incidents involve elephants.
Description of the solution
The need for strict vigilance through watchtowers to manage the boundary line of the reserve forests is there and proper demarcation with fixing of pillars in the division. Construction of CPTs and EPTs, as well as other relevant measures, to counter the multi-faceted challenges that RFs face in the Nagaon Division. These CPTs and EPTs are multi-purpose and useful towards forest management, utilizing least amount of resources for maintenance and construction. These can be constructed under MGNREGA funds through convergence with other state government departments by looking at various models practiced in different landscapes across India.
Description of the technology
A watchtower is simply a structure with a platform a few meters high that can support one or two people and from which the surrounding area can be observed. It can be either be on a tree or as a stand-alone structure. For CPTs and EPTs: Common dimensions of such trenches are 3m wide at the top, 1m wide at the bottom and 2m deep. The design of the CPTs and EPTs may also depend on the challenge that needs to be addressed : - For cattle grazing, trench size of at least 4ft depth and 4ft width. - For encroachment, trench size of 3ft height and 3ft width. - For erosion control, trench size of 3ft height and 3ft width These trenches are constructed after identification of vulnerable areas on the forest fringes where encroachment activities, man-animal conflicts and other issues have been repeatedly observed. Other relevant measures that can be considered include the utilization of used rail tracks sourced from the Indian Railways for fencing purposes. This has already been tried on an experimental basis in Assam.
Institutional partners
Department of Environment and Forests (DoEF), JFMCs
Identified barriers Lack of properly defined boundaries in reserve forests.
Lack of awareness among communities regarding reserve forests.
pg. 55
Lack of capacity among the JFMCs.
There are reports that animals get injured in tea garden areas after falling into the deep tranches, dug within the garden areas for drainage of water.
Lack of funding towards construction of trenches
Lack of participation of local communities and VFCs towards construction
Defective construction and lack of maintenance
How will these be overcome through REDD+ project?
Regular surveillance will check encroachment.
Training campaign among communities regarding the importance of reserve forests.
CPTs and EPTs will make sure animals are not injured and man-animal conflicts are reduced.
Implementation plan
1) Proper demarcation of reserve forests with help of the Forest Dept. 2) Creating awareness among JFMCs and concerned forest communities regarding
management of reserve forests. 3) Construction of watch towers & posting of staff on 24 hours duty during most
vulnerable periods. 4) Vaccination of cattle near the fringe villages needs to done regularly and
awareness camp & animal health camps needs to be conducted with the help of veterinary doctors regularly.
5) Elephant depredation hot spots needs to be identified. 6) JFMC’s (or) EDC’s needs to be activated & awareness to be given on protection
to wildlife. 7) Provision of funds to public for construction of stone wall/solar electric fencing
around agricultural fields. 8) Live/bio-fencing 9) Construction of watchtowers & posting of staff on 24 hours duty during most
vulnerable periods. 10) Identification of vulnerable areas with need for fencing based on objective criteria 11) Exploring various models of trench construction
Bio-fencing to counter encroachment
Name of the intervention:
Bio-fencing to reduce encroachment, illegal felling and man-animal conflicts
Code: FM-BRDR-PLANT
Description of the problem
Encroachment and illegal felling is one of the many causes of deforestation and forest degradation. Further, in areas where agricultural fields are situated adjacent to forestlands, there are frequent man-animal conflicts.
Description of the solution
Development of biological barriers such as agave plantation can stop the felling and transport of local timber, while also acting as a barricade against animal incursion. These natural barriers would supplement existing efforts undertaken by the DoEF, like surveillance through watchtowers and procurement of night-vision glasses, to check these illegal activities. In addition, such vegetative barriers restrict animals from foraging on agricultural produce and causing crop damages.
Description of technology
Agave plantations have been used across various states in India for live fencing due to its low maintenance requirements, growth of marginal lands and its soil binding properties. Agave leaves are thick and fleshy, and its tips are full of spines39. Rows of agave plantations would help check illegal encroachment, felling and transport of timber, as well as man-animal conflicts, by acting as a natural barrier. Other types of vegetation can also be explored to act as bio-fencing towards restricting these activities.
Identified barriers
1. Lack of protection and maintenance of these bio-fencing techniques 2. Lack of capacity and training of local DoEF personnel and communities towards bio
fencing 3. Destruction of such fences by encroachers
39 www.biogov.in/article/agave-a-multipurose-dryland-plant/
Socio-Economic report of Nagaon Forest Division
How will these be overcome through REDD+ project?
1. Undertaking communication campaigns on the benefits of natural barriers to restrict these activities.
2. Training and capacity building of JFMCs and local communities, in addition to convergence of central and state funds and schemes, on the plantation and maintenance of these bio-fences.
3. Distribution of saplings (e.g. agave or other thorny species) of plants which can be used for live fences.
Implementation plan
1. Training of DoEF personnel, JFMCs and local communities on the construction and maintenance of live fences
2. Identification of areas which are priority plantations to take up agave plantation, geo-tagging them.
3. Ground reconnaissance, raising agave, planting them in the prescribed manner. 4. Development of strategies to converge the objectives of this intervention with other
DoEF initiatives to check illegal felling and transport.
Co-benefits Decrease man-animal conflict, encroachment, and smuggling.
Potential schemes
Existing DoEF schemes
Afforestation/Reforestation and ANR activities
Name of the intervention:
Plantation activities: 1. Afforestation and Reforestation in non-forest lands for tree cover. 2. Assisted Natural Regeneration in forests to stop degradation
Code: FM-ANR-AFD
Description of the problem
REDD+ interventions strives to decrease degradation and deforestation and associated emissions. Through LULC change mapping, it is observed that there are pockets of degradation and deforestation in Nagaon, which leads to emissions.
Description of the solution
Plantation activities in identified degraded pockets through Assisted Natural Regeneration (ANR) and gap plantation and identified non-forest pockets prone to deforestation (afforestation and reforestation) will help in enhancement of forest stock and increase forest and tree cover.
Detailed description of the technology
Afforestation and reforestation both refer to establishment of trees on lands not currently having trees. Reforestation refers to establishment of forest on land that had recent tree cover, whereas afforestation refers to land that has been without forest for much longer40. For such activities, it is stipulated that the identified land at the time of commencement of plantation is not a forest, and woody vegetation on the land is below the forest thresholds as decided for the national GHG inventory; which is a crown cover of 10%. ANR is a method for enhancing the establishment of secondary forest from degraded grassland and shrub vegetation by protecting and nurturing the mother trees and their wildlings inherently present in the area41. ANR activities are focused on lands currently classified as forests (and which meet the minimum eligibility criteria for forests mentioned above), but which may not remain one in the future due to anthropogenic pressures from the drivers of forest change identified in the socio-economic surveys conducted in the landscape. Depending on the existing condition and canopy cover of the identified area, the appropriate techniques and methods for plantations and development of the degraded landscape will be employed towards regenerating forest cover through selection of appropriate tree species, forest management, protection and monitoring.
Institutional partners
JFMCs/EDCs
Identified barriers
1. Non-availability of degraded areas on a suitable scale. 2. Lack of sufficient funds to undertake plantation activities across Nagaon. 3. Lack of technology-driven cost effective monitoring of these plantations.
How will these be overcome
1. Training of DoEF personnel and JFMCs on undertaking best land regeneration practices through trainings planned under REDD+.
40 www.ipcc.ch/ipccreports/sres/land_use/index.php?idp=47 41 www.fao.org/forestry/anr/en/
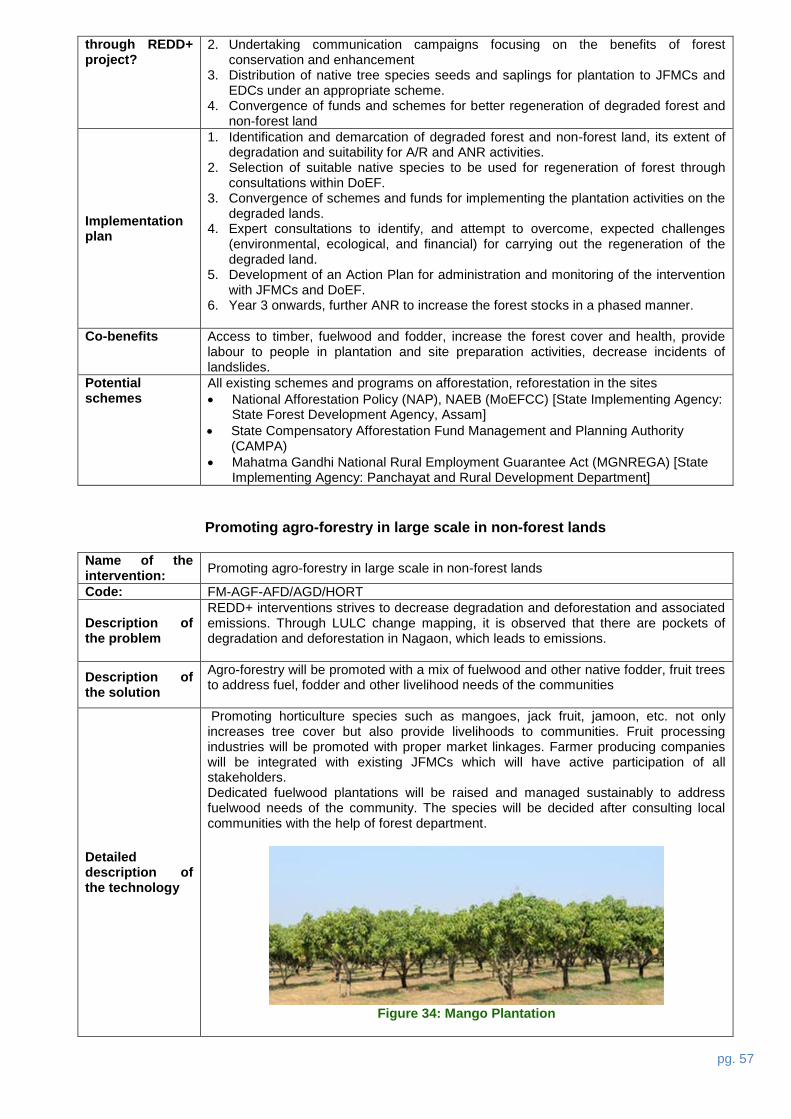
pg. 57
through REDD+ project?
2. Undertaking communication campaigns focusing on the benefits of forest conservation and enhancement
3. Distribution of native tree species seeds and saplings for plantation to JFMCs and EDCs under an appropriate scheme.
4. Convergence of funds and schemes for better regeneration of degraded forest and non-forest land
Implementation plan
1. Identification and demarcation of degraded forest and non-forest land, its extent of degradation and suitability for A/R and ANR activities.
2. Selection of suitable native species to be used for regeneration of forest through consultations within DoEF.
3. Convergence of schemes and funds for implementing the plantation activities on the degraded lands.
4. Expert consultations to identify, and attempt to overcome, expected challenges (environmental, ecological, and financial) for carrying out the regeneration of the degraded land.
5. Development of an Action Plan for administration and monitoring of the intervention with JFMCs and DoEF.
6. Year 3 onwards, further ANR to increase the forest stocks in a phased manner.
Co-benefits Access to timber, fuelwood and fodder, increase the forest cover and health, provide labour to people in plantation and site preparation activities, decrease incidents of landslides.
Potential schemes
All existing schemes and programs on afforestation, reforestation in the sites
National Afforestation Policy (NAP), NAEB (MoEFCC) [State Implementing Agency: State Forest Development Agency, Assam]
State Compensatory Afforestation Fund Management and Planning Authority (CAMPA)
Mahatma Gandhi National Rural Employment Guarantee Act (MGNREGA) [State Implementing Agency: Panchayat and Rural Development Department]
Promoting agro-forestry in large scale in non-forest lands
Name of the intervention:
Promoting agro-forestry in large scale in non-forest lands
Code: FM-AGF-AFD/AGD/HORT
Description of the problem
REDD+ interventions strives to decrease degradation and deforestation and associated emissions. Through LULC change mapping, it is observed that there are pockets of degradation and deforestation in Nagaon, which leads to emissions.
Description of the solution
Agro-forestry will be promoted with a mix of fuelwood and other native fodder, fruit trees to address fuel, fodder and other livelihood needs of the communities
Detailed description of the technology
Promoting horticulture species such as mangoes, jack fruit, jamoon, etc. not only increases tree cover but also provide livelihoods to communities. Fruit processing industries will be promoted with proper market linkages. Farmer producing companies will be integrated with existing JFMCs which will have active participation of all stakeholders. Dedicated fuelwood plantations will be raised and managed sustainably to address fuelwood needs of the community. The species will be decided after consulting local communities with the help of forest department.
Figure 34: Mango Plantation
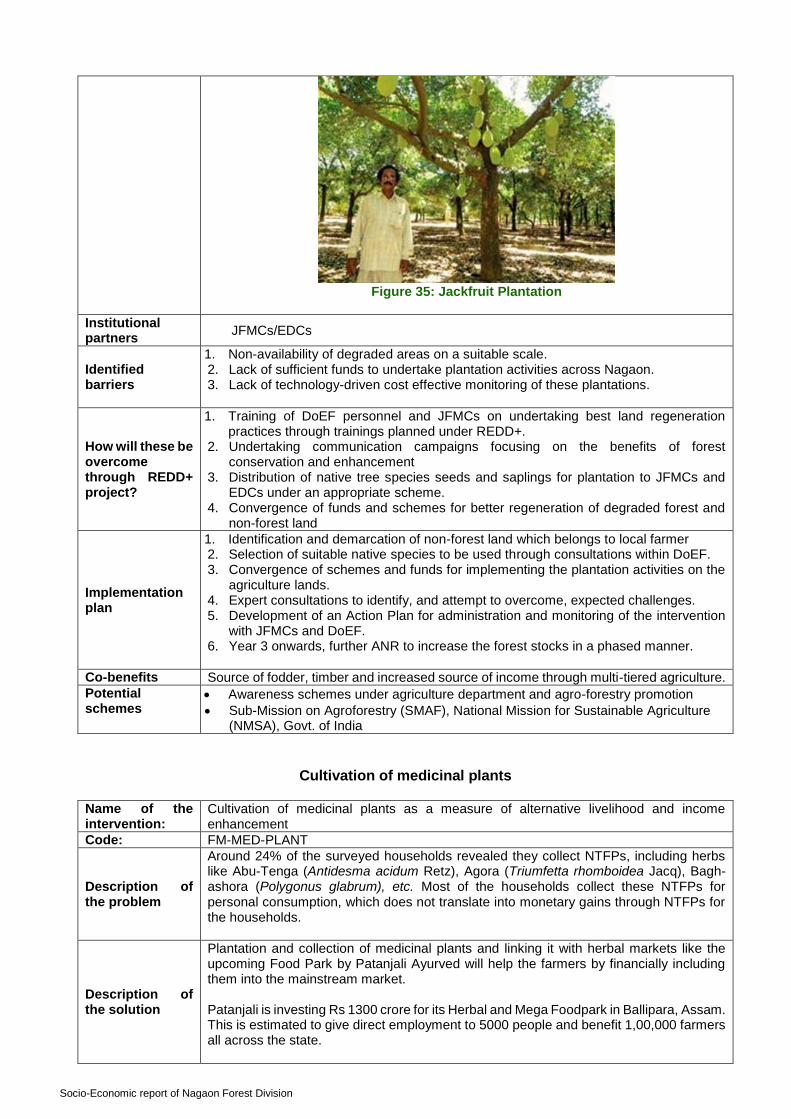
Socio-Economic report of Nagaon Forest Division
Figure 35: Jackfruit Plantation
Institutional partners
JFMCs/EDCs
Identified barriers
1. Non-availability of degraded areas on a suitable scale. 2. Lack of sufficient funds to undertake plantation activities across Nagaon. 3. Lack of technology-driven cost effective monitoring of these plantations.
How will these be overcome through REDD+ project?
1. Training of DoEF personnel and JFMCs on undertaking best land regeneration practices through trainings planned under REDD+.
2. Undertaking communication campaigns focusing on the benefits of forest conservation and enhancement
3. Distribution of native tree species seeds and saplings for plantation to JFMCs and EDCs under an appropriate scheme.
4. Convergence of funds and schemes for better regeneration of degraded forest and non-forest land
Implementation plan
1. Identification and demarcation of non-forest land which belongs to local farmer 2. Selection of suitable native species to be used through consultations within DoEF. 3. Convergence of schemes and funds for implementing the plantation activities on the
agriculture lands. 4. Expert consultations to identify, and attempt to overcome, expected challenges. 5. Development of an Action Plan for administration and monitoring of the intervention
with JFMCs and DoEF. 6. Year 3 onwards, further ANR to increase the forest stocks in a phased manner.
Co-benefits Source of fodder, timber and increased source of income through multi-tiered agriculture.
Potential schemes
Awareness schemes under agriculture department and agro-forestry promotion
Sub-Mission on Agroforestry (SMAF), National Mission for Sustainable Agriculture (NMSA), Govt. of India
Cultivation of medicinal plants
Name of the intervention:
Cultivation of medicinal plants as a measure of alternative livelihood and income enhancement
Code: FM-MED-PLANT
Description of the problem
Around 24% of the surveyed households revealed they collect NTFPs, including herbs like Abu-Tenga (Antidesma acidum Retz), Agora (Triumfetta rhomboidea Jacq), Bagh-ashora (Polygonus glabrum), etc. Most of the households collect these NTFPs for personal consumption, which does not translate into monetary gains through NTFPs for the households.
Description of the solution
Plantation and collection of medicinal plants and linking it with herbal markets like the upcoming Food Park by Patanjali Ayurved will help the farmers by financially including them into the mainstream market. Patanjali is investing Rs 1300 crore for its Herbal and Mega Foodpark in Ballipara, Assam. This is estimated to give direct employment to 5000 people and benefit 1,00,000 farmers all across the state.
pg. 59
Detailed description of the technology
The Balipara unit of Patanjali will produce Rs 20,000 crore annual production with an annual production capacity of around 12 lakh MT. The unit will manufacture wide range of consumer products such as cosmetics, nutritional foods and kitchen essentials among others. The plant will produce rice bran oil from the remains of rice husks. (Patanjali Ayurved Ltd., November 2016)
Partner institutions
1. DoEF 2. JFMCs/EDCs/SHGs and Gram Panchayats 3. Patanjali Ayurved Ltd. 4. Horticulture Mission, Agriculture Department (Ayush Programme for cultivation of
medicinal plants)
Identified barriers
1. Lack of awareness and knowledge of market potential of medicinal plants 2. Lack of resources and capacity of local communities towards the development and
monitoring of medicinal plantations 3. Lack of coordination among institutions for the deployment of this intervention, along
with other financial and technical towards adoption of these modern techniques
How will these be overcome through REDD+ project?
1. Undertaking communication campaigns on benefits from medicinal plants. 2. Training and capacity building on plantation techniques 3. Financial, technical and institutional support to overcome the barriers of medicinal
plantation activities.
Implementation plan
1. Identification and selection of suitable lands for plantation activities. 2. Training, capacity building and promotion of medicinal plantations. 3. Facilitating distribution of seeds of ecologically adaptive and agro-climatically suitable
species 4. Convergence of public funds and schemes for promoting and implementing medicinal
plantations 5. Development of an Action Plan for administration and monitoring of the intervention
with Gram Panchayats, JFMCs, and DoEF.
Co-benefits Increased income through alternative options. Reduced dependence on forest resources leading to less extraction and exploitation of forest resources.
Potential convergence
Horticulture Mission, Agriculture Department (Ayush Programme for cultivation of medicinal plants)
Sustainable grazing and livestock management:
1. Silvi-pastoral and Horti-pastoral models
2. Fodder densification and stall feeding
3. Vaccination of livestock
Silvi-pastoral and Horti-pastoral Models
Name of the intervention:
Silvi-pastoral and Horti-pastoral practices for sustainable grazing
Code: FM-SILV-HORT
Description of the problem
Around 68% of surveyed households have cattle in their houses. An average of 3 cows is present per family. It is estimated that there are 2,087,631 livestock (NER databank) in the district, which require a constant supply of fodder and pasturelands. Poultry, Duckery, Goatery and Piggery are major backyard activities of the rural households for food and nutrition. Pig rearing is taken as a subsidiary occupation by the small and marginal farmers and the agricultural labourers of the tribal community.42 According to the socio-economic survey, sheep, pig, chicken and gooses are reared in most of the households and used for meat purposes. There are 480,208 rural households in Nagaon (Census 2011), with average of 4 livestock per household. From the socio-economic survey conducted in the landscape, it was found that 83% of the cattle goes for open grazing. And around 22% of the surveyed households revealed they collect fodder from forests. This leads to pressures on existing lands to provide fodder and pastures.
42 District Report: Nagaon, Baseline Survey of Minority Concentrated Districts, OKDISCD – Guwahati (Ministry of Minority Affairs, Govt. of India)
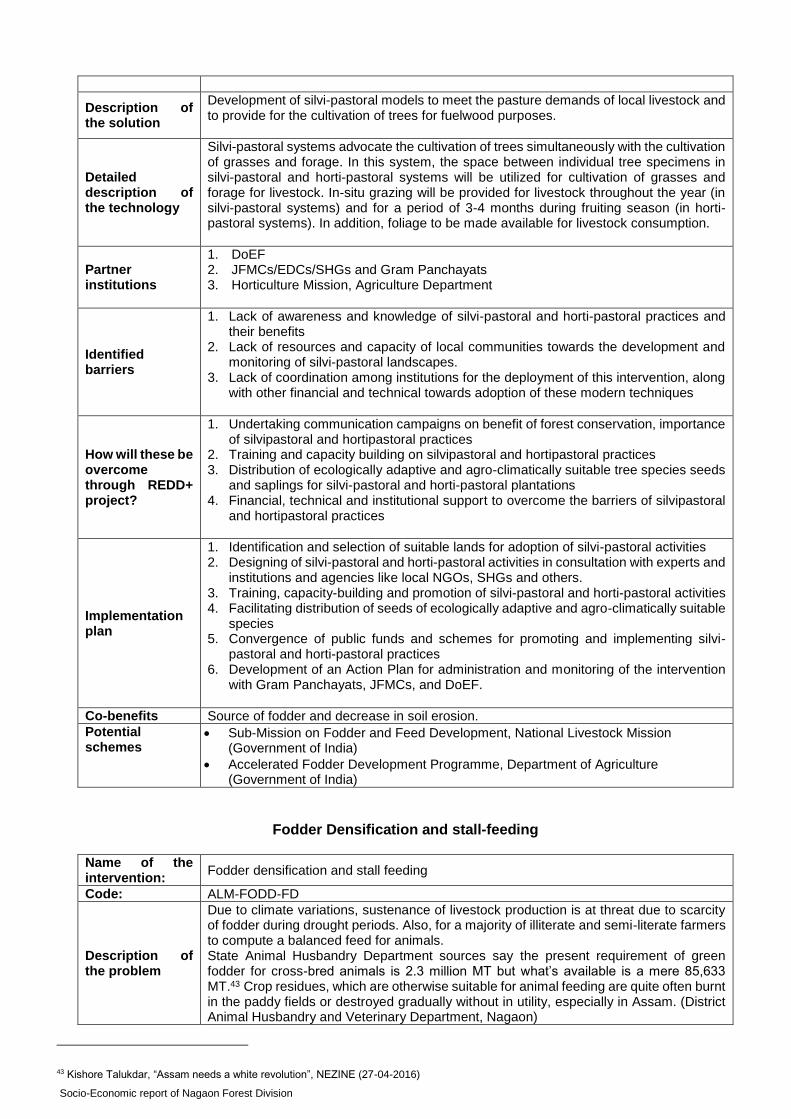
Socio-Economic report of Nagaon Forest Division
Description of the solution
Development of silvi-pastoral models to meet the pasture demands of local livestock and to provide for the cultivation of trees for fuelwood purposes.
Detailed description of the technology
Silvi-pastoral systems advocate the cultivation of trees simultaneously with the cultivation of grasses and forage. In this system, the space between individual tree specimens in silvi-pastoral and horti-pastoral systems will be utilized for cultivation of grasses and forage for livestock. In-situ grazing will be provided for livestock throughout the year (in silvi-pastoral systems) and for a period of 3-4 months during fruiting season (in horti-pastoral systems). In addition, foliage to be made available for livestock consumption.
Partner institutions
1. DoEF 2. JFMCs/EDCs/SHGs and Gram Panchayats 3. Horticulture Mission, Agriculture Department
Identified barriers
1. Lack of awareness and knowledge of silvi-pastoral and horti-pastoral practices and their benefits
2. Lack of resources and capacity of local communities towards the development and monitoring of silvi-pastoral landscapes.
3. Lack of coordination among institutions for the deployment of this intervention, along with other financial and technical towards adoption of these modern techniques
How will these be overcome through REDD+ project?
1. Undertaking communication campaigns on benefit of forest conservation, importance of silvipastoral and hortipastoral practices
2. Training and capacity building on silvipastoral and hortipastoral practices 3. Distribution of ecologically adaptive and agro-climatically suitable tree species seeds
and saplings for silvi-pastoral and horti-pastoral plantations 4. Financial, technical and institutional support to overcome the barriers of silvipastoral
and hortipastoral practices
Implementation plan
1. Identification and selection of suitable lands for adoption of silvi-pastoral activities 2. Designing of silvi-pastoral and horti-pastoral activities in consultation with experts and
institutions and agencies like local NGOs, SHGs and others. 3. Training, capacity-building and promotion of silvi-pastoral and horti-pastoral activities 4. Facilitating distribution of seeds of ecologically adaptive and agro-climatically suitable
species 5. Convergence of public funds and schemes for promoting and implementing silvi-
pastoral and horti-pastoral practices 6. Development of an Action Plan for administration and monitoring of the intervention
with Gram Panchayats, JFMCs, and DoEF.
Co-benefits Source of fodder and decrease in soil erosion.
Potential schemes
Sub-Mission on Fodder and Feed Development, National Livestock Mission (Government of India)
Accelerated Fodder Development Programme, Department of Agriculture (Government of India)
Fodder Densification and stall-feeding
Name of the intervention:
Fodder densification and stall feeding
Code: ALM-FODD-FD
Description of the problem
Due to climate variations, sustenance of livestock production is at threat due to scarcity of fodder during drought periods. Also, for a majority of illiterate and semi-literate farmers to compute a balanced feed for animals. State Animal Husbandry Department sources say the present requirement of green fodder for cross-bred animals is 2.3 million MT but what’s available is a mere 85,633 MT.43 Crop residues, which are otherwise suitable for animal feeding are quite often burnt in the paddy fields or destroyed gradually without in utility, especially in Assam. (District Animal Husbandry and Veterinary Department, Nagaon)
43 Kishore Talukdar, “Assam needs a white revolution”, NEZINE (27-04-2016)

pg. 61
Description of the solution
Densification of roughages and waste crop residues in compact blocks is an effective solution for livestock feed management. The digestibility of crop residues and other low quality forages can be increased through the action of rumen microbes by strategically mixing nitrogen and minerals that are deficient in these feed resources. The increase in digestibility of crop residues and low quality forages, in turn also increases their intake. Both these phenomena enhance the efficiency of nutrient utilization from these feed resources in animal food chains. Fodder densification machines are based on the formation of a complete diet in the form of densified feed blocks or pellets from straws mixed with minerals, oil seed cakes and other agro-industrial by-products. This technology will enhance income of farmers, decrease environmental pollution and help alleviate shortage of good quality seeds in tropical countries. In addition, the feed produced in the densified form as blocks or pellets could also provide complete feed to livestock in emergency situations. This will also enable efficient and cost-effective transport of fodder upon its densification into fodder blocks where up to 10 tons of feed block can be easily transported in a truck as against 4 ton loose fodder. (DAH&VD, Nagaon) Fodder Cultivation Scheme for production of oat grass was not very popular, hence it was discontinued 2 years earlier. It can be started on a pilot basis in one or two villages. Absence of feed mill in the district the main cause of lack of quality feed for cattle which is the main obstacle for promoting stall feeding. Quality fodder and feed production can be promoted in some of the fringe villages of forest villages.
Detailed description of the technology
The Densified Total Mixed Ration Block (DTMRB) technology has mostly been developed in India, through the collaborative efforts of animal nutritionists and feed technologists. It is different from the green forages or silage based complete feeds (Schroeder and Park, 1997; Kononoff, 2005). Since the fibrous crop residues are low density feeds, apart from difficulties in its handling and transportation, making a densified block from this loose and lighter stuff is challenging. A different approach and machinery are required for making such blocks from these residues and other dried roughages such as tree leaves and forest grasses. The first step in the process of making straw based feed blocks is the grinding of concentrate ingredients, followed by their mixing and addition of the feed additives. This is then followed by mixing of these ingredients and straw in proper proportions along with addition of molasses in a specifically designed TMR mixer, taking care that mixing is uniform and ingredients are not separated due to gravity. Finally, the weighed quantity of the mixed stuff is transferred into a hydraulic press to get the final product – the DTMRB. Machinery Needed
A grinder (hammer mill) and a mixer is required for making a normal concentrate mixture.
A specially designed TMR Mixer is required for mixing weighed quantities of low density crop residue (straws, stovers, bagasse, dried forest grasses, dried tree leaves etc.) and the high density concentrate. Molasses and any other liquid feed additive are also added at this stage. The mixing is done through vertical motion, so that there is no separation due to gravity
Weighed quantity of the mixed ingredients is transferred into densification machine (works on the principle of hydraulic compression) which compresses the forage and concentrate mixture into densified complete feed block.
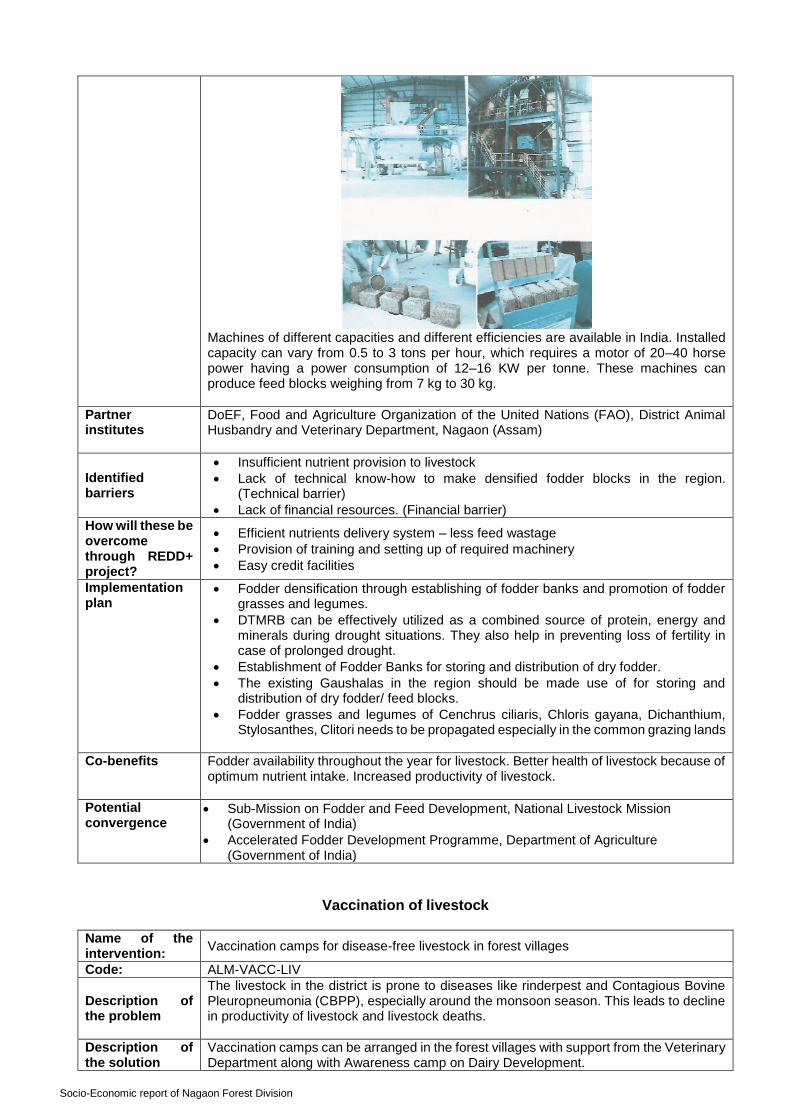
Socio-Economic report of Nagaon Forest Division
Machines of different capacities and different efficiencies are available in India. Installed capacity can vary from 0.5 to 3 tons per hour, which requires a motor of 20–40 horse power having a power consumption of 12–16 KW per tonne. These machines can produce feed blocks weighing from 7 kg to 30 kg.
Partner institutes
DoEF, Food and Agriculture Organization of the United Nations (FAO), District Animal Husbandry and Veterinary Department, Nagaon (Assam)
Identified barriers
Insufficient nutrient provision to livestock
Lack of technical know-how to make densified fodder blocks in the region. (Technical barrier)
Lack of financial resources. (Financial barrier)
How will these be overcome through REDD+ project?
Efficient nutrients delivery system – less feed wastage
Provision of training and setting up of required machinery
Easy credit facilities
Implementation plan
Fodder densification through establishing of fodder banks and promotion of fodder grasses and legumes.
DTMRB can be effectively utilized as a combined source of protein, energy and minerals during drought situations. They also help in preventing loss of fertility in case of prolonged drought.
Establishment of Fodder Banks for storing and distribution of dry fodder.
The existing Gaushalas in the region should be made use of for storing and distribution of dry fodder/ feed blocks.
Fodder grasses and legumes of Cenchrus ciliaris, Chloris gayana, Dichanthium, Stylosanthes, Clitori needs to be propagated especially in the common grazing lands
Co-benefits Fodder availability throughout the year for livestock. Better health of livestock because of optimum nutrient intake. Increased productivity of livestock.
Potential convergence
Sub-Mission on Fodder and Feed Development, National Livestock Mission (Government of India)
Accelerated Fodder Development Programme, Department of Agriculture (Government of India)
Vaccination of livestock
Name of the intervention:
Vaccination camps for disease-free livestock in forest villages
Code: ALM-VACC-LIV
Description of the problem
The livestock in the district is prone to diseases like rinderpest and Contagious Bovine Pleuropneumonia (CBPP), especially around the monsoon season. This leads to decline in productivity of livestock and livestock deaths.
Description of the solution
Vaccination camps can be arranged in the forest villages with support from the Veterinary Department along with Awareness camp on Dairy Development.
pg. 63
Detailed description of the technology
From the Veterinary and Animal Husbandry Department, their ongoing Vaccination Scheme for cattle for prevention of BQ, HS and FMD is given twice in villages throughout the state during the two seasons- pre monsoon and post monsoon.
Partner institutions
1. Veterinary and Animal Husbandry Department 2. JFMCs/EDCs/SHGs and Gram Panchayats
Identified barriers
1. Lack of awareness and knowledge animal treatments 2. Lack of resources and capacity of local communities towards livestock vaccination 3. Lack of coordination among institutions for the deployment livestock vaccination
programmes
How will these be overcome through REDD+ project?
1. Undertaking communication campaigns on benefits from livestock vaccination 2. Training and capacity building
Implementation plan
1. Convergence of public funds and schemes for promoting and implementing livestock vaccination
2. Development of an Action Plan for administration and monitoring of the intervention with Gram Panchayats, JFMCs, and DoEF.
Co-benefits Improved livestock health. Increased productivity of livestock.
Potential convergence
Sub-Mission on Fodder and Feed Development, National Livestock Mission (Government of India)
Accelerated Fodder Development Programme, Department of Agriculture (Government of India)
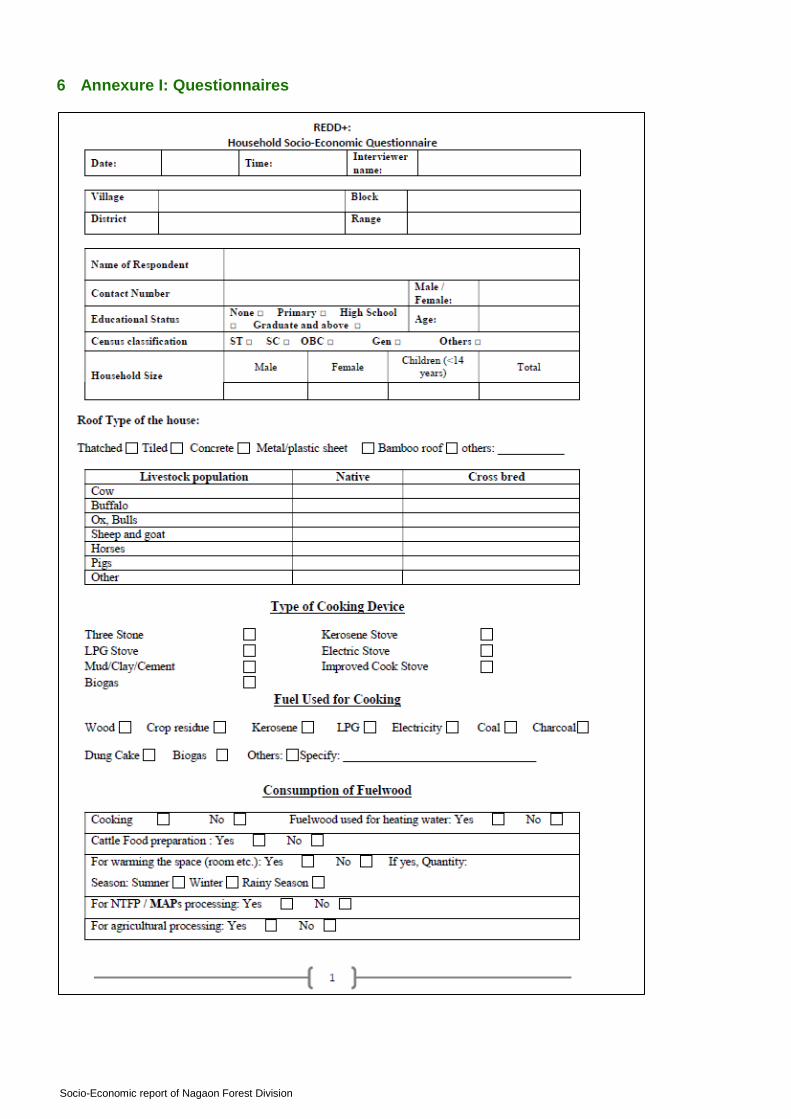
Socio-Economic report of Nagaon Forest Division
6 Annexure I: Questionnaires
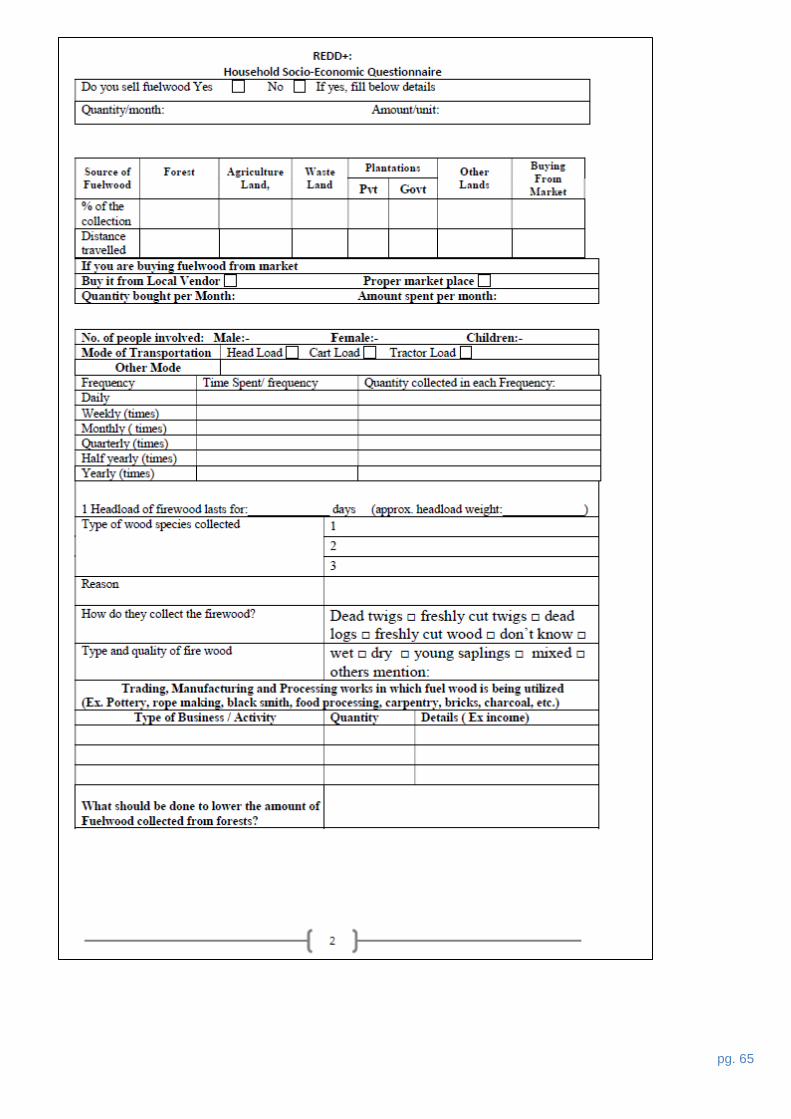
pg. 65

Socio-Economic report of Nagaon Forest Division
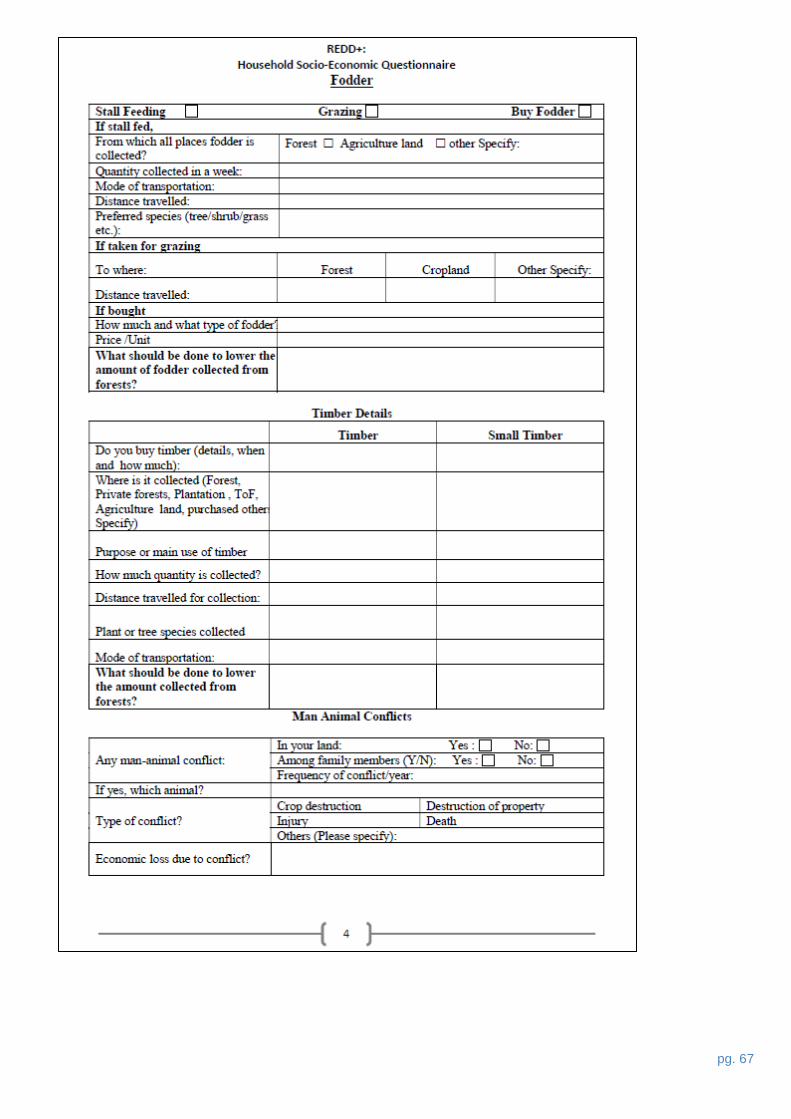
pg. 67
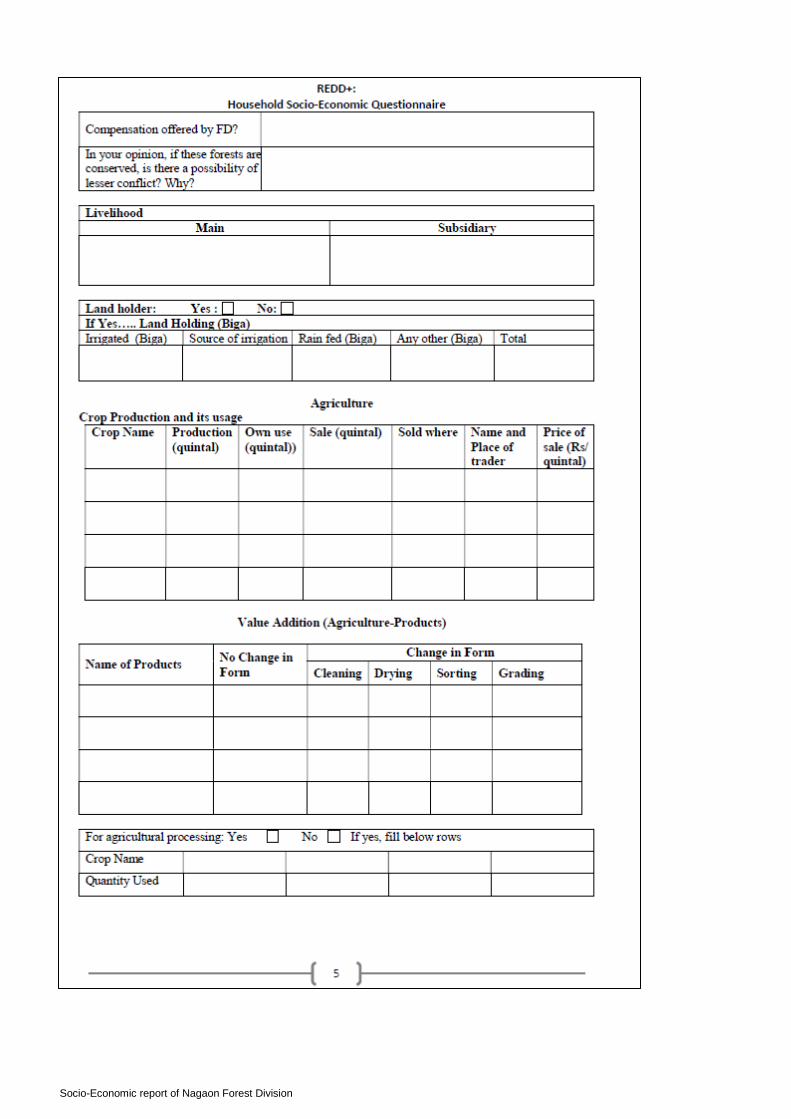
Socio-Economic report of Nagaon Forest Division
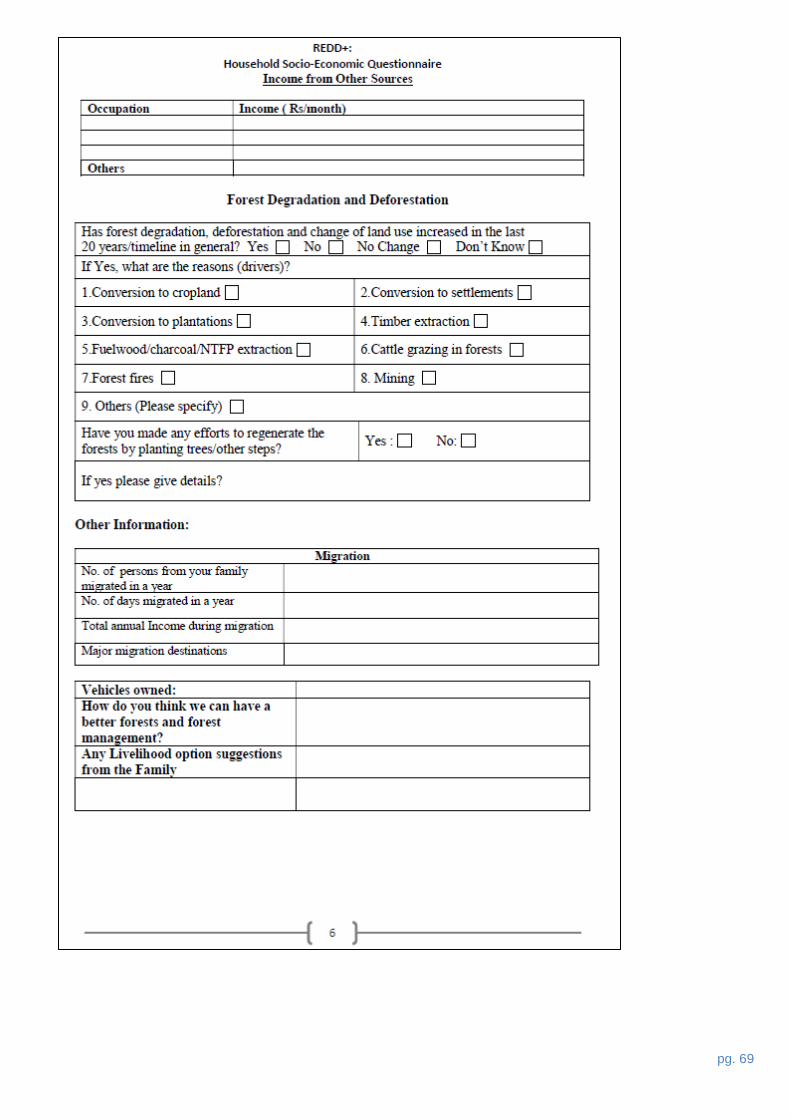
pg. 69
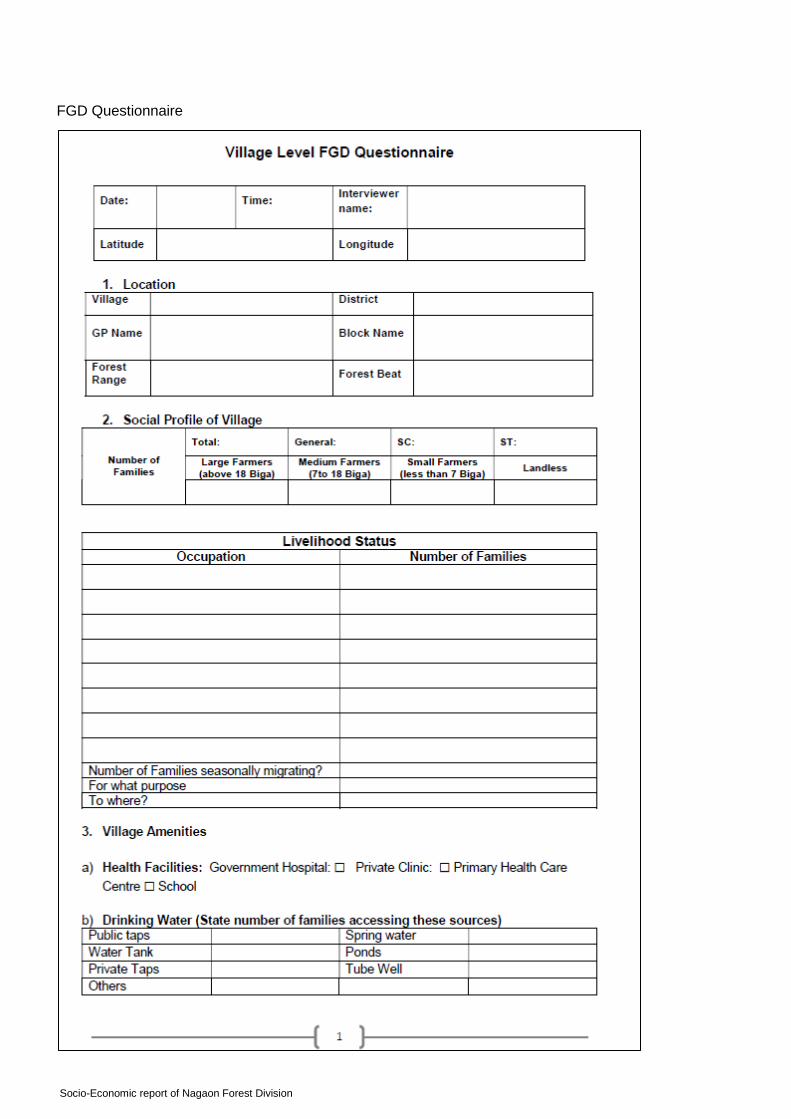
Socio-Economic report of Nagaon Forest Division
FGD Questionnaire
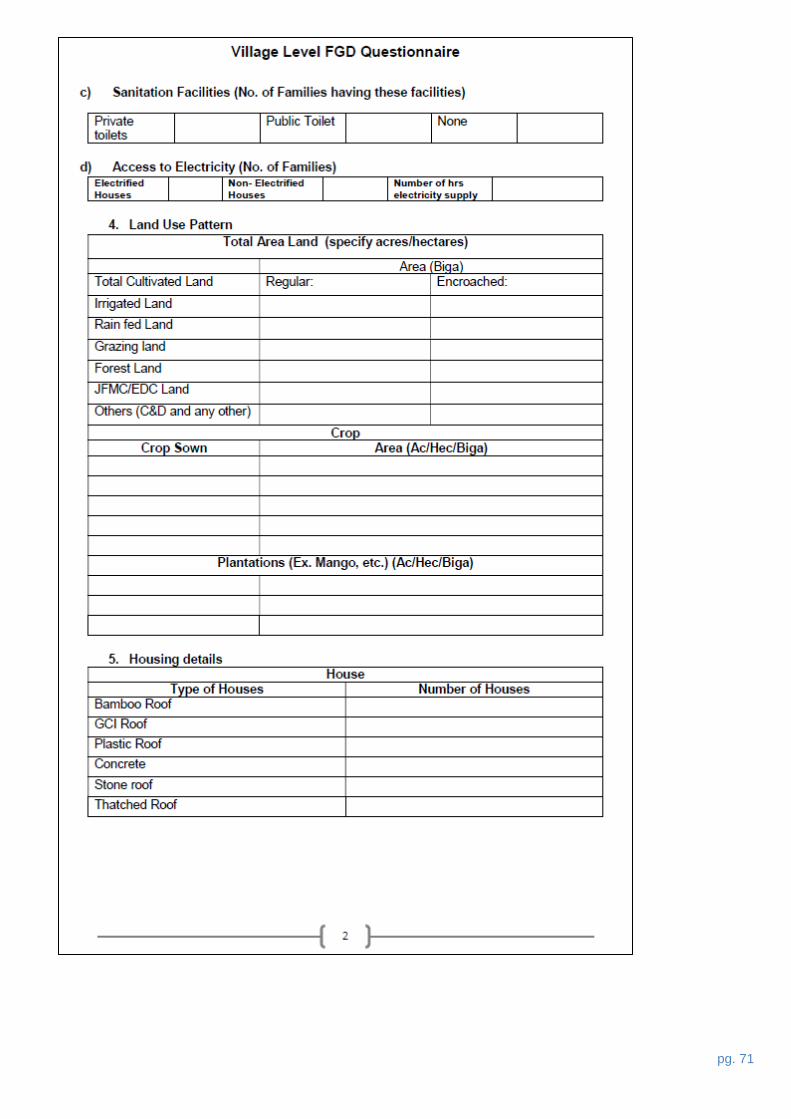
pg. 71
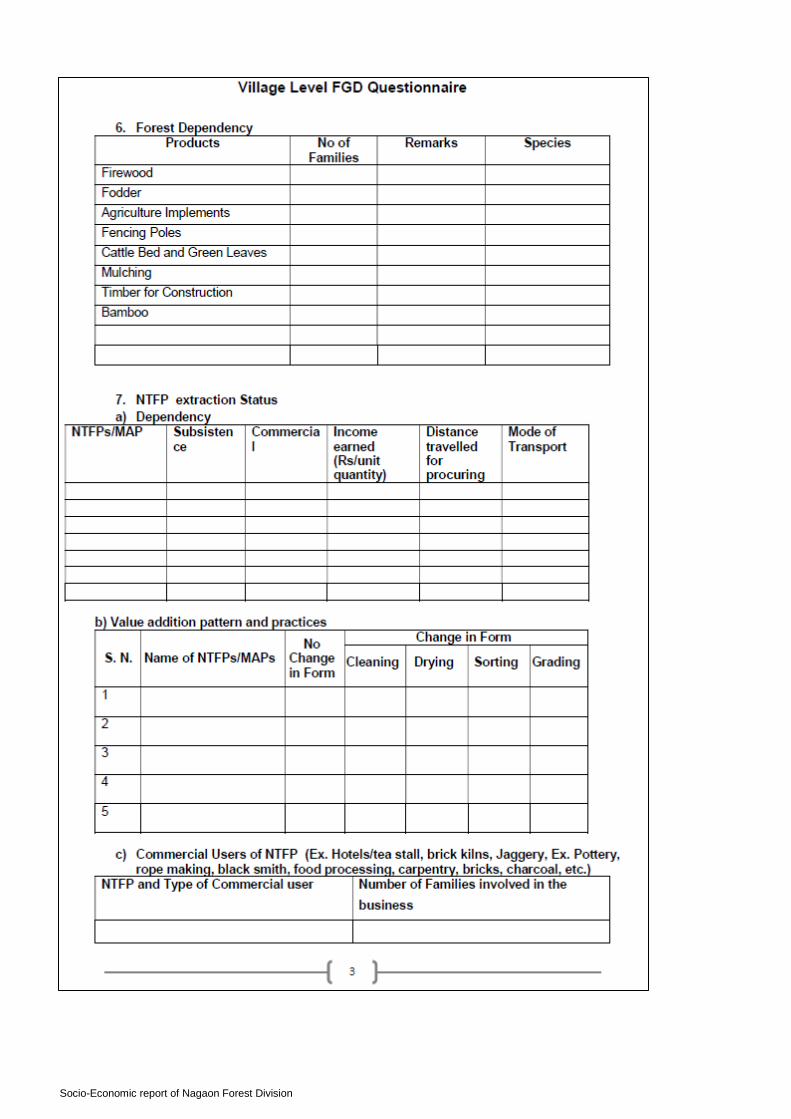
Socio-Economic report of Nagaon Forest Division
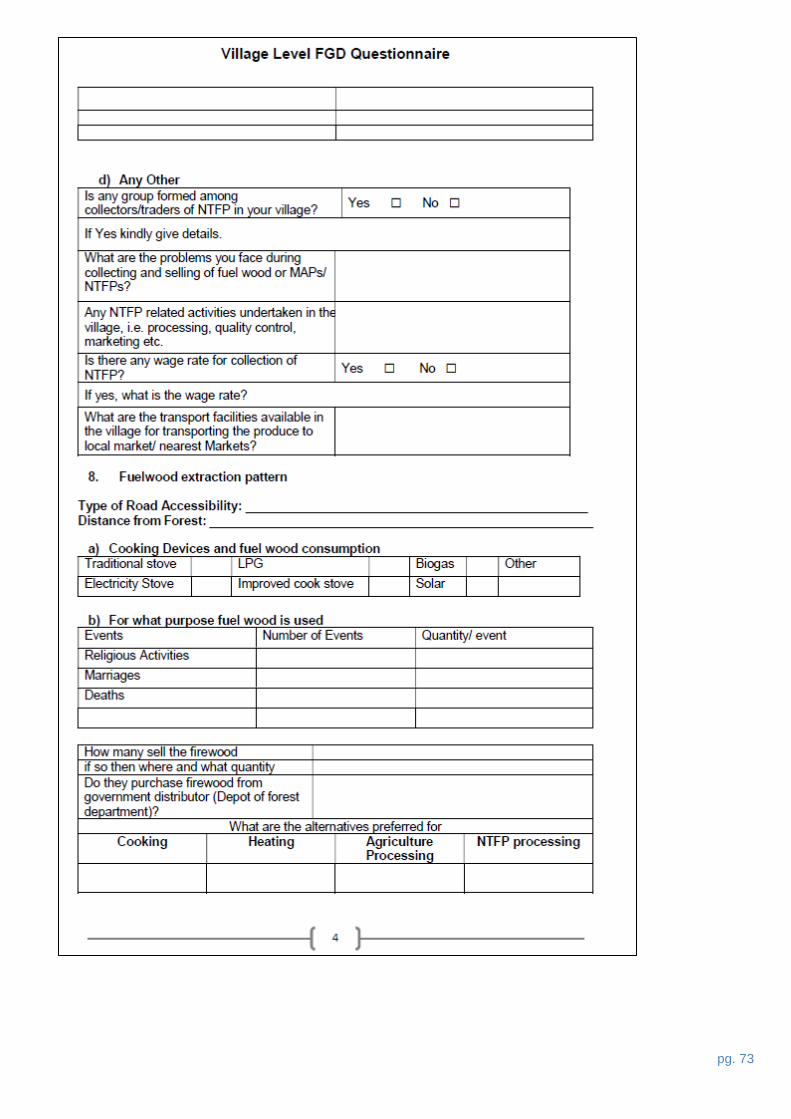
pg. 73

Socio-Economic report of Nagaon Forest Division
pg. 75
Socio-Economic report of Nagaon Forest Division

pg. 77
7 Annexure II: Attendance sheets
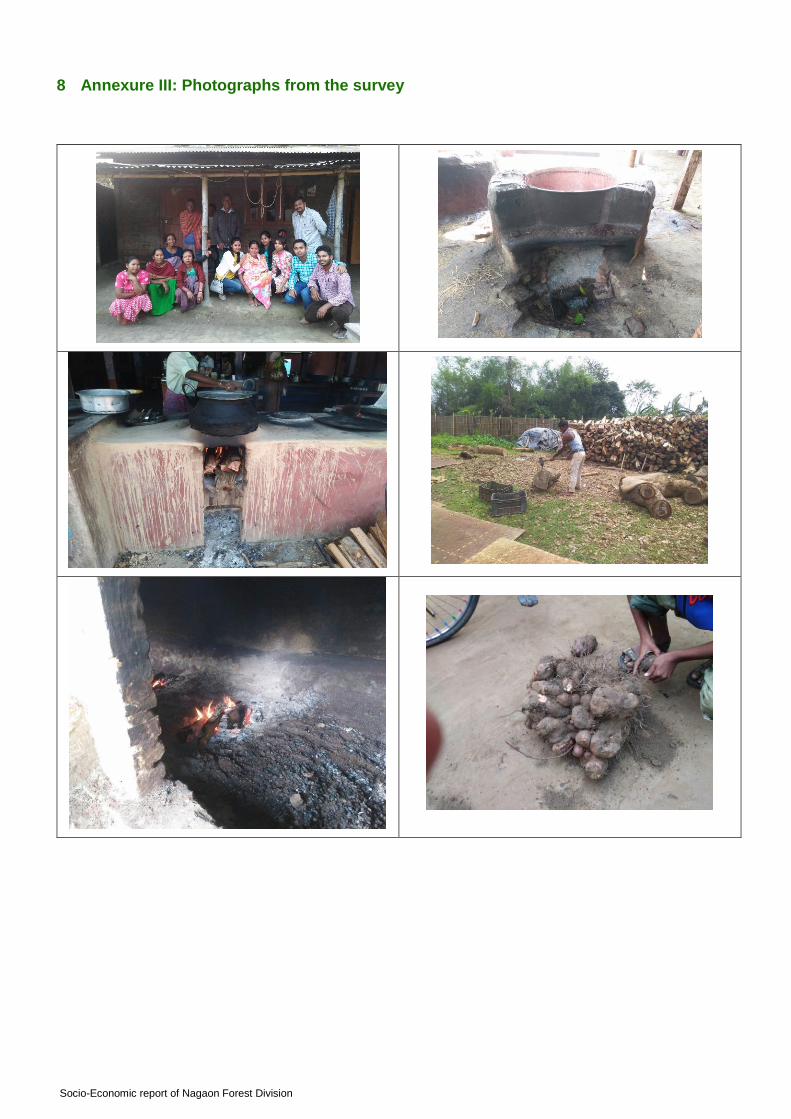
Socio-Economic report of Nagaon Forest Division
8 Annexure III: Photographs from the survey
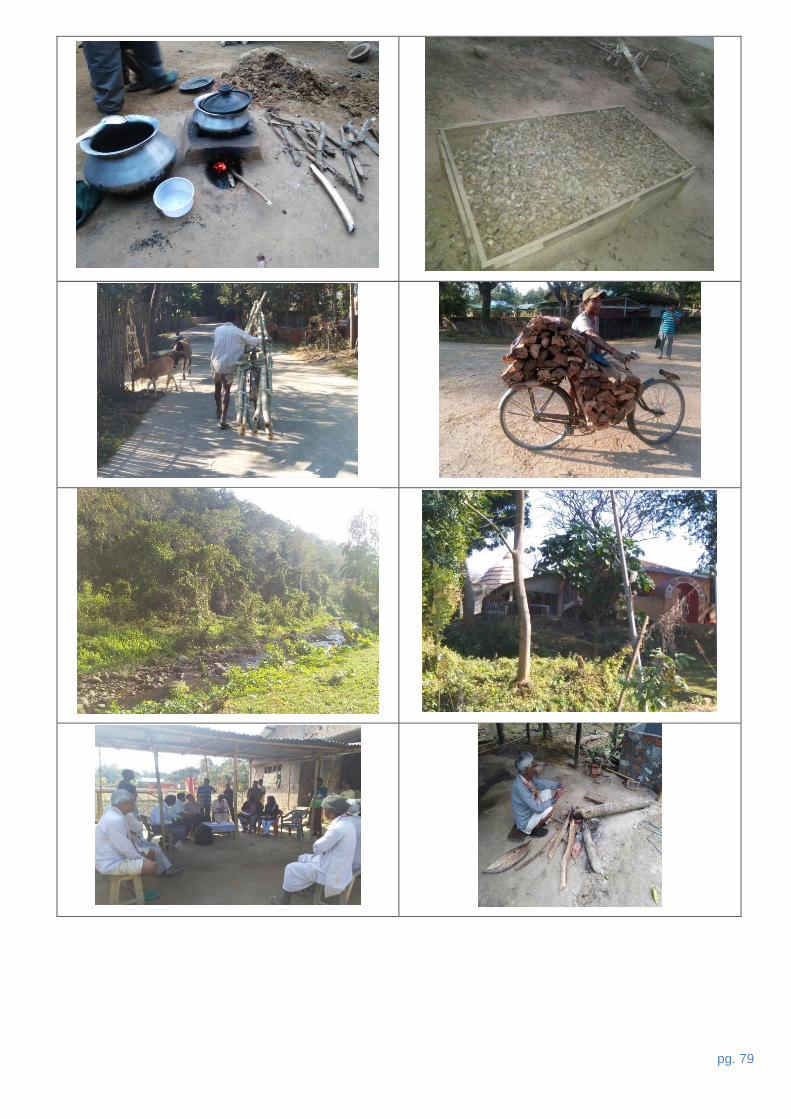
pg. 79
Socio-Economic report of Nagaon Forest Division
pg. 81
IORA Ecological Solutions Pvt. Ltd.
225 B, Indraprastha Gyanmandir Complex,
Lado Sarai Village, New Delhi – 110030
Tel: +91-11-41077549
Fax: +91-11-41023126
Email: [email protected]