Cell Division, Genetics, and Molecular Biology Cell Division ...
158
30 C 30 C unit Cell Division, Genetics, and Molecular Biology Cell Division, Genetics, and Molecular Biology Cancer is a broad group of diseases associated with the uncontrolled, unregulated growth of cells. Much more active than normal cells, cancer cells divide at rates that far exceed those of the parent cells from which they arose. Cancer cells also do not mature into specific cell types, as do normal cells. Cancer cells cannot carry out some of the functions of normal cells, which in turn can seriously affect a patient’s health. Cancer research aims at understanding how cells become cancer cells, and how they differ from normal cells. A research team at the University of Alberta, led by Dr. Mark Glover, is making significant contributions to our knowledge of one form of breast cancer. People at risk of developing this form of breast cancer have a muta- tion in a particular gene, which in turn directs the production of a mutant protein. Dr. Glover’s group created the first three-dimensional model of the part of this pro- tein that is involved in cancer development. This knowledge may lead to a method to screen patients for this type of cancer early on. As you progress through the unit, think about these focusing questions: • What cellular processes allow for reproduction and growth of an organism? • What regulates the transmission of genetic information from one generation to the next? • How is DNA responsible for the production of proteins? 552 Unit 30 C UNIT 30 C PERFORMANCE TASK Investigating Human Traits Genetics allows us to understand and predict the inheritance of traits. This kind of information can be very important for traits that cause health problems, such as cancer. How can human genetic traits be investigated? What do the patterns of inheritance of some common traits tell us about the genes that determine those traits? At the end of this unit, you may apply your skills and knowledge to complete this Performance Task. NEL www.science.nelson.com GO
-
Upload
khangminh22 -
Category
Documents
-
view
3 -
download
0
Transcript of Cell Division, Genetics, and Molecular Biology Cell Division ...

30C30Cunit
Cell Division, Genetics,and Molecular BiologyCell Division, Genetics,and Molecular Biology
Cancer is a broad group of diseases associated with the uncontrolled, unregulated
growth of cells. Much more active than normal cells, cancer cells divide at rates that
far exceed those of the parent cells from which they arose. Cancer cells also do not
mature into specific cell types, as do normal cells. Cancer cells cannot carry out some
of the functions of normal cells, which in turn can seriously affect a patient’s health.
Cancer research aims at understanding how cells become cancer cells, and how they
differ from normal cells. A research team at the University of Alberta, led by
Dr. Mark Glover, is making significant contributions to our knowledge of one form
of breast cancer. People at risk of developing this form of breast cancer have a muta-
tion in a particular gene, which in turn directs the production of a mutant protein.
Dr. Glover’s group created the first three-dimensional model of the part of this pro-
tein that is involved in cancer development. This knowledge may lead to a method
to screen patients for this type of cancer early on.
As you progress through the unit, think about these focusing questions:
• What cellular processes allow for reproduction and growth of an organism?
• What regulates the transmission of genetic information from one generation tothe next?
• How is DNA responsible for the production of proteins?
552 Unit 30 C
UNIT 30 C PERFORMANCE TASKInvestigating Human TraitsGenetics allows us to understand and predict the inheritance of traits. This kind ofinformation can be very important for traits that cause health problems, such as cancer.How can human genetic traits be investigated? What do the patterns of inheritance ofsome common traits tell us about the genes that determine those traits? At the end of thisunit, you may apply your skills and knowledge to complete this Performance Task.
NEL
www.science.nelson.com GO
Ch 17_Bio_Alberta30 1/8/07 3:31 PM Page 552

Cell Division, Genetics, and Molecular Biology 553NEL
Unit 30 C
GENERAL OUTCOMESIn this unit, you will• describe the processes of mitosis and
meiosis
• explain the basic rules and processesassociated with the transmission ofgenetic characteristics
• explain classical genetics at a molecularlevel
Ch 17_Bio_Alberta30 1/8/07 3:32 PM Page 553

Unit 30 CCell Division,Genetics, andMolecularBiology
ARE YOU READY?
554 Unit 30 C NEL
These questions will help you find out what you already know, and what you need toreview, before you continue with this unit.
Knowledge1. Identify the cell structures shown in Figure 1 and explain the importance
or function of each.
Concepts
• DNA, genes, chromosomes
• sexual reproduction
• asexual reproduction
• adaptations and variations
• traits
• nature versus nurture
Skills
• relate biological diversity togenetic diversity
• probability
You can review prerequisiteconcepts and skills on theNelson Web site and in theAppendices.
A Unit Pre-Test is alsoavailable online.
Prerequisites
2. (a) Organize the following structures from largest to smallest: organ,chromosome, organism, nucleus, tissue, DNA molecule, cell, gene.
(b) Copy Figure 2. Use the listed structures in (a) as labels for your diagram.
3. If a human muscle cell contains 46 chromosomes, indicate the number ofchromosomes that you would expect to find in the cells shown in Figures 3, 4, 5,and 6, on the next page.
Figure 1
1
4
5
2
3
Figure 2
www.science.nelson.com GO
Ch 17_Bio_Alberta30 1/8/07 3:32 PM Page 554

Unit 30 C
Cell Division, Genetics, and Molecular Biology 555NEL
4. Provide examples of hereditary traits that are (a) determined by genes(b) influenced by the environment
5. Many single-cell organisms divide by a process called binary fission. One celldivides into two cells identical to each other and identical to the original cell.More complex organisms form specialized sex cells. When sex cells combinefrom two different organisms, they form a fertilized egg or zygote.(a) Identify one advantage of binary fission as a means of reproduction.(b) Identify and explain an advantage of reproduction by the union of sex cells
from different individuals.
6. Explain why the duplication of genetic material is essential prior to division.
Skills 7. Table 1 shows the events in a typical cell cycle. Draw and label a
circle graph to represent the data.
8. A couple are expecting their third child. After the birth of two boys,they reason that the next child will be a girl.(a) Determine the probability of having three boys in a row.(b) Determine the probability that the next child will be a girl.
Figure 3Skin cell, 450�
Figure 4Sperm cell, 1000�
Figure 5Unfertilized egg cell, 2000�
Figure 6Egg cell being fertilized by sperm cell, 5000�
Table 1 Events in the Cell Cycle
Event Time (h)
rapid growth 15
growth and DNA replication 20
preparation for division 10
mitosis 5
Ch 17_Bio_Alberta30 1/8/07 3:32 PM Page 555

In this chapter
1717 Cell Division
chapter
Cell Division
Exploration: ObservingDaphnia
Investigation 17.1:Frequency of Cell Division
Mini Investigation:Cloning from a PlantCutting
Explore an Issue: TheEthics of Stem CellResearch
Web Activity: Stem CellCord Blood
Investigation 17.2:Identification of a Cancer Cell
Mini Investigation:Gamete Formation inGrasshoppers
Investigation 17.3:Comparing Mitosis andMeiosis
Web Activity: ComparingLife Cycles of Plants
Web Activity: Dr. RenéeMartin
Web Activity: ModellingMitosis and Meiosis
All life depends on the ability to grow and reproduce. Both these processes involve celldivision. Organisms that reproduce asexually produce offspring that are identical to theparents. Sexually reproducing organisms exchange genetic information, so that the off-spring have a unique combination of traits. The genetic material determines the proteinsthat make up cells, which ultimately give rise to physical traits.
Daphnia (Figure 1, next page) is a truly remarkable animal. Females can produce off-spring without a mate since they can produce eggs that require no fertilization. Upondevelopment, these eggs become females, which in turn produce females, all of which areidentical to each other and to the parent. Then, in response to some environmental cue,Daphnia begin producing eggs that develop as either males or females. The males andfemales produce sex cells. Sexual reproduction occurs when the sperm cells fertilize theegg cells, producing many offspring with a variety of traits. Asexual reproduction occurswhen food is plentiful, while sexual reproduction is triggered during times of environ-mental stress.
All of the cells in Daphnia arise from one single cell. To develop into the complexorganism in Figure 1, that single cell must divide many times. In this chapter, you willexplore the events that occur during cell division in order to produce cells of the bodyand specialized cells involved in reproduction.
556 Chapter 17 NEL
Answer these questions as best you can with your current knowledge. Then, using the concepts and skills you have learned, you will revise your answers at the end ofthe chapter.
1. Make a list of the advantages of being multicellular.
2. Suggest possible advantages of reproducing(a) asexually(b) sexually
3. If 22 chromosomes are found in the muscle cell of a mouse, predict the number ofchromosomes found in each cell of the following types:(a) brain cell(b) sperm cell (c) fertilized egg cellExplain your predictions.
STARTING Points
Career Connection:Geneticist
Ch 17_Bio_Alberta30 1/8/07 3:32 PM Page 556

Cell Division 557NEL
Exploration Observing Daphnia
Materials: prepared slide of Daphnia, concave depression slide,glycerin, cover slip, Daphnia culture, medicine dropper,microscope, ice cubes, cotton swab
• If available, look at a prepared slide of Daphnia. Take note ofthe Daphnia’s general appearance and the location of certainfeatures (e.g., eyes, antennae, heart) so that you will be ableto identify them more easily in the Daphnia culture.
• Remove the prepared slide. Obtain the other materials. Using acotton swab, smear some glycerin into the depression on theslide. Then, using a medicine dropper, place a small drop ofDaphnia culture onto the glycerin. Prepare a wet mount byadding a cover slip. Examine the slide under low-powermagnification. Pay attention to the movement and heart rateof the organism.
• Place the slide on an ice cube for 3 min, then dry the bottomof the slide with a paper towel and observe once again underlow-power magnification.
(a) Why did you smear glycerin on the slide? (b) Why did you put the slide on an ice cube? (c) Make and label a scientific drawing of a Daphnia. (d) Do you think that Daphnia are composed of many cells?
Describe any features that you observe that demonstratethis fact.
(e) Try viewing the Daphnia under medium power. (Hint: Youmay have to adjust the diaphragm.) Draw what you see.
Figure 1Daphnia is also known as a water flea, but it is a crustacean, not an insect.
eyeantennae
heart
brood pouch
intestine
Ch 17_Bio_Alberta30 1/8/07 3:32 PM Page 557

558 Chapter 17 NEL
17.117.1 The Cell CycleAll the estimated 100 trillion cells that make up your body arose from a single fertilizedegg. As with the frog egg shown in Figure 1, this fertilized egg cell underwent a seriesof divisions that increased the number of cells, thus increasing the size and complexityof your body until eventually you reached your current size. Cell division also maintainsa fully grown individual. All multi-cellular eukaryotic organisms grow in size and main-tain the cells of their body (the somatic cells) by a sequence of events called the cell cycle.
Learning TipDNA, the cell’s hereditaryinformation, is found in thechromosomes of a cell. Ineukaryotic cells (cells with anucleus), the chromosomes are found in the nucleus.Review this information inSection 6.5 of this book.
Figure 1Early stages of cell division of a fertilized frog egg
one division several divisions
The cell cycle is often described as taking place in phases (Figure 2, next page). However,the cycle is a continuous process and does not pause after each phase. During the divi-sion phase (mitosis, or M), the components of the cytoplasm and the components of thenucleus of the parent cell are divided to give rise to two identical daughter cells by twoprocesses, mitosis and cytokinesis. Mitosis ensures the equal distribution of the nuclearcontents. This process includes the duplication of chromosomes, so that each daughtercell ends up with the same number of chromosomes as the parent cell. Cytokinesisdivides the cytoplasm and its constituent organelles of the parent cell roughly equallybetween the daughter cells.
For most cells, the nuclear division that occurs during mitosis marks only a smallpart of their cycle. The stage between division phases, called interphase, is marked bya period of rapid growth (gap 1, or G1), the duplication of chromosomes (synthesis,or S), another period of growth (gap 2, or G2), and preparation for further divisions. Cellscarry out their particular functions during interphase.
Chromosome StructureBefore looking at the details of mitosis, you will need to know something about thestructure of chromosomes. In animals such as humans, the DNA is divided among anumber of chromosomes. Chromosomes contain both DNA and a number of proteins.
cell cycle the sequence of stagesthrough which a cell passes fromone cell division to the next
mitosis (M) a type of cell divisionin which a daughter cell receivesthe same number of chromosomesas the parent cell
cytokinesis the division ofcytoplasm
interphase the time intervalbetween nuclear divisions when acell increases in mass, roughlydoubles the cytoplasmiccomponents, and duplicates itschromosomes
Ch 17_Bio_Alberta30 1/8/07 3:32 PM Page 558

Cell Division 559NEL
Section 17.1
M:mitosis and cytokinesis
cellcycle
S:synthesis of DNAfor duplication of
chromosomes
G1:phase of rapid cellgrowth
G2:growth and
preparation for cell division
I N T E R P H A S E
D I V I S I O N P H A S E
Figure 2 The cell cycle. The circle representsthe entire life cycle of the cell,which can be divided into twomajor phases: interphase and thedivision phase. Most cells spend themajority of their time in interphase.
This combination of DNA and proteins is called chromatin. As the cell moves throughthe cell cycle, chromosomes may be either uncondensed or condensed. Uncondensedchromosomes are long, thin strands that cannot be seen under a light microscope. Acondensed chromosome can be seen under a light microscope and may resemble thediagram in Figure 3. Condensed chromosomes may be either unduplicated or dupli-cated. In a duplicated chromosome, the original chromosome and its duplicate areattached to each other by a structure called the centromere. While attached to oneanother, the two chromosome duplicates are called sister chromatids. Since sister chro-matids contain identical genetic information, the pair, attached at the centromere, isstill considered to be one chromosome.
chromatin the complex of DNAand protein that make upchromosomes
centromere the structure thatholds chromatids together
sister chromatids a chromosomeand its duplicate, attached to oneanother by a centromere untilseparated during mitosis
one chromosome(unduplicated)
one chromosome(duplicated)
centromere
sister chromatids
Figure 3An unduplicated and a duplicatedchromosome
Ch 17_Bio_Alberta30 1/8/07 3:32 PM Page 559
560 Chapter 17 NEL
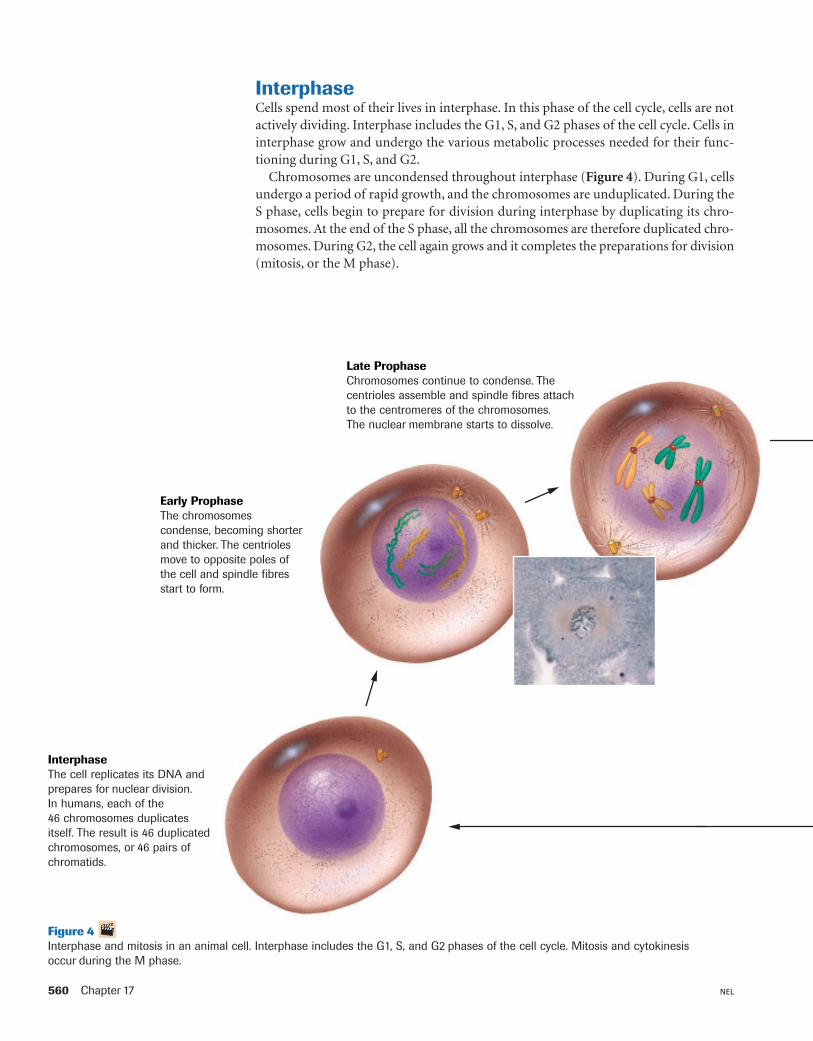
InterphaseCells spend most of their lives in interphase. In this phase of the cell cycle, cells are notactively dividing. Interphase includes the G1, S, and G2 phases of the cell cycle. Cells ininterphase grow and undergo the various metabolic processes needed for their func-tioning during G1, S, and G2.
Chromosomes are uncondensed throughout interphase (Figure 4). During G1, cellsundergo a period of rapid growth, and the chromosomes are unduplicated. During theS phase, cells begin to prepare for division during interphase by duplicating its chro-mosomes. At the end of the S phase, all the chromosomes are therefore duplicated chro-mosomes. During G2, the cell again grows and it completes the preparations for division(mitosis, or the M phase).
Late ProphaseChromosomes continue to condense. Thecentrioles assemble and spindle fibres attachto the centromeres of the chromosomes. The nuclear membrane starts to dissolve.
InterphaseThe cell replicates its DNA andprepares for nuclear division. In humans, each of the 46 chromosomes duplicatesitself. The result is 46 duplicatedchromosomes, or 46 pairs ofchromatids.
Early ProphaseThe chromosomescondense, becoming shorterand thicker. The centriolesmove to opposite poles ofthe cell and spindle fibresstart to form.
Figure 4 Interphase and mitosis in an animal cell. Interphase includes the G1, S, and G2 phases of the cell cycle. Mitosis and cytokinesisoccur during the M phase.
Ch 17_Bio_Alberta30 1/8/07 3:32 PM Page 560

Cell Division 561NEL
The Stages of Mitosis
ProphaseProphase is the first phase of mitosis. The chromosomes in the nucleus become visible undera microscope as they shorten and thicken (Figure 4). In animal cells, a small body in thecytoplasm separates and its parts move to opposite poles of the cell as the chromosomesbecome visible. These tiny structures, called centrioles, provide attachment for thespindle fibres, which serve as guide wires for the attachment and movement of the chro-mosomes during cell division. Collectively, the centrioles and spindle fibres make up thespindle apparatus. Most plant cells do not have centrioles, but spindle fibres still formand serve a similar purpose. The centromere joining the two chromatids helps anchorthe chromosomes to the spindle fibres. When viewed under a microscope during prophase,the nuclear membrane appears to fade; in effect, it is dissolving to allow the separation ofchromosomes and cell organelles.
Section 17.1
MetaphaseChromosomes line upat the equatorial plate.The nuclear membranecompletely dissolves.
AnaphaseThe centromeres divide andthe resulting chromosomes,formerly chromatids, move toopposite poles of the cell. Anidentical set of chromosomesmoves to each pole.
TelophaseChromosomes lengthen again, thespindle fibres dissolve, and a nuclearmembrane forms around thechromosomes. In humans, each newnucleus contains 46 uniquechromosomes.
centriole small protein body foundin the cytoplasm of animal cells thatprovides attachment for spindlefibres during cell division
spindle fibre protein structure thatguides chromosomes during celldivision
Ch 17_Bio_Alberta30 1/8/07 3:32 PM Page 561

562 Chapter 17 NEL
MetaphaseThe second phase of mitosis is metaphase. Chromosomes composed of sister chromatidsmove toward the centre of the cell. This centre area is called the equatorial plate, because,like the equator of Earth, it is midway between the poles of the cell. The chromosomesappear as dark, thick filamentous structures that are attached to the spindle fibres. Eventhough they are most visible at this stage, it is still very difficult to count the number ofchromosomes in most cells because the chromosomes are entangled. Chromatids canbecome intertwined during metaphase.
AnaphaseAnaphase is the third phase of mitosis. The centromeres divide and the sister chro-matids, now referred to as chromosomes, move to opposite poles of the cell. If mitosisproceeds correctly, the same number and type of chromosomes will be found at eachpole. Occasionally, segments of the chromatids will break apart, and may reattach, inanaphase.
TelophaseThe last phase of mitosis is telophase. The chromosomes reach the opposite poles of thecell and begin to lengthen. The spindle fibres dissolve and a nuclear membrane formsaround each mass of chromatin. Telophase is followed by cytokinesis, the division ofthe cytoplasm.
CytokinesisOnce the chromosomes have moved to opposite poles, the cytoplasm begins to divide.Cytokinesis appears to be quite distinct from nuclear division. In an animal cell, afurrow develops, pinching off the cell into two parts. This is the end of cell division.In plant cells, the separation is accomplished by a cell plate that forms between the twochromatin masses. The cell plate will develop into a new cell wall, eventually sealingoff the contents of the new cells from each other.
Cells are grown in culture.
Total: 50 cell divisions
Cells are frozenin liquid
nitrogen after20 divisions.
Cells are frozenin liquid
nitrogen after40 divisions.
After cells thaw,they divide 30more times.
After cells thaw,they divide 10more times.
Figure 5Cell division appears to becontrolled by a biological clock.
Situation A Situation B
Practice1. List the stages of mitosis. Briefly describe what occurs in each stage. To help in your
description, sketch the sequence of events that occurs in an animal cell. Includelabels for different structures.
2. A cell with 10 chromosomes undergoes mitosis. Indicate how many chromosomeswould be expected in each of the daughter cells.
A Cell ClockHow old can cells become? If cells continue to undergo mitosis, could an organismstay eternally young and live forever? Research on cultured cells (cells grown in a nutrientmedium) indicates that a biological clock may regulate the number of cell divisionsavailable to cells. When immature heart cells maintained in tissue culture were frozen,they revealed an internal memory of the number of cell divisions they had undergone.If a cell had undergone twenty divisions before freezing, the cell completed anotherthirty divisions once it thawed, then died. When a cell was frozen after ten divisions, itcompleted another forty divisions after thawing and then died. Cells always completeda total of fifty divisions no matter how long the freezing or at what stage the cell divi-sion was suspended (Figure 5).
Mitosis and Cell Division inPlants and AnimalsThis Audio Clip highlights theobservable differences betweenplant and animal cell mitosis andcytokinesis.
EXTENSION +
www.science.nelson.com GO
Ch 17_Bio_Alberta30 1/8/07 3:32 PM Page 562

Cell Division 563NEL
Not all cells of the body have the same ability to undergo mitosis. Age is one reasoncells stop dividing. However, division is usually stopped by cell specialization. Relativelyunspecialized cells, such as skin cells and the cells that line the digestive tract, reproducemore often than do the more specialized muscle cells, nerve cells, and secretory cells.Only two cell types in the human body divide endlessly: the sperm-producing cells,called spermatogonia, and the cells of a cancerous tumour. Males are capable of pro-ducing as many as one billion sperm cells a day from the onset of puberty well into oldage. However, once the sperm cells are formed, they lose the ability to divide further.Cancer cells divide at such an accelerated rate that the genes cannot regulate the prolif-eration and cannot direct the cells toward specialization.
It would appear that the more specialized a cell is, the less able it is to undergo mitosis.The fertilized egg cell is not a specialized cell; differentiation begins to occur only afterits third division, which results in eight cells. Interestingly, it is at the point where dif-ferentiation begins that the biological clock within the cell is turned on.
Section 17.1
• Cell division produces new cells for cell growth and for the replacement ofworn-out cells in the body.
• Cell division involves a series of steps that produce two genetically identicaldaughter cells. Two divisions occur during cell division: nuclear division(mitosis) and cytoplasmic division (cytokinesis).
• During interphase, genetic material is replicated.
• Cells seem able to divide only a finite number of times.
• Cells lose the ability to divide as they specialize.
SUMMARY The Cell Cycle
Purpose Design AnalysisProblem Materials EvaluationHypothesis Procedure SynthesisPrediction Evidence
To perform this investigation, turn to page 587.
Frequency of Cell DivisionIn this activity, you will view and compare cells from onion cellsand from a whitefish blastula in various stages of mitosis.Because slides are used, the cell divisions you will be viewing arefrozen in time. Therefore, it will not be possible for you to watch asingle cell progress through the stages of mitosis. Based on yourobservations, you will determine the frequency of cell division
and construct a clock representing the division cycle, given thetime taken to complete one cycle of mitosis. In a table, you willrecord the number of cells in each stage of mitosis.
INVESTIGATION 17.1 Introduction Report Checklist
Cancer and MetastasisCells that divide uncontrollablycan become cancer. Thisanimation shows how cancer cellscan spread from one part of thebody to another.
www.science.nelson.com GO
EXTENSION +
Ch 17_Bio_Alberta30 1/8/07 3:32 PM Page 563

564 Chapter 17 NEL
Section 17.1 Questions1. During interphase, what event must occur for the cell to be
capable of undergoing future divisions?
2. Using a dictionary, look up the meaning of the prefixesused in the stages of mitosis: pro-, meta-, ana-, and telo-.Why would they be used in the naming of the phases ofmitosis?
3. Compare and contrast the structure of the daughter cellswith that of the original parent cell.
4. Describe the structure and explain the function of thespindle fibres.
5. What is the significance of cytokinesis? Speculate whatwould happen if cytokinesis did not occur.
6. When a cell has reached its maximum size, what twoalternatives does it have? When does the cell carry out onealternative over the other?
7. What would happen if you ingested a drug that preventedmitosis? What if it only prevented spindle fibre formation?
8. A cell from a tissue culture has 38 chromosomes. After mitosis and cytokinesis, one daughter cell has39 chromosomes and the other has 37. What might haveoccurred to cause the abnormal chromosome numbers?
9. Suppose that during mitosis, both sister chromatids movedto the same pole, resulting in daughter cells with adifferent number of chromosomes than the parent cell.How might this abnormality affect cell structure, cellfunction, or both?
10. Explain the concept of the cell clock.
11. Suggest reasons why skin cells, blood cells, and the cellsthat line the digestive tract reproduce more often thanother types of cells such as muscle cells. If some of thesecells were to become cancerous, how might a chemicaltherapy to stop those cells from reproducing work?
12. (a) Describe the differences between the two cell cycles inFigure 6.
(b) Which cell cycle do you believe would represent a cellof an embryo and which would represent anunspecialized cell in an adult? Give your reasons.
13. List areas of the body where you think cell division is mostrapid. Also, indicate the comparative level of specializationof the cells in each area. Explain your predictions.
14. It is believed that weed killers like 2,4-D and 2,4,5-T maywork by stimulating cell division. Why would the stimulationof cell division make these chemicals effective weed killers?
15. At one time, blood was transfused only from youngerindividuals to the elderly. It was believed that youngerblood would provide the elderly with more energy. Doolder people actually have older blood cells? Support youranswer.
16. X-rays and other forms of radiation break chromosomesapart. Physicians and dentists will not X-ray pregnantwomen. Even women who are not pregnant wear a leadapron when being X-rayed near the reproductive organs.The apron blocks the passage of X-rays. Why is itundesirable to X-ray the reproductive organs? Why is itespecially undesirable to X-ray pregnant women?
17. Scientists have developed techniques aimed at gettinghighly-specialized cells to act as if they are immature cellsthat have not yet become specialized. Why would scientistswant to be able to get a mature nerve cell to respond likea cell that hasn’t undergone specialization?
S
S
G1
M
Cell Cycle for Cell A: 36 h
Cell Cycle for Cell B: 25 h
cellcycle
cellcycle
M
G1
G2
G2
Figure 6
Ch 17_Bio_Alberta30 1/8/07 3:32 PM Page 564

Cell Division 565NEL
17.217.2Applications of the Cell CycleScientists continue to study the cell cycle and to gain a deeper understanding of themechanisms and the role of the process. As more is learned about the cell cycle, we havebeen able to apply this knowledge to many human needs. There are various perspec-tives on the costs and benefits of these new technologies, and when they are appropriateto use.
CloningCloning is the process of forming identical offspring from a single cell or tissue in theparent organ. A clone originates from a single parent cell, and both the clone and parenthave identical (or nearly identical) nuclear DNA. Although some clones show accidentalchanges in genetic information, cloning does not result in the variation of traits thatwould occur with the combination of male and female sex cells. Cloning is therefore con-sidered a form of asexual reproduction. In fact, clones occur naturally. Some species, suchas hydra (Figure 1 (a)) reproduce by undergoing mitosis to produce buds with identicalDNA to the larger parent cell. The smaller plantlets on a runner of a strawberry plantare identical clones of the larger parent plant (Figure 1 (b)). In animals, offspring with anidentical genetic makeup are sometimes produced when a single fertilized egg under-goes mitosis and the resulting early embryo (called a zygote) then splits in two (Figure 1(c)). This results in identical twins. They are also called monozygotic twins, since theyformed from a single zygote. Fraternal twins are formed when two different eggs are fer-tilized separately. They are also known as dizygotic twins. Fraternal twins, therefore, areno more genetically similar than are non-twin siblings (Figure 1 (d)).
Figure 1(a) Hydra reproduce asexually by budding. The buds break off to form separate, genetically
identical organisms.(b) The strawberry plant can reproduce asexually by forming genetically identical plantlets on
runners. (c) Identical twins originate from a single fertilized egg that undergoes mitosis to produce an
early embryo which then splits into two, producing two genetically identical individuals. (d) Development of fraternal twins does not involve the splitting of a fertilized egg. Instead,
fraternal twins develop from two independent fertilization events, such as occurs when amother has two eggs in her uterus that are fertilized by two different sperm cells. Eachfertilized egg then develops independently.
(a) (b) (c) (d)
Multiple BirthsIt has been estimated that 1 in 85births will produce twins, 1 in 7500will produce triplets, 1 in 650 000will produce quadruplets, and 1 in57 000 000 will producequintuplets.
DID YOU KNOW ??
Ch 17_Bio_Alberta30 1/8/07 3:32 PM Page 565

566 Chapter 17 NEL
Plant Cloning TechnologyIn 1958, Fredrick Stewart created great excitement in the scientific world when he revealedthat he had produced a plant from a single carrot cell (Figure 3). Today, this technique
mini Investigation Cloning from a Plant Cutting
In some plants, asexual reproduction is accomplished naturallywhen a portion of the plant, such as a stem or leaf, breaks offand develops roots at the base of the broken portion. It ispossible for the broken part to become a new plant. This activityis an example of artificial propagation.
Materials: coleus plant, scissors, goggles, gloves, fungicide,flower pot, potting soil, apron
The fungicide is poisonous. Review the MSDSbefore beginning this investigation. Any spills onthe skin, in the eyes, or on clothing should bewashed immediately with cold water. Report anyspills to your teacher.
step 1 step 2 step 3 Figure 2
• Perform the following steps as shown in Figure 2.
1. Using scissors, carefully cut off the tips of three coleusstems. Cut on an angle. Include several leaves on eachstem.
2. Remove a few leaves from the bottom. Put on splashgoggles, and wear gloves and/or use tongs to immerse thestem in fungicide.
3. Plant the cuttings in soil.
• Record each cutting’s initial height and number of leaves.Take these measurements every week for two months.
• Describe the new plants each time.
(a) What evidence suggests that coleus can regenerate partsof the plant that were lost?
(b) Without removing the plant from the pot, how can youdemonstrate that the roots from the cutting are growing?
single cell extractedfrom carrot
carrot clone
Figure 3Fredrick Stewart was able to grow aclone from a single cell of a carrotplant. This allowed production ofmany identical individuals from asexually reproducing species. Thiswas the first application ofknowledge of mitosis in generatingclones.
Ch 17_Bio_Alberta30 1/8/07 3:32 PM Page 566

Cell Division 567NEL
is commonly called cloning. Many commercially important plant species, includingorchids, are now produced from clones. Unlike plants that arise from sexual reproduc-tion, cloned plants are identical to their parents. This allows production of strains ofplants with predictable characteristics. Not all plant species can be cloned, however.Carrots, ferns, tobacco, petunias, and lettuce respond well to cloning, but the grass andlegume families do not. Scientists continue to investigate these differences.
Each cell in the cloned plant contains the complete complement of chromosomesfrom the parent. As the new plant develops, it undergoes mitosis to increase in size.Some cells then specialize (differentiate) and form roots, stems, or leaves, until a com-plete plant is formed.
Animal Cloning TechnologyWhile plant cloning experiments were being conducted, Robert Briggs and Thomas Kingwere busy investigating nuclear transplants in frogs. Working with the common grass frog,the scientists extracted the nucleus from an unfertilized egg cell by inserting a fine glass tube,or micropipette, into the cytoplasm and sucking out the nucleus (Figure 4). A cell withouta nucleus is referred to as enucleated.
Section 17.2
enucleated the condition where acell does not contain a nucleus
Figure 4A small glass tube, called a micropipette, is used to remove the nucleus from a cell andlater introduce a new nucleus.
Figure 5Cloning a common grass frog usingembryo splitting
unfertilized egg
sperm
mitotic division
blastula stage:mitosis has occurred
nucleus is removed
nucleustransferred
cell with thetransplantednucleus beginsto divide by mitosis
blastula
enucleated cell
separated cells
adult frog
Next, the nucleus of a cell from a frog embryo in the blastula stage of development wasremoved and inserted into the enucleated cell (Figure 5). The egg cell with the transplantednucleus began to divide much like any normal fertilized egg cell. In later trials, the cellwith the transplanted nucleus occasionally grew into an adult frog. The adult frogs dis-played the characteristics from the transplanted nucleus. Careful analysis proved thatthe adults were clones of the frog that donated the nucleus.
However, different results were obtained when the nucleus was taken from cells at laterstages of development. For example, the nucleus from cells in a later stage, called the gas-trula stage, did not bring the enucleated egg from the single-cell stage to the adult. Ifmitosis occurred at all, it did not progress as far as it did in eggs that received a blastulanucleus. The difference is that the nucleus of a cell in the gastrula stage of development,unlike a cell in the earlier blastula stage, has specialized. As cells begin to specialize, theybecome less able to undergo mitosis.
Ch 17_Bio_Alberta30 1/8/07 3:32 PM Page 567

568 Chapter 17 NEL
Cloning from adult mammalian cells has proved even more difficult, since they tendto be highly specialized. Until recently, the only way to get clones was by splitting off cellsfrom a developing embryo (Figure 6). However, cells beyond the eight-cell stage of devel-opment seem to be unable to stimulate cell division.
donor mouse (white)
Nucleus fromdonor is injectedinto enucleatedegg.
Unfertilized eggis removed andenucleated.
recipient mouse (brown)
Cell is culturedin laboratory.
Cell mass isimplantedin recipient.
cloned offspring(white)
Developing cells from earlystage of embryodevelopment are collected.
Single cellsare isolatedand nucleusis extracted.
Figure 6Cloning a mammal using embryo splitting
The long-held scientific belief that adult cells cannot be used to clone animals wasdisproved with the appearance of a sheep named Dolly. Dr. Ian Wilmut, of the RosalindInstitute in Scotland, extracted the nucleus from an udder cell of an adult Finn Dorsettsheep and placed the nucleus into the enucleated egg cell from a Poll Dorsett sheep. Theegg was allowed to develop in a Petri dish until an early embryo stage was reached.Then this embryo was placed into the womb of a third sheep, a Scottish Blackface. Hergenetic information was shown to be identical to that of the Finn Dorsett adult; Dollywas a clone (Figure 7).
Medical experimentation and research could potentially benefit from the availabilityof cloned animals. For example, experiments on the effectiveness of a drug are oftendifficult to interpret because of the genetic variation among the individuals tested. If allthe test subjects were genetically identical, clearer results could be obtained. In agricul-ture, the strongest livestock could be cloned, decreasing farmers’ losses due to disease, andthereby increasing yield. However, many people have moral and ethical problems withthis technology and worry about the impact on society .
Figure 7Dolly could claim three differentsheep as mothers. The geneticmother died before Dolly was born.
Ch 17_Bio_Alberta30 1/8/07 3:32 PM Page 568

Cell Division 569NEL
Section 17.2
Practice1. List the steps involved in cloning animals from nuclei taken from the blastula stage
of development.
2. Why are identical twins often called “nature’s clones”?
3. Do all the cells of your body divide at the same rate? Explain.
4. What is an enucleated cell?
The Ethics of Stem Cell ResearchA stem cell is a cell from which any other type of cell canarise (stem). Upon receiving the appropriate signals, stemcells differentiate into specialized cells with a particularfunction, such as heart muscle cells. Since a stem cell has notdifferentiated, it can undergo many cell divisions. Fertilizedeggs and early embryos are composed entirely of stem cells.Plants retain many stem cells throughout life, in the growingtips of roots and shoots. Some adult animals also retain manystem cells, such as in salamanders that can grow a lost tail. In contrast, the adult human body has very few stem cells.Stem cells are found in the adult human body in bonemarrow, fat, blood, and even in hair follicles. The richestsource of non-embryonic stem cells is umbilical cord blood.
Stem cells have the potential of having enormous medicalbenefits. Since stem cells can potentially give rise to any othertype of cell, they may be able to help people whose cells arenot able to function properly. For example, stem cells could beused to replace faulty insulin-producing cells in the pancreasof diabetics or faulty neurotransmitter-producing cells in thebrains of people with Parkinson disease.
Some people do not agree with the use of stem cells onethical grounds. Scientists still do not fully understand how asingle, unspecialized cell becomes a complex organism withmany specialized cells. Some people worry that scientists may
Issue Design AnalysisResolution Evidence Evaluation
Issue ChecklistEXPLORE an issue
use human embryos to answer these questions. Othersbelieve that any cell that can potentially give rise to a humanbeing should not be used for research or therapy.
• In small groups, conduct background research on thisrapidly changing field of research using newspapers,periodicals, CD-ROMs, and the Internet. Outline how theissue is changing and any new issues that are emerging.Prepare a bibliography and make notes as you work.
• Based on your background research, describe one ethicalissue related to the use of stem cells in research or therapy.
• For the issue you have stated, write a statement thatdescribes one viewpoint. For example, you might state,“Withholding a potential cure because it uses stem cells isunethical, because it causes people with a medicalcondition to suffer.”
• Decide whether you agree or disagree with the statement. If necessary, conduct additional research to find evidenceto support or refute your viewpoint.
• Write a position paper. Be prepared to defend your group’sposition to your classmates.
www.science.nelson.com GO
WEB Activity
www.science.nelson.com GO
Web Quest—Stem Cell Cord BloodResearch into stem cell cord blood has provided major steps forward in scientific under-standing. It is becoming commonplace for parents to save the blood from their newborn'sumbilical cord and to bank it in case of future medical needs. The issue is no longer whether ornot banking the cord blood is acceptable, but rather the argument between the use of privateor public stem cell cord blood banks. This Web Quest asks you to develop a supported positionon this issue and create a presentation that can be given to your class.
Stem CellsThis NOVA video asks what arestem cells and how do we find abalance between hope for curesand respect for life.
www.science.nelson.com GO
EXTENSION +
Stem Cells UpdateThis NOVA video discusses a newtechnique for creating stem cellsthat may ease ethical concerns.
www.science.nelson.com GO
EXTENSION +
Ch 17_Bio_Alberta30 1/8/07 3:32 PM Page 569

570 Chapter 17 NEL
Mitosis and TelomeresTelomeres are caps at the ends of chromosomes (Figure 8). Scientists have determinedthat telomeres reduce in length each time a cell goes through the cell cycle and divides.Telomeres might have a role in cell aging and in the behaviour of cancer cells.
In 1984, Carol Greider and Elizabeth Blackburn set out to find the enzyme that affectedthe length of the telomere. Not only did they find the enzyme, but they also discoveredmuch about how it works. Dr. Blackburn demonstrated a connection between telomeraseand aging. Yeast cells that lack the enzyme telomerase undergo telomere shortening andeventually die. Other researchers working in Scotland found that as human cells age,telomere length shortens. The length of the chromosomes of a 70-year-old human is muchshorter than that of a child. As we saw in Section 17.1, normal cells pass through thecell cycle only a finite number times. Once a cell can no longer undergo mitosis, celldeath occurs. Telomeres length serves as a molecular “clock” for cellular aging.
What impact does telomere length have on cloning technology? The answer is notyet clear. Since Dolly was cloned from the cells of a six-year-old sheep, she began lifewith shorter telomeres than would a non-cloned sheep. Dolly developed arthritis at anearly age and died of lung disease in February of 2003 at only six years of age—half thenormal life expectancy of a sheep. These events may be linked to telomere length.However, some cloned animals appear to have longer telomeres, as if they were younger.
In the human body, cells generally undergo mitosis only 50 to 100 times during theirlifespan. Cancer cells, however, never seem to lose their ability to divide, and theirtelomere length is also maintained. Telomerase is also not present in most normal cells.A group working at McMaster University under the direction of Calvin Harley was thefirst to show that telomerase is reactivated in human cancer cells. This allows cancercells to maintain telomere length and, therefore, their ability to divide (Figure 9). Dr. Harleyis now working with a pharmaceutical company to develop a drug that can block telom-erase action. They hope that decreasing telomerase activity will slow cell division of thecancer cells, but have little impact on normal cells.
telomere
telomere
cell
nucleus
chromosome
Telo
mer
e Le
ngth
Number of Cell Divisions
somatic cellsTelomerase is inactive.Telomeres shorten.
thresholdto senescenceMost cellsstop dividing. crisis
Most cells die.
abnormal cellsignore warningsto stop dividingTelomerase is inactive. Telomeres shorten.
immortalized somatic cells and tumor cells Telomerase is active.Telomeres are maintained.
Figure 8Telomeres are end caps ofchromosomes. An enzyme, calledtelomerase, acts on the telomerecausing changes in length.
Figure 9The activity of telomerase in normal cells (turquoise line) decreases as the cell ages. Eventually, the cells reach the point where damage to the chromosomes will result ifthe telomeres become any shorter. At this point, normal cells stop dividing and die. Abnormal cells continue to divide (yellow line). Cancer cells (brown line) reactivate telomerase and so are able to continue mitosis.
telomere the cap at the end of achromosome
Ch 17_Bio_Alberta30 1/8/07 3:33 PM Page 570

Cell Division 571NEL
Section 17.2
• Cloning is the process of forming identical offspring from a single cell or tissue.
• Cloning permits the production of offspring with characteristics identical tothose of the parent.
• Some plants and animals naturally clone themselves (reproduce asexually).
• Technologies have been developed to clone both plants and animals. Furtherdevelopment of cloning technology relies on increased understanding of cellprocesses such as mitosis.
SUMMARY Applications of the Cell Cycle
Section 17.2 Questions1. Describe how nuclear transplants are used to clone frogs.
2. Dolly was not the first cloned animal, nor was she the firstmammal clone. What made her cloning so special?
3. Explain why male animals would no longer be needed ifcloning became the accepted method of reproduction.
4. If the nucleus is extracted from an adult animal cell andplaced into an enucleated egg, how would it be possible todistinguish the cloned individual from the original?
5. Make a list of benefits and potential problems associatedwith cloning farm animals.
6. Speculate on the potential benefits and problemsassociated with cloning humans.
7. Research the nature versus nurture debate and theevidence provided by studies of twins. Find out aboutsome psychological conditions that have both a geneticand an environmental component. What are theadvantages and disadvantages of each approach? Thinkabout the social, moral, and ethical implications of eachviewpoint.
www.science.nelson.com GO
Purpose Design AnalysisProblem Materials EvaluationHypothesis Procedure SynthesisPrediction Evidence
To perform this investigation, turn to page 589.
Identification of a Cancer CellCancer cells have unique features that can be used to distinguishthem from non-cancerous cells. These differences can be usedby medical professionals as a means of detecting cancer, often inearlier, easy-to-treat stages by technologies such as X-rays,infrared photography, and cell biopsies. Some of thesedifferences can be viewed using a light microscope. What arethese differences? Do they relate to the ability of these cells tocontinue undergoing mitosis?
In this investigation, you will examine stained slides ofcancerous and non-cancerous cells under a light microscope toobserve some differences between these cell types.
INVESTIGATION 17.2 Introduction Report Checklist
Ch 17_Bio_Alberta30 1/8/07 3:33 PM Page 571

572 Chapter 17 NEL
17.317.3 MeiosisMeiosis is the type of cell division involved in the formation of sex cells, or gametes. Inhumans, this takes place in the testes and ovaries. Meiosis involves two stages of celldivision that have some similarities to the phases in mitosis. In mitosis, the chromo-some number of the daughter cells is the same as in the parent cell. In meiosis, the chro-mosome number of the daughter cells is half that of the parent cell. A human cellcontaining 46 chromosomes will undergo meiosis and produce gametes that have 23 chromosomes. Each gamete will contain both the same number and the same kindof chromosomes. The number of chromosomes in a gamete is called the haploidchromosome number, or n ; the number of chromosomes in all other cells having anucleus is twice the haploid number and is called the diploid number, or 2n. In humans,the haploid chromosome number is 23 and the diploid chromosome number is 46.
Offspring carry genetic information from each of the parents. This explains why youmight have your father’s eyes but your mother’s hair. Although you may look more likeone parent than another, you receive genetic information from each parent. For example,your father gives you a chromosome with genes that code for eye colour, but so does yourmother. Each of the 23 chromosomes that you receive from your biological father ismatched by 23 chromosomes from your biological mother, so that each parent givesyou half of your genetic information. The paired chromosomes are called homologouschromosomes because they are similar in shape, size, and gene arrangement (Figure 1).The genes in homologous chromosomes deal with the same traits. Each cell in yourbody, except the sex cells, contains 23 pairs of homologous chromosomes, or 46 chro-mosomes in total. The 23rd pair of chromosomes, which determine sex in mammals, arecalled the X and Y chromosomes and are only partially homologous. Males receive an Xand a Y chromosome and females receive two X chromosomes. You will learn moreabout these chromosomes later in this chapter and in Chapter 22.
During fertilization, a haploid (n = 23) sperm cell unites with a haploid(n = 23) egg cell to produce a diploid (2n = 46) zygote. The fusion of male and femalegametes restores the diploid chromosome number in the zygote. The zygote will begindividing by mitosis and will eventually become a multicellular human baby.
Stages of MeiosisMeiosis involves two nuclear divisions that produce four haploid cells. Meiosis I is oftencalled reduction division because the diploid, or 2n, chromosome number is reduced tothe haploid, or n, chromosome number. The second phase, meiosis II, is marked by a sep-aration of the two chromatids. The phases used to describe the events of mitosis canalso be used to describe meiosis. As with mitosis, DNA synthesis occurs prior to the celldivision phase.
Meiosis IDuring prophase I, the nuclear membrane begins to dissolve, the centriole splits and itsparts move to opposite poles within the cell, and spindle fibres are formed. The chromo-somes come together in homologous pairs. Each chromosome of the pair is a homologueand is composed of a pair of sister chromatids. The whole structure is then referred to asa tetrad because each pair is composed of four chromatids.
This process is referred to as synapsis. As the chromosomes synapse, the chromatidsoften intertwine. Sometimes the intertwined chromatids from different homologues breakand exchange segments in a process called crossing over (Figure 2, next page). Crossingover permits the exchange of genetic material between homologous pairs of chromosomes.
meiosis two-stage cell division inwhich the chromosome number ofthe parental cell is reduced by half
haploid refers to the number ofchromosomes in a gamete
diploid refers to twice the number ofchromosomes in a gamete
homologous chromosomespaired chromosomes similar inshape, size, gene arrangement, andgene information
sisterchromatids
from mother from father
similar gene
Figure 1Homologous chromosomes
tetrad a pair of homologouschromosomes, each with twochromatids
synapsis the pairing ofhomologous chromosomes
crossing over the exchange ofgenetic material between twohomologous chromosomes
Ch 17_Bio_Alberta30 1/8/07 3:33 PM Page 572

Cell Division 573NEL
Section 17.3
homologouschromosome pair
As the chromosomesmove closer together,synapsis occurs.
Chromatids break,and genetic informationis exchanged.
Figure 2 Crossing over occurs betweenhomologous pairs of chromosomesduring prophase I of meiosis.
prophase I telophase Ianaphase Imetaphase I
Figure 3 During meiosis I, homologous chromosomes are segregated.
The replicated chromosomescondense. Homologouschromosomes come togetherin synapsis and crossing overoccurs. Chromosomes attachto the spindle.
Chromosomes line up at theequatorial plate.
Each chromosome separatesfrom its homologue. They moveto opposite poles of the cell.
The nucleus completes itsdivision. The chromosomesare still composed of sisterchromatids. The cytoplasmdivides after telophase.
Metaphase I follows prophase I (Figure 3). The homologous chromosomes attach them-selves to the spindle fibres and line up along the equatorial plate.
During anaphase I, the homologous chromosomes move toward opposite poles. Theprocess is known as segregation. At this point of meiosis, reduction division occurs. Onemember of each homologous pair will be found in each of the new cells. Each chromo-some consists of two sister chromatids.
During telophase I, a membrane begins to form around each nucleus. However,unlike in mitosis, the chromosomes in the two nuclei are not identical because each ofthe daughter nuclei contains one member of the homologous chromosome pair.Although homologous chromosomes are similar, they are not identical. They carrygenes for the same traits (for example, eye colour), but those genes may differ (forexample, coding for brown eyes or coding for blue eyes). The cells are now ready tobegin the second stage of meiosis.
Crossing OverThis Audio Clip will discuss thetiming of crossing over and thebenefit that a species derives fromthis process.
www.science.nelson.com GO
EXTENSION +
Ch 17_Bio_Alberta30 1/8/07 3:33 PM Page 573
574 Chapter 17 NEL
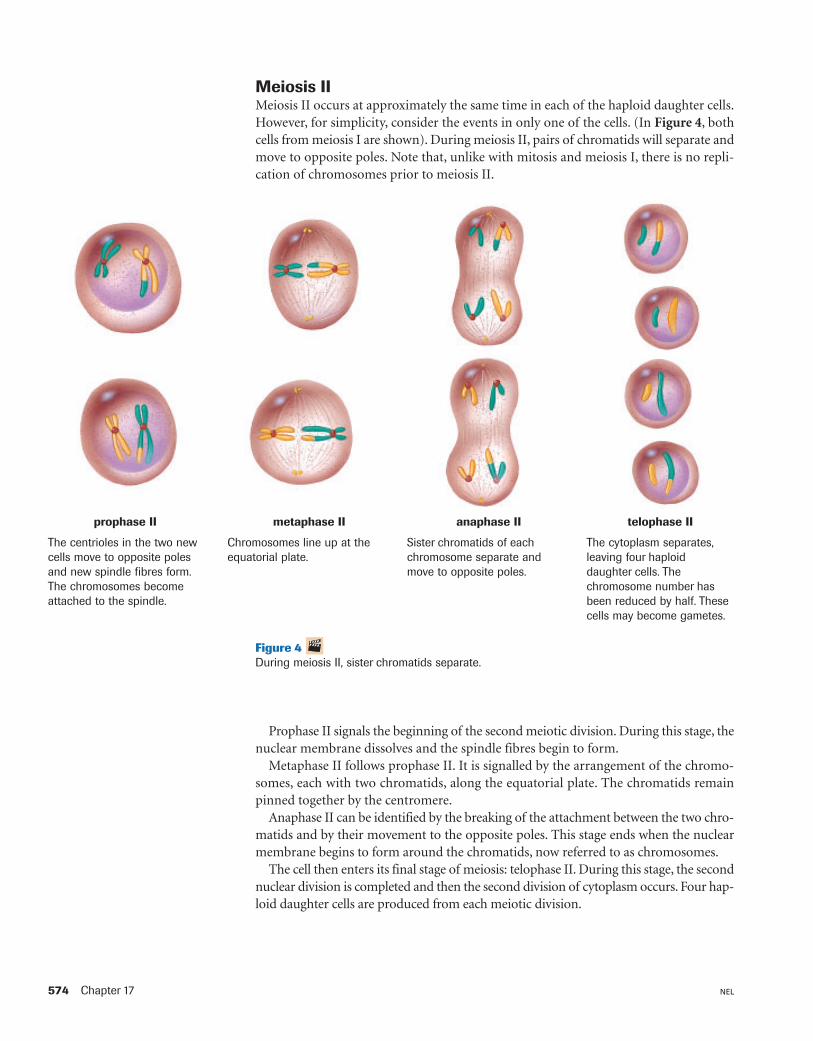
Meiosis IIMeiosis II occurs at approximately the same time in each of the haploid daughter cells.However, for simplicity, consider the events in only one of the cells. (In Figure 4, bothcells from meiosis I are shown). During meiosis II, pairs of chromatids will separate andmove to opposite poles. Note that, unlike with mitosis and meiosis I, there is no repli-cation of chromosomes prior to meiosis II.
Figure 4 During meiosis II, sister chromatids separate.
The cytoplasm separates,leaving four haploiddaughter cells. Thechromosome number hasbeen reduced by half. Thesecells may become gametes.
Sister chromatids of eachchromosome separate andmove to opposite poles.
Chromosomes line up at theequatorial plate.
The centrioles in the two newcells move to opposite polesand new spindle fibres form.The chromosomes becomeattached to the spindle.
prophase II metaphase II anaphase II telophase II
Prophase II signals the beginning of the second meiotic division. During this stage, thenuclear membrane dissolves and the spindle fibres begin to form.
Metaphase II follows prophase II. It is signalled by the arrangement of the chromo-somes, each with two chromatids, along the equatorial plate. The chromatids remainpinned together by the centromere.
Anaphase II can be identified by the breaking of the attachment between the two chro-matids and by their movement to the opposite poles. This stage ends when the nuclearmembrane begins to form around the chromatids, now referred to as chromosomes.
The cell then enters its final stage of meiosis: telophase II. During this stage, the secondnuclear division is completed and then the second division of cytoplasm occurs. Four hap-loid daughter cells are produced from each meiotic division.
Ch 17_Bio_Alberta30 1/8/07 3:33 PM Page 574

Cell Division 575NEL
Comparing Mitosis and MeiosisSingle-celled eukaryotic species undergo asexual reproduction by mitosis, followed bycytokinesis. In multicellular eukaryotic species, somatic cells undergo these same processesin order to grow and repair tissue. In contrast, meiosis occurs only in the sex cells ofmulticellular eukaryotic species, in order to produce the gametes needed for sexualreproduction.
The most significant difference between mitosis and meiosis is the end result (Figure 6).Mitosis results in two daughter cells that are identical to each other. The daughter cellshave the same genetic information and carry the same number of chromosomes as the
Section 17.3
Practice1. Define meiosis. Describe the main stages in the process. Sketch the sequence of
stages to help you in your description. Label your diagrams appropriately.
2. How are haploid cells different from diploid cells in humans?
3. What is a tetrad?
4. What are homologous chromosomes?
5. Do homologous chromosomes have the same number of genes? Explain.
6. Do homologous chromosomes have identical genes? Explain.
mini Investigation Gamete Formation in Grasshoppers
Obtain prepared slides of grasshopper (Figure 5) testes andidentify cells undergoing meiosis. Make a few sample diagramsof cells at various stages of cell division.
(a) Label the chromosomes.
(b) Are you able to count the chromosome number? Explainwhy or why not.
(c) Explain and compare what happens in prophase,metaphase, and anaphase of meiosis I and II.
(d) How do cells undergoing meiosis II differ from cellsundergoing meiosis I?
Figure 5
Figure 6 Comparison of mitosis and meiosisin humans. Mitosis produces twodiploid cells from one diploid cell.Meiosis produces four haploid cellsfrom one diploid cell.
meiosisdiploid chromosome
number
haploid chromosome
number
first meioticdivision
second meioticdivision
46
23 23
23232323
mitosis
46 46
46
Ch 17_Bio_Alberta30 1/8/07 3:33 PM Page 575

576 Chapter 17 NEL
parent cell. In contrast, meiosis results in four daughter cells that are different from eachother and from the parent cell. The daughter cells have different genetic informationfrom each other and from the parent cell and carry half the number of chromosomes asthe parent cell.
Figure 7 and Figure 8 (next page) summarize the similarities and differences betweenmitosis and meiosis. As you examine Figures 7 and 8, make note of the chromosomenumber of the cell or cells, whether the chromosome number is haploid or diploid, andduring which stage the chromosome number changes.
Meiosis, combined with fertilization, explains the variation in traits that is observedin species that reproduce sexually. The variation occurs through three mechanisms.First, crossing over during prophase I exchanges genes on the chromosomes. Second,during metaphase I, the paternal and maternal chromosomes are randomly assorted.Although homologues always go to opposite poles, a pole could receive all the maternalchromosomes, all the paternal ones, or some combination. Lastly, during fertilization,different combinations of chromosomes and genes occur when two gametes unite.
prophase I telophase Ianaphase Imetaphase I
The replicated chromosomescondense. Homologouschromosomes come together insynapsis and crossing overoccurs. Chromosomes attach tothe spindle.
Homologous chromosomes lineup at the equatorial plate.
Each chromosome separatesfrom its homologue. They moveto opposite poles of the cell.
The nucleus completes itsdivision. The chromosomesare still composed of sisterchromatids. The cytoplasmdivides after telophase.
Figure 7Stages of meiosis I. During meiosis I, crossing over occurs and homologous pairs separate. These events do not occur during mitosis.
Purpose Design AnalysisProblem Materials EvaluationHypothesis Procedure SynthesisPrediction Evidence
To perform this investigation, turn to page 590.
Comparing Mitosis and MeiosisScientists often use models to help them to understand complexprocesses. To understand the consequences of mitosis andmeiosis, you must have a clear view of the similarities anddifferences between these two modes of cell division. In thisinvestigation, you construct and use models to investigate theseessential processes.
INVESTIGATION 17.3 Introduction Report Checklist
Ch 17_Bio_Alberta30 1/8/07 3:33 PM Page 576

Cell Division 577NEL
Section 17.3
prophase metaphase anaphase telophase
The cytoplasm separates,leaving four haploid daughtercells. The chromosomenumber has been reduced byhalf. These cells may becomegametes.
Sister chromatids of eachchromosome separate andmove to opposite poles.
Chromosomes line up at theequatorial plate.
The centrioles in the two newcells move to opposite polesand new spindle fibres form.The chromosomes becomeattached to the spindle.
prophase II metaphase II anaphase II telophase II
(b) Meiosis II
The chromosomes condense,becoming shorter and thicker.The centrioles assemble andspindle fibres attach to thecentromeres of thechromosomes. The nuclearmembrane starts to dissolve.
Chromosomes line up at theequatorial plate. The nuclearmembrane completely dissolves.
The centromeres divide andthe resulting chromosomes,formerly chromatids, move toopposite poles of the cell. Anidentical set of chromosomesmoves to each pole.
Chromosomes lengthenagain, the spindle fibresdissolve, and a nuclearmembrane forms aroundthe chromosomes.
(a) Mitosis
Figure 8Comparison of the stages in (a) mitosis and (b) meiosis II. In mitosis, homologouschromosomes are separated, giving rise to genetically identical sister cells. In meiosis II, thesister chromatids in the products of meiosis I separate as the cells divide again. This gives riseto four genetically different sex cells.
Ch 17_Bio_Alberta30 1/8/07 3:33 PM Page 577

578 Chapter 17 NEL
Development of Male and Female GametesThe formation of sex cells during meiosis is referred to as gametogenesis. Althoughhuman male and female gametes both follow the general process of meiosis, some dif-ferences do exist. The cytoplasm of the female gametes does not divide equally aftereach nuclear division. As shown in Figure 9, one of the daughter cells, called the ootid,receives most of the cytoplasm. The other cells, the polar bodies, die, and the nutrientsare absorbed by the body of the organism. Only one ovum (egg cell) is produced frommeiosis. In contrast, with sperm cells, there is an equal division of cytoplasm. Spermcells have much less cytoplasm than egg cells. Sperm cells are specially designed formovement: they are streamlined and cannot carry excess weight. Egg cells use the nutri-
Practice7. Copy and complete Table 1. Compare the chromosome number in the organisms
before, during, and as a result of meiosis. Indicate whether the chromosome numberis haploid or diploid.
Table 1 Chromosome Number in Cells of Four Organisms
Human Cat Shrimp Bean
Before meiosis
chromosome number 46 ? ? ?(haploid or diploid?)
number of pairs of 23 ? 127 ?homologous chromosomes
After meiosis I
chromosome number 23 19 ? ?(haploid or diploid?)
After meiosis II
chromosome number 23 ? ? 11(haploid or diploid?)
number of pairs of 0 ? ? ?homologous chromosomes
gametogenesis the formation ofgametes (sex cells) in animals
ootid an unfertilized ovum
Spermatogenesis
four sperm cellsootid
polar bodies
first polar body
spermatocyte
chromosomenumber
oocyte
Oogenesis
First meioticdivision
Secondmeioticdivision
46
23 23 23 23
46 4646
2323 23232323 2323
2323 2323 2323 2323
Figure 9 Generalized diagram of sperm andegg cell formation in humans
Ch 17_Bio_Alberta30 1/8/07 3:33 PM Page 578

Cell Division 579NEL
ents and organelles carried within the cytoplasm to fuel future cell divisions in the eventthat the egg cell becomes fertilized.
Human males make many more sex cells than females. The diploid spermatocytes—the cells that give rise to sperm cells—are capable of many mitotic divisions beforemeiosis ever begins. Males can produce one billion sperm cells every day. At birth, humanfemales have about two million primary oocytes in their ovaries. Primary oocytes havealready entered meiosis I, but they will remain suspended in prophase I until the femalereaches reproductive age, or puberty. Starting at the first menstrual cycle, meiosis willresume in one oocyte at a time, once a month.
Section 17.3
WEB Activity
Case Study—Comparing Life Cycles of PlantsIn this Web-based Case Study, you will observe and compare the life cycles of different plants.By examining the reproductive life cycles of plants you will gain a greater understanding ofhow reproductive diversity contributes to the evolution of complex organisms.
www.science.nelson.com GO
Cell Division and Life CyclesOrganisms that undergo asexual reproduction produce offspring by mitosis. In this typeof life cycle, cells divide by mitosis and give rise to daughter cells with the same chro-mosome number as the parent cell. There is no change in chromosome number. Examplesof organisms that reproduce asexually are bacteria and yeasts.
In contrast, the chromosome number changes during the life cycle of a species thatundergoes sexual reproduction. Examples of sexually reproducing species include flow-ering plants and birds. Two events in sexual reproduction change chromosome number:meiosis and fertilization. The gametes are formed by meiosis; these cells have half the chro-mosome number as the somatic cells. During fertilization, two gametes join to form azygote, and the chromosome number is restored to that of the somatic cells.
There are variations in these two main types of the life cycles. Figure 10,on the nextpage shows a common life cycle found in flowering plants. In flowering plants, pollen con-tains the male sex cells, and the female egg cells are stored within the flower. The gametescontain a haploid chromosome number (1n). At fertilization, a diploid zygote (2n) isformed. The zygote undergoes mitosis to produce seeds, which then undergoes furthermitosis to produce the adult 2n plant, called the sporophyte. Specialized cells in themature 2n plant undergo meiosis to produce haploid (1n) spores. The spores thenundergo mitosis to produce a mature, multicellular gametophyte. In most floweringplants, the gametophyte is too small to see without magnification. Since mitosis doesnot change chromosome number, the gametophyte is also haploid (1n). Specialized cellsin the gametophyte develop into gametes, and the cycle begins again. Many familiarplants are sporophytes, such as the pine trees in a boreal forest. In other plant species, suchas ferns, it is the gametophyte that is the larger, dominant form.
Figure 11,on the next page shows a common life cycle for animals, such as humans.In this life cycle, the gametes (sperm cells and egg cells) are haploid (1n) and single-celled. During fertilization, the gametes fuse and form a diploid (2n) zygote. This zygoteundergoes mitosis to form the multi-cellular diploid adult body. Specialized cells in theadult body (in humans, cells in the testes and ovaries) undergo meiosis to producegametes. Up to this point, the life cycles of plants in Figure 10 and of animals in Figure 11 are the same. However, the gametes of most animals do not undergo mitosisto form a multi-cellular gametophyte. Instead, the haploid stage remains single celled.When these haploid gametes unite, fertilization occurs and the life cycle begins again.
Reproductive Strategies forSurvival (Non-Human)The different species on our planethave a remarkable variety ofstrategies to ensure their survival.Review some of thesereproductive strategies bycompleting this extension activity.
www.science.nelson.com GO
EXTENSION +
Ch 17_Bio_Alberta30 1/8/07 3:33 PM Page 579

580 Chapter 17 NEL
mature tree
Lodgepole Pine Life Cycle
meiosisfertilization
DIPLOID
HAPLOID
zygote
sporophyte
spores
gametophytes
gametes
m i t o s i s
m i t o s i s
Figure 10Lodgepole pine life cycle. Thediploid cells formed at fertilizationundergo mitosis to form themulticelled sporophyte (the tree).The haploid stage starts whenmeiosis produces spores. Theseundergo mitosis to form amulticellular gametophyte, which iscontained in the cones.
DIPLOID
HAPLOID
meiosisfertilization
DIPLOID
HAPLOID
zygote
multicelledbody
adult person
Human Life Cyclebody cells
gamete-producing cells
gametes
m i t o s i s
Figure 11Human life cycle. The diploid cellsformed at fertilization undergomitosis to form the multicelled body.The haploid stage is the single-celled gametes.
• Meiosis involves the formation of sex cells or gametes. All gametes produced bymeiosis have haploid chromosome numbers.
• Cells undergoing meiosis pass through two divisions.
• Homologous chromosomes are similar in shape, size, gene arrangement, andgene information.
• Crossing over is the exchange of genetic material between homologouschromosomes that occurs during meiosis.
SUMMARY Meiosis
Two Styles of Life CycleSome species undergo both sexualand asexual life cycles. For example,the spider plant can reproduce byseeds (sexual reproduction) or byrunners (asexual reproduction).Aphid females reproduce asexuallywhen the environment is stable, andsexually when the environmentchanges. Similarly, the male dronesin a honey bee colony are producedby asexual reproduction, but thefemale workers and the queens areproducts of sexual reproduction.
DID YOU KNOW ??
Ch 17_Bio_Alberta30 1/8/07 3:33 PM Page 580

Cell Division 581NEL
Section 17.3
Section 17.3 Questions1. How does the first meiotic division differ from the second
meiotic division?
2. Explain why synapsis may lead to the exchange of geneticinformation.
3. Construct a table to compare meiosis with mitosis. Howdoes meiosis differ from mitosis?
4. A muscle cell of a mouse contains 22 chromosomes. Basedon this information, how many chromosomes are there inthe following types of mouse cells?(a) daughter muscle cell formed from mitosis (b) egg cell (c) fertilized egg cell
5. Compare the mechanisms of gametogenesis in males andfemales.
6. When meiosis occurs in females, the cytoplasm is notdivided equally among the resulting four cells. Explain why.
7. Compare the life cycles of plants and animals.
8. Figure 12 shows sperm cell production following meiosis.(a) Which cells do not contain homologous pairs? (b) If the chromosome number for cell A is 12, indicate the
chromosome number for cell C.
9. Use Figure 13 to answer the questions below.(a) Which process(es) identify mitosis? Explain your
answer. (b) Which process(es) identify meiosis? Explain your
answer.
parent 1 parent 2
process W process X
1n
process Y
process Z
embryo
2n2n 2n2n
1n1n
2n2n
Figure 13The processes and number of sets of chromosomes involvedin the production of an embryo in humans
AA
BB BB
CC CC CC CC
Figure 12Sperm cell production in humans
10. King Henry VIII of England had some of his wives executedfor not producing sons. Indicate why a little knowledge ofmeiosis might have been important for Henry’s wives.
11. A microscopic water animal called Daphnia can bereproduced from an unfertilized egg. This form ofreproduction is asexual because male gametes are notrequired. Indicate the sex of the offspring produced.Explain your answer.
Ch 17_Bio_Alberta30 1/8/07 3:33 PM Page 581

582 Chapter 17 NEL
17.417.4 Abnormal MeiosisMeiosis, like most processes of the body, is not immune to mistakes. Nondisjunctionoccurs when two homologous chromosomes fail to separate during meiosis or mitosis.The result is that one of the daughter cells will have too many chromosomes, while theother will have too few. Cells that lack genetic information, or have too much informa-tion, will not function properly. Nondisjunction can also occur in any cell during mitosis,but the effects are most devastating during the formation of sex cells in meiosis.
Some organisms have more than two complete chromosome sets. This condition iscalled polyploidy. Polyploid organisms may have three chromosome sets (triploidy or3n), four chromosome sets (tetraploidy or 4n), and rarely, even more than four chro-mosome sets. Polyploidy can result when a diploid (2n) egg cell is fertilized by a haploid(1n) sperm, giving rise to a 3n cell. Nondisjunction of all chromosomes within the eggcell produces a diploid sex cell, which then becomes triploid upon fertilization. Tetraploidorganisms are most often produced by the failure of the 2n zygote to divide after repli-cating its chromosomes. Following normal mitosis a 4n embryo is formed. Polyploidyis common in plants. Wheat, oats, tobacco, and potatoes are agriculturally importantpolyploid species. Plant geneticists may use chemicals that create errors in meiosis andmitosis to create new polyploid plants.
In humans, nondisjunction produces gametes with 22 and 24 chromosomes. Thegamete with 24 chromosomes has both chromosomes from one of the homologous pairs.If that gamete joins with a normal gamete of 23 chromosomes from the opposite sex, azygote containing 47, rather than 46, chromosomes will be produced. The zygote willthen have three chromosomes in place of the normal pair. This condition is referred toas trisomy. However, if the sex cell containing 22 chromosomes joins with a normalgamete, the resulting zygote will have 45 chromosomes. The zygote will have only oneof the chromosomes rather than the homologous pair. This condition is called monosomy.Once the cells of the trisomic or monosomic zygotes begin to divide, each cell of thebody will contain more or fewer than 46 chromosomes.
nondisjunction the failure of a pairof homologous chromosomes toseparate properly during meiosis
polyploidy a condition in which anorganism has more than twocomplete sets of chromosomes
trisomy the condition in which there are three homologouschromosomes in place of ahomologous pair
monosomy the condition in whichthere is a single chromosome inplace of a homologous pair
Figure 1Dr. Renée Martin
WEB Activity
www.science.nelson.com GO
Canadian Achievers—Dr. Renée MartinPregnancy loss, birth defects, and mental retardation have been linked with chromosomeabnormalities in sperm and eggs, but much of the scientific research to date has focused onabnormalities in the egg. Dr. Renée Martin (Figure 1), a medical geneticist from the Universityof Calgary, is recognized for her research on chromosomal abnormalities in human sperm cells.A research centre at the university has been named after her. Dr. Martin’s research indicatesthat 10 % of sperm in normal men have a chromosomal abnormality, but men who haveundergone radiotherapy have much higher frequencies of abnormal sperm. One of the mostimportant questions to be answered is whether or not any of these abnormal sperm cellsactually fertilize an egg. Dr. Martin’s research will provide valuable information on birth defectsand miscarriages. Visit the Nelson Web site to learn more about Dr. Martin's researchcontributions.
Ch 17_Bio_Alberta30 1/8/07 3:33 PM Page 582

Cell Division 583NEL
Nondisjunction DisordersNondisjunction is associated with many different human genetic disorders. For example,Down syndrome is a trisomic condition. Down syndrome is also called trisomy 21because it usually results from three copies of chromosome 21. People with Down syn-drome (Figure 2) can be identified by several common traits, regardless of race: a round,full face; enlarged and creased tongue; short height; and a large forehead. Down syn-drome is generally associated with mental retardation, although people with this condi-tion retain a wide range of mental abilities. The risk of having a baby with Down syndromeincreases with the age of the mother. About 1 in 600 babies is born with Down syn-drome.
Turner syndrome occurs when sex chromosomes undergo nondisjunction. This mono-somic disorder produces a female with a single X chromosome. In the egg cell, bothhomologous X chromosomes move to the same pole during meiosis I (Figure 3). Whenthe egg with no X chromosome is fertilized by a normal sperm cell with an X chromo-some, a zygote with 45 chromosomes is produced. Individuals with Turner syndromeappear female, but do not usually develop sexually and tend to be short and have thick,widened necks. About 1 in every 3000 female babies is a Turner syndrome baby. MostTurner syndrome fetuses are miscarried before the 20th week of pregnancy.
Klinefelter syndrome is caused by nondisjunction in either the sperm or egg (Figure 3). The child inherits two X chromosomes—characteristic of females—and a singleY chromosome—characteristic of males. The child appears to be a male at birth; how-ever, as he enters sexual maturity, he begins producing high levels of female sex hor-mones. Males with Klinefelter syndrome are sterile. It has been estimated that Klinefeltersyndrome occurs, on average, in 1 of every 500 male babies.
Section 17.4
Figure 2People with Down syndrome have awide range of abilities.
normal female normal male normal female normal male
normal meiosis nondisjunction nondisjunction normal meiosis
Klinefeltersyndrome
Turnersyndrome
trisomicfemale
Turnersyndrome
Figure 3Nondisjunction disorders in humans
xxxx xxxx
xxxxxx xx
xoxoxoxoxxxxxxxxyxxy
xyxy xyxy
x yxy
www.science.nelson.com GO
CAREER CONNECTION
GeneticistGeneticists are professionals withspecialized education, training,and experience in genetics. Thosewith expertise in medical geneticsmay help families understand birthdefects and how diseases areinherited. They may counselpeople who carry genes thatincrease their risk of developingdisease, such as some forms ofcancer.
Ch 17_Bio_Alberta30 1/8/07 3:33 PM Page 583

584 Chapter 17 NEL
Karyotype ChartsOne tool for detecting the results of abnormal meiosis is a chart of the chromosomescalled a karyotype. Technicians obtain a karyotype chart by mixing a small sample of tissuewith a solution that stimulates mitotic division. A different solution is added which stopsdivision at metaphase. Since chromosomes are in their most condensed form duringmetaphase—their size, length, and centromere location are most discernible—it is thebest phase in which to obtain a karyotype. The metaphase cells are placed onto a slide andthen stained, so that distinctive bands appear. A photograph of the chromosomes is taken.The image is enlarged, and each chromosome is cut out and paired up with its homologue.Homologous chromosomes are similar in size, length, centromere location, and bandingpattern. Finally, all the pairs are aligned at their centromeres in decreasing size order. Thesex chromosomes are always placed last.
Figure 4 shows karyotypes of a normal male and of a female with Down syndrome.In about 95 % of cases, a child with Down syndrome has an extra chromosome in chro-mosome number 21. This trisomic disorder is produced by nondisjunction; the personhas too much genetic information. Compare the chromosomes of a male shown inFigure 4 (a), with the chromosomes of a female who has Down syndrome, shown inFigure 4 (b). Notice how the chromosomes are arranged in pairs.
Figure 4(a) Karyotype chart of a male with 46 chromosomes. Notice that the chromosome pair
number 23 is not homologous. Males contain an X and a Y chromosome. They act as ahomologous pair in meisois, but they are not similar in size and shape as are the otherchromosome pairs.
(b) Karyotype of a female with Down syndrome. Note the trisomy of number 21. Downsyndrome affects both males and females.
(a) (b)
karyotype chart a picture ofchromosomes arranged inhomologous pairs
Karyotype PreparationThis animation depicts the stepsinvolved in preparing a karyotypechart. You can also seerepresentative karyotypes fromindividuals with nondisjunctiondisorders.
www.science.nelson.com GO
EXTENSION +
Ch 17_Bio_Alberta30 1/8/07 3:33 PM Page 584
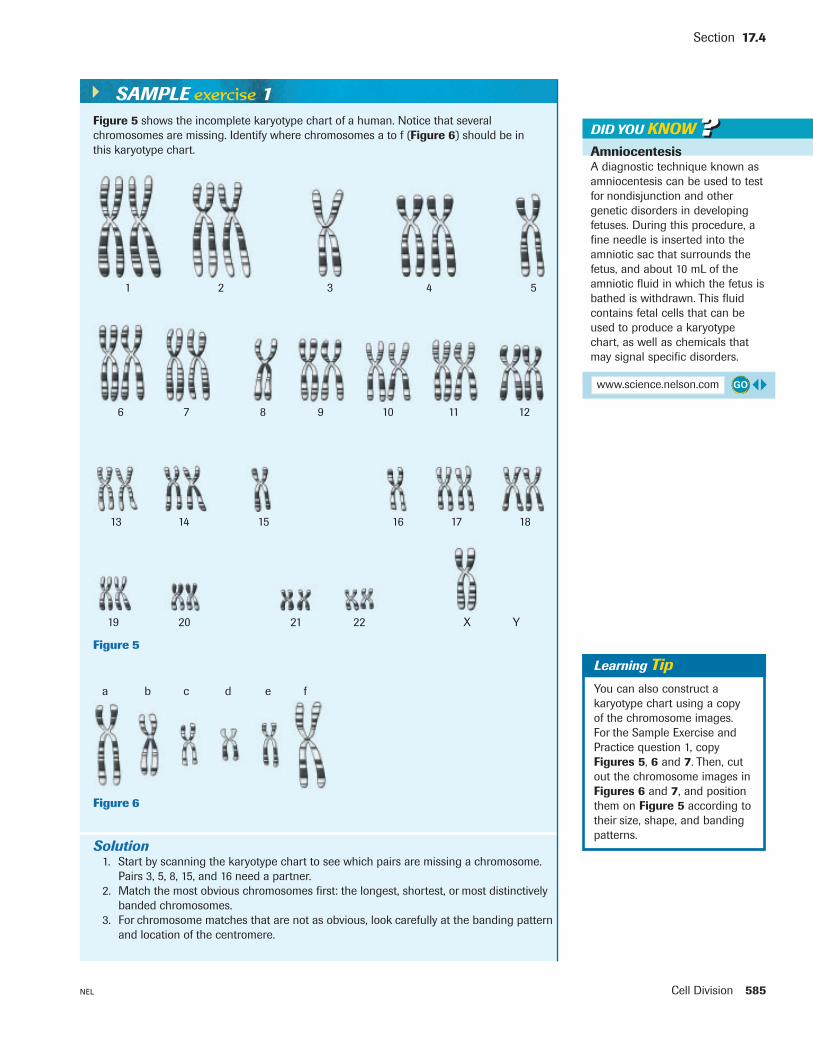
Cell Division 585NEL
Section 17.4
Figure 5 shows the incomplete karyotype chart of a human. Notice that several chromosomes are missing. Identify where chromosomes a to f (Figure 6) should be inthis karyotype chart.
SAMPLE exercise 1
1 2 3 4 5
6 7 8 9 10 11 12
13 14 15 16 17 18
19 20 21 22 X Y
Figure 5
a b c d e f
Figure 6
Solution1. Start by scanning the karyotype chart to see which pairs are missing a chromosome.
Pairs 3, 5, 8, 15, and 16 need a partner.2. Match the most obvious chromosomes first: the longest, shortest, or most distinctively
banded chromosomes.3. For chromosome matches that are not as obvious, look carefully at the banding pattern
and location of the centromere.
AmniocentesisA diagnostic technique known asamniocentesis can be used to testfor nondisjunction and othergenetic disorders in developingfetuses. During this procedure, afine needle is inserted into theamniotic sac that surrounds thefetus, and about 10 mL of theamniotic fluid in which the fetus isbathed is withdrawn. This fluidcontains fetal cells that can beused to produce a karyotypechart, as well as chemicals thatmay signal specific disorders.
DID YOU KNOW ??
Learning TipYou can also construct akaryotype chart using a copy of the chromosome images. For the Sample Exercise andPractice question 1, copyFigures 5, 6 and 7. Then, cutout the chromosome images inFigures 6 and 7, and positionthem on Figure 5 according totheir size, shape, and bandingpatterns.
www.science.nelson.com GO
Ch 17_Bio_Alberta30 1/8/07 3:33 PM Page 585

586 Chapter 17 NEL
4. Always pay attention to the X and Y chromosomes. In Figure 5, on the previous page,the missing chromosome might be X or Y. If it is Y, it will have to be found through elimination since it will not match X.
a, 5 b, 8 c, 16 d, Y e, 15 f, 3
WEB Activity
Web Quest—Modelling Mitosis and MeiosisCellular division is one of the most critical processes an organism regularly undergoes.Unfortunately, errors during cellular division can result in a number of genetic syndromes suchas Down syndrome, Turner syndrome, Klinefelter syndrome, and XYY syndrome. In this WebQuest, you will explore normal and abnormal cellular division. You will use the knowledge thatyou gathered to create an animation or presentation that shows exactly how abnormal cellulardivisions occur.
• Nondisjunction occurs when two homologous chromosomes move to the same pole during meiosis. In humans, this produces gametes with 22 and24 chromosomes.– Trisomy: a zygote containing 47 chromosomes; causes human genetic
disorders such as Down syndrome and Klinefelter syndrome– Monosomy: a zygote containing 45 chromosomes; causes Turner syndrome
• A karyotype chart is a picture of chromosomes arranged in homologous pairs indescending order by size, with the sex chromosomes placed last.
SUMMARY Abnormal Meiosis
Section 17.4 Questions1. What is nondisjunction?
2. Differentiate between monosomy and trisomy.
3. What is Down syndrome?
4. What is a karyotype?
5. What is Turner syndrome?
6. Use a diagram to illustrate how nondisjunction in meiosis I(2n = 4) differs from nondisjunction in meiosis II.
www.science.nelson.com GO
Practice1. This person has either Down syndrome or Klinefelter syndrome. Identify the
placement of chromosome g (Figure 7) to identify which of these twodisorders the patient has.
Figure 7
g
KaryotypingThere are a number of humangenetic disorders that involvenondisjunction. In this VirtualBiology Lab, you will constructkaryotype charts and use them topredict genetic disorders, in muchthe same way as a geneticcounsellor might.
www.science.nelson.com GO
EXTENSION +
Ch 17_Bio_Alberta30 1/8/07 3:33 PM Page 586
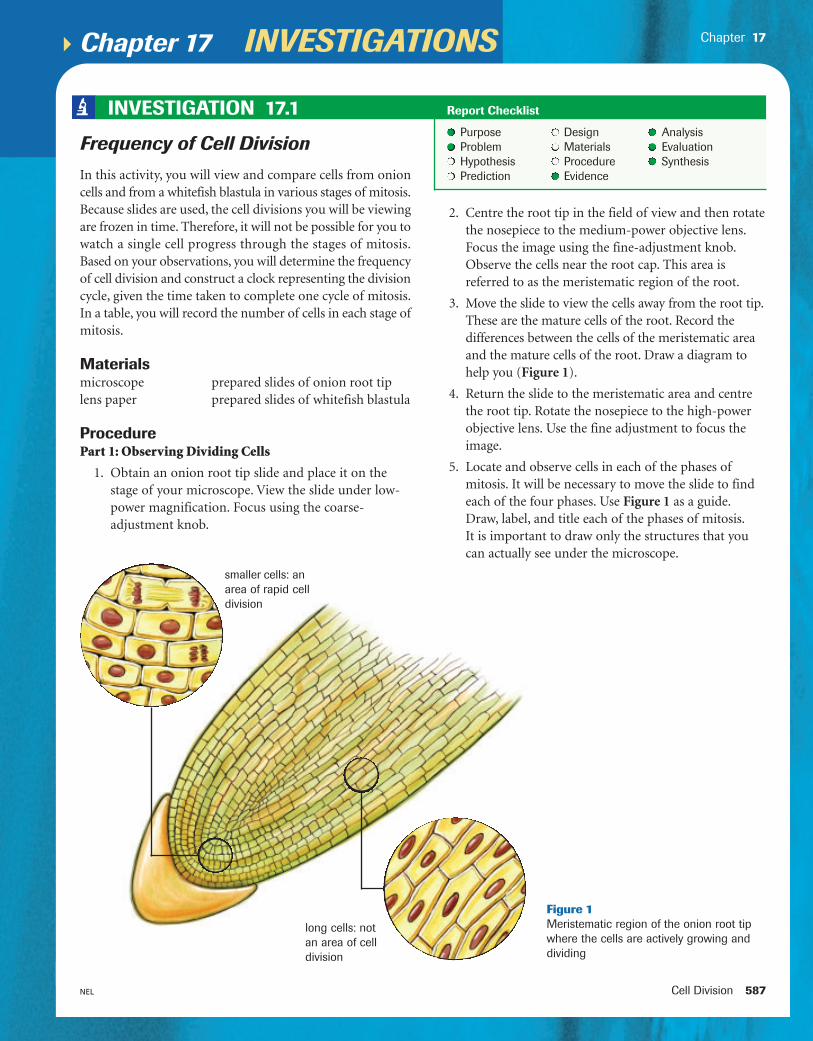
Chapter 17 INVESTIGATIONS
Cell Division 587NEL
Frequency of Cell Division
In this activity, you will view and compare cells from onioncells and from a whitefish blastula in various stages of mitosis.Because slides are used, the cell divisions you will be viewingare frozen in time. Therefore, it will not be possible for you towatch a single cell progress through the stages of mitosis.Based on your observations, you will determine the frequencyof cell division and construct a clock representing the divisioncycle, given the time taken to complete one cycle of mitosis.In a table, you will record the number of cells in each stage ofmitosis.
Materialsmicroscope prepared slides of onion root tiplens paper prepared slides of whitefish blastula
ProcedurePart 1: Observing Dividing Cells
1. Obtain an onion root tip slide and place it on thestage of your microscope. View the slide under low-power magnification. Focus using the coarse-adjustment knob.
Chapter 17
Purpose Design AnalysisProblem Materials EvaluationHypothesis Procedure SynthesisPrediction Evidence
INVESTIGATION 17.1 Report Checklist
smaller cells: anarea of rapid celldivision
long cells: notan area of celldivision
Figure 1Meristematic region of the onion root tipwhere the cells are actively growing anddividing
2. Centre the root tip in the field of view and then rotatethe nosepiece to the medium-power objective lens.Focus the image using the fine-adjustment knob.Observe the cells near the root cap. This area isreferred to as the meristematic region of the root.
3. Move the slide to view the cells away from the root tip.These are the mature cells of the root. Record thedifferences between the cells of the meristematic areaand the mature cells of the root. Draw a diagram tohelp you (Figure 1).
4. Return the slide to the meristematic area and centrethe root tip. Rotate the nosepiece to the high-powerobjective lens. Use the fine adjustment to focus theimage.
5. Locate and observe cells in each of the phases ofmitosis. It will be necessary to move the slide to findeach of the four phases. Use Figure 1 as a guide.Draw, label, and title each of the phases of mitosis.It is important to draw only the structures that youcan actually see under the microscope.
Ch 17_Bio_Alberta30 1/8/07 3:33 PM Page 587

588 Chapter 17 NEL
6. Return your microscope to the low-power objectivelens and remove the slide of the onion. Place the slideof the whitefish blastula on the stage. Focus with thecoarse-adjustment knob. Repeat the procedure thatyou followed for the onion cells and, in the whitefishblastula, locate dividing cells under high-powermagnification. Note how different the animal cellsare compared to the plant cells.
Part 2: Determining the Frequency of Cell Division
7. Count 20 adjacent whitefish blastula cells and recordwhether the cells are in interphase or division phase.Record the number of cells in interphase and thenumber of cells that are actively dividing.
8. Repeat the same procedure for the meristematicregion of the plant root.
Part 3: Creating a Cell-Division Clock
9. Under high-power magnification, locate 50 onion rootcells that are dividing. Do not include cells that arebetween divisions. Identify the phase of mitosis eachcell is in. Record the number of cells in each phase.
10. Repeat the procedure for the cells of the whitefishblastula.
Analysis and EvaluationPart 1: Observing Dividing Cells
(a) How do the cells of the meristematic area differ fromthe mature cells of the root?
(b) Why were plant root tip cells and animal blastulacells used for viewing cell division?
(c) Explain why the cells that you viewed under themicroscope do not continue to divide.
(d) Compare and contrast cell division in plant andanimal cells. Use a Venn diagram to organize yourideas.
Part 2: Determining the Frequency of Cell Division
(e) For both the plant and animal cells, calculate thepercentage of cells that are dividing. Use thefollowing formula:
(f) For both plant and animal cells, create a circlegraph showing the percentage of cells in divisionphase and the percentage of cells in interphase.Label the diagrams appropriately. Compare thegraphs. How are they different? How are they thesame?
Part 3: Creating a Cell-Division Clock
(g) For both plant and animal cells, calculate thepercentage of cells that are in each of these fourphases: prophase, metaphase, anaphase, andtelophase.
(h) For each cell type, construct a circle graph showingthe percentage of cells in each phase of mitosis.Include labels and titles.
(i) If it takes 16 h to complete one cycle of mitosis forwhitefish and 12 h for onions, determine the timespent in each phase. Include this information in yourcircle graphs.
Synthesis(j) The number of animal cells in each phase of mitosis
was recorded in Table 1. If the time taken to completeone cycle of mitosis was 15 h, create a cell-divisionclock to represent the data.
INVESTIGATION 17.1 continued
Table 1 Number of Cells in Different Phases of Mitosis
Mitotic phase Number of cells in phase
prophase 15
metaphase 20
anaphase 10
telophase 5
× 100 = ___ % dividingNumber of cells dividing
����Total number of cells counted
Ch 17_Bio_Alberta30 1/8/07 3:33 PM Page 588

Cell Division 589NEL
Chapter 17
Identification of a Cancer Cell
PurposeTo identify cancerous cells and to recognize the differencesbetween cancerous and non-cancerous cells
Materialslight microscope lens paper prepared slide of squamous cell carcinoma
Procedure 1. Clean the microscope lenses with lens paper. Rotate
the revolving nosepiece to the low-power objectivelens. Place the slide of the carcinoma on the stage ofthe microscope and bring the image into focus usingthe coarse-adjustment knob.
2. Locate the dermal and epidermal layers. Draw a linediagram showing the position of the epidermal anddermal cell layers. Determine and record whether thecells of the epidermis are invading the dermis.
3. Rotate the revolving nosepiece to the medium-powerobjective lens. Locate a cancerous cell. Figure 1 is anexample of cancerous cells. Use the fine-adjustmentknob to bring the image into focus. Observe howcells of the carcinomas have a much larger nucleus.They appear pink in colour and often have anirregular shape.
4. Rotate the nosepiece to high-power magnification,and bring the image into focus using the fine-adjustment knob.
5. Estimate and record the size of the cell, inmicrometres (µm).
6. Estimate and record the size of the nucleus of thesame cell, in micrometres (µm).
7. Rotate the revolving nosepiece to the medium-powerobjective lens and locate a normal cell. Rotate thenosepiece to the high-power objective lens, and bringit into focus with the fine-adjustment knob. Figure 2is an example of normal cells.
Purpose Design AnalysisProblem Materials EvaluationHypothesis Procedure SynthesisPrediction Evidence
INVESTIGATION 17.2 Report Checklist
Figure 1
8. Repeat steps 5 and 6 for the normal cell.
Analysis(a) Using the formula below, determine the nucleus-to-
cytoplasm ratio for the cancerous cell and for thenormal cell.
Evaluation(b) Compare the cancerous and normal cells in a table
similar to Table 1.
Table 1
Cell type Cell size Nuclear shape Nuclear size Nucleus-to-cytoplasm ratio
normal cell
cancerous cell
Figure 2
Ch 17_Bio_Alberta30 1/8/07 3:33 PM Page 589

Synthesis(c) Cancerous cells are often characterized by a large
nucleus. Based on what you know about cancer andcell division, provide an explanation for the enlargednucleus.
(d) Why are malignant (cancerous) tumors a greaterthreat to life than benign tumors?
(e) Provide a hypothesis that explains why the skin is sosusceptible to cancer.
(f) A scientist finds a group of irregularly shaped cellsin an organism. The cells demonstrate littledifferentiation, but the nuclei in some of the cellsstain darker than others.(i) Based on these findings, would it be logical to
conclude that the organism has cancer? Justifyyour answer.
(ii) What additional tests might be required to proveor disprove the hypothesis that the cells arecancerous?
INVESTIGATION 17.2 continued
Comparing Mitosis and Meiosis
In this investigation, you will model and compare the events ofmitosis and meiosis. In this model, you will create homologouschromosomes that have the same size and shape, but differentcolours. This will show that they are similar but not identical.
Materialsred modelling clay plastic knifeblue modelling clay sheets of papergreen modelling clay pencil
ProcedureFor each step, make a coloured sketch of your model withappropriate labels. Include brief descriptions of your stepsand make sure to use the same step numbers as given.
Part 1: Mitosis
1. Take some red clay and roll it between your hands tocreate a piece 10 cm long and about as thick as yourfinger. Make another piece about 5 cm long.
2. Repeat step 1 with the blue clay.
3. Make an identical copy of each piece of clay. Thenattach the identical pieces with a green ball of clay(Figure 1).
4. Draw a line down the length of a sheet of paper.Line up the four chromosomes along the line(Figure 2).
Purpose Design AnalysisProblem Materials EvaluationHypothesis Procedure SynthesisPrediction Evidence
INVESTIGATION 17.3 Report Checklist
590 Chapter 17 NEL
Figure 1
Figure 2
5. Remove the green balls and move eachof the single pieces of clay to oppositeends of the paper (Figure 3, next page).
6. Before every mitotic division, eachchromosome is duplicated duringinterphase. Make an identical copyof each piece of clay as before(Figure 4, next page).
Part 2: Meiosis
7. Follow steps 1 to 3 from part 1.
Ch 17_Bio_Alberta30 1/8/07 3:33 PM Page 590

Cell Division 591NEL
Chapter 17
Figure 3 Figure 4
Figure 5 Figure 6 Figure 7
INVESTIGATION 17.3 continued
8. Demonstrate crossing over. Break off a piece of clayfrom one chromosome and attach it to the otherchromosome (Figure 5). Repeat a few times if youlike.
9. To simulate metaphase I, place the chromosomes oneither side of the equatorial plate, represented by aline drawn on a piece of paper (Figure 6).
10. Choose one of the haploid daughter cells and line thechromosomes up along the equatorial plate. Removethe centromere and move chromosomes to oppositepoles (Figure 7).
Analysis and EvaluationPart 1: Mitosis
(a) In step 3, what process did you model?
(b) What do the red and blue pieces of clay represent?What do the green balls of clay represent?
(c) In step 4, what is the diploid chromosome number ofthe cell?
(d) What phase of mitosis does the model represent?
(e) In step 5, what structure do the single pieces of clayrepresent after separation?
(f) What phase of mitosis does the model represent?
(g) In step 6, how many chromosomes are in each of thedaughter cells?
(h) Compare the daughter cells with the parent cell.
Part 2: Meiosis
(i) In steps 1 to 3, on what basis are chromosomesconsidered to be homologous?
(j) What is the diploid chromosome number?
(k) In step 8, what must happen before the homologouschromosomes can cross over?
(l) In which phase does crossing over occur?
(m) What happens during crossing over?
(n) In step 9, how does metaphase I of meiosis differfrom metaphase of mitosis?
(o) What is the haploid chromosome number?
(p) In step 10, compare the resulting daughter cells ofmitosis and meiosis.
Ch 17_Bio_Alberta30 1/8/07 3:34 PM Page 591

Chapter 17 SUMMARY
592 Chapter 17 NEL
Outcomes
Knowledge• define and explain the significance of chromosome number
in somatic and sex cells (i.e., haploidy, diploidy andpolyploidy) (17.3, 17.4)
• explain cell cycle events (i.e., interphase, including G1, S,and G2 phases, chromosomal behaviour in mitosis andcytokinesis) (17.1)
• describe spermatogenesis and oogenesis and the reductionof chromosomal number in meiosis (17.3)
• compare the processes of mitosis and meiosis (17.3)
• describe the processes of crossing over and nondisjunctionin terms of stages, replication, and resultant chromosomenumbers and evaluate their significance to variation inorganism inheritance and development (17.4)
• compare the formation of fraternal and identical offspring ina single birthing event (17.1)
• describe the diversity of reproductive strategies byincorporating the principles of mitosis and meiosis whencomparing the alternation of generations in a range oforganisms (17.3)
STS• explain that science and technology are developed to meet
societal needs and expand human capability (17.2, 17.4)
Skills• ask questions and plan investigations of questions, ideas,
problems, and issues (all)
• gather and record data and information by performing asimulation to demonstrate the behaviour of chromosomesduring mitosis (17.1); use a microscope and prepared slidesof onion root tip cells to identify the stages of a cell cycle,and calculate the duration of each stage; research andcompare a range of reproductive strategies in organismsand present them in charts, tables, or diagrams (17.3)
• analyze data and apply mathematical and conceptualmodels by preparing and interpreting models of humankaryotypes (17.4)
• work as members of a team and apply the skills andconventions of science (all)
Key Terms
17.1
17.2enucleated
stem cell
telomere
17.3
MAKE a summary
1. Sketch the processes of meiosis and mitosis and showthe differences between them. Label the sketch with asmany of the key terms as possible. Check othersketches and use appropriate designs to make yoursketch more clear.
2. Revisit your answers to the Starting Points questions atthe start of the chapter. Would you answer thequestions differently now? Why?
somatic cell
cell cycle
mitosis
cytokinesis
interphase
chromatin
centromere
sister chromatids
centriole
spindle fibre
meiosis
haploid
diploid
homologous chromosomes
tetrad
synapsis
crossing over
gametogenesis
ootid
polar body
oocyte
17.4nondisjunction
polyploidy
trisomy
monosomy
karyotype chart
Go To
The following components are available on the Nelson Web site. Follow the links for Nelson Biology Alberta 20–30.
• an interactive Self Quiz for Chapter 17
• additional Diploma Exam-style Review Questions
• Illustrated Glossary
• additional IB-related material
There is more information on the Web site wherever you seethe Go icon in the chapter.
www.science.nelson.com GO
A Cure for AgingDr. Siegfried Hekimi, (professor of biology at McGill University),Dr. Michael West, (Chief Executive Officer of Advanced CellTechnology in Worcester Massachusetts), Dr. Cynthia Kenyon,(biochemistry and biophysics professor from the University of California, San Francisco), and Dr. Marc Tatar (BrownUniversity in Rhode Island) all discuss the causes of aging and their research into slowing the aging process.
www.science.nelson.com GO
EXTENSION +
Ch 17_Bio_Alberta30 1/8/07 3:34 PM Page 592

Chapter 17 REVIEW
Cell Division 593NEL
Many of these questions are in the style of the DiplomaExam. You will find guidance for writing Diploma Exams inAppendix A5. Science Directing Words used in DiplomaExams are in bold type. Exam study tips and test-takingsuggestions are on the Nelson Web site.
DO NOT WRITE IN THIS TEXTBOOK.
Part 11. Select the diagram that represents metaphase.
A. Figure 1 (a)B. Figure 1 (b)C. Figure 1 (c)D. Figure 1 (d)
Chapter 17
2. The following descriptions explain events in the variousstages of a cell cycle. Arrange the description in thecorrect sequence of events. (Record all four digits of youranswer.)1. Chromatids separate and move to opposite poles.2. Chromosomal alignment occurs in the equatorial plate.3. Chromosomes become longer and thinner.4. Chromosomes shorten and thicken.
(a) (b)
(c) (d)
Figure 1
Use the following information to answer questions 3 to 6.
A student observed three different areas in the mitotic regionin an onion root tip. She counted the number of cells that wereat each stage of the cell cycle at the time the root was killedand mounted on the slide. Her results are presented in Table 1.
Table 1 Number of Cells in Different Stages of Division
Number of cells
Phase Area 1 Area 2 Area 3 Total
interphase 99 79 88
prophase 12 14 16
metaphase 6 4 5
anaphase 0 2 2 4
telophase 2 3 4 9
3. According to the data in Table 1, the duration of thephases of the cell cycle, from the longest to the shortest, isA. prophase, metaphase, anaphase, telophase, interphaseB. interphase, prophase, metaphase, telophase, anaphaseC. interphase, prophase, metaphase, anaphase, telophaseD. not possible to list, since the number of cells and not
the duration was observed
4. Calculate the percentage of cells in prophase. (Record youranswer as a value rounded to one decimal place.)
5. If the total time for the completion of one cell cycle is 660min, determine the time required to complete metaphase.(Record all four digits of your answer.)
6. Calculate the percentage of cells undergoing mitosis. (Record your answer as a value rounded to one decimalplace.)
7. A researcher studied the growth rate of a malignant cell inmice. Every two days, he counted the number of cells in a 1 mm2 area, over a period of two months. Select the graphin Figure 2, on the next page, that represents the datacollected.A. Figure 2 (a)B. Figure 2 (b)C. Figure 2 (c)D. Figure 2 (d)
www.science.nelson.com GO
NR
NR
NR
NR
Ch 17_Bio_Alberta30 1/8/07 3:34 PM Page 593

594 Chapter 17 NEL
10. Select the number of chromosomes that would be in eachblastula cell, following mitosis.A. 20B. 22C. 23D. 45
11. Indicate which of the following cells would be capable ofmeiosis: A. brain cells B. fat cells C. cells of a zygoteD. sperm-producing cells of the testes
Part 212. Figure 4 shows plant and animal cells during cell division.
(a) Identify each cell as either a plant or an animal cell.Justify your answer.
(b) Identify the phases of cell division.
8. Select the number of chromosomes that were in the spermcell.A. 20B. 22C. 23D. 45
9. Select the number of homologous pairs of chromosomesthat would be in the zygote if it were female.A. 21B. 22C. 23D. 24
Number of Days
Num
ber
of C
ells
(a)
Number of DaysN
umbe
r of
Cel
ls
(b)
Number of Days
Num
ber
of C
ells
(c)
Number of Days
Num
ber
of C
ells
(d)
Figure 2
Use the following information to answer questions 8 to 10.
Figure 3 shows the early events in fertilization of a human eggand sperm, and development of the embryo. The numbersrefer to the number of chromosomes.
23
45
sperm zygote
mitosis
Figure 3
Figure 4
A B C D
Growth Rate ofMalignant Cells
Growth Rate ofMalignant Cells
Growth Rate ofMalignant Cells
Growth Rate ofMalignant Cells
13. Explain why a better understanding of the mechanism ofcell division may enable scientists to regenerate limbs.
14. Explain why the formation of calluses on the handsprovides evidence that cell division can be stimulatedby cell damage.
15. Explain how it is possible to produce a trisomic XXXfemale.
16. Sketch a diagram that shows the kind of nondisjunctionthat would cause a male and female each with anabnormal number of chromosomes to produce an XYYoffspring.
17. If nondisjunction disorders could be eliminated byscreening sperm and egg cells, sperm and egg bankscould all but eliminate many genetic disorders. Describethe social, moral, and ethical implications to society of thesystematic elimination of genetic disorders in humans.
Ch 17_Bio_Alberta30 1/8/07 3:34 PM Page 594

Cell Division 595NEL
18. Copy Table 2 into your notebook, determine the missingvalues, and complete the table. To calculate the time spentin interphase, for example, you would use the followingequation:
Number of cells in interphase=
Time spent in phase
Total number of cells counted Total time of cycle (660 min)
19. Using the data provided, sketch a circle graph showingthe amount of time spent in each phase of the cell cycle.
20. Identify one advantage of using a cutting instead of usingseeds to grow a new plant.
Chapter 17
Table 2
Total cell Time spentCell phase Area 1 Area 2 count in phase
interphase 91 70 ? ?
prophase 10 14 ? ?
metaphase 2 1 ? ?
anaphase 2 1 ? ?
telophase 4 4 ? ?
26. Twins can be either identical or fraternal. Write a unifiedresponse that includes the following aspects of twins:• Copy Table 3 in your notebook. Identify with a check
mark (✓) the statements that you believe are always, oralmost always, true for fraternal twins and for identicaltwins.
• Justify each choice.
female A male B female C
zygote D zygote E
zygote F
chromosomenumber
process X
8
3 5
8 8
44 4444 44
meiosis
Figure 5
Table 3
Fraternal Identical Descriptor twins twins
They have the same blood type. ? ?
They are the same sex. ? ?
They like the same hockey team. ? ?
They have the same mass. ? ?
They have the same hair colour. ? ?
They know what the other one ? ?is thinking.
Use the following information to answer questions 18 and 19.
Table 2 shows data collected from two different fieldsof view while examining hamster embryo cells. The number ofcells found in each of the cell phases was recorded. It took660 min to complete one cycle from interphase to interphase.
Use the following information to answer questions 21 to 25.
Fruit flies normally have eight chromosomes. Flies with fewerchromosomes die before maturity. Figure 5 shows the processof meiosis in three fruit flies.
21. Identify the parent in which nondisjunction takes place.
22. Identify how many chromosomes would be in zygotes D,E, and F.
23. Describe what is happening during process X.
24. Identify which zygote would most likely be healthy.
25. Identify by name the conditions that the other zygoteshave.
DE
DE
DE
DE
DE
DE
DE
DE
Ch 17_Bio_Alberta30 1/8/07 3:34 PM Page 595

In this chapter
1818 The Basis of Heredity
chapter
The Basis of Heredity
Exploration: Similaritiesand Differences
Mini Investigation: Cross-Pollination
Web Activity: Creating aPersonal Profile
Explore an Issue: GeneticScreening
Web Activity: PedigreeAnalysis
Investigation 18.1: HowDo Environmental FactorsAffect Gene Expression?
Case Study: A Mystery ofBlood Types
Investigation 18.2:Genetics of Corn
Explore an Issue:Drought-Tolerant andSalt-Tolerant Plants
Have you ever been able to identify a person as a member of a particular family by cer-tain physical traits? Some traits, such as curly hair or a prominent nose, can be tracedthrough a family’s lineage. Heredity is the transmission of biological traits from par-ents to offspring. When the members of different generations all share a particular trait,this is evidence that the trait is inherited. Genetics is the study of inheritance of biolog-ical traits.
Biological traits are determined by genes, which are specific segments of DNA. Duringreproduction, genes of the parent or parents are transmitted to the next generation.Long before we knew of genes and DNA, humans were able to use knowledge of trans-mission of biological traits to their advantage. Domesticated animals, such as cows anddogs, were produced by choosing parents having traits that were desired in the offspring.Crop plants were also developed by selecting parents with desirable traits.
Every person inherits one of about eight million possible combinations of his or herparents’ chromosomes. Your set of genes and your traits are therefore all your own. Eventwins who are genetically identical may not share all the same traits.
What patterns can be found in the transmission of genetic traits? How do these relateto the transmission of genes? In this chapter, you will explore patterns of inheritance ofbiological traits and explain how these patterns arise.
596 Chapter 18 NEL
Answer these questions as best you can with your current knowledge. Then, using the concepts and skills you have learned, you will revise your answers at the end ofthe chapter.
1. Is it possible for two parents with black hair to have a child with red hair? Why or why not?
2. Sometimes, when breeders cross two individuals with valuable traits, the offspringdo not show the same traits. Suggest a reason why this may be so.
3. A team of researchers at the University of Alberta studied sets of identical twins tosee if driving a truck or other heavy machinery was related to back pain. Each set oftwins included one individual who drove for a living and another who did not. Theyfound that the amount of back pain experienced by a truck-driving twin was the same as for the non-driving twin.(a) Why was it important to study identical twins? (b) Could the study have used fraternal twins instead? Why or why not?
STARTING Points
Career Connections:Veterinarian; Agrologist
Ch 18_Bio_Alberta30 1/8/07 12:21 PM Page 596

The Basis of Heredity 597NEL
Figure 1Bobby Hull and Brett Hull starred in the National Hockey Leagueand were the first father and son to win the Hart Trophy.
Figure 2The father of former prime minister Paul Martinwas also a federal politician.
Figure 3Keifer and Donald Sutherland have successfulacting careers.
Exploration Similarities and Differences
Look at the people shown in Figure 1, Figure 2, and Figure 3.Identify any traits, such as eye colour, eye shape, face shape,and nose length and width, that show a family resemblance.Consider the information in the captions.
• Organize the traits in a chart or table.
• Identify the traits that you think are inherited.
(a) Describe the criteria you used to decide that a trait wasinherited.
(b) Brett Hull is one of the NHL’s all-time goal scorers. Do youthink Brett inherited the ability to score goals from hisfather, Bobby Hull (Figure 1), or is this a skill he learned?Give reasons for your answer.
Ch 18_Bio_Alberta30 1/8/07 12:21 PM Page 597

598 Chapter 18 NEL
18.118.1 Gregor Mendel—Pioneer of GeneticsHumans have long understood that certain characteristics were passed down from gen-eration to generation. Stone tablets crafted by the Babylonians 6000 years ago showpedigrees of successive generations of champion horses. However, the first real understandingof inheritance would not come until the work of an Austrian monk, Gregor Mendel, inthe mid-19th century (Figure 1). Mendel tracked and recorded the transmission of sevenvisible traits through several generations of the garden pea. To keep track of the differentgenerations, he called the first cross the parental generation, or P generation. The off-spring of this cross he called the first filial generation, or the F1 generation. The nextgenerations were the F2 generation, the F3 generation, and so on.
Why did Mendel work with the garden pea? First, he observed that garden peas havea number of characteristics that are expressed in one of only two alternative forms. Thismade it easier to see which form was inherited.
The second reason is related to how this species reproduces. Garden peas usuallyreproduce through self-pollination. During pollination, the pollen produced by the anthersof the stamens attaches to the pistil. The pistil consists of the stigma, style, and ovary(Figure 2). The ovary contains an egg cell or female sex cell (gamete). Sperm cells (themale gametes) in the pollen grains fertilize the egg cell, and seeds are produced. In self-pollination, the pollen grains and the pistil are from the same plant: in cross-pollination,the pollen grains and the pistil are from different plants. The garden peas that Mendelworked with were “pure” varieties with known traits that came from a long line of self-pollinated pea plants. The traits of each variety had, therefore, been present in all indi-viduals of that variety over many generations.
The Principle of DominanceWhen Mendel used pollen from a pea plant with round seeds to fertilize a pea plantwith wrinkled seeds, he found that all the offspring (the progeny) in the F1 generationhad round seeds. Did this mean that the pollen determines the shape of a seed? Mendeltested this by using pollen from a plant with wrinkled seeds to fertilize a plant withround seeds. Once again, all the progeny had round seeds. Round-seed shape was alwaysthe dominant trait, regardless of parentage. Mendel called the other wrinkled-seed shapethe recessive trait. Mendel repeated the experiment for other traits. One trait was alwaysdominant and the other recessive.
Mendel reasoned that each trait must be determined by something he called “factors.”Today, we know these factors are genes. Mendel also realized that there can be alternateforms of a gene, which give rise to alternate forms of a trait. We now call the alternateform of a gene an allele. For example, the gene for seed colour has two alleles, one thatdetermines green-seed colour and one that determines yellow. Alleles that determinedominant traits are dominant alleles. Alleles that determine recessive traits are recessivealleles. A dominant allele is indicated by an uppercase italic letter, such as R for roundseeds. The recessive allele is designated by the lowercase italic letter, such as r for wrinkled seeds.
Figure 1Gregor Mendel (1822–1884) was anAustrian monk whose experimentswith garden peas laid the foundationfor the science of genetics.
stamen
filament anther pollen
style ovary
pistil
stigma
Figure 2The structure of a flower
progeny new individuals that resultfrom reproduction; offspring
dominant trait a characteristic thatis expressed when one or bothalleles in an individual are thedominant form
Ch 18_Bio_Alberta30 1/8/07 12:21 PM Page 598

The Basis of Heredity 599NEL
Mendel’s Principle of SegregationMendel next let the F1 plants self-fertilize, to observe the pattern of transmission of traitsin the F2 generation. When he had crossed pure round-seed plants with pure wrinkled-seed plants, 100 % of the F1 generation had round seeds. Mendel was astonished to findthat 75 % of the F2 generation had round seeds and 25 % had wrinkled seeds. That is, forseed shape, the ratio was 3:1 round to wrinkled. He performed crosses to follow other traitsand found the F1 generations all had the same 3:1 ratio of dominant to recessive trait.
To explain these ratios, Mendel reasoned that each plant must carry two copies (alleles)of each gene that can be the same or different. An individual with round seeds must carryat least one dominant allele (R), but individuals with wrinkled seeds must always carrytwo copies of the recessive allele (rr).
When both alleles of a gene pair are the same, an individual is said to be homozygousfor that trait. When the alleles of a gene pair are different, an individual is heterozygousfor that trait. The complement of genes of an organism is called its genotype, and thephysical expression of the genotype is the phenotype.
Mendel also correctly concluded that the two copies of a gene in a gene pair undergo segregation during the formation of the sex cells. Each mature gamete contains only onemember of a gene pair. When an individual is homozygous for a gene, all of its gametescarry the same allele. When an individual is heterozygous for a gene, each gamete couldreceive either allele. Figure 3 (a) shows the results of a cross between two homozygouspeas. At fertilization, the new individual receives one copy of the gene from the femaleparent and one from the male parent. All members of the F1 generation, therefore, areheterozygous. When the F1 generation was allowed to self-pollinate, three different geno-types were produced, which determined the two phenotypes that Mendel observed(Figure 3 (b)).
Section 18.1
recessive trait a characteristic thatis expressed only when both allelesin an individual are the recessiveform
allele one of alternative forms of agene
homozygous having identicalalleles for the same gene
heterozygous having differentalleles for the same gene
genotype the genetic complementof an organism
phenotype the observablecharacteristics of an organism
segregation the separation ofalleles during meiosis
round seed wrinkled seed
RR
R R
rr
rr
Rr
hybrid offspring produced
round seed
gametes formed
cross-pollination occurs
Figure 3(a) When a pea plant homozygous for round seeds is cross-pollinated with a pea plant
homozygous for wrinkled seeds, the offspring are all heterozygous.(b) The F2 progeny from a cross of two heterozygous pea plants with round seeds will have
three possible genotypes RR, Rr, and rr.
Rr Rr
R
RR Rr Rr rr
round round round wrinkled
r R r
F2 generation inherits alleles fromthe gametes of the F1 generation.
Meiosis occurs. Each gamete has one of the homologous chromosomes.
(a) (b)
Genetic TermsThis animation gives a visualreview of some of the terms usedin studying genetics.
www.science.nelson.com GO
EXTENSION +
Ch 18_Bio_Alberta30 1/8/07 12:21 PM Page 599

600 Chapter 18 NEL
mini Investigation Cross-Pollination
Materials: two plants of the same species that have differentcolours of flowers, small scissors, paint brush, plastic bags,potting soil, water, small pots
• On the plant you want to be the seed-parent, select a flowerthat is not yet open. Using Figure 4 as a guide, remove theanthers from the flower.
• Using the paint brush, transfer pollen from the pollen-parentto the stigma of the seed-parent flower from which youremoved the anthers.
(a) Predict the flower colour of the offspring of your cross-pollinated plant. Give reasons for your prediction.
(b) Why were the anthers removed from the plant that receivedthe pollen?
(c) Why was a plastic bag placed over the flower?
• If there is time, collect and grow seeds from the flower youpollinated. Cover the pollinated flower with a plastic bag.Once the flower has produced seeds, plant the seeds inmoist soil. Place the plant in sunlight (or under a bright light)and keep it watered until it produces flowers.
(d) Was your prediction correct?
Figure 4 Pollen is transferred from the donor plant to the pistil of therecipient, which has had its stamens removed to prevent self-pollination.
Remove anthers from seed parent.
Transfer pollen from pollen parent to seed parent.
• Inherited traits are controlled by factors—genes—that occur in pairs.Each member of a pair of genes is called an allele.
• One factor, or allele, masks the expression of another. This is known as the principleof dominance.
• A pair of factors, or alleles, separates from one another (segregate) during theformation of sex cells. This is often referred to as the law of segregation.
Gregor Mendel—Pioneer of GeneticsSUMMARY
Section 18.1 Questions1. Why were the pea plants selected by Mendel ideally suited
for studying the transmission of traits?
2. Explain why, under normal circumstances, an individualcan carry only two alleles of a gene.
3. Use an example that helps differentiate between the termsgenotype and phenotype.
4. Black fur colour is dominant to yellow in Labrador retrievers.(a) Explain how the genotype of a homozygous black dog
differs from that of a heterozygous black dog.(b) Could the heterozygous black dog have the same
genotype as a yellow-haired dog? Explain.
5. A pea plant with round seeds is cross-pollinated with apea plant that has wrinkled seeds. The plant with roundseeds is heterozygous. Indicate each of the following:(a) the genotypes of the parents(b) the gametes produced by the parent with round seeds(c) the gametes produced by the parent with wrinkled seeds(d) the possible genotype(s) and the phenotype(s) of the
F1 generation
Ch 18_Bio_Alberta30 1/8/07 12:21 PM Page 600

The Basis of Heredity 601NEL
18.218.2phenotypic ratio the ratio ofoffspring with a dominant trait tothe alternative, recessive trait
Punnett square a chart used todetermine the predicted outcome ofa genetic cross
genotypic ratio the ratio ofoffspring with each possible allelecombination from a particular cross
Rr
wrinkledseed
wrinkled seed
r
r r
R
rr
gametes
rr
gametes
roundseed
Figure 1The partially completed Punnettsquare for a cross between a peaplant with genotype rr and a peaplant with genotype Rr. Thegenotype rr in one cell of thePunnett square is one of fourpossible combinations of theparental alleles.
Rr
roundseed
wrinkledseed
r
r r
R
rr
gametes
Rr Rr
rr rr
gametes
Figure 2
Probability and Inheritance of Single Traits
For every cross, Mendel kept track of the number of offspring that inherited the dominanttrait and recessive trait. Based on mathematical analysis of these numbers, Mendel alsoconcluded that each gamete produced by a heterozygous individual has an equal chanceof getting either allele of a gene pair. Recall that when Mendel allowed peas that were het-erozygous for the seed shape allele to self-pollinate, 75 % of the F2 generation had theround-seed phenotype and 25 % had the wrinkled-seed phenotype. In other words, thephenotypic ratio of offspring with the dominant trait to offspring with the recessivetrait was 3 to 1. To get this ratio, each sex cell must have had an equal probability of get-ting the R allele as the r allele during the process of segregation.
The probability of an outcome is a measure of the likelihood that the outcome willoccur. Probability may be expressed as a fraction, a decimal, or a percentage. Probability(P) can be determined using the following formula:
P �
For example, you might calculate the probability of getting heads when you toss acoin. There is only one way of tossing heads, so the numerator is 1. Since there are twopossible outcomes in total, the denominator is 2. Therefore, the probability P of tossingheads is �
12
�, or 0.5, or 50 %.A Punnett square is a chart that can help us to predict the phenotypes of the progeny
of a cross between parents of known genotypes, or to deduce the genotypes of parentsfrom the observed phenotypic ratio of their progeny. Punnett squares also allow us todetermine the expected ratio of the genotypes (genotypic ratio) and the phenotypesfor a cross, and to state the probability of that particular genotype or phenotype will occurin the progeny of a cross.
number of ways that a given outcome can occur�����
total number of possible outcomes
A breeder crosses a pea plant with wrinkled seeds and a pea plant with round seeds. Sheknows that the plant with round seeds is heterozygous for the gene for seed shape. Theallele for round seeds (R ) is dominant over the allele for wrinkled seeds (r). Determine theexpected genotypic ratio and phenotypic ratio of the progeny.
SolutionSince r is the recessive allele, the genotype of the plant with wrinkled seeds must be rr.Since the plant with round seeds is heterozygous, its genotype must be Rr. The symbolsfor the alleles in the gametes are written across the top and along the left side of thePunnett square (Figure 1). Each cell is then filled in by entering one allele from the topof the square and a second allele from the side of the square.
Figure 2 shows a completed Punnett square for a cross between a heterozygousround-seed pea plant and a wrinkled-seed pea plant. Two of the four cells show thegenotype Rr and two show rr. The expected genotypic ratio in the progeny of Rr to rr is,therefore, 1:1. Offspring with genotype Rr will have round seeds, and those with geno-type rr will have wrinkled seeds.
Therefore, the phenotypic ratio is 1:1 ( �12
� round and �12
� wrinkled).
SAMPLE exercise 1
Ch 18_Bio_Alberta30 1/8/07 12:21 PM Page 601

602 Chapter 18 NEL
Test CrossesWool producers often prefer sheep with white wool, since black wool tends to be brittle anddifficult to dye. Black sheep can be avoided by breeding only homozygous white rams.However, the allele for white wool (W) is dominant over the allele for black wool (w), sowhite rams can be heterozygous. How could a wool producer be sure that a white ram ishomozygous?
For the cross shown in Figure 3, what is the probability that an offspring will have a phenotype of wrinkled seeds? Express the answer as a percent.
SolutionSince the allele for wrinkled seeds, r, is recessive, only offspring with a genotype rr willhave wrinkled seeds. From the Punnett square, 1 of every 4 offspring are expected tohave this genotype, so the probability that an offspring will have wrinkled seeds is 25 %.
SAMPLE exercise 2
Practice1. What is the phenotypic ratio of the cross in the Punnett square shown in
Figure 4?
2. Using a Punnett square, determine the expected phenotypic ratio and genotypic ratio for the progeny of a cross between a pea plant that is homozygous for the white allele (r) for flower colour and a pea plant that ishomozygous for the red allele (R).
Rrroundseed
r
R r
R
Rr
gametes
RR Rr
Rr rr
gametes
roundseed
Figure 3 A Punnett square showing the resultsof a cross between two heterozygousplants with round seeds
Figure 4Punnett square of a monohybrid cross between a homozygous tall pea and ahomozygous short pea
Tt
Tt Tt
Ttt
t
TT
WEB Activity
Case Study—Creating a Personal ProfileSome human genes determine visible traits that show an inheritance pattern that is similar tothat of Mendel’s garden peas. As a result, you can predict a person’s genotype for these traitsjust by observing him or her. In this activity, you will use a list of some common dominant andrecessive traits, and use this information to create a profile of your own phenotype andpotential genotype.
www.science.nelson.com GO
GeneticsIn this Virtual Biology Laboratory,you can assess data and performsimulated crosses to explain theinheritance of shell colour inglyptodonts, an extinct relative ofthe armadillo.
www.science.nelson.com GO
EXTENSION +
F2 Ratios This animation shows some of theresults of Mendel's crosses, whichyou can then convert tophenotypic ratios. How close arethe observed phenotypic ratios tothe predicted phenotypic ratio?
www.science.nelson.com GO
EXTENSION +
Ch 18_Bio_Alberta30 1/8/07 12:22 PM Page 602

The Basis of Heredity 603NEL
Section 18.2
A test cross is the cross of an individual of unknown genotype to an individual witha recessive genotype. The phenotypes of the F1 generation of a test cross reveal whetheran individual with a dominant trait (such as a white ram) is homozygous or heterozygousfor the dominant allele. If a white ram is crossed with a black ewe and the observed phe-notypic ratio is 1:1 black to white, then the genotype of the ram must be Ww (Figure 5).If all the offspring are white, then the genotype of the white ram must be WW.
Test crosses are the simplest way of determining the genotype of an individual.Sometimes, however, the parents are not available to test cross. When only informationabout the phenotypes of the offspring of a cross is available, the genotypes and pheno-types of the parents can be found by working backwards through a Punnett square.
Half of the offspring areblack and half are white.
All of the offspringare white.
Ww Ww
Ww Ww
W W
w
w
W ? × ww W ? × ww
Ww ww
Ww ww
W w
w
w Figure 5 A test cross is a way of determiningif an individual with the dominanttrait is heterozygous orhomozygous.
A horticulture worker has seeds from a particular cross, but has no information about thegenotype or the phenotype of the parents. He plants and grows the offspring, and records thetraits of each offspring (Table 1). What was the genotype and phenotype of the parent plants?
SolutionDetermine the observed phenotypic ratio of the progeny, rounding off if needed.
�w
rroinuknlded
� � �
List the possible genotypes for each phenotype, as shown in Table 2.
3�1
5472�1850
SAMPLE exercise 3
Table 2
Phenotype Genotype
round-seed peas RR or Rr
wrinkled-seed peas rr
Table 1
Offspring phenotype Numbers
round-seed peas 5472
wrinkled-seed peas 1850
test cross the cross of anindividual of unknown genotype toan individual that is fully recessive
Factors that Contribute toGenetic VariationIn this Audio Clip, you will hearabout the underlying mechanismsthat create genetic variation in theoffspring of sexually reproducingindividuals.
www.science.nelson.com GO
EXTENSION +
Ch 18_Bio_Alberta30 1/8/07 12:22 PM Page 603

604 Chapter 18 NEL
A 3:1 phenotypic ratio occurs when two heterozygous individuals are crossed, so weknow that the parents must be heterozygous. Since only �
14
� of the progeny had wrinkledseeds, this is the recessive phenotype and must be determined by two copies of therecessive allele. The parents were heterozygous, so their genotype was Rr. Check theanswer using a Punnett square (Figure 6).
Practice3. A fish breeder has a red male cichlid of unknown parentage. Red colour is
dominant to yellow in the fish. He must know whether the fish is heterozygousfor these colours. Suggest a way the fish breeder might find out the genotypeof his red male. Use a Punnett square to explain your answer.
4. A neighbour gives a home gardener some seeds that he collected last yearfrom his red carnations. The gardener plants 50 of the seeds and is surprisedto find 12 of the plants have white flowers. Assuming that all the seeds camefrom one cross, what was the genotype of the parents?
rr
roundRrRR
round wrinkled
round
Rr
round parent
r
R
rR
round parent
Figure 6The observed phenotypic ratio isthe same as the ratio predicted bythe Punnett square.
Section 18.2 Questions1. In Dalmatian dogs, the spotted condition is dominant to
non-spotted.(a) Using a Punnett square, show the cross between two
heterozygous parents.(b) A spotted female Dalmatian dog has six puppies sired
by an unknown male. From their appearance, theowner concludes that the male was a Dalmatian. Threeof the pups are spotted and three are not. What is thegenotype and phenotype of the puppies’ father?
2. For Mexican hairless dogs, the hairless trait is dominant tohairy. A litter of eight pups is found; six are hairless andtwo are hairy. What are the genotypes of their parents?
3. Test crosses are valuable tools for plant and animalbreeders.(a) Provide two practical examples of why a cattle rancher
might use a test cross.(b) Why are most test crosses performed using bulls
rather than cows?
• By using a Punnett square, the expected phenotypic ratio and genotypic ratio ofthe offspring of a cross can be determined.
• Probability, P �
Probability values can be used to predict the likelihood that a particularphenotype will appear in a cross.
• A test cross is the cross of an individual of unknown genotype to an individualwith a fully recessive genotype.
number of ways that a given outcome can occur�����
total number of possible outcomes
Probability and Inheritance of SingleTraitsSUMMARY
Ch 18_Bio_Alberta30 1/8/07 12:22 PM Page 604

The Basis of Heredity 605NEL
18.318.3Pedigree ChartsPedigree analysis is another tool for solving genetic problems. This approach is especiallyuseful when it is not possible to perform crosses using specific individuals or to generatelarge numbers of progeny, such as for humans. A pedigree chart is like a family treein which the inheritance of a trait can be traced from parents to offspring.
A pedigree chart shows the family relationship among individuals. Symbols identify thegender of each individual and whether an individual had the trait of interest. Pedigree chartsmay also show when an individual is known to be homozygous or heterozygous for a trait.The top of Figure 1 shows some commonly used symbols. The pedigree chart in thelower part of Figure 1 shows the transmission of an inherited disease among membersof a family. Genetic counsellors may use pedigree charts in their work.
I
II
male
female
mating
Roman numeralssymbolizegenerations.
Arabic numbers symbolizeindividuals within a givengeneration.
Birth order within each group of offspringis drawn left to right, oldest to youngest.
identicaltwins
fraternaltwins
affectedindividuals
knownheterozygotesfor autosomalrecessive
31 2
Pedigree Symbols
Sample Pedigree
I
II
III
2
1 2 3
1
54
2 31
Figure 1Squares represent males and circles represent females. A slash through a symbol indicatesthat person is deceased. Vertical lines connect parents to offspring, horizontal lines connectmates and connect siblings. Individuals affected by the inherited disease are identified by thedarker-coloured symbols. Symbols having two different colours identify individualsheterozygous for the disease.
pedigree chart a chart used torecord the transmission of aparticular trait or traits over severalgenerations
Ch 18_Bio_Alberta30 1/8/07 12:22 PM Page 605

606 Chapter 18 NEL
Practice1. People with albinism do not produce normal pigment levels. Albinism is a recessive
trait. Use the pedigree chart in Figure 2 to answer the following questions. Use anuppercase “A” to represent the dominant allele, and a lowercase “a” for the recessiveallele.(a) How many children do the parents A and B have?(b) Indicate the genotypes of the parents.(c) Give the genotypes of M and N.
female albinism
female normal
male albinism
male normal
D
A B
C E F G H
J K L M NI
? ?
Figure 2
Genetic ScreeningDue to advances in technology, it is now possible to getinformation about the genotype of any person relatively easily.Genetic screening may be carried out before birth (prenatalscreening) or any time after birth. The most common reason forparents to want prenatal genetic screening is because they areat increased risk of passing a genetic disease to their child.
Thalassemia is one genetic disease for which prenatalgenetic screening may be performed. Thalassemia is a diseaseof the blood, which affects a person’s ability to produceenough red blood cells. Only people with two copies of amutant allele of a particular a gene will have the disease.Genetic screening for thalassemia is performed only on thosepeople with a family history of the disease. Prenatal screeningcan identify the presence of the thalassemia allele before thechild is born.
Persons at risk of Huntington disease may request either pre-or post-natal screening. Huntington disease is a neurologicaldisorder caused by a dominant allele. Huntington is characterizedby rapid deterioration of nerve control, which causes a rangeof symptoms, including involuntary movements, slurredspeech, loss of memory, and depression. Huntington disease isfatal. There is no cure and available treatments have littleeffect on symptoms. Symptoms of Huntington disease begingradually, usually in middle age, when most people havealready had children. Genetic screening allows people toknow whether they have inherited the disease before anysymptoms develop, so they may know whether they are at riskof passing it on to their children.
Issue Design AnalysisResolution Evidence Evaluation
Issue ChecklistEXPLORE an issue
Understanding the Issue• Working in a group, conduct research and find out more
about genetic screening.
1. Define genetic screening. Describe some technologies usedin genetic screening.
2. What are some advantages of genetic screening? Providean example.
3. What are some physical dangers associated with geneticscreening methods? Provide an example.
Take a StandConsider this position statement: Genetic screening should becompulsory for any person with a family history of a geneticdisease.
With your group members, create a list of differentstakeholders in this issue. Based on your research, determinepoints that support and refute the position statement from theperspective of each stakeholder. Then, decide whether yourgroup agrees or disagrees with the position statement. Presentyour position to the class. Prepare to defend your group’sposition in a class discussion.
www.science.nelson.com GO
Ch 18_Bio_Alberta30 1/8/07 12:22 PM Page 606

The Basis of Heredity 607NEL
Section 18.3
WEB Activity
Simulation—Pedigree AnalysisComplete the interactive Pedigree Analysis Tutorial in this Virtual Biology Laboratory. You canalso use pedigree analysis to examine the inheritance of several genetic diseases in humans,and to act as a “genetic counsellor” in some hypothetical case studies.
www.science.nelson.com GO
• A pedigree chart traces the inheritance of a trait from parents to offspringthrough several generations.
• Pedigree charts are useful in cases when it is not possible to perform and followspecific crosses, such as in human genetic studies.
Pedigree ChartsSUMMARY
Section 18.3 Questions1. A woman begins to show symptoms of Huntington disease.
Her father had Huntington disease, but her mother neverdeveloped the disorder. Neither her husband nor anyone inhis immediate family have any symptoms.(a) What is the genotype of the woman with Huntington
disease?(b) What is the probable genotype of the woman’s husband?(c) If the woman has six children, how many are likely to
develop Huntington disease?
2. Phenylketonuria (PKU) is a genetic disorder caused by a dominant allele. Individuals with PKU are unable tometabolize a naturally occurring amino acid, phenylalanine.If phenylalanine accumulates, it inhibits the developmentof the nervous system, leading to mental retardation. Thesymptoms of PKU are not usually evident at birth, but candevelop quickly if the child is not placed on a special diet.The pedigree in Figure 3 shows the inheritance of thedefective PKU allele in a family.(a) How many generations are shown by the pedigree?(b) How many children were born to the parents of the
first generation?
(c) What is the genotype of individuals 1 and 2, generation I?(d) How is it possible that in generation II, some of the
children showed symptoms of PKU, while others didnot? (Hint: Use a Punnett square to help with yourexplanation.)
(e) For individuals 6 and 7, in generation II, a child withoutPKU symptoms was born. Does this mean that theycan never have a child with PKU? Explain your answer.
3. Research the inheritance of one of the traits in Table 1 in afamily that you know. Get information from at least threegenerations of the family. Use the information you collectto make a pedigree chart.
4. (a) How or where might genetic screening be used forpurposes other than genetic counselling?
(b) What laws, if any, do you think are likely to ariseregarding the use of genetic screening? Why?
I
II
III
1 2
1 2 3 4 5 6 7
1 2 3 4 5
Figure 3
Table 1
Trait Dominant Recessive
freckles present absent
dimples present absent
earlobe suspended attached
hairline pointed on straight acrossforehead forehead
chin dimple present absent
www.science.nelson.com GO
Ch 18_Bio_Alberta30 1/8/07 12:22 PM Page 607

608 Chapter 18 NEL
18.418.4 Other Patterns of InheritanceThe traits that Mendel studied showed little variability. Each had only two alleles, one thatwas clearly dominant and one clearly recessive. However, many inherited traits showmore variability than just two alternate forms. These types of traits will not be inheritedin the predicted 3:1 phenotypic ratio of a trait with one dominant allele and one reces-sive allele.
Pleiotropic GenesSome genes, called pleiotropic genes, affect many different characteristics. Sickle-cellanemia, a blood disorder, is caused by a pleiotropic gene. Normal hemoglobin (the pig-ment that carries oxygen in the blood) is produced by the allele HbA. Sickle cell anemiaoccurs in individuals who have two copies of the mutated allele, HbS. This mutationproduces abnormally shaped hemoglobin molecules that interlock with one another.The new arrangement of molecules changes the shape of the red blood cells, whichbecome bent into a sickle shape. The sickle-shaped red blood cells cannot pass throughthe capillaries, and so cannot deliver oxygen to the cells. People with sickle-cell anemiacan suffer from fatigue and weakness, an enlarged spleen, rheumatism, and pneumonia.Patients often show signs of heart, kidney, lung, and muscle damage.
Multiple AllelesWhen traits are determined by more than two (multiple) alleles, the most commonlyseen trait is called the wild type, and the allele that determines it is the wild-type allele.Non-wild-type traits are said to be mutant, and the alleles that determine them aremutant alleles. In most cases of multiple alleles, there is a hierarchy of dominance.
Members of the species Drosophila melanogaster, the fruit fly (Figure 1), can have anyone of four eye colours. Red eye colour is the wild type, but the eyes may also be apricot,honey, or white. The Drosophila species as a whole has more than two alleles for eye colourbut, since fruit flies are diploid, each individual carries only two genes for eye colour.
The dominance hierarchy and symbols for eye colour in Drosophila are shown inTable 1. When there are multiple alleles for the same gene, upper case letters and super-script numbers are used to express the dominance relationships between the differentalleles. For simplicity, the capital letter E is used for the eye colour gene and superscriptnumbers to indicate the position of each allele in the dominance hierarchy.
pleiotropic gene a gene thataffects more than one characteristic
wild type the most common alleleof a gene with multiple alleles
mutant any allele of a gene otherthan the wild type allele
Figure 1(a) Drosophila melanogaster, the
fruit fly, is widely used forgenetic studies.
(b) Wild type, or red, is the mostcommon eye colour. It isdominant over all the otheralleles for eye colour.
(a)
(b)
Table 1 Dominance Hierarchy and Symbols for Eye Colour in Drosophila
Phenotype Allele symbol Possible genotype(s) Dominant over
wild type E1 E1E1, E1E2, E1E3, E1E4 apricot, honey, white
apricot E2 E2E2, E2E3, E2E4 honey, white
honey E3 E3E3, E3E4 white
white E4 E4E4
Pleiotropic Effects ofMarfan SyndromeMarfan Syndrome is caused by amutation in a single gene. Thisanimation shows you how this onegene affects four different organsystems.
www.science.nelson.com GO
EXTENSION +
Ch 18_Bio_Alberta30 1/8/07 12:22 PM Page 608

The Basis of Heredity 609NEL
Section 18.4
Incomplete DominanceWhen two alleles are equally dominant, they interact to produce a new phenotype—this form of interaction between alleles is known as incomplete dominance. When anindividual is heterozygous for two alleles that show incomplete dominance, both allelesare equally expressed, but at half the level that would occur were the individual homozygousfor either allele. The phenotype of a heterozygous individual is, therefore, intermediatebetween its homozygous parents. For example, when a homozygous red snapdragon iscrossed with a homozygous white snapdragon, all of the F1 generation have pink flowers.If members of the F1 generation are crossed, the F2 generation has a surprising phenotypicratio of one red to two pink to one white (1:2:1). The Punnett square in Figure 3 showsthe genotypes behind this ratio.
apricot
wildtype
E 4
E 1
E 2 E 3
apricot honey
wildtype
E 1 E 3
E 3 E 4E 2 E 4
E 1 E 2
Figure 2A cross between a fruit fly withwild-type eye colour and one withapricot-coloured eyes
What will be the phenotypic ratio of the offspring from the mating of the followingDrosophila individuals?
E1E 4 (wild-type eye colour) � E 2E 3 (apricot eye colour)
SolutionThe problem can be solved by using a Punnett square. The first parent is heterozygous,and so will produce gametes with the E1 allele and the E 4 allele. The other parent is alsoheterozygous, and will produce gametes with the E 2 allele and the E 3 allele. The Punnettsquare for this cross is, therefore, as shown in Figure 2.
Using the dominance hierarchy in Table 1, the phenotypic ratio of the F1 offspring willproduce two wild-type eye colour (genotypes E 1E 2 and E 1E 3 ) to one apricot eye colour(genotype E 2E 4 ) to one honey eye colour (genotype E 3E 4 ).
SAMPLE exercise 1
Practice1. A student working with Drosophila makes the following cross:
E 1E 2 (wild-type eye colour) � E 2E 4 (apricot eye colour)
What will be the phenotypic ratio of the offspring?
incomplete dominance theexpression of both forms of an allelein a heterozygous individual in thecells of an organism, producing anintermediate phenotype
CR
CW
CR
CW
CRCW
CRCW CWCW
CRCR
CRCR
CRCW
CWCW
= red= pink= white
Figure 3 Colour in snapdragons is anexample of incomplete dominance.When homozygous red-floweredsnapdragons are crossed withhomozygous white-floweredsnapdragons, the F1 generation allhave pink flowers. When a cross ismade between two F1 individuals,the F2 generation has a phenotypicratio of one red to two pink to onewhite.
Ch 18_Bio_Alberta30 1/8/07 12:22 PM Page 609

CodominanceAnother form of allele interaction is codominance. When two alleles show codomi-nance, both alleles are fully expressed in a heterozygous individual, but not in the samecells. Coat colour in shorthorn cattle shows codominance (Figure 4). Red coats are com-posed of all red hairs, and white coats are all white hairs. When a red shorthorn is crossedwith a white shorthorn, any calves produced will have roan-coloured coats, which isintermediate between the red and the white coat colour. However, each hair is not theintermediate roan colour. Instead, a roan coat has a mixture of white hairs and red hairs.
610 Chapter 18 NEL
codominance the expression ofboth forms of an allele in aheterozygous individual in differentcells of the same organism
HrHw HrHw
HrHw HrHw
Hr Hr
Hw
Hw
red bull
white cow roan calf
F1 generation
F2 generation
roan cow roan bull
redHrHr
roanHrHw
roanHrHw
whiteHwHw
X
Figure 4In codominance, either one of two different alleles is expressed. In shorthorn cattle, the coatsof roan animals have intermingled red and white hair.
Environment and PhenotypeSometimes, variation of a trait is determined by the interaction of the genotype withthe environment. The environment can have a profound effect on phenotype. Himalayanrabbits have black fur when they are raised at low temperatures, but white fur whenraised at high temperatures. In some cases, different parts of the same organism canhave different traits when exposed to different environments. Leaves of the water but-tercup, Ranunculus aquatilis, that develop above the surface of the water are broad,lobed, and flat, while those that develop below the water are thin and finely divided.However, the leaves all have identical genetic information.
CAREER CONNECTION
VeterinarianVeterinarians provide health careservices that include the diagnosisand treatment of injured and sickanimals. They give advice aboutthe breeding of animals andperform genetic procedures andembryo transfers. Veterinarianswork long hours and are dedicatedanimal health specialists. Learnmore about their duties.
www.science.nelson.com GO
Coat Colour in theHimalayan RabbitView this animation of how coatcolour in this species is affectedby temperature.
www.science.nelson.com GO
EXTENSION +
Ch 18_Bio_Alberta30 1/8/07 12:22 PM Page 610
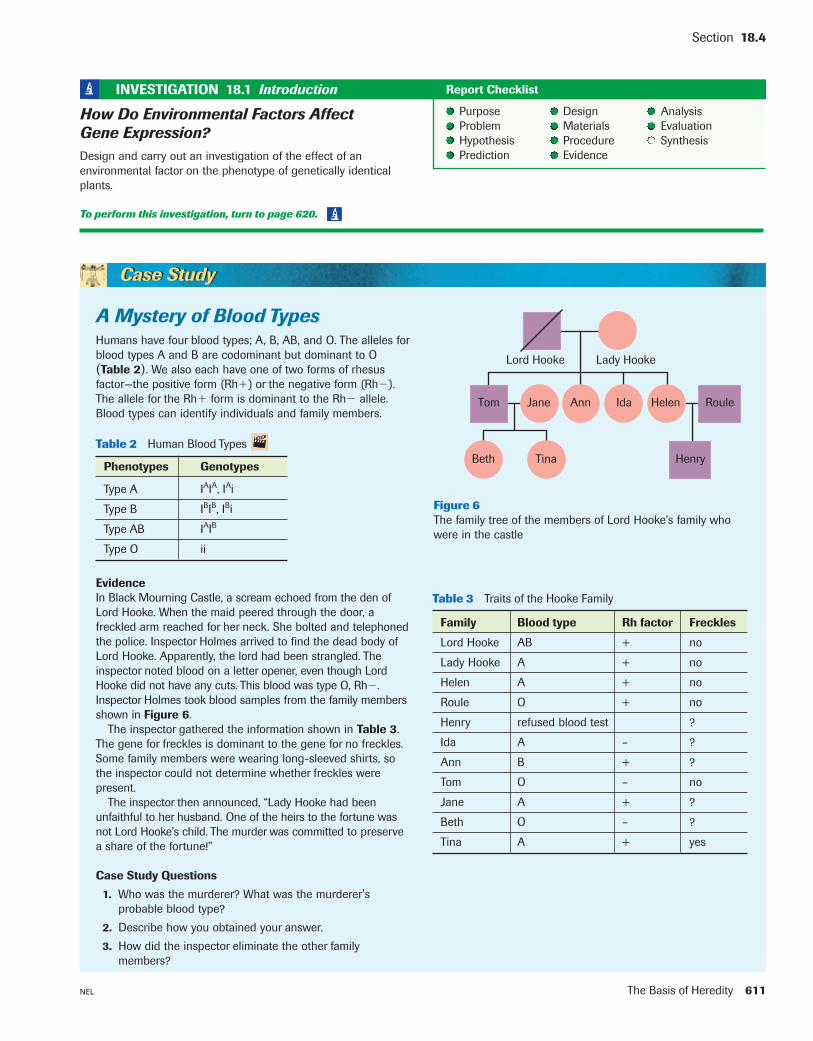
The Basis of Heredity 611NEL
Section 18.4
A Mystery of Blood TypesHumans have four blood types; A, B, AB, and O. The alleles forblood types A and B are codominant but dominant to O(Table 2). We also each have one of two forms of rhesusfactor—the positive form (Rh�) or the negative form (Rh�).The allele for the Rh� form is dominant to the Rh� allele.Blood types can identify individuals and family members.
Case StudyCase Study
Table 2 Human Blood Types
Phenotypes Genotypes
Type A IAIA, IAi
Type B IBIB, IBi
Type AB IAIB
Type O ii
Lord Hooke Lady Hooke
Tom Jane Ann Ida Helen Roule
Beth Tina Henry
Figure 6The family tree of the members of Lord Hooke’s family whowere in the castle
EvidenceIn Black Mourning Castle, a scream echoed from the den ofLord Hooke. When the maid peered through the door, afreckled arm reached for her neck. She bolted and telephonedthe police. Inspector Holmes arrived to find the dead body ofLord Hooke. Apparently, the lord had been strangled. Theinspector noted blood on a letter opener, even though LordHooke did not have any cuts. This blood was type O, Rh�.Inspector Holmes took blood samples from the family membersshown in Figure 6.
The inspector gathered the information shown in Table 3.The gene for freckles is dominant to the gene for no freckles.Some family members were wearing long-sleeved shirts, sothe inspector could not determine whether freckles werepresent.
The inspector then announced, “Lady Hooke had beenunfaithful to her husband. One of the heirs to the fortune wasnot Lord Hooke’s child. The murder was committed to preservea share of the fortune!”
Case Study Questions
1. Who was the murderer? What was the murderer'sprobable blood type?
2. Describe how you obtained your answer.
3. How did the inspector eliminate the other familymembers?
Table 3 Traits of the Hooke Family
Family Blood type Rh factor Freckles
Lord Hooke AB + no
Lady Hooke A + no
Helen A + no
Roule O + no
Henry refused blood test ?
Ida A – ?
Ann B + ?
Tom O – no
Jane A + ?
Beth O – ?
Tina A + yes
Purpose Design AnalysisProblem Materials EvaluationHypothesis Procedure SynthesisPrediction Evidence
To perform this investigation, turn to page 620.
How Do Environmental Factors Affect Gene Expression?Design and carry out an investigation of the effect of anenvironmental factor on the phenotype of genetically identicalplants.
INVESTIGATION 18.1 Introduction Report Checklist
Ch 18_Bio_Alberta30 1/8/07 12:22 PM Page 611

Section 18.4 Questions1. Multiple alleles control the coat colour of rabbits. A grey
colour is produced by the dominant allele C. The Cch alleleproduces a silver-grey colour, called chinchilla, whenpresent in the homozygous condition, CchCch. When Cch ispresent with a recessive gene, a light silver-grey colour isproduced. The allele C h is recessive to both the full-colourallele and the chinchilla allele. The C h allele produces awhite colour with black extremities. This coloration patternis called Himalayan. An allele C a is recessive to all genes.The C a allele results in a lack of pigment, called albino. Thedominance hierarchy is C >Cch >C h >C a. Table 4 providesthe possible genotypes and phenotypes for coat colour inrabbits. Notice that four genotypes are possible for full-colourbut only one for albino.
(a) Indicate the genotypes and phenotypes of the F1generation from the mating of a heterozygousHimalayan-coat rabbit with an albino-coat rabbit.
(b) The mating of a full-colour rabbit with a light-grey rabbitproduces two full-colour offspring, one light-greyoffspring, and one albino offspring. Indicate the genotypes of the parents.
(c) A chinchilla rabbit is mated with a light-grey rabbit.The breeder knows that the light-grey rabbit had analbino mother. Indicate the genotypes and phenotypesof the F1 generation from this mating.
(d) A test cross is performed with a light-grey rabbit, andthe following offspring are noted: five Himalayan rabbitsand five light-grey rabbits. Indicate the genotype of thelight-grey rabbit.
2. A horse that is homozygous for the allele C r will have achestnut, or reddish, coat. A horse that is homozygous forthe allele C m will have a very pale cream coat, calledcremello. Palomino coat colour is determined by theinteraction of both the chestnut and the cremello allele.Indicate the expected genotypic ratio and phenotypic ratioof the F1 progeny of a palomino horse with a cremello horse.
3. Two pea plants are cross-pollinated. Using a Punnettsquare and probability analysis, you predict that �
34
� of theoffspring will be tall. However, less than �
14
� grow to be tall.What other factors can affect phenotype? How much trustshould be put on probability calculations?
Table 4 Coat Colour in Himalayan Rabbits
Phenotypes Genotypes
full colour CC, CC ch, CC h, CC a
chinchilla C chC ch
light grey C chC h, C chC a
Himalayan C hC h, C hC a
albino C aC a
612 Chapter 18 NEL
• Some genes have more than two alleles, and can determine more than two formsof a trait. Multiple alleles may display a dominance hierarchy.
• Alleles that show incomplete dominance are equally dominant. An individualwho is heterozygous for alleles that show incomplete dominance will have anintermediate phenotype.
• Codominant alleles are both expressed in a heterozygous individual.
Other Patterns of InheritanceSUMMARY
Ch 18_Bio_Alberta30 1/8/07 12:22 PM Page 612

The Basis of Heredity 613NEL
18.518.5Dihybrid Crosses and
Polygenic TraitsA dihybrid cross is a cross that involves individuals with two independent traits that arepresent in alternate forms. Mendel performed dihybrid crosses with his garden peas tosee if traits were inherited independently or with one another. He first crossed plantsthat were pure-breeding (homozygous) for two dominant traits with plants that werehomozygous for two recessive traits, as shown in Figure 1. Each parent is homozygous fortwo traits, seed shape and seed colour. All the members of the F1 offspring are hetero-zygous for the seed-colour gene and for the seed-shape gene. Since all the F1 progenyhad yellow, round seeds, Mendel’s principle of dominance applies to this dihybrid cross.
Evidence of Independent AssortmentMendel explained the result shown in Figure 1 by postulating that each gene was inheritedindependently. Today, this is referred to as Mendel’s second law or the law of independentassortment. This law states that genes that are located on different chromosomes assortindependently.
To create a Punnett square for a dihybrid cross, we include one allele for both of thegenes in the possible gametes. The Punnett square in Figure 2 shows the expected geno-types and phenotypes for Mendel’s dihybrid cross when we assume that the genes for seedshape and seed colour are inherited independently. One parent will produce gameteswith alleles yR and the other will produce gametes with alleles Yr. The predicted phenotypeof the F1 generation is the same as Mendel observed.
Figure 3 shows the behaviour of two separate chromosomes, one that carries the genefor seed shape and another that carries the gene for seed colour. (Pea plants actuallyhave more than two chromosomes.) As the homologous chromosomes move to oppositepoles during meiosis, each gamete receives two chromosomes, one carrying the seed-shape gene and one carrying the seed-colour gene. According to the law of segregation,the alleles of both these genes will segregate during meiosis. Therefore, the allele foryellow seeds segregates from the allele for round seeds, and the allele for wrinkled seedssegregates from the allele for round seeds.
yellow,round
All members of the F1 generationhave the same genotypeand phenotype.
YyRr
YYRR
YR YR
yyrr
yryr
green,wrinkled
Figure 1A dihybrid cross between a peaplant that is homozygous for yellowseed colour (YY) and round seedshape (RR) with a plant that ishomozygous for green seed colour(yy) and wrinkled seed shape (rr).
Figure 2All gametes produced by a peaplant homozygous for yellow seedcolour (YY) and wrinkled seedshape (rr) will have the alleles Yr.Similarly, all gametes produced by apea plant homozygous for greenseed colour (yy) and round seedshape (RR) will have the alleles yR.Since all the offspring have yellow,round seeds, the genotype of all theF1 generation must be YyRr. Thiswould not be possible if the genesfor seed shape and seed colourwere inherited together.
Gametes
GametesYr
yR
yR
Yr
YyRr
YyRr YyRr
YyRr
F1 generationyellow, round
green,round
yyRR
YYrr
yellow,wrinkled
dihybrid cross a genetic crossinvolving two genes, each of whichhas more than one allele
Paired Chromosomes
Y
R r
y
Y Y
R R
y y
r r
Figure 3Segregation of alleles and independent assortment of chromosomes during meiosis gives riseto four possible combinations of alleles in the gametes of a plant of genotype YyRr.
Ch 18_Bio_Alberta30 1/8/07 12:22 PM Page 613

614 Chapter 18 NEL
Mendel then produced an F2 generation by allowing the F1 progeny to self-fertilize. Herecorded the phenotypes of all the F2 progeny and then calculated the ratio of each phenotypehe observed. The F2 generation had the following phenotypic ratios: �
196� yellow, round
seeds; �136� green, round seeds; �
136� yellow, wrinkled seeds; and �
116� green, wrinkled seeds.
Figure 4 shows the expected genotypes from this cross when we assume that inde-pendent assortment occurred. The parents would produce four types of gametes. Thegenotypes in nine of the 16 cells would determine yellow, round seeds (YYRR, YyRR,YYRr, and YyRr); three of the 16 cells would determine green, round seeds (yyRR andyyRr); three more cells would determine yellow, wrinkled seeds (YYrr and Yyrr); andone cell would determine green, wrinkled seeds (yyrr). Since the predicted phenotypicratio is the same as the ratio that Mendel observed, this cross also provides evidence forindependent assortment.
Gametes
YYRR YyRR YYRr YyRr
YyRR
YYRr
YyRr
yyRR
YyRr
yyRr
YyRr
YYrr
Yyrr
yyRr
Yyrr
yyrr
YR
yR
Yr
yr
YR yR Yr yr
Figure 4 From the Punnett square analysis, self-fertilization of the F1 generation willresult in an F2 generation with a 9:3:3:1ratio. This ratio can only result ifsegregation of alleles and independentassortment of chromosomes occurs.
Probability and Dihybrid CrossesWe can determine the probability of particular phenotypes and genotypes in the progenyof dihybrid crosses in much the same way as for monohybrid crosses. Probability values canbe used to predict the chances of getting a particular genotype or phenotype in an offspring,or to tell us whether two genes are likely to be located on different chromosomes. In dihybridcrosses, however, we are interested in finding out the probability that two outcomes will occurat the same time. Recall that probability (P) is given by
P �number of ways that a given outcome can occur�����
total number of possible outcomes
Purpose Design AnalysisProblem Materials EvaluationHypothesis Procedure SynthesisPrediction Evidence
To perform this investigation, turn to page 620.
Genetics of CornUse Punnett squares and phenotypic ratios to analyze theinheritance of two traits in corn.
INVESTIGATION 18.2 Introduction Report Checklist
Ch 18_Bio_Alberta30 1/8/07 12:22 PM Page 614

The Basis of Heredity 615NEL
Section 18.5
In humans, free ear lobes are determined by the dominant allele E, and attached ear lobesby the recessive allele e. The dominant allele W determines a widow’s peak hairline andthe recessive allele w determines a straight hairline (Figure 5). The genes for these twotraits are located on different chromosomes. Suppose a man with the genotype EeWw anda woman with the genotype EeWw are expecting a child. What is the probability that thechild will have a straight hairline and attached ear lobes?
SAMPLE exercise 1
Figure 5In humans, both ear lobe shape and hairline shape are inherited. The free ear lobe in(a) is dominant to the attached ear lobe in (b), and the widow’s peak in (c) isdominant to a straight hairline in (d).
(a) (b)
(c) (d)
Learning TipWhen thinking aboutprobability, keep the followingtwo rules in mind:• When outcomes are
independent, the probabilityof one outcome is notaffected by the result of anyother outcomes. For example,if you toss two heads in arow, the probability oftossing heads a third time isstill 1 out of 2.
• The probability ofindependent eventsoccurring together is equal tothe product of those eventsoccurring separately. Thechances of tossing headsonce is �
12
�, the probability oftossing heads twice in a rowis �
12
� � �12
� � �14
�, and theprobability of tossing headsthree times in a row is �12
� � �12
� � �12
� � �18
�.
SolutionTo have attached ear lobes and a straight hairline, the child must have the genotypeeeww. Since the two genes are on separate chromosomes, the gene for ear shape andhairline shape will assort independently. The outcome that the child will receive two e alleles is, therefore, independent of the outcome that the child will receive two walleles.
First, determine the probability of each of these outcomes separately, using a separatePunnett square for each gene. From Figure 6 (a), we see the probability that the childwill have attached ear lobes is one in four ( �
14
�). From Figure 6 (b), we see theprobability that the child will have a straight hairline is also one in four ( �
14
�).
EE Ee
Ee ee
E e
E
e
12
12
14
14
14
14
12
12
WW Ww
Ww ww
W w
W
w
12
12
14
14
14
14
12
12
Figure 6Punnett squares showing monohybrid crosses between heterozygous parents for(a) free ear lobes and (b) for a widow’s peak
(a) (b)
Probability—The Sum andProduct RulesThis Audio Clip explores the useof the sum and product rules ofprobability.
www.science.nelson.com GO
EXTENSION +
Ch 18_Bio_Alberta30 1/8/07 12:22 PM Page 615

616 Chapter 18 NEL
Selective Breeding The plants and animals that make up the world’s food supply have, in large part, beendeveloped artificially from wild ancestors. Selective breeding involves identifying indi-viduals with desirable traits and using them as parents for the next generation. Overtime, the desirable traits became more and more common. For example, North AmericanAboriginal farmers used selective breeding to develop many useful crop plants, longbefore the arrival of Europeans. Many crops that are important to Canadian agricul-ture were developed by selective breeding, including rust-resistant wheat; sweet, full-kernel corn; and canola, which germinates and grows rapidly in colder climates.
You are probably familiar with the term “purebreds.” Many dogs and horses are con-sidered to be purebreds, or thoroughbreds. Genotypes of these animals are closely reg-ulated by a process called inbreeding, in which similar phenotypes are selected forbreeding. The desirable traits vary from breed to breed. For example, Irish setters arebred for their long, narrow facial structure and long, wispy hair, but dalmations are bredfor broader faces and short hair with spots. The bull terrier (pit bull) was originally bredfor fighting. Quick reflexes and strong jaws were chosen as desirable phenotypes. Somegeneticists have complained that inbreeding has caused problems for the general publicas well as for the breed itself.
New varieties of plants and animals can be developed by hybridization. This process isthe opposite to that of inbreeding. Rather than breed plants or animals with similar traits,the hybridization technique attempts to blend desirable but different traits. Corn hasbeen hybridized extensively, beginning with the work of Aboriginal peoples thousands ofyears ago. The hybrids tend to be more vigorous than either parent. Figure 7, on the nextpage, shows the most common method used. Two homozygous plants, A and B, arecrossed to produce an AB hybrid. Two other homozygous plants, C and D, are crossed toproduce a CD hybrid. Hybrids AB and CD are then crossed to produce hybrid ABCD.This hybrid will have desired traits from plants A, B, C, and D, and will be more vigorous.
Polygenic TraitsIn dihybrid crosses, two genes determine two separate traits. However, sometimes asingle trait is determined by more than one gene. Many of your characteristics are deter-mined by several pairs of independent genes. Skin colour, eye color, and height are buta few of your characteristics that are polygenic traits. Polygenic traits have much morevariability in a population than those determined by a single gene. Each of the genescan have multiple alleles, show incomplete dominance or co-dominance, and can beaffected by the environment.
Now, multiply these probabilities to calculate the probabilities of each event occurringin a dihybrid cross—that is, for the combination of traits. Therefore, the probability thatthe child will have the genotype eeww is �
14
� � �14
� � �116�.
Practice1. Calculate the probability that the couple will have a child with
(a) a widow’s peak and free ear lobes(b) a straight hairline and free ear lobes(c) a widow’s peak and attached ear lobes
selective breeding the crossing ofdesired traits from plants or animalsto produce offspring with bothcharacteristics
Aboriginal Crop PlantsFor centuries, Aboriginal peoplesbred many crop plants besidescorn, which they ultimatelyintroduced to European settlers.These include beans, tomatoes,potatoes, peanuts, peppers, cocoa,squash, pumpkins, sunflowers,long-fibre cotton, rubber, andquinine.
DID YOU KNOW ??
inbreeding the process wherebybreeding stock is drawn from alimited number of individualspossessing desirable phenotypes
www.science.nelson.com GO
CAREER CONNECTION
AgrologistAgrologists are plant, crop, andfood production specialists. Newbreeds of plants and animals areof great interest to thesescientists. They work with grainfarmers and livestock producerson research projects designed toovercome challenges and realizeeconomic opportunities inagriculture. Learn how agrologistsspecialize in many fields.
polygenic trait inheritedcharacteristics that are determinedby more than one gene
Ch 18_Bio_Alberta30 1/8/07 12:22 PM Page 616

The Basis of Heredity 617NEL
Section 18.5
Examples of polygenic traits in humans include skin colour, height, and intelligence.In other animals and plants, many desirable traits, such as milk production in cows oryield in canola, are also determined by more than one gene pair. This makes breeding forthese traits very difficult.
In some cases, two different genotypes interact to produce a phenotype that neitheris capable of producing by itself. In other cases, one of the genes will interfere with theexpression of the other, masking its effect. Genes that interfere with the expression of othergenes are said to be epistatic.
Observed phenotypic ratios of polygenic traits vary significantly from the phenotypicratios predicted by Punnett square analysis of non-interacting genes. Coat colour indogs provides an examp1e of epistatic genes. As shown in the Punnet square in Figure 8, the allele B produces black coat-colour, while the recessive allele b producesbrown coat-colour. However, a second gene also affects coat-colour. The allele W of thissecond gene prevents the formation of pigment, thereby preventing colour. The reces-sive allele w does not prevent colour. The genotype wwBb would be black, but the geno-type WwBb would appear white. The W allele masks the effect of the B colour gene. Inhumans, the gene responsible for albinism is epistatic. This gene interferes with theexpression of genes that determine pigment formation in the skin, hair, and eyes.
Figure 7Hybridization can be used to produce a more vigorous strain of corn.
Figure 8Punnett square of a cross betweena white dog (WwBb) and a blackdog (wwBb)
WwBb � wwBb
WwBB WwBb
WwBb Wwbb
wB wb
WB
Wb
wwBB wwBb
wwBb wwbb
wB
wbbrown
white
48
38
38
black
plant A plant B
hybrid AB seed
hybrid AB
plant Dplant C
hybrid CD seed
hybrid CD
hybrid ABCDseed
epistatic gene a gene that masksthe expression of another gene orgenes
Coat Colour in LabradorRetrieversCoat colour variations in thisbreed of dog is determined by twointeracting genes. In thissimulation, choose a genotype foreach gene and observe thephenotype.
www.science.nelson.com GO
EXTENSION +
Ch 18_Bio_Alberta30 1/8/07 12:22 PM Page 617

618 Chapter 18 NEL
Drought-Tolerant and Salt-TolerantPlantsUnwise agricultural practices have dramatically reduced theproductivity of the world’s agricultural land. By one estimate,the reduction in crop yields since 1940 is the same as if all theland in India and China had produced no crops at all. Inaddition, land equivalent to the area of Hungary has becomeso degraded that it is unable to produce any viable crop at all.Much of the problem is linked to poor irrigation techniques(Figure 9). When water, rich in minerals, floods the land,evaporation carries away water but leaves the minerals.Eventually, the mineral salts accumulate within the soil.creating an environment difficult for plants to survive.
Proposed Solutions from GeneticsTraditionally, plant breeders have used selective breeding tocreate new varieties with desirable traits. Today, molecularbiologists have developed gene insertion techniques thatprovide breeders with a more precise tool. Using genesplicing, desired traits from one species can be introducedinto a non-related species.
In 2001, articles in scientific journals reported theproduction of genetically modified (GM) tomatoes that cangrow in soils with high salt levels. Researchers inserted agene that enhanced the ability of cells in the tomato plants totransport excess salts into fluid storage sacs (vacuoles). TheGM tomatoes can grow in soils 50 times more saline thannon-GM tomatoes. The salts accumulate in the leaves, so thetomato fruit does not have a salty taste. The development of
Issue Design AnalysisResolution Evidence Evaluation
Issue ChecklistEXPLORE an issue
Figure 9Irrigation allows plants to grow inarid lands.
other plants capable of living in saline solutions will allowfarmers to reclaim marginal land.
In related research, geneticists are looking at developingdrought-tolerant plants. Several genes have been identifiedthat enable plants to cope with arid conditions. TheRockefeller Foundation committed $50 million to support theeffort to improve drought resistance for GM maize and rice.
However, as with any technology, GM drought-tolerant andsalt-tolerant plants could have undesirable consequences.Some of these concerns are outlined below.
Environmental Concerns: Every year, some of the bestfarmland in the world is converted to urban land. Thisexpansion of cities into farmland also reduces foodproduction. Producing GM drought-tolerant and salt-tolerantplants that can grow on marginal land does nothing to resolvethe issue of urban expansion.
GM drought-tolerant and salt-tolerant plants could lead tothe conversion of deserts and saltwater marshes intoagricultural land, disrupting the natural balance within theseecosystems. These ecosystems provide habitat for manyspecies, and saltwater marshes also help filter and cleanwater systems.
Food Production Concerns: At present, 5 billion peopleinhabit Earth, and the population is projected to increase tonearly 10 billion within 50 years. Only 3.7 billion ha (hectares)of the world’s 13.1 billion ha of land can be used for crop production. According to the United Nations Food and
Ch 18_Bio_Alberta30 1/8/07 12:22 PM Page 618

• The phenotypic ratios that Mendel observed in his dihybrid crosses provideevidence for independent assortment of chromosomes.
• The probability of inheritance of the two traits together is the same as theproduct of the probability of inheritance of both traits separately.
Dihybrid CrossesSUMMARY
Section 18.5 Questions1. In guinea pigs, black coat colour (B) is dominant to white
(b), and short hair length (S) is dominant to long (s).Indicate the genotypes and phenotypes from the followingcrosses:(a) A guinea pig that is homozygous for black and
heterozygous for short hair crossed with a white, long-haired guinea pig.
(b) A guinea pig that is heterozygous for black and forshort hair crossed with a white, long-haired guinea pig.
(c) A guinea pig that is homozygous for black and for longhair crossed with a guinea pig that is heterozygous forblack and for short hair.
2. Black coat colour (B) in cocker spaniels is dominant towhite coat colour (b). Solid coat pattern (S) is dominant tospotted pattern (s). The gene for pattern arrangement islocated on a different chromosome than the one for colour,and the pattern gene segregates independently of thecolour gene. A male that is black with a solid patternmates with three females. The mating with female A, which
is white and solid, produces four pups: two black, solid,and two white, solid. The mating with female B, which isblack and solid, produces a single pup, which is white,spotted. The mating with female C, which is white andspotted, produces four pups: one white, solid; one white,spotted; one black, solid; one black, spotted. Indicate thegenotypes of the parents.
3. For human blood, the alleles for types A and B arecodominant, but both are dominant over the type O allele.The Rh factor is separate from the ABO blood group and islocated on a separate chromosome. The Rh� allele isdominant to Rh�. Indicate the possible phenotypes of achild of a woman with type O, Rh� and a man with type A,Rh�.
4. Skin colour in humans is determined by more than onegene pair, whereas Rh factor in blood is controlled by onegene pair. Which would show more variability in thehuman population? Why?
The Basis of Heredity 619NEL
Section 18.5
Agricultural committee, over the next 50 years, the amount ofarable land on Earth per person will decline from 0.24 ha toabout 0.12 ha, which will not be enough to feed many of thepoor. Although GM crops may not be the entire answer, theymay allow an increase in food production, and so deserve further study.
Geneticists’ Concerns: Some geneticists worry about theconsequences if GM crops hybridize with non-GM species.Traditional methods of crop breeding involve selectingparticular individuals with desirable traits from within apopulation, thereby altering gene frequencies within apopulation of a single species. Newer technologies allowgenes to be transferred between entirely different species. It is difficult to predict how these transferred genes willinteract in a naturally reproducing population. For example,would a gene that increases drought tolerance also make aplant more susceptible to disease?
• Evaluate each of the concerns expressed.
(a) What assumptions lie at the basis of these divergentopinions?
(b) What additional information would be useful to make aninformed decision about whether or not GM crops shouldbe pursued?
• Working in a group, discuss the different viewpointspresented above.
• Still in your group, conduct additional research on the issueof developing GM drought-tolerant and salt-tolerant plants.When research is complete, discuss the question belowuntil you reach a consensus.
(c) Should GM crops, resistant to drought and salinity, befunded? Do they provide at least a partial solution?
• Be prepared to debate the issue as a class. Express youropinion and provide a rationale for your view.
www.science.nelson.com GO
Ch 18_Bio_Alberta30 1/8/07 12:22 PM Page 619

Chapter 18 INVESTIGATIONS
How Do Environmental Factors Affect Gene Expression?
Many environmental factors can affect the phenotype of aplant. Traits such as growth rate, colour, leaf size, and leafshape can be affected by environmental factors such as lightintensity, hours of darkness, wavelength of radiation, and airtemperature. In this investigation, you will design an exper-iment to explore how one environmental factor of your choiceaffects the phenotype of a plant.
You can find more information about designing an exper-iment in Appendix A1. Have your teacher check the procedurebefore beginning the experiment. Then, write a lab report,following the guidelines in Appendix A3.
Purpose Design AnalysisProblem Materials EvaluationHypothesis Procedure SynthesisPrediction Evidence
INVESTIGATION 18.1 Report Checklist
Genetics of Corn
Corn is one of the world’s most important food crops. It has beensubject to selective breeding techniques and hybridizationfor many years, which have resulted in vigorous, high-yieldingvarieties. Nearly all corn grown today is hybrid corn. Somevarieties of corn are chosen for their sweet flavour while themixed coloration of other, inedible varieties makes them pop-ular decorations during the autumn months.
PurposeTo determine the genotypes of parents by examining pheno-types of corn for two different and independent traits.
ProblemTo determine the probable genotypes of the parents of thesample corn ears.
Materialsdihybrid corn ears (sample A, sample B)
Procedure1. Obtain a sample A corn ear from your instructor
(Figure 1). The kernels display two different traitsthat are located on different chromosomes.
Purpose Design AnalysisProblem Materials EvaluationHypothesis Procedure SynthesisPrediction Evidence
Report Checklist
620 Chapter 18 NEL
INVESTIGATION 18.2
Figure 1
(a) Indicate the two different traits.
(b) Predict the dominant phenotypes.
(c) Predict the recessive phenotypes.
Ch 18_Bio_Alberta30 1/8/07 12:22 PM Page 620

Chapter 18
INVESTIGATION 18.2 continued
2. Assume that the ear of corn is from the F2
generation. The original parents were pure breedinghomozygous for each of the characteristics. Assign theletters P and p to the alleles for colour, and S and s tothe alleles for shape. Use the symbols PPss � ppSS forthe parent generation.
(d) Indicate the phenotype of the PPss parent.
(e) Indicate the phenotype of the ppSS parent.
3. Count 100 of the kernels in sequence, and record theactual phenotypes in a table similar to Table 1.
4. Obtain sample B. Assume that this ear was producedfrom a test cross. Count 100 kernels in sequence andrecord your results.
Analysis and Evaluation(f) Indicate the expected genotypes and phenotypes of
the F1 generation resulting from a cross between theoriginal parents PPss � ppSS.
(g) Use a Punnett square to show the expected genotypesand the phenotypic ratio of the F2 generation. Compareyour results with what you obtained in question 3.What factors might account for discrepancies?
(h) Assuming that sample B was produced from a test cross,indicate the phenotypic ratio of the F1 generation.
(i) Indicate the phenotype of the unknown parent.
Synthesis(j) Why are test crosses important to plant breeders?
(k) A dihybrid cross can produce 16 differentcombinations of alleles. Explain why 100 seeds were counted rather than only 16.
(l) A dominant allele Su, called starchy, producessmooth kernels of corn. The recessive allele su, calledsweet, produces wrinkled kernels of corn. Thedominant allele P produces purple kernels, while therecessive p allele produces yellow kernels. A corn plantwith starchy, yellow kernels is cross-pollinated with acorn plant with sweet, purple kernels. One hundredkernels from the hybrid are counted, and thefollowing results are obtained: 52 starchy, yellowkernels and 48 starchy, purple kernels. What are thegenotypes of the parents and the F1 generation?
(m) The wild ancestor of corn grew only in CentralAmerica. From this ancestor, Aboriginal peoples usedselective breeding to develop different types of corn.Today, scientists continue to use technology andselective breeding methods to develop varieties ofcorn that can grow in a wide range of environmentalconditions. As a result, corn is now grown in manyplaces where its ancestor would not be able tosurvive. What are some risks associated with growinga species in a foreign environment?
The Basis of Heredity 621NEL
Table 1 Phenotypes of the F2 Generation
Phenotype Number Ratio
dominant genes forcolour and shape
dominant gene forcolour, but recessive for shape
recessive gene forcolour, but dominant gene for shape
recessive genes forcolour and shape
Comb Shape in ChickensTwo genes interact to produce comb shape in chickens.Change the genotype and see what happens to thephenotype .
www.science.nelson.com GO
EXTENSION +
Ch 18_Bio_Alberta30 1/8/07 12:22 PM Page 621

Chapter 18 SUMMARY
622 Chapter 18 NEL
Outcomes
Knowledge• describe the evidence for dominance, segregation, and the
independent assortment of genes on differentchromosomes, as investigated by Mendel (18.1, 18.2)
• compare ratios and probabilities of genotypes andphenotypes for dominant/recessive alleles, multiple alleles,and incompletely dominant or codominant alleles, epistatic,and pleiotropic alleles (18.2, 18.3, 18.4, 18.5)
• explain the relationship between variability and the numberof genes controlling a trait (18.3)
STS• explain that decisions regarding the application of scientific
and technological development involve a variety ofperspectives (18.3)
Skills• ask questions and plan investigations by designing a plan
for collecting data to demonstrate human inheritance (18.2)
• conduct investigations and gather and record data byperforming an experiment to demonstrate inheritance of atrait controlled by a single pair of genes (18.5), and bydesigning and performing an experiment to demonstratethat an environmental factor can cause a change in theexpression of genetic information in an organism (18.4)
• analyze data and apply mathematical and conceptualmodels by predicting, quantitatively, the probability ofinheritance from monohybrid and dihybrid (18.2, 18.4); usingPunnett squares to interpret patterns and trends associatedwith monohybrid and dihybrid patterns of inheritance (18.2,18.4); performing, recording, and explaining predictedphenotypic ratios versus actual counts in genetic crosses toshow a relationship between chance and genetic results(18.2, 18.4, 18.5); and drawing and interpreting pedigreecharts from data on human single-allele and multiple-alleleinheritance patterns (18.3, 18.4)
• work as members of a team and apply the skills andconventions of science (all)
Key Terms
18.1
18.3pedigree chart
18.4
MAKE a summary
1. Create a concept map that shows the principles ofinheritance of traits. Label the sketch with as many of thekey terms as possible.
2. Revisit your answers to the Starting Points questions atthe start of the chapter. Would you answer thequestions differently now? Why?
progeny
dominant trait
recessive trait
allele
homozygous
heterozygous
genotype
phenotype
segregation
18.2phenotypic ratio
Punnett square
genotypic ratio
test cross
pleiotropic gene
wild type
mutant
incomplete dominance
codominance
18.5dihybrid cross
selective breeding
inbreeding
polygenic trait
epistatic gene
Go To
The following components are available on the Nelson Web site. Follow the links for Nelson Biology Alberta 20–30.
• an interactive Self Quiz for Chapter 18
• additional Diploma Exam-style Review Questions
• Illustrated Glossary
• additional IB-related material
There is more information on the Web site wherever you seethe Go icon in the chapter.
www.science.nelson.com GO
Spawning TroubleDr. Daniel Heath, (University of Windsor) has discovered thatthe eggs of captive-bred salmon are getting smaller each year.The lack of selective pressure on the eggs in a hatchery maybe the cause, since more small fish are surviving than wouldbe if the eggs developed in the wild. Dr. Heath is concernedthis will lead to health problems in the wild population, and ifthis may also be a general problem with captive breedingprograms for other animals, including endangered species.
www.science.nelson.com GO
EXTENSION +
Ch 18_Bio_Alberta30 1/8/07 12:22 PM Page 622
Chapter 18 REVIEW
The Basis of Heredity 623NEL
Many of these questions are in the style of the DiplomaExam. You will find guidance for writing Diploma Exams inAppendix A5. Science Directing Words used in DiplomaExams are in bold type. Exam study tips and test-takingsuggestions are on the Nelson Web site.
DO NOT WRITE IN THIS TEXTBOOK.
Part 1
1. Determine and identify the genotypic ratio of the F1progeny from the cross.A. 50 % Ss and 50 % ssB. 75 % SS and 25 % SsC. 75 % Ss and 25 % ssD. 100 % Ss
2. Determine and identify the phenotypic ratios ofthe F1 progeny of the cross.A. 75 % long stem and 25 % short stemB. 50 % long stem and 50 % short stemC. 75 % short stem and 25 % long stemD. 100 % long stem
Chapter 18
4. Predict the chance of parents 1 and 2 from generation Ihaving a child with blood type AB. (Record your answer indecimal form.)
5. If individuals 6 and 7 had another child, calculate the probability that the child would have blood type O. (Record your answer in decimal form.)
1 2
1 2 3 4 5 6 7
1 2 3 4 5
female male female maleblood type A
blood type O
blood type AB
blood type B
I
II
III
Figure 1
Figure 2
Use the following information to answer questions 1 and 2.
Long stems are dominant over short stems for pea plants. Aheterozygous long-stem plant is crossed with a short-stem plant.
Use the following information to answer questions 6 and 7.
In cattle, the polled trait (hornless) is dominant to the hornedcondition. A single bull mates with three different cows andproduces offspring as shown in Figure 2.
Use the following information to answer questions 3 to 5.
The pedigree chart in Figure 1 shows the transmission ofblood types in a family.
3. Indicate the genotypes for individuals 1 and 2, generation I.A. IAi and IBiB. IAIA and IBIB
C. IAi and IBIB
D. IAIB and IBi
bullpolled
cow Ahorned
calf D horned
bullpolled
cow Bpolled
calf E horned
bullpolled
calf F polled
cow Cpolled
6. Identify the respective genotypes for the bull, cow A, andcow B.A. bull = Pp, cow A = pp, cow B = PpB. bull = PP, cow A = pp, cow B = PpC. bull = Pp, cow A = pp, cow B = ppD. bull = PP, cow A = Pp, cow B = Pp
7. Identify which of the cattle could have two possiblegenotypes.A. cow C and calf FB. cow B and calf EC. cow A and calf DD. bull and calf D
Part 28. Explain the advantages and limitations of using blood
typing by the courts to prove paternity.
9. Cystic fibrosis is regulated by a recessive allele, c. Explainhow two parents without this condition can produce achild with cystic fibrosis.
NR
NR
www.science.nelson.com GO
Ch 18_Bio_Alberta30 1/8/07 12:22 PM Page 623
624 Chapter 18 NEL
10. In horses, the trotter trait is dominant to the pacer trait. A male, described as a trotter, mates with three differentfemales. Each female produces a foal. The first female, apacer, gives birth to a foal that is a pacer. The secondfemale, also a pacer, gives birth to a foal that is a trotter.The third female, a trotter, gives birth to a foal that is apacer. Determine the genotypes of the male, all threefemales, and the three foals sired. Designate the trotterallele as T and the pacer allele as t.
11. For ABO blood groups in humans, the A and B genes arecodominant, but both A and B are dominant over type O.(a) Identify the possible blood types in the children of a
man with blood type O and a woman with blood type AB.
(b) Could a woman with blood type AB ever produce achild with blood type AB? Could she ever have a childwith blood type O? Explain your answer.
12. Some cats have six toes, a condition determined by adominant allele. Sketch a pedigree chart showing themating of a male cat with six toes to a normal female.Assume the following:• The male cat with six toes had a normal mother.• The cats produce six offspring (four females and two
males). Two of the female offspring and one of the maleoffspring have six toes.
• One of the six-toed female offspring mates with a six-toed male from different parents. Four femaleoffspring are produced, and three of them have six toes.
13. In shorthorn cattle, the mating of a red bull and a whitecow produces a calf that is described as roan. Roananimals have intermingled red and white hair. After manymatings between roan bulls and roan cows, the followingphenotypic ratio was observed in the offspring: one red,two roan, one white. Does this ratio indicate codominanceor multiple alleles? Explain your answer.
17. Explain how a bald offspring can be produced from themating of a normal female and a normal male.
18. Could normal parents ever produce a bald girl? Explainyour answer.
19. The ability to curl your tongue up on the sides (T ) isdominant to not being able to roll your tongue (t ). (a) A woman who can roll her tongue marries a man who
cannot. Their first child has his father's phenotype.Predict the genotypes of the mother, father, and child.
(b) Determine the probability that their second child willnot be able to roll her or his tongue.
20. Phenylketonuria (PKU) is an inherited disease caused bythe lack of the enzyme needed to metabolize the aminoacid phenylalanine. If untreated, PKU builds up in the brainand causes mental retardation. PKU is determined by arecessive allele. A woman and her husband are bothcarriers of PKU. Determine the probability of(a) their first child having PKU.(b) both of their first two children having PKU.
21. Amniocentesis is a common prenatal procedure, used toobtain cells to test for genetic abnormalities such as cysticfibrosis. The test is usually carried out in the 15th to 18thweek of pregnancy when a woman has an increased risk ofhaving children with genetic abnormalities. A woman withcystic fibrosis in her family history (Figure 3, next page) iscarrying a child. Her husband’s lineage also is linked tocystic fibrosis. Cystic fibrosis is caused by a recessive allelefound on chromosome 7. Write a unified responseaddressing the following aspects of performingamniocentesis in the case of father K and mother O.• Like all procedures that enter the body, some risk,
although small, is associated with amniocentesis. On thebasis of the information provided, would you recommendan amniocentesis be done for mother O and father K?Explain your reasons.
• Would you recommend the procedure if father K hadmarried mother O’s cousin, woman J? Explain yourreasons.
• Should amniocentesis be performed even if there is nostrong evidence suggesting genetic problems? Explainyour reasons.
• Should this pedigree be made public? Identify bothpros and cons before coming to a conclusion.
Use the following information to answer questions 14 to 16.
Thalassemia is a serious human genetic disorder which causessevere anemia. The homozygous condition (TmTm ) leads tosevere anemia. People with thalassemia die before sexualmaturity. The heterozygous condition (TmT n ) causes a lessserious form of anemia. The genotype T nT n causes nosymptoms of the disease.
Use the following information to answer questions 17 and 18.
Baldness is an autosomal trait, but it is influenced by sex.Baldness (HB) is dominant in males but recessive in females.The normal gene (Hn) is dominant in females, but recessive inmales.
14. Predict all the possible genotypes of the offspring of amale with the genotype T mT n and a woman of the samegenotype.
15. Predict all the possible phenotypes of the offspring of aman with the genotype T mT n and a woman of the samegenotype.
16. Would it ever be possible for offspring to be produced fromtwo individuals with the genotypes T mT m and T mT n
respectively? Explain your answer.
DE
DE
DE
DE
DE
DE
Ch 18_Bio_Alberta30 1/8/07 12:22 PM Page 624

The Basis of Heredity 625NEL
Chapter 18
22. In Canada, it is illegal to marry your immediate relatives. Usingthe principles of genetics, explain why inbreeding of humansis discouraged.
ID
A B
C E F G H
J K L M N O
Mother O’s Family Tree
Father K’s Family Tree
A B
IDC E F G H J
K L M N O P Q R S
I
II
III
I
II
III
Figure 3
27. Predict the genotypes of the parent plants.
28. The plant breeder crosses two individuals from the F1generation that have high oil-content and four seeds perpod. If all the members of the F2 generation all have highoil-content and four seeds per pod, predict the genotypesof the two F1 parent plants chosen by the breeder.
29. The breeder wants to confirm the genotype of the two F1parent plants using a cross. What genotype should theplant she crosses the F1 parent plants have? Explain.
Use the following information to answer questions 23 to 26.
When paper impregnated with the bitter chemicalphenylthiocarbamide (PTC) is placed on the tongue, about 70 % of people can taste the chemical. The ability to taste PTCis determined by a dominant taster allele (T ). Those whocannot taste PTC are homozygous for the recessive alleles (t ).A second gene on another chromosome determines skinpigmentation. Allele (A) is dominant, and determines normalpigmentation. People who are homozygous for the recessiveallele (a) will be albino. A normally pigmented woman whocannot taste PTC has a father who is an albino and a PTCtaster. She marries a normally pigmented man who ishomozygous for the dominant (A) allele for pigmentation. The man can taste PTC, but his mother cannot.
Use the following information to answer questions 27 to 29.
In a specific variety of soybeans, the allele for seeds containinga high oil-content (H ) is dominant to the allele for low oil-content (h). A gene located on another chromosomedetermines the number of seeds in a pod. Through crossingexperiments, it was determined that the allele that determinesfour seeds per pod (E) is dominant to the allele thatdetermines two seeds per pod (ee). A plant breeder crossestwo soybean plants of this variety, both of which have high oil-content and four seeds per pod. The phenotypes of the F1generation and their ratios are shown in Table 1.
23. Predict all the possible genotypes for these two traits forchildren by this couple.
24. Determine the probability that a child from this couple willnot be able to taste PTC.
25. Determine the probability that a child from this couple willbe albino?
26. Determine the probability that a child from this couple willbe able to taste PTC and be albino.
DE
DE
DE
DE
DE
DE
DE
Table 1 Phenotypes of the F1 Generation
Phenotype Ratio
high oil-content—four seeds per pod 9
high oil-content—two seeds per pod 3
low oil-content—four seeds per pod 3
low oil-content—two seeds per pod 1
Ch 18_Bio_Alberta30 1/8/07 12:22 PM Page 625

In this chapter
1919 Beyond Mendel
chapter
Beyond Mendel
Exploration: InheritedTraits
Lab Exercise 19.A: Tracingthe Hemophilia Gene
Explore an Issue:Screening for GeneticDisorders
Web Activity:Amniocentesis
Investigation 19.1: Sex-Linked Traits
Lab Exercise 19.B:Mapping Chromosomes
Lab Exercise 19.C:Evidence of HereditaryMaterial
Web Activity: Avery andMacLeod
Web Activity: Elementary,My Dear Crick
Investigation 19.2:Isolation andQuantification of DNA
Explore an Issue:Competition andCollaboration AdvanceScience
Early scientists believed that hereditary traits were located in the blood. The term “purebloodline,” which is still used today by animal breeders (Figure 1), is a reminder of thismisconception, as is the French term Métis conferred by European fur traders on peo-ples of mixed Aboriginal and European “blood.” Today we know that inherited traitsare determined by genes, which are located along the thread-like chromosomes foundin the nucleus of each cell.
The field of genetics changed quickly once scientists began to describe the location andthe chemical makeup of chromosomes. Genes can now be identified and selected, andsometimes even altered. One of the most dramatic examples of changing inherited traitsis the production of mice that are smarter than mice are naturally. This genetically mod-ified strain was dubbed Doogie, after a television character who was a teenage genius.
The modification and insertion of a single gene, NR2B, into a chromosome of themice improves the functioning of nerve receptors that play a key role in memory andlearning. The laboratory-bred Doogie mice learn faster and remember more than normalmice. For example, scientists found that when a new and an old object were introducedinto the cage with the Doogie mice, they spent most of their time exploring the newobject. This indicated that they recognized and remembered the old object. Normalmice spent equal time with the new and old objects. The Doogie mice generated greatexcitement, because humans possess a corresponding gene.
626 Chapter 19 NEL
Answer these questions as best you can with your current knowledge. Then, using the concepts and skills you have learned, you will revise your answers at the end ofthe chapter.
1. In what part of the cell would you find genes?
2. Can you distinguish males from females by looking at their genetic material?
3. Explain how a better understanding of chromosome structure could lead to a morecomplete understanding of gene function.
4. Why might some people be opposed to making mice smarter?
5. Why might the research with mice prove important for people with Alzheimer’sdisease?
STARTING Points
Career Connection:Entomologist
Ch 19_Bio_Alberta30 1/8/07 12:34 PM Page 626

Beyond Mendel 627NEL
Exploration Inherited Traits
Some physical characteristics are controlled by a single genethat can be expressed in one of two ways. Try the tests belowto see what phenotype you express.
• Fold your arms in front of your body.
(a) Which arm is on top?
• Change arm position so that the other arm is on top.
(b) Describe how it feels.
• Interlock your fingers.
(c) Are the fingers from your left hand or your right handon top?
• Place a strip of PTC paper on your tongue.
(d) Could you taste the paper?
• Gather and compile the class data for all three tests.
(e) For each test, which trait occurred most frequently inyour class?
(f) Do traits determined by dominant genes always occurwith the highest frequency? Explain your answer.
Figure 1Animal breeders produce varieties of a species with a specific set of traits, such as theseAppaloosa horses. The value of an individual animal is often determined by its bloodline, aterm that dates back to early misconceptions about heredity.
Ch 19_Bio_Alberta30 1/8/07 12:34 PM Page 627

628 Chapter 19 NEL
19.119.1 Chromosomes and Genetics During the Middle Ages (500–1300 CE), curious individuals would sneak into caves todissect corpses. Despite strict laws prohibiting such behaviour, the inquiring minds ofearly physicians and scientists compelled them to conduct their investigations. Generationsof artists sketched different parts of the body (Figure 1), creating a guide to anatomy inthe process. As a composite structure of organs began to appear, theories about functionarose. The principle that structure gives clues about function also applies to genetics.However, the early geneticists had to wait for the emergence of the light microscopebefore investigations into genetic structure could seriously progress. The study of genesis closely connected with technology. The light microscope, the electron microscope,X-ray diffraction, and gel electrophoresis have provided a more complete picture of themechanisms of gene action.
The discovery of the nucleus in 1831 was an important step toward understandingthe structure and function of cells and the genes they contain. By 1865, the year in whichMendel published his papers, biologists knew that the egg and sperm unite to form azygote, and it was generally accepted that factors from the egg and sperm were blendedin developing the characteristics of the offspring. Even though Mendel knew nothingabout meiosis or the structure or location of the hereditary material, he was able todevelop theories about inheritance that adequately explain how traits are passed onfrom generation to generation.
At about the same time that Mendel was conducting his experiments with gardenpeas, new techniques in lens grinding were providing better microscopes. The improvedtechnology helped a new branch of biology, cytology, to flourish. Cytology is the studyof cell formation, structure, and function. Aided by these technological innovations, in1882, Walter Fleming described the separation of threads within the nucleus duringcell division. He called the process mitosis. In the same year, Edouard van Bendennoticed that the sperm and egg cells of roundworms had two chromosomes, but the fer-tilized eggs had four chromosomes. By 1887, August Weisman offered the theory thata special division took place in sex cells. By explaining the reduction division nowknown as meiosis, Weisman added an important piece to the puzzle of heredity and pro-vided a framework in which Mendel’s work could be understood. When scientists redis-covered Mendel’s experiments in 1900, the true significance of his work became apparent.
Chromosomal TheoryIn 1902, American biologist Walter S. Sutton and German biologist Theodor Boveri inde-pendently observed that chromosomes came in pairs that segregated during meiosis. Thechromosomes then formed new pairs when the egg and sperm united. The concept ofpaired, or homologous, chromosomes supported Mendel’s explanation of inheritance basedon paired factors. Today, these factors are referred to as the alleles of a gene. One factor, orallele, for each gene comes from each sex cell.
The union of two different alleles in offspring and the formation of new combinationsof alleles in succeeding generations could be explained and supported by cellular evidence.The behaviour of chromosomes during gamete formation could help explain Mendel’slaw of segregation and law of independent assortment.
Sutton and Boveri knew that the expression of a trait, such as eye colour, was not tiedto only the male or only the female sex cell. Some structures in both the sperm cell and
Figure 1The artist Leonardo da Vincibecame interested in anatomy anddissection because of his desire topaint the human form better.
Learning TipRecall that homologouschromosomes occur in pairsand are similar in size, shape,and gene information andarrangement.
Ch 19_Bio_Alberta30 1/8/07 12:34 PM Page 628
Beyond Mendel 629NEL
the egg cell must determine heredity. Sutton and Boveri deduced that Mendel’s factors(alleles) must be located on the chromosomes. The fact that humans have 46 chromo-somes (44 autosomes and 2 sex chromosomes), but thousands of different traits, ledSutton to hypothesize that each chromosome carries genes. Genes that are on the samechromosome are said to be linked genes.
The chromosomal theory of inheritance can be summarized as follows:
• Chromosomes carry genes, the units of heredity.
• Paired chromosomes segregate during meiosis. Each sex cell or gamete has halfthe number of chromosomes found in the somatic cells. This explains why eachgamete has only one of each of the paired alleles.
As you saw in the previous chapter, chromosomes assort independently during meiosis.Each gamete receives one member from each pair of chromosomes, and each chromo-some pair has no influence on the movement of any other chromosome pair. Thisexplains why in a dihybrid cross an F1 parent, AaBb, produces four types of gametes:AB, aB, Ab, ab. Each gamete appears with equal frequency due to segregation and inde-pendent assortment. Each chromosome contains many different alleles and each geneoccupies a specific locus or position on a particular chromosome.
Morgan’s Experiments and Sex-Linked TraitsThe American Thomas Hunt Morgan was among the first of many geneticists who usedthe tiny fruit fly, Drosophila melanogaster, to study the principles of inheritance. There areseveral reasons why the fruit fly is an ideal subject for study. First, the fruit fly reproducesrapidly. Offspring are capable of mating shortly after leaving the egg, and females produceover 100 eggs after each mating. Female Drosophila can reproduce for the first time whenthey are only 10 to 15 days old, so it is possible to study many generations in a shortperiod of time. Since genetics is based on probability, the large number of offspring isideal. A second benefit arises from Drosophila’s small size. Many individuals can be housedin a single culture tube. A small, solid nutrient at the bottom of the test tube can main-tain an entire community. The third and most important quality of Drosophila is thatmales can easily be distinguished from females. Males are smaller and have a roundedabdomen with a dark-coloured posterior segment while the larger females have a pointedabdomen with a pattern of dark bands.
While examining the eye colour of a large number of Drosophila, Morgan notedthe appearance of a white-eyed male among many red-eyed offspring (Figure 2). Heconcluded that the white-eyed trait must be a mutation. Morgan was interested intracing the inheritance of the allele coding for white eyes, so he mated the white-eyedmale with a red-eyed female. All members of the F1 generation had red eyes. NormalMendelian genetics indicated that the allele for red eyes was dominant. Most researchersmight have stopped at that point, but Morgan did not. Pursuing further crosses andpossibilities, he decided to mate two hybrids from the F1 generation. An F2 genera-tion produced �
34
� red eyes and �1
4� white eyes, a ratio that could again be explained by
Mendelian genetics. But further examination revealed that all the females had redeyes. Only the males had white eyes. Half of the males had red eyes and half had whiteeyes. Did this mean that the white-eyed phenotype only appears in males? Why couldmales express the white-eyed trait but not females? How did the pattern of inheri-tance differ between males and females? To find an answer, Morgan turned to cytology.
Previous researchers had stained and microscopically examined the eight chromo-somes from the cells of the salivary glands of Drosophila. They found that females havefour homologous pairs and males have only three homologous pairs. The fourth pair,which determines sex, is only partially homologous. Males were found to have one
Section 19.1
autosome a chromosome notinvolved in sex determination
linked genes genes that arelocated on the same chromosome
Figure 2In Drosophila, the allele that codesfor white eyes (male fly, top photo)is recessive to the allele that codesfor red eyes (female fly, bottomphoto).
Ch 19_Bio_Alberta30 1/8/07 12:34 PM Page 629

630 Chapter 19 NEL
Morgan explained the results of his experiments by concluding that the Y chromo-some does not carry the gene to determine eye colour. We now know that the gene foreye colour in Drosophila is located on the part of the X chromosome that does notmatch the Y chromosome. Therefore, Morgan’s conclusion was correct. The Y chro-mosome does not carry an allele for the eye-colour gene. Traits determined by geneslocated on sex chromosomes are called sex-linked traits.
The initial problem can now be re-examined. The pure-breeding, red-eyed female canbe indicated by the genotype XRXR and the white-eyed male by the genotype X rY. Thesymbol XR indicates that the allele for red eye is dominant and is located on the X chro-mosome. There is no symbol for eye colour on the Y chromosome because it does notcontain an allele for the trait. A Punnett square, as shown in Figure 4, can be used to
sex-linked trait trait that isdetermined by genes located on the sex chromosomes
Figure 3Drosophila contain three pairs of autosomes and a single pair of sex chromosomes.
maleautosomes
femaleautosomes
XY
XX
red-eyedmale , XRY
females(red-eyed)
male(white-eyed)
male (red-eyed)
Y
Xr
XR
XR
XRXR XRXr
XRY XrY
red-eyed female , XRXR
females(red-eyed)
males(red-eyed)
Y
XR
Xr
XR
XRXr XRXr
XRY XRY
red-eyed female , XRXr
white-eyedmale , XrY
F1 generation F2 generation
X chromosome paired with a small, hook-shaped Y chromosome. Females have two paired X chromosomes (Figure 3). Since the X and Y chromosomes are not completelyhomologous (although they act as homologous pairs during meiosis), it was concludedthat they contain different genes.
CAREER CONNECTION
EntomologistEntomologists study the life cycleof insects and conduct researchinto evolution and biodiversity. Thescience of entomology has made asignificant contribution tounderstanding genetics and genemapping. Would you like to workwith fruit flies or arthropods, suchas spiders and mites? Explore thisfield of study.
www.science.nelson.com GO
Figure 4 Punnett squares showing F1and F2 generations for a cross between a homozygous red-eyedfemale and a white-eyed male.
Ch 19_Bio_Alberta30 1/8/07 12:34 PM Page 630

Beyond Mendel 631NEL
determine the genotypes and the phenotypes of the offspring. All members of the F1 gen-eration have red eyes. The females have the genotype XRX r, and the males have thegenotype XRY.
The F2 generation is determined by a cross between a male and female from the F1
generation. Upon examination of the F1 and F2 generations, the question arises whetherthe males inherit the trait for eye colour from the mother or father. The male offspringalways inherit a sex-linked trait from the mother. The father supplies the Y chromosome,which makes the offspring male.
The F2 male Drosophila are XRY and X rY. The females are either homozygous red foreye colour, XRXR, or heterozygous red for eye colour, XRX r (Table 1). Although Morgandid not find any white-eyed females from his initial cross, some white-eyed females dooccur in nature. For this to happen, a female with at least one allele for white eyes mustbe crossed with a white-eyed male. Notice that females have three possible genotypes, butmales have only two. Males cannot be homozygous for an X-linked gene because they haveonly one X chromosome. The Y chromosome has less than 100 genes.
Recall that humans have 46 chromosomes. Females have 23 pairs of homologouschromosomes: 22 autosomes, and two X sex chromosomes. Males have 22 pairs ofhomologous chromosomes, and one X sex chromosome and one Y sex chromosome(Figure 5). It has been estimated that the human X chromosome carries between 100and 200 different genes. The Y chromosome has less than 100 genes.
Sex-linked genes are also found in humans. For example, a recessive allele locatedon the X chromosome determines red–green colour-blindness. More males are colour-blind than females because females require two recessive alleles to exhibit colour-blindness. Since males have only one X chromosome, they require only one recessive alleleto be colour-blind. Other sex-linked traits that affect males primarily include hemophilia,hereditary near-sightedness (myopia), and night-blindness.
This explains why recessive lethal X-linked disorders in humans, such as infantilespinal muscular atrophy, occur more frequently in males. This could also explain whythe number of females reaching the age of 10 and beyond is greater than the number ofmales. Males die at birth or before the age of 10 from recessive lethal X-linked disorders.
Barr BodiesThe difference between male and female autosomal (non-sex) cells lies within the X andY chromosomes. Dr. Murray Barr, working at the University of Western Ontario inLondon, recognized a dark spot in some of the somatic cells of female mammals duringthe interphase of meiosis. This spot proved to be the sex chromatin, which results whenone of the X chromosomes in females randomly becomes inactive in each cell. This darkspot is now called a Barr body in honour of its discoverer. This discovery revealed thatnot all female cells are identical; some cells have one X chromosome inactive, while somehave the other. This means that some cells may express a certain trait while others expressits alternate form, even though all cells are genetically identical. For example, if a humanfemale is heterozygous for the skin disorder anhidrotic ectodermal dysplasia, she willhave patches of skin that contain sweat glands and patches that do not. This mosaic ofexpression is typical of X chromosome activation and inactivation. In normal skin, theX chromosome with the recessive allele is inactivated and sweat glands are produced. Inthe afflicted skin patches, the X chromosome with the recessive allele is activated and nosweat glands are produced.
Section 19.1
Table 1 Possible Genotypesfor Drosophila
Females Males
X RX R X rY
X RX r X RY
X rX r
recessive lethal a trait that, whenboth recessive alleles are present,results in death or severemalformation of the offspring.Usually, recessive traits occur morefrequently in males.
Barr body a small, dark spot ofchromatin located in the nucleus ofa female mammalian cell
Figure 5Sex chromosomes. Sections ofthe X and Y chromosomes arehomologous; however, few genesare common to both chromosomes.
X
Y
differentialregion
pairing region
Barr Body FormationListen to a discussion of theformation of Barr bodies andmosaic phenotypes in females.
www.science.nelson.com GO
EXTENSION +
Ch 19_Bio_Alberta30 1/8/07 12:34 PM Page 631

632 Chapter 19 NEL
Purpose Design AnalysisProblem Materials EvaluationHypothesis Procedure SynthesisPrediction Evidence
Tracing the Hemophilia Gene
A pedigree chart provides a means of tracing the inheritanceof a particular trait from parents through successive genera-tions of offspring. Hemophilia A is a blood-clotting disorderthat occurs in about one in 7000 males. The disorder is asso-ciated with a recessive gene located on the X chromosome,normally represented as Xh. Normal blood clotting is con-trolled by a dominant gene, XH. The fact that a female mustinherit one of the mutated alleles from her mother and anotherof the mutated alleles from her father helps explain why thisdisorder is very rare in females. Males, on the other hand, onlyneed to inherit one recessive allele to express the disorder.
PurposeTo use pedigree charts to trace the hemophilia gene fromQueen Victoria
EvidenceSee Figure 6.
Analysis1. Study the pedigree chart of Queen Victoria and
Prince Albert (Figure 6). Note the legend at topright.
(a) Who was Queen Victoria’s father?
(b) How many children did Queen Victoria and PrinceAlbert have?
2. Locate Alice of Hesse and Leopold, Duke of Albany,on the pedigree chart.
(c) Using the legend, provide the genotypes of both Aliceof Hesse and Leopold.
3. Locate the royal family of Russia on the pedigreechart by finding Alexandra. Alexandra, a descendantof Queen Victoria, married Nikolas II, Czar ofRussia. Nikolas and Alexandra had four girls (onlyAnastasia is labelled), and one son, Alexis.
(d) Explain why Alexis was the only child withhemophilia.
(e) Is it possible for a female to be hemophilic? If not,explain why not. If so, identify a male and femalefrom the pedigree chart who would be capable ofproducing a hemophilic, female offspring.
(f) On the basis of probability, calculate the number ofVictoria’s and Albert’s children who would be carriersof the hemophilic trait.
LAB EXERCISE 19.A Report Checklist
?
3
? ?
? ? ? ? ? ? ?
????3
3 2
?Duke ofSaxe-Coburg-Gotha
George III
EdwardDuke of Kent(1767–1820)
Albert Victoria(1819–1901)
Edward VII
George V
GeorgeVI
Elizabeth IIPrincePhilip
Margaret
AnastasiaAlexis
Alice of HesseLeopoldDukeof Albany
Louis IIGrand Duke of Hesse carrier female
hemophilic male
status uncertain
three females
Alexandra
I
II
III
IV
V
VI
VII
VIII
Figure 6
Ch 19_Bio_Alberta30 1/8/07 12:34 PM Page 632

Beyond Mendel 633NEL
Section 19.1
Screening for Genetic DisordersScreening for inherited diseases can be carried out by variousmethods, including detailed pedigrees and biochemicaltesting for known disorders. Prenatal (“before birth”)diagnosis can determine the presence of many geneticconditions in the unborn fetus. Amniocentesis involves theextraction of a small sample of fluid from the amnion, themembranous sac around the fetus. Chorionic villi sampling(CVS) involves withdrawing cells from the chorion, a fluid-filled membranous sac that surrounds the amnion. CVS canyield results earlier than amniocentesis, as early as in theninth week of pregnancy.
Before the development of a process that permitted theextraction of insulin from animals, the children of parents whopassed on two copies of the recessive allele for diabetes diedat a young age. Today, genetic screening can tell potentialparents if they carry this allele (Figure 7). Huntington diseaseis a neurological disorder caused by a dominant allele thatonly begins to express itself later in life. The disease ischaracterized by the rapid deterioration of nerve control,eventually leading to death. Early detection of this disease bygenetic screening is possible.
By having knowledge of a genetic disorder prior to birth,parents will have the opportunity to be better prepared tocope with any additional challenges the disorder may bring.Some parents may choose to terminate a pregnancy based onthe results of genetic screening. This use of genetic screeningis controversial.
• In small groups, research the issue of using geneticscreening to detect inherited conditions. Find other ways ofdealing with genetic disorders instead of genetic screening.You may wish to focus your research on one of theconditions described above.
• List the points and counterpoints against genetic screeninguncovered by your group. After considering each of these,
Issue Design AnalysisResolution Evidence Evaluation
Report ChecklistEXPLORE an issue
and any alternative means of dealing with genetic disordersthat you found, write a statement that outlines your group’sposition on this issue.
• Prepare to defend your group’s position in a classdiscussion.
Figure 7A genetic counsellor helps a couple to assess their risks ofhaving children with inherited diseases.
The Pros and Cons of Genetic ScreeningThis audio clip discusses some of the advantages anddisadvantages associated with genetic screening practicesin humans.
www.science.nelson.com GO
EXTENSION +
WEB Activity
www.science.nelson.com GO
Simulation—AmniocentesisAmniocentesis involves removing cells from the amniotic fluid, without damaging the fetus.Watch this animated simulation of amniocentesis to see how the cells are gathered and howthey are used.
Ch 19_Bio_Alberta30 1/8/07 12:34 PM Page 633
634 Chapter 19 NEL
• The chromosomal theory of inheritance:– Chromosomes carry genes, the units of heredity.– Each chromosome contains many different genes.– Paired chromosomes segregate during meiosis. Each sex cell or gamete has
half the number of chromosomes found in a somatic cell.– Chromosomes assort independently during meiosis. This means that each
gamete receives one member from each pair of chromosomes, and that eachchromosome pair has no influence on the movement of any otherchromosome pair.
• Females have two X chromosomes. Males have one X and one Y chromosome.
• Sex-linked traits are controlled by genes located on the sex chromosomes.A recessive trait located on the X chromosome is more likely to express itself inmales than in females, since males need only one copy of the recessive allelewhile females need two.
• Female somatic cells can be identified by Barr bodies, which are actuallydormant X chromosomes.
SUMMARY Chromosomes and Genetics
Section 19.1 Questions1. Describe how the work of Walter S. Sutton and Theodor
Boveri advanced our understanding of genetics.
2. How do sex cells differ from somatic cells?
3. Describe how Thomas Morgan’s work with Drosophilaadvanced the study of genetics.
4. Identify two different sex-linked traits in humans.
5. What are Barr bodies?
6. A recessive sex-linked allele (h) located on the X chromosome increases blood-clotting time, causinghemophilia.(a) With the aid of a Punnett square, explain how a
hemophilic offspring can be born to two normalparents.
(b) Can any of the female offspring develop hemophilia?Explain.
7. In humans, the recessive allele that causes a form ofred–green colour-blindness (c) is found on the Xchromosome.(a) Identify the F1 generation from a colour-blind father
and a mother who is homozygous for colour vision. (b) Identify the F1 generation from a father who has colour
vision and a mother who is heterozygous for colourvision.
(c) Use a Punnett square to identify parents that couldproduce a daughter who is colour-blind.
Purpose Design AnalysisProblem Materials EvaluationHypothesis Procedure SynthesisPrediction Evidence
To perform this investigation, turn to page 652.
Sex-Linked TraitsIn this activity, you will cross Drosophila that carry genes for sex-linked traits, using virtual fruit fly software. To determine if a traitis sex-linked, you will perform two sets of crosses. In the first setof crosses, you will confirm that a trait is sex-linked using malesand females with and without a trait. How will you set up thecrosses to get the data you will need? In the second set ofcrosses, you will determine the phenotypic ratios in offspring of
the F1 generation and observe the frequency of one trait in themale and in the female offspring. What ratio would you expectfor a sex-linked trait?
INVESTIGATION 19.1 Introduction Report Checklist
Ch 19_Bio_Alberta30 1/8/07 12:34 PM Page 634

Beyond Mendel 635NEL
19.219.2Gene Linkage and CrossoverIt is often said that great science occurs when good questions are asked. Like Mendel,Morgan asked great questions when he observed a few unexpected gene combinations whenhe performed some dihybrid crosses with Drosophila. Morgan had found a number ofobvious mutations in Drosophila. He had noted a number of genes in Drosophila thathad different alleles that were easy to observe, which he used in many genetic experi-ments. When he carried out dihybrid crosses of Drosophila, Morgan observed that insome of the crosses, almost all the offspring had the same combination of traits as did theparents. Morgan’s hypothesis to explain these observations, which he tested with furtherexperiments, gave further support to the theory that the genes are located on chromosomes.
Morgan first crossed Drosophila homozygous for wild-type body-colour (AA) andstraight wings (BB) with Drosophila homozygous for black body-colour (aa) and curvedwings (bb). The resulting F1 generation was therefore heterozygous for both traits (AaBb).When members of the F1 generation mated among themselves, the F2 generation showedfar less variability than expected. Since this was a dihybrid cross, Morgan had predictedthat the F2 generation would have a 9:3:3:1 phenotypic ratio, as was observed in thework of Mendel. Instead, nearly all the individuals with wild-type body-colour hadstraight wings and nearly all those with black body-colour had curved wings.
Why did the observed ratios differ so much from the predicted ratio? From theseobservations, Morgan concluded that the two genes must not have undergone inde-pendent segregation. For this to be true, both genes would have to be located on thesame chromosome. In other words, the genes for body colour and wing shape must belinked genes.
Figure 1 illustrates what would happen to the alleles in this cross during meiosis, ifMorgan’s hypothesis was correct and the genes for body colour and wing shape werelinked genes.
When two gametes from this cross unite, the new individual is heterozygous for bothtraits (AaBb). Remember that one parent carried the dominant alleles of the two linkedgenes (A is linked to B) and the other parent carried the recessive alleles (a is linked tob). Morgan, therefore, predicted that the F2 generation would have a 3:1 phenotypicratio (three flies with wild-type body-colour and straight wings to every one with blackbody-colour and curved wings), as shown in Figure 2, on the next page.
parents
B B
AA
B
A
AaBb
two types ofgametes inequal ratio
F1 generation
a
b
a
b
ab
�
Figure 1During meiosis, homologouschromosomes (represented as greenand red chromosomes) move toopposite poles. One gamete carriesthe AB alleles and the other carriesthe ab alleles.
Ch 19_Bio_Alberta30 1/8/07 12:34 PM Page 635

636 Chapter 19 NEL
Crossing OverMendel had explained most of his observations by hypothesizing that the two genes wereboth on the same chromosome. By the Punnett square analysis shown in Figure 2, only twodifferent phenotypes are predicted for these linked genes. This was not what Morgan observed.In a small number of flies from the dihybrid cross, the offspring had a different combinationof traits than the parents. Table 2 shows the numbers of the different phenotypes and theirpredicted genotypes.Where did the new allele combinations come from? Where did the newcombinations of the two traits come from?
AB
ab
AB ab
“a” allele is linkedwith “b” allele
“A” allele is linked with “B” allele
AABB AaBb
AaBb aabb
Figure 2Punnett square analysis, assumingthat all the gametes carry the samealleles as the parent. The expectedphenotypic ratio is three wild-typebody-colour, straight wings to oneblack body-colour, curved wings.
Table 2 Observed Progeny (F2) of AaBb × AaBb F1 Parents
Phenotype Number Possible genotype
wild-type body-colour, 290 AABB or AaBbstraight wings
black body-colour, 92 Aabbcurved wings
wild-type body-colour, 9 AAbb or Aabbcurved wings indicated recombinations
black body-colour, straight wings 9 AaBB or aaBbindicated recombinations
Table 1 Linked Genes Identified by Morgan’s Research on Drosophila
Trait Dominant/Recessive Location
wingless (wg) recessive lethal chromosome 2(all wingless offspring are born dead)
curly wings (Cy) dominant chromosome 2
purple eyes (pr) recessive nonlethal chromosome 2
stubble bristles (Sb) dominant chromosome 3
ebony body (e) recessive nonlethal chromosome 3
miniature wings (m) sex-linked recessive chromosome 4
cut wings (ct) sex-linked recessive chromosome 4
white eyes (w) sex-linked recessive chromosome 4
vermillion eyes (v) sex-linked recessive chromosome 4
Morgan was able to find a number of linked genes. Some of these are shown in Table 1.
Ch 19_Bio_Alberta30 1/8/07 12:34 PM Page 636

Beyond Mendel 637NEL
Section 19.2
Mapping ChromosomesAs other traits in Drosophila were studied, it became clear that there were groups oflinked genes. These linkage groups corresponded to different chromosomes.Furthermore, particular genes were always found at the same location (locus) on thechromosome. If this were not true, crossing over would not result in the exact exchangeof alleles.
Morgan’s experiments also showed that the frequency of crossovers between any twogenes in a linkage group was always the same. The frequency of crossing over betweenany two genes can be stated as a percent:
crossover percentage � � 100 %
The crossover percentage in the offspring shown in Table 2, on the previous page, is
crossover percentage � �4
1
0
8
0� � 100 %
� 4.5 %
The percentage of crossovers is related to the actual physical distance of the two geneson the chromosome. Genes located farther away from one another cross over at higherfrequencies than genes located close together. Two genes with a crossover percentage of1 % are much closer to one another than two genes with a crossover percentage of 12 %.Armed with this knowledge, geneticists were able to build a map of the chromosomesof Drosophila (Figure 4, next page).
When genes are in the correct order on a chromosome map, the map distances betweenthe different genes is additive. This fact allows us to place genes in their proper order, basedon the percentage crossover values between the different genes.
number of recombinations���total number of offspring
parents
B B
AA
B
B
A
AaBb
Afour types ofgametes inunequal ratio
F1 generation
a
b
a
b
a
a
b
b
� Figure 3Consider the green chromosome tohave been inherited from the fatherand the red from the mother. In thegametes, a chromosome that hasundergone crossing has sectionsthat are maternal (coming from themother) and sections that arepaternal (coming from the father).When the maternal and paternalhomologous chromosomes carrydifferent alleles, they may exchangealleles.
linkage group a group of linkedgenes on a chromosome
locus (plural, loci) a specificlocation along a chromosomewhere a particular gene is found
Recall that chromosomes sometimes undergo crossing over during meiosis. Duringcrossing over, a segment of DNA on one homologous chromosome is exchanged withthe corresponding segment on the other homologous chromosome (Figure 3), recom-bining the set of genes on the chromosomes. Crossing over occurs in meiosis, duringsynapsis. Through crossing over, the gene combinations on a single chromosome can bealtered as it is passed from generation to generation. In this cross, gametes with the genecombination Ab and aB would not occur without crossing over.
Ch 19_Bio_Alberta30 1/8/07 12:34 PM Page 637

638 Chapter 19 NEL
Map Units
long feelers short feelers
dumpy wingslong wings
grey body
short legslong legs
black body
purple eyesred eyes
long wings
straight wings curved wings
brown eyesred eyes
vestigial wings
Normal Characteristics Mutant Characteristics
0
13
48.5
54.5
67
75.5
104.5
31
Figure 4Gene mapping of chromosome 2 forDrosophila melanogaster. Note thatmany genes are located on onechromosome.
From crosses between different Drosophila, a geneticist finds that the crossover frequencybetween gene A and gene B is 12 %, the crossover frequency between gene B and gene Cis 7 %, and between gene A and gene C is 5 %. What is the order and relative distances ofthese three genes on the chromosome?
SolutionIf gene A were in the middle, then the sum of the distances between B and A and Aand C must equal the distance between B and C. These distances are not equal, so Ais not in the middle (Figure 5).
SAMPLE exercise 1
BA � AC � BC12 � 5 � 7
Therefore, A is not in the middle.
B 12 A
C
5
7B
A C
Figure 5
If gene B were in the middle, then the sum of the distances between A and B andbetween B and C must equal the distance between A and C. These distances are notequal, so B is not in the middle (Figure 6, next page).
Ch 19_Bio_Alberta30 1/8/07 12:34 PM Page 638

Beyond Mendel 639NEL
Section 19.2
If gene C were the middle gene, then the sum of the distances between A and C and Cand B must equal the distance between A and B. These distances are equal. Therefore,C is in the middle (Figure 7).
AB � BC � AC12 � 7 � 5
Therefore, B is not in the middle.
A 12 B
C7B
5A C
AC � CB � AB5 � 7 � 12
Therefore, C is in the middle.
A 12 B
C7B
5A C
Figure 6
Figure 7
Practice1. A geneticist observes that the crossover frequency between gene A and gene
B is 4 %, the crossover frequency between gene B and gene C is 14 %, andbetween gene A and gene C is 10 %. What is the order and relative distancesof these three genes on the chromosome?
Mapping Chromosomes
A. H. Sturtevant, a student who worked with Thomas Morgan,hypothesized that
• genes are located in a linear series along achromosome, much like beads on a string,
• genes that are closer together will be separatedless frequently than those that are far apart,
• and that crossover frequencies can be used toconstruct gene maps.
Sturtevant’s work with Drosophila helped establishtechniques for chromosome maps.
Procedure1. Examine the picture of a chromosome (Figure 8,
next page). Crossing over takes place when breaksoccur in the chromatids of homologouschromosomes during meiosis. The chromatids breakand join with the chromatids of homologouschromosomes. This causes an exchange of allelesbetween chromosomes.
Purpose Design AnalysisProblem Materials EvaluationHypothesis Procedure SynthesisPrediction Evidence
LAB EXERCISE 19.B Report Checklist
Ch 19_Bio_Alberta30 1/8/07 12:34 PM Page 639

640 Chapter 19 NEL
(a) Circle the areas of the chromatids that show crossingover.
(b) Using the diagram above, which genes appearfarthest apart? (Choose from EF, FG, or EG.)
(c) Which alleles have been exchanged?
2. In 1913, Sturtevant used crossover frequencies ofDrosophila to construct chromosome maps. Todetermine map distances, he arbitrarily assigned onerecombination for every 100 fertilized eggs. Forexample, genes that had a crossover frequency of15 % were said to be 15 units apart. Genes that had a5 % recombination rate were much closer. Thesegenes are 5 units apart.
(d) Using the data in Table 3, determine the distancebetween genes E and F.
Analysis(h) What mathematical evidence indicates that gene F
must be found between genes E and G?
(i) Draw the gene map to scale. (Use 1 cm to represent1 unit.)
(j) For a series of breeding experiments, a linkage group composed of genes W, X, Y, and Z was foundto show the gene combinations in Table 5. (Allrecombinations are expressed per 100 fertilized eggs.)
LAB EXERCISE 19.B continued
centromere
G
F
E
G
F
E
g
f
E
G
F
e
g
f
e
g
f
e
homologouschromosomes
chromatids
Figure 8 Crossing over
Table 3
Cross Offspring Frequency (%)
EF × ef EF + ef ( from parent) 94
Ef + eF (recombination) 6
Table 4
Cross Offspring Frequency (%)
EF × ef EF + ef ( from parent) 94
Ef + eF (recombination) 6
EG × eg EG + eg ( from parent) 90
Eg + eG ( recombination) 10
FG × fg FG + fg (from parent) 96
Fg + fG (recombination) 4
Table 5
Genes W X Y Z
W - 5 7 8
X 5 - 2 3
Y 7 2 - 1
Z 8 3 1 -
Table 6
Genes A B C D
A - 12 15 4
B 12 - 3 8
C 15 3 - 11
D 4 8 11 -
(e) Would the distance between genes e and f beidentical?
3. Use the data in Table 4 to construct a complete genemap.
(f) What is the distance between genes E and G?
(g) What is the distance between genes F and G?
Construct a gene map. Show the relative positions ofeach of the genes along the chromosome andindicate distances in map units.
(k) For a series of breeding experiments, a linkage group composed of genes A, B, C, and D was foundto show the gene combinations in Table 6. (Allrecombinations are expressed per 100 fertilized eggs.)Construct a gene map. Show the relative positions ofeach of the genes along the chromosome andindicate distances in map units.
Ch 19_Bio_Alberta30 1/8/07 12:34 PM Page 640

Beyond Mendel 641NEL
Section 19.2
Using Marker Genes Earlier in the chapter, you learned that genes located on the same chromosome are usu-ally inherited together. Marker genes can be used to follow the inheritance of a linkedtrait. Marker genes give rise to an easily identifiable phenotype and are used to trace theinheritance of other genes that are difficult to identify. The marker gene must be locatedon the same chromosome and, ideally, at a very small distance from the gene beingtraced.
Dr. Ram Mehta, president of PBR Laboratories in Edmonton, uses gene markers to iden-tify possible gene mutations in yeast. The yeast cells are treated with agents that mightalter the genetic structure of the yeast, such as various chemicals, or environmentalagents such as radiation. Since the chemical structure of DNA in human chromosomesand yeast chromosomes is the same, the yeast provides a model that helps scientists topredict how any given agent may affect human chromosomes.
Normally, yeast colonies are an off-white colour. This colour is determined by a dominant gene. Pink or red colonies indicate that a mutation in this normal, dominantgene has taken place (Figure 9). The red and pink colour is determined by one of twomarker genes that are located along different sections of the chromosome. The markergenes are expressed only when the normal, dominant gene for colour has been inacti-vated by a mutation. Colonies will show both pink and red colour only when crossingover has occurred. Crossing over indicates that the agent being tested broke apart the yeast chromosome containing the marker genes. Mutation rates can be calculated from the frequency with which pink or red colonies appear.
marker gene a gene that confersan easily identifiable phenotype andis used to trace the inheritance ofother genes that are difficult toidentify; it must be located on thesame chromosome, and ideally, at avery small distance from the genebeing followed
Figure 9Mutated yeast colonies
• Linked genes do not segregate independently because they are situated on thesame chromosome. Linked genes can undergo recombination due to crossing over.
• Crossing over occurs more frequently between genes located relatively far apartthan for those located relatively close together.
• Genetic linkage maps can be created by sorting genes according to thepercentage crossover values.
Gene Linkage and CrossoverSUMMARY
Section 19.2 Questions1. Why does gene linkage limit the variability of an organism?
2. Does crossing over increase or decrease the variability ofan organism? Explain.
3. Create a chromosome map for each set of three genesfrom the given information.(a) The crossover frequency between gene A and gene B
is 23 %, the crossover frequency between gene B andgene C is 11 %, and between gene A and gene C is12 %.
(b) The crossover frequency between gene X and gene Z is8.5 %, the crossover frequency between gene Y andgene Z is 2.25 %, and between gene Y and gene X is6.25 %.
Ch 19_Bio_Alberta30 1/8/07 12:34 PM Page 641

642 Chapter 19 NEL
19.319.3 DNA Is the Hereditary MaterialThe nucleus of every cell in your body contains deoxyribonucleic acid, or DNA. DNA isfound in the cells of all organisms, from mushrooms to trees, from sponges to mam-mals. Scientists’ fascination with DNA arises from the fact that it is the only moleculeknown that is capable of replicating itself. Sugar molecules, protein molecules, and fatmolecules cannot build duplicates of themselves. DNA can duplicate itself, thereby per-mitting cell division.
Sometimes referred to as the language of life, the genetic code is contained in 46 sep-arate chromosomes in your body. Characteristics such as your hair colour, skin colour,and nose length are all coded within the chemical messages of DNA. Packed within theDNA are all the instructions that make you unique. Unless you are an identical twin,your DNA code is distinctively one of a kind.
DNA contains instructions that ensure continuity of life, which we observe as sim-ilar structural traits between members of different generations. Pea plants produce seedsthat grow into other pea plants because the DNA holds the chemical messages for the roots,stems, leaves, and seed pods of a pea (Figure 1). In a similar way, guinea pigs give birthto other guinea pigs, and humans procreate with other humans. However, you havelearned that not all offspring are identical to their parents. The uniqueness of descendantscan be explained by new combinations of genes and by mutations. In order to understandhow genes affect the expression of an organism’s traits, you will have to learn how DNAregulates the production of protein. Proteins are the structural components of cells.DNA, therefore, not only provides continuity of life, but also accounts for the diversityof life forms.
Finding the Material of Heredity In 1869, twenty-five-year-old Swiss biochemist Friedrich Miescher extracted a viscouswhite substance from white blood cells deposited on the bandages of wounded soldiers.He named this slightly acidic, phosphorus and nitrogen-rich material nuclein becausehe found it within the nuclei of these cells. With further work, Miescher found thatnuclein was comprised of both an acidic portion, which he called nucleic acid, and analkaline portion. The alkaline portion was later determined to be protein. Several decadeslater, Miescher’s single nucleic acid was shown to actually be two nucleic acids, one ofwhich was renamed ribonucleic acid (RNA) and the other, deoxyribonucleic acid (DNA).Ongoing research gradually revealed the structure, function, and importance of theremarkable and complex DNA molecule and showed it to be the source of hereditary infor-mation. This knowledge in turn triggered revolutions in the biological sciences.
Early work aimed at finding the material of heredity focused on proteins as the mostprobable source. In 1943, Danish biologist Joachim Hammerling demonstrated that thenucleus was likely to be the region in which the hereditary material of the cell would befound. He was able to do this as a result of research involving the large single-celledgreen alga Acetabularia. This organism grows to an average length of 5 cm and has threedistinct regions known as the cap, the stalk, and the foot.
Hammerling’s experiments first involved cutting the cap off of some cells and thefoot, which contains the nucleus, off of others. The cells whose caps were removed wereable to regenerate new caps, but the cells whose feet had been removed were not able to regenerate new ones (Figure 2, next page). As a result, Hammerling hypothesizedthat the hereditary information was contained in the foot and, more specifically, the
Figure 1DNA contains the information thatensures that pea plants produceseeds that grow into other peaplants.
continuity of life a succession ofoffspring that share structuralsimilarities with those of theirparents
Ch 19_Bio_Alberta30 1/8/07 12:34 PM Page 642

Beyond Mendel 643NEL
nucleus. To further test his hypothesis, he conducted additional experiments in whichhe transplanted stalks from a species of Acetabularia with a flowerlike cap onto the footof another species with a disk-shaped cap. The caps that eventually developed on thetransplanted stalks were all disk-shaped. Hammerling concluded that the instructionsneeded to build these new caps were very likely in the nucleus in the foot of the cell andnot elsewhere.
Hammerling’s results encouraged scientists to concentrate their search for the mate-rial of hereditary material on the nucleus and its contents. Proteins and DNA are presentin the nucleus in large quantities, but DNA was initially thought to be too simple a mate-rial to account for the great variety seen in cells and cell processes, while proteins werealready known to play a significant role in metabolic functions. However, work by Britishbiologist Frederick Griffith on Streptococcus pneumoniae, in 1928, laid the foundation forlater research. Canadian-born scientists Oswald Avery and Colin MacLeod,along with their American teammate Maclyn McCarty, built upon this work over a 14-year period culminating in 1944, and came to the conclusion that DNA was indeedthe molecular material of heredity.
Section 19.3
Figure 2Hammerling’s experiment strongly suggested that the hereditary material is located in the nucleus.
One Man’s CastleIs Another Man’s LabFriedrich Miescher’s discoverytook place in the vaults of an oldcastle that had been converted toa laboratory. You can hearMiescher describe the process heused to isolate nuclein in ananimation found by accessing theNelson Web site.
DID YOU KNOW ??
DNA’s HomesDNA does not just reside in thenucleus. A small amount of DNAis also found in chloroplasts andmitochondria. The size of thegenome varies depending on thespecies. Plants tend to have alarger mitochondrial genomecompared with that of animals.
DID YOU KNOW ??
www.science.nelson.com GO
Experiment 1
Experiment 2
cap
stalk
cap removednew cap
regeneration
nucleus
nucleus
foot
foot removedno foot
regeneration
Ch 19_Bio_Alberta30 1/8/07 12:34 PM Page 643

644 Chapter 19 NEL
Purpose Design AnalysisProblem Materials EvaluationHypothesis Procedure SynthesisPrediction Evidence
Evidence of Hereditary Material
In the 1920s, Frederick Griffith, an English medical officer,started experimenting with Streptococcus pneumoniae. Thisbacterium, which causes pneumonia, exists in two forms.One form is surrounded by a polysaccharide coating called acapsule and is known as the S form because it forms smoothcolonies on a culture dish. The second harmless form has nocoating and is known as the R form because it forms roughcolonies on a culture dish (Figure 3).
The following is an abbreviated summary of Griffith’s pro-cedures and results:
Procedure1. Mouse A was injected with encapsulated cells
(S form), while mouse B was injected withunencapsulated cells (R form).
2. Encapsulated (S-form) pneumococcal cells wereheated, killed, and then injected into mouse C(Figure 4).
3. The heated encapsulated (S-form) cells were mixedwith unencapsulated (R-form) cells. The mixture wasgrown on a special growth medium. Cells from theculture medium were injected into mouse D(Figure 4).
LAB EXERCISE 19.C Report Checklist
Figure 3A representation of the two forms of S. pneumoniae
unencapsuledcells (R form)
encapsuledcells (S form)
encapsulatedcells (S form)
Mouse C injected withheated encapsulated cells.
encapsulatedcells heated
mouse C mouse D
Mouse D injected with a mixtureof heated encapsulated cellsand unencapsulated cells.
unencapsulatedcells (R form)
Figure 4 A visual outline of the procedure
Ch 19_Bio_Alberta30 1/8/07 12:35 PM Page 644

Evidence• Mouse A contracted pneumonia and died, while mouse B
continued to live. Mouse B was sacrificed, and an autopsywas conducted on both mice. The autopsies revealedliving S cells in mouse A’s tissues and living R cells inmouse B’s tissues.
• Mouse C continued to live. Mouse C was sacrificed andthe autopsy revealed that no living S cells were found inthe animal’s tissues.
• Mouse D died. An autopsy indicated that the mouse haddied of pneumonia; encapsulated (S-form) bacteria andunencapsulated (R-form) bacteria were isolated from themouse.
Analysis and Evaluation(a) What conclusions can you derive from the
experimental results with mouse A and mouse B?
(b) Why might a scientist decide to repeat step 1 of thisexperimental procedure on other mice?
(c) What is the significance of the result with mouse C?
(d) Predict what would have happened to the mouse ifthe unencapsulated (R-form) cells had been heatedand then injected. What would this step haverepresented in the experimental protocol?
(e) Would you have predicted that mouse D would die?Explain why or why not.
(f) A microscopic examination of the dead and live cellmixture (step 3) revealed cells with and withoutcapsules. What influence did the heat-destroyed cellshave on the unencapsulated cells?
(g) Griffith hypothesized that a chemical in the dead,heat-treated, encapsulated cells (step 3) must havealtered the living unencapsulated cells and he dubbedthis chemical phenomenon transformation. In 1944,Oswald Avery, Maclyn McCarty, and Colin MacLeodconducted experiments in test tubes with
Streptococcus pneumoniae that led them to concludethat DNA is the transforming principle, as they calledit, and not proteins, as was widely believed. In theirexperiments, what must have happened to the DNAwhen the cells divided?
Synthesis(h) To discover the identity of the transforming principle,
Avery and his associates ruptured heat-killed,encapsulated cells to release their contents. RNA,DNA, protein, and purified polysaccharide coats wereisolated and were tested for transforming activity.Avery and his associates found that only R cells mixedwith purified DNA isolated from dead S cells weretransformed to S cells. When R cells were mixed withpurified RNA, with the polysaccharide coat, or withprotein extracted from dead S cells, only R cellcolonies were isolated. Do these results support theirhypothesis? Explain.
(i) Predict the experimental results of the followingprotocols. Support your prediction with ahypotheses.
• Polysaccharide-digesting enzymes are used to digest theencapsulated polysaccharide coat of the heatedS form of the bacteria. The treated bacteria are thenplaced with unencapsulated pneumonia cells, which arethen injected into a mouse.
• Heated encapsulated bacteria are treated with DNAase, aDNA-digesting enzyme. The treated bacteria are thenmixed with unencapsulated pneumonia cells, which areinjected into a mouse.
• All proteins are extracted from the heated encapsulatedbacteria. The treated bacteria are then mixed withunencapsulated pneumonia cells, which are injected intoa mouse.
(j) Based on the information provided, suggestimprovements to the experimental protocols.
LAB EXERCISE 19.C continued
Beyond Mendel 645NEL
Section 19.3
Ch 19_Bio_Alberta30 1/8/07 12:35 PM Page 645

646 Chapter 19 NEL
Confirming the Chemical of HeredityFrederick Griffith’s work in the 1920s began because he was trying to develop a vaccineagainst pneumonia caused by Streptococcus pneumoniae. However, his unexpected exper-imental observations, followed by the work of Avery, McCarty, and MacLeod, led scientiststo begin questioning the initial assumption within the scientific community that thematerial of heredity was protein. What was now needed was experimental evidence thatwould clearly and conclusively indicate that DNA was indeed the material of heredity.This evidence was to come some six years after the work of Avery’s team as the result ofan innovative experiment.
Alfred D. Hershey and Martha ChaseIt was not until 1952 that DNA was accepted as the hereditary material. That year,American scientists Alfred Hershey and Martha Chase conducted experiments using avirus (bacteriophage T2) that infects a bacterial host (Figure 7). Bacteriophages (com-monly called phages) consist of two components: DNA and a protein coat. A bacterio-phage infects a bacterial cell by attaching to the outer surface of the cell and injecting itshereditary information into it. This leads to the production of thousands of new viruses,which then burst out of the cell, resulting in its death. The results of Hershey and Chase’sexperiments showed that only the DNA from the bacteriophage, and not the proteincoat, enters the bacteria to direct the synthesis of new viral DNA and new viral protein coats.
bacteriophage a virus that infectsbacteria
Figure 7Micrograph of a bacteriophageinjecting its DNA into a bacterialcell
WEB Activity
www.science.nelson.com GO
Canadian Achievers—Avery and MacLeodCanadian-born scientists Dr. Oswald Avery and Dr. Colin MacLeod spent their early years asscientists in Nova Scotia, where they were born. They met in New York, where, together withAmerican scientist Maclyn McCarty, they painstakingly isolated components of pneumococci(Streptococcus pneumoniae) for over a decade before identifying DNA as the transformingprinciple. You can find more information on this classic experiment in an animation byaccessing the Nelson science Web site.
Figure 5Dr. Oswald Avery
Figure 6Dr. Colin MacLeod
Ch 19_Bio_Alberta30 1/8/07 12:35 PM Page 646

Beyond Mendel 647NEL
Proteins contain sulfur but no phosphorus, whereas DNA contains phosphorus butno sulfur. Therefore, to track the location of DNA and proteins, Hershey and Chasetagged the viral proteins with an isotope of sulfur, 35S, and the viral DNA with an iso-tope of phosphorus, 32P. 35S and 32P are radioisotopes of sulfur and phosphorus, respec-tively. They are easy to track in an experiment because radioisotopes are unstable and theradiation that they emit as they decay can be measured.
Each type of tagged bacteriophage was allowed to infect a separate batch of bacterialhost cells and to multiply. The bacterial cells were put into a blender to remove the pro-tein coats of the viruses from the surfaces of the bacteria. The mixtures were then sub-jected to centrifugation to isolate the individual components (bacteria as a pellet and viralparticles in the liquid). The bacterial cells that were exposed to viruses containing radioac-tively labelled DNA contained 32P. The bacterial cells that were exposed to viruses whoseprotein coats were radioactively tagged with 35S did not contain any radioactivity; instead,the radioactive 35S was found in the culture medium (Figure 8). These experimentsillustrate that phosphorus-rich DNA was injected into the bacterial cells. In addition,Hershey and Chase found that the bacteriophages in both experiments reproduced anddestroyed the bacterial cells that they had infected. This observation further supportedthe claim that DNA entering the host bacterial cell carries all the genetic information.Hershey and Chase’s experiments ended the debate. DNA was accepted as the hereditarymaterial.
Section 19.3
bacterial cell infection 32P inside cell radioactive phosphorusfound within cells
virus particle DNA tagged with radioactive 32P
Experiment 1
bacterial cell infection 35S outside cell radioactive sulfurfound outside cell
virus particle protein tagged with radioactive 35S
Experiment 2
Figure 8 Hershey and Chase’s experiment conclusively showed that DNA was the hereditary material.
isotope one of two or more atomsof the same element containing thesame number of protons but adifferent number of neutrons
radioisotope an unstable isotopethat decays spontaneously byemitting radiation
Ch 19_Bio_Alberta30 1/8/07 12:35 PM Page 647

648 Chapter 19 NEL
The Race to Reveal the Structure When scientists confirmed that DNA was the material of heredity, their focus shiftedto understanding how it works. Part of that understanding would come from knowingits structure since, as in other subjects, structure in biology provides many clues aboutfunction. In the race to be the first to discover the structure of DNA, scientists aroundthe world employed emerging technologies to help them gain new insights into thismysterious “molecule of life.” In the end, the honour would go James Watson and FrancisCrick (Figure 9).
James Watson was considered a child prodigy when he entered the University ofChicago at the age of 15. He began studying ornithology, but eventually turned his attention to genetics and molecular biology. In 1951, he began studies at England’sCambridge University, where he met Francis Crick, a physicist who had served with theBritish army during World War II. Each would bring to bear his experience from a dif-ferent area of science to interpret and synthesize the experimental data that were rapidlymounting.
One source of important data came from the Cambridge laboratory of MauriceWilkins, where researcher Rosalind Franklin used a technique called X-ray diffraction tohelp determine the structure of the DNA molecule. Another source of data involved thecomparison of the chemical structure of DNA molecules in different organisms. By thistime it had long been known that DNA is comprised of chains of molecules callednucleotides. The nucleotides consist of a 5-carbon cyclic ring structure called a deoxyribose sugar (Figure 10) having one of four nitrogenous bases attached to its1� carbon and a phosphate group attached to it 5� carbon (Figure 11). The carbons inthe sugar are identified by the numbers one to five and a prime (�) symbol to distin-guish them from the carbons in the nitrogenous base. The four nitrogenous bases are ade-nine (A), guanine (G), thymine (T), and cytosine (C). Adenine and guanine aredouble-ringed structures classed as purines, while thymine and cytosine are single-ringed structures classed as pyrimidines. The only difference in the nucleotides is intheir bases.
Figure 10A deoxyribose sugar with numberedcarbons
Figure 11A DNA nucleotide is comprised of adeoxyribose sugar, a nitrogenousbase, which in this case is adenine,and a phosphate group.
CH
H
CH
CH2OH
HC CH
OOH
OH
1�4�
5�
2�3�CH2OP
O
H
H
OH
N
NH2
NN
N
O
H
O�
O�
nitrogenbase
deoxyribosesugar
phosphategroup
H H
nucleotide a molecule having afive-carbon sugar with anitrogenous base attached to its 1�carbon and a phosphate groupattached to its 5� carbon
deoxyribose sugar a sugarmolecule containing five carbonsthat has lost the –OH (hydroxylgroup) on its 2� position
nitrogenous base an alkaline,cyclic molecule containing nitrogen
phosphate group a group of fouroxygen atoms surrounding a centralphosphorus atom found in thebackbone of DNA
Figure 9Francis Crick and James Watsonwere awarded the Nobel Prize forPhysiology or Medicine in 1962 fordeducing the structure of DNA.
Ch 19_Bio_Alberta30 1/8/07 12:35 PM Page 648

Beyond Mendel 649NEL
Biochemist Erwin Chargaff ’s evidence was crucial to helping Watson and Crick con-struct an accurate model of DNA. His observations determined that, for the DNA of anygiven species, the amount of adenine was always equal to the amount of thymine and theamount of guanine was always equal to the amount of cytosine. This relationship betweenthe bases was consistent across all the species that he investigated. Although one species mighthave a different amount of adenine compared to another species, for example, the amountof thymine in each species was always equal to the amount of adenine.
Just as crucial was the X-ray photograph taken by Rosalind Franklin, which indicatedthat DNA was a helix that was likely double-stranded, that the distance between thestrands was constant, and that the helix completed a full turn once every ten base pairs(Figure 12). Given this new data, Watson and Crick were able construct a three-dimen-sional scale model of DNA that portrayed the relationship between the bases as well asall of the nucleotide chemical bond angles and spacing of atoms consistent with theobservations of other researchers. They presented their model to the scientific commu-nity in 1953, and in 1962 were awarded the Nobel Prize along with Maurice Wilkins.Because she had died prior to 1962 and the Nobel Prize is awarded only to living recip-ients, Rosalind Franklin was not included despite the acknowledgement of the signifi-cant importance of her photograph to the model proposed by Watson and Crick.
The Watson and Crick model of DNA structure is essentially the same one used by sci-entists today. Scientists already knew that molecules of DNA were made up of sugars(deoxyribose), phosphate, and four different nitrogen bases: adenine, guanine, cytosine,and thymine. What scientists did not know was the way in which these bases werearranged.
Section 19.3
Figure 12Rosalind Franklin’s X-ray diffractionpattern of DNA revealed that it had ahelical structure.
WEB Activity
Simulation—Elementary, My Dear CrickErwin Chargaff visited Watson and Crick in Cambridge in 1952. Crick’s lack of knowledge withrespect to nitrogenous bases did not impress Chargaff. By the following year, Watson andCrick had constructed their model of DNA. Enjoy Watson and Crick’s deductive process in ananimation found by accessing the Nelson Web site.
www.science.nelson.com GO
Learning TipChargaff’s RulesThe proportion of A alwaysequals that of T (A � T).The proportion of G alwaysequals that of C (G � C).A � G � T � C
Ch 19_Bio_Alberta30 1/8/07 12:35 PM Page 649

650 Chapter 19 NEL
Competition and CollaborationAdvance ScienceScientists have been described as intelligent, ambitious, andsometimes competitive. Yet, for science to progress, manyindividuals must work together in a collaborative,communicative atmosphere. Current science demands twoconflicting ideologies: competition and collaboration. A finebalance is not necessarily struck between the two. Otherfactors that come into play are economics, politics, marketdemand, profit, and patriotism in times of war.
StatementCompetition is the key driving force of science, followed bycollaboration.
• Form groups to research this issue. Prepare a position paperin point form that supports or disputes this statement, using
Issue Design AnalysisResolution Evidence Evaluation
Issue ChecklistEXPLORE an issue
a specific example. Some scientists and case studies thatmay be used include Robert Oppenheimer’s and PhillipMorrison’s role in the Manhattan Project; the perception ofLinus Pauling as a communist and the denial of a visa forhim to visit Watson and Crick in Cambridge; Craig Venterand Eric Lander leading opposing research teams in theHuman Genome Project; and Fritz Haber’s role in theproduction of deadly gases during World War I.
• Search for information in periodicals, on CD-ROMS, and onthe Internet.
• As a group, present your supported view in a classdiscussion.
www.science.nelson.com GO
Purpose Design AnalysisProblem Materials EvaluationHypothesis Procedure SynthesisPrediction Evidence
To perform this investigation, turn to page 653.
Isolation and Quantification of DNAIn this activity, you will extract DNA from both beef liver andonion cells in Parts 1 and 2. If your school has the necessaryreagents and equipment, you will then have the option of testingfor the presence of DNA in Part 3 and of determining itsconcentration using a spectrophotometer in Part 4. You will needto gather evidence and analyze and evaluate the results that you
observe, and to then explain those results in writing. Heed allcautions and wear safety equipment as instructed.
INVESTIGATION 19.2 Introduction Report Checklist
Figure 13Rosalind Franklin’s X-raycrystallography was crucial to thedetermination of the structure ofDNA.
Politics and Science Watson and Crick might not have been credited as the co-discoverers of DNA were it notfor politics. The X-ray diffraction technique developed in England had been used byMaurice Wilkins and Rosalind Franklin (Figure 13) to view the DNA molecule. At thattime, the American scientist Linus Pauling, a leading investigator in the field, was refuseda visa to England to study the X-ray photographs. Pauling, along with others, had beenidentified by then U.S. Senator Joseph McCarthy as a communist sympathizer for hissupport of the anti-nuclear movement. Many scientists today believe that the UnitedStates passport office may have unknowingly determined the winners in the race for thediscovery of the double-helix model of DNA.
The McCarthy era of the early 1950s is considered by many historians as a time ofparanoia and repression. Many creative people had their careers stifled or destroyedbecause of their perceived association with communism. In most cases the charges wereunfounded. It is perhaps ironic that, in 1962, Linus Pauling was awarded a Nobel Prize,this time for his dedication to world peace.
Ch 19_Bio_Alberta30 1/8/07 12:35 PM Page 650

DNA is the Hereditary MaterialSUMMARY
Year Scientist Experimental results
1928 Frederick Griffith • experimented using mice and two different strains of pneumococcus bacteria(virulent and nonvirulent); observed that when heat-treated virulent pneumo-coccus was mixed with nonvirulent pneumococcus and was injected into healthymice, death resulted
• discovered the process of transformation
1943 Joachim Hammerling • experimented using green alga Acetabularia; observed that regeneration of newappendages was driven by the nucleus-containing “foot” of the alga
• hypothesized that hereditary information is stored in the nucleus
1944 Oswald Avery, • demonstrated that DNA was the transforming principle of pneumococcus bacteriaMaclyn McCarty,and Colin MacLeod
1949 Erwin Chargaff • discovered that in the DNA of numerous organisms the amount of adenine is equalto the amount of thymine, and the amount of guanine is equal to that of cytosine
1952 Alfred Hershey • used radioactively labelled viruses, infected bacterial cells; observed that the and Martha Chase infected bacterial cells contained radioactivity originating from DNA of the virus,
suggesting that DNA is hereditary material
1953 Rosalind Franklin • produced an X-ray diffraction pattern of DNA that suggested it was in the shape ofa double helix
1953 James Watson • deduced the structure of DNA using information from the work of Chargaff, and Francis Crick Franklin, and Maurice Wilkins
late 1860s Friedrich Miescher • isolated nonprotein substance from nucleus of cells; named this substance nuclein
Section 19.3 Questions1. Describe how the experiments of Joachim Hammerling;
Frederick Griffith; Oswald Avery, Maclyn McCarty, andColin MacLeod; and Alfred Hershey and Martha Chasestrengthened the hypothesis that DNA is the hereditarymaterial.
2. Explain why Hammerling’s experiment cannot be used asconclusive scientific evidence that DNA is the hereditarymaterial.
3. Hammerling chose Acetabularia as a model organism forhis experiment. Identify some of the characteristics of thisgreen alga that rendered it an ideal organism. Scientistsuse model organisms in many of their experiments. Identifysocial, economic, and physical characteristics that would
make an organism highly suitable for experimentalresearch. Explain why humans do not make ideal researchsubjects.
4. Explain why it is important to study both the historicexperiments that revealed genetic principles and theprinciples themselves. Support your reasons, usingexamples.
5. It can be argued that the repetition of experiments is awaste of time, money, and other valuable resources.Provide arguments that support and dispute thisstatement. Use examples from the experiments of Griffithand of Avery, McCarty, and MacLeod to strengthen yourarguments.
Beyond Mendel 651NEL
Section 19.3
Ch 19_Bio_Alberta30 1/8/07 12:35 PM Page 651

Chapter 19 INVESTIGATIONS
652 Chapter 19 NEL
Purpose Design AnalysisProblem Materials EvaluationHypothesis Procedure SynthesisPrediction Evidence
INVESTIGATION 19.1 Report Checklist
Sex-Linked Traits
In this activity, you will cross Drosophila (Figure 1) that carrygenes for sex-linked traits using virtual fruit fly software. Todetermine if a trait is sex-linked, you will perform two setsof crosses: A and B.
ProblemsIf white eye colour in Drosophila is a sex-linked recessivetrait, what are the phenotypic ratios of the F1 generationwhen a homozygous red-eyed female and a white-eyed maleare crossed?
What other traits are sex-linked in Drosophila? Are theyrecessive or dominant?
Materialsvirtual fruit fly simulation softwarecomputers
Procedure1. Log onto the software. Remember that each parent is
homozygous for the trait chosen.
2. Select 1000 offspring.
3. For crosses A and B, follow these algorithms:
A: P: white-eyed female × red-eyed maleF1: red-eyed female × red-eyed maleF2: red-eyed female × white-eyed male
B: P: homozygous red-eyed female × white-eyedmaleF1: red-eyed female × red-eyed male
4. For cross A, create a Punnett square to show theexpected phenotypic ratio of offspring in eachgeneration. Also, be sure to indicate the genotype ofeach phenotype.
5. After cross A, count the flies and the number ofoffspring (out of 1000) of each sex and with eachtrait. Record the information in a table beside thecorresponding Punnett square.
6. When you have finished cross A, create a newparental generation.
7. Carry out cross B. Follow steps 4 to 6.
8. Determine if other traits are sex-linked. Follow thesame procedure as in step 3, using new traits.Indicate which traits you are examining.
Figure 1Drosophila males are smaller and have a rounded abdomen whilethe larger females have a pointed abdomen.
male Drosophila
female Drosophila
Familiarize yourself with the software before starting thisactivity. Start with the tutorial. Note that the labelling of traitsin the software is different from the conventions used in thistextbook. Be sure you understand what each label in the soft-ware correlates to in the textbook.
For cross A, these conditions must be met if the trait is sex-linked:
• In the F1 generation, female offspring inherit the trait ofthe male parent and male offspring inherit the trait ofthe female parent.
• In the F2 generation, there is a 1:1 phenotypic ratio forthe traits in both males and females.
For cross B, you will confirm that the trait is sex-linked. Youwill cross parents with traits that are opposite to the traits ofthe parents in cross A. By examining the phenotypic ratios inoffspring of the F1 generation, you can observe the greater fre-quency of one trait in either the male or the female offspring.
Ch 19_Bio_Alberta30 1/8/07 12:35 PM Page 652

Chapter 19
Analysis(a) In one or two paragraphs, describe the results of
crosses A and B. Is white eye colour in Drosophilasex-linked? If so, which sex does this trait appear inmore frequently? Explain.
(b) In one or two paragraphs, describe the results withthe other traits you examined. Is the trait sex-linked?If so, which sex does this trait appear in morefrequently? Is the trait recessive or dominant?Explain.
Evaluation(c) List and briefly explain any technical difficulties you
had using the software.
(d) What improvements would you suggest to enhancethe usefulness of the software?
(e) What are the advantages of using software to carryout this investigation compared to conducting it withactual Drosophila?
INVESTIGATION 19.1 continued
Isolation and Quantification of DNA
In Parts 1 and 2 of this investigation, you will isolate DNAfrom onion cells and beef liver. Part 3 verifies the presenceof DNA in your extraction using a biological analysis andPart 4 quantifies the amount of DNA using spectrophotom-etry. Parts 3 and 4 are optional depending on whether yourschool has the necessary reagents.
ProblemHow much DNA can be extracted from plant and animalcells using simple laboratory methods?
Materials
Pasteur pipette, or plasticgraduated eyedropper
distilled waterDNA standard solution
test-tube rackspectrophotometercuvettefacial tissue
Purpose Design AnalysisProblem Materials EvaluationHypothesis Procedure SynthesisPrediction Evidence
INVESTIGATION 19.2 Report Checklist
Beyond Mendel 653NEL
safety gogglesrubber glovesfresh beef liverscissorsmortar and pestle0.9 % (w/v) solution of
sodium chloride (NaCl)three 10 mL graduated
cylinderssand (very fine, washed)cheeseclothtwo 50 mL beakers, or
two large test tubes10 % (w/v) solution of
sodium dodecyl sulfate(SDS)
95 % ethanol (chilled)50 mL graduated cylinderglass rodfour medium test tubes4 % (w/v) solution of
sodium chloride (NaCl)onionblender (optional)hot-water bathboiling chipsice-water bathmeat tenderizer solution
(3 g/50 mL of solution)diphenylamine solution25 mL graduated cylinder
ProcedureDNA extraction is the first step in many biotechnologicalprocedures. Cell walls and cell membranes must be disruptedto isolate DNA. In addition, lipids, proteins, and sugars mustbe separated from nucleic acid. In the following procedure,heat, detergents, salts, and cleaving enzymes are used to min-imize contamination from nonnucleic acid molecules and tomaximize purification.
Part 1: Extraction of DNA from Beef Liver
The ethanol solution is toxic and flammable. Keep itaway from all sources of heat.
1. Obtain a 10 g to 15 g sample of beef liver and place itin the mortar.
2. Using scissors, cut the liver into small pieces.
Ch 19_Bio_Alberta30 1/8/07 12:35 PM Page 653

3. Add 10 mL of 0.9 % NaCl solution to the diced liver.Use a 10 mL graduated cylinder to measure out theNaCl. Add a pinch of sand into the mixture to act asan abrasive, and grind the tissue thoroughly forapproximately 5 min.
4. Strain the liver cell suspension through several layersof cheesecloth to eliminate any unpulverized liver.Collect the filtrate into a 50 mL beaker.
5. Add 3 mL of 10 % SDS solution. If a centrifuge isavailable, spin the suspension, and remove and savethe supernatant. If a centrifuge is not available, mixthe suspension thoroughly for 30 s and proceed tostep 6.
6. Gently layer twice the volume (approximately 25 mL)of cold 95 % ethanol on the supernatant as that ofthe total volume of the cell suspension–SDS mixture.Use a 50 mL graduated cylinder to measure out theethanol.
7. Using the glass rod, stir gently and slowly. A white,mucuslike substance will appear at the interfacebetween the solutions. This substance is theDNA–nucleoprotein complex. After the complexhas formed, twirl the stirring rod slowly and collectit onto the rod. Record your observations.
8. Place the isolated DNA–nucleoprotein complex intoa test tube containing 3 mL of 4 % NaCl solution forlater use. Use a 10 mL graduated cylinder to measurethe 4 % NaCl solution. Pour the waste alcohol intothe waste alcohol container designated by yourteacher.
Part 2: Extraction of DNA from OnionOnion is used because of its low starch content, which allowsfor a higher purity DNA extraction.
9. Repeat steps 1 to 5 using finely chopped onion.Instead of hand chopping the onion, a blender couldbe substituted, which gives optimum results.
10. Stir the mixture and let it sit for 15 min in a 60 �Cwater bath containing boiling chips. (Any longer andthe DNA starts to break down.)
11. Cool the mixture in an ice-water bath for 5min, stirring frequently.
12. Add half the volume of meat tenderizer solution as ispresent in your filtrate and swirl to mix.
13. Repeat steps 6 to 8.
Part 3: Testing for the Presence of DNAThe presence of DNA may be detected qualitatively with thereagent diphenylamine. Diphenylamine reacts with the purinenucleotides in DNA, producing a characteristic blue colour.
Diphenylamine solution contains glacial acetic acid.Be very careful not to spill any of the solution onyourself or on any surface. Inform your teacherimmediately if any spills occur. Wear safety gogglesand rubber gloves when handling this solution.
14. Stir the DNA from the onion and beef liver withtheir respective glass rods to resuspend them into the4 % NaCl solution.
15. Dispense 15 mL of diphenylamine solution into a25 mL graduated cylinder. The teacher will direct youto the stock diphenylamine solution, which will havebeen set up in a burette.
16. Transfer 5 mL of the solution to a 10 mL graduatedcylinder with a Pasteur pipette or with a plasticgraduated eyedropper.
17. Add 5 mL of diphenylamine solution to the DNAsuspension obtained from the onion and from thebeef liver.
18. Repeat step 16 and add 5 mL of diphenylaminesolution to a test tube containing 3 mL of distilledwater (the blank).
19. Repeat step 16 and add 5 mL of diphenylaminesolution to a test tube containing 3 mL of DNAstandard (the standard).
20. Place all of the test tubes in a boiling water bath(containing boiling chips) for 10 min and record the colour changes. Record your observations.
21. Remove the test tubes from the hot-water bath andplace into a test-tube rack. Allow the tubes to coolbefore proceeding.
654 Chapter 19 NEL
INVESTIGATION 19.2 continued
Ch 19_Bio_Alberta30 1/8/07 12:35 PM Page 654
Part 4: Quantitative Determination of DNAConcentration Using Spectrophotometry The principle underlying a spectrophotometric method ofanalysis involves the interaction of electromagnetic (EM)radiation (light) with matter. When EM radiation strikes anatom, energy in the form of light is absorbed. The remainderof the energy passes through the sample and can be detected.The more molecules that are present, the more energy willbe absorbed, resulting in a higher absorbance reading. Sincethe relationship is direct, we can determine the concentra-tion of an unknown by comparing it with a known. In thiscase, the unknown is the concentration of DNA in your samples and the known is the DNA standard.
22. Set the spectrophotometer to a wavelength of 600 nm.(See the video Spec 20 on the Nelson Web site.)
23. Fill a dry cuvette with the solution that consists ofthe distilled water and the diphenylamine. This willserve as a blank.
24. Wipe off any fingerprints from the outside of thecuvette by holding the cuvette at the very top andusing a facial tissue. Place the blank into thespectrophotometer and set the absorbance to 0.00.(See the video Spec 20 on the Nelson Web site.)
25. Pour the blank solution back into its original testtube and place it in a test-tube rack.
26. Rinse the cuvette with a tiny amount of standardDNA solution (DNA standard and diphenylaminefrom step 19). Wipe off any fingerprints in themanner described in step 24.
27. Place the DNA standard solution into thespectrophotometer, then record the absorbance.(See the video Spec 20 on the Nelson Web site.)
28. Pour the DNA standard solution into its original testtube and save in case of error.
29. Repeat steps 26 to 28 with the beef liver extractsolution and with the onion extract solution.
Chapter 19
INVESTIGATION 19.2 continued
Beyond Mendel 655NEL
Analysis(a) Propose reasons that the onion cells required heating
and the liver cells did not.
(b) DNA was spooled out using a glass rod. How do youaccount for the “stickiness” of DNA to glass?
(c) Describe the DNA you extracted. If DNA is a rigidstructure, why do the DNA strands appear flexible?What features of DNA’s structure account for itsstiffness? If DNA is rigid, how does it coil tightly intoa small space?
(d) Comment on the purity of the DNA extracted.
(e) Compare the amount of DNA extracted from theonion versus that from the liver. Which source ofDNA provided more of the molecule? Account forthis observation, given your knowledge of cellstructure and given differences in the procedure.
(f) What was the purpose of the standard DNAsolution? What was the purpose of the blank?
(g) Did the spectrophotometric results correlate with thequalitative observations obtained from thediphenylamine test? Comment.
(h) Calculate the amount of DNA extracted from eachsource using your standard as a guide.
(i) The liver and onion were chopped very finely.Provide reasoning for this step. If the step wasomitted, what effect would this omission have on theresults?
(j) SDS is a detergent. Describe how detergents workand explain the role of SDS in the protocol.
(k) How does NaCl contribute to maximum DNAextraction? (Hint: Think about DNA’s chemicalconstituents.) Keep in mind that NaCl is a saltthat ionizes in solution.
(l) What is the purpose of adding cold ethanol to eachextraction? How does this phenomenon work?
(m) In the extraction of DNA from onion, you added ameat tenderizer solution. The meat tenderizersolution contains an enzyme called papain. What roledoes papain play in the extraction?
(n) Identify three properties of DNA that aredemonstrated by this investigation.
Evaluation(o) Suggest possible sources of error in this procedure
and describe their effect on the results.
www.science.nelson.com GO
www.science.nelson.com GO
www.science.nelson.com GO
Ch 19_Bio_Alberta30 1/8/07 12:35 PM Page 655

Chapter 19 SUMMARY
656 Chapter 19 NEL
Outcomes
Knowledge• summarize the historical events that led to the discovery of
the structure of the DNA molecule, as demonstrated byFranklin, Watson, and Crick (19.3)
• explain the limitations of variability due to gene linkage andthe influence of crossing over on assortment of genes onthe same chromosome (19.2)
• explain the relationship between variability and the numberof genes controlling a trait (19.2)
• compare the pattern of inheritance produced by genes onthe sex chromosomes to that of genes on autosomes, asinvestigated by Morgan and others (19.1)
STS• explain that decisions regarding the application of scientific
and technological development involve a variety ofperspectives including social, cultural, environmental,ethical, and economic considerations (19.2, 19.3)
Skills• ask questions and plan investigations (19.2, 19.3)
• conduct investigations and gather and record data andinformation (19.1, 19.2)
• analyze data and apply mathematical and conceptualmodels by analyzing crossover data for a single pair ofchromosomes to create a chromosome map showing genearrangement and relative distance (19.2)
• work as members of a team and apply the skills andconventions of science (all)
Key Terms
19.1autosome
linked genes
sex-linked trait
recessive lethal
Barr body
MAKE a summary
1. Create a poster of a human genome that shows theprinciples of sex-linked genes and helps show therelationship between genes and chromosomes. Labelthe sketch with as many of the key terms as possible.Check other posters and use appropriate ideas to makeyour poster clear.
2. Revisit your answers to the Starting Points questions atthe beginning of the chapter. Would you answer thequestions differently now? Why?
19.2linkage group
locus (loci)
marker gene
19.3continuity of life
bacteriophage
isotope
radioisotope
nucleotide
deoxyribose sugar
nitrogenous base
phosphate group
Go To
The following components are available on the Nelson Web site. Follow the links for Nelson Biology Alberta 20–30.
• an interactive Self Quiz for Chapter 19
• additional Diploma Exam-style Review Questions
• Illustrated Glossary
• additional IB-related material
There is more information on the Web site wherever you seethe Go icon in the chapter.
www.science.nelson.com GO
Beyond the GenomeDr. Victor Ambros (professor of genetics at Dartmouth MedicalSchool), Dr. Katherine Wilson (associate professor of cellbiology at Johns Hopkins Medical School), and Dr. Wolf Reik,(Babraham Institute in Cambridge, England) discuss theirresearch on how our cells really work, including how genes“know” to turn on at the right times.
www.science.nelson.com GO
EXTENSION +
Ch 19_Bio_Alberta30 1/8/07 12:35 PM Page 656

Chapter 19 REVIEW
Beyond Mendel 657NEL
Many of these questions are in the style of the DiplomaExam. You will find guidance for writing Diploma Exams inAppendix A5. Science Directing Words used in DiplomaExams are in bold type. Exam study tips and test-takingsuggestions are on the Nelson Web site.
DO NOT WRITE IN THIS TEXTBOOK.
Part 11. In performing experiments with fruit flies, Drosophila
melanogaster, Thomas Morgan discovered that white eyecolour is recessive to red eye colour. When females withwhite eyes were crossed with males with red eyes, Morgandiscovered the females all had red eyes and the males allhad white eyes. Select the answer that explains this outcome.A. Male offspring inherit the white allele from the mother,
which in males becomes dominant. Female offspringinherit the red allele from the father, which isdominant over the white allele they inherit from themother.
B. Male offspring inherit the white allele from the motherand a Y chromosome from the father that does notcarry a gene for eye colour. Female offspring inheritthe red allele from the father, which is dominant overthe white allele they inherit from the mother.
C. Male offspring inherit the red allele from the mother,which is recessive in males. Female offspring inheritthe red allele from the father and no allele for eyecolour from the mother.
D. Male offspring inherit the red allele from the fatherand a Y chromosome from the mother that carries anallele for white eye colour. Female offspring inherit thered allele from the mother, which is dominant over thewhite allele they inherit from the father.
Chapter 19
2. Identify the statement that correctly describes howDuchenne muscular dystrophy is inherited.A. Duchenne muscular dystrophy is a dominant allele
located on an autosome.B. Duchenne muscular dystrophy is a recessive allele
located on an autosome.C. Duchenne muscular dystrophy is a dominant allele
located on a sex chromosome.D. Duchenne muscular dystrophy is a recessive allele
located on a sex chromosome.
3. Identify the statement that is true for generation II.A. 50 % of the males inherited the disorder from an allele
carried by their mother. B. 25 % of the males inherited the disorder from an allele
carried by their mother.C. 50 % of the females inherited the disorder from an
allele carried by their father.D. 100 % of the females inherited the allele carried by
their mother but did not develop the disorder.
4. Identify the answer that is correct for generations I and III.A. In generation I, the mother carries the recessive allele
and is heterozygous. In generation III, males andfemales inherit the Duchenne allele from theirmothers.
B. In generation I, the father carries the recessive alleleand is heterozygous. In generation III, females andmales inherit the Duchenne allele from their fathers.
C. In generation I, the mother carries the recessive alleleand is homozygous. In generation III, only malesinherit the Duchenne allele from their mothers.
D. In generation I, the father carries the recessive alleleand is homozygous. In generation III, females andmales inherit the Duchenne allele from their fathers.
5. Brown spotting on the teeth is a sex-linked trait in humans.A father with brown spotting passes the trait along to allhis daughters but not to his sons. The mother does nothave brown spotting on her teeth. This indicates that thebrown spotting gene is A. dominant and located on the X chromosomeB. recessive and located on the X chromosomeC. dominant and located on the Y chromosomeD. recessive and located on the Y chromosome
6. The recombination frequency among genes found on thesame chromosomes depends onA. which genes are dominant and which genes are
recessiveB. the number of genes along the chromosomeC. the size of the chromosomeD. the distance between the genes
I
II
III
IVFigure 1
Use the following information to answer questions 2 to 4.
In the pedigree chart shown in Figure 1, females arerepresented by circles and males by squares, while lightshading indicates normal phenotype and dark shadingindicates Duchenne muscular dystrophy.
www.science.nelson.com GO
Ch 19_Bio_Alberta30 1/8/07 12:35 PM Page 657

658 Chapter 19 NEL
7. Ocular albinism in humans is characterized by a lack ofpigment in the iris of the eyes. This X-linked trait oftenresults in blindness for those afflicted. A woman whocarries this trait marries a normal man. Identify the chanceof ocular albinism in a child from this couple.A. 100 % chance of normal female offspring and a 100 %
chance of normal male offspring B. 50 % chance of female offspring with ocular albinism,
50 % chance of normal female offspring, and 100 %chance of normal male offspring
C. 100 % chance of normal female offspring, 50 %chance of male offspring with ocular albinism, and 50 % chance of normal male offspring
D. 50 % chance of female offspring with ocular albinism,50 % chance of normal female offspring, 50 % chanceof male offspring with ocular albinism, and 50 %chance of normal male offspring
8. The allele R produces rose combs in chickens. Anotherallele P, located on a different chromosome, produces peacombs. The absence of the dominant rose comb and peacomb alleles (rrpp) produces birds with single combs.When the dominant R allele and the dominant P allele areboth present, they interact to produce a walnut comb(R_P_). Identify the phenotypes of the parents and theexpected phenotypic ratios of the F
1generation from a
cross of chickens with the genotype RrPp × rrPp.A. The parental phenotypes are walnut comb and pea
comb. The expected F1 phenotypic ratio from the crossis 3 walnut:3 pea:1 rose:1 single.
B. The parental phenotypes are walnut comb and peacomb. The expected F1 phenotypic ratio from the crossis 4 walnut:4 rose.
C. The parental phenotypes are rose comb and peacomb. The expected F1 phenotypic ratio from the crossis 3 walnut:2 rose:2 pea:1 single.
D. The parental phenotypes are pea comb and singlecomb. The expected F1 phenotypic ratio from the crossis 4 rose:4 pea.
Use the following information to answer questions 9 and 10.
The chromosome map in Figure 2 shows the portion of achromosome that carries genes for scalloped wings, bar eyes,and garnet eyes—all mutant traits in Drosophila melanogaster.It was drawn using data from several test crosses.
bar eye scalloped wing garnet eye
6 units 7 units
Figure 2
9. Determine the frequency of crossover between scallopedwings and garnet eyes, as a percent. (Record all four digitsof your answer.)
10. Determine the frequency of crossover between bar eyesand garnet eyes, as a percent. (Record all four digits ofyour answer.)
Part 211. Describe Erwin Chargaff’s contribution to the
determination of DNA structure.
12. Explain how the development of the chromosome theory islinked with the development of the light microscope.
13. Describe the contributions made by Walter Sutton,Theodor Boveri, and Thomas Morgan in the development ofthe modern-day chromosome theory of genetics.
14. The gene for wild-type eye colour is dominant and sex-linked in Drosophila melanogaster. White eyes arerecessive. The mating of a male with wild-type eye colourwith a female of the same phenotype produces offspring that are �
34
� wild-type eye colour and �14
� white-eyed. Predictthe genotypes of the P
1and F
1generations.
15. The autosomal recessive allele tra transforms a femaleDrosophila melanogaster into a phenotypic male when itoccurs in the homozygous condition. The transformedfemales are sterile. The tra gene has no effect on thephenotype of XY males. Using Punnett squares, predict thegenotypes and phenotypes of individuals in the F
1and F
2generations from the following cross: XX, + /tra crossedwith XY, tra/tra. (Note the + indicates the normal dominantgene.)
16. Edward Lambert, an Englishman, was born in 1717.Lambert had a skin disorder that was characterized by verythick skin, which was shed periodically. The hairs on hisskin were very course and quill-like, giving him the name“porcupine man.” Lambert had six sons, all of whomexhibited the same traits. The trait never appeared in hisdaughters. In fact, the trait has never been recorded infemales. Hypothesize the nature of the inheritance of the“porcupine trait” that would explain these observations.
NR
NR
Ch 19_Bio_Alberta30 1/8/07 12:35 PM Page 658

Beyond Mendel 659NEL
17. Predict the phenotypes of the P1
generation.
18. If parents 1 and 2 were to have a fourth child, determinethe probability that the child would have hemophilia.
19. If parents 1 and 2 were to have a second male, determinethe probability that the boy would have hemophilia.
20. Predict the genotypes of parents 4 and 5.
21. A science student hypothesizes that dominant genesoccur with greater frequency in human populations thanrecessive genes occur. Either support or refute thestudent’s hypothesis, using the information that you havegathered in this chapter to justify your decision.
Chapter 19
22. Use the crossover frequencies to sketch a gene map.
23. Identify which genes are farthest apart. Determine theirdistance. Illustrate your answer by way of a diagram.
24. From the data provided in Table 1, conclude in a writtenstatement the relative position of the FV, C, and B alleles.
Use the following information to answer questions 17 to 20.
Figure 3 is a pedigree chart of a family in which somemembers have hemophilia.
1 2
3 4 5 6
7 8 9 10
normal female
hemophilic female
normal male
hemophilic male
I
II
III
Figure 3
Use the following information to answer questions 22 to 24.
In 1911, Thomas Morgan collected the gene crossoverfrequencies shown in Table 1 while studying Drosophilamelanogaster. The loci for four different genes that code forwing shape are located on the same chromosome. Bar-shapedwings are indicated by the B allele, carnation wings by the Callele, fused veins on wings by the FV allele, and scallopedwings by the S allele.
Table 1
Gene combinations Recombination frequency
FV/B 2.5 %
FV/C 3.0 %
B/C 5.5 %
B/S 5.5 %
FV/S 8.0 %
C/S 11.0 %DE
DE
DE
DE
DE
DE
DE
Ch 19_Bio_Alberta30 1/8/07 12:35 PM Page 659

In this chapter
2020 Molecular Genetics
chapter
Molecular Genetics
Exploration: Similaritiesand Differences
Mini Investigation:Building a DNA Model
Web Activity: DNAReplication
Lab Exercise 20.A:Synthesis of a Protein
Investigation 20.1: Protein Synthesis andInactivation of Antibiotics
Web Activity:Electrophoresis
Web Activity: Researchersin Human GeneticDisorders
Mini Investigation:Examining the HumanGenome
Investigation 20.2:Restriction EnzymeDigestion ofBacteriophage DNA
Web Activity:Transformation ofEukaryotes
Case Study: GeneMutations and Cancer
Lab Exercise 20.B:Looking for SINEs ofEvolution
By the mid-1950s, scientists had determined that chromosomes contained DNA andthat DNA was the genetic material (Figure 1). Building on the work of other scientists,Watson and Crick deduced the structure of this complex molecule. This knowledge laidthe basis for the field of molecular biology, which aims to understand the inheritance oftraits at the level of interactions between molecules in the cell.
A primary goal of molecular genetics is to understand how DNA determines the phe-notype of an organism. What happens to DNA during duplication of chromosomes inmitosis? How does the structure of DNA relate to its function? How does one molecule,identical in every somatic cell of an organism, determine the characteristics of the manydifferent types of cells that are found in that organism?
Today, questions such as these continue to drive research in the fields of biology,biotechnology, biochemistry, and medicine. We now know the sequence of all thenucleotides that make up the genome of many organisms, including that of our ownspecies, Homo sapiens. This information has given scientists new ways to study the rela-tionships between species and the mechanisms of evolution. It also allows law enforce-ment agencies to identify individuals with incredible accuracy from minute quantitiesof DNA.
Using genetic technologies, scientists can move genes from one species to another. Infields such as agriculture, corporations have patented the genomes of these organismsin order to profit from the advantages they offer over conventional organisms. Similarmanipulation of human cells may one day lead to treatments for previously untreat-able debilitating diseases. The research and application of these technologies raises manysocial, ethical, and legal issues that society has yet to fully resolve.
660 Chapter 20 NEL
Answer these questions as best you can with your current knowledge. Then, using the concepts and skills you have learned, you will revise your answers at the end ofthe chapter.
1. Differentiate between DNA and proteins. What cellular roles do they play?
2. Describe the physical and chemical characteristics of DNA.
3. What is the significance of DNA replication in your body?
4. Write a short overview, in paragraph form, of the process of DNA replication.
STARTING Points
Career Connections:Biological Technician; Biotechnologist
Ch 20_Bio_Alberta30 1/8/07 12:40 PM Page 660

Molecular Genetics 661NEL
Figure 1DNA sequences are represented by the letters A, T, C, and G.
Exploration The Size of the Genome
All organisms, no matter how simple they may seem to us,require DNA in each cell to encode the instructions necessaryto live and reproduce. The total DNA of an organism is referredto as its genome. In bacteria, the genomic DNA is circular,accounts for 2 % to 3 % of the cell’s mass, and occupies about10 % of its volume. In this activity, you will make a model of anEscherichia coli cell that will be 10 000 times bigger than actualsize. You will also gain an appreciation for how compactly DNAis packed within a cell.
Materials: 2 cm gelatin capsule, 10 m of white thread, 10 m ofcoloured thread
• Try to construct the bacterium by placing the long lengths ofthread inside the gelatin capsule. Good luck! It’s not easy!
(a) Why does it take two lengths of thread to represent thechromosome?
(b) Is the thread that you tried to place in the capsule toothick to represent the actual thickness of the DNA? (What percentage of bacterial cell volume does yourthread fill, and what is the actual volume that the DNAoccupies in the bacteria?)
(c) If the human genome is 1000 times bigger than the E. coligenome, how many metres of thread would it take torepresent the human genome?
(d) What size container would you need to hold the threadrepresenting the human genome?
Ch 20_Bio_Alberta30 1/8/07 12:40 PM Page 661

662 Chapter 20 NEL
20.120.1 DNA Structure and ReplicationAccording to the model proposed by Watson and Crick, DNA consists of two strands ofnucleotides. Each nucleotide contains a deoxyribose sugar, a phosphate group, and anitrogenous base, all covalently bonded to each other. Each strand of DNA has a back-bone of sugar and phosphate groups (Figure 1). The nitrogenous bases stick out from thebackbone of each DNA strand.
Watson and Crick’s model also indicates that the two strands of DNA form a structurethat resembles a twisted ladder. The base pairs are the rungs of the ladder and the sugar–phosphate backbones are the struts. This structure is called a double helix (see Figure 1).Each DNA strand in the double helix twists in a clockwise direction.
complementary base pairingpairing of the nitrogenous base ofone strand of DNA with thenitrogenous base of another strand
H
H
N
CH3
O
T
OH H
HN
NN
N
A
N N
H
sugar
sugar
H
N
N
H
H
H
O
C
NH
H
H
N
NN
O
G
N N
H
sugar
sugar
Figure 2Adenine forms two hydrogen bondswith thymine, while guanine formsthree hydrogen bonds withcytosine.
P5’ end
3’ end
P
P
P
P
P
P
P
S T A
G C
C G
A T
S
S
S
S
S
S
S
nitrogenous bases
one nucleotide sugar–phosphate backbone
nitrogenous bases
deoxyribose sugar moleculea simplified version of the DNA molecule showing the double coilor helix
phosphate molecule
Figure 1A simplified diagram of thestructure of DNA
In the DNA molecule, the bases of one DNA strand are paired with bases in the otherstrand. A purine is always paired with a pyrimidine. Adenine (a purine) is always pairedwith thymine (a pyrimidine), and guanine (a purine) is always paired with cytosine (apyrimidine). This type of pairing is termed complementary base pairing. Hydrogenbonds, between the complementary bases (A-T and G-C) on opposite strands, hold thedouble helix together (Figure 2). Although a single hydrogen bond is very weak, largenumbers of hydrogen bonds are collectively strong, so the DNA molecule is very stable.
CAREER CONNECTION
Biological TechnicianBiological technicians may work inthe field, in the laboratory, or both.They perform routine analysis andtechnical duties to support thework of scientists and engineersworking in fields that includemolecular biology. Whateducational background isrequired to enter this field?
www.science.nelson.com GO
Ch 20_Bio_Alberta30 1/8/07 12:40 PM Page 662

Molecular Genetics 663NEL
Section 20.1
Learning TipThe rules of complementaryDNA base pairing are• A to T• G to CWhen you know the sequenceon one strand, you also knowthe sequence on thecomplementary strand.
antiparallel parallel but running inopposite directions; the 5� end ofone strand of DNA aligns with the3� end of the other strand in adouble helix
Practice1. Define the following terms: nucleotide, complementary base pairing, and antiparallel.
2. In a DNA molecule, a purine pairs with a pyrimidine. If this is the case, then whycan’t A–C and G–T pairs form? (Hint: Look closely at the bonds between the basepairs in Figure 2 on the previous page.)
3. The following is a segment taken from a strand of DNA: 5�–ATGCCTTA–3�. Write outthe complementary strand for this segment. Be sure to show directionality.
DNA replication the processwhereby DNA makes exact copiesof itself
semiconservative replicationprocess of replication in which eachDNA molecule is composed of oneparent strand and one newlysynthesized strand
template a single-stranded DNAsequence that acts as the guidingpattern for producing acomplementary DNA strand
mini Investigation Building a DNA Model
What would a section of a DNA molecule look like if you couldsee one close up? You can find out by building your own modelof the double helix. For this activity, you need to selectmaterials that will allow you to model the following features:
• the sugar–phosphate backbone
• the anti-parallel strands
• the four different nitrogenous bases
• the bonds between complementary base pairs that hold thetwo strands together
Your model should show a minimum of 12 base pairs. It shouldbe free-standing and approximately 15 cm tall by 6 cm wide.Include a legend with your model that clearly identifies eachpart of the DNA strand.
DNA ReplicationIn Chapter 17, you saw that mitosis involves the duplication of chromosomes. For mitosisto occur, DNA must copy itself and be equally divided between the daughter cells. To haveall the correct genetic information, the DNA in each daughter cell must be an exact copyof the DNA in the parent cell. DNA replication is the process by which a cell makes anexact copy of its DNA. The main stages of DNA replication are the same in both prokary-otic cells (without a membrane-bound nucleus) and eukaryotic cells (with a membrane-bound nucleus).
DNA replication is semiconservative. Semiconservative replication involves sepa-rating the two parent strands and using them to synthesize two new strands (Figure 3, nextpage). The hydrogen bonds between complementary bases break, allowing the DNA helixto unzip. Each single DNA strand acts as a template to build the complementary strand.Finally, any errors are repaired, resulting in two identical DNA molecules, one for eachdaughter cell.
The sequence of bases on any one strand of DNA can vary greatly between species, butits opposite strand will always have the complementary sequence of bases. For example, thesequences of the strands below are complementary:
5�–ATGCCGTTA–3�
3�–TACGGCAAT–5�
The two strands of nucleotides are antiparallel. They run parallel but in oppositedirections to one another. One strand will have a 5� carbon and phosphate group at oneend and a 3� carbon and the hydroxyl group of a deoxyribose sugar at its other end. Itsantiparallel strand will have a 3� carbon and the hydroxyl group of a deoxyribose sugarat the first end and a 5� carbon and phosphate group at its other end (Figure 1, pre-vious page).
The direction of the strand is important when enzymes interact with DNA, either tocopy the DNA prior to cell division or to “read” genes in order to make proteins. Enzymescan read or copy DNA in only one direction. The sequence of only one DNA strand isgiven when sequences are written out since the complementary strand is easily deducedaccording to the rules of complementary base pairing.
Ch 20_Bio_Alberta30 1/8/07 12:40 PM Page 663

664 Chapter 20 NEL
Separating the DNA StrandsThe two strands of the DNA helix cannot simply pull apart because they are tightly heldtogether by the hydrogen bonds between bases and by the twists of the helix. The enzymeDNA helicase unwinds the helix by breaking the hydrogen bonds between the com-plementary bases. As this happens, the bonds between bases tend to reform. To preventthis, proteins bind to the separated DNA strands, helping to hold them apart. The twostrands are now separated along part of the DNA molecule and are the template strandsfor the next step in replication. The point at which the two template strands are separatingis called the replication fork. One template strand runs in the 3� to 5� direction in rela-tion to the replication fork, while the other runs in the 5� to 3� direction (Figure 4).
old strandsemiconservative
replication
Key
new strand
Figure 3DNA replicates semiconservatively.Each daughter molecule receivesone strand from the parentmolecule plus one newlysynthesized strand.
DNA helicase the enzyme thatunwinds double-helical DNA bydisrupting hydrogen bonds
3�
5�3�
3�
3�
3�
5�
5�
5�
5�
leading strand2. proteins
1. DNA helicase
3. primerreplication fork
4. DNA polymerase IIIdirection of replication
laggingstrand
Figure 4 1. DNA helicase opens the double helix. 2. Proteins bind to the DNA to keep the two strandsseparate. 3. RNA primers are attached to the template strands. 4. DNA polymerase synthesizesthe new DNA strands. The leading strand is synthesized continuously, and the lagging strandis synthesized in short fragments. DNA polymerase III adds complementary nucleotides in the5� to 3� direction, using single-stranded primers as starting points. One nucleotide is attachedto the next by bonding the phosphate on the 5� end of the new nucleotide to the hydroxylgroup on the 3� end of the last nucleotide.
Building the Complementary StrandsThe next stage of DNA replication synthesizes two new DNA strands on the templatestrands through complementary base pairing. The new strands are synthesized by anenzyme called DNA polymerase III. This DNA polymerase builds a new strand bylinking together free nucleotides that have bases complementary to the bases in the tem-plate. A short piece of single-stranded ribonucleic acid, called a primer, is attached to thetemplate strand. This gives DNA polymerase III a starting point to begin synthesizing the
DID YOU KNOW ??DNA PolymerasesThere are several DNA polymerasesin a cell, all with their own role.Each has a unique name, createdby adding a roman numeral after"DNA polymerase." The main DNApolymerase involved in DNAreplication is DNA polymerase III. Itadds the 5� phosphate group of afree nucleotide to the 3� carbon ofthe sugar in the last nucleotide.
DNA polymerase III the enzymethat synthesizes complementarystrands of DNA during DNAreplication
Ch 20_Bio_Alberta30 1/8/07 12:40 PM Page 664

Molecular Genetics 665NEL
new DNA strand. DNA polymerase III adds nucleotides to a growing strand in only onedirection—the 5� to 3� direction. The phosphate group at the 5� end of a free nucleotideis connected to the hydroxyl group on the 3� carbon of the sugar on the last nucleotidein the strand. As a result, one of the new strands will be synthesized continuously asDNA polymerase III moves in the 5� to 3� direction toward the replication fork. Thisstrand is called the leading strand.
The other new strand, the lagging strand, is synthesized in short fragments. Thisallows the lagging strand to be synthesized in the 5� to 3� direction. RNA primers arerequired. To complete the replication of the DNA, the primers are cut out from the lag-ging strand and are replaced by DNA nucleotides by a different enzyme called DNA polymerase I.
Another enzyme, DNA ligase, links the sugar–phosphate backbone of the DNA frag-ments together (Figure 5).
Section 20.1
leading strand the new strandof DNA that is synthesized towardsthe replication fork andcontinuously during DNAreplication
lagging strand the new strandof DNA that is synthesized awayfrom the replication fork and inshort fragments, which are laterjoined together
DNA polymerase I an enzyme thatremoves RNA primers and replacesthem with the appropriatenucleotides during DNA replication
DNA ligase an enzyme that joinsDNA fragments together
DNA RepairAs complementary strands of DNA are synthesized, both DNA polymerase I and III actas quality control checkers by proofreading the newly synthesized strands. When a mis-take occurs, the DNA polymerases backtrack to the incorrect nucleotide, cut it out, andthen continue adding nucleotides to the complementary strand. The repair must bemade immediately to avoid the mistake from being copied in later replications. Other DNArepair mechanisms can correct any errors that were missed during proofreading.
DNA polymerase I
DNA polymerase IIIdirection of synthesis
DNA polymerase III addsnucleotides to the primers to form short fragments of DNA.
DNA polymerase Iremoves the RNA primers and replaces them with DNA nucleotides. A nick is left betweenfragments.
DNA ligase joins thefragments together.
RNA primer
5�
3�
5�
3�
5�
3�
3�
5�
3�
5�
3�
5�
DNA fragmentRNA primer
DNA ligase
Figure 5Building the lagging strand
Okazaki FragmentsThe short fragments that aresynthesized to form the laggingstrand during DNA replication arecalled Okazaki fragments. Theywere named after Reiji Okazaki,who first described them in the1960s.
DID YOU KNOW ??
Ch 20_Bio_Alberta30 1/8/07 12:40 PM Page 665

WEB Activity
Simulation—DNA ReplicationThe Escherichia coli genome consists of 4.7 million nucleotide pairs. This entire genome isreplicated in 40 min. Proofreading by DNA polymerase I and polymerase III maintains the errorrate at roughly one error per 1000 cells duplicated! View a complete animation of DNAreplication by accessing the Nelson Web site.
DNA Structure and ReplicationSUMMARY
www.science.nelson.com GO
666 Chapter 20 NEL
Section 20.1 Questions1. Summarize the key physical and chemical properties of
DNA.
2. Differentiate between a purine and a pyrimidine.
3. Copy Table 1 into your notebook, fill in the missinginformation, and supply an appropriate title.
5. Define a replication fork.
6. In a double helix, there is a complete turn every 3.4 nm, or10 nucleotides. Assume that the DNA molecule in aparticular chromosome is 75 mm long. Calculate thenumber of nucleotide pairs in this molecule.
7. Copy Table 2 into your notebook and complete themissing information. Explain how you determined themissing values.
Table 1
Enzyme Function
DNA helicase
DNA polymerase I
DNA polymerase III
DNA ligase
4. A molecule of DNA was analyzed and found to contain20 % thymine. Calculate the percentage of adenine,guanine, and cytosine in this molecule.
Table 2
Nucleotide Sample A Sample B Sample C
adenine 10 % 20 %
guanine 40 % 15 %
thymine 35 % 20 %
cytosine
Separating the Strands
• DNA helicase unzips the double helix by breaking the hydrogen bonds betweenthe complementary bases in the two strands of the parent DNA molecule.
• Proteins attach to the newly exposed DNA strands, preventing the hydrogenbonds from re-forming and keeping the strands apart.
Building the Complementary Strands
• DNA polymerase III adds complementary nucleotides to the growing strands,using the exposed strands of the parent DNA molecule as a template.
• The leading strand is formed continuously.
• The lagging strand is formed in short fragments, starting from an RNA primer.
• DNA polymerase I cuts out the RNA primers and replaces them with theappropriate DNA nucleotides.
• DNA ligase joins the fragments together to form a complete DNA strand.
DNA Repair
• DNA polymerase enzymes cut out incorrectly paired nucleotides and add thecorrect nucleotides in a process called proofreading.
Ch 20_Bio_Alberta30 1/8/07 12:40 PM Page 666

Molecular Genetics 667NEL
20.220.2Gene ExpressionAs you learned in previous chapters, specific segments of DNA on a chromosome are calledgenes. Genes determine the inherited characteristics, or traits, of an organism. Everysomatic (body) cell in an organism contains identical copies of DNA, and each of theseDNA copies is a genetic blueprint for the organism. Once scientists knew the structureof DNA and how it replicated, they used this knowledge to further investigate anotherquestion: How do the genes in DNA determine an inherited trait?
The way the information in a gene is converted into a specific characteristic or traitthrough the production of a polypeptide is called gene expression. Recall that a polypep-tide is a chain of amino acids and that proteins are made up of polypeptides. Proteinsform many structures in an organism, such as skin and muscle, and they also form allof the enzymes in a cell. The products of all genes are polypeptides.
A second type of nucleic acid is involved in converting the instructions in a gene intoa polypeptide chain. Ribonucleic acid (RNA) is a polymer of nucleotides similar toDNA. There are three main structural differences between RNA and DNA. First, thesugar in RNA has an extra hydroxyl group and is called ribose rather than deoxyribose(Figure 1). Second, instead of the base thymine found in DNA, RNA contains the baseuracil. Like thymine, uracil can form complementary base pairs with adenine (Figure 2).Third, RNA is single-stranded and not double-stranded like DNA. There are three typesof RNA that are needed to convert genes into proteins: messenger RNA (mRNA), transferRNA (tRNA), and ribosomal RNA (rRNA).
gene expression conversion of agene into a specific trait throughthe production of a particularpolypeptide
ribonucleic acid (RNA) a nucleicacid consisting of nucleotidescomprised of the sugar ribose andnitrogenous bases
The Central DogmaThere are two main stages of gene expression, transcription and translation. In transcription, the genetic information is converted from a DNA sequence into messenger RNA (mRNA). In all cells, the mRNA carries the genetic information fromthe chromosome to the site of protein synthesis. In eukaryotic cells, which contain anucleus, the mRNA carries the genetic information from the nucleus to the cytoplasmas it passes through the pores in the nuclear envelope.
The second stage of gene expression is translation. During translation, the geneticinformation carried by the mRNA is used to synthesize a polypeptide chain.
The two-step process of transferring genetic information from DNA to RNA and thenfrom RNA to protein is known as the central dogma of molecular genetics (Figure 3, nextpage). We will explore transcription and translation in more detail in this section. You
transcription the process ofconverting DNA into messengerRNA
messenger RNA (mRNA) theproduct of transcription of a gene;mRNA is translated by ribosomesinto protein
translation the process ofsynthesizing a specific polypeptideas coded for by messenger RNA
CH2HO OH
H
OH
O
ribose sugar
H
H
OH
H
5�
3�
4� 1�
2�
CH2HO OH
H
OH
O
deoxyribose sugar
H
H
H
H
5�
3�
4� 1�
2�
Figure 1A ribose sugar possesses an �OH group (hydroxyl) on the 2� carbon. Thedeoxyribose sugar is missing the �OH group on the 2� carbon. The deoxy partof the name deoxyribose indicates a “loss of oxygen” at position 2.
DNA A AACGT
RNA U UUGCA
Figure 2 Base pairing of RNA with DNAduring transcription. Notice thatthymine does not exist in RNA but issubstituted with uracil.
Ch 20_Bio_Alberta30 1/8/07 12:40 PM Page 667

668 Chapter 20 NEL
will see that the sequence of nucleotides in a gene determines the sequence of aminoacids in a polypeptide.
Transcription During transcription, the DNA sequence of a gene is copied (transcribed) into thesequence of a single-stranded mRNA molecule.
Transcription is divided into three processes: initiation, elongation, and termination.During initiation, an enzyme called RNA polymerase binds to the DNA at a specificsite near the beginning of the gene. During elongation, RNA polymerase uses the DNAas a template to build the mRNA molecule. During termination, the RNA polymerasepasses the end of the gene and comes to a stop. The mRNA is then released from thetemplate strand of DNA.
InitiationTranscription starts when the RNA polymerase enzyme binds to the segment of DNAto be transcribed and opens the double helix. Figure 4 shows an electron micrographof this process. The RNA polymerase binds to the DNA molecule in front of the geneto be transcribed in a region called the promoter. In most genes, the promoter sequencecontains a string of adenine and thymine bases that serves as the recognition site for RNApolymerase. The promoter indicates which DNA strand should be transcribed andwhere the RNA polymerase should start transcribing the DNA. Since the binding siteof RNA polymerase only recognizes the promoter region, it can only bind in front ofa gene.
ElongationOnce the RNA polymerase binds to the promoter and opens the double helix, it startsbuilding the single-stranded mRNA in the 5� to 3� direction. The promoter is not tran-scribed. The process of elongation of the mRNA molecule is similar to DNA replica-tion. However, RNA polymerase does not require a primer and it copies only one of theDNA strands. The transcribed DNA strand is called the template strand. The mRNAsequence is complementary to the DNA template strand except that it contains the baseuracil in place of thymine.
TerminationSynthesis of the mRNA continues until RNA polymerase reaches the end of the gene. RNApolymerase recognizes the end of the gene when it comes to a stop signal called a termination sequence. Transcription stops and the newly synthesized mRNA discon-nects from the DNA template strand. RNA polymerase is then free to bind to another pro-moter region and transcribe another gene. Figure 5, on the next page, summarizes thesteps in transcription.
gene mRNA
Transcriptionnucleus nuclearenvelope
cytoplasmTranslation
polypeptideprotein
DNA
Figure 3The central dogma of molecular genetics
RNA polymerase enzyme thattranscribes DNA
Figure 4The RNA polymerase (dark circles)binds to the DNA strand andinitiates transcription. Transcriptionoccurs simultaneously at numerouslocations along the DNA.
promoter sequence of DNA thatbinds RNA polymerase in front of agene
template strand the strand of DNAthat the RNA polymerase uses as aguide to build complementarymRNA
termination sequence sequenceof bases at the end of a gene thatsignals the RNA polymerase to stoptranscribing
Ch 20_Bio_Alberta30 1/8/07 12:40 PM Page 668

Molecular Genetics 669NEL
Section 20.2
5� 3�
RNA polymerase
mRNA
5�3�
5�mRNA
DNA has rewounddirection oftranscription
mRNA
template strand
DNA
RNA polymerase
promoter
(a) InitiationRNA polymerase binds toDNA at a promoter.
(b) DNA double helix is unwound,exposing the template strand.
(c) ElongationmRNA is synthesized using onestrand of DNA as a template.mRNA is synthesized in the 5� to 3� direction.
(d) As elongation proceeds, RNApolymerase moves along DNA,synthesizing mRNA. DNA thathas already been transcribedrewinds into a double helix.
(e) RNA polymerase reaches thetermination sequence at end ofgene.
(f) TerminationTranscription stops. mRNA andRNA polymerase are released.
Practice1. A short fragment of a particular gene includes the following sequence of
nucleotides:
TACTACGGT
Write out the corresponding mRNA transcript.
2. A short fragment of another gene includes the following sequence of nucleotides:
ACCATAATATTACCGACCT TCG
(a) Explain the purpose of the promoter region in transcription. (b) Copy the sequence into your notebook and circle the promoter region. Explain
the rationale for your selection.
Figure 5 A summary of the process of transcription
Regulation of TranscriptionThis Audio Clip discusses theregulatory factors that controlwhen and how much mRNA istranscribed from a given gene.
www.science.nelson.com GO
EXTENSION +
Ch 20_Bio_Alberta30 1/8/07 12:40 PM Page 669

670 Chapter 20 NEL
TranslationThe second part of the central dogma of molecular biology (Figure 3, page 668) is thetranslation of the genetic information carried by mRNA into a chain of amino acids toform a polypeptide. Therefore, the process of translation involves protein synthesis, andit depends on the remarkable nature of the genetic code.
Only 20 amino acids are found in proteins. The DNA in a gene codes for these 20amino acids by combinations of the four nitrogenous bases. During translation, theDNA code is read in groups of three nucleotides, called a codon. Each codon calls for aspecific amino acid to be placed in the growing polypeptide chain. Codons can consistof any combination of the four nitrogenous bases, so there are 64 (43 = 64) possible dif-ferent codons for the 20 different amino acids. The groups of three bases in both DNAand mRNA are both called codons, so it is important to clarify which code is being pre-sented when writing out a genetic sequence. The remainder of this description will usemRNA codons. Table 1 shows the mRNA codons. One of these codons (AUG) is thestart codon, where translation begins. It also codes for the insertion of the amino acidmethionine, so all polypeptide chains initially start with the methionine, but it may laterbe edited out. Three other codons (UAA, UAG, and UGA) do not code for amino acidsand are called the stop codons because they cause protein synthesis to stop. The other60 codons code for one of the 20 amino acids. Some amino acids have more than onecodon; for example, both serine and leucine each have 6 different codons. Table 2, on thenext page, lists the abbreviations for the amino acids to help you look them up in Table 1.
Like transcription, translation can be divided into the same three stages: initiation, elon-gation, and termination.
InitiationInitiation of translation occurs when a ribosome recognizes a specific sequence on themRNA and binds to that site. In eukaryotes, the ribosome consists of two subunits, alarge subunit and a small subunit (Figure 6, next page). The two subunits bind to themRNA, clamping it between them. The ribosome then moves along the mRNA in the 5�
to 3� direction, adding a new amino acid to the growing polypeptide chain each time it
codon sequence of three bases inDNA or complementary mRNA thatserves as a code for a particularamino acid
start codon specific codon (AUG)that signals the start of translation
stop codon specific codon thatsignals the end of translation
Why Three Nucleotides per Codon?Why are there always threenucleotides in a codon? Why nottwo or four? Listen to this AudioClip to find out the reason behindthe triplet code found in DNA andmRNA sequences.
www.science.nelson.com GO
EXTENSION +
Table 1 Codons and Their Amino Acids
2nd (middle) Base of a Codon
1st Base U C A G 3rd Base
U UUU Phe UCU Ser UAU Tyr UGU Cys UUUC Phe UCC Ser UAC Tyr UGC Cys CUUA Leu UCA Ser UAA STOP UGA STOP AUUG Leu UCG Ser UAG STOP UGG Trp S
C CUU Leu CCU Pro CAU His CGU Arg UCUC Leu CCC Pro CAC His CGC Arg CCUA Leu CCA Pro CAA Gln CGA Arg ACUG Leu CCG Pro CAG Gln CGG Arg S
A AUU Ile ACU Thr AAU Asn AGU Ser UAUC Ile ACC Thr AAC Asn AGC Ser CAUA Ile ACA Thr AAA Lys AGA Arg AAUG Met ACG Thr AAG Lys AGG Arg S
G GUU Val GCU Ala GAU Asp GGU Gly UGUC Val GCC Ala GAC Asp GGC Gly CGUA Val GCA Ala GAA Glu GGA Gly AGUG Val GCG Ala GAG Glu GGG Gly S
ribosome an organelle composedof RNA and protein and located inthe cytoplasm that carries outprotein synthesis
Ch 20_Bio_Alberta30 1/8/07 12:40 PM Page 670

Molecular Genetics 671NEL
Section 20.2
reads a codon (Figure 7). Ribosomes synthesize different proteins by associating with dif-ferent mRNAs and reading their coding sequences.
A ribosome must begin reading the coding sequence at the correct place in the mRNA,or it will misread all the codons. The first codon that it recognizes is the start codonAUG. Binding to the start codon ensures that the ribosome translates the genetic codeusing the reading frame of the mRNA molecule. It is critical that the mRNA be positionedin the ribosome in its reading frame so that the genetic code is translated into the cor-rect sequence of amino acids.
Once the ribosome has bound the mRNA, how does it get the amino acids that cor-respond to the codon? This job falls to a second type of RNA molecule known as transferRNA (tRNA). At one end of the tRNA there is a sequence of three bases, the anticodon,that is complementary to the codon of the mRNA. The opposite end carries the corre-sponding amino acid (Figure 8, next page). For example, if the mRNA has the codon UAU,the complementary base sequence of the anticodon is AUA, and the tRNA would carrythe amino acid tyrosine. Check Table 1 to find the mRNA codon and prove to yourselfthat it calls for tyrosine. Every tRNA carries only one specific amino acid, which meansthat at least 20 different tRNAs are required. Recall that there are 64 possible codons.In reality, anywhere from 20 to 64 types of tRNA molecules are available, depending onthe organism.
Figure 6Ribosomes consist of a large subunit and asmall subunit.
largesubunit
smallsubunit
intact ribosome
small subunitlarge subunit
polypeptidechain
ribosome
3’
5’
mRNA
direction oftranslation
Figure 7The large and small subunit of a ribosomework together to translate a strand ofmRNA into a polypeptide. The polypeptidegrows as the ribosome moves farther alongthe mRNA strand.
transfer RNA (tRNA) the form ofRNA that delivers amino acids to aribosome during translation
anticodon group of threecomplementary bases on tRNA thatrecognizes and pairs with a codonon the mRNA
Practice3. Transcribe the following sequence of DNA into mRNA.
TACGGATTTCTCCGCAAATTAGGG
4. Translate the following mRNA sequence into an amino acid sequence.
5�-AUGCCCUCUAUUCCGGGAAGAUAG-3�
5. How many nucleotides are necessary in the DNA to code for the following sequenceof amino acids?
Leu-Tyr-Arg-Trp-Ser
Table 2 Amino Acids and TheirAbbreviations
Amino Three-letteracid abbreviation
alanine Ala
arginine Arg
asparagine Asn
aspartic acid Asp
cysteine Cys
glutamic acid Glu
glutamine Gln
glycine Gly
histidine His
isoleucine Ile
leucine Leu
lysine Lys
methionine Met
phenylalanine Phe
proline Pro
serine Ser
threonine Thr
tryptophan Trp
tyrosine Tyr
valine Val
Ch 20_Bio_Alberta30 1/8/07 12:40 PM Page 671

672 Chapter 20 NEL
ElongationThe first codon that is recognized by the ribosome is the start codon AUG. The AUGcodon also codes for methionine, so every protein initially starts with the amino acidmethionine. The ribosome has two sites for tRNA to attach: the A (aminoacyl) site andthe P (peptidyl) site. The tRNA with the anticodon complementary to the start codonenters the P site, as shown in Figure 9 (a). The next tRNA carrying the required aminoacid enters the A site, as shown in Figure 9 (b). In Figure 9 (c), a peptide bond hasformed between the methionine and the second amino acid, alanine. The ribosome hasshifted over one codon so that the second tRNA is now in the P site. This action hasreleased the methionine-carrying tRNA from the ribosome and allowed a third tRNA toenter the empty A site. The process is similar to a tickertape running through a ticker-tape machine, except that the ribosome “machine” moves along the mRNA “tickertape.”The tRNAs that have been released are recycled in the cell cytoplasm by adding newamino acids to them. The process continues until the entire code of the mRNA has beentranslated and the ribosome reaches a stop codon, as shown in Figures 9 (d) and (e).
ACCACGGCUUU
P GCCGAAA
AAUCU
UUAGA
G G G C C
OH
aminoacyl site for attachmentof amino acid tyrosine
anticodon arm
anticodon
C C C G G
G A G
C U C G
C UAG
CGC
CG
G
G
GG G
CC
GC
A
AU
A
U
A
GA
UA
UC
U
5� end
3� end
Figure 8 The tRNA molecule has a cloverleaf structure. The molecule folds to form this structure becauseof hydrogen bonding. The anticodon is located on the anticodon arm and the amino acid iscovalently bound to the adenine nucleotide at the 3� end (aminoacyl). In this case, the aminoacid that would be added is tyrosine because the anticodon is AUA.
DID YOU KNOW ??RNA Polymerase I, II, IIIThere are three forms of the RNApolymerase in eukaryotes: RNApolymerase I transcribes ribosomalRNA; RNA polymerase II transcribesmRNA; and RNA polymerase IIItranscribes tRNA and other shortgenes that are about 100 base pairsin length.
DID YOU KNOW ??From DNA to ProteinThe discovery of the relationshipbetween DNA, mRNA, ribosomes,tRNA, and protein was the result ofnumerous scientists working onseparate pieces of the puzzle.Watch an online animation of theirstudies.
www.science.nelson.com GO
Ch 20_Bio_Alberta30 1/8/07 12:40 PM Page 672

Molecular Genetics 673NEL
Section 20.2
Met
A site
3� 5�
5� 3� mRNA
P site
(a)tRNA
UACAUG GCA AUAAGG AGG
Met
Ala
A site
ribosome shifts
P site
(b)
UACAUG GCA AUAAGG AGG
3� CGU 5�
5� 3� mRNA
ribosome shiftsribosome shifts
(c)
A site
peptidebond
P site
CGUAGG AGG
3� UAU 5�
5� 3� mRNA
AlaMetIle
AUG GCA AUA
MetArg
Ala Ile
A siteP site
tRNA
(d)
IletRNA
U A U
U A C
UAU3� UUG 5�
5� 3� mRNAAGG AGG AUA AAC CUAAUG GCA
polypeptide chain
A site
stop codon
P site
(e)
GCU5� 3� mRNAAGU CGA UAGGUU ACU
Val
SerThr
Asn
polypeptidechain
large subunitof ribosome
small subunit of ribosome
Psite
Asite
(f) tRNA
5� 3� mRNA
UGU3� 5�
A G U C G A U A GFigure 9 Protein synthesis(a) The first tRNA that is brought into the P site carries methionine because the start codon is AUG. (b) The second tRNA enters the A site. (c) A peptide bond forms between methionine and alanine. The ribosome shifts one codon over and the next
tRNA brings in the appropriate amino acid into the A site. (d) The ribosome moves the mRNA and another amino acid is added to the chain. (e) The process is repeated until the ribosome reaches a stop codon for which no tRNA exists. (f) A release-factor protein helps break apart the ribosome–mRNA complex, releasing the polypeptide chain.
Ch 20_Bio_Alberta30 1/8/07 12:40 PM Page 673

674 Chapter 20 NEL
TerminationEventually, the ribosome reaches one of the three stop codons: UGA, UAG, or UAA.Since these three codons do not code for an amino acid, there are no correspondingtRNAs. A protein known as a release factor recognizes that the ribosome has stalled andhelps release the polypeptide chain from the ribosome. As shown in Figure 9 (f), on theprevious page, the two subunits of the ribosome now fall off the mRNA and transla-tion stops.
Purpose Design AnalysisProblem Materials EvaluationHypothesis Procedure Synthesis Prediction Evidence
Synthesis of a Protein
In this activity, you are provided with a DNA nucleotidesequence that codes for a hypothetical protein. The code isgiven in three fragments. This DNA code is from a eukary-otic cell so in the mRNA transcript there are extra codonscalled introns. Eukaryotic cells cut these sequences out of themRNA before it leaves the nucleus, so the codons are tran-scribed but are not translated.
In this exercise, you will transcribe the three pieces of DNAcode into mRNA and identify the beginning fragment, themiddle fragment, and the end fragment. In addition, you willremove the intron segment and translate the mRNA into theprotein.
Procedure1. Copy each of the following sequences onto a separate
piece of paper. (Hint: Turn your paper so you canwrite the sequence out along the horizontal length ofthe paper. Leave room below each sequence to writeyour mRNA sequence directly below.)
Sequence ACTCGCGCCGAAACTTCCCTCCTAAACGTTCAACCGGTTCTTAATCCGCCGCCAGGGCCCC
Sequence BCGTAACAACTTGTTACAACATGGTCATAAACGTCAGATGGTCAATCTCTTAATGACT
Sequence CTACAAACATGTAAACACACCCTCAGTGGACCAACTCCGCAACATAAACCAAACACCG
2. Divide the sequences into triplets (codons) by puttinga slash between each group of three bases.
3. Transcribe the DNA into mRNA.
4. Identify the middle, end, and beginning sequence.Use your knowledge of start and stop codons to helpyou figure it out. (Hint: You will need to examine thecodons that start and end a fragment.)
5. Remove codons 24 to 51, including codon 51. Thesecodons are the intron, or extra codons, found in thisDNA segment.
6. Translate the mRNA into protein using the geneticcode.
Analysis(a) Which fragment was the beginning fragment?
How do you know?
(b) Which fragment was the end fragment? How do youknow?
(c) Codons 24 to 51 represent an intron. If the intronswere not cut out of the mRNA before it leaves thenucleus and attaches to a ribosome, what wouldhappen to the protein structure? Is it likely that thisprotein would still perform the same function?Explain your answer.
(d) How many amino acids does this protein contain?
(e) Is this genetic sequence eukaryotic or prokaryotic?How do you know?
(f) If you worked backward, starting with the aminoacid sequence of the protein, would you obtain thesame DNA nucleotide sequence? Why or why not?
(g) Provide the anticodon sequence that would build thisprotein.
LAB EXERCISE 20.A Report Checklist
Ch 20_Bio_Alberta30 1/8/07 12:40 PM Page 674

Molecular Genetics 675NEL
Section 20.2
Gene ExpressionSUMMARY
Purpose Design AnalysisProblem Materials EvaluationHypothesis Procedure SynthesisPrediction Evidence
To perform this investigation, turn to page 695.
Protein Synthesis and Inactivation ofAntibioticsEach protein has a specific function. Its presence or absence in acell may make the difference between life and death. Bacteria thatcarry an ampicillin-resistance gene produce a protein thatinactivates the antibiotic ampicillin. What happens when they are
grown on ampicillin-rich media? This investigation allows you toobserve the effects of the presence and function of a specific gene.
INVESTIGATION 20.1 Introduction Report Checklist
Table 3 Summary of Transcription
Initiation
• Initiation of transcription starts when the RNA polymerase binds to the promoter regionof the gene to be transcribed.
• The DNA is unwound and the double helix is disrupted.
Elongation
• A complementary messenger RNA (mRNA) molecule is synthesized in the 5� to 3�direction, using one strand of DNA as a template.
• Adenine (A) bases in the DNA are paired with uracil (U) in the mRNA.
• Transcription continues until the RNA polymerase reaches a termination sequence.
Termination
• When the RNA polymerase comes to a termination sequence, it falls off the DNAmolecule.
• The mRNA separates from the DNA.
G U
codon
DNA templatestrand
transcription
mRNA
translation
polypeptide
amino acid
U G C C A A A C C U
C A A C G G T T T G G A
valine alanine lysine proline
3�
5� 3�
5�
Figure 10An overview of gene expression
Ch 20_Bio_Alberta30 1/8/07 12:40 PM Page 675

676 Chapter 20 NEL
Section 20.2 Questions1. State the central dogma of molecular genetics.
2. Describe the role of the following molecules in geneexpression: ribosomes, mRNA, tRNA.
3. The genetic code is read in groups of three nucleotidescalled codons. Explain why reading the code in pairs ofnucleotides is not sufficient.
4. The following is the sequence of a fragment of DNA:
GGATCAGGTCCATAC
Transcribe this sequence into mRNA.
5. Using the genetic code, decipher the following mRNAsequence:
5� - AUGGGACAUUAUUUUGCCCGUUGUGGU - 3�
6. The amino acid sequence for a certain peptide isLeu–Tyr–Arg–Trp–Ser. How many nucleotides arenecessary in the DNA to code for this peptide?
7. Identify which step in transcription would be affected andpredict what would happen in each situation:(a) The termination sequence of a gene is removed. (b) RNA polymerase fails to recognize the promoter.
8. Construct a table to compare the processes of replicationand transcription. Remember to consider both similaritiesand differences.
9. Distinguish between the following terms:(a) P site and A site (b) codon and anticodon (c) start and stop codon (d) DNA and RNA
10. Identify which of the following selections correctly lists theanticodons for the amino acids threonine, alanine, andproline:A. ACU GCU CCAB. ACT GCT CCAC. TGA CGA GGTD. UGA CGA GGU
11. Errors are occasionally made during the process oftranscription. Explain why these errors do not always resultin an incorrect sequence of amino acids. Describe at leasttwo examples to illustrate your answer.
Table 4 Summary of Translation
Initiation
• Ribosome subunits (large and small) bind to the mRNA transcript, sandwiching themRNA between them.
• The ribosome moves along the mRNA, reading the codons.
• Translation begins when the ribosome reaches the start codon, AUG.
Elongation
• Through the genetic code, each codon specifies a particular one of the 20 amino acidsthat make up polypeptides.
• Transfer RNA (tRNA) molecules have an anticodon that is complementary to the codonin the mRNA. The tRNA carries the amino acid specified by the codon.
• The ribosome contains two sites, the A (aminoacyl) site and the P (peptidyl) site.
• When the start codon is in the P site, the first tRNA delivers methionine. Since the startcodon codes for methionine, all polypeptides initially start with this amino acid.
• The second codon of the mRNA is exposed at the same time in the A site. When thetRNA delivers the second amino acid, a peptide bond is formed between the two aminoacids.
• The ribosome shifts over one codon. The tRNA that delivered the methionine is releasedfrom the P site.
• When the ribosome shifts, the tRNA containing the growing polypeptide moves to the P site. A third amino acid, specified by the third codon, is brought in to the A site by thenext tRNA. A peptide bond is formed between the second and third amino acid.
• Amino acids continue to be added to the polypeptide until a stop codon is read in the A site.
Termination
• The stop codons are UAG, UGA, and UAA. At this point the ribosome stalls.
• A protein known as the release factor recognizes that the ribosome has stalled andcauses the ribosome subunits to disassemble, releasing the mRNA and newly formedpolypeptide.
Ch 20_Bio_Alberta30 1/8/07 12:40 PM Page 676

Molecular Genetics 677NEL
20.320.3DNA and BiotechnologyCarpenters require tools such as hammers, screwdrivers, and saws, and surgeons requirescalpels, forceps, and stitching needles. The tools of the molecular biologist are livingbiological organisms or biological molecules. Using these tools, scientists can treat spe-cific DNA sequences as modules and move them from one DNA molecule to another,forming recombinant DNA. Research in exploring and using this type of biotechnologyhas led to exciting new advances in biological, agricultural, and medical technology.Biotechnology research has also found ways to introduce specific DNA sequences intoa living cell. For example, the gene that encodes insulin has been introduced into bac-terial cells so that they become living factories producing this vital hormone. The intro-duction and expression of foreign DNA in an organism is called genetic transformation.In this section, you will explore some of the key tools used by molecular geneticists inproducing recombinant DNA and genetically transformed organisms.
DNA SequencingBefore a DNA sequence can be used to make recombinant DNA or to transform anorganism, the scientist or technician must first identify and isolate a piece of DNA con-taining that sequence. One of the tools used to do this is DNA sequencing. DNAsequencing determines the exact sequence of base pairs for a particular DNA fragmentor molecule. In 1975, the first DNA sequencing techniques were simultaneously devel-oped by Frederick Sanger and his colleagues and by Alan Maxim and Walter Gilbert.Sanger’s technique relied on first replicating short segments of DNA that terminate dueto a chain-terminating nucleotide. Four separate reaction tubes are run, each with achain-terminating nucleotide incorporating a different base (i.e., A, T, G, and C). The var-ious lengths of DNA segments are then separated by loading and running the contentsof the tubes on a sequencing gel (Figure 1). Because the end nucleotide of each segmentis chain-terminating, its base is already known. Consequently, the sequence can be readdirectly from the gel in ascending order (shortest to longest segments). The sequenceof the strand is written along the edge of the gel diagram, starting from the bottomwhere the shortest strands have travelled. This method is comparatively slow and can onlysequence short fragments of DNA.
DNA can also be sequenced in a test tube using isolated segments of DNA. This tech-nique depends on a primer, DNA polymerase, and the four DNA nucleotides, each ofwhich is labelled with a specific dye. The complementary strand is built from these dye-labelled nucleotides. The nucleotides in the synthesized strand can then be identifiedby their colours, allowing the original strand sequence to be deduced according to the rules of complementary base pairing.
recombinant DNA fragmentof DNA composed of sequencesoriginating from at least twodifferent sources
genetic transformationintroduction and expression offoreign DNA in a living organism
G
GT
CATT
ACGTAATC
Figure 1A sequencing gel is a matrixcontaining many small spaces. TheDNA fragments are charged andwill move towards one pole of anelectric field. Smaller DNAfragments move through the spacesmore quickly than larger fragmentsand are found at the bottom of thegel. The larger fragments willremain towards the top of the gel.The resulting ladder of fragmentscan be read, giving the sequence ofthe initial DNA fragment.
WEB Activity
www.science.nelson.com GO
Simulation—ElectrophoresisElectrophoresis is an important tool in molecular biology. In addition to nucleic acids, it is also usedto separate proteins from a mixture. Electrophoresis of nucleic acids and proteins depend on thesimilar factors. In this Virtual Biology Lab, you will perform polyacrylamide gel electrophoresis(PAGE) to identify proteins involved in the biochemistry of shell colour in an extinct organism.
Ch 20_Bio_Alberta30 1/8/07 12:40 PM Page 677

678 Chapter 20 NEL
A DNA sequencing technique based on the one developed by Sanger was the mostcommon method used in the project. In this technique, pieces of DNA are replicatedand changed so that the fragments, each ending with one of the four nucleotides, can bedetected by a laser. Automated equipment can then determine the exact number ofnucleotides in the chain. A computer is used to combine the huge amount of data andreconstruct the original DNA sequence.
Prior to the Human Genome Project, the genes for hereditary disorders such as cysticfibrosis, muscular dystrophy, and Huntington disease had been identified. The aim of theproject is to add to this list so that new drugs and genetic therapies can be developed to
Table 1 Milestones in Genome Mapping
Milestone Date
human chromosome 22 completed (the first chromosome December 1999to be mapped)
Drosophila genome completed March 2000
human chromosomes 5, 16, 19 mapped April 2000
human chromosome 21 completely mapped May 2000
human genome completely mapped June 2000
The Human Genome ProjectIn a series of meetings held in the mid-1980s, plans were developed to begin the processof producing maps of the entire genetic makeup of a human being. The internationalproject began in the United States in October 1990 with James Watson, of Nobel Prizefame, as one of the first directors. The human genome consists of approximately30 000 genes, with the 23 pairs of chromosomes containing an estimated 3 billion pairsof nucleotides. Constructing the genome map involved using mapping techniques (sim-ilar to those you read about in Chapter 19) and DNA sequencing technology. When theproject began, only about 4500 genes had been identified and sequenced. The collabo-rative efforts of many scientists from numerous countries and rapid improvements insequencing techniques helped complete the gene map by June 2000 (Table 1).
DID YOU KNOW ??Genome FactsOn February 15, 2001, scientistsfrom the Human Genome Projectand Celera Genomics confirmedthat there were approximately30 000 genes in the humangenome—a number far less thanthe original estimate of 120 000.This was determined using twodifferent DNA sequencingtechniques.
Other Facts• 99.9 % of the nitrogenous base
sequences is the same in allhumans.
• Only 5 % of the genes containsthe instructions for producingfunctional proteins; the remaining95 % does not have any knownfunction.
• A worm has approximately 18 000genes; a yeast cell has about6000.
WEB Activity
Canadian Achievers—Researchers in Human Genetic DisordersAdvances in biotechnology have led a greater understanding of many human geneticdisorders. These advances have involved many research teams working together, either directlyor by publishing their work in peer-reviewed articles. The following list shows some Canadianswho are among the researchers making important contributions:
• Dr. Michael Hayden, University of British Columbia: Huntington disease
• Dr. Lap-Chee Tsui, Hospital for Sick Children, Toronto: cystic fibrosis
• Dr. Judith Hall, University of British Columbia: cystic fibrosis
• Dr. Christine Bear, University of Toronto: cystic fibrosis
• Dr. Ron Warton, Hospital for Sick Children, Toronto: Duchenne muscular dystrophy
Go to the Nelson Web site to find more information on the work of these people. After youhave completed reading this material, write a short paragraph that describes your view on theimportance of genetic research. Defend your position.
www.science.nelson.com GO
Figure 2Dr. Judith Hall
Ch 20_Bio_Alberta30 1/8/07 12:40 PM Page 678

Molecular Genetics 679NEL
Section 20.3
combat genetic disorders. The project also may open a Pandora’s box of ethical questions,legal dilemmas, and societal problems. Who will own or control the information obtainedand how will we prevent potential misuse of the data?
Enzymes and Recombinant DNAAs you have seen in this section, DNA sequencing is one way to identify specific seg-ments of DNA. Another way is by creating genetic linkage maps, as you saw in Chapter 18. Once a particular segment of DNA has been identified, molecular biolo-gists may use enzymes to isolate that segment or modify it. The DNA fragment maythen be used to create recombinant DNA or be transferred to another organism. Wewill review some of the most commonly used enzymes.
mini Investigation Examining the Human Genome
In this activity, you will go to an online map of the humangenome. On the map, you will find diagrams containinginformation about every chromosome in the genome. Themagenta and green regions on the diagrams reflect the uniquepatterns of light and dark bands seen on human chromosomesthat have been stained for viewing through a light microscope.The red region represents the centromere or constrictedportion of the chromosome. On other chromosome diagrams,you will see yellow regions that mark chromosomal areas thatvary in staining intensity. The chromatin in these areas iscondensed and sometimes known as heterochromatin,meaning “different colour.” Some diagrams have yellow regionsoverlaid by thin horizontal magenta lines. This colour patternindicates variable regions called stalks that connect very smallchromosome arms (satellites) to the chromosome.
Go to the Nelson Web site, and follow the link for MiniInvestigation: Examining the Human Genome. On the genomemap, click on each chromosome diagram to discover the traitsand disorders located on that chromosome. For example,Figure 3 shows traits and disorders that are found onchromosome 20.
Touch each chromosome pair to find the number of genesmapped on that chromosome.
Use the information you find to answer the questions below.
(a) Which chromosome pair contains the greatest number ofgenes?
(b) Which chromosome contains the fewest genes?
(c) Estimate the size of the human genome. Show how youcalculated your estimate.
www.science.nelson.com GO
Creutzfeldt-Jakob diseaseGerstmann-Straussler disease
Insomnia, fatal familialHallervorden-Spatz syndrome
Alagille syndromeCorneal dystrophy
Inhibitor of DNA binding, dominant negativeFacial anomalies syndrome
GigantismRetinoblastoma
Rous sarcomaColon cancer
GalactosialidosisSevere combined immunodeficiency
Hemolytic anemiaObesity/hyperinsulinism
Pseudohypoparathyroidism, type 1aMcCune-Albright polyostotic fibrous dysplasia
SomatotrophinomaPituitary ACTH secreting adenoma
Shah-Waardenbourg syndrome
Diabetes insipidus, neurohypophysealSRY (sex-determining region Y)McKusick-Kaufman syndromeCerebral amyloid angiopathyThrombophiliaMyocardial infarction, susceptibility toHuntington-like neurodegenerative disorderAnemia, congenital dyserythropoieticAcromesomelic dysplasia, Hunter-Thompson typeBrachydactyly, type CChondrodysplasia, Grebe typeHemolytic anemiaMyeloid tumour suppressorBreast CancerMaturity Onset Diabetes of the Young, type 1Diabetes mellitus, noninsulin-dependentGraves disease, susceptibility toEpilepsy, nocturnal frontal lobe and benign neonatal, type 1Epiphyseal dysplasia, multipleElectro-encephalographic variant patternPseudohypoparathyroidism, type IB
Figure 3 Although chromosome 20 is one of the smallest chromosomes, it has a great numberof genes.
CAREER CONNECTION
BiotechnologistBiotechnologists are involved inimproving and developingprocesses and products used inagriculture, health care, and thechemical industry. Abiotechnologist needs specializedknowledge of biochemistry,microbiology, and moleculargenetics. Find out more aboutopportunities in this field.
www.science.nelson.com GO
Ch 20_Bio_Alberta30 1/8/07 12:40 PM Page 679

680 Chapter 20 NEL
Restriction EndonucleasesRestriction endonucleases, otherwise known as restriction enzymes, are like molec-ular scissors that can cut double-stranded DNA at a specific base-pair sequence. Eachtype of restriction enzyme recognizes a particular sequence of nucleotides that is knownas its recognition site. Molecular biologists use these enzymes to cut DNA in a pre-dictable and precise way. Most recognition sites are four to eight base pairs long andare usually characterized by a complementary palindromic sequence (Table 2). Forexample, look at the restriction enzyme EcoRI. This sequence is palindromic becauseboth strands have the same base sequence when read in the 5� to 3� direction.
restriction endonuclease anenzyme that cuts double-strandedDNA into fragments at a specificsequence; also known as arestriction enzyme
recognition site a specificsequence within double-strandedDNA that a restrictionendonuclease recognizes and cuts
palindromic reading the samebackwards and forwards
sticky ends fragment ends of aDNA molecule with short single-stranded overhangs, resulting fromcleavage by a restriction enzyme
T T A G A G A T GA A A T T C A G A T T C A G A T A G C A T 3�5�
A A T C T C T A CT T T A A G T C T A A G T C T A T C G T A 5�3�
T T A G A G A T GA A A T T C A G A T T C A G A T A G C A T 3�5�
A A T C T C T A CT T T A A G T C T A A G T C T A T C G T A 5�3�
T T A G A G A T GA A A T T C A G A T T C A G A5�
A A T C T C T A CT T T A A G T C T A A G T C TT A G C A TA T C G T A
3�
5�3�
(c)
(b)
(a) EcoRI
EcoRI
EcoRI
Figure 4 Cleavage of DNA sequence usingrestriction enzyme EcoRI.(a) EcoRI scans the DNA molecule.(b) EcoRI binds to the recognition
site.(c) EcoRI cuts between the guanine
and adenine nucleotides,producing two fragments withcomplementary ends.
GAA T5�- T C-3�C T T A3�- AG-5�
G CAA T T5�- -3�C T T AA3�- G-5�
GGGC3�- CC-5�CCCG5�- GG-3�
CAGC3�- TG-5�GT CG5�- AC-3�
T T CG3�- AA-5�AAGC5�- T T -3�
T CG3�- A-5�AGC5�- T -3�
CCC G3�- GG-5�GGG C5�- CC-3�
CAGC3�- T G-5�G T CG5�- AC-3�
T T CG3�- A A-5�A AGC5�- T T -3�
T C G3�- A-5�AG C5�- T -3�
Table 2 Restriction Enzymes and Their Recognition Sites
Microorganism Enzyme Recognition After restriction of origin site enzyme digestion
Escherichia coli EcoRI
Serratia marcescens SmaI
Arthrobacter luteus AluI
Streptomyces albus Sal I
Haemophilus HindIIIparainfluenzae
Figure 4 shows the action of the restriction enzyme EcoRI. EcoRI scans a DNA mole-cule and stops when it is able to bind to its recognition site. Once bound to the site, itcuts the bond between the guanine and adenine nucleotides on each strand. At the endof each cleavage site, one strand is longer than the other and has exposed nucleotidesthat lack complementary bases. The overhangs produced by the exposed DNA nucleotidesare called sticky ends. EcoRI always cuts between the guanine and the adenine nucleotideon each strand. Since A and G are at opposite ends of the recognition site on each of thecomplementary strands, the result is the overhang, or sticky end, at each cleavage site.
www.science.nelson.com GO
DID YOU KNOW ??Maps and LibrariesRestriction endonucleases are alsoused to create genetic maps andlibraries. Go to the Nelson Web sitefor information on theseapplications.
Ch 20_Bio_Alberta30 1/8/07 12:40 PM Page 680

Molecular Genetics 681NEL
Section 20.3
Not all restriction endonucleases produce sticky ends. For example, the restrictionendonuclease SmaI produces blunt ends, which means that the ends of the DNA frag-ments are fully base paired (Table 2). Since SmaI cuts between the cytosine and gua-nine nucleotides and since these nucleotides are directly opposite each other in theircomplementary strands, the result is a blunt cut without sticky ends.
Restriction endonucleases that produce sticky ends are a generally more useful tool tomolecular biologists than those that produce blunt ends. Sticky-end fragments can bejoined more easily through complementary base pairing to other sticky-end fragmentsthat were produced by the same restriction endonuclease. However, this is not always pos-sible. To create recombinant DNA, molecular biologists choose restriction enzymes thatwill not cut in the middle of the DNA sequence of interest. For example, if the goal is tocreate recombinant DNA containing a particular gene, you would avoid using a restric-tion enzyme that cuts within the sequence of that gene.
Restriction enzymes are named according to the bacteria they come from. Generallyspeaking, the first letter is the initial of the genus name of the organism. The secondand third letters are usually the initial letters of the species name. The fourth letter indi-cates the strain, while the numerals indicate the order of discovery of that particularenzyme from that strain of bacteria.
blunt ends fragment ends of aDNA molecule that are fully basepaired, resulting from cleavage bya restriction enzyme
Learning TipRestriction enzymes are namedaccording to specific rules. Forexample, the restriction enzymeBamHI is named as follows:
• B represents the genusBacillus.
• am represents the speciesamyloliquefaciens.
• H represents the strain.• I means that it was the first
endonuclease isolated fromthis strain.
Practice1. The following sequence of DNA was digested with the restriction endonuclease Sma I:
5�-AATTCGCCCGGGATATTACGGATTATGCATTATCCGCCCGGGATATTTTAGCA-3�
3�-TTAAGCGGGCCCTATAATGCCTAATACGTAATAGGCGGGCCCTATAAAATCGT-5�
SmaI recognizes the sequence CCCGGG and cuts between the C and the G. (a) Copy this sequence into your notebook and clearly identify the location of the
cuts on it. (b) How many fragments will be produced if Sma I digests this sequence? (c) What type of ends does Sma I produce?
2. HindIII recognizes the sequence AAGCTT and cleaves between the two A’s. Whattype of end is produced by cleavage with HindIII?
3. Explain why restriction endonucleases are considered to be molecular tools.
4. Copy the following sequence of DNA into your notebook. Write out thecomplementary strand. Clearly identify the palindromic sequences by circling them.
GCGCTAAGGATAGCATTCGAATTCCCAATTAGGATCCTTTAAAGCTTATCC
MethylasesMethylases are enzymes that can modify a restriction enzyme recognition site by addinga methyl (—CH3) group to one of the bases in the site (Figure 5). Methylases are impor-tant tools in recombinant DNA technology. They protect a gene fragment from being cutin an undesired location.
Like restriction enzymes, methylases were first identified in bacterial cells. Methylasesare used by a bacterium to protect its DNA from digestion by its own restriction enzymes.In bacteria, restriction enzymes provide a crude type of immune system. In fact, theterm restriction comes from early observations that these enzymes appeared to restrictthe infection of E. coli cells by viruses known as bacteriophages. The restriction enzymesbind to recognition sites in the viral DNA and cut it, making it useless. Eukaryotic cellsalso contain methylases. However, in eukaryotes methylation usually occurs in order toinactivate specific genes.
methylase an enzyme that adds amethyl group to one of thenucleotides found in a restrictionendonuclease recognition site
G A
CH3
C TA T T CT A A G
CH3
Figure 5At a methylated EcoRI site, EcoRIrestriction enzyme is no longer ableto cut.
The First Restriction EnzymeThe first restriction endonuclease,HindIII, was identified in 1970 byHamilton Smith at John HopkinsUniversity. Smith received theNobel Prize in 1978 for hisdiscovery. Since then, more than2500 restriction endonucleaseshave been identified.
DID YOU KNOW ??
Ch 20_Bio_Alberta30 1/8/07 12:40 PM Page 681

682 Chapter 20 NEL
DNA LigaseTo create recombinant DNA, pieces of DNA from two sources must be joined together.Using restriction enzymes and methylases, molecular geneticists can engineer fragmentsof DNA that contain the specific nucleotide sequences they want. These segments ofDNA are then joined together by DNA ligase. If two fragments have been generated usingthe same restriction enzyme, they will be attracted to each other at their complementarysticky ends. Hydrogen bonds will form between the complementary base pairs. DNA ligasethen joins the strands of DNA together (Figure 6).
A G C A GA T C G A C A T G C AT C G T C A G C TT G T A C G T
3�
5�
5�
DNA ligase
A G C A GA A A T T C A T AT C G T C A G C TT G T A T
3�
5�
A G C A GA T C G A C A T G C A
T C G T C A G C TT G T A C G T
3�
5�
3�
5�
3�
5�
3�
HindIII fragment
EcoRI fragment(c)
(b)
(a)
DNA ligase
Figure 6 DNA ligase is able to joincomplementary sticky endsproduced by the same restrictionenzyme via a condensation reaction.(a) Complementary sticky ends
produced by HindIII(b) Hydrogen bonds form between
complementary bases. DNAligase creates bonds betweennucleotides in the DNAbackbones.
(c) If fragments are notcomplementary, then hydrogenbonds will not form.
Taq DNA Polymerase and the Polymerase Chain ReactionIn 1985, American scientist Kary Mullis invented a biotechnology technique called thepolymerase chain reaction (PCR). PCR allows scientists to make billions of copies ofpieces of DNA from extremely small quantities of DNA. The reaction depends on the spe-cial property of Taq polymerase. In nature, Taq DNA polymerase is found in the bacteriumThermos aquaticus, which lives at extremely high temperatures. Like all the DNA poly-merases, Taq DNA polymerase synthesizes DNA during replication. As you have learnedpreviously, enzymes have an optimum temperature range in which they function. Oneadaptation that allows Thermos aquaticus to survive at high temperatures is that its DNApolymerase is stable at much higher temperatures than DNA polymerases from otherorganisms. Mullis used the heat-stable property of Taq polymerase in his PCR technique.
To prepare for PCR, the following materials are placed together in a small tube: Taqpolymerase, the DNA to be copied, a large quantity of the four deoxynucleotides (A, T,G, and C), and short primers. The tube is then inserted into a PCR machine. PCR involvesfour simple steps (Figure 7).
polymerase chain reaction (PCR)a technique for amplifying a DNAsequence by repeated cycles ofstrand separation and replication
DID YOU KNOW ??Eukaryotic MethylationMethylases in eukaryotes areconnected with the control oftranscription. In addition,approximately 2 % of mammalianribosomal RNA is methylated after itis transcribed.
initial DNA sample
single-strandedDNA templates
1.
2.
3.
4.heat
cool primer
complementary DNA copy
Figure 7Steps in the PCR1. The mixture is heated to a temperature high enough to break the hydrogen bonds in the
double helix of the DNA and separate the strands. This forms single-stranded DNAtemplates.
2. The mixture is cooled, and the primers form hydrogen bonds with the DNA templates. 3. Taq polymerase synthesizes a new stand of DNA from the DNA template by
complementary base pairing, starting at each primer. 4. The cycle of heating and cooling is repeated many times.
Ch 20_Bio_Alberta30 1/8/07 12:40 PM Page 682

Molecular Genetics 683NEL
Each PCR cycle doubles the number of DNA molecules. After just 10 cycles there are210 (over two million) copies of the DNA template. Since scientists can use PCR to syn-thesize many identical copies from a very small sample of DNA, this technology has ledto many advances in medicine, evolutionary biology, genetic engineering, and forensicscience. Mullis was awarded the Nobel Prize in Chemistry in 1993 for his invention.
Section 20.3
vector a vehicle by which foreignDNA may be introduced into a cell
transgenic a cell or an organismthat is transformed by DNA fromanother species
plasmid a small double-strandedcircular DNA molecule found insome bacteria
Figure 8Chromosomal and plasmidDNA coexist in many bacteria.
plasmid DNA(several thousandbase pairs each)
circular chromosomalDNA (4 million base pairs)
bacterialcell
Purpose Design AnalysisProblem Materials EvaluationHypothesis Procedure SynthesisPrediction Evidence
To perform this investigation, turn to page 696.
Restriction Enzyme Digestion ofBacteriophage DNAUsing restriction enzymes and electrophoresis, molecularbiologists are able to excise and isolate target sequences fromDNA. How would the banding patterns compare if the samefragment of DNA were digested with different restrictionenzymes? In this investigation, you will conduct electrophoresis of
bacteriophage DNA that has been digested with restrictionenzymes.
INVESTIGATION 20.2 Introduction Report Checklist
Transformation So far, you have seen that mapping and sequencing can be used to identify the relativeposition and nucleotide sequence of genes in a DNA molecule. Using various enzymes,scientists can isolate DNA fragments containing a gene or genes. Multiple copies of thefragment can be prepared using PCR. The DNA fragment may also be joined (annealed)to other DNA fragments.
In genetics, transformation is any process by which foreign DNA is incorporated intothe genome of a cell. A vector is the delivery system used to move the foreign DNA intoa cell. The specific vector used for transformation is chosen based on the size and sequenceof the foreign DNA fragment, the characteristics of the cells to be transformed, and thegoal of the transformation. The goal of most genetic transformation is to express thegene product(s), and so change the traits of the organism that receives the foreign DNA.An organism with foreign DNA in its genome is said to be transgenic.
Transformation of BacteriaBacteria are the most common organisms that are transformed by molecular biologists.Transgenic bacteria may be used to study gene expression or gene function, to createand maintain a stock of a particular DNA fragment, or to synthesize a useful geneproduct. For example, transgenic bacteria have been engineered to produce humangrowth hormone, used in the treatment of pituitary dwarfism.
The first stage of transformation for any organism is to identify and isolate the DNAfragment that is to be transferred. The DNA fragment is then introduced into the vector.Plasmids are small, circular, double-stranded DNA molecules that occur naturally in thecytoplasm of many bacteria (Figure 8). Plasmids are commonly used as vectors for bac-terial transformation. A plasmid contains genes, and it is replicated and expressed inde-pendently of the large bacterial chromosome. There can be many copies of a plasmid ina single bacteria cell and, under certain conditions, plasmids can pass through the cellmembrane.
Figure 9, on the next page, is a diagram of the basic steps in producing transgenicbacteria. First, both the plasmid vector and the DNA containing the desired sequence arecut by the same restriction enzyme(s). In this example, both DNA molecules are cut byEcoRI, generating sticky ends. The cut plasmid and DNA fragment are then mixedtogether and incubated with DNA ligase. This produces recombinant plasmids that
Ch 20_Bio_Alberta30 1/8/07 12:40 PM Page 683

684 Chapter 20 NEL
contain the foreign DNA fragment. The bacterial cells are then treated to open pores inthe cell membrane, which allows them to take up the recombinant plasmid. Once a bac-terium has been transformed, it makes many copies of the recombinant plasmid, eachof which includes a copy of the foreign DNA. This is often called gene cloning since thebacterium produces many identical copies (clones) of the original DNA fragment.
However, not all the bacterial cells will take up the recombinant plasmid. How can ascientist or technician distinguish between bacteria with a plasmid and those without?Plasmids used for transformation experiments often carry genes for antibiotic resistance,which can then be used to select for transformed bacteria. By growing the bacteria inmedium that contains the antibiotic, any cells that do not contain a plasmid are killed off.Individual bacteria cells are then grown into colonies so that the plasmid DNA can be iso-lated from the cells and checked to make sure it contains the desired foreign DNA sequences.
For this transformation procedure to be successful, the plasmid DNA must have onlyone recognition site for the restriction enzyme that is used, or else it would be cut intoa number of useless pieces. Naturally occurring plasmids do not always have a singleappropriate restriction enzyme site, so scientists have engineered plasmids especiallyfor transformation. Most of these engineered plasmids contain a multiple-cloning site,which is a single region that contains unique recognition sites for an assortment ofrestriction enzymes. The recognition sites are positioned very close together and are notfound anywhere else on the plasmid’s DNA sequence.
Vectors other than plasmids may also be used to transform bacteria, including virusesand small inert particles that are literally fired into the cells.
multiple-cloning site a region in a vector that is engineered tocontain the recognition site of anumber of restriction enzymes
circular plasmid DNA
1. Plasmid DNA is cut open atEcoRI recognition site, producingEcoRI sticky ends.
2. DNA ligase joins fragmentand plasmid.
Gene fragment to be inserted is cut out from source using EcoRI; therefore, it hasEcoRI sticky ends.
recombinant DNA
3. Plasmid is introduced intobacterial cell.
bacterialchromosome
plasmid withforeign gene
EcoRI
Figure 9 A foreign gene is introduced into aplasmid. The plasmid is now anexample of recombinant DNA,which can be introduced into abacterial cell to produce numerouscopies of the gene.
DID YOU KNOW ??Plasmids: Beneficial GuestsJapanese scientists were the first todiscover plasmids that carry genesfor multiple drug resistance. Thebacterium Shigella, which causesdysentery, developed resistance toas many as four antibiotics,including tetracycline, streptomycin,chloramphenicol, and thesulfonamides. The multidrugresistance was due to a plasmidwithin the bacterium that carriedgenes for resistance and could bepassed naturally from bacterium tobacterium.
How to Make cDNAOne way to make copies of aparticular gene is to use anenzyme called reversetranscriptase. This enzymesynthesizes DNA from mRNA. Theresulting molecule is called copyDNA or cDNA. The cDNA canthen be transferred into a vectoror a cell.
www.science.nelson.com GO
EXTENSION +
Ch 20_Bio_Alberta30 1/8/07 12:40 PM Page 684

Molecular Genetics 685NEL
Section 20.3
WEB Activity
Case Study—Transformation of EukaryotesThe first transgenic animal and the first transgenic plant were both produced in 1982. Theanimal was a mouse that contained the gene for growth hormone from a rat. The plant was atobacco plant that contained a gene from a bacterial cell. The introduced gene produced anantibiotic in the plant’s cells that protected the plant from bacterial infection. Since then, manytransgenic animals and plants have been produced.
Producing transgenic eukaryotes is a lot more complex than the transformation of bacteria,and new techniques are still being developed. In this activity, you will find out about one technique used to create transgenic eukaryotes.
www.science.nelson.com GO
DNA and BiotechnologySUMMARY
Table 3 Key Tools of Molecular Biology
Tool Use Example
restriction bacterial enzyme that cuts DNA BamHI recognition site:endonuclease sequences at a specific recognition site
DNA sequence before cleavage:
DNA sequence after cleavage with BamHI:
methylase enzyme that adds a methyl group to BamHI methylase adds methyl group (�CH3) torecognition sites to protect DNA from second guanine nucleotide in the recognition site: cleavage by restriction enzyme
DNA sequence no longer cleaved by BamHI
methyl group changes recognition site
DNA ligase enzyme that joins DNA fragments by DNA fragments before subjection to DNA ligase:creating bonds between nucleotides in the DNA backbone
DNA fragments after subjection to DNA ligase:
two fragments are joined
plasmid small circular DNA that has the ability plasmid containing multiple-cloning site, ampicillin-resistance gene, to enter and replicate in bacterial cells and other restriction enzyme sitesand, therefore, can be used as a vector tointroduce new genes into a bacterial cell
HindIII
BamHI
amprSma I
multiple-cloning site
GGA T5�- CC-3�CC T A3�- GG-5�
T CAGCGGA T CCCA5�- T -3�AGT CGCC T AGGG3�- T A-5�
T CAGCG GA T CCCA5�- T -3�AGT CGCC T AG GG3�- T A-5�
GGA T5�- CC-3�CC T A3�- GG-5�
A T AGTG AA T T CG5�- G-3�T A T CAC T T AA G3�-
5�-3�- CC-5�
-3�-5�
A T AGTGAA T T C5�- G-3�T A T CAC T T AAG
GC3�- C-5�
Ch 20_Bio_Alberta30 1/8/07 12:40 PM Page 685

686 Chapter 20 NEL
Section 20.3 Questions1. Define restriction endonuclease and methylase.
2. Restriction endonucleases are found in many species ofbacteria.(a) Describe their role and function in a bacterial cell. (b) How does the role of restriction endonucleases in
nature differ from the role of restriction endonucleasesin the laboratory setting?
3. Distinguish between blunt ends and sticky ends.
4. Define recognition site. Using examples to support youranswer, depict the palindromic nature of recognition sites.
5. Restriction enzymes cut at recognition sites that areusually six to eight base pairs in length. Provide reasonswhy a 2-base-pair recognition site would be too short tobe useful and a 14-base-pair recognition site may be toolong to be useful in the field of genetic engineering.
6. Sketch a diagram that summarizes the process ofpolymerase chain reaction (PCR). Clearly label theimportant features.
7. Explain why the Human Genome Project’s initial years werespent developing techniques that would sequence largerDNA strands efficiently. (Hint: The human genome containsapproximately three billion base pairs.)
8. As a scientist working for a pharmaceutical company, youare asked to engineer bacteria that will produce humangrowth hormone. The objective is commercial production inorder to treat individuals who are deficient in this hormone.Describe the steps you would take in order to produce thishormone.
9. Transformation technology is used in agriculture to creategenetically modified organisms (GMOs) that contain usefultraits. This is a controversial technology, however. Somepeople think that GMOs pose unacceptable environmentalor health risks. The Government of Canada has setregulations that must be met for approval of GMOs. Usingthe Internet and other resources, research the regulationsthat have been put into place. Do you feel these guidelinesare adequate? What modification would you make to theseguidelines if you could? Explain the implications of theguidelines that have been set.
Extension
10. In order to create recombinant DNA containing the desired sequences, scientists have developed a numberof procedures to find and isolate DNA, and to confirmwhether a transgenic organism contains the foreign DNA.Go to the Nelson Web site to find out how the techniquesof electrophoresis, Southern blotting, and Northern blottingwork and when they are used. Then, summarize theinformation in a chart or another appropriate format.
11. PCR can be used to create a DNA “fingerprint” that canidentify an individual. This technique has been applied toforensics. In some well-known cases, such as that of GuyPaul Morin, PCR has been used to overturn convictionsmade before the technology was available. In June 2000,the Government of Canada passed the DNA IdentificationAct, which gave the Royal Canadian Mounted Police theright to create and maintain a database of DNAfingerprints. Conduct research on the use of PCR toidentify individuals. Then, use this information to prepare aconvincing argument for or against the requirement thatanyone accused of a serious crime must supply police witha DNA sample.
www.science.nelson.com GO
www.science.nelson.com GO
www.science.nelson.com GO
Ch 20_Bio_Alberta30 1/8/07 12:40 PM Page 686

Molecular Genetics 687NEL
20.420.4Mutations and Genetic VariationMutations are changes in the sequence of the DNA molecule and are the source of newgenetic variation that may be acted on by natural selection. A beneficial mutation givesan organism a selective advantage and tends to become more common over time, leadingto new evolutionary changes. A harmful mutation reduces an individual’s fitness andtends to be selected against. Harmful mutations occur at low rates in a species. Somemutations are neutral, having neither a benefit nor a cost, and are not acted on by nat-ural selection.
As scientists gained more knowledge about the nature of DNA and the genetic code,they were able to more fully understand mutations. Point mutations are changes in asingle base pair of a DNA sequence. They may or may not change the sequence of aminoacids. Gene mutations change the amino acids specified by the DNA sequence, and theyoften involve more than a single base pair. Figure 1 summarizes the DNA changes that occurin some common types of mutation.
Learning TipReview how mutationscontribute to the variability ofspecies and how naturalselection acts on mutations inChapter 6 of this book.
Met Asn Pro Thr stop
U UG C C C CA A A A AA A C
Met
silent mutation
nonsense mutation deletion mutation (entire codon)
missense mutation insertion mutation
deletion mutation
normal mRNA strand
Asn Pro Thr stop
U U UG C C C CA A A AA A C
Met Asn Pro Pro stop
U UG C C C C CA A A AA A C
Met stop
U UUG C C C CA A A A AA A
A
Met Asn Pro His
U UG C C C
C
A A A AA A C
stopMet
U UUG C C C CA A A AA A C
Met Pro Thr stop
U UGA AA A ACC C C
AA
C
mRNA 5� 3�
protein
Asn
5� 3�5� 3�
5� 3�5� 3�
5� 3�5� 3�
Figure 1A summary of different types of mutations that may occur in a DNA sequence, affecting thetranscribed RNA sequence.
point mutation a mutation at aspecific base pair
gene mutation a mutation thatchanges the coding for amino acids
Ch 20_Bio_Alberta30 1/8/07 12:40 PM Page 687

688 Chapter 20 NEL
One type of point mutation, called a silent mutation, has no effect on the operationof the cell. In the silent mutation example in Figure 1, the codon for threonine haschanged from ACA to ACU. However, this mutation does not change the amino acidbecause both these codons code for threonine. Most silent mutations occur in the non-coding regions, so they do not affect protein structure.
A missense mutation arises when a change in the base sequence of DNA alters acodon, leading to a different amino acid being placed in the polypeptide. Sickle cellanemia is the result of a missense mutation. Another type of point mutation is a non-sense mutation. A nonsense mutation occurs when a change in the DNA sequencecauses a stop codon to replace a codon specifying an amino acid. During translation,only the part of the protein that precedes the stop codon is produced, and the fragmentmay be digested by cell proteases. Nonsense mutations are often lethal to the cell. Missenseand nonsense mutations arise from the substitution of one base pair for another.
An example of a gene mutation is a deletion, which occurs when one or morenucleotides are removed from the DNA sequence. In the deletion mutation example inFigure 1, on the previous page, a cytosine nucleotide has been deleted. This changes thethird codon from CCC to CCA, but the amino acid does not change because both CCCand CCA code for proline. However, the deletion also causes a change in the fourthcodon, from ACA to CAU. This does affect the amino acid, changing it from threonineto histidine. Such shifts in the reading frame usually result in significant changes to theprotein.
Another way that a shift in the reading frame can occur is by the insertion of anucleotide. Since the DNA sequence is read in triplets of nucleotides, inserting an extranucleotide will cause different amino acids to be translated, similar to a deletion muta-tion. When a mutation changes the reading frame, it is called a frameshift mutation.Insertions and deletions can both cause frameshift mutations. A deletion or insertion oftwo nucleotides will also result in a shift of the reading frame; however, a deletion orinsertion of three nucleotides does not have this effect. Instead, the insertion or deletionof three nucleotides results in the addition or removal of one amino acid.
Another category of mutations involves large segments of DNA and is seen at thechromosomal level. Translocation is the relocation of groups of base pairs from onepart of the genome to another. Usually translocations occur between two nonhomolo-gous chromosomes. A segment of one chromosome breaks and releases a fragment,while the same event takes place on another chromosome. The two fragments exchangeplaces, sometimes disrupting the normal structure of genes. When unrelated genesequences come together and are transcribed and translated, the result is a fusion pro-tein with a completely altered function, if any. Some types of leukemia are associatedwith translocations and their respective fusion proteins.
Finally, an inversion is a section of a chrosome that has reversed its orientation inthe chromosome (has turned itself around). There is no gain or loss of genetic material,but, depending on where the inversion occurs, a gene may be disrupted.
Causes of Genetic MutationsSome mutations are simply caused by error of the genetic machinery and are known asspontaneous mutations. For example, DNA polymerase I occasionally misses a base ortwo, which results in a point mutation. Mutations may also arise from exposure to mutagenic agents. These are induced mutations. Some examples of mutagenic agentsinclude ultraviolet (UV) radiation, cosmic rays, X-rays, and certain chemicals.
insertion the placement of an extranucleotide in a DNA sequence
frameshift mutation a mutationthat causes the reading frame ofcodons to change
translocation the transfer of afragment of DNA from one site inthe genome to another location
inversion the reversal of a segmentof DNA within a chromosome
spontaneous mutation a mutationoccurring as a result of errors madein DNA replication
mutagenic agent an agent thatcan cause a mutation
induced mutation a mutationcaused by a chemical agent orradiation
silent mutation a mutation thatdoes not result in a change in theamino acid coded for
missense mutation a mutationthat results in the singlesubstitution of one amino acid inthe polypeptide
nonsense mutation a mutationthat converts a codon for an aminoacid into a stop codon
deletion the elimination of a basepair or group of base pairs from aDNA sequence
Ch 20_Bio_Alberta30 1/22/07 2:47 PM Page 688

Molecular Genetics 689NEL
Section 20.4
Gene Mutations and CancerCancer is considered a genetic disease because it is alwaysassociated with a mutation in the genetic sequence. However,many different things can alter DNA, including viruses andvarious environmental factors (Figure 2).
Case StudyCase Study
normal mouse cells (growing in tissue culture) into cancerouscells. The cancer-causing genes, called oncogenes, seemed toturn on cell division. In their noncancerous state, oncogenesare usually referred to as proto-oncogenes. Proto-oncogenesmay remain inactive or may perform some useful functionuntil they are triggered to become active oncogenes. Evidencesuggests that activation occurs in a number of steps, so asingle “hit” (mutation) does not immediately result incancerous cell divisions.
Further studies indicate that cancer-causing oncogenes arepresent in normal strands of DNA. But if oncogenes are foundin normal cells, why do normal cells not become cancerous?One current theory that has gained acceptance from thescientific community suggests that the cancer gene has beentransposed (moved) to another gene site. Such transpositionsmay have been brought about by environmental factors ormutagenic chemicals or other agents.
Genes that direct the assembly of amino acids into proteinsare referred to as structural genes. Genes called regulatorgenes act like a switch to turn “off” segments of the DNAmolecule, so that a gene is active only when and where itsgene product is needed. In very simple terms, when amutagen causes the oncogene to become separated from itsregulator gene, the cell may then be unable to turn the gene"off" (Figure 3). This causes the cell to continue to divide atan accelerated rate.
32 %
30 %
10 %
7 %
5 %10 %
3 % 1 %2 %
tobacco
diet
viruses
environment
alcohol
sunlight
STDs
food additives
unknown
Figure 2Estimates of risk factors for cancer calculated in percentages.Lifestyle choices related to diet and smoking can be linkedwith over 60 % of cancer cases.
Viruses inject foreign genetic information into cells,disrupting the DNA that codes for cell division. Some virusesthat are linked to sexually transmitted diseases are known tocause cancer. For example, women who have humanpapillomavirus (HPV) have a greater incidence of cancer.Environmental factors have been linked to other types ofcancer. Skin cancer, for example, has been linked withultraviolet radiation from the Sun. Exposure to harmfulchemicals in our environment can also cause cancer. Anumber of cancer-causing substances can be found incigarettes.
Whatever the initial cause, scientists agree that all cancersare related to mutations. Usually, it takes more than onemutation to trigger a malignant growth. This is why cancerusually occurs more frequently in older people.
Two lines of evidence indicate that cancer results frommutations. First, cancer cells often display nitrogen basesubstitution, or the movement of genetic material from onepart of the chromosome to another. Second, many knownmutagens are also known to cause cancer. X-rays, ultravioletradiation, and mutagenic chemicals can induce cancer.
In 1982, molecular biologists were able to provide additionalevidence to support the hypothesis that cancer could betraced to genetic mutations. Segments of chromosomesextracted from cancerous mice were used to transform
DNA molecule
regulator genestructural gene
DNA molecule broken apart
regulator genestructural gene
radiation
enzymes repair DNA molecule
Figure 3Mutagenic agents may cause the separation of the regulatorand structural genes. If the structural gene codes for a proteininvolved in controlling cell division, this separation can lead tocancer.
Ch 20_Bio_Alberta30 1/8/07 12:40 PM Page 689

690 Chapter 20 NEL
Inferring Relationships from DNA SequencesAt one time, scientists could compare and classify species based only on their mor-phology and behaviour. For example, Charles Darwin found evidence for the theory ofevolution by comparing anatomical features of different species (see Chapter 6). Today,biologists can compare the genetic makeup of different species for evidence of rela-tionships among them.
Phylogeny is the proposed evolutionary history of a group of organisms, or of aspecies. Overall, species that are closely related will share very similar DNA sequences,while those that are more distantly related will have more genetic differences. For example,you might expect that the sequence of DNA in a house cat’s genome would have moresimilarities to that of a lion than to a sparrow. As we have seen, the DNA of any organismcan mutate. Natural selection acts on beneficial and harmful mutations in a popula-tion, changing the relative proportions of these mutations that are passed on from gen-eration to generation. The genomes of two species with a recent common ancestor wouldhave had less time and opportunity for mutations to accumulate and be selected, and sowe can predict that they would show fewer differences.
Mutations do not occur only in genomic DNA. Nuclear DNA is often quite a largegenome, so for some research it is more efficient for scientists to examine the changes inthe smaller genomes of mitochondria or chloroplasts. In particular, mitochondrial DNA(mtDNA) can be used to trace inheritance through the maternal line in mammals, as theegg is the only source of the mitochondria that are passed on to new offspring.
Mitochondrial DNA has also provided some fascinating clues about the evolutionaryhistory of modern humans. Two theories are proposed to explain the current distribu-tion of humans around the world. One proposes that modern humans, Homo sapiens,evolved simultaneously in different regions of the world from an earlier species, Homoerectus. This theory is called the multiregional model and proposes that the differentethnic groups observed worldwide today would have begun their evolution to Homosapiens between one and two million years ago. According to this model, the groupsinterbred to some degree, and so didn't form into different species. The second theory,called the monogenesis model, proposes that Homo species moved out of Africa twice:first as Homo erectus, and second as Homo sapiens between 100 000 and 200 000 yearsago, and that modern ethnic groups are all descendants of the second migration.
Mitochondrial DNA analyses for a variety of individuals, representing the ethnicgroups found around the world, seem to support the monogenesis model. The greatestvariety of mtDNA mutations exist in African ethnic groups, which is consistent withthe theory that mutations accumulate over time and that the population that has existedthe longest will demonstrate the largest accumulation of mutations. Additionally, themtDNA from ethnic groups on continents other than Africa were traced back to Africarather than to each other.
The most common oncogene, ras, is found in 50 % of coloncancers and 30 % of lung cancers. Present in normal cells, rasmakes a protein that acts as an “on” switch for cell division.Ras ensures that cells divide to replace damaged or deadcells. After a sufficient number of cells have been produced,the ras gene should be turned off. But the cancer-causingoncogene produces a protein that blocks the “off” switch.With the switch left on, cell division goes on continuously.
Case Study Questions
1. Why do many scientists believe that certain viruses causecancer?
2. How does sunlight cause cancer?
3. List three environmental carcinogens and suggest apossible source for each.
4. Distinguish between oncogenes and proto-oncogenes.
5. Explain how oncogenes are activated.
6. What is the ras gene?
phylogeny proposed evolutionaryhistory of a species or group oforganisms
Learning TipLab Exercise 5.A in Chapter 5shows an example of howdifferences in genomic DNAsequences provide evidence forthe relationships amongvarious species.
DID YOU KNOW ??The RomanovsMitochondrial DNA was used toidentify the suspected remains ofthe imperial Romanov family inRussia, who were murdered by theBolsheviks in 1918. To do so,mitochondrial DNA from PrincePhilip of England, a close relative ofthe former Tsarina Alexandrathrough his maternal side, wascompared to mitochondrial DNArecovered from the remains,resulting in positive identificationand the resolution of an 80-year-oldmystery.
Ch 20_Bio_Alberta30 1/8/07 12:40 PM Page 690

Molecular Genetics 691NEL
Section 20.4
Interspersed ElementsOther DNA analyses focus on intervening sequences inserted into DNA. For example,SINEs (short interspersed elements) and LINEs (long interspersed elements) are oftenassociated with the genes of retroviruses within the genome and are thought to havebeen inserted by those viruses. SINEs and LINEs are often located in areas of the DNAthat appear to be noncoding regions. That is, the DNA in these areas does not code forone of the known gene products of that species. Although the function of the DNA inthese regions is not known, it is inherited; therefore, changes to these DNA sequences,such as insertions, are passed to succeeding generations.
If two species have the same SINE or LINE located at precisely the same position intheir DNA, it can be assumed that the insertion occurred only once in a common ancestor.SINEs and LINEs make ideal markers for tracing evolutionary pathways. They are easyto find and identify, even if they undergo small mutational changes, because they arerelatively large and recognizable segments of DNA often hundreds of base pairs in length.The possibility of a mutation reverting to an older form is extremely remote, as thechances of a SINE or LINE being inserted in exactly the same location in two differentspecies is highly unlikely.
SINEs repeated DNA sequences300 base pairs long that alternatewith lengths of DNA sequencesfound in the genomes of higherorganisms
LINEs repeated DNA sequences5000 to 7000 base pairs long thatalternate with lengths of DNAsequences found in the genomes ofhigher organisms
Purpose Design AnalysisProblem Materials EvaluationHypothesis Procedure SynthesisPrediction Evidence
Looking for SINEs of Evolution
In this activity, you will use DNA sequences to predict andchart phylogenetic relationships among species.
Suppose you find a pattern in the noncoding SINE DNA oftwo different species, and do not find that pattern in otherspecies. Evolution can explain the situation by saying that thetwo species recently had a common ancestor, and that bothspecies inherited this pattern from their ancestor. The pre-dicted family tree is shown in Figure 4.
sections of DNA that appear to be homologous.These homologous sequences have been alignedvertically so that similarities and differences can beeasily seen and colours are used to highlight thosenucleotides that are not matches (Figure 6).
LAB EXERCISE 20.B Report Checklist
Time
species A lacks the SINE
species B inherits the SINE
commonancestor
species ofA, B, and C
Xspecies C inherits the SINE
commonancestorspecies
of B and C
Figure 4X indicates the time when the SINE became inserted into thegenome. Since the SINE insertion occurs only once, at time X,the size and precise location of the SINE will be identical inspecies B and C.
GA T AG C G C G T AA A A T GGZA A T AG T T A A AGA T T A C G C A T A A A T A CY
XW
SpeciesSpeciesSpeciesSpecies
A A T AG C G C G T AA A A T AGGA T AG C G C G T AA A A A AG
Figure 5Sequenced DNA fragments from four distantly relatedspecies
Figure 6DNA sequences from Figure 5 aligned for comparison.Note that spaces appear in the sequences only to facilitatecomparisons.
GA T AGAZ-A A T AG T T A A AGA T T A C G C A T A A A T A CY-
X-W-
A A T AGAGA T AGA
C G C G T A A A T GG
C G C G T A A A T AGC G C G T A A A A AGSpecies
SpeciesSpeciesSpecies
Part I: Looking for a SINE
Procedure I1. Examine the hypothetical DNA code from four
different species (Figure 5). These species have large
Ch 20_Bio_Alberta30 1/8/07 12:40 PM Page 691

692 Chapter 20 NEL
The single nucleotide differences have most likelyresulted from point mutations, while the nine-nucleotide segment in species Y is probably theresult of an insertion. (Note that this is much morelikely than the alternative possibility—that each ofthe other species experienced an identical deletionevent in its past.) The type of pattern observed inspecies Y often results from a SINE or LINEinsertion.
2. Copy the DNA sequences in Figure 7 into yournotebook. Align the homologous sections vertically.
3. Use a highlighter to colour all positions that have thesame nucleotide in all four species.
4. Use a different colour to highlight the SINEinsertion.
Analysis and Evaluation I(a) Identify any nucleotide differences in the SINE
sequences. Explain how these differences might haveoccurred.
(b) Identify whether mutations that occur within theSINE are likely to be harmful, beneficial, or neutral.Explain.
(c) Based on the data alone, construct a chart similar toTable 1 showing the phylogenetic relationship ofthese species.
Part II: Evolution Displayed by SINEs and LINEs
Procedure II5. Study the data in Table 1. DNA sequencing was used
to document the presence or absence of interspersedelements A through I in five mammals. Camels areincluded as the outgroup.
6. Use the data to construct a chart showing thephylogenetic relationships between these mammals.Clearly indicate the relative positions at which eachinsertion most likely occurred.
Analysis and Evaluation II(d) Are whales more closely related to cows or
hippopotamuses? Explain your rationale.
(e) Identify which insertion happened first: A or B?Explain your reasoning.
Synthesis(f) Explain whether pigs and camels are more closely
related than hippopotamuses and camels.
(g) What must be true about the genomes of all whalespecies (i.e., which SINEs must they all contain)?Explain your rationale.
(h) A researcher interested in the evolution of whaleswants to know whether orcas are more closely relatedto white-sided dolphins or to pilot whales. Describe away to answer this question.
LAB EXERCISE 20.B continued Table 1 Molecular Evidence for the Evolution of Whales*
Group SINE or LINE
A B C D E F G H I
cow � � � � � � � � �
pig � � � � � � � � �
whale � � � � � � � � �
deer � � � � � � � � �
hippopotamus � � � � � � � � �
camel � � � � � � � � �
+ indicates presence of element - indicates absence of element* Data modified from Nikaido 1999
P A A T T G C T T C G TA A T T T T C GA AQ A C T T G C T T C G TA A T T A AG C T G
S A C T T G C T A C G TA A T T A AG C C GR
SpeciesSpecies
SpeciesSpecies A T T T G C T T C G TA T T T T T C GA A
T T G C C C C G C T A A AG C G C T T T AG CT T G C G T A A AG T T AG T A C GA A T T G C
T T G C G T A A AG T T AGGA C GA A T C G CT T G C C C C G C T A A AG C G C T T T AG C
C C C G CC G C T T T AGG T GA AG
C A C G CC G C T T GAGG T GA C G
Figure 7Homologous DNA sequences from four species
Ch 20_Bio_Alberta30 1/8/07 12:40 PM Page 692

Molecular Genetics 693NEL
Section 20.4
Mutations and Genetic VariationSUMMARY
Table 2 Types of Mutations
Category Type
point mutation substitution
AAG CCC GGC AAAAAG ACC GGC AAA
deletion
AAG CCC GGC AAAAAC CCG GCA AA
insertion
AAG CCC GGC AAAAAG ACC GGG CAA A
chromosomal translocation
chromosome 1 5� AAATTCG GCACCA 3�chromosome 2 5� TAGCCC AAGCGAG 3�
chromosome 1 5� TAGCCC GCACCA 3�chromosome 2 5� AAATTCG AGCGAG 3�
inversion
normal chromosome 5� AATTGGCCATA ATATGAA AAGCCC 3�3� TTAACCGGTAT TATACTT TTCGGG 5�
after inversion 5� AATTGGCCATA TTCATAT AAGCCC 3�3� TTAACCGGTAT AAGTATA TTCGGG 5�
Result
missense mutation
only one amino acid substituted
frameshift mutation
can result in many differentamino acids substituted or a stopcodon read (nonsense mutation)
inactivation of gene iftranslocation or inversion iswithin a coding segment
• In mammals, mitochondrial DNA can be used to trace inheritance through thematernal lineage.
• Comparisons of DNA sequences can provide detailed phylogenetic relationshipsby revealing the specific changes in the genetic makeup of species andpopulations.
• SINEs and LINEs provide excellent inheritable markers for tracing the evolutionof species’ lineages.
Ch 20_Bio_Alberta30 1/8/07 12:40 PM Page 693

694 Chapter 20 NEL
Section 20.4 Questions1. Clearly define the following terms and give an example of
each: mutation, frameshift mutation, point mutation,nonsense mutation, missense mutation.
2. Explain why mutations, such as insertions or deletions, areoften much more harmful than nitrogen-base substitutions.
3. Which of two types of mutations, nonsense or missense,would be more harmful to an organism? Explain youranswer using your knowledge of protein synthesis.
4. Identify three factors that can produce gene mutations.
5. Identify the type of mutation that has occurred in thestrands below. Describe the effect on the protein. Theoriginal strand is
AUG UUU UUG CCU UAU CAU CGU
Determine whether or not the following mutations wouldbe harmful to an organism. Translate the mRNA sequenceinto protein to help you decide. The mutation is indicatedin red.
(a) AUG UUU UUG CCU UAU CAU CGUAUG UUU UUG CCU UAC CAU CGU
(b) AUG UUU UUG CCU UAU CAU CGUAUG UUU UUG CCU UAA CAU CGU
(c) AUG UUU UUG CCU UAU CAU CGUAUG UUU CUU GCC UUA UCA UCG U
(d) AUG UUU UUG CCU UAU CAU CGUAUG UUU UUG CCU AUC AUC GU
(e) AUG UUU UUG CCU UAU CAU CGUUGC UAC UAU UCC GUU UUU GUA
6. Which of the following amino acid changes can result froma single base-pair substitution?(a) arg to leu (b) cys to glu (c) ser to thr(d) ile to ser
7. Explain why a food dye that has been identified as achemical mutagen poses greater dangers for a developingfetus than for an adult.
8. List three changes that can be made to your personallifestyle that would reduce the odds of a mutation takingplace.
9. Explain how mutations may be of benefit to an organism,and describe how these beneficial mutations are maintainedin a species. Identify the biological process that influenceswhich mutations stay in a population over time.
10. Both mitochondria and chloroplasts contain their owngenomes, which are separate from the nuclear genome. TheDNA in mitochondria and chloroplasts have been used asevidence for the endosymbiotic theory of the evolution ofeukaryotic organisms. This theory was developed by theAmerican scientist Dr. Lynn Margulis. According to thistheory, mitochondria and chloroplast arose from bacteriaand algae cells that became engulfed by another cell withwhich they had a symbiotic relationship. Over time, thebacteria and algae became a part of the other cell. Evidenceof this theory can be found by comparing the DNA ofmitochondria with bacteria, and of chloroplasts with algae.Go to the Nelson Web site to learn more about the theory ofendosymbiosis, and summarize the DNA evidence thatsupports it.
Extension
11. The mutation that causes sickle cell anemia involves thesubstitution of the amino acid valine for the amino acidglutamic acid. Research the structure of valine andglutamic acid and, with your knowledge of chemistry,hypothesize why this substitution results in a largeconformational change for the hemoglobin protein. Listother amino acids that could have been substituted insteadof valine that may not have caused such serious sideeffects. List amino acids that are similar to glutamic acidthat would probably cause similar side effects.
www.science.nelson.com GO
Ch 20_Bio_Alberta30 1/8/07 12:40 PM Page 694

Chapter 20 INVESTIGATIONS Chapter 20
Protein Synthesis andInactivation of Antibiotics
In this investigation, you will examine the effects of ampi-cillin on two types of bacteria. E. coli MM294/pAmp con-tains a gene insert that directs the synthesis of a protein thatinactivates ampicillin, whereas E. coli MM294 does not.Ampicillin inhibits bacterial growth by interfering with cellwall biosynthesis. Based on your knowledge of protein syn-thesis, make a prediction about the survival of E. coliMM294/pAmp and E. coli MM294 on ampicillin-rich media.
ProblemWhat effect does the presence of an ampicillin-resistance genein a bacterium have on its growth on ampicillin-rich media?
Materialsapron masking tape safety goggles permanent marker gloves inoculating loop10 % bleach Bunsen burner2 LB agar plates MM294 culture2 LB � ampicillin MM294/pAMP culture
(LB/amp) plates 37 °C incubator
Wear safety goggles at all times.
Wear gloves when performing the experiment.Disposable latex gloves are best avoided sinceallergic reactions to latex have been widely reported.Disposable polyethylene, PVC, or neoprene glovesare recommended.
Wipe down all surfaces with 10 % bleach before andafter the laboratory exercise.
All resulting cultures must be immersed in 10 %bleach before disposal to ensure sterilization.
Do not leave a lit Bunsen burner unattended. Referto Appendix C2 for a review of the safe use of aBunsen burner.
Wash your hands thoroughly at the end of thelaboratory.
Procedure1. Put on your safety goggles and gloves, and wipe
down your bench with a 10 % bleach solution.
2. Obtain two LB plates and two LB/amp plates fromyour teacher.
3. Label the bottom of each plate with your name andthe date, using a permanent marker.
4. Label both of the LB plates “� amp” for the E. coliMM294 cells. Label both of the LB/amp plates “�
amp” for the E. coli MM294/pAMP cells.
5. Hold your inoculating loop like a pencil and sterilizeit in the nonluminous flame of the Bunsen burneruntil it becomes red hot. Cool the sterilized loop bytouching it to the edge of the agar on one of the LBplates.
6. Using the sterilized loop, pick up one colony of E. coliMM294 from a start culture plate. Glide theinoculating loop across an LB agar plate, making surenot to gouge the agar (Figure 1).
Purpose Design AnalysisProblem Materials EvaluationHypothesis Procedure SynthesisPrediction Evidence
INVESTIGATION 20.1 Report Checklist
Figure 1Pattern of streaking on an agar plate
7. Resterilize your loop as directed in step 5.
8. Repeat step 6 with E. coli MM294 streaked on anLB/amp plate.
9. Resterilize your loop as directed in step 5.
10. Repeat step 6 with E. coli MM294/pAmp streaked onthe other LB plate.
11. Resterilize your loop as directed in step 5.
12. Repeat step 6 with E. coli MM294/pAmp streaked onthe other LB/amp plate.
13. Sterilize and cool your inoculating loop.
14. Place all four streaked plates in a stack and tape themtogether. Seal the edges of your plates with maskingtape.
15. Place the streaked plates upside down in theincubator. Alternatively, if you do not have anincubator, place the plates in a warm part of theroom for a couple of days.
Molecular Genetics 695NEL
Ch 20_Bio_Alberta30 1/8/07 12:40 PM Page 695

16. Disinfect your laboratory bench using the bleachsolution.
17. Wash your hands thoroughly with soap and water.
Analysis(a) After sufficient time has elapsed, remove your plates
from the incubator and note any changes.
Never open the plates, as any bacterial colonieswithin are a potential source of contamination. Ifcondensation has accumulated on one side of aplate, try looking through its bottom to observe thecolonies you may have cultured. Once theexperiment has been completed, flood plates withbleach to kill the bacterial colonies that have beencultured. Alternatively, place plates in an autoclavebefore they are disposed.
Evaluation(b) Compare your results to your prediction. Explain any
possible causes for variation.
INVESTIGATION 20.1 continued (c) What evidence is there to indicate that protein wassynthesized by the bacteria?
(d) Why was it important to streak out both types ofbacteria on both types of plates?
(e) This experiment contains both positive and negativecontrols. Identify them. What information do thecontrols provide in this experiment?
(f) Why was it important to cool the inoculating loopbefore obtaining a bacterial colony from a stock plate?
(g) Why was it important to resterilize the inoculatingloop between transfers of bacteria?
(h) Suggest possible sources of error in this procedureand indicate their effect on the results.
Synthesis(i) E. coli strains containing the genetic sequence pAmp
are resistant to ampicillin. Research how theampicillin can be deactivated by �-lactamase, theprotein coded for by the ampicillin-resistance gene.
(j) Predict what would happen if there was an error inthe genetic sequence that codes for �-lactamase.
Restriction Enzyme Digestion ofBacteriophage DNA
In this investigation, bacteriophage lambda DNA will bedigested using the restriction endonucleases EcoRI, HindIII,and BamHI. The fragments produced will be separated usinggel electrophoresis. Fragment sizes will be calculated from ananalysis of the agarose gel. Bacteriophage lambda DNA isobtained from a virus that infects bacterial cells and is 48 514base pairs in length.
Before you begin, predict the number and size of the DNAfragments you will obtain, using the restriction enzyme sitemap shown in Figure 1 on the next page.
ProblemHow do the patterns of DNA fragments compare when a pieceof DNA is digested using different restriction endonucleases?
Materialssafety gogglesgloves70 % ethanol solution (or 10 % bleach)4 1.5 mL Eppendorf tubeswaterproof pen for labellingmasking tapepolystyrene cupfreezercrushed ice20 �L of 0.5 �g/�L lambda DNA5 �L 10� restriction buffer1.0–20 �L micropipette with tips2 �L each of BamHI, EcoRI, and HindIII restriction
endonucleases
Purpose Design AnalysisProblem Materials EvaluationHypothesis Procedure SynthesisPrediction Evidence
INVESTIGATION 20.2 Report Checklist
696 Chapter 20 NEL
Ch 20_Bio_Alberta30 1/8/07 12:40 PM Page 696

Chapter 20
microcentrifuge (optional)37 °C water baththermometer1 g agarosepaper boatelectronic balance500 mL Erlenmeyer flask250 mL graduated cylindermicrowave or hot plateflask tongs or oven mittsgel casting tray and gel electrophoresis box 1L 1� TBE buffer5 �L loading dyepower supply (45 V)plastic wrap25–30 mL 0.025 % methylene blue, or enough to cover the
gel in the staining traylight box or overhead projectoracetate sheet
Wear safety goggles at all times.
Wear gloves when performing the experiment.
Wipe down all surfaces with 70 % ethanol, or 10 %bleach, before and after the laboratory exercise.
Do not use ethanol near a heat source.
Wash your hands thoroughly at the end of thelaboratory.
ProcedureDay 1: Restriction Enzyme Digestion
1. Put on your safety goggles and gloves, and wipedown your bench with a 70 % ethanol solution (or 10 % bleach).
INVESTIGATION 20.2 continued
Table 1 Reagents to Add to Tubes
Tube DNA 10� Water BamHI EcoRI HindIII(�L) buffer (�L) (�L) (�L) (�L)
(�L)
BamHI 4 1 4 1 � �
EcoRI 4 1 4 � 1 �
HindIII 4 1 4 � � 1
control 4 1 5 � � �
Ethanol is highly flammable. Make sure that anyflame on your desk or near it is turned off before use.
2. Label four 1.5 mL Eppendorf tubes “BamHI,”“EcoRI,” “HindIII,” and “control.” Place the tubes in apolystyrene cup containing crushed ice. Table 1outlines the amount of reagents to add to each tube.To keep track of each tube’s contents, copy the tableinto your notebook and check off each reagent as youadd it to the tube.
3. Read down each column, adding the same reagent toall appropriate tubes. Use a fresh tip on themicropipette for each reagent. Add the 4 �L of DNAto each tube first, followed by the 10� reactionbuffer, and then the water. Make sure you add theenzyme last. Dispense all the contents close to thebottom of the Eppendorf tubes. Ensure that thepipette tip is touching the side of the tubes whendispensing the contents. Keep everything on ice at alltimes.
4. Close the Eppendorf tube tops. Place the tubes in themicrocentrifuge, close it, and spin at maximum speedfor approximately 3 s. If you do not have access to amicrocentrifuge, then just tap the tubes on a soft pador thick paper towel on the bench, pooling thecontents to the bottom.
Molecular Genetics 697NEL
0
5 505
EcoRI EcoRI EcoRI EcoRI EcoRI
31 747 34 499 39 168 41 732
48 500
23 132
21 22622 346
HindIII HindIIIHindIII
BamHI BamHI BamHI BamHI BamHI
37 49536 895
44 97244 141
27 479
25 15726 104
27 972 37 584
Figure 1Restriction enzyme map of bacteriophage lambda DNA
Ch 20_Bio_Alberta30 1/8/07 12:41 PM Page 697

When using the microcentrifuge:
• Do not open the centrifuge until it stops completely.
• If the centrifuge tubes are smaller than the metalholder or holes, use the proper adaptor to accommodate them.
• Do not unplug the centrifuge by pulling on thecord. Pull the plug.
5. Place the tubes in a 37 °C water bath for a minimumof 45 min. Use a thermometer to check thetemperature of the water.
6. Once the digestion is complete, place the tubes inthe polystyrene cup and put the cup in a freezer untilyour next class. Make sure you have labelled your cupwith your name.
Day 2: Gel Electrophoresis
7. Measure 0.96 g of agarose powder in a paper boat onan electronic balance and transfer to a 500 mLErlenmeyer flask.
8. Use a graduated cylinder to add 125 mL of 1� TBEbuffer and swirl to mix.
9. Heat the flask on a hot plate or in a microwave untilthe solution is completely clear. Handle carefully,using tongs or oven mitts. Make sure you weargoggles and a lab coat.
If the agarose gets too hot it may bubble over. Besure to observe your Erlenmeyer flask throughoutthe heating process. If the agarose solution starts to bubble up the neck of the flask, remove it immediately from the heat source using an ovenmitt or tongs. Handle all hot glassware with caution.
10. Prepare the gel casting tray. Depending on your gelelectrophoresis unit, you may have to tape the gelcasting tray. Ensure that the plastic comb is insertedproperly.
11. Once the flask with agarose solution is cool enoughto handle with bare hands, pour the mixture into thegel casting tray. The comb teeth should be immersedin about 6 mm of agarose. The gel should cover onlyabout one-third of the height of the comb teeth. Usea micropipette tip to remove bubbles from the gel assoon as it is poured.
INVESTIGATION 20.2 continued 12. Allow the agarose to set for a minimum of 20 min.The gel will become cloudy as it solidifies.
13. Once the gel has set (you may test this by gentlytouching the lower righthand corner with yourfinger), flood the gel with 1� TBE running bufferand then pull out the comb gently without rippingany of the wells.
14. Orient the tray containing the gel in the gelelectrophoresis box so that the wells made by thecomb are at the end with the positive electrode.
15. Add 1� TBE buffer to the gel electrophoresis boxuntil the buffer is approximately 5 mm above the gel.Place the gel electrophoresis box to the side.
16. Add 1 �L of loading dye to each of the Eppendorftubes. Microfuge for 3 s.
17. Micropipette the full contents of one Eppendorf tubeinto a well on the gel. Do the same for each tube. Besure to record the order in which you dispense thetubes. Steady the micropipette over each well usingboth hands.
18. Close the gel box and connect it to the power supply.If you are using a gel box that you made, set thevoltage to 45 V dc and turn it on. Electrophoresefor 12 h. Alternatively, if you have a stronger powersupply or a store-bought electrophoresis unit,electrophorese at 110 V for 2.5 h.
When using the power supply:
• Be sure the grounding pin in the power supply isnot broken.
• Pull the plug, not the cord, when unplugging thepower source.
• Do not let the wire leads connected to the electricpower supply or batteries touch each other.
19. Unplug the power supply and carefully remove thegel. Wrap the gel in plastic wrap and place it in therefrigerator for a maximum of one day.
Day 3: Staining the Gel
20. Unwrap the gel and place it in the staining tray.
21. Flood the gel with 0.025 % methylene blue solution.Let the gel sit in the solution for at least 20 to 25 min. Pour off the water and replace it with freshwater. Repeat this process three more times. Keep aneye on the intensity of the DNA bands. If you destainfor too long, you may lose the smaller fragments.
698 Chapter 20 NEL
Ch 20_Bio_Alberta30 1/8/07 12:41 PM Page 698

Chapter 20
If you do not destain for long enough, the whole gelremains blue and the fragments cannot bedifferentiated.
22. Place the destained gel on a light box or on anoverhead projector.
23. Obtain a blank acetate sheet or plastic wrap andplace it over the gel. Trace the pattern of bands ontothe wrap or sheet. Be sure to draw a line where thebottom of each well starts.
Evidence(a) Carefully measure the distance in millimetres that each
band migrated from the well origin. Copy Table 2 intoyour notebook and use it to record the distances.
Analysis(b) Using the HindIII digestion as a marker, plot the
distance travelled (x-axis) versus the fragmentbase-pair size (y-axis) on semilogarithmic paper.Please note that the 23 130-base-pair fragment andthe 27 491-base-pair fragment do not resolve, butinstead travel as one band. Therefore, take an averageof their size for graphing purposes.
(c) Using interpolation, determine the fragment size ofthe bands produced by digestion with BamHI andEcoRI. Enter your calculated base-pair fragment sizesinto your table.
INVESTIGATION 20.2 continued (d) Compare the calculated base-pair fragments to theactual base-pair fragments. Use the restriction enzymemap of bacteriophage lambda (Figure 1) todetermine the size of the actual band fragments foreach enzyme. Calculate the percentage error.
Evaluation(e) What was the purpose of each tube? of the control?
(f) Why do the smaller bands migrate faster than thelarger bands?
(g) Some bands that are close in size migrate together.What measures may be taken to resolve bands closein size?
(h) What purpose does the 1� running buffer serve?
(i) Why must the gel be made using 1� TBE buffer?
(j) During electrophoresis, bubbles are produced at theanode and at the cathode. Explain why bubbles appear.
(k) Why must loading dye be added to the samplesbefore they are loaded into the wells of the gel?
(l) Notice on your gel that the larger fragments arestained darker than the smaller fragments. Explainwhy this is the case.
(m) Suggest possible sources of error in this procedure.Indicate the effects of these sources of error on theresults.
Table 2 Distance Travelled by Each Band From the Well Origin
HindIII EcoRI BamHI
Actual Distance Actual Distance Calculated Actual Distance Calculatedfragment travelled fragment travelled fragment fragment travelled fragment
size (mm) size (mm) size size (mm) size
27 491
23 130
9 416
6 557
4 361
2 322
2 027
Molecular Genetics 699NEL
Ch 20_Bio_Alberta30 1/8/07 12:41 PM Page 699

Chapter 20 SUMMARY
700 Chapter 20 NEL
Outcomes
Knowledge• describe, in general, how genetic information is contained in
the sequence of bases in DNA molecules in chromosomes;how the DNA molecules replicate themselves; and how thegenetic information is transcribed into sequences of basesin RNA molecules and is finally translated into sequences ofamino acids in proteins (20.1, 20.2)
• explain, in general, how restriction enzymes cut DNAmolecules into smaller fragments and how ligasesreassemble them (20.3)
• explain, in general, how cells may be transformed byinserting new DNA sequences into their genomes (20.3)
• explain how a random change (mutation) in the sequenceof bases results in abnormalities or provides a source ofgenetic variability (20.4)
• explain how sequences of nucleic acids contained in thenucleus, mitochondria, and chloroplasts gives evidence forthe relationships among organisms of different species byexamining similarities and differences in base sequences(20.4)
STS • explain that science and technology have both intended and
unintended consequences for humans and the environment(20.3, 20.4)
• explain that scientific research and technologicaldevelopment help achieve a sustainable society, economy,and environment (20.3, 20.4)
Skills • ask questions and plan investigations (20.4)
• conduct investigations and gather and record data andinformation (20.2, 20.3, 20.4)
• analyze data and apply mathematical and conceptualmodels to develop and assess possible solutions (20.2, 20.4)
• work as members of a team and apply the skills andconventions of science (all)
Key Terms
20.1
20.2
complementary base pairing
antiparallel
DNA replication
semiconservative replication
template
DNA helicase
DNA polymerase III
leading strand
lagging strand
DNA polymerase I
DNA ligase
gene expression
ribonucleic acid (RNA)
transcription
messenger RNA (mRNA)
translation
RNA polymerase
promoter
template strand
termination sequence
codon
start codon
stop codon
ribosome
transfer RNA (tRNA)
anticodon
recombinant DNA
genetic transformation
restriction endonuclease
recognition site
palindromic
sticky ends
blunt ends
methylase
polymerase chain reaction(PCR)
vector
transgenic
plasmid
multiple-cloning site
point mutation
gene mutation
silent mutation
missense mutation
nonsense mutation
deletion
insertion
frameshift mutation
translocation
inversion
spontaneous mutation
mutagenic agent
induced mutation
phylogeny
SINEs
LINEs
20.3
20.4
MAKE a summary
1. Starting with the title “The Human Genome,” produce aflowchart that illustrates the flow of information fromgene to protein. Include as many key concepts aspossible.
2. Revisit your answers to the Starting Points questions atthe beginning of the chapter. Would you answer thequestions differently now? Why?
Ch 20_Bio_Alberta30 1/8/07 12:41 PM Page 700

Molecular Genetics 701NEL
Chapter 20
UNIT 30 C PERFORMANCE TASKInvestigating Human TraitsIn this Performance Task, you will use the skills you gainedin this Unit to design and carry out a correlational study onhuman traits to determine if they are autosomal or sex-linked. Go to the Unit 30 C Performance Task link on theNelson web site to complete the task.
www.science.nelson.com GO
Cracking the Code of LifeIn this NOVA video, follow corporate and academic scientists asthey race to capture one of the biggest prizes in scientifichistory: the complete, letter-by-letter sequence of geneticinformation that defines human life—the human genome.
www.science.nelson.com GO
EXTENSION +
Artificial LifeScientists can now synthesize strands of DNA with anynucleotide sequence they want. Does this mean that they cancreate artificial life from these blueprints? Some scientistsbelieve the answer is yes, and that it isn’t that far away! Find outwhy by watching this NOVA video.
www.science.nelson.com GO
EXTENSION +
Golden Rice or Frankenfood?Vitamin A deficiency is a leading cause of preventableblindness. Scientists have developed a genetically-modified ricethat contains β-carotene, the precursor to vitamin A. Some seethis new rice as an important contribution to world health, butothers warn that genetically modified foods could have hiddendangers. What do you think?
www.science.nelson.com GO
EXTENSION +
Go To
The following components are available on the Nelson Web site. Follow the links for Nelson Biology Alberta 20–30.
• an interactive Self Quiz for Chapter 20
• additional Diploma Exam-style Review Questions
• Illustrated Glossary
• additional IB-related material
There is more information on the Web site wherever you seethe Go icon in the chapter.
www.science.nelson.com GO
DNA MotorsDr. Vanessa Auld, Quirks and Quarks genetics columnistexplains the details behind the discovery by a group ofAmerican and Czech researchers of proteins that act like small motors inside the nucleus of the cell. This discovery is changing our understanding of how DNA is used tomanufacture the proteins and chemicals the cell uses tosustain life.
www.science.nelson.com GO
EXTENSION +
Ch 20_Bio_Alberta30 1/8/07 12:41 PM Page 701

Chapter 20 REVIEW
702 Chapter 20 NEL
Many of these questions are in the style of the DiplomaExam. You will find guidance for writing Diploma Exams inAppendix A5. Science Directing Words used in DiplomaExams are in bold type. Exam study tips and test-takingsuggestions are on the Nelson Web site.
DO NOT WRITE IN THIS TEXTBOOK.
Part 1
1. Identify the DNA sequence that would result inphenylalanine being placed in a polypeptide chain.A. UUGB. AACC. UUUD. TTT
2. Identify the term that best describes the mutation thatcauses the loss of phenylalanine.A. silent mutationB. insertion mutationC. deletion mutation D. missense mutation
3. Gene therapy trials to correct this defect in the CFTR genehave been conducted by doctors in several centres. Thefollowing is a list of some genetic technologies that mightbe used in this work:
1. restriction endonucelases2. mtDNA3. polymerase chain reaction4. DNA ligase5. viruses6. bacterial plasmids7. gene sequencing
Identify the technologies that would most likely be used toisolate the gene for a therapy trial. (Record all four digits ofyour answer in the order in which the technologies wouldbe used.)
4. Identify the enzyme that is correctly matched with itsfunction.A. DNA polymerase I: synthesis of the continuous
matching strandB. DNA helicase: synthesis of messenger RNAC. DNA polymerase III: cuts out the primer and replaces
it with DNA nucleotidesD. DNA ligase: links adjacent nucleotides together by
covalent bond
5. Select the response that correctly identifies thecomplementary DNA strand for this strand: 5�-TACTTTGGCCCAGAG-3�A. 3�-AUGAAACCGGGUCUC-5�B. 3�-UACUUUGGCCCAGA-5�C. 3�-ATGAAACCGGGTCTC-5�D. 5�-ATGAAACCGGGTCTC-3�
Use the following information to answer questions 1 to 3.
The cause of cystic fibrosis has been identified as a variety ofmutations to the CFTR gene on chromosome 7. The mostcommon of these involves the loss of three nucleotides, whichin turn results in the loss of a phenylalanine at amino acidposition 508. Use the following information to answer questions 6 and 7.
1. Amino acids are brought to the ribosome and linkedtogether in the correct order.
2. A copy of the gene is taken to the ribosome.
3. RNA polymerase attaches to the promoter site.
4. The two subunits of the ribosome attach to the RNA strand.
5. DNA polymerase III makes a matching strand usingcomplementary base pairs.
6. Release factor binds to the A site and the ribosomereleases the amino acid chain.
7. The two original strands serve as templates for thesynthesis of new matching stands.
8. The lagging strand is synthesized in short fragments.
9. The two strands are unwound and the hydrogen bonds arebroken.
6. Identify the steps described above that correspond to theprocess of replication. (Record all four digits of your answerin the order the steps would occur in the cell.)
7. Match these terms to the selection above that bestdescribes them. (Record all four digits of your answer.)
________ ________ ________ ________
initiation of termination elongation initiation oftranscription of translation of amino translation
acid chain
www.science.nelson.com GO
NR
NR
NR
Ch 20_Bio_Alberta30 1/8/07 12:41 PM Page 702

Molecular Genetics 703NEL
Part 28. Use a diagram to illustrate how the two DNA strands in a
double helix run antiparallel. Make sure you label yourdiagram.
9. How does the fact that DNA replicates semiconservativelydecrease the possibility of errors made during DNAreplication? Describe another mechanism that minimizesDNA replication error.
10. Numerous enzymes are involved in DNA replication.Outline the role that the following enzymes play: DNAligase, DNA gyrase, DNA helicase, DNA polymerase I, andDNA polymerase III.
11. What is the complementary strand of AATTGCATA?
12. DNA polymerase III can only extend an existing DNAstrand in the 5� to 3� direction. Describe the mechanismsin place that compensate for DNA polymerase III’s inabilityto intitiate a strand and for its stringent directionality.
13. One strand of a DNA molecule contains the nucleotideproportions 15 % adenine (A), 30 % thymine (T), 20 %guanine (G), and 35 % cytosine (C). Predict theproportions of the four base pairs in the double-strandedform of this DNA.
14. Describe the function of mRNA and tRNA in proteinsynthesis.
15. Distinguish between transcription and translation. Use atable to organize your answer.
16. The following is a sequence of DNA for a hypotheticalpeptide: 5�- AAGTACAGCAT - 3�3�- TTCATGTCGTA - 5�Translate this sequence into protein using the genetic code.
17. Every codon consists of a triplet of base pairs. Explain whyamino acids cannot be coded with just two base pairs.
18. Describe how the structure of mRNA is similar to DNA.How does mRNA differ from DNA?
19. Cutting a piece of DNA with a restriction enzyme can giveDNA fragments with sticky ends or with blunt ends,depending on the restriction enzyme that is used. Write aunified response addressing the following aspects ofcutting DNA with a restriction enzyme:• Distinguish between sticky ends and blunt ends.• Describe how a DNA fragment with a sticky ends could
be produced. • Describe how a DNA fragment with blunt ends could
be produced. • Illustrate your descriptions with diagrams.
20. The DNA fragment CGTCATCGATCATGCAGCTC contains arestriction enzyme recognition site. Identify the site.
Chapter 20
21. Explain how the presence of an antibiotic-resistance markergene in a plasmid can be used to determine whether atransformation protocol has been successful.
22. Recently, the Human Genome Project (HGP) wascompleted. The HGP has provided us with a completesequence of the human genome. Despite this greatadvancement, we are far away from realizing the numerousmedical treatments that will eventually be made availablebecause of, or as a result of, the project. Scientists are nowworking on the Human Proteome Project, which involveslinking genes to both functional and dysfunctional proteins.Explain why there would be limited progress in medicalresearch if scientists were restricted to working only withDNA sequences and not with proteins.
23. Pseudomonas syringae is a bacterium found in raindropsand most ice crystals. These bacteria act as nuclei for icecrystal formation, catalyzing ice formation at temperaturesapproaching 0 °C. It does so by producing an ice-nucleation protein in the outer membrane of its cells.Researchers have been able to cleave the gene for thisprotein from its genome, thereby preventing the bacteriafrom forming ice crystals. When the genetically engineered“ice-minus” bacteria are sprayed on tomato plants, frostdamage is reduced. The presence of the ice-minus bacteriacan extend growing seasons, thus increasing crop yields,especially in cold climates. However, environmental groupshave raised serious concerns about releasing geneticallyengineered bacteria into the environment. Write a unifiedresponse addressing the following aspects of the use ofice-minus bacteria:• Predict whether the new microbes could gain a
selective advantage over the naturally occurring species? • Describe what might happen if the genetically
engineered microbes mutate? • Do you think that genetically engineered microbes
should be introduced into the environment? Justify youropinion.
Use the following information to answer questions 24 to 26.
Huntington disease is an inherited disorder that manifestsitself in abnormal body movements and memory loss thatdegenerates into dementia and cognitive decline. This disorderis caused by a codon repeat in the Huntington protein gene onchromosome 4. In the normal form of this gene there are fewerthan 40 repeats of the codon CAG. More repeats result in theeventual onset of the disease and severity seems to increasewith the number of repeats.
DE
DE
Ch 20_Bio_Alberta30 1/8/07 12:41 PM Page 703

704 Chapter 20 NEL
24. Identify the amino acid specified by the CAG codon.
25. Explain what increased inclusions of the CAG codon in theHuntington gene might do to the protein structure of theHuntington protein.
26. Describe the steps a lab would take to diagnose thenumber of CAG repeats on the Huntington gene of anindividual. Identify the specific technologies and describehow they would be used in this analysis.
29. Identify the technique listed above that would bestdetermine paternal inheritance of Aboriginal ancestry.Explain your selection.
30. Sketch a diagram of meiosis that shows the formation of ahuman egg. Label the important features and clearly labelthe ploidy of the key stages. Describe how mtDNA isinherited during the formation of the human zygote, andidentify which parent would be contributing the geneticmarkers for Aboriginal ancestry if they were identified inmtDNA.
31. Identify and describe two DNA technologies that wouldbe used to carry out these tests.
32. Identify two advantages and two disadvantages to bothsociety and individuals that might arise from using DNAtechnology to trace ethnic patterns of inheritance.
Use the following information to answer questions 27 and 28.
The first recombinant DNA organisms were bacteria that werealtered for commercial purposes to produce a protein productwhen grown in culture. These recombinant organisms causedlittle public concern, as they were perceived to be containedwithin a laboratory or factory. However, subsequent geneticengineering projects have included the release of engineeredorganisms into the environment. Agricultural transgenicproducts being grown today include golden rice, insect-resistant maize and cotton, and herbicide-resistant canola andcorn, to name a few.
Use the following information to answer questions 29 to 32.
A company, Gene Tree, offers kits that can be used to testwhether an individual has DNA sequences found most often inthe Aboriginal peoples. The tests are compared to knowngenetic markers in mitochondrial DNA (mtDNA), Ychromosome DNA, and nuclear DNA that are unique to theAboriginal peoples of North America. Testing to establish theethnic background of individuals may raise concerns about theuse of this information. Historically, there have been political,legal, and moral issues around attempts to identify anindividual’s ethnicity as distinct from those of others.
27. Identify and describe the technologies used to createthese recombinant organisms.
28. Explain the concerns of those who oppose the use ofthese organisms, and the benefits touted by theirproponents.
DE
DE
DE
Ch 20_Bio_Alberta30 1/8/07 12:41 PM Page 704

Unit 30 C REVIEW
Molecular Genetics 705NEL
Unit 30 C
Many of these questions are in the style of the DiplomaExam. You will find guidance for writing Diploma Exams inAppendix A5. Science Directing Words used in DiplomaExams are in bold type. Exam study tips and test-takingsuggestions are on the Nelson Web site.
DO NOT WRITE IN THIS TEXTBOOK.
Part 11. Indicate the correct order, beginning with prophase, of the
following events of cell division.1. Nuclear membrane begins to dissolve.2. Chromatids move to opposite poles.3. Chromosomes align along the equatorial plate.4. Chromosomes reach opposite poles and begin to
lengthen.
2. A fertilized mosquito egg has six chromosomes. Duringmitosis, the egg cell undergoes multiple divisions. Whichrow shows the correct number of chromosomes found intelophase and interphase?
Number of chromosomesRow Telophase InterphaseA. 3 3B. 3 6C. 6 3D. 6 6
3. Identify the phases of cell division in Figure 1.
________ ________ ________ ________prophase metaphase anaphase telophase
4. The correct labels for the structure identified by letters inFigure 1 areA. W = centriole, X = centromere, Y = cytoplasm,
Z = nucleolusB. W = centromere, X = spindle fibre,
Y = division plate, Z = nuclear membraneC. W = chromatid, X = centromere,
Y = nuclear membrane, Z = nucleolusD. W = chromosome, X = spindle fibre,
Y = chromatin, Z = nuclear membrane
5. Identify the row that correctly gives the dominant traits,according to this data.
Row Seed colour Cob type Leaf sizeA. white large smallB. white small largeC. yellow small smallD. yellow large large
6. Identify the row that correctly gives the expected traits ofthe offspring, if a plant from the F1 generation were cloned.
Row Seed colour Cob type Leaf sizeA. white large smallB. white small largeC. yellow small smallD. yellow large large
7. If a plant from the F1 generation were crossed with a cornplant with white seeds, identify the colour seeds you wouldexpect to see in the F2 generation.A. 100 % of individuals would have white seedsB. 75 % of individuals would have yellow seeds and 25 %
white seedsC. 50 % of individuals would have white seeds and 50 %
yellow seedsD. 100 % of individuals would have yellow seeds
Use the following information to answer questions 3 and 4.
Figure 1 shows four phases of cell division in a plant cell.
Use the following information to answer questions 5 to 7.
A corn plant with white seeds, a large cob, and small leaves iscrossed with a corn plant with yellow seeds, a large cob, andlarge leaves. All of the F1 offspring have yellow seeds, largecobs, and large leaves.
stage 1 stage 2
W
X
stage 3 stage 4
Y
Z
Figure 1
www.science.nelson.com GO
NR
NR
Ch 20_Bio_Alberta30 1/8/07 12:41 PM Page 705

706 Unit 30 C NEL
9. Identify the row that best describes the type of mutationand its consequence to the structure of the protein.
Row Mutation ConsequenceA. insertion causes a shift to the reading
frame and results in anentirely different amino acidsequence
B. deletion causes a shift to the readingframe and results in anentirely different amino acidsequence
C. substitution causes a different aminoacid at one location
D. inversion causes different amino acidsfor the sequence inverted asreading frame is reversed
10. Select the statement that best describes the codons givenin the description of thalassemia.A. These are mRNA codons as they contain the base
uracil.B. These are mRNA codons as they contain the base
thyamine.C. These are DNA codons as they contain the base
uracil.D. These are DNA codons as they contain the base
thymine.
Use the following information to answer questions 9 and 10.
Thalassemia is a serious human genetic disorder that causessevere anemia. People with thalassemia die before sexualmaturity. There are over 90 different mutations that can lead tothalassemia. One of the mutations changes the codon TAC toTAA.
Use the following information to answer questions 11 and 12.
1. Initiation commences when the RNA polymerase binds tothe promoter region of the gene to be transcribed.
2. The ribosome continues to move along the mRNA, readingthe code in triplets known as codons.
3. When the ribosome moves over, the tRNA containing thegrowing peptide is shifted over to the P site. A third aminoacid, specified by the third codon, is brought into the A siteby the next tRNA. A peptide bond is formed between thesecond and third amino acid.
4. A complementary RNA strand is synthesized in thedirection of 5� to 3�, using one strand of DNA as atemplate. This step is known as elongation. Thecomplement of adenine in RNA is uracil.
5. New amino acids are added to the chain in the process ofelongation, which continues until a stop codon is read inthe A site. The stop codons are UAG, UGA, and UAA. Atthis point, the ribosome stalls.
6. Once the termination sequence is reached by the RNApolymerase, the process ceases. The mRNA is separatedfrom the DNA and the RNA polymerase falls off the DNAmolecule.
7. When the start codon is in the P site, a tRNA delivers theamino acid methionine. The tRNA recognizes the codonbecause of the complementary anticodon.
11. Identify the statements that describe the process oftranscription. (Record all three digits of your answer in theorder in which they would occur in the cell.)
12. Identify the statements that describe the process oftranslation. (Record all four digits of your answer in theorder in which they would occur in the cell.)
8. Correctly match the cell number in Figure 2 with thecondition. (Record all four digits of your answer.)
________ ________ ________ ________Turner’s trisonomic will not trisonomic
syndrome female survive male
XX XY
XX
normal female
nondisjunction normalmeiosis
normal male
X Y
XXX XO OY XXY
1 2 3 4
Figure 2
NR
NR
NR
Ch 20_Bio_Alberta30 1/8/07 12:41 PM Page 706

Cell Division, Genetics, and Molecular Biology 707NEL
Unit 30 C
Use the following information to answer questions 13 to 15.
Genetic inheritance of risk for certain types of breast cancerhas long been inferred from its incidence in family clusters.Mutations in either the BRCA1 or BRCA2 genes accounts for2 % to 3 % of breast cancers and 9 % of ovarian cancers.People who are identified as having a mutation in either ofthese genes have a 60 % to 85 % lifetime risk of getting breastcancer and a 15 % to 40 % lifetime risk of getting ovariancancer. The gene BRCA1 is located on chromosome 17 andcodes for approximately 1800 amino acids, while the geneBRCA2 is located on chromosome 13 and codes forapproximately 3400 amino acids.
13. Select the statement that is supported by these data.A. Mutations in the BRCA1 and BRCA2 genes are
inherited in an autosomal recessive pattern.B. Mutations in the BRCA1 and BRCA2 genes always
cause breast cancer and sometimes cause ovariancancer.
C. Mutations in the BRCA1 and BRCA2 genes causecancer when influenced by environmental factors.
D. Mutations in the BRCA1 and BRCA2 genes alwayscause ovarian cancer and sometimes cause breastcancer.
14. Determine the minimum number of base pairs a BRCA2gene would contain to code for a complete protein.(Record all four digits of your answer.)
15. Identify which of the following statements about BRCA1and BRCA2 gene mutations is incorrect:A. A woman’s risk for genetically linked breast cancer is
only elevated if the maternal branch of her family hada history of breast cancer.
B. Mutations in the BRCA genes also increase the risk ofovarian cancer.
C. Women without mutations in the BRCA genes may stillbe at high risk of getting breast cancer.
D. A woman’s lifetime risk of genetically linked breastcancer is elevated if there is a family history of breastcancer in either branch of her family.
Part 216. Genetic testing to identify mutations of the BRCA1 and
BRCA2 genes can be accomplished by gene cloning.Explain why a patient might or might not want to havesuch genetic tests done.
17. Determine the total time for which cells were in eachphase, for both whitefish and frog cells.
18. Identify the phase of the cell cycle that took the longesttime to complete, for both whitefish and frog cells.
19. Sketch the cell cycle for the fertilized whitefish and frogeggs.
NR
Use the following information to answer questions 17 to 19.
A student observed fertilized eggs of two different species,whitefish and frog, undergoing mitosis. The number of cells ineach stage of the cell cycle, at the time the egg masses wereprepared and mounted on a slide, were counted. Thesenumbers are presented in Table 1.
Use the following information to answer questions 20 to 22.
Cancer cells can divide at rates that far exceed those of normalcells. Some drugs used to treat cancer block the action ofenzymes that are essential for chromosomal duplication.
Table 1 Number of Cells in Specific Stages of the Cell Cycle
Cell cycle stage Whitefish Frog
interphase 81 88
prophase 10 6
metaphase 5 5
anaphase 1 0
telophase 3 1
20. Why would these drugs be useful in treating cancer?
21. Predict the phase of the cell cycle that would likely beaffected by these drugs.
22. Predict the phase of mitosis that might be affected.
23. Approximately 25 plant species make up about 90 % of thehuman diet. Some scientists have speculated that globalwarming will reduce plant diversity, making us even moredependent on these species. Our ability to maintain ourfood supply under these conditions would requireadvances in genetic engineering, selective breeding, andcloning of plants. Describe ways in which thesetechnologies might be used to increase crop production.
DE
DE
DE
DE
DE
DE
Ch 20_Bio_Alberta30 1/8/07 12:41 PM Page 707

35. Predict the phenotype(s) of the F1 generation.
36. Two members of the F1 generation are mated. Determinethe predicted phenotype ratio for the F2 generation.
708 Unit 30 C NEL
24. Identify the stage of meiosis indicated by the labels X andY on Figure 2.
25. Describe the events at each stage of meiosis shown onthe flowchart in Figure 2.
26. Identify which cells in Figure 2 would have haploidchromosomes?
27. Cell A in Figure 2 contains 44 chromosomes. Infer thenumber of chromosomes that cell C contains.
32. Use the diagrams and labels in Figure 3 to help explainthe process of crossing over.
33. Identify correctly the letter label in Figure 3 that marksthe first haploid cells formed by meiosis. Explain youranswer.
34. Identify the correct letter label that marks metaphase II.What is happening during this phase?
Use the following information to answer questions 24 to 27.
Figure 2 is a flowchart showing the stages of meiosis forspermatogenesis.
A
B
X
Y
C
B
C
C
C
Figure 2
28. Sketch the karotype.
29. Predict how many chromosomes will be found in a musclecell of the fetus.
30. From the information provided, is it possible to predict thesex of the embryo? Explain your answer.
31. Gene therapy is a technique in which defective genes arelocated and substituted by normally functioning genes. Inthe future, gene banks may likely be a common source ofgenes for treating genetic disorders. List two potentialdisadvantages to society of the use of gene banks.
Use the following information to answer questions 32 to 34.
Figure 3 shows the formation of sex cells in a mammal.
X
YW
Z
Figure 3
Use the following information to answer questions 28 to 30.
A normal human sperm cell fertilizes an egg cell containing 24 chromosomes. A lab technician examining a karotype offetal cells notices trisomy of chromosome pair 21.
Use the following information to answer questions 35 and 36.
In guinea pigs, black hair is dominant to white hair, and shorthair is dominant to long hair. A guinea pig that is homozygousfor both white hair and for short hair is mated with a guineapig that is homozygous for both black hair and for long hair.
DE
DE
DE
DE
DE
DE
DE
DE
DE
DE
DE
DE
Ch 20_Bio_Alberta30 1/8/07 12:41 PM Page 708

Cell Division, Genetics, and Molecular Biology 709NEL
Unit 30 C
37. In chickens, the allele for rose comb (R) is dominant overthe allele for single comb (r), and the allele for featheredlegs (F ) is dominant to the allele for clean legs (f ). Abreeder mates four birds with feather legs and rose combs.The phenotypes of the offspring of these crosses areshown in Table 2. Determine the genotypes of theparents.
Table 2
Parents Phenotype of F1 offspring
rooster A → hen C all have rose combs; some havefeathered legs and some have cleanlegs
rooster A → hen D all rose combs and feathered legs
rooster B → hen C most have rose combs, some havesingle combs; all have feathered legs
rooster B → hen D rose and single combs; all have feathered legs
Use the following information to answer questions 41 to 44.
Tay Sach disease results from a mutation in the gene for theenzyme hexoseaminidase. This mutation is an autosomalrecessive disorder. The absence of a correct gene for thisenzyme results in an inability to break down fatty materialcalled ganglioside, which causes eventual death as theganglioside builds up in the brain. There is no effectivetreatment for this disease.
5�-AUGCAGGUGACCUCAGUG-3�mRNA sequence for normal protein
5�-AUGCAGGUGACAUACCUCAGUG-3�mRNA sequence for mutated protein
38. In mice, coat colour is determined by more than one gene.For one gene, the allele C determines a coloured coat, andthe allele c determines an albino phenotype. For a secondgene, the B allele causes activation of a pigment thatproduces black coat colour. The recessive allele, b, causesincomplete activation of the pigment, producing browncoat colour. These two genes are located on separatechromosomes and segregate independently. Determinethe predicted genotypic and phenotypic ratios of the F1generation from the cross CcBb × CcBb.
39. In your notebook, construct a table to compare replication,transcription, and translation. (A comparison includessimilarities and differences.) Your table should include thefollowing headings: Process name, Location in cell, Timeduring cell cycle, Product, Brief summary of process.
40. In actively dividing cells, DNA replication occurs duringinterphase. Sketch the process of replication, using thefollowing segment of DNA as an example:
5�-AAAAATTTAATATATTACAATGGCCCCGCGATAGTTCGTAGT-3�
3�-TTTTTAAATTATATAATGTTACCGGGGCGCTATCAAGCATCA-5�
Label and annotate your diagram to describe the process.Clearly indicate the start codon on your diagram.
41. Give the amino acid sequence that would result fromtranslation of the mRNA at the ribosome.
42. Write the sequence for the normal and mutated proteininto your notebook. Determine the DNA sequence fromwhich each sequence is transcribed.
43. Tay Sach disease is the result of a gene mutation. Identifythe mutation by circling the changed sequence. Name thetype of mutation that has occurred and explain thechanges that would occur in the protein.
44. Outline the procedure that you would follow to attempt agene therapy treatment for Tay Sach disease. Start from theassumption you already know the sequence of the normalgene.
45. Describe an advantage and disadvantage to treatingindividuals with Tay Sachs by applying gene therapy tosomatic cells. Describe an advantage and disadvantage totreating individuals with Tay Sachs by applying genetherapy to sex cells.
46. The gene for growth hormone has been isolated fromhuman chromosomes and cloned in bacteria. The bacteriaproduce human growth hormone, which can be harvestedin large quantities. The hormone is invaluable to peoplewith dwarfism. Before its development, people withdwarfism relied on costly pituitary extracts. Although theprospect of curing dwarfism has been met with approval,some concerns have been raised about the potentially vastsupply of growth hormone. Should individuals who do nothave dwarfism but who want to grow a few morecentimetres have access to the growth hormonebiotechnology? Justify your opinion.
47. Review the focusing questions on page 552. Using theknowledge you have gained from this unit, briefly outlinea response to each of these questions.
DE
DE
DE
DE
Ch 20_Bio_Alberta30 1/8/07 12:41 PM Page 709