
Rijksuniversiteit Groningen Detectability of biosignatures in ...
Upload
khangminh22Category
view
0download
0
University of Groningen
Genetics of clear cell renal cell carcinomaDuns, Gerben
IMPORTANT NOTE: You are advised to consult the publisher's version (publisher's PDF) if you wish to cite fromit. Please check the document version below.
Document VersionPublisher's PDF, also known as Version of record
Publication date:2011
Link to publication in University of Groningen/UMCG research database
Citation for published version (APA):Duns, G. (2011). Genetics of clear cell renal cell carcinoma: new tumor suppressor genes and aberrantchromatin regulation. [S.n.].
CopyrightOther than for strictly personal use, it is not permitted to download or to forward/distribute the text or part of it without the consent of theauthor(s) and/or copyright holder(s), unless the work is under an open content license (like Creative Commons).
The publication may also be distributed here under the terms of Article 25fa of the Dutch Copyright Act, indicated by the “Taverne” license.More information can be found on the University of Groningen website: https://www.rug.nl/library/open-access/self-archiving-pure/taverne-amendment.
Take-down policyIf you believe that this document breaches copyright please contact us providing details, and we will remove access to the work immediatelyand investigate your claim.
Downloaded from the University of Groningen/UMCG research database (Pure): http://www.rug.nl/research/portal. For technical reasons thenumber of authors shown on this cover page is limited to 10 maximum.
Download date: 09-01-2022

'/
/!
,
\' t
--,.
,.,
� · . .. 1 ,
• . t;
,.
..
, .
6 \. I
� .
. f '
' t1
' .. ,,
. .• L
�; 14
/"
. l·
.,,
. '\
It
(
1 ..
4.\l
\ ,, '
t'
f, .,
�-I
.. ,,_
, . '
r t
f II
',,,.\ l
•: \f
( t
:)
,, . \
� k
/
, ,.
• 'I(
. ,"\
I ,,
I ,' (
\ ft
f]\
• t
.•
'' \,
' u
, ' . . ,
( ,.,,
. � t
. ' ..
\\
I '
I
'' .
--.
: (
\ � _
, i
tt
I (l
'
,, . '
.... , t
I . .
-I•
h
j{ •
,,
I\
\ I
'
• \\
\ ·•r"1
I ,.
'·,
I . \
,\(
"'
I:.
1'
::,_�
il
.i ..
._ .. .. \, -
. l
-· :
,,. ;
f :
_j
, ,
( '1,..1 1
.._ I '
-+'
-:""
\
\
. , rt \
, \ '
I
�-,
\ I
-\
/
'
t �
'•'
,, ,.
\1
"
/ ,.,
�' t·•
A,.
c 1 :
. ,. ,
•
• •
• •
,'\
,, '""'
\\
l(,
,' II G)
CD ' 0- CD ::J
0
C ::J
U>
• "'- .
. '-.
I 4: \
'-)
• - .
'
. �,
, f
.-7/;
• ·� I
, ! , , ,
\\ �, '
, -
"I .,
11
. ,!
l ',
, , .,
)� ()
.,
, ..
l .
. '
/ 0
"1.
) 'i
' �i
(� \
-�'
-l
'
t',t /C
,, r
. , .. ,
I -
,,, .II
.
...
�
t .,
("
--.tt
\ ' !
I I
-._'.I
'
\
,� '. �
" ,.,
I)
, •
I 1
'
I J
l \ '
1\
\ ,.,.
' I /
•1
,, ,, /
I
,, "
0 .
4\ •.
t\
l'l
,, -=
•.'\
• .
' �· 4
) t :
,.,.
/
•'
--
I,
I "
\
'\.' •
� ,
14
-4•
-._
li.
• '
C\
....
,.
,.,
0
. .,
'...
I ,,.c
\ ,.
\ '
' � ...
, ""
l\
� "
�,-�
-· .
,·,
,,_1
1 .. ,
� l <,-
t" ,,
\ '
\\
,\
I r
\ ,
l /
t.'
' I
• .. ,.
-,\
,, �
,.,
I
l .
(
'd
� : ; I .� : t
,, ' ! 1 1 I ·,
' \ I
;
l • .,
i t 1,
::J
a, CD
0-�
CD r-+
'
C o1
3 ::J
0
r-+
'
n
u,
:::r
C
' -a
0
-a
3
' a,
CD r-+
U>
-
· U>
::J
0
'
' CD
lC
lC
CD C
::J
ru
CD !:±
. U>
0
a,
::J
::J a.. C>
CD
:::,
CD
r-t -· n
0
-h
n
CD
OJ
-,
n
CD
CD
:::,
OJ
n
CD
n
OJ
-,
n -· :::,
0 3
OJ
-'-
I I I I I l !I!

Genetics of clear cell renal cell carcinoma:
new tumor suppressor genes and aberrant chromatin regulation
Gerben Duns

Stellingen behorende bij het proefschrift Centrak U Mcdische M
Genetics of clear cell renal cell carcinoma: Biblint!Jeek C new tumor suppressor genes and aberrant chromatin regulati Groniugcn G
1. De 3p21 regio bevat met PBRM1, SETD2 en BAP1 meerdere ccRCC- geassocieerde
tumorsuppressor- genen (dit proefschrift).
2. Verschillende ccRCC tumoren hebben inactiverende mutaties in zowel VHL als PBRM1
als SETD2, wat erop wijst dat inactivatie van deze genen individueel niet voldoende is
voor de ontwikkeling van ccRCC tumoren (dit proefschrift).
3. PBRM1 is in een meerderheid van ccRCC tumoren ge"inactiveerd en is daarmee een
interessant aangrijpingspunt voor nieuw te ontwikkelen gerichte therapieen tegen
ccRCC (dit proefschrift).
4. Een verstoring van de regulering van chromatine is een essentiele gebeurtenis in de
ontwikkeling van ccRCC tumoren (dit proefschrift)
s. lnactivatie van VHL a Ileen leidt niet tot de ontwikkeling van ccRCC tumoren. Het is
dan ook een logische stap om de (ccRCC) tumoren van patienten die leiden aan VHL
syndroom te screenen op mutaties in de "nieuwe" ccRCC- geassocieerde
tumorsuppressor-genen.
6. Het doen van (een promotie-)onderzoek is te vergelijken met het maken van een
wielertocht in de bergen: je vraagt je geregeld af waarom je er aan begonnen bent,
maar het behalen van resultaat/ bereiken van de top geeft voldoening.
7. "De weereld is een speeltooneel, elck speelt zyn rol en kryght zijn deel" (Joost van
den Vandel).
8. Voetballers die bij clubs spelen die overheidssubsidies ontvangen zouden niet meer
moeten verdienen dan de Balkenende- norm.
9. De doodstraf is een wrede en onmenselijke straf, net zoals de in Nederland
bestaande levenslange gevangenisstraf zonder enig uitzicht op vervroegde vrijlating.
Gerben Duns, 7 december 2011

Gerben Duns
Genetics of clear cell renal cell carcinoma: new tumor su�pressor genes and aberrant chromatin regulation
Thesis Universi"ty of Groningen with summary in Dutch
The studies designed in this thesis were financially supported by the Dutch Cancer Society (Grant 2007-3892), the Foundation "De Drie Lichten" in the Netherlands, the "Jan Kornelis The Cock" Fou�dation, and the Rene Vogels Stichting
Printing of this thesis was financially supported by the Dutch Cancer Society, Rijksuniversiteit Groningen, and Groningen University for Drug Exploration (GUIDE)
Cover design by lvo Tanis ([email protected])
Lay-out by Off Page, Amsterdam
Printed by Off Page, Amsterdam
© 2011 G. Duns. All rights are reserved. No part of this book may be reproduced or transmitted in any form or by any means without permission of the author.
ISBN: 978-90-367-5193-3

RIJKSUNIVERSITEIT GRONINGEN
Genetics of clear cell renal cell carcinoma:
new tumor suppressor genes and aberrant chromatin regulation
Proefschrift
ter verkrijging van het doctoraat in de Medische Wetenschappen
aan de Rijksuniversiteit Groningen op gezag van de
Rector Magnificus, dr. E. Sterken, in het openbaar te verdedigen op
woensdag 7 december 2011 om 14:30 uur
door
Gerben Duns geboren op 14 oktober 1981
te Apeldoorn

Promotor:
Copromotores:
Beoordelingscommissie:
Prof. dr. R. M. W. Hofstra
Dr. K. Kok
Dr. E. van den Berg- de Ruiter
Prof. dr. A. H. M. Geurts van Kessel
Prof. dr. S. J. M. Jones
Prof. dr. J. M. Nijman

Paranimfen: Annemieke T. van der Goot
Willem M. Kok

CONTENTS
Chapter 1 General Introduction
Chapter 2 Histone Methyltransferase Gene SETD2 is a Novel Tumor
Suppressor Gene in Clear Cell Renal Cell Carcinoma
Chapter 3 Evaluation of the use of GINI in the search for tumor
suppressor genes
Chapter 4 The effect of SETD2 knockdown on transcript levels
and alternative splice site choice in proximal tubular
9
21
37
epithelial cells 53
Chapter 5 Targeted exome sequencing in clear cell renal cell carcinoma
tumors suggests aberrant chromatin regulation as a crucial step in ccRCC development 81
Chapter 6 The entire miR-200 seed family is strongly deregulated in clear cell renal cell cancer compared to its progenitor cells, the proximal tubular epithelial cells 111
Chapter 7 General Discussion 127
Summary
Nederlandse samenvatting
Acknowledgements/ Dankwoord
List of abbreviations
141
147
153
159


GENERAL INTRODUCTION
Clear cell renal cell carcinoma
Renal cell carcinoma (RCC) is the most common type of kidney cancer in adults, and accounts for 3% of all new cancers diagnosed in the Western world (Jemal et al., 2010). The incidence of RCC is the lowest in Asia and Africa (with the lowest recorded rates less than 1 new annual case per 100,000 population, age standardized) and the highest in Europe and North America (with the highest recorded rates in both men and women observed in the Czech Republic, with 20.2 and 9 .5 annual new cases per 100,000, respectively). The incidence in the Netherlands is 7. 9 and 4.5 per 100,000 in men and women, respectively (Curado et al., 2007).
There is evidence, supported by animal experiments and histological characterization of pre- and early stages of epithelial renal tumors that RCC derives from the mature nephron (Motzer et al., 1996). RCC is a clinicopathologically heterogeneous disease that consists of a number of histologically defined entities. The present classification of renal cell carcinoma was established by international consensus and led to the World Health Organization (WHO) 2004 classification. According to this classification, which is based on both morphological and genetic characteristics, RCC can be grouped into clear cell, papillary, chromophobe, collecting duct, medullary carcinoma, and unclassified categories (Eble et al., 2004). The WHO classification of RCC and the cytogenetic aberrations associated with the different RCC subtypes are summarized in Table 1. Clear cell renal cell carcinoma (ccRCC) is by far the most prevalent subtype,
Table 1. Classification renal cell carcinoma (RCC) subtypes.
Histologic subtype (WHO classification 2004)
Clear cell RCC
Papillary RCC
Chromophobe
Hereditary cancer syndromes -- --- --
Collecting duct carcinoma
Medullary carcinoma ----Mucinous tubular and spindle cell carcinoma
Neuroblastoma-associated RCC
Xp11.2 translocation-TFE3 carcinoma
Unclassified lesions
Prevalence (%) Cytogenetic findings
70
10 to 15
4 to 6
5
� deletions, VHL mutatio..'2.:__ Trisomy of chromosomes 7 and 17, loss of Y chromosome
Loss of multiple chromosomes: 1,2,6,10,13,17,21
Dependent on subtype -----<1
<1
<1
<1
<1
4
Loss of multiple chromosomes: 1,6, 14, 15,22; gain of chromosome 3
Extracellular matrix gene loss
Loss of multiple chromosomes: 1,4,6,8, 13, 14
Multiple gene loss (most often 20q13)
Translocations involving Xp11.2
Sources: Eble et al., 2004; Prasad et al., 2006
10 CHAPTER 1

comprising more than 70% of adult malignant kidney tumors. ccRCC is a malignant tumor composed of cells with a clear cytoplasm due to an intensive intracytoplasmatic accumulation of glycogen and lipids. Electron-microscopic and immunohistochemical features resembling the proximal tubule are seen in ccRCC, suggesting that ccRCC tumors are derived from the epithelial cells of the proximal tubulus (Thoenes et al., 1985). Figure 1 shows a schematic picture of the different parts of the nephron from which ccRCC and the other RCC subtypes are thought to be derived from (Prasad et al., 2006).
Proximal tubulus
Papil/aryRCC
Clear cell RCC
> Cortex
Medulla
Loop of Henle
Mucinous tubular and
spindle cell carcinoma
.__ _____ __. ___________ _ ,,,,,· ,,
Cortical collecting duct
Chromaphobe RCC
Medullary collecting duct
Collecting duct carcinoma
Renal medullary carcinomory
Figure 1. Schematic overview of the nephron, showing the different parts from which the RCC subtypes are thought to be derived from. Figure is modified from http://www.beltina.org.
In general ccRCC tumors occur sporadically. The average age of diagnosis is 60-64 years. However, 7% of sporadic cases of ccRCC are diagnosed in patients who are younger than 40, and rare cases have been described in patients between 14 and 18 years, without evidence of familial disorders (Bruder et al., 2004). The three most well-established risk factors associated with the development of ccRCC are smoking, obesity and hypertension (Chow et al., 2000; McGuire et al., 2011; Parkin et al., 1985).
Hereditary clear cell renal cell carcinoma
Approximately 2% of ccRCC tumors are familial (reviewed by Maher, 1996). The most frequent cause of familial RCC is a dominantly inherited cancer syndrome named VHL disease, which is estimated to occur at rates of 1 :45500 to 1: 100000 (Maddock et al., 1996; Maher et al., 1990a). VHL disease is the result of germline mutations in the Von Hippe/ Lindau (VHL) gene, and is characterized by the development of benign and malignant tumors across several organs, mainly in parts of the body with a high density
GENERAL INTRODUCTION 11

of blood vessels (reviewed by Kaelin, 2002). The lifetime risk of developing one or more ccRCC tumors in VHL disease is over 70% by the age of 60 (Maher et al., 19906). In a majority of sporadic ccRCC tumors VHL is inactivated as well (Gnarra et al., 1994; Nickerson et al., 2008).
An intriguing finding has been the frequent occurrence of translocations involving chromosome 3 in familial cases of ccRCC that are not linked to VHL. The best known case is undoubtedly the t(3,8)(p14;q24) translocation reported by Cohen et al. (1979) in a three-generation family in which all members with bilateral ccRCC carried this constitutive translocation. The chromosome 3 breakpoint appeared to map in intron 3 of FHIT (Zimonjic et al., 1997). Subsequently, several other familial cases of ccRCC have been identified with a constitutive translocation involving chromosome 3 (Bonne et al., 2007; Foster et al., 2007; Rodriguez-Perales et al., 2004). The various cases, however, do not appear to share a breakpoint on chromosome 3. And, although detailed analysis of a number of these translocations has resulted in the identification of genes disrupted by the translocation, none of these genes appear to be mutated in a substantial number of sporadic cases of ccRCC. It has been suggested that in these cases susceptibility to ccRCC may result from chromosome 3 instability, predisposing to loss of 3p. Indeed, analysis of the tumors in these families often revealed loss of the translocation chromosome that contained the short arm of chromosome 3 (reviewed by Bodmer et al., 2002; Li et al., 1993).
Therapy
In most cases, ccRCC tumors are still localized at the moment they are found. Surgical removal is the standard of care for these tumors, and offers long-term recurrencefree survival, although for patients who suffer from metastatic disease or develop distant relapse, the scenario is worse. Renal cell carcinomas are resistant to traditional cytotoxic chemotherapy. lmmunotherapy, which has been the most frequently used therapy until recently, has not been satisfactory in most cases either (reviewed by Bukowski et al., 201 1 ).
Advances in the understanding of ccRCC biology have resulted in the development of targeted approaches, which include the use of humanized monoclonal antibodies against VEGF, small-molecule tyrosine-kinase inhibitors, and inhibitors of mTOR. These approaches, which target pathways that are characteristic and essential for ccRCC tumors, show superior response rates compared to conventional strategies (reviewed by Clark, 2009).
Genetics of clear cell renal cell carcinoma
At the genomic level, ccRCC is characterized by a range of copy number alterations, of which loss of the short arm of chromosome 3 is by far the most frequent (Van den Berg et al., 1993). Genomic regions with a high incidence of allelic loss are thought to harbor so-called tumor suppressor genes (TSGs), defined by Haber and Harlow ( 1997) as "genes that sustain loss-of-function mutations in the development of cancer". The allelic losses are regarded as one of the two genetic alterations that are necessary to bial lelically inactivate TSGs (Knudson, 1971 ). In ccRCC a tumor suppressor gene
12 CHAPTER 1

has been identified in the recurrently lost 3p25 region, namely VHL. One allele of the VHL gene is thus deleted in most - if not all - ccRCCs. The remaining allele is inactivated by small mutations in 43-82% of ccRCC samples (Foster et al., 1994a; Gnarra et al., 1994; Nickerson et al., 2008; Shuin et al., 1994). In combination with the predisposition to multicentric ccRCC in patients with VHL germline mutations, these data have pinpointed VHL as a classic tumor suppressor gene. Further support came from the observation that reintroduction of wildtype VHL into VHL-null ccRCC cells suppresses tumorigenicity both in vitro and in vivo (Chen et al., 1995; Gnarra et al., 1996; lliopoulos et al., 1995; Schoenfeld et al., 1998).
As mentioned, in a subset of ccRCC tumors, VHL is not biallelically inactivated. Thus, at least for these tumors, VHL inactivation is probably not the driving force for the observed 3p loss. Moreover, VHL inactivation alone causes a senescence-like phenotype in vitro and in vivo (Young et al., 2008), and although kidneys from patients suffering from VHL disease contain VHL mutations in hundreds of pre-neoplastic lesions, only a few of these are thought to develop into ccRCC tumors (Mandriota et al., 2002). These observations strongly suggest that alternative and/or additional ccRCC cancer genes play a role in ccRCC development. The observed frequent loss of regions of 3p, other than 3p25, in ccRCC tumors strongly suggests that these regions might contain unidentified ccRCC tumor suppressor genes. Many studies have therefore attempted to precisely map the position and the boundaries of the deleted regions of 3p.
Loss-of-heterozygosity (LOH) studies suggest that 3p21 loss is slightly more frequent than, and/or may occur separately from, loss of the 3p25 and 3p14 loci (Clifford et al., 1998; Van den Berg et al., 1997). Allelic loss of 3p25 or of 3p12-14, but not of 3p21, has been shown to occur in renal cell adenoma, suggesting that loss of the 3p21 region is a prerequisite for malignant development of ccRCC (Van den Berg et al., 1998). This suggests that loss of these 3p segments may independently contribute to ccRCC development, and indicates the presence of tumor suppressor genes at the 3p21 and 3p14 regions. A few genes located at these regions on 3p have been suggested to have a tumor suppressor role in ccRCC, most notably fragile histidine triad protein gene (FHIT), and ras association (RalGDS/AF-6) domain family member 1 (RASSF1A) (Figure 2). FHIT co-localizes with the fragile site FRA3B at 3p14.2. A multitude of studies in different types of tumors have shown various molecular alterations, including CpG-island hypermethylation, leading to inactivation of FHIT. FHIT participates in a number of important signal pathways in response to endogenously or exogenously applied stressful agents, particularly those that cause DNA damage (reviewed by Saldivar et al., 2010). There are still questions to pursue concerning the selective advantage conferred to cells by loss of expression of FHIT, and the involvement of FHIT in ccRCC is disputed (Bugert et al., 1997 Van den Berg et al., 1997).
RASSF1, located at 3p21, was initially suggested to be a tumor suppressor gene in lung cancer, based on its location in a region of frequent LOH and the absence of expression as a result of promoter hypermethylation of the remaining allele (Agathanggelou et al., 2001). Dreijerink et al. (2001) showed promoter
GENERAL INTRODUCTION 13

3p25
3p21.3
RASSF1
3p21.1
3p14.2
Figure 2. Schematic picture of the short arm of chromosome 3, showing the locations of the VHL ccRCC tumor suppressor gene, and the putative ccRCC tumor suppressor genes RASSF1 and FHIT.
hypermethylation of RASSF1 in 39 out of 43
primary ccRCC tumors. The RASSF1 gene
has two GC-rich promoters that produce
two isoforms, RASSF1 A and RASSF1 C. In
ccRCC, both these transcripts suppress
the tumorigenicity of the KRC/Y RCC cell
line in SCID mice (Li et al. , 2004). This
can be regarded as a hallmark of a tumor
suppressor gene. However, as RASSF1 a is
not inactivated by mutation but by promoter
methylation, this gene may not be seen as a
tumor suppressor gene in the classic sense.
The aberrant promoter hypermethylation
is a secondary effect as another event has
to precede this one in order to establish
the aberrant hypermethylation. Moreover,
the process of hypermethylation will
simultaneously affect all alleles of a gene in
a single event. This is in contrast with the
situation for the classic tumor suppressor
genes where inactivation requires two
independent events (Knudson et al., 1971).
Therefore, inactivation of FHIT and RASSF1 is probably not the driving force for the
frequently observed loss of 3p14 and 3p21,
respectively.
The proposed model, suggesting that
loss of 3p segments occurs independently
in ccRCC tumorigenesis, is challenged
by recent studies that show that for the
majority of ccRCCs the loss of 3p most likely encompasses the entire p-arm. In a
study by Sukosd et al. (2003), based on microsatellite analyses, 95 out of 98 ccRCC
tumors showed loss of a segment ranging from pter to 3p12. In a SNP-based study
by Toma et al. (2008), 15 out of 20 tumors had lost the entire p-arm. Neither of these
studies reported any cases with retention of heterozygosity at the VHL locus, while
retention at the FHIT locus was observed in six cases in the combined studies. The
data of Braga et al. (2002) and Chudek et al. (1997) underscore these conclusions.
Their data on 55 and 100 ccRCCs, respectively, indicate large terminal deletions for
42 and 94 cases, respectively, of which 28 and 89 most likely encompass almost the
entire p-arm. Chudek et al. (1997) reported retention of the most telomeric part of 3p
in 6 cases, but this segment did not include the VHL locus. Many studies that report
interstitial 3p deletions in ccRCC tumors are based on the analysis of microsatellite
markers. The interpretation of microsatellite data of primary tumors is complicated to
say the least. Primary tumors have an admixture of normal tissue, and this will dampen
14 CHAPTER 1

the effect of LOH on the observed ratios between the alleles. A study by Liu et al. (1999) suggested that up to 50% of the low molecular weight allele deletions in tumor samples may go undetected in this type of study. Thus, reported interstitial deletions, or interruptions of regions of deletion, based on only one marker should be regarded with caution. Alimov et al. (2000) used an analysis protocol that took the findings of Liu et al into account, and did report interstitial deletions in six primary RCCs. Wilhelm et al. (1995) avoided the influence of contaminating normal cells by using short-term cultures of primary ccRCC. All 41 tumors that they analyzed appeared to have strictly terminal deletions of the major part of 3p, including the FHIT locus. Thus, it ca nnot be excluded that interstitial deletions do occur, but they are presumably very scarce.
The combined genomic studies strongly suggest that the short arm of chromosome 3 may harbor several, as yet unidentified, tumor suppressor genes that contribute to ccRCC development. Identifying ccRCC tumor suppressor genes by positional cloning strategies alone has proven extremely difficult. Decades of research on the identification of the tumor suppressor genes other tha n VHL that underlie the high frequency of 3p deletions in ccRCC has not led to the identification of a clea r-cut tumor suppressor gene. The identification of tumor suppressor genes was hampered by the omission of methods to screen large numbers of genes in parallel for small (point) mutations. This situation has changed in the last decade. New methods like Gene Identification by Nonsense-mediated mRNA decay Inhibition (GINI), and, more recently, next-generation sequencing-based approaches, have given us new and powerful tools to identify tumor suppressor genes.
AIM
The aim of this thesis was to identify new tumor suppressor genes that are involved in the development of clear cell renal cell carcinoma (ccRCC). Subsequent detailed functional analysis of these genes should help us to understa nd the initial processes that underlie the development of ccRCC.
OUTLINE
In Chapter 2, we applied Gene Identification by Nonsense mediated mRNA decay Inhibition (GIN/) in the search for novel ccRCC tumor suppressor genes. This led to the identification of SETD2 as a new candidate ccRCC tumor suppressor gene. Using the current knowledge on ccRCC genetics, we evaluated the use of GIN/ in the search for tumor suppressor genes in Chapter 3.
SETD2 codes for a histone methyltransferase that is nonredundantly responsible for trimethylation of lysine 36 of histone H3 (H3K36me3). This modification has been suggested to have a function in alternative splice site choice. In Chapter 4, we describe the initial steps that should result in the elucidation of the mechanisms through which SETD2 inactivation could contribute to ccRCC development. We investigated the
GENERAL INTRODUCTION 1 5

effect of siRNA-mediated SETD2 knockdown in proximal tubular epithelial cells on transcript levels and alternative splice site choice.
The recently developed next-generation sequencing (NGS) technologies make it possible to sequence large numbers of genes in parallel. In Chapter 5, we continued our search for ccRCC tumor suppressor genes by sequencing all coding regions and exon-i ntron boundaries from the short arm of chromosome 3 in ten primary ccRCC tumors, using exome capturing followed by NGS. This led to the identification of PBRM 1 as a candidate ccRCC tumor suppressor gene.
Besides protein coding genes, non-coding transcripts, inc luding microRNAs, have been shown to have a function in the development of several tumor types. Therefore, we compared miRNA transcript levels in ccRCC-derived cell lines with the miRNA levels in normal proximal epithelium, and correlated these transcript levels with copy numbers and transcript levels of predicted targets, as described in Chapter 6.
In Chapter 7, the work described in this thesis is discussed.
REFERENCES
Agathanggelou A, Honoria S, Macartney DP, et al. Methylation associated inactivation of RASSF1A from region 3p21.3 in lung, breast and ovarian tumours. Oncogene 2001 ;20:1509. Alimov A, Kost-Alimova M, Liu J, et al. Combined LO H/CG H analysis proves the existence of interstitial 3p deletions in renal cell carcinomas. Oncogene 2000;19:1392. Bonne A, Vreede L, Kuiper RP, et al. Mapping of constitutional translocation breakpoints in renal cell cancer patients: identification of KCNI P4 as a candidate gene. Cancer Genet Cytogenet 2007;179 :11. Bodmer D, Van den Hurk W, Van Groningen JJ, et a l . Understanding familial and nonfamilial renal cell cancer. Hum Mol Genet 2002;11 :2489. Braga E., Senchenko V, Bazov I, et al. Critical tumor-suppressor gene regions on chromosome 3 P in major human epithelial malignancies: allelotyping and quantitative real-time PCR. Int J Cancer 2002;100:534. Bruder E, Passera 0, Harms D, et al. Morphologic and molecular characterization of renal cell carcinoma in children and young adults. Am J Surg Pathol 2004;28: 1117. Bugert P, Wilhelm M, Kovacs G. FHIT gene and the FRA3B region are not involved in the genetics of renal cell carcinomas. Genes Chromosomes Cancer 1997;20:9 . Bukowski RM. Cytokine therapy for metastatic renal cell carcinoma. Semin Urol Oneal 2011;19 :148.
1 6 CHAPTER 1
Chen F, Kishida T, Duh FM, et al. Suppression of growth of renal carcinoma cel ls by the van Hippel-Lindau tumor suppressor gene. Cancer Res 1995;55:4804. Chow WH, Gridley G, Fraumeni JFJr, et al. Obesity, hypertension, and the risk of kidney cancer in men. N Engl J Med 2000;343:1305. Chudek J, Wilhelm M, Bugert P, et al. Detailed microsatel l ite analysis of chromosome 3p region in non-papillary renal cell carcinomas. Int J Cancer 1997;73:225. Clark PE. The role of VHL in clear-cell renal cel l carcinoma and its relation to targeted therapy. Kidney Int 2009:76;939. Clifford SC, Prowse AH, Affara NA, et al. Inactivation of the von Hippel-Lindau (VH L) tumour suppressor gene and allelic losses at chromosome arm 3p in primary renal cell carcinoma: evidence for a VHL-independent pathway in clear cel l renal tumorigenesis. Genes Chromosomes Cancer 1998;22:200. Cohen AJ, Li FP, Berg S, Marchetta DJ, et al . Hereditary renal-cell carcinoma associated with a chromosomal translocation. N Engl J Med 1979;301 :592. Curado. M. P., Edwards, B., Shin. H.R., et al. Cancer Incidence in Five Continents, Vol . IX. IARC Scientific Publications 2007;160. Dreijerink K, Braga E, Kuzmin I, et al. The candidate tumor suppressor gene, RASSF1 A, from human chromosome 3p21.3 is involved in kidney tumorigenesis. Proc Natl Acad Sci U S A 2001 ;98:7504 .

Eble J N, Sauter G, Epstein J I, et al. World Health Organization Classification of Tumours. Pathology and Genetics of Tumours of the Urinary System and Male Genital Organs. IARC Press: Lyon 2004. Foster RE, Abdulrahman M, Morris MR, et al. Characterization of a 3;6 translocation associated with renal cell carcinoma. Genes Chromosomes Cancer 2007;46:311. Foster K, Prowse A, Van den Berg A, et a l . Somatic mutations of the van Hippel-Lindau disease tumour suppressor gene in nonfamilial clear cell renal carcinoma. Hum M al Genet 1994;3:2169. Gnarra JR, Tory K, Weng Y, et al . Mutations of the VHL tumour suppressor gene in renal carcinoma. Nature Genet 1994;7:85. Gnarra JR, Zhou S, Merril MJ, et al . Post-transcriptional regulation of vascular endothelial growth factor mRNA by the product of the VHL tumor suppressor gene. Proc Natl Acad Sc USA 1996;93:10589. Haber D, Harlow E. Tumour-suppressor genes: evolving definitions in the genomic age. Nat Genet 1997;16 :320. lliopoulos 0, Kibel A, G ray S, et al. Tumour suppression by the human van Hippel-Lindau gene product. Nat Med 1995;1 :822. Jemal A, Siegel R, Xu J, et al. Cancer Statistics, 2010. CA Cancer J Clin 2010;60:277. Kaelin J r. WG . M olecular basis of the VHL hereditary cancer syndrome. Nat Rev Cancer 2002;2:673. Knudson AG, J r. Mutation and cancer: statistical study of retinoblastoma. Proc Natl Acad Sci U S A 1971 ;68:820. Li FP, Decker J H, Zbar B, et al. Clinical and genetic studies of renal cell carcinomas in a family with a constitutional chromosome 3;8 translocation. Genetics of familial renal carcinoma. Ann Intern Med 1993;118:106. Li J, Wang F, Protopopov A, et al. Inactivation of RASSF1 C during in vivo tumor growth identifies it as a tumor suppressor gene. Oncogene 2004;23:5941. Liu J, Zabarovska VI, Braga E, et al. Loss of heterozygosity in tumor cells requires re-evaluation: the data are biased by the size-dependent differential sensitivity of allele detection. FEBS Lett 1999;462:121. Maddock IR, Moran A, M aher ER, et al. A genetic register for van Hippel-Lindau disease. J Med 1996;33:120. Maher ER. Inherited renal cell carcinoma. Br J Urol 1996;78:542.
M aher ER, Yates JR, Ferguson-Smith MA. Statistical analysis of the two stage mutation model in von Hippel-Lindau disease, and in sporadic cerebellar haemangioblastoma and renal cell carcinoma. J Med Genet 1990;27:311. Maher ER, Yates JRW, Harries R, et al. Clinical features and natural history of van HippelLindau disease. Q J Med 1990;77:1151. Mand riota SJ, Turner KJ, Davies DR, et a l . HIF activation identifies early lesions in VHL kidneys: evidence for site specific tumor suppressor function in the nephron. Cancer Cell 2002;1 :459. McGuire B B, Fitzpatrick J M . B M I and the risk of renal cell carcinoma. Curr Opin Ural 2011 ;21 :356. Motzer RJ, Bander N H, Nanus DM. Renal-cell carcinoma. N Eng J Med 1996;335:865. Nickerson M L, Jaeger E, Shi Y, et al. Improved identification of von Hippel-Lindau gene alterations in clear cell renal tumors. Clin Cancer Res 2008;14 :4726. Parkin DM, Pisani P, Lopez AD, et al. At least one in seven cases of cancer is caused by smoking. Global estimates for 1985. Int J Cancer 1994;59:494. Rodriguez-Perales S, Melendez B, G ribble SM, et al. Cloning of a new familial t(3;8) translocation associated with conventional renal cell carcinoma reveals a 5 kb microdeletion and no gene involved in the rearrangement. Hum Mol Genet 2004;13:983. Saldivar JC, Shibata H, Huebner K. Pathology and biology associated with the fragile FHIT gene and gene product. J Cell Biochem 2010;109:858. Schoenfeld A, Davidowitz EJ, Burk RD. A second major native von Hippel-Lindau gene product, initiated from an internal translation start site, functions as a tumor suppressor. Proc Natl Acad Sci U S A 1998;95:8817. Shuin T, Kondo K, Torigoe S, et al. Frequent somatic mutations and loss of heterozygosity of the von Hippel-Lindau tumor suppressor gene in primary human renal cell carcinomas. Cancer Res 1994;54 :2852. Su kosd F, Kuroda N, Beathe T, et al. Deletion of chromosome 3p14.2-p25 involving the VH L and FH IT genes in conventional renal cell carcinoma. Cancer Res 2003;63:455. Thoenes W, Sterkel St, Rumpelt HJ . Histopathology and classification of renal cell tumors (adenomas, oncocytomas, and carcinomas) : the basic cytological and histopathological elements and their use for diagnostics. Path Res Pract 1985;181:125.
1 G EN ERAL I NTRODUCTIO N 1 7

Toma Ml, Grosser M, H err A, et al. Loss of heterozygosity and copy number abnormality in clear cell renal cell carcinoma discovered by high-density Affymetrix 1 OK single nucleotide polymorphism mapping array. Neoplasia 2008;10:634.
Van den Berg A, Dijkhuizen T, Draaijers TG, et al. Analysis of multiple renal cell adenomas and carcinomas suggests allelic loss at 3p21 to be a prerequisite for malignant development. Genes Chromosomes Cancer 1997;19:228.
Van den Berg A, Draaijers TG, Kok K, et al. Normal FH IT transcripts in renal cell cancerand lung cancer-derived cell lines, including a cell line with a homozygous deletion in the FRA3B region. Genes Chromosomes Cancer 1997;19:220.
1 8 CHAPTER 1
Van den Berg E, Van der Hout AH, Oosterhuis JW, et al. Cytogenetic analysis of epithelial renal-cell tumors: relationship with a new histopathological classification. I nt J Cancer 1993;55:223. Wilhelm M, Bugert P, Kenck C, et al. Terminal deletion of chromosome 3p sequences in nonpapillary renal cell carcinomas: a breakpoint cluster between loci D3S1285 and D3S1603. Cancer Res 1995;55:5383. Young AP, Schlisio S, Minamishima YA, et al. VH L loss actuates a H I F-independent sensescence programme mediated by Rb and p400. Nat Cell Biol 2008;10:361. Zimonjic DB, Druck T, Ohta M, et al. Positions of chromosome 3p14.2 fragile sites (FRA3B) within the F H IT gene. Cancer Res 1997 ;57:1166.


H I STON E M ETHYLTRAN S FERAS E G EN E SETD2 I S A N OVEL TU MOR SU PPRESSOR G E N E
I N CLEAR CELL RENAL CELL CARCI NOMA
Gerben Duns 1 , Eva van den Berg 1 , I nge van Duiven bode1 ,
J a n Osinga 1 , H a rry H o l lema 2, Robert M .W. H ofstra 1 ,
a n d K laas Kok 1
Depa rtments of 1 Genetics and 2Patho logy & Med ica l B io logy, Un iversity M ed ica l Center G ron i ngen, U n iversity of G ron ingen ,
G ron ingen , the Nether lands
Ada pted from Duns et a l . , Cancer Research 201 0 ;70( 1 ) :4287-9 1 .

ABSTRACT
Sporadic clear cell renal cel l carcinoma (cRCC) is genetically characterized by the recurrent loss of the short arm of chromosome 3, with a hotspot for copy number loss in the 3p21 region. We applied a method called "gene identification by nonsensemediated mRNA decay inhibition" to a panel of 10 cRCC cell lines with 3p21 copy number loss to identify biallelic inactivated genes located at 3p21. This revealed inactivation of the histone methyltransferase gene SETD2, located on 3p21.31, as a common event in cRCC cel l s. SETD2 is nonredundantly responsible for trimethylation of the histone mark H3K36. Consistent with this function, we observed loss or a decrease of H3K36me3 in 7 out of the 10 cRCC cell lines. Identification of missense mutations in 2 out of 10 primary cRCC tumor samples added support to the involvement of loss of SETD2 function in the development of cRCC tumors.
22 CHAPTER 2

INTRODUCTION
Clear cell renal cell carcinoma (cRCC) is the most prevalent subtype of renal cell carcinoma and accounts for 3% of all human malignancies (1 ). Originating from the epithelium of the proximal tubulus, it is genetically characterized by recurrent loss of 3p regions. These losses are thought to represent one of the two hits required to functionally inactivate tumor suppressor genes (TSG) located in these regions (2) . The Von Hippel-Lindau gene, located at 3p25, has been identified as a TSG involved in the pathology of cRCC, and is inactivated in the majority (57-80%) of cRCCs (3, 4). Although the frequent copy number loss of 3p21 (5) also suggests the presence of one or more additional TSGs in this segment of 3p, decades of research have not led to the identification of a TSG located in this genomic segment. In an attempt to identify a putative 3p21 TSG, we applied a modified version of the "gene identification by nonsense-mediated mRNA decay inhibition" (GINI) method (6) to a panel of 10 cRCC cell lines showing copy number loss of 3p21. The GINI method allows for genome-wide identification of transcripts harboring premature termination codons (PTC). Inhibition of the nonsense-mediated mRNA decay pathway in vitro results in the accumulation of PTC transcripts, which can be detected using gene expression microarrays. Several groups have successfully applied modified versions of the GINI method in their search for TSGs (7-9). Using GINI, we identified the histone methyltransferase gene SETD2/ HYPB, located on 3p21.31, as a new TSG involved in the development of cRCC.
MATERIALS AND METHODS
Cell lines
cRCC cell lines RCC-AB, RCC-ER, RCC-FG2, RCC-HS, RCC-JF, RCC-JW, RCC-MF, and RCC-WK were obtained from Cell Line Services, Eppenheim, Germany. The cells, which tested negatively for Mycop/asrna, bacteria, and fungi, had been passed 10 to 13 times upon arrival (as stated by Cell Line Services). Experiments were performed on cells that had undergone six to eight additional passages. cRCC cell lines RCC-1, RCC-4, and RCC-5 were established by Dr. C.D. Gerharz (Institute of Pathology, University Hospital, Dusseldorf, Germany) and karyotyped. To ensure their authenticity, they were recently re-karyotyped. All cRCC cell lines were maintained in RPMI 1640 (Sigma). Embryonal kidney cell line HEK293T was obtained from American Type Culture Collection (CRL-1573) and maintained in DMEM (Sigma). MN160 and PTEC are primary cultures derived from proximal tubular epithelial cells. DNA was purified using a phenol/chloroform extraction method.
Primary tumor samples
Primary cRCC tumor samples (for details, see Supplementary Table S1) were snapfrozen in liquid nitrogen, sections were cut and the histology was reviewed by a pathologist (H. Hollema). Tissue biopsies containing at least 70% tumor cel ls were selected for analysis. DNA was isolated using the OIAamp DNA Micro Kit (Oiagen).
SETD2 IS A NOVEL TUMOR SUPPRESSOR GENE IN ccRCC 23

DNA samples from formalin-fixed matching normal kidney samples were obtained using a paraffin material DNA isolation protocol.
ArrayCGH
ArrayCGH was carried out using Agilent Human Genome CGH Microarray 244a sl ides (pin G4411 B) following the protocols of the manufacturer. Slides were scanned using the G25052C DNA m icroarray scanner (Agilent Technologies). Array images were analyzed using Agilent feature extraction software (v10.5.1.1) and DNA analytics (Agilent).
G I N I
Cells were grown to 70% confluence and treated with emetine dihydrochloride hydrate (100 µg/m l medium) or caffeine (10 m mol/L in medium), or not treated. Following 8 hours of incubation at 37 °C, cells were harvested. Experiments were performed in duplicate. RNA was isolated using the RNeasy Mini Kit (Oiagen). Transcript abundance in treated and untreated cells was measured using Human HT-12_ V3_Beadchips (48K; lllumina). The Lumi package implemented in R (10, 11) was used for variance stabil izing transformation fol lowed by robust spline normalization of the microarray data (GEO accession no. GSE20491 ). GeneSpring GX 10.0 (Agilent) was used to calculate treatment-induced fold changes. Putative PTC-containing transcripts were selected according to the following criteria:
1. Transcripts should show emetine- as well as caffeine-induced accumulation in one or more cell lines. Transcripts were considered to be accumulated when present in the list of 1,000 transcripts with the highest treatment-induced fold changes.
2. Transcripts showing accumulation in the majority of cell l ines were considered to be so-called stress-response genes and were discarded from further analyses.
3. In untreated cells, PTC transcripts should show a significantly lower abundance than their non-PTC harboring counterparts.
4. Emetine- and caffeine-induced accumulation pushes the abundance towards a level sim i lar to the abundance in PTEC and MN 160.
Mutation analysis
Thirty-seven PCR primer sets were designed to amplify and sequence all coding sequences and exon-intron boundaries of SETD2 annotated in the human genome (National Center for Biotechnology Information). Amplified PCR products were purified using EXOSAP IT (GE Healthcare) and sequenced using BigDye Terminator chemistry (Applied Biosystems).
Reaction products were run on the ABl3130XL Genetic Analyzer (Applied Biosystems). Sequences wereevaluated using Mutation Surveyor (SoftGenetics LCC). Cancer samples showing putative mutations were re-sequenced to eliminate any potential sequencing artifacts. To check for aberrant transcripts, cDNA fragments, obtained by reverse transcription of RNA from the cell l ines, were amplified using
24 CHAPTER 2

stepdown PCR (60°C-55°C} and visualized on a 2% agarose gel. Primer sequences are available upon request.
Western blot analysis
Cells were lysed in Triton extraction buffer [0.5% Triton X-100 (v/v), 2 mmol/L phenylmethylsulfonyl fluoride, and 0.02% NaN3 (m/v)]. Histones were isolated by acid extraction O/N in 0.2 N HCI, separated using SOS-PAGE (15%) and transferred to a nitrocellulose membrane. The following primary and secondary antibodies were used for Western analysis: rabbit anti-histone 3 (ab1791, 1 :4,000; Abeam}, rabbit antitrimethyl histone H3 (Lys36; ab9050, 1 :750; Abeam), rabbit anti-dimethyl-histone H3 (Lys 36; 07-369, 1 :2,000; Millipore) and horseradish peroxidase->conjugated secondary antibody (goat anti-rabbit; Bio-Rad). Positive staining was visualized using ECL solution mixture from Roche. Attached antibodies were stripped from the membrane using Re-Blot Plus Strong Solution (Chemicon/Millipore) to allow reuse of the membrane.
RESULTS AND DISCUSSION
ArrayCGH analysis
In our search for candidate TSGs located at 3p21, we decided to include only c RCCderived cell lines and primary tumor samples that showed copy number loss for 3p21. This selection was based on our arrayCGH data. Seven out of 11 cRCC cell lines and 6 out of 11 cRCC primary tumor samples lost the entire short arm of chromosome 3 (3p). Three cell lines and three primary tumor samples had copy number loss of a part of 3p, with a segment of overlap from 21.4 to 69.6 Mb from pter, including 3p21 but not the VHL gene, located at 3p26-p25 (Supplementary Fig. S1). One cell line (RCC-WK) did not show copy number loss of 3p21 and was not considered in the subsequent GINI analysis.
GIN I analysis
To identify transcripts harboring PTCs, we performed GINI on 10 cRCC cell lines with copy number loss of 3p21. Gene expression microarrays were used to identify transcripts that were accumulated as a result of nonsense-mediated mRNA decay inhibition. Transcripts were selected for further analysis based on criteria outlined in Materials and Methods. In this study, we restricted the search for biallelic inactivated transcripts to the 3p21 region. One gene fitting all our criteria was the histone methyltransferase gene SETD2, located at 3p21.31. Based on the observed "transcript level profiles", we expected SETD2 to harbor PTCs in RCC-AB and RCC-ER (Fig. 1 ).
SETD2 mutation analysis
The presence of PTC-introducing mutations in these two cell lines was confirmed by sequence analysis of all exons and exon-intron boundaries of SETD2. A 1-bp deletion
SETD2 IS A NOVEL TUMOR SUPPRESSOR GENE IN ccRCC 25

10 .0 .. ····················
� 9.0 ·
·=
iii E 0
■ untreated
� caffeine treated
D emetine treated
Figure 1 . Effect of nonsense-mediated mRNA decay inhibition on SETD2 transcript levels in cRCC cell lines. For each cell line, SETD2 transcript levels are shown in untreated (black columns), caffeine-treated (striped columns), and emetine-treated (gray columns) cells, respectively. Normalized intensity values are shown on a log 2 scale. Levels below a value of 7 are close to the detection limit. The SETD2 probe binds to the 3' part of the transcript. The SETD2 transcript in RCC-FG2 lacks this part (Supplementary Fig. S2.g) , explaining the low transcript levels. SETD2 transcript a bundance is low in untreated RCC-AB and RCC-ER cells compared with the other cell lines and shows caffeine- and emetine-induced accumulation in RCC-AB and RCC-ER. Based on these transcript level profiles, we expected RCC-AB and RCC-ER to harbor PTCs in the SETD2 gene.
resulting in a PTC 42 nucleotides downstream was detected in RCC-AB. In RCC-ER, a nonsense mutation was identified (Fig. 2; Supplementary Fig. S2; Supplementary Table S2). The other cel l lines were sequenced for mutations other than those causing PTCs. We identified an in-frame 9-bp deletion in exon 1 in RCC-MF, a missense mutation in exon 3 in RCC-JW not corresponding to a known single-nucleotide polymorphism (not present in dbSNP}, and a silent mutation in exon 3 in RCC-J F. In addition, the SETD2 transcript of RCC-FG2 seemed to lack the terminal three exons (Supplementary Fig. S2). To further assess the clinical relevance of these findings, we sequenced SETD2 in 10 cRCC primary tumors with 3p21 copy number loss (Supplementary Fig. S2), and in two of them, we identified missense mutations that did not correspond to known single-nucleotide polymorphisms (dbSNP). The mutations identified in RCC-AB, RCC-ER, and RCC-MF as well as the aberrant splicing observed in RCC-FG2 will all have a severe effect on the function of the protein. The three missense mutations identified affect amino acids that are conserved across SETD2 orthologues in several species (Supplementary Fig. S3). The missense mutation in T-3 affects the SET domain, which is responsible for the methyltransferase activity of the protein. The missense
26 CHAPTER 2

NHr{,_____ ____ --.L..J .-.II ____ _______ 1 2564
Figure 2. SETD2 mutations in cRCC samples. Schematic representation of SETD2 with a rrows showing the locations of the mutations and the corresponding amino acid changes. AWS, AWS domain ; SET, SET domain ; PS, post-SET domain ; LCR, low-charge reg ion; WW, WW domain ; I P, interaction with RNAPOL2A; Del, deletion . Nationa l Center for Biotechnology Information Reference Sequence: NP _054878.5.
mutation in T-4 affects the low charge region, which is thought to have transcriptional activation activity, whereas the missense mutation in RCC-JW affects an amino acid which is not located in a known functional domain (Fig. 2). The missense mutation in T-3 was shown to be somatic (Supplementary Fig. S2). The matching normal renal sample of T-4 was heterozygous for the missense mutation, indicating that SETD2 mutations might contribute to genetic susceptibility for cRCC. The missense mutations in T-4 and RCC-JW were not seen in 100 healthy control samples. AGVGD, SIFT, and Polyphen gave ambiguous results in their predictions of the pathogenicity of the mutations (Supplementary Table S3). However, the ratio between observed nonsynonymous and synonymous mutations (6:1) was higher than the 2:1 predicted for nonselected passenger mutations (12), indicating that the observed mutations are functional rather than coincidental. The observed mutation frequency in the cRCC primary tumor samples might be an underestimation of the actual frequency, as the samples were not checked for aberrant splicing caused by intronic mutations.
Our findings were confirmed by a massive sequencing project on cRCC performed recently that found somatic truncating mutations in SETD2 in 12 out of 407 (3%) cRCC clinical specimens (13). Sequencing of a panel of nine small cell lung carcinomaderived cell lines, a type of carcinoma also characterized by loss of 3p21 (14), did not reveal any hemizygous mutations (data not shown). This implies that the inactivating mutations of SETD2 could be specific for cRCC, as is also suggested by Dalgliesh and colleagues (13).
Trimethylation of H3K36 i n cRCC SETD2 was discovered in 1998 and initially characterized as Huntingtin-interacting protein (HYPB; refs. 15, 16). In 2005, HYPB was shown to function as a histone methyltransferase via a conserved SET domain and was renamed SETD2 ([Su(var)3-9, enhancer of zeste [E(z)] and trithorax (trx)] domain-containing protein 2). A number of recent articles correlate loss- or gain-of-function of histone-modifying enzymes, including histone lysine methyltransferases, with the pathology of several types of cancer. Aberrant activity of h istone-modifying enzymes could result in altered
SETD2 IS A NOVEL TUMOR SUPPRESSOR GENE I N ccRCC 27

I
chromatin configuration and disruption of normal transcriptional programs, pushing the cell towards cancerous development (17) . Recently, a trend for lower SETD2 transcript levels in breast cancer tissue was shown, linking the reduction of SETD2 mRNA levels with tumor development (18). SETD2 is nonredundantly responsible for all trimethylation of lysine 36 of histone H3 (19, 20). This mark may be involved in transcriptional elongation and splicing (21). To assess the effect of the mutations identified in SETD2 on the global level of trimethylated H3K36, we performed Western blot analysis on our panel of cRCC cell lines. There was a strong decrease of global H3K36me3 levels in 7 out of 10 tested cRCC cell lines, whereas H3K36me2 levels were consistent across the panel of cell lines (Fig. 3). In RCC-ER and RCC-AB, which harbor hemizygous mutations introducing PTCs in SETD2, H3K36me3 was lost. The observed faint residual staining was probably an effect of nonspecific binding of the antibody. RCC-MF and RCC-FG2 have trimethylated H3K36 levels similar to those observed in RCC-AB and RCC-ER, indicating that the mutations in these cell lines totally disrupt the H3K36me3 methyltransferase activity of the SETD2 protein as well. The missense mutation identified in RCC-JW seems to have no effect on the H3K36me3 activity of the SETD2 protein, as the level of global trimethylated H3K36 was not decreased in this cel l line. Given the decrease of global trimethylated H3K36 levels in a large subset of our cRCC cell line panel , global H3K36me3 might play a tumorsuppressive role in proximal epithelial tubu lar cells. The observed decrease of global trimethylated H3K36 in cRCC cel l lines in which no mutations in SETD2 were identified implies that, besides the loss of methyltransferase activity of SETD2, other mechanisms might also result in the loss of H3K36me3. Altogether, our resu lts provide a strong basis for the involvement of loss of SETD2 function in the development of cRCC.
- - - - --- --- --H3K36me3 H3K36me2 H3
Figure 3. Global histone methylation levels in cRCC cell lines. Global H3K36me3 and H3K36me2 levels in cRCC-derived cell lines as detected by Western blot analysis. H E K293T samples were included as positive controls. Histone 3 (H3) levels were used as a loading control.
28 CHAPTER 2

REFERENCES Jemal A , Siegel R, Ward E, Hao Y, X u J , Thun MJ . Cancer statistics, 2009. CA Cancer J Clin 2009;59 :225-49.
Knudson AG , Jr. Mutation and cancer: statistical study of retinoblastoma. Proc Natl Acad Sci U S A 1971; 68: 820-3.
Gnarra JR, Tory K, Weng Y, et al. Mutations of the VHL tumor suppressor gene in renal carcinoma. Nat Genet 1994;7:85-90.
N ickerson ML, Jaeger E, Shi Y, et al . Improved identification of von Hippel-Lindau gene alterations in clear cell renal tumors. Clin Cancer Res 2008;14:4726-34.
Van den Berg A, Dijkhuizen T, Draaijers TG , et al. Analysis of multiple renal cell adenomas and carcinomas suggests allelic loss at 3p2 1 to be a prerequisite for malignant development. Genes Chromosomes Cancer 1997;19:59-76.
Noensie EN, Dietz HC. A strategy for disease gene identification through nonsense mediated mRNA decay inhibition. Nat Biotechnol 2001 ;19:434-9.
lonov Y, Nowak N, Perucho M, Markowitz S , Cowell J K. Manipulation of nonsense decay identifies gene mutations in colon cancer cells with microsatellite instability. Oncogene 2004;23:639-45.
Huusko P, Poncinano-Jackson D, Wolf M, et al. Nonsense-mediated decay microarray analysis identifies mutation of EPH B2 in human prostate cancer. Nat Genet 2004;36:979-83. Muggerud AA, Edgren H, Wolf M, et al. Data integration from two microarray platforms identifies bi-allelic inactivation of R I C8A in a breast cancer cell line . BMC Med Genet 2009;2:26-34.
Du P, Jibbe WA, Lin S M. Lumi: a pipeline for processing lllumina microarray. Bioinformatics 2008;59:1547-8.
Lin SM, Du P, Huber W, Kibbe WA. Modelbased variance-stabilizing transformation for llumina microarray data. Nucleic Acids Res 2008; 36:e11.
Bardelli A, Parsons D, Silliman N , et al. Mutational analysis of the tyrosine kinome in colorectal cancers. Science 2003;300:949.
Dalgliesh G L, Furge K, Greenman C , et al. Systematic sequencing of renal carcinoma reveals inactivation of histone modifying enzymes. Nature 2010;463:360-3.
Kok K, Osinga J, Carritt B, et al. Deletion of a DNA sequence at the chromosomal region 3p21 in all major types of lung cancer. Nature 1987;330:578-81.
Mao M, Fu G, Wu J-S, et al. Identification of genes expressed in human CD34+ hematopoietic stem/progenitor cells by expressed sequence tags and efficient full-length cDNA cloning . Proc Natl Acad Sci U S A 1998;95:8175-80.
Rega S, Stiewe T, Chang D-1 , et al. Identification of the full-length huntingtin-interacting protein p231 H B P/HYPB as a DNA binding factor. Moll Cell Neurosci 2001 ;18 :68-79.
Miremadi A, Oestergaard MZ, Pharoah PDP, Caldas C. Cancer genetics of epigenetic genes. Hum Mol Genet 2007;16: Spec No. 1 :R28-49 .
El Sarakbi W, Sasi W, Jiang WG , Roberts T , Newbold RF, Mokbel K. The mRNA expression of SET D2 in human breast cancer: correlation with clinico-pathological parameters. BMC Cancer 2009;9:290-6.
Edmunds JW, Mahadevan LC, Clayton AL. Dynamic histone H3 methylation durin g gene induction : HYPB/SET D mediates all H3K36 trimethylation . EMBO J 2008;27:406-20.
Yoh S M, Lucas JS, Jones KA. The lws1 :Spt6:CT D complex controls cotranscriptional mRNA biosynthesis and HYP/Setd2-mediated histone H3K36 methylation . Gene Dev 2008;22:3422-34.
Kolasinska-Zwierz P, Down T, Latorre I, Liu T, Liu XS, Ahringer J . Differential chromatin marking of introns and expressed exons by H3K36me3. N at Genet 2009;41 :376-81.
SETD2 IS A NOVEL TUMOR SUPPRESSOR GENE I N ccRCC 29

S U PPLEMENTARY FIGU RES AND TABLES
RCC1
RCC4
RCC5 RCC-AB RCC-ER RCC-FG2 RCC-HS RCC-JF RCC-JW RCC-MF RCC-WK
T- 1 T-2 T-3 T-4
T-5 T-6 T-7 T-8 T-9
T-10
T-1 1
Supplementary Figure 1. Schematic overview copy number loss of the short arm of chromosome 3 for the individual clear cell renal cel l carcinoma samples. Red lines correspond to regions with copy number loss. Black lines correspond to regions which do not show copy number loss. Blue horizontal line: smallest region of overlap of copy number loss, which ranges from 2 1 .4 Mb to 69.6 Mb from Pter.
30 CHAPTER 2

(A)
(B)
(C)
(0)
(E)
2
2
A A A C T T A G G T T G G G A C T T
{\ f\ ____J
A A A C T T A G ! T T G G G A C T T
A A A G A A C A C A C A C T C A C A G T C
�G-_-_-_-_-_-_ _ -_-_-T�C-A.,._,C__,A_G�
2
1 ,
2
2
G T G G C T C A A C G G G A G G C T C
1 \/\f\ l\l\ I\
,-ll '\ T C A A
G A G A C T C T T
I _\&_J1_ _ _f\�f-
G A G A C T C T T
C A G A T A A T A
C ! G A T A A T A
* {\ I\
• • u.-1' - I G G G A G G C T C
T A T C T A A A G T
i"""
! A T C T A A A G ;:
G A T G C C A C T C
.A A T G C C A C T C
l\!�A I 'yj/\l I /\Ml\ I\
3 1. {\ f\ . J\ I\ I\
C ! G A T A A T A G A T G C C A C T C
G C A G T G A C T A C A A T A G T T
/\' . f\ t I\ . ' t G C A G T G A C T i
* C A A T A G T T
(F) 2 [\/ /\/\/ I /\, I [\ I
Supplementary Figure 2. Mutation analysis SETD2 gene: sequencing (a-f) and PCR amplification of cDNA (g) to check for mutations and aberrant transcripts. a. Sequence ana lysis of part of exon 3 of SETD2. ( 1 ) Wi ld type. (2) RCC-JW, showing the hemizygous c.3829G> T mutation (*). b. Sequence ana lysis of part of exon 1 1 of SETD2. ( 1 ) Wild type . (2) RCC-MF, showing the hemizygous c. 5330_5338de lAA CA CA CA C mutation (*). c. Sequence ana lysis of part of exon 1 5 of SETD2. ( 1 ) Wi ld type. (2) RCC-AB, showing the hemizygous c.6447de/C mutation (*). d. Sequence ana lysis of part of exon 3 of SETD2. ( 1 ) Wi ld type. (2) RCC-ER, showing the hemizygous c.20 1 lT>A mutation (*). e. Sequence ana lysis of part of exon 7 of SETD2. ( 1 ) Wi ld type. (2) Primary clea r cel l rena l ce l l carcinoma tumour T-3, showing the hemizygous c.4899G>A mutation (*). (3) Corresponding norma l kidney tissue does not show the mutation, indicating that the mutation is somatic. f. Sequence ana lysis of part of exon 1 6 of SETD2. (1) Wi ld type. (2) Primary clear cel l rena l cel l carcinoma tumour T-4, showing the hemizygous c.7 1 1 3A>G mutation (*). (3) The same mutation was found in the correspond ing norma l kidney tissue, indicati ng a germl ine orig in . g. PCR ampl ified cDNA fragments of exons 1 5-2 1 of the SETD2 transcript. Cel l l i ne 1 : RCC-FG2, 2: RCC-5, 3 : HK-2 (immortalized PTEC cell line) . RCC-FG2 shows a PCR product of norm a I length for exons 1 5- 1 7 and exons 1 7-1 8 , but n o product if the reversed primer is situated downstream of exon 1 8 . This indicates aberrant spl ic ing leading to loss of exons 1 9-2 1 . 3
(G)
G C A G T G A C T A /i C A A T A G T T
15-17 17-18
1 2 3 1 2 3
- - -17-19
1 2 3
- -
17-20
1 2 3
- -17-21 Exons
1 2 3 Cell line
--
---
SETD2 I S A NOVEL TU MOR SUPPRESSOR G E N E I N ccRCC 31

NP 054878 . 5
XP 516423 . 2
XP 864 158 . l
XP 5898 8 6 . 3
NP 00107480 9 . l
XP 23 6648 . 4
XP 4 18510 . 2
1599
1584
1597
1582
1070
14 60
1 3 97
NKNXHYYFMALKNDBX
,
TQKGNCSR ... NHSCBPNCBTOIOO'rVNGOLRV NKNIH'iYPMALKNDEI TOKGNCSRPMNHSCEPNCETOKWTVNGQLRV
NKNIH'iYPMALKNDEI TOKGNCSRFMNHSCEPNCETOKWTVNGQLRV
NKNIH'iYFMALKNDEI TOKGNCSRFMNHSCEPNCETOKWTVNGOLRV
NKNIH'iYFMALKNDEI TOKGNCSRFHNHSCEPNCETOKWTVNGQLRV
NKNIH'iYFMALKNDEI TQKGNCSRFMNHSCEPNCETQKWTVNGQLRV
NKNIH'iYPMALKNDEI TQKGNCSRPMNHSCEPNCETOKWTVNGQLRV
cRCC primary tumour: T-8. Amino acid change: D1616N
NP 054878 . 5 2345 VVQPAMVT
I
VAPGQPQPLQPSBMVVTNNLLDLPPPSPPKPKTXVLPPN XP 516423 . 2 2330 VVOPAAAVT VAPGQPOPLOPSEMVVTNNLLDLPPPSPPKPKTIVLPPN
XP 864 158 . l 2343 VVQPATAVT VAPGQPOPLOPPEMVVTNNLLDLPPPSPPKPKTIVLPPN
XP 589886 . 3 2 328 VVQPTAAVT VAPGQPOPLOPPEMVVTNNLLDLPPPSPPKPKTIVLPPN
NP 00107480 9 . 1 1815 VVQPTAAVT VAPGQPOSLQPPEMVVTNNLLDLPPPSPPKPKTIVLPPN
XP 23 6648 . 4 2205 VVQPAAAVT VAPGQPQPLOPPEMVVTNNLLDLPPPSPPKPKTIVLPPN
XP 418 510 . 2 2135 IVQPPPAVT VAAGQPOPIQQPELVVTNNLLDLPPPSPPKPKTIVLPPN
cRCC primary tumour: T-4. Amino acid change: T2354A
NP 054878 . 5
XP 516423 . 2
XP 864 158 . l
XP 58988 6 . 3
NP 00107480 9 . l
XP 23 6648 . 4
XP 4 18 510 . 2
1253
1238
12 4 9
1234
723
1117
1052
BBL
l
DPS-OBKPSTTYOOPDSSYGACGGHKYOONABQYGGTRD11WQ EELRN DFS- QEKPSTTYQQPDSSYGACGGHKYQQNAEQYGGTRDYWO
EELRNL EPSQQEKPTTTYQQPDSSYGACGGHKYQQSAEHYGGTRNYWQ
EELRNL DPSQQEKPTTTYQQPDSSYGACGGHKYQQSAEQCSGARSHWQ
EELRNL DFSQQERPTTTYQQPDSSYGTCGTHKYQQSTEHYGGTHNYWQ
EELRNL DPSQQERPTTTYQQPDSSYGTCGTHKYQQSAEHYGGTHDYWQ
EGMGG ELQ-AEKPSSTYQQPDSSPGWSGYWQPGTGAYSSSQNCWQ
cRCC cell line: RCC-JW. Amino acid change: G1259V
P1otelnAcc. Gent 019anlsm
IIP -°'""71 5 SETD2 Homo sapiens XP _,1o-i:) Z SETD2 Pan lroglodytes "-�1� 1 SETD2 Canis lupus fam,t,ans XP_!580380.3 SETD2 Bos taurus IIP_001074:)()II 1 Seld2 Mus musculus XP_� 4 Setd2 Rattus nol\'tgocus XP _411510 Z SETD2 Gallus gallus
1648
1633
164 6
1631
1119
150 9
14 4 6
2394
237 9
2392
2377
1864
2254
2184
1301
1286
1298
1283
772
1166
1100
Supplementary Figure 3. Conservation SETD2 protein across species. Amino acids for which missense mutations were identified ( in red squares) a re shown together with their su rrounding amino acids . Conservation is shown across 7 different species (according to Homo/ogene) .
32 CHAPTER 2

Supplementary Table 1. Characteristics primary ccRCC tumor samples.
Tumour Age at diagnosis Sex
T- 1 70 F T-2 60 M T-3 67 M
--T-4 66 F T-5 66 M
T-6 46 F T-7 52 M T-8 84 F T-9 68 M T- 1 0 82 F T- 1 1 70 F
TNM
pT1 aGxNxMx
pT3bG3-4NxM0 pT3bG 1 NxM0 T2G 1 N0M0 pT1 aG2NxMx pT1 G 1 NxMx
T2G 1 N0M0 pT3abG4NxMx pT1 aG2NxM0
pT1 G2bN0Mx T3G3N 1 M0
Stage
?
I l l - -I l l
I l l ?
?
I I ?
?
?
I l l
Diagnosis (WHO)
Clear ce l l rena l ce l l ca rcinoma
Clear ce l l rena l ce l l carcinoma
Clear cel l rena l cel l ca rc inoma ----
Renal cel l ca rc inoma Clear ce l l rena l cel l carc inoma C lear cel l rena l ce l l carcinoma
Clear ce l l rena l ce l l carcinoma Clear ce l l rena l cel l ca rc inoma Clear ce l l rena l ce l l carcinoma
Clear ce l l rena l cel l ca rc inoma Clear cel l rena l ce l l carcinoma
Supplementary Table 2 . Overview of SETD2 mutations identified in ccRCC samples
Sample DNA mutation ccRCC cel l lines
RCC-AB Hem c.6447delC --
RCC-ER Hem c.20 1 ?T>A RCC-FG2 unknown RCC-J F Hem.c41 89T>C RCC-JW Hem c.3829G > T
-------
-- - - -
RCC-MF Hem c.5330_5228delAACACACAC ccRCC primary tumours
T-3
T-4 c.4899G>A
c.7 1 1 3A>G
Effect on mRNA Effect on protein
del exons 1 9-2 1
R2 1 32fsX1 3 L655X unknown - --none G 1 259V 1 7 60-1 7 62del NTH
D 1 6 1 6N
T2354A
Hem: hemizygous, de l : deletion. NCB I Reference Sequence: N M_01 4 1 59.6, NP _054878 .5
SETD2 I S A NOVEL TUMOR SU PPRESSOR G E N E IN ccRCC 33

Supplementary Table 3. Prediction program scores for identified missense mutations
mutation Conservation
Sample cDNA level protein level nucleotide (0.0-1.0) Amino acid
RCC-JW Hem c.3829G > T G1259V 0.8 highly - - -T-3 c.4899G>A D1616N 1.0 highly
T-4 c.7113A>G T2354A 1.0 highly
S I FT PolyPhen
median sequence Sample predicted to score conservation prediction
RCC-JW affect protein 0.02 4 .32 possibly function damaging
T-3 affect protein 0.00 4 .32 benign function --
T-4 affect protein 0.00 4 .32 benign function
up to
Opossum
Chicken
Chicken - -
PSIC score difference
1.994
1.436
1.344
physiochemical difference
moderate
small
small
G rantham AGVG D distance (0-21 5) prediction
109 C15
23 C15
58 C55
* Based on the Grantham scores, the amino acid substitution in RCC-JW is expected to have a significant biochemical effect. (Grantham score: 1 09). The amino acid substitutions in T-3 and T-4 are not expected to have a significant biochemical effect (Grantham scores: 58 and 23). * According to the AGVGD prediction program, the identified variant in T-4 is likely to interfere with protein function (score: C55) , while the variants identified in T-3 and RCC-JW are less likely to interfere with protein function (score C 1 5) . (CO: not likely to interfere with fun ction, C65: most likely to interfere with function) * According to the SIFT prediction program, all three identified variants affect the function of the protein.(median sequence conservation =4.32, low confidence) * According to the Polyphen prediction program, the variant identified in RCC-JW has a "possibly damaging"effect (PS/C score: 1 . 994). T he variantes identified in T-3 and T-4 are not predicted to have a pathogenic effect (PSIC scores: 1.344 and 1.436). Hem: hemizygous, del: deletion. NCB I Reference Sequence: NM_014159 .6, NP _054878.5


EVALUATIO N O F TH E USE O F G I N I I N TH E
SEARCH FOR TU MOR S U P P R ESSOR G EN ES
Duns G 1 , Van den Berg E 1 , Va n Duivenbode 1 1 ,
S ietzema J G 1 , Osinga J 1 , Ho l lema H2, H ofstra RMW1 , Kok K 1
Depa rtments of 1 Genet ics a n d 2Patho logy a n d M ed ica l B io logy, U n ivers ity Med ica l Centre G ron ingen , U n ivers ity of G ron ingen ,
G ro n i ngen , the Netherl ands

ABSTRACT
Gene Identification by Nonsense mediated mRNA decay Inhibition (GINI) provides a promising possibility to identify putative tumor suppressor genes (TSGs). We applied a GINI strategy to a panel of ccRCC-derived cell lines and identified SETD2 as a novel ccRCC tumor suppressor gene, as described in Chapter 2. Here, we describe the appl ied GINI strategy in more detail. Moreover, we evaluate the use of GINI in the search for TSGs by using the current knowledge on ccRCC genetics. We show that GINI has some intrinsic limitations. TSGs that code for relatively small proteins and/ or have only a limited number of exons appear to have a l imited chance on being identified by GINI. Moreover, the succes of the method is dependent on the quality of the used gene expression platform.
38 CHAPTER 3

INTRODUCTION
Tumor suppressor genes are in general inactivated by large deletions, mutations that alter the amino acid sequence of the protein, or mutations that introduce a premature termination codon (PTC), which include nonsense mutations, out-of-frame indels or a splice site mutation. In the majority of cases, the presence of a PTC does not result in the production of truncated proteins, but rather induces accelerated decay by nonsense mediated mRNA decay (NMD) (Anczukow et al., 2008; Karam et al. , 2008; Mort et al., 2008; Perrin-Vidoz et al., 2002).
In 2001 Noensie and Dietz described a method for the genome-wide identification of transcripts that harbor a PTC in cell lines. They pharmacologically inhibited nonsense mediated mRNA decay (NMD) by the translational inhibitor emetine dihydrochlorate. This results in the accumulation of a subset of transcripts harboring PTCs and the increased transcript levels can be measured using gene expression microarrays. The presence of the PTC in the transcript can be confirmed by Sanger sequencing (Noensie and Dietz, 2001).
Gene Identification by Nonsense-mediated mRNA decay Inhibition (GINI) provides a promising possibility to identify putative tumor suppressor genes (Huusko et al., 2004; Ivanov et al., 2007). We applied a GINI strategy in our search for tumor suppressor genes involved in the development of clear cell renal cell carcinoma (ccRCC). We combined several methods and criteria to maximize the chances of finding ccRCC tumor suppressor genes and, at the same time, minimize the number of false-positive candidates that hampered the analysis of GINI strategies described earlier. Here, we describe the GINI strategy that led to our identification of histone methyltransferase SETD2 as a new ccRCC tumor suppressor (Duns et al., 2010). Moreover, using the known ccRCC tumor suppressor gene VHL (Gnarra et al., 1994; Nickerson et al., 2008) and the recently identified ccRCC tumor suppressor gene PBRM1 (Chapter 5 of this thesis; Varela et al., 2011) as examples, we describe the intrinsic limitations of using GINI in the search for tumor suppressor genes.
MATERIAL AND METHODS
Cel l l ines
Prostate cancer cell line Du145 was obtained from the American Type Culture Collection, Manasses, Virginia, USA, and maintained in DMEM (Sigma-Aldrich, St.Louis, MO, USA). The previously described splice site acceptor mutation introducing a PTC in MLH1 and the hemizygous nonsense mutation in EPHB2 in DU145 (Huusko et al., 2004) were confirmed in this cell line using capillary Sanger sequencing.
The ccRCC-derived cell lines RCC-AB, RCC-ER, RCC-FG2, RCC-HS, RCC-J F, RCC-JW, RCC-MF, and RCC-WK were obtained from Cell Line Services, Eppenheim, Germany. The cells, which tested negatively for Mycoplasma, bacteria, and fungi, had been passed 10 to 13 times upon arrival (as stated by Cell Line Services). Experiments were performed on cells that had undergone six to eight additional passages. cRCC
THE USE OF GINI IN THE SEARCH FOR TUMOR SUPPRESSOR GENES 39

cell l ines RCC-1 , RCC-4, and RCC-5 were established by Dr. C.D. Gerharz (Institute of Pathology, University Hospital, Dusseldorf, Germany) and karyotyped. To ensure their authenticity, they were recently re-karyotyped. All ccRCC cell lines were maintained in RPMI 1640 (Sigma). MN160 and PTEC are primary cu ltures derived from proximal tubular epithelial cells. DNA was purified using a phenol/chloroform extraction method.
ArrayCG H ArrayCGH was carried out using Agi lent Human Genome CGH Microarray 244a slides (pin G4411 B) following the manufacturer's protocols. Slides were scan ned using the
G25052C DNA microarray scanner (Agilent Technologies, Santa Clara, CA, USA). Array images were analyzed using Agilent feature extraction software (v10.5.1.1 ) and DNA analytics (Agilent).
GIN I Cells were grown to 70% conf luence and either treated with emetine dihydrochloride hydrate (100 µg/ml medium) or caffeine (10 mmol/L in medium), or not treated. Following 8 hours of incubation at 37 °C, cel ls were harvested. Experiments were performed in du plicate. RNA was isolated using the RNeasy Mini Kit (Oiagen, Ven lo, the Netherlands).
Transcript abundance in treated and u ntreated cells was measured using Human HT-1 2_V3_Beadchips (48K; lllumina, San Diego, CA, USA). The Lumi package implemented in R (Du et al., 2008; Lin et al. , 2008) was used for variance stabilizing transformation followed by robust spline normalization of the microarray data (GEO accession no. GSE20491 ). GeneSpring GX 10.0 (Agilent) was used to calcu late treatment-induced fold changes.
Mutation analysis Mutational analysis of SETD2 in the panel of ccRCC-derived cell lines is described in Chapter 2. Mutational analysis of PBRM 1 and VHL in the panel of ccRCC-derived cell lines and primary tumors is described in Chapter 5. Nine and ten PCR primer sets were designed to amplify and sequence exons and exon-intron boundaries of AR/D3A, and AR/D5B, respectively, an notated in the human genome (National Center for Biotechnology Information). Amplified PCR products were purified using EXOSAP IT (GE Healthcare, Little Chalfont, Buckinghamshire, UK) and sequenced using BigDye Terminator chemistry (Applied Biosystems, Foster City, CA, USA). Reaction products were run on the ABl3130XL Genetic Analyzer (Applied Biosystems). Sequences were evaluated using Mutation Surveyor (SoftGenetics LCC, State College, PA, USA). The following primers were used: ARID3A: exon 1_F: CGGCCAGGTATTTGCATCCG, exon 1_R: CACCAACATCTCCGCCCAAC, exon 2a_F: CTGCATCCTGCATGAGATGG, exon 2a_R: CCATCACGGCCTGTAGTTTC, exon 2b_F:CAGGGCCATGAAACTACAG, exon 2b_R: CACTCAGAGCCAGTAACAG, exon 3_F: GCCGGCTCTTCCTATTTCCAGAGA, exon 3_R: GCAACGTGGGCCTTCAAAGGG, exon 4_F: CTCCAGTGCAGGAGGGACATGGT, exon 4_R: CTCACCACCGCCCCGACATACC, exon S_F:
40 CHAPTER 3

GGTGGATAAACCGAGGCAGAGCTG, exon S_R: CCTCGCACCCCTACTTGACGC, exon 6_F: G GTGGTGCCACAGTGG GGTTTAC, exon 6_R: ACCCAGAGAGG GGAAGAGGTATCC, exon 7 _F: TCGCACCATTGCACTCCAG , exon 7 _R : ATGTAGG CTCCAAGGCCCTCAC, exon 8_F: CAGAGCTTGCAGTGAGCTG , exon 8_R : taccgggtgaacgatggtat. AR I DS B : exon 1 a_F: ACATGG CAGTGAGGAAGC, exon 1 a_R : AGAGAAAGGCGCCATACG, exon 1 b_F: TGCCTTGATCCATCCTCTTC, exon 1 b_R : ATACAGACGACCCAACAG, exon 2_F : CCCAGCGTTATATCTGTTGGGTCGT, exon 2_R : GGAGTCGATCCTGCTTGCCTGC, exon 3_F: TGGGCCTTGTGGAGAGTGGATCA, exon 3_R : ACCCATCCAGTCATCTCTCCATCC, exon 4_F : GCTGGCATCCCCCAGACTGTAA, exon 4_R : CCCGTTCCCCATCACCGCTCTT, exon S_F: TGTAATAATGAGGGCTGCCTGCCAC, exon S_R : TGCCTCCAAGACACAGGCACAGA, exon 6_F : TACCGGTTCACCCTTAGCAC, exon 6_R: TCCAATTCAAAGAATCTGAGCA, exon 7 _F: CTTTGGGCAAATTGTTTCCT, exon 7 _R: CCCAATAAACCCCAAAAGT, exon 8_F : TTCTCTGTTTCTGG GTTTCCAG, exon 8_R: TTTCAGTTTCCCAAAAGGTCA, exon 9_F: CCATAGCATTGATGCTACTGGA, exon 9_R: CATCAAGCCATCCAACTGTG .
Quantitative RT-PCR
RT-PCR was performed on G I N I samples to assess PBRM 1 transcript l eve ls . RNA was reverse transcribed us ing the Fermentas RevertAid H minus first strand cDNA kit (Thermo Fisher Scientific, Wa ltham, Massachusetts, U SA) . SybrGreen RT-PCR was performed i n a tota l vo lume of 10 u l us ing a 384-we l l m icrowel l p lates and the AB l7900HT Fast RT-PCR system (Appl ied B iosystems, Foster City, CA, U SA) The fo l lowing primers were used for PBRM 1 : Forward : TGCAGAGGCCAACCTACAAC, Reversed : TCGTGTAGCCAGGTGGAATG . The housekeeping gene TBP was used as a reference (forward primer: GCCCGAAACGCCGAATAT, reversed primer: CCGTGGTTCGTGGCTCTCT) . Al l PCR experiments were performed in trip l i cate.
RESULTS AND DISCUSSION
NMD inhibition by emetine and caffeine treatment
Pharmacologica l i nh ibition of N M D induces a cel l u l a r stress response (Noensie and Dietz, 2001 ) . Therefore, t he l i st o f transcripts that show an i ncrease in abundance as a result of N M D inh ib ition not on ly inc ludes transcripts that harbor premature term ination codons ( "PTC transcripts") , but a l so transcripts encoded by upregu lated " stress response genes " . Severa l approaches have been used in earl ier G I N I surveys to reduce the number of these fa lse-positives and to obta in a l im ited l i st of cand idate PTC transcripts . These approaches inc lude a combination of N M D inh ibition with transcriptiona l i n h ibition by actinomycin D (Huusko et a l . , 2004; Ivanov et a l . , 2007), and the use of s i RNA-med iated knockdown of proteins essentia l for N M D (Huusko et a l . , 2004) .
We anticipated that treatment of cel l s by compounds that block N M D via d ifferent mechan isms wou ld excite different stress responses. A combination of treatments with d ifferent compounds cou ld therefore be used to exc l ude treatment-specific stress
TH E USE OF G I N I I N THE S EARCH FOR TUMOR SUPPRESSOR G E N ES 4 1

response genes. In an attempt to obtain a selective list of candidate PTC transcripts in ccRCC-derived cel l lines, we combined two different methods of inhibiting the NMD that were used in earlier GINI screens:
( 1 ) t reating the cells with emetine dihydrochlorate (we will refer to this inhibition as emetine treatment) (Noensie et al . , 2001 ). This inhibits the movement of the ribosome along the nascent transcripts. As a result, the so-cal led " pioneer round of translation" , which is essential for N MD, cannot take place ( lshigaki et al., 2001 ).
(2) treating the cells with caffeine (Ivanov et al . , 2007). This inhibits the phosphorylation of Rent1 (hUpf1) by SMG-1, a process which is essential for NMDinduced mRNA degradation (Brumbaugh et al., 2004; Ohnishi et al., 2003).
GIN I val idation To validate these methods, we first app lied them to the human prostate cancer cel l line DU145, which harbors truncating mutations in MLH1 and EPHB2 (Huusko et al., 2004). Emetine- and caffeine-treatment of DU 145 resulted on average in 2.6- and 2.8-fold accumulation for MLH1 and 2.1- and 2.1-fold accumulation for EPHB2 transcripts, respectively, as assessed by RT-PCR (Figure 1).
We then checked if gene expression microarrays could be used to identify these treatment-induced increases in transcript levels. MLH1 showed emetine- and caffeineinduced fold changes of 3.9 and 2.3, respectively, for EPHB2, this was 1.6 and 1.4, respectively (data not shown). Thus, gene expression microarrays can be used to identify NMD-inhibition-induced increases in the abundance of PTC transcripts.
4.5
4.0
3.5
3 .0 � . g- 2.5
2.0
-� 1.5
1.0
0.5
0.0
,$' � ,$' .t' .t' - �e )c...V
cl
� ,$' - �e ��e KV
cl �e «;
Samples
� ��e
�<l, «;
■ EPHB2
D MLH1
Figure 1 . I ncreased transcript levels of MLH1 and EPHB2 as a result of NMD inhibition in the prostate cancer- derived cell line DU1 45 .
42 CHAPTER 3

GIN I i n ccRCC We subsequently applied GINI in the search for tumor suppressor genes involved in ccRCC development. We used a combination of methods and criteria to increase our chances of identifying tumor suppressor genes, while at the same time limiting the number of false-positive candidate PTC transcripts.
Loss of the short arm of chromosome 3 (3p) is frequently observed in ccRCC tumors, which suggests the presence of tumor suppressor(s) in this region (Knudson et al., 1 97 1 ). To increase the chance of identifying these genes, we selected ten ccRCCderived cell lines showing copy number loss of 3p, as assessed by arrayCGH (This thesis: Chapter 2). We anticipated that a gene which is inactivated in a majority of tumors has a considerable chance of being inactivated by a mutation introducing a PTC that elicits NMD in at least one of the cell lines, although most likely not in all of them. In addition, we used two proximal tubular epithelial cell (PTEC) samples as reference. The transcript levels in these samples should reflect the "normal" situation. We inhibited NMD in the ccRCC-derived cell lines by treating them with emetine or caffeine.
Filtering steps Transcript levels in treated and untreated cells were assessed using gene expression microarrays. For each ccRCC-derived cell line, lists of probes were generated that showed emetine- or caffeine-induced increase of transcript levels. We arbitrarily selected the top 1 000 probes with the highest treatment-induced fold changes. To limit the lists of candidate PTC transcripts, we applied the following three criteria (summarized in Figure 2):
(1 ) To eliminate treatment-specific stress response genes, transcripts that showed increased transcript levels after only one of the two treatments were eliminated. This resulted in a list of 203 (range 1 21 -321 ) probes on average per cell line.
(2) Genes were then selected based on their genomic location. 1 4 probes (representing 1 4 genes) that passed filtering step #1 in one or more of the cell lines were located on the short arm of chromosome 3, including the RASSF1 gene, an isoform of which is a known physiological NMD transcript (Mendell et al., 2004).
(3) The "GINI profiles", i.e., the transcript levels in the wild-type (WT) and treated samples, of the 1 3 other genes were visually inspected for a so-called "PTC profile" : due to NMD, PTC transcripts should be significantly less abundant than their non-PTC harboring counterparts (in PTECs as well as in the other ccRCC-derived cell lines). Emetine- and caffeine-treatment should restore the abundance of PTC transcripts to a level that resembles the wild-type transcript levels. The expected transcript levels for a hypothetical gene harboring a premature termination codon in two of the cell lines are shown in Figure 2.
This last filtering step, comparing transcript levels in other untreated cell lines of comparable nature as a selection criterion, has been described previously (Rossi et al. , 2005). This is however clearly not without risks, as transcript levels of several genes will likely vary, even between cells of the same origin. So for genes that show fluctuating transcript levels between the different untreated samples, the criteria should be applied less stringently.
THE USE OF GIN! IN THE SEARCH FOR TUMOR SUPPRESSOR GENES 43

1. & 2. 3. PTC profile
1 2 ··•·••·•··•·•·•••••·•••·•··•····•·••·•·• ••·•··•••·••·•·••·••···········•·•··•···••·•··•·•·••••·••·••···•··•·••·•··•·•··•·••••·••••··
08 .. .... .
D B
0.4
0 2 .. . . . . .
* *
: r r
Figure 2. Overview of our G IN I strategy. The graph shows the expected transcript levels for a hypothetical gene that harbors mutations introducing a premature termination codon in tumorderived cell lines T-3 and T-6. LOH: loss of heterozygosity, PTC: transcript harboring premature termination codons, N: "normal" cells, T: tumor-derived cell line.
SETD2 is the only gene out of the 1 3 candidates on 3p that fitted all
these cr iteria.
The GINI patterns of SETD2 in RCC-AB and RCC-ER were indicative for the presence of a premature termination codon : in untreated RCC-AB and RCC-ER cel ls the SETD2 transcript abundance was low compared to the other cell l ines. Emetine- and caffeine treatment resulted in the accumulation of SETD2 transcripts in RCC-AB and RCC-ER (Figure 3).
We indeed identified a 1-bp deletion introducing a frameshift and a nonsense mutation in RCC-AB and RCC-ER, respectively (Duns et al . , 2010). A screen for mutations other than those causing premature termination codons in the other ccRCC-derived cell l ines revealed inactivating mutations in three of them. A h uge sequencing project on ccRCC tumors by Dalgl iesh et al. (2010) identified truncating mutations in SETD2 i n 12 out of 407 (3%) clinical ccRCC specimens, providing in vivo
evidence for SETD2 being a candidate ccRCC tumor suppressor gene (Dalgliesh et al., 2010). SETD2 is located at 3p21 and encodes a histone methyltransferase that is nonredundantly responsible for trimethylation of lysine 36 of histone 3 (H3K36me3) (Edmunds et al. , 2008).
False-positives
Given the emerging role for deregulated chromatin regulation in ccRCC pathogenesis, we re-analyzed our data, and focused on PTC profiles for genes with a function in chromatin regulation. We saw possible PTC profiles for the genes coding for the chromatin remodeling proteins ARID3A and AR/05B i n five and two cell lines, respectively (Figure 4).
However, we did not identify any tru ncating mutations by capillary Sanger sequencing in these genes.
44 CHAPTER 3

1 1 .0�---------------------� Ill QJ :::J ro 10.0 ...... .......................... .................... . . . . . . .......... ...................................................... . > >-� Ill C QJ
+-' C
9.0
13 8 .0 .
ro § 1 .0 . 0 z
■ Untreated ■ Caffeine □ Emetine
Figure 3. Effect of nonsense-mediated mRNA decay inhibition on SETD2 transcript levels in ccRCC-derived cell lines. For each cel l l ine, SETD2 transcript levels a re shown in untreated, caffeine-treated and emetine-treated cel ls , respectively. Normal ized intensity values are shown on a log2 sca le. Levels below a va lue of 7 a re close to the detection l im it . The dotted horizonta l l ines represent the average transcript levels measured in untreated proximal tubu lar epithe l ia l ce l ls .
False-negatives With the current knowledge on ccRCC genetics and the known mutational status of PBRM1 and VHL in our panel of ccRCC-derived cell lines (Chapter 5 of this thesis), we retrospectively evaluated our GINI strategy and showed that the use of GINI in searching for tumor suppressor genes has some intrinsic limitations.
The VHL gene, located at 3p25 and coding for the Von Hippe! Lindau protein, is a major tumor suppressor gene in clear cel l renal cel l carcinoma. VHL has been shown to be inactivated in a majority of ccRCC tumors (Gnarra et al., 1994; Nickerson et al. , 2008). PBRM1, located at 3p21, and coding for BAP180, the chromatin targeting subunit of the SWI/SNF complex, was recently identified as the second major tumor suppressor gene in ccRCC (Chapter 5 of this thesis; Varela et al., 2011 ). Capillary Sanger sequencing of VHL and PBRM1 in our panel of ten ccRCC-derived cell l ines revealed inactivating mutations in six and five of them, respectively. Three and four of the mutations identified in VHL and PBRM 1 , respectively, introduce premature termination codons. (This thesis: Chapter 5, table 1). However, the GINI profiles for VHL and PBRM1 among the panel of ccRCC-derived cell l ines do not indicate the presence of premature termination codons in any of the ccRCC-derived cell lines (Figure 5). Thus, VHL and PBRM1 exemplify intrinsic drawbacks of using GINI in the search for tumor suppressor genes; this is explained below.
T H E USE OF GINI IN THE SEARC
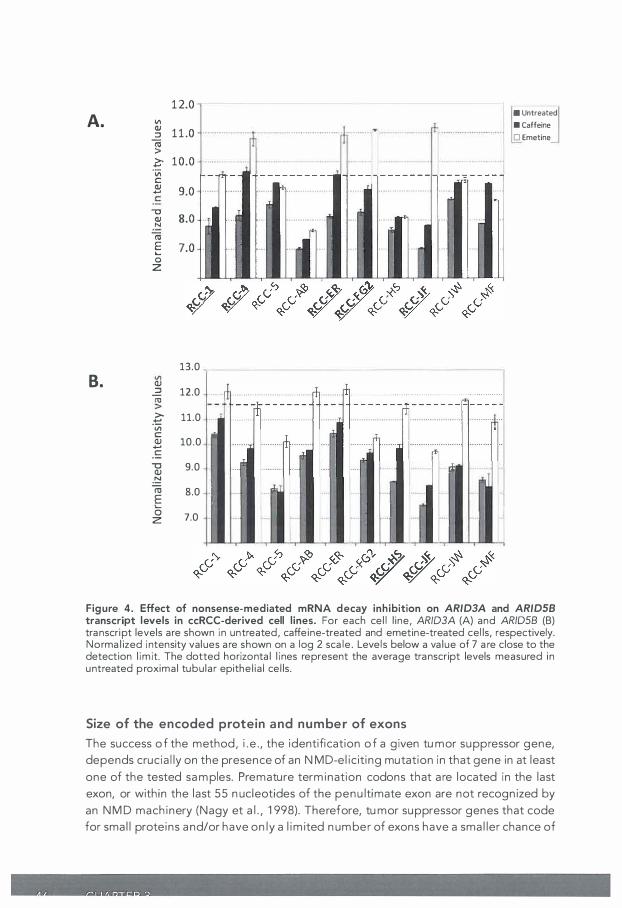
A.
B.
12.0 VI
� 11 .0 (ij > � 10 .0 "vi C 2 9.0 '"C � 8.0
(ij § 1.0 0 z
QJ
�
>-+-' ·u; C: QJ +-' C:
"'C QJ .!::! ro E 0 z
13 .0
12 .0
11 .0
10.0
9.0
8.0
7 .0
-
·····-�
pi
I • . I .... iii • 1, . ··•• . I,
1:
... ,i
... l L, I: I
■ Untreated ■ Caffeine □ Emetine
Figure 4. Effect of nonsense-mediated mRNA decay inhibition on ARID3A and ARIDSB transcript levels in ccRCC-derived cell l ines. For each ce l l l ine , ARID3A (A) and AR/05B (B) transcript levels are shown in untreated , caffeine-treated and emetine-treated cel ls, respectively. Norma l ized intensity val ues a re shown on a log 2 sca le . Levels below a va lue of 7 a re close to the detection l im it. The dotted horizonta l l ines represent the average transcript levels measured i n untreated proxima l tubu lar epithe l ia l ce l ls.
Size of the encoded protein a nd number of exons The success of the method, i .e . , the identification of a given tumor suppressor gene,
depends crucially on the presence of an N M D-eliciting mutation in that gene in at least
one of the tested samples. Premature termination codons that are located in the last
exon, or within the last 55 nucleotides of the penultimate exon are not recognized by
an NM D machinery (Nagy et al. , 1 998). Therefore, tumor suppressor genes that code
for small proteins and/or have only a limited number of exons have a smaller chance of

A. Ill QJ ::::, ro > > +-' 'iii C QJ +-' .S "'C QJ � ro E .... 0 z
12.0..---- ------- -----------,
11.0 -1----··· •-·••············ ............... _ .................... _. ___ ......................... .............. . . - - - - - - - - - - - - - - - - - - - - - - - - - - - - - - - - - - - - - - - · 10.0 ... ..
9.0
8.0
.. . ... .. .............. ______ _ t
.. .. t+ ......
B . 11.0 Ill QJ ::::, ro 10.0 ...................................................................................................................................... . > > .� Ill C QJ +-' .s
'"C QJ .!:::! ro E
9.0 ....... ----------
8.0
0 7 .0 . z
____ ................................ ..
□ Untreated
■ Caffeine
□ Emetine
Figure 5. Effect of nonsense-mediated mRNA decay inhibition on VHL and PBRM1 transcript levels in ccRCC-derived cell lines. For each cel l l ine, VHL (A) and PBRM 1 (B) transcript l evels are shown i n untreated, caffeine-treated, and emetine-treated cel ls, respectively. Norm a l ized intensity va l ues a re shown on a log2 sca le . Levels below a va lue of 7 a re close to the detection l im it. The dotted horizonta l l ines represent the average transcript levels measured i n untreated proxima l tubular epithe l ia l cel ls .
being inactivated by a N MD-eliciting mutation compa red to genes that code for larger proteins and/or contain more exons. Even more, a PTC in a gene containing only one exon will never elicit N MD.
The full VHL gene contains three exons and encodes a protein (VHL30) containing 213 amino acids (lliopoulos et al., 1995). As a result, a relatively large fraction of premature termination codons in VHL in ccRCC tumors is expected to be in a location in which they cannot be detected by the N MD machinery (Figure 6.a). We identified mutations in VHL that introduce a premature termination codon in three out of ten ccRCC-derived cell lines. None of these a re at a position where they could elicit N MD (Figure 6. a), which expla ins why VHL was not picked up in this GI NI screen. In three

A.
COOH
54 213
B.
COOH
1602
Figure 6. VHL and PBRM1 mutations in ccRCC samples. Schematic overview of pVHL (A) and BAF180, encoded by PBRM 1 (8). Colors highlight the protein parts encoded by the different exons. Arrows show the location of the mutations and the corresponding amino acid changes. Underlined: mutations in ccRCC-derived cell lines that introduce a premature termination codon (PTC). PTCs located downstream of * are not recognized by the NMD machinery. For VHL, the region in which a PTC is not recognized by NM D includes 234 nucleotides (fu l l VHL transcript: 642 nucleotides). For PBRM 1 , this region includes 228 nucleotides (full PBRM 1 transcript: 4806 nucleotides). NMD: mutation results in a PTC that is recognized by the NMD machinery. National Center for Biotechnology Information Reference Sequence: NM_00055 1 .3, NP_00054 1 .2 (VHL) and NM_0 1 8 1 65.4, NP_060635.2 (PBRM 1).
out of ten primary ccRCC tumors, we identified mutations in VHL that introduce a PTC. In only one primary tumor (T-e), could the PTC transcript have been potentially recognized by the NMD machinery (Figure 6.a). So, the chance of identifying a given tumor suppressor gene by GINI depends on the size of the encoded protein and the number of exons.
Expression platform
PBRM1 il lustrates how GINI depends on the expression platform used. Screening of PBRM 1 (28 exons, 1602 amino acids) for mutations in our cel l lines revealed four mutations introducing premature termination codons that are all supposed to be detected by the NMD pathway (Figure 6. b) . However, the observed signals for PBRM1 expression were very low in all samples, and none of the probes showed increased
HAPTER 3

transcript levels as a result of NMD inhibition in any of these four cell lines (Figure 5.b) . Using RT-PCR on the GINI samples from RCC-4, we clearly show an increase in PBRM1 transcript abundance as a result of both emetine- and caffeine treatment (Figure 7). Thus, we must conclude that the expression profiling platform we used was not sensitive enough to reliably identify the changes in transcript abundance.
Cell l ines
A further limitation of the GINI strategy is its dependence on dividing cells. Therefore, tumor-derived cell lines have to be available. In order to enlarge the chance of identifying tumor suppressor genes that are mutated in only a small fraction of samples, the GINI strategy should preferably be applied to a large number of cell lines.
CONCLUSION
In conclusion, the GINI strategy has proven to be a very helpful tool in identifying putative tumor suppressor genes. However, as described above, the method has some limitations. The recent development of next-generation sequencing (NGS) technologies makes it possible to sequence large numbers of genes in parallel, making the use of GINI redundant. The method might, however, still be useful in specific cases. For example, Sumitsuji et al. (2003) showed that NMD inhibition fol lowed by cDNA sequencing can be used to rapidly identify mutations in the MLH1 gene, which is large and difficult to sequence, in patients suspected of having hereditary nonpolyposis colon cancer.
§ 5.0 -,-------------------------------, .., C. 'i: 4. 0 u Ill C
� 3.0
-g 2. 0 -� ra E 1 .0
Figure 7. Effect of nonsense-mediated mRNA decay inhibition on PBRM1 transcript levels in ccRCC-derived cell line RCC-4 as assessed by RT-PCR.
THE USE OF GINI I N THE SEARCH FOR TUMOR SUPPRESSOR GENES 49

REFERENCES
Anczukow 0, Ware M D, Buisson M, et al. Does the nonsense- mediated mRNA decay mechanism prevent the synthesis of truncated BRCA 1, CHK2, and p53 proteins? Hum Mut 2008;29:65. Brumba ugh KM, Otterness DM, Geisen C, et a I . The mRNA surveillance protein hSMG-1 functions in genotoxic stress response pathways in mammalian cells. Mol Cell 2004;14:585. Dalgliesh G L, Furge K, Greenman C, et al. Systematic seq uencing of renal carcinoma reveals inactivation of histone modifying enzymes. Nature 2010;463:360. Du P, J ibbe WA, Lin SM . Lumi: a pipeline for processing l l l umina microarray. B ioinformatics 2008;59:1547. Duns G, Van den Berg E, Van Duivenbode I, et al. Histone Methyltransferase Gene SETD2 Is a Novel Tumor Suppressor Gene in Clear Cell Renal Cell Carcinoma. Cancer Res 2010;70:4287. Edmunds JW, Mahadevan LC, Clayton AL. Dynamic histone H3 methylation d uring gene ind uction: HYPB/ SETD2 mediates all H3K36 trimethylation. EMBO J 2008;27:406. Gnarra JR, Tory K, Weng Y, et al. M utations of the VHL tumour suppressor gene in renal carcinoma. Nat Genet 1994;7:85. Hu usko P, Ponciano- Jackson D, Wolf M, et al. Nonsense- mediated decay microarray analysis identifies mutations of EPHB2 in human prostate cancer. Nature Genet 2004;36:979. lliopoulos 0, Kibel A, Gray S, et al. Tumour suppression by the human von Hippel-Lindau gene product. Nat Med 1995;1 :822. lshigaki Y, Li X, Serin G, et al. M aquat LE. Evidence for a pioneer round of mR NA translation: mRNAs subject to nonsense- mediated decay in mammalian cells are bound by CB P80 and CB P20. Cell 2001;106:607. Ivanov I, Lo KC, Cowell J K, et al. Identifying candidate colon cancer tumor suppressor genes using inhibition of nonsense- mediated mRNA decay in colon cancer cells. Oncogene 2007;26:2873. Kaelin Jr. WG . Von Hippel-Lindau disease. Anny Rev Pathol Mech Dis 2007;2:145. Karam R, Carvalho J, Bruno I, et al. The NM D mRNA surveillance pathway downregulates aberrant E-cadherin transcripts in gastric cancer cells and in CDH1 mutation carriers. Oncogene 2008;27:4255.
50 CHAPTER 3
Knudson AG , Jr. M utation and cancer: statistical study of retinoblastoma. Proc Natl Acad Sci U S A 1971 ;68:820. Lin SM , Du P, Huber W, Kibbe WA. Modelbased variance-stabilizing transformation for lllumina microarray data. Nucleic Acids Res 2008;36:e11. Mendell JT, Sharifi NA, Meyers J L, et al. Nonsense surveillance regulates expression of diverse classes of mammalian transcripts and mutes genomic noise. Nat Genet 2004;36:1073. Mort M, Ivanov D, Cooper DN, et al. A metaanalysis of nonsense mutations causing human genetic d isease. Hum M ut 2008;29:1037. Nagy E, Maquat LE. A role for terminationcodon position within intron-containing genes: when nonsense affects RNA abundance. Trends Biochem Sci 1998;23:198. Nickerson M L, Jaeger E, Shi Y, et al. Improved identification of von Hippel-Lindau gene alterations in clear cell renal tumors. Clin Cancer Res 2008;14 :4726. Noensie EN, Dietz HC. A strategy for disease gene identification through nonsense- mediated mRNA decay inhibition. Nat Biotechnol 2001;19:434. Ohnishi T, Yamashita A, Kashima I , et al. Phosphorylation of hUPF1 induces formation of mRNA surveillance complexes containing hSM G-5 and hSMG-7. Mol Cell 2003;12:1187. Perrin-Vidoz L, Sinilnikova O M , StoppaLyonnet D, et a l . The nonsense- mediated mRNA decay pathway triggers degradation of most BRCA 1 mRNAs bearing premature termination codons. Hum Mol Genet 2002;11 :2805. Rossi MR, Hawthorn L, Platt J, et al. Identification of inactivating mutations in the JAK1, SYNJ2, amd CPLTM1 genes in prostate cancer cells using inhibition of nonsense- mediated decay and microarray analysis. Cancer Genet Cytogenet 2005;161 :97. Sumitsuji I, Sugano K, Matsui T, et al. Frequent genomic disorganisation of M LH1 in hereditary non-polyposis colorectal cancer (HNPCC) screened by RT-PCR on puromycin treated samples. J Med Genet 2003;40:e30. Varela I, Tarpey P, Raine K, et al. Exome sequencing identifies frequent mutation of the SWI/SNF complex gene PBRM1 in renal carcinoma. Nature 2011 ;469:539.


THE EFFECT OF SETD2 KNOCKDOWN
ON TRANSCR IPT LEVELS AND
ALTERNATIVE SPLICE S ITE CHOICE IN
PROXIMAL TUBULAR EPITHELIAL CELLS
Duns G 1 , B i lenky M 2, S ietzema J G 1 , Van den Berg E 1 , He A2,
Th iessen N2, Ol ivier M 1 , H ofstra RMW 1 , J ones SJ M 2, Kok K1
1Department of Genetics, Un iversity Medica l Center Groni ngen , Un iversity of Groni ngen , Groni ngen , the Netherlands
'BC Cancer Agency-Genome Sciences Centre, Va ncouver, British Columbia , Ca n ada

ABSTRACT
SETD2 was recently identified as a new candidate ccRCC tumor suppressor gene. SETD2 codes for a histone methyltransferase that is responsible for trimethylation of lysine 36 of histone H3 (H3K36me3). The specific role of SETD 2 in ccRCC development is la rgely unknown. H3K36me3 is involved in a lternative splice site choice, while misregulation of splicing is common in cancer and plays a role in tumor development and maintenance. One could therefore speculate that SETD2 inactivation contributes to ccRCC development by the deregulated splicing of target genes. Here, we describe the initia l steps to determine the effects of functional loss of SETD2 in proxima l tubular epithelial cells and its contribution to ccRCC development. We show significantly altered transcript levels for a subset of genes as a result of siRNA-mediated knockdown: this subset is enriched for genes that function in angiogenesis-related processes. This is in concordance with the observation that SETD2 is required for embryonic vascular remodeling in mice, and might indicate a role for SETD2 in tumor angiogenesis. Moreover, several genes show an appa rent change in alternative splice site choice as a result of SETD2-knockdown, which corroborates earlier findings. Further functional studies are needed to determine the exact mechanisms and proteins that underlie the observed changes in transcript levels and a lternative splice site choice, and the effect of these changes on the function of the encoded proteins, as well as their potentia l role in ccRCC tumorigenesis.
54 CHAPTER 4

INTRODUCTION
SET domain-containing protein 2
SET domain-containing protein 2 (SETD2) was recently identified as a candidate tumor suppressor gene in clear cell renal cell carcinoma (ccRCC) (Dalgliesh et a l . , 201 0; Duns et al . , 2010). SETD2 codes for a histone methyltransferase which is nonredundantly responsible for trimethylation of lysine 36 of histone H3 (H3K36me3) (Edmunds et al. , 2008; Yoh et al., 2008). We showed inactivating mutations in SETD2 in five out of ten ccRCC-derived cell lines. These five cell lines, and two additional ccRCC-derived cell lines, all showed loss or a significant decrease of global H3K36me3. Our data support the findings of Dalgliesh et al. (2010) who identified inactivating mutations in SETD2 in 12 out of 407 (3%) primary ccRCC tumors. Inactivating mutations in SETD2 appear to be specific for ccRCC (Dalgliesh et al., 2010). However, decreased SETD2 transcript levels have been observed in malignant breast cancer (Al Sarakbi et a l . , 2009), and a transposon-based genetic screen in mice suggested a role for SETD2 inactivation in the development of pancreatic cancer (Starr et al., 2009).
The precise role of SETD2 inactivation in ccRCC development is unknown, although it is known that SETD2 is required for embryonic vascular remodeling in mice (Hu et al., 2010), which might point to a role in tumor angiogenesis. Xie et al. (2008) showed that SETD2 can directly interact with P53, and selectively regulates a subset of P53 target genes. This might suggest a tumorigenic role for SETD2 inactivation through deregulation of the P53 pathway. The identification of inactivating mutations in additional histone modifying enzymes in a subset of ccRCC tumors (Dalgliesh et al.,2010) however strongly suggests that the tumorigenic effect of SETD2 inactivation is probably the result of the loss of its histone methyltransferase activity.
Histone modifications and cancer
Post-translational modification of histone tails can affect chromatin structure and/or result in the recruitment or rejection of specific protein complexes, affecting gene regulation. A number of recent papers correlate loss- or gain-of-function of histonemodifying enzymes, including histone lysine methyltransferases, with the pathology of several types of cancers (reviewed by Fullgrabe et al., 201 0; Morin et al., 2011 ). Aberrant activity of histone- modifying enzymes could result in altered chromatin configuration and disruption of normal transcriptional programs, pushing the cell towards cancerous development.
Trimethylation of histone 3 at position K36
The H3K36me3 mark is mainly located on the gene body of active genes and is therefore associated with actively transcribed genes (Barski et al., 2007). Several observations suggest the involvement of H3K36me3 and other histone modifications in the regulation of splicing. H3K36me3 is specifically enriched in exons relative to intronic regions (Andersson et al., 2009; Huff et al., 201 0; Kolasinska-Zwierz et al., 2009; Spies et al., 2009). Furthermore, H3K36me3 is less prominently enriched
EFFECT OF SETD2 KNOCKDOWN ON TRANSCRIPT LEVELS AND ALTERNATIVE SPLICING 55

in alternatively spliced exons than in constitutive exons (Andersson et al., 2009;
Kolasinska-Zwierz et al. , 2009). Moreover, H3K36me3 peaks at bona fide exons,
but not at intronic exon-like sequence composition regions ( ECRs), which have high
nucleosome occupancy like that of bona fide exons, but are not spliced (Huff et al.,
201 0). Recent reports provide more direct evidence for the involvement of H3K36me3
in alternative splicing. Depolarization of human neuronal cells increases H3K36me3
methylation locally around the alternatively spliced exon 18 of NCAM and induces
exon skipping (Schor et al., 2009) . It has been suggested that histone modifications
are able to modulate the outcome of alternative splicing by influencing the elongation
rate of RNAPOLII (Schor et al., 2009). Slowing of the elongation rate could result in
recognition of " weak" splice sites, resulting in inclusion of alternative exons (De la
Mata et al., 2003) . Recently, Luco et al. (2010) showed that H3K36me3 can directly
affect splicing by the recruitment of polypyrimidine tract-binding protein (PTB) via
chromatin-binding protein MRG 15, which specifically recognizes trimethylated
H3K36 . PTB binds to exon-specific silencing elements, resulting in the repression of these exons (Luco et al., 2010). They suggest the existence of several of these
"adaptor complexes", which consist of a combination of: (1) a modified histone tail,
(2) a chromatin-binding protein that recognizes this specific histone modification, and
(3) a splice regulator that is recruited to the histone mark via the chromatin-binding
protein (reviewed by Luco et al., 2011 ) .
Alternative splicing and cancer
About 90% of human pre-m RNAs can be alternatively spliced, which results in the
production of protein isoforms. Expression of these isoforms is in many cases tissue
specific, dependent on the balance of splicing enhancer and repressor activities
that are present. Alternative splicing plays an important role in differentiation and
development-al programs and contributes to cell lineage and tissue identity (Allemand
et al., 2008; Wang et al . , 2008). The importance of alternative splicing is apparent from
the numerous diseases that have been shown to be caused by mutations in either
cis-acting or trans-acting protein splicing factors (Caceres & Kornblihtt, 2002; Cooper
et al., 2009). Misregulation of splicing is com mon in cancer and plays a role in tumor
development and maintenance (Venables et al . , 2004; 2009) . Recently, it was shown
that disturbed expression of splicing factors in ccRCC may lead to impaired alternative
splicing of genes regulating tumor growth and may contribute to the process of
carcinogenesis (Piekielko-Witkowska et al., 201 0) .
Aim
This chapter describes the initial steps to determine the effects of functional loss of
SETD2 in proximal tubular epithelial cells (PTECs) that are thought to be the progenitor
cells of ccRCCs, and its contribution to ccRCC development. Here, we aim to identify
the genes that carry a H3K36me3 mark in proximal tubular epithelial cells, and assess
the effect of H3K36me3 knockdown on expression and alternative exon usage of
target genes in these cells.
56 CHAPTER 4

MATERIALS AND METHODS
Proximal tubular epithel ial cel ls and cel l l ines
PTEC-2A09 and PTEC-060123 are primary cultures derived from proximal tubular epithelia l cells (Pathology Department, University Medical Centre, Groningen, the Netherlands). PTECs were grown in renal epithelial cell basal medium supplied with rena l epithelia l cell growth kit (ATCC, PCS-400-030, PCS-400-040). ccRCC-derived cell line RCC-AB was obtained from Cell Line Services, Eppenheim, Germany. The cell line, which tested negatively for Mycop/asma, bacteria, and fungi, had been passed 10 to 13 times upon arrival (as stated by Cell Line Services). RCC-AB was maintained in RPMl1640 (Sigma, St. Louis, MO, USA). Embryonal kidney cell line HEK293T was obtained from American Type Culture Collection (CRL-1573) and maintained in DMEM (Sigma). Experiments were performed on cells that had undergone six to eight additional passages.
siRNA experiments
Proximal epithelial cells were grown to a confluence of near 100% in 25 or 75 cm2
flasks (37 °C, 5% CO2). The cells were transfected with SETD2 on-target plus siRNA or Non Targeting siRNA (Dharmacon, Lafayette, CO, USA ) at 100 nM final concentration using l ipofectamine 2000 reagent ( lnvitrogen, Carlsbad, CA, USA), Mock transfected, or not treated. Following 72 h incubation, cells were harvested. Pellets were split in two fractions, and RNA was isolated from one fraction using the Fermentas Genejet RNA purification kit according to the manufacturer's instructions (Thermo Fisher Scientific, Waltham, MA, USA). Decreases in SETD2 transcript levels were assessed by quantitative RT-PCR with a Taqman gene expression assay for SETD2 (Hs01015881_m 1) (Applied Biosystems, Foster City, CA, USA), and normalized against housekeeping gene TBP (forward primer: GCCCGAAACGCCGAATAT, reverse primer: CCGTGGTTCGTGGCTCTCT), using the ABl9700 HT Sequence detector system (Applied Biosystems). The other part of the cell pellet was used for histone modification analysis. Cells were lysed in Triton extraction buffer [0.5% Triton X-100 (v/v), 2 mmol/L phenylmethylsulfonyl fluoride, and 0.02% NaN3 (m/v)]. Histones were isolated by acid extraction O/N in 0.2 N HCL, separated using SDS-PAGE (15%) and transferred to a nitrocellulose membrane. The following primary and secondary antibodies were used for Western analysis: rabbit anti- histone 3 (Ab1791, 1 :4,000;Abcam, Cambridge, UK), rabbit anti-trimethyl histone H3 (Lys36; ab9050, 1 :750; Abeam) and horseradish peroxidase-conjugated secondary antibody (goat anti-rabbit: Bio-RAD, Hercules, CA, USA). Positive staining was visualized using ECL solution mixture from Roche, Basel, Switzerland. Attached antibodies were stripped from the membrane using Re-Bl ot Plus Strong Solution (Chemicon/Millipore) to al low reuse of the membrane.
RNA-seq sample preparation
RNA was converted into a library of template molecules suitable for subsequent cluster generation using the lllumina TruSeq™ RNA Sample preparation kit ( l llumina , San Diego, CA, USA). In brief, 400 ng of tota l RNA was ethanol precipitated, and
EFFECT OF SETD2 KNOCKDOWN ON TRANSCRIPT LEVELS AND ALTERNATIVE SPLICING 57

the pellet was resuspended in a fragmentation mix. The RNA was subsequently fragmented on a thermal cycler (94°C for 8 minutes). Fragmented RNA was reversibly transcribed into cDNA using SuperScript II reverse transcriptase and random primers on a thermal cycler (25°C for 10 minutes, 42°C for 50 minutes, 70°C for 15 minutes), following the manufacturer's instructions. Second strand cDNA was subsequently synthesized by adding a Second strand master mix and incubating at 16°C for a hour. Double stranded cDNA was separated from the second strand master mix using Ampure XP beads (Beckman Coulter Genomics, Danvers, MA, USA), following the manufacturer's instructions. 3' and 5' overhangs that result from fragmentation were subsequently removed by adding End repair mix to the purified double stranded cDNA, and incubating at 30°C for 30 minutes using thermal cycler. To prevent the blunt-end fragments from forming concatamers during the adapter ligation reaction, a single 'N nucleotide was added to the 3' ends by adding A-Tailing mix to the bluntend fragments, and incubating at 37 °C for 30 minutes using a thermal cycler. Multiple indexing adapter were added to the ds cDNA by adding DNA ligase mix and RNA adapter index, and subsequently incubating at 30°C for 10 minutes in a thermal cycler. Adapter-ligated ds cDNA was purified using Ampure XP beads (Beckman Coulter Genomics), fol lowing the manufacturer's instructions. DNA fragments that had adapter molecules on both ends were subsequently en riched and amplified using PCR. PCR Master mix and a PCR Primer cocktai l , which an neals to the ends of the adapters, were added to the adapter-ligated ds cDNA. The adapter-ligated ds cDNA was subsequently amplified in a PCR-reaction (98°C for 30 seconds, 15 cycles of (98°C for 10 seconds, 60°C for 30 seconds, 72°C for 30 seconds), 72°C for 5 minutes) using a thermal cycler. The amplified adapter-ligated cDNA library was subsequently purified using Ampure XP beads (Beckman Coulter Genomics), following the manufacturer's instructions. Quality and quantity of the obtained adapter-ligated cDNA library was assessed using the Experian™ DNA 12K analysis kit (Bio-RAD, Hercules, CA, USA). DSN (Duplex-specific thermostable nuclease) normalization was subsequently used to deplete abundant sequences such as those derived from rRNA and tRNA following the DSN Normalization Sample Preparation Guide (lllumina, San Diego, USA). This obviates the use of Poly-A selection, which has a bias towards the 3' end of transcripts, which could be problematic when analyzing alternative splicing. In short, a reaction mix containing 100 ng of the cDNA sample prep and hybridization buffer (50 mM Hepes, pH 7 .5, 0 .5 M NaCL) was prepared in a PCR tube. Double stranded cDNA molecules were denatured to single stranded DNA molecules, and subsequently renaturated by incubating the tube on a thermal cycler at 98°C for 2 minutes followed by 68°C for 5 hours. Double stranded DNA, which represent the highly abundant transcripts, were subsequently removed from the reaction mixture by treatment with Specific thermostable nuclease (DSN) enzyme (Evrogen, Moscow, Russia) at 68°C, for 25 minutes. DSN treated DNA was subsequently en riched using Phusion polymerase (Fin nzymes Oy, Espoo, Finland), and purified with SPRI beads (Agencourt, Beverly, MA, USA) as described in the DSN Normalization Sample Preparation Guide (lllumina). Quality and quantity of the DSN treated cDNA library was assessed using the Experian TM DNA 12 K analysis kit (Bio-Rad).
58 CHAPTER 4

Chromatin immunoprecipitation
Chromatin immunoprecipitation was performed us ing the S imp le Ch l P® Enzymatic Chromatin IP Kit (Magnetic Beads) # 9003 (Ce l l S igna l i ng Technology, Beverly, Massachusetts, USA), accord ing to the manufactu rer's instructions. B riefly, approximately 2 x 1 07 (proxima l tubu lar epithe l ia l cel l s) to 4 x 1 07 (H EK293T) ce l ls were used for each experiment. DNA was cross- l i nked to h istones by treati ng cel l s with 37% formaldehyde (1 0 m ins, RT) . Cross- l i nking was stopped by adding g lycine to a fina l concentration of 0. 1 25M (5 m ins, RT) . Ce l ls were subsequently washed with PBS and harvested by scrap ing . Cel l pel lets were resuspended in cel l lysis buffer with p rotease inh ibitor and incubated for 1 0 m ins on ice. Nucle i were subsequently pe l leted by centrifugation . Chromatin was subsequently fragmented so that the majority of fragments consisted of one nucleosome, us ing m icrococca l n uclease digestion at 37°C for 20 m inutes. Nuclease d igestion was stopped by adding EDTA to a fina l concentration of 5 mM. Nucle i were pel leted and resuspended in a Ch l P buffer. N uc le i were lysed using a Sandel in son icator (3 sets of 20 second pu lses at 35% amp l itude) (Sande l i n , Berl in , Germany). Breakdown of the nuc lear membrane was determ ined by observing n uclei under a l ight m icroscope. A fraction of the cross- l i nked preparation was used for ana lysis of DNA d igestion and determination of chromatin concentration . DNA was isolated from this fraction us i ng spin col umns, and DNA fragment s ize was determ ined by e lectrophoresis on a 1 % agarose ge l . DNA concentration was assessed using a Nanodrop 8000 spectrophotometer (Thermo Scientific, Wi lm ington , DE , USA) . Chromatin immunoprecipitation was performed on the cross- l i nked chromatin preparation (O/N, 4°C), accord ing to the manufactu rer's instructions . The fo l lowing antibodies (a l l from Cel l S igna l ing Technology), wh ich were kind ly made ava i lab le to us by B ioke, Le iden, the Netherlands, were used : Tri -Methyl -H istone H3 (Lys 36) (D5A7) XP™ Rabbit mAb (1 :50), Tri-Methyl-H istone H3 (Lys4) (C42D8) Rabbit mAb (1 : 50), TriMethyl-H istone H3 (Lys27) (C36B 1 1 ) Rabbit mAb (1 : 1 00), Hi stone 3 (D2B 1 2) XP® Rabbit mAb (Ch IP Formu l ated) #4620 ( 1 : 50), Normal Rabbit lgG #2729 ( 1 : 1 00) . RT-PCR was used to assess the specific enrichment as a resu lt of IP with the h istone modificationspecific antibod ies. The fo l lowing primer sets (a l l from Cel l S igna l i ng Techno logy) were used: H3K36me3: S imp leCh l P™ H uman GAPDH intron 2 (#4478) vs S impleCh l P™
Human GAPDH promoter (#447 1 ) . H3K4me3: S impleCh l P™ Human GAPDH pro moter (#447 1 ) vs SimpleCh l P™ Human MyoD1 Exon 1 (#4490), H3K27me3: H uman M yoD1 Exon 1 (#4490) vs S impleCh l P™ H uman GAPDH promoter (#447 1 ) . I P samples were incubated overn ight at 4°C with rotation . CH I P Grade Prote in G Magnetic Beads # 9600 were used to col lect the immunocomplexes (2h , 4°C) . The Protein G Magnetic beads were subsequently pel leted by placing the tubes in a Magnetic Separation Rack. After salt-wash ing the beads, chromatin was e l uted from the antibody/Protein G beads by gently vortexing in Ch l P El ution Buffer (30 m ins, 65°C). Protein G Magnetic beads were pel l eted by placing the tubes i n a magnetic separation rack, and the e l uted chromatin supernatant was transferred to new tube. 6 µI SM NaCl and 2 µI Proteinase K was added , and incubated for 2 hours at 65°C. DNA was subsequently pu rified us ing spin co l umns, and quantified usi ng a rea l-time quantitative PCR method.
EFFECT OF SETD2 KNOCKDOWN ON TRANSCR I PT LEVELS AND ALTERNATIVE SPLIC ING 59

I
Chl P-seq sample preparation Chromatin immunoprecipitated DNA was prepared for next-generation sequencing (NGS) analysis following the "Preparing Samples for Ch IP sequencing of DNA" manual ( lllumina). 3' and 5' overhangs were converted into phosphorylated blunt ends, by incubating a reaction mix containing 30 µ I Ch IP enriched D NA ( ~ 10 ng), 10 µ I Hp, 4 µ I T4 DNA ligase buffer with 10 mM ATP, 2 µ I d NTP mix, 1 µ I T4 DNA polymerase, 1 µ I Kienow DNA polymerase and 1 µI T4 PNK) for 30 minutes at 20°C. End-repaired D NA was purified using the OIAquick PCR purification kit, and eluted in 34 µ I Elution buffer, according to the manufacturer's instructions (Oiagen, Venlo, the Netherlands). 'A' bases were added to the 3'end , by incubating a reaction mix containing 34 µI DNA sample, 5 µ I Kienow buffer, 10 µ I dATP, and 1 µ I K ienow exo (3' to 5' exo minus) for 30 minutes at 37°C. A-tailed D NA fragments were purified using the minElute PCR purification kit, and eluted in 10 µ I Elution buffer, according to the manufacturer's instructions (Oiagen). Adapters (that have a single 'T' base overhang at their 3' end) were subsequently ligated to the A-tai led D NA fragments by incubating a reaction mix containing 10 µ I DNA sample, 15 µ I DNA ligase buffer, 1 µI diluted adapter oligo mix and 4 µ I DNA ligase for 15 minutes at RT. The adapter- ligated D NA fragments were purified using the minElute PCR purification kit, and eluted in 10 µI Elution buffer (Oiagen). The adapter- l igated library was subsequently size-selected (range 200-300 bp) by running the D NA sample on a 2.5% agarose gel in TAE buffer. The region of the gel containing the appropriate sized DNA fragments was excised using a scalpel. DNA was purified from the agarose slices using the Oiagen Gel extraction kit, and eluted in 36 µ I E lution Buffer, according to the manufacturer's instructions (Oiagen). Adaptermodified DNA fragments were subsequently amplified in a reaction mix containing 36 µ I DNA, 10 µ I 5x Phusion* buffer, 1 .5 µ I d NTP mix, 1 . 1 µ I PCR primer 1. 1, 1 µ I PCR primer 2. 1 and 0.5 µ I Phusion polymerase using the following PCR protocol : 98°C for 30 seconds, 18 cycles of (98°C for 10 seconds, 65 °C for 30 seconds, 72°C for 30 seconds), 72°C for 5 minutes. The adapter-modified D NA fragments were subsequently purified using the minElute PCR purification kit (Oiagen).
Seq uencing Enriched bar-coded libraries were sequenced with 100 bp paired-end reads (RNA-seq) or single-end reads (Ch lP-seq) across one lane of an lllumina HiSEO 2000 f low cel l ( l llumina).
RNA-Seq ana lysis The resulting 1 00 bp sequence reads were a l igned to the human reference genome (hg19) and resource containing sequences spanning annotated exon-exon junctions. The Burrows-Wheeler aligner (BWA) (v0.5 .7) (Li & Durbin, 2009) was used with default setting except that the Smith-Waterman alignment for the unmapped mate was disabled. Exon-exon junctions were compiled using transcript models from Ensembl v61 (Flicek et al. , 2010), RefSeq (Pruitt and Maglott, 2001) and UCSC 'known genes' (Rhead et a l . , 2010) gene annotation sources (downloaded from http:/ /genome.ucsc .
CHAPTER 4

edu on March 17 , 2009), as described (Morin et al. , 2010). Sequence reads that were uniquely aligned to junction sequences were computationally repositioned to assign the genomic hg 19 coordinates and an alignment file in the barn format (Li et al., 2009), swith duplicated reads marked with Picard tools (v.1.11) was generated for the downstream analyses. We used custom JAVA programs to generate coverage profiles from the alignment barn file. We accepted reads with a BWA read quality of at least 5 and allowed reads that represented duplicated DNA fragments. Resulting files in 'bigWig' format (Kent et al . , 2010) were used for visualization in the UCSC browser.
RPKM, data normalization and 2-score
To quantify expression levels using generated genome wide read-profiles we calculated Reads Per Kilobase per Million mapped reads (RPKM) (Mortazavi et al. , 2008; Pepke et al. , 2009) for all exons annotated in Ensembl v61 (253,750 in total) using the following expression:
RPKM = nl(L *N)
Where n is a fractional number of reads aligned to the region, L is the length of the region in Kb, and N is the number reads aligned into all annotated exons, in millions. We excl uded reads aligned to the mitochondrial genome in calculating the normalization constant, N. For pair-wise sample comparisons, an empirical Z-score was calculated assuming the mean coverage of exon followed a Poisson distribution:
where CA
and C8 are mean coverages of a given exon for samples A and B, respectively, and xA8 is a ratio of total number of aligned exonic reads for two samples, xA8 = N
AIN8.
We also calculated an asymmetry as
and a fold-change
FC = (1 + A) /(1 - A)
We first calculated the Z-score, asymmetry and fold-change for every individual exon. Exons that had Z � 2 and FC � 1.5 were considered as upregulated, while exons that had Z � 2 and FC � 0.66 were considered downregulated between samples.
Alternatively we also calcu lated all above observables for the whole gene. In this case, the mean coverage was calculated as the sum of total coverage for all exons in
EFFECT OF SETD2 KNOCKDOWN ON TRANSCRIPT LEVELS AND ALTERNATIVE SPLICING 61

the gene divided by tota l exonic length. The same thresholds for the z-score and foldchange were a pplied to determine lists of up- and downregulated genes.
CHIP-Seq analysis
Single-end 100 bp sequence reads were ma pped to hg19 (NCBI 37) using BurrowsWheeler a l igner (BWA) (v0.5.9) (Li et al. , 2009) and default parameters. Reads having identical coordinates were collapsed into a single read and reads with BWA alignment quality � 5 (in this way, we also filtered reads aligned into multiple locations) were directionally extended 150 basepairs. By applying custom JAVA software to extended ChlP-seq reads we generated genome-wide profiles in the Wig and bigWig formats (Kent et al,. 2010) to be visualized in the UCSC genome browser (Karolchik et al. , 2007) and for downstream ana lysis.
Different a pproaches were a pplied to the ana lysis of various epigenetic modifications. To determine genes that were marked with H3K36me3, we calculated read coverage and RPKM over the annotated gene models (Ensembl v61 ). By considering genome-wide distribution of H3K36me3, and comparing RPKM ca lculated for the random genomic regions, we selected a threshold to separate the signa l from the background, and by doing so, determined the genes that are marked by this histone modification. To determine genes that were marked with a H3K4me3 mark, we calculated RPKM for the regions flanking transcription start sites (TSS) ( +/- 1000 bp) and used FindPeaks2 software (Fejes et al., 2008) to identify enriched locations at FDR ~0.01. To determine genes that were marked with a H3K27me3 mark, we calculated RPKM for the regions flanking transcription start sites (TSS) ( +/- 1000 bp) and used the genome-wide H3K27me3 distribution to determine a threshold discriminating marked promoters from unmarked promoters.
RESULTS
Histone modifications in proximal tubular ep ithelial cells
Chromatin immunoprecipitation fol lowed by next-generation sequencing (ChlPseq) can be used genome-wide to identify genomic segments that are bound by chromatin-binding proteins or carry a specific histone modification. Here, we aimed to identify genes that have a H3K36me3 mark in proxima l tubular epithelia l cells. We validated the ChlP-seq method on chromatin from HEK293T cells. Chromatin immuno-precipitation using an antibody specific for H3K36me3 resulted in an a pproximately 6.0-fold enrichment of genomic segments that have a H3K36me3 mark, as compared to immunoprecipitation using an antibody against the core of histone 3 (H3). Subsequent next-generation sequencing of the DNA-content of the precipitated chromatin revea led H3K36me3 profiles that showed similarity to previously published H3K36me3 profiles (Barski et al., 2007; Mikkelsen et a l . , 2007) (data not shown) . Having validated the method, we then performed ChlP-seq experiments on two proxima l tubular epithelial cell samples to identify the set of genes that have a H3K36me3 mark in this cell type. In para l lel, we assessed the H3K4me3 and H3K27me3 profiles
62 CHAPTER 4

in one of the proximal tubular epithelial cell samples. The enrichment for the ChlPseq experiments on chromatin from the proximal tubular epithelial cells was 4.8, 7.0, and 12.3 for H3K36me3, H3K27me3, and H3K4me3, respectively. Subsequent nextgeneration sequencing (for ChlP-seq alignment statistics, see Supplementary Table 5 7 ) revealed a distribution of the histone modifications across the genome that was expected from literature: H3K36me3 is mainly present on the "body" of active genes. H3K27me3, which is associated with inactive genes, shows a reciprocal pattern with H3K36me3. H3K4me3 is enriched around transcription start sites of active or poised genes (Figure 1). The differences in distribution of the histone modifications explain the differences in enrichment following chromatin immunoprecipitation; in contrast with H3K36me3 and H3K27me3, which are located at broad genomic regions, H3K4me3 is located at much more restricted regions, and therefore shows a higher enrichment. We compared the distribution of H3K36me3, H3K27me3, and H3K4me3 in proximal tubular epithelial cells with previously published ChlP-seq data from adult kidney and fetal kidney samples (GEO database GSM621634 and GSM621634, respectively). Overall, the patterns show a striking resemblance. However, for several genes that are known to be specifically expressed in endothelial cells we see H3K4me3 and H3K36me3 marks in the "total kidney" samples, which contain endothelial cells, while these marks are absent in proximal tubular epithelial cells (Figure 2), showing that a subset of genes has tissue-specific histone marks.
We correlated the level of histone modifications present on genes with the transcript levels of these genes in the proximal tubular epithelial sample, as assessed by RNA-seq (For RNAseq alignment statistics, see Supplementary Table 2). For H3K4me3 and H3K36me3, we clearly see a positive correlation with transcript levels. For H3K27me3, we clearly see a negative correlation (Figure 3).
siRNA-mediated knockdown of SETD2
SETD2 transcript levels were decreased approximately 60% in siRNA-treated PTECs compared to wildtype PTECs (Figure 4.a). This resulted in a decrease of the level of global H3K36me3 of approximately 70%, as depicted in Figure 4b. We included clear cell renal cell carcinoma cell line RCC-AB in this experiment. RCC-AB harbors an inactivating mutation in SETD2, which results in loss of H3K36me3 (Duns et al., 2010). The observed faint residual staining is probably an effect of nonspecific binding of the antibody (Figure 4b). The effect of the decreased H3K36me3 levels in proximal tubular epithelial cells on expression and alternative splice site choice of target genes was assessed by RNA-seq.
Effect of SETD2 knockdown on transcript levels
We observed a significant decrease (fold-change (FC) <2/3, z-score<-2.0) in expression for 55 protein coding genes, and a significant increase in expression for 33 protein coding genes as a result of SETD2 knockdown (FC>1.5, z-score>2.0) (Table 1 ) . As expected, SETD2 is in the list of genes that show a significant decrease in transcript level. The differentially regulated genes were analyzed for fur:,ctional enrichment using DAVID (Dennis et al., 2003). The Functional Annotation Chart Tool was used to obtain
EFFECT OF SETD2 KNOCKDOWN ON TRANSCRIPT LEVELS AN D ALTERNATIVE SPLICI NG 63

Table 1 . Genes showing s ign ificantly a ltered transcript levels as a resu lt of SETD2 knockdown in proximal tubu lar epithe l i a l ce l l sample PTEC-2A09.
Name E I F4EBP1 B N I P3 ANG PTL4 ENO2 ADAMTS5 TFPl2 PLAT IG FBP6 I N S IG2 PRDX3 N H P2 L1 PG K1 SETD2 TMCO1 DD IT4 AKAP 1 2 WBP2 CRKL H K2 C4orf3 NDRG 1 P4HA1 FAM 1 62A PLAU C1 9orf33 LDHA ASNS RPS23 I M PAD1 CCN D 1 TP l 1 ADAMTS 1 MYADM MARCKS C1 2orf57 ERO1 L B N I P3 L SERP I N E 1 LGALS1 CTG F SLC2A1 C1 0orf55 KRT8 PRN P LAMC2 TH BS1
64 CHAPTER 4
Ensembl_lD RPKM (WT) ENSG000001 87840 2649 ENSG000001 7 6 1 7 1 9552 ENSG000001 67772 5 1 24 ENSG000001 1 1 674 7480 EN SG00000 1 54736 1 435 ENSG000001 05825 1 4229 ENSG000001 04368 85 1 2 ENSG000001 67779 1 907 ENSG000001 25629 1 920 ENSG000001 65672 9333 ENSG00000 1 00 1 38 3003 ENSG00000 1 02 1 44 36735 ENSG00000 1 8 1 555 21 72 ENSG000001 43 1 83 29 1 4 ENSG000001 68209 3589 EN SG00000 1 3 1 0 1 6 26489 EN SG00000 1 3247 1 3956 ENSG00000099942 2490 ENSG000001 59399 3392 ENSG000001 64096 441 0 ENSG000001 0441 9 3933 ENSG000001 22884 4546 ENSG00000 1 1 4023 4358 ENSG000001 22861 41 6 1 5 ENSG000001 67644 7727 ENSG000001 34333 666 1 7 ENSG00000070669 341 3 ENSG000001 86468 1 02 1 2 ENSG000001 04331 347 1 EN SG00000 1 1 0092 32953 ENSG00000 1 1 1 669 1 1 1 27 ENSG000001 54734 1 67 1 1 ENSG000001 79820 3876 ENSG000001 55 1 30 31 98 ENSG000001 1 1 678 336 1 ENSG000001 97930 5763 ENSG000001 04765 7439 EN SG000001 06366 39433 ENSG000001 00097 1 5285 ENSG00000 1 1 8523 1 8976 ENSG000001 1 7394 1 0726 ENSG00000222047 55 1 5 ENSG000001 7042 1 1 57 1 1 EN SG00000 1 7 1 867 4746 ENSG00000058085 42671 ENSG000001 37801 22046
RPKM (SETD2 KD) Fold change 1 020 -2.6 3886 -2.5 2 1 66 -2.4 3235 -2.3 62 1 -2.3 6379 -2.2 388 1 -2.2 903 -2. 1 9 1 0 -2. 1 4578 -2.0 1 483 -2.0 1 8305 -2.0 1 084 -2.0 1 460 -2.0 1 8 1 7 -2.0 1 3873 - 1 .9 2072 - 1 .9 1 3 1 1 - 1 . 9 1 788 - 1 .9 2341 - 1 . 9 2 1 28 - 1 .8 2575 - 1 .8 2483 - 1 .8 23798 - 1 .7 4459 - 1 .7 38508 - 1 . 7 1 982 - 1 . 7 5937 - 1 .7 2048 - 1 .7 1 9560 - 1 .7 6644 - 1 .7 1 0 1 29 - 1 .6 2367 - 1 .6 1 959 - 1 . 6 2067 - 1 .6 3557 - 1 .6 4597 - 1 .6 246 1 8 - 1 .6 9543 - 1 .6 1 1 958 - 1 . 6 6863 - 1 .6 3546 - 1 .6 1 0 1 38 - 1 .5 3064 - 1 . 5 27688 - 1 .5 1 4346 - 1 . 5

Table 1 continued.
Name Ensembl_lD PSAT1 ENSG000001 35069 RPS29 ENSG000002 1 37 41 TN FRSF1 2A ENSG00000006327 H MGA1 ENSG000001 37309 TGFA ENSG000001 63235 -- --- ---GPX8 ENSG000001 64294 RNF1 87 ENSG000001 68 1 59 GTF2H5 ENSG000001 85068 K IF1 C ENSG000001 29250 DEFB1 ENSG000001 64825 C2CD4A ENSG000001 98535 SAA2 ENSG000001 34339 G PX3 ENSG000002 1 1 445 --- --VG F ENSG000001 28564 C3 ENSG000001 25730 SAA1 ENSG000001 73432 C1 R ENSG000001 59403 SST ENSG000001 57005 CDC25B ENSG000001 0 1 224 I Fl6 ENSG000001 26709 DEPDC6 ENSG000001 55792 G B P2 ENSG000001 62645 MORC4 ENSG000001 33 1 3 1 MAOA ENSG000001 8922 1 M M P7 ENSG000001 37673 ABCA1 ENSG000001 65029 CEBPD ENSG00000221 869 WDR74 ENSG000001 333 1 6 CPD ENSG000001 08582 NRBP2 ENSG000001 851 89 CRYM ENSG000001 033 1 6 ABCC3 ENSG000001 08846 TMEM2 ENSG000001 35048 SOD2 ENSG000001 1 2096 PRO M 1 ENSG00000007062 NAM PT ENSG000001 05835 SLC34A2 ENSG000001 57765 SYN E2 ENSG00000054654 SAT1 ENSG000001 30066 TNFSF1 0 ENSG00000 1 2 1 858 G LS ENSG000001 1 541 9 TN FRSF1 1 B ENSG000001 6476 1
RPKM (WT) 6079 9 1 36 77 1 6 1 93 1 0 7 1 20 3722 4856 4528 4529 55 � --�-97 882 87 1 -- --645 842 3 1 29 809 742 965 1 727 98 1 973 3394 2 1 42 2738 1 92 1 1 708 56790 1 0429 --4067 1 965 2822 2798 1 0925 2874 276 1 4084 41 04 7546 --5743 1 001 3 7953
RPKM (SETD2 KD) 3970 -- -5975 5053 1 2666 4724 2472 --3264 3046 3086 542 757 3295 2658 1 876 2402 8099 -- -1 937 1 704 2 1 38 38 1 3 2 1 33 2087 6539 4083 5045 35 1 6 3069 1 0 1 306 1 82 1 7 7039 3332 4778 4692 1 7992 4635 4409 6446 6270 1 1 4 1 2 8669 1 5094 1 1 676
---- --
Fold change - 1 .5 -1 .5 - 1 . 5 - 1 . 5 - 1 . 5 - 1 .5 -1 .5 -1 . 5 - 1 .5 9.9 7.8 3.7 3. 1 2.9 2.9 2.6 2.4 2.3 2.2 2.2 2.2 2. 1 1 .9 1 .9 1 .8 1 .8 1 . 8 1 .8 1 . 7 1 . 7 1 .7 1 . 7 1 .7 1 .6 1 .6 1 .6 1 .6 1 . 5 1 . 5 1 . 5 1 . 5 1 . 5
- ----�
--
EFFECT OF SETD2 KNOCKDOWN O N TRANSCRI PT LEVELS A N D ALTERNATIVE SPL IC ING 65

A.
B.
H3K36me3 -l1.U.i+11 it/I tAt "! ,+ .. I itub w•tt dth II tM I-% MWKt:Nlti\8: d11 I, file H I
H3K27me3
H3K36me3
............. .. , .... - �� SEC2211 tl-++H • TI"LO 'l++t-+l
PDlf'IS � NlCVS 8-llfrt.,i-;H ) HVLK-ASl ...,....._. ,o,AS l++IH!-■I MC'l1i........... §§ IWtmlillll illlf:tt:::1111 1=: :ii 11VLI< I 11YLK I
:t: t::::;' ""'-"" I
I II 1111■111■·/ uws ,-1 II -1111■1ll1 ""'-'j"�,.
UMl"S fl ITC"" ll-4-lf+i+++f
-......-...
�.11 11elll:r:S? ll++•...-+ wt1+!dt:+ttlits:11:tb41z:t:¥llt-tt+-hY4► 11tw1"""�!11 Atihtt1 mJI d, t1trnM1tHMf:M.te4: +l+1bb ti' ·Ii◄ llfv!lk#+NtNWAlttrded:tdttff Ao ... ,i.-............. __ d♦t+1,kM ,_,., , .. , . .Ja...W.. ... �.---···----····--·---"""
C6orn:;:� · � �-i LINC88336 H l�K3 14:: MLN JII
ITl'"3� 1.D02 1fo
HlR.12�◄
�
L.alJ2 "OC188587Sl!H N
""""' " HMGIU ,■ ::: i Hl"IGAl ti """"' 0
ceor1'
l
1 ceor1'I
ceor1'
I
RPSl e te i-ACSINT...,. $f«'C H91 TAFl t lH TCP"iltttf �::m SPD�1 86 � s=ltf.1 �" ' I Ill · -1 II T�l l tH Pf"lCSJNl �
C6or1'l 06 �
N"ss•-=�i � 11
Figure 1 . Histone modification profiles in proximal tubular cell sample PTEC-2A09. Coverage profi les for H3K36me3 (top), H3K37me3 (midd le) and H3K4me3 (bottom) generated from the barn a l ignment fi le (see Materia ls and Methods), and d isplayed as custom tracks on the UCSC genome browser. The profi les represent the number of sequence reads u n iquely a l ign ing to (A) segments of chromosome 3 (1 22.38-1 24.90 M b from pter), and (B) chromosome 6 (33 .43-35 . 1 7 M b from pter). The bottom part of the figures shows the locations of the RefSeq genes, with boxed reg ions and th in l ines representing exons and intrans, respectively.

A.
B.
PTEC H3K36me3 ·xd�it- -- - - - - - - - - - - - - - - kidney...._........J_IM......._.u....i.�-.illlll!YllliaJi;&j-.U.!....w..li.LI.IMl.l.-.w.1&..._�....._.�...,..,.....,...-1_
PTEC H3K4me3 ·AdUii-�ii.Stlii.r.-:::-::..:::d&i..�::-'i':�::-::::-:::-icr..:-:_::: .. � ... --:: .. :-:_=:.:. ..... � ..... :;:;.:;:._�at;:.:.:;;:a,;;::=::::.:...::::uli:f
_ _ _ _ _ _ _ _ _ _ _ _ _ _ _ kidney.1;...�L-�-m./'a;:;::a;.j;u::;.;-t=====�!::!:=��=�!!!!!I!!"---'""";;.;��.:.=�
PTEC H3K36me3 _ _ _ _ ___ _
Adult
PTEC
Hlltll I --11111 , I -
. I -, -
H3K4me3 - _ _ _ _ _ _ _ J.;;;.;::;;:::=.;;;;;::.=z:.;;:;:;1t::;;;;;;;,.::-;. ;;:;i;i;;:::;:;;;;;;;::;:;;;;;;;;;;;;.;.:;t::;;;,_;:;;;;;;;;;;;;;.;., :;;.;;;;,ii;i.....,;;:;;;;;......,;..:;:j,.�;;;;;.;:;::_=...= .. �.;;; ..... .a1 Adult I i kidney i l - - - - - - - - - - - - - - - - - - - - - - - l'ioDFAiPiPPPl1tt1:'.li 1t'.Hii11�-..... ----........ -�DO:DIITT�4LUtt-"-----"--EiEM1CC�l'riqi111f�:T�f:-i"f�ii!r-�- ·:�-qr'· .... LAMTOR3 1M EMCN I Ht E t E 10 E E E I
LAMTOR3 ill LAMTOR3 ill DNAJB14 .-tH
H2AFZ I LOC256880 I
Figure 2. H3K36me3 and H3K4me3 profiles on endothelium•specific genes. Coverage profi l es for H3K36me3 and H3K4me3 in proximal tubu lar epithe l i a l cel l sample PTEC-2A09 (PTEC) a nd an adu lt kidney sample (G EO database GSM621 634), generated from the barn a l ignment fi le (see Materia ls and Methods), and disp layed as custom tracks on the UCSC genome browser. The profi les represent the number of sequence reads un iquely a l ign ing to segments of (A) chromosome 9 (1 30.55-1 30.66 Mb from pter), and (B) chromosome 4 (1 00.6- 1 01 .6 M b from pter). The bottom parts of the figu res show the location of the RefSeq genes in these genomic segments, with boxed regions and th in l ines representing exons and intrans, respectively. The ENG and EMCN genes, which code for the endothel ia l markers Endog l in and Endomucin , respectively, are h igh l ighted by dotted squares in A and B. These genes show H3K36me3 and H3K4me3 marks in the total kidney sample, which are largely absent in the proximal tubu la r epithe l ia l ce l l s (PTECs).
the p-values that describe the probability that a functional term will be enriched among the up- or down regulated genes. Gene set enrichment analysis for KEGG pathways for the set of downregulated genes reveals enrichment for, amongst others, the glucolysis/ gluconeogenesis pathway, the p53 signaling pathway, renal cell carcinoma, and the ErbB signaling pathway, amongst others (Table 2). Gene set enrichment analysis for GO terms for the set of downregulated genes reveals enrichment for angiogenesis related processes, amongst others (Table 2). Gene set enrichment analysis for KEGG pathways for the set of upregulated genes reveals enrichment for arginine and praline metabolism. Gene set enrichment analysis for GO terms for the set of upregulated genes reveals enrichment for homeostatic processes (Table 2).
EFFECT OF SETD2 KNOCKDOWN ON TRANSCR I PT LEVELS AN D ALTERNATIVE SPLIC ING 67

Table 2. En riched KEGG pathways and top 1 0 enriched GO terms for genes showing s ignificantly altered transcript levels as a result of SETD2 knockdown.
Downregulated genes Upregulated genes
Benjamini- # Benjamini-Term # genes % P-va lue Hochberg Term genes % P-value Hochberg
Enriched KEGG Glycolysis/G luconeogenesis 5 8.5 3.80E-04 2 .20E-02 Arg in ine and 3 8 .8 7 .70E-03 1 .80E-01
pathways pra l ine metabolism
P53 s igna l ing pathway 3 5 . 1 6.00E-02 8 .40E-01
Complement and 3 5 . 1 6.20E-02 7 . 1 0E-01 coagu lation cascades
Rena l cel l carcinoma 3 5 . 1 6.30E-02 6 . 1 0E-01
ErbB signa l ing pathway 3 5 . 1 9 .20E-02 6.80E-01
R ibosome 3 5 . 1 9 .20E-02 6 .80E-01 - --- -Prostate cancer 3 5 . 1 9.60E-02 6 .20E-01
GO terms (BP _FAT) B lood vessel development 8 1 3 .6 2.00E-05 1 .50E-02 chemical homeostasis 7 20.6 3.40E-04 2.00E-01
G lycolysis 5 8 .5 2 .00E-05 7 .90E-03 homeostatic process 7 20.6 2.50E-03 5.50E-01 ---Vasculature development 8 1 3 .6 2.30E-05 6.00E-03 cel lu lar ion homeostasis 5 1 4.7 5 .30E-03 6.80E-01
g lucose catabol ic process 5 8 .5 4.70E-05 9 . 1 0E-03 cel l u la r ion homeostasis 5 1 4.7 5 .60E-03 5 .90E-01
blood vessel morphogenesis 7 1 1 .9 8.40E-05 1 .30E-02 ion homeostasis 5 1 4.7 7 .30E-03 6.00E-01
hexose catabol ic process 5 8.5 9.40E-05 1 .20E-02 response to drug 4 1 1 .8 8.00E-03 5 .70E-01
response to hypoxia 6 1 0.2 9 .70E-05 1 . 1 0E-02 regu lation of 3 8 .8 9.30E-03 5 .70E-01 inflammatory response
monosaccharide 5 8 .5 1 .00E-04 1 .00E-02 cellular homeostasis 5 1 4 .7 1 . 1 0E-02 6.00E-0 1 catabolic process --
response to oxygen levels 6 1 0 .2 1 .20E-04 1 . 1 0E-02 behavior 5 1 4. 7 1 .20E-02 5 .60E-01
Arginine and praline 3 8 .8 7 .70E-03 1 .80E-0 1 lymphocyte chemotaxis 2 5 .9 1 .30E-02 5 .80E-01 metabolism

Table 3. Genes showing a change in a lterative spl ice site choice as a resu lt of SETD2 knockdown.
Gene Symbol
AASS --DPM 1 LTB P3
PUM2 RAD1 -AXI N 1 -RCC1
Alternatively # reads Ensemble ID skipped exon retained
ENSG000000083 1 1 1 9 4 ENSG0000000041 9 7 0 ---ENSG000001 68056 24 5
-ENSG0000005591 7 2 1 -- --- --- --ENSG000001 1 3456 3
ENSG000001 03 1 26 9 - -
ENSG000001 801 98 6'
2
1 1 �-- - ---9
Wild type SETD2 knock down
fraction # reads fraction skipped retained skipped retained skipped retained skipped
9 0.3 0.7 4 2 0.7 0.3 1 1 0.0 1 .0 7 1 7 0.3 0.7 ---3 0.6 0.4 34 8 0.8 0.2 -- -- - --9 0. 1 0.9 25 37 0.4 0.6 ---- -- ---1 1 0.2 0.8 5 3 0.8 0.2 1
- - --9 0.5 0. 5 2
3 1 -- - -3
0.6 0.5
-- -0.4
0.4 -- -0.5 -0.6

A.
B.
C.
: I
I
I
I
I
I
I
_.:_
-f-1
s I
I
T
-2t....._--==,!__--------L------'
� ::.::: 0... Cl:: C: .!,!
0.. 1
C) � 3 -1
-.I
I
I
I
I
□ I
I
I
-'-
-2<---- -=="'--------1----------"
-,
I
I
I
I
Figure 3. Correlation between the presence of histone modifications and transcript levels in proximal tubular sample PTEC-2A09. Box plots showing the distribution of transcript levels ( log 1 0RPKM) for al l Ensembl v61 human transcripts in untreated PTEC-2A09 cel ls , as assessed by RNA-seq. (A) H3K36me3. The H3K36me3 coverage was measu red as the total number of reads fa l l i ng with in gene boundaries normal ized by the length of the gene. Using the cumu lative distributive function (CDF), an empirical threshold was selected to spl it genes into subsets having H3 K36me3 or no H3K36me3. (B) H3K4me3. The H3K4me3 coverage was measured as the total n umber of reads fa l l ing with in 1 Kb up- and downstream of the transcription start site (TSS), normal ized by 2 Kb. Using the cumu lative distributive function (CDF), an empirical threshold was selected to spl it genes into subsets having H3 K4me3 or no H3K4me3 . (C) H3K27me3. The H3K27me3 coverage was measu red as the total number of reads fa l l ing with in 1 Kb up and downstream of the transcription start site (TSS), norma l ized by 2 Kb. Using the cumu lative distributive function (CDF), an empirical threshold was selected to spl it genes into subsets having H3 K27me3 or no H3K27me3.
Effect of SETD2 knockdown on alternative splice site choice
Numerous individual exons show a significant decrease (FC � -1.5, z-score :::;: -2.0) or increase (FC � 1 .5, z-score � 2.0) of transcript levels as a result of SETD2 knockdown, whereas the transcript level for the whole gene is not significantly changed. This might be the result of a change in alternative splice site choice. We performed a preliminary data analysis, and focused on genes that showed significantly altered levels for one
70 CHAPTER 4

A.
B.
1.2 ..----------------------.
0.8
0.6 .•
0.4 ... ..
0.2 "'""
H3K36me3
H3
Figure 4. siRNA-mediated knockdown of SETD2 in proximal tubular epithelial cells. (A) SETD2 transcripts levels relative to the level in untreated cel ls, as assessed by RT-PCR. (B) H3K36me3 levels as assessed by Western blot ana lysis. B lotting with anti-h istone 3 (H3) served as a loading contro l .
exon. Individual reads mapping at, and around, the alternatively spliced exons were visualized using the Integrative Genomics Viewer (IGV) (http://www.broadinstitute. org/igv/). Subsequently, the ratios between the number of reads that skip the exon of interest and the number of reads that retain the exon of interest were assessed, and compared between the wildtype (WT) sample and the SETD2 knockdown (SETD2 KD) sample. Our preliminary data analysis revealed possible changes in alternative splice site choice as a result of SETD2 knockdown for AASS, Axin 1, DPM1, LTBP3, PUM2, RAD1, and RCC1 (Table 3). In Figure 5, the transcript levels for the different isoforms of RAD1 are shown. SETD2 knockdown appears to result in a shift from isoform 2 (which lacks exon 3) towards isoform 1 (which retains exon 3) of RAD1. All the genes that show differential exon usage as a result of SETD2 knockdown have a H3K36me3 mark in the wildtype PTEC sample, as is shown for RAD1 in Figure 5d.
Besides the apparent change in splice site choice for some genes, we observed an apparent change in transcriptional start site usage as a result of decreased H3K36me3 levels for several genes, including STK19. Knockdown of SETD2 appears to result in usage of a downstream alternative start site of STK19 (Figure 6).
EFFECT OF SETD2 KNOCKDOWN ON TRANSCRIPT LEVELS AND ALTERNATIVE SPLICING 71

....... _ ...... _ - --
Figure 5. Differential alternative splice site choice as a result of SETD2 knockdown in proximal tubular epithelial cell sample PTEC-A09. (A) Coverage profiles of transcript levels, generated from the barn alignment file (see Materials and Methods), and displayed as custom tracks on the UCSC genome browser. The profiles represent the number of sequence reads uniquely aligning to the RAD 1 gene, as assessed by RNA-seq. The exon-intron structure of RAD 1 (RefSeq) is shown at the bottom, with boxed regions and thin lines representing exons and intrans, respectively. WT: untreated PTEC sample, SETD2 KD: PTEC sample treated with SETD2 siRNA. (B) Individual C.
sequence reads mapping to RAD 1 ,
- -- ti --- • --- 1111 --- ..
Exon 4 Exon 3 Exon 2
B.
WT • • 1 1 •
SETD2 KO
Exon 4 Exon 3 Exon 2
, 2 -- - - - --- -- - - -- - --- - -- - - - -- -- - - - - - - - - - - - - - - - - -- -- -- ----- --- --
D isoform 1 as visualized by the Integrative Genomics Viewer. Boxes represent the aligned sequence reads. Total coverage is shown on top. Reads that span d ifferent exons are represented by two or more separate boxes connected by thin lines . In this example, several sequence reads skip exon 3 of RAD 1 in the WT sample,
10 - - - - - - - - - - - - - ---- -
while most of the sequence reads in the SETD2 knockdown sample show retainment of this exon. (C) Graph representing the number of seq uence reads that show exclusion ( isoform 2) or retainment (isoform 1 ) of exon 3 of RAD 1 . (D) Coverage profiles for H3K36me3 (top) and H3K4me3 (bottom) generated from the barn alignment file (see M aterials and Methods), and displayed as custom tracks on the UCSC genome browser. The
VI +-' a. ·;:: u VI C
� +-' #
D lsoform 2 8 - - - - - - - - - - - - - - - - - -
6 - - - - - - - - - - - - - - - - - -
4 ------------------
: +-----------'--1 ___.______.___----_,_--- - - - - -___._--- - ��1--------,----- - -
D.
WT SETD2 knockdown - - - - - - - - - - - - --------------------..
1 0 -1 _'!_����'!!_�!_ 0 _ ■ • • , .U. , a Ill L..._. _ .•
H3K4me3 36 -
0 -
RAD1
RAD1 6
profiles represent the number of sequence reads uniq uely aligning to the RAD 1 gene. The exon-intron structure of RAD 1 (RefSeq) is shown at the bottom, with boxed regions and thin lines representing exons (numbered) and intrans, respectively.
HAPTER 4

A.
SETD2 KO
B. 12
10
V) 8 "'C re QJ 6 l,,,_
# 4
2
0
C.
ST�19I $Tl(19 $Tl(19 STK19 STl(19
--
, 1 , 1 ! ll t, I • l t l l t lo II I f ! • • l t t i " : l T I I t ' I J J ! t f < ll ---- - - --
Exon 1 (TSS}
WT SETD2 knockdown
(TSS*J Exon 2
■ Exon 1
■ Exon 2
- - --- ------------,----=----........................ � .......... =-------------........ '-==-=-��,-.�-� :1r-
l- .M. • .Mill ... - ... . - .. a..1 ... H3K36me3
H3K4me3 8 _, � � � .-. � ...... ,I STKt91• . I I I J I I ill I IJI I JII 1111 lllllllll 111 1111 1 11 l1JII■ JI Jl.11 I ■ . ....... ,
iEgliiftE::::::::::::1:::::::::::::::::::::::::::::::::::::::::::::::::::::::::::::::::::::::::::::1::::::e:::::::::::::1:1::r 1 2 5 6---r"
Figure 6. Differential a lternative start site usage STK1 9 as a result of SETD2 knockdown in proximal tubular epithelial cel l sample PTEC-2A09. (A) Coverage profi les of transcript l evels, generated from the barn a l ignment fi le (see Materia ls and Methods), and disp layed as custom tracks on the UCSC genome browser. The profi les represent the number of sequen ce reads un iquely al igning to the first part of the STK1 9 gene, as assessed by RNA-seq. The exon- intron structure of the first part of STK1 9 (RefSeq) is shown at the bottom, with boxed regions and thin l ines representing exons (numbered) and intrans, respectively. TSS: transcription start s ite, TSS*: a lternative transcription start site. WT: untreated PTEC sample, SETD2 KD: PTEC sample treated with SETD2 s iRNA. (B) Graph representing the number of sequence reads that map to exon 1 or exon 2 of STK1 9 in the untreated and SETD2 knockdown samples. (C) Coverage profi les for H3K36me3 (top) and H3K4me3 (bottom) generated from the barn a l ignment fi l e (see Materia ls and Methods), and disp layed as custom tracks on the UCSC genome browser. The profi les represent the number of sequence reads un iquely a l ign ing to the STK1 9 gene. The exon-i ntron structure of STK1 9 (RefSeq) is shown at the bottom, with boxed regions and th in l i nes representing exons (numbered) and intrans, respectively.
H3K36me3 in different tissue types
We used severa l pub l ica l ly ava i lab le data sets from Ch l P-seq experiments (inc lud ing
G EO databases G S M 537699 (adu lt l iver) , GSM61 3873 (breast myoepithe l i a l ce l ls , and
GS M669597 ( left l u m ina l epithe l ium) to assess whether H3K36me3 modification of the
investigated genes was specific for proxima l tu bu lar epithe l i um . None of the a bove
genes appeared to have a H3K36me3 mark specifica l ly in proximal tu bu la r epithe l i a l
ce l ls (data not shown).
E FFECT OF S ETD2 KNOC KDOWN ON TRANSCR I PT LEVELS AN D ALTER NATIVE S P LI C I N G 73

DISCUSSION
Inactivation of SETD2 has been suggested to be specific for clear cell renal cel l carcinoma (Dalgliesh et al., 2010). This might indicate the presence of H3K36me3 o n a subset of genes specifically in proximal tubular epithelial cells. A change in transcription or transcription-related processes for these genes as a result of H3K36me3 loss might contribute to ccRCC development. As expected, the H3K36me3 profiles in PTECs are largely similar to those in other tissues. However, adult kidney and proximal tubular epithelial cells did show differences in their H3K36me3 profiles for a small subset of genes. Some of these genes are specifically expressed in endothelium cells, that are present in adult kidney, showing that a subset of genes has tissue-specific histone marks. Comparison of the H3K36me3 profiles of PTECs with other epithelial cells may identify a set of genes that specifically carry a H3K36me3 mark in PTECs. As an initial step, the analysis of bronchial epithelial cells will be carried out.
Transient siRNA-mediated knockdown of SETD2 in proximal tubular cells, which resulted in a significant decrease in global H3K36me3 levels (Figure 4), results in significantly increased transcript levels of 33 genes and significantly decreased transcript levels of 55 genes. The set of downregulated genes showed a significant enrichment for genes that function in angiogenesis-related processes (Table 2). This is in concordance with the observation that SETD2 is required for embryonic vascular remodeling (Hu et al., 2009). The enrichment of genes that are involved in the p53 signaling pathway might imply that SETD2 does indeed function in regulating a subset of P53 target genes (Xie et al., 2009). For most of the genes, it remains unclear if the observed changes in transcript levels are a direct result of SETD2 knockdown. The observation that H3K36me3 is virtual ly absent on DEFB1 and C2CD4A in the PTEC sample implies that the observed increased transcript levels for these genes are not the result of loss of H3K36me3.
Several individual exons show a significant decrease of transcript levels as a result of SETD2 knockdown, whereas the transcript level for the whole gene is not significantly changed. This might be the result of a change of an alternative splice site choice. Our preliminary data analysis revealed an apparent change in alternative splice site choice as a result of SETD2 knockdown for seven genes (Table 3). This indeed suggests the involvement of H3K36me3 in alternative splice site choice for at least a subset of genes. However, we did not confirm the changes in alternative splicing as a result of the modulation of H3K36me3 levels for FGFR2, TPM1, TPM2,
and PKM2 that were observed by Luco et al. (2010) in this study. TPM1 and PKM2 are in our list of genes that show significant changes in the expression of an individual exon, while not showing differential transcript levels for the whole gene. This might indicate that alternative splice site choice for these genes has indeed changed as a result of SETD2 knockdown. However, due to numerous reads mapping to the intronic regions of these genes, we could not rel iably assess the numbers of reads skipping or retaining the exons concerned. FGFR2 did not show detectable transcript levels, and TPM2 did not show any detectable change in alternative exon usage (data not shown).

Our preliminary data analysis also revealed a set of genes for which H3K36me3 downregulation appears to result in change of their transcriptional start site. The observed changes should be treated with caution, as most of the transcripts show a lower coverage towards the 5' end, probably as a result of mRNA degradation, which in most cases starts in the 5' region of an mRNA molecule. The apparent changes in transcriptional start site usage could therefore be false-positives, due to low coverage. Either way, a possible link between H3K36me3 and intragenic transcription in mammals was recently provided by Xie et al. (2011). They showed that recruitment of histone demethylase KDM5B to H3K36me3 via interaction with chromodomain protein MRG15 decreased intragenic H3K4me3, resulting in suppression of cryptic intragenic transcription (Xie et al., 2011 ).
Several of the genes that show changes in alternative exon usage are interesting with respect to tumorigenic development. LTBP3 plays a critical role in TGF-13 signaling (Hyytiainen et al. , 2004) lsoform 1 and 2 of LTBP3 are predominantly expressed in different tissue types, suggesting different functions in cellular regulation for these different isoforms. Axin 1 is a negative regulator of WNT-signaling. The observed shift from isoform 1 towards isoform 2 of Axin 1 has been previously observed in ovarian tumors (Klinck et al. , 2008). PUM2 and RAD1 code for proteins that control cell cycle entry (Kedde et al., 2010) and play a role in DNA repair (Zhang et al., 2011 ), respectively. So, given their function, deregulation of several of these genes could potentially contribute to ccRCC development. At the moment, knockdown experiments in additional PTEC samples are ongoing to confirm the role of SETD2/H3K36me3 in the choice of alternative splice site or start site for these genes. Additional studies will be needed to assess the relevance of these altered splicing events with respect to ccRCC development. Comparing the abundance of different isoforms between large numbers of ccRCC tumor samples and normal renal epithelial samples could provide clues about the fraction of ccRCC tumors in which these altered splicing events play a role. The genes for which we observed a change of alternative splice site selection or a change in alternative transcription start site all have a H3K36me3 mark in proximal tubular epithelial cells. However, the mark appeared not to be specific for proximal tubular epithelial cells, as H3K36me3 is also present on these genes in several other tissue types, including breast epithelium. There might, however, be more subtle differences in the local amount of H3K36me3 levels between proximal tubular epithelial cells and the other tissue types. The resolution of our H3K36me3 ChlP-seq data is not sufficient to detect these subtle differences. Another possibility is that, although the gene carries a H3K36me3 mark in several tissues, the change in exon usage has a tumorigenic effect in proximal tubular epithelial cells, but not in other cell types. Either way, additional data are being collected to further analyze H3K36me3 positions in PTEC samples and to compare them with those in other tissue types, such as bronchus epithelial cells.
H3K36me3 is present on the "body" of genes that are transcribed by RNA Polymerase II , i.e . , a majority of actively transcribed protein coding genes (Edmunds et al., 2008). However, SETD2 knockdown in proximal tubular cells appears to affect the processing of only a limited number of target genes. One reason might be that the RNAi-mediated knockdown of SETD2 was not sufficient. Although the global
EF FECT OF SETD2 KNOCKDOWN ON TRANSCRIPT LEVELS AND ALTERNATIVE SPLICING 75

H3K36me3 level appears to be strongly decreased (Figure 4), the residual H3K36me3 levels might be sufficient to result in the "normal" processing of most of the target genes. The ongoing experiments should reveal whether a stronger and/or prolonged knockdown of SETD2 and H3K36me3 levels indeed has a stronger effect on transcript levels, alternative splice site choice, or choice of transcr iptional start site for numerous additional target genes.
ACKNOWLEDGEMENTS
We thank Jackie Senior for editing the manuscript. This project has been financial ly supported by the Dutch Cancer Society (Grant 2007-3892) and the Foundation "De Orie Lichten" in the Netherlands.
REFERENCES
Allemand E, Batsche E, Muchardt C. Splicing, transcription, and chromatin: a menage a trois. Current opinion in Genetics and development 2008:18;145. Al Sarakbi W, Sasi W, Jiang WG, et al. The mRNA expression of SETD2 in human breast cancer: correlation with clinico-pathological parameters. B MC Cancer 2009;9;290. Andersson R, Enroth S, Rada-Iglesias A, et al. Nucleosomes are well positioned in exons and carry characteristic histone modifications. Genome Research 2009; 19: 1732-41. Barski A, Cuddapah S, Cui K, et al. High- resolution profiling of histone methylations in the human genome. Cell 2007 ;129 :823 . Caceres JF, Kornblihtt AR. Alternative splicing: multiple control mechanisms and involvement in human disease. Trends in Genetics 2002;18:186. Cooper TA, Wan L, Dreyfuss G. RNA and disease. Cell 2009;136:777. Dalgliesh G L, Furge K, Greenman C, et al. Systematic sequencing of renal carcinoma reveals inactivation of histone modifying enzymes. Nature 2010:463;360. De la Mata M, Alonso CR, Kadener S, et a l . A slow RNA polymerase I I affects alternative splicing in vivo. Mol Cell 2003;12:525. Dennis G Jr, Sherma BT, Hosacj DA, et al. DAVID: database for annotation, visualization, and integrated discovery. Genome Biol 2003;4 : P3 . Duns G, Van den Berg E , Van Duivenbode I, et al. H istone Methyltransferase Gene SETD2 Is a Novel Tumor Suppressor Gene in
76 CHAPTER 4
Clear Cell Renal Cell Carcinoma. Cancer Res 2010;70:4287. Edmunds JW, Mahadevan LC, Clayton AL. Dynamic histone H3 methylation during gene induction: HYPB/ SETD2 mediates all H3K36 trimethylation. EMBO J 2008;27:406. Fejes AP, Robertson G, Bilenky M, et al. FindPeaks 3 .1: a tool for identifying areas of enrichment from massively parallel shortread sequencing technology. Bioinformatics 2008;24:1729 . Flicek P., Amode MR, Barrell D, et al. Ensembl 2011. Nucleic Acids Res 2010;39: D800. Kent WJ, ZweigAS, Barber G, et al. BigWig and Big Bed: enabling browsing of large distributed datasets. Bioinformatics 2010;26:2204. Fullgrabe J, Kavanagh E, Joseph B . Histone onco-modifications. Oncogene 2011 ;30:3391. Hu M, Sun X-J, Zhang Y-L, et al. Histone H 3 lysine 36 methyltransferase Hypb/Setd2 is required for embryonic vascular remodeling. Proc Natl Acad Sci U S A 2010;107:2956. Huff JT, Plocik AM, Guthre C, et al. Reciprocal intronic and exonic histone modification regions in humans. Nature Structural & Molecular Biology 2010;17:1495. Hyytiainen M, Penttinen C, Keski-Oja. Latent TG F-beta binding proteins: extracellular matrix association and roles in TGF-beta activation. Crit Rev Clin Lab Sci 2004;41 :233. Karolchik D, Hinrichs AS, Kent WJ. The UCSC Genome Browser. Curr Protoc Bioinf 2007 Chapter 1 :Unit 1.4. Kedde M, Van Kouwenhove M, Zwart W, et al. A Pumilio-induced RNA structure switch

in p27-3'UTR controls miR-22 1 and miR-222 accessibi l ity. Nature Cel l B io logy 201 0; 1 2 : 1 01 4. Kl inck R, Bramard A, l nke l L, et a l . Mu ltiple Alternative Spl ic ing Markers for Ovarian Cancer. Cancer Res 2008;68:657 . Kolasinska-Zwierz P, Down T, Latorre I, et a l . D ifferentia l chromatin marking of intrans and expressed exons by H3K36me3. Nature Genetics 2009;41 :376. Li , H . & Durb in , R . Fast and accurate short read a l ignment with Burrows-Wheeler transform . B ioinformatics 2009;25 : 1 754. Luco RF, Pan Q, Tominaga K, et al . Regu lation of a lternative spl ic ing by h istone modifications. Science 201 0;327 :996. Mortazavi A, Wi l l iams BA, McCue K, et a l . Mapping and quantifying mammal ian transcriptomes by RNA-Seq. Nat Methods 2008;5 :62 1 . Morin , R . , Ba inbridge, M . , Fejes, A. , et a l . Profi l i ng t he HeLa S3 transcriptome using randomly primed cDNA and massively para l le l short-read sequencing. B io Techniques 2008;45 :8 1 . Morin RD, Mendez-Lago M, Mungal l AJ, et a l . Frequent mutation of histone-modifying genes in non-Hodgkin lymphoma. Nature 201 1 ;476:298. Pepke S , Wold B, M ortazavi A. Computation for ChiP-seq and RNA-seq studies. Nat Methods 2009;6:S22. Piekiel ko-Witkowska, Wiszomirska H, Wojcicka A, et a I. Distu rbed expression of spl ic ing factors in rena l cancer affects a lternative spl ic ing of apoptosis regu lators, oncogenes, and tumor suppressors . P loS One 201 0;5 :e 1 3690. Pru itt KD, Maglott DR. RefSeq and LocusLink: NCBI gene-centered resources. N ucleic Acids Res 2001 ;29: 1 37 .
Rhead B , Karolch ik D, Kuhn RM , et a l . The UCSC Genome Browser database: update 201 0. Nucle ic Acids Res 201 0;38 :D6 1 3 . Schor I E , Rascovan N , Pel isch F, et a l . Neu rona l ce l l depolarisation induces intragenic ch romatin m odifications affecting NCAM a lternative spl ic ing. Proc Natl Acad Sci U S A 2009; 1 06:4325-30. Spies N, N ie lsen CB, Padgett RA, et al . B iased chromatin s ignatures around polyadenylation sites and exons. Mol Cel l 2009;36:245. Starr TK, Al laei R, Si lverstein KA,et al . A transposon-based genetic screen in m ice identifies genes a ltered in colorectal cancer. Science 2009;323: 1 7 47 . Venables J P. Aberrant and a lternative spl ic ing in cancer. Cancer Res 2004;64:7647 . Venables J P, Kl inck R, Koh C, et a l . Cancerassociated regu lation of a lternative spl ic ing . Nat Struct Ma l B io l 2009; 1 6:670. Wang ET, Sandberg R, Luo S, et a l . Alternative isoform regu lation in human tissue transcriptomes. Nature 2008;456:470. Xie L, Pelz C, Wang W, et al . KDM5B regulates embryonic stem cel l self-renewa l and represses cryptic intragen ic transcription . EMBO J 201 1 ;30: 1 473. Xie P, Tian C, An L, et a l . H istone methyltransferase protein SETD2 i nteracts with p53 and se lectively regu lates its downstream genes. Cel l S igna l 2008;20: 1 67 1 . Yoh SM , Lucas JS, Jones KA. The lws :Spt6: CTD complex controls cotranscriptiona l m RNA b iosynthesis and HYPB/Setd2-mediated h istone H3K36 methylation . Genes Dev 2008 :22;3422. Zhang C, Liu Y, Hu Z, et al . Targeted deletion of mouse Rad 1 leads to deficient ce l l u la r DNA damage responses. Protein ce l l 201 1 ;2 :4 1 0.
EFFECT OF SETD2 KNOCKDOWN O N TRAN SCRI PT LEVELS AND ALTERNATIVE SPLI C I N G 77

SUPPLEMENTARY TABLES
Supplementary Table S1. Ch l Pseq statistics
Percent Percent Sample mark total reads a l igned used al igned used
PTEC-2A09 H3K27me3 1 33525 1 8 948 1 829 8735566 7 1 .0 65.4
PTEC-2A09 H3 K36me3 1 1 988678 8805572 7421 825 73.4 6 1 .9 - -- --
PTEC-2A09 H3K4me3 1 2041 542 7904654 7044424 65.6 58.5
HEK293 H3K36me3 46 1 1 6644 3 1 1 5081 6 28206308 67.5 6 1 .2
Used: reads that passed qua l ity treshhold (QC=S), and dupl icated reads are col lapsed
Supplementary Table S2. RNAseq statistics
Tota l number Sample of reads
PTEC-2A09 (WT) 1 59681 542
PTEC-2A09 (SETD2 KD) 1 8362241 6
78 CHAPTER 4
Mapped to hg1 9
1 36292574
1 56 1 92275
Number Mapped into Mapped i nto of reads Ensembl v61 Ensembl v61 passing QC exons genes
44977 1 20 1 1 1 1 8028 20976657
56099498 1 1 95641 8 27 1 9253 1


TARG ETED EXO M E S EQU E N C I N G I N CLEAR
CELL R E NAL C E LL CARC I N O MA TU M O RS
S U G G ESTS AB E R RANT CH ROMATI N
R EG U LATI O N AS A C R U C IAL STE P I N
CCRCC D EVELO P M ENT
G erben Duns 1 , Robert M .W. Hofstra 1 , J a nti ne G . S ietzem a 1 , H a rry Ho l l ema2, I nge van Du iven bode 1 , Ange la Ku i k 1 ,
Cor G iezen 1 , J a n Osi nga 1 , J e l kje J . Bergsma 1 , H a rr ie B ijnen 1 , P ieter van der Vl ies 1 , Eva va n den Berg 1 , K l aas Kok 1 .
Departments of 1Genetics a n d 2Path ology & Med ica l B io l ogy, University Med ica l Center Gron inge n , Un ivers ity of Gron ingen , the N etherl ands
Under review

ABSTRACT
Clear cel l renal cell carcinomas are characterized by loss of 3p. VHL, located at 3p25, is a major ccRCC tumor suppressor gene and is inactivated in the majority of cases. However, inactivation of VHL alone is not sufficient for ccRCC development, but rather induces senescence. Recently, SETD2, located at 3p21, was identified as a new candidate tumor suppressor gene in ccRCC. Its observed mutational frequency in ccRCC tumors suggests however there are still undiscovered tumor suppressor genes on 3p. We therefore screened all genes on 3p for mutations in ten primary ccRCC tumors using targeted capturing followed by high-througput sequencing. We identified inactivating mutations in VHL and PBRM 1 in six and seven out of ten cases, respectively, pinpointing PBRM 1 as a candidate ccRCC tumor suppressor gene. In one primary tumor, we identified a truncating mutation in BAP1 . Sequencing of PBRM 1 in ccRCC-derived cell lines confirmed its frequent inactivation in ccRCC. PBRM 1 and BAP1 , which are both located at 3p21, code for BAF1 80, the chromatin targeting subunit of the SWI/SNF complex, and BRCA 1 associated protein-1, which is involved in histone deubiquitination, respectively.
Taken together, these data suggest an important role for aberrant chromatin regulation in ccRCC development.
82 CHAPTER 5

INTRODUCTION
Clear cell renal cell carcinoma (ccRCC) tumors show a different mutational spectrum compared to most other tumor types. In the majority of cases, the tumor suppressor gene Von Hippe/ Lindau (VHL) is inactivated, while classical tumor genes like P53, PTEN, KRAS, BRAF, RB and EGFR2 make only a small contribution [Dalgliesh et al. , 2010]. Although VHL is a major tumor suppressor gene in ccRCC, its inactivation alone does not result in ccRCC development, but rather induces senescence [ Mandriota et al., 2002; Young et al., 2003]. This suggests that there are other genes involved in the development of ccRCC.
The main focus in the search for these genes has been on segments of the short arm of chromosome 3 (3p) that show recurrent loss in ccRCC tumors, suggesting the presence of tumor suppressors in these regions. These regions include 3p25, in which VHL is located, and 3p21, which is the site of, until recently, unidentified tumor suppressor genes [Van den Berg et al. , 1997].
Recently, the histone methyltransferase gene SETD2, located at 3p21.31, was identified as a new candidate tumor suppressor gene involved in ccRCC development [Dalgliesh et al, 201 O; Duns et al. , 2010]. The identification of inactivating mutations in additional genes coding for histone modifying enzymes (JAR/D1C, UTX, MLL2) in a subset of ccRCC tumors points to a role of aberrant histone modulation in at least a fraction of ccRCC samples [Dalgliesh et al. , 201 0] . The observed mutational frequency of SETD2 in ccRCC tumors suggests however that this gene may not be the sole tumor suppressor gene in the 3p21 region. Here we describe the screening of all exons, exon-intron boundaries, and untranslated regions from 3p for mutations in a panel of ten primary ccRCC tumors, using targeted capturing followed by a high-troughput sequencing approach.
MATERIAL AND METHODS
Tumor samples and cel l l ines
Primary ccRCC tumor samples were snap-frozen in liquid nitrogen , section s were cut and the histology was reviewed by one pathologist (H. Hollema). Tissue biopsies containing at least 70% tumor cells were selected for analysis. The characteristics of these ccRCC-derived cell lines were described earlier [Duns et al. , 201 0].
S N P analysis
We used the Human CytoSNP-12 BeadChip ( l llumina, San Diego, CA, USA) to assess 3p copy number loss in a panel of 13 primary clear cell renal cell carcinoma tumors following the manufacturer's instructions. Data were analysed using NEXUS v6.0 (Biodiscovery, El Segundo, CA, USA).
TARGETED EXOME SEQUENCING I N CLEAR CELL RENAL CELL CARCIN OMA 83

Exome capture desig n and l ibrary preparation We developed a custom-designed SureSel ect kit (Agilent, Santa Clara, CA, USA) containing, at a 2x coverage, baits for 541 3p genes, UTX, JARID 1 C, TP53 and ISW (approximately 6000 exons) inc luding their 3' UTRs and 5 ' UTRs, and for all miRNAs from 3p. The set in total covered 2 Mb of sequences.
Genomic l ibrary preparation targeted exome capture Genomic DNA was isolated from primary ccRCC tumor tissue using the Oiamp DNA Mini Kit (Oiagen, Venlo, The Netherlands) and size-fragmented by Adaptive Focused acoustics on a Covaris E120 (Covaris Inc, Woburn, Massachusetts, USA) (duty cycle: 10%, intensity: 5, cycles per burst: 20, time: 180 s) to a median size of 200 bp. Fragmented DNA was purified using Oiaquick PCR purificaton columns. Genomic libraries were prepared using the NEBNext sample preparation kit following the manufacturer's instructions (NEB, Ipswich, UK). Adaptors were ligated to the endrepaired and dA-tailed D NA fragments using an ll lumina Index PE adaptor oligo mix ( l l lumina). Adapter- l igated D NA fragments were subsequently size- selected (300-350 bp) using E-gel® Clonewell system ( lnvitrogen, Carlsbad, CA, USA). Size selected adapter-ligated libraries were amplified following the Phusion-high-fidelity-MM protocol (NEB). 500 ng of each amplified adapter-ligated library was hybridized to baits using the SureSelect Target Enrichment System for paired-end multiplex sequencing ( l llumina). Hybridized D NA fragments were purified using AM Pure beads (Agencourt BioSciences Corporation, Beverley, MA, USA). lndex-barcode tags were added by post-hybridization amplification ( 12-14 cycles) following the Phusion-high-fidelity-MM protocol (NEB). Quality and quantity of fragmented DNA samples and libraries were assessed using Experian DNA 12K analysis kit (Bio-Rad, Hercules, CA, USA).
Sequencing Enriched barcoded libraries were sequenced with 1 00 bp paired- end reads across one lane of an ll lumina HiSEQ 2000 flowcell ( l llumina). The sequence reads were analyzed using the CLC BIO Genomic Work Bench Suite 4.5 (CLC BIO, Arhus, Denmark). After trimming low quality sequences, reads were aligned against c hromosome 3 (GRCh37. p2 primary reference assembly).
Variant ca l l i ng We used DIP and SNP analysis tools in CLC bio to identify putative inde ls and single nucleotide changes (quality central base = 20, average quality of surrounding bases =
15, maximum number of gaps and mismatches = 2). The list of putative variations was shortened by discarding those present in: (1) the
dbSNP and/or 1000 Genome Project databases, (2) more than one sample, (3) 100 % of reads, or those that were (4) intergenic, i.e. not in an annotated gene. Furthermore, only putative variants present in paired reads were selected, as these reads have a high probability of being match ed correctly. The functional impact of mutations was predicted using Alamut (Interactive Biosoftware, Rouen, France), NetGene (http://
84 CHAPTER 5

www.cbs.dtu .dk/services/NetGene2/) and the Berke ley Drosoph i la Genome Project (http://www.fruitfly.org/seq_too ls/spl ice. htm l ) .
Mutation screening PCR primer sets were designed to confi rm putative mutations found in VHL, PBRM1, BAP1 and ZNF197. I n addition, 36 primer sets were designed to screen our pane l of ccRCC-derived ce l l l i nes for mutations in the cod ing exons and exon- intron boundaries of VHL and PBRM1. Ampl ified PCR products were purified usi ng EXOSAP IT (G E Hea lthcare, Litt le Cha lfont, Buckinghamsh ire , U K) and sequenced using B igDye Term inator chem istry (Appl ied Biosystems, Foster City, CA, USA) . Reaction products were run on the AB l 3 1 30XL Genetic Ana lyzer (Appl ied Biosystems). Sequences were eva luated using Mutation Surveyor (SoftGenetics LCC, State co l l ege, PA, USA) . Primer sequences a re ava i l able u pon request.
RESULTS AND DISCUSSION
S N P analysis SNP array ana lysis on 1 3 ccRCC tumors revea led an a l le l l i c i mba lance of 3p, most l i ke ly indicating copy number loss, in ten tumors . Seven primary ccRCC tumors appeared to have lost the entire short a rm of chromosome 3 (3p). Tumor samples T-b, T-c and T-d had copy number loss of part of chromosome 3, with a segment of overlap from pter to 64.0 Mb re lative to pter, which inc l udes the 3p2 1 and 3p25 regions (Supp. F ig . 5 1 ) .
3p exome sequencing We conducted partia l resequencing of the DNA from the ten primary ccRCC tumors that showed loss of 3p. We enriched for a l l m icroRNAs and a l l exons, exon- intron boundaries, 5 'UTRs and 3'UTRs of 542 genes located on the short arm of chromosome 3 and fou r additiona l genes (UTX, JAR/D1C, TP53 and /S\1\/), representing a tota l of 2 . 1 Mb bases. Sequencing resu lted in an average of 8.7 m i l l ion pa ired-end reads per sample that cou ld be a l igned aga inst chromosome 3 (G RCh 37 .p2) and to the genomic segments of UTX, JAR/D1C, TP53 and /SW. Variant ca l l i ng and qua l ity fi ltering , which is described in the Materia ls and Methods section , resu lted in a l i st of 203 un ique putative variations in 1 36 genes (Supp.Tab le 5 1 ) . These i nc l ude 1 1 inde ls introduc ing a framesh ift, 3 inframe inde ls, 46 m issense mutations, 2 mutations that were pred icted to affect spl icing , 7 va riations affecting a 5 'UTR, 59 mutations affecting a 3 'UTR, 52 i ntron ic m utations with unknown effect and 23 synonymous m utations. (Supp .Tab le 5 1 ) . The mutations i n VHL, PBRM1, BAP1 and ZNF197 were confi rmed us ing cap i l l a ry Sanger sequencing (Supp. Fig .52).
VHL and PBRM1 are the only genes that show truncating m utations i n more than one primary ccRCC tumor sample . Notab ly, because a l l the tumor samples showed loss of one copy of 3p, these hem izygous mutations resu lt in complete loss of the functiona l protei ns. We identified five pathogen ic mutations in VHL. Fra mesh ift introducing mutations in VHL were identified in th ree out of ten primary tumors .
TARG ETED EXOME SEQU ENCI NG I N CLEAR CELL RENAL CELL CARCI NOMA 85

Tumor T-a shows a missense mutation in VHL that affects the P- domain and which is predicted to affect protein function and tumor T-j shows an exonic mutation which results in loss of a donor splice site (Supp.Table S1 ).
Seven out of the ten primary ccRCC tumors proved to have mutations in PBRM1. Five of them are truncating mutations. In addition, we identified a missense mutation in PBRM1 affecting a bromodomain and predicted to be pathogenic in tumor T-h and a splice site mutation resulting in loss of an acceptor site in tumor T-a (Fig. 1, Supp. Table S1).
' NH2� I 8D1
1 1 1
Figure 1 . PBRM1 mutations in ccRCC samples. Schematic representation of PBRM 1 with arrows showing the locations of the mutations and the corresponding amino acid changes. Red: truncating mutations. Black: missense mutations. Underscored: mutations in primary tumor samples. BD: Bromo domain , BAH: bromo-adjacent homology domain, HMG: high mobility group. Fs: frameshift. National Center for Biotechnology Reference Sequence: NP _060635.2
We did not identify mutations in SETD2 (3p21 ), JAR/01 C or UTX in this screen, nor did we detect mutations in the tumor suppressors TP53, MLH1, or other candidate tumor suppressors from 3p including FHIT, TUSC2, and FOXP1.
We previously identified four inactivating mutations in SETD2 in our panel of ten ccRCC-derived cell lines [Duns et al. , 201 0]. Capillary Sanger sequencing now revealed inactivating mutations in PBRM1 and VHL in five and six ccRCC cell lines, respectively (Fig. 1, Supp. Fig. S3, Supp.Table S2). Four primary tumor samples and four cell l ines had inactivating mutations in both VHL and PBRM1 (Table 1) . Three cell lines showed inactivation of SETD2, PBRM1 and VHL (Table 1). This suggests that inactivation of these genes affects separate pathways that all contribute to ccRCC tumorigenesis.
VH L regulates the cellular response to oxygen availability in the local microenvironment. Under normoxic circumstances, VHL targets the transcription factor Hypoxia inducible factor a (HI Fa) for proteosomal degradation. Inactivation of VHL results in consistently high HIFa levels, resulting in upregulation of HIF targets, which include Vascular endothelial growth factor (VEGF) and Platelet derived growth factor (PDGF). Binding of these ligands to their cognate receptors activates a series of kinase-dependent signaling pathways including the RAF-MEK-ERK and Phosphatidylinositol-3 kinase-AKT-mTOR pathways, triggering angiogenesis and proliferation [Clark, 2009].
The functions of SETD2 and PBRM1 in tumorigenesis are less well understood. The histone methyltransferase SETD2 is responsib le for trimethylation of lysine 36
86 CHAPTER 5

Table 1 . Overview mutations in VHL, PBRM1 , SETD2, BAP1 and ZNF1 97 in ccRCC-derived cel l l ines and primary ccRCC tumors.
Primary ccRCC tumors
Gene Refseq ID a
PBRM1 N M_0 1 8 1 65.4 Spl ice site VH L N M_00055 1 .2 m issense
S ETD2 N M_01 41 59.6 BAP1 N M_004656.2 --- --ZN F1 97 N M_006991 .3
ccRCC derived cell l ines
b c d e f g h
_ _ __ ins 1 bp del 1 bp ins 1 bp del 1 bp missense del 1 bp
del 2 bp --'-------
ins 1 bp del 4 bp Sp l ice site
del 1 bp ----del 4 bp
Gene Refseq ID 1 4 5 AB ER FG2 HS JF JW M F
PBRM 1 N M_0 1 8 1 65.4 ins 1 bp del 4 bp Nonsense m isse_n_se ___ ____ _ del 1 bp -- --VH L N M_0005 5 1 . 2 ins 37 bp m issense _____ del 1 bp del 1 bp ins 6 bp missense
S ETD2 N M_01 41 59.6
ins : insertion , del : deletion, bp: basepai r(s)
del 1 bp Nonsense Loss 3 exons
m issense del 9 bp

on histone 3 (H3K36me3), a modification which is associated with transcriptionally active genes and which has been suggested to play a role in transcriptional elongation and the regulation of alternative splicing of target genes [Luco et al . , 2010]. SETD2 inactivation appears to be unique for ccRCC tumors, suggesting a tumor suppressive function of SETD2 specifically in proximal tubular epithelial cel ls [Dalg liesh et al., 201 0; Duns et al . , 201 0]. In this screen, we did not identify inactivating mutations in SETD2.
PBRM1 is located at 3p21 and encodes the Polybromo 1 (BAF180) protein, which is the chromatin targeting subunit of the Polybromo complex SWI/SNF [Thompson, 2009]. SWI/SNF complexes are large ATP-dependent chromatin-remodeling machines that change the accessibility of DNA by controlling the dynamics of nucleosome occupancy [Reisman et al. , 2009]. Several SWI/SNF components have previously been shown to be involved in cancer development: inactivating mutations in SMARCB 1 and AR/D 1A have been identified in rhabdoid tumors and ovarian carcinomas respectively [Reisman et al., 2009; J ones et al., 2010]. Inactivating mutations in BRG 1 have been identified in several tumor types [Rodrig uez-Nieto et al., 2011; Schneppenheim et al. , 2010], while truncating m utations in PBRM 1 have been described previously in breast cancer samples [Xia et a l . , 2008].
The role of SWI/SNF complexes in tumor suppression is poorly understood. SWI/ SNF components target several genes and signaling pathways that are involved in cell proliferation and cancer, incl uding the Wnt, ErbB, p53, MAPK and insulin signaling pathways, and in processes such as DNA repair, cell cycle regu lation and apoptosis [Euskirchen et al., 2011 ]. PBRM 1 plays a role in coordinating senescence by reg u lating the transcriptional activity of a subset of p53 target genes [Burrows et al . , 201 0], and has been suggested to be involved in the cel l ular response to hypoxia [Kenneth et al., 2009].
The identification of inactivating mutations in PBRM 1 in primary ccRCC tumors and ccRCC-derived cell lines confirms the recent findings of Varela et a l, who sequenced the whole exome of seven primary ccRCC tumors and corresponding normal tissue, and identified somatic truncating mutations in PBRM 1 in four of them [Varela et al . , 2011]. Mutational screening of PBRM 1 using capillary-based sequencing in a total of 227 primary ccRCC tumors revealed inactivating mutations in 91 (41 %) of them. The frequency and nature of the mutations in PBRM 1 in ccRCC tumors suggest that it is a major ccRCC tumor suppressor gene. This points to an important role for aberrant chromatin regulation in the development of ccRCC and proves the longstanding hypothesis that 3p21 is the location of a major tumor suppressor gene.
We identified truncating mutations in two additional genes: ZNF1 97 and BAP1 (Table 1 , Supp.Table S1). BAP 1 , located at 3p21.31 and coding for BRCA 1 associated protein-1, is especial ly interesting with respect to ccRCC pathogenesis. BAP1 mediates deubiquitination of histone H2A and HCHC1, and is involved in the transcriptional control of genes reg ulating cell growth and proliferation [Yu et al., 201 0]. Frequent mutations in BAP7 have been identified in metastizing uveal melanomas and malignant pleural mesothelioma [Harbour et al., 2010; Bott et al., 2011 ]. A role for BAP1 inactivation in a subset of ccRCC tumors would be consistent with the emerg ing role of aberrant chromatin regu lation in ccRCC. BAP1 was not included in the screen
88 CHAPTER 5

by Dalgliesh et al, and no inactivating mutations were identified in the seven ccRCC tumors sequenced by Varela et al [Dalg liesh et al., 201 O; Varela et al., 2011 ]. Mutational screening of BAP1 in a larger panel of ccRCC tumors should therefore give a better estimate of the frequency of inactivation in ccRCC.
ZNF197 belongs to the zinc finger protein superfamily, members of which are regulatory proteins characterized by nucleic acid-binding zinc finger domains. Alternative isoform 2 of ZNF197 lacks these zinc finger motifs and codes for a protein that has been shown to bind to pVHL and negatively regulate HIF-1-a transactivation [Li et al. , 2003]. Inactivation of ZNF197 might therefore be redundant to VHL inactivation. The mutation in ZNF197 was identified in a sample in which no VHL mutation was identified (Table 1 ).
ccRCC genetics
ccRCC genetics appears to be dominated by inactivation of two tumor suppressor genes, VHL and PBRM1, as the majority of primary ccRCC tumors and ccRCC derived cell lines have inactivating mutations in VHL and/or PBRM1. Other genes, including SETD2, JAR/D1C and UTX, appear to play a role in a smaller subset of ccRCC tumors [Dalgliesh et al., 2010]. We did not identify inactivating mutations in these genes in our panel of primary ccRCC tumors, nor did we detect any mutations in several other (candidate) tumor suppressor genes. Several of our ccRCC derived cell lines show concomitant inactivating mutations in VHL, PBRM1 and SETD2, suggesting that inactivation of these genes is functionally nonredundant. Further research is needed to define the specific roles of VHL, PBRM1 and SETD2 in ccRCC tumorigenesis. Our ccRCC-derived cell lines, with their known mutational status for these 3 genes, are ideal tools for performing further research.
ACKNOWLEDGEMENTS
This work was funded by the Dutch Cancer Society, grant 2007-3892. We thank Jackie Senior for editing the paper.
REFERENCES
Bott M, Brevet M, Taylor BS, et al. The nuclear deubuquitin ase BAP1 is commonly inactivated by somatic mutations a nd 3p21.1 losses in malignant pleural mesothelioma . Nature Genet 2011 ;43:668. Burrows AE, Smogorzewska A, Elledge SJ . Polybromo-associated BRG-associated factor components BRD7 a nd BAF180 are critical regulators of p53 required for induction of replicative senescence. PNAS U S A 2010;107:14280. Clark PE. The role of VHL in clear-cell renal cell carcinoma a nd its relation to targeted therapy. Kidney Int 2009;76:939-945.
Dalgliesh G L, Furge K, Greenman C, et al. Systematic sequencing of renal carcinoma reveals inactivation of histone modifying enzymes. N ature 2010;463:360. Duns G, van den Berg E, va n Duivenbode I, et al . Histone methyltra nsferase gene SET D2 is a novel tumor suppressor gene in clear cell renal cell carcinoma . Ca ncer Res 2010;70:4287. Euskirchen G M, Auerbach RK, Davidov E, et al. Diverse roles and interactions of the SWI/SNF chromatin remodeling complex revealed using global approaches. PloS G enet 2011 ;7:e1002008.
TARGETED EXOME SEQUENCING IN CLEAR CELL RENAL CELL CARCINOMA 89

H a rbour JW, Onken MD, Roberson ED, et a l . Frequent mutation o f BAP1 i n metastasizi ng uveal melanomas. Science 201 0;330: 1 4 1 0. Jon es S, Wang TL, Sh ih l eM , et a l . Frequent m utations of chromatin remodel ing gene ARI D 1 A in ovarian clear ce l l carc inoma. Science 201 0;330:228. Ken neth NS, Mudie S , Van Uden P, et al . SWI/ S N F regu l ates the ce l l u l a r response to hypoxia . J B io l Chem 2009;284:4 1 23. Li Z, Wang D, Na X, Schoen SR, et a l . The VH L protein recruits a novel KRAB-A domain prote in to repress H I F- 1 a lpha transcriptiona l activity. EMBO J 2003 ;22: 1 857 . Luco R F, Pan Q, Tominaga K, et a l . Regu lation of a lternative spl icing by h istone modifications. Science 201 0;327 :996. Mandriota SJ , Turner KJ , Davies DR, et a l . H I F i nactivation identifies early lesions i n VH L k idneys: evidence for site-specific tumor suppressor function in the nephron . Cancer Ce l l 2002; 1 :459. Reisma n D , G laros S , Thompson EA. The SWI/SNF complex and can cer. Oncogene 2009;28 : 1 653. Rodriguez-Nieto S , Canada A, Pros E , et a l . Massive para l le l D N A pyrosequencing ana lysis of the tumor suppressor BRG 1 /SMARCA4 in l un g primary tumors. Hum Mutat 201 1 ;32: 1 999.
90 CHAPTER 5
Schneppenheim R, Fruhwald MC, Gesk S, et a l . Germl ine mutation and somatic inactivation of SMARCA4/BRG 1 in a fami ly with rhabdoid tumor predisposition syndrome. Am J H u m Genet 201 0;86:279. Thompson M . Polybromo-1 : the chromatin targeti ng subunit of the PBAF complex. B iochimie 2009; 9 1 :309. Van den Berg A, Dijkhu izen T, Draa ijers TG , et a l . Analysis of m u lt ip le rena l ce l l adenomas and carcinomas suggests a l le l ic loss at 3p21 to be a prerequisite for ma l ignant development. Genes Chromosomes Cancer 1 997 ; 1 9 :228. Vare la I , Ta rpey P, Ra ine K, et a l . Exome sequencing identifies frequent mutation of the SWI/SN F complex gene PBRM1 i n rena l carcinoma. Nature 201 1 ;469 :539 . Xia W, Nagase S , Montia AG , et a l . BAF1 80 is a critica l regu lator of p2 1 induction and a tumor suppressor mutated in breast cancer. Cancer Res 2008;68 : 1 667 ' . Young AP, Sch l is io S , M inamishima YA, e t a l . VHL loss actuates a H I F- independent senescence programme med iated by Rb and p400. N at Cel l Biol 2008; 1 0:36 1 . Yu H , Mashta l i r N , Daou S, et a l . The ubiqu it in carboxyl hydro lase BAP1 forms a terna ry complex with YY1 and HCF-1 and is a critical regu lator of gene expression. Mol Cel l B io l 201 0;30:507 1 .

SUPPLEMENTARY F IGURES AND TABLES
T-a
T-b
T-c
T-d
T-e
T-f
T-g
T-h
T-i
T-j
--------
■
-■
Supplementary Figure 1 . 3p copy number loss in primary ccRCC tumors assessed by SNP arrays. Red l ines: regions showing chromosomal loss. B lue horizonta l l ines: regions showing chromosomal ga in . Purple l i ne: regions showing imba lance.
TARG ETED EXO M E SEQU ENC ING IN CLEAR CELL RENAL CELL CARC IN OMA 9 1

(A)
(B)
(C)
(D)
(E)
(F)
(G)
(H)
( I )
{1} : ; . ; .. : . · : :. · ' . ; ; : .: . : .
�
T,
G G G
r2J . . L : .:. . : . ! : - : : : . * . . . : ::: , . - : : . . ; : . � ti:s/JJJMMM �t:sfi\(J;LJl����
A A G T A T T C UI_ T G G G G G G T G G G
{l} i • : : , C ,; ; , ' . ' /\ • \ . : • : • . _ '. _ '.
m:tt�f
c
• �� (2) : . ; . . _:_ C .• j
. ; . • :
_, •
�
-- - ·
< . . 1 -i i :j.. i' 1 i j . - - l 1
. . , .. . ' . - · . * . . .
.. '. .. i .. I • .• I - , ' ' • ' i · / '.
A A G C A G A A T � � m * m m m m m �
/l/
T T T T
�-
-
� \!\JvJ. ' "'( ·t ; ' '
(1)
T/T T/T T/T T/T A/T G/A G/G A/G G/A Af§ A A T G C C A C T
G A A C A A C A T T G A A T A A G A T T
r2) �� ;\�d G A A C A A ,;j_p,_ A/C T/A T/T G/T A/G A/A T/A A/T A/A G/A A/G T/A T/T
� _ G � A c;:, , A T C T T C T T T T T C C . T G
(1)
/l/ MAis&JA�DNVV\A&JJcJA&.J
(1)
(2)
(1)
(2)
(1) (2)
(1) (2)
G G G A C A IJS.. C/T T/T T/C C/T T/T T/T T/T T/T T/C C/C C/T T/G G/T
T A C T T T T G T Af§- G C
�
. � ' i. . ! . : . . ' •· : . j · I · ; i ·· , •· - • - - i - ·· · ·!
� [: '. • • > -i .:.· . . :j- * ! , .. :. i . : � : . ... •· . ... . . .. . ·•• - .. .,,, . . . . . ' . �
C A A G A A Af:I_ T/G G/A A/G G/T T/T T/T T/G G/T T/T T/C C/A A/G
�-====-� ;;::;-:. ·=== T C A G G C A C G � T A T C C A A T C
-. .. . � * *· t ) . .
92 CH TER 5
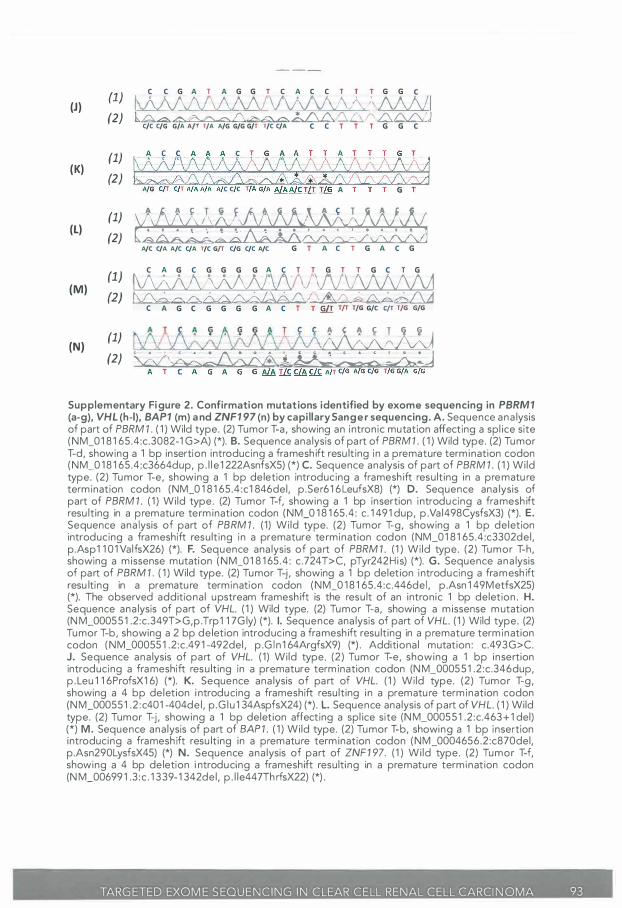
{J)
{K)
{L)
(M)
(N)
C C G A T A G G T C A C C T T T G G C
{l} tvvv\N\AM/\1\A/V\MJ MNI (2) h A a:-.c-. � f\0;,,p, -0 �.J\6, '\ I , /"' 6 D,/\/J
C/C C/G G/A A/T T/A A/G G/G G/T T/C C/A � C C T T T G G C
(1)
{2}
(1) (2) �� � � =:=���
A/C C/A A/C C/A T/C G/T C/G C/C A/C � G T A C T G A C G
C A G C G G G G A C T T G T T G C T G 11J 1\/\AMMM/\/\/\/W\J\/\M/Vl �J �oo6AALV�4�1 A� �A�hru
C A G C G G G G A C T T � m � � � � �
(1) iJ0JJJw (2) < � · •
1
< • :J\ •� ;_ '• :�: < : : � � • ! ��\. &�
Supplementary Figure 2. Confirmation mutations identified by exome sequencing in PBRM1 (a-g), VHL (h-1), BAP1 (m) and ZNF1 97 (n) by capillary Sanger sequencing. A. Sequence ana lysis of part of PBRM 1 . ( 1 ) Wild type. (2) Tumor T-a , showing an intronic mutation affecting a spl ice site (NM_01 8 1 65.4:c.3082-1 G>A) (*). B. Sequence ana lysis of part of PBRM 1 . ( 1 ) Wild type. (2) Tumor T-d, showing a 1 bp insertion introducing a framesh ift resu lting in a premature term ination codon (NM_0 1 8 1 65.4:c3664dup, p . l l e 1 222AsnfsX5) (*) C. Sequence ana lysis of part of PBRM 1 . ( 1 ) Wi ld type. (2) Tumor T-e, showing a 1 bp deletion introducing a framesh ift resu lting in a prematu re term ination codon (NM_0 1 8 1 65.4 :c1 846del, p .Ser6 1 6LeufsX8) (*) D. Sequence ana lysis of part of PBRM 1 . ( 1 ) Wi ld type. (2) Tumor T-f, showing a 1 bp insertion introducing a framesh ift resu lting in a premature term ination codon (NM_0 1 8 1 65.4 : c. 1 491 dup, p .Va l498CysfsX3) (*). E. Sequence ana lysis of part of PBRM 1 . (1 ) Wi ld type. (2) Tumor T-g , showing a 1 bp deletion introducing a frameshift resu lt ing in a premature termination codon (NM_01 8 1 65.4 :c3302del , p.Asp1 1 0 1 ValfsX26) (*). F. Sequence ana lysis of part of PBRM 1 . ( 1 ) Wi ld type. (2) Tumor T-h , showing a m issense mutation (NM_01 8 1 65 .4 : c.724T>C, pTyr242His) (*). G. Sequence ana lysis of part of PBRM 1 . ( 1 ) Wild type. (2) Tumor T-j , showing a 1 bp deletion introducing a framesh ift resu lting in a premature termination codon (NM_0 1 8 1 65.4:c .446del , p .Asn 1 49MetfsX25) (*). The observed additiona l upstream framesh ift is the resu lt of an intronic 1 bp deletion . H. Sequence ana lysis of part of VHL. ( 1 ) Wild type. (2) Tumor T-a, showing a m issense mutation (N M_00055 1 .2:c.349T>G,p.Trp1 1 7G ly) (*). I. Sequence ana lysis of part of VHL. ( 1 ) Wild type. (2) Tumor T-b , showing a 2 bp deletion introducing a framesh ift resu lting in a premature term ination codon (NM_00055 1 .2:c .49 1 -492del , p .G l n 1 64ArgfsX9) (*) . Additiona l mutation : c.493G>C. J. Sequence ana lysis of part of VHL. ( 1 ) Wi ld type. (2) Tumor T-e, showing a 1 bp insertion introducing a frameshift resu lting in a premature term ination codon (N M_00055 1 .2 :c .346dup, p . Leu 1 1 6ProfsX1 6) (*). K. Sequence ana lysis of part of VHL. ( 1 ) Wi ld type. (2) Tumor T-g , showing a 4 bp deletion i ntroducing a frameshift resu lting in a prematu re term ination codon (N M_000551 .2 :c401 -404del , p.G l u 1 34AspfsX24) (*) . L. Sequence ana lysis of part of VHL. ( 1 ) Wild type. (2) Tumor T-j , showing a 1 bp deletion affecting a spl ice site (N M_00055 1 .2 :c.463+ 1 del) (*) M. Sequence ana lysis of part of BAP1 . ( 1 ) Wi ld type. (2) Tumor T-b, showing a 1 bp insertion introducing a framesh ift resu lting in a premature term ination codon (NM_0004656.2 :c870del, p.Asn290LysfsX45) (*) N. Sequence ana lysis of part of ZNF1 97. ( 1 ) Wi ld type. (2) Tumor T-f, showing a 4 bp deletion i ntroducing a frameshift resu lting in a premature termination codon (N M_00699 1 .3 :c . 1 339- 1 342del , p . l le447Th rfsX22) (*) .
TARG ETED EXOM E S EQUENCING I N CLEAR CELL RENAL CELL CARCI N OMA 93

(A) (1)
(B)
(C)
(D)
(E)
(F)
(G)
(H)
( I )
(2) �;' � ���� G C T A T A C C A C 8 A A A A C A T T T
G C C A A A G A T A T
(1) .
(2) �� * * * 0 • I ( = : :. I\ - 1
* Ac;:,.✓.---. /;v� G C C A A A G A _ _ _ _ G A T C T C C T
T A A A A T T G C A G C A A G T T A T G
11) lAAM/\M/\/\J\N\N\/\/'.
\ ;W\/J (2)
(1) (2)
(1) (2)
(1) (2)
T A A A A T T G T A G C A A G T T A T G
T G A A G G T
T G A A G G T T G ! C G A C T G T G T
G C C A G G T
AA/'\AAA/
37 nts
T G C T G C G C T C G G T G A A C T C (l} P\;\/\AlWWJ'\j\Al\A/VV\f\/VCV (2)
, o , , � � 9 1;: _r_ o A I\ I ,A A A. t. A '-➔ C ,£,\ A /·\A /\ £\ ,0.,L\& l\f\/4...;J..V_ /\ w,L\£;.__£
T G C T G C G C T § G G T G A A C T C
C A A T G T T G A C G G A C A G C C T
(l) 10,A.AN" \/1 , A � � :/' 1 I O � � � A c A o t /' � ! (2) �At\L\�* �/\AAA�
C A A T G T T G A G G A C A G C C T
G C C T A T T T T T G C C A A T A T C
r1J �/\A/VVVV\/v\/Vv\;\A/\fv 0 · c C .- --- A ' - I , · · · · l ·a .. C
A :.... A -- , · A • I C
(2) \ cJ:v::s/\ Db-AL\ A * ,o.c>-n..6 AA/\ 1\A.t G C C T A T T T T _ G C C A A T A T C
94 CHAPTER 5

(J)
(K)
•• 1 ◄ • • f I ·• .. . . . .
.. ..
. ' ' . � . . . .
(1) .. . ::::: ::. -::::: :·: ! :: · . ::·:: . ··:: . : :: . .. . . • "-·· · :�··· ··: ·_:·· . . • -: .. -: :: ' .. .
... , ..
···· ··•· ·· ······· .. . .. . . . .. . . ·-· ·· ... .... - •· . , _
....... ,.. .
. .. . .. .
(2) �
· c G C A T C C § � A I � A A C A G C T
G T C G T G C T G C C C G T A T G G C
(1) 1/VY'NW'xV\f{VWWVVv\f' lc ·�A��A� ' !�!:� · c. c ,, , A , � A , A
(2) ��� �J G T C G T G C T G T C C G T A T G G C
Supplementary Figure 3. Mutations in PBRM1 (a-e) and VHL (f-k) in ccRCC derived cel l l ines identified by capil lary Sanger sequencing. A. Sequence ana lysis of PBRM 1. ( 1 ) Wild type. (2) . RCC-4, showing a 1 bp insertion introducing a framesh ift result ing in a premature term ination codon (NM_01 8 1 65.4:c2592dup, p .H is865Th rfsX4) (*). B. Sequence ana lysis of PBRM 1 . ( 1 ) Wi ld type . (2) . RCC-ER, showing a 4 bp deletion introducing a frameshift resulting in a premature term ination codon (N M_01 8 1 65.4:c753-756del , p.Asp25 1 G lufsX3 1 ) (*). C. Sequence ana lysis of PBRM 1. ( 1 ) Wi ld type. (2) RCC-FG2, showing a nonsense mutation (NM_0 1 8 1 65.4:c1 333C>T, pG ln445X) (*). D. Sequence ana lysis of PBRM 1 . ( 1 ) Wi ld type. (2) RCC-HS, showing a missense mutation (NM_0 1 8 1 65 .4: c.3386G> T, pGly1 1 29Val) (*) . E. Sequence ana lysis of PBRM 1. ( 1 ) Wi ld type. (2) RCC-MF, showing a 1 bp deletion introducing a framesh ift resulting i n a premature term ination codon (N M_0 1 8 1 65.4 :c1 487del , p .Asn496MetfsX4)(*). F. Sequence analysis of VHL. ( 1 ) Wi ld type. (2) RCC- 1 , showing a 37 bp i nsertion i ntroducing a frameshift resu lt ing in a premature term ination codon (N M_00055 1 .2 :c458-459ins37, p . Pro 1 54CysfsX2) (*) G. Sequence ana lysis of VHL. ( 1 ) Wi ld type. (2) RCC-4, showing a m issense mutation (N M_00055 1 .2 : c . 1 94C>G, pSer65Trp) H. Sequence ana lysis of VHL. ( 1 ) Wild type . (2) RCC-ER, showing a 1 bp deletion i ntroducing a frameshift resulti ng i n a premature term ination codon (N M_000551 .2 :c482del , p.Asp1 43AlafsX1 6) (*) . I . Sequence ana lysis of VHL. ( 1 ) Wild type. (2) RCC-FG2, showing a 1 bp deletion introducing a framesh ift resu lt ing in a premature term ination codon (N M_000551 .2 :c .444del , p .Phe 1 48LeufsX1 1 ) (*). J. Sequence ana lysis of VHL. ( 1 ) Wi ld type. (2) RCC-JW, showing an i nframe 6 bp insertion (N M_00055 1 .2 :c .328-444insGCATCA, p .H is 1 1 0del insArg l l eAsn) (*) . K. Sequence ana lysis of VHL. ( 1 ) Wi ld type. (2) RCC-MF, showing a missense mutation (NM_000551 .2 :c .236C> T, p . Pro86Ser) (*) .
TARG ETED EXOM E SEQU ENCI N G I N CLEAR CELL RENAL CELL CARC INO MA 95

Supplementary Table S1 . Unique variations identified by targeted exome sequencing.
Gene name
ABHD5
ABHD5
ADAMTS9
APEH
APPL1 ,ASB 1 4
APPL1 ,ASB 1 4
ARHGEF3
ARHGEF3
ARI H2
ARPP21
ARPP21
ATG7
ATXN7
ATXN7
ATXN7
BAP1
BAP1
BSN
C3orf1 8
C3orf77
CACNA2D2
CACNA2D2
CACNA2D2
CACNA2D3
CACNA2D3
CADM2
CADM2
CAPN7
CAV3
CAV3
CCDC36
CCDC66
CCDC66
CCR3
96 CHAPTER 5
Refseq Tumor
NM_01 6006 T-a
NM_01 6006 T-c
NM_1 82920 T-c
NM_001640 T-a
NM_01 2096 T-b
NM_001 1 42733 T-b
NM_001 1 2861 5 T-g
NM_01 9555.2 T-i
NM_006321 T-b
NM 001 025068 T-g
N M_01 6300 T-g
NM_001 1 4491 2. 1 T-e
NM_000333 T-b
NM_000333 T-g
N M_001 1 28 1 49 T-b
NM 004656.2 T-b
N M_004656.2 T-j
NM 003458 T-a
NM_01 62 1 0 T-b
NM_00 1 1 45030 T-h
NM_001 005505 T-c
NM_001 005505 T-e
N M_00 1 005505 T-i
NM_01 8398 T-i
N M_01 8398 T-h
N M_1 53 1 84 T-d
NM_1 53 1 84 T-d
NM_01 4296 T-i
NM_001 234 T-i
NM 033337.2 T-h
N M_1 781 73.3 T-h
NM_001 01 2506 T-j
NM_00101 2506.4 T-g
NM_001 837 T-a
Mutation
Sanger seq type genomic location
not performed missense 4374391 4
not performed missense 43743774
not performed 3'UTR 64501 7 1 9
not performed intronic 497 1 5 1 23
not performed 3'UTR 57303851
not performed intronic 57303851
not performed intronic 567791 70
not performed missense 56787540
not performed intronic 49004749
not performed 3'UTR 357268 1 7
not performed intronic 3572681 7
not performed missense 1 1 383650
not performed 3'UTR 639851 57
not performed 3'UTR 6398651 4
not performed missense 639851 57
Confirmed Frameshift 52439842
not performed intronic 52436770
not performed missense 49691 434
not performed 3'UTR 5059637 1
not performed synonymous 44328924
not performed 3'UTR 50401 376
not performed 3'UTR 50400737
not performed 3'UTR 50401 336
not performed intronic 54354624
not performed synonymous 5 5 1 07571
not performed 3'UTR 861 1 76 1 8
not performed synonymous 859354 1 3
n o t performed missense 1 5259048
not performed 5'UTR 8775526
not performed missense 8787347
Not confirmed missense 4929381 9
not performed intronic 56651 698
not performed missense 56653900
not performed 5'UTR 46283902
cDNA level
N M_01 6006.4
(ABHD5) :c.341 G> T
N M_01 6006.4
(AB HD5):c.201 G>C
N M_01 9555.2
(ARHGEF3):c.430G> T
N M_001 1 4491 2. 1
(ATG7):c.905G>T
N M_001 1 77387. 1
(ATXN7):c.2760C>A
NM_004656.2
(BAP1 ) :c.870del
N M_003458.3
(BSN):c.4445C> T
N M_01 4296.2
(CAPN7): c.328A>G
N M_033337 .2
(CAV3): c.250C>G
N M_1 781 73.3
(CCDC36): c889T>G
N M_001 01 2506.4
(CCDC66): c.2629A>G

protein level Coverage
p.Arg 1 1 4Leu 787
Lys67Asn 348
X 1 65
255 ·- -- ------ ---
----
-----
------
X
--- �
Ala 1 445er
X
Cys302Phe
X
X
Ser920Arg
p.Asn290LysfsX45
p.Pro1 482Leu
X - -------
X
X
X
X
X
X ---- ----X
l le 1 1 0Val
X
p.Leu84Val
Trp297Gly,Gly
-----lle877Val
--------X
281
281
2 1 9
2 1 6
1 96
335
335
259
474
3 1 1
474
1 92
306
426
432
221
237
336
242
1 77
284
261
365
398
281
338
249
1 57
61 6
703
Frequency
Variant WT Variant/WT
T G 34.9/65 . 1
C G 24.7/75.3
T C 44.2/55.8
A G 62.4/37.6
T A 32.0/68.0
T A 68.0/32.0
A C 75.3/24.7
A C 62.0/38.0
A G 70.4/29.6
G A 78.8/2 1 .2
G A 78.8/2 1 .2
T G 44.8/55.2
A C 22.6/77.4
C A 31 .8/68.2
A C 77.4/22.6
G 36.5/63.5
A T 34.3/65.7
T C 54.5/45.5
T C 25.2/74.8
C A 67.3/32.7
T C 7 1 .3/28.7
A G 43.8/56.2
C G 29.8/70.2
T C 32.8/67.2 -----T C 63.7/36.3
T C 1 9.9/8 1 . 1
T C 7 1 .5/28.5 --- -G A 6 1 . 1 /38.9
------A G 28. 1 /7 1 .9
G C 63.0/37.0
G T 73. 1 /26.9
A G 41 .4/58.6
G A 73.7/26.3
T C 37.7/62.3
Predictions
AGVGD SIFT Polyphen
co Tolerated Probably damaging
co Tolerated Benign
X X X
X X X
X X X
X X X
X X X
C65 Affect protein Possibly function damaging
X X X
X X X
X X X
co Tolerated Possibly damaging
---- --X X X
X X X
co Tolerated Possibly damaging
X X X
X X X
C65 Affect protein Probably function damaging
X X X
X X X
X X X
X X X
X X X
X X X
X X X
X X X
X X X
co Tolerated Benign
X X X
co Tolerated Benign
co Tolerated Probably damaging
X X X
co Tolerated Probably damaging
X X X
TARG ETED EXO M E SEQU ENC ING I N C LEAR CELL RENAL CELL CARCI N OM A 9 7

Supplementary Table 51 . Continued.
Gene name
CCR5
CCR5
CDCP1
CEL5R3
CGGBP1
CGGBP1
CHDH
CHDH
CLA5P2
CMTM8
CNTN3
CNTN4
CNTN4
CNTN4
CNTN6
COL7A1
COLO
CPNE9
CTNNB1
CTNNB1
DAG1
DAG1
DCP1A
DH FRL1
DLEC1
DLEC1
DLEC1
DNAH 1
DNAH 1
DNAH1
DOCK3
DOCK3
ENTPD3
98 CHAPTER 5
Refseq
NM_000579
NM_000579
N M_022842
NM_001407
NM 001 008390
NM_001008390
NM 01 8397
N M_01 8397
N M_01 5097
N M_1 78868.3
N M_020872
N M_1 7561 2
NM_1 75607
NM_1 75607
NM 0 1 4461
N M_000094
N M_005677
NM_ 1 53635
N M_00 1 098209
NM_001 904.3
NM_004393
N M_004393
NM_01 8403
NM_1 768 1 5
NM_007337
NM_007337
NM_007335
NM 0 1 55 1 2
N M_0 1 55 1 2
N M_0 1 55 1 2
N M_004947
NM_004947
NM_001 248
Tumor Sanger seq
T-d not performed
T-g not performed
T-c not performed
T-g not performed
T-e not performed
T-g not performed
T-j not performed
T-g not performed
T-f not performed
T-g not performed
T-6 not performed
T-d not performed
T-i not performed
T-g not performed
T-i not performed
T-a not performed
T-d not performed
T-j not performed
T-f not performed
T-6 not performed
T-b not performed
T-d not performed
T-g not performed
T-f not performed
T-6 not performed
T-i not performed
T-i not performed
T-b not performed
T-d not performed
T-6 not performed
T-e not performed
T-6 not performed
T-e not performed
Mutation
type genomic location cDNA level
3'UTR 4641 7340
3'UTR 4641 7266
missense 451 30627 NM 022842.3
(CDCP1) : c.2000C>G
3'UTR 48675391
3 'UTR 88 10 1 730
3'UTR 88101 339
3'UTR 53851 505
intronic 53852920
intronic 33653588
missense 32398997 N M_1 78868.3
(CMTM8): c.280A>G
missense 7441 3659 NM_020872 . 1
(CNTN3): c. 1 1 72A> T
5'UTR 308 1 5 1 9
intronic 3097734
synonymous 3081 933
synonymous 1 33737 1
intronic 48620392
3'UTR 1 5491 8 1 8
missense 97566 1 8 NM_ 1 53635.2
(CPN E9): c.67 1 A>G
intronic 4 1 268866
missense 4 1 266697 NM_001 904.3
(CTNN B 1 ) : c.494A>G
3'UTR 49572438
3'UTR 49572260
missense 53378932 N M_01 8403 .5
(DCP 1 A): c . 1 73G>A
missense 93780283 NM_001 1 95643. 1
(DHFRL1 ): c.73A>T
in frame del 3 8 1 6407 1 NM_007337.2
(DLEC1) : c.531 2-531 4del
missense 381 63900 NM_007337.2
(DLEC1 ): c.5 1 4 1 C> T
synonymous 381 63900
missense 524041 78 N M_01 551 2.4
(DNA H 1 ): c.6 1 9 1 A>G
missense 5242031 5 N M_01 551 2.4
(DNAH 1 ) : c.8765C>T
synonymous 523866 1 5
intronic 5 1 1 1 2909
synonymous 5 1 399347
missense 40442421 N M_001 248.2
(ENTPD3): c.205A>G

- - -- -
� - ---
Frequency Predictions
protein level Coverage Variant WT Variant/WT AGVGD S IFT Polyphen
X 670 T A 32.2/67 .8 X X
X 630 T G 22.4/77.6 X X
Thr667Ser 237 C G 39.7/60.3 co Tolerated Benign
X 328 C G 72.0/28.0 X X X
7 1 4 A C 40.2/59.8 X X
X 553 C T 49.9/50.1 X X X
X 307 T C 64.2/35.8 X X X
1 70 A G 60.0/40.0 X X X
284 C T 64.8/35.2 X X
Met94Val 363 G A 70.5/29.5 co Tolerated Benign
Lys39 1 lle 370 A T 43.0/57.0 co Affect protein Benign
function
X 481 G A 25.8/74.2 X X X
1 84 T G 63.0/37.0 X X
367 A G 21 .0/79.0 X X X
X 597 C T 27.0/73.0 X X X
1 7 1 A C 55.0/45.0 X X X
4 1 2 A G 30. 1 /69.9 X X X
Tyr224Cys 283 G A 1 8.7/8 1 .3 C65 Affect protein Probably
function damaging
1 62 G A 60.5/38.9 X X
Gln1 65Arg 4 1 7 G A 64.7/35.3 co Tolerated Possibly
damaging
21 1 A G 26. 1 /73.9 X X X
X 665 C G 62.9/37.1 X X X
Arg58Gln 293 T C 47 . 1 /52.9 co Tolerated Probably
damaging
Arg25Trp 921 A T 40.7/59.3 co Tolerated Benign
p.Asp1 772del 253 ATG 58. 1 /4 1 .9 X X
Pro1 7 1 4Leu 246 T C 64.6/35.4 co Tolerated Benign
X 246 C T 35.4/65.6 X X X
Asn2064Ser 61 0 G A 67.7/32.3 co Affect protein Benign
function
Ala2922Val 1 95 T C 64. 1 /35.9 co Affect protein Benign
function
X 295 T C 28.5/7 1 .5 X X X
306 T C 75.2/24.8 X X
X 646 A G 31 .0/68.9 X X X
Thr69Ala 2 1 0 G A 21 .4/78.6 co Affect protein Probably
function damaging
TARG ETED EXOM E SEQUENC ING IN CLEAR CELL RENAL CELL CARCI N OMA 99

Supplementary Table 51 . Continued.
Gene name
EPHA3
EPM2AI P 1
EPM2AI P 1
ERC2
FAM 1 1 6A
FBLN2
FGD5
FGD5
FGD5
FOXP1
FRMD4B
FYCO1
GADL1
GBE1
GPD1 L
GRM2
HACL1
HYAL1
I FRD2
IL1 7 RB
IL1 7 RC
IL1 7RE
IQCF2
IQ5EC1
ITI H 1
ITIH 3
ITPR1
KAT2B
KBTBD8
KCN H8
KIF 1 5
LMOD3
LOC 1 00 1 32526
LOC401 052
LRI G 1
LRIG 1
1 00 C HAPTER 5
Refseq
N M_005233
NM_014805
NM_01 4805
N M_01 5576
NM_1 52678
NM_001 004019
N M_1 52536
N M_1 52536
N M_1 52536
NM_032682
NM_01 5 1 23
NM_0245 1 3
NM_207359
N M_0001 58
N M_01 5 1 41
XM_002342357
N M_01 2260
NM_0073 12
NM_006764
NM_01 8725
NM_032732
N M_1 53480
NM_203424
NM_01 4869
NM_00221 5
NM_00221 7
N M_001 099952
N M_003884
NM_032505
N M_1 44633
NM_020242
NM_1 9827 1 .3
XM_001 721 2 1 2
N M_001 008737
NM_01 5541
N M_01 5541
Tumor Sanger seq
T-6 not performed
T-i not performed
T-h not performed
T-g not performed
T-6 not performed
T-g not performed
T-e not performed
T-g not performed
T-6 not performed
T-i not performed
T-f not performed
T-e not performed
T-j not performed
T-d not performed
T-6 not performed
T-6 not performed
T-d not performed
T-i not performed
T-i not performed
T-e not performed
T-i not performed
T-h not performed
T-e not performed
T-d not performed
T-6 not performed
T-a not performed
T-a not performed
T-c not performed
T-a not performed
T-e not performed
T-a not performed
T-6 not performed
T-a not performed
T-h not performed
T-d not performed
T-d not performed
Mutation
type genomic location cDNA level
intronic 894451 94
3'UTR 37030382
missense 37033820 NM_01 4805.3 (EPM2AIP 1 ): c.749T>C
intronic 56041371
missense 5761 4059 NM 1 52678.2 (FAM1 1 5A): c. 1 709G>C
synonymous 1 3672866
3'UTR 1 49749 1 0
3'UTR 1 4862732 ----intronic 1 4941 867
intronic 7 1 1 6 1 8 1 7
3'UTR 69220061
missense 46008983 NM_0245 1 3.2 (FYCO 1 ): c . 1 843C> T
intronic 30898466
3'UTR 8 1 539250
3'UTR 32207534
5 'UTR 5 1 74341 1
synonymous 1 5609395
5'UTR 5034051 7
missense 50327685 NM_006764.4 (IFRD2): c.496G>A
intronic 5389 1 058
intronic 9972688
missense 9948480 NM_001 1 93380. 1 ( IL1 7RE): c.457A>G
missense 5 1 897361 NM_203424.1 (IQCF2): c.470T>C
intronic 1 2941 9 1 7
synonymous 528 1 70 1 4
intronic 52842507
intronic 4738980
missense 201 89472 NM_003884.4 (KAT2B): c.21 37C>A
3'UTR 67060743
intronic 1 9559422
intronic 44869851
in frame del 69 1 7 1 497 NM_1 9827 1 .3 (LMOD3): c.41 -43del
3 'UTR 1 3977985
3'UTR 1 0048939
intronic 66449347
intronic 66449347

--- ---
---·- ---
protein level
X
Leu250Ser
Arg570Pro
X
X
X
X
Arg61 5Trp
X - ----X
X
X
X --- ---Ala 1 66Thr
-- ---�
Lys1 53Glu,Glu
Phe1 57Ser
-- --- --- -X
Coverage
243
1 52
484
253
288
1 93
1 90
383
262
220
336 -----1 94
207
21 1
447
450
668
365
1 89
277
345
230
572
277
281 -----
1 77 --- - --- - -----235
Pro71 3Thr 221
X 435
205
1 58
p .Leu 1 4_ 358
Asp1 5delinsHis
X 235
X 1 88
1 83
1 83
Variant
A
G
G
C
G
T
G
T
A
T
A
A
C
A
C
A
A
T
T
C
G
G
C
A
G
T
A
A
C
G
G
G
G
T
T
WT
G
C
A
T - ----
C
C
C
C -----G
C
G
G
T
G
T
G
G
G
C
T
C
A
T
G
A
C
G
C
A
A
A
AGA
C
A
C
C
Frequency Predictions
Variant/WT AGVGD SIFT Polyphen
21 .8/78.2 X X X
35.5/64.5 X X X
73.8/26.2 X X Benign
32.4/67 .6 X X X
64.2/35.8 co Tolerated Possibly
damaging
30.6/69.4 X X ----29.5/70.5 X X X
21 .9/78 . 1 X X X
57.6/42.2 X X X
54. 1 /45.9 X X X
62.5/37.5 X X
79.4/20.6 co Affect protein Probably
function damaging
6 1 .4/38.6 X X
22.7177.3 X X X
1 7 .0/83.0 X X X
25.8/74.2 X X X
27 . 1 /72.9 X X X
63.3/36.7 X X X
68.8/31 .2 co Tolerated Probably
damaging
77.3/22.7 X X X --- -29.6/70.1 X X X
30.0170.0 co Affect protein Probably
function damaging
1 7.3/82.5 C65 Affect protein Probably
function damaging
77.3/22.7 X X X
68.3/3 1 .7 X X X
70.1 /29.9 X X X
44.7/55.3 X X X
20.8179.2 C35 Affect protein Probably
function damaging
34.9/65. 1 X X X
6 1 .0/39.0 X X X
63.3/37.7 X X
27.4/72.6 X X
57.9/42.1 X X X
67.0/33.0 X X X
30. 1 /69.9 X
30.1 /69.9 X X X
TARGETED EXO M E SEQU ENC ING I N CLEAR CELL RENAL CELL CARCI N O M A 1 0 1

Supplementary Table 51 . Continued.
Gene name Refseq
LRRC3B N M_052953
LTF N M_002343 - ---MAG l 1
MAG l 1
MAG I 1
MAG l 1
MAG I 1
MAG l 1
MAG l 1
MAG l 1
MAN F
MAP4
MITF
NEK1 0
NEK1 0
N ISCH
N ISCH
NK IRAS1
NR1 D2
N R2C2
N R2C2
NR2C2
N R2C2
N R2C2
NUP2 1 0
NUP2 1 0
OXNAD1
P4HTM
PBRM1
PBRM1
PBRM1
PBRM1
PBRM1
PBRM1
1 02 CHAPTER 5
N M_004742
N M_001 033057
NM_004742
N M_001 033057
N M_001 033057
N M_001 033057
N M_001 033057
N M_002343
N M_00601 0
N M_00l 1 34364
N M_000248
N M_1 99347
N M 1 99347
N M_0071 84
N M_007 1 84
N M_020345
N M_005 1 26.4
N M_003298
N M_003298
N M_003298
N M_003298
N M_003298
N M_024923
N M_024923
N M_1 38381
N M_1 77938
N M_01 8 1 65
N M_0 1 8 1 65.4
N M_0 1 8 1 65.4
N M_01 8 1 65.4
NM 01 8 1 65.4
N M_01 8 1 65.4
Tumor
T-g
T-f
T-g
T-i
T-i
T-f
T-g
T-i
T-e
T-f
T-g
T-g
T-j
T-d
T-b
T-c
T-c -----
T-h
T-e
T-a
T-d
T-g
T-j
T-h
T-a
T-b
T-j
T-g
T-f
T-d
T-e
T-f
T-g
T-j
Mutation
Sanger seq type genomic location cDNA level
not performed 3'UTR 26751 986
not performed synonymous 4649691 0
not performed 3'UTR 6534641 1
not performed 3'UTR 65341 301
not performed 3'UTR 65345591
not performed intronic 653451 34
not performed intronic 6534641 1
not performed intronic 65345591
not performed missense 654561 35 NM_01 5520.1
(MAG I 1 ): c.782A>G
not performed synonymous 65345 1 34
not performed intronic 5 1 425141
not performed 3'UTR 47892855
not performed 5'UTR 69985764
not performed intronic 27387564
not performed missense 27338698 NM 1 99347.2
(NEK1 0): c . 1 202A>G
not performed intronic S2504963
not performed synonymous 52504895
not performed 3'UTR 23934322
not performed missense 24003660 NM_0051 26.4
(NR1 D2): c.71 0A>G
not performed 3'UTR 1 5086206
not performed 3'UTR 1 5085906
not performed 3'UTR 1 5089098
not performed 3'UTR 1 5088874
not performed intronic 1 5065790
not performed 3'UTR 1 3357935
not performed missense 1 3383322 NM_024923.2
(NUP2 1 0) : c .31 54G>A
not performed synonymous 1 63 1 2495
not performed missense 49039984 NM_ 1 77939.2
(P4HTM): c.679A>G
not performed 3'UTR 52581 406
Confirmed Frameshift 52598 1 8 1 N M_0 1 8 1 65.4
(PBRM 1 ): c.3664dup
Confirmed Frameshift 52643954 NM_01 8 1 65.4
(PBRM 1 ) : c . 1 846del
Confirmed Frameshift 52651 509 NM_01 8 1 65.4
(PBRM 1 ) : c . 1 491 dup
Confirmed Frameshift 5261 3205 NM_0 1 8 1 65.4
(PBRM1 ): c.3302del
Confirmed Frameshift 52696231 N M_0 1 8 1 65.4
(PBRM 1 ): c.446del

protein level
X ----X
X
X ------X
--- ----
-- --------
---
p.H is261 Arg
X
X
X
Asn401 Ser
X
X
p.Asn237Ser
X
X
X - -- -----X
----X
Gly1 052Ser
X
p. l le227Val
----X ----
p. l le1 222AsnfsX5
p.Ser61 6LeufsX8
p.Val498CysfsX3
p.Asp1 1 01 ValfsX26
p.Asn 1 49MetfsX25
Coverage Variant WT
5 1 6 T C
302 A G
362 G C
689 A G
861 A G
334 C T
362 G C
861 A G
583 C T
334 C T
1 76 A G
237 T C
200 A G
264 T C
229 C T
237 G G
395 A G
303 C A
435 G A
436 T G
449 A G
553 T C
403 G C
208 G A
3 1 9 T C
521 T C
1 63 A G
255 G A
47 1 T A
2 1 9 T
247 A
----503 A
386 T
388 T
Frequency Predictions
Variant/WT AGVGD SIFT Polyphen
26.4/73.6 X X X
34. 1 /65.9 X X
80.9/1 9.1 X X X
62.3/37.7 X X X
63.6/36.4 X X X - -- --60.5/39.5 X X X
80.9/1 9.1 X X X
63.6/36.4 X X X
53.3/46.7 co Affect protein X
function
60.5/39.5 X X X
67.6/32.4 X X X
22.8/77.2 X X X
29.5/70.5 X X X
32.6/67.4 X X X
32.8/66.8 co Tolerated Benign
25.3/74.7 X X X
28.4/7 1 .6 X X X
64.4/35.6 X X X
29.7/70.3 co Tolerated Benign
38. 1 /61 .9 X X X
32.3/67.7 X X X
43.8/56.2 X X X
33.3/66.7 X X X
24.0/76.0 X X X
28.5/7 1 .5 X X X --- ---23.6/76.4 co Affect protein Probably
function damaging
60.7/39.3 X X X
23.5/76.1 C1 5 Tolerated Benign
39.9/60.1 X X X
37.9/61 .6 X X
· --- --41 .3/58.7 X X X
26.0/73.6 X X X
42.5/57.5 X X X
1 9. 1 /80.4 X X
TARG ETED EXO M E SEQU ENC ING I N CLEAR CELL RENAL CELL CARC I N OMA 1 03
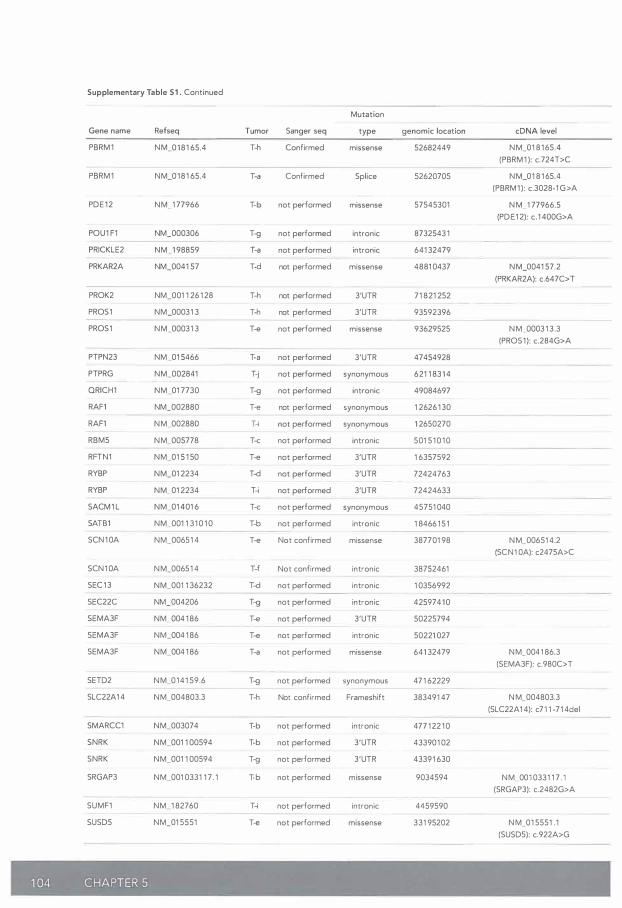
Supplementary Table S1 . Continued
Gene name
PBRM 1
PBRM 1
PDE 1 2
POU1 F1
PRICKLE2
PRKAR2A
PROK2
PROS1
PROS1
PTPN23
PTPRG
QRICH1
RAF1
RAF1
RBMS
RFTN1
RYBP
RYBP
SACM 1 L
SATB1
SCN 1 0A
SCN 1 0A
SEC 1 3
SEC22C
SEMA3F
SEMA3F
SEMA3F
SETD2
SLC22A1 4
SMARCC1
SNRK
SNRK
SRGAP3
SUMF1
SUSD5
1 04 CHAPTER 5
Refseq
N M_0 1 8 1 65.4
NM_0 1 8 1 65.4
N M_1 77966
NM_000306
NM 1 98859
NM_0041 57
NM_001 1 26 1 28
NM_00031 3
N M_00031 3
NM_01 5466
NM_002841
NM 01 7730
NM_002880
N M_002880
N M_005778
NM_01 5 1 50
NM_01 2234
NM_01 2234
NM_01 401 6
NM_001 1 3 1 0 1 0
NM_00651 4
N M_00651 4
NM_001 1 36232
NM_004206
NM_004 1 86
NM_004 1 86
NM_004 1 86
N M_0 1 4 1 59.6
NM_004803.3
NM_003074
NM_001 1 00594
NM_001 1 00594
NM_001 0331 1 7 . 1
NM 1 82760
NM_01 5551
Tumor Sanger seq
T-h Confirmed
T-a Confirmed
T-b not performed
T-g not performed
T-a not performed
T-d not performed
T-h not performed
T-h not performed
T-e not performed
T-a not performed
T-j not performed
T-g not performed
T-e not performed
T-i not performed
T-c not performed
T-e not performed
T-d not performed
T-i not performed
T-c not performed
T-b not performed
T-e Not confirmed
T-f Not confirmed
T-d not performed
T-g not performed
T-e not performed
T-e not performed
T-a not performed
T-g not performed
T-h Not confirmed
T-b not performed
T-b not performed
T-g not performed
T-b not performed
T-i not performed
T-e not performed
Mutation
type genomic location cDNA level
missense 52682449 N M_01 8 1 65.4 {PBRM 1 ): c.724T>C
Splice 52620705 N M_01 8 1 65.4 {PBRM 1 ) : c.3028-1 G>A
missense 57545301 N M_1 77966.5 {PDE1 2): c . 1 400G>A
intronic 8732543 1 - -- -intronic 641 32479
missense 4881 0437 N M_0041 57.2 {PRKAR2A): c.647C>T
3'UTR 7 1 821 252
3'UTR 93592396
missense 93629525 N M_0003 1 3.3 (PROS 1 ): c.284G>A
3'UTR 47454928
synonymous 621 1 83 1 4
intronic 49084697
synonymous 1 2626 1 30
synonymous 1 2650270
intronic 501 5 1 0 1 0
3'UTR 1 6357592
3'UTR 72424763
3'UTR 72424633
synonymous 45751 040
intronic 1 8466 1 5 1
missense 387701 98 N M_00651 4.2 {SCN1 0A): c2475A>C
intronic 38752461
intronic 1 0356992
intronic 42597410
3'UTR 50225794
intronic 50221 027
missense 641 32479 N M_0041 86.3 (SEMA3F): c.980C>T
synonymous 47 1 62229
Frameshift 383491 47 N M_004803.3 (SLC22A1 4): c7 1 1 -7 1 4del
intronic 477 1 22 1 0
3'UTR 433901 02
3'UTR 43391 630
missense 9034594 N M_001 0331 1 7 . 1 {SRGAP3): c.2482G>A
intronic 4459590
missense 331 95202 N M_01 5551 . 1 (SUSD5): c.922A>G

Frequency Predictions
protein level Coverage Variant WT Variant/WT AGVGD SIFT Polyphen
p.Tyr242His 1 94 G A 35.1 /64.9 co Affect protein Probably
function damaging ---- --- ------Splice 381 T C 1 3.9/86. 1 X X X
Arg467His 263 A G 66.5/33.5 C25 Affect protein Probably
function damaging
498 G T 3 1 .5/68.5 X X
1 99 A T 35.2/64.8 X X
Pro21 6Leu 306 A G 62.7/37.3 C65 Affect protein Probably
function damaging
X 350 T C 69. 1 /30.9 X X
X 397 T C 50. 1 /49.9 X X X --- --Gly95Glu 208 T C 38.0/62.0 co Affect protein Probably
function damaging
X 3 1 4 T C 26.8/73.2 X X X
X 469 T C 60. 1 /39.9 X
263 C T 67.7/32.3 X X X
X 1 64 C T 75.6/24.4 X X
X 293 C T 63. 1 /36.9 X X X
1 98 T G 25.3/74.7 X X X -- ---X 8 1 4 A G 1 6.7/84.3 X X X
X 434 C G 22.8/77.2 X X
X 655 A G 67.3/32.7 X X X ----- --- - --
-----
-----
-----
- -----
343 A G 67. 1 /32.9 X X X
2 1 9 G C 2 1 .0/78.1 X X X
p.Glu825Asp 377 G T 1 5.6/84.4 co Tolerated Benign
1 65 A G 69. 1 /30.9 X X
226 T C 23.5/76.5 X X X
274 T C 64.2/35.4 X X X
21 1 A G 27.5/72.5 X X X
1 54 T C 20. 1 /79.9 X X X
p.Pro327Leu 1 53 T C 58.2/41 .8 C1 5 Affect protein Possibly
function damaging
X 667 A G 63.3/36.7 X X
p.Leu238SerfsX25 257 TTTG 54.5/44.7 X X
203 G A 64.5/35.5 X X X
X 351 A G 1 5.4/84.6 X X
X 474 T A 66.7/33.3 X X X
Gly828Ser 394 T C 64.0/36.0 C55 Affect protein Possibly
function damaging -- - --1 5 1 A G 57.0/43.0 X X X
Lys308Glu 356 C T 3 1 .5/68.5 co Affect protein Possibly
function damaging
TARG ETED EXO M E SEQU ENCI NG I N CLEAR CELL RENAL CELL CARC INOMA 1 05

Supplementary Table 51 . Continued
Gene name
SYN2
SYN2
TATDN2
TGM4
TH RB
TMEM 1 1 1
TOP2B
TRAIP
TRAIP
TRAK1
TRANK1
TTC21 A
VGLL3
VGLL3
VGLL4
VGLL4
VH L
--· VHL
VHL
VHL
VH L
XCR1
XYLB
XYLB
ZDHHC3
ZDHHC3
ZFYVE20
ZFYVE20
ZNF 1 67
ZNF1 67
ZNF 1 97
ZNF385D
ZNF445
1 06 CHAPTER 5
Refseq
N M_1 33625
NM_0031 78
N M_01 4760
N M_003241
N M_000461
N M_01 8447
NM_001 068
N M_005879
NM_005879
NM_001 042646. 1
NM_01 4831 .2
NM_001 1 055 1 3
NM_01 6206
NM_01 6206
NM_001 1 28220
N M_001 1 2821 9
NM_000S51 .2
---NM_000551 .2
NM_000551 .2
NM_000551 .2
N M_000551 .2
N M_001 024644
NM_005 1 08
N M_005 1 08
NM 001 1 35 1 79
NM_001 1 35 1 80
N M_022340
NM_022340
N M_01 8651
NM_0251 69
NM_006991 .3
N M_024697
N M_1 8 1 489
Tumor Sanger seq
T-a not performed
T-h not performed
T-h not performed
T-c not performed
T-g not performed
T-f not performed
T-g not performed
T-g not performed
T-g not performed
T-f not performed
T-b not performed
T-c not performed
T-a not performed
T-i not performed
T-a not performed
T-a not performed
T-b Confirmed
T-e Confirmed
T-g Confirmed
T-a Confirmed
T-j Confirmed
T-i not performed
T-d not performed
T-d not performed
T-h not performed
T-h not performed
T-j not performed
T-d not performed
T-a not performed
T-a not performed
T-f Confirmed
T-a not performed
T-b not performed
M utation
type genomic location cDNA level
3'UTR 1 223251 8
3'UTR 1 2226293
3'UTR 1 0321 578
3'UTR 44955493
3'UTR 241 6401 4
synonymous 1 00 1 6 1 59
intronic 25640770
intronic 49885642
synonymous 49881 339
In frame ins 42251 578 N M_001 042646. 1 (TRAK1 ) : c . 1 963+ 1 28_ 1 963+ 1 30del --- --
missense 36871 1 24 NM_0 1 4831 .2 (TRANK 1 ) : c.8608A>G
intronic 391 50543
3'UTR 86994861
3'UTR 86994499
5'UTR 1 1 6238 1 9
intronic 1 1 6238 1 9
Frameshift 1 01 91 498 NM_000551 .2 (VHL): c.491_492del
Frameshift 1 01 88202 NM_000551 .2 (VHL): c.346dup
Frameshift 1 0 1 88258 NM_000551 .2 (VHL): c.401_404del
missense 1 0 1 88206 NM_000551 .2 (VHL): c.349T>G
Splice 1 01 88320 NM_000551 .2 (VHL): c.463+1 del
missense 46062889 NM_00S283.2 (XCR1) : c.551 T>C
missense 38401 83 1 N M_005 1 08.3 (XYLB): c. 1 42A>G
synonymous 3841 6748 -- --- --3'UTR 44962767
intronic 44962767
3'UTR 1 51 1 2960
intronic 1 5 1 26593
3 'UTR 4461 291 9
intronic 446129 1 9
Frameshift 44683961 NM_006991 .3 (ZN F1 97): c. 1 339 _ 1 342del
intronic 2 1 462942 NM_024697.2 (ZNF385D): c.955-3C>A
missense 44488293 N M_1 8 1 489.5 (ZNF445): c.2870A>G

protein level
X ---- -- - -� --X -- - ---
- -- --- - --
X
X
X
X ·----- --
X
225
lle2870Val
-- --
X
X
X -� ---
p.Gln1 64ArgfsX9
-- -- --p.Leu1 1 6ProfsX1 6
p.Glu 1 34AspfsX24
Trp 1 1 7Gly
-- - -Splice
-� - -p. Leu 1 84Pro
p.Thr48Ala
- -- -
- --------- -
X
X
X
X
p. l le447ThrfsX22
--- -- - -
Glu957Gly
Coverage Variant WT
802 T C
21 6 T C
262 G A -- --·
304 A T
628 T C
236 T C
1 64 G A
442 C A
591 T C
GGA 26.2/73.3
-- --- ---1 65 C T
3 1 5 A T
330 T A
348 A C
237 A C
237 A C
1 67 AG
395 C
43 1 AATT
540 G T
253 G
577 G A
343 G A
373 A G
292 T C
292 T C
266 G T
1 65 T G
545 G A
545 G A
532 ATCC
2 1 8 T G
463 C T
Frequency Predictions
Variant/WT AGVGD S IFT Polyphen
40.4/59.6 X X
27.3/72.7 X X X
54.6/45.4 X X
72.0/28.0 X
20.7/79.3 X X X
28.4/81 .6 X X X
38.4/6 1 . 1 X X X
3 1 .7/68.3 X X
30.6/69.4 X X
X X
67.3/32 . 1 co Tolerated Benign
67.3/32.7 X X X
20.9/79 . 1 X X
62.6/37.4 X X
24. 1 /75.9 X X X
24. 1 /75.9 X X X
46.7/53.3 X X
40.0/57.7 X X X
42.5/56.8 X X X
1 5 .2/84.4 C65 Affect protein Probably
function damaging
22.9/77 . 1 X X
68.8/31 .2 co Tolerated Probably
damaging
20.4/79.6 co Tolerated Probably
damaging
27.3/72.7 X X X -- --69.9/30.1 X X
69.9/30.1 X X X
33.5/66.5 X X
70.9/29. 1 X X X
63.7/36.3 X X X
63.7/36.3 X X
26.3/73.3 X X X
27.5/72.5 X X X
33.5/66.5 co Affect protein Benign
function
TARG ETED EXOME SEQU ENCI NG I N CLEAR CELL RENAL CELL CARCI NOMA 1 07

Supplementary Table S2. Identified mutations in VHL, PBRM 1 and SETD2 in ccRCC-derived cel l l ines.
cRCC-derived cell l ine
RCC-4
RCC-ER
RCC-FG2 --
RCC-HS
RCC-MF
RCC-AB
RCC-ER
RCC-FG2
RCC-J F - -RCC-JW
RCC-MF
RCC-1
RCC-4
RCC-ER
RCC-FG2
RCC-JW
RCC-M F
Mutation
Gene name RefSeq ID type cDNA level
PBRM 1 N M_01 8 1 65.4 Frameshift c.2592dup - - - ---PBRM1 N M_0 1 8 1 65.4 Framesh ift c.753_756del -- --PBRM 1 N M_01 8 1 65.4 Nonsense c. 1 333C>T -- -- - - --- --PBRM1 N M_0 1 8 1 65.4 missense c.3386G>T --PBRM1
SETD2* -SETD2*
SETD2* --SETD2* - -- -SETD2*
SETD2*
VH L
VHL
VH L
VHL
N M_01 8 1 65.4 Frameshift
N M_01 41 59.6 Framesh ift -- - - -N M_01 4 1 59.6 Nonsense
-- -- --N M_01 41 59.6 loss of last 3 exons
N M_01 4 1 59.6 synonymous - - -
N M_0 1 4 1 59.6 m issense
N M_01 41 59.6 i n frame deletion
N M_00055 1 .2 - -- --N M_000551 .2 -- - --N M_00055 1 .2
N M_00055 1 .2
Frameshift
Missense -Framesh ift
Frameshift --VH L N M_00055 1 .2 l nframe i nsertion
VHL N M_00055 1 .2 M issense
c . 1 487del
c.6447delC
c.201 7T>A -- -- -----unknown --
c.41 89T>C -c.3829G >T -- -- -
c.5330_5338delAACACACAC - --c.458-459ins37
c . 1 94C>G -c.482del --c.444del
c.328_ 444insGCATCA
c.256C>T
--
* Accord ing to the SIFT prediction program, the identified variant in PBRM 7 in RCC-HS is l i kely to affect protein function (score 0.00, median sequence conservation =3 . 1 7) * Accord ing to the Polyphen prediction program, the identified variant in PBRM 1 in RCC-HS is probably damaging
protein level
p .H is865ThrfsX4
p.Asp25 1 G lufsX3 1
p .G ln445X
p .G ly1 1 29Val
p .Asn496MetfsX41
R21 32fsX1 3 - -L655X
unknown ---none
G 1 259V
1 760-1 762del NTH
p . Pro 1 54CysfsX2
p.Ser65Trp
p.Asp1 43AlafsX1 6
p. Phe1 48LeufsX1 1
p .H is 1 1 0del insArg l leAsn
p .Pro86Ser
* Accord ing to the AGVGD pred iction program, the identified variant in PBRM 7 i n RCC-HS is less l i kely to interfere with protein function (score C 1 5). * Accord ing to the S I FT prediction program, the identified variant in VHL i n RCC-HS is l i kely to affect protein fun ction (score 0.00, median sequence conservation =3 .47) * Accord ing to the Polyphen prediction program, the identified variant i n VHL i n RCC-HS is probably damaging * Accord ing to the AGVG D prediction program, the identified variant i n VHL i n RCC-HS l i kely to i nterfere with protein function (score C65) . * Accord ing to the S I FT prediction program, the identified variant in VHL in RCC-M F is tolerated (score 0 .23, median sequence conservation =3 .47) * Accord ing to the AGVG D prediction program, the identified variant in VHL i n RCC-MF less l i kely to i nterfere with protein function (score C1 5). * The mutations i n SETD2 were identified i n an earl ier screen (Duns, Cancer Research 20 1 1)


TH E ENTI RE M I R-200 SEED FAM I LY IS STRONG LY DEREG U LATED IN CLEAR CELL
RENAL CELL CANCER COM PARED TO ITS PROG EN ITO R CELLS, TH E P ROXI MAL
TU B U LAR EP ITH ELIAL CELLS
Gerben Duns 1 , Anke van den Berg2, I nge van Du ivenbode 1 ,
Car G iezen 1 , J oost Kl u iver2, Ha rry va n G oor2, Robert M .W. H ofstra 1 ,
Eva van den Berg 1 , K l aas Kok1
Depa rtments of Genetics1 and Patho logy & Medica l B io logy2, Un iversity Medica l Centre G ron ingen , U n iversity of G ron ingen ,
G ron ingen , The Netherl ands.
In revision

ABSTRACT
Despite numerous studies reporting deregulated microRNA (miRNA) and gene expression patterns in clear cell renal cell carcinoma (ccRCC), no direct comparisons have been made to its presumed normal counterpart; the renal proximal epithelial tubular cells (PTEC). The aim of this study was to determine the miRNA expression profiles of ten clear cell renal cell carcinoma-derived cell lines and short-term cultures of PTEC, and to correlate these with their gene expression, and copy-number profiles. Using microarray-based methods, a significantly altered expression level in ccRCC cel l lines was observed for 23 miRNAs and 1 630 genes. The set of miRNAs with significantly decreased expression levels include al l members of the miR-200 family known to be involved in the epithelial to mesenchymal transition (EMT) process. Expression levels of 13 of the 47 validated target genes for the down regulated miRNAs were increased more than two-fold. Our data reinforce the importance of the EMT process in the development of ccRCC.
112 CHAPTER 6

I NTRODUCTION
Clear cell renal cell carcinoma (ccRCC) is the most prevalent subtype of kidney cancer and accounts for 3% of human malignancies (Jemal et al., 2009). ccRCC is characterized by the frequent loss of 3p (van den Berg et al., 1997) and several genes have been postulated to be involved in its pathogenesis. Based on the current literature, it can be hypothesized that, in addition to protein coding genes, microRNAs (miRNAs) will also be involved in the pathogenesis of ccRCC. Several miRNAs have been shown to exert tumor suppressive or oncogenic functions in a tissue-specific manner (Chen, 2005; Garzon et al., 2006; Kent and Mendell, 2006). Aberrant expression of these miRNAs results in differential translational control of numerous target genes. This can result in the deregulation of cellular processes like proliferation, differentiation, programmed cell death, and morphogenesis, thereby contributing to the process of tumor development (Chen, 2005; Garzon et al., 2006; Kent and Mendell, 2006). Several groups have published up- and downregulated miRNAs in primary ccRCC tumors compared to normal kidney tissue (Gottardo et al., 2007; Nakada et al. , 2008; Huang et al., 2009; Petillo et al., 2009; Chow et al. , 2010; Juan et al. , 201 O; Slaby et al., 201 O; Weng et al., 2010). However, a disadvantage of examining tumor tissue is the admixture of normal cells and intra-tumoral heterogeneity. The same holds true for the renal tissue used as the normal counterpart, as kidneys are complex organs consisting of many different cel l types. This, and the fact that ccRCC is thought to arise specifically from the epithelial cells of the proximal tubuli of the kidney ( PTEC), makes the outcome of most studies less reliable (Thoenes et al., 1986). These proximal tubular cells can be isolated from kidney tissue and cultured for a limited number of passages, allowing isolation of RNA for profiling studies from pure cells (Clifford et al., 1998). In the case of ccRCC we postulated that the best strategy would be to compare cancer cell lines with short term cultures of these PTEC cells. We adopted this strategy and analyzed gene and miRNA expression profiles of ccRCC-derived cell lines in comparison to short-term cultures of their precursor cells, i.e. PTECs of the kidney. We further correlated the expression profiles with DNA copy numbers.
MATERIALS AND M ETHODS
Cel l l ines The ccRCC cell lines RCC-AB, RCC-ER, RCC-FG2, RCC-HS, RCCJ F, RCC-JW, RCC-MF, and RCC-WK were obtained from Cell Line Services (Eppenheim, Germany). The cells, which tested negative for Mycoplasma, bacteria and fungi, were cultured as recommended. Experiments were performed on cells that had undergone six to eight additional passages. The ccRCC cell lines RCC-1, RCC-4, and RCC-5 were established by Dr. C. D. Gerharz (Institute of Pathology, University Hospital, Dusseldorf, Germany). To ensure their authenticity, they were re-karyotyped. All cRCC cell lines were maintained in RPMI 1640 (Sigma). MN 160 and PTEC are primary cultures der ived from proximal tubular epithelial cells.
miRNAS & CLEAR CELL RENAL CELL CARCIN OMA 11 3

miRNA expression Cells were grown to 70% confluence. Total RNA fractions were isolated using the Trizol
reagent (lnvitrogen, Carlsbad, CA, USA). RNA qua l ity was assessed using the Agilent
2100 Bioanalyzer (Agilent Technologies, Santa Clara, CA, USA) . mi RNA transcript
abundance was measured using Human m iRNA m icroarrays (V2) (Agilent) fo l lowing the manufacturer's protocols . The array contained probes for a total of 542 human
miRNAs. S lides were scanned using the G25052C DNA microarray scanner (Agilent).
Array images were analyzed using Agilent feature extraction software (v10.5.1 .1) and GeneSpring GX (Agilent) . Data were normalized using a 75% percentile shift (Gibcus et al . , 2009) . Significantly up- and downregulated miRNAs in the ccRCC derived cel l
lines compared to the PTEC samples were identified using an unpaired t-test followed by Benjamini-Hochberg correction (false discovery rate FDR: 0.05 and a fold change
of at least 2 (FC > 2.0)) . Validated targets of indiv idual mi RNAs were obtained from
M I RECORDS (http://mirecords.biolead.org/).
ArrayCG H DNA was isolated from ccRCC-derived ce ll lines using standard protocols . ArrayCGH was carr ied out using Agilent Human Genome CGH M icroarray 244a slides (pin
G4411 B) fo llowing the manufacturer's protocols . Slides were scanned using the
G25052C DNA microarray scanner (Agilent Technologies) . Array images were analyzed
using Agilent feature extraction software (v10.5.1 .1) and NEXU S copy number software
(V6 .0, Biodiscovery, Inc. , El Segundo, CA, USA). In NEXU S, chromosomes with an apparent diplo id copy number were used for re-centering. We then used these data to determine the integer copy number of the genomic loci of all mi RNA.
Gene expression profi l ing RNA from ccRCC-derived ce ll lines and normal renal samples was isolated using the
RNeasy Mini Kit (Oiagen, Venlo, Netherlands) Transcript abundance was measured using Human HT-12_ V4_Beadchips (lllumina, San Diego, CA, USA) . The Lumi package implemented in R (Du et a l . , 2008; Lin et al . , 2008) was used for variance stabi lizing
transformation followed by robust spline norma lization of the microarray data (GEO Series accession number GSE20491 ). GeneSpring GX 10.0 (Agi lent) was used to calculate fold changes between normal renal samples and ccRCC-derived cell lines.
Significantly up- and downregulated genes were identified following the same criteria
as given for the mi RNA expression arrays, i .e . FC > 2.0, FDR < 0.05. Genes were
omitted from further analysis if the average expression level in the ccRCC cell lines
and in the PTEC ce ll lines was below a normalized va lue of 7, which is close to the
background. Pathway-enrichment analyses were done using GeneGo (http://www.
genego.com/) .
114 CHAPTER 6

RESULTS
Characterization of the ccRCC cel l l i nes ArrayCGH analysis revealed multiple chromosomal gains and losses in most of the cell lines (Figure 1, Supplementary Table 1). All cell lines showed a reduced copy number for a large part of the short arm of chromosome 3, with a common region of overlap extending 70 Mb from pter. Other recurrently lost regions included segments on 1 p, 4q, 9, 11 q and 149. Eight out of ten cell lines carried a homozygous deletion on 9p21, wh ich varied in s ize from 50 kb to 600 kb and included the CDKN2A and CDKN2B gene loci.
lpJ!l3•'111�
t 10 II I) ll 14 IS 1, 17 II It :,J ::I :? X r
RCC-1 -,--r-' .l I .1w I ...._rd· f '\I
RCC-4 �-·111111 '"-'- I''
RCC-5 "1 h
"' I 11 II -• ..J
,-- - 1"" - --:,,-. RCC-AB .. ,....__.--..-..--.,.l'""n'-----------........ __..--..---'----�--.-.----RCC-ER
RCC-FG2 .---.------------
RCC-HS .,.. • ..-----· I I -- ,.....-
RCC-JF
----•• 1111-• ,,, , ,__,... ,4,,-s:rrd::Ye ■
RCC-JW .......--• .....__.,,. -..JUd---�-- - -----■ --.....__._,....,_._.,_.._"""-.,.,. _ ___,,, ... ----_
RCC-MF
Figure 1 . Graphical representation of the chromosomal aberrations in the ccRCC cell lines detected by arrayCGH . The top of the panel, indicated as aggregate, shows the frequency with which the aberrations are seen. For a summary of the recurrently lost and gained regions, see Supplementary Table 1 .
Gene expression profi l ing
amplification
.] deletion
mRNA profiling revealed a total 11,604 genes (14714 probes) that passed the selection filters. Of these, 767 genes were expressed at significantly h igher levels in the ccRCC cell lines compared to PTEC, whereas 869 genes were expressed at significantly lower levels in ccRCC cell lines. Th is set of 1636 differentially expressed genes was significantly enriched for a number of pathways, several of wh ich were cell cyclerelated (supplementary Table 2). Three of the enriched pathways were related to the epithelial-to-mesenchymal transition (EMT). Of the downregulated genes (including the known tumor suppressors VHL and SETD2, but not FHIT) 65 were located at 3p,
miRNAS & CLEAR CELL RENAL CELL CARCINOMA 1 1 5

the genomic segment most commonly deleted. This equa l s 22% of a ll 3p genes that are expressed at a detectable level in PTECs and indicates that genes from 3p are significantly overrepresented in the group of genes that have a decreased abundance in ccRCC (P-va lue < 0.001 ).
miRNA expression profiling
Out of 542 human miRNAs that were present on the array, 239 (44%) miRNAs passed the qua lity filter (f lags: present or marginal) in at least four samples. Eight miRNAs showed a significantly increased abunda nce in ccRCC compared to PTEC and 1 5 miRNAs showed a significantly decreased abundance (Figure 2a, b, Table 1 ).
The l atter set included a ll five members of the miR-200 family. Although ccRCC is characterized by recurrent deletions of the short arm of chromosome 3, none of the eight miRNAs that were located at 3p and had detectable levels in PTEC showed a
4' m ic
� 3 , � �.. 1 · . CL ID
l , . ------------. . -• . -----. .
1 ,
'IP
-6 -4 -2 b i A
Log2 Fold Change
10.0 ps0.0004
9.5 ll• •0 85
9.0
8.5
a.o 7.5
7.0 0 2
log2 niR-197
C
4 6
3 4
-3.0 1 1 3 0
g u � � � � ffi � � � � i � � � � � � � � � � �
-·
- tmi.miR,1-11 ln•m1R•200< t,,.,.mlft-:0, IID-mlR-2001
:::::::::�. Down ht.a-ml��• t,,.,.mlR-:?OOb IID-m1R·10b 1,s.,,nlR-101 l>s.,m1R·135b hu-mlft.e25 h1.a-mlfl.10i1• f>u.mlR·:?OOb'
____________________________________ .bWDJ&'-222!---------·
B
1 .. .! s 1
i
- i.. .. mtR-8112b - hs.,mlR-�1•
-
CDH1
psO 0013
lw•mlR•32"-3p
�:::::�:�p Up hsl-mlR-338-5p hH,mlR•141> h.s•mllM07
0-------------
D
Figure 2. miRNAs showing statistically different levels in ccRCC cell lines compared to normal renal epithelium (FC>2.0, p<0.05). A. Vo lcano plot, showing average fo ld changes and corresponding p-val ues for the ind ividua l m i RNAs. Dotted l i nes ind icate the thresholds. B. M icroarray heat map showing the re lative abundance of the s ignificantly down- and upregu lated m iRNAs in the individua l cel l l ines . C. Corre l ation between USP4 transcript levels and m iR- 1 97 abundance (Pearson- correlation : -0.85) . D. Transcript levels of epithe l ia l marker E-cadherin in normal proxima l tubu lar epithe l ia l cel ls (MN 1 60 and PTEC), and the ccRCC-derived ce l l l ines.
1 1 6 CHAPTER 6

Table 1 . mi RNAs sign ificantly up- and downregulated in ccRCC samples. Fold change: average expression level in ccRCC-derived cel l l ines (n = 1 0) versus average expression level in proxima l tubular epithel ia l cel ls (n =2). Boxed m iRNAs are located at genomic regions frequently showing copy number loss.
Upregulated in ccRCC Downregu lated in ccRCC
miRNA Locus Fold change p-value m iRNA Locus Fold change p-va lue
miR-892b Xp27.3 2 1 .8 0.001 0 m iR- 1 4 1 1 2p1 3.3 1 73 .8 0.000 1 -----
miR-43 1 * 1 4932. 3 1
m iR-324-3p 1 7p 1 3. 1
m iR-500 Xp1 1 .32
m iR-423-5p 1 7q 1 1 .2
m iR-338-5p 1 7q25.3
m iR-1 49
m iR-1 97
2q27.3
1 p 1 3.3
1 4.2
8.3
7.3
4.3
3.6
3.0
2.8
0.0280 miR-200c 1 2p1 3.3 1
0.00 1 0 m iR-205 1 q32.2
0.3360 m iR-200a 1 p36.33
0.0069 m iR-429 1 p36.33
0.0320 miR-1 46a 5q33.3
0.0041 m iR-200a* 1 p36.33
0.0083 m iR-200b 1 p36.33
miR-1 0b 2q3 1 .3
m iR- 1 0a 1 7921 . 3 1 -- -miR- 1 35b 1 q32. 1
m iR-625 1 4q32.3
m iR- 1 0a* 1 7921 . 3 1
m iR-200b�36.33
miR-222* Xp 1 1 .3
40.4 0.0001 ----35.3 0.0001 - --1 0.2 0.0069
9.3 0.2800
8.3 0.0090
7 .5 0.0006
6.7 0.0041
6.5 0.0320
6.3 0.0337
6.2 0.0305
5.6
4.0
3.7
2.7
0.0041
0.0426
0.0480
0.0333
Fold change: average expression level in ccRCC-derived cel l l ines (n = 1 0) vs average expression level in proximal tubu lar epithe l ia l cel ls (n =2). Boxed miRNAs are located at genomic regions frequently showing copy n umber loss.
significant decrease in abundance across the entire panel of ccRCC cell lines. Let-7g and miR-138, both reported to be suppressed in some cancer types, exhibited a more
than two-fold decrease in abundance in 6/10 and 8/10 ccRCC cell lines, respectively (Supplementary Table 3) . One pathway, development of microRNAs-dependent
inhibition of EMT (p-value : 4 .6E-19), appeared to be significantly enriched for the set of 23 microRNAs that showed consistent aberrant expression in ccRCC.
Coupling of miRNA expression to copy number aberrations and gene
expression levels
An altered level of miRNA expression in the ccRCC cell lines compared to the PTEC
cells can be a consequence of an altered copy number for the miRNA locus. To
address this question we analyzed if there was a correlation between the integer copy
number and levels of expression of the miRNAs. For 73 miRNA loci, copy number
aberrations were detected in at least two cell lines. The correlation was > 0.5 for seven miRNAs, while the highest correlation was detected for miR-574 located at 4p14, with
a correlation coefficient of 0. 7 4.
m iRNAS & CLEAR CELL RENA L CELL CARC INOMA 117

To determine the pathogenic consequences of the significantly altered m iRNA levels, we correlated their expression levels to those of the protein coding genes. We focused on the proven target genes of the 23 m iRNAs we had identified as being significantly deregulated . In total 64 validated targets were reported in the miRNA database, of which 47 passed the quality filters set for the microarray analysis. Interestingly, this set included only one gene, i.e. FUS1/TUSC2, for the set of upregulated m iRNAs. The other 46 genes were targets of the down regulated m iRNAs. Thirteen of these genes had a significantly higher mRNA level in the ccRCC cel l lines, with an absolute fold change > 4 (Supplementary Table 4), supporting their interaction with the respective m iRNAs.
miRNAs can exert oncogenic functions by targeting tu mor suppressor genes. We focused on 3p, a region of the genome that is deleted in most, if not all, ccRCC (van den Berg et al. , 1997). The expression profi ling data revealed 65 significantly downregulated transcripts that were located on 3p. Eight of these are predicted by TargetScan to contain a conserved target sequence for one of the significantly upregu lated miRNAs (Supplementary Table 5). Of these predicted m iRNA/mRNA combinations, miR-197 and ubiquitin specific peptidase 4 (USP4) showed the most significant inversed correlation {P-value = -0.85) (Figure 2c).
DISCUSSION
The kidney is a complex organ comprising many different cel l types. Based on the variety of functions, each cel l type in the kidney will have its own specific m iRNA profile. Thus the miRNA profile of a kidney specimen is, to a large part, a reflection of the composition of that particular sample. ccRCC is considered to be derived from a specific type of cell, the epithelial cells of the proximal tubu l us. Tumor speci mens wi ll also contain variable amounts of d ifferent normal cell types, which wi ll al l contribute to the mi RNA profile of that specimen. As an example, we used an exome sequencing approach on ten pri mary ccRCCs, all microscopically se lected to have at least 80% tumor cells. The resulting data ind icated that the fraction of tu mor cells was often much lower, in some cases even less than 50%, d ue to unrecognized infiltrating lymphocytes. In the current study we circumvented these disadvantages by analyzing ccRCC-derived cel l l ines and comparing their m iRNA profi les with short-term cultures of epithelial cells of the proximal tubu lus of the kidney.
Fifteen miRNAs were significantly downregulated in all ten ccRCC cell lines compared to PTEC. We are the first to show such decreased levels for all the miRNA-200 family members and miR-205. In reported studies on primary ccRCC tu mor specimens in comparison to the total renal tissue, only individual members of this m i RNA family were identified (Nakada et al. , 2008; Chow et al. , 2010; Slaby et al., 2010; Weng et al . , 2010), ind icating the strength of our approach using ccRCC-derived cell lines in combination with short-term cu ltures of PTEC.
A decreased miR-205 level has not been reported before in ccRCC tu mors, but has been observed in several other tu mor types (Volinia et al., 2006). miR-205 shares some i mportant target genes with the miR-200 fam i ly that suppress the epithelial- to
118 CHAPTER 6

mesenchymal transition (EMT) process (Gregory et al., 2008; review by Mongroo and Rustgi , 2010). miR-200 family members regulate the processes of EMT mainly by regulating ZEB 1 and ZEB2 translation through binding to their 3'UTR sequences. ZEB 1 and ZEB2 are part of a complex network of transcriptional repressors that regulate the expression of E-cadherin and a number of master regulators of epithelial polarity. Thus, a decreased abundance of the miR-200 family will result in an increased activity of ZEB 1 and ZEB2, amongst others resulting in a repression of E-cadherin. Indeed, the transcript level of E-cadherin is strongly decreased in 9/10 of our ccRCC-derived cell lines (Figure 2d). Three EMT-related pathways were significantly enriched for the differentially expressed genes (Supplementary Table 2), further supporting the importance of this transition in the development of ccRCC. The development of the proximal tubuli of the kidney is the product of a complex series of events during embryogenesis that include a transition from mesenchyme to epithelium (Davies et al., 1999). The development of ccRCC from these progenitor cells thus appears to include the reciprocal process. The acquisition of a mesenchymal phenotype gives tumor cells the capacity to infiltrate surrounding tissues, leading to increased cell motility and invasion. As such, the process appears to be linked to tumor progression rather than to initiating steps.
Among the other significantly decreased miRNAs are miR-146, loss of which results in leukemia in a mouse model (Starczynowski et al., 201 1), and miR-10a and miR- 1 Ob, which are involved in the transcriptional regulation of HOX genes and are deregulated in several cancer types (Lund, 2010). In studies on primary tumor specimens, miR-200a* and the primary transcripts of miR- 1 0a and miR- 1 Ob correlated with a good prognosis (Petillo et al., 2009). miR-1 0a and 106 have also been associated with non-metastatic ccRCC (Heinzelmann et al., 2011). miR-324, miR-423-Sp and miR-149, which showed significantly decreased levels in our ccRCC-derived cell lines, have been reported to discriminate between ccRCC and papillary RCC (Petillo et al., 2009). Three other miRNAs, i.e. miR-2006, miR-200c, and miR10b are part of a 65-member miRNA-signature that discriminates between different types of kidney tumors (Youssef et al., 201 1 ).
None of the eight miRNAs that showed significantly increased levels in the ccRCCderived cell lines compared to PTEC have been reported in ccRCC before. Only miR-197 has a proven target: tumor suppressor candidate 2 (TUSC2/FUS1 ), located at the 3p21.3 region that is frequently lost (Du et al., 2008). The TUSC2 transcript levels seem to be unaltered in ccRCC. However, this interaction may well be important in the pathogenesis of ccRCC, as, in general, miRNA targeting leads to inhibition of translation and not degradation of its target genes.
According to Knudson's classical model, recurrent loss of specific chromosomal segments in tumors suggests the presence of tumor-suppressive genes in these regions. Such a model could well apply to miRNAs. The clustering of miRNAs in regions of the chromosome that are frequently unstable in cancer indeed suggests that genomic alterations might be one of the mechanisms that control miRNA expression in cancer (Calin and Croce, 2006). Of the miRNAs that showed a decreased transcript abundance in the ccRCC-derived cell lines, six were located in genomic loci that are
miRNAS & CLEAR CELL RENAL CELL CARCI NOMA 1 19

frequently lost in ccRCC, i .e. miR-200a, miR-200a*, miR-200b, miR-200b* and miR-429 located at 1 p36.33, and miR-625 located at 14923.3. This suggests that the loss of the chromosomal region that contains a miRNA locus is an important factor in the functional loss of these miRNAs.
None of the 15 miRNAs that were consistently down regulated map to the short arm of chromosome 3, although let-7g and miR-138 did have a decreased level in 6/10 and 8/10 of the analyzed cell lines, respectively. Thus, loss of function of one of the known miRNAs from 3p does not appear to be the driving force for the frequently observed loss of this chromosomal segment. As reduced expression of miRNAs by chromosomal losses explains only a subset of cases, other mechanisms such as epigenetic changes, or mutations within the mi RNA, may play a role in the inactivation of these miRNAs.
In conclusion, we have used an alternative approach to identify miRNAs whose expression is consistently altered in ccRCC compared to their normal counterpart, the epithelial cells of the proximal tubulus, and pinpointed the epithelial- to mesenchymal transition as an important event in the development of ccRCC. The data presented here will help to interpret and understand the findings in primary RCC specimens, and may help to elucidate some of the processes that lead to the development and progression of ccRCC. With the availability of detailed expression-, miRNA- and CGH profi les, these cell lines should prove valuable in further studies.
ACKNOWLEDG EM E NTS
This work was supported by Grant RUG-2007-3892 from the Dutch Cancer Society and by a Grant from the Jan Kornelis De Cock foundation in Groningen. We thank Jackie Senior for editing the manuscript.
REFERENCES
Ca l in GA, Croce CM. 2006. M icroRNAs and chromosoma l abnormal ities i n cancer ce l l s . Oncogene 25:6202-62 1 0. Chen CZ. 2005 . MicroRNAs as oncogenes and tumor suppressors. N Engl J Med 353 : 1 757-1 77 1 . Chow TF, Mankaruos M, Scori las A, Youssef Y, G i rgis A, Mossad S, Metias S, Rafael Y, H oney RJ , Stewart R, Pace KT, Yousef GM . 20 1 0. The m iR- 1 7-92 Cluster is Over Expressed in and Has an Oncogenic Effect on Renal Cel l Carcinoma. J U ro l 1 83:743-75 1 . Cl ifford SC, Czapla K, Richards FM, O 'Donoghue DJ, and Maher ER. 1 998 . Hepatocyte growth factor-stimu lated rena l tubu lar m itogenesis: effects on expression of c-myc, c-fos, c-met, VEG F and the VH L tumoursuppressor and re lated genes. Br J Cancer 7 7 : 1 420-1 428.
1 20 CHAPTER 6
Davies JA, Perera AD and Wa lker CL. 1 999. Mechanisms of epithe l ia l development and neoplasia in the metanephric kidney. Int J Dev Bio l 43 : 473-478 . Du P, Kibbe WA, L i n SM . 2008. Lumi : a p ipe l ine for processing l l l umina m icroarray. B io informatics 59 : 1 547-1 548. Garzon R, Fabbri M , Cimmino A, Ca l in GA, Croce CM. 2006. MicroRNA expression and function in cancer. Trends Mol Med 1 2 :580-587. G ibcus JH, Tan LP, Ha rms G , Schakel RN, de Jong D, B lokzij l T, Mo l ler P, Poppema S , Kroesen BJ , van den Berg A. 2009. Hodgkin lymphoma cel l l i nes a re characterized by a specific mi RNA expression profi le . Neoplasia 1 1 : 1 67-1 76. Gottardo F, Liu CG, Ferracin M , Ca l in GA, Fassan M, Bass i P, Sevignan i C, Byrne D,

Negrini M, Pagano F, Gomella LG, Croce CM, Baffa R . 2007. M icro-RNA profiling in kidney and bladder cancers. Urologic oncology 25:287-292. Gregory PA, Bert AG, Paterson EL, Barry SC, Tsykin A, Farsh id G, Vadas MA, Khew-Goodall Y, Goodall GJ. 2008. T he miR-200 family and miR-205 regulate epithelial to mesenchymal transition by targeting ZEB1 and SI P1. Nature Cell B iology 10:593-601. Heinzelmann J, Henning B, Sanjmyatav J, Posorki N, Steiner T, Wunderlich H, Gadja MR, Junker K. 2011. Specific mi RNA signatures are associated with metastasis and poor prognosis in clear cell renal cell carcinoma. World J Urol 2011 ;29:367-373. Huang Y, Dai Y, Yang J, Chen T, Yin Y, Tang M, Hu C, Zhang L. 2009. M icroarray analysis of microRNA expression in renal clear cell carcinoma. Eur J Surg Oneal 35:1119-1123. Jemal A, Siegel R, Ward E, Hao Y, Xu J, T hun MJ . 2009. Cancer statistics, 2009. CA Cancer J Clin 59:225-249 . Kent OA, Mendell JT . 2006. A small piece in the cancer puzzle: microRNAs as tumor suppressors and oncogenes. Oncogene 25:6 1 88-6 1 96.
Juan D, Alexe G, Antes T, Liu H, M adabhushi A, Del isi C, Ganesan S, Bhanot G, Liou LS. 2010. Identification of a microRNA panel for clearcell kidney cancer. Urology 75:835-841. Lin SM, Du P, Huber W, Kibbe WA. 2008. Model-based variance- stabilizin transformation for l l lumina microarray data. Nucleic Acids Res 36:e11. Lund AH. 2010. miR-10 in development and cancer. Cell Death Differ 17:209-214. Mongroo PS and Rustgi AK. 2010. T he role of the miR-200 family in epithelial-mesenchymal transition. Cancer B iology & T herapy 10: 219-222. Nakada C, Matsuura K, Tsukamoto Y, Tanigawa M, Yosh imoto T, Narimatsu T, Nguyen LT, H ij iya N, Uchida T, Sato F, M imata H, Seto M, Moriyama M. 2008. Genome-wide microRNA expression profiling in renal cell carcinoma: significant down-regulation of miR-141 and miR-200c. J Pathol 216:418-427.
Petillo D, Kort EJ, Anema J, Furge KA, Yang XJ, Teh BT. 2009. M icroRNA profiling of human kidney cancer subtypes. Int J Oncol;35:109-114. Slaby 0, Jancovicova J, Lakomy R, Svoboda M, Poprach A, Fabian P, Kren L, Michalek J, Vyzula R. 2010. Expression of miRNA-1066 in conventional renal cell carcinoma is a potential marker for prediction of early metastasis after nephrectomy. J Exp Clin Cancer Res 29: 90. Starczynowski DT, M orin R, McPherson A, Lam J, Chari R, Wegrzyn J, Kuchenbauer F, H i rst M, Tohyama K, Humph ries RK, Lam WL, M arra M, Karsan A. 2011. Genome-wide identification of human microRNAs located in leukemia-associated genomic alterations. B lood 117:595-607. T hoenes W, Sterkel S, Rumpelt HJ . 1986. H istopathology and classification of renal cell tumors (adenomas, oncocytomas and carcinomas). T he basic cytological and h istopathological elements and their use for diagnostics. Pathol Res Pract 181:125-143. Van den Berg A, Dijkhuizen T, Draaijers T G, Hulsbeek M M, M aher ER, Van den Berg E, Sterkel S, Buys C H . 1997. Analysis of multiple renal cell adenomas and carcinomas suggests allelic loss at 3p21 to be a prerequisite for mal ignant development. Genes Chromosomes Cancer 19:59-76. Volinia S, Calin GA, Liu CG, Ambs S, Cimmino A, Petrecca F, Visone R, Iorio M, Roldo C, Ferracin M, Prueitt RL, Yanaihara N, Lanza G, Scarpa A, Vecch ione A, Negrini M, Harris CC, Croce C M . 2006. A mi R NA expression signature o f human solid tumors defines cancer gene targets. Proc Natl Acad Sci USA 103:2257-2261. Weng L, Wu X, Gao H, Mu B, Li X, Wang J H, Guo C, J in J M, Chen Z, Covarrubias M, Yuan YC, Weiss LM, Wu H . 2010. MicroRNA profiling of clear cell renal cell carcinoma by wholegenome small RNA deep sequencing of paired frozen and formalin-fixed, paraffin-embedded tissue specimens. J Pathol 222:41-51 . Youssef YM, Wh ite NM, Grigull J, Krizova A, Samy C, Mej ia-Guerrero S, Evans A, Yousef G M . 201 1 . Accurate molecular classification of kidney cancer subtypes using micro RNA signature. Eur Urol 59:721-730.
miRNAS & CLEAR CELL RENAL CELL CARC INOMA 1 2 1

SUPPLEMENTARY FIG U RES AND TABLES
Supplementary Table 1 . Recurrent copy number alterations i n the ccRCC-derived cell lines
Copy number losses Copy number gains
Region of overlap Region of overlap Location (Mb from pter) Frequency Location (Mb from pter) Frequency
1p pter-28,099 7 /10 Sq 129,266-qter 6/10
3p pter-64,696 10/10 7p (1) 3,934-11,673 5/10
4q 84,724-qter 5/10 7p (2) 27, 174-cen 6/10
9p 22,022-31,998 8/10 7q cen-qter 5/10
9q cen-qter 5/10
11 q 112,852-qter 5/10
14q 49, 977-qter 7 /10
Supplementary Table 2. Pathways significantly represented in the group of up- and downregulated genes.
Rank Pathway Maps
1 Cell cycle_Chromosome condensation in prometaphase
2 Cell cycle_ The meta phase checkpoint
3 Cell cycle_Role of APC in cell cycle regulation
4 Cell cycle_lnitiation of mitosis
5 Cell cycle_Spindle assembly and chromosome separation
6 DNA damage_ATM/ATR regulation of G1/S checkpoint
7 Cell adhesion_Chemokines and adhesion
8 Cytoskeleton remodeling_Cytoskeleton remodeling
9 _ _ DNA damage_ATM / ATR regulation of G2 / M checkpo�
10 Cell cycle_Start of DNA replication in early S phase
11 Cytoskeleton remodeling_ TG F, WNT and cytoskeletal remodeling
12 Cell cycle_ Transition and termination of DNA replication
13 Cell cycle_Sister chromatid cohesion
1 4 Cell cycle_Regulation of G 1 /S transition (part 1)
15 Cel l adhesion_ECM remodeling
1 6 Reproduction_Progesterone-mediated oocyte maturation
17 Immune response_Histamine H1 receptor signaling in immune response
1 8 Cell cycle_Cell cycle (generic schema)
19 Cell cycle_Role of Nek in cell cycle regulation
20 Cell cycle_ESR1 regulation of G1/S transition
1 22 CHAPTER 6
pValue Ratio
1.057E-13 15/21
1.609E-13 1 9/36
2.734E-12 17/32
4.919E-12 15/25
7.444E-11 1 6/33
5.419E-10 15/32
1.730E-09 26/100
1.323E-08 25/1 02
3.769E-08 1 2/26
6.580E-08 1 3/32
8.085E-08 25/111
1.045E-07 1 2/28
6.392E-07 10/22
6.991 E-07 1 3/38
1.185E-06 1 5/52
1.368E-06 13/40
2.329E-06 14/48
4.337E-06 9/21
4 .836E-06 11/32 ·-- ·---
6.811 E-06 11/33

Supplementary Table 2. continued
Rank
21
22
23
24
25
26
27
28 -- -29
30
3 1
32
33
34
35
36
37
38
39
40
41
42
43
44
45
46
47
48
49
50
Pathway Maps
dCTP/dUTP metabol ism
Apoptosis and surviva l_p53-dependent apoptosis
Cell cycle_Nucleocytoplasmic transport of CDK/Cycl ins
S igna l tra nsduction_AKT signal ing
Immune response_Oncostatin M signa l ing via MAPK i n human ce l l s
S igna l tra nsduction_cAMP signa l ing -- ---
Cel l adhesion_Endothe l ia l cel l contacts by junctiona l mechanisms
Cel l cycle_Role of 1 4-3-3 proteins in ce l l cycle regu lation
I mmune response_M I F-mediated g lucocorticoid regu lation
Cel l adhesion_lntegrin-mediated cel l adhesion and migration
Immune response_Oncostatin M signa l i ng via MAPK in mouse cel ls
Cel l cycle_Role of SCF complex in ce l l cycle regu lation
Cell adhesion_ Tight junctions
Apoptosis and surviva l_G ranzyme A signa l i ng ---- --
DNA damage_Brca 1 as a transcription regu lator
DNA damage_Role of Brea 1 and Brca2 in DNA repair
DNA damage_DNA-damage-induced responses
Immune response_l L-1 7 s igna l ing pathways
Development_WNT signa l i ng pathway. Part 2 -- --
pVa lue
8 .903E-06
1 .276E-05
1 .529E-05
2 .034E-05
2 .339E-05
3 .09 1 E-05
3 .379E-05
6 .230E-05
6.230E-05
6 .733E-05
8 .040E-05
8 .995E-05
1 .046E-04
1 .208E-04
1 .208E-04
1 .208E-04
1 .479E-04
1 .647 E-04
1 .881 E-04
Development_ TG F-beta-dependent induction of EMT via RhoA, 2 .073E-04 P l3K and I LK. -- --Cel l adhes ion_Cadherin-mediated cel l adhesion 2.383E-04
Development_ TGF-beta-dependent induction of E MT via MAPK 2.543E-04
Immune response_CD40 s igna l ing
Development_Regu lation of epithel ia l-to-mesenchymal transition (EMT)
Apoptosis and surviva l_HTR 1 A signa l ing -- --- --- --
Regu lation of C FTR activity (norm and CF)
Development_Beta-adrenergic receptors transactivation of EG FR
ATP/ITP metabol ism
Regu lation of l ipid metabol ism_Regu lation of l ip id metabo l ism by n iacin and isoprena l ine
-- -- --Cel l adhesion_H istamine H 1 receptor s igna l ing in the interruption of cell barrier i ntegrity
3 .251 E-04
3 .25 1 E-04
4.520E-04
4.590E-04
6 .821 E-04
7 .224E-04
7 .501 E-04
7 . 501 E-04
Ratio
1 7/75
1 0/29
7/1 4
1 2/43
1 1 /37
1 1 /38
9/26
8/22
8/22
1 2/48
1 0/35
9/29
1 0/36
9/30
9/30
9/30
5/9
1 3/60
1 2/53
1 1 /46
8/26
1 1 /47
1 3/64
1 3/64
1 1 /50
1 2/58
9/37
1 9/1 24
1 0/45
1 0/45
Ratio: number of genes with a s ign ificantly a ltered level of expression versus the tota l number of genes in th is pathway as indicated in the GeneGo package
miRNAS & CLEAR C ELL RENAL CELL CARCI NOMA 1 23

Supplementary Table 3. m iRNAs located in recurrently lost regions that show an average decrease in transcript abundance of two-fo ld or more in a subset of the ccRCC-derived ce l l l i nes.
miRNA Locus RCC-1 RCC-4 RCC-5 RCC-AB
hsa-m i R-200b 1 p36.33 7 .6 ,!, 27 .0 ,!, 4.0 ,!, 4.3 ,!,
hsa-m i R-200b* 1 p36.33 2.6 ,!, 4.8 ,!, 1 . 1 t 9.2 ,!,
hsa-mi R-200a* 1 p36.33 5.0 ,!, 4.9 ,!, 1 0 .7 ,!, 7 .4 ,!,
hsa-m iR-200a 1 p36.33 40.3 ,!, 1 6 .4 ,!, 4. 1 ,!, 5.8 ,!,
hsa-m iR-429 1 p36.33 78 .2 ,!, 8.3 ,!, 2 .8 ,!, 5.2 ,!,
hsa-m i R-34a 1 p36.22 2 .7 ,!, 4.5 ,!, 1 . 1 ,!, 3.2 ,!,
hsa-let-7g 3p2 1 . 1 5 .4 ,!, 45 .3 ,!, 1 . 7 ,!, 2.5 ,!,
hsa-mi R- 1 38 3p2 1 .32 & 1 6q 1 3 1 8 .5 ,!, 3 . 2 ,!, 4.7 ,!, 5.9 ,!,
hsa-let-7f 9922 .32 & Xp1 1 . 22 6.0 ,!, 60. 1 ,!, 3 . 1 ,!, 1 .6 ,!,
hsa-let-7d 9922.32 3 .0 ,!, 23 .7 ,!, 1 . 8 ,!, 1 .4 ,!,
hsa-m i R-23b 9q22 .32 4.6 ,!, 1 0 .2 ,!, 1 . 3 ,!, 1 . 3 t
hsa-m iR-27b 9922.32 8 .7 ,!, 9 .3 ,!, 1 .6 ,!, 1 .0 -- --
hsa-m iR-2 1 993 1 .3 6.0 ,!, 1 1 .3 ,!, 1 .2 ,!, 1 . 5 ,!,
hsa-let-7a 9922.32 & 1 1 q24 . 1 & 229 1 3 .3 1 4 .8 ,!, 33 .7 ,!, 3 .7 ,!, 1 .4 ,!,
hsa-m i R-625 1 4923 .3 3 .0 ,!, 7 . 9 ,!, 1 1 .9 ,!, 8 . 1 ,!,
hsa-mi R-1 34 1 4q23.3 4 .6 ,!, 3.4 ,!, 2 . 1 ,!, 2.3 ,!,
Numbers ind icate the absolute fo ld change for the ccRCC-derived ce l l l i ne re lative to PTEC. (t) positive FC, (-!-) negative FC. Tota l# ind icates number of ce l l l ines with a fo ld change > 2.
Supplementary Table 4. Va l idated target genes with a sign ificantly h igher m RNA level in the ccRCC cel l l ines.
Gene symbol
BLMH
BRCA1
CCNA2
CDKN3
H MG B 1
MCM 1 0
N FIX
PA2G4
POLE2
RAD54L
TI M ELESS
UH RF1
USF2
1 24 CHAPTER 6
Fold Change microRNA
3.2 m iR-1 46a
2 . 1 m iR-1 46a
4.7 m iR-1 46a
3 .4 m iR-1 46a
2 .9 m iR- 1 41
5 .7 m iR-1 46a
2.5 m iR- 1 46a
3 .2 m iR- 1 46a
2.4 m iR- 1 46a
2 .9 m iR- 1 46a
2 .5 m iR- 1 46a
5.0 m iR- 1 46a
2 . 1 m iR- 1 0a

RCC-ER RCC-FG2 RCC-HS RCC-JF RCC-JW RCC-MF Tota l #
1 8 .7 ,J, 3 . 1 ,J, 7 .4 ,J, 4.2 ,J, 6 .6 ,J, 6 .9 ,J, 1 0 -- - -- -- - -- --1 . 8 ,J, 3 .6 ,J, 5.8 ,J, 4.6 ,J, 2 .7 ,J, 9.0 ,J, 9
3.5 ,J, 6 .8 ,J, 1 1 .3 ,J, 9 .6 ,J, 5 .3 ,J, 1 7.5 ,J, 1 0 - --- ---- -- --·-74.8 ,J, 4.4 ,J, 8 .5 ,J, 7.1 -1, 9.2 ,J, 6.4 -1, 1 0 ---- --68.5 -1, 4.0 ,J, 4.5 ,J, 6 .7 ,J, 1 0 .5 ,J, 7 .6 -1, 1 0
1 9.4 ,J, 2 .2 -1, 2 .7 -1, 1 .8 -1, 2 .9 ,J, 1 .6 -1, 7 -- --- - --1 2 .5 ,J, 1 .6 ,J, 1 6 .8 -1, 1 . 5 -1, 1 6 .4 ,J, 1 .5 -1, 6 -- -- --- -- -- - -- --
----
1 3 . 1 ,J, 7 .6 -1, 2.0 t 2.8 -1, 1 .0 - 1 0.5 ,J, 8 -- --6.0 ,J, 1 .0 - 23.6 -1, 1 . 1 t 28.4 ,J, 1 .3 -1, 6 -4.0 ,J, 1 .0 - 1 1 .3 -1, 1 . 1 t 1 3 . 1 -1, 1 . 1 - 5
4.5 ,J, 1 .0 - 2 .6 -1, 1 .1 t 2 1 .0 ,J, 1 .3 -1, 5 -- -- � -- ---6.1 -1, 1 .2 ,J, 2 .8 ,J, 1 . 3 ,J, 1 3 .9 -1, 1 .5 -1, 5 -- --4.2 ,J, 1 .6 -1, 1 3 .7 ,J, 2 .4 -1, 6 .5 ,J, 1 . 1 -1, 6 --- --- --- -- --3.6 -1, 1 .2 t 1 7 .0 -1, 1 .2 t 34.7 ,J, 1 .5 -1, 6 -- -- -- -- --3.0 ,J, 1 .5 ,J, 9.6 -1, 8.2 -1, 4.5 -1, 6.0 -1, 9
4.0 ,J, 7 .6 -1, 2.3 t 1 . 7 -1, 3.2 ,J, 4.0 -1, 9
Supplementary Table 5. Predicted targets on 3p for s ign ificantly upregulated m iRNAs.
name
microRNA
locus FC
predicted target
p-va lue Symbol FC p-va lue Pearson
correlation
hsa-m i R- 1 49 2927 .3 3.0 t 0.0041 ARPC4 4. 9 -1- 6 .51 E-09 -0.63 ---
hsa-miR- 1 97
hsa-miR-324-3p -- --
hsa-m iR-338-5p
hsa-miR-8926
1 p 1 3.3 2 .8 t 1 7p 1 3 ._1 _8.3 t
1 7925.3
OXSR1 2 .9 ,J, 6 .60E-09 -0.57
0.0083 USP4 2.2 -1-----0.001 0 G NAl2 3 .0 -1-
SUMF1 2 .6 -1-
2 .25E-07
1 . 1 5E-09 -- --
-0.85
-0.70
9 . 1 3E-1 1 -0.8 1
0 .0320 VG LL4 2 .6 -1- 9 .37 E-06 -0.75 ---- -------------G NAl2 3 .0 ,J, 1 . 1 5E-09 -0.57 ------ ---- ---
Xp27.3 2 1 .8 t 0.00 1 0 UBP 1 2.0 -1- 2 .97E-09 -0.72
FC: Fold change (ccRCC versus PTEC). {t) positive FC, (-1-) negative FC
miRNAS & CLEAR CELL RENAL CELL CARC I N OMA 1 25


GENERAL DISCUSSION
In th is thesis, we describe different approaches used to identify novel ccRCC tumor suppressor genes. Here, I summarize our findings, put them in a broader perspective, and speculate on future perspectives.
Chromosomal aberrations and VHL mutations in ccRCC
To facilitate our search for ccRCC tumor suppressor genes, we obtained a panel of ccRCC-derived cell lines. During the course of this project, these cel l lines were characterized in detail with respect to their chromosoma l copy number, miRNA expression, and gene expression profiles. Moreover, these cell lines were screened for inactivating mutations in the Von Hippe/ Lindau (VHL) gene, which is a known ccRCC tumor suppressor gene.
We assessed chromosoma l copy number aberrations for a total of eleven ccRCCderived cell l ines, and 22 primary ccRCC tumors. We observed, amongst various other aberrations, a complete loss of 3p in seven cel l lines and 14 primary tumors. Three cell lines and five tumors had a large terminal deletion, the sma llest being 64 Mb. One primary tumor showed retainment of the terminal pa rt (pter to 24 Mb from pter), which included the 3p25 region. The two tumors that did not show 3p loss did not show a loss or gain for any other locus, indicating that these samples may not have conta ined sufficient tumor cel ls to detect copy number aberrations. Our findings underscore those of recent papers that show that the vast majority of ccRCC tumors have large termina l deletions of 3p that comprise almost the entire p-arm (Toma et a l . ,2008; Sukosd et al., 2003). In contrast to what others h ave observed (Van den Berg et al., 1997; Chudek et al., 1997; Braga et al. , 2002), none of the ccRCC samples that we ana lyzed showed interstitia l 3p deletions. One cell line that did not show 3p loss was excluded from subsequent experiments, as this cel l line may not hold cl ues for a 3p-located tumor suppressor gene. Other recurrently lost regions include segments on 1 p, 4q, 9, 11 q, and 14q. Eight out of ten cel l lines carried a homozygous deletion on 9p21 varying in size from 50 to 600 kb, which inc luded the CDKN2A and CDKN2B gene loci, encoding the P16 and P15 proteins, respectively. This suggests a possible role for p15 and/or p16 inactivation in ccRCC development.
We identified inactivating mutations in VHL, located at 3p25, in five out of ten ccRCC-derived cell lines and in six out of ten primary ccRCC tumors that were screened for VHL mutations. This is in agreement with previous reports of the inactivation of VHL in about 50 % of ccRCC tumor samples (Gnarra et al., 1994; Nickerson et a l . ,2008). The function of VHL and its role in ccRCC tumorigenesis have been well studied during the past decade. VHL is part of a ubiquitin ligase complex that targets transcription factor HI Fa for proteosomal degradation. Inactivation of V HL results in consistently high HIFa levels, triggering the upregu lation of HI Fa targets, which include vascular endothelial growth factor (VEGF) and platelet derived growth factor (PDGF). These targets in turn activate pathways such as the RAF-MEK-ERK and Phosphatidylinositol-3 kinase-AKT-m TOR pathways, triggering angiogenesis and proliferation (Clark et a l . , 2009; Baldewijn et al . , 2010; reviewed by Kaelin, 2008) . Recent reports show that VHL
1 28 CHAPTER 7

is involved in several other processes, including tight junction formation, suggesting a role in epithelial-to-mesenchymal transition (Harten et al., 2009). Although VHL is a major player in ccRCC tumorigenesis, VHL is not inactivated in all ccRCC tumors, and VHL loss alone is not sufficient for ccRCC development, suggesting the need for additional genetic events (Mandriota et al., 2002; Young et al., 2008). For a long time the search for (ccRCC) tumor suppressor genes has been focused on protein coding genes. Recent findings, however, indicate that noncoding genes, including miRNAs, can exert tumor suppressive or oncogenic functions in a tissue-specific manner (reviews by Kent et al., 2006; Garzon et al., 2006; Chen et al., 2005).
miRNAs and ccRCC In Chapter 6, we compared the genome-wide microRNA expression profiles in the ccRCC-derived samples with those in proximal tubular epithelial cells (PTECs), which are the cells from which ccRCC tumors are thought to be derived (Thoenes et al., 1985). We showed a significant downregulation of all members of the miR-200 family and miR-205. These miRNAs control cellular morphogenesis by translational regulation of targets that include the transcription factors ZEB 1 and ZEB2, which in their turn regulate the expression of E-cadherin and a number of master regulators of epithelial polarity (Gregory et al., 2008). As a result of loss of the miR-200 family, epithelial cells undergo an epithelial-to-mesenchymal transition (EMT), which, in a tumorigenic context, confers a metastatic potential to the cells (Gibbons et al., 2009). Thus, our data suggest a role for miRNAs in ccRCC progression. None of the known miRNAs that are located on the short arm of 3p were consistently downregulated in the ccRCC samples, suggesting that loss-of-function of these miRNAs is not the driving force for the frequently observed loss in this chromosomal segment.
A new gene for ccRCC, SETD2
In Chapter 2, we applied Gene Identification of nonsense-mediated m RNA-decay Inhibition (GIN/) on the ccRCC-derived cell lines that showed 3p loss, and identified SETD2 as a new candidate ccRCC tumor suppressor gene. SETD2 is located at 3p21, and encodes a histone methyltransferase that is nonredundantly responsible for trimethylation of lysine 36 of histone 3 (H3K36me3). We identified inactivating mutations in five out of ten ccRCC-derived cell lines. These five cell lines, and two other cell lines, showed loss or significant decrease of global H3K36me3 modification levels. Sequencing of SETD2 in a total of 20 primary ccRCC tumors revealed missense mutations in two of them. A huge exome-sequencing project revealed inactivating mutations in SETD2 in 12 out of 407 (3%) primary ccRCC tumors, providing in vivo evidence for the relevance of our findings (Dalgliesh et al., 2010).
Dalgliesh et al. (2010) did not identify mutations in SETD2 in other tumor types, and suggested that inactivation of SETD2 might be specific for ccRCC tumors. We performed a mutational screening of SETD2 in nine small-cell lung carcinoma-derived cell lines, a type of carcinoma also characterized by loss of 3p21, but also did not find any mutations. However, the number of investigated non-ccRCC tumors might not have been sufficient to give a good estimate of the mutation rate in other tumor
GENERAL DISCUSSION 1 29

types. M o reover, decreased SETD2 tra nscri pt leve ls have been observed in m a l ignant breast ca ncer (Al Sarakbi et a l ., 2009), and a tra nsposon-based genetic screen i n m ice suggested a ro le for SETD2 i nactivation in the deve lopment of pancreatic cancer (Sta rr et a l . , 2009) . Da lg l i esh et a l . (20 1 0) reported the identification of inactivati ng m utations in other h i stone-modifying enzymes in a su bset of ccRCC tu mors; th is suggests a broader ro l e for aberra nt h iston e 3 methylation in ccRCC development. Therefore, i nactivat ing m utations in these d ifferent h istone H 3-modifying enzymes might contribute to tumorigenic devel opment by affecting the same pathways. Aberra nt activity of h i stone- mod ifyi ng enzym es cou l d resu lt i n a ltered ch romati n configuration and d isru ption of norma l transcri ptiona l progra ms, push ing the ce l l towa rds ca ncerous deve lopment (Mori n et a l . , 20 1 1 ; reviewed by Fu l l g rabe et a l ., 20 1 1 ) .
The function of SETD2 Th e m echan isms th rough wh ich i nactivation of SETD2 contributes to ccRCC deve lopment a re not yet fu l l y known . However, one cou l d specu late that l oss of H 3 K36me3, wh ich is the resu lt of SETD2 i nactivatio n , resu lts in dereg u lated tra nscri ption an d/or transcri ption-re l ated process ing of a set of genes that p lay a ro l e i n ccRCC tu m origenesis. Trimethylat ion of H 3 K36me3 is i nt imate ly l i n ked with transcriptiona l e longation , as S ETD2 is recru ited to nucl eosomes by hyperphosphorylated RNA po lymerase d u ring tra nscriptiona l e longation (Yoh et a l ., 2008) . Furthermore, the prefere ntia l l ocation of H3K36me3 on exons re lative to intronic reg ions suggests a ro le for H K36me3 in exon defi n ition and , therefore , in reg u l at ing sp l ic ing (Kolas i nskaZwierz et a l ., 2009; Spies et a l ., 2009, Andersson et a l ., 2009, Huff et a l ., 201 0). H istone modifications have previous ly been suggested to be able to modu late the outcome of a lternative sp l ic ing by infl uenc ing th e e longat ion rate of RNAPOL I I (Schor et a l ., 2009). S lowing of the e longation rate cou ld resu l t i n recogn ition of "wea k" sp l ice sites, resu ltin g in i nc lusion of a lternative exons (De la M ata et a l ., 2003). I ndeed, recently, Luco et a l . (20 1 0) showed that H 3 K36me3 can d i rectly affect sp l ic ing by recruit ing polypyri m i d i n e tract-b ind ing protei n (PTB) v ia the ch romati n bind ing protein M RG 1 5 , wh ich specifica l l y recogn izes trimethylated H 3 K36. PTB b inds to exon-specific s i lenc ing e lements, resu lti ng in the repression of these exons (Luco et a l .,20 1 0). They suggested the existence of severa l of these " ad a ptor com plexes " , wh ich consist of a combination of ( 1 ) a mod ified h i stone ta i l , (2) a ch romatin b ind ing protein that recogn izes th is specifi c h istone modification , a n d (3) a sp l ice reg u lator that is recru ited to the h istone mark via the ch romatin-bind ing protein (reviewed by Luco et a l ., 201 1 ) . Recent find ings suggest that a lternative sp l ic ing a n d trimethylated H3K36 can bi-d i rectiona l ly infl uence each other. Co-tra nscri ptiona l sp l iceosome assembly and sp l ic ing enhances the recru itment of SETD2, lead ing to enrichment of H3 K36me3 (De A lmeida et a l ., 20 1 1 ; K im et a l . , 201 1 ). Al l these find ings suggest that S ETD2 inactivation resu lts i n aberrant spl ici n g , wh ich is com mon i n cancers a n d p lays a ro le i n tu morigenesis and m a i ntenance (Venab les et a l ., 2009) .
To assess the effect of SETD2 i nactivation on transcri pt level s a n d a l ternative spl ice s ite cho ice in p roxim a l tu b u l a r epith e l i a l ce l ls , we trans iently knocked down SETD2 i n these ce l l s, resu lti n g i n s ign ificant ly decreased g loba l H 3 K36me3 levels.
1 30 CHAPTER 7

By RNAseq, we assessed the effect of this knockdown on transcript levels and exon usage genome-wide. As expected from the literature (Edmunds et al., 2008; Yoh et al. , 2008), there was a positive correlation between the presence of H3K36me3 and gene expression in the wild-type PTEC sample. A limited set of genes showed a significant change in transcript levels as a result of SETD2 knockdown. Gene set enrichment analysis of the set of 55 downregulated genes showed a significant enrichment for angiogenesis-related processes, and the ErbB- and P53 signaling pathways. The enrichment for angiogenesis-related genes is in concordance with the crucial role for SETD2 in embryonic vascular remodeling in mice (Hu et al., 2010). SETD2 was previously suggested to play a role in the transcriptional control of a subset of P53 target genes by direct interaction with P53 (Xie et al., 2008). It remains to be explored which of the observed changes in transcript levels are a direct consequence of SETD2 knockdown, and what mechanisms link SETD2 function and/or H3K36me3 with the regulation of transcript levels.
Considering alternative splicing, our preliminary data analysis indeed revealed an apparent change in alternative splicing as a resu lt of SETD2 knockdown for a set of genes, which corroborated the suggested role of SETD2 via H3K36me3 in alternative splice site choice for a subset of target genes (Luco et al., 2010). Several of the genes that show a change in alternative exon usage encode proteins that function in processes that are relevant to tumorigenesis, such as WNT signaling (Axin), TGF-13 signaling (LTBP3}, cell cycle entry control (PUM2), and DNA repair (RAD 7) . Besides genes that show a change in alternative splice site choice, some genes appeared to be transcribed from a different transcriptional start site as a result of SETD2 knockdown. It was recently shown that KDM5B, a H3K4me3 demethylase, is recruited to H3K36me3 via interaction with the chromodomain protein MRG 15. This resu lts in a decrease of intragenic H3K4me3, thereby suppressing cryptic intragenic transcription (Xie et al. , 2011 ) . Thus, loss of H3K36me3 could indeed resu lt in alternative transcriptional start site choice. The exact mechanisms and proteins that underlie the observed changes in alternative splicing or transcriptional start site, and the effect of these changes on the function of the encoded proteins, as wel l as their potential role in ccRCC tumorigenesis, require further functional study.
PBRM1 The observed frequency of inactivating mutations in SETD2 in ccRCC tumors suggested that there were probably other potential ccRCC tumor suppressor genes located at 3p21 to be discovered. As our GINI analysis did not reveal any other candidates, we decided to make use of the recently developed next-generation sequencing (NGS) technology to look for additional inactivated genes (Chapter 5). This resulted in the identification of inactivating mutations in PBRM1 in seven out of ten ccRCC tumors and inactivating mutations in BAP1 and ZNF197 in one tumor. Moreover, we identified inactivating mutations in PBRM1 in five out of ten ccRCC-derived cell lines. PBRM1 is located at 3p21, and encodes BAF180, which is the chromatin targeting subunit of the SWI/SNF nucleosome remodeling complex (Thompson et al., 2009). SWI/SNF complexes are large ATP-dependent chromatin-remodeling machines that change
GENERAL DISCUSSION 1 31
the accessibility of DNA by control l ing the dynamics of nucleosome occupancy. The frequent inactivation of PBRM 1 in ccRCC has also been reported by Varela et al. (2011), who identified inactivating mutations in PBRM 7 in 92 out 227 (41%) primary ccRCC tumors. This strongly suggests that PBRM 7 is an important ccRCC tumor suppressor gene that plays a role in tumorigenic development in a large fraction of ccRCC samples. Severa l other components of the SWI/SNF remodeling complex are involved in the development of different cancer types (Schneppenheim et a l ., 2010; Rodriguez-Nieto et al. , 2011; Jones et a l., 201 O; reviewed by Reisman et a l., 2009). The identification of inactivating mutations in PBRM 1 in four breast cancer samples (Xia et al., 2008), a pancreatic cancer sample (Jones et a l., 2008), and several cell lines derived from different tumor types (Varela et al., 2011 ) provide additional support for PBRM 1 being a true tumor suppressor gene. Furthermore, Varela et al. (2011) showed that siRNA-mediated knockdown of PBRM 1 in ccRCC-derived cell lines with wild-type PBRM 1 results in a significant increase in proliferation, increased colony formation in soft agar, and increased cell migration. However, more in vivo evidence is needed to prove the tumor suppressive role of PBRM 1 in ccRCC.
The frequent inactivation of BAP1 in other tumor types (Bott et al., 201 1; Harbour et al., 2010), and the role of the encoded protein in chromatin regulation, make BAP1 an interesting candidate ccRCC cancer gene. The truncating mutation in ZNF1 97, which was identified in a ccRCC sample in which no VHL mutation was found, is interesting, given the fact that an alternative isoform of ZNF197 encodes a protein that is possibly involved in VHL-mediated HIF-1-a transactivation (Li et al., 2003). Inactivation of ZNF1 97 might therefore be redundant to VHL inactivation. Mutational screening of a larger panel of ccRCC tumors is however needed to give a better estimate of the mutational frequency in ccRCC for these genes.
ccRCC genetics
Inactivation of individual ccRCC tumor suppressor genes such as VHL, PBRM 1 , or SETD2 could confer growth advantage upon the proximal tubular epithelia l cel l. However, the observed concomitant mutations in PBRM 7, VHL, and SETD2 in a subset of ccRCC samples suggest that at least three mutations are required for a proxima l tubular epithelial cell to develop into a ccRCC tumor. As shown by Young et a l . (2008) in a Cre/loxP mouse model, VHL inactivation a lone is indeed not sufficient to lead to ccRCC tumors in mice. Generation of single-, double-, as well as triple-conditional knockout mice that represent the possible "combinations" of inactivation of VHL, PBRM 1 , and SETD2 might therefore be necessary to confirm the tumorigenic effect of inactivation of these genes in proxima l tubular epithelial cells. These knockout mice could a lso provide clues about the possible mechanisms through which inactivation of the individua l genes contributes to ccRCC development, as well as the probable order in which the mutational events take place during ccRCC development. One possibility is that inactivation of these genes contributes to ccRCC development by affecting different pathways. Alternatively, the functions of the proteins which are encoded by these genes might converge on the same pathways, and inactivation of these genes might therefore mutua l ly strengthen their effects. PBRM1 plays a role in coordinating
132 CHAPTER 7

senescence by regulating the transcriptional activity of a subset of p53 target genes (Burrows et al., 2010), and has been suggested to be involved in the cellular response to hypoxia (Kenneth et al., 2009), suggesting a functional overlap with VHL function. Indeed, Varela et al. (2011) showed that nearly all primary ccRCC tumors that harbor inactivating mutations in PBRM 1 have a "hypoxia signature" , including those in which no VHL mutations were identified.
An extensive cross-talk has been shown to exist between different histone modifications and the enzymes that are responsible for these modifications (Kouzarides et al., 2007). Interestingly, the H3K27me3 demethylase UTX travels with the elongating RNAPOLII complex (Smith et al., 2007). It is therefore tempting to speculate that the inactivation of the different histone methylation enzymes observed in ccRCC tumors affects the same set of target genes. Recently, VHL has been shown to regulate gene expression and tumor growth through the regulation of histone demethylases (Beyer et al., 2008; Niu et al., 2011; Yang et al., 2009). We therefore propose that inactivation of VHL has a tumorigenic effect in PTECs partially as a result of deregulation of histone demethylases. Inactivating mutations in histone methylation enzymes such as SETD2 irreversibly alter histone modification patterns, resulting in a loss of cellular identity, and contributing to ccRCC development (Figure 1 ) .
In conclusion, our data indicate that the short arm of chromosome 3 harbors several genes that could contribute to ccRCC development when inactivated (Figure 2).
The frequently observed 3p loss in ccRCC tumors could be driven by the inactivation of different ccRCC tumor suppressor genes located at 3p, or combinations of 3p tumor suppressors. In general, it is assumed that a subtle mutation in one allele of a tumor suppressor gene provides a "first hit " , after which loss of a larger chromosomal segment results in loss of the other allele, and therefore in the functional inactivation of the tumor suppressor gene. Given the apparent presence of multiple candidate ccRCC tumor suppressors on 3p, it is however tempting to speculate that 3p loss alone could already confer growth advantage upon the proximal tubular epithelial cell, and could therefore provide an early step in tumorigenic development.
Several of the mutated genes in ccRCC encode proteins that modify histone tails or remodel chromatin, suggesting that aberrant chromatin regulation is a core driver event in the development of clear cell renal cell carcinoma. Unraveling the mechanisms through which aberrant chromatin regulation contributes to ccRCC development will be an important area of future ccRCC research, and may result in the identification of novel therapeutic targets.
GENERAL DISCUSSION 133

Inactive VHL
(2) HIF- a stabilization, dimerization
[ HIF-� l
I r-, - I
HRE
Inactivation SETD2
-- Functional VHL
Increased levels histone demethylases
(1)
VHL-dependent proteosomal degradation of HIF-a
Histone demethylases
Aberrant regulation histone modifications
l I ccRCC tumorigenesis
Figure 1 . Role of VHL in the regulation of histone modifications. (1 ) V H L forms part of an E3-ubiquitin ligase complex that targets the transcription factor Hypoxia inducible factor (H I F)-a for degradation. (2) Inactivation of VHL results in the accumulation of H I F-a, which forms a heterodimer with H I F-�, and translocates to the nucleus, where it binds to hypoxia-responsive elements (H RE) and activates the transcription of target genes. Recently, these target genes have been shown to include several histone demethy lases (Beyer et al., 2008; Niu et a l ., 2008). Inactivation of VHL therefore results in consistently high histone demethy lase levels, resulting in the aberrant regulation of histone modifications, with possibly tumorigenic consequences. Inactivating mutations in histone methyltransferase SETD2 result in tota l loss of H3K36me3, irreversibly a ltering histone modification patterns. The tumorigenic effects of VHL inactivation and inactivation of SETD2 and other histone modifying enzymes that have been shown to be inactivated in a subset of ccRCCs (Dalgliesh et a l., 2010) might therefore converge, at least partia l l y, on the same pathways.
1 34 C HA PTER 7

Primary ccRCC tumors ccRCC-derived cell l ines
3p25
3p21.3
3p21.1
3p14.2 _ _
SETD2
BAP1 PBRM1
D Missense/ inframe indel
Ill Splice site
■ Nonsense/ frameshift introducing
Figure 2. Schematic picture of the short arm of chromosome 3 (3p), showing the locations of "3p genes" in which inactivating mutations were identified during this project. The columns represent the ten ccRCC tumor samples that were screened for mutations in 3p genes by targeted exome-sequencing (Chapter 5) and the ten ccRCC-derived cell lines. These cell lines were screened for VHL, PBRM 1 , and SETD2 mutations, but not for mutations in BAP 7 and ZNF1 97. The vertical line represents the minimally deleted region among this set of ccRCC samples, comprising a large terminal part of 3p. The little squares represent the identified mutations. Targeted 3p exome sequencing of ten primary ccRCC did not reveal any inactivating mutations in SETD2. However, screening for SETD2 mutations in another set of primary ccRCC tumors revealed missense mutations in two out of ten samples (Chapter 2) .
REFERENCES Al Sarakbi W, Sasi W, Jiang WG, et a l . The mRNA expression of SETD2 in human breast cancer: correlation with clinico-pathological parameters. B MC Cancer 2009;9:290. Andersson R, Enroth S, Rada-Iglesias A, et a l . Genome Res 2009 ; 1 9 :1732.
Baldewijns MM. Van Vlodrop IJ H, Vermeulen PB, et al. VHL and HI F signalling in renal cel l carcinogenesis . Journal of Pathology 2010;221: 125.
Beyer S, Kristensen MM, Jensen KS, et a l . The histone demethylases J MJ D1A and JMJ D2B are transcriptional targets of hypoxia-inducible factor HIF. J Biol Chem 2008;283:36542. Bott M, Brevet M, Taylor BS, et al. The nuclear deubuquitinase BAP1 is commonly inactivated by somatic mutations and 3p21.1 losses in malignant pleural mesothelioma. Nature Genetics 2011 ;43:668.
Braga E., Senchenko V, Bazov I, et al. Critical tumor-suppressor gene regions on chromosome 3P in major human epithelial malignancies: allelotyping and quantitative real-time PCR. Int J Cancer 2002;100:534 . Burrows AE, Smogorzewska A, El ledge SJ . Polybromo- associated BRG-associated factor components BRD7 and BAF180 are critical regulators of p53 required for induction of replicative senescence. PNAS USA 2010;107:14280. Chen CZ. MicroRNAs as oncogenes and tumor suppressors. N Engl J Med 2005;353:1757. Chudek J, Wilhelm M, Bugert P, et al. Detailed microsatellite analysis of chromosome 3p region in non-papillary renal cel l carcinomas. Int J Cancer 1997;73:225. Clark PE. The role of VHL in clear-cell renal cell carcinoma and its relation to targeted therapy. Kidney International 2009;76: 939.
G EN ERAL D ISCUSS I O N 1 35

Dalgliesh G L, Furge K, Greenman C, et a l . Systematic sequencing of renal carcinoma reveals inactivation of histone modifying enzymes. Nature 2010;463:360. De Almeida SF, Grosso AR, Koch F, et a l . Splicing enhances recruitment of methyltransferase HYPB/SETD2 and methylation of hi stone H3 Lys 36. Nat Struct Mol B iol 2011; 18: 83. De la M ata M , Alonso CR, Kadener S, et al . A slow RNA polymerase I I affects alternative splicing in vivo. Mol Cel l 2003;12:525. Edmunds JW, M ahadevan LC, Clayton AL. Dynamic histone H3 methylation during gene i nduction: HYPB/ SETD2 mediates all H3K36 trimethylation. E M B O J 2008;27:406. Fullgrabe J, Kavanagh E, Joseph B. Histone once-modifications. Oncogene 201 1 ;30:3391. Garzon R, Fabbri M, Cimmino A, et al. MicroRNA expression and function in cancer. Trends Mol Med 2006 ; 1 2:580. G ibbons DL, Lin W, Creighton CJ , et al. Contextual extracel lular cues promote tumor cel l EMT and metastasis by regulating miR-200 family expression . Genes & Dev 2009;23:2140. Gnarra JR, Tory K, Weng Y, et al. Mutations of the VHL tumour suppressor gene in renal carcinoma. Nature Genetics 1994:7;85. Gregory PA, Bert AG, Paterson EL, et al . T he miR-200 fami ly and miR-205 regulate epithel ial to mesenchymal transition by targeting ZEB1 and SIP1. Nature Cell B iology 2008;10:593. Harbour JW, Onken M D, Roberson ED, et a l . Frequent mutation of BAP1 in metastasizing uveal melanomas. Science 2010;330: 1410. Harten SK, Shukla D, Ba rod R, et al. Regulation of renal epithelial tight junctions by the von Hippel-Lindau tumor suppressor gene involves occludin and claudin and is i ndependent of E-cadherin . Mol B iol Cel l 2009:20;1089 . Hornsby C, Page K M , Toml inson I P. What can we learn from the population incidence of cancer? Armitage and Doll revisited. Lancet Oncol 2007;8:1030. Hu M, Sun X-J , Zhang Y-L, et a l . Histone H3 lysine 36 methyltransferase Hypb/Setd2 is required for embryonic vascular remodeling. Proc Natl Acad Sci U S A 2010;107:2956. Huff JT, Plocik AM , Guthre C, et al. KR Reciprocal i ntron ic and exonic histone modification regions in humans. Nature Structural & Molecular Biology 2010:17:1495. Jones S, Wang T L, Shih leM, et al. Frequent mutations of chromati n remodeling gene ARI D1A in ovarian clear cell carcinoma. Science 2010;330:228.
1 36 CHAPTER 7
Jones S, Zhang X, Parsons DW, et a l . Core signal ing pathways in human pancreatic cancers revealed by global genomic analyses. Science 2008;321 :1801. Kaelin Jr. WG . The von Hippel-Lindau tumour suppressor protein : 0
2 sensing and cancer.
Nature Reviews Cancer 2008:8;865. Kenneth NS, Mudie S, Van Uden P, et al. SWI/ SN F regulates the cel lular response to hypoxia. J B iol Chem 2009;284:4123. Kent OA, M endel l JT. A smal l piece in the cancer puzzle: microRNAs as tumor suppressors and oncogenes. Oncogene 2006;25:6188. Kim S, K im H, Fong N , Erickson B , et a l . PremRNA splic ing is a determinant of histone H3K36me3 methylation . Proc Natl Acad Sci U S A 2011;108:13563. Kolasinska-Zwierz P, Down T, Latorre I, et a l . Differential chromatin marking of i ntrans and expressed exons by H3K36me3. N ature Genetics 2009;41 :376 . Kouzarides T. Chromatin Modifications and their function . Cell 2007;128:693. Li Z, Wang D, Na X, et al . The VH L protein recruits a novel KRAB-A domain protein to repress HI F-1 a lpha transcriptional activity. EMBO J 2003;22:1857. Luco RF, Alla M , Schor I E, et al . Epigenetics in alternative pre-mRNA spl icing. Cel l 2011; 144:16. Luco RF, Pan 0, Tominaga K, et a l . Regulation of alternative splicing by histone modifications. Science 2010;327:996. Mandriota SJ , Turner KJ , Davies DR, et a l . HIF activation identifies early lesions in VHL kidneys: evidence for site specific tumor suppressor function in the nephron . Cancer Cell 2002;1 :459 . Morin RD, Mendez-Lago M , Munga l l AJ, et al. Frequent mutation of histone-modifying genes in non-Hodgkin lymphoma. Nature 2011 ;476:298. N ickerson M L, Jaeger E, Shi Y, et al . Improved identification of von Hippel-Lindau gene alterations in clear cell renal tumors. Cli n Cancer Res 2008;14:4726 . N iu X, Zhang T, Liao L, et a l . The von HippelLindau tumor suppressor protein regulates gene expression and tumor growth through histone demethylase JAR ID1 C. Oncogene 2011. [Epub ahead of print]. Reisman D, G lares S, Thompson EA. T he SWI/SNF complex and cancer. Oncogene 1009 ;28: 1653. Rodriguez-N ieto S, Canada A, Pros E, et al. Massive parallel DNA pyrosequencing analysis

of the tumor suppressor BRG1/SMARCA4 in lung primary tumors. Hum Mutat 2011 ;32: 1999. Schneppenheim R, Fruhwald MC, Gesk S, et al. Germline mutation and somatic inactivation of SMARCA4/BRG 1 in a family with rhabdoid tumor predisposition syndrome. Am J Hum Genet 2010;86: 279. Schor I E, Rascovan N, Pelisch F, et al. Neuronal cell depolarisation induces intragenic chromatin modifications affecting NCAM alternative splicing. Proc Natl Acad Sci U S A 2009;106:4325 . Smith ER, Lee MG, Winter B, et a l . Drosophila UTX is a histone H3 Lys27 demethylase that colocalizes with the elongating form of RNA polymerase I I . Mol Cell Biol 2008;28:1041. Spies N, Nielsen CB, Padgett RA, et al. Biased chromatin signatures around polyadenylation sites and exons. Mol Cell 2009;36:245 . Starr T K, Allaei R, Silverstein KA,et al. A transposon-based genetic screen in mice identifies genes altered in colorectal cancer. Science 2009;323: 17 47. Sukosd F, Kuroda N, Beathe T, et al . Deletion of chromosome 3p14.2-p25 involving the VHL and FHlt genes in conventional renal cell carcinoma. Cancer Res 2003;63:455. T hoenes W, Sterkel St, Rumpelt HJ . Histopathology and classification of renal cell tumors (adenomas, oncocytomas, and carcinomas): the basic cytological and histopathological elements and their use for diagnostics. Path Res Pract 1985;181:125. T hompson M. Polybromo-1: the chromatin targeting subunit of the PBAF complex. Biochimie 2009;91 :309. Toma Ml, Grosser M, Herr A, et al. Loss of heterozygosity and copy number abnormality in clear cell renal cell carcinoma discovered by high-density affymetrix 1 OK single nucleotide polymorphism mapping array. Neoplasia 2008;10:634.
Van den Berg A, Dijkhuizen T, Draaijers T G, et a l . Analysis of multiple renal cell adenomas and carcinomas suggests allelic loss at 3p21 to be a prerequisite for malignant development. Genes Chromosomes Cancer 1997; 19:228. Varela I, Tarpey P, Raine K, et al. Exome sequencing identifies frequent mutation of the SWI/SNF complex gene PBRM1 in renal carcinoma. Nature 2011 ;469:539. Venables J P. Aberrant and alternative splicing in cancer. Cancer Res 2004;64 :7647. Venables J P, Klinck R, Koh C, et al. Cancerassociated regulation of alternative splicing. Nat Struct Mol Biol 2009;16:670. Xia X, Lemieux ME, Li W, et al. Integrative analysis of HIF binding and transactivation reveals its role in maintaining histone methylation homeostasis. Proc Natl Acad Sci U S A 2009;106:4260. Xia W, Nagase S, Mantia AG, et al. BAF180 is a critical regulator of p21 induction and a tumor suppressor mutated in breast cancer. Cancer Res 2008;68:1667. Xie L, Pelz C, Wang W, Bashar A, et al. KDMS B regulates embryonic stem cell self-renewal and represses cryptic intragenic transcription. E MBO J 2011 ;30: 1473. Xie P, Tian C, An L, et al. Histone methyltransferase protein SET D2 interacts with p53 and selectively regulates its downstream genes. Cell Signal 2008;20:1671. Yang J, Ledaki I, Turley H, et al. Role of hypoxia-inducible factors in epigenetic regulation via histone demethylases. Ann NY Acad Sci 2009;1177:185. Yoh SM, Lucas JS, Jones KA. T he lws:Spt6 : CT D complex controls cotranscriptional mRNA biosynthesis and HYPB/Setd2-mediated histone H3K36 methylation. Genes Dev 2008; 22: 3422. Young AP, Schlisio S, Minamishima YA, et al. VHL loss actuates a H IF-independent sensescence programme mediated by Rb and p400. Nature Cell Biology 2008;10:361.
G EN ERAL D I SCUSS ION 1 37


Renal cell carcinoma (RCC) is the most common type of kidney cancer in adults, and accounts for 3% of all new cancers diagnosed in the Western world. Clear cell renal cel l carcinoma (ccRCC) is by far the most prevalent subtype, comprising more than 70% of adult malignant kidney tumors. ccRCC tumor are thought to be derived from the epithelial cel ls of the proximal tubuli (PTECs).
In most cases, ccRCC tumors are still localized at the moment they are found. Surgical removal is the standard of care for these tumors, and offers long-term recurrence-free survival, although for patients who suffer from metastatic disease or develop distant relapse, the scenario is worse. Renal cell carcinomas are resistant to traditional cytotoxic chemotherapy. lmmunotherapy, which has been the most frequently used therapy until recently, has not been satisfactory in most cases either.
Advances in the understanding of ccRCC biology have led to the development of approaches that target pathways that are characteristic and essential for ccRCC tumors, and show superior response rates compared to immunotherapy.
At the genomic level, ccRCC is characterized by a range of copy number alterations, of which loss of the short arm of chromosome 3 is by far the most frequent one. Genomic regions with a high incidence of al lelic loss are thought to harbor so-called tumor suppressor genes (TSGs). The Von Hippe/ Lindau (VHL) gene, located at 3p25, is a known TSG and is bi-allelicely inactivated in a large fraction of ccRCC tumors. However, VHL is not inactivated in all ccRCC tumors, and inactivation of VHL alone does not result in ccRCC development, suggesting that additional and/or alternative genes play a role in ccRCC development.
The identification of novel TSGs was hampered by the omission of methods to screen large numbers of genes in parallel for small (point) mutations. This situation has changed in the last decade. New methods like Gene Identification by nonsensemediated mRNA decay Inhibition (GINI), and, more recently, next-generation sequencing-based approaches, have given us new and powerful tools to identify tumor suppressor genes.
This thesis presents the search for novel ccRCC tumor suppressor genes involved in the development of ccRCC.
In Chapter 1, an overview of the current knowledge regarding the epidemiology, etiology, and genetics of ccRCC is presented.
In Chapter 2, we describe the use of GINI in the search for novel ccRCC tumor suppressor genes. In this method, the NMD pathway, a pathway that degrades mRNA molecules that harbor a premature termination codon (PTC), is pharmacologically inhibited in cell lines. This results in the accumulation of transcripts harboring a PTC. The increased transcript levels of these mRNAs can be detected using gene expression microarrays. The presence of the mutation in this transcript causing the PTC still needs to be identified by Sanger sequencing. We applied a GINI strategy on a panel of ten ccRCC-derived cell lines and combined several methods and criteria to maximize the chances of finding ccRCC tumor suppressor genes and, at the same time, minimize the number of false-positive candidates that hampered the analysis of GINI strategies described earlier. This led to the identification of mutations introducing a premature termination codon in histone methyltransferase gene SETD2,

located at 3p21, in two cell lines. Sequencing of SETD2 in the other cell lines revealed inactivating mutations in three of them. SETD2 is responsible for trimethylation of lysine 36 of histone H3 (H3K36me3). Consistent with this function, we observed a loss or a decrease of H3K36me3 in seven out of the ten ccRCC cell lines. Identification of missense mutations in 2 out of 10 primary ccRCC tumor samples added support to the involvement of loss of SETD2 function in the development of ccRCC tumors.
In Chapter 3, we evaluate the use of GINI in the search for TSGs by using the current knowledge on ccRCC genetics. We show that GINI has some intrinsic limitations. TSGs that code for relatively small proteins and/or have only a limited number of exons appear to have a limited chance on being identified by GINI. Moreover, the succes of the method is dependent on the qual i ty of the used gene expression p latform, and the availability of tumor-derived cell lines.
In Chapter 4, we describe the initial steps that should result in the elucidation of the mechanisms through which SETD2 inactivation contributes to ccRCC development. H3K36me3 has been suggested to have a function in alternative splice site choice. Misregulation of splicing is common in cancer and plays a role in tumor development. We knocked down SETD2 in proximal tubular epithelial cells and indeed observed an apparent change in alternative splicing for a set of genes, several of which are interesting with respect to tumorigenic development. Moreover, a set of genes showed a significant change in transcript level as a result of SETD2 knockdown. The set of downregulated genes showed a significant enrichment for genes that function in angiogenesis-related processes and genes that are involved in the p53-pathway. This is in concordance with the earlier described role of SETD2 in embryonic vascular remodeling and its function in the regulation of a subset of P53 target genes.
The recently developed next-generation sequencing (NGS) technologies make it possible to screen large numbers of genes in parallel for mutations. We continued our search for ccRCC tumor suppressor genes by sequencing all coding regions and exonintron boundaries from the short arm of chromosome 3 in ten primary ccRCC tumors, using targeted exome capturing followed by NGS, as described in chapter 5. This led to the identification of inactivating mutations in PBRM 7 in seven out of ten ccRCC tumors and inactivating mutations in BAP1 and ZNF197 in one tumor each. Moreover, we identified inactivating mutations in PBRM 7 in five out of ten ccRCC-derived cell lines. PBRM 1 is located at 3p21, and encodes BAF180, which is the chromatin targeting subunit of the SWI/SNF nucleosome remodeling complex. SWI/SNF complexes are large ATP-dependent chromatin-remodel ing machines that change the accessibility of DNA by controlling the dynamics of nucleosome occupancy. The observed mutational frequency of PBRM 1 suggests that this is a major ccRCC tumor suppressor gene. Several ccRCC samples show concomitant mutations in VHL and PBRM 1 , suggesting that inactivation of these genes is functionally nonredundant.
Besides protein coding genes, non-coding transcripts, including miRNAs, have a function in the development of several tumor types. In Chapter 6, we compared miRNA transcript levels in ccRCC-derived cell lines with the miRNA levels in normal proximal tubular epithelium, and correlated these transcript levels with copy numbers and transcript levels of predicted targets. Among the significantly downregulated
SUMMARY 141

I
1 42
miRNAs in the ccRCC cell lines were all miRNA-200 family members and miR-205. As a result of loss of the miR-200 family and miR-205, epithelial cells undergo an epithelial-to-mesenchymal transition (EMT), which, in a tu morigenic context, confers a metastatic potential to the cel ls. Th us, our data suggest a role for these m iRNAs in ccRCC progression.
In Chapter 7, the results described in this thesis are discussed. The short arm of chromosome 3 appears to harbor several genes that could contribute to ccRCC development when inactivated. Our data give new insights into the mechanisms that are involved in the development of ccRCC. Several of the mutated genes in ccRCC encode proteins that modify histone tails or remodel chromatin, suggesting that aberrant chromatin regulation is a core driver event in the development of clear cell renal cell carcinoma.


Niercelcarcinoom is het meest voorkomende type nierkanker en neemt zo'n drie procent van alle gevallen van kanker bij volwassenen voor zijn rekening. Verreweg de meeste niercelcarcinomen (meer dan 70 procent) zijn van het "clear cel l " subtype.
Clear cell niercelcarcinomen (ccRCCs) ontstaan uit de epitheelcellen van de proximale tubuli en zijn in de meeste gevallen nog niet uitgezaaid op het moment dat ze worden gevonden. De standaardbehandeling voor een patient met een ccRCC is de chiru rgische verwijdering van de tumor. Voor patienten met een gelokaliseerde tumor biedt deze behandeling langdurige overlevingskansen. Voor patienten die te maken hebben met uitzaaiingen is het scenario echter veel minder gunstig. ccRCCs zijn resistent tegen traditionele chemotherapie. Ook immunotherapie, een behandeling die tot voor kort veel werd toegepast, slaat in de meeste gevallen niet aan. De toegenomen kennis en inzicht in de biologie van ccRCC hebben recentelijk geleid tot de ontwikkeling van behandelingen die aangrijpen op 'pathways' die karakteristiek en essentieel zijn voor ccRCC. Vergeleken met immunotherapie hebben deze gerichte therapieen een veel hogere ' response rate'.
ccRCCs worden genetisch gezien gekenmerkt door een aantal chromosomale veranderingen, waarbij verlies van de korte arm van chromosoom 3 het meest voorkomt. Het veelvu ldige verlies van 3p in ccRCCs is een aanwijz ing voor de aanwezigheid van tumorsuppressor- genen in dit genomische segment. Het Von Hippe/ Lindau (VHL) gen, gelegen op 3p25, is een bekend ccRCC tumorsuppressor-gen en is bi- allelisch ge·,nactiveerd in de meerderheid van ccRCC tumoren. VHL is echter niet in al le ccRCC tumoren ge-,-nactiveerd en inactivatie van VHL alleen leidt niet tot de ontwikkeling van ccRCC tumoren. Vermoedelijk spelen additionele en/ of alternatieve genen dan ook een rol in de ontwikkeling van ccRCC.
De zoektocht naar nieuwe tumorsuppressor- genen werd lang bemoei lijkt door de afwezigheid van methodes waarmee grote aantallen genen tegelijk kunnen worden gescreend voor kleine (punt)mutaties. Deze situatie is het in het laatste decenium veranderd. Methodes zoals gene identification by nonsense-mediated mRNA decay inhibition (GINI) en "next- generation sequencing" technieken hebben ons nieuwe krachtige instrumenten gegeven om tumorsuppressor- genen te identificeren.
In dit proefschrift beschrijven we de zoektocht naar nieuwe tumorsuppressorgenen die betrokken zijn bij de ontwikkeling van ccRCC.
In Hoofdstuk 1 wordt een overzicht gegeven van de huidige kennis betreffende de epidemiologie, etiologie en genetica van ccRCC.
In Hoofdstuk 2 beschrijven we het gebruik van GINI in de zoektocht naar nieuwe ccRCC tumorsuppressor- genen. In deze methode wordt de nonsense- mediated mRNA decay pathway geblokkeerd in cellijnen. Deze pathway ru imt mRNA molecu len die ten gevolge van mutaties een prematuu r stopcodon (PTC) hebben. Uitschakeling van deze pathway resulteert in de ophoping van transcripten met een PTC. De ophoping van deze transcripten kan warden gedetecteerd met behulp van gen-expressie microarrays. Sanger sequencing wordt vervolgens gebruikt om de aanwezigheid van een PTC in de betreffende transcripten aan te tonen.
We hebben een GINI- strategie toegepast op een panel van tien ccRCC- cellijnen. Verschi l lende methodes en criteria werden daarbij toegepast om de kans op het

vinden van nieuwe tumorsuppressor-genen te vergroten en tegelijkertijd het aantal vals- positieve kandidaten te beperken. Dit resulteerde in de identificatie van PTC
introducerende mutaties in het histon- methyltransferase- gen SETD2, gelegen op
3p21, in twee cellijnen . Sequencing van SETD2 in de overige cellijnen resulteerde in de
identificatie van inactiverende mutaties in nog drie cellijnen. SETD2 is verantwoordelijk
voor trimethylering van lysine 36 van histon 3 (H3K36me3). De bevinding dat zeven van de tien ccRCC cellijnen een verlies of in ieder geval een significante afname
van H3 K36me3 laten zien is in lijn met de betrokkenheid van SETD2 functie in de
ontwikkeling van ccRCC. Extra bewijs voor de betrokkenheid van verlies van SETD2-
functie in de ontwikkeling van ccRCC- tumoren werd geleverd door de identificatie van
missense mutaties in SETD2 in twee van de tien gescreende primaire ccRCC- tumoren .
In Hoofdstuk 3 evalueren we het gebruik van GINI in de zoektocht naar
tumorsuppressor- genen . Hierbij hebben we gebruik gemaakt van de huidige kennis
over de genetica van ccRCC. We laten zien dat GINI enkele intrinsieke beperkingen
heeft. Tumorsuppressor- genen d ie coderen voor relatief k leine eiwitten en/ of een beperkt aantal exonen hebben blijken slechts een kleine kans te hebben om
ge·1dentificeerd te warden met behulp van GINI . Daarnaast is de kans op succes
afhankelijk van de kwaliteit van het gebruikte expressie- platform.
In Hoofdstuk 4 beschrijven we de initiele stappen die moeten leiden tot de
ontrafeling van de mechanismes waardoor inactivatie van SETD2 bijdraagt aan de
ontwikkeling van ccRCC. H3 K36me3 is betrokken bij de keuze van alternatieve splice
sites. Misregulatie van splicing komt vaak voor in kanker en speelt een ro l bij tumor
ontwikke l ing. lnactivitatie van SETD2 draagt daarom mogelijk bij aan de ontwikkeling
van ccRCC door een verandering in splicing van targetgenen. Met behulp van siRNA
zorgden wij voor een afname van de hoeveelheid SETD2 in proximale tubulaire
epitheelcellen en observeerden inderdaad een verandering in alternatieve splicing
voor een aantal genen . Verschil lende van deze genen zijn goed te koppelen aan
tumorontwikkeling. Daarnaast laat een aantal genen als gevolg van de afname van
SETD2 een verandering in transcript- niveau zien . De groep downgereguleerde
genen is significant verrijkt voor genen die functioneren in angiogenese- gerelateerde
processen en voor gen en die een rol spelen in de p53 pathway. Dit is in overeenstemming
met de eerder beschreven rol van SETD2 in embryonale vasculaire modellering, en de
rol van SETD2 in de regulatie van een subset van P53 targetgenen.
De recent ontwikkelde "next generation " sequencing (NGS) technieken maken het
mogelijk een groot aantal genen in parallel te screenen voor mutaties . In Hoofdstuk 5 zetten wij onze zoektocht naar nieuwe ccRCC tumorsuppressor- genen voort door a lle coderende regio's en exon-intron grenzen van de korte arm van chromosoom
3 in tien pr imaire ccRCC tumoren te sequencen met behulp van 'targeted exome captur ing' gevolgd door NGS. Dit resulteerde in de identificatie van inactiverende mutaties in PBRM 1 in zeven van de tien ccRCC tumoren, en inactiverende mutaties
in BAP1 en ZNF1 97 ieder in een tumor. Daarnaast identificeerden we inactiverende
mutaties in PBRM 1 in vijf van de tien ccRCC cellijnen. PBRM 1 ligt op 3p21, en codeert
voor BAF 1 80, een onderdeel van het SWI/SNF complex. SWI/SNF- complexen zijn grote AT P- afhankelijke chromatine- modellerende machines d ie de toegankel ijkheid
NEDERLANDSE SA MENVATTING 147

van DNA kunnen be·1nvloeden door de positie van nucleosomen langs het DNA te veranderen. De hoge frequentie van mutaties in PBRM 1 in ccRCC tumoren doet vermoeden dat dit een belangrijk ccRCC tumorsuppressor- gen is.
Behalve genen die coderen voor eiwitten spelen ook niet- coderende transcripten zoals microRNAs een rol in de ontwikkeling van verschillende tumortypes. In Hoofdstuk 6 vergelijken we de mi RNA niveaus in ccRCC- cel l ijnen met de mi RNA niveaus in normaal proximaal tubu lair epitheel , en correleren de hoeveelheid transcripten met het aantal genomische kopieen en de transcript- niveaus van voorspelde mRNA targets. Onder de significant downgereguleerde microRNAs in de ccRCC-cellijnen bevonden zich al le leden van de miR-200 familie en miR-205. Als gevolg van verlies van functie van deze microRNAs ondergaan cel len een zogenaamde epitheel- mesenchym transitie (EMT), wat in een tumorigene context bijdraagt aan het metastatisch potentieel van de eel . De miR-200 familie en miR-205 lijken dus een rol te spelen in de progressie van ccRCC.
In Hoofdstuk 7 worden de resultaten die zijn beschreven in dit proefschrift bediscussieerd. De korte arm van chromosoom 3 blijkt verschillende genen te bevatten die mogelijk een rol spelen bij aan de ontwikkeling van ccRCC. Onze data geven nieuwe inzichten in de mechanismes die betrokken zijn bij de ontwikkeling van ccRCC. Verschi l lende van de gemuteerde genen in ccRCC coderen voor eiwitten die een rol spelen in het modificeren van histonen en het modelleren van chromatin. Een verstoring van de regulatie van chromatine lijkt dan ook een essentie le gebeurtenis in de ontwikkeling van clear cel l renal cell carcinoma.


ACKNOWLEDGEMENTS / DANKWOORD
Dit proefschrift is het resultaat van bijna vier-en-een-half jaar onderzoek aan de afdeling Genetica. Vier-en-een-half jaar lijkt lang, maar, cliche en dus waar: de tijd vliegt en voor je het weet ben je bezig met het schrijven van een dankwoord. Terugkijkend kan ik zeggen dat het een mooie en leerzame periode is geweest. Graag wil ik dan ook de collega's bedanken met wie ik tijdens deze periode te maken heb gehad en die- direct of indirect- een rol hebben gespeeld bij het tot stand komen van dit proefschrift.
Allereerst gaat mijn dank uit naar mijn begeleiders, mijn co-promotores Dr. Klaas Kok en Dr. Eva van den Berg - de Ruiter, en mijn promoter Prof. Dr. Robert M. W. Hofstra.
Klaas, bedankt voor de mogelijkheid om mijn promotie-onderzoek onder jouw begeleiding te kunnen doen. lk heb je manier van begeleiden, met je nuchtere kijk en droge humor, als zeer prettig ervaren. Je hebt me geleerd om zelfstandig onderzoek te doen en je was altijd beschikbaar voor deskundig advies. Het heeft even geduurd voordat we ons eerste echte resultaat hadden, maar ik heb van je geleerd dat geduld en vertrouwen in je eigen data belangrijke eigenschappen zijn om een onderzoek tot een goed einde te kunnen brengen. Uiteraard was het ook een voorrecht om geregeld te kunnen genieten van de gastvrijheid en de kookkunsten van jou en Anke.
Robert, bedankt voor je input in het nierkankerproject. Je duidelijke visie en doortastendheid hebben een belangrijke rol gespeeld bij het tot stand komen van dit proefschrift. Daarbij zijn er volgens mij weinig professoren die op zo'n relaxte manier met hun PhD- studenten omgaan.
Eva, bedankt voor het delen van je kennis, met name op het gebied van de cytogenetica, tijdens onze werkbesprekingen.
I would like to thank the reading committee, formed by Prof. J. M. Nijman, Prof. A. H. M. Geurts van Kessel, and Prof. S. J. M. Jones, for their willingness to read my thesis and for giving their approval for the defense.
Inge, na een half jaar kwam jij als analist onze (zeer) k leine "nierkankergroep" versterken. lk heb vanaf het begin met erg veel plezier met je samengewerkt. Je inzet, betrokkenheid en goede praktische werk waren cruciaal voor het tot stand komen van het SETD2 paper, en daarmee het hele proefschrift. Een bedankje is hier dus zeer op zijn plaats. Dat je de afdeling "voortijdig" verliet om met aardappels aan de slag te gaan spijtte zowel ons als jouzelf: een goed teken lijkt mij.
Jantine, jij ging daarna als analist aan de slag op het ChlPseq-project. Na een paar jaar ltalie weer terug in het lab en in Stad. Het moet even wennen zijn geweest, maar daar heb ik vrij weinig van gemerkt. Vanaf het begin leek het je vanzelf te gaan en kwamen er mooie resultaten. Dat je daarnaast ook zeer plezierig in de omgang bent maakt je een erg fijne collega om mee samen te werken.
De studenten die stage hebben gelopen op het project: bedankt voor al jullie werk en inzet. Matthijs voor het toepassen van GINI op longtumor-cellijnen, Harrie voor het onderzoeken van verschillende histon- modificaties in niertumoren, Cor en Angela voor het sequencen van tumorsamples.

De wekelijkse oncogenetica-werkbesprekingen op woensdagochtend waren, met
naast onze "nierkankergroep" onder andere Helga, Renee, Rolf, Jan O en Robert, erg
nuttig en bovendien gezellig.
Gerard te Meerman, bedankt voor de nuttige en bij vlagen onnavolgbare
uiteenzettingen over statistiek en next- generation sequencing.
Anke van den Berg, bedankt voor onder andere het bediscussieren van onze
miRNA- data en je bijdrage aan de miRNA- paper. Andere mensen van de afdeling
Pathologie & Medische Biologie die ik wil bedanken voor hun bijdrage aan verschillende
hoofdstukken van dit proefschrift: Harry Hollema, Joost Kluiver, Harry van Goor, Lydia
Visser, Nancy Halsema en Geert Harms.
Professor Steven M Jones, thank you for the opportunity to visit the Genome
Sciences Centre in Vancouver. Ann, Nina and Misha, thanks for your great help with
analyzing our Ch IP-seq and RNA-seq data. Misha, it was great to visit Vancouver Island
with you and Elize.
De heren van Bioke/ Cell Signaling Technology: Koos Kranenborg, Bryan Ricketts,
Robert Akkers en Fons Elstrodt, bedankt voor jullie enthousiaste hulp bij het opzetten
van de ChlPseq-experimenten en het beschikbaar stellen van materiaal. Jackie, bedankt voor het snelle en zorgvuldige "editen" van dit proefschrift en
verschillende andere manuscripten.
Het secretariaat (Mentje, Ria, Joke, H elene en Bote), Marina en Edwin: bedankt
voor jullie hulp bij allerhande adminstratieve, financiele en computertechnische zaken.
My roommates: Anna, Ana, Peter, Annemieke, Jorieke, Justyna, Helga, Karin,
Tjakko, Jihane, and Jinghua, thank you for the great atmosphere at our room!
Helga, als enige "postdoc" op onze kamer was je, wellicht tot vervelens toe, een
dankbare vraagbaak. Je droge sarcastische opmerkingen waren zeer vermakelijk.
Anna, het was leuk om te zien hoe snel en op welke manier je je het Nederlands
eigen maakte, dat werd gewaardeerd!
Peter, jij was als enige andere man op de kamer en sportkenner bij uitstek (wat ook
van pas kwam bij het pubquizzen) een ideale gesprekspartner.
Karin, ik heb veel met je gelachen, mede dankzij jouw directheid en je bijnaam
schiep natuurlijk meteen een band. Ondanks dat ik je nooit heb zien voetballen weet
ik dat je een uitstekende tackle in de benen hebt.
Annemieke, ik heb genoten van je vrolijke gezelschap, je betrokkenheid en je humor.
Je bevlogenheid in je werk was mooi om te zien. Fijn dat je mijn paranimf wilt zijn!
Verder zorgden de verschillende "vaste bewoners" van het lab ervoor dat het
ook daar goed vertoeven was: Paul J, Ron, Krista, Mathieu, Ludolf, Monique, Karen,
Soesma, Astrid, DJ Miguel en Rutger, bedankt voor de gezelligheid op het lab, jullie
hulp, en verschillende hilarische momenten. Jan, bedankt voor je hulp bij onder andere
het Sanger- sequencen. De mensen van de "genome analysis facility": Mariska, Jelkje,
Bahram en Pieter, die ook passen in bovengenoemd rijtje, wil ik graag bedanken voor
de prettige samenwerking en hun praktische bijdrage aan de verschillende "next
generation-sequencing" projecten beschreven in dit proefschrift.
Rest mij nog een aantal collega's van de afdeling te bedanken die nog niet
genoemd zijn, maar die hebben bijgedragen aan een mooie tijd, zowel op als naast
ACKNOWLEDGEMENTS/ DANKWOO RD 1 53

het werk: Christine, Yunia, Eva, Renee, Paul vd Z, Maria, Olga, Duco, Barbara, Suzanne, Agata, Gosia, Mats, Rodrigo, Asia, Dineke, Celine, Cleo, Ellen, Noortje, Mitja. Thank you for a pleasant time!
lvo, bedankt voor je bereidheid om- last minute- een mooie omslag voor dit proefschrift te ontwerpen.
Willem, we kennen elkaar van jongsaf aan, en vanaf het moment dat we elf jaar geleden beiden in Groningen gingen studeren zijn we beste vrienden. Wat mij betreft dan ook logisch dat jij mijn paranimf bent.
Verder wil ik zoals het betaamt in een dergelijk dankwoord als laatste mijn vrienden en familie bedanken, in het bijzonder mijn lieve zus, zwager en zusje: Hi lde en Michel (vanuit Ethiopie) en Renske (vanuit waar dan ook ter wereld, maar recentelijk zowaar NL) en mijn l ieve ouders: bedankt voor jullie altijd aanwezige steun en belangstelling!
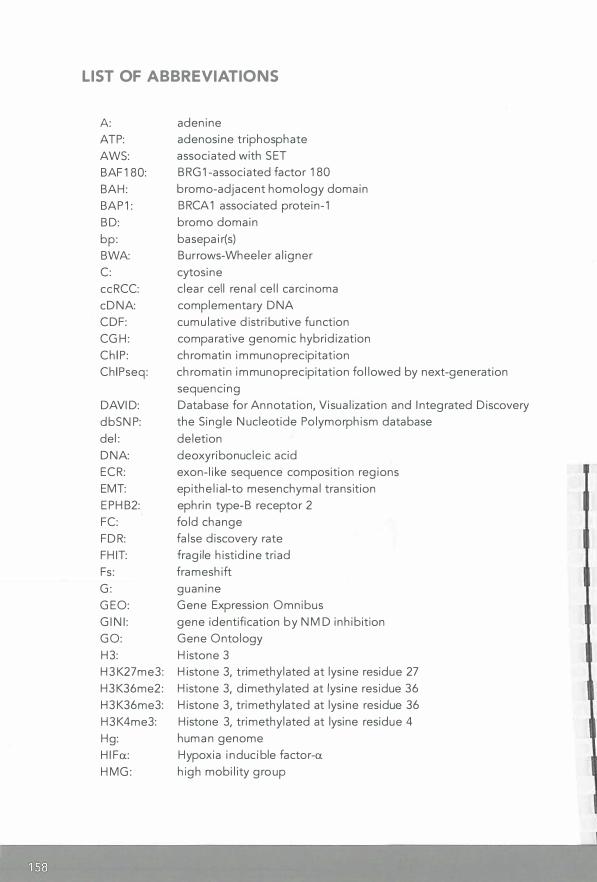
LIST OF ABBREVIATIONS
A: ATP: AWS: BAF180: BAH: BAP1: BD: bp: BWA: C: ccRCC: cDNA: CDF: CGH: ChlP: ChlPseq:
DAVID: dbSNP: del : DNA: ECR: EMT: EPHB2: FC: FDR: FHIT: Fs: G: GEO: GINI: GO: H3: H3K27me3: H3K36me2: H3K36me3: H3K4me3: Hg: HIFa: HMG:
adenine adenosine triphosphate associated with SET BRG 1-associated factor 180 bromo-adjacent homology domain BRCA 1 associated protein-1 bromo domain basepair(s) Burrows-Wheeler aligner cytosine clear cell renal cell carcinoma complementary DNA cumulative distributive function comparative genomic hybridization chromatin immunoprecipitation chromatin immunoprecipitation followed by next-generation sequencing Database for Annotation, Visualization and Integrated Discovery the Single Nucleotide Polymorphism database deletion deoxyribonucleic acid exon-like sequence composition regions epithelial-to mesenchymal transition ephrin type-B receptor 2 fold change false discovery rate fragile histidine triad frameshift guanine Gene Expression Omnibus gene identification by NMD inhibition Gene Ontology Histone 3 Histone 3, trimethylated at lysine residue 27 Histone 3, dimethylated at lysine residue 36 Histone 3, trimethylated at lysine residue 36 Histone 3, trimethylated at lysine residue 4 human genome Hypoxia inducible factor-a high mobility group

IGV: Ins: IP: Kb: KD: KEGG: LOH: Mb: MLH1: mRNA: miRNA: MRG15: mTOR: NCBI: NGS: NMD: PBRM1: PCR: PDGF: Pl3K: PTB: PTC: PTEC: Pter: RASSF1: RCC: RefSeq: RNAPOLIIA: RNA: RNAseq: RPKM: RT: RT-PCR: SET: SETD2: siRNA: SWI/SNF: T: TSG: TSS: UCSC: UTR: VEGF:
Integrative Genomics Viewer insertion interaction with RNAPOLIIA kilobases knock down Kyoto Encyclopedia of Genes and Genomes loss of heterozygosity mega bases mutl homolog 1 messenger RNA microRNA MORF-related gene 15 mammalian target of rapamycin National Center for Biotechnology Information next-generation sequencing nonsense-mediated mRNA decay Polybromo 1 polymerase chain reaction platelet derived growth factor phosphatidylinositol 3-kinase polypyrimidine tract binding protein premature termination codon proximal tubular epithelial cell terminal end of the short arm of the chromosome ras association (RalGDS/AF-6) domain family member 1 renal cell carcinoma Reference Sequence RNA polymerase 2A ribonucleic acid transcriptome profiling using next-generation sequencing reads per kilobase per million mapped reads room temperature real-time polymerase chain reaction suppressor of variegation , enhancer of zeste and thrithorax SET domain containing 2 small inhibiting RNA switch/ sucrose nonfermentable thymine tumor suppressor gene transcription start site University of California, Santa Cruz untranslated region vascular endothelial growth factor
LIST OF ABBREVIATIONS 159

VH L: WHO: WT: ZN F1 97 :
1 60
Von H ippe! Lindau World Hea lth Organ ization wi ld-type zinc finger protein 1 97
11 01 f��· -.
Copyright © 2022 FDOKUMEN