Coordination of Growth and Cell Division in the Drosophila Wing
11
Cell, Vol. 93, 1183–1193, June 26, 1998, Copyright 1998 by Cell Press Coordination of Growth and Cell Division in the Drosophila Wing vertebrate regulators that are thought to function specif- ically in cell cycle control have also been implicated in growth control (Sherr, 1996). An interesting case is the Thomas P. Neufeld, Aida Flor A. de la Cruz, Laura A. Johnston, and Bruce A. Edgar* Division of Basic Sciences retinoblastoma tumor suppressor (pRB), which is be- Fred Hutchinson Cancer Research Center lieved to function as a cell cycle inhibitor. Recent studies 1100 Fairview Avenue North show that pRB can throttle RNA pol I and pol III transcrip- Seattle, Washington 98109 tion (Cavanaugh et al., 1995; White et al., 1996) and that cells lacking pRB will proliferate at doses of cyclohexi- mide which arrest control cells (Herrera et al., 1996). Summary This suggests that pRB might directly suppress growth by reducing a cell’s protein synthetic capacity and thus In most tissues, cell division is coordinated with in- affect cell cycle progression only indirectly. If this were creases in mass (i.e., growth). To understand this coor- true the various factors that interact with pRB—Cyclins dination, we altered rates of division in cell clones or D and E, CDKs 2, 4, and 6, the E2F transcription factors, compartments of the Drosophila wing and measured and the CDK inhibitor p16—would also be expected the effects on growth. Constitutive overproduction of to affect general biosynthesis. This might explain why the transcriptional regulator dE2F increased expres- mutations in these genes are so frequently associated sion of the S- and M-phase initiators Cyclin E and with cellular transformation and carcinogenesis. Alter- String (Cdc25), thereby accelerating cell proliferation. natively, these molecules might be integral parts of a Loss of dE2F or overproduction of its corepressor, mechanism that senses growth and regulates the ac- RBF, retarded cell proliferation. These manipulations tivity of cell cycle control genes accordingly (Rosen- altered cell numbers over a 4- to 5-fold range but had wald et al., 1995; Aktas et al., 1997; Leone et al., 1997; little effect on clone or compartment sizes. Instead, Peeper et al., 1997). Studies in cell culture seem to changes in cell division rates were offset by changes support this latter possibility (Ohtsubo and Roberts, in cell size. We infer that dE2F and RBF function specif- 1993; Quelle et al., 1993; Reznitsky et al., 1994; Franch ically in cell cycle control, and that cell cycle accelera- et al., 1995), but since the effects of these regulators tion is insufficient to stimulate growth. Variations in on increases in mass are rarely measured, this issue dE2F activity could be used to coordinate cell division remains unresolved. with growth. Here, we address these issues in the developing wing of Drosophila melanogaster. The wing originates from Introduction an embryonic primordium of about 50 cells, which are organized into an epithelial “disc.” These cells prolifer- Most cells double their mass during each division cycle, ate exponentially in the larva, roughly double their mass maintaining a roughly constant size as they proliferate during each 10–12 hr cycle, and reach about 50,000 (Mitchison, 1971). Yet, it remains unclear how the bio- in number before they differentiate (Garcı´a-Bellido and Merriam, 1971; Madhavan and Schneiderman, 1977). As synthesis that constitutes growth is coordinated with in vertebrate development, cell proliferation in the wing cell cycle controls. A paradigm for approaching this is directed by region-specific, secreted signals that act problem arose from studies pioneered in yeast by Hart- through the WG/WNT, DPP/BMP, VN/EGF, Notch, and well (1971) and Nurse et al. (1976), who identified cell Hedgehog pathways (Zecca et al., 1995, Burke and proliferation mutants of two general classes. One type Basler, 1996; Doherty et al, 1996; Lecuit et al., 1996; of mutant blocked cell cycle progression while allowing Schnepp et al., 1996; Karim and Rubin, 1998; see Ser- cell growth to continue, and the other arrested cell rano and O’Farrell, 1997, for review). Paradoxically, al- growth and division coordinately. Mutations in this first though wing growth is driven by spatially patterned sig- class are now known to affect cell cycle control, whereas nals, cell proliferation occurs ubiquitously during the those in the second class generally affect biosynthesis. growth phase, with little obvious patterning (Garcı ´a-Bel- The distinct phenotypes of these mutants highlight the lido and Merriam, 1971; Gonza ´ lez-Gaita ´ n et al., 1994; fact that in yeast, cell cycle progression and cell growth Mila ´ n et al., 1996a, 1996b). The lack of concordance are separable processes which are normally coupled, between signaling and proliferation patterns suggests and that growth is dominant and rate-limiting (Johnston that their connection is probably indirect. Perhaps cell et al., 1977). signaling modulates growth, and growth rates are moni- Despite its simplicity, confirmation of this paradigm tored by an intermediary mechanism that regulates the has been slow in higher eukaryotes. There are examples activity of cell cycle control genes to match (Bryant, in metazoans of specific cell cycle alterations that un- 1996; Edgar and Lehner, 1996). couple growth from division, resulting in altered cell size As noted above, two candidate players in this growth (Franch et al., 1995; Hemerly et al., 1995; Sheikh et al., monitoring mechanism are the dE2F transcription factor 1995; Fero et al., 1996; Kipreos et al. 1996; Weigmann and its corepressor RBF, a fly homolog of pRB (Dynlacht et al., 1997). This suggests that the dominance of growth et al., 1994; Ohtani and Nevins, 1994; Du et al., 1996b). over cell cycle controls is conserved. However, several E2F activates genes required for S phase in both Dro- sophila and vertebrates and promotes cell cycle pro- gression in diverse cell types (Johnson et al., 1993; * To whom correspondence should be addressed.
-
Upload
independent -
Category
Documents
-
view
1 -
download
0
Transcript of Coordination of Growth and Cell Division in the Drosophila Wing
Cell, Vol. 93, 1183–1193, June 26, 1998, Copyright 1998 by Cell Press
Coordination of Growth and Cell Divisionin the Drosophila Wing
vertebrate regulators that are thought to function specif-ically in cell cycle control have also been implicated ingrowth control (Sherr, 1996). An interesting case is the
Thomas P. Neufeld, Aida Flor A. de la Cruz,Laura A. Johnston, and Bruce A. Edgar*Division of Basic Sciences
retinoblastoma tumor suppressor (pRB), which is be-Fred Hutchinson Cancer Research Centerlieved to function as a cell cycle inhibitor. Recent studies1100 Fairview Avenue Northshow that pRB can throttle RNA pol Iand pol III transcrip-Seattle, Washington 98109tion (Cavanaugh et al., 1995; White et al., 1996) and thatcells lacking pRB will proliferate at doses of cyclohexi-mide which arrest control cells (Herrera et al., 1996).SummaryThis suggests that pRB might directly suppress growthby reducing a cell’s protein synthetic capacity and thusIn most tissues, cell division is coordinated with in-affect cell cycle progression only indirectly. If this werecreases in mass (i.e., growth).To understandthis coor-true the various factors that interact with pRB—Cyclinsdination, we altered rates of division in cell clones orD and E, CDKs 2, 4, and 6, the E2F transcription factors,compartments of the Drosophila wing and measuredand the CDK inhibitor p16—would also be expectedthe effects on growth. Constitutive overproduction ofto affect general biosynthesis. This might explain whythe transcriptional regulator dE2F increased expres-mutations in these genes are so frequently associatedsion of the S- and M-phase initiators Cyclin E andwith cellular transformation and carcinogenesis. Alter-String (Cdc25), thereby accelerating cell proliferation.natively, these molecules might be integral parts of a
Loss of dE2F or overproduction of its corepressor,mechanism that senses growth and regulates the ac-
RBF, retarded cell proliferation. These manipulations tivity of cell cycle control genes accordingly (Rosen-altered cell numbers over a 4- to 5-fold range but had wald et al., 1995; Aktas et al., 1997; Leone et al., 1997;little effect on clone or compartment sizes. Instead, Peeper et al., 1997). Studies in cell culture seem tochanges in cell division rates were offset by changes support this latter possibility (Ohtsubo and Roberts,in cell size. We infer that dE2Fand RBF function specif- 1993; Quelle et al., 1993; Reznitsky et al., 1994; Franchically in cell cycle control, and that cell cycle accelera- et al., 1995), but since the effects of these regulatorstion is insufficient to stimulate growth. Variations in on increases in mass are rarely measured, this issuedE2F activity could be used to coordinate cell division remains unresolved.with growth. Here, we address these issues in the developing wing
of Drosophila melanogaster. The wing originates fromIntroduction an embryonic primordium of about 50 cells, which are
organized into an epithelial “disc.” These cells prolifer-Most cells double their mass during each division cycle, ate exponentially in the larva, roughly double their massmaintaining a roughly constant size as they proliferate during each 10–12 hr cycle, and reach about 50,000(Mitchison, 1971). Yet, it remains unclear how the bio- in number before they differentiate (Garcıa-Bellido and
Merriam, 1971; Madhavan and Schneiderman, 1977). Assynthesis that constitutes growth is coordinated within vertebrate development, cell proliferation in the wingcell cycle controls. A paradigm for approaching thisis directed by region-specific, secreted signals that actproblem arose from studies pioneered in yeast by Hart-through the WG/WNT, DPP/BMP, VN/EGF, Notch, andwell (1971) and Nurse et al. (1976), who identified cellHedgehog pathways (Zecca et al., 1995, Burke andproliferation mutants of two general classes. One typeBasler, 1996; Doherty et al, 1996; Lecuit et al., 1996;of mutant blocked cell cycle progression while allowingSchnepp et al., 1996; Karim and Rubin, 1998; see Ser-cell growth to continue, and the other arrested cellrano and O’Farrell, 1997, for review). Paradoxically, al-growth and division coordinately. Mutations in this firstthough wing growth is driven by spatially patterned sig-class are now knownto affect cellcycle control, whereasnals, cell proliferation occurs ubiquitously during thethose in the second class generally affect biosynthesis.growth phase, with little obvious patterning (Garcıa-Bel-The distinct phenotypes of these mutants highlight thelido and Merriam, 1971; Gonzalez-Gaitan et al., 1994;fact that in yeast, cell cycle progression and cell growthMilan et al., 1996a, 1996b). The lack of concordanceare separable processes which are normally coupled,between signaling and proliferation patterns suggestsand that growth is dominant and rate-limiting (Johnstonthat their connection is probably indirect. Perhaps cellet al., 1977).signaling modulates growth, and growth rates are moni-Despite its simplicity, confirmation of this paradigmtored by an intermediary mechanism that regulates the
has been slow in higher eukaryotes. There are examplesactivity of cell cycle control genes to match (Bryant,
in metazoans of specific cell cycle alterations that un-1996; Edgar and Lehner, 1996).
couple growth from division, resulting in altered cell size As noted above, two candidate players in this growth(Franch et al., 1995; Hemerly et al., 1995; Sheikh et al., monitoring mechanism are the dE2F transcription factor1995; Fero et al., 1996; Kipreos et al. 1996; Weigmann and its corepressor RBF, a fly homolog of pRB (Dynlachtet al., 1997). This suggests that the dominanceof growth et al., 1994; Ohtani and Nevins, 1994; Du et al., 1996b).over cell cycle controls is conserved. However, several E2F activates genes required for S phase in both Dro-
sophila and vertebrates and promotes cell cycle pro-gression in diverse cell types (Johnson et al., 1993;*To whom correspondence should be addressed.
Cell1184
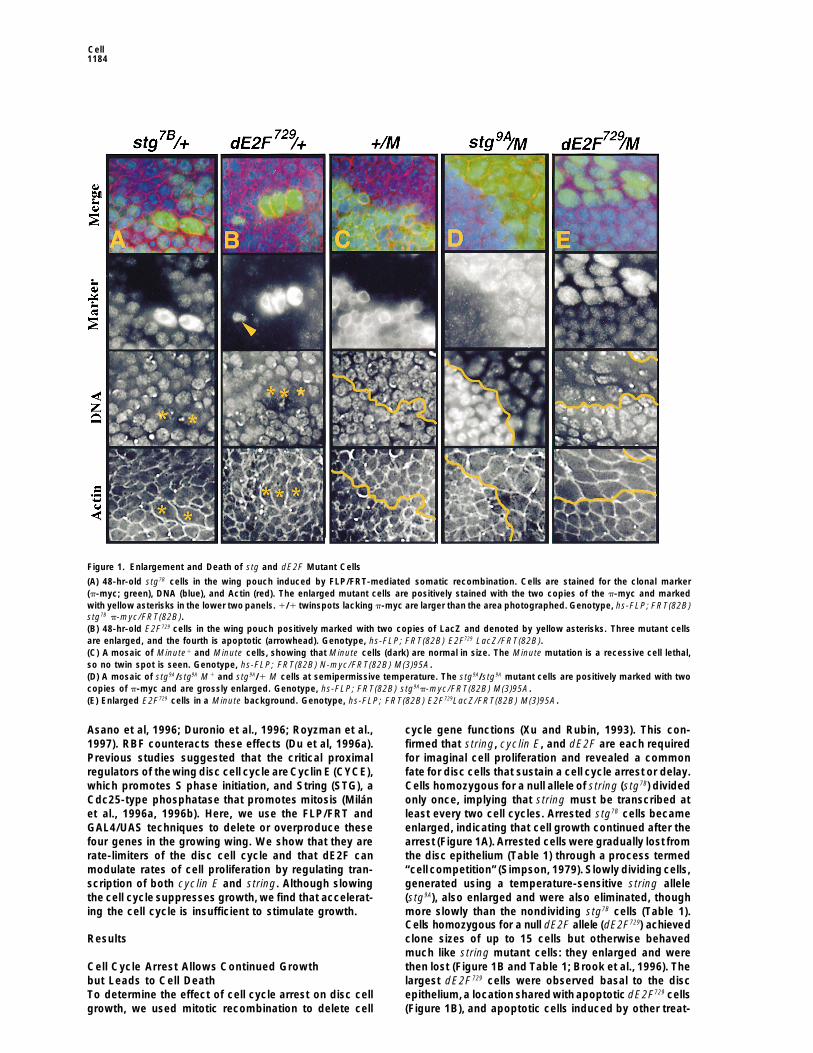
Figure 1. Enlargement and Death of stg and dE2F Mutant Cells
(A) 48-hr-old stg7B cells in the wing pouch induced by FLP/FRT-mediated somatic recombination. Cells are stained for the clonal marker(p-myc; green), DNA (blue), and Actin (red). The enlarged mutant cells are positively stained with the two copies of the p-myc and markedwith yellow asterisks in the lower two panels. 1/1 twinspots lacking p-myc are larger than the area photographed. Genotype, hs-FLP; FRT(82B)stg7B p-myc/FRT(82B).(B) 48-hr-old E2F729 cells in the wing pouch positively marked with two copies of LacZ and denoted by yellow asterisks. Three mutant cellsare enlarged, and the fourth is apoptotic (arrowhead). Genotype, hs-FLP; FRT(82B) E2F729 LacZ/FRT(82B).(C) A mosaic of Minute1 and Minute cells, showing that Minute cells (dark) are normal in size. The Minute mutation is a recessive cell lethal,so no twin spot is seen. Genotype, hs-FLP; FRT(82B) N-myc/FRT(82B) M(3)95A.(D) A mosaic of stg9A/stg9A M1 and stg9A/1 M cells at semipermissive temperature. The stg9A/stg9A mutant cells are positively marked with twocopies of p-myc and are grossly enlarged. Genotype, hs-FLP; FRT(82B) stg9Ap-myc/FRT(82B) M(3)95A.(E) Enlarged E2F729 cells in a Minute background. Genotype, hs-FLP; FRT(82B) E2F729LacZ/FRT(82B) M(3)95A.
Asano et al, 1996; Duronio et al., 1996; Royzman et al., cycle gene functions (Xu and Rubin, 1993). This con-firmed that string, cyclin E, and dE2F are each required1997). RBF counteracts these effects (Du et al, 1996a).
Previous studies suggested that the critical proximal for imaginal cell proliferation and revealed a commonfate for disc cells that sustain a cell cycle arrest or delay.regulators of thewing disc cell cycle areCyclin E (CYCE),
which promotes S phase initiation, and String (STG), a Cells homozygous for a null allele of string (stg7B) dividedonly once, implying that string must be transcribed atCdc25-type phosphatase that promotes mitosis (Milan
et al., 1996a, 1996b). Here, we use the FLP/FRT and least every two cell cycles. Arrested stg7B cells becameenlarged, indicating that cell growth continued after theGAL4/UAS techniques to delete or overproduce these
four genes in the growing wing. We show that they are arrest (Figure 1A). Arrested cellswere gradually lost fromthe disc epithelium (Table 1) through a process termedrate-limiters of the disc cell cycle and that dE2F can
modulate rates of cell proliferation by regulating tran- “cell competition” (Simpson, 1979). Slowly dividing cells,generated using a temperature-sensitive string allelescription of both cyclin E and string. Although slowing
the cell cycle suppresses growth, we find that accelerat- (stg9A), also enlarged and were also eliminated, thoughmore slowly than the nondividing stg7B cells (Table 1).ing the cell cycle is insufficient to stimulate growth.Cells homozygous for a null dE2F allele (dE2F729) achievedclone sizes of up to 15 cells but otherwise behavedResultsmuch like string mutant cells: they enlarged and werethen lost (Figure 1B and Table 1; Brook et al., 1996). TheCell Cycle Arrest Allows Continued Growth
but Leads to Cell Death largest dE2F729 cells were observed basal to the discepithelium,a location shared with apoptotic dE2F729 cellsTo determine the effect of cell cycle arrest on disc cell
growth, we used mitotic recombination to delete cell (Figure 1B), and apoptotic cells induced by other treat-
Imaginal Disc Cell Cycles1185
Table 1. Elimination of Arrested or Slowly Dividing Mutant Cells;Percent Surviving Mutant Clones
dE2F729 stg7B stg9A stg9A stg9A
PHS (null) (null) (ts; 308) (ts; 238) (ts; 188)(hr) % (N) % (N) % (N) % (N) % (N)
24 hr 94 (52) 74 (39) 34 (115) 56 (126) 81 (81)48 hr 62 (83) 6 (33) 4 (106) 15 (109) 75 (93)72 hr 5 (38) 0 (15) 1 (73) 2 (88) 36 (104)
The gradual elimination of E2F729, stg7B, and temperature-sensitivestg9A cells at various temperatures. The frequencies of 1/1 clones(twinspots) with and without associated mutant cell clones weretallied. Values displayed are percentages representing the frequen-cies of surviving mutant clones 24, 48, or 72 hr after clone induction(Number of mutant clones paired with 1/1 clones/Total 1/1clones 3 100). (N) represents number of clones scored.
ments (Figure 4E). These observations suggest a pro-gression in which cells experiencing cell cycle arrestcontinue to grow,are displaced from thedisc epithelium,and finally undergo apoptosis. This fatemay be commonto all cells that sustain an inappropriate cell cycle arrestin the disc, since cells homozygous for null alleles ofcdc2 (B47) or cyclin E (AR95) also produced clones of2–4 cells, which enlarged and then died (data notshown). Although cell growth continued after cell cyclearrest, clones of arrested cells produced far less tissuemass than their wild-type sister clones (twinspots). This
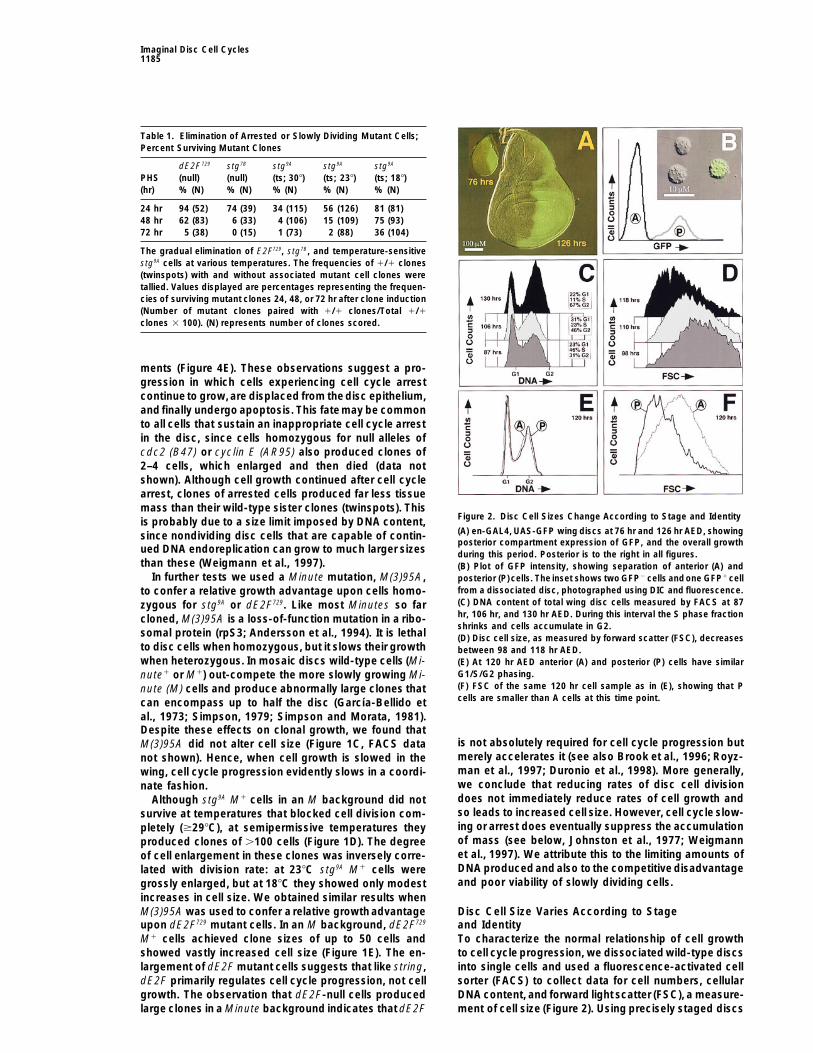
Figure 2. Disc Cell Sizes Change According to Stage and Identityis probably due to a size limit imposed by DNA content,(A) en-GAL4, UAS-GFP wing discs at 76 hr and 126 hr AED, showingsince nondividing disc cells that are capable of contin-posterior compartment expression of GFP, and the overall growth
ued DNA endoreplication can grow to much larger sizes during this period. Posterior is to the right in all figures.than these (Weigmann et al., 1997). (B) Plot of GFP intensity, showing separation of anterior (A) and
In further tests we used a Minute mutation, M(3)95A, posterior (P) cells. The inset shows two GFP2 cells andone GFP1 cellfrom a dissociated disc, photographed using DIC and fluorescence.to confer a relative growth advantage upon cells homo-(C) DNA content of total wing disc cells measured by FACS at 87zygous for stg9A or dE2F729. Like most Minutes so farhr, 106 hr, and 130 hr AED. During this interval the S phase fractioncloned, M(3)95A is a loss-of-function mutation in a ribo-shrinks and cells accumulate in G2.
somal protein (rpS3; Andersson et al., 1994). It is lethal (D) Disc cell size, as measured by forward scatter (FSC), decreasesto disc cells when homozygous, but it slows their growth between 98 and 118 hr AED.when heterozygous. In mosaic discs wild-type cells (Mi- (E) At 120 hr AED anterior (A) and posterior (P) cells have similar
G1/S/G2 phasing.nute1 or M1) out-compete the more slowly growing Mi-(F) FSC of the same 120 hr cell sample as in (E), showing that Pnute (M) cells and produce abnormally large clones thatcells are smaller than A cells at this time point.can encompass up to half the disc (Garcıa-Bellido et
al., 1973; Simpson, 1979; Simpson and Morata, 1981).Despite these effects on clonal growth, we found that
is not absolutely required for cell cycle progression butM(3)95A did not alter cell size (Figure 1C, FACS datamerely accelerates it (see also Brook et al., 1996; Royz-not shown). Hence, when cell growth is slowed in theman et al., 1997; Duronio et al., 1998). More generally,wing, cell cycle progression evidently slows in a coordi-we conclude that reducing rates of disc cell divisionnate fashion.does not immediately reduce rates of cell growth andAlthough stg9A M1 cells in an M background did notso leads to increased cell size. However, cell cycle slow-survive at temperatures that blocked cell division com-ing or arrest does eventually suppress the accumulationpletely ($298C), at semipermissive temperatures theyof mass (see below, Johnston et al., 1977; Weigmannproduced clones of .100 cells (Figure 1D). The degreeet al., 1997). We attribute this to the limiting amounts ofof cell enlargement in these clones was inversely corre-DNA produced and also to the competitive disadvantagelated with division rate: at 238C stg9A M1 cells wereand poor viability of slowly dividing cells.grossly enlarged, but at 188C they showed only modest
increases in cell size. We obtained similar results whenM(3)95A was used to confer a relative growth advantage Disc Cell Size Varies According to Stage
and Identityupon dE2F729 mutant cells. In an M background, dE2F729
M1 cells achieved clone sizes of up to 50 cells and To characterize the normal relationship of cell growthto cell cycle progression, we dissociated wild-type discsshowed vastly increased cell size (Figure 1E). The en-
largement of dE2F mutant cells suggests that like string, into single cells and used a fluorescence-activated cellsorter (FACS) to collect data for cell numbers, cellulardE2F primarily regulates cell cycle progression, not cell
growth. The observation that dE2F-null cells produced DNA content, and forward light scatter (FSC), a measure-ment of cell size (Figure 2). Using precisely staged discslarge clones in a Minute background indicates that dE2F
Cell1186
(P) cells. At early time points P cells were larger than Acells, but they divided more rapidly than A cells (Garcıa-Bellido and Merriam, 1971; D. Prober and B. A. E, unpub-lished data) and eventually became smaller (Figure 2F).Interestingly, the proportions of G1, S, and G2 in A andP cell populations remained indistinguishable despitetheir differing cell sizes and division rates (Figures 2Eand 3). This suggests that cell growth rates are inte-grated with division rates throughout the cycle, ratherthan at a single control point such as the G1/S transition.More generally, these observations show that rates ofcell division and cell growth are only loosely coupledand vary independently according to developmentalstage and the spatial position of cells within the disc.
Targeted Overexpression of Cell Cycle RegulatorsWe used two techniques to overexpress cell cycle regu-lators in the disc. The first technique employed the pos-terior-specific en-GAL4 “driver” to coactivate expres-sion of UAS-linkedcell cycle genes along with UAS-GFP.Since en-GAL4 expresses continuously from the earlieststages of disc formation until maturation of the wing,this allowed us to study the effects of changes in steady-state levels of target gene expression in a defined cellpopulation over as many as ten cell cycles (Figure 3).Our second approach utilized the “flip-out” GAL4 driver(Act.GAL4) to coactivate permanent, heritable expres-sion of UAS-linked targets in random clones of cells.This technique employs heat-shock induction of the FLPrecombinase to fuse an Actin 5c promoter to GAL4,generating random clones of GAL4 expressing cells ata precisely defined time point (Pignoni and Zipursky,1997). At set intervals after inducing HS-FLP, we countedthe number of GFP-positive cells per clone (Figure 3)and measured the area of epithelium they occupied (Fig-ure 7). This enabled us to determine in vivo rates of cell
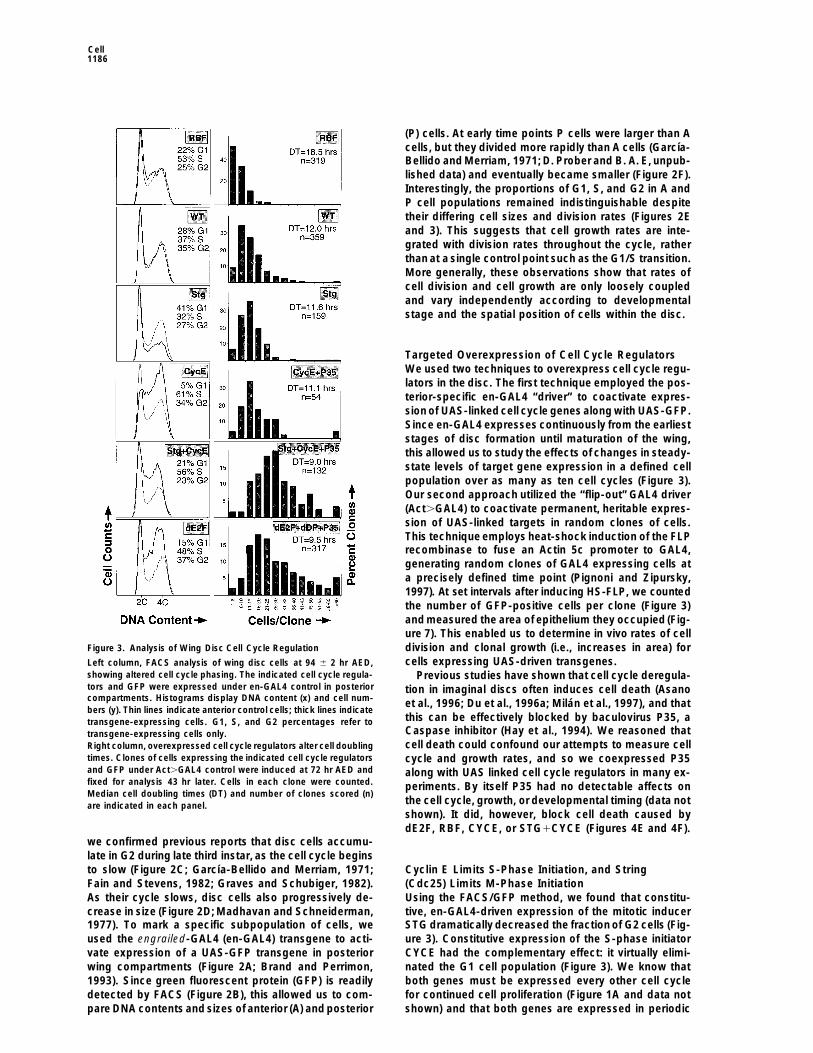
Figure 3. Analysis of Wing Disc Cell Cycle Regulation division and clonal growth (i.e., increases in area) forcells expressing UAS-driven transgenes.Left column, FACS analysis of wing disc cells at 94 6 2 hr AED,
showing altered cell cycle phasing. The indicated cell cycle regula- Previous studies have shown that cell cycle deregula-tors and GFP were expressed under en-GAL4 control in posterior tion in imaginal discs often induces cell death (Asanocompartments. Histograms display DNA content (x) and cell num- et al., 1996; Du et al., 1996a; Milan et al., 1997), and thatbers (y). Thin lines indicate anterior control cells; thick lines indicate
this can be effectively blocked by baculovirus P35, atransgene-expressing cells. G1, S, and G2 percentages refer toCaspase inhibitor (Hay et al., 1994). We reasoned thattransgene-expressing cells only.cell death could confound our attempts to measure cellRight column, overexpressed cell cycle regulators alter cell doubling
times. Clones of cells expressing the indicated cell cycle regulators cycle and growth rates, and so we coexpressed P35and GFP under Act.GAL4 control were induced at 72 hr AED and along with UAS linked cell cycle regulators in many ex-fixed for analysis 43 hr later. Cells in each clone were counted. periments. By itself P35 had no detectable affects onMedian cell doubling times (DT) and number of clones scored (n)
the cell cycle, growth, or developmental timing (data notare indicated in each panel.shown). It did, however, block cell death caused bydE2F, RBF, CYCE, or STG1CYCE (Figures 4E and 4F).
we confirmed previous reports that disc cells accumu-late in G2 during late third instar, as the cell cycle beginsto slow (Figure 2C; Garcıa-Bellido and Merriam, 1971; Cyclin E Limits S-Phase Initiation, and String
(Cdc25) Limits M-Phase InitiationFain and Stevens, 1982; Graves and Schubiger, 1982).As their cycle slows, disc cells also progressively de- Using the FACS/GFP method, we found that constitu-
tive, en-GAL4-driven expression of the mitotic inducercrease in size (Figure 2D; Madhavan and Schneiderman,1977). To mark a specific subpopulation of cells, we STG dramatically decreased the fraction of G2 cells (Fig-
ure 3). Constitutive expression of the S-phase initiatorused the engrailed-GAL4 (en-GAL4) transgene to acti-vate expression of a UAS-GFP transgene in posterior CYCE had the complementary effect: it virtually elimi-
nated the G1 cell population (Figure 3). We know thatwing compartments (Figure 2A; Brand and Perrimon,1993). Since green fluorescent protein (GFP) is readily both genes must be expressed every other cell cycle
for continued cell proliferation (Figure 1A and data notdetected by FACS (Figure 2B), this allowed us to com-pare DNA contents and sizes of anterior (A) and posterior shown) and that both genes are expressed in periodic
Imaginal Disc Cell Cycles1187
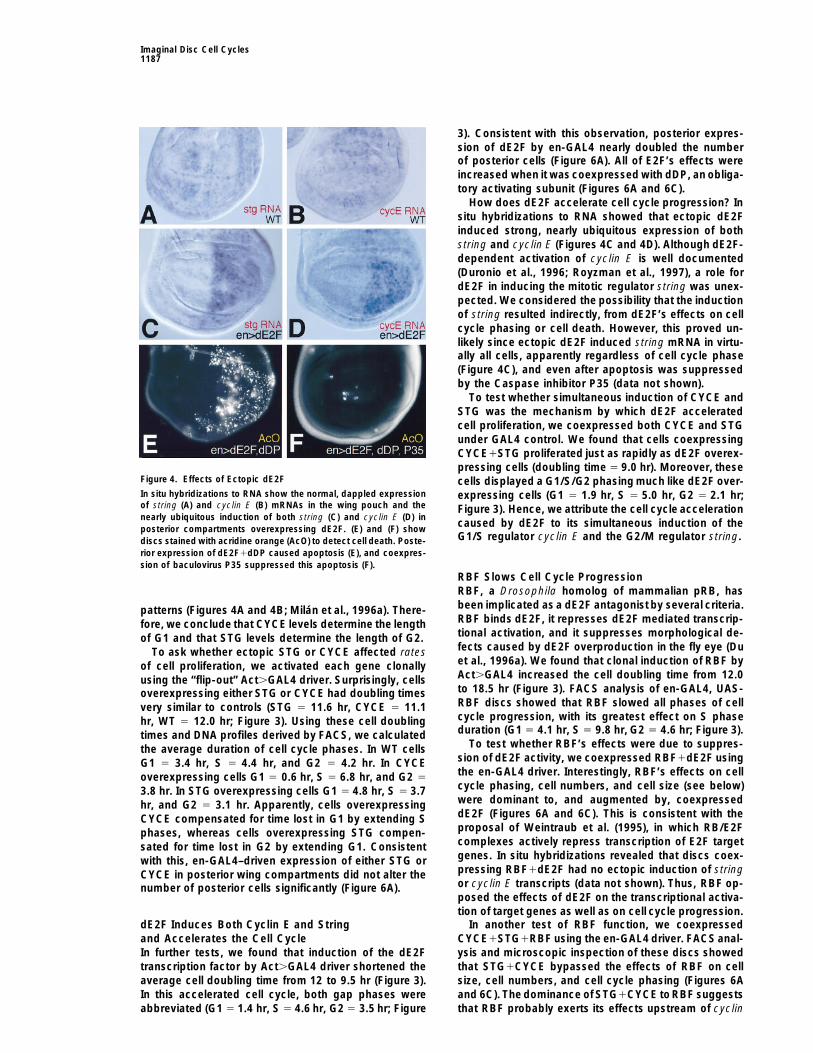
3). Consistent with this observation, posterior expres-sion of dE2F by en-GAL4 nearly doubled the numberof posterior cells (Figure 6A). All of E2F’s effects wereincreased when it was coexpressed with dDP, an obliga-tory activating subunit (Figures 6A and 6C).
How does dE2F accelerate cell cycle progression? Insitu hybridizations to RNA showed that ectopic dE2Finduced strong, nearly ubiquitous expression of bothstring and cyclin E (Figures 4C and 4D). Although dE2F-dependent activation of cyclin E is well documented(Duronio et al., 1996; Royzman et al., 1997), a role fordE2F in inducing the mitotic regulator string was unex-pected. We considered the possibility that the inductionof string resulted indirectly, from dE2F’s effects on cellcycle phasing or cell death. However, this proved un-likely since ectopic dE2F induced string mRNA in virtu-ally all cells, apparently regardless of cell cycle phase(Figure 4C), and even after apoptosis was suppressedby the Caspase inhibitor P35 (data not shown).
To test whether simultaneous induction of CYCE andSTG was the mechanism by which dE2F acceleratedcell proliferation, we coexpressed both CYCE and STGunder GAL4 control. We found that cells coexpressingCYCE1STG proliferated just as rapidly as dE2F overex-pressing cells (doubling time 5 9.0 hr). Moreover, these
Figure 4. Effects of Ectopic dE2F cells displayed a G1/S/G2 phasing much like dE2F over-In situ hybridizations to RNA show the normal, dappled expression expressing cells (G1 5 1.9 hr, S 5 5.0 hr, G2 5 2.1 hr;of string (A) and cyclin E (B) mRNAs in the wing pouch and the Figure 3). Hence, we attribute the cell cycle accelerationnearly ubiquitous induction of both string (C) and cyclin E (D) in
caused by dE2F to its simultaneous induction of theposterior compartments overexpressing dE2F. (E) and (F) showG1/S regulator cyclin E and the G2/M regulator string.discs stained with acridine orange (AcO) to detect cell death. Poste-
rior expression of dE2F1dDP caused apoptosis (E), and coexpres-sion of baculovirus P35 suppressed this apoptosis (F).
RBF Slows Cell Cycle ProgressionRBF, a Drosophila homolog of mammalian pRB, hasbeen implicated as a dE2F antagonist by several criteria.patterns (Figures 4A and 4B; Milan et al., 1996a). There-RBF binds dE2F, it represses dE2F mediated transcrip-fore, we conclude that CYCE levels determine the lengthtional activation, and it suppresses morphological de-of G1 and that STG levels determine the length of G2.fects caused by dE2F overproduction in the fly eye (DuTo ask whether ectopic STG or CYCE affected rateset al., 1996a). We found that clonal induction of RBF byof cell proliferation, we activated each gene clonallyAct.GAL4 increased the cell doubling time from 12.0using the “flip-out” Act.GAL4 driver. Surprisingly, cellsto 18.5 hr (Figure 3). FACS analysis of en-GAL4, UAS-overexpressing either STG or CYCE had doubling timesRBF discs showed that RBF slowed all phases of cellvery similar to controls (STG 5 11.6 hr, CYCE 5 11.1cycle progression, with its greatest effect on S phasehr, WT 5 12.0 hr; Figure 3). Using these cell doublingduration (G1 5 4.1 hr, S 5 9.8 hr, G2 5 4.6 hr; Figure 3).times and DNA profiles derived by FACS, we calculated
To test whether RBF’s effects were due to suppres-the average duration of cell cycle phases. In WT cellssion of dE2F activity, we coexpressed RBF1dE2F usingG1 5 3.4 hr, S 5 4.4 hr, and G2 5 4.2 hr. In CYCEthe en-GAL4 driver. Interestingly, RBF’s effects on celloverexpressing cells G1 5 0.6 hr, S 5 6.8 hr, and G2 5cycle phasing, cell numbers, and cell size (see below)3.8 hr. In STG overexpressing cells G1 5 4.8 hr, S 5 3.7were dominant to, and augmented by, coexpressedhr, and G2 5 3.1 hr. Apparently, cells overexpressingdE2F (Figures 6A and 6C). This is consistent with theCYCE compensated for time lost in G1 by extending Sproposal of Weintraub et al. (1995), in which RB/E2Fphases, whereas cells overexpressing STG compen-complexes actively repress transcription of E2F targetsated for time lost in G2 by extending G1. Consistentgenes. In situ hybridizations revealed that discs coex-with this, en-GAL4–driven expression of either STG orpressing RBF1dE2F had no ectopic induction of stringCYCE in posterior wing compartments did not alter theor cyclin E transcripts (data not shown). Thus, RBF op-number of posterior cells significantly (Figure 6A).posed the effects of dE2F on the transcriptional activa-tion of target genes as well as on cell cycle progression.
In another test of RBF function, we coexpresseddE2F Induces Both Cyclin E and Stringand Accelerates the Cell Cycle CYCE1STG1RBF using the en-GAL4 driver. FACS anal-
ysis and microscopic inspection of these discs showedIn further tests, we found that induction of the dE2Ftranscription factor by Act.GAL4 driver shortened the that STG1CYCE bypassed the effects of RBF on cell
size, cell numbers, and cell cycle phasing (Figures 6Aaverage cell doubling time from 12 to 9.5 hr (Figure 3).In this accelerated cell cycle, both gap phases were and 6C). The dominance of STG1CYCE toRBF suggests
that RBF probably exerts its effects upstream of cyclinabbreviated (G1 5 1.4 hr, S 5 4.6 hr, G2 5 3.5 hr; Figure
Cell1188
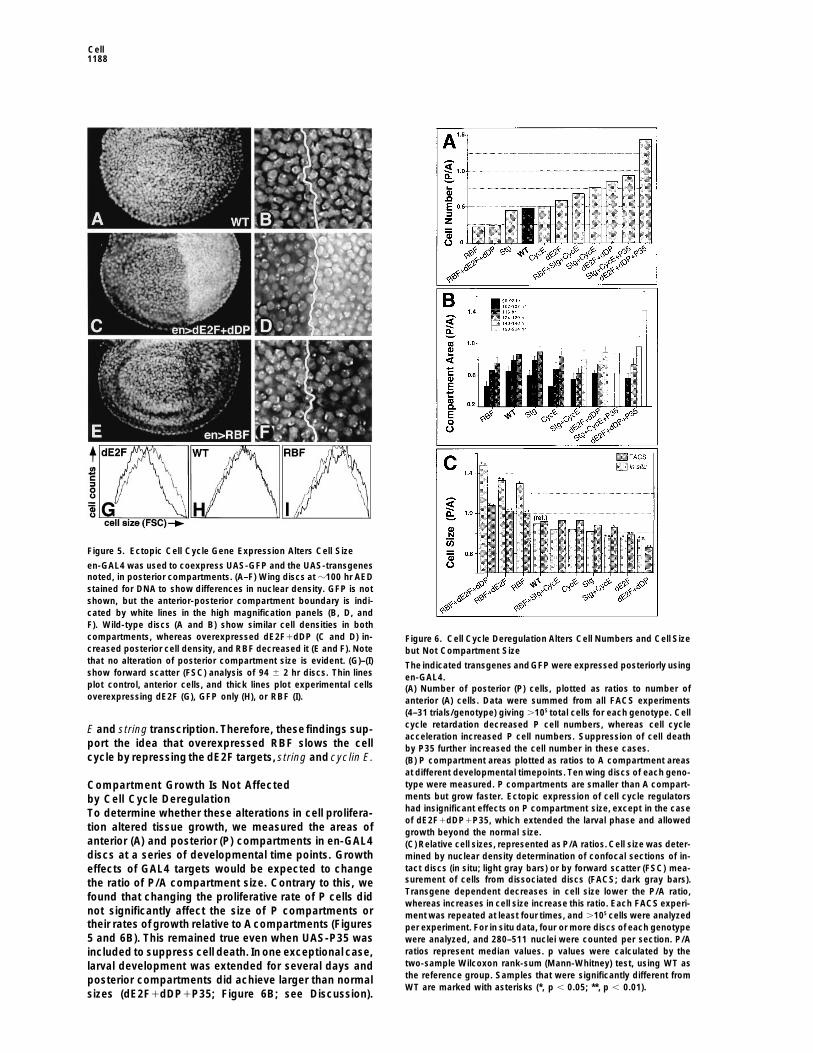
Figure 5. Ectopic Cell Cycle Gene Expression Alters Cell Size
en-GAL4 was used to coexpress UAS-GFP and the UAS-transgenesnoted, in posterior compartments. (A–F) Wing discs at z100 hr AEDstained for DNA to show differences in nuclear density. GFP is notshown, but the anterior-posterior compartment boundary is indi-cated by white lines in the high magnification panels (B, D, andF). Wild-type discs (A and B) show similar cell densities in bothcompartments, whereas overexpressed dE2F1dDP (C and D) in- Figure 6. Cell Cycle Deregulation Alters Cell Numbers and Cell Sizecreased posterior cell density, and RBF decreased it (E and F). Note but Not Compartment Sizethat no alteration of posterior compartment size is evident. (G)–(I) The indicated transgenes andGFP were expressed posteriorly usingshow forward scatter (FSC) analysis of 94 6 2 hr discs. Thin lines en-GAL4.plot control, anterior cells, and thick lines plot experimental cells (A) Number of posterior (P) cells, plotted as ratios to number ofoverexpressing dE2F (G), GFP only (H), or RBF (I). anterior (A) cells. Data were summed from all FACS experiments
(4–31 trials/genotype) giving .105 total cells for each genotype. Cellcycle retardation decreased P cell numbers, whereas cell cycleE and string transcription. Therefore, thesefindings sup-acceleration increased P cell numbers. Suppression of cell death
port the idea that overexpressed RBF slows the cell by P35 further increased the cell number in these cases.cycle by repressing the dE2F targets, string and cyclin E. (B) P compartment areas plotted as ratios to A compartment areas
at different developmental timepoints. Ten wing discs of each geno-type were measured. P compartments are smaller than A compart-Compartment Growth Is Not Affectedments but grow faster. Ectopic expression of cell cycle regulatorsby Cell Cycle Deregulationhad insignificant effects on P compartment size, except in the caseTo determine whether these alterations in cell prolifera-of dE2F1dDP1P35, which extended the larval phase and allowed
tion altered tissue growth, we measured the areas of growth beyond the normal size.anterior (A) and posterior (P) compartments in en-GAL4 (C) Relative cell sizes, represented as P/A ratios. Cell size was deter-discs at a series of developmental time points. Growth mined by nuclear density determination of confocal sections of in-
tact discs (in situ; light gray bars) or by forward scatter (FSC) mea-effects of GAL4 targets would be expected to changesurement of cells from dissociated discs (FACS; dark gray bars).the ratio of P/A compartment size. Contrary to this, weTransgene dependent decreases in cell size lower the P/A ratio,found that changing the proliferative rate of P cells didwhereas increases in cell size increase this ratio. Each FACS experi-
not significantly affect the size of P compartments or ment was repeated at least four times, and .105 cells were analyzedtheir rates of growth relative to A compartments (Figures per experiment. For in situ data, four or more discs of each genotype5 and 6B). This remained true even when UAS-P35 was were analyzed, and 280–511 nuclei were counted per section. P/A
ratios represent median values. p values were calculated by theincluded to suppress cell death. In one exceptional case,two-sample Wilcoxon rank-sum (Mann-Whitney) test, using WT aslarval development was extended for several days andthe reference group. Samples that were significantly different fromposterior compartments did achieve larger than normalWT are marked with asterisks (*, p , 0.05; **, p , 0.01).
sizes (dE2F1dDP1P35; Figure 6B; see Discussion).
Imaginal Disc Cell Cycles1189
However, even in this case the P compartment wasnormal in size throughout most of its development andgrew at the normal rate.
As might be deduced from these results, altering thenumber of cells in the P compartment without changingits size resulted in striking changes in cell size. Cellsize changes were readily visible (Figure 5) and wereassessed by both FACS and cell density measurementsmade microscopically (Figure 6C). Both methods showedthat accelerated proliferation correlated with decreasedcell size, whereas retarded proliferation correlated withincreased cell size. FACS data were analyzed to deter-mine whether cell size changes were due to changes incell cycle phasing, but in each case the experimentalcells showed changes in average size during all cellcycle phases. Similar cell size effects were observed atall developmental stages tested, from early third instar(76 hr AED) to late pupation (160 hr AED; data notshown).
The observed relationship between cell numbers, com-partment sizes, and cell sizes suggests that accumula-tion of mass in the P compartment progressed at thenormal rate regardless of changes in cell division rates.Although it might be inferred that cell cycle deregulationhas no effect on cell growth, there remained a furtherconsideration. Studies of disc development have dem-onstrated that compartments function as units of sizecontrol (Garcıa-Bellido et al.,1973; Simpson and Morata,1981). Since expression of the en-GAL driver we usedis itself compartmentally determined, we suspected thatcompartmental size controls might counteract any ef-fects of GAL4 targets on growth.
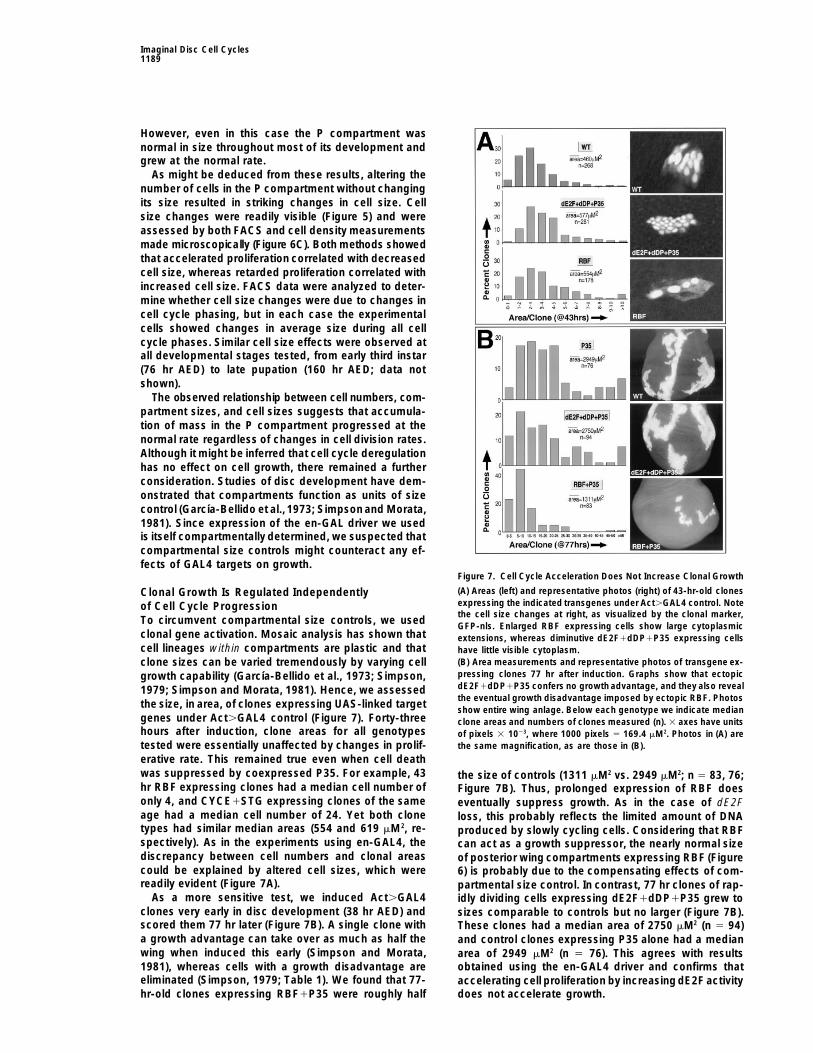
Figure 7. Cell Cycle Acceleration Does Not Increase Clonal Growth
(A) Areas (left) and representative photos (right) of 43-hr-old clonesClonal Growth Is Regulated Independentlyexpressing the indicated transgenes under Act.GAL4 control. Noteof Cell Cycle Progressionthe cell size changes at right, as visualized by the clonal marker,
To circumvent compartmental size controls, we used GFP-nls. Enlarged RBF expressing cells show large cytoplasmicclonal gene activation. Mosaic analysis has shown that extensions, whereas diminutive dE2F1dDP1P35 expressing cellscell lineages within compartments are plastic and that have little visible cytoplasm.
(B) Area measurements and representative photos of transgene ex-clone sizes can be varied tremendously by varying cellpressing clones 77 hr after induction. Graphs show that ectopicgrowth capability (Garcıa-Bellido et al., 1973; Simpson,dE2F1dDP1P35 confers no growth advantage, and they also reveal1979; Simpson and Morata, 1981). Hence, we assessedthe eventual growth disadvantage imposed by ectopic RBF. Photos
the size, in area, of clones expressing UAS-linked target show entire wing anlage. Below each genotype we indicate mediangenes under Act.GAL4 control (Figure 7). Forty-three clone areas and numbers of clones measured (n). 3 axes have unitshours after induction, clone areas for all genotypes of pixels 3 1023, where 1000 pixels 5 169.4 mM2. Photos in (A) are
the same magnification, as are those in (B).tested were essentially unaffected by changes in prolif-erative rate. This remained true even when cell deathwas suppressed by coexpressed P35. For example, 43 the size of controls (1311 mM2 vs. 2949 mM2; n 5 83, 76;hr RBF expressing clones had a median cell number of Figure 7B). Thus, prolonged expression of RBF doesonly 4, and CYCE1STG expressing clones of the same eventually suppress growth. As in the case of dE2Fage had a median cell number of 24. Yet both clone loss, this probably reflects the limited amount of DNAtypes had similar median areas (554 and 619 mM2, re- produced by slowly cycling cells. Considering that RBFspectively). As in the experiments using en-GAL4, the can act as a growth suppressor, the nearly normal sizediscrepancy between cell numbers and clonal areas of posterior wing compartments expressing RBF (Figurecould be explained by altered cell sizes, which were 6) is probably due to the compensating effects of com-readily evident (Figure 7A). partmental size control. In contrast, 77 hr clones of rap-
As a more sensitive test, we induced Act.GAL4 idly dividing cells expressing dE2F1dDP1P35 grew toclones very early in disc development (38 hr AED) and sizes comparable to controls but no larger (Figure 7B).scored them 77 hr later (Figure 7B). A single clone with These clones had a median area of 2750 mM2 (n 5 94)a growth advantage can take over as much as half the and control clones expressing P35 alone had a medianwing when induced this early (Simpson and Morata, area of 2949 mM2 (n 5 76). This agrees with results1981), whereas cells with a growth disadvantage are obtained using the en-GAL4 driver and confirms thateliminated (Simpson, 1979; Table 1). We found that 77- accelerating cell proliferation by increasing dE2F activity
does not accelerate growth.hr-old clones expressing RBF1P35 were roughly half
Cell1190
Discussion slowing reduplication of the genome must eventuallylimit biosynthetic capability (Johnston et al., 1977; Weig-mann et al., 1997). Although increasing dE2F activityEven in yeast, where cell proliferation would seem to
be a simple cell-autonomous response to nutrients, it accelerated the rate of cell proliferation by 25%, it hadno measurable affect on rates of mass accumulationremains unclear how the cell cycle machinery is coupled
to increases in cell mass. This problem is more formida- (Figure 7). Therefore, we conclude that dE2F acts pri-marily as a cell cycle regulator and has little direct role inble in animal tissues where cell–cell communication net-
works, rather than nutrition, regulate cell proliferation. stimulating growth. RBFcan act as a growth suppressor,but it appears to execute this function via retarding cellHere, we address the relationship of growth and cell
cycle control in vivo in the developing wing of Drosoph- cycle progression.One apparent contradiction to this conclusion is ourila. This system allowed us to probe questions not ac-
cessible in single-celled systems that lack cell–cell com- finding that compartments overexpressing dE2F, dDP,and the apoptosis suppressor P35 grew larger than nor-munication or in early embryos where massive reserves
of maternal cytoplasm bypass the necessity for growth mal (Figure 6B). For unknown reasons this combinationof transgenes extended larval development for severalcontrol.days. During this period the overexpressing cells accu-mulated in multiple layers and abnormal folds. We alsoCell Cycle Controls in the Wingobserved a P35-dependent, multiple layering of cells inThrough loss- and gain-of-function experiments, weclones expressing dE2F1dDP or STG1CYCE. Althoughidentified cyclin E and the Cdc25 homolog string asP35 blocked apoptosis in these cells, it apparently didlimiting regulators of S- and M-phase initiation in devel-not block their delamination from the disc epithelium.oping wings. Ectopic CYCE truncated G1 and ectopicBased on this we suggest that the overgrowth ofSTG truncated G2, but in either case cells compensateddE2F1dDP1P35 expressing compartments arose fromby lengthening other cell cycle phases. Such compensa-the structural disorganization that ensued when cellstion has also been noted in single-celled systems, butmarked for death were excluded from the epitheliumthe mechanisms involved remain unknown. In contrast,but failed to die. Disrupting the epithelial organizationwe found that the transcriptional regulator dE2F had theof the disc may disturb thecell–cell communication usedcapability to regulate overall rates of cell proliferation.Byin compartmental sizecontrol and so lead to overgrowthdeleting dE2F or ectopically expressing it in combination(see also Watson et al., 1994).with its coactivator dDP or its corepressor RBF, we
subjected cells to whatwe presume were seven differentlevels of dE2F activity (dE2F2/dE2F2 , GAL4-dE2F1 Coordinating Division Rates with GrowthdDP1RBF , GAL4-dE2F1RBF , GAL4-RBF , WT , A logical thesis posed by our findings is that disc cellsGAL4-dE2F , GAL4-dE2F1dDP). This revealed a simple could use growth-dependent modulation of dE2F activ-relationship in which more dE2F activity gave faster cell ity to coordinate the accumulation of mass with ratescycles and less activity gave slower cell cycles. This of division. Evidence for this in the wing is compellingcorrelation is most clearly illustrated by the progressive butnot yet conclusive. dE2F is required for normal prolif-alterations in cell numbers and cell size that resulted eration of wing cells, and alterations in dE2F activity canfrom changing cell cycle rates (Figure 6). Thus, dE2F indeed change rates of cell division in a dose-dependentappears to satisfy a critical criterion as a dosage-sensi- fashion. dE2F targets such as cyclin E, string, and ribo-tive regulator of rates of cell cycle progression. Further nucleotide reductase 2 are normally expressed in peri-experiments led us to ascribe this property of E2F to its odic patterns in the growing wing, and these patternsability to promote expression of both cyclin E and string. might reflect growth-dependent transcription. More-This effectively shortened both gap phases, bypassed over, cellsizes and division rates vary indifferent regionsthe compensatory mechanisms noted above, and de- of the disc, yet the G1/S/G2 phasing of cells remainscreased overall cell doubling times. E2F’s ability to acti- quite uniform (Figure 2). Since dE2F affects G1/S andvate genes used in DNA replication has been shown in G2/M progression coordinately, this is consistent withmany systems, but this is one of the first reports of a scenario in which endogenous dE2F activity variesE2F-dependent activation of a limiting mitotic regulator from cell to cell and is higher in more rapidly cycling(Cdc25/STG). cells.
Contrary to this thesis, dE2F is probably only one ofmany regulators of cyclin E and string in imaginal discsFunctions of dE2F and RBF
Is dE2F also a growth regulator? If it were, it might have (Johnston and Edgar, 1998; Jones and Saint, unpub-lished data). Another consideration is that dE2F proteinbehaved like the Minutes, which alter growth and cell
proliferation coordinately without affecting cell size is normally expressed much more uniformly in the grow-ing wing than its putative targets (our unpublished ob-(Simpson, 1979; Simpson and Morata, 1981; Figure 1).
We found a different relationship, however: dE2F altered servations). This suggests that, as with the vertebrateE2Fs, regulation of Drosophila E2F is likely to occurrates of cell cycle progression much more than rates of
mass accumulation (growth), and dramatic changes in through phosphorylation of cofactors like RBF ratherthan via modulated expression. Overexpressed dE2Fcell sizes resulted. The only significant growth affect we
observed was that loss of dE2F or overexpression of its presumably has activity because it exceeds the levelsof endogenous posttranslational regulators like RBF,corepressor, RBF, eventually suppressed growth in cell
clones. This is probably an indirect consequence, since but this may not recapitulate the mechanisms actually
Imaginal Disc Cell Cycles1191
dE2F729 is a P[LacZ] insertion-mutation that is null for function.used in vivo. Further testing of the thesis that dE2FdE2F729 has been reverted by P element excision, and the revertedlinks growth rates to cell cycle progression will entailchromosome complements the FRT dE2F729 p-myc chromosomedemonstrating that endogenous dE2F activity varies inused here (N. Dyson, personal communication). Cells homozygous
vivo and deciphering whether and how such variation for the FRT stg7B p-myc chromosome arm used can be rescued formight be coupled to growth. division in wing discs by several stg1 transgenes. Thus, the FRT
dE2F729 p-myc and FRT stg7B p-myc chromosomes used are pre-Despite these gaps in our understanding, recent stud-sumed free of confounding secondary mutations.ies in other systems already provide clues about how
this coupling might work. Connections have been drawnUAS Transgenesfrom growth factor signaling through the RAS pathwayA 4.4 kb dE2F cDNA from pBS-dE2F (Dynlacht et al., 1994) wasto the FRAP/TOR kinase and finally to the translationalligated into the EcoRI site of pUAST (Brand and Perrimon, 1993) to
regulators eIF4E and S6K (Barbet et al., 1996; Sonen- generate UAS-dE2F. A 2.3 kb XhoI/XbaI fragment containing theberg, 1996). It has also been proposed that RAS stimu- stg cDNA was ligated into pUAST to generate UAS-STG. For UAS-lates cell proliferation by suppressing the activity of pRB GFPnls, oligonucleotides encoding the nuclear localization signal
of SV40 large T antigen preceded by a consensus initiation codon(Aktas et al 1997; Leone et al., 1997; Peeper et al., 1997).were ligated into HindIII/EcoRI-digested pBluescript SKII, generat-Thus, it is tempting to suggest that extracellular signalsing pBS-nls. A 720 bp EcoRI/BamHI fragment encoding thestimulate translation, and a translationally sensitive reg-GFPS65T derivative was ligated into pBS-nls to generate pBS-
ulator, such as a D-type Cyclin, responds by accumulat- GFPnls, and finally the full GFPnls insert was transferred as a XhoI/ing to levels sufficient to activate E2F and its targets XbaI fragment into pUAST.(Rosenwald et al., 1995; Sherr, 1996). Such a mechanismwould couple translation rates to E2F activity and thus Flow Cytometrypresumably also couple increases in cell mass to cell Staged larvae derived from 2–3 hr egg collections and raised at
238C were dissected in PBS. Wing discs were washed twice in PBScycle progression.This type of regulation has been dem-and incubated with gentle agitation for 2–4 hr in 500 ml PBTH (4.5onstrated recently in Saccharomyces cerevisiae, wheremg/ml porcine trypsin-EDTA [Intergen], 0.5 mg/ml Hoechst 33342 innutritional conditions influence levels of the G1 CyclinPBS). Dissociated cells lost the columnar morphology observed in
CLN3 through translational control (Barbet et al., 1996; situ and became spherical (Figure 2B). Twenty to forty discs werePolymenis and Schmidt, 1997). We find that Cyclin E generally dissociated. We used a Becton Dickinson FACS Vantage,can weakly stimulate expression of dE2F targets in the and data were analyzed using Cell Quest (Becton Dickinson) and
Multicycle AV (Pheonix Flow Systems) software.fly wing, but in contrast to dE2F, Cyclin E’s biologicaleffects seem confined to G1/S progression (Figure 3;
Proliferation and Growth Rate Measurementsour unpublished observations, see also Duronio andGAL4-expressing clones were induced by the FRT “flip out” methodO’Farrell, 1995). Moreover, we have so far failed to un-(Struhl and Basler, 1993; Pignoni and Zipursky, 1997) in HS-FLP,cover a role for Drosophila Cyclin D in dE2F control (S.Act5c.CD2.GAL4, UAS-GFPnls (6 additional UAS lines) animals.
Datar and B. A. E., unpublished data; Finley et al., 1996). Larvae were heat shocked either at 38 6 2 hr AED for 1 hr at 378C,Thus, it remains unclear how dE2F activity might be or at 72 6 1 hr AED for 30 min at 348C. Dissected discs were fixed
at 115 hr AED. GFP-positive cells per clone were counted on acoupled to translation rates.Leitz DMRD epifluorescence microscope. Cell doubling times wereOther modes of growth control are also possible. Forderived using the formula logN/log2 (hr), where N 5 median cellinstance, cell growth and cell cycle progression mightnumber/clone and hr 5 age of the clone. To measure clone and
respond to the patterning signals that control wing de- compartment sizes, .10 discs from precisely staged larvae werevelopment though parallel, yet independent pathways imaged on a BioRad MRC-600 confocal microscope, and areas of(Johnston and Edgar, 1998). This could explain why wing GFP-positive tissue were determined using the histogram function
of Adobe Photoshop.cells vary in size at different developmental stages andin different regions of the patterning field (Figure 2).
HistologyThe finding that manipulations of Ras1 and PI3K geneDiscs were fixed in 6% paraformaldehyde in PBS for 40 min, washedactivity change cell sizes in the wing may also be consis-in PBS 1 0.1% Tween 20, and mounted in Fluoroguard (BioRad).tent with this possibility (Diaz-Benjumea and Hafen,Rhodamine-phalloidin (Molecular Probes) and Hoechst 33258
1994; Leevers et al., 1996; Karim and Rubin, 1998). Nev- (Acros) were used to label cell outlines and nuclei. Clonal markersertheless, the fact that mutations in the protein synthesis were detected using anti-myc (1:50) or anti-b-Gal (1:10000) 18 anti-machinery (the Minutes) retard cell proliferation without bodies (Oncogene Science and Cappel), and preabsorbed FITC-
conjugated 28 antibodies (1:600; Jackson). To identify apoptoticchanging cell size leads us to favor the model proposedcells, unfixed discs were incubated for 10 min in Schneider’s culturefor yeast two decades ago, in which growth is upstreammedium containing acridine orange (1.6 mM), and mounted inof and dominant to cell cycle controls (Johnston et al.,Schneider’s medium. High magnification fluorescent images were
1977). collected on a Deltavision S/A30 microscope. In situ hybridizationswere carried out using digoxygenin-labeled RNA probes as de-scribed (Tautz and Pfeifle, 1989).Experimental Procedures
Fly Stocks AcknowledgmentsUAS-dE2F, UAS-STG, and UAS-GFPnls lines were generated byP element–mediated transformation. Several transgenic lines were We thank Nick Dyson and Christian Lehner for gifts of flies and
reagents; Dara Lehman, Michele Garfinkel, and Bre Holt for theirgifts: UAS-CYCE from C. Lehner, UAS-RBF and UAS-dDP from N.Dyson, UAS-P35 from B. Hay, en-GAL4 from A. Brand, and UAS- contributions to the early stages of this work; Kristy Seidel for expert
help with statistics; and Nick Dyson, Lee Hartwell, Pat O’Farrell,GFPS65T from B. Dickson. stg7B, stg9A (Edgar and O’Farrell, 1989),dE2F729 (Brook et al., 1996), Act.CD2.GAL4 (Pignoni and Zipursky, Christian Lehner, and Jim Roberts for comments on the manuscript.
Supported by National Institutes of Health GM51186 to B. A. E.,1997), and M(3)95APlac92 (Andersson et al., 1994) have been de-scribed. Clonal analysis was performed as per Xu and Rubin (1993). American Chemical Society PF-4301 to T. N., and National Institutes
Cell1192
of Health GM17373 to L. A. J. Bruce Edgar is a Lucille P. Markey syndrome of multiorgan hyperplasia with features of gigantism, tu-morigenesis, and female sterility in p27Kip1-deficient mice. Cell 85,and Rita Allen Scholar.733–744.
Finley, R.L., Jr., Thomas, B.J., Zipursky, S.L., and Brent, R. (1996).Received January 8, 1998; revised May 15, 1998. Isolation of Drosophila Cyclin D, a protein expressed in the morpho-
genetic furrow before entry into S phase. Proc. Natl. Acad. Sci. USA93, 3011–3015.
ReferencesFranch, H.A., Shay, J.W., Alpern, R.J., and Preisig, P.A. (1995).Involvement of pRB family in TGFbeta-dependent epithelial cell hy-Aktas, H., Cai, H., and Cooper, G.M. (1997). Ras links growth factorpertrophy. J. Cell Biol. 129, 245–254.signaling to the cell cycle machinery via regulation of cyclin D1 andGarcıa-Bellido, A., and Merriam, J.R. (1971). Parameters of the wingthe Cdk inhibitor p27KIP1. Mol. Cell. Biol. 17, 3850–3857.imaginal disc development in Drosophila melanogaster. Dev. Biol.Andersson, S., Saeboe-Larssen, S., Lambertsson, A., Merriam, J.,26, 61–87.and Jacobs-Lorena, M. (1994). A Drosophila third chromosome Mi-Garcıa-Bellido, A., Ripoll, P., and Morata, G. (1973). Developmentalnute locus encodes a ribosomal protein. Genetics 137, 513–520.compartmentalisation of the wing disk of Drosophila. Nature NewAsano, M., Nevins, J.R., and Wharton, R.P. (1996). Ectopic E2F ex-Biol. 245, 251–253.pression induces S-phase and apoptosis in Drosophila imaginalGonzalez-Gaitan, M., Capdevila, M.P., and Garcıa-Bellido, A. (1994).discs. Genes Dev. 10, 1422–1432.Cell proliferation patterns in the wing imaginal disc of Drosophila.Barbet, N.C., Schneider, U., Helliwell, S.B., Stansfield, I., Tuite, M.F.,Mech. Dev. 40, 183–200.and Hall, M.N. (1996). TOR controls translation initiation and earlyGraves, B.J., and Schubiger, G. (1982). Cell cycle changes duringG1 progression in yeast. Mol. Biol. Cell 7, 25–42.growth and differentiation of imaginal leg discs in Drosophila mela-Brand, A.H., and Perrimon, N. (1993). Targeted gene expression asnogaster. Dev. Biol. 93, 104–110.a means of altering cell fates and generating dominant pheontypes.Hartwell, L.H. (1971). Genetic control of the cell division cycle inDevelopment 118, 401–415.yeast: II. genes controlling DNA replication and its initiation. J. Mol.Brook, A., Xie, J.-E., Du, W., and Dyson, N. (1996). Requirements forBiol. 59, 183–194.dE2F function in proliferating cells and in post-mitotic differentiatingHay, B.A., Wolff, T., and Rubin, G.M. (1994). Expression of baculovi-cells. EMBO J. 15, 3676–3683.rus P35 prevents cell death in Drosophila. Development 120, 2121–Bryant, P.J. (1996). Cell proliferation control in Drosophila: flies are2129.not worms. BioEssays 18, 781–784.Hemerly, A., de Almeida Engler, J., Bergounioux, C., Van Montagu,Burke, R., and Basler, K. (1996). Dpp receptors are autonomouslyM., Engler, G., Inze, D., and Ferreira, P. (1995). Dominant negativerequired for cell proliferation in the entire developing Drosophilamutants of the Cdc2 kinase uncouple cell division from iterativewing. Development 122, 2261–2269.plant development. EMBO J. 14, 3925–3936.
Cavanaugh, A.H., Hempel, W.M., Taylor, L.J., Rogalsky, V., Todorov,Herrera, R.E., Sah, V.P., Williams, B.O., Makela, T.P., Weinberg, R.A.,G., and Rothblum, L.I. (1995). Activity of RNA polymerase I transcrip-and Jacks, T. (1996). Altered cell cycle kinetics, gene expression,tion factor UBF blocked by Rb gene product. Nature 174, 177–180.and G1 restriction point regulation in Rb-deficient fibroblasts. Mol.
Diaz-Benjumea, F.J., and Hafen, E. (1994). The sevenless signaling Cell. Biol. 16, 2402–2407.cassette mediates Drosophila EGF receptor function during epider-
Johnson, D.G., Schwarz, J.K., Cress, W.D., and Nevins, J.R. (1993).mal development. Development 120, 569–578.Expression of transcription factor E2F1 induces quiescent cells to
Doherty, D., Feger, G., Younger-Shepherd, S., Jan, L.Y., and Jan, enter S phase. Nature 365, 349–352.Y.N. (1996). Delta is a ventral to dorsal signal complementary to
Johnston, L.A., and Edgar, B.A. (1998). Wingless and Notch regulateSerrate, another Notch ligand, in Drosophila wing formation. Genescell-cycle arrest in the developing Drosophila wing. Nature, in press.Dev. 10, 421–434.Johnston, G.C., Pringle, J.R., and Hartwell, L.H. (1977). Coordination
Du, W., Vidal, M., Xie, J.-E., and Dyson, N. (1996a). RBF, a novelof growth with cell division in the yeast Saccharomyces cerevisiae.
RB-related gene that regulates E2F activity and interacts with cyclinExp. Cell Res. 105, 79–98.
E in Drosophila. Genes Dev. 10, 1206–1218.Karim, F.D., and Rubin, G.M. (1998). Ectopic expression of activated
Du, W., Xie, J.E., and Dyson, N. (1996b). Ectopic expression of dE2F Ras1 induces hyperplastic growth and increased cell death in Dro-and dDP induces cell proliferation and death in the Drosophila eye. sophila imaginal tissues. Development 125, 1–9.EMBO J. 15, 3684–3692.
Kipreos, E.T., Lander, L.E., Wing, J.P., He, W.W., and Hedgecock,Duronio, R.J., and O’Farrell, P.H. (1995). Developmental control of E.M. (1996). Cul-1 is required for cell-cycle exit in C. elegans andthe G1 to S transition in Drosophila: cyclin E is a limiting downstream identifies a novel gene family. Cell 85, 829–839.target of E2F. Genes Dev. 9, 1456–1468.
Lecuit, T., Brook, W.J., Ng, M., Calleja, M., Sun, H., and Cohen,Duronio, R.J., Brook, A., Dyson, N., and O’Farrell, P.H. (1996). E2F- S.M. (1996). Two distinct mechanisms for long-range patterning byinduced S phase requires Cyclin E. Genes Dev. 10, 2505–2513. Decapentaplegic in the Drosophila wing. Nature 381, 387–393.Duronio, R.J., Bonnette, P.C., and O’Farrell, P.H. (1998). Mutation Leevers, S.J., Weinkove, D., MacDougall, L.K., Hafen, E., and Wa-of the Drosophila dDP, dE2F, and cyclin E genes reveal distinct terfield, M.D. (1996). The Drosophila phosphoinositide 3-kinaseroles for the E2F/DP transcription factor and cyclin E during the Dp110 promotes cell growth. EMBO J. 15, 6584–6594.G1-S transition. Mol. Cell. Biol. 18, 141–151.
Leone, G., DeGregori, J., Sears, R., Jakoi, L., and Nevins, J.R. (1997).Dynlacht, B.D., Brook, A., Dembski, M., Yenush, L., and Dyson, N. Myc and Ras collaborate in inducing accumulation of active cyclin(1994). DNA-binding and trans-activation properties of Drosophila E/Cdk2 and E2F. Nature 387, 422–426.E2F and DP proteins. Proc. Natl. Acad. Sci. USA 91, 6359–6363.
Madhavan, M., and Schneiderman, H.A. (1977). Histological analysisEdgar, B.A., and Lehner, C.F. (1996). Developmental control of cell of the dynamics of growth of imaginal discs and histoblast nestscycle regulators: a fly’s perspective. Science 274, 1646–1652. during the larval development of Drosophila melanogaster. WilhelmEdgar, B.A., and O’Farrell, P.H. (1989). Genetic control of cell division Roux’s Arch. 183, 269–305.patterns in the Drosophila embryo. Cell 57, 177–187. Milan, M., Campuzano, S., and Garcıa-Bellido, A. (1996a). Cell cy-Fain, M.J., and Stevens, B. (1982). Alterations in the cell cycle of cling and patterned cell proliferation in the Drosophila wing duringDrosophila imaginal disc cells precede metamorphosis. Dev. Biol. metamorphosis. Proc. Natl. Acad. Sci. USA 93, 11687–11692.92, 247–258. Milan, M., Campuzano, S., and Garcıa-Bellido, A. (1996b). Cell cy-Fero, M.L., Rivkin, M., Tasch, M., Porter, P., Carow, C.E., Firpo, cling and patterned cell proliferation in the wing primordium of Dro-
sophila. Proc. Natl. Acad. Sci. USA 93, 640–645.E., Perlmutter, R.M., Kaushansky, K., and Roberts, J.M. (1996). A
Imaginal Disc Cell Cycles1193
Milan, M., Campuzano, S., and Garcıa-Bellido, A. (1997). Develop- Dean, D.C. (1995). Mechanism of active transcriptional repressionmental parameters of cell death in the wing disc of Drosophila. Proc. by the retinoblastoma protein. Nature 375, 812–815.Natl. Acad. Sci. USA 94, 5691–5696. White, R.J., Trouche, D., Martin, K., Jackson, S.P., and Kouzarides,Mitchison, J.M. (1971). The biology of the cell cycle. (London: Cam- T. (1996). Repression of RNA polymerase III transcription by thebridge University Press). retinoblastoma protein. Nature 382, 88–90.
Nurse, P., Thuriaux, P., and Nasmyth, K. (1976). Genetic control of Xu, T., and Rubin, G.M. (1993). Analysis of genetic mosaics in devel-the cell division cycle in the fission yeast Schizosaccharomyces oping and adult Drosophila tissues. Development 117, 1223–1237.pombe. Mol. Gen. Genet. 146, 167–178. Zecca, M., Basler, K., and Struhl, G. (1995). Sequential organizingOhtani, K., and Nevins, J.R. (1994). Functional properties of a Dro- activities of engrailed, hedgehog and decapentaplegic in the Dro-sophila homolog of the E2F1 gene. Mol. Cell. Biol. 14, 1603–1612. sophila wing. Development 121, 2265–2278.Ohtsubo, M., and Roberts, J.M. (1993). Cyclin-dependent regulationof G1 in mammalian fibroblasts. Science 259, 1908–1912.
Peeper, D.S., Upton, T.M., Ladha, M.H., Neuman, E., Zalvide, J.,Bernards, R., DeCaprio, J.A., and Ewen, M.E. (1997). Ras signalinglinked to the cell-cycle machinery by the retinoblastoma protein.Nature 386, 177–181.
Pignoni, F., and Zipursky, S. (1997). Induction of Drosophila eyedevelopment by decapentalegic. Development 124, 271–278.
Polymenis, M., and Schmidt, E.V. (1997). Coupling of cell divisionto cell growth by translational control of the G1 cyclin CLN3 in yeast.Genes Dev. 11, 2522–2531.
Quelle, D.E., Ashmun, R.A., Shurtleff, S.A., Kato, J.-y., Bar-Sagi, D.,Rousel, M.F., and Sherr, C.J. (1993). Overexpression of mouseD-type cyclins accelerates G1 phase in rodent fibroblasts. GenesDev. 7, 1559–1571.
Reznitsky, D., Gossen, M., Bujard, H., and Reed, S.I. (1994). Acceler-ation of the G1/S phase transition by expression of cyclins D1 andE with an inducible system. Mol. Cell. Biol. 14, 1669–1679.
Rosenwald, I.B., Kaspar, R., Rousseau, D., Gehrke, L., Leboulch, P.,Chen, J.-J., Schmidt, E.V., Sonenberg, N., and London, I.M. (1995).Eukaryotic translation initiation factor 4E regulates expression ofcyclin D1 at transcriptional and post-transcriptional levels. J. Biol.Chem. 270, 21176–21180.
Royzman, I., Whittaker, A.J., and Orr-Weaver, T.L. (1997). Mutationsin Drosophila DP and E2F distinguish G1-S progression from anassociated transcriptional program. Genes Dev. 11, 1999–2011.
Schnepp, B., Grumbling, G., Donaldson, T., and Simcox, A. (1996).Vein is a novel component in the Drosophila epidermal growth factorreceptor pathway with similarity to the neuregulins. Genes Dev. 10,2302–2313.
Serrano, N., and O’Farrell, P.H. (1997). Limb morphogenesis: con-nections between patterning and growth. Curr. Biol. 7, R186–R195.
Sheikh, M.S., Rochefort, H., and Garcia, M. (1995). Overexpressionof p21WAF1/CIP1 induces growth arrest, giant cell formation andapoptosis in human breast carcinoma cell lines. Oncogene 11, 1899–1905.
Sherr, C.J. (1996). Cancer cell cycles. Science 274, 1672–1677.
Simpson, P. (1979). Parameters of cell competition in the compart-ments of the wing disc of Drosophila. Dev. Biol. 69, 182–193.
Simpson, P., and Morata, G. (1981). Differential mitotic rates andpatterns of growth in compartments in the Drosophila wing. Dev.Biol. 85, 299–308.
Sonenberg, N. (1996). Translational control. In Translational Control,J.W.B. Hershey, M.B. Mathews, and N. Sonenberg,eds. (Cold SpringHarbor: Cold Spring Harbor Press), pp. 245–269.
Struhl, G., and Basler, K. (1993). Organizing activity of winglessprotein in Drosophila. Cell 72, 527–540.
Tautz, D., and Pfeifle, C. (1989). A non-radioactive in situ hybridiza-tion method for the localization of specific RNAs in Drosophila em-bryos reveals translational control of the segmentation gene hunch-back. Chromosoma 98, 81–85.
Watson, K.L., Justice, R.W., and Bryant, P.J. (1994). Drosophila incancer research: the first fifty tumor suppressor genes. J. Cell Sci.18, 19–33.
Weigmann, K., Cohen, S.M., and Lehner, C.F. (1997). Cell cycleprogression, growth and patterning in imaginal discs despite inhibi-tion of cell division after inactivation of Drosophila Cdc2 kinase.Development 124, 3555–3563.
Weintraub, S.J., Chow, K.N.B., Luo, R.X., Zhang, S.H., He, S., and