Characteristics of Socio-Technical Systems 1 Introduction to the Concept of Socio-Technical Systems
Upload
khangminh22Category
view
1download
0
SOCIO-ECONOMIC ISSUES IN THECENTRAL TRUONG SON LANDSCAPE
Compiled by
Central Truong Son Initiative Report No. 2Hanoi, 2003
Nguyen Lam Thanh
The opinions expressed in this document represent those of the authors and editors.They do not necessarily reflect the opinions of WWF.
The designation of geographical entities in this document and the presentation of thematerial do not imply any expression on the part of the authors, editors, or WWF concerning
the legal status of any country, territory or area or its authorities, or concerning thedelineation of its frontiers and boundaries.
The authors, editors, and WWF take no responsibility for any misrepresentation of materialthat may result from the translation of this document into any other language.
Published by WWF IndochinaCopyright© 2003 WWF
Publication License No: 1565XB
Reproduction of any part of this publication for educational, conservation, and any othernon-profit purposes is authorized without prior permission from the copyright holder,
provided that the source is fully acknowledged.
Reproduction for resale or other commercial purposes is prohibited without prior writtenpermission from the copyright holder.
Suggested citation: Nguyen Lam Thanh. 2003. Socio-economic Issues in the Central Truong Son Landscape. Central Truong Son Initiative Report No. 2.
WWF Indochina, Hanoi, Vietnam.
Printed by: Viet Tien Printing Company
Design and Layout: GraphicLink Co., Ltd and Angie Woo
Cover Photographs: Andrey Kouznetsov and Tran Viet Duc
Copies available from:WWF Indochina
Tel: +84 (0) 4 733 8387E-mail: [email protected]
Forest Protection DepartmentMinistry of Agriculture and Rural Development
2 Ngoc Ha StreetHanoi, Vietnam
Street address53 Tran Phu Street
Hanoi, Vietnam
Mailing addressIPO Box 151
Hanoi, Vietnam
Socio-economic Issues in the Central Truong Son Landscape
iii
BACKGROUND TO THE CENTRAL TRUONG SON REPORTS
In response to concerns about the increasing pace of biodiversity loss and the need to increase the scale andintegration of global conservation efforts - WWF together with its conservation partners have developed anew approach to conservation – ecoregion conservation. Scientists have undertaken a major analysis of theworld’s biodiversity and identified more than 800 ecoregions that reclassify the way we view the naturalworld. From this global inventory, 238 ecoregions have been identified that comprise the most valuableand representative global biodiversity. These priority ecoregions have been labeled as the Global 200.
In 1998, the Forests of the Lower Mekong Ecoregion Complex (FLMEC) was selected as one of the firstlocations to initiate an ecoregion based conservation programme. With initial support from WWF-USand USAID, the programme has now been established as one world’s first fully functioning EcoregionAction Programmes (EAP).
In March 2000, over eighty scientists from Cambodia, Lao P.D.R., Vietnam, and many other countriesparticipated in an ambitious and groundbreaking assessment of biological conservation prioritieswithin the Forests of the Lower Mekong Ecoregion Complex. The results of this biological assessmenthave since been published in the report entitled “Towards a Vision for Biodiversity Conservation in theForests of the Lower Mekong Ecoregion Complex”.
After the biological assessment and a ‘situation analysis’ to examine the threats and opportunities,WWF decided to focus on two of the Global 200 ecoregions falling within the Forests of the LowerMekong Ecoregion Complex – the Greater Truong Son and the Central Indochina Dry Forests.
The Greater Truong Son comprises the most unique and diverse biodiversity within the FLMEC. Thediscovery of the saola (Pseudoryx nghetinhensis) by WWF and Vietnamese scientists in 1992 in VuQuang Nature Reserve drew the world’s attention to the biodiversity associated with this mountainchain. Since that first remarkable discovery, many other new species have been found, including anumber of large mammals such as the large-antlered (giant) muntjac (Muntiacus vuquangensis) and theAnnamite striped rabbit (Nesolagus timminsi). These discoveries highlight the Greater Truong Son asone of the world’s most remarkable and unique ecoregions. In addition to these species totally relianton successful conservation in the ecoregion, a number of wider-ranging, highly threatened species suchas the Asian elephant (Elephas maximus), tiger (Panthera tigris) and the world’s most endangered largemammal, the lesser one-horned (Javan) rhinoceros (Rhinoceros sondaicus) are found in the ecoregion.
The Central Truong Son Initiative* is a pilot initiative being developed by WWF’s Greater Truong SonEAP, with a view towards establishing the process of working at three scales - ecoregional/nationalpolicy, landscape and site. The aim of this fledgling initiative is to create a partnership of a broad rangeof stakeholders - from local communities to international organisations - working together to securebiodiversity conservation and sustainable development in the Central Truong Son Landscape (CTSL).
Following the methodology of the ecoregional approach, the Central Truong Son Initiative is based oncoordinated conservation action, designed under a large-scale framework and guided by a long-termvision of success. The approach is based on the recognition that uncoordinated actions at individualsites are neither efficient nor effective at conserving functioning ecological systems or halting the lossof natural resources. In order to be more effective, a more ambitious coordinated effort is required thatis developed and designed under an overarching strategy. The need for such a coordinated effortresulted in the establishment of an advisory group comprising 16 government institutions. Thisunprecedented collaboration will work as a vital support body to the Central Truong Son Initiative inits planning process towards a conservation strategy for the CTSL.
In order to develop such a comprehensive, overarching strategy, there is a great deal of information thatneeds to be assimilated. Through a process of lengthy and detailed consultations, the necessaryinformation has been identified and collected. This series of reports presents that information in aformat that is both suitable for informing those involved with the strategy development process, andconducive to those merely interested in the status and issues of the CTSL.
* Truong Son is also known as the "Say Phou Louang" in Lao P.D.R., and as the "Truong Son" internatinally. The Central Truong Son isone landscape in the ecoregion.

v
Socio-economic Issues in the Central Truong Son Landscape
EXECUTIVE SUMMARY
The report highlights clear differences between provinces within the priority landscape, and to a lesserextent within individual provinces.
Part I of the study provides an overview of the socio-economic issues of the Central Truong SonLandscape’s provinces. The geographical locations, administrative systems, socio-economic issues andthe development trends in some key provinces in the region are reviewed. Specifically, the CentralTruong Son Landscape (CTSL) encompasses six provinces and two supplementary provinces, covering17% of the nation’s territory: Quang Tri, Thua Thien Hue, Quang Nam, Da Nang, Gia Lai, Kon Tum,Binh Dinh and Quang Ngai.
Ten percent of the nation’s population reside here, including 33 ethnic groups (9% of regionalpopulation) and nine indigenous groups. Of these, over ninety percent live in Kon Tum and Gia Laiprovinces, and many live in rural mountainous areas.
Generally, there have been improvements in many sectors in the CTSL - namely health, education andtransport- as a result of increased government spending, subsidies and targeted developmentprogrammes. There has been a dramatic increase in university students, technical workers andvocational training workers. The region has a higher population growth rate than the national average,and over half of the population is of working age.
However, the improvements and benefits are unevenly distributed over the landscape, across differentsectors and during the year. Urban areas and commune centres are typically targeted for infrastructuredevelopment and investment, as are the coastal regions. During the 1996-2000 period, Da Nang(10.33%) and Gia Lai (12.65%) provinces experienced the highest economic growth; and in 1999, DaNang and Binh Dinh provinces had the highest Gross Domestic Products (GDP) in the region. Whilstthe agro-forestry sector declines in the region, the industry-construction sector is experiencing thehighest growth rate of all sectors in all provinces except one. Eighty percent of the population derivetheir income from the agro-forestry sector, which collectively accounts for over 60% of the land area.
Conversely, many of those living in remote, mountainous areas - predominantly ethnic minorities -remain isolated and live in substandard conditions due to a combination of factors related to thedifficult terrain in which they live and to the focus of development in urban and commune centres:
- inaccessible and/or untarred roads (particularly in Quang Nam province); - lack of access to clean and centralized water supplies; - lack of access to major electricity suppliers; - low communications capacity (2.2 of 100 people have telephones) and minimal
interpersonal contact.
As such, access to adequate health care, health and education facilities, and maintainance of languageskills (i.e. Vietnamese) are issues of concern, among others. The risk of contracting diseases such asdysentry and tuberculosis are high in many regions, and malaria regularly plagues people living inmountainous areas.
As a whole, the region remains the poorest in Vietnam, with nearly all provinces on the national povertylist. Notably, Quang Tri, Quang Ngai and Kon Tum have the highest poverty rate, which peaks at nearly30%. This doubles in the mountainous regions; in Kon Tum, the vast majority of peoples living inpoverty and starvation are ethnic minorities. Those experiencing positive change over time live closeto roads or in town peripheries, and are involved in non-agricultural sectors, such as local governmentstaff, civil servants and teachers.
vi
Socio-economic Issues in the Central Truong Son Landscape
The per capita income in the Central Truong Son Landscape is 214 USD per year, which is 70% of thenational average. Although three hundred kilograms of rice are available per person, there can beshortages throughout the year of 3-4 months in some areas.
Environmental concerns have arisen due to the construction of the Ho Chi Minh highway, whichcrosses several provinces in the Truong Son Landscape, and the development of unused land of poorquality. Environment-friendly technology however, namely small scale hydropower generators, mayprovide solutions for people living in remote areas.
Three kinds of migration occur in the CTSL: in-region migration between localized areas; planned andfree migration among regional provinces; and the external migration of groups from provinces north ofthe CTSL. Generally, the main drive behind migration comes from experiencing economic hardships.One consequence is a significant increase in the number of people living in mountainous areas,particularly in areas with fertile basalt-based soil and in primary forests.
Four fundamental objectives drive the short and long-term orientation of socio-economic developmentin the provinces.
1. To attach great importance to the implementation of industrialization/modernization inagricultural development and rural upgradation. Changing the agricultural and rural economyinto large-scale production is both an immediate and long-term lasting need.
2. To promote the economic transference mechanism, linking agricultural development with theprocessing industry and professional work generation. Also cementing production with anavailable market in order to establish the combination between agriculture, industry, service andmarketing.
3. To enhance the advantages of all areas, rapidly applying scientific/technological achievements tothe development of agricultural commodities, thus meeting increasing demands for agriculturalproducts and industrial materials.
4. To develop the agricultural sector in line with other economic sectors. The State’s economy willplay a leading role in combination with the cooperative economy, to gradually build thefoundations.
Part II focuses on providing information to form the basis of analyzing some economic, cultural, andsocial features of the ethnic minorities and of mountainous areas, in relation to the location andobjectives of conservation actions.
Part III touches upon the groups and organizations involved in the region’s conservation.
Part IV presents consequences and related recommendations:
� The slash and burn cultivation system carried out by the ethnic minority people is not the keyreason leading to environmental degradation presently, greater impacts come from other causes.
� The Truong Son region and Central Highlands cover a considerable area that could be exploitedin the future for the purposes of existence, especially in arranging/reconciling residents amongareas.

vii
Socio-economic Issues in the Central Truong Son Landscape
� The development of the Central Truong Son Landscape should be motivated on the basis ofconcrete studies, detailed projection, and contents corresponding to human and ecological featuresin each area and in every ethnic group, thus avoiding unplanned and unbalanced development.This is necessary for both the settled and protected areas.
� Through the tendency of expanding the area for agricultural cultivation, ecological conservationand watershed protection, the resources available for the ethnic groups will be graduallynarrowed. Conservation will only be truly successful after economic stability has been created forthe influenced groups.
� The promotion of the role of local communities in natural resource management and enhancementof participation via the establishment of land-use rights regulations, both in written and traditionalforms, are important measures. Community based traditions and democratic decision-makingprocesses have the potential to encourage them to be core members in forest protection and naturalresource conservation.
� The culture of ethnic minorities is cemented by the forest and its wildlife.
� Notably, the women’s role is highly respected in not only matriarchical societies, but in othercommunities as well. Their daily lives are intertwined with the forest; as the core of the family,they produce food, fetch logs and water, and raise animals to feed their children. They willgradually depend less on the forest if their family’s living standards are improved. Only then,animal hunting will cease to be the main income for households.
� The rights and obligations of the inhabitants regarding the protection of the natural environmentshould be effectively promoted, in order to help raise their awareness of the value of the region’sbiodiversity. Social organizations need to be strengthened to ensure local environmentmaintenance and natural resource management.
� Holistic, inter-sectoral cooperation among the relevant agencies at central or local levels isneeded; most importantly their participation in devising and implementing plans under a unitedprogramme is needed.
� The Central Truong Son Landscape’s conservation and development should be recognized instrategic national and sub-national development policies.
The Central Truong Son Landscape’s natural resource management and conservation play animportant role in the national and regional development. This is not only relevant to biodiversityand environmental protection issues, but also to the conservation of ethnic minorities’ identity andcultural values in the region.
viii
Socio-economic Issues in the Central Truong Son Landscape
ACKNOWLEDGEMENTS
Central Truong Son Initiative’s acknowledgementThe successful completion of the Central Truong Son Initiative’s initial stage is thanks to thehelp,support and advice of a vast number of people and organizations. It is impossible to thankevery single one of these contributors within this page, but an attempt has been made to thank asmany people as possible and hopefully all organizations involved.
The programme and the entire process behind it recognizes the invaluable support of HisExcellency, Vice Minister Nguyen Van Dang, Ministry of Agriculture and Rural Developmentwhose level of involvement and commitment have been integral to the development of theCentral Truong Son Initiative. The Initiative must pay a particular debt of thanks to Dr. NguyenBa Thu, Director of the Forest Protection Department of MARD, for the constant support andenthusiasm he has provided during the development process.
The six-member core consultative group was a driving force behind the shaping of this pro-gramme. Therefore, special acknowledgement for the key role in the process undertaken by thecore advisory group is due to Mr. Tran Quoc Bao, Prof. Le Quy, Mr. Vu Van Dung, Mr. Tran LienPhong, Mr. Nguyen Lam Thanh, Prof. Dr. Pham Nhat.
The technical and administrative support for the development of the Initiative was provided by theEcoregion Action Programme office at WWF Indochina in Hanoi led by Michael Baltzer togetherwith Mac Tuyet Nga, James Hardcastle, Nguyen Thi Dao and Rob Shore. Also from WWFIndochina Programme, special thanks are due to Eric Coull, Hoang Thanh, Tran Minh Hien,Barney Long, Mai Ky Vinh, Martin Geiger, Le Trong Trai and other staff from WWF Indochinafor their support and involvement, Jenny Springer and Kristin Clay from WWF-US for theirinvaluable support during the process.
Finally, an gratitude is due to the provincial People’s Committees, Forest ProtectionDepartments, Agriculture and Rural Development Departments and all the other local stakehold-ers consulted in the Central Truong Son Landscape provinces (Quang Tri, Thua Thien Hue, DaNang, Quang Nam, Kon Tum, Gia Lai and Binh Dinh).
USAID and WWF-US has provided the invaluable financial support for the development ofthe Central Truong Son Initiative.
Author’s acknowledgementThis study was only possible with the financial support provided by WWF. We would also such asto thank the Forest Protection Department (MARD) for their assistance to complete this study. Wewould such as to thank Mr. Mike Baltzer and Ms. Nguyen Thi Dao from WWF Indochina’sEcoregion Action Programme for providing us with valuable consultations and for whole-heartedsupport during the research process.
We would also such as to thank Mr. Cao Dang Viet, Quang Tri Sub-department of ForestProtection; Mr. Hoang Ngoc Khanh, Thua Thien Hue Sub-department of Forest Protection; Mr.Dang Duc Thu, DARD in Da Nang; Mr. Ho Thanh Hoang, Kon Tum Sub-department of ForestProtection; Mr. Nguyen Huu Long, Gia Lai Sub-department of Forest Protection; Mr. Dang DinhNguyen, Quang Nam Sub-department of Forest Protection for their help in arranging fieldresearch and for giving us valuable information during this study.
A special debt of thanks is due to the leaders and officials in charge of ethnic minority affairs atQuang Tri, Thua Thien Hue, Quang Nam, Gia Lai, Kon Tum, Quang Ngai and Binh Dinhprovinces; Kon Tum DOLISA and People’s Committee for their great efforts in providing helpfulinformation and documents as well as for their willingness to discuss related issues.
Additionally, I would such as to thank all colleagues and CEMMA officials who have contributedgreatly to this report.
TABLE OF CONTENTS
BACKGROUND . . . . . . . . . . . . . . . . . . . . . . . . . . . . . . . . . . . . . . . . . . . . . . . . . . . . . . . . . . . . . . . . . .iiiEXECUTIVE SUMMARY . . . . . . . . . . . . . . . . . . . . . . . . . . . . . . . . . . . . . . . . . . . . . . . . . . . . . . . . . .vACKNOWLEDGEMENTS . . . . . . . . . . . . . . . . . . . . . . . . . . . . . . . . . . . . . . . . . . . . . . . . . . . . . . . .viiiTABLE OF CONTENTS . . . . . . . . . . . . . . . . . . . . . . . . . . . . . . . . . . . . . . . . . . . . . . . . . . . . . . . . . . .ixLIST OF TABLES . . . . . . . . . . . . . . . . . . . . . . . . . . . . . . . . . . . . . . . . . . . . . . . . . . . . . . . . . . . . . . . . .xABBREVIATIONS AND ACRONYMS . . . . . . . . . . . . . . . . . . . . . . . . . . . . . . . . . . . . . . . . . . . . . . .xi
PART I: PREFACE1.1 Introduction . . . . . . . . . . . . . . . . . . . . . . . . . . . . . . . . . . . . . . . . . . . . . . . . . . . . . . . . . . . . .11.2 Overall goals, scope, study methodology and progress . . . . . . . . . . . . . . . . . . . . . . . . . . . .2
1.2.1 Overall goal . . . . . . . . . . . . . . . . . . . . . . . . . . . . . . . . . . . . . . . . . . . . . . . . . . . . . . . .21.2.2 Scope of information collection and assessment . . . . . . . . . . . . . . . . . . . . . . . . . . . .21.2.3 Collection and analysis methods . . . . . . . . . . . . . . . . . . . . . . . . . . . . . . . . . . . . . . . .2
1.3 Limitations and challenges . . . . . . . . . . . . . . . . . . . . . . . . . . . . . . . . . . . . . . . . . . . . . . . . . .3
PART II: AN OVERVIEW OF THE SOCIO-ECONOMIC ISSUES 2.1 Geographic location and administration . . . . . . . . . . . . . . . . . . . . . . . . . . . . . . . . . . . . . . . .52.2 Socio-economic issues . . . . . . . . . . . . . . . . . . . . . . . . . . . . . . . . . . . . . . . . . . . . . . . . . . . . . .7
2.2.1 Population and labor . . . . . . . . . . . . . . . . . . . . . . . . . . . . . . . . . . . . . . . . . . . . . . . . . .72.2.2 Ethnic minorities . . . . . . . . . . . . . . . . . . . . . . . . . . . . . . . . . . . . . . . . . . . . . . . . . . . . .82.2.3 Economic growth rate and transference of economic mechanisms . . . . . . . . . . . . .112.2.4 Agro-forestry industry . . . . . . . . . . . . . . . . . . . . . . . . . . . . . . . . . . . . . . . . . . . . . . . .162.2.5 Infrastructure . . . . . . . . . . . . . . . . . . . . . . . . . . . . . . . . . . . . . . . . . . . . . . . . . . . . . . .172.2.6 Education . . . . . . . . . . . . . . . . . . . . . . . . . . . . . . . . . . . . . . . . . . . . . . . . . . . . . . . . .202.2.7 Healthcare . . . . . . . . . . . . . . . . . . . . . . . . . . . . . . . . . . . . . . . . . . . . . . . . . . . . . . . . .222.2.8 Migration . . . . . . . . . . . . . . . . . . . . . . . . . . . . . . . . . . . . . . . . . . . . . . . . . . . . . . . . . .222.2.9 Poverty and starvation status . . . . . . . . . . . . . . . . . . . . . . . . . . . . . . . . . . . . . . . . . .24
2.3 Development tendencies of some core provinces . . . . . . . . . . . . . . . . . . . . . . . . . . . . . . . .26
PART III: SOME SOCIO-ECONOMIC AND CULTURAL FEATURES OF THE ETHNICMINORITIES AND SOME MOUNTAINOUS AREAS
3.1 Administrative geography and population . . . . . . . . . . . . . . . . . . . . . . . . . . . . . . . . . . . . .303.2 Traditional society features . . . . . . . . . . . . . . . . . . . . . . . . . . . . . . . . . . . . . . . . . . . . . . . . .303.3 Shifting cultivation . . . . . . . . . . . . . . . . . . . . . . . . . . . . . . . . . . . . . . . . . . . . . . . . . . . . . . .323.4 Medical care and personal healthcare . . . . . . . . . . . . . . . . . . . . . . . . . . . . . . . . . . . . . . . .333.5 Education in mountainous areas . . . . . . . . . . . . . . . . . . . . . . . . . . . . . . . . . . . . . . . . . . . . .343.6 Economic features . . . . . . . . . . . . . . . . . . . . . . . . . . . . . . . . . . . . . . . . . . . . . . . . . . . . . . .343.7 Socio-economic development programmes/projects in the region . . . . . . . . . . . . . . . . . . .363.8 Emerging problems in socio-economic development . . . . . . . . . . . . . . . . . . . . . . . . . . . . .39
PART IV: ORGANIZATIONS INVOLVED IN CONSERVATION 4.1 Local level resident groups . . . . . . . . . . . . . . . . . . . . . . . . . . . . . . . . . . . . . . . . . . . . . . . . .414.2 Watershed-based natural resource users . . . . . . . . . . . . . . . . . . . . . . . . . . . . . . . . . . . . . . .414.3 Local administrative system . . . . . . . . . . . . . . . . . . . . . . . . . . . . . . . . . . . . . . . . . . . . . . . .424.4 Local socio-political organizations . . . . . . . . . . . . . . . . . . . . . . . . . . . . . . . . . . . . . . . . . . .434.5 Other related organizations . . . . . . . . . . . . . . . . . . . . . . . . . . . . . . . . . . . . . . . . . . . . . . . . .43
PART V: SUMMARY AND RECOMMENDATIONS ON SOME ISSUES RELATING TONATURAL RESOURCE MANAGEMENT AND CONSERVATION . . . . . . . . . . . . . . . .44
BIBLIOGRAPHY. . . . . . . . . . . . . . . . . . . . . . . . . . . . . . . . . . . . . . . . . . . . . . . . . . . . . . . . . . . . . . . . .46
INDEX I: Area and population of the CTSL’s provinces/districts . . . . . . . . . . . . . . . . . . . . . . . . . . .54INDEX II: The CTSL’s area, population and density . . . . . . . . . . . . . . . . . . . . . . . . . . . . . . . . . . . . .56INDEX III: Report series of the Central Truong Son Initiative . . . . . . . . . . . . . . . . . . . . . . . . . . . . . .59
ix
Socio-economic Issues in the Central Truong Son Landscape
x
Socio-economic Issues in the Central Truong Son Landscape
LIST OF TABLES
Table 1: Administration and population in the Central Truong Son provinces 1999-2000 . . . . . . . . .6
Table 2: Mountainous areas and Highland areas - areas II and III . . . . . . . . . . . . . . . . . . . . . . . . . . .6
Table 3: Population and labor in the CTSLs’ provinces 1999-2007 . . . . . . . . . . . . . . . . . . . . . . . . . .7
Table 4: List of ethnic minority groups in the Central Truong Son Landscape . . . . . . . . . . . . . . . . .9
Table 5: Locations of ethnic minority populations in the CTSL . . . . . . . . . . . . . . . . . . . . . . . . . . . .10
Table 6: Provinces’ GDP in the Central Truong Son Landscape 1996-2000 . . . . . . . . . . . . . . . . . .12
Table 7: Percentage of value mechanism of key economic sectors . . . . . . . . . . . . . . . . . . . . . . . . . .12
Table 8: Growth rate of the provinces’ main sectors in the CTSL 1996-2000 . . . . . . . . . . . . . . . . .13
Table 9: Provinces’ 1999 income per head in the Central Truong Son Landscape . . . . . . . . . . . . . .13
Table 10: Economic growth rate in Quang Tri . . . . . . . . . . . . . . . . . . . . . . . . . . . . . . . . . . . . . . . . .14
Table 11: Economic growth rate in Thua Thien Hue . . . . . . . . . . . . . . . . . . . . . . . . . . . . . . . . . . . . . .14
Table 12: Economic growth rate in Da Nang City . . . . . . . . . . . . . . . . . . . . . . . . . . . . . . . . . . . . . . . .14
Table 13: Economic growth rate in Binh Dinh . . . . . . . . . . . . . . . . . . . . . . . . . . . . . . . . . . . . . . . . . .14
Table 14: Economic growth rate in Gia Lai . . . . . . . . . . . . . . . . . . . . . . . . . . . . . . . . . . . . . . . . . . . .15
Table 15: Economic growth rate in Kon Tum . . . . . . . . . . . . . . . . . . . . . . . . . . . . . . . . . . . . . . . . . . .15
Table 16: Economic growth rate in Quang Nam . . . . . . . . . . . . . . . . . . . . . . . . . . . . . . . . . . . . . . . . .15
Table 17: Economic growth rate in Quang Ngai . . . . . . . . . . . . . . . . . . . . . . . . . . . . . . . . . . . . . . . . .15
Table 18: Land Used in the Central Truong Son Landscape during 1999-2000 . . . . . . . . . . . . . . . . .16
Table 19: Percentage of land-use in the Central Truong Son Landscape . . . . . . . . . . . . . . . . . . . . . .17
Table 20: Provinces’ roads in the Central Truong Son Landscape . . . . . . . . . . . . . . . . . . . . . . . . . . .18
Table 21: Rural infrastructure condition . . . . . . . . . . . . . . . . . . . . . . . . . . . . . . . . . . . . . . . . . . . . . . .20
Table 22: Education and training in the Central Truong Son Landscape . . . . . . . . . . . . . . . . . . . . . .21
Table 23: Health care status in the Central Truong Son Landscape . . . . . . . . . . . . . . . . . . . . . . . . . .22
Table 24: Gia Lai’s migration during 1975-2000 . . . . . . . . . . . . . . . . . . . . . . . . . . . . . . . . . . . . . . . . .24
Table 25: Poverty and starvation in the CTSL’s provinces . . . . . . . . . . . . . . . . . . . . . . . . . . . . . . . . .25
Table 26: Poverty and starvation status in Kon Tum in 2000 . . . . . . . . . . . . . . . . . . . . . . . . . . . . . . .26
Table 27: Economic structure and production form of the ethnic minorities . . . . . . . . . . . . . . . . . . .36
xi
Socio-economic Issues in the Central Truong Son Landscape
ABBREVIATIONS AND ACRONYMS
BEMMA Provincial Committee for Ethnic minorities and mountainous area affairsCEMMA State Committee for Ethnic Minorities and Mountainous Area AffairsDAFP Department of Agro-forestry and Pisciculture DARD Department of Agriculture and Rural DevelopmentDoE Department of EducationDoI Department of IndustryDoL Department of LandDOLISA Department of Labor, Invalid and Social AffairsDoS Department of StatisticsDPC District People’ s CommitteeDRNEZ Department of Resettlement and New Economic ZonesFAO Food and Agriculture OrganizatioFPD Forest Protection DepartmentFU Farmer’s UnionGDPT General Department of Post and TelecommunicationHPP Highland People’s ProgrammeMARD Ministry of Agriculture and Rural DevelopmentMoCI Ministry of Culture and InformationMoET Ministry of Education and TrainingMoH Ministry of HealthMOLISA Ministry of Labor, Invalid and Social AffairsMPI Ministry for Planning and InvestmentPPC Provincial People’ s CommitteeSFPD Sub-department of Forest ProtectionVEC Vietnam Electricity CorporationWU Women’s UnionWWF World Wide Fund For Nature

xii
Socio-economic Issues in the Central Truong Son Landscape
1
Socio-economic Issues in the Central Truong Son Landscape
PART I: PREFACE
1.1 Introduction
The Central Truong Son Landscape is recognized to be of critical importance for biodiversityconservation on national, regional, and global scales. With clear awareness of the significanceand importance of conservation of the country’s natural wealth within the nationaldevelopment strategy, the Forest Protection Department under MARD and WWF havetogether implemented series of activities with the mandate to promote regional strategicconservation.
In November 2000, a meeting was held in Hue between numerous different stakeholders,including scientists, Government officers, the state management officers from central level andlocal levels with the aim at promoting and absorbing initiatives to ensure the long-termconservation of the Central Truong Son Landscape.
Through the systematical approach to issues related to conservation, and especially through theprocess and cycle of development, many opportunities, challenges, barriers have beenuncovered. In addition to the knock-on effects of the war, the socio-economic growth in theregion has experienced huge changes and variations, during the recent decades. It is essentialto conduct precise analysis of the socio-economic situation, to determine the influencingfactors in order to put forward the priorities and conventions.
Information collection and analysis activities are operational with the support from theprovincial working groups selected and made contract by WWF (the working groups were notestablished in Binh Dinh and Quang Ngai provinces, as they did not fall within the originalprioritized areas). Field trips were organized to work with the local working groups of the eightprovinces.
The implementation process and support from the local working groups
1. Preparation of the list of information, data, and reports that need collecting. Theinformation is listed in the nomenclature of the table index at the provincial, district, andcommunal levels. A work agenda and content list was been sent to provincial teams 10 days inadvance to allow preparation of information, documents, and site visits.
2. Working with the local groups: as planned, information collection was implemented with thehelp of the provincial working groups. Each group was comprised of three people: one fromPeople’s Committee office, and the remaining two members from DARD and SFPD. The headof group who works in DARD or SFPD was responsible for liaison and support for theactivities.
In addition, the working group worked with the agencies in charge of Ethnic minority affairsto collect further information and supplement the information collected by the local workinggroups, especially information regarding to Ethnic minorities and mountainous areas issues.
3. Further information collection, summary and report on the study: conducted from HanoiThis study report is divided into four parts:
2
Socio-economic Issues in the Central Truong Son Landscape
Part I: An overview of the socio-economic issues of the Central Truong SonLandscape’s provinces, mentioning the geographical location, administration, the socio-economic issues and the development tendencies of some key provinces in the region.
Part II: focuses on providing information to form the basis of analyzing someeconomic, cultural, and social features of the Ethnic minorities and mountainous areas,in relation to the location and objectives of the conservation actions.
Part III: touching upon the groups/organizations involved in region’s conservation.
Part IV: consequences and related recommendations.
The conceptions in this study originated from researching members. However, they are alsobased on databases, study reports, and reports from various organizations/local agencies.
1.2 Overall goals, scope, study methodology and progress
1.2.1 Overall goal
This study aims to give an initial background of the current issues and the orientation of socio-economic development in the eight provinces of the region with particular regard to agro-forestry, healthcare, education, population, labor, migration, poverty and starvation. Thusproviding an overall view of the factors relating directly or indirectly to biodiversityconservation. In addition, this report provides an analysis of the Ethnic minorities andmountainous areas (the areas within the boundary of the Central Truong Son PriorityLandscape), with regard to some important aspects such as the system of traditional society,traditional cultivation and income sources.
The study then provides the data that forms the basis for the analysis and evaluation of theenvironmental/socio-economic picture.
1.2.2 Scope of information collection and assessment
The information collection was conducted in eight provinces: Quang Tri, Thua Thien Hue, DaNang, Gia Lai, Kon Tum, Quang Ngai and Binh Dinh.
Information collected can be summarized within the following groups: administration,population, labor, land-use, agro-forestry production, healthcare, education, infrastructure,hunger alleviation and poverty reduction.
Degree of information: Data was chiefly collected at provincial level, with additional data atdistrict, commune and community levels.
The related agencies: FPD - MARD, DARD, BEMMA, DRNEZ, DOLISA
1.2.3 Collection and analysis methods
Collection of quantitative and qualitative data was compiled with the basic information listalready available in existing documents and reports from localities.
3
Socio-economic Issues in the Central Truong Son Landscape
Expert method: based on the results of discussion and information exchange, provided for thespecialists and management officers.
RRA: collection and analysis of information from meeting and working with villagers.
Comparative: as the data are not homogenous and of unity, the most reliable or united data willbe selected - for example from the Provincial People’s Committees (PPC), the Departments ofStatistics, or the Provincial Committee for Ethnic Minorities and Mountainous Area Affairs(BEMMA).
Analysis and synthesis method: based on secondary data. The data are built, synthesized andevaluated as requested.
1.3 Limitations and challenges
Throughout the process, we have been met with willing support from the working groupmembers as well as the functional agencies. However, several limitations and difficulties havemade an impact on the quality and progress of this study.
1.3.1 With regard to scope and essence
The objectives and requirements are much bigger than the provided resources including humanresource, time and available funds.
Information collection was carried out in a large area comprised of eight provinces (covering46 districts with nearly 600 communes/wards). Besides this, it is very difficult to distinguishthe assessment and analysis of general issues from those in regional provinces recognized tobe in conservation areas (46 districts).
The information collected includes various sectors (such as health care, education,infrastructure, agro-forestry, population, ethnic minorities) and multiple subjects within asector.
Detailed data was also requested: including information at three levels (Provincial, district, andcommunal levels).
1.3.2 As for the information provided
The central level data: the Central Truong Son Landscape is geographically defined throughconservation requirements, rather than as an economic region of Vietnam. Consequently, therequired data collection and evaluation on this region has not been done, resulting in barriersin processing information and synthesising the data.
The information content and the indicators related to socio-economic issues as per requestedhave not been systematically supervized and synthesized leading to the insufficientfundamental indicators at provincial, district levels and especially at communal level. Thereports from local agencies place more emphasis upon qualitative and common data.
Data from different sources is neither homogenous nor unified.
4
Socio-economic Issues in the Central Truong Son Landscape
1.3.3 Other problems
Each province established a group of three members to support the activities. In practicehowever, there was limited participation for a number of reasons. For example, only onemember participated in Kon Tum, plus two in Hue, Quang Tri, and Quang Nam respectively.In general, it seemed the work was mainly carried out by the head of group, and that theparticipation of the other members was limited.
The data collection was quite complicated as it is related to many different agencies while thepartners were not ready to meet the requests. Barriers to collection appeared, and there wasvery little support in T.T Hue province.
In order to complete the task, the working group took the initiative of planning to work withProvincial State Committees for Ethnic Minorities and Mountainous Area Affairs (CEMMA),as well as with the other agencies, which facilitated and provided data. The informationcollected from Binh Dinh and Quang Ngai provinces depended entirely on ProvincialCEMMAs as these provinces did not establish working groups.
5
Socio-economic Issues in the Central Truong Son Landscape
PART II: AN OVERVIEW OF THE SOCIO-ECONOMIC ISSUES
2.1 Geographic location and administration 1
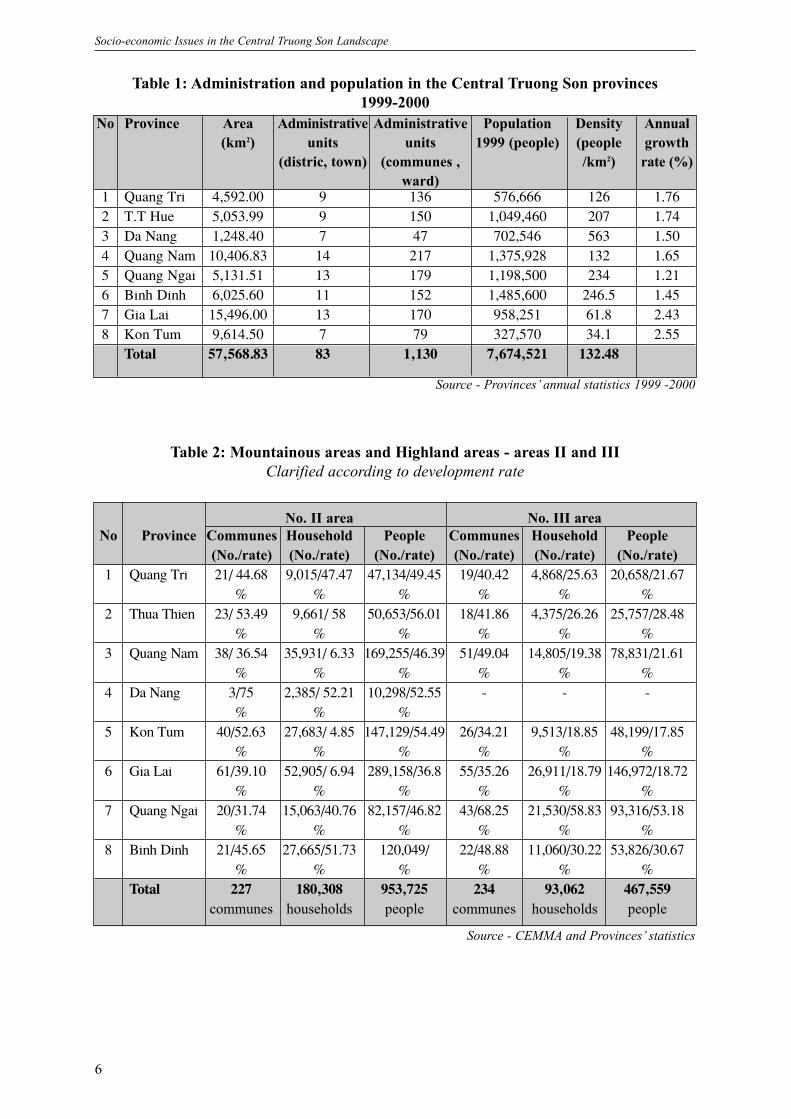
The Central Truong Son Landscape is centered on the geographical area comprising of sixprovinces: Quang Tri, Thua Thien Hue, Quang Nam, Da Nang, Gia Lai and Kon Tum with twosupplementary provinces: Binh Dinh and Quang Ngai. The area covers 83 administrative unitsat the district/town level with 1,130 communes, wards and townships. The total area is57,928.83 km2, which represents 17% of the whole country’s area. Of which, the mountainous- highland area makes up more than 75% of the total natural area. Its population is 7,670,194people, constituting around 10% of the total population; population density is 132 people/km2.The CTSL is the home to 33 different ethnic groups and nine indigenous groups. Among them,there are small ethnic groups such as the Brau and Ro Mam.
The Central Truong Son Landscape with the mighty southern and northern Truong Son massifsis considered as the most uncolonisable part of the Central Provinces. The mountain range runsfrom north to south, with the majority of the terrain slopping from west to east. The regionincludes high mountain peaks such as Ngoc Tien (2,032m), Ngoc Lum Leo (2,023m) and NgocLinh (2,598m), the highest mountain of the Southern Truong Son range.
The river systems of the central region and highlands originate from here, with a huge networkof rivers such as the Huong, Vu Gia - Thu Bon, Tra Khuc, and Ba rivers that mainly runtowards the coast. Some of other river systems (chiefly the Sesan) lie in the Mekong basinrunning through Lao P.D.R. to the East Sea.
Due to highly mountainous terrain and isolation, almost all of the inhabitants settle in theplains, near the coast. The huge western portion lies very far from the centers of development,with fewer people and poorly developed economic conditions.
Besides the advantages, there are disadvantages to the socio-economic development process inthis region. The Central Truong Son Landscape still is evaluated as the poorest region of thecountry. There are 234 communes in extreme difficulty in the region, from a total of 2,325communes that benefited from the National Programme 135, accounting for 11.62% 2.
1 Data source: Eight provinces’ statistics, 1999-20002 List of extreme communes, secure areas that benefited from Programme 135, CEMMA, 5/2001
6
Socio-economic Issues in the Central Truong Son Landscape
Source - Provinces’ annual statistics 1999 -2000
No Province Area Administrative Administrative Population Density Annual(km2) units units 1999 (people) (people growth
(distric, town) (communes , /km2) rate (%)ward)
1 Quang Tri 4,592.00 9 136 576,666 126 1.762 T.T Hue 5,053.99 9 150 1,049,460 207 1.743 Da Nang 1,248.40 7 47 702,546 563 1.504 Quang Nam 10,406.83 14 217 1,375,928 132 1.655 Quang Ngai 5,131.51 13 179 1,198,500 234 1.216 Binh Dinh 6,025.60 11 152 1,485,600 246.5 1.457 Gia Lai 15,496.00 13 170 958,251 61.8 2.438 Kon Tum 9,614.50 7 79 327,570 34.1 2.55
Total 57,568.83 83 1,130 7,674,521 132.48
No. II area No. III areaNo Province Communes Household People Communes Household People
(No./rate) (No./rate) (No./rate) (No./rate) (No./rate) (No./rate)1 Quang Tri 21/ 44.68 9,015/47.47 47,134/49.45 19/40.42 4,868/25.63 20,658/21.67
% % % % % %2 Thua Thien 23/ 53.49 9,661/ 58 50,653/56.01 18/41.86 4,375/26.26 25,757/28.48
% % % % % %3 Quang Nam 38/ 36.54 35,931/ 6.33 169,255/46.39 51/49.04 14,805/19.38 78,831/21.61
% % % % % %4 Da Nang 3/75 2,385/ 52.21 10,298/52.55 - - -
% % %5 Kon Tum 40/52.63 27,683/ 4.85 147,129/54.49 26/34.21 9,513/18.85 48,199/17.85
% % % % % %6 Gia Lai 61/39.10 52,905/ 6.94 289,158/36.8 55/35.26 26,911/18.79 146,972/18.72
% % % % % %7 Quang Ngai 20/31.74 15,063/40.76 82,157/46.82 43/68.25 21,530/58.83 93,316/53.18
% % % % % %8 Binh Dinh 21/45.65 27,665/51.73 120,049/ 22/48.88 11,060/30.22 53,826/30.67
% % % % % %Total 227 180,308 953,725 234 93,062 467,559
communes households people communes households people
Table 2: Mountainous areas and Highland areas - areas II and IIIClarified according to development rate
Source - CEMMA and Provinces’ statistics
Table 1: Administration and population in the Central Truong Son provinces1999-2000
7
Socio-economic Issues in the Central Truong Son Landscape
2.2 Socio-economic issues
2.2.1 Population and labor
Population and distribution 3
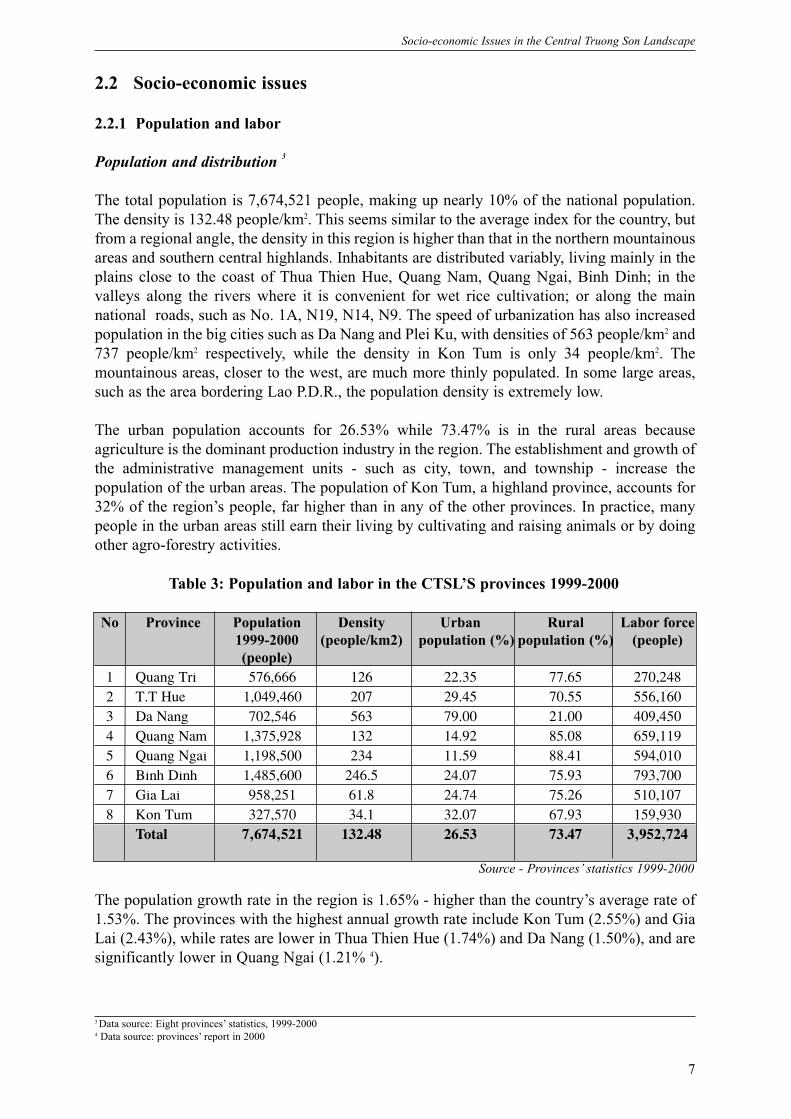
The total population is 7,674,521 people, making up nearly 10% of the national population.The density is 132.48 people/km2. This seems similar to the average index for the country, butfrom a regional angle, the density in this region is higher than that in the northern mountainousareas and southern central highlands. Inhabitants are distributed variably, living mainly in theplains close to the coast of Thua Thien Hue, Quang Nam, Quang Ngai, Binh Dinh; in thevalleys along the rivers where it is convenient for wet rice cultivation; or along the mainnational roads, such as No. 1A, N19, N14, N9. The speed of urbanization has also increasedpopulation in the big cities such as Da Nang and Plei Ku, with densities of 563 people/km2 and737 people/km2 respectively, while the density in Kon Tum is only 34 people/km2. Themountainous areas, closer to the west, are much more thinly populated. In some large areas,such as the area bordering Lao P.D.R., the population density is extremely low.
The urban population accounts for 26.53% while 73.47% is in the rural areas becauseagriculture is the dominant production industry in the region. The establishment and growth ofthe administrative management units - such as city, town, and township - increase thepopulation of the urban areas. The population of Kon Tum, a highland province, accounts for32% of the region’s people, far higher than in any of the other provinces. In practice, manypeople in the urban areas still earn their living by cultivating and raising animals or by doingother agro-forestry activities.
No Province Population Density Urban Rural Labor force1999-2000 (people/km2) population (%) population (%) (people)(people)
1 Quang Tri 576,666 126 22.35 77.65 270,2482 T.T Hue 1,049,460 207 29.45 70.55 556,1603 Da Nang 702,546 563 79.00 21.00 409,4504 Quang Nam 1,375,928 132 14.92 85.08 659,1195 Quang Ngai 1,198,500 234 11.59 88.41 594,0106 Binh Dinh 1,485,600 246.5 24.07 75.93 793,7007 Gia Lai 958,251 61.8 24.74 75.26 510,1078 Kon Tum 327,570 34.1 32.07 67.93 159,930
Total 7,674,521 132.48 26.53 73.47 3,952,724
Table 3: Population and labor in the CTSL’S provinces 1999-2000
Source - Provinces’ statistics 1999-2000
The population growth rate in the region is 1.65% - higher than the country’s average rate of1.53%. The provinces with the highest annual growth rate include Kon Tum (2.55%) and GiaLai (2.43%), while rates are lower in Thua Thien Hue (1.74%) and Da Nang (1.50%), and aresignificantly lower in Quang Ngai (1.21% 4).
3 Data source: Eight provinces’ statistics, 1999-20004 Data source: provinces’ report in 2000
8
Socio-economic Issues in the Central Truong Son Landscape
There is a large gap in the natural population growth rate between the low and high lands,ranging from 0.2% to 0.5% depending on the area. In Dak Doa (Gia Lai province) the annualgrowth rate can reach 4%.
The population growth rate between the rural and urban areas also shows great disparity, asmuch as 0.5-1%. The highland communities and ethnic minorities contribute to this number.In recent years, the Ministry of Health has implemented many programmes with a view toreducing the overpopulation rate, and to take care of people’s health at the same time.However, the results still show the limitations in the highlands, because the conditions andpractices of supporting services as well as the propaganda have not been supportive to thebeneficiaries.
The growth rate is less high in some poor areas of T.T. Hue and Quang Tri, partly becausepeople migrate to other provinces, while the highland provinces have to suffer great pressurefrom the steady growth rate.
Labor 5
According to 1999 statistics, there are 3,952,724 people of working age in the region,accounting for 51% of the population in the region. The young labor structure is a veryimportant force contributing to the socio-economic construction and development of theregion. However, the labor force differs among the provinces, e.g. 58% in Da Nang City, 48%in Kon Tum and only 46% in Quang Tri. This is partly explained by the movements of thelabor force between the less developed and more developed areas. In addition, there is a highnatural birth rate in some poor areas.
2.2.2 Ethnic minorities
Population and residence
According to the list of ethnic minority groups in Vietnam (declared in 1978), the CTSL hasendogenous communities with the following language origins:
+ South Asian origins: Mon-Kho Me group: Ba Na, Xo Dang, Co Tu, Bru, Van Kieu, Ta Oi,Gie -Trieng, Co, Ro Mam, and Brau.
+ Malayo-Polynesian origins: Malayo-Polynesian group: Gia Rai
5 Data source: Eight provinces’ statistics, 1999-2000
9
Socio-economic Issues in the Central Truong Son Landscape
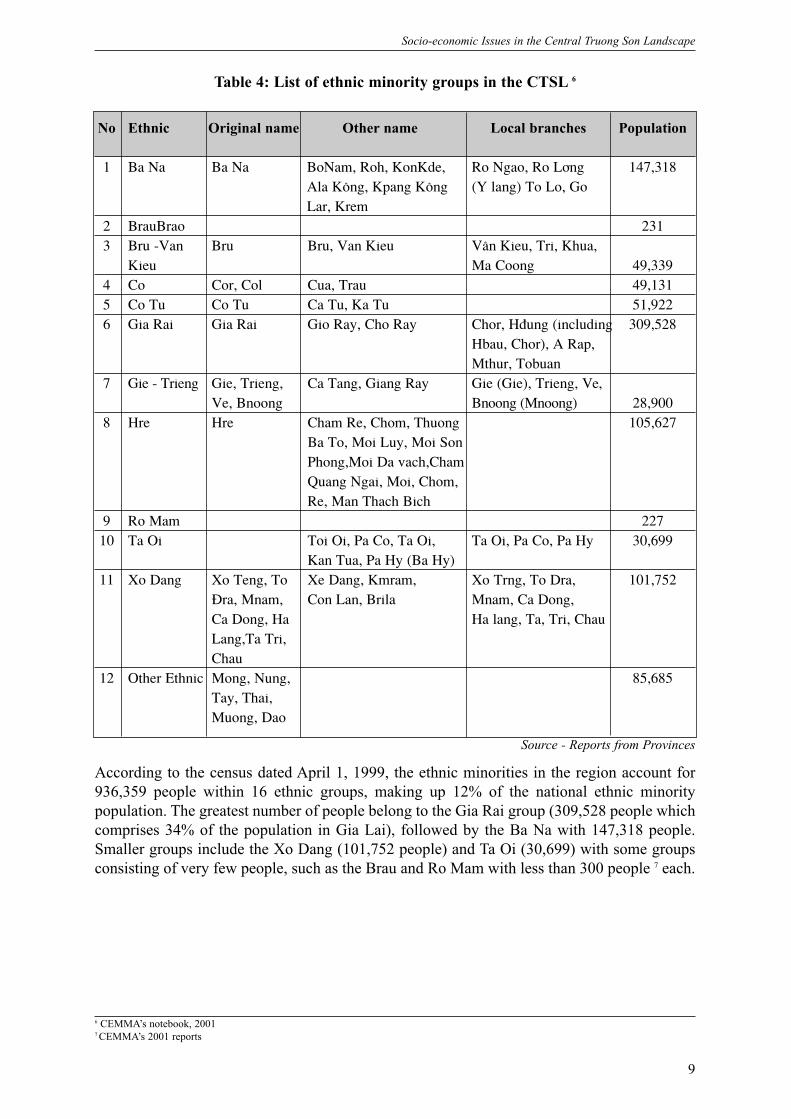
According to the census dated April 1, 1999, the ethnic minorities in the region account for936,359 people within 16 ethnic groups, making up 12% of the national ethnic minoritypopulation. The greatest number of people belong to the Gia Rai group (309,528 people whichcomprises 34% of the population in Gia Lai), followed by the Ba Na with 147,318 people.Smaller groups include the Xo Dang (101,752 people) and Ta Oi (30,699) with some groupsconsisting of very few people, such as the Brau and Ro Mam with less than 300 people 7 each.
Table 4: List of ethnic minority groups in the CTSL 6
No Ethnic Original name Other name Local branches Population
1 Ba Na Ba Na BoNam, Roh, KonKde, Ro Ngao, Ro L¨ng 147,318Ala K´ng, Kpang K´ng (Y lang) To Lo, Go Lar, Krem
2 BrauBrao 2313 Bru -Van Bru Bru, Van Kieu V©n Kieu, Tri, Khua,
Kieu Ma Coong 49,3394 Co Cor, Col Cua, Trau 49,1315 Co Tu Co Tu Ca Tu, Ka Tu 51,9226 Gia Rai Gia Rai Gio Ray, Cho Ray Chor, HÆung (including 309,528
Hbau, Chor), A Rap, Mthur, Tobuan
7 Gie - Trieng Gie, Trieng, Ca Tang, Giang Ray Gie (Gie), Trieng, Ve,Ve, Bnoong Bnoong (Mnoong) 28,900
8 Hre Hre Cham Re, Chom, Thuong 105,627Ba To, Moi Luy, Moi Son Phong,Moi Da vach,Cham Quang Ngai, Moi, Chom, Re, Man Thach Bich
9 Ro Mam 22710 Ta Oi Toi Oi, Pa Co, Ta Oi, Ta Oi, Pa Co, Pa Hy 30,699
Kan Tua, Pa Hy (Ba Hy)11 Xo Dang Xo Teng, To Xe Dang, Kmram, Xo Trng, To Dra, 101,752
ßra, Mnam, Con Lan, Brila Mnam, Ca Dong, Ca Dong, Ha Ha lang, Ta, Tri, ChauLang,Ta Tri, Chau
12 Other Ethnic Mong, Nung, 85,685Tay, Thai, Muong, Dao
Source - Reports from Provinces
6 CEMMA’s notebook, 20017 CEMMA’s 2001 reports
10
Socio-economic Issues in the Central Truong Son Landscape
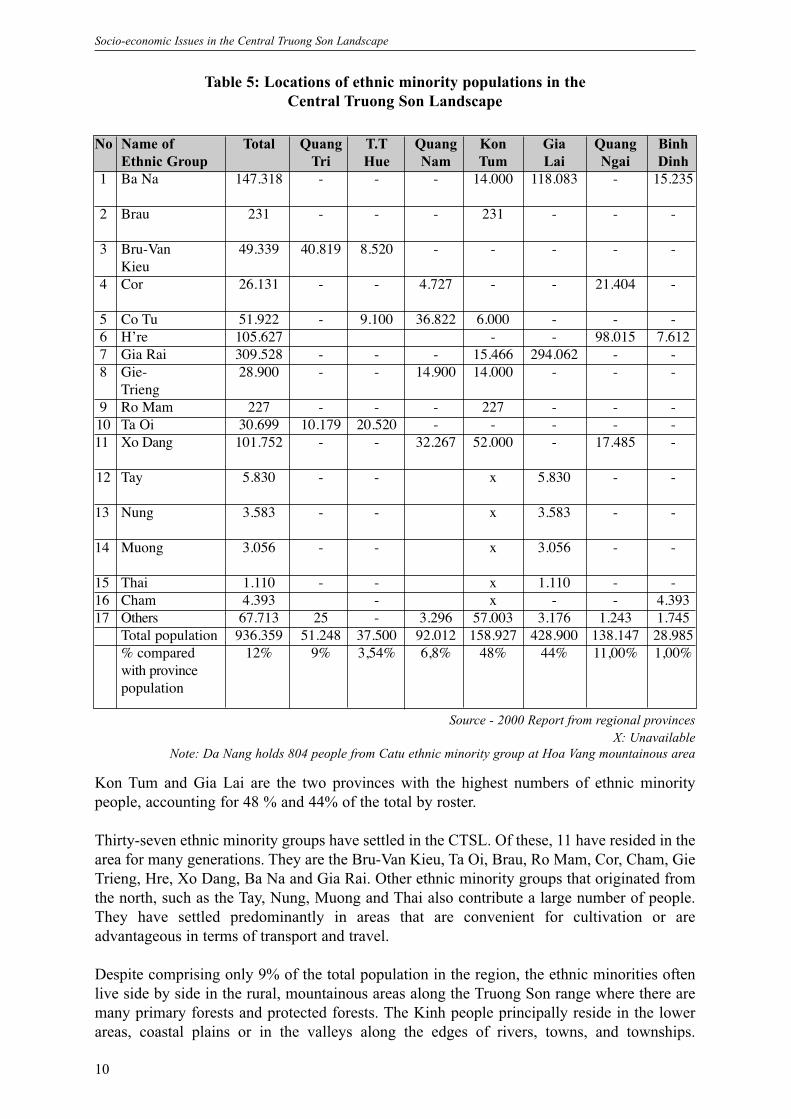
Kon Tum and Gia Lai are the two provinces with the highest numbers of ethnic minoritypeople, accounting for 48 % and 44% of the total by roster.
Thirty-seven ethnic minority groups have settled in the CTSL. Of these, 11 have resided in thearea for many generations. They are the Bru-Van Kieu, Ta Oi, Brau, Ro Mam, Cor, Cham, GieTrieng, Hre, Xo Dang, Ba Na and Gia Rai. Other ethnic minority groups that originated fromthe north, such as the Tay, Nung, Muong and Thai also contribute a large number of people.They have settled predominantly in areas that are convenient for cultivation or areadvantageous in terms of transport and travel.
Despite comprising only 9% of the total population in the region, the ethnic minorities oftenlive side by side in the rural, mountainous areas along the Truong Son range where there aremany primary forests and protected forests. The Kinh people principally reside in the lowerareas, coastal plains or in the valleys along the edges of rivers, towns, and townships.
Table 5: Locations of ethnic minority populations in theCentral Truong Son Landscape
Source - 2000 Report from regional provinces
No Name of Total Quang T.T Quang Kon Gia Quang Binh Ethnic Group Tri Hue Nam Tum Lai Ngai Dinh
1 Ba Na 147.318 - - - 14.000 118.083 - 15.235
2 Brau 231 - - - 231 - - -
3 Bru-Van 49.339 40.819 8.520 - - - - -Kieu
4 Cor 26.131 - - 4.727 - - 21.404 -
5 Co Tu 51.922 - 9.100 36.822 6.000 - - -6 H’re 105.627 - - 98.015 7.6127 Gia Rai 309.528 - - - 15.466 294.062 - -8 Gie- 28.900 - - 14.900 14.000 - - -
Trieng9 Ro Mam 227 - - - 227 - - -10 Ta Oi 30.699 10.179 20.520 - - - - - 11 Xo Dang 101.752 - - 32.267 52.000 - 17.485 -
12 Tay 5.830 - - x 5.830 - -
13 Nung 3.583 - - x 3.583 - -
14 Muong 3.056 - - x 3.056 - -
15 Thai 1.110 - - x 1.110 - -16 Cham 4.393 - x - - 4.39317 Others 67.713 25 - 3.296 57.003 3.176 1.243 1.745
Total population 936.359 51.248 37.500 92.012 158.927 428.900 138.147 28.985% compared 12% 9% 3,54% 6,8% 48% 44% 11,00% 1,00%with provincepopulation
X: UnavailableNote: Da Nang holds 804 people from Catu ethnic minority group at Hoa Vang mountainous area
11
Socio-economic Issues in the Central Truong Son Landscape
According to the population census carried out on 1/4/1999, the Kinh people make up 88.74%of the population in Plei Ku City (Gia Lai province), while in An Khe district they comprise90.90% of the population. The population fluctuates between 30 and 50% 8 in other districts.
The areas in which ethnic peoples have settled are distinctive in the CTSL. Their residentialareas bear the typical features of their respective cultures. For example, at the mention of “GiaLai”, the Gia Rai group surely is recalled; the same is true of the Xo Dang and the Ba Na inKon Tum. The different ethnic minority groups live closely together, although not on a largescale. However, in recent years, close settlement has become more popular, particularly afterthe appearance of the Tay, Nung, Thai, and Muong migrant groups. The number of migrantshas reached 85,685 people, making up 9% of the ethnic minority population in the region; theyhave settled mainly in Gia Lai and Kon Tum.
The resettlement of the ethnic minority groups contributes to local development and enrichesthe economic, cultural and ethnic landscape of the CTSL.
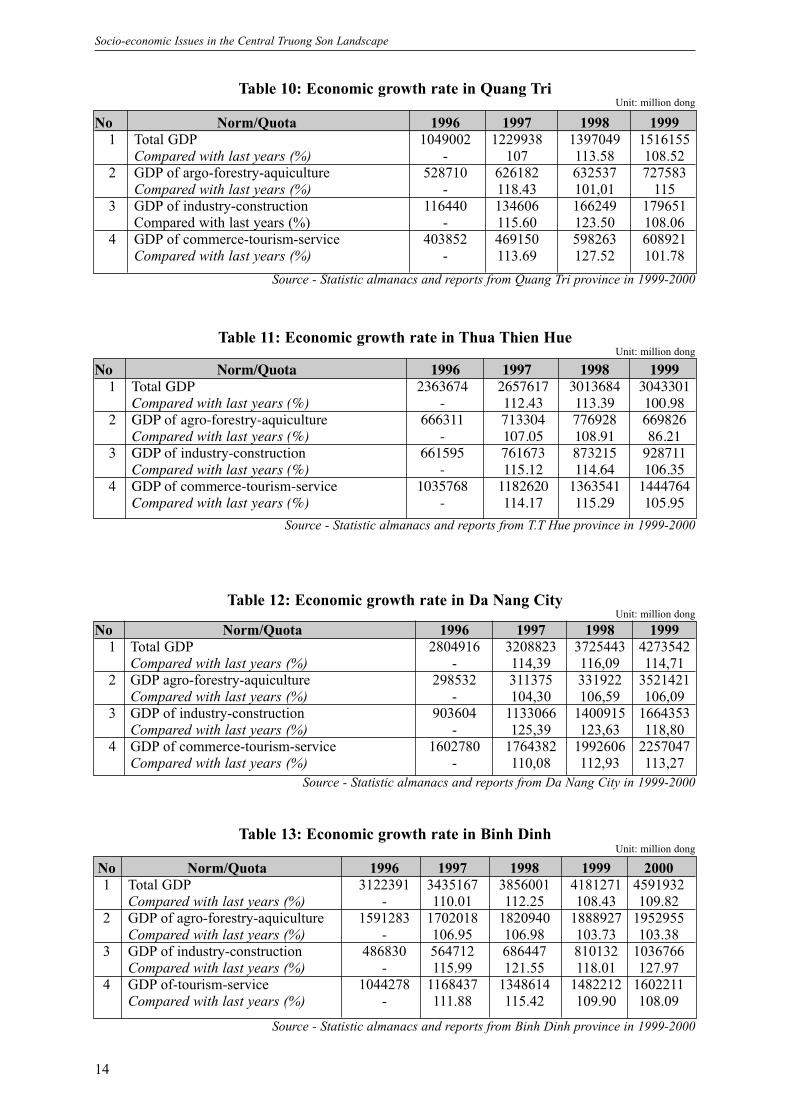
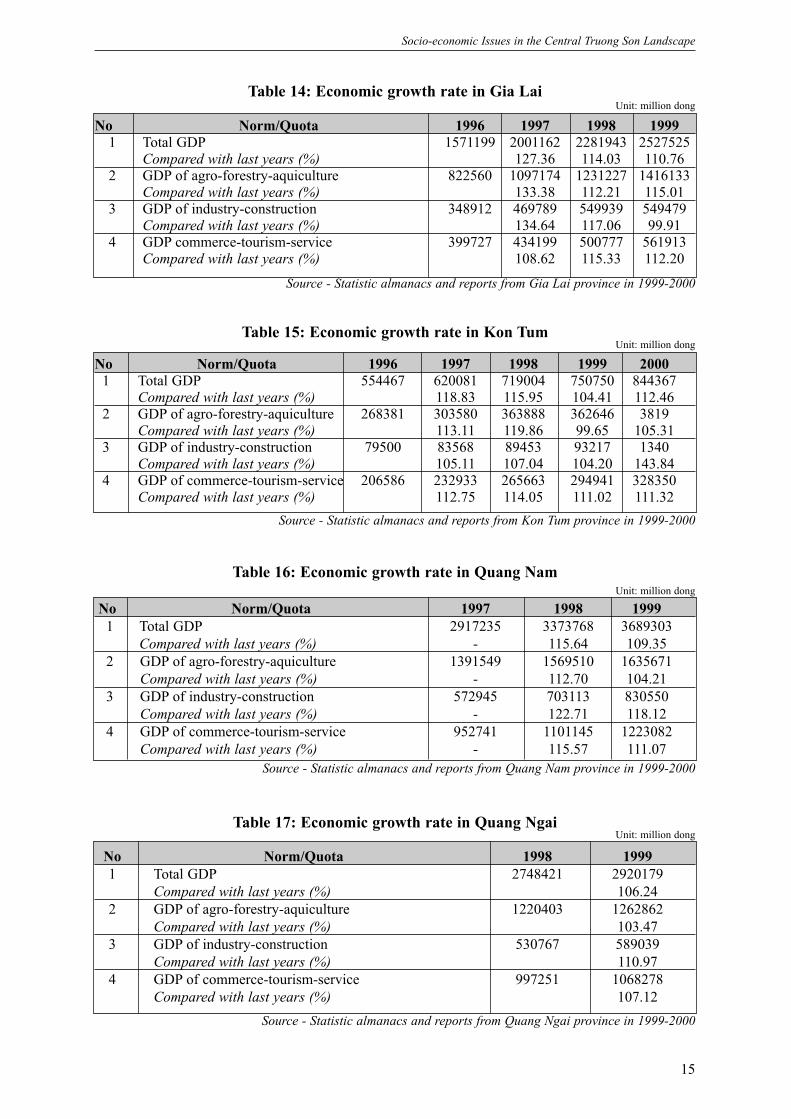
2.2.3 Economic growth rate and transference of economic mechanisms 9
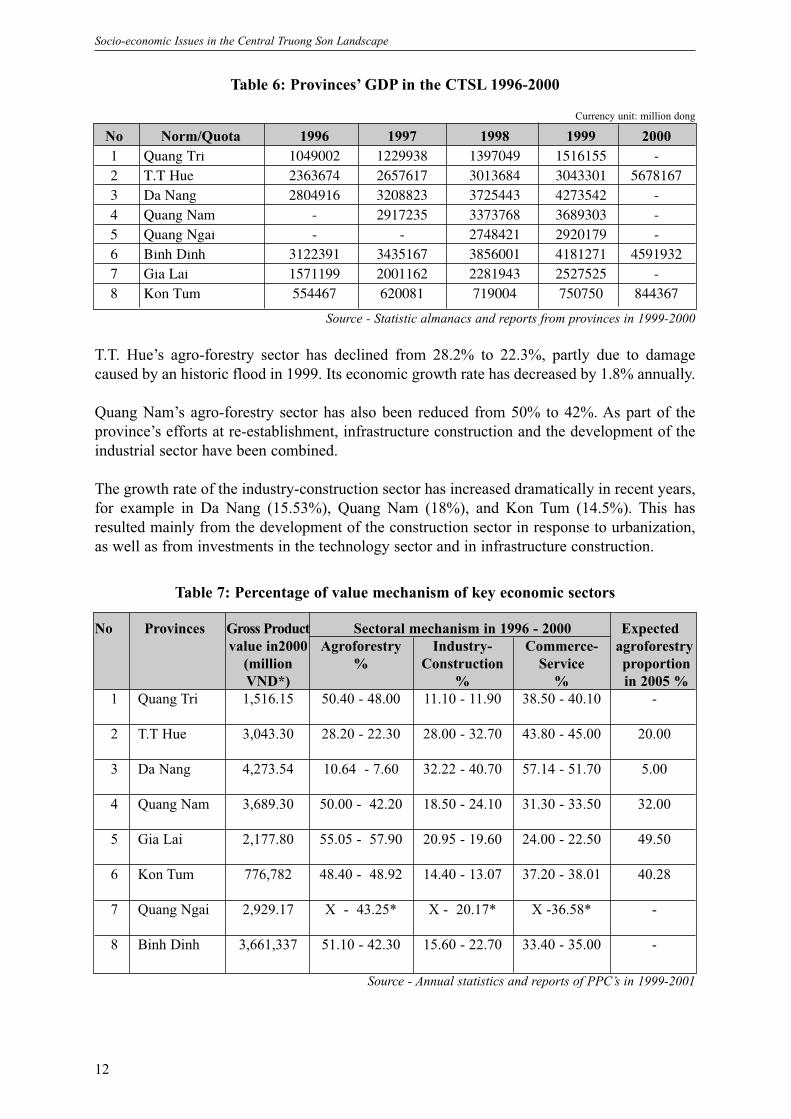
In recent years, the growth in the regional provinces’ GDPs has been positive. The averageGDP in the region gained over 9% annually during the period 1996-2000, which was higherthan the national average rate. In particular, Gia Lai and Kon Tum achieved relatively highgrowth rates (12.65% and 9.85% respectively), which mainly were dependent on the growthof the agro-forestry industry (15.7% and 10.7%).
The yields of industrial plantations, namely coffee, rubber and pepper, have made importantcontributions to the GDPs. However, the profit yielded by such goods depends heavily onexport markets. During 1999-2000, natural disasters, drought and the fall in the price ofagricultural products resulted in the decrease in the economic growth rates of these provinces.
Da Nang city has a fairly high growth rate of 10.33% that is dependant mainly on the industry-construction sector’s growth rate (15.53%). This sector represents 40.7% of Da Nang city’sGDP, which is a high rate compared with those of the regional provinces in particular and ofthe country as a whole.
In general, the region still relies on agro-forestry production, which represents 50% to 60% ofeach provinces’ GDP. The highest percentage is attributed to Gia Lai, which accounted for57% in 2000; this was the only province that enjoyed a continually increasing rate in recentyears. In contrast, the rate has gradually decreased in other provinces, at a relatively slow rateof 2%-3% over a four-year period (1996-2000).
8 Gia Lai population census in 19999 Data source: provinces’ reports on socio-economic development (2001-2005) and 2010
12
Socio-economic Issues in the Central Truong Son Landscape
T.T. Hue’s agro-forestry sector has declined from 28.2% to 22.3%, partly due to damagecaused by an historic flood in 1999. Its economic growth rate has decreased by 1.8% annually.
Quang Nam’s agro-forestry sector has also been reduced from 50% to 42%. As part of theprovince’s efforts at re-establishment, infrastructure construction and the development of theindustrial sector have been combined.
The growth rate of the industry-construction sector has increased dramatically in recent years,for example in Da Nang (15.53%), Quang Nam (18%), and Kon Tum (14.5%). This hasresulted mainly from the development of the construction sector in response to urbanization,as well as from investments in the technology sector and in infrastructure construction.
Table 7: Percentage of value mechanism of key economic sectors
No Norm/Quota 1996 1997 1998 1999 20001 Quang Tri 1049002 1229938 1397049 1516155 -2 T.T Hue 2363674 2657617 3013684 3043301 56781673 Da Nang 2804916 3208823 3725443 4273542 -4 Quang Nam - 2917235 3373768 3689303 -5 Quang Ngai - - 2748421 2920179 -6 Binh Dinh 3122391 3435167 3856001 4181271 45919327 Gia Lai 1571199 2001162 2281943 2527525 -8 Kon Tum 554467 620081 719004 750750 844367
Table 6: Provinces’ GDP in the CTSL 1996-2000
Source - Statistic almanacs and reports from provinces in 1999-2000
Currency unit: million dong
No Provinces Gross Product Sectoral mechanism in 1996 - 2000 Expectedvalue in2000 Agroforestry Industry- Commerce- agroforestry
(million % Construction Service proportionVND*) % % in 2005 %
1 Quang Tri 1,516.15 50.40 - 48.00 11.10 - 11.90 38.50 - 40.10 -
2 T.T Hue 3,043.30 28.20 - 22.30 28.00 - 32.70 43.80 - 45.00 20.00
3 Da Nang 4,273.54 10.64 - 7.60 32.22 - 40.70 57.14 - 51.70 5.00
4 Quang Nam 3,689.30 50.00 - 42.20 18.50 - 24.10 31.30 - 33.50 32.00
5 Gia Lai 2,177.80 55.05 - 57.90 20.95 - 19.60 24.00 - 22.50 49.50
6 Kon Tum 776,782 48.40 - 48.92 14.40 - 13.07 37.20 - 38.01 40.28
7 Quang Ngai 2,929.17 X - 43.25* X - 20.17* X -36.58* -
8 Binh Dinh 3,661,337 51.10 - 42.30 15.60 - 22.70 33.40 - 35.00 -
Source - Annual statistics and reports of PPC’s in 1999-2001
13
Socio-economic Issues in the Central Truong Son Landscape
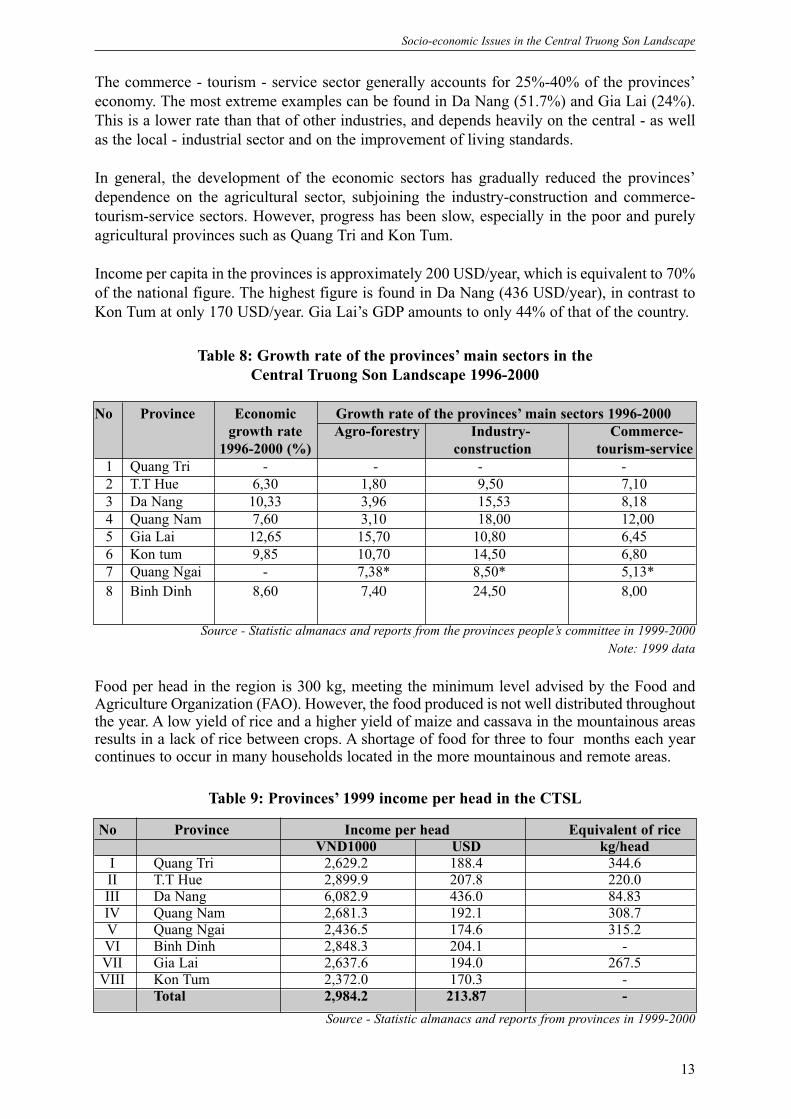
The commerce - tourism - service sector generally accounts for 25%-40% of the provinces’economy. The most extreme examples can be found in Da Nang (51.7%) and Gia Lai (24%).This is a lower rate than that of other industries, and depends heavily on the central - as wellas the local - industrial sector and on the improvement of living standards.
In general, the development of the economic sectors has gradually reduced the provinces’dependence on the agricultural sector, subjoining the industry-construction and commerce-tourism-service sectors. However, progress has been slow, especially in the poor and purelyagricultural provinces such as Quang Tri and Kon Tum.
Income per capita in the provinces is approximately 200 USD/year, which is equivalent to 70%of the national figure. The highest figure is found in Da Nang (436 USD/year), in contrast toKon Tum at only 170 USD/year. Gia Lai’s GDP amounts to only 44% of that of the country.
No Province Income per head Equivalent of rice VND1000 USD kg/head
I Quang Tri 2,629.2 188.4 344.6II T.T Hue 2,899.9 207.8 220.0III Da Nang 6,082.9 436.0 84.83IV Quang Nam 2,681.3 192.1 308.7V Quang Ngai 2,436.5 174.6 315.2VI Binh Dinh 2,848.3 204.1 -VII Gia Lai 2,637.6 194.0 267.5VIII Kon Tum 2,372.0 170.3 -
Total 2,984.2 213.87 -
Table 9: Provinces’ 1999 income per head in the CTSL
Source - Statistic almanacs and reports from provinces in 1999-2000
No Province Economic Growth rate of the provinces’ main sectors 1996-2000growth rate Agro-forestry Industry- Commerce-
1996-2000 (%) construction tourism-service1 Quang Tri - - - -2 T.T Hue 6,30 1,80 9,50 7,103 Da Nang 10,33 3,96 15,53 8,184 Quang Nam 7,60 3,10 18,00 12,005 Gia Lai 12,65 15,70 10,80 6,456 Kon tum 9,85 10,70 14,50 6,807 Quang Ngai - 7,38* 8,50* 5,13*8 Binh Dinh 8,60 7,40 24,50 8,00
Table 8: Growth rate of the provinces’ main sectors in the Central Truong Son Landscape 1996-2000
Source - Statistic almanacs and reports from the provinces people’s committee in 1999-2000Note: 1999 data
Food per head in the region is 300 kg, meeting the minimum level advised by the Food andAgriculture Organization (FAO). However, the food produced is not well distributed throughoutthe year. A low yield of rice and a higher yield of maize and cassava in the mountainous areasresults in a lack of rice between crops. A shortage of food for three to four months each yearcontinues to occur in many households located in the more mountainous and remote areas.
14
Socio-economic Issues in the Central Truong Son Landscape
No Norm/Quota 1996 1997 1998 1999 20001 Total GDP 3122391 3435167 3856001 4181271 4591932
Compared with last years (%) - 110.01 112.25 108.43 109.822 GDP of agro-forestry-aquiculture 1591283 1702018 1820940 1888927 1952955
Compared with last years (%) - 106.95 106.98 103.73 103.383 GDP of industry-construction 486830 564712 686447 810132 1036766
Compared with last years (%) - 115.99 121.55 118.01 127.974 GDP of-tourism-service 1044278 1168437 1348614 1482212 1602211
Compared with last years (%) - 111.88 115.42 109.90 108.09
Table 13: Economic growth rate in Binh Dinh
Source - Statistic almanacs and reports from Binh Dinh province in 1999-2000
Unit: million dong
Unit: million dong
No Norm/Quota 1996 1997 1998 19991 Total GDP 1049002 1229938 1397049 1516155
Compared with last years (%) - 107 113.58 108.522 GDP of argo-forestry-aquiculture 528710 626182 632537 727583
Compared with last years (%) - 118.43 101,01 1153 GDP of industry-construction 116440 134606 166249 179651
Compared with last years (%) - 115.60 123.50 108.064 GDP of commerce-tourism-service 403852 469150 598263 608921
Compared with last years (%) - 113.69 127.52 101.78
Table 10: Economic growth rate in Quang Tri
Source - Statistic almanacs and reports from Quang Tri province in 1999-2000
No Norm/Quota 1996 1997 1998 19991 Total GDP 2363674 2657617 3013684 3043301
Compared with last years (%) - 112.43 113.39 100.982 GDP of agro-forestry-aquiculture 666311 713304 776928 669826
Compared with last years (%) - 107.05 108.91 86.213 GDP of industry-construction 661595 761673 873215 928711
Compared with last years (%) - 115.12 114.64 106.354 GDP of commerce-tourism-service 1035768 1182620 1363541 1444764
Compared with last years (%) - 114.17 115.29 105.95
Table 11: Economic growth rate in Thua Thien Hue
Source - Statistic almanacs and reports from T.T Hue province in 1999-2000
Unit: million dong
No Norm/Quota 1996 1997 1998 19991 Total GDP 2804916 3208823 3725443 4273542
Compared with last years (%) - 114,39 116,09 114,712 GDP agro-forestry-aquiculture 298532 311375 331922 3521421
Compared with last years (%) - 104,30 106,59 106,093 GDP of industry-construction 903604 1133066 1400915 1664353
Compared with last years (%) - 125,39 123,63 118,804 GDP of commerce-tourism-service 1602780 1764382 1992606 2257047
Compared with last years (%) - 110,08 112,93 113,27
Table 12: Economic growth rate in Da Nang City
Source - Statistic almanacs and reports from Da Nang City in 1999-2000
Unit: million dong
15
Socio-economic Issues in the Central Truong Son Landscape
No Norm/Quota 1998 19991 Total GDP 2748421 2920179
Compared with last years (%) 106.242 GDP of agro-forestry-aquiculture 1220403 1262862
Compared with last years (%) 103.473 GDP of industry-construction 530767 589039
Compared with last years (%) 110.974 GDP of commerce-tourism-service 997251 1068278
Compared with last years (%) 107.12
Table 17: Economic growth rate in Quang Ngai
Source - Statistic almanacs and reports from Quang Ngai province in 1999-2000
Unit: million dong
No Norm/Quota 1996 1997 1998 19991 Total GDP 1571199 2001162 2281943 2527525
Compared with last years (%) 127.36 114.03 110.762 GDP of agro-forestry-aquiculture 822560 1097174 1231227 1416133
Compared with last years (%) 133.38 112.21 115.013 GDP of industry-construction 348912 469789 549939 549479
Compared with last years (%) 134.64 117.06 99.914 GDP commerce-tourism-service 399727 434199 500777 561913
Compared with last years (%) 108.62 115.33 112.20
Table 14: Economic growth rate in Gia LaiUnit: million dong
Source - Statistic almanacs and reports from Gia Lai province in 1999-2000
No Norm/Quota 1996 1997 1998 1999 20001 Total GDP 554467 620081 719004 750750 844367
Compared with last years (%) 118.83 115.95 104.41 112.462 GDP of agro-forestry-aquiculture 268381 303580 363888 362646 3819
Compared with last years (%) 113.11 119.86 99.65 105.313 GDP of industry-construction 79500 83568 89453 93217 1340
Compared with last years (%) 105.11 107.04 104.20 143.844 GDP of commerce-tourism-service 206586 232933 265663 294941 328350
Compared with last years (%) 112.75 114.05 111.02 111.32
Table 15: Economic growth rate in Kon Tum
Source - Statistic almanacs and reports from Kon Tum province in 1999-2000
Unit: million dong
No Norm/Quota 1997 1998 19991 Total GDP 2917235 3373768 3689303
Compared with last years (%) - 115.64 109.352 GDP of agro-forestry-aquiculture 1391549 1569510 1635671
Compared with last years (%) - 112.70 104.213 GDP of industry-construction 572945 703113 830550
Compared with last years (%) - 122.71 118.124 GDP of commerce-tourism-service 952741 1101145 1223082
Compared with last years (%) - 115.57 111.07
Table 16: Economic growth rate in Quang Nam
Source - Statistic almanacs and reports from Quang Nam province in 1999-2000
Unit: million dong
16
Socio-economic Issues in the Central Truong Son Landscape
No Type of land Total area Quang T.T Da Quang Quang Binh Gia Kon Tri Hue Nang Nam Ngai Dinh Lai Tum
Natural 5,772,660.68 474,573.56 505,399 124,840 1,040,747 513,520.12 602,560 1,549,571 961,450land area
1 Agriculture 826,048.52 68,928.94 59,000 12,837 110,606 99,055.58 116,900 277,336 81,385land area
2 Forestry 2,672,517.34 149,812.97 224,500 61,776 430,033 144,163.37 193,700 854,060 614,472land area
3 Normally 204,458.32 18,255,97 21,100 37,782 26,113 20,797.35 29,400 38,007 13,003used land
4 Living land 44,878.14 3,590.15 4,000 2,110 6,987 6,593.99 6,400 11,865 3,3325 Unused 2,024,758.36 233,985.53 196,799 10,335 467,008 242,909.83 256,160 368,303 249,258
land
Table 18: Land Used in the CTSL during 1999-2000
Source - Statistic almanacs and reports from provinces in 1999-2000
Unit: ha
10 Data source: Eight provinces’ statistics, 1999-2000; and the 2001 strategy for socio-economic development
2.2.4 Agro-forestry industry 10
Agro-forestry production plays an important role in the region’s economy; it has become anessential source of income for nearly 80% of the population. During 1996-2000, the industryaccounted for approximately 50% of the GDP in Quang Tri, Quang Nam, and Kon Tumprovinces. In Da Nang City, it accounted for only 10.64% and in Gia Lai it reached up to 55%.
During the period 1996-2000 in Quang Tri, T.T. Hue and Quang Nam provinces, the averagegrowth rate of the wet rice cultivation sector was 3.0%, which was lower than the nationalaverage rate. This is an extremely difficult area for agricultural cultivation; the area forcultivation per head is limited, and is blighted by natural disasters (i.e. flooding occursfrequently). In particular, the 1999 flood impacted both agricultural production and peoples’lives in the mountainous areas as well as on the coastal plains. It reduced the rate of GDP growthand specifically, of growth in the agro-forestry sector in many provinces. A typical example canbe found in Thua Thien Hue, where the agro-forestry growth rate dropped to -3.94%.
In contrast, Binh Dinh and Quang Ngai gained over 7%, partly due to the noticeable rate ofthe aquatic industry’s growth, which is second to that of the agro-forestry sector. In recentyears, considerable attention has been given to achieving greater output. Kon Tum gained10.7%, of which the forestry sector - in particular, wood exploitation and processing -accounted for 10.64% of the GDP.
Gia Lai is recognized as the province with the highest agro-forestry sector growth rate in theregion (15.7%). This stems from the cultivation of coffee, pepper and rubber, together withthe increase in the production of vegetables and of several other foods. During 2000 -2001,the fall in the price of coffee and pepper on the international markets severely decreased thevalue and density of goods, as well as the GDP growth rate. The turbulent growth rate ofindustrial plantations has changed the land-use structure and has visually limited the forestarea in many localities.
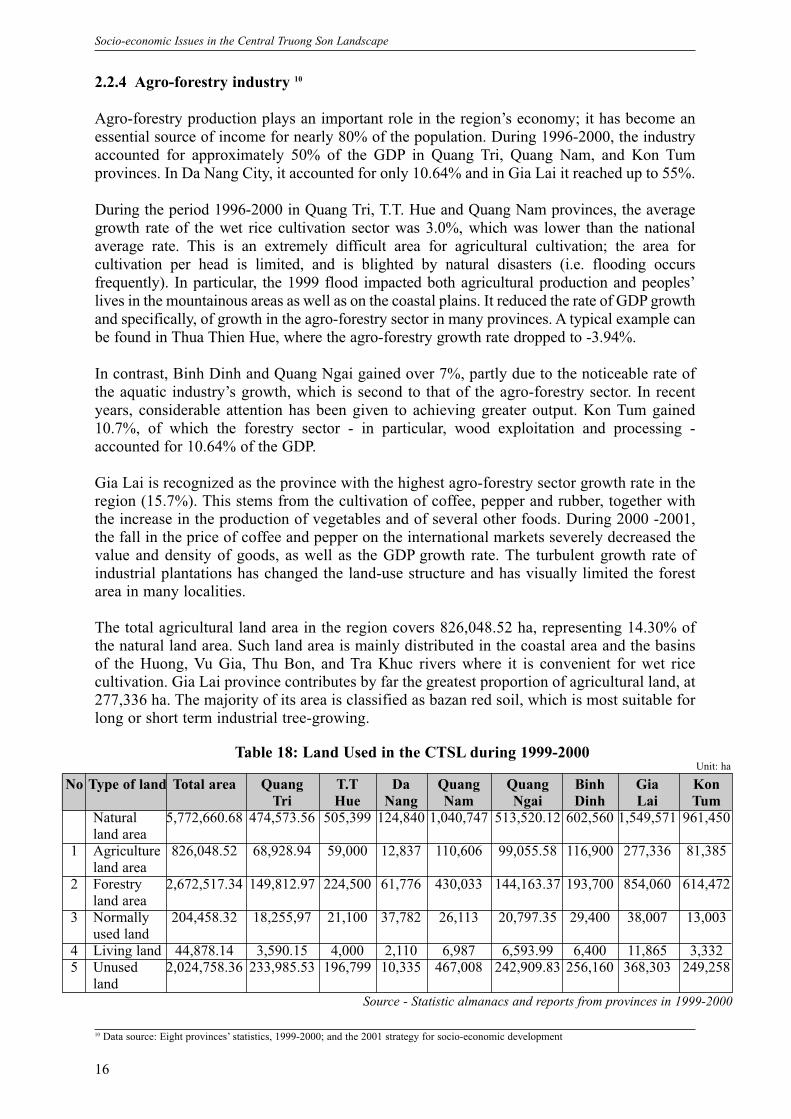
The total agricultural land area in the region covers 826,048.52 ha, representing 14.30% ofthe natural land area. Such land area is mainly distributed in the coastal area and the basinsof the Huong, Vu Gia, Thu Bon, and Tra Khuc rivers where it is convenient for wet ricecultivation. Gia Lai province contributes by far the greatest proportion of agricultural land, at277,336 ha. The majority of its area is classified as bazan red soil, which is most suitable forlong or short term industrial tree-growing.
17
Socio-economic Issues in the Central Truong Son Landscape
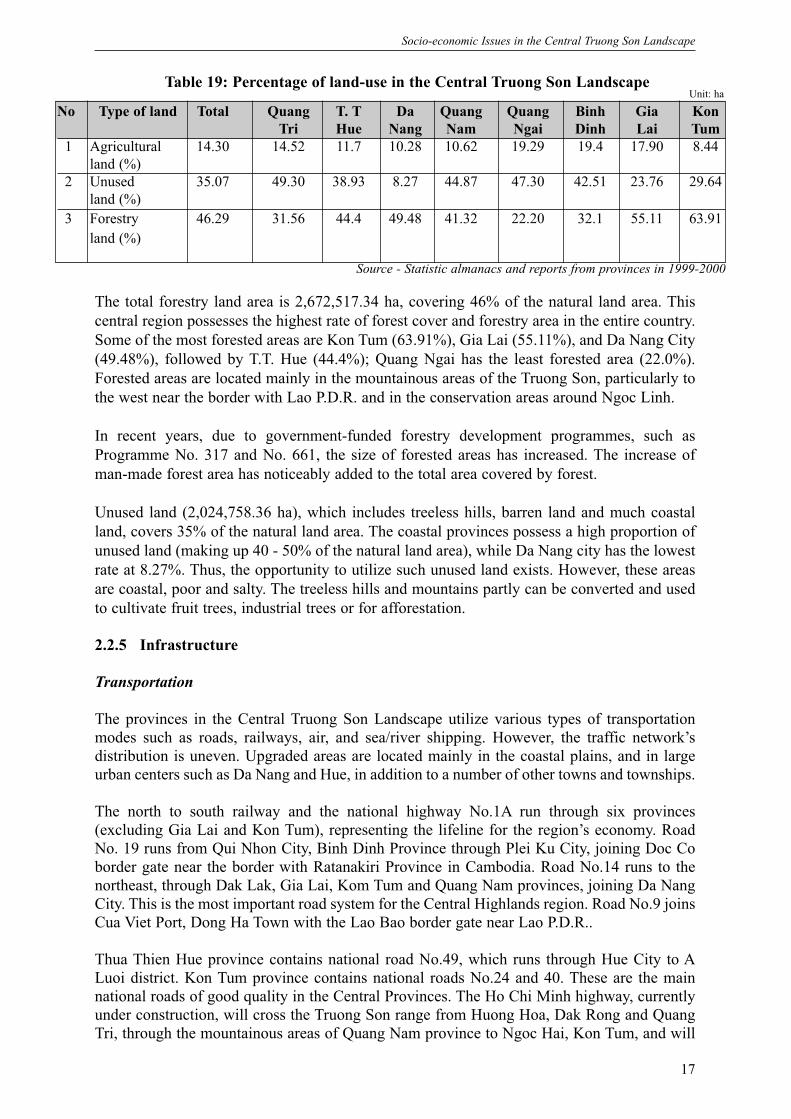
The total forestry land area is 2,672,517.34 ha, covering 46% of the natural land area. Thiscentral region possesses the highest rate of forest cover and forestry area in the entire country.Some of the most forested areas are Kon Tum (63.91%), Gia Lai (55.11%), and Da Nang City(49.48%), followed by T.T. Hue (44.4%); Quang Ngai has the least forested area (22.0%).Forested areas are located mainly in the mountainous areas of the Truong Son, particularly tothe west near the border with Lao P.D.R. and in the conservation areas around Ngoc Linh.
In recent years, due to government-funded forestry development programmes, such asProgramme No. 317 and No. 661, the size of forested areas has increased. The increase ofman-made forest area has noticeably added to the total area covered by forest.
Unused land (2,024,758.36 ha), which includes treeless hills, barren land and much coastalland, covers 35% of the natural land area. The coastal provinces possess a high proportion ofunused land (making up 40 - 50% of the natural land area), while Da Nang city has the lowestrate at 8.27%. Thus, the opportunity to utilize such unused land exists. However, these areasare coastal, poor and salty. The treeless hills and mountains partly can be converted and usedto cultivate fruit trees, industrial trees or for afforestation.
2.2.5 Infrastructure
Transportation
The provinces in the Central Truong Son Landscape utilize various types of transportationmodes such as roads, railways, air, and sea/river shipping. However, the traffic network’sdistribution is uneven. Upgraded areas are located mainly in the coastal plains, and in largeurban centers such as Da Nang and Hue, in addition to a number of other towns and townships.
The north to south railway and the national highway No.1A run through six provinces(excluding Gia Lai and Kon Tum), representing the lifeline for the region’s economy. RoadNo. 19 runs from Qui Nhon City, Binh Dinh Province through Plei Ku City, joining Doc Coborder gate near the border with Ratanakiri Province in Cambodia. Road No.14 runs to thenortheast, through Dak Lak, Gia Lai, Kom Tum and Quang Nam provinces, joining Da NangCity. This is the most important road system for the Central Highlands region. Road No.9 joinsCua Viet Port, Dong Ha Town with the Lao Bao border gate near Lao P.D.R..
Thua Thien Hue province contains national road No.49, which runs through Hue City to ALuoi district. Kon Tum province contains national roads No.24 and 40. These are the mainnational roads of good quality in the Central Provinces. The Ho Chi Minh highway, currentlyunder construction, will cross the Truong Son range from Huong Hoa, Dak Rong and QuangTri, through the mountainous areas of Quang Nam province to Ngoc Hai, Kon Tum, and will
No Type of land Total Quang T. T Da Quang Quang Binh Gia Kon Tri Hue Nang Nam Ngai Dinh Lai Tum
1 Agricultural 14.30 14.52 11.7 10.28 10.62 19.29 19.4 17.90 8.44land (%)
2 Unused 35.07 49.30 38.93 8.27 44.87 47.30 42.51 23.76 29.64land (%)
3 Forestry 46.29 31.56 44.4 49.48 41.32 22.20 32.1 55.11 63.91land (%)
Table 19: Percentage of land-use in the Central Truong Son Landscape
Source - Statistic almanacs and reports from provinces in 1999-2000
Unit: ha
18
Socio-economic Issues in the Central Truong Son Landscape
11 MTT’s 2000 report on rural and mountainous areas transportation development12 T.T Hue and Gia Lai’s strategic report on socio-economic development, 2001
join Plei Ku City. It will ensure a higher level of traffic security from north to south. Thehighway is designed to reduce the high density of traffic on national road No.1A, and toprovide an alternative route during natural disasters such as floods, which occur frequently inthe coastal areas. However, in the process of developing transport infrastructure and urbanareas; of settling populations, and; of implementing new socio-economic and infrastructuredevelopment projects, forest areas often are negatively impacted.
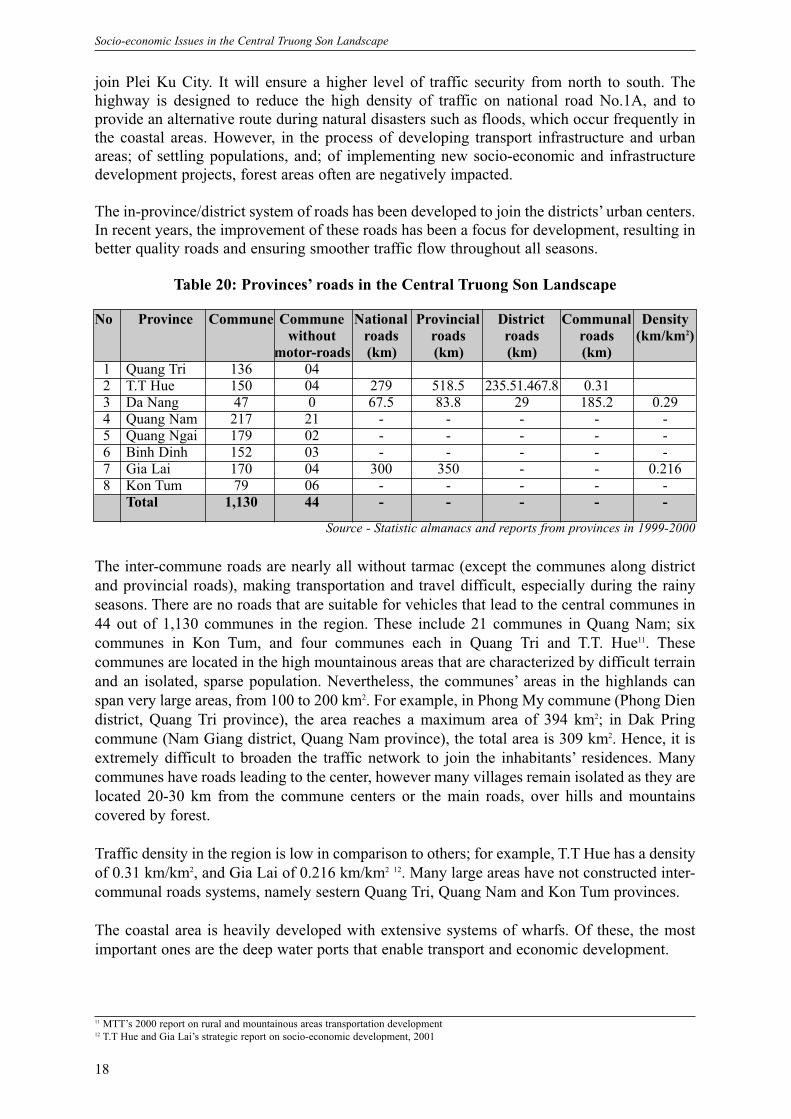
The in-province/district system of roads has been developed to join the districts’ urban centers.In recent years, the improvement of these roads has been a focus for development, resulting inbetter quality roads and ensuring smoother traffic flow throughout all seasons.
No Province Commune Commune National Provincial District Communal Densitywithout roads roads roads roads (km/km2)
motor-roads (km) (km) (km) (km)1 Quang Tri 136 042 T.T Hue 150 04 279 518.5 235.51.467.8 0.313 Da Nang 47 0 67.5 83.8 29 185.2 0.294 Quang Nam 217 21 - - - - -5 Quang Ngai 179 02 - - - - -6 Binh Dinh 152 03 - - - - -7 Gia Lai 170 04 300 350 - - 0.2168 Kon Tum 79 06 - - - - -
Total 1,130 44 - - - - -
Table 20: Provinces’ roads in the Central Truong Son Landscape
Source - Statistic almanacs and reports from provinces in 1999-2000
The inter-commune roads are nearly all without tarmac (except the communes along districtand provincial roads), making transportation and travel difficult, especially during the rainyseasons. There are no roads that are suitable for vehicles that lead to the central communes in44 out of 1,130 communes in the region. These include 21 communes in Quang Nam; sixcommunes in Kon Tum, and four communes each in Quang Tri and T.T. Hue11. Thesecommunes are located in the high mountainous areas that are characterized by difficult terrainand an isolated, sparse population. Nevertheless, the communes’ areas in the highlands canspan very large areas, from 100 to 200 km2. For example, in Phong My commune (Phong Diendistrict, Quang Tri province), the area reaches a maximum area of 394 km2; in Dak Pringcommune (Nam Giang district, Quang Nam province), the total area is 309 km2. Hence, it isextremely difficult to broaden the traffic network to join the inhabitants’ residences. Manycommunes have roads leading to the center, however many villages remain isolated as they arelocated 20-30 km from the commune centers or the main roads, over hills and mountainscovered by forest.
Traffic density in the region is low in comparison to others; for example, T.T Hue has a densityof 0.31 km/km2, and Gia Lai of 0.216 km/km2 12. Many large areas have not constructed inter-communal roads systems, namely sestern Quang Tri, Quang Nam and Kon Tum provinces.
The coastal area is heavily developed with extensive systems of wharfs. Of these, the mostimportant ones are the deep water ports that enable transport and economic development.
19
Socio-economic Issues in the Central Truong Son Landscape
13 PPC’s reports, 200114 CEMMA, 2001
Several large ports currently are being built, namely Dung Quat (Quang Ngai), Lien Chieu (DaNang), Chan May (T.T. Hue) and Cue Viet (Quang Tri). Linked to the system of wharfs are theconjugated industrial zones, as well as the processing, transportation, service and commercialareas. Through the development of industrial zones, the coastal border gate helps to promotethe rate of growth in the industry-construction and trading-service, reducing the dependenceon the agro-forestry sector. This is also a very important mechanism for generatingemployment in rural areas, lessening the demand for land and forest use in many areas.
Aviation transport is also concentrated upon in the region; in addition to Da Nang InternationalAirport - which provides the focal point for the movement of passengers and goods, bothdomestically and internationally - there are two more domestic airports in the region: Phu Bai(Hue) and Plei Ku (Gia Lai).
Communications
During recent years, and through considerable investment, the communications network of theprovinces in the region has been widely developed. The Government has spent billions ofVND setting up the Viba wave work, the radio/television receiving and broadcast stations inprovinces, and the stations covering waves for the remote and mountainous areas.Consequently, the status and quality of telecommunication has been remarkably improved.Many provinces have telephone or wireless lines to their communes. The numbers oftelephone subsidies has increased significantly. The rate of telephones per 100 people in theregion is 2.32, of which Thua Thien Hue contributes 2.6 telephones/per 100 people, Da Nangreaches 6.37, Gia Lai averages 1.8 and Quang Nam has only 1.4 13.
Electricity and water supply construction works
Electricity: The provinces of the CTSL make use of the national electricity network. Theregion has contributed to reducing the electricity shortfall to of its provinces through theconstruction of a 500 kv wire network and the operation of the two turbines at the Yaly FallsHydropower Station (which has an optimal output capacity of 640 MW). Besides such largescale electricity production, there are several smaller hydropower stations such as Phu Ninh,Quang Nam province, Ia Dray, Gia Lai province and preventive diesel power stations. Thereare also numerous small-scale hydropower generators supplying electricity for households inremote or mountainous areas.
The CTSL is recognized as holding a huge capacity for hydropower, though the Sesan basin, andthe network of rivers in provinces such as Quang Tri and Quang Nam.
Most district centers are connected to high, medium or low voltage stations through thetransmission network. However, electricity is unevenly distributed, mainly concentrated in theurban areas and coastal plains. In the mountainous areas, with perilous/complicated terrain anda scattered population, construction of the electrical cable network is difficult, causing a seriouslack of electricity to meet the demand for production and for the inhabitant’s everyday use.
Kon Tum still has 25 communes whose centers do not have access to the electricity network(equivalent to 31.65%). The households with access to electricity account for 62% of theprovince as a whole. Similarly there are 43 communes whose centers do not have access to theelectricity network in Quang Nam, making up 20% 14.
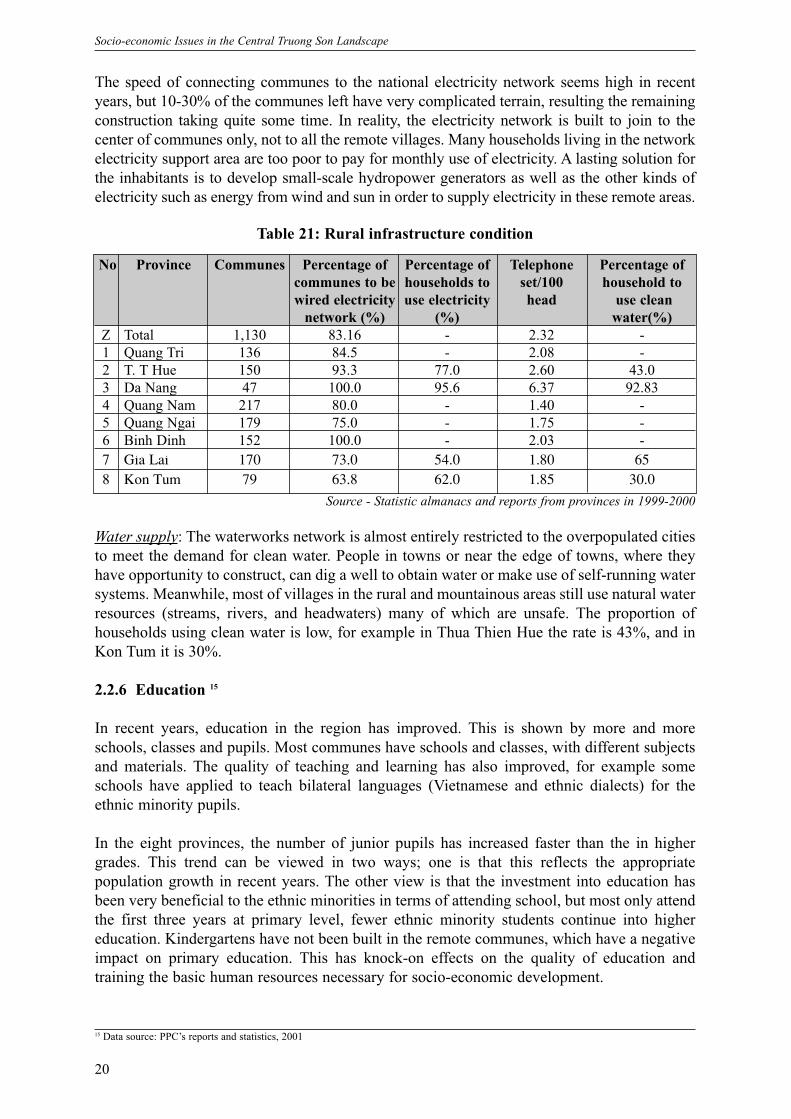
20
Socio-economic Issues in the Central Truong Son Landscape
15 Data source: PPC’s reports and statistics, 2001
The speed of connecting communes to the national electricity network seems high in recentyears, but 10-30% of the communes left have very complicated terrain, resulting the remainingconstruction taking quite some time. In reality, the electricity network is built to join to thecenter of communes only, not to all the remote villages. Many households living in the networkelectricity support area are too poor to pay for monthly use of electricity. A lasting solution forthe inhabitants is to develop small-scale hydropower generators as well as the other kinds ofelectricity such as energy from wind and sun in order to supply electricity in these remote areas.
No Province Communes Percentage of Percentage of Telephone Percentage of communes to be households to set/100 household to wired electricity use electricity head use clean
network (%) (%) water(%) Z Total 1,130 83.16 - 2.32 -1 Quang Tri 136 84.5 - 2.08 -2 T. T Hue 150 93.3 77.0 2.60 43.03 Da Nang 47 100.0 95.6 6.37 92.834 Quang Nam 217 80.0 - 1.40 -5 Quang Ngai 179 75.0 - 1.75 -6 Binh Dinh 152 100.0 - 2.03 -7 Gia Lai 170 73.0 54.0 1.80 658 Kon Tum 79 63.8 62.0 1.85 30.0
Table 21: Rural infrastructure condition
Source - Statistic almanacs and reports from provinces in 1999-2000
Water supply: The waterworks network is almost entirely restricted to the overpopulated citiesto meet the demand for clean water. People in towns or near the edge of towns, where theyhave opportunity to construct, can dig a well to obtain water or make use of self-running watersystems. Meanwhile, most of villages in the rural and mountainous areas still use natural waterresources (streams, rivers, and headwaters) many of which are unsafe. The proportion ofhouseholds using clean water is low, for example in Thua Thien Hue the rate is 43%, and inKon Tum it is 30%.
2.2.6 Education 15
In recent years, education in the region has improved. This is shown by more and moreschools, classes and pupils. Most communes have schools and classes, with different subjectsand materials. The quality of teaching and learning has also improved, for example someschools have applied to teach bilateral languages (Vietnamese and ethnic dialects) for theethnic minority pupils.
In the eight provinces, the number of junior pupils has increased faster than the in highergrades. This trend can be viewed in two ways; one is that this reflects the appropriatepopulation growth in recent years. The other view is that the investment into education hasbeen very beneficial to the ethnic minorities in terms of attending school, but most only attendthe first three years at primary level, fewer ethnic minority students continue into highereducation. Kindergartens have not been built in the remote communes, which have a negativeimpact on primary education. This has knock-on effects on the quality of education andtraining the basic human resources necessary for socio-economic development.
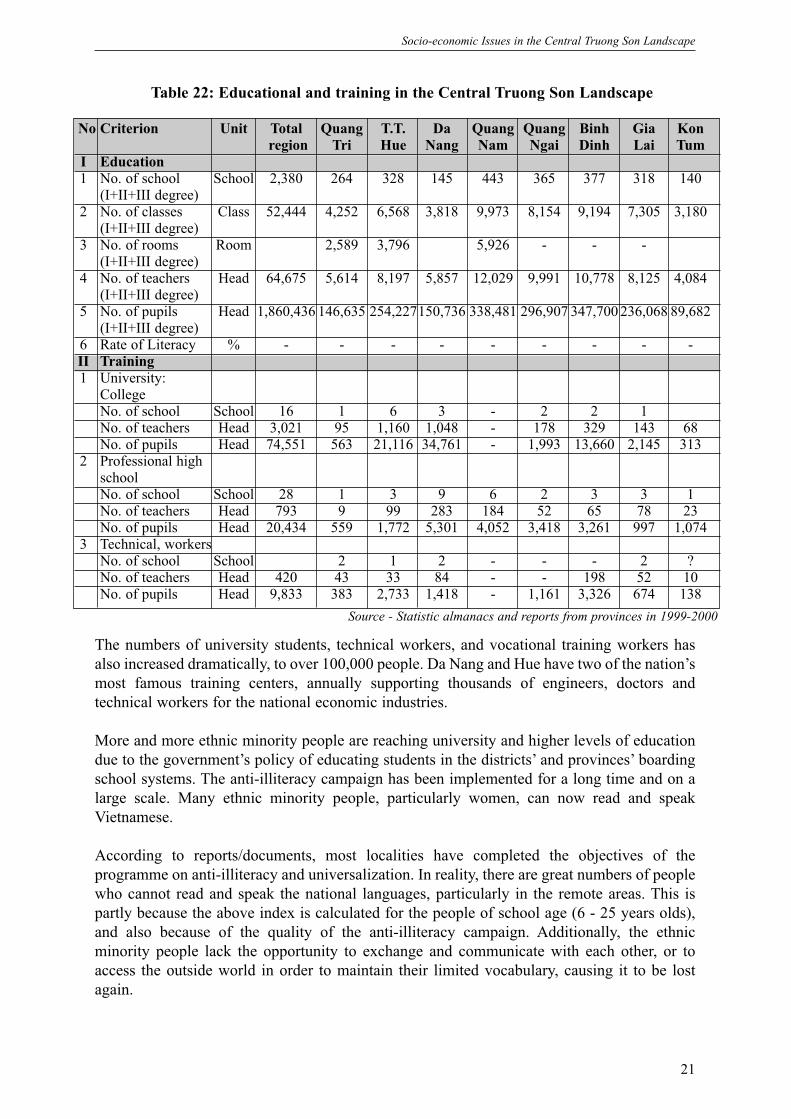
21
Socio-economic Issues in the Central Truong Son Landscape
The numbers of university students, technical workers, and vocational training workers hasalso increased dramatically, to over 100,000 people. Da Nang and Hue have two of the nation’smost famous training centers, annually supporting thousands of engineers, doctors andtechnical workers for the national economic industries.
More and more ethnic minority people are reaching university and higher levels of educationdue to the government’s policy of educating students in the districts’ and provinces’ boardingschool systems. The anti-illiteracy campaign has been implemented for a long time and on alarge scale. Many ethnic minority people, particularly women, can now read and speakVietnamese.
According to reports/documents, most localities have completed the objectives of theprogramme on anti-illiteracy and universalization. In reality, there are great numbers of peoplewho cannot read and speak the national languages, particularly in the remote areas. This ispartly because the above index is calculated for the people of school age (6 - 25 years olds),and also because of the quality of the anti-illiteracy campaign. Additionally, the ethnicminority people lack the opportunity to exchange and communicate with each other, or toaccess the outside world in order to maintain their limited vocabulary, causing it to be lostagain.
No Criterion Unit Total Quang T.T. Da Quang Quang Binh Gia Kon region Tri Hue Nang Nam Ngai Dinh Lai Tum
I Education1 No. of school School 2,380 264 328 145 443 365 377 318 140
(I+II+III degree)2 No. of classes Class 52,444 4,252 6,568 3,818 9,973 8,154 9,194 7,305 3,180
(I+II+III degree)3 No. of rooms Room 2,589 3,796 5,926 - - -
(I+II+III degree)4 No. of teachers Head 64,675 5,614 8,197 5,857 12,029 9,991 10,778 8,125 4,084
(I+II+III degree)5 No. of pupils Head 1,860,436 146,635 254,227150,736 338,481 296,907 347,700 236,068 89,682
(I+II+III degree)6 Rate of Literacy % - - - - - - - - -II Training1 University:
CollegeNo. of school School 16 1 6 3 - 2 2 1No. of teachers Head 3,021 95 1,160 1,048 - 178 329 143 68No. of pupils Head 74,551 563 21,116 34,761 - 1,993 13,660 2,145 313
2 Professional high schoolNo. of school School 28 1 3 9 6 2 3 3 1No. of teachers Head 793 9 99 283 184 52 65 78 23No. of pupils Head 20,434 559 1,772 5,301 4,052 3,418 3,261 997 1,074
3 Technical, workersNo. of school School 2 1 2 - - - 2 ?No. of teachers Head 420 43 33 84 - - 198 52 10No. of pupils Head 9,833 383 2,733 1,418 - 1,161 3,326 674 138
Table 22: Educational and training in the Central Truong Son Landscape
Source - Statistic almanacs and reports from provinces in 1999-2000
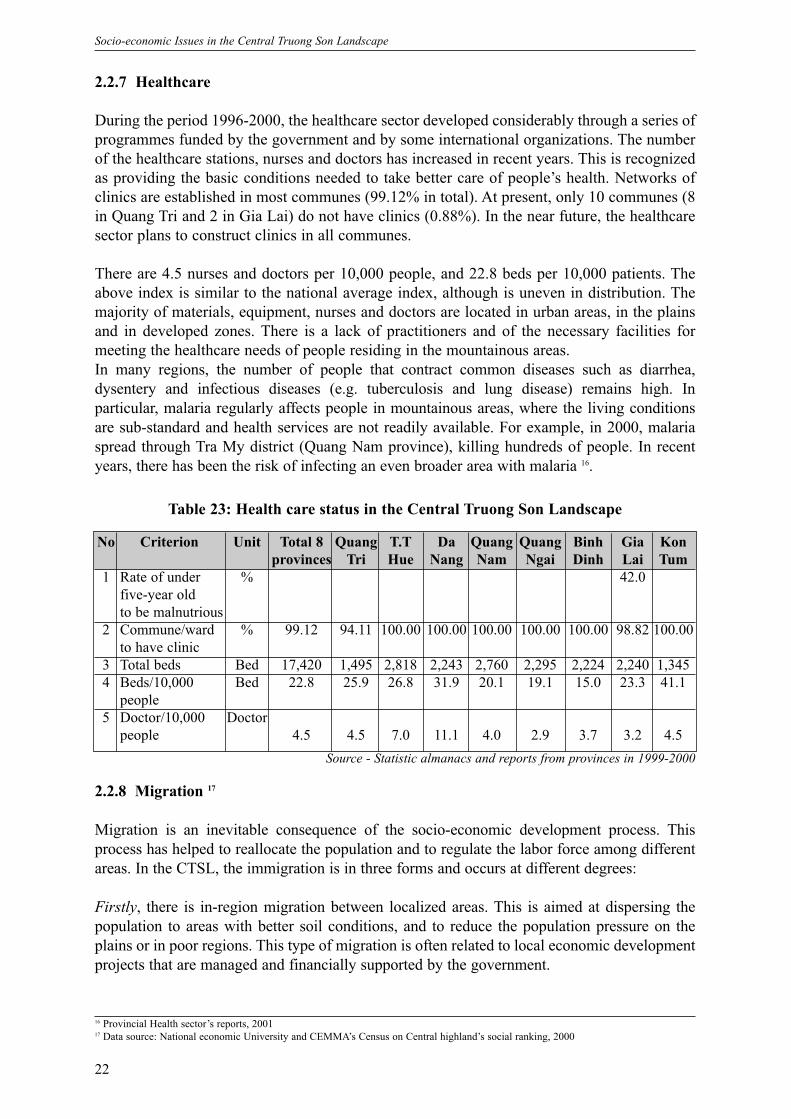
22
Socio-economic Issues in the Central Truong Son Landscape
2.2.8 Migration 17
Migration is an inevitable consequence of the socio-economic development process. Thisprocess has helped to reallocate the population and to regulate the labor force among differentareas. In the CTSL, the immigration is in three forms and occurs at different degrees:
Firstly, there is in-region migration between localized areas. This is aimed at dispersing thepopulation to areas with better soil conditions, and to reduce the population pressure on theplains or in poor regions. This type of migration is often related to local economic developmentprojects that are managed and financially supported by the government.
16 Provincial Health sector’s reports, 200117 Data source: National economic University and CEMMA’s Census on Central highland’s social ranking, 2000
2.2.7 Healthcare
During the period 1996-2000, the healthcare sector developed considerably through a series ofprogrammes funded by the government and by some international organizations. The numberof the healthcare stations, nurses and doctors has increased in recent years. This is recognizedas providing the basic conditions needed to take better care of people’s health. Networks ofclinics are established in most communes (99.12% in total). At present, only 10 communes (8in Quang Tri and 2 in Gia Lai) do not have clinics (0.88%). In the near future, the healthcaresector plans to construct clinics in all communes.
There are 4.5 nurses and doctors per 10,000 people, and 22.8 beds per 10,000 patients. Theabove index is similar to the national average index, although is uneven in distribution. Themajority of materials, equipment, nurses and doctors are located in urban areas, in the plainsand in developed zones. There is a lack of practitioners and of the necessary facilities formeeting the healthcare needs of people residing in the mountainous areas.In many regions, the number of people that contract common diseases such as diarrhea,dysentery and infectious diseases (e.g. tuberculosis and lung disease) remains high. Inparticular, malaria regularly affects people in mountainous areas, where the living conditionsare sub-standard and health services are not readily available. For example, in 2000, malariaspread through Tra My district (Quang Nam province), killing hundreds of people. In recentyears, there has been the risk of infecting an even broader area with malaria 16.
No Criterion Unit Total 8 Quang T.T Da Quang Quang Binh Gia Kon provinces Tri Hue Nang Nam Ngai Dinh Lai Tum
1 Rate of under % 42.0five-year old to be malnutrious
2 Commune/ward % 99.12 94.11 100.00 100.00 100.00 100.00 100.00 98.82 100.00to have clinic
3 Total beds Bed 17,420 1,495 2,818 2,243 2,760 2,295 2,224 2,240 1,3454 Beds/10,000 Bed 22.8 25.9 26.8 31.9 20.1 19.1 15.0 23.3 41.1
people5 Doctor/10,000 Doctor
people 4.5 4.5 7.0 11.1 4.0 2.9 3.7 3.2 4.5
Table 23: Health care status in the Central Truong Son Landscape
Source - Statistic almanacs and reports from provinces in 1999-2000
23
Socio-economic Issues in the Central Truong Son Landscape
Secondly, there is planned and free migration among regional provinces; specifically, fromQuang Tri, Thua Thien Hue, Quang Ngai and Quang Nam to Gia Lai and Kon Tum. Thistargeted group of immigrants predominantly consists of poor people that immigrated at the endof the 1970s, 1980s and at the beginning of 1990s. They have since settled down in new places.However, due to the lack of available land, some have had to rely on exploiting forest resources(such as wood and logs, or wildlife for trade). This practice often occurs in the buffer zones ofconservation areas such as Kon Ka Kinh and Song Thanh.
Thirdly, there is the external migration of groups who come from provinces to the north, suchas Thai Binh, Nam Ha, Hai Hung, Nghe An and Thanh Hoa. Most of them are taking part in thefree migration plan that is supported by the government, and is backed up with the provision ofbasic necessities in order to help the people to stabilize in their new settlements.
The groups of people coming from northern mountainous areas such as Cao Bang, Lang Son,Lao Cai, Son La, Tuyen Quang and Hoa Binh, mostly belong to the Tay, Nung, Dao, Mong, Thaiand Muong ethnic groups. Due to hard living conditions in the northern areas, they have had tomove to new places in order to make survive. These groups migrate freely, i.e. not according tothe authorities’ plans. As such, they receive less support for their resettlement.
They often migrate in groups consisting of households and according to family or villagerelations. This can help them to stabilize and subsequently to improve their lives in their newhomes, where often they face many natural, social and economic challenges. Nonetheless, theseimmigrants are able to quickly stabilize their lives typically in only 3-4 years, depending on theirknowledge of the local conditions and on the conditions of specific areas themselves. The newsettlers are able to form good relations with the ethnic minority groups, some of which have beenliving in the area for generations.
However, some migrant groups either adapt poorly to their new environments or have a lowpotential for production due to their extreme poverty, namely the Mong and Dao ethnic groups. In recent years, the provinces have made plans and have expanded existing projects with amandate to help them to stabilize their lives, as well as to develop production skills. As such, theywill support free migrants and will contribute to improving their lives, step by step.
Another form of free migration that is excluded from the new economic programmes involveslocal government officers. Normally, they move among relatives or people with whom theyhave strong connections. They often settle in towns and townships that are suitable forproduction and goods exchange, as well as being convenient for transportation and with goodinfrastructure. Land is traded or transferred through past immigrants or local inhabitants. Overa period of time - the length of which depends on their adaptability and economic condition -their lives stablize. Although the government does not support them financially, they aresupported with regard to legal procedures, such as the migration procedure and employmentgeneration, as well as through financial resources from their family and relatives.
Over the last 26 years (from 1976 to 2000), Gia Lai province received 55,972 households(242,129 migrants). Of these, 35,484 households (160,110 migrants) benefited from the neweconomic programme; free migration accounted for 20,488 households (82,019 people)coming from 26 provinces 18.
18 Data source: Gia Lai DRNEZ’s report on migration in 2000
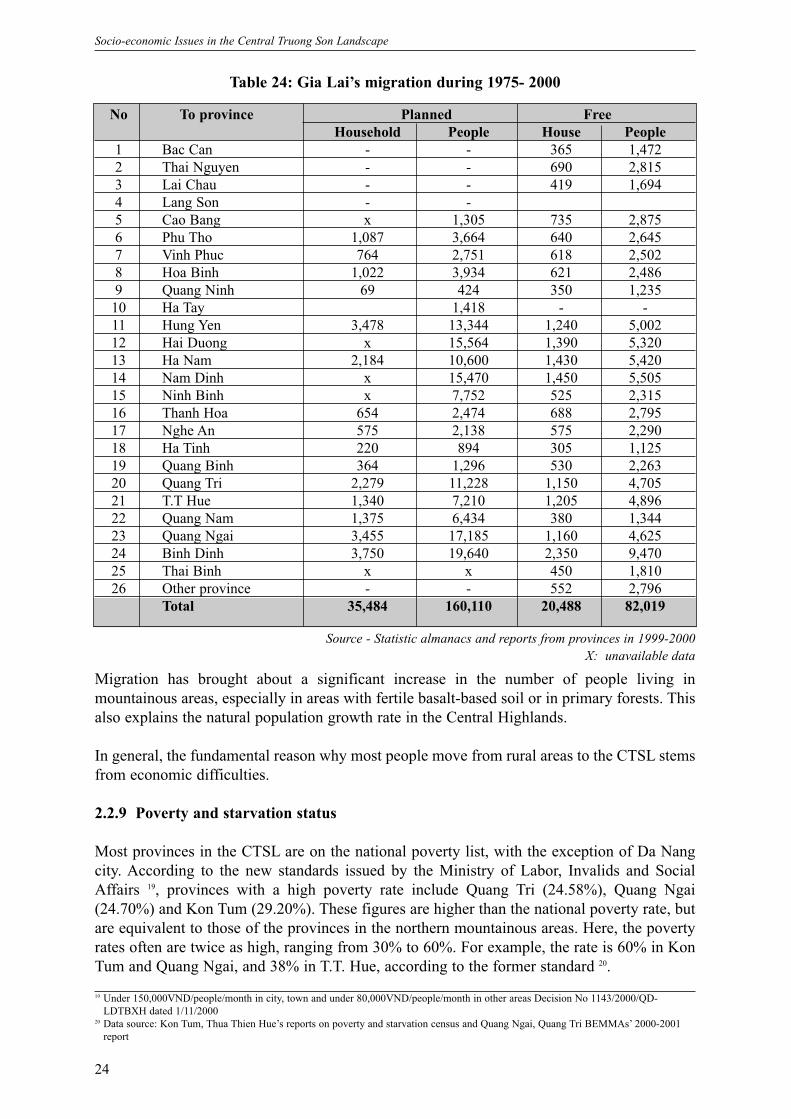
24
Socio-economic Issues in the Central Truong Son Landscape
Migration has brought about a significant increase in the number of people living inmountainous areas, especially in areas with fertile basalt-based soil or in primary forests. Thisalso explains the natural population growth rate in the Central Highlands.
In general, the fundamental reason why most people move from rural areas to the CTSL stemsfrom economic difficulties.
2.2.9 Poverty and starvation status
Most provinces in the CTSL are on the national poverty list, with the exception of Da Nangcity. According to the new standards issued by the Ministry of Labor, Invalids and SocialAffairs 19, provinces with a high poverty rate include Quang Tri (24.58%), Quang Ngai(24.70%) and Kon Tum (29.20%). These figures are higher than the national poverty rate, butare equivalent to those of the provinces in the northern mountainous areas. Here, the povertyrates often are twice as high, ranging from 30% to 60%. For example, the rate is 60% in KonTum and Quang Ngai, and 38% in T.T. Hue, according to the former standard 20.
No To province Planned FreeHousehold People House People
1 Bac Can - - 365 1,4722 Thai Nguyen - - 690 2,8153 Lai Chau - - 419 1,6944 Lang Son - -5 Cao Bang x 1,305 735 2,8756 Phu Tho 1,087 3,664 640 2,6457 Vinh Phuc 764 2,751 618 2,5028 Hoa Binh 1,022 3,934 621 2,4869 Quang Ninh 69 424 350 1,23510 Ha Tay 1,418 - -11 Hung Yen 3,478 13,344 1,240 5,00212 Hai Duong x 15,564 1,390 5,32013 Ha Nam 2,184 10,600 1,430 5,42014 Nam Dinh x 15,470 1,450 5,50515 Ninh Binh x 7,752 525 2,31516 Thanh Hoa 654 2,474 688 2,79517 Nghe An 575 2,138 575 2,29018 Ha Tinh 220 894 305 1,12519 Quang Binh 364 1,296 530 2,26320 Quang Tri 2,279 11,228 1,150 4,70521 T.T Hue 1,340 7,210 1,205 4,89622 Quang Nam 1,375 6,434 380 1,34423 Quang Ngai 3,455 17,185 1,160 4,62524 Binh Dinh 3,750 19,640 2,350 9,47025 Thai Binh x x 450 1,81026 Other province - - 552 2,796
Total 35,484 160,110 20,488 82,019
Table 24: Gia Lai’s migration during 1975- 2000
Source - Statistic almanacs and reports from provinces in 1999-2000X: unavailable data
19 Under 150,000VND/people/month in city, town and under 80,000VND/people/month in other areas Decision No 1143/2000/QD- LDTBXH dated 1/11/2000
20 Data source: Kon Tum, Thua Thien Hue’s reports on poverty and starvation census and Quang Ngai, Quang Tri BEMMAs’ 2000-2001report
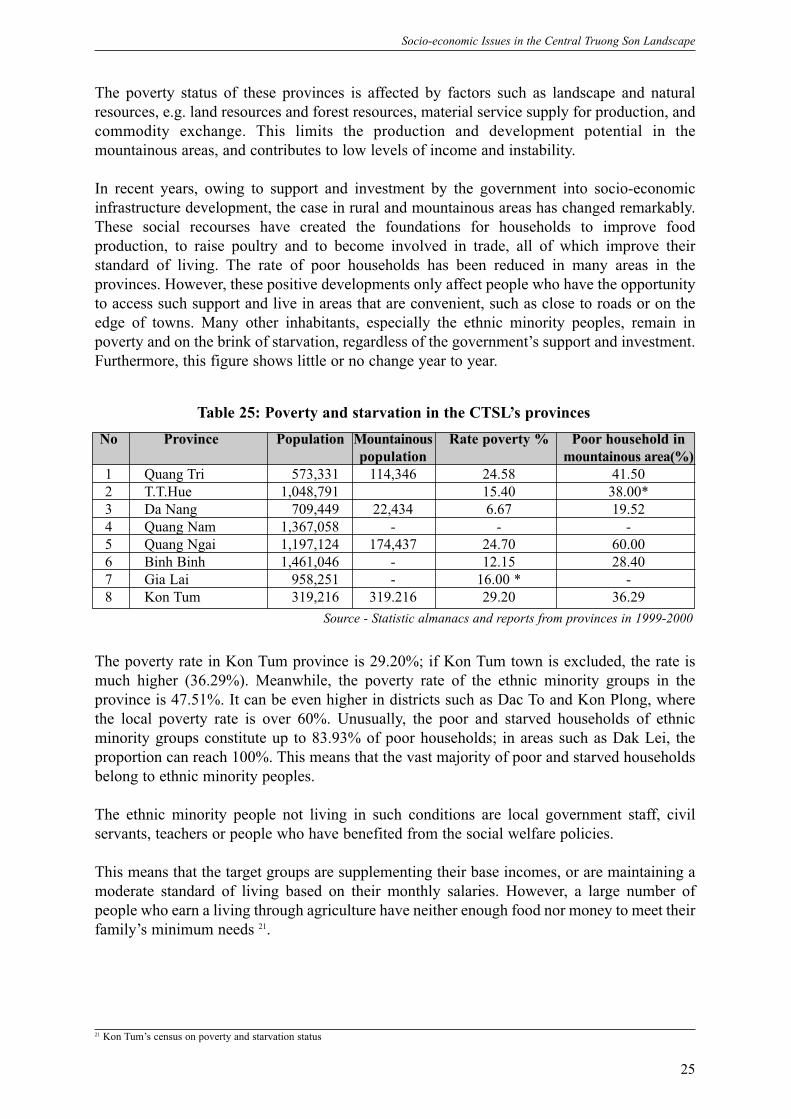
25
Socio-economic Issues in the Central Truong Son Landscape
The poverty rate in Kon Tum province is 29.20%; if Kon Tum town is excluded, the rate ismuch higher (36.29%). Meanwhile, the poverty rate of the ethnic minority groups in theprovince is 47.51%. It can be even higher in districts such as Dac To and Kon Plong, wherethe local poverty rate is over 60%. Unusually, the poor and starved households of ethnicminority groups constitute up to 83.93% of poor households; in areas such as Dak Lei, theproportion can reach 100%. This means that the vast majority of poor and starved householdsbelong to ethnic minority peoples.
The ethnic minority people not living in such conditions are local government staff, civilservants, teachers or people who have benefited from the social welfare policies.
This means that the target groups are supplementing their base incomes, or are maintaining amoderate standard of living based on their monthly salaries. However, a large number ofpeople who earn a living through agriculture have neither enough food nor money to meet theirfamily’s minimum needs 21.
Table 25: Poverty and starvation in the CTSL’s provinces
Source - Statistic almanacs and reports from provinces in 1999-2000
No Province Population Mountainous Rate poverty % Poor household in population mountainous area(%)
1 Quang Tri 573,331 114,346 24.58 41.502 T.T.Hue 1,048,791 15.40 38.00*3 Da Nang 709,449 22,434 6.67 19.524 Quang Nam 1,367,058 - - -5 Quang Ngai 1,197,124 174,437 24.70 60.006 Binh Binh 1,461,046 - 12.15 28.407 Gia Lai 958,251 - 16.00 * -8 Kon Tum 319,216 319.216 29.20 36.29
The poverty status of these provinces is affected by factors such as landscape and naturalresources, e.g. land resources and forest resources, material service supply for production, andcommodity exchange. This limits the production and development potential in themountainous areas, and contributes to low levels of income and instability.
In recent years, owing to support and investment by the government into socio-economicinfrastructure development, the case in rural and mountainous areas has changed remarkably.These social recourses have created the foundations for households to improve foodproduction, to raise poultry and to become involved in trade, all of which improve theirstandard of living. The rate of poor households has been reduced in many areas in theprovinces. However, these positive developments only affect people who have the opportunityto access such support and live in areas that are convenient, such as close to roads or on theedge of towns. Many other inhabitants, especially the ethnic minority peoples, remain inpoverty and on the brink of starvation, regardless of the government’s support and investment.Furthermore, this figure shows little or no change year to year.
21 Kon Tum’s census on poverty and starvation status
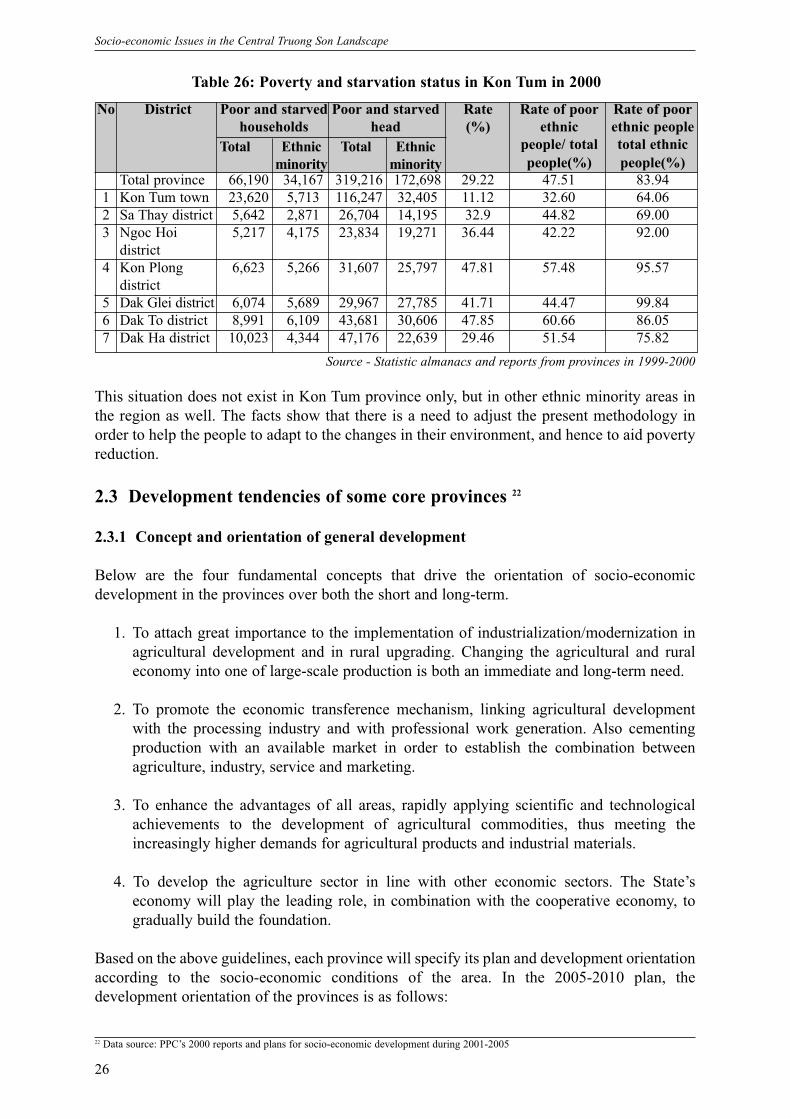
26
Socio-economic Issues in the Central Truong Son Landscape
This situation does not exist in Kon Tum province only, but in other ethnic minority areas inthe region as well. The facts show that there is a need to adjust the present methodology inorder to help the people to adapt to the changes in their environment, and hence to aid povertyreduction.
2.3 Development tendencies of some core provinces 22
2.3.1 Concept and orientation of general development
Below are the four fundamental concepts that drive the orientation of socio-economicdevelopment in the provinces over both the short and long-term.
1. To attach great importance to the implementation of industrialization/modernization inagricultural development and in rural upgrading. Changing the agricultural and ruraleconomy into one of large-scale production is both an immediate and long-term need.
2. To promote the economic transference mechanism, linking agricultural developmentwith the processing industry and with professional work generation. Also cementingproduction with an available market in order to establish the combination betweenagriculture, industry, service and marketing.
3. To enhance the advantages of all areas, rapidly applying scientific and technologicalachievements to the development of agricultural commodities, thus meeting theincreasingly higher demands for agricultural products and industrial materials.
4. To develop the agriculture sector in line with other economic sectors. The State’seconomy will play the leading role, in combination with the cooperative economy, togradually build the foundation.
Based on the above guidelines, each province will specify its plan and development orientationaccording to the socio-economic conditions of the area. In the 2005-2010 plan, thedevelopment orientation of the provinces is as follows:
22 Data source: PPC’s 2000 reports and plans for socio-economic development during 2001-2005
Table 26: Poverty and starvation status in Kon Tum in 2000
Source - Statistic almanacs and reports from provinces in 1999-2000
No District Poor and starved Poor and starved Rate Rate of poor Rate of poorhouseholds head (%) ethnic ethnic people
people/ total total ethnicpeople(%) people(%)
Total province 66,190 34,167 319,216 172,698 29.22 47.51 83.941 Kon Tum town 23,620 5,713 116,247 32,405 11.12 32.60 64.062 Sa Thay district 5,642 2,871 26,704 14,195 32.9 44.82 69.003 Ngoc Hoi 5,217 4,175 23,834 19,271 36.44 42.22 92.00
district4 Kon Plong 6,623 5,266 31,607 25,797 47.81 57.48 95.57
district 5 Dak Glei district 6,074 5,689 29,967 27,785 41.71 44.47 99.846 Dak To district 8,991 6,109 43,681 30,606 47.85 60.66 86.057 Dak Ha district 10,023 4,344 47,176 22,639 29.46 51.54 75.82
Total Ethnic Total Ethnicminority minority
27
Socio-economic Issues in the Central Truong Son Landscape
Thua Thien Hue province
The province is moving its economy in a new direction by developing several sectors. Thisinvolves increasing the share of the industry, commerce, tourism and services sectors, andbuilding the industrial port zone in Chan May. This also will create an economic associationwith the Central Industrial Zones’ sectors.
Major development projects include the establishment of artificial timber manufacturing plantswith capacities of 20-30,000m3/year, as well as the construction of the Dong Lam cementfactory (production capacity of 1.4 million tons /year) and the Nam Dong cement factory (withthe same production capacity).
Another focus is the improvement of transport networks in the form of road and railwaysystems, particularly national highways No. 1A and No. 49 that link to provincial road No.14and Lao P.D.R..
Another important activity is the building of important irrigation facilities such as Ta TrachLake, Thao Long Dam, Truoi Lake, as well as the construction of water reservoirs and Co Bihydroelectric dam, which are currently undergoing preparation.In the agriculture sector, priority lies with increasing agricultural productivity throughintensive farming. This involves increasing the areas for growing short and long-termindustrial plants such as sugar cane and pineapple to 12-15,000ha, and providing materials forthe processing industry. A change in the techniques currently used in agriculture will also resultin an increase in production of high quality goods.
Also planned is the enhancement of the afforestation programme from 4-5,000 ha/year on150,000 ha of bare land and hills. This interlinks closely with the plans for protecting forests,enhancing the breeding pool and processing forest products. Additionally, the province plansto increase the forest coverage throughout the province, particularly in Bach Ma National Park.
Thua Thien Hue is in an extremely advantageous position to develop its tourism industry,given the recognition of the ancient capital city of Hue by UNESCO. Their currentdevelopment strategy will give higher priority to the protection of forests and of naturalresources in order to support ecological tourism.
Changing the economic structure by raising the value of products and the rate of livestockbreeding in the agricultural sector will help to limit the rate of natural resource exploitation ona broader scale. However, finding suitable seeds for this ecological zone remains an unsolvableproblem. This evidenced by the complete failure of recent attempts to develop crops such ascoffee, sugar cane and pineapple in the mountainous areas of Thua Thien Hue province.
Da Nang City
Da Nang has the advantage of being the central region’s center of development. Da Nang Cityhas been built to be a focal point for transportation networks and for development in theCentral Highlands, Southern Lao P.D.R. and northeast Thailand. The industrial sector isrecognized as the key sector, and involves the building and development of ports, particularlyin industrial zones such as Lien Chieu and Hoa Khanh. This is in addition to the synchronizeddevelopment of the engineering, metal ware, garment, shoe, leather, chemical, food processingand building materials industries.
28
Socio-economic Issues in the Central Truong Son Landscape
The maximum GDP growth rate is 13.5%/year. The density of the industry-construction andcommercial- service sectors will noticeably increase in the coming years. In the agro-forestryand aquaculture industries, the value of seafood as well as the density is on the increase due tothe strengthening of processing and export.
The development of horticulture brings about high-value fresh vegetables, fruits and pottedplants to service the demands of the urban population and export. Cattle and poultry-raising isalso being developed with an aim to improve their quality and value.
Afforestation and forest protection will increase the forest cover up to 65,000 ha, accountingfor 52% of the natural land area. This will be implemented via the construction and protectionof restricted-use forest, watershed protection forest and natural conservation areas such as BaNa-Nui Chua, Son Tra, and South Hai Van. Wood processing plants have an output capacity of40,000m3/year, using mainly planted trees or imported wood.
Da Nang’s socio-economic development will reduce the pressure of illegal exploitation ofnatural resources in the mountainous and neighboring areas. However the rate of urbanizationand the expansion of industrial zones will have the opposite impact on the ecology of theconservation areas located close to inhabited areas.
Gia Lai province
Agriculture will be the leading sector in the development strategy of Gia Lai province over thecoming years. The rapid development of agro-forestry production shall be boosted by thedevelopment of farming in harmony with the processing industry to increase the value ofgoods. The target for the annual growth rate is an increase of 9%.
Apart from the main foodstuff - rice - highly commercial crops will be grown, such as coffee(81,000 ha, although not to be continuously grown), rubber trees (60,000 ha), cashews (12,000ha) pepper and tea (4,000 ha), firewood (4,000 ha) and sugar cane (14,000 ha). Cattle raisingis also prioritized.
Afforestation and forest protection is associated with wood processing. Gia Lai is a provincethat needs to develop such an industry in order to supply timber to the An Khe fibre plywoodfactory. An exploitation rate of 45,000m3/year from natural forests and 84,000m3/year fromman-made forests is tentatively planned. This is an extremely large yield, with a highprobability of having a large impact the natural forests of the province, particularly as thetarget yield may not be acheived by harvesting solely from man-made forests.
Industry focuses on agricultural product processing for export; however some units producebuilding materials with a view to meeting the demand for immediate use. Some significantindustrial clusters have been built surrounding Plei Ku city and in the areas to the south. Modern construction works such as hydropower stations Nos. 2 and 3 in the Sesan Rivercatchments are planned in order to supply electricity to the central region, supplemented withsmall-scale hydropower works to meet immediate demands.
With regard to transportation, national roads 9, 14, 25 and 14C, as well as provincial roads willbe upgraded in conjunction with the construction of the Ho Chi Minh Highway.
Gia Lai will concentrate heavily on making use of the natural resources in the coming years inorder to develop its economy, with a basis in improving capacity in terms of processing.
29
Socio-economic Issues in the Central Truong Son Landscape
Kon Tum province
Kon Tum is a poor province, which plans to continue to concentrate on agriculturaldevelopment in the coming decade. It is planned that the agro-forestry sector will continue toaccount for 40-41% of Kon Tum’s economy by the 2005.
The province aims to develop areas specialising in key commercial crops such as coffee andrubber on the basis of intensive cultivation and maintenance of the present land area. These arefocused in Kon Tum town, Dak To, Dak Ha and Ngoc Hai districts. The total area designatedfor cultivation is 40,000 ha. The aim of intensively cultivating wet rice is to increase the outputand quality of the end product. The 12,000 ha of cassava is maintained to support animal-raising and the processing industry.
In the agro-forestry industry, land allocation is implemented to control and protect 250,000ha offorest. Around 70,000-75,000ha of new forest needs to be grown to supply the wood for the papermill, which produces 130,000 tons/year. The area covered by forest represents 66% of the total.Kon Tum plans to annually exploit 30,000m3 and to cease the exploitation of natural forest.As for the industrial sector, several production plants for building material, such as stone forconstruction, as well as cassava, coffee and rubber processing plants will be constructed.
In the transportation sectore, there are plans to upgrade the provincial roads joining the districtand townships; to construct the Ho Chi Minh Highway from Kon Tum to Da Nang City; toconstruct the national road No. 24 to Quang Ngai; and to join national road No. 40 to nationalroad No.18B in Lao P.D.R..
Over the next 5 years, the province will receive 10,000 people under the new economic zonesprogramme in order to meet the employment needs of the paper industry and of thedevelopment projects in Sa Thay, Ngoc Hai and Dak Lei districts.
Kon Tum, with its highland terrain, is considered as vital to protect the Yaly hydropowerstation, so maintenance and protection of conservation areas is prioritized. The impacts of thesocio-economic development process will not be greatly felt in the areas that need to beprotected.
30
Socio-economic Issues in the Central Truong Son Landscape
PART III: SOME SOCIO-ECONOMIC AND CULTURALFEATURES IN THE ETHNIC MINORITY AND
MOUNTAINOUS AREAS
3.1 Administrative geography and population
3.1.1 Administrative geography23
The Central Truong Son Landscape comprises eight provinces in the center of Vietnam. Theseare divided into administrative units of 46 districts/towns/cities and 608 villages/wards. Thisnatural conservation zone covers two cities (Hue and Da Nang), one town (Kon Tum) and 46districts, including their buffer zones and surrounding areas. It has a total area of 38,354 km2,making up 66.6% of the area of the eight provinces and 11.63% of the country’s total area. Ithouses a population of 3,344,615, which is around 600,000 households.
Of 608 communes, 234 are defined as especially poor, with a population of 467,559 in 93,062households. These people are among the foci of the government’s hunger elimination andpoverty reduction programme (No. 133) and the socio-economic development of especiallypoor village’s plan (No. 135).
3.1.2 Population distribution
The average density is 87 people/km2, which is 65% of the national average. However,there are large discrepancies in density between areas in the zone, and the highest densityis often seen in areas such as cities/towns, lower lands, near rivers, flat areas and areasconvenient for transportation. The majority of the population lives in the eastern andnortheastern parts of the zone, mainly in the two big cities of Da Nang and Hue, and theirsurrounding areas.
The density of the population in delta districts is approximately 200 people/km2, comparedto 80-100 people/km2 in more mountainous areas. In the most mountainous areas, thepopulation is even sparser with an average density of 10-20 people/km2;for example DakRong in Quang Tri (27 people/km2) and A Luoi in Thua Thien Hue (29 people/km2). Themost sparsely populated districts are Nam Giang in Quang Nam and Sa Thay in Kon Tumwith densities of 10 and 10.9 people/km2 respectively. Dak Pring village has a density ofonly 3 people/km2 24.
3.1.3 Population growth rate 25
From 1985-1996, the population increased at a high rate - about 3% annually. In recent years,due to good medical care and the family planning programme, the rate has been reduced to 2.0-2.5%. Some mountainous districts experience a stable rate due to both a high birth rate and ahigh death rate.
23 Data source: Eight provinces’ statistics and socio-economic development report, CEMMA24 Project on conservation of Thanh river25 BEMMA’s report, 2001
31
Socio-economic Issues in the Central Truong Son Landscape
3.2 Traditional society features
3.2.1 Family size and distribution of labor force
A typical ethnic minority family has six to eight members, which is higher than that of theregion as a whole. In the more extreme cases, families have been found to contain 12 to 14members. These families comprise two to three generations living together.
Due to the relatively new tendency of detaching from families at a young age, families aredecreasing in size26. Female-dominated families exist in the Ba Na ethnic minority group. Insuch cases, women play a very important role regardless of the family’s size. In contrast,men dominate the family in other minority groups. Nonetheless, labor distribution inaccordance with age and sex (natural labor distribution) is common. Men are alwaysresponsible for finding and exploiting land, felling trees for wood and hunting. Meanwhile,women are responsible for fetching water and firewood, cooking, caring for the children andfarming. Women are under more working pressure than men as they have many otherhousehold chores 27.
Working according to the crop cycle is typical in the product manufacturing processpracticed here. The farming season runs from January to April, beginning with locatingland, slash and burn clearing, sowing the seeds and finally crop harvesting. However, dueto regional differences in climate and natural conditions, the process may be displaced forup to one month. This depends largely on the timing of the rainy season. Hunting is nowcarried out in all seasons, usually during the men’s free time. This is often after lunarOctober - the time for worshiping and festivals - and when their storehouses are full offood28.
3.2.2 Social structure 29
In the Truong Son and Central Highlands, residential communities live in groups, and thevillage is considered to be the basic social unit as well as the traditional social organization.
By this, we mean that it holds great importance in the communities. The above-mentionedsocial organization continues to co-exist with the administrative one in accordance with theregulations issued by the state of Vietnam. In addition to the voted or appointed heads ofhamlets and the leaders of socio-political organizations (such as the youth or women’sorganizations), there are some patriarchs who are highly respected and are in responsiblepositions. In these cases, the roles of the village leaders, patriarchs and magicians rank first.They provide advice, make important decisions in village affairs, arbitrate and mediatepersonal relationships, and make ceremonial offerings.
In many places, people act in accordance with both systems: the national laws and the rules setby the village. Generally, the village rules are applied firstly and quickly, by default. Conflictsoccur when some articles in the village rules conflict or overlap with national laws.
26 The author’s 2000 working report27 PRA report in Gia Lai, 1997 HPP and the field trip survey in Lo Pang commune, Mang Yang district in 7/200128 Field writing and census in Quang Tri’s mountainous areas, 200029 Gia Lai PRA report, HPP, 1997
32
Socio-economic Issues in the Central Truong Son Landscape
Because of the low level of education, people are not very aware of the laws; this is themain reason that they easily break the law. This is particularly common with respect to themanagement and use of land, water resources, animal hunting and forest exploitation.There are many cases of forest laws being breached; this is due to the local people’s beliefthat they hold natural possession of the forest, and as such they are allowed to hunt, log etcetera.
Another driver is economic - they may be employed by illegal wood exploiters and wildlifesuppliers based in cities and towns.
3.2.3 Social/community relationship
In some localities, the social relationship is defined where only one ethnic minority group livesor where many groups of minorities live in the same area. The social relationships of the largerand more developed minority groups will usually affect those of the smaller ones. In theCentral Truong Son, there are several small minority groups with low populations. Althoughthey may be good-natured, they are afraid of encountering and forming relationships withother minorities in particular.
Each village has its own territory, which is generally defined by natural boundaries such as ariver, a spring or a common wood. These natural or man-made boundaries are approved andobeyed.
Community possession is also applied to lands, fields, mountains and forest, rivers andsprings. An individual has the right to exploit, use, inherit, offer and even to transfer thecommunity possessions, although not to individuals from different communities. For fallowland, the owner loses his usage right beyond the date stipulated by the community.
Community and democratic traditions are basic and typical features of Truong Son and CentralHighland communities. They are the strength and guarantee for the existence of each minoritygroup, through internal and external solutions as well as via their relationship with the naturalenvironment.
The process of developing the social economy in recent years has resulted in manyinfluences and dramatic changes to community relations. Firstly, population booms both innumber and proportion of ethnic minorities. The ethnic minorities from the north or the Kinhpeople have taken with them their lifestyle, manners, and custom, creating a mix of thecultural features.
Secondly, changes in the social economy, as well as in the living conditions of each communityand family unit, have also caused changes in the mentality of the native residents, such thatthey reorient themselves according to the direction of development.
However, the process of integrating external cultural elements remains very slow. Some dealwell with their new lives, and hence can integrate and self improve. Meanwhile, others persistwith their accustomed way of living and tend to separate from the outside world. This is partof the reason why the poverty rate is far higher in the ethnic minorities’ communities, and isonly decreasing very slowly.
33
Socio-economic Issues in the Central Truong Son Landscape
3.3 Shifting cultivation
As they use traditional methods of cultivation, many minority groups are classified aspracticing shifting cultivation. As such, they often are considered to be those who injure theforest and as difficult to impose demographic control upon (in other words, they are verypoor). In order to stabilize, develop and improve people’s standard of living, the governmenthas carried out a resettlement programme aimed at the above minority groups since 1975. Afternearly 30 years, a great number of minority people have stabilized and improved their lives.Nevertheless, the old methods continue to be practiced. They can be divided into several types:
1. Stable resettlement (the Kinh people). These groups normally settle in the advantageousareas, such as in lowland areas that are convenient for wet rice cultivation.
2. Resettlement but maintaining the shifting cultivation - i.e. continuing to practicetraditional cultivation methods that require large areas of land. This group lives inmountainous areas where the conditions for agricultural production are disadvantageous,and where there is little area for wet rice cultivation. As a result, they slash and burn theland to produce their main crops. Their living conditions are poor, and there is a high rateof starvation.
3. Complete shifting cultivation. They live in remote, disconnected areas. They earn aliving through natural resource exploitation. They do not have the opportunity to gainaccess to social services. Poverty, starvation and disease occur at high rates.
3.4 Medical care and personal healthcare30
Every commune has a healthcare service center. However, it is often located far from thevillages, e.g. tens of kilometers on very bad roads. This causes difficulties in accessinghealthcare services. The healthcare practitioners working at the district and commune levelsare trained in primary qualifications, and there are very few physicians or doctors available.There are almost no health practitioners originating from the ethnic minorities. Very fewpeople’s health is cared for and it is very poor quality care. The lack of equipment is a severelimit to the service center’s capacity.
According to the government’s policies, people are provided some medication, normallyinfluenza balm and malaria pills, on an annual basis and at a very low cost, or even free. Othergood quality medications are sold at cost price. However, not all people use this service. Manycontinue to use their traditional methods and remedies, or to make ceremonial offerings in thehopes of improving their health.
Diseases are a serious problem in the region. The common diseases, which are the majorcauses of death in this region, are tuberculosis, lung disease, malaria, pneumonia, diarrhea andintestinal diseases that afflict women and children often. In the mountainous areas of QuangTri province, the proportion of malnourished children fluctuates from 60% to 70%; theproportion of female diseases and of goiters is 29 %. These are high figures in comparison withthose for the nation as a whole.
Diseases result from the lack of good and sanitary conditions in daily life, and the fact thatpeople’s living customs have yet to improve31. Rapid population growth continues on in
30 Data source: BEMMA’s report 2000-200131 Quang Tri BEMMA’s report, 2000
34
Socio-economic Issues in the Central Truong Son Landscape
mountainous areas. This is partly due to a high birthrate and partly to the fact that the familyplanning programme was not carried out in this area before 1995. Due to the popularizationand development of family planning services over the past five or six years, the birthrate in theregion has gone down. Some families have become used to the newly-introduced methods ofbirth control, including vasectomy. However, such changes must be made at the right time andeffective strategies to increase people’s awareness must be used.
A remarkably successful healthcare service in the mountainous areas is the immunizationprogramme, which reaches 90% to 95% of children at the injection age. Many other succesfulattempts to improve the healthcare service for people have been made.
3.5 Education in mountainous areas
Almost every commune has a school and runs classes. Those located by the side of main roadsare more comfortable and better equipped. In remote regions, the situation is still poor. Anotherpoint of concern is the teachers, especially ethnic minority teachers. The competence of theteaching staff is low with only 15% of teachers that have been standardized. The number ofstudents attending classes is high at the beginning of the school year; however, 6-7% quit orattend few classes by the end of the course.
In the high mountainous areas, the proportion of students that attend classes reaches only 75%(or even only 50% in some communes). There are many factors that contribute to thissituation, chiefly poverty, the large number of children and a customary lack of concern forchildren’s education. Low attendance is also caused by geographical obstacles in many areas,a lack of teachers in general, plus a lack of classes and teachers for minority pupils. Aremarkable point is that the proportion of minority people that do not know Kinh in theremote regions is as high as 50 to 60%. This causes difficulties in educating and popularisingeducation - which is part of the ongoing poverty reduction and illiteracy eliminationprocesses in the region.
3.6 Economic features
The most typical feature is a dramatic gap between rich and poor people. Because they aremainly at a low level of economic development, earning a living depends on hunting andthey are reliant on each other to survive. Farm production, livestock raising, hunting,collecting and exploiting the forest, as well as traditional vocations and rice growing, arethe main production activities carried out by the minority people of the Truong Son regionand the Central Highlands. Some regions make use of the advantages of technicalinfrastructure, traffic integrated into the market, changing mechanisms and forms ofmanufacturing.
Means of accommodation, eating, living and traveling are very simple, as people mainlyremain on their land. In the past few years, the living standard of people in more developedregions has changed in accordance with their new environments.
3.6.1 Agricultural production
Agriculture plays a key role in the economic structures, making up 80-90% of the total GDPin the districts33. Farming possesses the greatest share (animal raising accounts for 5-10% ofthe sectoral structure). The annual growth rate is 3-3.5%.
35
Socio-economic Issues in the Central Truong Son Landscape
Income per head in the region is lower than that of the country as a whole. In Huong Ho¸district (Quang Tri province), there is 180 kg of food per head available, and in Dak Rong thereis 190 kg per head - equivalent to 73.7% and 77.8% respectively in comparison with theprovincial average income per capita.
Food production in the mountainous areas is characterized by a high but unstable density,low yield and poor harvest (often caused by natural calamities). However, there is decentpotential for food production where virgin soil is continuously reclaimed. New seeds, cropstructure and technical tools are being used to increase productivity and yield, meeting thecommunities’ self-service demand for food. Subsistence food crops can be replaced in someareas by short or long-term commercial crops with higher economic values, resulting ingreater income generation.
Milpa cultivation
Milpa cultivation is considered as an important element of agricultural production activities.
There are two types:
� Alternative cultivation in a closed cycle, which is normally practiced by Ba Na and XoDang ethnic groups. Each household separates land into two areas: land in use andrecovering land. This cycle enables the soil to recover after 10 years of use, when thesoil will be enriched again and the former level of productivity will be reached.However this type of agriculture is only appropriate in areas with low populationdensities, plentiful forests and a relatively undisturbed, stable natural environment.
� Most of the other ethnic groups practice open cycle alternating cultivation. With therapid population growth, people have to rotate their land more and more to produceenough food. The soil becomes poorer and forests cannot regenerate quickly enough.The people then move to other places with better conditions, such as areas with moreland and forests to exploit, resulting in an overall reduction in forest area. Thisexplains why some groups tend to move to remote and secluded areas far frompopulation centers.
Milpa cultivation tends to require significant natural resource exploitation, and theutilization of natural recovery. The environment is damaged when the biological cycle isunstable. The process of biological degradation in a region leads to the destruction ofmachinery, the narrowing of forest areas and hence the disappearance of fauna and flora,particularly valuable and rare species. The life of highland peoples is blighted by severalpressure factors, such as population, land and the labor force. For stability, they need toestablish a balance between these factors. At present, the land suitable for cultivation isdecreasing, with the cycle of alternative cultivation limited to 3-4 years in many localities.
3.6.2 Husbandry
Animal raising plays a noticeable role in people’s lives; not only is it relevant to incomegeneration, foodstuff and nutrition, but also to worship, spray ceremonies and annualfestivals, or when a family member falls ill. Animals are free to wander and feed themselves.Cattle (buffalo and cows) are popular as it is easy for them to find food, and moreover theyare in the habit and customs. In addition, animals such as pigs, chickens, and ducks are alsocommonly raised.
36
Socio-economic Issues in the Central Truong Son Landscape
3.6.3 Other income sources
� Exploitation of forest products and animal hunting are the main sources of income inpeople’s everyday lives. In addition, animal hunting is done to protect their crops andbecause it is considered as the martial spirit and tradition of some ethnic groups as well.
� The ethnic groups here continue to practice many of traditional handicrafts, particularlyweaving (Ta Oi and Ba Na ethnic people), forging (Xo Dang people) and knitting (in allcommunities). But due to a poorly developed economy, these professions are being lostover time.
Income generation activities are varied, depending on the ethnic group and on a specific area.But most activities are simple, decentralized, self-serving and without bearing the hallmark oftrue goods production.
Goods exchange is conducted using the barter system, and the equivalent price system isgoverned by definite unwritten law. The people tend to spend more than they earn, particularlyon festivals and on worship. All of this contributes to starvation each year.
3.7 Socio-economic development programmes/projects in the region 35
In the common strategy for developing the regional socio-economic situation, including theimplementation of an “equal development” policy among the ethnic minority groups, thegovernment has had many policies and provided much support to bolster development througha number of programmes and projects. Most project activities in the region are included in thenationally targeted programmes and projects have been carried out pursuant to commonprinciples and management mechanisms including:
a. Settled agriculture and resettlement project: The group is the ethnic minority people. TheDepartment of Settled Agriculture, Resettlement and New Economic Zones is to be thecontrolling agency, along with the Ministry of Agriculture and Rural Development.
The project objectives are to stablize people’s lives, as well as manufacturing and forestprotection around shifting cultivation zones. Activities include reclaiming virgin soil,practising intensive farming, installing small irrigation schemes, growing commercial trees,
Table 27: Economic structure and production form of the ethnic minorities 34
Production form Tree/plants/animal/professions Assessment of action and tendencyWet field Wet rice Area expanded, productivity and yield
increasedMilpa Hill rice, maize, casava, sweet potato, The area gradually narrowed, low
multi-kind beans, jack fruit, papaya, productivity and quality, unavailablebanana, pineapple, tea, coffe, mulberry marketsand cinamon
Hasbandry Chicken, pig, buffalo, cow, goat Intensive cultivation, low quality and yield poorly developed
Handicraft Knitting, weaving and forging Lost to oblivion self-serving productionForestry Afforestation and protection not stable or developed yet
logging limited and forbiddennon-timber forest product resources exhausted
In-forest animal birds, mammals, reptiles etc scarce and strictly forbiddenhunting
37
Socio-economic Issues in the Central Truong Son Landscape
afforestation, building infrastructure such as roads, health centres, kindergardens, plus movingand stablizing villages.
b. The projects under Programme 327 (completed): The ethnic minority people was the targetgroup of this project. The Ministry of Agriculture and Rural Development was the controllingagency.
The objectives of the Programme 327 was to grow trees on barren hills, to protect forests andthe ecological environment, to make full use of the soil’s potential in the mountainous areas,to attract the labour force and to create jobs. Project activities included fenced growing,preserving existing forests, afforesting new ones, developing rural areas and agriculture, andbuilding infrastructure.
c. The project on relocating people and developing new economic zones: The project is tohave an indirect impact on the ethnic minority people. The Department of Settled Agriculture,Resettlement and New Economic Zones is to be the controlling agency, along with theMinistry of Agriculture and Rural Development.
The aim of this project is to adjust population density, develop the ecconomy, and stablize thesociety. The project has invested in setting up new economic zones with commercial crops andforest trees to be grown and farmed in the economic zones and industrial zones of the CentralHighlands.
d. The project of afforesting 5 million ha (Programme 661) from 1998 to 2010: The maintarget groups are the people from mountainous areas and ethnic minority groups. TheDepartment of Forestry Development with the Ministry of Agricultural and RuralDevelopment are the controlling agencies.
The aims of the project are restoring the balance of the ecology, ensuring stable developmentof the environment, setting up concentrated material zones and creating jobs to make animportant contribution to the socio-economic development of the society and to help themountainous inhabitants to settle their lives.
e. National programme on hunger and povery reduction (coded: No 133). With MOLISA asthe controlling agency.
This project mainly gives priority to communes in extreme difficulty in remote areas.According to Decision No. 133, the content and main activities of this project are:
- Investing in improving the infrastructure (excluding fresh water in rural areas),relocating the population, helping production and the development of careers, issuingcredits to the poor, offering support to education and healthcare, promoting agriculture,fishing and forestry, improving and training the team that is in charge of HAPRP andoriginates from poor communes, implementing settled agriculture and resettlement;moving people to new economic zones, plus aiding the particularly poor and needyhouseholds.
f. The programme on socio-economic development for communes in extreme difficulty inmoutainous and remote areas (coded No. 135). CEMMA is the controlling agency.
The specific targets of the programme are:
38
Socio-economic Issues in the Central Truong Son Landscape
- By 2000, there will be no chronically poor households. There will be a reduction of 4-5%per year, innitially through providing people with clean water, eleminating severalserious infectious diseases, and building roads to the centre of communes.
- By 2005, the number of communes ranked as ‘especially hard’ will be reduced to 25%.By 2000, sufficient clean water will be supplied to people, over 70% of children will goto school, most people will receive training and will share their experiences inproduction. In addition, most people will be able to incorporate cultural, social andscientific knowledge into their lives and the production process.
This programme is being carried out in 234 communes with difficulties within 7 provinces.The initial years focused on the construction of rural infrastructure.
In addition, there are several other development investment and support programmes such as:
g. The programme of building up commune centers This programme focuses on buildinginfrastructure in commune centers. CEMMA is the controlling agency.
This programme focuses on building six types of infrastructure: electric power stations, trafficroutes, schools, medical aid stations, markets, agricultural development stations. These will bedone at strategic development points of some communes in order to push socio-economicdevelopment. This programme has now been combined with Programme 135 of developingthe socio-economic situation in communes in extreme difficulty.
h. Programmes on subsidizing product prices, costs and consumption CEMMA is theexecuting agency.
This programme helps to provide raw materials and services, and to influence the circulationand consumption of products by people. The target groups of this programme are those livingin region III, difficult communes.
i. Programme on aiding ethnic groups in extreme difficulty (under Programme 133)CEMMA is the executing agency.
The target groups of the programme are households of ethnic peoples in extreme difficulty, inregion III plus some in region II. Activities include giving famine relief in the period betweencrops, supplying means of living and issuing credits to enhance the production process.However, this programme has now been changed into a policy supporting ethnic people inextreme difficulty.
3.8 Emerging problems in socio-economic development
Several problems have emerged from the process of implementing socio-economicdevelopment in the Central Truong Son Landscape.
Development has brought about remarkable achievements in this region. However, the ethnicand disadvantaged people have not adequately benefited from development activities,especially those living in the mountainous and remote areas as well as in very isolated highmountain areas. Overall, the main problems faced by these people are:
39
Socio-economic Issues in the Central Truong Son Landscape
3.8.1 Poverty
This issue is rather difficult to solve. For instance, the percentage of poor households in themountainous areas of Thua Thien Hue and Quang Tri account for 42- 45%; among ethnicpeople, this figure is 50- 60%. This figure rises even higher if calculated according to thenew criteria introduced by MOLISA. Most ethnic people are living below the poverty lineand are extremely short of food. The problem is more serious for the people living in smallgroups in the remote areas due to their disadvantageous living conditions, insufficientproduction facilities and the inability to access social services.
3.8.2 Environmental degradation and forest losses
Due to various reasons such as slash and burn cultivation, war and illegal exploitation, theenvironment in some regions has been seriously degraded. This in turns causes floods,landslides, soil erosion, water shortages and infertile soil. Land area used for cultivation hasincreased in many areas of the Central Highlands. Annually, about 122,820 ha of forest areaare lost, mostly in mountainous areas. Therefore, there must be a considerable amount ofdeforested land in this area, partly because of the ethnic people’s cultivation, partly becauseof illegal logging and forest destruction to increase the land area for growing coffee, pepperand fruit trees.
3.8.3 High population growth rate
The population growth rate has put a great deal of pressure on the environment and the land,especially the forests. As well as the high natural growth rate among ethnic minority groupssuch as the Ba Na (3.9%) and Gie Trieng (3.9%)36, the effect caused by the mechanicalgrowth rate should not be ignored.
Mechanical population growth leaves the greatest impact on the living environment of theTruong Son and Central Highlands. This growth can be attributed to the Kinh people fromthe coastal delta, and to people from the north as a result of both part of planned and freemigration. This situation is apparent in the Central Highland provinces including Gia Lai andKon Tum. In 1945, Kinh people accounted for 5% of the population; this figure increased to50% by 1975 and at present, amounts to between 50-87%, depending on the province.During the past 25 years, the population of the Central Highlands has increased dramatically(around 3 to 4 times) due to migration from the north of the ethnic minorities - i.e. 700,000from free migration37.
The Truong Son region and Central Highlands have become the “promised land” forthousands of people. Those who are well enough off purchase land for growing commercialcrops. The poor households (both from the north and south) move here to make living. Thishas led to the use of the slash and burn method, land trading and forest destruction. It is notonly the newcomers, but the inhabitants that have lived here for many generations, that arebeing pushed into this cycle.
3.8.4 Infrastructure
Due to the isolated terrain and poor infrastructure capacity, roads for transportation have notbeen built in many communes, let alone at the village level. This is partly due to the fact thatan administrative unit in the mountainous areas is often much bigger than that in the coastal
40
Socio-economic Issues in the Central Truong Son Landscape
plain areas. The national electricity network has reached the provinces, districts and somecommunal centers; however, up to 70% ~ 75% of the population do not have access to it.
3.8.5 Low schooling level and high illiteracy
The percentage of illiterate working people in communes in region III is 60- 70%. The rate ofliteracy in the Ba Na and Gia Rai ethnic groups is 20% (1989). If gender is taken intoconsideration, the figure of illiterate women is 12%. The illiteracy rate among breadwinnersand people in the labor force is rather high38.
3.8.6 The differences in culture and language/dialect
As they live in isolation, the Central Truong Son ethnic minority people have retained theirown cultural identity and traditions. Integrating and accepting modern development (as inlowland culture/the majority people’s culture) is difficult for them due to the barriers createdby different languages, lifestyle, customs, and cultivation methods.
3.8.7 The differentiation between the rich and the poor
The achievements in the region also have had a negative aspect. Although some people haveincreased their wealth (mainly the ethnic majority people), and some ethnic minority peoplehave been able to stabilize their lives, many others have had to face an even more difficult lifebecause of the environmental changes/degradation caused by urbanization and expansion ofareas for growing crops such as coffee and rubber trees.
3.8.8 Insufficient management
Various issues relating to inefficient management of development in the ethnic minority andmountainous areas (as well as in the region as a whole) have arisen.
Some programmes/projects have been implemented without concrete research into the socio-ecological conditions. Another common problem is that local participation in the planning andimplementation of socio-economic programmes is limited. There are very implicit issuesresulting from poverty status and economic weakness. These normally fall to the ethnicminority groups who are less educated, illiterate, and familiar with the natural life. To earn aliving, they themselves find and use a solution, which they have always used to survive.
41
Socio-economic Issues in the Central Truong Son Landscape
PART IV: ORGANIZATIONS INVOLVED IN CONSERVATION
To ensure a successful conservation campaign, that maintains the natural biodiversity, theconservation areas of the CTSL must be directly or indirectly related to the mass organizationsand different target groups that impact - positively or negatively - on the regional conservationstrategy. This not only covers protection and maintenance of protected areas, but also theconsideration of a natural resource utilization plan and the socio-economic development of theinfluenced areas. The following target groups can be identified:
Local residents, natural resources users, provincial or district level government agencies,international organizations, and donors.
4.1 Local level resident groups
Community level residents have a direct influence on protected/conservation areas throughland and available water use, and the exploitation of forest that has potential to guarantee asecure livelihood. This group plays an important and decisive role, and their input is vital toensure the success of planning and managing the preserved areas. Conservation work mustaddress concerns about the demands and profit of the local residents, which is institutionalizedin concrete regulations, principles, and policies.
The majority of local residents belong to ethnic minority groups. These people, who are thetraditional owners of the land and who hold distinct cultures, should be thought about whenconsidering interventions and likely impacts. This is particularly important in relation to issuessuch as land-use rights, division of profits from conservation activities, construction ofirrigation works, hydropower station construction, changes of habits and customs, unwrittenlaws and the role of the community’s core members.
Local community groups include local socio-political organizations (e.g. Communal people’scommittee, village head, Women Union, Youth Union, Fatherland Front) that are behind thecommunities’ people of prestige, namely village patriarchs and well-educated persons.Developing the communes’ socio-economic situation, reducing hunger, alleviating poverty andimproving people’s lives are fundamental to ensuring that strategic conservation is successful.These reduce communities’ dependence, impact and intervention on forest resources.
4.2 Watershed-based natural resource users
This group has both direct and indirect impact/influence on the conservation areas. If theirlivelihoods are not guaranteed, these people will trespass on the conservation areas to exploitnatural resources such as plants, trees, and rare animals either directly or indirectly (bycollaborating with the local people). This is clearly seen in conservation areas such as Kon KaKinh and Phong Dien.
The poor management of headwater forests has also resulted in local climate changes,reduction of household and agricultural water quality, as well as unexpected droughts andfloods. Hence, the water source also plays an important role in the economic lives of people inurban and coastal areas.
42
Socio-economic Issues in the Central Truong Son Landscape
4.3 Local administrative system 39
The local administrative system is directly in charge of conservation duties throughimplemention and state management. This system is set up in conformity to the commonstructure of most provinces. The provincial peoples’ committee ranks as the first level, playinga decisive role in designing strategies and socio-economic development plans, including themanagement and construction of conservation zones that are related to and dominate the localcommunity, as well as other participating international organizations. These units function asconsultant and assistant offices for the provincial people’s committee, and are established fromprovince to district, some even to communes.
The PPC, more precisely the president of the PPC, makes the final decision in all plans,programmes and projects; and is invested in a position of authority that is decentralized fromthe central level. The functions, duties, rights, obligations and managed sectors of some coreagencies at the provincial level are involved in economic development and natural resourcemanagement as follows:
a. DPI is the consulting unit for making plans, as well as for linking and distributing thebudgets invested in the province. DPI possesses much power in governing the othermanagement agencies’ activities.
b. DARD is the agency responsible for agro-forestry activities in localities. These includethe implementation of state management work concerning the sector, and directexpansion of specific activities such as projection, design, agro-forestry promotion,veterinary services and watershed management.
c. DOLISA is in charge of hunger alleviation and poverty reduction, according to thenational targets Programme No. 133.
d. BEMMA or DRNEZ is in charge of supervising and supporting local communities,especially the ethnic minorities. This agency is responsible for managing and directingthe implementation of the programmes carried out in areas with difficulties, namelyprogrammes such as No. 135 on resettlement, and support the ethnic communities inextreme difficulty.
e. SFPD and DFD are both state management agencies with regard to forest protection andimplement some programmes/projects on afforestation development such as the 5million ha Programme.
The SFPDs in Thua Thien Hue and Gia Lai are recognized as the provincial focal pointdepartments under the PPC, while in Kon Tum, Quang Tri and Da Nang they are underDARD.
f. The Electricity Company and the DoTT are in charge of building and upgrading theinfrastructure (e.g. electricity and roads)
g. The Department of Land (DoL) is the state management agency responsible for land, landprojection and use, among other things.
43
Socio-economic Issues in the Central Truong Son Landscape
It is essential to ascertain targets for stable development in the long-term strategy, haveunited and combined plans, and carry out development programmes in these areas toavoid contradictions between conservation duties and development, as well as for abetter combination of human forces.
4.4 Local socio-political organizations
There are also other socio-politic organizations in the State administrative system such as theFatherland Front, Women’s Association, Farmer’s association, Veteran’s association and YouthUnion, which cast a wide net from provinces to districts and communes. These organizationsplay a role in encouraging, speeding up and supporting activities in peoples’ communities. Inaddition, they also direct and participate in some socio-economic development programmes tocreate motivation for social development, for example helping with income generation,alleviating hunger, reducing poverty and protecting the environment.
4.5 Other related organizations
With its typically diverse biological features, the Central Truong Son Landscape has attractedthe attention of many international environmental organizations. At present, a great number ofactivities have been implemented here by BirdLife, FIPI, WWF and JICA. Some other largeinternational organizations, such as the World Bank and the ADB, have important programmeson socio-economic development, hunger alleviation and poverty reduction in the eightprovinces. In addition, other international NGO’s currently are implementing projects, forexample OHK and ICCO in Quang Tri and Thua Thien Hue.
44
Socio-economic Issues in the Central Truong Son Landscape
PART V: SUMMARY AND RECOMMENDATIONS ON SOME ISSUES RELATING TO NATURAL RESOURCE
MANAGEMENT AND CONSERVATION
The Central Truong Son Landscape’s natural resource management and conservation also playan important role in national and regional development. This is not only significant to bio-diversity and environmental protection, but also to the conservation of ethnic minorities’identity and cultural values in the region.
In the above-mentioned issues, it is obvious that environmental protection and natural resourceconservation involve not only in the ethnic minority people, but also the majority people(either directly or indirectly depending on the concrete circumstance and different conditions).
� The slash and burn cultivation system carried out by the ethnic minority people is not thekey reason leading to environmental degradation presently; greater impacts come fromother causes.
� The Truong Son region and Central Highlands cover a considerable area that could beexploited in the future for the purposes of survival and co-existence, especially inarranging or reconciling residents among areas.
� The development of the CTSL should be motivated on the basis of concrete studies,detailed projection, and content corresponding to human and ecological features in eacharea and in every ethnic group, thus avoiding unplanned and unbalanced development.This is necessary for both the settled and protected areas.
� Through the tendency of expanding the area for agricultural cultivation, ecologicalconservation, and watershed protection, the resources available for the ethnic groups willbe gradually narrowed. The pressure for survival forces them to adapt to the newenvironment and often breaks the barriers stipulated by outsiders. Conservation will onlybe truly successful after economic stability has been created for the influenced groups.
� Thus, people need support from all sides to enhance food production and other materialsby creating or introducing techniques, plus sensible and effective management to helpthem to familiarize themselves with the changes of lifestyle, cultivation methods, andeven habits to incorporate an unfamiliar lifestyle. People have enough food to servethemselves, income to pay for services such as healthcare, education and culture, andfavor life near forest, as they can make a profit from the forest without it beingencroaching upon it.
� To promote the role of local communities in natural resource management and enhanceparticipation via the establishment of land-use rights regulations, both in written andtraditional forms. They themselves are the owners of both the natural resources and thelocal knowledge. They know how to exploit and protect what is important to human lifeand to natural diversity. Community based traditions and democratic ones are the potentialstrength to encourage them to be core members in forest protection and natural resourceconservation.
� The culture of ethnic minorities is cemented by the forest and its wildlife. They have their
45
Socio-economic Issues in the Central Truong Son Landscape
own methods of building and managing the economy, culture and environment. Theyunderstand the ways to exploit the cultural factors/aspects in order to promote naturalresource management and conservation of unwritten laws, festivals, rituals, and religiousbeliefs (such as the Water God, Rain God or animal worship.)
� Notably, the women’s role is highly respected, in not only matriarchy society, but in othercommunities as well. Women’s daily life is intertwined with their forest, as they are thecore member of family who produce food, fetch logs and water, and raise animals to feedtheir children. They will gradually depend less on the forest if their and family members’living standards are improved with better methods. By then, animal hunting will not bethe main income for households.
� To promote propaganda in the communities of people’s right and obligations towardsprotection of the natural environment. To help them become more aware of the regions’biodiversity values. The social organizations need to be strengthened to ensure localenvironment maintenance and natural resource management.
� The Central Truong Son Landscape’s conservation and development should be recognizedin the strategic aspects and national development policy, as well as the policies’specification and supplementation implemented in each locality, and the appropriatenessof human ecology.
� Holistic, inter-sectoral cooperation among the relevant agencies at central or local levelsis needed, and most importantly their participation in making and implementing a planunder a united programme bearing their support and without contradiction.
The success of nature protection and conservation is heavily dependant on the people living insuch areas, including the ethnic minority and the majority, as well as on the indigenous peopleand migrants. Consequently, a human being’s existence is natural and it cannot be separatedfrom nature.
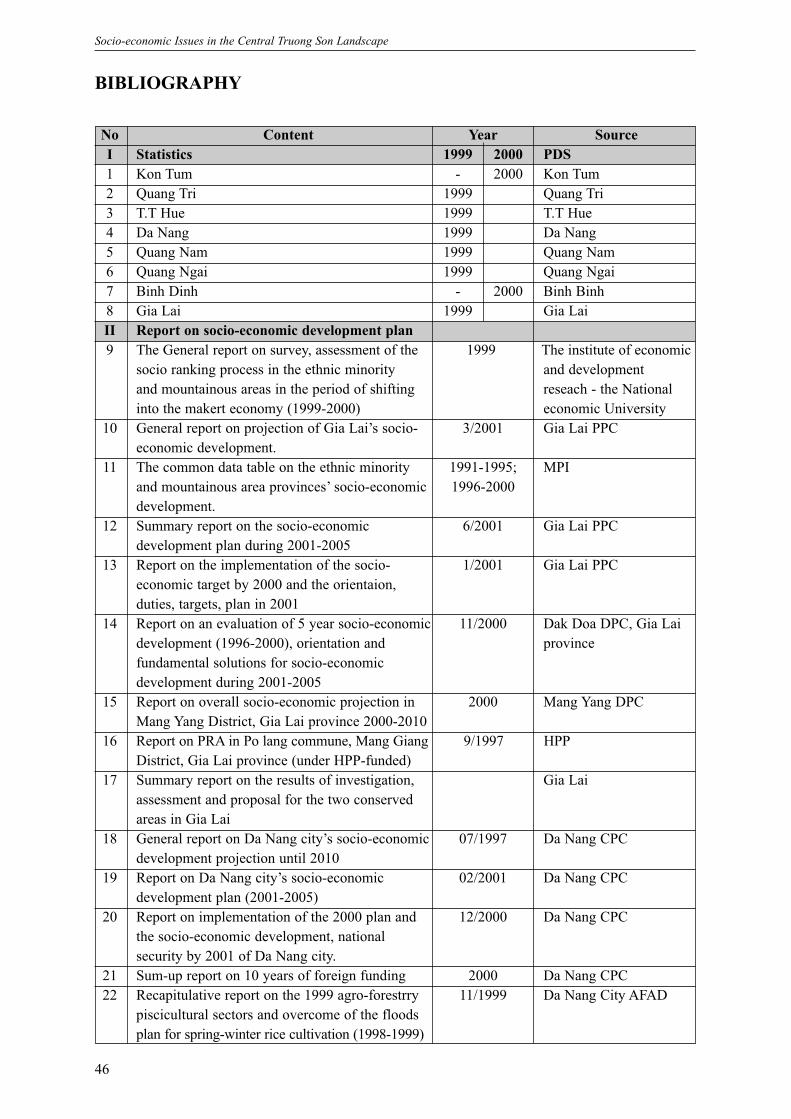
46
Socio-economic Issues in the Central Truong Son Landscape
BIBLIOGRAPHY
No Content Year SourceI Statistics 1999 2000 PDS1 Kon Tum - 2000 Kon Tum2 Quang Tri 1999 Quang Tri3 T.T Hue 1999 T.T Hue4 Da Nang 1999 Da Nang5 Quang Nam 1999 Quang Nam6 Quang Ngai 1999 Quang Ngai7 Binh Dinh - 2000 Binh Binh8 Gia Lai 1999 Gia Lai II Report on socio-economic development plan 9 The General report on survey, assessment of the 1999 The institute of economic
socio ranking process in the ethnic minority and development and mountainous areas in the period of shifting reseach - the Nationalinto the makert economy (1999-2000) economic University
10 General report on projection of Gia Lai’s socio- 3/2001 Gia Lai PPCeconomic development.
11 The common data table on the ethnic minority 1991-1995; MPIand mountainous area provinces’ socio-economic 1996-2000 development.
12 Summary report on the socio-economic 6/2001 Gia Lai PPCdevelopment plan during 2001-2005
13 Report on the implementation of the socio- 1/2001 Gia Lai PPCeconomic target by 2000 and the orientaion, duties, targets, plan in 2001
14 Report on an evaluation of 5 year socio-economic 11/2000 Dak Doa DPC, Gia Laidevelopment (1996-2000), orientation and provincefundamental solutions for socio-economicdevelopment during 2001-2005
15 Report on overall socio-economic projection in 2000 Mang Yang DPCMang Yang District, Gia Lai province 2000-2010
16 Report on PRA in Po lang commune, Mang Giang 9/1997 HPPDistrict, Gia Lai province (under HPP-funded)
17 Summary report on the results of investigation, Gia Lai assessment and proposal for the two conserved areas in Gia Lai
18 General report on Da Nang city’s socio-economic 07/1997 Da Nang CPCdevelopment projection until 2010
19 Report on Da Nang city’s socio-economic 02/2001 Da Nang CPCdevelopment plan (2001-2005)
20 Report on implementation of the 2000 plan and 12/2000 Da Nang CPCthe socio-economic development, national security by 2001 of Da Nang city.
21 Sum-up report on 10 years of foreign funding 2000 Da Nang CPC22 Recapitulative report on the 1999 agro-forestrry 11/1999 Da Nang City AFAD
piscicultural sectors and overcome of the floodsplan for spring-winter rice cultivation (1998-1999)
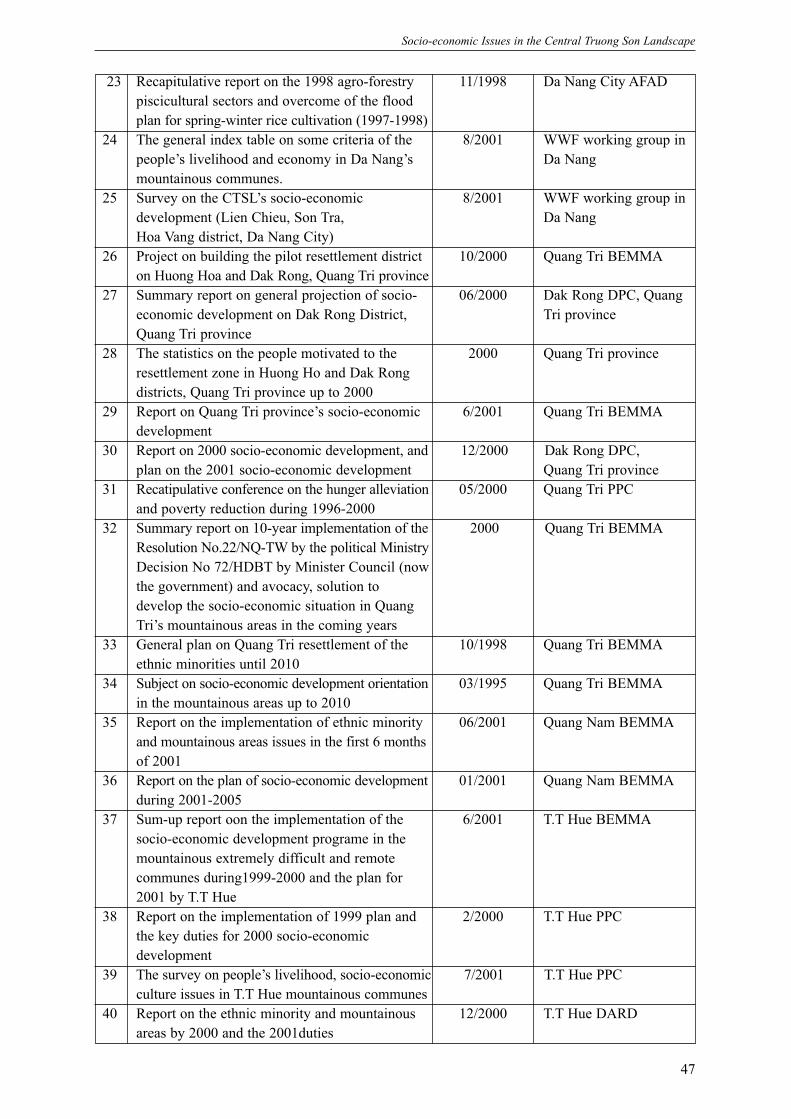
47
Socio-economic Issues in the Central Truong Son Landscape
23 Recapitulative report on the 1998 agro-forestry 11/1998 Da Nang City AFADpiscicultural sectors and overcome of the floodplan for spring-winter rice cultivation (1997-1998)
24 The general index table on some criteria of the 8/2001 WWF working group in people’s livelihood and economy in Da Nang’s Da Nang mountainous communes.
25 Survey on the CTSL’s socio-economic 8/2001 WWF working group indevelopment (Lien Chieu, Son Tra, Da NangHoa Vang district, Da Nang City)
26 Project on building the pilot resettlement district 10/2000 Quang Tri BEMMAon Huong Hoa and Dak Rong, Quang Tri province
27 Summary report on general projection of socio- 06/2000 Dak Rong DPC, Quang economic development on Dak Rong District, Tri provinceQuang Tri province
28 The statistics on the people motivated to the 2000 Quang Tri provinceresettlement zone in Huong Ho and Dak Rong districts, Quang Tri province up to 2000
29 Report on Quang Tri province’s socio-economic 6/2001 Quang Tri BEMMAdevelopment
30 Report on 2000 socio-economic development, and 12/2000 Dak Rong DPC,plan on the 2001 socio-economic development Quang Tri province
31 Recatipulative conference on the hunger alleviation 05/2000 Quang Tri PPCand poverty reduction during 1996-2000
32 Summary report on 10-year implementation of the 2000 Quang Tri BEMMAResolution No.22/NQ-TW by the political MinistryDecision No 72/HDBT by Minister Council (now the government) and avocacy, solution to develop the socio-economic situation in Quang Tri’s mountainous areas in the coming years
33 General plan on Quang Tri resettlement of the 10/1998 Quang Tri BEMMAethnic minorities until 2010
34 Subject on socio-economic development orientation 03/1995 Quang Tri BEMMAin the mountainous areas up to 2010
35 Report on the implementation of ethnic minority 06/2001 Quang Nam BEMMAand mountainous areas issues in the first 6 monthsof 2001
36 Report on the plan of socio-economic development 01/2001 Quang Nam BEMMAduring 2001-2005
37 Sum-up report oon the implementation of the 6/2001 T.T Hue BEMMAsocio-economic development programe in the mountainous extremely difficult and remote communes during1999-2000 and the plan for 2001 by T.T Hue
38 Report on the implementation of 1999 plan and 2/2000 T.T Hue PPCthe key duties for 2000 socio-economic development
39 The survey on people’s livelihood, socio-economic 7/2001 T.T Hue PPCculture issues in T.T Hue mountainous communes
40 Report on the ethnic minority and mountainous 12/2000 T.T Hue DARDareas by 2000 and the 2001duties
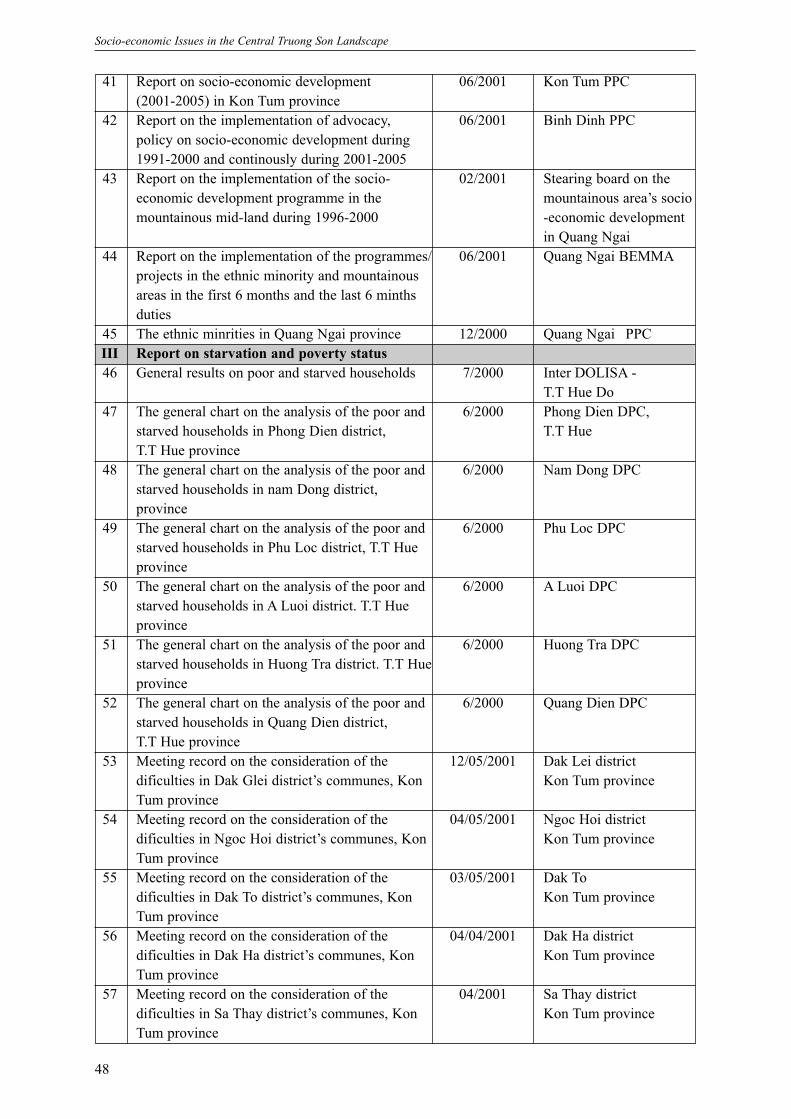
48
Socio-economic Issues in the Central Truong Son Landscape
41 Report on socio-economic development 06/2001 Kon Tum PPC(2001-2005) in Kon Tum province
42 Report on the implementation of advocacy, 06/2001 Binh Dinh PPCpolicy on socio-economic development during 1991-2000 and continously during 2001-2005
43 Report on the implementation of the socio- 02/2001 Stearing board on the economic development programme in the mountainous area’s sociomountainous mid-land during 1996-2000 -economic development
in Quang Ngai44 Report on the implementation of the programmes/ 06/2001 Quang Ngai BEMMA
projects in the ethnic minority and mountainous areas in the first 6 months and the last 6 minths duties
45 The ethnic minrities in Quang Ngai province 12/2000 Quang Ngai PPC III Report on starvation and poverty status 46 General results on poor and starved households 7/2000 Inter DOLISA -
T.T Hue Do47 The general chart on the analysis of the poor and 6/2000 Phong Dien DPC,
starved households in Phong Dien district, T.T HueT.T Hue province
48 The general chart on the analysis of the poor and 6/2000 Nam Dong DPCstarved households in nam Dong district, province
49 The general chart on the analysis of the poor and 6/2000 Phu Loc DPCstarved households in Phu Loc district, T.T Hueprovince
50 The general chart on the analysis of the poor and 6/2000 A Luoi DPCstarved households in A Luoi district. T.T Hueprovince
51 The general chart on the analysis of the poor and 6/2000 Huong Tra DPCstarved households in Huong Tra district. T.T Hueprovince
52 The general chart on the analysis of the poor and 6/2000 Quang Dien DPCstarved households in Quang Dien district, T.T Hue province
53 Meeting record on the consideration of the 12/05/2001 Dak Lei districtdificulties in Dak Glei district’s communes, Kon Kon Tum provinceTum province
54 Meeting record on the consideration of the 04/05/2001 Ngoc Hoi district dificulties in Ngoc Hoi district’s communes, Kon Kon Tum provinceTum province
55 Meeting record on the consideration of the 03/05/2001 Dak Todificulties in Dak To district’s communes, Kon Kon Tum provinceTum province
56 Meeting record on the consideration of the 04/04/2001 Dak Ha districtdificulties in Dak Ha district’s communes, Kon Kon Tum provinceTum province
57 Meeting record on the consideration of the 04/2001 Sa Thay districtdificulties in Sa Thay district’s communes, Kon Kon Tum provinceTum province
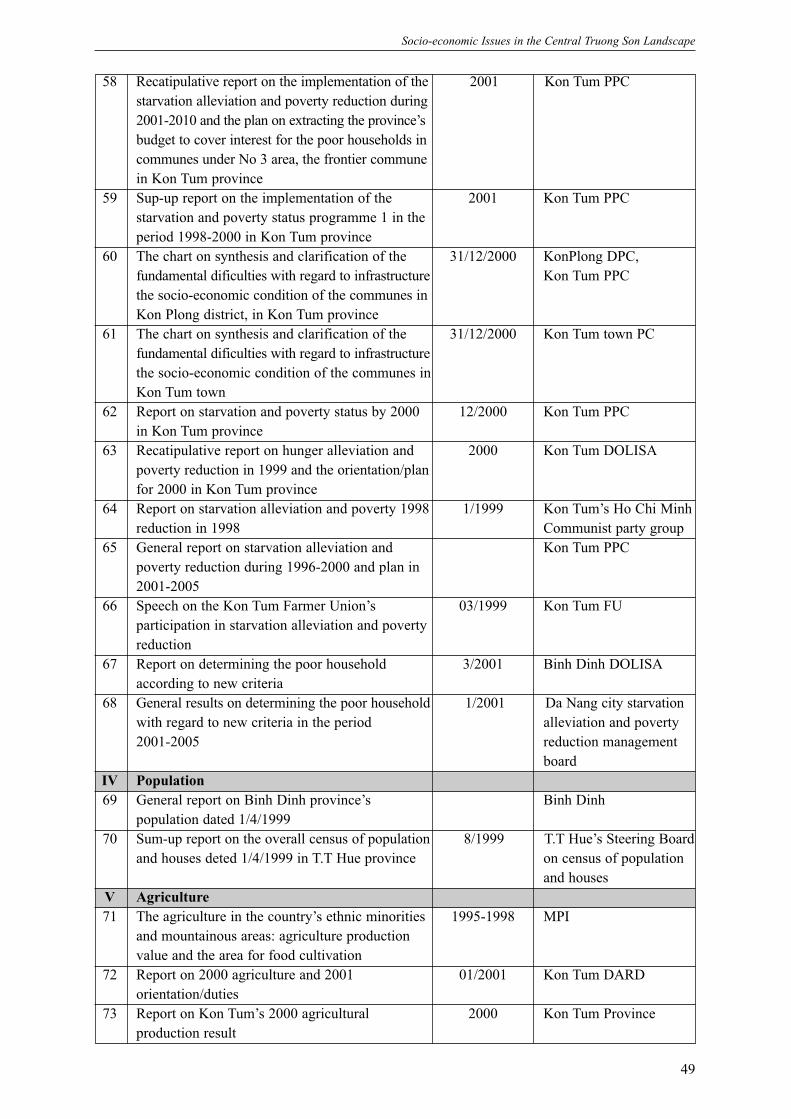
49
Socio-economic Issues in the Central Truong Son Landscape
58 Recatipulative report on the implementation of the 2001 Kon Tum PPCstarvation alleviation and poverty reduction during2001-2010 and the plan on extracting the province’sbudget to cover interest for the poor households incommunes under No 3 area, the frontier communein Kon Tum province
59 Sup-up report on the implementation of the 2001 Kon Tum PPCstarvation and poverty status programme 1 in the period 1998-2000 in Kon Tum province
60 The chart on synthesis and clarification of the 31/12/2000 KonPlong DPC,fundamental dificulties with regard to infrastructure Kon Tum PPCthe socio-economic condition of the communes inKon Plong district, in Kon Tum province
61 The chart on synthesis and clarification of the 31/12/2000 Kon Tum town PCfundamental dificulties with regard to infrastructurethe socio-economic condition of the communes in Kon Tum town
62 Report on starvation and poverty status by 2000 12/2000 Kon Tum PPCin Kon Tum province
63 Recatipulative report on hunger alleviation and 2000 Kon Tum DOLISApoverty reduction in 1999 and the orientation/planfor 2000 in Kon Tum province
64 Report on starvation alleviation and poverty 1998 1/1999 Kon Tum’s Ho Chi Minhreduction in 1998 Communist party group
65 General report on starvation alleviation and Kon Tum PPCpoverty reduction during 1996-2000 and plan in 2001-2005
66 Speech on the Kon Tum Farmer Union’s 03/1999 Kon Tum FUparticipation in starvation alleviation and poverty reduction
67 Report on determining the poor household 3/2001 Binh Dinh DOLISAaccording to new criteria
68 General results on determining the poor household 1/2001 Da Nang city starvation with regard to new criteria in the period alleviation and poverty 2001-2005 reduction management
board IV Population69 General report on Binh Dinh province’s Binh Dinh
population dated 1/4/199970 Sum-up report on the overall census of population 8/1999 T.T Hue’s Steering Board
and houses deted 1/4/1999 in T.T Hue province on census of population and houses
V Agriculture 71 The agriculture in the country’s ethnic minorities 1995-1998 MPI
and mountainous areas: agriculture production value and the area for food cultivation
72 Report on 2000 agriculture and 2001 01/2001 Kon Tum DARDorientation/duties
73 Report on Kon Tum’s 2000 agricultural 2000 Kon Tum Provinceproduction result
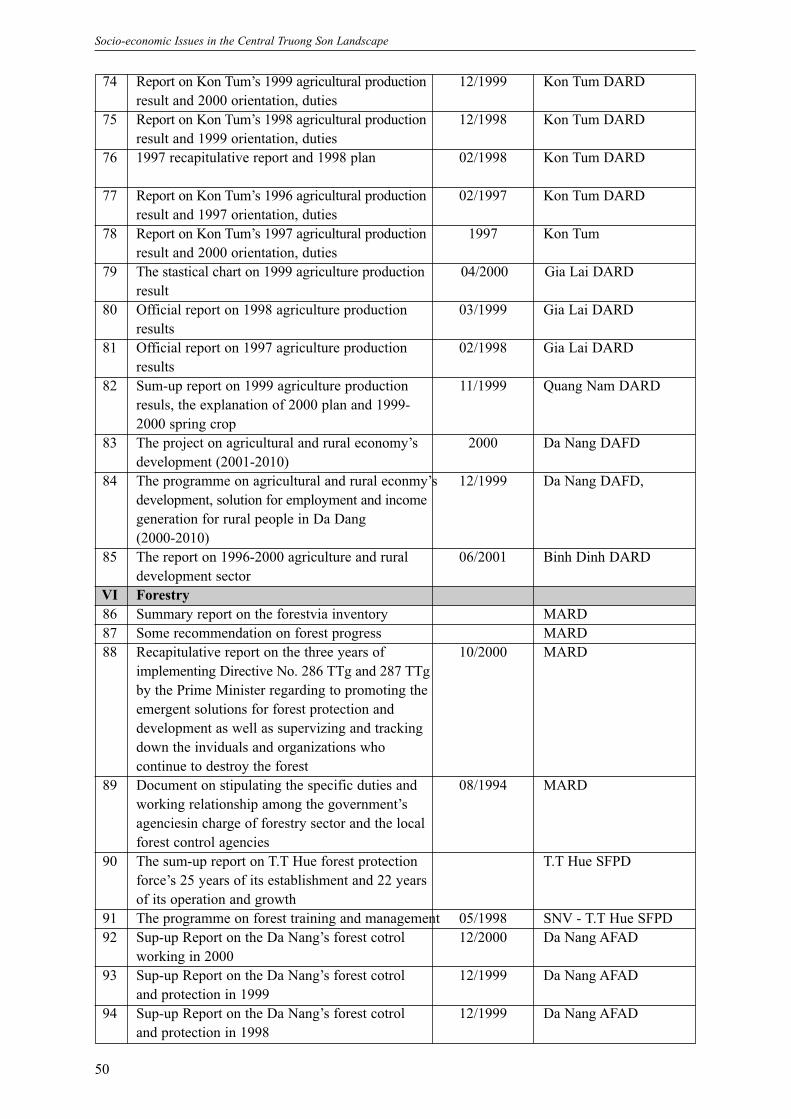
50
Socio-economic Issues in the Central Truong Son Landscape
74 Report on Kon Tum’s 1999 agricultural production 12/1999 Kon Tum DARDresult and 2000 orientation, duties
75 Report on Kon Tum’s 1998 agricultural production 12/1998 Kon Tum DARDresult and 1999 orientation, duties
76 1997 recapitulative report and 1998 plan 02/1998 Kon Tum DARD
77 Report on Kon Tum’s 1996 agricultural production 02/1997 Kon Tum DARDresult and 1997 orientation, duties
78 Report on Kon Tum’s 1997 agricultural production 1997 Kon Tum result and 2000 orientation, duties
79 The stastical chart on 1999 agriculture production 04/2000 Gia Lai DARDresult
80 Official report on 1998 agriculture production 03/1999 Gia Lai DARDresults
81 Official report on 1997 agriculture production 02/1998 Gia Lai DARDresults
82 Sum-up report on 1999 agriculture production 11/1999 Quang Nam DARDresuls, the explanation of 2000 plan and 1999- 2000 spring crop
83 The project on agricultural and rural economy’s 2000 Da Nang DAFDdevelopment (2001-2010)
84 The programme on agricultural and rural econmy’s 12/1999 Da Nang DAFD,development, solution for employment and incomegeneration for rural people in Da Dang (2000-2010)
85 The report on 1996-2000 agriculture and rural 06/2001 Binh Dinh DARDdevelopment sector
VI Forestry86 Summary report on the forestvia inventory MARD87 Some recommendation on forest progress MARD88 Recapitulative report on the three years of 10/2000 MARD
implementing Directive No. 286 TTg and 287 TTgby the Prime Minister regarding to promoting the emergent solutions for forest protection and development as well as supervizing and tracking down the inviduals and organizations who continue to destroy the forest
89 Document on stipulating the specific duties and 08/1994 MARDworking relationship among the government’sagenciesin charge of forestry sector and the local forest control agencies
90 The sum-up report on T.T Hue forest protection T.T Hue SFPD force’s 25 years of its establishment and 22 yearsof its operation and growth
91 The programme on forest training and management 05/1998 SNV - T.T Hue SFPD92 Sup-up Report on the Da Nang’s forest cotrol 12/2000 Da Nang AFAD
working in 200093 Sup-up Report on the Da Nang’s forest cotrol 12/1999 Da Nang AFAD
and protection in 199994 Sup-up Report on the Da Nang’s forest cotrol 12/1999 Da Nang AFAD
and protection in 1998
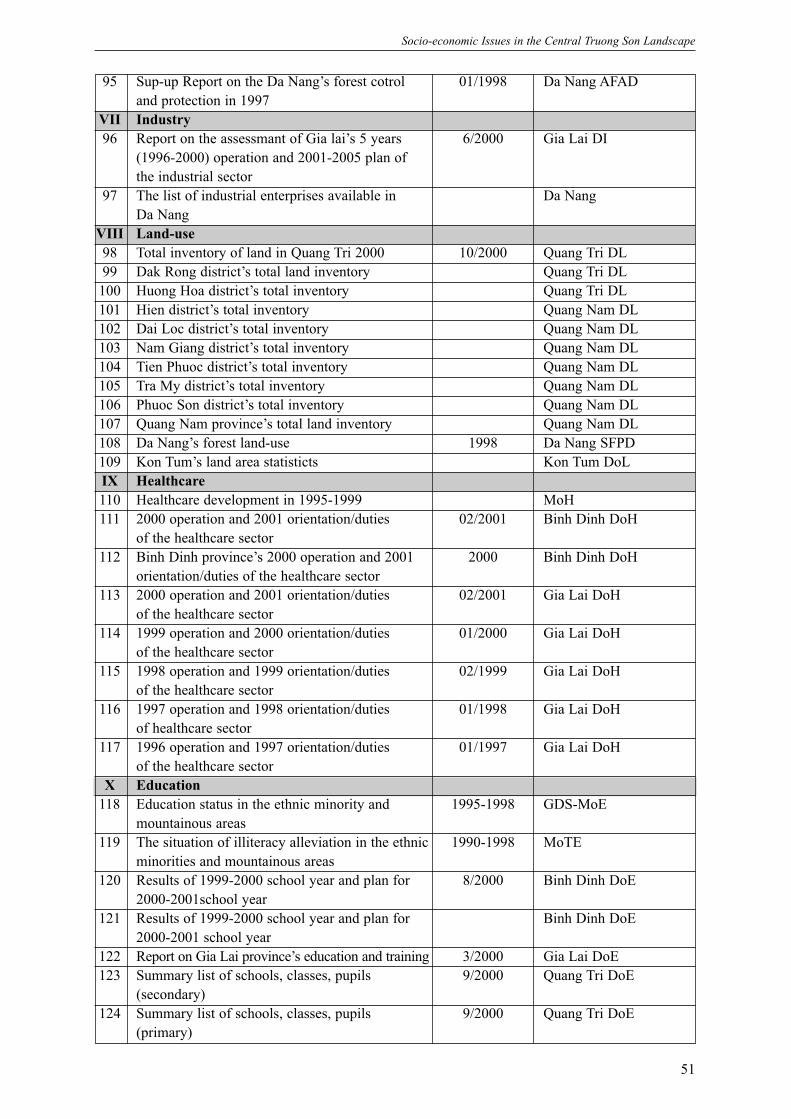
51
Socio-economic Issues in the Central Truong Son Landscape
95 Sup-up Report on the Da Nang’s forest cotrol 01/1998 Da Nang AFADand protection in 1997
VII Industry96 Report on the assessmant of Gia lai’s 5 years 6/2000 Gia Lai DI
(1996-2000) operation and 2001-2005 plan of the industrial sector
97 The list of industrial enterprises available in Da NangDa Nang
VIII Land-use98 Total inventory of land in Quang Tri 2000 10/2000 Quang Tri DL99 Dak Rong district’s total land inventory Quang Tri DL
100 Huong Hoa district’s total inventory Quang Tri DL101 Hien district’s total inventory Quang Nam DL102 Dai Loc district’s total inventory Quang Nam DL103 Nam Giang district’s total inventory Quang Nam DL104 Tien Phuoc district’s total inventory Quang Nam DL105 Tra My district’s total inventory Quang Nam DL106 Phuoc Son district’s total inventory Quang Nam DL107 Quang Nam province’s total land inventory Quang Nam DL108 Da Nang’s forest land-use 1998 Da Nang SFPD109 Kon Tum’s land area statisticts Kon Tum DoLIX Healthcare110 Healthcare development in 1995-1999 MoH111 2000 operation and 2001 orientation/duties 02/2001 Binh Dinh DoH
of the healthcare sector 112 Binh Dinh province’s 2000 operation and 2001 2000 Binh Dinh DoH
orientation/duties of the healthcare sector113 2000 operation and 2001 orientation/duties 02/2001 Gia Lai DoH
of the healthcare sector114 1999 operation and 2000 orientation/duties 01/2000 Gia Lai DoH
of the healthcare sector115 1998 operation and 1999 orientation/duties 02/1999 Gia Lai DoH
of the healthcare sector 116 1997 operation and 1998 orientation/duties 01/1998 Gia Lai DoH
of healthcare sector117 1996 operation and 1997 orientation/duties 01/1997 Gia Lai DoH
of the healthcare sector X Education
118 Education status in the ethnic minority and 1995-1998 GDS-MoEmountainous areas
119 The situation of illiteracy alleviation in the ethnic 1990-1998 MoTEminorities and mountainous areas
120 Results of 1999-2000 school year and plan for 8/2000 Binh Dinh DoE2000-2001school year
121 Results of 1999-2000 school year and plan for Binh Dinh DoE2000-2001 school year
122 Report on Gia Lai province’s education and training 3/2000 Gia Lai DoE123 Summary list of schools, classes, pupils 9/2000 Quang Tri DoE
(secondary)124 Summary list of schools, classes, pupils 9/2000 Quang Tri DoE
(primary)
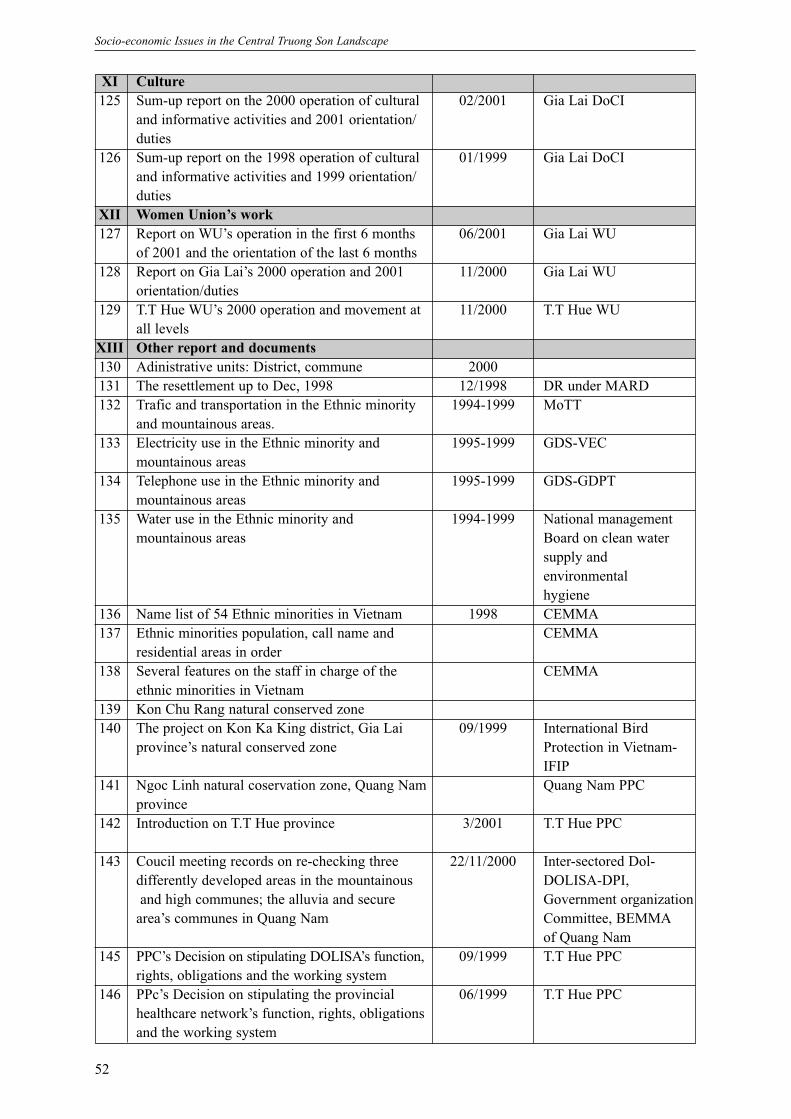
52
Socio-economic Issues in the Central Truong Son Landscape
XI Culture125 Sum-up report on the 2000 operation of cultural 02/2001 Gia Lai DoCI
and informative activities and 2001 orientation/duties
126 Sum-up report on the 1998 operation of cultural 01/1999 Gia Lai DoCIand informative activities and 1999 orientation/duties
XII Women Union’s work127 Report on WU’s operation in the first 6 months 06/2001 Gia Lai WU
of 2001 and the orientation of the last 6 months 128 Report on Gia Lai’s 2000 operation and 2001 11/2000 Gia Lai WU
orientation/duties129 T.T Hue WU’s 2000 operation and movement at 11/2000 T.T Hue WU
all levelsXIII Other report and documents130 Adinistrative units: District, commune 2000131 The resettlement up to Dec, 1998 12/1998 DR under MARD 132 Trafic and transportation in the Ethnic minority 1994-1999 MoTT
and mountainous areas.133 Electricity use in the Ethnic minority and 1995-1999 GDS-VEC
mountainous areas134 Telephone use in the Ethnic minority and 1995-1999 GDS-GDPT
mountainous areas 135 Water use in the Ethnic minority and 1994-1999 National management
mountainous areas Board on clean water supply andenvironmentalhygiene
136 Name list of 54 Ethnic minorities in Vietnam 1998 CEMMA137 Ethnic minorities population, call name and CEMMA
residential areas in order 138 Several features on the staff in charge of the CEMMA
ethnic minorities in Vietnam139 Kon Chu Rang natural conserved zone 140 The project on Kon Ka King district, Gia Lai 09/1999 International Bird
province’s natural conserved zone Protection in Vietnam-IFIP
141 Ngoc Linh natural coservation zone, Quang Nam Quang Nam PPCprovince
142 Introduction on T.T Hue province 3/2001 T.T Hue PPC
143 Coucil meeting records on re-checking three 22/11/2000 Inter-sectored Dol-differently developed areas in the mountainous DOLISA-DPI, and high communes; the alluvia and secure Government organization
area’s communes in Quang Nam Committee, BEMMAof Quang Nam
145 PPC’s Decision on stipulating DOLISA’s function, 09/1999 T.T Hue PPCrights, obligations and the working system
146 PPc’s Decision on stipulating the provincial 06/1999 T.T Hue PPChealthcare network’s function, rights, obligations and the working system
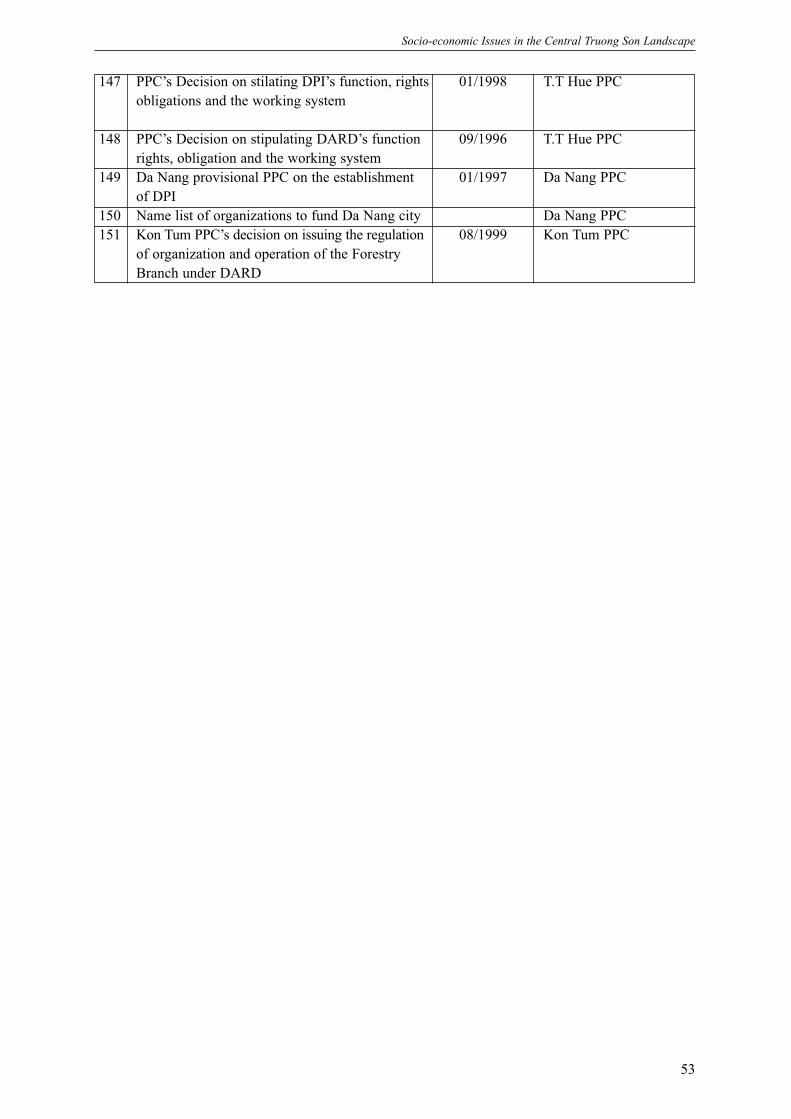
53
Socio-economic Issues in the Central Truong Son Landscape
147 PPC’s Decision on stilating DPI’s function, rights 01/1998 T.T Hue PPCobligations and the working system
148 PPC’s Decision on stipulating DARD’s function 09/1996 T.T Hue PPCrights, obligation and the working system
149 Da Nang provisional PPC on the establishment 01/1997 Da Nang PPCof DPI
150 Name list of organizations to fund Da Nang city Da Nang PPC151 Kon Tum PPC’s decision on issuing the regulation 08/1999 Kon Tum PPC
of organization and operation of the Forestry Branch under DARD
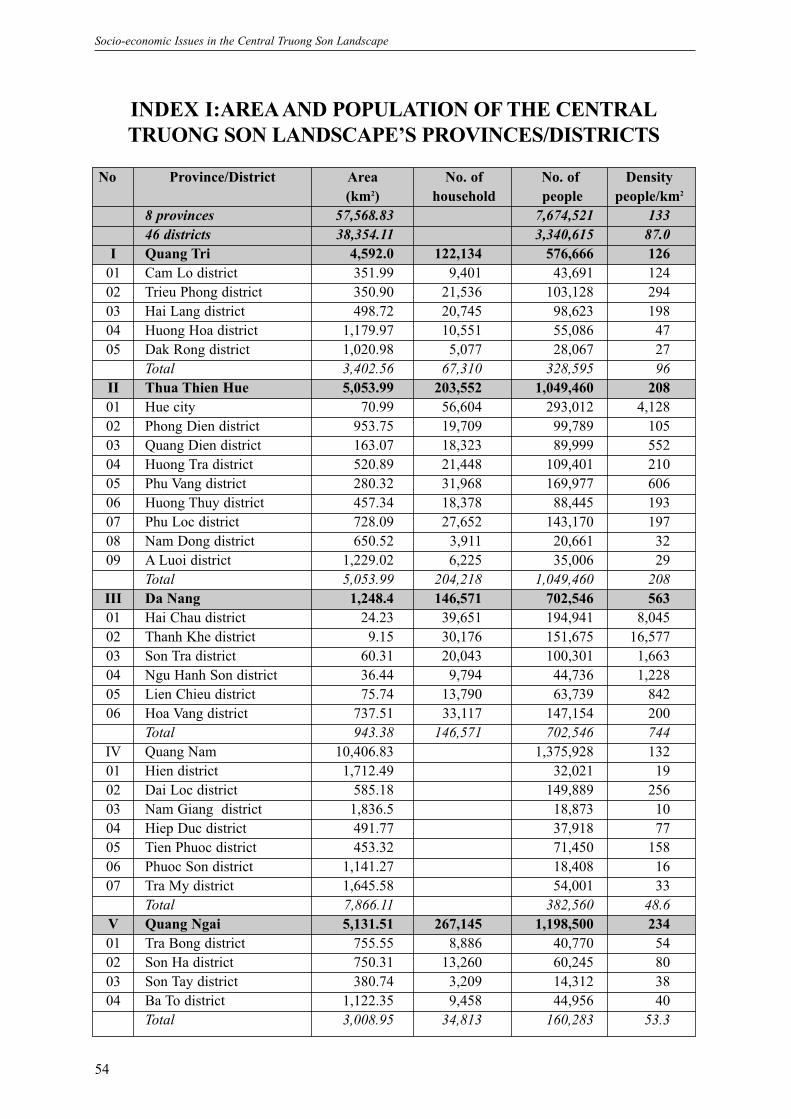
54
Socio-economic Issues in the Central Truong Son Landscape
No Province/District Area No. of No. of Density (km2) household people people/km2
8 provinces 57,568.83 7,674,521 13346 districts 38,354.11 3,340,615 87.0
I Quang Tri 4,592.0 122,134 576,666 12601 Cam Lo district 351.99 9,401 43,691 12402 Trieu Phong district 350.90 21,536 103,128 29403 Hai Lang district 498.72 20,745 98,623 19804 Huong Hoa district 1,179.97 10,551 55,086 4705 Dak Rong district 1,020.98 5,077 28,067 27
Total 3,402.56 67,310 328,595 96II Thua Thien Hue 5,053.99 203,552 1,049,460 20801 Hue city 70.99 56,604 293,012 4,12802 Phong Dien district 953.75 19,709 99,789 10503 Quang Dien district 163.07 18,323 89,999 55204 Huong Tra district 520.89 21,448 109,401 21005 Phu Vang district 280.32 31,968 169,977 60606 Huong Thuy district 457.34 18,378 88,445 19307 Phu Loc district 728.09 27,652 143,170 19708 Nam Dong district 650.52 3,911 20,661 3209 A Luoi district 1,229.02 6,225 35,006 29
Total 5,053.99 204,218 1,049,460 208III Da Nang 1,248.4 146,571 702,546 56301 Hai Chau district 24.23 39,651 194,941 8,04502 Thanh Khe district 9.15 30,176 151,675 16,57703 Son Tra district 60.31 20,043 100,301 1,66304 Ngu Hanh Son district 36.44 9,794 44,736 1,22805 Lien Chieu district 75.74 13,790 63,739 84206 Hoa Vang district 737.51 33,117 147,154 200
Total 943.38 146,571 702,546 744IV Quang Nam 10,406.83 1,375,928 13201 Hien district 1,712.49 32,021 1902 Dai Loc district 585.18 149,889 25603 Nam Giang district 1,836.5 18,873 1004 Hiep Duc district 491.77 37,918 7705 Tien Phuoc district 453.32 71,450 15806 Phuoc Son district 1,141.27 18,408 1607 Tra My district 1,645.58 54,001 33
Total 7,866.11 382,560 48.6V Quang Ngai 5,131.51 267,145 1,198,500 23401 Tra Bong district 755.55 8,886 40,770 5402 Son Ha district 750.31 13,260 60,245 8003 Son Tay district 380.74 3,209 14,312 3804 Ba To district 1,122.35 9,458 44,956 40
Total 3,008.95 34,813 160,283 53.3
INDEX I:AREAAND POPULATION OF THE CENTRALTRUONG SON LANDSCAPE’S PROVINCES/DISTRICTS
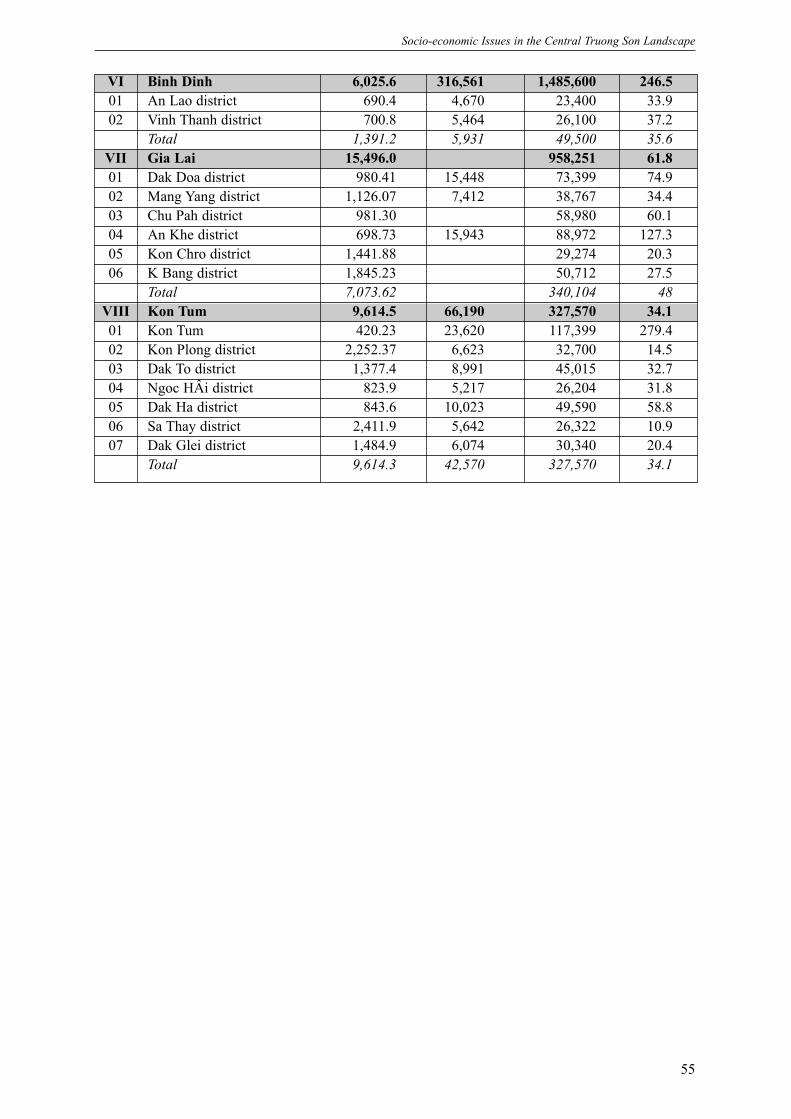
55
Socio-economic Issues in the Central Truong Son Landscape
VI Binh Dinh 6,025.6 316,561 1,485,600 246.501 An Lao district 690.4 4,670 23,400 33.902 Vinh Thanh district 700.8 5,464 26,100 37.2
Total 1,391.2 5,931 49,500 35.6VII Gia Lai 15,496.0 958,251 61.801 Dak Doa district 980.41 15,448 73,399 74.902 Mang Yang district 1,126.07 7,412 38,767 34.403 Chu Pah district 981.30 58,980 60.104 An Khe district 698.73 15,943 88,972 127.305 Kon Chro district 1,441.88 29,274 20.306 K Bang district 1,845.23 50,712 27.5
Total 7,073.62 340,104 48VIII Kon Tum 9,614.5 66,190 327,570 34.101 Kon Tum 420.23 23,620 117,399 279.402 Kon Plong district 2,252.37 6,623 32,700 14.503 Dak To district 1,377.4 8,991 45,015 32.704 Ngoc HÂi district 823.9 5,217 26,204 31.805 Dak Ha district 843.6 10,023 49,590 58.806 Sa Thay district 2,411.9 5,642 26,322 10.907 Dak Glei district 1,484.9 6,074 30,340 20.4
Total 9,614.3 42,570 327,570 34.1
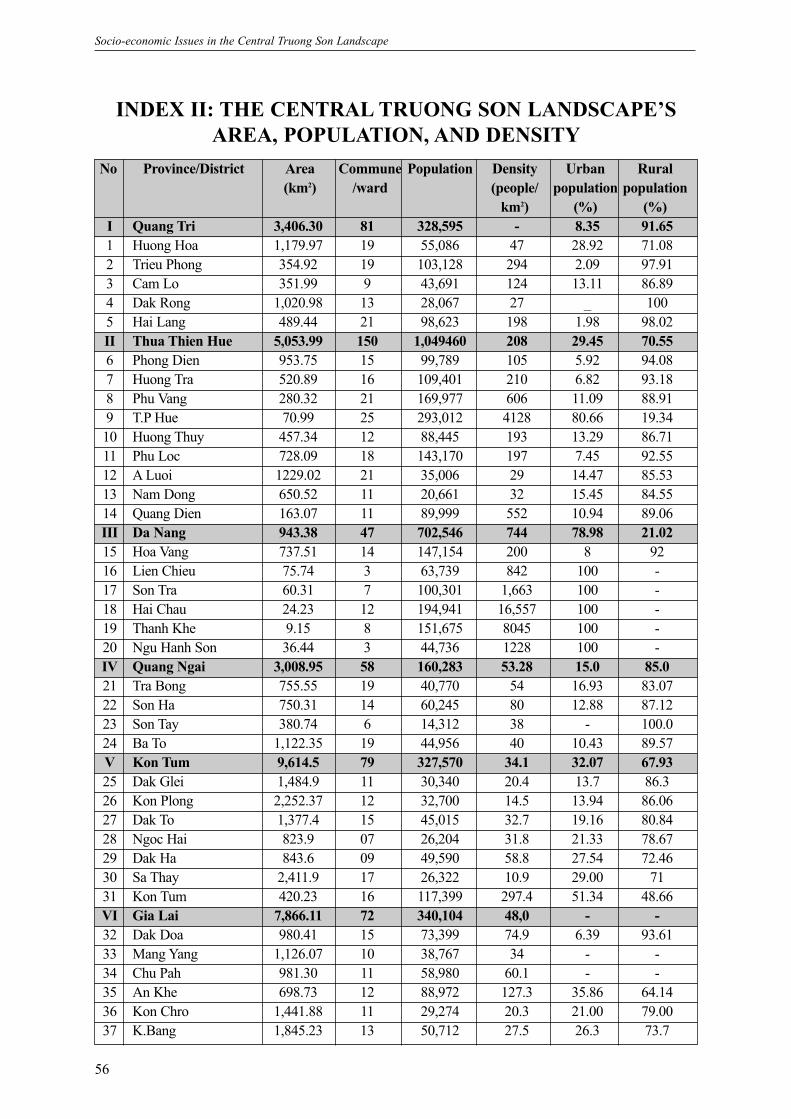
56
Socio-economic Issues in the Central Truong Son Landscape
No Province/District Area Commune Population Density Urban Rural(km2) /ward (people/ population population
km2) (%) (%)I Quang Tri 3,406.30 81 328,595 - 8.35 91.651 Huong Hoa 1,179.97 19 55,086 47 28.92 71.082 Trieu Phong 354.92 19 103,128 294 2.09 97.913 Cam Lo 351.99 9 43,691 124 13.11 86.894 Dak Rong 1,020.98 13 28,067 27 _ 1005 Hai Lang 489.44 21 98,623 198 1.98 98.02II Thua Thien Hue 5,053.99 150 1,049460 208 29.45 70.556 Phong Dien 953.75 15 99,789 105 5.92 94.087 Huong Tra 520.89 16 109,401 210 6.82 93.188 Phu Vang 280.32 21 169,977 606 11.09 88.919 T.P Hue 70.99 25 293,012 4128 80.66 19.3410 Huong Thuy 457.34 12 88,445 193 13.29 86.7111 Phu Loc 728.09 18 143,170 197 7.45 92.5512 A Luoi 1229.02 21 35,006 29 14.47 85.5313 Nam Dong 650.52 11 20,661 32 15.45 84.5514 Quang Dien 163.07 11 89,999 552 10.94 89.06III Da Nang 943.38 47 702,546 744 78.98 21.0215 Hoa Vang 737.51 14 147,154 200 8 9216 Lien Chieu 75.74 3 63,739 842 100 -17 Son Tra 60.31 7 100,301 1,663 100 -18 Hai Chau 24.23 12 194,941 16,557 100 -19 Thanh Khe 9.15 8 151,675 8045 100 -20 Ngu Hanh Son 36.44 3 44,736 1228 100 -IV Quang Ngai 3,008.95 58 160,283 53.28 15.0 85.021 Tra Bong 755.55 19 40,770 54 16.93 83.0722 Son Ha 750.31 14 60,245 80 12.88 87.1223 Son Tay 380.74 6 14,312 38 - 100.024 Ba To 1,122.35 19 44,956 40 10.43 89.57V Kon Tum 9,614.5 79 327,570 34.1 32.07 67.9325 Dak Glei 1,484.9 11 30,340 20.4 13.7 86.326 Kon Plong 2,252.37 12 32,700 14.5 13.94 86.0627 Dak To 1,377.4 15 45,015 32.7 19.16 80.8428 Ngoc Hai 823.9 07 26,204 31.8 21.33 78.6729 Dak Ha 843.6 09 49,590 58.8 27.54 72.4630 Sa Thay 2,411.9 17 26,322 10.9 29.00 7131 Kon Tum 420.23 16 117,399 297.4 51.34 48.66VI Gia Lai 7,866.11 72 340,104 48,0 - -32 Dak Doa 980.41 15 73,399 74.9 6.39 93.6133 Mang Yang 1,126.07 10 38,767 34 - -34 Chu Pah 981.30 11 58,980 60.1 - -35 An Khe 698.73 12 88,972 127.3 35.86 64.1436 Kon Chro 1,441.88 11 29,274 20.3 21.00 79.0037 K.Bang 1,845.23 13 50,712 27.5 26.3 73.7
INDEX II: THE CENTRAL TRUONG SON LANDSCAPE’SAREA, POPULATION, AND DENSITY
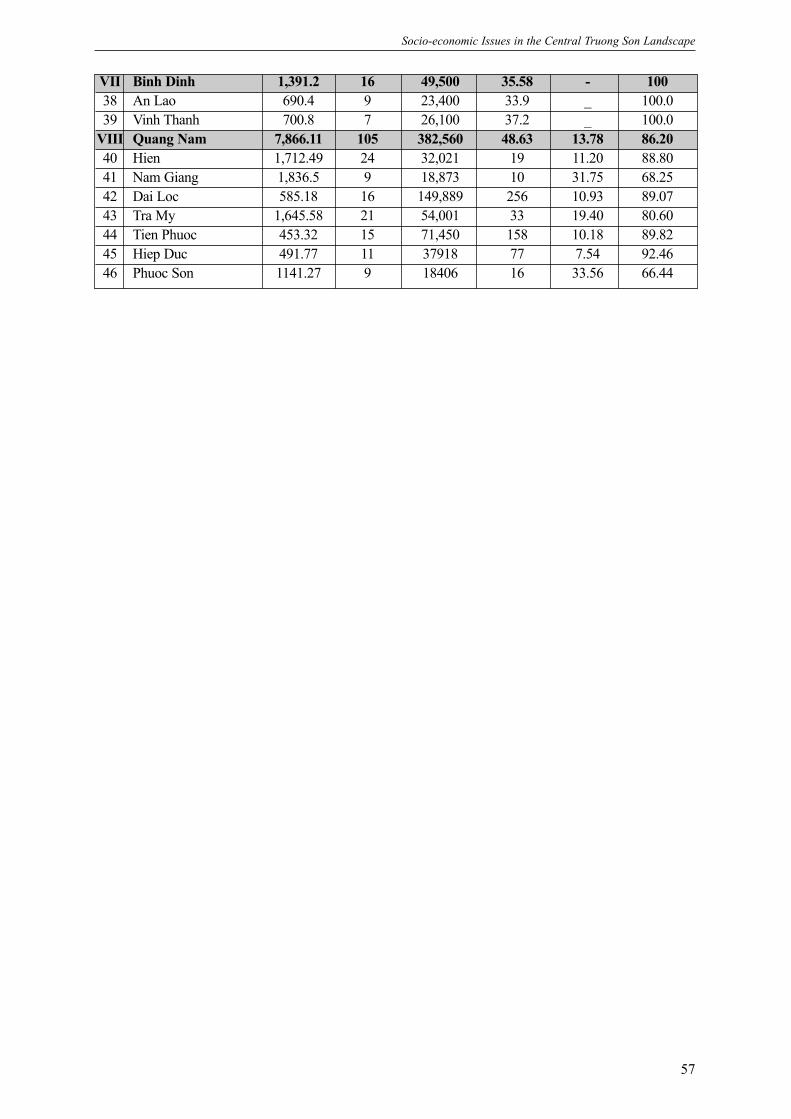
57
Socio-economic Issues in the Central Truong Son Landscape
VII Binh Dinh 1,391.2 16 49,500 35.58 - 10038 An Lao 690.4 9 23,400 33.9 _ 100.039 Vinh Thanh 700.8 7 26,100 37.2 _ 100.0
VIII Quang Nam 7,866.11 105 382,560 48.63 13.78 86.2040 Hien 1,712.49 24 32,021 19 11.20 88.8041 Nam Giang 1,836.5 9 18,873 10 31.75 68.2542 Dai Loc 585.18 16 149,889 256 10.93 89.0743 Tra My 1,645.58 21 54,001 33 19.40 80.6044 Tien Phuoc 453.32 15 71,450 158 10.18 89.8245 Hiep Duc 491.77 11 37918 77 7.54 92.4646 Phuoc Son 1141.27 9 18406 16 33.56 66.44
58
Socio-economic Issues in the Central Truong Son Landscape
59
Socio-economic Issues in the Central Truong Son Landscape
INDEX III: REPORT SERIES OFTHE CENTRAL TRUONG SON INITIATIVE
Towards a Biodiversity Vision for the Forests of the Lower Mekong Ecoregion ComplexCompiled by: Michael C. Baltzer, Nguyen Thi Dao, and Robert G. Shore
a) Main Report
This report, commonly termed "the biovision", details the biodiversity of the Forests of theLower Mekong Ecoregion Complex (FLMEC). The FLMEC is an amalgamation of fourecoregions - one of which is the Greater Truong Son. This report is responsible for thedelineation of the Greater Truong Son Ecoregion. Within the report is a description of theecoregion, its biological features of importance, and the threats faced by the ecoregion. Thereport goes further by identifying and ranking conservation priorities within the GreaterTruong Son, with the ultimate goal of ensuring the conservation of all biodiversity of theecoregion for future generations
b) Technical Annex
The Technical Annex is the second document in the "biovision" series. This report expands onthe information provided in the main report by providing more detailed information about eacharea identified as a conservation priority (termed a "priority landscape"). In addition, theTechnical Annex contains condensed versions of the scientific desk studies on the birds,mammals, vegetation and fish of the entire FLMEC.
Socio-economic Scoping Report for the Forests of the Lower Mekong Ecoregion Complex Compiled by: John Baker, Bruce McKenney and Jack Hurd
To compliment the large scale biological assessment conducted for the FLMEC, a socio-economic scoping study was also conducted.
This "situational analysis" is less detailed than the biological assessment, with the intention ofproviding only essential background information about the main threats to biodiversity and theunderlying and exacerbating socio-economic factors. In conclusion, goals andrecommendations for improving biodiversity conservation are outlined.
1. A Biological Assessment of the Central Truong Son LandscapeCompiled by: Andrew W. Tordoff, Robert J. Timmins, Robert J. Smith and Mai Ky Vinh
Biodiversity Advisory Group: Nguyen Xuan Dang (IEBR); Jack Tordoff (Birdlife International);Le Trong Trai (FIPI); Le Xuan Canh (IEBR); Nguyen Cu (IEBR/Birdlife International); NguyenTien Hiep (IEBR); Nguyen Kim Son (IEBR); Vu Van Dung (FIPI); Do Tuoc (FIPI); Pham MongGiao (FPD); Tran Quoc Bao (FPD); Pham Nhat (Xuan Mai Forestry College); Phan Ke Loc(Hanoi University); Nguyen Van Sang (IEBR); Nguyen Huu Duc (Hanoi PedagogicalUniversity); Rob Shore (WWF Indochina); Alexander Monastyrski (VRTC); AndreyKouznetzov (VRTC).
60
Socio-economic Issues in the Central Truong Son Landscape
This is the first report produced under the Central Truong Son Initiative. Covering one of theGreater Truong Son most critical priority landscapes, A Biological Assessment of the CentralTruong Son Landscape follows a similar process to the "biovision" report for the Forests of theLower Mekong Ecoregion Complex (FLMEC).
This report details the biological importance and status of the Central Truong Son prioritylandscape, and identifies threats to the region. Furthermore, the report outlines conservationpriorities for the region and develops broad targets for each of these priorities. SubsequentGeographical Information Systems (GIS) analyses aid in defining a "conservationlandscape" for the Central Truong Son Landscape.
2. Socio-economic Issues in the Central Truong Son LandscapeCompiled by: Nguyen Lam Thanh
This report provides an extensive overview of the socio-economic situation and issues foundwithin the Vietnamese portion of the Central Truong Son priority landscape.
The report contains a great deal of "benchmark data" that is essential to planning forsuccessful conservation and development efforts. This information highlights cleardifferences between provinces within the priority landscape, and to a lesser extent withinindividual provinces. Due to the diverse nature of the region, resulting from vastgeographical, climatic and cultural differences, the benchmark data is needed to tailorconservation efforts to each area.
3. An Assessment of Development Initiatives in the Central Truong Son LandscapeCompiled by: Aylette Villemain, Herbert Christ, Nguyen Thanh Hai, Tran Kim Long, BachTan Sinh and Do Duc Tho
The Central Truong Son Initiative aims to combine successful biodiversity conservationwith sustainable development. In order to achieve a balanced result, it is essential thatexisting and planned development initiatives are identified and integrated into conservationstrategies.
This report focuses on the provinces located within the Vietnamese portion of the CentralTruong Son priority landscape. Planned and existing development initiatives, such as roadconstruction and poverty alleviation projects, are detailed in the report and the potential effectson conservation are commented upon.
4. Existing Land-use Management in the Central Truong Son LandscapeCompiled by: Tran An Phong
Research Team: Tran An Phong, Dao Van Can, Ta Hoa Binh vµ Nguyen Xuan Phuong
Within Vietnam, extensive work has been carried out in designating land-use managementpractices. This report attempts to pool the often confusing and scattered information into onecohesive map of existing land-use management practices in the Central Truong SonLandscape.
61
Socio-economic Issues in the Central Truong Son Landscape
The main outputs of the study are detailed Geographical Information System (GIS) data andmaps; they may be combined with additional data for further analyses. However, a briefaccompanying report provides some explanation of land-use management within the CentralTruong Son Landscape.
5. People, Land and Resources in the Central Truong Son Landscape Compiled by: Huynh Thu Ba
Research Team: Huynh Thu Ba; Le Cong Uan; Vuong Duy Quang; Pham Ngoc Mau;Nguyen Ngoc Lung; Nguyen Quoc Dung
In addition to extensive biological and situational data, an understanding of how localcommunities utilize and interact with their environment is essential to developing effectiveand integrated conservation strategies.This report aims to develop a more detailed understanding of the current issues related topeople, land and resources - in particular Community Based Natural Resource Management(CBNRM). The study focuses on two pilot sites within the Central Truong Son Landscape,where extensive fieldwork was conducted. Detailed comparisons both within and betweenthe sites are made and key recomendations are listed.
6. Tourism Potential of the Central Truong Son LandscapeCompiled by: Hoang Phuong Thao
Tourism within the region is a rapidly expanding sector. If developed properly, this couldprovide significant financial benefits to the inhabitants of the Greater Truong Son.
This report investigates existing tourist attractions and facilities with a view towards theirpotential enhancement. The study also examines the potential of developing additionaltourism infrastructure, investigating the full range of possibilites (including ecotourism), asall tourism has the potential to either benefit or harm conservation in a direct or indirectmanner.
7. Hunting and Collecting Practices in the Central Truong Son Landscape Compiled by: Le Trong Trai, Dang Thang Long, Phan Thanh Ha and Le Ngoc Tuan
Phong Dien Nature Reserve (Thua Thien Hue Province) is a critical part of the CentralTruong Son Landscape as it protects one of the last remnants of lowland forest and is hometo important species such as Saola and Edward's pheasant.
This study builds on existing data collected from Phong Dien, and expands the scope toinclude seven villages. The study investigated which natural resources are used in the area,where they are collected from and their value in financial and cultural terms. The analyzedinformation points out a local dependence on natural resources.
WWF embarked on Ecoregion-Based Conservation in 1998 in response to concernsabout the increasing pace of biodiversity loss and the need to increase the scale andintegration of global conservation efforts. Thinking and acting across large scales (suchas ecosystems, bioregions, or - in WWF's case - ecoregions) can better address both theneed to conserve viable species populations and ecosystem processes, and the need tointegrate conservation and human development.
Ecoregion conservation begins with the "Global 200" ecoregions - 238 large,biologically-defined regions identified as representing the highest priorities forconservation across all the Earth's major habitat types. The Forests of the Lower Mekongis a complex of four diverse and threatened ecoregions, three of which are listed asGlobal 200 ecoregions. Established in 1999, the Ecoregion Action Program (EAP) in theForests of the Lower Mekong is currently working to conserve the beautiful andendangered biodiversity of two of these ecoregions - the Greater Truong Son and theCentral Indochina Dry Forests.
The Greater Truong Son ecoregion comprises some of the world's most unique andthreatened wildlife - from it's charismatic endemic species such as the stunning Douclangur and the remarkable saola, to some of the world's most endangered and evocativespecies like the Asian elephant, tiger and Javan rhinoceros. The future of these, and manyother species is dependant on successful, long-term conservation of the ecoregion as awhole that must be undertaken immediately, before they are lost forever. EAP in theGreater Truong Son aims to conserve this ecoregion through:
� Mobilising conservation throughout the entire Greater Truong Son ecoregion� Protecting key sites and species through integrated conservation and development
activities in priority landscapes� Promoting a supportive policy environment for conservation and sustainable
development� Laying the foundations for lasting conservation
The Central Truong Son Initiative is a pilot initiative being developed by WWF'sGreater Truong Son EAP in cooperation with the Governments of Vietnam and LaoP.D.R.. The aim of this fledgling initiative is to create partnership of a broad range ofstakeholders - from local communities to government institutions and internationalorganisations - working together to secure biodiversity conservation and sustainabledevelopment in the Central Truong Son Landscape.
This publication was made possible through support provided by the Officeof Environment, Bureau for Economic Growth, Agriculture, and Trade,
U.S. Agency for International Development.
WWF is one of the world's largest and most experienced conservationorganizations, with almost five million supporters and a global network active inmore than 90 countries.
WWF's mission is to stop the degradation of the planet's natural environment andto build a future in which humans can live in harmony with nature, by:
� Conserving the world's biological diversity� Ensuring that the use of renewable natural resources is sustainable� Promoting the reduction of pollution and wasteful consumption
WWF produced the Central Truong Son Initiative Report Series with the cooperation and support of the FPD and USAID.
Vietnam's Forest Protection Department (FPD) is a government partner in theCentral Truong Son Initiative.
The FPD, located under the Ministry of Agriculture and Rural Development(MARD), is responsible for providing technical advice and guidance in regard toSpecial Use Forests, and for wildlife management and law enforcement.
The United States Agency for International Development (USAID), inconjunction with WWF-US, has generously provided funds towards the CentralTruong Son Initiative.
USAID, an independent federal government agency, is the principal U.S. agencyto extend assistance to countries recovering from disaster, trying to escape poverty,and engaging in democratic reforms.
Copyright © 2022 FDOKUMEN