Socio-cultural, Religious, and Political Aspects - Pakistan ...
Upload
khangminh22Category
view
2download
0
i
SOCIO-ECOLOGICAL IMPACT OFAGROFORESTRY
IN PUNJAB
Thesis submittedfor the Fulfillment of theDegree of Doctorate in Botany
BY
SYED MUHAMMAD AKMAL RAHIM
(M.Sc. BOTANY PUNJAB, M.Sc. FORESTRY PF1 PESHAWAR)
DEPARTMENT OF BOTANY
UNIVERSITY OF THE PUNJAB LAHORE
PAKISTAN
NOVEMBER, 2010

ii
DEDICATED TO
MY PARENTS WHO HAVE SPENT THEIR ENTIRE
PRECIOUS LIVES STRUGGLING TO PROVIDE ME
WITH A BRIGHT, SUCCESSFUL
AND LITERATE FUTURE

iii
PAGECONTENTS
NO
viiiAcknowledgments
Summary....................................... .......... *
List of Tables .
List ofFigurcs
List of Abbreviations .I Chapter I - Introduction —............ ....
1,1 Introduction
12 Forest Types
1.3 Supply and Demand of Wood ..1.4 Agrofbrestiy
1.5 Defin i tions and Practices
1.6 Rationale for Agroforestry/Fanriland Planting
1.7 Aspects of Agroforestry
1.7.1 Ecological aspects
1.72 Economic Aspects
1.7.3 Social Aspects
t.7.4 Institutional Aspect
1.8 Agroforcstiy and the Fanner
1.9 Agroforcstiy in Punjab
1.9.1 USAID Social Forestry Program
1.9.2 Punjab Forest Sector Development Project (PFSDP),. 19
1.9,2.1 Phasing Out of Punjab Forest Department
(PFD) Nurseries
1.9.3 Case Studies in Agroforcstry
1.9,3.1 Planing Canrpaings in the Thai Desert,. ,
1.9,3.2 Tamarix aphylla (Farash) Windbreaks...
1.9.3.3 Poplars in Peshawar Valley
1 .9,3.4 Poplare and Turmeric in Changa Manga
x
viii
xix
xxii
I
1
3
3
8
8
12
14
14
14
15
15
15
17
18
19
20
20
20
20
20

iv
Plantation
1.9.3J Eucalyptus Shelter Belts in Sindh.
1.9.3.6 Hurries in Sindh
1.10 Effect of Trees on Agricultural Crops
II Chapter II- Material Method
2.1 Material .2.2 Methods
2.2.1 Soil sampling
2.2.2 Soil Analysis
2.2.3 pH Determination
2.2.4 Electrical Conductivity (EC)
2.2.5 Carbonate
2.2.6 Bi-Carbonate (HCO3)
22.1 Calcium and Magnesium
2.2.8 Chloride
2.2.9 Organic Matter
22.10 Calcium carbonate
2.2.11 Nitrogen .2.2.12 Sodium
Potassium...
21.14 Sulphate
2.2.15 Phosphorus
2.2.16 Textural analysis
23 Survey of Farm Plantations
2.4 Soil Suitability Classification .. ..25 Phyto-sociological Analysis
20
22
22
27
27
32
32
32
32
33
33
33
34
34
34
35
35
35
2.2.13 36
37
37
38
40
42
44
2.6 Data compilation, processing and statistical analysis.
Ill Chapter III- Survey of Farm Plantations
3.1 Criteria for Division into Agroecological zone
3.1.1 Zone I- Indus della
46
48
48
50

V
503.1.2 Zone II- Southern Irrigated plains
3.1.3 Zone III: (a & b) - Sandy Desert
3.1.4 Zone IV (a & b)- Northern irrigated plains
3.1.5 Zone V- Banin i (Rain fed) Lands
3.1.6 Zone VI - Wet Mountains
3.1.7 Zone VII-Northern Dry Mountains
3.1,8 Zone VIII- Western dry Mountains
3.1,9 Zone EX-Dry Western Plateau
3.1.10 Zone X-Suleiman Piedmont
3.2 Agro Ecological Zones of the Punjab
32.1 Agro ecological Zone III-A -Sandy Deserts
32.2 Agro ecological Zone UI-B-Sandy Deserts
Agio ecological Zone IV-A - Northern Irrigated
Plains .
50
51
51
51
51
52
52
52
53
53
54
56
583.3 Study Area
3.3,1 Location and extent
3,3.2 Population
3.3.3 Topography....
33.4 Soil
33.5 Climate .33.6 Land its use
3.4 Data collection and analysis
3.5 Questionnaire Preparation/ Methodology.
3,6 ResullsandEvaluations
59
59
59
59
61
61
63
63
64
3.6.1 Trend of raising of trees on farm lands. 64
3.6.2 64Land tenure and its effects on Agroforestry practices.
3.6.3 Land hotding 65
3.6.4 Choice of Species
3.6.5 Choice of Agroforestry design
3.6.6 Pattern/ Spacing
3.6.7 Preference of the agriculture crops.
66
66
67
68

vi
3.7 Discussion
Chapter [V - Ecological effects of Agroforestry on soil
4.1 Agro ecological Zone HI. B Sandy Deserts
4.2 Agio ecological Zone ILL A Sandy Deserts
4.3 Agro ecological Zone IV.A Northern Irrigated Plains.. ,
4.4 Zone V- Barani (Rain fed) Lands
4.5 Soil Texture . .4.6 Organic Matter
4.7 Nitrogen and Phosphorus
4.8 pH, EC and CEC
4.9 Carbonates. Bicarbonate, Chloride and Sulfates
4.10 Calcium plus Magnesium, Sodium and Potassium
4,11 Discussion . ,
V Chapter V Phytosociological Analysis
5-1 Introduction
5*2 Association 1 Suaedetum fiuticosae
5*3 Association 2 Association Kochietum indicum
5*4 Association 3 Association Diplachnetum fuscae
J.5 Association 4 Desmostachyctum bipinnatae
5,6 Association 5 Alhagietum maurorac
5,7 Association 6 Sporoboletum arabicae
5.8 Association 7 Polypogaetum monspeliensae
5.9 Association 8 Erythraeo-polypogaetum-monspeliensae
5.10 Association 9 Vetcviarietum zyzanioides
5.11 Association 10 Imperatetum cylindrieae
5.12 Association II Scirpetum marilimae
5 j3 Association 12 Typhetum anguslitac
68
71
73
73
73
73
73
76
78
81
83
86
91
95
95
99
103
105
108
111
114
117
120
123
126
129
132
1405.14 Discussion and classification,
1435.15 Classification.

vii
146VI Chapter VI SOILS and Land Suitability Classification...
6.1 How to use the soil information
62 Soil mapping units.......6.3 Land suitability for forest trees
6.4 Rawalpindi Tehsil .....6.5 Chakwal Tehsil
6.6 Feteh Jang Tehsil .6.7 Rahim Yar Khan Tehsil
6.8 Bahawalpur Tehsil .6.9 Bahawal Nigar Tehsil .6.10 Muzaflargarh Tehsil
6.11 Dera Ghazi Khan Tehsil * ....6.12 Khushab Tehsil .6.13 Mianwali Tehsil ....... .6.14 Okara Tehsil...
6.15 Sahiwal Tehsil .6.16 Chichawami Tehsil
6.17 Multan Tehsil. .
6.18 Khanewal Tehsil .6.19 Vehari Tehsil
6.20 Pakpattan Tehsil . * ......6.21 Discussion .
VII Chapter 7 Discussion, Conclusions and Recommendations
VU1 References * ...IX Appendix
X Paper Published .
147
147
148
150
154
158
162
166
170
174
178
182
186
190
194
198
203
206
210
214
218
221
240
264
267

viii
ACKNOWLEDGEMENTS
It is a pleasure to thank those who have been very helpful to me during all the phases
of completing my PhD thesis. To begin with I would like to express my thanks and
gratitude to my Research Supervisor Dr Shahida llasnain , Professor, Department of
Microbiology and Molecular Genetics and Dean of Live Sciences, University of the
Punjab, Lahore, for her inspiring guidance and encouragement. She provided
refreshing insight and critical questions to be answered in the thesis. Moreover, her
keen interest and painstaking efforts during lire course of research work and drawing
right conclusions thereof are specially acknowledged.
1 must also express my heartfelt gratitude and sincere thanks to my mentor, Mr.
Mahmood Iqbal Sheikh, former Director General Pakistan Forest Institute and Ex-
Chief Conservator of Forest, Government of the Punjab Province. He not only
motivated me to join PhD program but also helped in the selection of my Doctoral
Topic and outlines there. 1 am equally grateful to my honorable senior teacher
Professor Dr. Razi Abbas Shamsi, ex-Chairman, Botany Department, University of the
Punjab who guided and helped me in the preparation of the synopsis of my thesis,
leading to its approval from the Board of higher studies. I also must thank my teacher,
Professor Dr. Rashid Mirza, Ex- Chairman, Botany Department, Govt. College
University, Lahore for his valuable advice during my field visits along with him,
regarding Phytosociological study of Farm Plantations.
Also my heartfelt thanks go to Professor Dr. Khan Rass Masood, Chairman.
Department of Botany, University of the Punjab for helping and facilitating me in the
timely submission of this thesis.
For the research involved for writing this thesis, collecting data was invariably a trying
experience. 1 collected a lot of data and soil samples. Many people helped with this for
which I would like to thank them whole hcortcdly, and also to hundreds of people who
filled out questionnaires forme.
I cannot forget the valuable help of former Chief Conservators of Forest, late
Sahibzada Muhammad Hafeez, Malik Mohammed Khan, Choudary Riaz-ul-Hassan,
Dr. Afzal and Sheik Abdul Qayum (World Bank consultant) for their motivation,
ix
persuasion and valuable suggestions which also enabled me to proceed and submit my
thesis in time.
1 express my heartfelt gratitude to my well-wishers friends Dr. Humcra Afrasiab,
Assistant Professor and Mrs, Secmal Vehra Ejaz, Assistant Professor Post- Graduate
GCW, Samanabad, Lahore, for helping me in proof reading of the draft thesis. I am
also thankful to other friends and colleagues Asma Zulifqar, Miss Ambrcen, Awais
Mufti of Botany Department, Dr. Farkhanda Manzoor Assistant Professor LCWU,
Sadia Shoieb, Research Assistant LCWU and Ch. Muhammad Iqbal Sub Divisional
Forest Officer Chachawatni for their precious help, generous advices and proper
guidance throughout the duration of my Research work. I also cannot forget the help
of the Director, Soil Survey of Pakistan (Mr. Akram) for allowing me to use his well
equipped Laboratory for soil analysis collected from various Farm Plantations and
preparation of GJS maps. For this l am also thankful to scientific officers /staff for
helping me particularly M/S. Rafiquc, Shahid and Zafar GondaL
1 am grateful to my parents for their financial and moral support and providing me the
opportunity to enrich my academic career. Their prayers and love encouraged and
helped me at every step of my life. Thanks are also due to my twin brother
Muhammad Ajmal Rahim. Conservator of the Forest who accompanied and helped me
throughout my field works. I also thank my sister Dr Shazia Awais, MD in USA for
her moral support and encouragement. Last but not least, my dedicated wife
Farkhanda Jabeen, Assistant Professor Department of the Botany, University of the
Punjab for her cooperation, help, suggestions and moral support throughout my study.
1 cannot forget the cooperation of my kids, Zoha Rahim (2nd year medical student) and
Syed M. Arsal Rahim who is a BBA student along with the prayers of my nieces Areej
Awais and Nashmia Rahim. It is hoped that this thesis provides a good review of
"Socioecological Impact of Agro-Forestry in the Punjab"
Syed Muhammad Akmat Rahim

SUMMARY
Against a world average of 25% area under forests, Pakistan has around 5% and
Punjab has only 2% area under manageable and productive forests. The present
deteriorating condition of the forests in Punjab has bleak prospects of
improvement and expansion in near future due to ever increasing demand for
agriculture produce. Moreover, to add to (he constraints, neither can additional
water be spared to undertake forestry operations, nor enough funds are available
even if new areas are earmarked for planting trees. Consequently the Province
of Punjab has to rely on imported wood and wood products to the tune of 8
billion rupees, due to exponential increase in population and increasing demand
for wood and paper.
In view of the present situation the best possible solution seems to be offered by
Farm forcstry/Agrotorestry that models planting trees and agricultural crops
together, which unfortunately, has not been utilized to its full potential. Around
67% of the land of Punjab is under Batani irrigated agriculture and if
agmforestry is properly practiced, the trees raised by the farmers will not only
contribute, however little, to improve forest cover, but will also serve as a
cushion against emergencies will serve as an additional income for the fanner.
The Punjab Forest department has made special strides towards introducing
farm forestry to farmers over the past 30 years by extending awareness and
training programs to farm foresters and promoting donor supported projects.
The present study is an assay of the shift from state to social forestry and
generation of direct and indirect benefits from this shift.
For the purpose of this study the province of Punjab was divided into four
agroeclogical zones, namely, Agroeclogical zone III- A (Sandy Desert),
Agroeclogical zone III- B (Sandy Desert), Agroeclogical zone IV- A (Northern
Irrigated Plains), Agroeclogical zone V- (Barani). A questionnaire-based survey
was carried out in 257 farm plantations from the four zones, keeping in view the

xi
zonal physiography, ecology, climate, soil, agricultural crops, water availability
and ground water viz-a- viz the choice of species. The survey results gave fairly
representative indicators revealing that the trend of planting trees increased
during 1995 to 2000 and has decreased thereafter. This trend was acquired and
preferred by agrofanners possessing small holdings, who admitted it to be a
source of additional income. The choice of species by 87% of the agrofarmers
was Eucalyptus, in spite of the fact that the environmentalist lobby discourages
its plantation. The most preferred plantation design was the Linear Model and
the 44% of the agrofarmers opted for 5x5 ft spacing. After concluding from the
results of the survey, that agroforestry is beneficial to the fanner both socially
and economically, and that the potential has not been utilized fully, suggestions
to further promote agroforestry/social forestry have been made. In this context
some tree species like Shisham, Albizzia, Jantcr (Sesbanea acgyptiaca) and Iple
Iple that are nitrogen fixing and improve die soil fertility have been
recommended to be grown on the agricultural lands.
The importance of soil texture in ogroforestry necessitates a comparison to be
made of the soils from various farm plantations in order to ascertain whether the
soils of various farm plantations were tcxlumlly similar or not. Thus an analysis
of 400 soil samples for the soil texture was carried out in the target zones and
the information thereby revealed, was utilized to develop Soil and Land
Suitability maps.
A pilot study for the evaluation of structure, composition and classification of
the community types of the saline areas of Ferozewala (District Sheikhupura)
was carried out using a standard terminology comparable with the
phytosociological work carried out in the European and Anglo-American
countries. A special advantage of this investigation is to obtain environmental
data which provides insight into the important factors operative in the habitat
e.g. soil pH, level of salinity, moisture level, grazing and extent of vegetation

xii
cover. The data thus obtained can be used to extract maximum potential of the
salt affected soils arc generally poorer in species than non-saline soils.
Finally, maps lor the agro farmers on the basis of land suitability classification
were prepared to guide the land users/planners in such a way so as to put the
land resources to the most beneficial use on sustained basis without
deteriorating the resources as well as the environment. This study represents a
pilot study with regards to the development of Soil and Land Suitability maps,
as the work was restricted to 17 Districts of the Punjab. The undoubted utility of
such maps based on the valuable land resource information being generated,
makes it imperative that the same may be extended to the rest of the districts of
Punjab as die next step and later for other provinces too, for it not only assists
the agrofarmers but also alleviates of poverty, consequently enhancing the gross
economy at the national level.

xiii
LIST OF TABLES
SR. NO DESCRIPTION’ PACE NO
Tabic No 1.1 Pakistan Forest areas by types
Supply and Demand Gap of wood at National
Level, 2002-03
Total supply of timber and fuel wood in
Pakistan for the year 2002-03
Projected Consumption of wood -National
Phasing out of Punjab Forest Department
Nurseries
Average Diameter (cm) and Height (m) of the
Trees
Yield of Wheat (Tons per ha) under the
Influence of Eucalyptus camaldulcnsis
Yield of Cotton (tons/ha) under the Influence
of Eucalyptus camaldulensis
Effect of Shisham Trees on Crop Yields in the
Districts of Peshawar and Charsadda
Effect of Poplar Trees on Crop Yields in the
Districts of Peshawar and Charsadda
Effect of Tree Lines (mainly poplar) Planted at
different Spacing on Maize and Fodder
Buffer solutions for pH
Table No 22 Standard solution of Sodium 1000 ppm
Table No 23 Standard solution of Potassium Chloride
Table No 2.4 Standard solution of Potassium Chloride
Table No 2.5 Standard Phosphate solution
Table No 2.6 Phenolphthalein indicators l %
Table No2.7 Methyl Orange 1%
Table No.2.8 NHiCl -NH4OH buffer solution
4
Table Nol.2 4
Table Nol.3 7
Table No1.4 7
Tabic Nol.5 21
Table Nol.6 21
24Table Nol.7
25Table Nol.8
26Table Nol.9
26Table NoUO
26Table Nol.ll
27Table No 2.1
27
27
27
27
28
28
28

xiv
Table No.2.9 Eriochrome Black- T (EBT) Indicators
Table No.2.10 EDTA (Versinate) solution
Table No.2.11 Silver Nitrate solution
Table No.2.12 IN Potassium Dichromate solution
Preparation of Di-phenyl Amines Sulphonate
Indicator
Table No.2.14 Ferrous Ammonium Sulphates solution
Tabic No.2.15 Sodium Hydroxide 4N
Table No.2.16 Digestion Mixtures
TableNo.2.17 Boric Acid 2%
Table No.2.18 Olsen (Sodium Bicarbonate 05 M pH 8.5)
Table No.2.19 Sulturic Acid 4M
Tabic No.2.20 Ammonium Molybodatc4% solutions
Table No.2.21 Phosphorus Antimony Tartrate solution
Table No.222 Ascorbic Acid solutions
Table No.2.23 Extracting Reagents
Table No.2.24 Calgon solution
Table No.2.25 Sulfuric Acid 0.1M
Tabic No.2.26 Ammonium Populate Indicators
Table No.2.27 Mixed Indicator
Table No.2.28 Phosphate stock solutions 100 ppm
Table No.229 Mixed Regents
Tabic No.230 Anunonium Sulfate
Table No.2.31 Survey Farm Plantations in various districts
Table No.232 Domin-krajina scale for %age cover
Land use pattern of Punjab
Table No.3.2 Trend of raising of farm plantations in Punjab
Result of survey for Land Tenure
Table No3.4 Size of Land Holdings
Table No.3.5 Choices of the Species by Agrofarmers
Tabic No.3.6 Choice of AgroforestTy Designs
28
28
28
28
29Table No.2.13
29
29
29
29
29
30
30
30
30
30
30
31
31
31
31
31
31
41
45
62Tabic No.3.1
64
65Table No.3.3
66
66
67

XV
Choice of Spacing by the agro farmers
Choice of Agroforestiy Designs
The Vegetation Distribution in Association
Suaedetum Fruticosae
Soil Characteristic of Association Suaedetum
Fruticosae
The Vegetation distribution in Association
Kochieturn Indicum
Soil characteristic of association Kochietum
indicum
The Vegetation Distribution in Association
Diplachnetum Fuscae
Soil characteristic of Association
diplachnetum fuscae
The vegetation distribution in Association
DcsmosLochyetum bipinnatae
Soil Characteristic of Association
Desmostochyetum Bipinnatae
The Vegetation Distribution in Association
Alhagietum Maurarac
Soil characteristic of Association Alhagietum
maurarae
The vegetation distribution in Association
Spoxobolclum arabicae
Soil Characteristic of Sporoboletum Arabicae
The Vegetation distribution in Association
Polypogaelum monspeliensae
Soil Characteristic of Polypogaetum
monspeliensae
The Vegciation Distribution in Association
Eryth raeo-Polypogaetum-monspeIiensae
67Table No.3.7
Table No.3.8 6K
100Table No,5.1
101Tabic No.52
103Table No.5.3
104Table No.5.4
106Table No.5.5
107Table No.5.6
109Table No.5.7
110Table No.5.8
112Table No.5.9
113Table No.5.10
115Table No.5.11
116Tabic No.5.12
118Table No.5.13
119Table No.5.14
Tabic No.5.15 121

xvi
Soil Characteristic of Association Erythraeo-
Polypogaetum-monspcliensae
The vegetation distribution in Association
Veteviarietum zyzanioidcs
Soil Characteristic of Association
Vclevierietum zyzaniodcs
The vegetation distribution in association
Imperatetum cylindrieac
Soil characteristic of Association imperatetum
cylindrieae
The vegetation distribution in Association
Scirpetum maritimac
Soil characteristic of Association Sciipctum
maritimae
The vegetation distribution in Association
Typhetum angustitae
Soil characteristic of Association Typhetum
angustitae
Integrated Associations
Soil characteristic of each Association
Land Suitability Mapping Units -Rawalpindi
Tchsil: Component Soils, Land Suitability for
Forest trees and specific management
requirements
Land Suitability Mapping Units -Chakwal
Tchsil: Component Soils, Land Suitability for
Forest trees and specific management
requirements
Land Suitability Mapping Units -Fetch Jang
Tchsil: Component Soils, Land Suitability for
Forest trees and specific management
Table No.5.16 122
Table No.5.17 124
Table No.5.18 125
127Table No.5.19
Table No.5.20 128
130Table No.5,21
1301Table No.5.22
1323Table No.5.23
134Table No.5.24
135Table No,5.25
13STable No.5.26
152Table No.6.1
156Table No.6.2
160Table No.6,3

xvii
requirements
Land Suitability Mapping Units - Rahim Yar
Khan Tehsit: Component Soils, Land
Suitability for Forest trees and specific
management requirements
Land Suitability Mapping Units - Bahawalpur
Tchsil: Component Soils, Land Suitability for
Forest trees and specific management
requirements
Land Suitability Mapping Units-Bahawalnagar Tchsil: Component Soils, Land
Suitability for Forest trees and specific
management requirements
Land Suitability Mapping Units -
Muzaflfargarh Tehsil: Component Soils, Land
Suitability for Forest trees and specific
management requirements
Land Suitability Mapping Units - Dera Gazi
KJhanTehsil:Component Soils, Land
Suitability for Forest Trees and Specific
Management Requirements
Land Suitability Mapping Units Khushab
Tehsil: Component Soils, Land Suitability for
Forest trees and specific management
requirements
Land Suitability Mapping Units Mianwali
Tehsil: Component Soils, Land Suitability for
Forest trees and specific management
requirements
Land Suitability Mapping Units Okara Tehsil:
Component Soils, Land Suitability for Forest
Table No.6.4 164
Table No.6.5 168
Tabic No.6.6 172
176Table No.6.7
180Table No.6.8
184Table No.6.9
188Table No.6.10
192Table No.6.11

xviii
trees and specific management requirements
Land Suitability Mapping Units SahiwaL
Tchsil: Component Soils, Land Suitability for
Forest trees and specific management
requirements
Land Suitability Mapping Units Chichawatni
Tehsil: Component Soils, Land Suitability for
Forest trees and specific management
requirements
Lund Suitability Mapping Units Multan
Tehsil: Component Soils, Land Suitability for
Forest trees and specific management
requirements
Land Suitability Mapping Units Khanewal
Tehsil: Component Soils, Land Suitability for
Forest trees and specific management
requirements
Land Suitability Mapping Units Vchari Tehsil:
Component Soils, Land Suitability for Forest
trees and specific management requirements
Land Suitability Mapping Units Pakpattan
Tehsil: Component Soils, Land Suitability for
Forest trees and specific management
requirements
196Tabic No.6,12
200Table No,6.13
Table No.6.14 204
208Table No.6.!5
212Table No.6.16
216Tabic No.6.17

xix
LIST OF FIGURES
Sr. No Description Page NoFig.2.1 Soil classification triangle based on the ISSS
Fig. 3.1 Agroeclogical Zones of Pakistan
Fig3.2 Map showing the Study Area
Fig.4.1 Compositions of sand, sill and clay in the soil of different
zones taken from the depth of0-60cm in different
Agroeclogical Zones
Fig.4.2 Trend showing depth wise distribution of silt, clay and sand
in different Agroeclogical Zones
Fig.43 Organic Matter content of soils from different zones taken
at various depths
Fig.4.4 Effect of depth (cm) on Organic MatteffOM) in different
Agroeclogical Zones
Fig.43 Zone wise variation in nitrogen and phosphorus in different
Agroeclogical Zones
Fig,4.6 Effect of depth (cm) on Nitrogen and Phosphorus in
different Agroeclogical Zones
Fig.4.7 Effect of depth (cm) on CEC, pH and EC in different
Agroeclogical Zones
Kig.4.8 Zone wise variation in Carbonates, Bicarbonates, Chloride
and Sulphates
Fig.4.9 Effect of depth (cm) on Carbonates and Bicarbonates in the
soil of different Agroeclogical Zones,
Fig.4.10 Effect of depth (cm) on Carbonates, Bicarbonates, Chloride
and Sulphates in the soil of different Agroeclogical zones,
Fig.4.11 Effect of depth (cm) on Ca+Mg in the soil of different
Agroeclogical Zones.
Fig.4,12 Effect of depth (cm) on Potassium (K) in the soil of
39
49
60
75
75
77
77
79
80
82
84
84
85
89
89

XX
different Agroeclogical Zones.
Flg.4.13 Effect of depth (cm) on Sodium (Na) in the soil of
different Agroeclogical Zones.
Fig.4.I4 Effect of depth (cm) on SAR in ihe soil of different
Agroeclogical Zones.
Fig.5.14 Various ranges of Salts in different associations
Fig.6.1 Land suitability classification Map for choice of tree
species in Tehsil Rawalpindi District Rawalpindi
Fig.6.2 Land suitability classification Map for choice of tree
species in Tehsil Chakwal District Chakwal.
Fig,6.3 Land suitability classification Map for choice of tree
species in Tehsil Feteh Jhang District Attock
Ftg.6.4 Land suitability classification Map for choice of tree
species in Tehsil Rahim Yar Khan Rahim YarKhan
Fig.6.5 Land suitability classification Map for choice of tree
species in Tehsil Bahawalpur district Bahuwalpur Khan
Rahim
Fig.6.6 Land suitability classification Map for choice of tree
species in Tehsil Bahawalnagar district Bahawalnagar
Fig.6.7 Land suitability classification Map for choice of tree
species in Tehsil Muzaffargarh district Muzaffargarh
Fiy.6.8 Land suitability classification Map for choice of tree
species in Tehsil Dcra Gazi Khan district Dera Gazi Khan
Fig.6,9 Land suitability classification Map for choice of tree
species in Khushab district Khushab
Fig.6.10 Land suitabil i ty dassificat ion Map for choice of tree
species in Mianwali district Mianwali
Kig.6.11 Land suitabil tty classification Map for choice of tree
species in Okara district Okara
Flg.6.12 Land suitability classification Map for choice of tree
species in Sahiwal district Sahiwal
90
90
139
151
155
159
163
167
171
175
179
183
187
191
195

xxi
Fig.6.13 Land suitability classification Map for choice of free
species in Chichawatni district Chichawatni
Fig.6.14 Land suitability classification Map for choice of tree
species in MuIran district Multan
Fig.6.15 Land suitability classification Map for choice of tree
species in KhanewaJ district Khanewal
Fig.6.16 Land suitability classification Map for choice of tree
species in Vehari district Vchari
F.6,I7 Land suitability classification Map for choice of tree
species in Pakpattan district Pakpattan
199
203
207
211
215

xxii
LIST OF ABBREVIATION
ABBREVIATIONS DESCRIPTIONS
ANC Acid Neutralizing Capacity
Cation Exchange Capacity
Gazi Khan
Electrical Conductivity
Exchange able Sodium Percentage
Food Agriculture Organization
Ferrous Ammonium Sulfate
Farm Plantations
Forestry Sector Master Plan
Geographic Information System
Government of Pakistan
Khyber Pakhlunkhwa
Kruskal Wallis
Moisture Correction factor
Northern Areas
Northern Western Frontier Province
Northern Frontier Province
Organic Matter
Punjab Economic Research Institute
Punjab Forest Department
Pakistan Forest Institute Peshawar
Punjab Forestry Research Institute
Punjab Forest Sector Development Project
Statistical Package for Social Scientist
United Slate of America Aid
CEC
DGK
EC
ESP
FAO
FAS
FM
FSMP
GIS
GOP
KP
KW
MCF
NA
NWFP
NWFP
OM
PERI
PFD
PFI
PFRI
PFSDP
SPSS
USAID

1
CHAPTER I
1.1 Introduction
Pakistan is a exceptional combination of deserts, alluvial plains, low and high hills,
valleys and a long coast line. The diversity in climate and soil is well reflected in Ihe
ecological distribution of flora and fauna. The climate / environment is generally arid
subtropical with the average rainfall of 250mm, while some of the driest regions
receive less than 123 mm annually (Hussain et al., 2003). There is wide range of
rainfall starting from 100 mm in the south to 1000 mm in the north. Pakistan has the
largest contiguous canal irrigation system in the world, without it, the country would
have been a vast unproductive desert (Shinwari et al., 2003; Ahmed et al., 2010). With
independence in 1947, the new bom country’s meager natural resources had to bear the
brunt of refugees from across the border. Trees were cut mercilessly, and subsequently,
the nexus between the contractor and the forester played havoc with the country’s tree
cover, rendering the state of affairs into an almost irreversible situation (GOP, 2006 -2007).
The country has a narrow forest resource base extending over only about 4.8% (4.59%
excluding farmland plantations) of its area, which is insufficient to provide the material
needs of the growing population and expanding industry, and to retard and arrest the
ongoing environmental and ecological degradation process. The situation is further
aggravated by the natural, but uneven distribution of the forest resources. Almost 80%
of the productive forests are located in the north (Hazara, Malakand, Azad Kashmir and
Northern areas), whereas 80% of the population and wood based industry is located in
the southern and central parts of Pakistan (Pakistan Economic Survey, 2004-2005 and
Naz,ef al., 2009).
Pakistan's fast growing population of about 15233 million is dependent for its wood
and wood products requirement on a meager forest resource base of 4.2 million
hectares (The Pakistan National Conservation Strategy, 2006). The per capita forest
area thus is only 0.0265 ha (Pakistan Economic Survey, 2004 - 05), compared to the
World is standard of one hectare. Only l/3rd of the total forest area is productive, while

2
the rest is of environmental and protective value only (Anon, 1991 and Ahmad, 1998),
It is becoming increasingly difficult to meet the demands of the glowing population for
fuel wood, fodder, agriculture implements and raw material required for wood based
industries (Caviglia and Kahn, 2001), There is no doubt that scanty tree cover is the
result of the gross mismanagement of forests in the past,
The immense impact of trees in the development of a country cannot be denied and
over-emphasized. While the productive role does not require much familiarization as
indicated by wood and a variety of wood products, the protective function implies
much more important features such as impact on climate, and physiography of the
country, conservation of soil and water (Higgs, 1997), regulation of stream flow (Drury
et ul., 2000) and prevention of calamities such as floods, landslides, siltation and
sedimentation of dams and river beds and change the course of rivers (Pallardy et al,
2002). The role trees play in protecting the croplands and orchards against hot or cold
winds is also now well appreciated by the farmers (Wilkinson and Craig, 2004). The
recreational and biodiversity value of forests together with the feet that forests are the
eternal abode / habitat where wildlife can live and multiply is now being increasingly
realized (Hubbard et ah, 1999; Disseleua, et ah. 2010). More than 60 percent of the
land in Pakistan is either already affected or likely to be affected by desertification.
The suspended sediment load per km of drainage basin is one of the highest in the
region. More than l .2 million ha of land has already been affected by soil erosion, 4.2
million ha have been rendered unproductive by salinity, and another 2.0 million ha have
become unusable due to water logging. Inspite of reclamation efforts, large areas
remain plagued by these problems. How could then the vast tracts of land be reclaimed?
Biological amelioration is the only answer (Sheikh and Qureshi, 1992; Sheikh et ah,
2000a; Khan etah, 2010a).
Although the official figure for the country’s forested land is 4.8 percent, actual
productive forest area comprises of less than 2 percent. Consequently, available timber
per capita is only 0.013 m3. Imports of wood and wood products have enlarged to Rs.
5,000 million per annum. It is anticipated that rising demand and declining supply will
follow due to increasing population and per capita income growth on the one hand, and
shrinking forests on the other. Due to the widening gap between wood supply and fuel
wood demand, the domestic energy requirements arc being met by kerosene oil, natural

3
gas, electricity, cow-dung, and agricultural wastes. All of these commodities could be
used more profitably for industrial purposes and crop production rather than for heating
and cooking (Sheikh et al„ 2000 and MAANICS, 2003-2004).
12 Forest Types
Pakistan has various forest types spread throughout the country. The details of the
forest types arc shown in Table 1.1 which indicates that Pakistan has a vast range of
forests i.e. Coniferous, Irrigated Plantations, Riverine forests, Scrub forests, Coastal
and Mazri forests, Linear plantations (Road side, Rail side and Canal side plantations)
and Range lands. These Range lands in feet cover most of the forest area of the country.
1.3 Supply and Demand of Wood
When Pakistan came into being in 1947, the number of trees per acre in Punjab on the
private fermlands varied from four to five (PERI, 2000). Thereafter, Punjab Forest
Department launched various campaigns to increase this number (Sheikh et at., 2000a
and Khan et at., 2010b). The survey carried out in 1971-72 showed that number of trees
per acre on private farmlands in the Punjab increased to eight. Subsequent campaigns
helped to increase to the level up to twelve trees per acre (PERI, 2000). To further
improve this average, another program was started by the Punjab Forest Department in
1980 to boost up tree production through a participatory approach. The results of these
campaigns were assessed in 1992 by Forestry sector Master Plan and it assessed the
number of trees /ha as eighteen (Anon, 2000) and in 1999-2000 by Punjab Economic
Research institute (PERI). The last survey showed that the number of trees per acre on
private fermlands had increased to 17. This was a perceptible breakthrough and could
be used as a base to assess the impact of agroforestiy on ecology/environment,
economic and social conditions in the Punjab (PERL 2000). Pakistan is practically
facing a wood shortage. Prices of limber and fuel wood have registered an alarming
increase in the recent past. Population of the country projected to be around 150 million
by the year 2010 has already reached 153.53 million (Table 1.2). Demand of wood and
wood products would increase proportionately.
One option to viaduct this gap between supply and demand could be to put more area
under slate forests. For the time being it seems rather difficult because of paramount
claim of agriculture on land and water and attended economic problems.

4
Table 1.1 Pakistan Forest areas by Types (Area in 000 ba)
' NWFP/KP N.AREA AJKSINDH BALUC- TOTALForest Type PUNJAB
285 407 1930Coniferous 1073 49 116
Irrigated
Plantations95 6 8 259150
Riverine forests 272 2 33258
163963 316 652 9Scrub forests 1 598
512Coastal forests 281 231
2424Mazri forests
Linear plantations 2 1 I 1 2116
5892437 371 2104 151Range land 150 2678
3050 106093268 1087 1325 567Total 1312
Source: Forestry Statistics of Pakistan PF1 Peshawar (2004)
Table 1.2 Supply and Demand Gap of wood at National Level, 2002-03
(Million nr)
Quantity %age shareTimberState Controlled Forests 3,340..409Import of wood and wood productsincluding Afghan timber_
5.220.639
91.44Farm lands 11.190Total 12.238N.B. On the basts of 0.0796 m3 / capita consumption for Population of 153.73million in 2002-2003 _
Fuel Wood31.462 99.80Farmlands
0.20State Controlled Forests 0.06031.522Total
N.B. On the basis of 0.205 m3 / capita consumption for Population of 153.73million in 2002-2003 _
Million nr* % shareGap i wood shortage
Total timber consumption 2812.23831.522Total fuel wood consumption 72
Grand Total 43.760Forest Growth l Annual Yields (FSMP-
1992)14.400
29.360Gap shortageSource; MAANICS International (Pvt) Ltd. Islamabad (2003-04)

5
Another option could be to strengthen forest management practices for enhanced
yield per unit area but that would also require heavy inputs (Hafecz, 1998). The only
practical alternative is to plant trees on cultivated and marginal lands with the help
farming community (Shouket and Qadir, 1997). Tree planting on private lands has
great social overtones and is intimately connected with rural welfare, priority being
given to village self-sufficiency (Montambault, 2005).
The Forest policies of Pakistan (1955, 1962, and 1991) accentuate the need to
encourage farm forestry and introduced legislation to do so (Ahmed and Mahmood
1998), but very little was converted into practical measures. Uptake and farmer’s
participation in form forestry activities are low because most social forestry projects
were mainly centered on biological and technical concerns and very little or no
emphasis was placed on accepting the perceptions of local tree growers or
beneficiaries of the projects. The limited acceptance of agroforestry activities is due
to the lack of attention given to formers’ views of the factors that influence their
decisions and, moreover, that projects mostly pay inadequate attention to local
conditions, cultural values, former's needs, and their involvement in such projects
(Akbar et ai 2000). Asaresuhofill treatment not only the vegetation is sparse but
also the sites once cleared of growth and left barren for a number of years does not
respond to reforestation / afforestation. There is an incessant cutting and grazing. The
forest resource has eroded gradually.
The scientific management of the government controlled forests was started more
than 150 years ago in early 1860s. Had the requisite silvicultural management /
treatment been undertaken and ensured, the cover would have been in a much better
shape, Several factors did not allow forest management according to Silvicultural
requirements of forests, During the first and second World Wars the accessible forests
were ruthlessly hacked to feed the war machine (Sheikh, et at, 2000b). Also at the
time of land settlement certain rights of die local population were admitted for timber,
fuel wood, grass cutting and grazing. These rights have multiplied with the growth of
the population and individual families. The exercise of such rights is no more
compatible will: foe resource potential. Thus the forests of foe sub-continent had
already exhausted to a very huge extent even before partition (Sheikh et at, 2000). A
glance at following Tables (1.2, i.3, and 1.4) would bring out the actual position of

6
production and shortage of wood, (MAANICS International (Pvt.) ltd, Islamabad,
2003-04) and also reveal existing wood gap / wood shortage supply and demand gap
Analysis- Pakistan.
It is not being realized that trees on agricultural land play an increasingly important
role for bridging the gap between demand and availability of wood. It is reported by
several authors that more than 90% of the fire wood requirements and almost 50 % of
the timber requirements are being met from the trees growing on private farmlands
(Haider, 1995; Hatch and Naughton, 1994). While the latest exercise by the
Government of Pakistan 2004, has also confirmed that 90% of fuel wood and 50% of
timber come from the farm and marginal lands (Tabic 12 to 1.4). With the passage of
time, the increasing population would need more food and animal husbandry
products. Area under forests will further diminish due to pressure of agriculture.
Irrational exploitation of land resources such as trees, grasses, water and soil and soil
erosion will result in a decreased land productivity causing ecological imbalance
(FAO, 1988). With agroforestry it would be possible to mitigate these problems.
Since the trees have inbuilt capacity to stabilize production of food, forage, firewood,
timber and protection of environment, it is economically profitable and ecologically
beneficial to establish agroforeslry system in the country {Amjad and Khan, 1996 and
Magcale. e/ a/., 2010).
In a FAO sponsored study, Sheikh (1987), discussed the role of “Forest Rural
Enteiprises in Pakistan”. The relevant material includes importance of raw material
produced on farmland for continued supply to the village carpenter to meet not only
the local demands but also to boost the socio-economic aspects of program of
growing trees on farmland. The study emphasizes die necessity of trees planting by
the farmers. Sheikh, (1991) analyzed the impact of various kinds of shclteibelts on a
variety of agricultural crops such as effects of Eucalyptus camatduknsis and
Dalbergki sissoo on wheat and cotton, and effect of Dalltergia sissoo, poplar and
willow on sugarcane and concluded that die trees do depress the agriculture crops up
to distance oflO meters. Singh el at.. (2005) evaluated crop productivity and defined
best tree density with advancing age of Prompts cineraria (Khezri) in an agroforcstry
system in North Western India and concluded that little soil water content at 1 m
distance from tree base compared with die center of four trees indicated greater
consumption of soil water within the tree rooting region.

7
Table 1J Total supply of limber and fuel wood in Pakistan for the year 2002-03
[limber | F/woud | Total woodSourceS.Noi State Forests
o.no o.noi NWFP0.029 0.097II Punjab 0.068
0.068U1 Sindh 0.036 0.032Balochistanreported)
IV (not
0.111V NA 0.1 1 10.084AIK 0,084VI0,470Sub Total 0.409
2 Imports0.596Timber round wood and 0.596I
sawn, Wood based pulp,paper and Pencilproducts (round woodcquiv.)_Afghan Timber (Bal) 0.0140.01411
0.029Afghan Timber (NWFP) 0.0291110.639Sub Total 0.639
0.061 1.109Grand Total (1+2) 1.048S*ortt: MAANKTS InlcrnitionaJ 0 Ud. JtUmibad IIOELMM)
The following Table (1.4) indicates the Wood supply and demand projections
(2003-2018) in Pakistan.
Table 1.4 Projected Consumption of wood
20182008 20132003UnitsItems189.24 209.96Million 170.56Population 153.73
0003nr' 15065 16715Industrial Timber 12238 135780003ÿ7 5789Industrial Fuel
wood_Commercial Fuelwood
5218 64234701
0003m* 14291046 12881161
0003m* 31727 3520128595Domestic 257730003m' 28999 3217426137Rural 235570003m* 2728 30272216 2459Urban0603n7 3880434974 43053Total Fuel wood 315220003m* 5386943760 46552 59768Grand Total
Source: MAANICS Infirnnllomil (Pw} Ltd. IdamaUad (26Qi~0i)
8
1.4 Agrofbrestry
The concept of trees on farmlands actually originated from the realization that trees
played a very important productive and protective role in safe-guarding the vital
interests of farmlands and their produce (Khan, 2001and Ackerman, et ai, 2010). In
Pakistan, trees on farmlands have since long been making a very handsome
contribution to supplement the production from the state forests. Ever since the
development of irrigation system in Indus Basin, people have been planting trees of
various species (Hussain, 1999). However, since removal of trees has been much
faster than the replacement, the inevitable result is that the resources have dwindled at
a fast pace. One option to viaduct the gap between supply and demand would be to
include more area under state forests (MAAN1CS, 2003-04). For the time being, it
seems to be difficult because of principal claim on land for agriculture to nourish the
ever-increasing human and livestock population (Sheikh and Nico, 1991; Sheikh,
1993).
Agroforcsiry assumed new directions and significance in Pakistan when barren land
was brought under irrigation in the Thai desert. The new settlers, with the help of the
Forest Department planted trees on their watercourses, farm roads, around the fields
for protection against desiccating winds (Hafcez, 1998 and Aguiar, et ai, 2010). It
was periiaps for the first time that shisham (Dalbergin sissoo) trees were planted in
conjunction with agricultural crops like wheat and sugarcane. Fertilizers added to the
crop made a highly beneficial effect on shisham as well and 5 m height was recorded
in one season, The added advantage was that sugarcane reduced branching in shisham
and practically straight boled trees developed. The similar research was repealed in
the province of Sindh, when water was available from river Indus to expand
agricultural lands, planting stock was distributed free of cost as an incentive. Actually
an effort was made to distribute the plants in the field of the new settlers as they did
not have means to collect the plants from forest nurseries due to lack of proper roads
and transport facilities (Pfefferkor et ai, 2005)
1.5 Definitions and Practices: In order to reduce the pressure on natural forest / states
forest and to fill foe gap of shortage of wood, die developing world have started a large
number of projects, which are being implemented under various names such as, Social
Forestry, Community Forestry, Village Wood Land Forestry and Rural Forestry where

9
trees and shrubs are grown m conjunction with agricultural crops in diliferent designs
and patterns. This joint production system of land management called Agroforestry, as
an optional of growing woody perennials and agricultural crops on same piece of land
in different spatial and temporal arrangements, is the future vision of forests in the
country (Ashton and Montagnini, 1999 : Bruhn, et al., 2010). The trees on the
agriculture or waste lands could be in the form of trees scattered all over the fields; a
single row of trees around the fields; a multiple of rows around the fields; trees along
the water courses (Jordan, 1998); tree rows spaced 5-20 meters apart and agriculture
crops planted in between (Alley Cropping AF System); a compact block planted in
rather non productive part of the field and as a block plantation to reclaim and enrich
the land for subsequent agriculture{Sheikh, 1990 and Benjamin et al., 2000).
Agroforestry is an inter-disciplinary approach to systems of land use and joint
production system (Avila, 1995). It implies awareness of communications and
feedbacks between farmer and environment, between demand and available resources
in a given area, which under certain conditions need optimization and sustained
management rather than ever escalating exploitation (Carroll, 1995 and Cao, et al..
2010). No one denies the existence and in fact critical role of competition in
agioforestry when agriculture crops arc grown in amalgamation with forest trees,
shrubs and /or cattle (Ahmad, 1998), At the same time, however, optimal use should
be made of space in the horizontal and vertical directions (Hafecz, 1998). Moreover, it
is a feature of agroforestry that many components of the systems, fully or partly, are
independent (Lassoic et al., 1994). This helps evade conflicts and to harmonize
diversified field efforts in land use. The following few definitions have been
considered by experts and scientists interested or involved in land use and related
sciences, based on their views and their individual understanding of what they call
agroforestry (Hussian, 1999).
1 .Agroforcstry is a land-use system that involves communally and ecologically
acceptable combination of trees with agricultural crops and / or animals, at the
same time or sequentially, so as to get increased total yield of plant and animal in
a sustainable way from a unit of farmland, particularly under conditions of low
levels of scientific inputs and trivial lands. (International Council for Research
on Agroforestry, (ICRAF), (Khan. 1989 and Sood, 2003 : Frey, et al., 2010)..
10
2.Agroforestry is a land use system in which woody perennials and herbaceous
in mixtures, zonal and/or sequentially with or withoutcrops are grown
animals (Kang et ai, 1990) and which provides greater benefits for the land
use than agriculture or forestry alone (Merwin,1990) including one or more of
the following: sustained soil fertility (Sanchez et ai,1997), soil conservation
(Train et ai, 2001), increased yield (Wilkinson and Elevitch, 2004), diminished
risk of crop failure, ease of management, pest and disease control and/or greater
fulfillment of the soico-eoonomic needs of foe local population (Nair, 1987;
Zubair and Garforth, 2005).
3.Agroforestry is a sustainable land management system which increases foe
overall yield of the land, combines production of crops (including tree crops) and
forest plants and/or animals simultaneously or sequentially, on the same unit of
land, and applies management practices that are compatible with foe cultural
practices of the local population (Sheikh, 1986; Sheikh and Haq, 1987; Zubair
and Garfcrlh, 2005).
In foe above definitions foe phrase “on foe same unit of land” seeks to emphasize that
zonal arrangements of agricultural crops and forest crops arc not considered to be
agroforestry, and to imply that the mixtures of the combined agricultural and forest
crops should be intermingled. However, it is still considered that foe definition is
inadequate, because, for example, it does not tell us what is meant by a unit of land,
and hence cannot help us to comprehend fully what is the degree of intimacy required
to distinguish agroforesiry system from systems in which agriculture and Forestry are,
to some extent, zoned or occupy adjacent but distinct blocks, or in which there are
strips (or lines) of forest trees alternating with strips or blocks of agricultural crops
(Sheikh, 1997; Craig and Wilkinson, 2004). Agroforcstry should be considered to be a
generic term that embraces foe following specific components (Avila, 1995).
(a)Agrosilviculture is foe conscious and deliberate use of land for the
concurrent production of agricultural crops (including tree crops) and
forest crops. This is perhaps the most common form of agroforestry
(Torquebiau, 1990; Bruhn, etui, 2010; Haile, et al., 2010).
11
(b) Silvopastoral is the land management system in which forests are managed
for the production of wood as well as for the rearing of domesticated
animals (Jose, 1999 and Brnhn, etai, 2010).
(cJAgrosilvopaslorat is die land management system in which lands are
managed for their ability to produce not only wood, but also leaves and/or
fruits that arc suitable for food and fodder, This is the most intensive form
of land management in which the land is managed concurrently for the
production of agricultural and forest crops and for rearing of domesticated
animals (Jose, 2002 and llolzmueller, 2009),
(d) Probably the best description of agroforestry has been used by the 1CRAF
i.e. Agroforestry is a collective name for land use systems and
technologies, where woody perennials (trees, shrubs, palms, bamboos, etc)
are deliberately used on the same land management unit as agricultural
crops and/ or animals, either in some form of spatial arrangement or
temporal sequence. In Agroforestry systems, there are ecological and
economical interactions between the different components (Higgs, 1997
and Frey, et aL, 2010).
Puri and Nair (2004) described agroforestry research for development in India in
which authors explained examination of the impact of agroforestry technology
generation and adoption in different parts of the country highlights the major role of
smallholders as agroforestry producers of the future. It is crncial that progressive legal
and institutional policies arc created to eschew the historical dichotomy between
agriculture and forestry and encourage integrated land-use systems. fCiptotera/., 2006,
surveyed various farmer; for sharing seed and knowledge in Western Kenya and
results showed that seed and knowledge were mostly shared along kinship ties.
Furthermore, informal social networks were found to be more effective for seed than
knowledge, farmers with leadership status in their groups, those who belonged to
many groups and those with larger farm sizes were more likely to give out seed of
improved fallow s, These categories of farmers could be targeted to enhance die spread
of technologies.

12
1.6 Rationale for Agroforestry/Farmland Planting
The rural population of the country is rather simple. All misfortunes or blessings are
accepted as God sent. Till late, majority of them have acted and behaved according to
the sweet will of the jagirdar or village Head man (Hussain, 1999 and Cao et at..2010). However, there is now some improvement in their thinking and attitudes and
there is a desire to change and improve their way of life. They have started
comprehending the advantages and disadvantages of a system imposed on them from
outside. It should nevertheless be felly understood that tree planting for rural
development will never succeed until the people are convinced of its usefulness. Some
major issues have to be considered for a meaningful program culminating in
formulation of village institutions to enable them to perpetuate and flourish on their
own (Sheikh, 1990 and Ackerman et al.t 2010).
Farm trees act as a buffer between fee state commercial forests. As regards social
forestry’s support to forest production systems, the trees on private land serve as a
very important buffer between ihe state commercial forests {Carroll, 1995 and Frey, et
at.. 2010). The latest example to elucidate this point is the use of poplar and Eucalypts
on private land to provide wood for the hutments of Afghan refugees. The chopped
wood was also being sold. If these trees were not handy, the commercial chir forests
would have suffered a great deal (Sheikh,2000). It is time to realize that whatever trees
are left in the state forests would not have been there if trees on private lands were not
available to meet the demands of feelwood and timber (Ahmad, 1998). Being readily
available, there is less temptation to axe the government forests. Unless social forestry
is made popular it is next to impossible to check the rampant illicit felling in state
forests (Ahmed and Mahmood, 1998 and Holzmucllcr, 2009). The state forests located
in the fragile mountain, sub-mountain and arid and scmi-arid ecosystems can be saved
only if the users are provided alternate source of feel and small wood (Akbar et at.,
2000). Studies all over the world have clearly shown that tree production and
agriculture production can be safely integrated to get the maximum yields of required
goods and services from the same piece ofland (Torquebiau, 1990). If fruit trees are
planted, these become a dependable source of food. Good examples are mangoes,
jaman, mulberry coconut etc. (Sood, 2003).

13
tn the hills and foothills, trees stabilize the land which is usually in small fragments. It
has been observed that cultivated slopes without trees get eroded and are washed down
with rain and snow but the land covervcd with trees and shrubs remains in position
(Pallardy et a/,. 2002 and Aguiar, et ai. 2010). Similarly, in the plains, the
farmlands laced with trees are not carried away by floods and hold their own {Sheikh
and Bukhari, 1996).
As regards the arid and semi arid areas, apart from some other factors, desertification
has been caused primarily by destruction of vegetation (Ratterman et at,, 2002). The
most important step to reinforce the arid land ecosystem would, therefore be,
revegetation. Tree planting activities in arid areas have a major role to play in
stabilization of agincuHune and to support all development strategies for the benefit of
a vast majority of poor population {Brandlc et at.,1994), It is so because they meet
most of their requirements of daily household through plant biomass. Trees and shrubs
combined wilh the cultuvation of annual plants has an important role to play to
develop a balanced nmal economy, as well, as avoiding degradation of the
environment and destruction of the resource base (Sundcrlin, 1997).
Fifty percent of rural population of Pakistan is composed of rural women whose
literacy rate is very low. Like other developing countries, the Pakistani rural woman is
also obliged to do lot of work for the family (Sheikh et ai, 2000b). In addition to
looking after children, their chores include collection of fuel, preparation of food,
fetching water, cutting of grass, grazing of animals and carrying of food to their
husbands, brothers and fathers who work in the fields. She is also called upon to
perform many other tasks such as cutting of wheat and rice, thrashing and winnowing ,
collection of cotton, etc. Due to scarcity of wood resources in the country, rural
women have to spend considerable time in collection of pine needles, grass, cow-dung,
etc. They have also to lake the livestock for pasturing to long distances. Since stall
feeding connot be afforded by small farmers, fodder collection is also done by the
womenfolk (Uddin et ai, 2006), If multipurpose trees are planted right on the fields in
close proximity to the village, the plight of the womenfolk, young girls and boys
would be alleviated to a great extent They would be able to save their energy for
attending to other spheres of work, such as education, child care and health (Sheikh
and Jan 1987; Sheikh, 1987).

14
1.7 Ecological, Economic, Social and Institutional Aspects of Agroforesfry
There are several significant aspects of agroforestry. These include ecological,
economic, social and institutional aspects (Salam et al, 2005).
1.7.1 Ecological aspects
Forests generally have a beneficial effect on the soils. The roots of the forest trees
take up nutrients from the soil, convert and utilize them for the production of plant
material, and then return them to the forest floor in the form ofieaves, twigs, branches,
fruit, etc. This litter is transformed into the soil humus (Sanchez, 1995 and
Holzmuellcr, 2009). ft is this cycle of uptake, deposition and uptake again that
accounts for the presence of forests on soils that are inherently low in nutrients (Giller,
2001). Soils are often incapable of sustaining annual agricultural crops; the harvesting
of which removes most of the organic matter that has been manufactured by the plant
(Tian el al 2001 and Frey, et ai, 2010). A well managed forest is to a large extent a
closed system and can be maintained that way (N’goran et al., 2002).
1.7.2 Economic Aspects
From the economic point of view, agroforcstry appears as an interesting contribution
to solve the food crisis as well as the energy crisis. The latter has been under-estimated
and it seems that the deficiency will soon attain an even more critical level in the Third
World than ihe shortage of grains. The production of fire wood outside the forests is,
therefore, a useful and essential diversification, able to produce additional earnings for
the farmers. Agioforestry plays effective the role of a long term profitable investment,
and once the market for woody products develops; the farmer will start taking concern
of his trees (Montambault el al.. 2005 and Frey, et ai, 2010).
Plantation costs are very low compared with other methods used to improve the
stability and fertility of agricultural soils. In arid regions, the production of fuelwood is
of the highest priority. While the production of trees for timber in wooded areas may
decrease the destruction of the natural forests, it may be seriously affected by abusive
exploitations. The additional income provided by the sale of fuelwood and timber
does more than compensate for the loss of crop production caused by competition for
light, nutrients and water (Kato et al., 1999).

15
1.7.3 Social Aspects
In Pakistan and for that matter in whole of South East Asia, a small farmer continues
to be poor and is almost a social outcast (Hussain, 1999 and Aguiar, et ai, 2010). One
reason for this state of affairs is that he never possesses extra money to meet his
emergent requirements and he is forced to borrow invariably from the well off
individuals of the society. He has to buy fertilizers, insecticides, pesticides etc to
increase his meager yields, besides making both ends meet and to buy day-to-day
requirement of his large family. Feed for the livestock is an additional burden.
Purchase of POL fuel and repairs of farm machinery requires money. If there is a crop
failure due to climatic or biotic facts, he is doomed and is never able to repay the ever
swelling loans. It is only the trees which could serve as a hedge against emergencies
and allow him to fulfill his socio-cultura! commitments such as marriages, births,
deaths, religious functions, educational requirements, medicines and health care etc.
By felling a few trees on his farm, he can always manage to meet extra expenses
(Sheikh, 2000a and Cao, elai, 2010).
1.7.4 Institutional Aspect
The system ofagroforestry will prosper only when it gets institutionalized. The people
have to get involved, physically, emotionally, financially and mentally so that the
programs once started develop a tempo of their own and there is continuity.
Agroforcster and wood user linkages have to be developed (Chandnshekhran, 1987).
Women have to become very aggressive and equal partners in the entire agroforestry
programs (Gautam et ai, 2003). Research Endings have to be transferred to the agro¬
foresters so that they can make use of iL Nothing will convince an agio forester more
than a few demonstration plots laid out on his land. The implementing staff should be
fully compensated and in turn the related staff should develop multiple skills. Measure
of success would be what people are encouraged to do through motivation and not
what they are prevented from doing. Institutional aspect would prosper when Ihe tree
farmer gets fully converted and convinced to the extent that he himself becomes the
greatest protagonist of tree planting, Agroforestry institutions have to be constantly
reviewed and improved (Sheikh, 1990 and Mertz, et ai, 20 1 0).
1.8 Agroforcstry and the Farmer
It would be pertinent to mention that to a common farmer with almost little education,
the environmental considerations or conservation of biodiversity docs not matter
16
(Sood, 2003 and Frey, et at,, 20 10). What agro farmer wants is fuel wood for heating
and cooking, small timber for his hutments and livestock shelter, wood for agricultural
implements and some extra for sale in the market to enable him to buy other
necessities of life for himself and his family.
A fundamental problem is that the strong tradition of practicing agriculture is not
matched by the rural people in terms of value the woodlands and forests have (Lassoie
et at., 1994). Khan (1989), during economic analysis of Agroforestry Options in small
inigaied land holdings in the Punjab, has studied the land use patterns, crop yields, and
joint production of timber and fuel wood along with agricultural crops. The author
concluded that wheat / poplar alley joint production system is physically feasible and
economically efficient option to improve the economy of small-irrigated forms by land
management system in the Punjab province. Comes et at. (1989) randomly selected
farms from the Vicosa, Uba, Carangola and Manchaca regions of Minas Gerais and
grouped litem into 0 to 10 ha, 10 to 50 ha, 50 to 100 ha and, 100 to 200 ha size
categories. Land use patterns and attitudes of farmers towards the agroforcstry system
were also assessed. The main crops planted were maize, beans and rice. The
proportion (19.4%) of reforested land was greatest for the small farms (for 0 to 10 ha
class). The proportion (8.2%) of natural forest cover was greatest for the larger farms
(for 100 to 200 ha class). The reforested areas were mainly on sloped lands. About
61% of formers intended to increase the area of reforested land most of these were
farmers with forms of 100 ha. Rao (1989) studied the economic returns for marginal
and small farmers. Three species namely Eucalyptus, Babul and Shisham were
recommended for planting on farm and private lands by the author.
Dixit and Sreenath (1993) conducted a study on the attitude of farmers towards form
forestry. Data from a survey of 100 farms in Chitradurga district, Karnataka, showed
that 66% had a favorable attitude towards social forestry (including farm forestry)
programs. Tree growing decisions of agrofarmers fanners were influenced by the
suggestions of the family, owners/tenants, associate farmers, and elders of village. The
factors that considerably predict form-level tree planting were availability of barren
land, lack of markets, lack of nurseries, and damage caused by livestock and humans.
Agroforestiy programs are more likely to be successful if they acknowledge and tackle
the foetors which underlie agio fanner’s reasons for planting or not planting trees
(Zubair and Garforth, 2005).

17
1.9 Agroforestry in Punjab
In view of the scarcity of wood in Punjab, the largest province of the country, and
otherwise maximum possibilities of a large-scale agroforcstiy program being available
due to availability ofland and water, special attention has been paid to agroforestry in
this province (Hafez, 1998). A nucleus organization was created under a development
scheme in 1975-76, called "Promotion of Tree planting in the Punjab’’. Its main
object was to organize the hitherto sporadic tree planting campaigns on scientific lines
and also to provide technical guidance on tree planting to the farmers (Hatch and
Naughlon, 1994). This project continued till 1984 when a larger and better-conceived
scheme called “Form Forestry Pilot Project” was initiated in six selected districts i.e.
Bahawalpur, Bhakkar, Multan, Jhang, Jhelum and Mianwali. Forest nurseries were
raised all over the province and seedlings distributed to the fanners (Sheikh, 1990).
Satisfied with die performance of these two projects and because of positive response
from the farming community, the Punjab Government decided to launch another
scheme titled "Social Forestry in the Punjab” for the period 1985-88 (PERI, 2000). It
aimed at establishing and maintaining wood lots and linear plantations in private
Farmland in addition to raising of bed nurseries. It was followed by another project
“Raising of Nursery Plants for Saline and Marginal Private Farmlands in Irrigated
Tract of the Punjab", which was approved for a period of three years starting 1986.
Under this project, tube plants were supplied to the farmers at the subsidized rate of
Rs.0.25 per plant (Sheikh et al 2000a and Najera, et ai. 2010).
Social forestry received a great impetus when the Punjab Chief Minister decided to
institute a series of prizes at provincial, divisional and district levels for the trees
growers. The plan envisaged to generate a competitive spirit in various groups of
population for undertaking afforestation on private lands on self-help basis. The prizes
to be awarded on the basis of evaluation included Suzuki car, sponsorship for Hajj i
Umra, free trips to New York and South Asia, besides cash prizes at divisional and
district levels (Sheikh, 2000). Other incentives such as subsidized tree planting in
private lands, essay, and poetry and slogan competitions played a key role in invoking
love for trees in the Punjab (PERI, 2000). In the subsidized tree planting campaign,
active participation by the farmer was ensured. He was to spend about Rs 2,000 per

18
hectare for jungle clearance, site preparation, weeding, cleaning and pruning. TheDepartment was required to spend huge amount
maintenance (Hafeez, 1998). To implement various social forestry schemes, aprogram for training of staff was also started m 1982-83 and completed in 1985-86(Sheikh, 2000).
in another model ofagroforestry introduced in irrigated plantations, the land was to be
prepared by tire Department, including the works such as removal of mesquite,
preparation of water courses and trenches etc. The formers were supplied with the
requisite planting stock and were helped with planting on proper spacing which is
usually 2m x 3m. From then onwards, the fanners were required to maintain the
plants, irrigate and remove all the weeds. They were also responsible for hoeing and
application of fertilizers to their crops from which trees were also duly benefited. As a
compensation for that, they were also allowed to cultivate the area in between the tree
rows for a period of one year. Usually tomatoes, okra, radish, turnips, carrots and
squashes were grown. After one year, the farmer was required to leave this particular
area and was given some land nearby in another compartment which was due to be
afforested according to schedule. In this manner, the Department was saving the cost
of maintenance for one year which comes to Rs, 1,200/ha and the farmer got Rs.4O0
per crop through sale of the vegetables. Almost 99% plants survived, growing
vigorously due to removal of weeds, intensive soil working and fertilizer effect. Every
year, hundreds of hectares were planted under this program (Sheikh el aL 2000c).
1.9.1 USAID Social Forestry Program
A joint (GOP-USAID) venture was launched in 1985 with a view to promoting tree
planting on private lands with appropriate guidance, backed by research, training and
education. The aim was to reach a stage when the nursery production and on-farm
planting would be fully privatized due to underlying socio-economic benefits. Transfer
of technology has gradually lead to establishment of forestry institutions in private
In the process, 150 million assorted nursery plants have been raised in the
fanner nurseries out of which 130 million have been planted. Survival has been
assessed as 70%. Taking 1,000 plants/acre, it means that an area of more than
equivalent of 10 Changa Manga plantations have been created (USAID, 1995).
cost of planting, irrigation and
sector.

19
The farmers are now sowing crops such as water melon, musk melon, ground nut etc.,
in between the lines. This is providing them early seasonal returns. The farmers are
being introduced to various wood based industrialists so that their apprehensions
regarding marketing of species like Eucalyptus are set aside. Many factories of
chipboard have offered to purchase 3-year old Eucalyptus wood at reasonable prices,
and are prepared to buy as much quantity as the farmers can produce which is a very
healthy sign.
1.9.2 Punjab Forest Sector Development Project (PKSDP)
A six-year World Bank aided project, estimated to cost Rs. 1,200 million, was
launched in 1995. The main objectives of this project was for developing requisite
technology and facilitating its transfer to expand private sector involvement in the
expansion of sustainable supplies of wood and wood products through strengthening
the extension potential of the Punjab Forest Department (PFD) with staff, transport,
equipment, guidance/training, and operating finances; facilitating the transmit of
information needed to support fanner’s participation in wood markets by providing the
Punjab Forest Department (PFD) with facilities, technical assistance, and operating
funds; Improving the availability of better-quality planting material by providing the
Punjab Forestry Research Institute (PFRJ) with operating funds to carry out research
on seed quality, demarcating seed production areas and launch model nurseries; and
starting adaptive research by providing operating funds to cany out specics/variety
trials and improve tree establishment and management practices on lands (Sheikh et
ai.t 2000a).
1,9.2.1 Phasing Out of Punjab Forest Department (PFD) Nurseries;
There were some seven Punjab Forest Department nurseries providing farm forestry
seedling requirements at the lime of project preparation (1994-95). Under the PFSDP
these were phased out and replaced by a large number of farmer nurseries by the year
6. It was also provided that if the private sector showed the requisite will. PFD may
stop raising nurseries altogether earlier on in the project period. The revised
anticipated phasing out ofpfd nurseries was as follows (Table l ,5 and 1 .6)

20
1.93 Case Studies in Agroforestry
Over a period time, social forestry programs have gained momentum due to a
coordinated effort by the foresters and farmers. These arc briefly described as unden
1.9.3.1 Planing Campaings in the Thai Desert
Although distribution of planting stock of assorted species was a common feature of
afforestation campaigns in the Thai and millions of plants were successfully planted
by the settlers on their field borders and along water courees, the foundations of a
village wood lot was truly laid out in Pakistan for the first time in 1952. Out of every
1,000 acre chak, 50 acres were reserved for planting a wood lot. The tree planting
campaings brought a very healthy change in the otherwise hot, drab and dry climate of
the desert (Ullah and Sheikh, 1960).
1.9.3.2 Tamarbe aphylla (Parash) Windbreaks
It is a very pleasant sight to see row after row, single or multiple planted, on the sand
dunes in Thai desert. This has been done to stabilize sand dunes on one hand and to
protect tender wheal, cotton and oil seed crops from the lacerating effect of sand laden
hot winds. Since the wood is a very efficient material lor turnery, toy making and
furniture manulacture it is getting as good a price as shisham (Ullah and Sheikh,
1960).
1.9.3.3 Poplars in Peshawar Valley
Poplars with sugar cane and wheat are a common scene in Peshawar valley. Wood
business has prospered and everyday many trucks loaded with poplar wood leave
NWFP for different destinations, even upto Karachi. Block plantation of poplar are
not uncommon (Sheikh, 1981 ).
1.9.3.4 Poplars and Turmeric in Changa Manga Plantation
Poplar and turmeric have been grown together in Changa Manga plantation for more
than two decades. Currently, the land is leased to the farmer for 1 to 2 years to grow
turmeric or some other agricultural crops such as wheat or even vegetables.
1.9.3.5 Eucalyptus Shelter Belts in Sindh
In 5 years, the Eucalyptus trees attain an average height of 1.3 meters and a diameter
of 15 cm. The tree has found its uses in chipboard and boat building industry.
Farmers are increasingly using this tree for prtection of their fruit and agricultural
crops front strong hot winds (Sheikh, 1981 : Sheikh and Haq-1999).

21
Table 1,5 Phasing out of Punjab Forest Department Nurseries
5 61 2 3Project year 0 4
Financial
year1999-00 2000-011996-97 1997-981994-95 1998-991995-96
PFDnurseries
140 70 0560 280 210700
Farmernurseries
1,000 1,000 1,000200 566 1,0780
Seedlings(in millions)
5055 50 50
Source: PEER!. 1999
Tabic 1.6 Average diameter (cm) and height (m) of the Trees
19851983 19841981 1982year
Av. dia.(em) 13.15.3 15.07.9 9.6
13.3Av. ht.(m) 10.6 12.66.5 8.9
Source: PEI Peshawar

22
1.93.6 Hurries in Sindh
The age old practice of raising block plantations of Acacia nilotica (kiker/babul) on
marginal land is yielding substantial profits. The hurrie is retained for a period of 4 to
5 years after which it is sold standing to eager customers for use as pit props in the
mines of Balochistan and Sindh. In the process, salt infested land gets improved due
to nitrogen fixing abililty of the tree (Sheikh, 1986).
1.10 Effect of Trees on Agricultural Crops
Eucalyptus eamaldulensis was planted on the lands of one Muhammad Aslam of
Mirpur Khas in Sindh to study the effects of trees on various agricultural crops. The
species was planted in 3 rows comprising a belt; plants were spaced I m in rows
which were 2 m apart, staggering in adjacent rows. Four such belts were planted at a
distance of 181-196 m, each belt being 630 m in length (Sheikh, 1990).
Two main crops of the area, namely, wheat and cotton where sown by the tanner in
between the successive trees belts to assess the effect. Each year during the reporting
period, in October/November wheat was sown in the area between the belts. After
two ploughings, the seeds were broadcasted at a rate of 125 kg/ha (50 kg/acre). Four
irrigations were applied after sowings. In the first year, 2.5 bags of DAP fertilizer/ha
was applied at the time of sowing, and one-half bag of Urca/DAP/ha 24 days after
sowing. Data were collected annually in March at harvest time. Plants were sampled
in lxl-m (1 m2) plots every 15 m along a randomly placed transect at right angles to
the belt. The individual samples were tied, tagged and thrashed after sun drying. The
grain was cleaned and weighed. Sample plots were laid out in the control area also,
exposed to normal wind velocity outside the sheltered zones. The grain yield data
from these plots were analyzed and the average yield projected in tons/hcctnnc. In
March 1981, when the bells were 15 months old and the average height of trees was
6.7 m, the analysis of wheat yield data indicated that the distance from the tree belt
had no significant effect on the yield or cither grain or straw. Data for the years 1982,
J984& 1985 are summarized in Table 1.7 (Sheikh, 1990).
It was concluded from the above data that the yield was depressed closer to the belts
and there was more depression in the yield on the northern side. The maximum yield
in the first year was generally available at a distance of 70 m from the bell and yield
beyond 20 m distance from the belt was significantly better

23
To study the effect of the tree belts on the yield of cotton, 12 quadrates of2mx2m
were laid each year. Data for the years 1981 to 1985 are tabulated in Table 1.8.
The analysis of data indicated that generally there was depression in the yield of
cotton up to 30 m distance on either side of the bell; beyond that there was positive
effect on the yield. Studies regarding effect of different tree species on a variety of
agriculture crops have been undertaken in different parts of Pakistan, it would be
interesting to give here results of some of these studies.
The study was conducted by the Punjab Forestry Research Institute for three years. It
was shown that the closest spacing gives the maximum dividends when poplars wen:
grown with agricultural crops, such as wheat, maize and fodder. As a matter of fact,
wheat gave the minimum income of Rs. 6, 799/ha from 1 .5m x 6m spacing followed
by 1.5mx9 m (Rs.7106) and 1.5mxl2 (Rs. 8, 199). It can, therefore, be concluded that
wheat and (odder crops if grown in conjunction with poplars, the spacing of trees has
to be wide enough to provide sufficient light to the agricultural crops; otherwise there
is lot of depression. The main aims of these studies are to act as guidelines for the tree
fanners practicing the Agioforestry,
The major objectives of present study were the identification and elaboration of agro-
climatic edapbic zones of Punjab from view point of Agroforcstry, assessment of
environmental / ecological impact of farmland plantation, impact on biodiversity, effect
on soil fertility and soil environment by studying Phylosociological study. It also
includes the evaluation of adoption level of Agroforestry interventions, extension of
biological approach to wasteland development, quantification of the social contribution
of Agroforestry over a period of lime, study of the tree-crop interface and monetary
gains / losses to the tree farmers along with preference of tree species by the farmer vis-
a-vis agro climatic zones by preparing Land suitability classification of choice of trees
species in 17 tchsils of 17 districts of Punjab, assessment of the aptitude of
agroforesters towards tree planting. The study of Agroforestry will help in the
development of linkages between wood producers and wood users, which will be
helpful in removing the hurdles in die expansion of the Agroforestry as land use system
and exploration of wood markets For the produced wood would be enhanced.

24
Tabic l ,7 Yield of Wheat (Tons per ha) under the Influence of Eucalyptus
camaldulensis
Distance fromwindbreak (m) 1982 1984 1985
0J5 0.930-15 *4.00
15-30 1.39 1.744.30
1.42 1.6530-45 4.40
1.68 1.7645-60 4.40
1.87 1.4660-75 4.50
1.7775-90 2.404.50
1.971.9290-105 4.40
2.052.18105-120 4.50
1.781.93120-135 4.40
1.601.79135-150 3.90
1.571.74150-165 3.90
1.261.19165-180 3.80
20.06 19341'otal 51.00
1.631374.25AYC:
1.611.634.00Av: from control plots
• Rounded [o decimal. Source: PFI Pcihawir

25
Table 1.8 Yield of cotton (tons/ha) under the Influence of Eucalyptus camaldulensis
Distance from 1981 1982 1984 1985
Windbreak (m)
1.29 0.200-15 1.12 0.19
1.8915-30 1.48 1.05 1.05
1.5930-45 1.66 1.11 1.09
45-60 1.381.73 1.80 1.34
1.3860-75 1.96 1.301.80
75-90 1.222.07 1.95 1.30
1.172.14 12090-105 1.94
1.19105-120 2.02 1.192.14
1.282.10 1271.76120-135
1.301.94 1.76 1.36135-150
1241.90 1.72 121150-165
028 0271.731.46165-180
12.8512.7221.87 21,08Total:1.06 1.071.751.82Ave:
Control plots: 0.800.821.71Source: PFI Peshawar
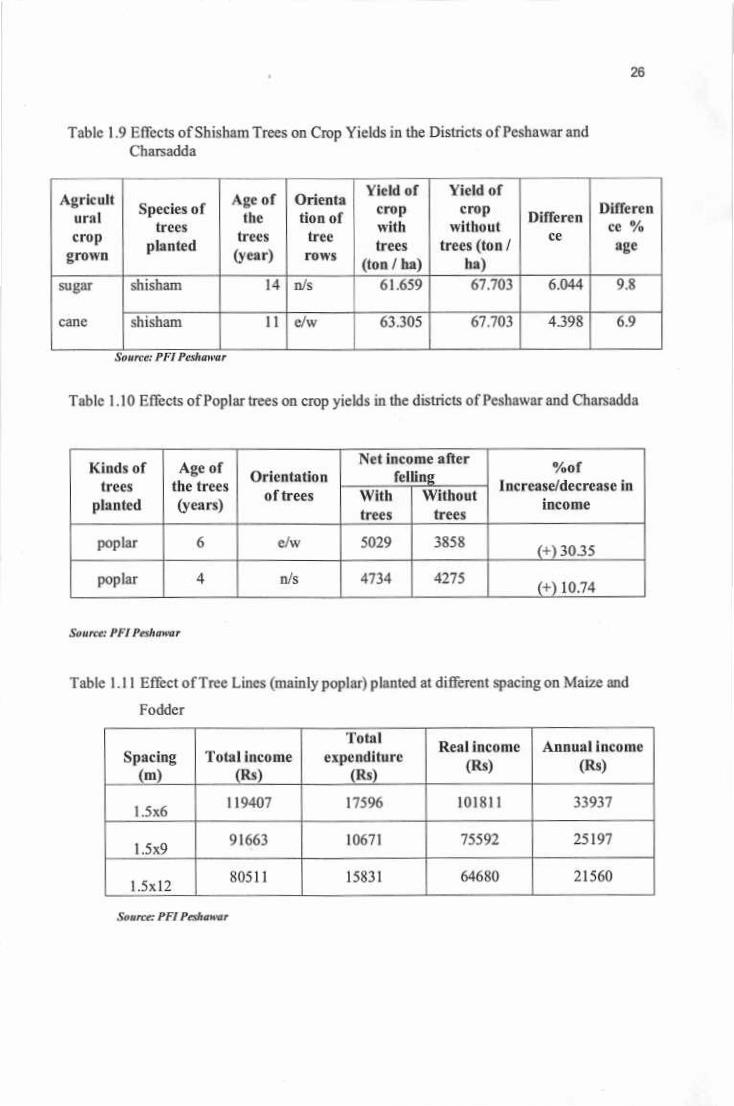
26
Table 1.9 Effects of Shisham Trees on Crop Yields in the Districts of Peshawar andCharsadda
Yield ofcrop
withouttrees (ton /
Yield ofcropwithtrees
Agriculturn Icrop
grown
Age of Orientation of
treerows
Species oftrees
planted
DifferenCC %
Differenthetrees ce
age(year)
ha)(ton / ha)
61.659 9.867703shisham 6.04414 n/ssugar
67703 4.398shisham 6.911 e/w 63.305cane
Source: PFI Pesiianur
Tabic 1.10 Effects of Poplar trees on crop yields in the districts of Peshawar and Charsadda
Net income afterfelling
%ofIncrease/decrease in
income
Kinds oftrees
planted
Age of
the trees(years)
Orientationof trees WithoutWith
trees trees
e/w 5029 3858poplar 6(+>30.35
4275poplar n/s 47344(+) 10.74
Source; PFIPeshawar
Tabic l.t l Effect of Tice Lines (mainly poplar) planted at different spacing on Mahte and
Fodder
Total
expenditureAnnual income
(Rs)Real income
Total incomeSpacingm)
(*) (Rs)(n0
101 K 1 1 33937119407 175961.5x6
251977559291663 1067)1.5x9
2156015831 64680805111.5x12
Source: PFI P&kmm

27
CHAPTER II
MATERIALS AND METHODS
2,1 MATERIALS
All media and solutions were prepared in glass-distilled water and autoclaved at
121°C at 15 Ib/inch2 for 15 minutes. Glassware was washed properly and oven dried
before use. All the chemicals used were of analytical grade.
Buffer Solutions for pH (Margesln era!.. 2005)Table 2.1
gm L'1No ComponentsCftHj>Q7tCtltit Arid)1 11.8060NaiHPQi,12HiOjScdjinn biphtuplumi)
10.94682
Distilled Water3 1000ml
Table 2.2 Standard solution of Sodium lOOOppm (Margcsin etal.. 2005)
gm L TNo Components2.5401 Na Cl
Distilled water 1000ml2
Table 2.3 Standard solution of Potassium Chloride 3M (Margcsin & aL 2005)
100 mf1No Componentsi 2220KCI
Distilled w ater 1000ml2
Standard solution of Calcium Chloride lOOOppm (Maigesin etai, 2005)Table 2.4
gm L"rComponentsNO3.65CaCh1
Distilled water 1000ml2
Table 2.5 Standard Phosphate solution
gm I/1No Components0.4394I KH2P04
(Potassnun di-hydrogen phosplinie)
ION 11 Cl 10 ml2Distilled water Up to
Volume2

28
Table 2.6 Phenolphthalein Indicators I % (Murgcsin eial, 2005)
100 mTComponentsNol.OgmfOOml
Phenolphthalein1Alcohol 50%2
Table 2.7 Methyl Orange 1% (Margcsin etal. 2005)
lOOmTComponentsNoMethyl Orange 1.0 gm1
100ml2 Distilled water
Table 2.8 NH4CI -NH4OH buffer solution (Margcsin eial. 2005)
ComponentsNo67JNH4Ct1570mlNtUOH21000Distilled water3
Table 2.9 Eriochrome Block- T (EBT) Indicators (Margcsin et al. 2005)
100 mr1ComponentsNoHOC,aH*N=NC,»HttOHXNOj)SOiNafEBT)_ 0.5 gmI
NHiOH H Cl( Hydronylarninc h ydrochtoride)
2 4.5 gm
100. ml3 95% ethanol
Table 2.10 EDTA (Verstnate): solution (Margcsin etal, 2005)
gm L'1ComponentsNo2.0Sodium EDTA
MgCli1
0.0521000ml3 H20
Table 2.11 Silver Nitrate solution
gm L'1ComponentsNoA&NOÿ1 5gm
Up tovolume
Distilled water2
Table 2.12 IN Potassium Dichromate solution
gm L1ComponentsNo2.00Up lo VolumeDistilled water2

29
Preparation of Di-phenyl amines Sulphonale IndicatorTable 2.13
100 ml1Sr.No ComponentsCnHiaNNaCÿS1 1.0Distilled water2 Up to Volume
Table 2.14 Perrous Ammonium SuJphates Solidion
gm L rComponentsSr.No
8.00FC(NH4HS04)26U20I
Up lo VolumeDistilled water2
Table 2.15 Sodium Hydroxide 4N (Maigcsin etaL. 2005)
gm 17ComponentsSr.No
160.0NiiOl 11I Distilled water Up to Volume2
Table 2.16 Digestion Mixtures (Murgcsin ei al.t 2005)
GmComponentsSr.No
10.00K;S041
1.00CuSO,5H,02
Selenium metal powder 1.003
Mixed in Mortar and pcslie
Table 2.17 Boric Acid 2% (Margesin et at.. 2005)
gm L?7Sr.No Components
H3BOi(Boric acid) 20.00
Up to volumeDistilled Water2
Table 2.18 Olsen (Sodium Bicarbonate 0.5 M pH 8.5)
gm l/rSr.No Components
42.00NallCO*1
Up to VolumeDistilled water2

30
Table 2.19 Sulfuric Acid 4M
gmL'1ComponentsSr.No
1 J E;S04 Concentrated 56ml
2 Distilled water Up to Volume
Table 2.20 Ammonium Molybodale 4% solutions
gmlOO mFSr.No Components
(NH4)6 MO7 024 4.001
Up to VolumeDistilled water2
Table No 2.2 1 Phosphorus Antimony Tartrate solutions (0.2%)
gm 100 ml'1ComponentsSr.No
KSBOC* Hi 0& 021L, 2 Distilled water Up to Volume
Ascorbic Acid Solutions (Margesin etaL 2005)Table 2.22
gm2f)Q ml1Sr.No Components
Ascorbic Acid (CÿIlsO*) 1.0561
Up to volumeMixed Reagcnt( Table 2.19)2
Table 2.23 Extracting Reagents (0.5 M NaHCOj, pH 8.5) (Margesin etai. 2005)
gm I?1Sr.No Components
NaHCO? 43.0 gm1
Distilled water Up to volume2
Adjusted the pH with 5N NaOH
Tabic 224 Calgon solution
gm L rSr.No Components
Sodi Sodium Hexamctaphosphate_
Distilled water
2.00I
Up to Volume2

31
Table 225 Sulfuric Acid 0.1M (Margesin etai, 2005)
100 ml 1Sr.No ComponentsH2SQ4(Conc.)1 3-4 dropsDistilled water
Prepared by titration with N/100 NaOH (Table 2.4)2 100ml
Table 2.26 Ammonium Puipurate Indicators (Margesin e/ a/., 2005)
gmlOO mfTSr.No Components
0.5Ammonium Purpurate{C,H1NÿOt)
1
100mlKIS042
Table 2.27 Mixed Indicators (Margesin etal. 2005}
200 ml*1ComponentsSr.No
020Bromocresol Green1
0.14Methyl Red2
Up to volumeLthanol (C2H5OH).3
Tabic 2.28 Phosphate stock solutions lOOppm (Margesin etal, 2005)
gm f. TComponentsSr.No
0.4394K HiPO,1
3.5 mlMCI cone.2
Distilled water Up to volume3
Mixed Regents (Ammonium Molybodate and Antimony PotassiumTartrate (Margiain ef a/.. 2005)
___Table 229
gm L1ComponentsSr.NoN1UMo7Q24 4HaO 61
0.1454CtUiKiOnShz. 3H2Q2500ml5 N lhS043Up to volumeDistilled water4
To be used in Table 2.20
Table 2JO Ammonium Sulfate
ComponentsSr.No5.00NH4SO41
I Up to Volume; Distilled water2

32
2.2 Methods
2.2.lSoil sampling
Soil samples were collected from a wide range of locations covering all ecological
zones. These samples were brought in plastic bags in the laboratory of Soil Survey
of Pakistan, Multan Road, Lahore. Soil samples were taken from various depths to
get a true picture of the profile.
2.2-2Soil Analysis
Samples were analyzed for particle size of sand, silt and clay and other soluble
nutrients like Carbonates, Bicarbonates, Sodium, Potassium, Sulfate, Calcium
Carbonates, Nitrogen, Phosphorous and Calcium plus Magnesium, Prepared the
soil extract by taking desirable amount of sieved soil in a beaker and added
distilled water gradually with constant stirring with spatula till a soil paste was
formed. The soil-water mixture was then consolidated and stirred again till it
confirmed to the requirement of saturated soil paste, namely, the paste glistens as it
reflected light, flew slowly and very slightly when the beaker was tipped, slide
freely and clearly of the spatula and finally that the free water did not appear on the
soil surface. Following analysis was done.
2-2-3pH Determination
The pH, or hydrogen ion concentration, [H*], in any environments have different
values which range between 0.5 in the most acidic soils to about lOi in the most
alkaline lakes, so the pH of soil is very important for the utilization of any
particular type of soil. The pH helps determine what kind of plants can grow in the
soil. Each soil has its own buffering property or acid neutralizing capacity (ANC),
which can be decreased with (lie addition of acidic compounds. Different studies
showed that the types of vegetation effect on the change of soil pH (Carter, 1993).
It is reported that a canopy species can decrease soil pH through four basic
processes i.c. with the increase of anions in soil solutions, quantity of acids
reaching the soil, degree of protonation of the stabilized soil acids and the strength
of soil acids. Most plants can grow in soil with a pH between 5.2-7.8. But some
plants prefer smaller ranges or more extreme conditions. The pH of soil is very

33
essentia! because soil solution carries in it nutrienis such as Nitrogen, Potassium,
and Phosphorus that plants require in precise quantities to grow, flourish, and fight
off diseases (Carter, 1993), For pH determination first of all saturated paste of the
soil sample was prepared. After the calibration of pH meter (Orion 720A+), with
standard buffer solutions of pH 9.00, 4.00 and 7.00 (Table 2.1), the pH was
determined (Margesin et ai., 2005).
2.2.4 Electrical Conductivity (EC)
The field-scale function of visible soil electrical conductivity (EC) to forestry has
its origin in the measurement of salinity of soil, which is an arid-zone trouble
associated with irrigated agricultural/forest land and with areas having low water
tables. Apparent soil electrical conductivity is influenced by a grouping of
physico-chemical properties including organic matter, soluble salts, bulk density,
clay content and mineralogy, soil water content, and soil temperature (Corwin and
Lcsch, 2005). The EC measurements have been used at field scales to map the
spatial deviation of several cdaphic properties: soil salinity, soil water content, clay
content or depth to clay-rich layers, , the depth of flood deposited sands, and
organic matter (Carter, 1993), In addition, EC has been used at field scales to
determine a variety of anthropogenic properties: leaching fraction, irrigation and
drainage patterns, and compaction patterns due to farm equipment (Carter, 1993).
For the determination of E.C, the extract of the saturated paste was taken and E.C
was measured with Electrical conductivity meter (Orion 145 A+). This meter was
also calibrated with K.C1 solution (Table 2,3) (Margesin et ai, 2005)
Soluble salts
2.2.5 Carbonate (Margesin et ai., 2005)
Five ml extract was taken for the determination of carbonate. One or two drops of
phenolphthalein indicator (Table 2.6) were used. The color turned to pink. The
extract was titrated against 0,0In H2SO4 till colorless end point obtained.
Carbonate mcq/l -volume of HC1 used x2N xIOOO
Volume of extract
N= Normality
2.2.6 Bi-Carbonate (HCOj) (Margesin etai.. 2005)

34
Five ml of the extract was taken and 3-4 drops of Methyl orange indicator (Table
2.7) were added to it. It was titrated against 0.1 H2SO4 till orange color appeared.
Bicarbonate meq/l 13 Volume of acid used for CO3 -Volume of acid used for HCO
= Nxl000 / volume of extract
If the sample was analyzed separately only for hco? then we used this formula also
Bicarbonate mcq/I ~ Volume of acid used for HCQi xl 000
Volume of extract
2.2.7 Calcium and Magnesium (Margcsin elal., 2005)
Five ml of the extract was taken than added 1-2 drops of buffer solution (Table
2.1) and 1-2 drops of Eriochrome black T indicator (Table 2.9). It was titrated
against 0.02N Versinate solution (Table 2.13). The end point was blue.
MeqofCa + Mg/1 = ml of Versinate used x Nxl000
Volume of the extract
1
N= Normality of Versinate
2.2,8 Chloride (Margesin ctai, 2005)
Two to three drops of Chromate were added in the 5ml of soil extract for the
determination of Chloride. The extract was titrated against 0.005N Silver nitrate
solution (Table 2.11) till brick red or reddish brown color appeared.
Chloride mg/1 = >L
Volume of the extract
2.2.9 Organic Matter
Trees obtain nutrients from two natural sources: organic matter and minerals.
Organic manor includes any plant or animal material that returns to the soil and
goes through the decomposition process. In addition to providing nutrients and
habitat to organisms living in the soil, organic matter also binds soil particles into
aggregates and improves the water holding capacity of soil. Most soils contain 2-
10 percent organic matter. However, even in small amounts, organic matter is very
important. (Bot and Bcnites, 2005).

35
One gram of the soil sample was taken in 300 ml titration flask. 10 ml of IN
Potassium dichromate solution (Table 2,12) and 20ml concentrated H2SO4 are
added. Allowed the solution to cool at least 40 minutes. After cooling, add 100-
200 ml of tap water, mix the solution, and allowed to stand for one hour. Then
added 10-15 drops of Diphenyl-Amine-Sulphonate indicator (Table 2.13) and 10
ml of Orthophosphoric acid are added and the sample is titrated against 0.5N
Ferrous Ammonium sulphate (Tabic 2.14) till sharp green end point obtained.
(Margesin et al., 2005)
Organic Matter % = ml of FAS fur blank - ml of FAS for sample x Nx0.69
Weight of sumple
FAS- Ferrous Ammonium sulphate
2.2.10 Calcium Carbonate (Margesin et al., 2005)
Five grams of the soil sample was taken in a plastic beaker of 500 ml capacity 100
ml of 0.5 NH4CI was added to the sample. Sample was shaken well and is left for
an hour. Then 20 ml from this volume was taken and put into 100 ml flask and
titrated it against 0.5 N NaOH (Table 2.15) till bluish end point appeared.
CaCOj% = (Blank reading-sample reading) x5
2.2.11 Nitrogen (Margesin el al., 2005)
Kjeldhal method was used to determine nitrogen. One gram of the sieved soil
sample was taken in a 100 ml Kjeldhal flask. 5*10 ml-distilled water was added.
After half an hour 2 gm of catalyst mixture (Table 2.16) was added and the flask
was placed on the digestion heater till dark color has turned to greenish blue. Flask
was cooled and digested mixture was transferred to 100 ml volumetric flask. 20 mlof 2% Boric acid (Table 2.17) solution was taken in the 100 ml titrated flask and
the flask was placed under the condenser of distillation assembly. 10 ml of the
diluted clear digest was added into the distillation assembly along with 5 ml of 40-
47% NaOH. Healed the assembly until 25 to 30 ml of liquid was distilled. This
liquid was titrated against 0.01 N HCL till pale lavender color appeared.
% Nitrogen = ml of HC1 for sample- ml of HC1 for blank x 14
Weight oftlie soil sample

36
2,2.12 Sodium (Margesin etal., 2005)
Sodium was determined by flame photometer. The stock solution of Sodium was
prepared by dissolving NaCl in distilled water, than a series of standard sodium
solutions (Table No 2.2) were prepared. Then 1, 2, 3, 4 & 5 ml from this stock
solution was taken and each diluted to one liter to get 1, 2, 3, 4 & 5 ppm of sodium
respectively, flame photometer was calibrated with the series of sodium solution
by adjusting the Galvano meter needle on zero with distilled water and 100 with 5
ppm solution. The test solution (saturation extract of soil) was subjected to the
flame photometer and the reading was noted. The flame photometer readings were
plotted against concentration from 1-5 ppm. From this graph the concentration of
the test solution was calculated.
Meq of Na/1= ppm / eq. wt of Na = ppm / 23
I Na+Ca mg/2SAR/
SAR - ESP from graph (ESP = Exchangeable Sodium Percentage)
2.2.13 Potassium (Margesin et al.,2005)
Potassium was measured in a similar way as sodium. The principle was the sameand the difference was only to use a different optical filter (Specific for Potassium)
to separate the specific radiation of potassium. Standard potassium solutions were
used (Table 2J). Then 1,3,5,7 and 10 ml from this stock solution were taken and
each diluted to one liter to get 1,3,5,7 and 10 ppm of potassium respectively. The
flame photometer was calibrated by adjusting the galvanometer needle
with distilled water and 100 with 10 ppm of potassium. A standard graph
prepared by plotting flame photometer reading against the potassium
concentrations.
The test solution was subjected to the flame photometer and reading was noted.
from the graph calculated the concentration of potassium in ppm by using the
following formula.
on zero
was

37
Meq of K/l = ppm / Eq. wt = ppm / 39
2.2.14 Sulphate (Margesin et al., 2005)
Sulphate cannot be detected by direct extraction but it can be calculated by
precipitation of the Barium Sulphate which can be estimated gravimetrically. This
can be also modified by Flame technique to estimate the amount of Barium left in
solution after adding a known excess. Sulphate was determined by
spectrophotometer. It was calculated by taking the difference in meq/L between
the sum of cat ions and sum of anions other than Sulphate.
Sulphate meqfl = ECc x I0J x 10 -sum of anions other than SO4
= ECex 103 x 10 (COji + HCOj+ Cl)
2.2.14 Phosphorus (Margesin et al., 2005)
Phosphorus is determined with spectrophotometer. The method is called Olsen
method. This method was developed in 1954 and uses the alkaline sodium
bicarbonate to extract soil phosphorus. This method is best in alkaline soils with
medium to high CEC levels and free lime or calcareous soils. This method has a
small result scale and does not at time accurately distinguish between high and
very high P levels. The Olsen solution (Table 2.18) was used for this purpose
along with 4M Sulphuric Acid (Table 2.19), Ammonium Molybodatc solution
(Table 2.20), Phosphorus Antimony Tartrate solution (Table 2.21) and Ascoibic
acid 1.75% (Table 2.22). All the prepared solution and distilled water were mixed
in the ratio 25 ml, 15 ml, 2,5 ml and 100 ml and Mixing reagent/ mixed indicator
(Table 2.27) is prepared in standard Phosphate solution (Table 2.5). Five gram of
soil sample was taken into 250 ml plastic bottle along with two blanks for control.
100 ml of extracting reagents (Table 2.23) was added to the sample and shaken for
about half an hour then the sample was filtered. Added 3 ml in each test tube of
standard series, with 3 ml of mixed reagent and allowed solution to stand for an
hour for color development. Absorbance was measured by spectrophotometer at
880 or 720 nm. Plotted a calibration graph of absorbance against P concentration
by using following formula.

38
P (ppm or mg/kg soil)- (a-b) x v/s x MCF
a= ppm p in sample extract
b - ppm p in blank
v = ml volume extracting solution added
s- air dry sample weight in gram
MCF-Moisture Corrections Factor (100+moisturc)/100
2.2.I5Textural analysis
Soil Texture, is the natural occurring group or cluster of soil particles in which the
forces holding the particles together are much stronger than the forces between
adjoining aggregates. Soil aggregation is the result of aggregate formation and
stabilization. The aggregates are mainly created by physical processes and
biological and chemical processes are mostly responsible for their stabilization
(Fayos et ai,, 2001), Fifty grams of the soil sample was taken into 500 ml plastic
beaker. 100 ml Calgon solution (Table 2.25) was added to the sample and sample
was left for 24 hours. After 24 hours each sample was shaken three minutes in the
mechanical shaker and was transferred to 1 000 ml cylinder and diluted its volume
to 1000 ml. The sample was shaken for 2.5 minutes and (he reading was recorded
at a 30 second interval (Margesin et ai, 2005; Bartlett et al.. 1994). The percentage
of sand silt and clay was calculated by using following diugrams.

39
100 0
90/Aio80, 20
70, 305-
40 %.v 60
*•\°50 Z_ 50
' |l< .40/ 60
\/30 sandyf -M70gpn
JF “ ¥AA
clay loam20/ \80m
f LMqn
0 100100 90 80 70 60 50 40 30 20 10 0
•/•SAND
LEGENDSandy Clay
Silty Clay
Silty City Loam
SIN Loam
[=]
Silt
Saw)
CZ3Loamy
Sandy Loam
Sandy Clay Loam I I
Fig. 2.1 Soil Classification Triangle based on the ISSS

40
23 Survey of Farm Plantations (FM)
In survey of Farm Plantations a number of accounts of the basic methods found in
literature (Sheikh, 1993) were adopted for the preparation of questionnaire, which
was also discussed with a few leading tree formers of the Punjab. The drafted
questionnaires contained social aspects of the tree farmers, demographic profile,
economic aspects and design of agroforestry. The requisite information was duly
recorded in two separate parts of the Perfotma in which Part A dealt with general
information such as site condition, species preference, patterns or design of planting,
source of the planting stock, number of plants planted, spacing adopted, the
agricultural crops raised along with trees and effect, if any on the yield of the
agricultural crops due to shade or competition for water and nutrients. In Part B the
nature of questions was a little different: farmer was asked about the number of
plants surviving; protection problems; insects or diseases whether he had carried out
any cultural operation etc. Did he gel any technical help from the Forest Department
to raise nursery or to plant trees and whether according to him growing trees in
conjunction with agriculture crops helped him economically and socially. The list of
Farm Plantations (FP) established throughout the Punjab by the Punjab Forest
Department under the World Bank aided forestry project named Punjab Forest
Sector Development Project (1996-2001) was consulted / prepared. These form
plantations were grouped according to ihe various agrocclogical zones of the Punjab.
The central region of the Punjab was preferred more than the north and south
regions. Following are the objectives oT the current survey that was earned out to
asses: number of farm plantations raised in Punjab; choice of species i.e. which
species are preferred; age of farm plantations; the pattem/dcsign of the form
plantations; The correlation between compact and linear plantation; the effect of
shade on the yield of the agriculture crops; the additional income generated through
agroforestry; the land tenure system; the spacing of trees planted on the farm;
problems the tree farmers foce regarding marketing and other related matters; the
trend of the farmers towards agroforeslry; the role of the Punjab forest department in
motivating the tree fanners; the nursery stock available for agroforeslry in foe public
and private nurseries; various tree diseases and pests seen in farm plantations; the

41
number of livestock grazing in farm plantations; extent of fodder provided by trees;the socio-economic impact; effects
improvement (Questionnaires Performs attached as Appendix !)ÿ
environment and biodiversity; soilon
Table 2.31 Showing the survey Farm Plantations in various districts
NO District FARM PLANTATION'S
1 Attock 26
2 Chakwal 10
3 Jhang 10
TobaTakc Sing4 12
5 Faisaiabad 12
6 Sheikhupura 19
Lahore 207
Gujranwala 108
10Hafuabad9
5Kasur10
411 Okara
6Sahiwal12
2513 Pakpattan
21Khancwal14
11Multan15
13Vehari16
13Muzaffargarh17
4Dera Ghazi KhanIS
5Bahawalpur19
21Rahim Yar Khan20
257Total

42
An initial survey was conducted during Januaiy 2004 to June 2004 to identify various
agro ecological zones of the Punjab and Farm Plantations (FP) were selected for
detailed interviews. Analysis of the surveyed plantations and their classification from
agroeclogical point of view was done during July 2004 to January 2005. More than
257 agroforesiers were interviewed. Data was collected by interviewing tree farmers
during detailed survey of various selected farm plantations falling under various
agroeclogical zone of the Punjab during January 2005. During the survey the author
and co-supervisor stayed in various villages where these farm plantations were
established. The field staff of the Punjab Forest Department also joined during the
interviews with the tree formers / agro farmers. Response rate has been about 95%.
The field staff that has been associated with trees on farm lands provided excellent
data and feedback. Various wood based industrialists, wood producers and wood
users were also interviewed.
The information gathered from the tree farmers was verified from the officials of the
Forest Department so that bias, if any, could be removed. Additionally, the farm
plantations were visited in the form of groups composed of the formers from various
districts to find out after discussion at site as to how for the tree plantation had
contributed towards poverty reduction / alleviation.
2.4 Soil Suitability / Capability Classification
Out of the parametric, subjective combinations and limiting condition methods for
land evaluation, the limiting condition method was followed to arrive at the final
suitability classification (Habarurema and Steiner 1997). The already soil survey
data collected through field surveys needed by Soil Survey of Pakistan, further
processing in a systematic way to identify the land utilization types. The current land
suitability for each soil mapping unit was derived through matching the land use
requirements of the relevant land use types with the land qualities of the respective
land mapping unit and for the limited soil mapping unit (s) the potential suitability
was also derived for the reclaimable unit(s).
These Maps include a brief description on physical environment of the areas
including location, climate, physiographic and general nature of soils, hydrology and

43
present land use.'natural vegetation (Chaudhary el al~, 1983). It is followed by
simplified tabular descriptions of various kinds of soils mapped in the area - the soil
mapping units, which arc then grouped on the basis of similarity with respect to their
adaptability and management requirements for specific tree species. The data was
described by land suitability mapping units. The distribution and extent of each
soil/land suitability mapping unit is indicated on the accompanying map of 'Soils and
Land Suitability' produced through GIS at a scale of 1:250,000. The above stated
maps 17 number were adjusted to meet the requirements of this work. These are listed
below:
1. Agroeclogicul /one III- A (Sandy Desert)
* Rahim Yar Khan
•Bahawalpur
•Bahawalnagar
2. Agrocclogical /one III- B (Sandy Desert)
* MuzafYargarh
•D. G. Khan
•Khushab•Mianwali
3. Agrocclogical /one IV- A (Northern irrigated Plains)
•Okara
•Sahrival
•Chichawatni
* Multan
•Khancwal
•Vehari
•Pakpattan
4. Agrocclogical /one V- (Barani)
•Attock
•Rawalpindi
•Chakwal
The information has been prepared for use by the personnel having no technical
background but only a limited knowledge about the soils who may consult only the
information given on ‘land suitability mapping units’ (grouped map delineations
given specific colors and represented by larger, italicized, Arabic numbers. These
mapping units are much fewer in number and are described in a rather generalized
form for easy comprehension. What the user of this information ought to do first is to

44
find out in which mapping unit his area or site of interest (farmland ) falls on (he
‘Soils and Land Suitability’ map. For that purpose, the map has been prepared in
paper color prints along with the related topographic map sheet. The transparent film
of the Soils and Land Suitability map should then be placed on the relevant part of the
topographic sheet so that the geographical features drawn on the former get exactly
superimposed on the latter. Farmer should then note the number and color of the
{soils or land suitability) mapping unit in which the area is located (llabarurema and
Sterner 1997).
2.5 Phyto'Sociological Analysis
The past decade has witnessed a proliferation of ecological (Clements 1904, Tensely,
1920, Vierec et a/,. 1992), mathematical, statistical approaches (Curtis and Mc-lntosh
1951; Whittaker, 1980; Kershew, 1964) to the organization of Phytosociologicai data
and subsequent classifications or ordination of data. For the choice of method for
describing and cataloguing the data pertinent to a particular problem the best method
may be taken to dial one which enables the maximum comprehension of structural
complexity of vegetation relative to the background environmental variables, in turn
relative to the amount of time input. Taking the fact into consideration the vegetation
data were analyzed by tabular comparison using the method of successive
approximation (Poor, 1955, Shimwell 1971, Vitt, 1995).
The data was collected by recording the cover-abundancc values of the 10 points
Domin scale (Table 2.33) of all plants within homogeneous plots positioned within
representative stands of the major vegetations types seen. In sampling, it was found
that for most situations Relev’es areas 2x2m was suitable; however Relev'cs of
smaller areas wherever appropriate were also taken. The minimal area determination
follows Shimwell 1971. Following procedure was adopted in the subsequent
tabulation of the vegetation data.
1) Aggregation of field data into tabular from and erection of differential tables
in the process described by Shimwell (1971) and Mueller and Heinz (1974).
2) Use of differential species and differential species groups to characterize
units.
3) Erection, differential and characterization of association,

45
Table No 2.32 Domin-iCrajina scale for %age cover
Ssÿÿ Dnmin-krJijina cover %
age Covercak
1 I any number, with complete cover IDO
0
2 9 any number with more than 3/4 but 75
less than complete cover
3 K any number, with 1 H -3/4 cover 50-75
4 7 any number, with 1/3 -1/2 cover 33-50
5 6 any number, with 1/4 -1 /3 cover 25-33
6 5 any number, with 1/10 -1/4 cover 10-25
7 4 any number, with 1/20-1/JO cover 5-10
8 3 scattered with cover under 1/20 [-5
9 2 very scattered, with small cover 1
10 1 seldom with insignificant cover
II solitary, with insignificant cover+

46
Sub associations, Variants and Noda on basis ofover-all floristic similarly; character
species of high constancy fidelity and dominance.
a) Name of associations, sub-associations and variant according to code of
Phytosociological nomenclature (Barkman ef a/.,1976).
b) Classification of association into higher units using the Zurich-Montpclier
school of hierarchical classification
c) Checking and correlating the ecological reality of the units extracted in the
field to major environmental gradients
d) Investigation of similar pattern in other localities, thereby obtaining an overall
pattern of variation within particular vegetation types.
This method will provide an overall syntaxanomy of the farm plantations. The
construction of differential table is the basis of this method. Differential table
showed the differential species and differential species groups stored into blocks and
separated from other species which were listed from high to low constancy, other
species were companions and showed a low degree of association with the
differential species.
2.6 Data compilation, processing and Statistical Analysis
Data analysis followed several specific steps:
> Coding, in which verbal responses; written answers or accumulated record are
converted to numbers;
> Data entry, in which coded data are entered directly into computer files;
> Descriptive analysis, in which the researcher examines frequency distributions
for individual variables;
> Cross-tabulation, in which relationships between variables are examined; and
> Index construction, scaling, and multivariate analysis, in which more complex
relationship among variables are dealt with.
> The data was processed in Excel programme and was sorted out to get correct
picture about: the species preference; pattern/1 design of the plantations; age
groups of the plantations; age at which the trees were harvested; method of sale;
47
income generated; agriculture crop depression due the trees; land tenure system
in vogue
Data compilation involved the coding of data and entry on computer through SPSS
{Statistical Package for Social Scientists) Version 1 1.0 for MS Windows. Because data
lor extent of tree growing did not follow a norma I distribution* to test difference between
numbers of farm plantations hold across categories of independent variables, Jtm&kal-
Wallis2 test was applied for independent variables with more than two categories. The
chi-square test of independence was used to examine the association between pairs of
categorical variables. A critical significance level of 5% was adopted for association
between independent variables and extent of tree growing.
i. The Mann-Whitney stat ist ic has been denoted by Z,
it. The Kniskai-Wallis statistic has been denoted by KW.

48
CHAPTER III
SURVEY OF FARM PLANTATIONS
Anyone on tour to the Punjab province will find many trees on private farms as
boundary markers, shade trees and in breakers. It would also be dearly visible that
many more could be accommodated in between. Despite the unscientific and
unplanned planting on farmlands, the private farmland plantations are currently
contributing four times as much of the timber and nine times as much of the fuel
wood that are being produced by state forests (Sheikh et al., 2000a). It is very
unfortunate that enough resources arc not being devoted to support farm forestry to
the level warranted by its potential importance as a productive resource and the basis
of secondary enterprise for the farmers growing agricultural crops. Such farmland
plantations deserve much more attention and resource allocation by the Forest
Department than for growing of trees in a scientific manner (Hafeez, 1998).
Based on physiography, climate and ecology, Roberts (Roberts, 1977) divided
Pakistan into nine major ecological or vegetative zones, which he further sub¬
divided into 18 habitat types an arrangement followed by Khan (1989) and Hussain
et al., 2003 for the development of Protected Areas System in terms of
representative ecotypes, The Pakistan Agriculture Research Council (Anon, 1980)
has divided the country into ten broad based agio-ecological zones on the basis of
several factors such as physiography, ecology, climate, soil, agricultural land use,
water availability and ground water (Fig 3.1).
3.1 Criteria for Division into Agroecological zone
Some criteria arc quantitative such as percentage of vegetation cover in a particular
ecological zone, that is, land available for timber production, total growing stock, its
level of productivity, density of woody vegetation that can safeguard soil from
erosion and provide refuge to the natural fauna etc. There are other criteria which are
qualitative or descriptive only, such as those relating to the role of the trees in the
optimal land use of the tract, supply of wide range of products and services critical
for the welfare of local population, social needs of the surrounding communities that
influence the existence of the trees and utilization of the forest produce, the level and
quality of people’s participation, etc (Kitalyi et al, 2004).

49
NAGRO ECOLOGICAL REGIONSPAKISTAN A
VII
/
IVb
Vy
'V
nib
LEGENDmdwiMtiSouthern Irrigated Plain
Sandy Desert (A)
Sandy Desert (B)
Nodharn tmgat*d Plain
IVbi Northern Irrigated Plain
Ilia
1
«t Northern Dry MountainsVB Western Dry Mountain*
IX Dry Western Plateau
rcftCaunot
Ph D Work Of Syed M AkmaJ RahimSodo Ecological Impact of Agnjfonatry in Punjab Botany Department Univanity of the Punjab, Lahore
Fig.3,1 Agroeclogical Zones of Pakistan

50
Based on the above considerations, the following criteria have been used for the selection
of the representative zones: climatic and cdaphic considerations physiography and
ecology; extent of forest and agricultural resources in each zone; site specificity: water
logging, salinity, commanded and un-commanded area and other landforms; the level of
biological diversity, socio-economic needs of the communities living in the zone; their
agricultural practices and soil fertility. The socio-cultural status of the communities (that
is, the adequacy or otherwise of irrigation water) include sub soil water and the degree of
similarity and comparability (Fig 3.1). This follows the five broad based agro-ecoiogical
zones of Punjab where the study has been conducted.
3.1.1 Zone I - Indus Delta: Covering districts of Thalia, Badin and Hyderabad with arid
tropical marine climate and clayey and silty soils. The mean daily maximum temperature
in summer ranges from 34-40°C and the mean winter temperature ranges between 19.0
and 20.0“C, with cold spells, which are not frequent. Summer and winter rainfall
averages 75 and 5 mm respectively.
3.1*2 Zone II- Southern Irrigated Plains: Includes lower Indus basin covering about
12 districts of the province of Sindh with arid sub-tropical climate, and silty and sandy
loam soils in the upper part. In the rest of the region, soil texture is almost the same but
has saline patches. It is sub-divided into northern and southern regions. The northern
region lias mean monthly maximum temperature rising to 50°C and the mean minimum
temperature in winter going down to about 8.5°C. The mean monthly rainfall is about 16-
20 mm in summer. The southern region is also hot in summer and cold in winter. The
mean monthly rainfall in summer (July, August and September) is slightly more than the
northern region, about 45-55 mm. The winter season is practically dry.
3.1J Zone III: (a & b) - Sandy Desert: (a). Besides some areas of Sindh it includes
quite a few districts of the Punjab. This region is characterized by sand ridges in the Thai
and Cholistan deserts having arid sub-tropical climate. In summer, the mean daily
maximum temperature ranges from 39 to 41°C. In winter, the mean daily minimum
temperature is about 7°C. The mean monthly summer rainfall varies from 32 mm in the
south to 38 mm in the north. Winter is practically rainless.
(b). There are various forms of sand ridges and dunes with arid to semi arid-sub-tropical
continental type of climate. The mean daily maximum temperature is approximately

51
40°C, The region, in general experiences occasional frost. The mean annual rainfall is
ISO to 350 mm, increasing from south to north.
3.1.4 Zone IV (a & b) - .Northern Irrigated Plains: (a) The region covers the area
between Sutlej and Jhclum rivers and spans about 14 districts of central Punjab, the most
fertile tract of the province. The climate in Eastern half is semi-arid sub-tropical
continental. The soils of the region arc sandy loam to clayey loom. The mean daily
maximum temperature in summer is 4M20C, while the mean monthly highest maximum
temperature during the same period is about 46°C. In winter, the mean daily minimum
temperature is 4-5°C with occasional cold spells when the mean monthly lowest
minimum temperature may go down to |.9°C. The mean monthly rainfall both in summer
and winter is as low as 30 mm. The mean annual rainfall is 200-300 mm,
(b) It covers saucer shaped alluvial valley of Peshawar and Mardan districts and has
semi-arid steppe sub-tropical continental climate. The soils are silty day to silly clay
loam. The mean daily maximum temperature is about 38*XT. In winter, the mean daily
minimum temperature is about 5°C wilh occasional cold spells when the mean monthly
lowest minimum temperature falls to l.4°C. Frost is common. The mean monthly rainfall
ranges from 29 to 32 mm both in winter and summer seasons.
3.1.5 Zone V - ttanmi (Rain Ted) Lands: The salt rang’d, Polhwar plateau and
Himalayan piedmont plains form this region. Climatically, a small narrow belt lying
along the mountains is nearly humid whereas in the southern pan, it is semi-arid and hot.
The narrow belt has the summer mean daily maximum lempenature of about 38°C with
frequent cold spells. The mean monthly rainfell is approximately 200 mm in summer and
36-50 mm in winter (December- February).
3.1.6 Zone VI - Wet Mountains: The zone covers Hazara and Rawalpindi divisions. It
is characterized by a scries of mountain ranges wilh undifferentiated type of ciimatc and
soil texture ranging from silty loam to silty day. In summer the mean daily maximum
temperature is about 35°C. In winter, the mean daily minimum temperature is 0-4°C,
with occasional prolonged cold spells. The tops of the mountains are generally covered
wilh snow during winter. The mean monthly rainfall in summer is 236 mm and in winter
116 mm.
3,1,7 Zone VII - Northern Dry Mountains: The region comprises high mountain areas
of ChitraJ, Dir, Swat and Agencies with undifferentiated climate and deep clayey soiJs
funned in alluvial material accumulated on lower parts of mountain slopes and alluvial

52
deposits in narrow valleys. In winter, the mean daily minimum temperature varies from
1°C to minus 6°C in the valleys going as low as - 13°C. The mean monthly rainfall
ranges from 25-75 mm in winter and increases to 50-100 mm in the spring. In summer, it
varies from 10-20 mm. The tops of high mountains are covered with snow generally for
the greater part of the year.
3,1,8 Zone VI11- Western dry Mountains; It lies to the south of Safed Koh and to the
west of Indus comprising plateaus and high mountains of Khyber Pakhtunkhwa (NWFP)
and Baluchistan with undifferentiated climate and deep and loamy calcareous soil in the
valleys. In the southern region, the mean monthly rainfall is summer varies from 5-15
mm increasing from 45 to 95 mm in the northern region. However, in winter the mean
monthly rainfall is 30-35 mm in the whole region. In summer, the mean daily maximum
temperature varies from 30-39 °C. In winter the mean daily minimum temperature varies
from minus 3°C to plus 7.7 aC. The winter is cold with mean daily minimum temperature
around minus 0.2 X with frequent cold spells when the mean monthly lowest minimum
temperature drops to minus 5X. The mean monthly rainfall in summer is about 95 mm
whereas in winter it is 63-9S mm.
3.1.9 Zone IX - Dry Western Plateau; The region comprises parts of Sindh and
mountainous areas of Baluchistan with intermountain basins and plateaus as well as the
coastal belt The region has arid (desert) tropical type of climate with constantly dry
season, and deep strongly calcareous silty loam soils in the plains. In summer, the mean
daily maximum temperature varies from 40.5 X to 33-34 X. In winter, the mean daily
minimum temperature is 3-6 X in the north and 11.5 to I5X along the coast. The
northern region receives occasional cold spells, when the mean monthly lowest
temperature falls from minus 1.5 to minus 4X.
The mean monthly rainfall in summer is extremely meager (2-4 mm) in the greater part
of the zone except in die extreme southeast where it is about 36-37 mm. In winter, the
mean monthly rainfall is 9 mm to 1 1 mm.
3.1.10 Zone X - Suleiman Piedmont: It comprises the piedmont plains of Sulaiman
range including parts of D.G. Khan. D. I Khan and Kachi, sloping towards the Indus
River. The climate of this region is arid and hot; sub-tropical continental. The mean daily
maximum temperature in summer is 40-43 X and the mean monthly highest maximum
temperature ranges from 45.7 to 48 X. In winter, the mean daily minimum temperature
varies from 5,8 to 7.7 X with occasional frost in winter. This zone being on the other

53
side of the mountains, the mean monthly rainfall in winter is about 13 mm, whereas in
summer it is about 21-38 mm. The irrigated plantations of the Punjab fall only in three
agro-ccological zones which arc described as under A map showing (Fig 3.2) the
location of various plantations in different ecological zones is given at map of three agro-
ccological zones.
3.2 Agro Ecological Zones of the Punjab
Punjab where the study has been conducted could be divided the following three agro-
ecological zones.
32.1 Agro ecological Zone Ill-A -Sandy Deserts
Apart from certain districts of Sindh, this region covers districts of Rahim Yar JChan,
Bahawalpur, BaJiawalnagar and the Chotisian desert. This region is characterized by
elongated NE-SW oriented sand ridges formed by eolian (pertaining to wind) agencies.
The area is considerably higher in level than the adjoining Indus plain. Morphologically,
the length of dunes is 6 to 8 times more than the width. They range in height from 8 to 10
m. The entire sandy tract is spotted with xcrophytic vegetation. The intcrdunal areas in
many places are devoid of sand. During the rainy season the runoff from the adjoining
dunes collects in the central parts ihat provide enough moisture to support some scanty
agriculture in the southern parts of the region. In some places wells have been sunk
several hundred feet deep but the water is hardly sufficient to support even the cattle and
human population’s drinking water requirements. The sand deposit is about hundred
meters thick, with a few lime-cemented luyers, each layer being a meter or less in
thickness.
The climate is arid (desert) sub-tropical with very hot summer and mild winter. The mean
daily summer maximum temperature ranges from 39 to 41°C and the mean monthly
highest maximum temperature is about 43 to 45°C. In winter, the mean temperature is
about 7°C, with the mean monthly lowest temperature falling to 2.5°C. The rainfall varies
from 150 mm to 200 mm. The winter is practically rainless.
Being a sandy tract, this zone is characterized by sandy soils and moving sand dunes. The
land surface is undulating. The sand ridges are sufficiently stable due to the presence of
low bushes, which have produced calcareous friable soils. The valleys between the ridges
have sandy loam soils but they cover only a very small proportion of the total area. The

54
clayey soils are saline over half of the area. They are generally calcareous having weak
crumb structure.
The original tree vegetation consists of Prosopis cineraria. Sahadora oieoides. Tamarix
aphyila and Tecoma unduiaia. The shrubs include Calligonum polygonoides, Calotropis
procera, Satsoia foetida and Haloxylon spp. Major grass species include Cymbopogon
javarancusa and Pennisetum dh’isum. Vegetation is sparse, Lopped heavily for fuel,
fodder and hutments.
Mainland use of this region is gracing of sheep, goats, camels and cattle. In the southern
part, guar and millets are important crops, which are grown in years of favorable rainfall.
In the southeastern part of the region, where rainfall is about 300 mm, wheat is an
important crop on loamy soils and castor on sandy loam soils, Where canal water is
available agricultural crop like wheat, sugar cane, cotton and oil seeds are grown. Citrus
and mango orchards have also been established. Following tree species which are suitable
for planting in this zone
Local nameBotanical name
BabulKola sins
Sufed sinsNeemSufedaJandLahuraShishamJangle jalebaSimalDhrekMango
Acacia niloticaAlbizzia lebbeckAlbizzia proceraAzadirachta indicaEucalyptus camaldulenstsProsopis cinerariaTecoma unduiataDalbergia sissoo
Pithecobbium dulceBombax ceilxtKfelia azedarachMangifera indica
3.2.2 Agm ecological Zone I ll-B-Sandy Deserts
This region covers the districts of Muzaffergarh, Mianwali, Bhakkar, Khushab and
Layyah with various forms of sand ridges and dunes including, longitudinal, transverse
sand sheets. At places silly and clayey deposits occur in narrow strips. The sand ridges
are 5 to 15 meters high. Between the sand ridges, there are hollows where runoff water
collects after the rain. In the central parts of the desert, large elongated channels and their

55
alignment suggest that they were formerly occupied by the shifting courses of river Indus,
The desert is quite profusely dotted with vegetation comprising dwarf trees.
The climate is arid to semi-arid sub-tropical continental. The mean daily summer
maximum temperature is approximately 40°C, with the mean monthly highest maximum
temperature going up to 45.6°C. In winter, mean daily minimum temperalurc is 5.5 °C
with the mean monthly lowest minimum temperature occasionally lading to 13°C. The
region, in general experiences occasional frost. The mean annual rainfall is 150 to 350
mm, increasing from south to north.
The hollows between the sand ridges have sandy loams and loams which account for
about 10 percent of the total area. However, in the southwestern part of the tract, the
proportion of loamy soils increases. All the soils are moderately calcareous and have low
organic matter content (about 0.4 percent) In addition, there are some narrow strips of
silty and clayey soils which are moderately to strongly calcareous and are locally saline-
sodic,
The original vegetation consists of trees such as Acacia nilotica, Prosopis cineraria,
Salvadora oleoides, Tamarix aphyila and shrnbs like Cailigomtm polygonoides, Tamarix
dioca, and Caiotropis procera, Zizyphus mtmmuiaria which has been heavily damaged
due to indiscriminate grazing and on account of conversion of land to agriculture. The
grass cover includes Eleusine compressa, Lasirus hirsutus, Saccharum banglease and
Panicum antidotale.
The predominant land use of the area is grazing of livestock (goats, sheep, camels and
cattle). The northern part of the region, with a rainfall of 300 to 350 mm, is used for dry
farming mainly gram and wheat, In the irrigated areas, cotton, sugarcane, guar, millets
and wheat arc grown. Citrus and mango arc common fruit trees. Following Tree species
which are suitable for planting in this zone:
Local nameBotanical namePliulaiBabulKala sirisSufed sirisNimMachnarSima!ShishamSiilbda
Acacia modestaAcacia niloticaA ibizzia lebbeckAlbizxia proceraAzadirachta indicaBauliinia purpureaBombax ceibaDalbergia sissooEucalyptus camaldulensis

56
E. microthecaE. tereticomisMangifera indicaMelia aiedarachMorus albaProsopis cinerariaTamarix aphyllaTecoma undulataZizyphus mauritiana
SufedaSufedaMango, aamBakainTutJandFarashLahuraBer
3.2.4 Agro ecological Zone IV-A - Northern Irrigated Plains
Districts of Sahiwal, Lahore, Kasur, Okara, Faisalabad, Jhang, and pan of Multan, Gujrat,
Shcikhupura and Gujranwala arc covered by this region. The land lying between Sutlej
and Jhelum rivers comprising the Rcchna, Chaj and Bari Doabs is the most important
area of the country from agricultural point of view. The Doabs have a relatively fiat
surface although there are some remnants of old river channels as welL Small and
scattered sand dunes occur at places in the southern part of these Doabs. A number of
Precambrian hillocks emerge in the plains at Shahkot, Sarghodha, Sangla Hills and
between Chiniol and Rabwah.
The climate can be divided into two parts. The northeastern half has semi-arid (steppe)
sub-tropical continental type of climate where the mean daily maximum temperature in
summer is 39.5 °C and the mean monthly highest maximum temperature is 45°C. In
winter, the mean daily minimum temperature is 6.2°C with occasional cold spells when
the mean monthly lowest minimum temperature falls down to 2 °C. The mean annual
rainfall ranges from 300 to 500 mm in the north.
The southwestern portion of zone IV (a) has arid sub-tropical continental climate. The
mean daily maximum temperature in summer is 4142°C, while the mean monthly
highest maximum temperature during the same period is about 469C. In winter, the daily
minimum temperature is 6°C with occasional cold spells when the mean monthly lowest
minimum temperature goes down to 1,9°C. The mean annual rainfall is 200 to 300 mm.
The soils in this zone are sandy loam to clayey loam. Along the rivers narrow strips of
new alluvium are deposited during the rainy season when the rivers arc in-spate. In the
southern and central parts of this region, the dominating soils are calcareous silty loams
with weak structure, whereas clayey soils also occur in patches to a minor extent. The
soils are deep, having 0.4 to 0.6 percent organic matters with pH around 82. They have

57
weak structure but good porosity and permeability. Saline sodic soils, occupy about 15
percent of the cultivated area.
In the northern part of the region dominant soils are loam and day loam with weak
structure, the clayey soils are also quite important, as they cover about 40 percent of the
area. The loamy soils (loams and clay loams) occur on high areas and are well drained.
The clayey soils occupy tow-lying land of basins and channel in fills, Saline-sodic soils
are quite extensive in some local areas. Soils are mostly non-calcareous in the Northern
part but calcareous in the central and southern parts.
The original vegetation consists of trees such as Acacia modesta, A. nilotica, Prosopis
cineraria. Tamarix aphylla. Zizyphus spp. and shrubs like Calligonum . Suedafruticasa.Rhazya stricta, Acacia jacquemontit etc. These are lopped for fodder, fuel, and
construction of hutments in the villages. The major grass species are Eleusine. Lasturns.
Panicum, Cymbopogan andSaccharum bengalense.
The main land use in this region is agriculture based on canal irrigation. In the northern
part rice, wheat and berseem are the main crops on clayey soils and millets, sugarcane,
melons and, oilseeds on loamy soils. In the central and southern parts, the main crops arc
cotton, sugarcane, maize and wheat. Fruit orchards of citrus and mango are also
important, especially in the central part of the zone. Tree species, which can be planted in
this zone.
Local name
PhulaiBabulKala sinsSufcd sinsNimKachnarKachnarShishamSimalBansSufcdaSufedaSutcdaMango, aamBakainWhite poplarHybrid poplar
Botanical nameAcacia modesta
Acacia niloticaAlbizzia lebbeckAlbizzia proceraAzadirachta indicaBauhinia purpureaBaubinia variegateOalbergia sissooBombax ceibaDendrocalamus strictusEucalyptus camaldulensisEucalyptus microthecaEucalyptus terettcornisMangifera indicaMelia azedaracbPopulus deltoidsPopulus euramericana

58
Prosopis cinerariaSyzygium cuminiiSalLX sppTamarix aphyllaTecoma undnlata
JandJama11
WillowFarashLahura
Field survey is the most common and widely used tool for collecting primary data for
social science studies. There arc two main types of survey methods interviews and the
Questionnaires. Fach method includes a number of subtypes. For example, interviews
may be conducted in group sittings, by telephone, or in a face to face private gel together
between the interviewer and the respondent. The interview may be highly structured, with
specific questions to be asked of all respondents, or it may be so unstructured that it
resembles a conversation between friends rather than an episode of data collection. In this
case, data collection by interview was preferred .
3J Study Area
The Punjab province (Fig 2) is extremely deficient in forest resources with only 2.08% of
the total area under productive forest cover. The province happens to be the most
populous of ail the provinces of Pakistan (Sheikh et ai, 2000). With consiant increase in
demand of food grains for the fast growing population, more areas cannot be spared for
raising forest plantations. One of the options is to raise trees along with agricultural crops
on the same piece of land called agro forestry. Agro forestry as land use is a collective
name for the practices where woody perennials (trees, shrubs, palms, bamboos etc) are
deliberately used on the same land management unit as agricultural crops and/or animals
or both, either in some form of spatial arrangement or temporal sequence often for
maximum net return from this joint production system (Khan, 1989), The farmers in
irrigated areas are already practicing agio forestry in some form to supplement fuel wood
and timber production of the province thereby increasing their own personal total farm
income (Ahmad, 1998). They have been practicing different models and patterns of agro
forestry systems in a haphazard way,
According to Forest Sector Master Plan (FSMP, 1992), farmers have already planted
134,000 ha equivalent of trees on agriculture lands. Although it is apparently a large area
but it is only one percent of the total agricultural land. Growing trees on form lands in a
scientific design and pattern could increase wood production several times without
affecting agricultural production. In fact trees would add agriculture production by
rehabilitating some of the 250,000 ha of water logged soil and over 450,000 ha of the

59
slightly saline soil in the irrigated parts of the Punjab with site specific species. This
would bring these areas, back into production while also doubling or tripling fuel wood
and timber production on farms (Anon, 1980). Before reviewing the agroforestry systems
practiced in different zones, general geographical features of the Punjab as a whole, land
use pattern, administrative and agro-ecological zones, vegetation types etc, are briefly
described in this chapter. So far, these systems have not been properly documented
(Sheikh, 2000). The geographical features of the Punjab as a whole, land use pattern,
administrative and agro-ecological zones, vegetation types, etc are explained under;
3.3.1 Location and Extent
The province of Punjab lies between 27°42’ to 34°02 north latitudes and 69°18’ to 75°23’
east longitudes. Its total geographical area approximates 20.63 million hectares, h is
surrounded by the provinces of Khyber Pakhtunkhwa (NWFP) and Balochistan on the
north and west, the province of Sindh in the south and India on the east. Lengthwise, it
extends to about 1,078 km from north to south and widthwise, to 616 km from east to
west (Hussain et al., 2003).
33.1Population
Of all the provinces, the Punjab is the most populous with 7432 million people
inhabiting it. About 70% of the population lives in villages, mostly dependent upon
agriculture for their livelihood. Literacy rate is less than 30% (Economic Survey of
Pakistan, 2006 - 2007).
33.3 Topography
The land forms consist of almost leveled alluvial plains except Salt Range which elevates
lixitn 500 - 1 000 m and is the dividing line between southern plains and northern plateau
of Pothohar which on average has 450 m altitude. The southern alluvial plains of
Bahawatpur lie at the minimum altitude of!50 m above sea leveL, whereas Patriaia hills
(Murree) arc perched at the highest altitude of 2500 m (Hafeez, 1998).
33.4 Soils
Two types of soils are encountered in the province: (i) old alluvial soils which are highly
fertile plains, irrigated through a world famous canal system as well as gullied, ravined
and dissected Barani lands of Pothohar plateau which arc deep and relatively fertile and
(li) sandy deserts of Thai and Choiistan covering about 20% of the province’s land mass.
These arc unstable due to windblown sands and are calcareous and infertile in nature
(Soil Survey of Pakistan Report, 2005).

60
AGRO FARM PLANTATIONS SURVEYED,COLLECTION OF SOIL SAMPLES AND
SOIL SUfTABILITY CLASSIFICATION MAPS IN PUNJAB(STUDY AREAS)
N
AisiAM«y0
fl
km i
• m
Ml«!
*•f
•T
Sf-T+vr4 •••/ *
y 4rv4 •
um*> Q t *
RjflWiW y
LEGEND
T Shfcham
4 Eucalyptus
•Other*(Klkar,Fnish etc)
Classified areas forSoils and Land Suitability
River
Pti 0 Worti of Sjÿd M Aknwl Rshimflouny Q»pftmam. Ur>tv«f*rty Of tty F>un}«fa. UhOf».
Fig 3.1 Map Showing the Study area for Survey of Farm Plantations in Punjab

61
33,5 Climate
Climatically, Punjab falls in three zones on the basis of rainfall such os: (i) arid deserts of
Thai and Cholistan with 300 mm below annual rainfall, (ii) semi arid areas of southern
Punjab and Pothohar with 300 - 600 mm rainfall and (iii) dry subtropical tract of central
and north Punjab and Salt Range with annual rainfall ranging from 600 - 1200 mm,
Temperatures in summer may exceed 50°C at certain places. In winter, few areas
experience frost for a short period, while rains in monsoon form the bulk, that is, two
third of the total rainfall. The rest of the rain falls in winter season. Moreover, the
southern part experiences less rainfall (Hussain etal., 2003).
33.6 Land and its use
Agriculture is the major land use in the Punjab, cultivated area being 12 million ha or
58.46%of the total land area. A sizeable area of 7.15 m ha is termed as wild land which
has some potential for production other than agriculture. Out of this 0.57 m ha are under
the control of the Forest Department for management as Range Lands. Per capita
availability of cultivated area is 0.16 ha while the forest area per person is only 0.009 ha
as compared to world average of one ha per capita. It shows high population density for a
scarce resource (Sheikh eta!., 2000b).
The province of the Punjab has highly diversified landscape and environment. Extensive
Old River terraces, recent and sub recent river plains, piedmont plains and sandy deserts
with sand dunes of different heights and shapes are the major land forms where variations
in soil forming fectors have given rise to a variety of soils. Large areas have also become
water logged and saline due to seepage from canals with high rate of evaporation leaving
whitish salt deposits over the surface (Shamsi et a 1994). The latter types of soils
permit only a specific type of vegetation (Halophytes) to grow and survive. Table 3.1
shows land use pattern of Punjab province.
Land use is differentiated by three-categories i.c. canal irrigated plains, Barani (rain fed)
areas and sandy areas of Cholistan and Thai deserts. Cotton (Gossypium spp.). Rice
(Oryza saliva). Sugarcane (Saccharum ojftcinarum). Maize (Zea mays), Wheat (Triticum
aestivum). Sunflower (Helianthus annus) and Potatoes (Solatium tuberosum) are the main
agricultural crops of canal irrigated plains with fruit production of citrus (Citrus
aurmtijblta). Mango (Mangifera indica), Guava (Psidium guajava). Date palm (Phoenix
dactylifera). Lichi (Litchi ehinensis), Jaman (Syzygium cuminii) and Anar (Punica
granatum),

62
Table 3.1 Land use pattern of Punjab
S.NO Land use class Area (000 ha ) Percentage
I. Forests / Trees 626 3.06
Conifers 72 1137
Scrubs 340 53.71
Riverine 8.0651
Irrigated Plantations 149 2334
Linear Plantations 14 332
Agriculture2 12059 58.46
89.08Irrigated 10743
10.921316Rain fed
5734 27.80Range Lands3
8.071661Barren Lands (Desert rocks)4
477 231Water bodies ( Rivers , lakes ,Dams , Reservoirs)
5
03062Urban Lands6
10020619All land classes
Source; Forestry sector in the Punjab at a glance (Design of management plan Change Manga
(Sheikh etaL 2000)

63
Vegetables and lentils (Lens esculenia) are also grown. Raising forest trees along with
agricultural crops is an old practice that remains popular with the farmers. The farmers
are raising agricultural crops with trees (agroforestry) and fruit gardens (Agri-
horticullure), in the form of row plantings, m wood lots and as windbreaks (Sheikh etal.,
2000a).
In Barani (rain fed) areas of Pothohar, the main agriculture crops are wheat, maize,
millets (Pennisetum spp.), lentils, pulses. Recently groundnut (Arachis hypogaea) is
gaining importance as a cash crop. Occasionally with tube well inigation facilities as in
Hazro, tobacco (Nicotiano tabacum), sugarcane and vegetables are also grown. The lands
not fit for cultivation arc being brought under tree culture, which is supplementing
fanner's income. The gullies, undulating and barren areas are used as grazing lands with
some fodder trees coming up naturally (Sheikh et at., 2QQ0b).
In sandy areas of Thai and Cholislan, favored agricultural crops are gram (Cicer
arictinum) and Jawar - Bajra (Pennisetum glaucum). Where moisture is available other
agricultural crops like millets, lentils, and pulses are raised. Forest trees are raised in the
form of shelterbelts and windbreaks along the boundaries of fields to protect their
agricultural crops and fruit trees from wind erosion and stabilizing the sand dunes.
Scattered xerophytic trees are also found. Grazing is the main source of livelihood
(Ahmad, 1998).
3.4 Data collection and analysts
Survey has been widely used in Pakistan in the past to collect information on forest
use. The examples arc: The study on Private Public Partnership (PPP), Baseline
survey of three irrigated plantations viz Changa Manga. Lai Sohanra & Kundian for Joint
Forest management (JFM) in Irrigated Plantation of the Punjab, Initial surveys Interim
report (Sheikh et a!.. 2000a) and Wood Use /consumption and Wood-fuel Energy in
Pakistan (Siddique et at., 1997) etc. Because majority of the population of the Punjab
(study area) is illiterate, the data were collected using a structured questionnaire through
face-to-face interviews with the Agro farmers.
3.5 Questionnaire Preparation/ Methodology
The Methodology and Questionnaire Preparation along with name of districts (Table
231) where farm plantations were surveyed is described in Chapter II.
resource

64
3.6 Results and Evaluation (Personal Communication)
Based on the surveys conducted by the author and review of studies conducted earlier,
the important findings pertaining to Agroforcstry that have emerged are summarized
below
3.6,1 Trend of raising of trees on farm lands
Till the year 2000, there has been an increasing trend in the planting of different trees
species, but it has gone down a little due to marketing difficulties and cessation of
activities by the Forest Department, There are many hindrances in the free movement of
wood from different parts of the country due to restrictions imposed by the Provincial
Forest Departments. Also, farmers do not know the size and specifications in which they
should convert their farm-grown wood for ready marketing. There is a persistent
campaign of vilification against agroforestry launched by the Agriculture Department and
Table 3.3 reveals that the maximum numbers of farm plantations (65%) were raised
during die period of 1995 - 2000 when the World Bank aided programme was in force
transferring technology and monetary incentives (Nissen et at., 2001). Allcr wards the
trend of raising these farm plantations started declining due to various reasons
enumerated in discussion;
Table 3.2 Trend of raising of farm plantations in Punjab
YEAR OFRAISING FARMPLANTATIONS
AVE ZMEDIANNO OF FP N%a*eNO RANK
-1.341 13 1.01985-1990 13 52 5 o.oou38 151991-19952
168 4.0 1,343 168 65 11996-2000
Pt 25 0.003838 152001-20052.5tooOverall 257 4
Kruskal-Wallis Test: H - 2.70 DF« 3 P = 0.440 ,H = 3.00 DF = 3 P *= 0J92 (adjusted for
tics)* NOTE *One or moresmaltsamples
3.6.2 Lund tenure and its effects on Agroforestry practices
The land tenure system, which prevails in Pakistan particularly in the Punjab province
these days, has evolved under the influence of changing social and political perspectives
over a period of more than a century and a half From the legal point of view, there are

65
three broad categories of land tenures (Sheikh, 1990). Landlord system, under which the
land is owned by an individual in the form of a large land estate, is sometimes extending
over a number of villages, Present proprietorship system, under which land is owned in
small lots by the individuals who with the help of family labor cultivate the land and
‘Riyatwari system’, under which the land is held directly for the state on tenancy with
foil security of tenancy. Technically, the ownership rests with the state, but practically as
long as the occupant pays the land rent, he retains the possession ofland (Otsuka et al„
2001). However, his rights to hold the land are usually inheritable and transferable. It
has been observed that the lessees generally do not want trees in their leased land
because they think that the major beneficiary would be the owner of the land and that the
lessee would only bear the increased shade with detrimental effect on the agricultural
crops. Under the current land tenure system, the short term tenants shun growing of trees
on the land for obvious reason of shading of crops and interfering with their root system.
On the other hand, the owner cultivators prefer to grow trees along with die crops as the
practice helps monetary gains and soil conservation and improvement (Place and Hazell,
1993). It was also recorded that out of 257 farm plantations (Table 3.4), three were
lessee and 254 were owner planted.
Tabic 3.3 Result of survey for Land tenure
AVERANK
ZMEDIANNNO OF %ageNO Land Ownership FP
2.0 1.00254.00254 99 11 Owner-1.001.03.00I03 1Lessee2
1.52Over all 257 100
Kruskah-WaUis Test: H™ 1.00DF- / P- 0.317NOTE* Otic or more small samples
3.63 Land holding
If land holding is small and the farmer will not be ready to plant trees. It is only the
landlord with big holding who would be able to spare land for trees even to the detriment
of agri-crop because he would be able to afford any losses in grains if at all realizing that
the trees are like money in the bank and could be cashed like money any time. The
interesting situation came after the analysis of the data of survey that majority of the farm
plantations were raised on land holding of up to 20 acres (86%) i.e. 223 out of 257. (Table
3,5)

66
Table 3.4 Average size ofland holdings
NO HOLDING OFLAND
NO OF FP % age l N MEDIAN AVE ZRANK
1 Up to 20 223 86 1 223,00 3.0 1 .222 21-40 22 09 1 22.00 2.0 0.003 41-13! 12 I 12.00 -1.2203 1.0
100——3 !Over all 257 2.0Kruskal-Wallis Test; H = 2.O0 DF = 2 P- 0.368NOTE * One or more small samples
3.6.4 Choice of Specks
Although the environmentalist lobby discourages the planting of Eucalyptus, there are
dear advantages in planting this tree species. For example these are easy to grow, have a
comparatively fost rate of growth, are not liked by livestock and are multipurpose in end
use. The propaganda has been done against the Eucalyptus by environmentalists and under
the influence their administrator. The results of the survey revealed (Tabic 3.6) that (87%)
Agrofarmers preferred Eucalyptus while the rest of 13% farmers grow other trees like
Shisham. Kikar etc. along with Eucalyptus.
Table 3.5 Choices of Species by Agrofermers
ZN Median Averank
No Choice of species No of %i r age
2.00 -1.00223.001223 87Eucalyptus only1.001.0034.001Eucalyptus and
others _
34 132
U5100257Over all
Kniskul- iVallis Test. H = 1.00 DF= I P =0317 NOTE * One or more small sample
3.65 Choice of Agroforestry design
As a matter of routine, the tree farmers prefer to plant trees on their land in rows or
multiple of rows as in this case, trees occupy less space and the land meant for agriculture
is not reduced (Table 3.3). Also, the crop shows less effect and is more visible when trees
are planted in rows. A large number of studies all over the world on the effect of trees on
agriculture crops have indicated the benevolent effect on the crops and that is why
plantation is preferred on other designs such as inter cropping, planting in odd comers of
the land, etc (Otsuka et a/., 2001). However, the farmer has to be advised to grow the
specific tree species in saline and water logged areas, for example, eucalyptus in water
row

67
logged areas and Eucalyptus, Babul Farash, Terminalias on saline soils like (Hurries in
Sindh), while Shisham, Albizzia, Poplar etc. on agriculture land whh plenty of irrigation
water (Owino, 2005).
Table 3.6 Choice of Agroforestry designs
NO OFNO "I AGROFORESTRY\ DESIGN
MEDIAN | AVE_1 RANK% AGE] N Z
FP
J_Linear plantations2 [ Compact plantations
123 4K 1 123.00 .vi) 1.22To103 40 103.00 0.001
3 | Lin/ Comp plantot ions 31 31.00 1,0 -1-2212 1
100"
3| Overall_
Kruskat-IVaHis Test ;H = 2.00 DF = 2 P“036* NOTE * One or more small samples257 2.0
3.6.6 Pattern/ Spacing
The spacing in the Agroforestry design is very important for the agroforesters. Those who
are more interested in the trees, try to increase the number of trees by reducing the space
in between. Fanners who prefer agriculture crops would try to increase the spacing of
trees to reduce their effects on the yield of the crops. The result of survey revealed that 58
FP (21.8%) preferred the spacing 10 feet apart while majority of the farmers 113 FP
(44%), adopted the spacing 5 feet apart. However, about 54 FP (21%) fanners preferred
10 feet row to row distance and 6 feet tree to tree distance (10x6). A few farmers i.c. about
132% preferred 15 feet apart to give more emphasis on agriculture crops as this spacing
allows free movement of agricultural machinery (Table 3.8).
Tabic 3.7 showing the Choice of spacing by the agro formers
zMEDIAN AVERANK
N% ACESPACING (ft) NO OF FPNO
-1345.00 Toi51 2210X101134113.00 4.0L113 445X50.453,054.00I21543 "ioX6
200 -0.45340013 I15X15 3423100 4257
Kruskal-Wallis Test; H - 3.00 DF ~3 P 0392 NOTE * One or more small samples
3.6.7 Preference of the agriculture crops
The choice of the tree species also depended on the preference of the agriculture crop by
the Agio farmers. Tire survey of farm plantations revealed that about 39% of the fanners
preferred the wheat only in Agroforestiy in both linear and compact designs of

68
Agroforestry and 17.5% farmers also preferred die wheat along with other agriculture
crops like Jawar, Sugarcane etc, while 40% fannere did not prefer the agriculture crops,
they only preferred to grow the trees on their farm lands. About 1.9% farmers preferred
rice and wheat in their farm lands and 0.8% preferred vegetables on their form plantations
(Table 3.9).
Table 3.8 Choice of Agroforestry designs
NO | PREFERENCE OF
AGRICULTURE
NO Ol'1 % AGE N MEDIAN I AV*TRANK
L
FP
CROP
Wheal only 102 39 4.00102.00 0.71
2 Wheat other crops 45 45,00 0.0018 3.00
Wheat and rice only 05 05.00 2.00t 'I *0.71
Vegetable only 02.00 1.00 -1.41-1 02 I
5.00 1.415 No agriculture 103 1 03.0040
5 3TOTAL 257 100
Kruskal-WaUls Test: H- 4.00 DF- 4 P = 0.406 NOTE * One or more small samples
3.7 Discussion
Trees on farms are an important resource to supplement the fragile annual crops
economy and they can trap and recycle nutrients at a different deeper level of the
soil. At an adequate and compatible density, they can help control water logging.
Certain nitrogen fixing legume and other tree species can provide inexpensive
supplies of valuable nitrogenous fertilizer via the incorporation of leaf litter in soil as
described in a study by Sangha et <//., (2005). According to Khan (1989) another
important advantage of trees on farmlands is supplementing form economy without
much of additional efforts and expenses. Farmland planting of trees is like fixed
deposit available in the rainy days or at the lime of need or failure of crops due to
natural calamities. Often, the unexpected expenditures such as weddings, funeral or
during economic recessions can be met from the return of farmland trees (Pakistan
National Conservation Strategy, 1992). In view of the economic and environmental
importance of trees being grown by the fanners on their lands, it was felt very
important to undertake extensive tours of 257 farm plantations spread over various
agro ecological zones of the Punjab. Most of the agro-foreslets were of the opinion

69
lhat the trees in their farms were helpful in more than one way, Not only that the
trees readily provided fodder, fuel, small timber, shade, shelter and protection ftom
hot and cold winds, improved environment and biodiversity, but also were a very
useful source to improve their socioeconomic condition through sale of wood,
especially when there were crop failures due to natural calamities as done in a
similar study by Wu and Pretty, (2004), The sale of wood was very handy to meet
some emergent expenses on religious ceremonies, marriages of children or payment
of school/college fees. In fact, trees served as a hedge against all unforeseen
emergencies. They further thought that if hues in any way were adverse to their way
oflife, the farmers would never have planted trees on their land mention in studies
conducted by Strong and Jacobson, (2006) and BofTa, (1999). According to some
other surveys conducted by Punjab Economic Research Institute during 1999, the
number of trees per acre was 17 and it was increasing. That is why even now, 90%
of fuel wood requirements and 55% timber requirements are being met from the
trees grown by the farmers on their land, though the potential is much more. By and
large, the rural population continues to be poor, eking out a Living from a few
morsels of grain and thriving on the milk from goats, sheep and camel. As such,
ways and means have to be delineated to improve their lot. However, a natural
disaster could rum their agricultural crops dashing their hopes for a better future
(PERI, 1999). There is an adverse propaganda by the agriculture department that
trees interfere with spraying of agri-crops and suppress yields. Also, there is lack of
awareness of the problems, related with tree farmers and education amongst farmers
and the people who matter in decision making. Lack of adequate forest extension
services and continuity of agroforcstry programmes and sustainability result to
absence of marketing facilities for wood produced under agroforestry. Furthermore,
too many rules and regulations hinder inter provincial movement of wood, for
example, mar keting of poplars wood grown in the northern part of the country, while
the industry is located in toe south in different provinces as mentioned in a study
done by Sheikh et al. . (2000a). In a study conducted by Zubair and Garforth, (200S)
described about NGOs, which always suggest not planting trees for fear of reduction
in agriculture crop output, should rather convince the tree farmers lhat trees serve as
a hedge against calamitcs/emcrgencies such as floods, drought, heavy rains etc.
When the agri-crops are destroyed due to natural calamities, the farmers can sell the

70
trees to tide over the difficult situations and it is also described by Hafeez, (1998). A
serious draw back in agriculture production is the fragmentation of farms into two or
more separate holdings. Fragmentation is the result of social laws of inheritance and
acquisition through marriage. Also, it inhibits the efficiency of farming operations.
Very often, the fragments are far apart so that the movement of personnel, work
animals, agricultural equipment and even the irrigation operations becomes difficult.
The most important criterion for the success of agroforestry program is the
association and physical and mental involvement of the local population at various
tiers of the community. They have to play a very fundamental role in identifying the
needs which could be dovetailed in their socioeconomics, land ownership and
sustainable life spectrum leading to much needed prosperity in the long run, duly
observed by Franzel etal., (2001) and Scherr, (2004).

71
CHAPTER IV
ECOLOGICAL EFFECTS OF AGROFORESTRY ON SOIL
The primary processes held responsible for the formation of high fertility around trees
relate to enhanced biological processes associated with the seasonal and long term
return of nutrients accumulated in trees to the soil through litter fall, root decay and
exudation, and their mineralization, as well as leaching of nutrients stored in canopies
(Sangha et al. 2005 and Kasongo, et al. 2010). Soil texture sometimes differs
according to tree size. Reasons behind these variations related to tree size are not
clearly understood. Increases in organic matter and improved microclimatic conditions
trees enhance soil microbial and enzymatic activity, decomposition and physical
characteristics {Tian et al, 200land Kumar, et al, 2010). Compared to open sites,
biological activity is two to three times higher. Fine soil lost ihrough wind erosion may
be intercepted by trees and deposited by through fall and stem (low. Trees also increase
soil nitrogen availability due to Nitrogen fixation (N’goran et al., 2002). Increased
fertility under trees may also be due to bird droppings and, which integrate livestock’s
dung deposition by animals which rest and feed under tree shade. The tree effect may
be more pronounced where livestock is excluded than in natural agrosilvopastoral
systems (Anon, 2000). Small trees induce little fertility change in their soil
environment. Small trees produced significantly less organic litter and root turnover
inputs. Unlike larger trees, small ones also had no dung deposited beneath them
(Brown, 2001). Nutrient enrichment by trees increases with tree size. Young trees do
not seem to influence the size of the nutrient pool significantly, and that the nutrient
concentration of sub canopy soils expands with tree size. More precise information is
needed on the dynamics of fertility of soil with increasing size of tree in relation to the
performance of linked crops, and recommendations on size/age and related conditions
of tree stands from which improved nutrient availability can potentially produce better
crop yields (Sangha et ai, 2005 and Saha, et al. 2010). Trees may also increase system
productivity by reducing nutrient losses through leaching in deep soil, and reduced soil
erosion. Trees may increase overall system productivity by increasing nutrient
availability through Nitrogen fixation and deep rooting, and their enlarged absorptive
capacity associated with mycorrbizae and fungal infection (Botha and Smith 2006),

72
However, even (hough these processes may be important in particular sites with
appropriate soil conditions and water availability, there are limitations to these
processes (Gebrehiwot, 2004). Strong, 2006 defined it as “Agroforestry is a deliberate
integration of woody components with agricultural and pastoral operation on the same
piece of land either in a spatial or temporal sequence in such a way that both ecological
and economical interaction occurs between them." The limits of production Ifom
particular soils are conditioned by quality and management practices. Thus the
activities which are basic for the promotion of the optimum land use are: land resources
inventories, evaluation of degradation hazards and production ability, enhancement of
soil fertility, land reclamation combating desertification and integrated land use
planning (Chandrshekhran, 1987 and Schmclz and Rdrnbkc, 2010). The potential
contribution of trees to soil improvement is one of tbe major assets of Agroforcstry in
general {Sanchez et at, 1997). The enhancement of soil fertility by trees is conspicuous
in studies which compare productivity of crops grown on soils formed under tree
canopies and on control soils in open sites {Craig and Wilkinson, 2004). Differences in
soil fertility as demonstrated by in situ crop productivity differ at varying distances
from the tree (Botha and Smith, 2006). Generally higher soil nutrient status under tree
cover is reflected in die mineral content of under story heibaceous species (Toney et
at 1997). Soil infertility is the result of the pressure on the land due lo a continuous
cycle of crop growing without allowing it to rest (Simons and Leakey, 2004). It,
therefore, should be realized that in order to ensure best land use, it is sigiificant that a
country's land resources be assessed in terms of fitness at different levels of inputs for
various types of land use such as agriculture, grazing and forestry (Baig, et at 2008).
Pfcffcrkom et at., (1999) suggests that if a large amount of genetic diversity has been
removed from the system, a complete replacement of taxa would require a long period
of lime. Migration in the basin was extraoidinarily quick and a return to diversity levels
took less than five million years. Regionally limited environmental alteration can also
account for different improvement rates in different regions, Monsoonal climatic
conditions favored a more rapid recovery in South Africa (Jablonski, 2002). The soil
sample were collected from various ecological zones with the technical help of the staff
of Pakistan Soil Survey of the Pakistan (PSSP) and chemical analysis of soil samples
were also done in the Laboratory of PSSP. There are ten zones of the country which
are grouped on the basis ;Climatic and edaphic considerations Physiography and

73
ecology; extent of forest & agricultural resources in each zone; site specificity: water
Jogging, salinity, commanded and uncommanded area and other landforms; the level of
biological diversity; socio-economic needs of the communities living in the zone; their
agricultural practices, soil fertility; socio-cuUurai status of the communities; the
adequacy or otherwise of irrigation water, including sub soil water and the degree of
similarity and comparability (Sharma, et al„ 20)0). The detail oT these zones has
already been discussed in Chapter 3, however, following Agroeclogical zones of Punjab
province are describe below.
4.1 AgroccLogical Zone 111 B Sandy Deserts: Apart from certain districts of Sindh,
this region covers districts of Rahim Yar Khan, Bahawalpur. Bahawalnsgar atid the
Cholistan desert. This region is characterized by elongated newly oriented sand ridges
formed by Aeolian (pertaining to wind) agencies. The detail is given in Chapter IQ.
4.2 Agrote logical Zone 111 A Sandy Deserts: This region covers the districts of
Muzaflargarb, Mianwali, Bhakkar, Khushab and Layyah with various forms of sand
ridges and dunes including, longitudinal, transverse sand sheets (Chapter IN).
4.3 Agroeclogical Zone IV A Northern Irrigated Plains; Districts of Sahiwal,
Lahore, Kasur, Okara Kaisalabad, Jhang, and part of Multan, Gujrat, Sheikhupura and
Gujranwala are covered by this region. The detail is given in Chapter 111.
4,4 Agroetlogica I Zone V Bo nmi (Rain fed) Lands: The salt range, Pothwar plateau
and Himalayan piedmont plains form this region. Climatically, a small narrow belt
lying along the mountains is nearly humid whereas in the southern part, it is semi-arid
and hot. The narrow belt has the summer mean daily maximum temperature of about
38DC with frequent cold spells. The mean monthly rainfall is approximately 200 mm in
summer and 36-50 mm in winter (December February) (Chapter 111).
4,5 Soil Texture
Soil texture is a vital soil characteristic that drives and force tree production and tree farm
management. The combined share of sand, sill, and clay in a soil determine and decide its
textural classification. Soil texture determines the rate at which water drains through a
saturated soil; water moves more freely through sandy soils than it does through clayey
soils (Harper, 2000). Soil texture also influences how much water is available to the trees;
clay soils have a greater water holding capability than sandy soils. In addition, well
drained soils typically have good soil aeration meaning that the soil contains air that is

74
similar to atmospheric air, which is conducive to healthy root growth, and thus healthy
trees (Calegari and Alexander, 1998). Soils also fluctuate in their susceptibility to erosion
(credibility) based on texture, a soil with a high proportion of silt and clay particles has a
greater credibility than a sandy soil under the same conditions. Variation in soil texture
also impacts organic matter levels; OM breaks down faster in sandy soils than in fine-
textured soils, given similar ecological conditions, tillage and fertility management,
because of a higher amount of oxygen available for decomposition (Lavelle and Spain,
2001). Soil texture drastically varies within many Agroeclogical zones. Soil physical
properties especially soil texture have a direct effect on water-holding capacity, cation-
cxchange-capacity, crop yield production capability, and Nitrogen (N) loss variations
within a field. Four Agroeclogical zones show considerable variation in sand, silt and
clay component of soil (Fig 4.1). The results revealed that Zone 111 A, Zone. II1B and
Zone V B give high value for sand and do not differ significantly for these components
(P>0,05) from one another. Zone 1VA have lowest clay component and it was
significantly less than that of Zone.IJI A. For Silt, Zone IV A gives higher value and was
significantly higher than of Zone.111 A and Zone. IV B which is different from each other
and gives high value but Zone V.B is drastically different from Zone 111 B and Zone IV A
for clay (comparison of means). The zone wise distribution of sand, silt and clay are
shown in Fig.4,1. Depth have highly considerable (P<0.01) effect on Sand, Silt and Clay
(Fig 4.2). The results shows that for Sand maximum value was obtained at >161 cm
depth which is considerably high from all other depth intervals (Multiple Range Test).
Value of silt was minimum (33.97) at 161+ cm depth and extensively higher from all
other depth intervals. All the depth intervals from 0.12 cm to 141.160 cm have similar
(not significant) value for silt but notably higher than at depth more than 161 cm.
Comparison of means given in Fig 4,2 showed that, minimum value (7.67) for day was
obtained at more than 161cm depth which is higher from that of I41-I60cm depth (not
significant) and considerably different from all other depth intervals i.e., 0.12cm to
81.1 40cm. Maximum clay was found at 36.60cm depth interval followed by 24.35cm,
61.80cm, 13.23cm and 0.12cm depth intervals. From Fig 4.2, it is clear that value of sand
first decreases and then increases as depth was increased i.e. quadratic of parabolic trend
with 94.34% value of coefficient of determination (R2). With increase in depth, values of
sill and clay has quadratic trend because both silt and clay first increases and then
decreased with increase in depth.

75
60 | aSand asm QClay |
a50
al40
1)'
•30oILL »
I V...20ftb
m10
*oZoneltl.A Zone!II.B ZonelV.A ZonoV.B
Zone
Fig.4.1 Compositions of sand, silt and clay in the soil of di ftereot zones takenfrom the depth of0-60cm in different Agroeclogieal zones
Sand - O -Silt-ÿ-- Ctay I70
f60 - .....f i
50 -X
f \40
*ÿ
1-i30 - —t20 -
10 - 't-_ _
"S
oti -is 30 4S 70 HO 150 iso
Depth (ran)
Fig 4.2 Trend showing depth wise distribution of silt, clay and sand in differentAgroeclogieal zones

76
4.6 Organic Mailer (OM)
In agro-farm plantations (FM) the annual amount of leaf fal! of mature trees varies from
zone to zone and depends upon the type of species. The results indicate that there was
no notable difference in Organic Matter (OM) between various Agrocclogical Zones,
especially under the farm plantations as majority of the farm plantations are comprised
of Eucalyptus and Kikar trees. There may be several reasons for discrepancy. The
changes in level of the OM in various zones are due to planting of various kinds of
species other than Eucalyptus and Kikar (Hafeez. 1993). The composition of the OM is
dependent upon the tree species and Agroeclogical zones of the Punjab Province. Fig
4,3 shows lira! among the various agnoeclogicaJ zones i.e. Zone 111 B, Zone IV A and
zone V B ,there is no di(Terence among these zones as for as OM is concerned
(P>0.05). The organic matter value for Zone III A is zero and for Zone MB, Zone IV
A and Zone V B is CL347, 0.270 and 0.309, respectively. The value of organic matter
was not detected for Zone HI A. The graphical representation for zone wise comparison
for organic matter is given in Fig.4J which indicates that OM decreased with the
increase in the depth of Soil.
Depth interval have notable and significant (P<0.01) effect on organic matter (Fig 4.4).
It is clear from the results that maximum organic matter (0.93) was found at 0.12cm
depth interval which is significantly different (least significant test) from all other depth
intervals i.e., 13.23cm to more than 161cm intervals (Comparison of means). Minimum
organic matter value (0.03) was found at more than 16lem depth which is
inconsequential different from 36.60cm, 61.80cm, 81.) 40cm and 141.160cm and
radically different from 0.12cm, 13_23cm and 24.35cm depth intervals. There is an
exponeniional relationship between organic matter and depth with coefficient of
determination (R:) value of 84.46% as shown in Fig.4.4. The impact of OM was
highest on fopsoil.
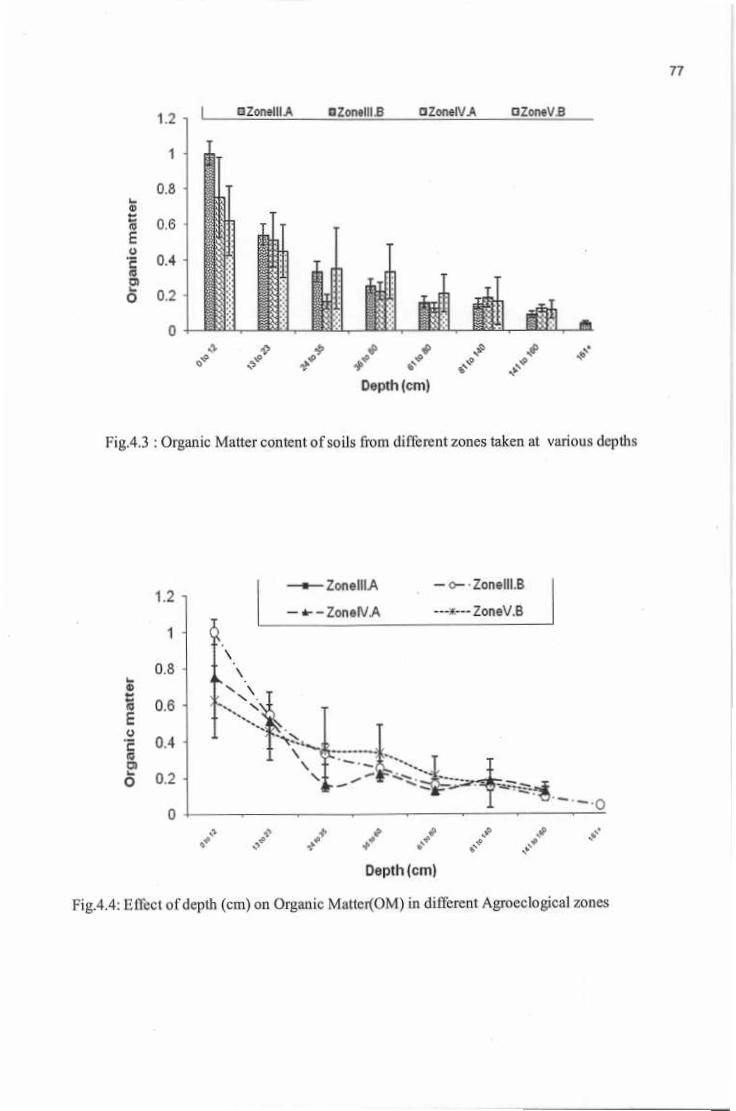
77
BZot»UIA BZon»llt£ aZonriVA1.2 L
1
0.8
£ 0.6
I «o>
6 0.2
Q0
& / /* 4T */ /
* *Depth (cm)
Fig.4.3 : Organic Matter content of soils from different zones taken at various depths
— o~-Zonelll.BZonelll-A1.2 —*— ZoneV.B—
51\
0.8 ,, VVXx\e
§ 0.6
£ 0.4
V,
% \\ra
6 0.2 \ —00
/ v/ / .>ÿ//Depth (cm)
Fig.4.4: Effect of depth (cm) on Organic Matter(OM) in different Agroeclogical zones

78
4.7 Nitrogen and Phosphorus
Nitrogen is one of the most important factors affecting soil fertility and productivity as
well as the growth and development of newly planted trees on farm lands. The major
portion of the nitrogen cycle occurs between vegetation especially trees and soil, only
minor exchanges generally taking place with the atmosphere and the hydrosphere. All
living trees and animals require phosphorus. Phosphorus containing compounds are
essential for photosynthesis in trees, for energy transformations and for the activity of
some hormones in both plants and animals (Gcbrchiwot, 2004). Different zones had no
differences in the Nitrogen contents i.c. value in the entire four zones did not vary
significantly (P>0.05). While ail the agroeclogical zones showed different (P<0,05)
phosphorus contents (Fig 4.5 B). Tire results of the present study shows that Zone IV A
has maximum value (52,58) for phosphorus followed by Zone V B (18.52) but
considerably different from Zone 111 B (I 5.40). It also shown that Zone 111 B and Zone
V B have nearly no difference (P>0.05) regarding phosphorus value. For Zone IB A
phosphorus value was not detected (Comparison of means).
It is concluded that there is similarities regarding the Nitrogen and Phosphorous values
(P>0,05) among diflerent depth intervals as shown by Fig 43A. Nitrogen values were
found as 1*283, 0.749, 0.772, 0.414, 0293,0.334, 0.300 and 0.001 at 0.12cm, 1323cm,
2435cm, 36.60cm, 61.80cm, 81.140cm, and 141.160cm and greater than 161cm depth
intervals, respectively. Phosphorus values were found as 20.86, 20.60 and 42.51 at
intervals 0.12cm, 1323cm and 24.35cm depth, respectively. Phosphorus values were
not traced from 36.60cm depth interval to more than 16) cm depth interval. Fig.4.6
shows that Zone III B has maximum value (0.782) for nitrogen but Zone III A, Zone IV
A and Zone V B have very low values (0.095, 0.013 and 0.011 respectively) for
nitrogen as compared to Zone III B, Zone wise comparison for nitrogen have almost no
variation (P>0.05). This contradiction is due to very much variation among nitrogen
values within Ihe zones.
There is an exponential relationship between nitrogen and depth with R” Value of
61,81% (Fig.4.6). There is no apparent relationship between phosphorus and depth.
From Fig.4.6 it is clear that depth from 50 to 200 cm, the value of phosphorus is almost
equal to zero.

79
1.2 n
1 I0.8 -!!mmm
0.6
2 0.4
0.2 •
0
ZoneJtl_A Zone_lll_B ZbneJV_A Zone_V_B
Zone
A
9080 -70 -60 *
50 -40 -
li30 * mm18
20 *
10 *
0
ZoneJII_A ZoneJII„B 2one_rV_A Zorte_V_B
Zone
B
Fig.4,5: Zone wise variation in Nitrogen and Phosphorus in different AgroecJogical zones

80
-a- ZonelllBZonelltA3 1
ZoneVS— «- - ZoU-riV
2.5
2c&©
H\£ 1.5
sz
1
il L IV
0.5
0 1—* <
/ V*** /1*
Depth (cm)
A
— c— Zone!11 BZonelllA250
ZoneV.B— ZonelVA
200
3
o150C.
n r/CL
IDO //
lSO
c
**•s»"D»pth (cm)
B
Fig.4.6: Effect of depth (cm) on Nitrogen and Phosphorus in different Agmeclogical zones

81
4.8 pH, Electrical Conductivity (EC) and Cation Exchange Capacity (CEC)
All trees have different pH preferences in different Agroec logical /.ones. The pH level of
the soil directly affects soil life and the availability of essential soil nutrients for tree
growth. pH of soil can help tree farmers to choose right of trees and allow the right
treatment for the soil, while the electrical conductivity indicates the amount of soluble
(sail) ions in the soil. Soil electrical conductivity (EC) is a measurement that correlates with
soil properties that influence trees productivity, organic matter level, including cation
exchange capacity (CEC), drainage conditions, salinity, soil texture, and subsoil
characteristics. The EC of soils varies depending on the amount of moisture held by soil
panicles. Sands have a low conductivity, silts have a medium conductivity, and clays have
a high conductivity. As a result, EC correlates strongly to soil particle size and texture
(Wahab et alt 2008). The effect of tree species on soil pH is most effective in the first ten
centimeter. The pH difference between Agrocclogical zones could be seen from Fig 4,7,
Never the less, the mean pH difference in soil was between 6-8. Zone wise comparison for
CEC (Cation Exchange Capacity), pH and EC is given in Fig 4.7{A & B). In four zones,
both CEC and EC have non-significant effect i,e., all the four zones have almost same
value of CEC and EC, The pH value is not similar among various zones and varies
significantly (P<0.01). The results of the present study reveals that zone 111 B have lower
pH value (6.57) as compared to all other three zones of study areas. Zone HI B, Zone IV B,
Zone IV B have considerably higher value than Zone 11LA but there is little difference in
values (not significant) of pH from on another (Least significant difference test). Zone wise
graphical presentation with means and standard error values are given in Fig.4.4A for CEC,
pH and EC. Fig 4,7 shows that CEC and pH are not varied and somewhat similar in
different depth level i.e„ CEC and pH value at different depths have tire same values. As
for as EC is concerned there is marked variation among the various zone (P<0.01). EC
value of 13.73 at depth 0 to 12 is greater and significantly different from EC value of 0.59
at depth of 161+. It is also revealed that depth from l* level (0 to 1 2cm) to level 141 to 160
have no difference (p>0.05) among them and from 2“* level (12 to 23cm) to last level of
depth (161+) have the same values (LSD test). It is clear from Fig.4.7, there is a linear
trend between CEC and different levels of depth (1ÿ=87.07%). With increase in depth, the
pH value first increased up till 50 cm depth, than decreased up till 125cm depth and again
increased (Fig.4.7), EC have exponential trend with depth as shown in Fig.4.7.

32
OZontV BOZonaJVAZonal II A10 n9 i V
:
' I
.
8 - ;;!; !
I'
- :
V
!;!!;
7 -i:6 -
5 -XA -32 -1 -0
V-TF"Depth (cm)
A
BggtaV :BOjamiBA fllcrdV A JttZpriHi 06 i
5 -
* 4 ’
|3
is
msu 2 -tf
!«
1
m L;Jit fcd0 l_L “TT
yv-
y/ y/ y
Dtpth(cm)
B
OZoreVBaZoneill 6 n_: - :. v :ÿ
16 T L
16
H - ;
J
jj !
i.S
12
10u
9 -LUU
6
i -
2
0
/s s s yw9Depth (cm)
cFig 4.7: Effect of depth (cm) on CEC, pH and EC in different Agioeclogical zones

83
4.9 Carbonates, Bicarbonate, Chloride and Sulfates
Carbonates arc perhaps the most vital dissolved component of soil solutions and in
alkaline soils this statement is even less disputable, contributing aspect in a tree chlorosis
similar to that induced by soils high in calcium carbonate (N’goran et ai, 2002), while
sulphate is a major plant nutrient, and is essential for tree growth. Agricultural crops under
trees on form land rarely respond to applied Sulfate. The sulfate ion is primarily adsorbed
by clays (Train et ai, 2001). The values forCOj, HCOj, Cl and SO* were found for Zone
111 B, Zone IV A and Zone V B. These are not found in Zone 111 A. Fig 4.10 shows that
zone wise differences for COj and HCOj have almost same similar values (P>0.05). Cl
and SO4 vary from zone to zone (Fig 4.10). The results for Cl reveal that Zone IV A and
Zone V B have same (not significant) and higher values and Zone II B and Zone V. Zone
V has also almost similar values from each other. Zone IV A is considerably different from
Zone 111 B regarding Cl value (LSD test). Similar results are found for SO4 i.c. value of
SO* in Zone V B (7.92) docs not differed from Zone ill B (6.37) and Zone 1V.A (1 1.75)
but value of SO4 for Zone III B is considerably differ from Zone IV A. The same results arc
presented in Fig.4.8, Effect of different depth levels on COj show no abrupt variation
(P>0.05) in results (Fig4.8). The mean values of CO3 at different depth levels are ranged
from 0.089±0.056 to 2.087±1.740. For HCOj, considerable (P<0.01) differences were
found regarding different depth levels. The results of study shows that maximum HCOj
(3.40) was found at 0 to 12 cm depth level and it is radically (P<0,05) differed from
2435cm, 81.l40cn to >161cm depth levels. Cl is drastically (P<0.01) differed for different
depth levels (Fig 4.9). Maximum (7.60) Cl was found at 24.35cm depth and statistically
different from depth level >16!cm (1-66) which is lowest value. There is highly
considerable (P<0.01) results for SO*. At 13.23cm depth level, maximum SO4 (14.36±3.99)
was found at par with 0.12cm and 24,35cm depths but extensively differs from depth level
36.60cm to >16lem (Comparison means table). COj values are drawn against different
depth levels in Fig.4.9. The exponential relationship was found between COj and depth
with R1 = 89,37%. Fig.4.5a shows that COj value decreases till 60cm depth and then
almost remains same up 10 180cm depth. The trend between HCOj and depth level is
somewhat quadratic. Linear trend was shown (Fig.4.9) between Cl value and depth levels
with RJ-82.42% i.e., with increase in depth, Cl value linearly decreases. The similar trend
(linear) was found between SO4 values and depth intervals with R1=82J3%. This trend is
also decreasing trend as SO* increased with decrease in depth level.

64
eCarbonata sBicarbonate QChlonde Sulphate16
14
« 12sv 10
Ae* 8sg .s 6
jiiJBI II
O 4
2
0
Zona VBZona IVAZons IIJA Zona 1115
Fig.4.8: Zone wise variation m Carbonates, Bicarbonates, Chloride and Sulphates
-o- ZonelHB
ZnneV.BZonelHA— *- -ZonelVA
3
25 a2
SV1 S
IVdu Si
S S S s / *"Depth (cm)
0.5
0
— O- ZOT+1IIB I— jortfeV B IjfOO»niA
ft
4ft
l-i%is
,>T~*41
2ftS' -Kax
t*
o
/f S fDepth (cm)
Fig.4,9: Effect of depth (cm) on Carbonates and Bicarbonatcs in the soil of different
Agiueclogical zones.

85
— — Z*r*#A — 0“ - ?nn»lll B — •--Zanrf/A ~»ii— Zon*V.e
1ft
«M
-i 12
£i *10
Nÿ\"4“— v—.
2
Y-8U
44,“!»' -6
4
2
0
£ $$
$¥'
Depih(cm]
J—c- ZontllLBZonelllA«
a36 ,r\
/ \33/ \
25 / \
6 \/2Dtn
WdN15
ID
5
0
// / / / sKDepth (cm)
Fig.4.10: Effect of depth (cm) on Carbonates, Bicarbonates, Chloride and Sulphates in the
soil of different Agrocclogical zones.

86
4.18 Calcium plus Magnesium, Sodium and Potassium
Every tree needs calcium to grow as an essential element of nutrients available in
the soil. Once permanent, calcium is not mobile in the tree. It is an important
ingredient of cell walls and can only be supplied in the xylem sap. Thus, if the
tree runs out of a supply of calcium, it cannot remobilize calcium from older
tissues. If transpiration is reduced for any cause, the calcium supply to growing
tissues will rapidly become insufficient (Sangha et at., 2005 and Singh, et at..
2010). Contrary to this, Magnesium is the fundamental core of the chlorophyll
molecule in tissue of tree. Thus, if Mg is scarce, the shortage of chlorophyll
results in poor and diminutive growth of trees. Magnesium also facilitates to
activate particular enzyme systems. Magnesium is rich in the earth's crust. It is
found in a extensive variety of minerals. Magnesium becomes accessible for tree
use as these minerals weather or break down. Magnesium is detained on the
surface of clay and organic matter particles. Although this exchangeable form of
Mg is available to trees, this nutrient will not readily leach from soils. There is
an "ideal" ratio of calcium to magnesium in soils (Ahmad et at., 2006). Results
for Ca+Mg are highly variable (P<0,01) in different Agroeclogical zones of the
Punjab Province (Fig 4.10). In Zone III A, the value of Ca+Mg was absent. The
results shows that maximum and similar values of Ca+Mg ware found in Zone
IV A and Zone V B but extensively different from value of Ca+Mg in Zone
HI.B. The zone wise graphical presentation for Ca+Mg is given in Fig.4.10
(Least significant difference lest). Depth also effect Ca+Mg values in the soil
(Fig 4.10). Maximum Ca+Mg was found at 13.23cm followed by all depth levels
except >191cm depth. Depths levels 0.12cm and 13.23cm have different value of
Ca+Mg from depth level of >161cm (Comparison of means). Fig.4.10 reveals
cubic trend between Ca+Mg and depth levels with R5i£90.46%. It is clear from
Fig.6a that Ca+Mg decreases with increase in depih till approximately at 60cm
level. After 60cm to 150, a negligible or small increase was seen in Ca+Mg
values and after that it decreases with increase in depth up to 180cm (Fig 4.10).

87
Potassium is an vital nutrient for tree growth. Because huge quantities are
absorbed from the root zone in the manufacture of most agronomic crops, it is
classified as a macronutricnt. Soil commonly contain over 20000 parts per
million (ppm) of total Potassium (K). Nearly all of this is structural component
of soil minerals and is unavailable to the plants. The trees use only exchangeable
K on the surface of the soil particles and K dissolved in the soil water. This often
amounts to less than 100 ppm. Potassium is involved in many plant metabolism
reactions, ranging from lignin and cellulose used for formation of cellular
structural components, to regulation of photosynthesis and production of plant
sugars that are used for various plant metabolic needs. It controls water loss from
trees and is involved in overall tree health. Soils that have adequate potassium
allow trees to develop rapidly and outgrow tree disease, insect damage and
protect against winter freeze damage (Harper, 2000). The results indicate that
there is no significant difference among the value of K in all Agroeclogical zone
(P>0.05). There was not much variation for potassium value found in different
zones e.g. Zone IV A (13.68±2*23) and Zone V B (14.25*4.83) have similar
values (P>0.05) for potassium and Zone HI A (0.02*0.001) and Zone III B
( 1.52±0.40) have also similar values and do not differ from each other (P>0.05).
But Zone IV A and Zone V.B with maximum values arc notably different from
Zone III A and Zone III B Similar results arc shown in Fig.4,11. Both sodium
and SAR are similar in all zones and very less variation was observed (P>0.05),
For Zone III A* values for sodium and SAR were not found. Fig.4.11 shows zone
wise mean ± standard error values regarding Na and SAR. The result (Fig 4.12)
shows mark difference (P<0.01) among the depth levels for potassium value.
The maximum K was found at 13.23cm depth and minimum at 81.160cm.
Potassium at 0.12cm depth decreased considerably (P<0.05) from K at 81 to
)40cm level of depth. Depth levels from 0.12 to >161cm have same value of K
except at 81.140cm depth. And from 13.23cm to >161cm levels of depth have
almost similar values and (P>0.05) differ with one another. The graph between
depth and potassium shows exponential trend (Fig 4.10). This mean that K is

es
found up io level of 30-60 cm and ihen its concentration considerably decrease
and almost negligible. The zone V B has no sign of the K because this zone is
almost located in hilly / scrub areas. The data indicates that the K have very less
effective role in Zone V B as majority of the plantations are comprise of
Eucalyptus plants. A soil rich in sodium, known as a “sodic" soil, in which
sodium occupies an surplus amount of space on soil exchange sites. As soil
sodium levels boost soluble calcium levels reduce and its soluble calcium that
gives soil it’s friable, loamy, porous structure. A constant decline in soluble
calcium brought on by ever increasing soil sodium causes the soil to lose these
encouraging structural properties, ensuing in impaired drainage and increased
compaction. Toxicity arising from the sodium ion itself is rare, due to the fact
that problems with soil structure usually arise well before sodium can build to
toxic levels (Ahmed, et ait 2006). A soil high in salt, also known as a “saline"
soil, is one in which soluble salt levels impair turf health by making it difficult
for Ihe plant to extract water from the soil. Sodium salts are critically important
because they have the potential to impair soil structure. Though sodium can be
involved in each condition, but a saline soil relatively / frequently contains very
minute sodium. Moreover, soils high in sodium are often low in soluble salts.
The results of the study reveals that Sodium varies (P<G.0t ) in different levels of
depth (Fig 4.12). Value of sodium was found at 24.35cm depth followed by
0.12cm, 13.23cm, 36,60cm, and 61.80cm, Minimum value of Na was at depth
>161cm. Fig.4.6a reveals almost linear trend between different depth levels and
sodium value. As depth increases sodium decreases (Comparison of means,
maximum). The value of SAR at different levels of depth is not similar and
varies (Fig 4.13). Maximum SAR was found at 24-35cm depth level which is
almost similar (P>0.05) but higher from 13-23cm, 36,60cm, 61.80cm depth
levels and significantly (P<0.05) lower from 0-12cm, 81-l40cm, 14 J -160cm and
>16lcm depth levels. The relationship between SAR and depth is cubic like,
SAR value increased from 0 to 40cm depth level, than decreased up to 150cm
and then show some increasing trend {Fjg 4.13).

89
QZoneV.B Jazonelil-A BZontlll.BL12
10
£ 8
i2*! »g
4
I ,n0 0
/ / // / /Depth (cm)
Pig.4.11: Effect of depth (cm) on Ca+Mg in the soil of different Agroeclogical /ones.
BZonelll.8 QZonelVA25, L
20
115E.2
8:
:
i.
CL
5
m0
/ // / / /
Depth (cm)
Kig.4.12: Effect of depth (cm) on Potassium (K) in Ihc soil of different Agroeclogical /ones.

90
35 l L aZon&IILA BZonoHI.B DZonsIVjA
30
25
11120£= 15
:
im ..
jjl V10
jlffl] jl&ii5
L*0
// / //
Depth{cm}
Fig.4.13: Effect of depth (cm) on Sodium (Na) in the soil of different Agrocclogical zones.
ozon»ivÿDZOWIIM OZotwIIIB25
20
15
£E
w 10
5 \
I0
/ / /S / /
Depth{cm}
Fig.4.14: Effect of depth (cm) on SAR in the soil of different Agroeclogical zones.

91
4.11 DISCUSSION
Ecological effects include the environmental condition at which living organism
easily survive. In case of agioforestry, a type of soil is one of the major factors for the
classification of different suitable species of plants. A comparison of the
characteristics of soils under various farm plantations necessitates a prior evaluation of
their particle size and composition in order to ascertain whether the soils were
texturally similar as discussed by Dixon et al„ (2001). Mostly the plant species require
well drained, medium texture soils, with average physical environment in which
salinity problem is negligible pointed also by VanWilgen etai, (2004). The suitability
classification of soil are based on several parameters, can help in predicting the best
growing field crops, horticultural crops, forest species and other plantation crops once
the suitability criteria is established (Nel et ai.2004). The FAO land suitability
classification system has four different categories: Orders, Classes, Subclasses and
Units. On the basis of which the data composed of four regional groups included Zone
111 A, Zone 111 B, Zone IV A and Zone V B. In the 0-10 cm layer, the mean
proportions of sand and silt under farm plantation were similar to those of the
corresponding layer where no trees were present as mentioned in a similar study by
Simons and Leakey, (2004), The mean proportion of clay was however, radically
higher under plantation soil at the 1% confidence level (Fig 4.1). In the immediate
subsoil layer of 10-20 cm, with reference to the mean proportion of the sand, there
was no difference in the top soil of Acacia nthlieu and Eucalyptus. As in the topsoil
layer, the mean proportion of clay was higher in the 10-20 cm layer of the plantation
soil. The implication of the higher amounts of clay in the plantations, soil is that it
would have a higher capacity of adsorbing nutrients than soil under Zone DI.B other
things being equal. Soil textural composition influences soil density. Clayey soils
usually have lower densities than sandy soils. Since the amount of clay in the 0-10 cm
layer of soil under the Zone V was virtually twice that of the Zone U.B and Zone III A,
one would expect the soil bulk density to be lower under the Zone V' than under the
Zone 111 b and Zone III A which resembled ihe results of study conducted by Malik
and Sharma, 1990). Soil texture analysis for differences among different zones for
sand, silt and clay shows that considerable difference was found among these zones.
By comparison it was found that Zone 111 A, Zone I11B and Zone V B give high value
can

92
for sand and do not differ significantly from one another. Zone IV A have low value
and significant different from Zone lll.B. For Silt, Zone IV A gives higher value and
considerably high from that of Zone III A and Zone IV B but with Zone 111 B.
Similarly, Zone V B and Zone 111 A have no-significant difference from each other
and give high value but Zone V B is significantly different from Zone III B and Zone
IV A for clay. Depth lias highly considerable effect on Sand, Silt and Clay. Sand
showed that maximum value obtained at >161 cm depth in Zone V.B which is clearly
different from all other depth intervals. Minimum value (33.97) was observed for silt
at 161+ cm depth and considerably different from all other depth intervals but from
0.12 cm to 141,160 cm depth silt have similar value which notably higher than depth
more than 161 cm. While for clay minimum value was obtained at more than 161cm
depth and maximum clay was found at 36.60cm depth. It was observed that proportion
of clay and silt decrease with increase in depth as compared to sand which contains
maximum proportion of soil and up to the 200cm depth more sandy soil found.
Calegari and Alexander, (1998) revealed in a study that organic matter (OM) contains
carbon compounds that were formed by living organisms. It covers a broad range of
things like lawn clippings, leaves, moss, algae stems, branches, lawn clippings,
lichens any parts of animals, manure, droppings, sewage mud, sawdust, insects, and
microbes and earthworms. The results indicate that OM was present maximum in the
upper layer and decrease with increase in depth. Four zones do not differ extensively
for organic composition. Maximum organic matter value for Zone 111 A at depth from
0-12cm as compared to Zone 111 B is observed, While Zone IV A and Zone V B shows
minimum organic matter value and the value of organic matter was very less detected
for Zone V. Depth interval had significant effect on organic matter. From comparison
it is clear that maximum organic matter was found at 0.12cm depth interval while
minimum organic matter value was found at more than 161cm depth rather it is
negligible.
Results showed that Zone 111 B has maximum value for Nitrogen but Zone III A, Zone
IV.A and Zone V.B have very low values for nitrogen as compared to Zone III B.
Zone wise comparison for Nitrogen has no considerable variation. Maximum
phosphorus value in Zone IV A was observed. It was shown that Zone 1II.B and Zone
V A have almost similar value regarding phosphorus. For Zone HI A phosphorus

93
value was not detected. No obvious relationship between phosphorus and depth while
an exponential relationship between nitrogen and depth was observed, According lo
depth maximum nitrogen values value from 0-12 cm depth was loutid and minimum at
161cm depth interval. Maximum value for phosphorus was found at 24-35cm depth
show considerable different between different depth intervals regarding nitrogen and
phosphorus values which were not traced from.36.60cm depth interval to more than
I61cm deplh interval as did by Coxand Hendricks, 2000. In four zones, both CEC and
EC are appreciably different. Zone V B show maximum value than others. Regarding
to depth Zone IV A and Zone V B show zero value as from 36-60cn deplh interval lo
161+ cm deplh. While Zone IILB shows maximum EC value and it decrease in Zone
Hl.A. Kjogh et al., 2000 also showed similar result that pH value shows no difference
regarding zone. Zone III A has extensively lower value for pH of 6.57 as compared to
all other three zones. Zone IUB, Zone IV B, Zone IV.B have considerably higher value
than Zone HiA but not notably differ front one another. The effect of various tree
species on soil pH varies in the first ten centimeters of the topsoil. The pH difference
between zones can be equal to 1 pH unit in the topsoil. But the average pH difference
in soil was between 02 and 0.4 pH unit as Hamid et al.. (2006) did similar type of
study. Results revealed that CEC and pH have no significant effect regarding deplh i.e,
CEC and pH value at different depths have the same pH value. There is highly
considerable effect of different depths on EC value. The values for COj, HCOj, Cl and
SO4 were found for Zone 111 Bf Zone fV A and Zone V B that was not found in Zone
HI A. Results show that zone wise differences for COj and HCO* are oegltgible.
Similar value of SO4 in Zone V.B is slightly differed from Zone Ilf.B and Zone IV.A
but value of SO* lor Zone 1U B is notably different from Zone IV A. The same results
at different depth levels on CO3. For llCOj, differences were found regarding different
depth levels. By comparison maximum llCO.i was found atO lo 12 cm deplh level, Cl
at 24.35cm depth. Andrew, 1999 also confirmed that there were highly variable results
for SO4. At 1 323cm depth level, maximum SO4 was found while COj value decreased
till 60cm depth and ihen almost remained same up to 180cm depth. A result for
Ca+Mg varies in different zones with respect to Ca+Mg. In Zone HE A, the value of
Cs+Mg was absent. Almost similar values of Ca+Mg ware found in Zone IV A and
Zone V B but different from value of Ca+Mg in Zone ni B as describe in a study by
Ben-and Epena, 1999. Krogh, et al. 2000 confirmed that for potassium value which

94
was found to be slight different for Zone 111 A and Zone III B but Zone IV A and Zone
V B show maximum values. Both Sodium and SAR were not different regarding
zones. For Zone III A, values for sodium and SAR was not found. Depth has highly
considerable effect on Ca+Mg values and shows that maximum Ca+Mg was found at
13.23cm followed by all depth levels except >191cm depth. Depths levels 0,12cm and
13.23cm have different value of Ca+Mg from depth level of >161cm. After 60cm to
150 slight increase was seen in Ca+Mg values and after that it decreased with increase
in depth up to 180cm. Differences among depth levels for potassium value shows that
maximum K was found at 13.23cm depth and minimum at 81.160cm. Potassium at
0.12cm depth was different from K at 81.140cm level of depth. Similarly for sodium
value radically difference was observed at different levels of depth. Maximum value of
sodium was found at 24.35cm depth and minimum value ofNa was at depth >16lem,
as depth increases sodium decreases as described by Ahmad, el al.t 2006. The value of
SAR at different levels of depth is also highly different. Maximum SAR was found at
24.35cm depth level which was not significantly differed from 13.23cm, 36.60cm, and
61.80 cm depth levels.

95
CHAPTER V
PHYTOSOCIOLOGICAL ANALYSIS
5.1 Introduction
The relationship of vegetation (under growth of trees) and soil characteristics is so
inter-dependent that they become indicative of each other. A habitat under certain
existing environment would permit plants adapted to the site condition thus the soil-
planl-relationship becomes so intimate that plants reflect the ecological conditions
of the inhabited area (Boggs, 2000 and Kumar et al, 2010). At the top of these
considerations, the application of vegetation analysis is manifold. Firstly as the form
of a study to monitor the effects of progressive pollution of the environment;
secondly as a sequential study on the effects of man upon environment in term of
recreation and agriculture within areas of great aesthetic landscape beauty; thirdly to
provide a scientific phytosociological, photography and ecological basis for
conservation or reclamation; and fourthly to produce syniaxanomy of the world
vegetation (Mignaut, et al., 2010). The phytosociological aspects will be taken into
consideration more related to salt affected soil and their relation and ultimately to
study the impact of salinity on the agrolbrestry. Most of the marginal lands in
Punjab have resulted from various degrees of water-logging and salinity. In the
semiarid climate the rainfall is irregular and insufficient to remove soluble salts
from the soil; within the soil salts are drawn upward by capillary action and
accumulate within the soil profile at the surface, when water evaporates. These soils
are cither saline and saline sodic or sodic and this salinity and water-logging which
have become more pronounced after 1950 is due to ill-skilled methods of irrigation
(Sheikh et al.. 2000).
Before the introduction of weir controlled irrigation, depth to ground water-table
ranged between 30 to 100 feet. There existed a dynamic equilibrium between
various components, ground water recharge and discharge, so that water table was
almost in static condition with little seasonal fluctuation. After the commissioning

96
of lower Clienab and upper Chetisb canals in Rechna Doab in the late 191*1 centuiy,
the hydrologic regime was disturbed due to seepage from irrigation channels and
infiltration from the irrigated fields. In the absence of proper drainage, (he excessive
recharge resulted in the rise in the ground water table; on the average it rose by
about one fool per year during the period 1900 to 1960 (Sheikh et at 2000a),
Depth to water table in the 45% of lire area was 0.5 ft, and in 29% of the area, it was
5-10 feel before undertaking the anti-water logging measures like pumping with
tube wells and digging surface drains (Pakistan Country Report, WAPDA 1975),
The adverse process of saltslinization and alkalization, have dexterous effects not
only on soil but also on water and on the general environment; they can make it
unfit for human habitation and even vegetation. Therefore, the theoretical and
practical research that is being done in the field of salt affected soils is essential to
the explanation of the processes of salinization and sodication that render vast
expanses of the land unfit for agriculture. Changes in vegetationsI composition also
occur with change in salinity. Generally there is a sharp decrease in species
diversity with even a low increment of soil salinity and that further drops m
diversity until only one or two species arc left which are capable to tolerating the
salinity extremes (Haider, and Qaiser, 2009),
Climate plays an important role in the formations of salt affected soils;
geomorphologic, hydrological, biological, topographical and hydro-geographical
conditions also exert great influence on their formation and according to Bargali et
al (1998) and Wahab et at., 2009, the plant cover also contributes to the migration
and accumulation of salts m soils,
The importance of this part of studying this phenomenon has been realized all over
the world. Studies on saltaftnizalion and alkalization of soil, studies on vegetation in
relation to soil, have been earned out by various scientists in different countries of
the world. As such considerable literature in this regard is available and we may not
dilate on that. Moreover the type of research work which we have undertaken is
hardly available in local scientific literature. Simply description of vegetation along
with soil eharacteristies have been carried out by many authors (Shah el at.. 1961;
Chaudhry and Sheikh 1961; Rutter and Sheikh 1962; Mirza and Bashir 1996; Dc
Velice et ai, 1999; Bunco et at. 1999; Tansley, 1999; Boggs, 2000; Mishra et al.

97
2002; Kumar et aL 2004; Ahmed et ai,, 2006 ; Mignaut, et ai, 2010). Chaudhry
(1953) has described the vegetation of “Bara” Lands of Punjab and that of water
logged areas of Sheikhupura District- Qadir et ai. (1966) carried out a
phytosociological survey at Karachi campus, recognizing six distinct plant
communities and correlated the diversity of the vegetation with edaphic conditions.
The Chapter presents the analysis and result of die ecological/sociological study
carried out in 2006 of some of the salt affected areas under farm-plantations in
Fcrozewala district Sheikhupura to ascertain the impact of salinity on the soil and
ultimately on the income of the farmers,
The land of this district is used Jbr general cropping under irrigation from canals
and lube wells or open surface wells. The main crops are wheat, sugarcane, cotton,
barseem, clovers, millets, rice and orchards. The soils are moderately to strongly
saline and possess intermediate structure . The vegetation of these soils here and
there was seen extensive patches of halophytic species. The diagnostic species of
sample area were Snaeda frulkosa. Kochia rndica, DiplachneJusca. Desmostachya
bipinnata, Athagi maurorum, Sporoboius arabicae, Potypogon monspeliensis.
Erythrae ramosissma. Veteveria zyzanioides, imperata cyiindrica. Sctrpus
maritimus.and Typha angustata. There were also many companion species. Due to
the rising of salinity the growth J cultivation of minor crops is becoming more non
profitable (Miiza and Bashir, 1996; Naz etai. 2010).
During these studies more than 300 Rclcv'es were taken and association were
tabulated according to the Methods given by the Shimwell (1973) and Whittaker,
1976. The format for the description of the association is as follow:
Name of Association: Whenever possible referred to a unit or association already
described;
Number of samples: The number of Rdcv’cs collected for each association, sub
association and noda;
Florisue characteristic: Referto over a U physiognom ic structures and
Ecological characteristics: Soil texture, pH, conductivity concentration of cations
and anions. Following associations were recognized:

98
Association 1 . Suacdetum fruticosae
Association 2, Kochictum indicum
a) Sub association Kochictosum indicum
b) Sub association Desmostachyetosum bipinnatac
Association 3, Diplachnetum tuscae
a) Sub association Diplaclinetosum fuscae
b) Sub association Albagetosum maurare
Association 4. Desmostachyclum bipinntac
Association 5. Alhagictum maurarae
Association 6. Sporoboletum arabicae
Association 7. Polypogaetum monspeliensac
Association No 8, Erythraeo- polypogaetum - mon spelicnsae
a) Sub Association Polypogoetosum monspeliensac
b) Sub Association Eiylhractosum ramosinac
c) Sub Association alhagietosum mauraroe
Association No 9, Veleviarielum zyzanioides
Association No 10. Imperatum cytindrieac
a) Sub Association lmperatetosutn cylindrieae
b) Sub Association Dicanthietosum annulatae
Association No 1 1 . Scripelum martimae
a) Sub Association Sciipctosum maritimae
b) Sub Association Polypogon-phaspaletosum-distichae
Association No 12. Typhetum angustitae
99
52 Association 1: SuHcdetum fruticosac
In Table 5J, twenty two (22) stands of different areas show fluhsiic composition of
this association. The stands show Suaeda jhtticosa is dominant with constancy class
V and Kochia mdica is differential species with constancy class V. Alhagi
mauronm, Acacia arabica, Conyza amibgua: Cynodon dactylon. Dicanthium
annulatum; Diplachnefusea and Typha angustata with low constancy class and arc
companion species. At many places, the majority of the plants found frequently and
is sparsely distributed. At many places the diagnostic species was more than 4 feet
high and the associate species were trees such as Acacia arabica; Salvadora oieoides
and Tamarixsp.
Many sub associations and variants can be recognized which can tolerate wide range
of salinity from non saline to highly saline, xcric to mesic habitat. Suaedafruticosaoccurs in several plant communities of Inland salt deserts. Many growth forms of
this species were seen in a natural habitat. In highly saline soil it may be dwarfed and
possess a prostate growth form or may appear as a single stemmed plant in locations
of tower salinity it shows much more robust growth and commonly tl occurs with
several main shoots due to branching at the base,
Highly saline soils contained plants ranging from 30 to 70 cm tall and some
individuals were found more than 100 cm (all. It appears that salinity, nitrogen and
organic contents
The association is well distributed in moderately saline habitats of Kula Shah Kaku,
Chak35f and G.T.Road Femzewala, opposite Daighi Park, Darghi Park and Ahmad
Nagar Ferozewala.

100
I'll ble 5.1 The vegetation distribution in Association Suaedetum frutieosae
IS 16 n IS 19 20 II 22 CLA141 12 13KiuitUBg Number 2 J 9 10J 7 3 114 6
KSK KS KSK KSK KSK KSK KSK RIF RIF RIF C3S DPF KSK KSK KSK KSK OOP C3S GTR C3S C43 ANFKtkcv’i CmJt So:
VV FE FFK
200 36 163 196(2J 255 254 257 259 233 8566 69 J14 70 71 320 66 251 252 253 84
44 44 44 44 44Art* of Mrlo'r ml 4 44 4 4 44 4 4 4 44 4
60 75 60 75 307S 70 30 70 82 90 85 90 85 80 75 75 60 65 66 65 68%jiÿe oner
5 K4 63 J33 J33 3 2No. of ipnlu 2 35 5 34 3 26 6
V5 567 677 7latda InitiiIMO 77 87 6 9 87 6 6 * S6 9
IV3 23 33 23 3Kuchin initial 22 2 33 2 23 2 2 2++
IIV22 42fnma aruhru 5 22 4 4+ 4
IIAthaj;i maunman 525 5 4+
24C flityza amblgua J 5
35t jnodon liinfyion 3
1 I3Uicairlhiim ,tmt.il,nnm 3
1I'Hfiiuchnnt fuxca
lypha angiuieta
Alto in JRWCI1VJ \'O. (KSK-J20) jihyia nodithmi-2
3
t2 (3 3 3 4
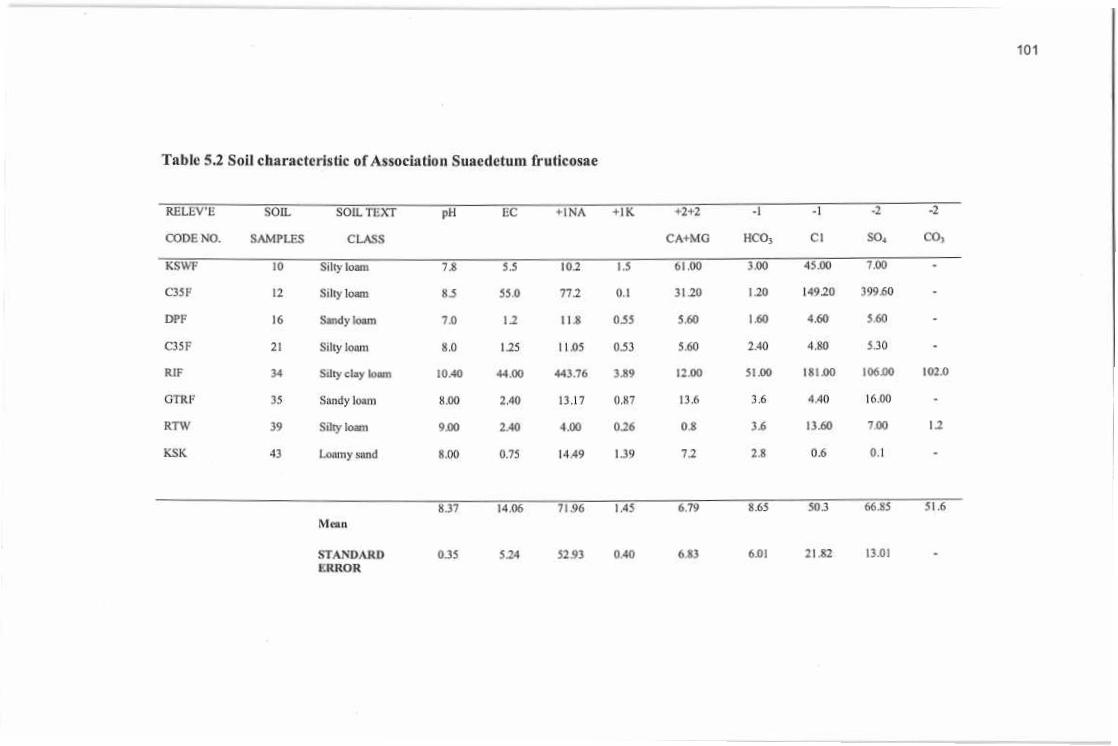
101
Table 5.2 Soil characteristic of Association Suacdcluni fruticosae
-2-2-1-1+2+2RELliV’E SOIL +1NA +1K.SOIL TEXT pH EC
CO,SO*ClCODE NO, SAMPLES HC05CA+MGCLASS
7.TO45.003.00KSWF 61,00ISSilly loam 7.S 10.210 5,5
149.20 399*0C35L 120Silly kiam 31 2012 772550 0.1Si
J 60DPF 4.601605,6016 055Sandy loam 127.0 11.8
5.304.80C35F 2.405.6023 I.2S 1 1 .05 0.53Silly loam 8.0
IHl.ua 106 00 102.0RIF 51.0012.0034 +43.76 3.89Silly clay In am 10.40 44.00
16.1X1GTK.F 4.403.613.635 13.17 0.87Sandy loam 2.408,00
127 00RTW 13.60026 36Silty loam 0839 4.009.00 2.40
0,1KSK 0.62.87.243 Loamy sand 1.390,758.TO 14.49
51.68.65 66.856.79 50271.96 1.458,37 14.06
M tAQ
13.0121.826 83 601524 52.93 0.40STANDARDERROR
0JS

102
53 Association 2: Association Kochicturn indicum
In Table 5.3, twenty stands of different areas show the floristic composition of this
association. The stands show that Kochia indica is dominant with constancy class V
Suaeda jruticasa and Desmostachy bipinnatae are differential species with constancy
class V and IV respectively. Cynodon dactylon; Alhagi maurorum, Sporobolus
arabicus, Spregula rubra, Rumex dentatus and Pegtmum harmala have low
constancy class and are companion secies.
The association is represented by two sub associations, sub association typicum
when: Kochia was dominant and other species were sparsely distributed, while sub
association Kochictosum indicum and sub Desmostachyetosum bipinnatae show
Desmostachy bipinnatae constant along with Kochia indica, while other species were
very rare.
The association has the soil characteristic with texture class sandy loam, silty loam;
pH 7,50 to 8.60; conductivity 0.99 to 4.00 m.mhos/cm; Sodium and Potassium 5.9 to
27 m.cq/1 and 0,25 to 0.77 m.eq/1 respectively Calcium plus Magnesium 2.00 to
10.8* sulfates 1.00 to 20.5m.eq/L Bicarixmatcs 2.02 to 6,00 m.c q/1. Carbonates were
totally absent mentioned in this association Table 5.4.
The association is well distributed in moderately saline habitats of Ferozewala
Stands of associations were collected from Kala Shah Kaku.

103
Tii bio 5.3 The vegetation distribution in Association Kochictum indicum
Sul) Assodulinn Kochieiosum indicum DcsmostachyfMsurn hipinnatacSub Association
CLASS20IVJ7 IK15 Id1312 14IIKimiiliig Mu. Z 8 III3 5 7 VI 4 6
KSk KSKKSK KSK KSK KSK KSKKSK KSK KSK KSK KSK KSK KSK KSK KSK KSK KSK KSK KSKRclcv'c Cwle V&.
334 331335333331343345y.u 344347337 339 341 350 34ft336 346 341 34933«
4444 4444Arc* ofRelo 'em! 4 44 4 44 44 4 4 44
HS VOvt. HO6565 6070%Hllc cover 85 6000 HUNV 75 8585 711 HO
5 K5 573 3 435 3 3N«. of ipectrt 1 2 31 1 2 2 42
7 V77778 76Ktnliln intiicn 7 67H 7 7 68 7 7 78
3 V54J 1131IwAle/nifniM l5 4 3 65 64
53 IV3 l2 I23 2On movloi hy i55
bipinnaln
II12 21 +CyfiiJitit dartytoN 4
II22 2+Atkttl mauntrum i3 +
3 +Ru IMJI-V denutut'.
I3Pryunum jp

104
Tabic 5.4 Soil characteristic of Association Kochictum indicum
-2SOIL TEXT CLASS -I -2IK -2+2 -1EC UNAPHKELtV'E SOIL
CL SO* CO*CA MO I ICOiCODE NO SAMPLES
2454 00 600 12.517.00 0 51S-45 2.1Silt)1 loamKS\VF 44
1.5 1.00025 6 00 6.007,85 0.15 250SandyKSKF 45
2.00 2J0590 0.37 9,007,55 0.99 5-90Silty loamKSKF 46
16 70 2055077 10 80 2804.00 27.60Clay loam 7 5KSKF 47
5.60 3 SO320 6601.60 12.80 0.31Silty loam 8.45KSKF 48
4.68 7.6613.16 6 607.96 11.140.441 90
Mean
0.94 2.99 4.740.09 1.44020 0.56 4.4)STANDARD ERROR

105
5.4 Association 3: Association Diplachnclum fuscae
The association Diplachnetutn fuscae is characterized by dominance and constancy
class V. Salinity indicating species Suaeda fruticosa and Albagi mattrorum are
frequent, two sub associations recognized are sub associations Diplachnetosum
fusca. sub association Alhagietosum maurorae, Imporata cylindrica. Acacia arabica,
Sonchus taper, Polygola abyssinica. Dicanthium amndatum are companion species
with low constancy class.
The Table 5.5 shows that this association has texture class loam, pH ranges in
between 8.00 to 9.4, electrical conductivity 0.65 to 66.00 tn.m hos/cm, Sodium
concentration 0.26 to 4.37 m.cq/1, Calcium plus Magnesium 0.8 to 30,40 m.eq/J;
Bicaibonates 0.16 to 5.6; Chloride concentration 0.6 to 399.00 Sulfates 2,6 to
316,00, Carbonates arc present only in one sample i.e. 3.2 m.eq/1 (Table 5.6).
Stands of associations were collected from Chak No. 45 Ferozcwala, Al-Sheikh
Trust Hospital; Kala Shah Kaku and opposite Darghi Park. This is also called as
Kallar grass and well distributed in most of the salt affected areas. Diphchttefusca is
suitable species for cultivation with salt afleeted soil.

106
Table 5.5 The vegetation distribution ill Association dlplnchnctum FtiscacSith uttadutioil Dlplwhjietiiiuin finea i; Sub auMHiilJun VlhJijjivfrmiiii muurorur
19 20 2! 22 23 24 2S CLA10 tl 12 13 IS 16 178 145 7 9 IX4 6321Rutininu No
SS
C45 C45 C4J C4S C45 C4) C43 C4) C43 C4J C43 AST C43 our KSK C43 C4J C4S C4J r*s C4J C4] KXKRdfV Code No C4) C*3
r f f rf F F F F F fF F H F F FrF Ff FF
316 146 147 US |49 130 210 291 31] 134136 (42 137 142 14) 283 144 284It139 140 1)1 8 104
4 4 4 4 4 44 4 4 4 4 4 4 4 44 4 4 44 44 4AreflofRdev'e 4 4
m2
93 90 95 98 99 98 70 80 80 8590 90 TO 60 60 60 85 80 80 75 89 90 88 90Percentage cover 90
3 3S 3 3 22 2 3 31 I 5 3 2I t KI 1 11No ul species
9 7 7 78 X 8 9 9 9 V8 8 8 8 8 78 8 9U/J.U Awr/nted 9 9 S 889
2 4]MMtl flMKIM
3 2 i3 2 2 (> II3 6 6
J 5 34 3 5 IIfjryrenijfl
I+ +aralm'c
4 I,Viiii i Inn Ji/irr
4 4/’ÿ v i jpiJ.j .iiViaimiiji
3 13
iWIUrtfllliUTJ

107
Table 5,6 Soil characteristic of Association Diplaclinetum fuscae
son. TFXT CLASS pH ECRELIVE son. + 1NA + IK +-2+2 -I -i -2
CODE NO SAMPLE CA'MG HCOi Cl SOj CO,
2 Sandy loam 220.65C45F 3.45 lOJ 2.35OSS 320 2.0
9.40Silly loam 8.00C43F 51J7IS 0.84 2.40 5.6 3220 3219,00
20 Silty lu.mi 1.50C43E S.15 13.50 129 5.6 0.16 6.46 8.40
27 Silly loam 82 5.50ANT 1020 o.ss 10.00 3.00 22-50 29,50
Silly loom39 2.40ODPF 3.209.00 0.26 0,30 3.60 1360 6.30
41 8.00 15261.45ASTfl 4.37 4.00 2.40 020 5 90Silty tlay loum
85.1942 8.7 66.00 30.40ASTIi 128 5.00 339.00 316 00Silty loam
43 8.00 0.66KSK 14.40 129 7.20 2.80 0.60 2.60Lomny stand
8.08 10.51 48,8126.04 1.46 7.95 3.09 52,81 3.2MEAN
0.17 7.96 9.79 044 3.36 0.59 41.06 38.31STANDARD ERROR

108
5.5 Association 4: Dcsmostachyduni bipin natae
In Table 5,7 twenty four stands of different areas show floristic composition of this
association. The stands show Desmostachy bipinnatae is dominant with constancy
class V and Kochia indica, is differential species with constancy class Jl Dicanthium
anmdatum; Athagi maurorum, Phalaris minor; Calatropis procera, Cyrtodon
dactybn, Conysa amibgita with low constancy class are companion species. Rumex
dentatiis, Importta cylindrica; Sonchus asper and Oligomeris glaucesens are also
present in few Relev‘es. Desmostachy bipinnatae is one of the most salt toierant
halophytes species. It is very frequent on xenc and dusty soil.
The perennial species grow in tussocks and form a component of several other
communities occurring in saline habitat of the Fcruzcwala. The association is found
on soil with texture as silty loam to sandy loam pH 8.1 to 9.4, Electrical conductivity
0.6 to 66.0 Sodium and Potassium 8.00 to 85.19 I m,eq/1 and 0.2 to 4.37 m.eq/1
respectively. Calcium plus Magnesium 0.8 (o 30,4 m, eq/i; Sulphates 2.3 to 316.00
m. eq/i. Bicarbonates 0.16 to 5.6 m. cq/i carbonates ore only present in one stand i.e.
3.2 ra.eq/i and absent in rest of the soil samples (Table 5.8).
The association is well distributed moderately in saline habitats of Ferozewaia.
Stands of association were collected from Chak. 45. Ahmad Nigar, Rice Research
Institute of Ferozewaia.

109
Tabic 5.7 The vegetation distribution in Association Desmostochyctum bipinnatac
H 2,1 24 CLA20iv 2117 tK14 16il ISII 131 oII u Dili ns;
Number
Rdev'f ( ndr
3 5 8 tfl2 4 f.
ss
C45 C45 C45 AWT C45 ANF AM AN6HJF AM ANTRIFL’45 C45 ANF ANF ANF RIF H 11- ANF ANF ANF ANF RIF
FFF FFNo, F185is,I5222V ISIIS 20212 17215237 14521 217 244237 23V 241 211 21V16 224 216 240
4 44 44444 4 4Area of
lliltr'ci m2
%»Se rr
No, of ipcdei
Oesmo.tiinhyn
bipiHHalU
Kochia irutiea
Dicemhlurn
4 44 4 4 44 4 4 444 44
vq sotsvs V)55 Bvs VOtooVJso vs100V6 sw V5 VO100 V5 V5 vsNO V0
K.2434 42 21I 43 41 3 S 32 3 2 44 4 3 4
V66 67 6 67 67H 7S SV s10 H 8 V S8 H V N
It32 3 3-+ +++
HI3 3353 43 3 3 4 +4 4
aiutuluium
III4 2 44Aihagi 2
maurorum
II3 55 65Pbttlari* minor
CtJarropis
43
ItJ22 33 2 23 2
proccra
Cynotion
daaylun
L'oiiyz/i
anihij/ua
3 I3+6
133 3
Alwra Rtk%> RoiANf -2W| Huarr Jrm.mo J.Itdev't No(ANF220| htpcnMo cftMtoirint 3 R«l*v"* No(ANF llljfmiAoaipff IlWcv'i S« |t'<5f I7.C4JF lljt)tr.wjÿimi'ci(pii

110
Table 5,8 Soil characteristic of Association Desmostocbyeturn blpinnatac
+IK *2+2
CA-MTi
-2 2-1 -IRELEV'E SOIL SOIL TEXT CLASS PH EC +INA
!:( tJ CL Sth co}CODE NO. SAMPLES
37,00an; M.l« 82 10.4 3.6 44.41R.5C45F 3 Clay k>ani
135.20 102.40 92 039-60 197 52 0.53 12 66.40C45F
C45F
4 town 10.45
3.20 2 60 I Ofl [.408 Silty loam
Silty loom
Silty loam
Si.05 0.50 2.63 1,04
2S0 45 34S.45 4.9 49.10 0.13 9.60 0.16ANF 22
ZM 2.40 4.80imn 17.50 1.43 3.20ASF 2S 8.40
24JO 67 80 4J09J0 10 00 1 1 00 1-30 4.00 400ANF 29Silty loam
15 007.80 220 3.93 3 1 1120 320 3.SOANF 30Silly login
0-52 ft,80 3.00 25.50 56SDRIF 32 S.W 8 50 91,39
Sandy loam
29.87 41 2S 4S.0St. I 9.JS 57.28 I Hi 6.70MEAN
12.180.32 4S 23.36 0J2 127 7.96 [6.00
STANDARD ERROR:

111
5,6 Association 5: Alhngielum maurorae
In this plant community type Alhagi maurorum with constancy class V is dominant.
The differential species are Suaeda Jrutlcosa, Kochia indica which have low
constancy class and cover abundance. Paspalum distichum. Acacia arabica,
Polypogon monspleiensis, Afelilotus indica, Scirpus maritimus, Conyza ambigua
and Polygola abyssinica arc companion and rare spccies(Table 5.9). However,
Alhagi maurorum is more frequently present on waste land, while SuaedaJruticosa,
Kochia indica are present only on saline soils.
With the decrease in salinity level in the substrata the percentage occurrence and
percentage cover of this species increases. The characteristic species were seen
abundantly present on many other waste lands with almost negligible amount of
salt. The association is found on soil with lexture as silly loam to sandy loam pH 8
to 9, Electrical conductivity 0.6 to 14.0 Podium and potassium 1.2 to 20.1 m.cq/1
and 0.7 to 3.10 m.eq/1 respectively, Calcium plus Magnesium 0.8 to 10 m. cq/i;
Sulphates .02 to 55.40 m. eq/L Bicarbonates 0.1 to 3.6 m. eq/i carbonates are only
present in two stand i.e. 1.2 m.cq/i and absent in rest of the soil samples (Tabic 5.8).
Stands of associations were collected from Chak No. 45, Ahmad Nigar, Ferozewala;
and Rice Research Institute, Kala Shah Kaku.

112
Table 5.9 The vegetation distribution in Association Alhagictum maurarae
CLASS15141312117 10Run nine No. S«2 53 4
KSKKSKC3<F C3SF ANF C3&K ANF C38F ANF C3SF ANF im:Rdev'i Code Nu. C45F C45F ItIF
)I5US 514204 206WSI205 7754 150 76 79157 264
44444 444Area n( Rdn> ml 44 4 44 44
006570 6595 90HQMl%*!(* Cover 95 40 6095 90 SO90
2 K4 22 2i33 1Nu. ol Spfdn 3 43 I3
V6667 S97T 7A iiiaet maurontm 79 *S <IV2332Suat'da fruticosn + +
lit+323 3 3Kothio 2
111454PaspaUam dinithttm 4 44 4
+.4 t'actu iirab/ta +
+PolfpogoH manspetiensi* +
\frtmtfu\ iiutk-a 3
Sctfjt u\ maritiitntui +
ConyZa SUnbiguu *
Poiyfalti abyxsiniat

113
Table 5.10 Soil characteristic of Association Alhagietum maurarac
-2-2-I-I+2+2t IK* INaF.CpHRELEVÿ SOIL SOIL TEXT CLASSCODE NO SAMPLE_ CO.SO.CLHCOjCA+MCS
8.62.42.0:LJ."0.511B.OSandy clay loamC45F 5
5.105.03.47.81.0682I 38 7Loamy sandIIC38F
8.446.40.15J61.79135158220 Silty loamC43F
1,2554081,0369.612920.114.09.026 Silty loamANF
0222 53.010.00.3610.25.58.2Silly loamKNF 27
0 0258.0321 123.103.8227.830ANFSilty loam
1.20.0213.63.6026 0.81.22.49.0ODPF 39
Silty Imam
0.10.62.8721,39[4.40,68.0K.SK 43Loamy Sand
129,616.92.7751303.5 32.883MEAN
6.69.40.433)03024. t1.50,1
STANDARD ERROR

114
5.7 Association 6: Sporoholeturn nrnbicae
The vegetation of this association (Table 5.11 ) consists of Sporobolus arabteus being
dominant and constant. Kochia indica was also constant with percentage cover.
Desmostacbya bipnnata, DtcarUhium annulatum, Cynodon duetyIon, Medicago
denticulata, Sacclutrum sponfaneum, Rumex dentatus arc companion species with low
constancy class. Sporobolus arabicus grows in non saline soil.
It is also commonly found as a primary or secondary invader of saline soils, occurring
with it are other salt tolerant species such as Suaeda fruticosa while in the non saline
soil it is associated with Dicanthium annulatum. Cynodon dactylon. Ccnchrim sp.
Sporobolus arabicus may form dense nearly pure stands on borders of saline pans,
where the mean salinity is nearly 5 nunhos/cm. Another species of this genus Le. 5.
airoides has been widely studied in U.S.A. and Canada, In his phytosociological study
of San Augustine plains. New Mexico, he reported that S. airoides was common
species on heavy alkaline soil.
The total range of salinity under which the association grew in Fcrozcwala was 2.05
m.mhos/cm conductivity. In some places when it was well represented character
species was dominant, the salinity is 1536 m.eq/1. Our studies have shown that it is a
facultative halophyte because it was common in non saline soil, also common where
there is an increase in sub surface salinity. Species is killed and areas arc then invaded
by more salt tolerant species such as Desmosiachya hipinnata and Suaeda fruticosa.
It is commonly found in sandier (salty soil broader-salt pans) soil texture, Sporobolus
stands ranges from silty to clay soil (Table 5.12). This association was collected from
Kala Shah Kaku, Rice Research Institute and AfsarTextile Mills of Ferozewala,

115
Table 5.11 The vegetation distribution in Association Spoioholeturn arabieae
ciavi13 1412II9 1085 7Run n ini' \n. 3 61 I 4
OIMF OIMF OIMFOIMF DIMF OIMF OIMF OIMF OIMF OIMFRtlo'c* code No, RSK RIF RIFK.SK
98 994693 94 9!9197362 91 100363361 364
444 444 444Area of RcUVmZ 44 44 4
9555 80955060 70987(185 84 60%sigt cover 8380
K43 35355 672 6No. of s|ui;Ic* 2 32
V55 55577 68 7Spmbpa ombaciii 88 8 7
V32 +2 +Kuchin iiitih u + +2 2 + + ++
II23Damn stmltytt bipnnaui ++
rv2335 5 65SUkunthium annulnutm 5 5
II+2 +CytMituji dnctyioti 2 +
II232Medh-uifo denticulate +
IISacchamm spuntanrunt +++
I2Rumex dentutus

116
Table 5.12 Suit characteristic of Sporoboletum a cubicac
-2-2-1-1Rclcv'c SoilCode No. sample
-INa +1K +2+2Soil text class pa ECCQ3Cl 504HC03
10.4 6.5OTMF 1.25 +.0 3.613 Silty loam 8.0 2.05 15.36

117
5.8 Association 7: Polypogactum monspeliensae
This association is characterized by dominance and constancy class V of characters
of Polypogon monspeliensis. Salinity indicating species as Kochia indica, Sutteda
fruticosa (differential species) with class IV arc sparsely present. The association is
composed of non saline soil, but it is primary and secondary colonizer on slightly
saline soil. This association is composed of three sub associations that is sub
association, Polypogaetum monspeliensae, sub association Erythraetosum
ratnosissma. sub association, Alhagietosum maurorae. The companion species arc
Phalaris minor, Erythrae ramosissma, Alhagi mauranim. Polygonum plebjum,
Cynodon dactylon, Scirpus maritiumus, Dicanrhium annuiatum, Chenopodium
murale with low constancy class (Table 5,13),
The ecological characteristics such as soil texture is sandy clay loam, loamy sand,
salty loam, pll ranges in between 7.8 to 9,05, E. Conductivity 0,6 to 14,0
m.mhos/cm, Sodium and Potassium 12 lo 20.15 and 0.70 to 3.1, Calcium plus
Magnesium 0,8 to 10.0, Bicarbonates 0.16 to 3.0, chlorides and Sulphates 0.6 to
81.0 and 0.01 to 55.4 Carbonates are present only two samples i.e. 1.2 m.eq/l
(Tabic 5.14).
The Relev’es of this association was collected from Darghai Park, Afsar Textile
Mill, Kala Shah Kaku and Chak No. 45 offerozewala.

118
Table 5.13 Showing the vegetation distribution in Association Polvpugaetuin moiispeliensae
Sub Association AlhaEu,iosutn mauraracSub Association Frythraetonum ramcAc asmaeSub Association Po(ypci#fletsum
mnnspclicnsac1)21 22»19171} IKkr1)Running No
RdevVCode No
It 14I 2 7 tos1 6 t »4
OOF C45F C43K C43F C45F C4JK C4JF C45FOTMF OTMF OTMF OTMF OTWF K5W OTMF CHFurr mw or MF CUM KSK US
MKF W
J: 33 34312*27 302»102 74 108 20no125 112 II 126 130 70 7t 103 115 101
A
44 44 4444 44 44Area of JteEcv'e m2 4
"'oogc cover
Ma afapeaw
POLYPOOON
MONSPEUENSIS
KOCHIA 1ND1CA
SUAEDA
FRUTICOSA
NIALARIS MINOR
ERYIHRAE
RAUORlSSIStA
ALHAGI
bUURORUMPOLYGQXUM
PJJZBJt/M
CVNonox
tMCTYLOX
SC1RPUS
MARITMUS
titCANTHlUM
AXMLATUM
CHEKOPODIUXt
MURALS
4 444 4 4 4 44 4
90 90VO9094 90909395 SO 9492100 95 95 90 90 90 90
3 3 3 2 3 3 4
7 7 7
95 889U 90K77 5687 K2 S3 35 42 6
V888 S898 X5 857 6X 7 97 i6 6
IV232 2 *3 +22 + + 4+ ++
IV2+3+ **
III3 3233 + ti
It5AJ 97
5 nr5 i4 +45 445
tit33 23 *333
IVJ53 445 3335 5 55
H55 S 4 43
14 5 5
I4 3

119
Table 5.14 Showing soil characteristic of association Polypogacturn monspclicnsae
-2*2Relev'eCode No,
Soil Soil text class EC +lNo +2+2On-Mg
-l -1pH +IKSO* COjHC03 Clsample
C45F 8,62.0 2.45 Sandy dayloamSilty loamSandy clayloamSilty loamSandy loam
0.7 8.18.0 1.1 9,5
7.03.0 45.0K5W
OTMF10 IJ 61.07.8 5.5 10.2
5.92.4 6,214 8.0 0,1 5,61,4 83
GTMF 10.82,4 4.815 8.7 0.7 18.41.8 16.6
5.8DPF 16 1.6 4.67.0 1.2 11.8 0.5 5.6
7.62.1 12.62.2 11J 0.7 19.77.9MEAN

120
5.9 Association 8: Erythraeo-polypogaetum-nionspelicnsae
The vegetation of this plant community (12 Relev’es) consist of Erythrae
ramosissma. Polypogon monspeiiensis being dominant and constant. Two species
have same constancy value. Sclrpus martimus, Cynadon dactylon, Dicanthium
amrulaturn, Sporobolus phallidus, Imperala cylmdrica, and Rumcx dentatus are
companion species (Table 5.15). Erythrae ramosissma and Polypogon
monspeiiensis have been found growing in soils that are non saline.
The ecological characteristics such as soil texture is silty to silty clay loam, pH
ranges in between 8 to 8.7, conductivity 1.4 to 8.5 m.mhos/cm. Sodium and
Potassium 8.3to 112.1 and 0.7 to .01, Calcium plus Magnesium 5.6 to 112,
Bicarbonates 0,8 to 2.4, Chlorides and Sulphates 4.8 to 20.4 and 5.9 to 63.8
Carbonates arc absent (Table 6.14). Electrical conductivity 1.1 to 8.5. 8.5 being
only in one stand. It is usually not found invading the more highly saline soil which
indicates that characters species have a more wide range of distribution in non
saline area. It occurs with many more species of saline community. About 8.5
conductivity, the characteristic species are very rarely present and if present,
growth form is vciy weak and small in size.
Within this community relative dominance of about 50% was of all graminoids and
contributed about 80 to 100% of vegetation cover in the soil sampled. It was
difficult to determine the edaphic factor responsible to produce pure stands of
Pofypagon-monspeliensis and Erythrae ramosissma and mixed stands of both
species. It appears Polypogon monspetie is happier in slightly xeric habitat than
Erythrae ramosissma.
The Rclev’es of this association was collected from Afsar Textile Mills of
Ferozcwala.

121
Table 5.IS The Vegetation distribution in Association Erytllÿÿac<>ÿ*Polypogaehlm-nloÿspelicnsJll,
12 CLASSn* 107 «5 62 3Running No. 4I
102 103104 332110 114Hriev'e CodcNu. 1*7I iM 10*ios100 101
OTMF in Mr OTMFOTMF OTMF OTMF OTMF OTMF OTMF OTMF OTMFOTMF
72 759$75757i. 70%»ge Cover 75 7378 9095
2 K3 335 4 3No. D/ Sptiici 44 4 4
V647 6Ertfht-iM- mmanttima 5 55 5 64 4«
Vs 3645Paiypagwi mtmfpelicnsLi 5 53 6 5 4 +
m35 1Scirpus mtrtlmm 5 34 5
(II54 6Cynodon dactyhn 5 45 43 4
Dictmtkium mwuliitum 5
4Spam bahts pita Nidus
Imperata cytindiicul 5
/turner datlatus 5 4

122
Table 5.16 Soil characteristic of Association Erythraeo-Polypogaettinwnoaspclicnsae
Relev’eCode No-
Soil Soil text class pH EC +lNa +1K +2+2 -1 -2 *2-lsample Ca+Mg HCOj Cl SO* COj
OTMF Silly clay loam14 8.0 1.4 83 0.1 5.6 2.4 62 5.9
15OTMF Silty bam 8.7 1 .8 16-6 0.7 18.4 2.4 4.8 10.8
31ANF Silty loam 8.2 8.5 0.7 U2112.1 0.8 20.4 63.8
93 3.9 473 03 11.7 1.8 10.4 26.0MEAN
Q2 22 34.9 0.19 3.7 03 4.9 18.5STANDARD I'll unit
123
5.10 Association 9: Vetcviarietuni zyzanioides
In Tabic 5,17, eleven stands of different areas show the floristic composition of this
association. The stands show Veteveria zyzanioides is dominant with constancy class
V. Polypogon mampetiensis, Erythrae ratnosissma, Dicanthium annulatum, Ruittex
dentatus, Conyza ambigua, Euphorbiaprostrata are companion species.
The ecological characteristic of this association indicates that texture class is silty
loam, sandy loam; pH ranges 8.0 to 83, conductivity 1.7 to 8.5 Sodium
concentration 13.1 to 117.1. Potassium 0.7 to 0.8, Calcium plus Magnesium 6.4 to
13.6 Sulphates 0.1 to 63.8 m.eq/1. Carbonates are entirely absent (Table 5.18).
The Rclev’es of these associations was collected from Afsar Textile Mill of
Fcnozcwala.

124
Table 5.17 The vegetation distribution in Association Vetevierietum zyzaniodcs
(IJLUII107 9K54 63Running No, 21
OTMS OTMS OTMS OTMSOTMS OTMS OTMSOTMS OTMSRcScv'e Code No, OTMS OTMS
259 261260258257256231235234233232
21222112 Z'u itt2 2 2
93 959593809S95 SOCiDVtr 9098 95
K.75 6654No. afspocici 57 7 54
V7t, 667 068 6Vcieilriei z\ mnhtdes 8 8
V23323 44 i(‘iihpogpn miiaprhrwn
V5555 35 4 45ramwitsmd 6 4
V++3 3 +OAmAim armulolum 44
V323 23Rumen dtmrnui i i }
13'233 2Conyza ambifuu 33
mi2 +Fuphorbfl* prcutrati 33

125
Tabic 5.18 Soil characteristic of Association Vetevierictum zyzanlodes
-1 -i-t-2+2 -irlKRclcv'eCotlr No.
EC +1N*Soil PHSuil tc\[ clanCO,SOJHCO, ClCa+MggampIt
63.82U.40.80.7 112ANF Silly clay loam S.5 : i7.i8.235
1.63.6 4413.6GTRF 2.435 Sandy loam SJO 13.1 05
0.16.0 18,06.4RTF 8.3silty loam 16.6 0.836 1.7
21.814.63.40.8 10.44K.9S.l 4.2
MEAN20.95.11.534.0 0.02 2.12.10.00
STANDARD ERROR

126
5.11 Association No 10: Imperatetum cylindrical'
The vegetation of this association (16 Relev’es) consists of Imperata cylmderica
being dominant with constancy class V, This association shows that Kochia mdica
have constancy class V with low percentage cover. Dicanthium awtulatum; Launia
sp, Polypogon monspeliensis, Erythrae ramosissma, Cyrtodon dottyton, Conyza
ambigua arc companion species. There are two sub associations named as
Imperatetosum cylmdrieae and Dicanthietosum annulatae (Table 5.19).
The plant community has a broad range of environmental tolerance since it occurs in
soils ranging front wet marsh to dry road sides and prairie as well as physiological
dry soil due to high toxic concentrations. U is generally limited to soils with salinities
less than 5 to 6 m mhos7cm averaging 0.5 to 1 m mhos/cm. It is dominant in
comparatively wet and non saline soil. Sub association Dicanthietosum annulatae is
characteristics of completely non saline and wet soil of mcsic habitat.
The ecological characteristic of this association indicates that texture class is silty
loam, sandy loam and silty clay loam; pH ranges 8.0 to 9.4, conductivity 0.6 to 6.0
Sodium concentration 8.3 to 51.3. Potassium 0.8 1.7, Calcium plus Magnesium 3.2
to 14.4 Sulphates 2.3 to 19.0 m.cq/1. Carbonates 3.2 in only one stand (Table 520).
The stands were collected from Kala Shalt K.aku, Chak No. 43, Chak No. 45 and
Afsar Textile Mill of Ferozewala.

127
Table 5.19 The vegetation distribution in Association Imperatetum cvlindrieac
Sub Assoc tdtior Dicttiiihietosum uinuliit.n!Sub Associmion Impcmteiosuin eyfiodriew
class1615141312II107 9Running Ha 3 s2 54 61
OTMF C43FC45F C45F C45F C45F C45FC43F C43F C43F C43F C45FRclcv'c Code No. KSK KSK KSK KSK
16210515Ay23161 ISOJ6K 146 1 65366 369367
444444 4444Arcii of RCICV'L’ m2 4 44 4 44
507565607075SO7550%ugc Cover 65 40SO 50 70 6080
444 444 4No of specici 3 42 2 42 2 2 4
V566577SKimpenda cylindrical 77 57 6 5X 6
V3++ÿ+Kothui tndicu 233 3 +3 2 +2 +
11155 43S653Dicanthiwn tintintermm
113344[.annulsp-
34PolI pagan moHspeltcmls
54Erythraexi ramesisima
Cynadnn dactytim 12
Sonndan vlcravi'Wt 44 4
+ +Rumor dcntntuf
ICorn.ti ambigtlil +

128
Table 5.20 Soil characteristic orAssociation Impcratefum cyiindricae
-2 -2+2+2 -IRclcv’e SoilCode No. sample
Soil text class pH EC +lNa +1K -1COjCa+Mg HCO' Cl SOi
22 2.0 23C45F 0.6 10.3 0.8 221 Sandy loam 8.4
5.9OTMF 5.6 6.2 6214 Silty clay loam M 8.38.0 0.1
19.0 32C43F 51.3 2.4 322 19.018 silty loom 9.4 0.86JQ
C43F 14.4 12.8silty loam 4.819 8.4 32 35.5 IJ 14.4
8.4C43F 21 1.7 5.6 0.1 6.4silty loam 1.5 13.58.1
9.6 3.26.2 9.1 9.62.5 23,8 1.08.4MEAN
2.82.1 5.8 3J00.9 8.4 0202STANDARO ERROR

129
5.12 Association No 11: Scirpctum maritimae
The vegetation of this stand which consist of 21 Relev'es show that Scirpus
mariimus is dominant with constancy class V, Kochia irtdica, Rumex dentarns,
Paspalum distichum, Polypogon monspeliensis. Sonchus asper. Phyla nodijlora,
Cynodon dactylon. Saccharum spontaneum, Erythrae ramosissma are companion
species, Scirpus maritimus is usually of moist habitat as given in Table 5,21.
There are two sub associations t.e. sub association Sciretosum maritimae and sub
association Polypogono-paspaletosum-dislichae* The ecological characteristics are
given in Table 5.22 in which soil texture class silty loam with pH ranges in between
7.8 to 9.4, Electrical conductivity 1.25 to 8.0 m. mhos/cm. Sodium and Potassium
concentration ranges in between 2.0 to 76,1 m.eq/1 and 0.3 to 1.9. Calcium plus
Magnesium 2.4 to 61.0, Ccarbonatcs are only present in two samples 12 to 3.2,
Chlorides and Sulphates 2,1 to 45.0 and 4.0 to 1 1 m.cq/l .
The Relev'es of this association was collected from Afsar Textile Mill, Rice
Research Institute, Chak No. 45 and International Industries limited of Fcrozewala.

130
Table 5.21 The vegetation distribution in Association Scirpetnm muritimne
Sub luocuabun I'.Jjpojeno papiieKMafn diuiclucSub uxxiiluiD ScspclMim ntiritimic
<lui2120IS17 iyIS 1612 1413II7 4Kmming No 10I 3 4 5 6 S2
C35F RTF C45F C4SF C45F KSW OTMF RSFRIF OTMF [ILF RIF RIF C4SF 1ILF 1ILF C45F C45F C45F C45F C45FRelcv’eCodeSo
MR 27373ISO 272 37 3* 4144 45131 134 39 42279 117 135 274 278 36 40
444 4 4444 44 44 4Afea of Rclcv'e m2 4 44 4 44 4 4
70 7575S7 9*3 M 80 75 7b 6087 85 » S285 80 80 85•jjcctmer 80 >0
3 K333 43 44 43No. i>f speem 3 35 3 32 3 43 3 4
V7 7 67 678S 88 88 87 8 7 7 8 8Siirpusmrilanun 88
16Y'i hta irrdU a 5
II33 3 4Rumtu Jtntastt \ 5 44 4
IV5 4436 +5 4Potfkihwn tiutuktim S 5 5 443
5 iv343 5S4 344/’olypogon Birtrrj/jpjWvrf L 5a 4
t4•WAvx arpfr 3
II’hyla nothfloru 3
ICynoifon diKtytvn ++
1+ji/ninuniruin -i-
II5 +Krytraua ramnwhmu 5 5

131
Table 5.22 Soil characteristic of Association Sclrpctum marjrimac
PH EC +!Ni +2+2 -J -2 *2Rclcv'e Soil Soil text clouCode No. sample_ + IK -I
Ca+Mg HCO, Cl SO* CO,
8.5 1.4 18.0 2.4 12 2.1 7.1 12C45F 6 silly loam 0.7
61.0 3.0 45.0 7.0silly loam 7.8 5.5 10.2 13KSW 10
4.8 10.88.0 1.8 16.6 0.7 18.4 2.4OTMF 15 silty lo&m
6.0 51J 08 2.4 5.6 32J 19.0 3217 silly loom 9,41JLF
silty loam 12 13.5 1.7 5.6 0.1 6.4 8.48,0C43F 17
4.037 silty loam 1.4 2.0 1.7 8.8 2.4 7.6RTF 82
8.0 76.1 03 2.0 16.0 62RTF 38 silly loam 8.6 8.8
15.3 2.3 16383 3.6 26.8 1.1 8.9 22MEAN
1.0 10.1 02 7.8 1.802 0.6 6.1STANDARD FRROR
132
5.13 Association No 12: Typhctum anguslitae
In Table 5.23 stands of different areas showed floristic composition of this
association. The stands showed Typha anguxtata is dominant with constancy class V
and Suaeda fruticosa, Polypogon tnonspeiiensis, Paspalum distichum, Sonchus
asper, Sonchus oteraccus and Scirpus martimus arc companion species with low
constancy class. Typha angustata is of moist habitat.
The ecological characteristic of this association is shown in Table 5.24 which
indicates that texture class of this association is clay loam and silt loam pH 7.5 to
8.4. Conductivity 1,6 to 4.0 m. mhos/cm Sodium and Potassium concentrations
ranges in between 12,8 to 17.6 and 0.1 to 0.7 Calcium plus Magnesium 3.2 to 10.8,
Bicarbonalcs 2.8 to 6.6, Chlorides and Sulphate 5.7 to 16.7 and 3.8 to 20.8 m.eq/1.
Carbonates arc entirely absent.
The Relcv'cs of this association was collected from Kala Shah Kaku and Chak No.
45 of Ferozcwala.
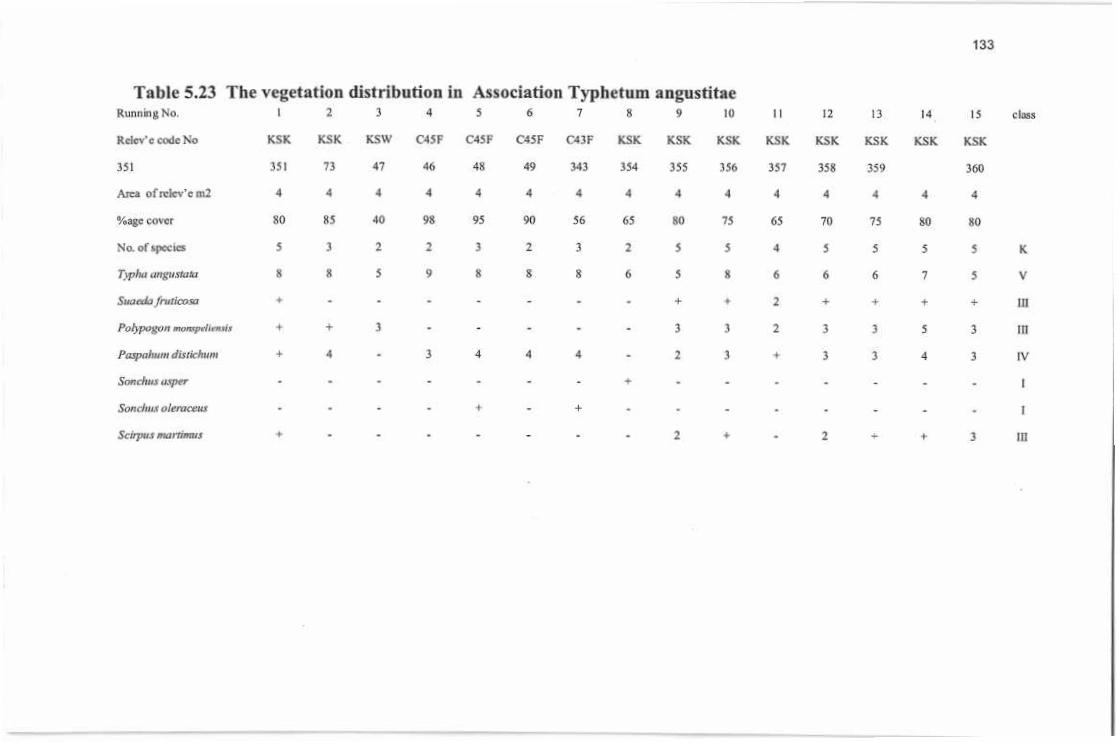
133
Table 5.23 The vegetation distribution in Association Typhetum angustitaeRunning No,
Rctcv'c code No
1 3 4 5 6 7 98 1 110 13M 14 15 doss
KSKKSK C4SF C45FKSW C45F C43F KSK KSK KSKKSK KSKKSK KSK KSK
351 73 47 48 49 355351 46 343 354 357356 358 359 360
Area of ndeve m2 4 44 4 4 4 4 4 4 44 4 4 4 4
S580 98 9540 90 56 65%agc cover 6580 75 70 75 80 80
5 3 22 2No. of ipccies 3 53 2 5 54 55 5 K
8 5Typhu anÿuxtuta 8 9 8 S 8 56 68 6 6 7 V5
Suaalij fruticoxa 4 2+ + + III+ ++
3Pafypogon momprlirntu 44 23 3 3 33 5 III
3Fiupnlumt distichim 4 4 44 4 2 3 3 3 3 IV+ 4
Snnchtis usper 4 I
Sonchux olemceus 4 4 I
2Scirpus nni’iimus 2+ 4 3 tn+

134
Tabic 5,24 Soil characteristic of Association Typhctum angustitae
+142Ca+M(j
-1 -1 -3KrlevVCode No,
Soil .SJJLI u'lt I'll EC +JNa +IK -1
Cl SO,Hoo*sample
ISClay Ittmtt IS 4.0 276 0,7 10JI I&.7 :o.sKSK7 47
5.6billy loam ft-4 1.6 12.8 OJ 3.2 tA 3.aKSK 48
HI 12.4MEAN
STANDARD DEVIATION
i}> 2.S 20,2 0.5 7,0 4,7

135
Table 5.25 Integrated Associations
A-Characteristic Species
vHi UI •v VII IXNO 11 VIII XAiSOti ill iitiii XI Ml
3-0* 031VSuuaiv jtvUcGza16-8(22l**VAim f’tn uui rn
7-0J Diplu-h’Wf fusca(25)v*««
DesmwHatitw fujivi nrffuA
i:4>v1 1SjVAlhtgi mjtinmim3
Sprobp.13 ,irabocu.i
Pah ivitun )ntuKfn{li f/ivl.r
5-Sil-l)Vb5-S<23)V7
Palypojtt in mompeliwix HiR<i2n
t'ifUfllJ .-ÿiituiidr: 6-8 ( 11 )V0frri/.vr<jftl ivJwdnftll 5-liltfr)VIII
Sririnm imin tinmmII M (21 >vTyj‘MI.........r. ii‘iJi: ?-‘)<15]V
f aver R«n°c<l>*mla Scalr) 5-0 ** TiiHl NoefRHrv‘r{12> CMUlMtv din 1 In V»**
II* Dlfftrmllal Sprats
AMOTIHIIPIIV M m VJI iy xuV VIII XIX XI XU
M‘ (22)IVKixkiu indteaI2-5(22)1112 Actum arabica
SuatdafivtbusaL >esmoitlitrli v blpinniun
1-4 1 22)**V
I -5 1 22)1V34
SuonFg frutuojti Lifga«ÿ*4:-i(2S)iir-uumrtan6
Kochla iru&cti 1-1 I24JIJ172-41,24)11Dictnithiim MtnuhniniN
SuatJii fruiiivsu9 1-3M5|IV
1-31Ij)HIKocbia im/n aIDKochiu initca M|14|VtlDexmtixlaciiut hlpunultt12 1-1(14111
11 Kochiu inJico 5-8
Suacdtifmthx>u>14 54)
(23)1V15 Scirpu* murtlmia 3-6
(I2)V .Cynadtn dmlylonIh 3-5
(12)111
F\ilvr>tmt>n maiapeliifuix 6-8 ( 1 1 IV17

136
2-4(ll)VIS !rillu .ii1 igwgjjww2-3A Ui.A'if JflllJL'l?10qt>)V3.5Dicmtthium tmnuiawm2flCfpll]
0-3 1 21 »A'ni'Aia jfi./fL tv213-5(21)11/flWfll'l jfnfO/H.V22
11-2 (13)111q Sutu'dafivticpsa0-3 <15)11124 Pohvcson iiuimrrlicims
* Cov<r Hu nyc < Utimla Scale) * •* OtHlllBCJ' rim*+* Total .No of Rdrv'r
C- Companion Species
mMIYY Y1 YU VIIIill 1YAnnclallom 1 Xi
Allwgt maururvm +-5*(12**'ll***
-i(2iaCiiHVUt iimh/xUii
0-3(22)1(Yinwfan iliiTvliwl)h Jilhiitm anmitglnni 0-JI2DTDifihu'tinar fuiaiT\yhn ownwtaM(NufjJmn daiHAonAIhugt Brumal
ftllHU-LÿAfiiriU
PrgfHtun ip
- -3) 32 )T
--*22)1
: :*--3(22)11.-j(22)11-3(22tl
0-5(25)1Imitmiiu njwiUrfl)
0--(2S)lAnotin arahiniSuni lilt; .iiptr 0-H2511PohtoU) ah)siinmi 0-4(23)1
0-3(25)1Pifanrhwm .minimumAlltngi mouronan_Phuluris minor
(1-3(24)11
(1-3(24)11
CnhU'opif itmernt 0-3(24)11( 'yntnlrw Jaiiylnn 0-3(24)1(5ml'.4j ainklijWi 0-3124)1
hwpnhum iUstit lnm 0-'1J5)L0-*(l 5)1Armhi urablcJ
Puh'Iiuxun r'JJijri',;' i i1.1 11, i.i ll l I ''ll
Mrtttmus ImhiM o-3M ;>x0--H15)!Scimut mariftumiii __
( n/iu.’ii mnhljitm_
1‘olygula ahymlnlcu_Dleanthtum anituhtlum
0-t(l5)l
0-ifl5Hi -2( l'))IV
CvnoJim tltulultm 1-2(14)11
'-3(14111AfttAyunu dfnlicuhilcI- (14)11Sticclnmim xponUmcwn
+-2(14)1+-6(23anPhuInrLt minor+-5(23)11UnihrM ramotiwinin

s- 3|* i =- E 5 » 3 5 S's : r ; 5 i ss-11 § 3 s-s*_ 3
__-s- s. SL -'ÿ' :Ej
a 7 *|ff|r§i *- • a-
as
iu iff furtin tni1
,r*
= i rÿ- ~ i'* tie|i Er 3 r
i l
tl £|1»si *
*? - 1 II In-• i* L
MI *£1 IIII
* R Er
= I l*3V
1I If 3 5i ff? I f* §- I5l§ I|!* E- e I1 5 l"
_VJ I UJ , -I-
? s & ~ isx £ B u eIM
— - & 6<
r_* £ ?*- ij*
r
W TJ J-J M—1 -— %—1—- r— - ——
* + £i-
Ct «* .*-*
< <<w
-£2
_I+ - > 3.—.
fillgap==;••-
sK>
+ii 1: aT3 i -t * W
fjwT-
i .ÿ *ÿ:
:i!du» '-fl 'S--T-. =, —
U>-

138
Table 5.26. Soil characteristic of each Association
XI XIIXIXNO V XIIIII VIASSOCIATIONS M IVi
SILT CLAY/SAN
SILT/SANDY/CL
SILTYCLAYLOAM
SILTCLAY/SANDYSIL
CLAY/SANDY/S1L
SILTYLOAM
SILT/SANDYLOAM
CLAY/5ANDY/STL
1 SOIL TEXT CLASS SILTYLOAM
SILTYLOAM YY
AY l.OA DYTY CLATYTYM LOALOAMYLOAM LOAMLOAM
MLOAM
8.3 7.97.9 8.18.3 8.48.38.08 8.07.9ft 8.612 Ph 8.370.2*0.2* 0.09* 0.2*0.2*0.25* 0.!7± O.I±0,35* 032*'*3.6 2.82.53.9 4.23.5 2.210.51 2.051.90 9,383 EC 14.06
534-* 0.9* LG*2.1*0.8* 22*5.15* 7.96* 13*43**±23.8 26S 2027113 48,9473153613.16
1.12*26.049.79*
32.871.96 57,28
23.36*4 +1NA
10.1*34.0*1.4* 8.4*34.9*2.9* 24.1**±1.0 LI0.8 030.7130 03LI0 1255 0.44 1.46+1K 1.45
0 2*022* 0 02* 0.2*0.19*0.30*1.45* 0.44*1,67* 032*'*153 7.06.211.7 10.46 7.5 19.76.79 7.96 4.0+2+2 CA+MC 6.60 6.70
2.1* 7.8*10,5* 2.1*3.7*3.36* 3.0*0.40* 0.93* 1.27***23 4.73.4 9.11.87 3.09 2.7 2,1-I HCO, 8.65 3.64.68 10.72
7,96* 0.6*03* 1.5* 5,8*0.5*3.5**± 0.59* 0.4*6.83*163 1LI12.6 10.4 9.610.4 14.6
5.1*8 29.87
16.0*16.9-1 Cl 50.3 52.817.66
3.0* 6.1*8.1* 4.9*10.3*± 41,06* 9.4*21.82*8.9 12.47.6 21.8 9 626.011 U 41.28
12.18*639 48 81
38.31*4.6-2 SO, 66.85
13.01* 1.8*20.9*0.9* 2.8*6.6* 183*83**±230 3.2*- 000 010 3.2 13-2 CO, 5!,6 0 48.0
-**STANDARD ERROR *

139
Rang** and Means of SodiumConcentration of Varlou*Associations
Ranges and Mean* of Electrical Conductivity
of Various AssociationsRanges and Means of p Hof
different Associations
80isa.a |
I i.CJac 8.6
CL 8 460
9„ 10
Hi ITo8.2 40% •oH 5
*a if> 7.6
5 20 miTS
I..11ill I>07.4 0 -r
1234 56789 1011121 2 3456 789 10 11 12 1 2 34 56 783 lO 11 12
No. Of AssociationsNo of Associations Mo of Associations
Ranges and Means of Potasium in differentAssociation
Ranges and Means of Bl-Cafbonjtesln
various Association*Ranges and Of Calcium and
Magnailum i n dlf f erent Association
172 25
jj.8.h.i.Jj. i ;lull j i i.i li,ii£ S 201.S
V
IS3
i.lI
io_ _
-40.5o T 5I II IIs oo 5* . 123456789 10 1132123456789 10 11121 23456789 10 11 12r
I No. of AssociationsNumber of AssociationsIN umber of Associations
Ranges and Means of Corbonatesindifferent Association
Ranges and Means of Sulfate in various
AssociationsRanges and Means of Cl In different
Association
608060 :c= 50
1 «*50 60mi 40 jta 3040 530 o20Cj20
II203 "I L0I 1 t~r7! 10 3Hia 0D0 >
1 2 3 4 S67H9 101H2123456789 10 11 121 2 34567 8 9 10 1112
No. of AssociationsNo. of AssociationsNo. of Associations
Fig 5.1 Showing the various ranges of Salts in different associations
140
5.14 DISCUSSION AND CLASS1FICAION
On the land surface of the world there extends a mantle of vegetation, a living fabric
of plant communities that is diverse and suitable in its response to environment,
varied in its structure and composition, expressive of biological productivity of the
land, interesting and aesthetically appealing to man. This mantle of vegetation, we see
now in many areas is being subjected to accelerating destruction. Many ecological
and anthropogenic factors may be involved, salinity is one of them and is of prime
importance. In this survey wc have tried to see how the different communities relate
to one another and express their environments. At the top of these considerations the
basic aim was to produce structure, composition and classification of the community,
types of the saline areas of Ferozewala using a standard terminology being
comparable with the phytosociological work carried out in the European and Anglo-
American countries. A special advantage of these investigations is the production of
environmental data which provide insight into the important factors operative in the
habitat e.g. soil pH, level of salinity, moisture level, grazing and extent of vegetation
cover. Salt affected soils are generally poorer in species than non-saline soils. The
distribution of these species appears to be controlled mainly by edaphic conditions.
These species appear to be selected out by the highly saline environment gradient
from the most to the least salt tolerance, with other ecological factors playing
secondary role. It was observed that successful species are also successfully
competitive; they are generally limited to saline environments indicating either a
requirement for excess salt tolerance or inability to compeic with plants with less
extreme environment. Thus a few of the most salt tolerant taxa Suaeda fruticosa;
Kochia indica, Diplachne fusca and Atriplex crassifolia are limited to saline
environment while other species such as Desmostachya bipimwta, Sporobolus
arabocus, Capparis sp. Alhagi maurorum are limited to moderate to weak saline
substrata, still other species such as Eleusinesp. Poiypogon monspeliensis, Cenehrus
sp and Imperata cyiindrica have more general distribution on a xeric to slightly saline
soil. The dominant and constant species in the sampled area are Suaeda fruticosa,
Kochia indica, Diplachne fusca, Desmostachya bipinnata, Alhagi maurorum,
140

141
Sprobolus arabacus, Polypogon monspeliensis, Erythrae ramosissima, Vetevieria
zyzauioides, Imperata cyiindrica,Scirpus maritimus and Typha anguslata.
The frequent species arc Rumex dentatus, Chenopodium album, G tnurale, Conyza
ambigva, Cynodon dactylon, etc, and many companion species arc also given in each
association (Table 5.25),
Several general changes in vegetation composition were recovered , such as reduced
salinity, increase in growth form (height) (see association Suaedetum frutkosae),
increase in density or increase in specks number (diversity) (see association
Potypogaetum monspeliensae), were recorded. Flowers (1957) and Ungar (1968)
have noted that generally there is a sharp decrease in species diversity with even a
low increase in soil salinity and then further drops in diversity until only one or two
specks are left which are capable of tolerating extreme salinity. This is in conformity
with our results as shown in Table 5.1 {Suaedetumfruticosae) (Relev’e No. 251 and
soil sample No. 34).
The ecological limitations for the structure, composition and distribution of various
plant communities recognized are edaphic (physical and chemicals), biotic (grazing),
soil moisture level and competitive ability of the members of the next community in
holosere (Schmelz andRombke, 2010). The connection between ecological
characteristics and plant communities (structure, composition, distribution) described
show that despite over-lapping to the ecological requirements, a clear segregation
exists between requirements of different associations.
Taking analytic (quantitative and qualitative) and synthetic characteristics into
consideration, the vegetation is grouped into twelve associations. Three associations,
Kochietum indicum, Diplachnetum fuscae and Alhagietum maurorae, belong to the
vegetation type of annual herb communities. Two associations, Scirpetum maritimae
and Typhetum augustitae form the vegetation types of emergent sedge and reed
swamp vegetation at the margin of open brackish water. Seven associations arc
described from salty vegetation dominated by perennial chenopods and grasses.
The relative concentrations of the major ecological gradient expressed in terms of
their ratio are of interest in determination of the ecological affinities of the
association. Twelve associations may be arranged in series according to sodium
concentration tolerance that is Suaedetum fruticosae> Desmostochyetum bipirinata.
Erythrae Polypogaetum, Monspel iettsae, Veteviarietum zyzanioide Scirpetum
Ml

142
maritima, Alhagieturn maurorae, lmperatum cylindrieae, Diplachnetum Jusca.Kochietum indicum, Polypogaetum mompeliensae, Sporoboletum arabicae and
Typhetum angustitae (Fig, 5.1).
Similarly the chloride concentration in different associations is as follows:
Diplachnetum fuscae Suaedetum fniticosae Desmostochyetum monspeliensis >
Scirpetum maritimae, Erythraeo polypogaetum, Veteviarietum zyzantoides,
lmperatum cylindrieae. Typhetum angustata, Kochietum indica. Sporoboletum
arabica, while concentrations of others arc shown in Fig 5.1.
There might have been certain variations in these tolerance ranges, if more soil
samples were taken. Although direct quantitative comparison is different, yet the
tolerance levels of the association are related to different plant communities described
by Unger (1974) for the inland salt pan of the U.SA. Out of all these associations
described, Suaedetum fruticosae and Atriplicetum crassifoliae are major associations
with a number of sub associations and variants (Qayyum, 1982) which colonize more
or less every type of saline habitat. In this survey these were lefl out and only few
Relev’es were taken. It is possible to work out several relationships between these
associations on the basis of salt concentration and moisture content in the substrata.
The initial colonizer on highly saline soil is Suaeda fruticosa with certain mesic
conditions. Spregula rubra will appear, if those conditions remain static but being a
spring annual it will disappear. Other annuals such as Atriplex crass{folia and Kochia
indica are subsequent colonizers. Subsequent colonization of the habitats is by
Desmostachya bipinnaia, which being perennial and deep rooted tends to colonize
xeric and dusty habitats. Further colonization seems to be in one of the three main
directions, degradation, and development of either xeric or mesic conditions.
A degraded association ( Veteviarietum zyzanioides) rises to prominence on sodium
poor soil, rugged soil and waste land. With the passage of time, this may tend to the
development of flora, typical of moist waste land (Chenopodium species and
Amarantus viridus).
From Desmostochyetum bipinnatae it may lead to more xeric and annual species such
as from Sporoboletum arabicae to Polypogaetum monspeliensae to lmperatum
cylindrieae. More loss in salinity level and an increase in water table lead to mesic
conditions via Dicanthium annulatum. It may lead to sub hydric conditions. Further
rise in water table and fall in salt (Tausccf and Mirza, 1999) which colonize more or
142

143
less every type of saline habitat. In Uiis survey these were left out and only few
Relev’es were taken. It may lead to sub hydric conditions. Further rise in water table
and fall in salt contents lead to Scirpetum maritirme and T)phetutn angustitae
associations, typical of marshy land.
5.15 Classification
In addition to describing the structure, composition and interrelationship or plant
communities, another aim of this work was to produce an inventory of vegetation
types comparable with Zurich Montpellier School of Thought. The classification of
these units into a hierarchy involves several difficulties. These difficulties are due to
non availability of local literature of community types from any local habitat. So one
has to depend on foreign related works. Taking these difficulties into consideration
and the classification proposed by different workers for the similar type of habitat,
Chapman (1974), Beaftink (1962), Shimwell (1971), Waisel (1972), Adam (1977),
Mhza (1978), Hussain and Mirza (1993), Mirza and Zia (1994), Ali and Mirza,
(1995), Mirza and Bashir ( 1996), Tausccf and Mirza (1999), as abase, the following
classification of the halophytic communities of Ferozewala (District Sheikhupura) is
being proposed.
1. CL Cakiletea marihmae. R.Tx, et Freising 1950.
o. Thero-suaedetalia Br.— B1 et de, Bob's 1957. em. Beeftink
1962.
A. Them -Suaedion , Br - Br - B1 1 931, 1933, em.
R. Tx. 1950.
Association Kochieturn indicum. Susedo-
Kochieium- hirsutae — Br. Bl. 1928.
Sub-association. Kochietosum md icum
Sub-association. Desmostachyetosum
bipinnaioe
Association. Suaedum fhnicosae (Ass. Nov. Prov)
Association. Diplacnnetum tuscae
Sub-association. Diplachnetosum fuseat
Sub-association. Alhagetosum maurarae
143

144
o. Desmoslachyetalia bipinnatac (Ass. Nov. Prov)
A. Desmostachyion bipinnatac
Association. Qesmostachyotum bipinnatae
Association. Alhagietum maurorae
Association. Sporoboietum arabicae
Association. Polypogaetum monspetierisae
Sub-association. Polypogoetosum monspdiensae
Sub-association. Erythraetosum ratnosissmae
Sub-association. Aihagietosum maurorae
Association, Erythraeo polypoganctum Monspdiensae
Association, Vetcvierietum xyzanioides
Association, Impcratum cylindrieae
2. CL Phragnitetea Tux. etpreg 1942,
Phragmiteialia (W, Koch) Tux eL Preg 1942.
A. Phragmilion W. Koch 1926.
Association. Scirpctum marimae (Br.Bll931,R.Tx.l937)
Sub-association, imperataetosum
Cylindrical
Sub-association, dicanthietosum
Annulatae
Association. Typhetum angustitae.( Eggl.1937, Schmalc 1939)
The case study has shown that in the Punjab Salinity, Sodicity and Water
logging are severe problems. This is a typical study of only one site (Tehsil
Fcrozewala of Sheikhupura District), Several such types of sites do exist
somewhere else in the Indus basin, This study is only a small example to
ascertain the deteriorating effects of salinity and sodicity on the soil, vegetation
and ultimately on the income of the tree farmers Agro farmers. Growing crops
(rice, wheat, cotton and rape seed) on the salt affected soils is less productive
due to low yield and thus economically non viable. The growth of the perennial
forage, salt tolerant grasses, Rhodes grasses, Chloris gayana, tall wheal grass
(Elytrigia elonga(e) and Kallar grass (Leptochloafused) is economically viable,
however, main focus should be on the economic utilization of the land while
still in the saline and sodic conditions as conducted by Mignaut, et ai, 2010.
o.
144

145
Use of the agroforestry and inlegrating the farming systems ( degrading versus
sustaining farming systems) seems to be more profitable where ever possible
alley farming belts of tree, interspaced with alleys of crop land) is more
economically useful.
Trees act as biological pumps. There is need to reintegrate trees and shrubs back
into agriculture landscape to reverse salinity such as A triplex amnicla . Tamarix
aphylla . Phoenix dactilifera, Prosopis spp, Susbenia bispmasa, Sesbenia
sesbena, Casarina, Grewia asiatie, Psldium guava etc. The incorporation of
these plants (grasses, shrubs and trees) into agriculture land system of the
Punjab has potential to increase crop, fiber, wood and animal production and
degradation of land will also be halted.
145

146
CHAPTER VI
SOILS AND LAND SUITABILITY CLASSIFICATION
The constantly growing population and the changing human needs is a great challenge
for the agricultural / forest land use planners. It results in the competition of different
land uses for the same tract of land and has led to an increasing need for systematic
national agricultural land use planning. Land evaluation is a comprehensive approach
and a best possible tool for systematic land use planning on sustained basis. Land
suitability evaluation for sustained crop production involves the interpretation of data
relating to soils, vegetation, topography, climate, etc., during an effort to match the
land characteristics with crop requirements (Hossain et at., 2007 and Alexis, et at.,
2010). The aim of these classifications is to guide the land users/plarmers in such a
way to put the land resources to the most beneficial use on sustained basis without
deteriorating the resources and the environment as well. The term Land Evaluation
refers to assess the suitability for forest trees of different tracts of land mapping units
for specific kind of use and to find out the land management alternatives that would be
physically and financially practicable and economically viable (Rodrigo et al,.2005).
Soils and Land Suitability Maps of various Agrocctogical zones represents land
resource information for different users including the Punjab Forest Department for
execution of it Farm Forestry Extension Programme.
These Maps are based on the data generated by Soil Survey of Pakistan, published in
its Reconnaissance Soil Survey Reports of various districts. These Maps give a brief
account of the various kinds of soils identified and mapped various Agroeclogical
Zones of the Punjab (Fig 3.1) and their classification for land suitability to grow
specific forest trees in combination with the (arm crops. The tree species considered
for the purpose are those listed by die Forest Department as the popular ones among
the farmers of different forest zones in the province. The land suitability classification
is intended to guide the farm forestry extension staff and the farmers in selection of
most adopted and promising tree species for each kind of soil occurring in the
farmlands as well as to assist them in adoption of appropriate soil and water

147
management technology that will encourage tree growth and improve quality of the
wood for maximum returns as envisaged under the project.
6.1 How to use the soil information
The information has been prepared for use by the personnel having no technical
background but only a limited knowledge about the soils who may consult only the
information given on land suitability mapping units’fgrouped map delineations given
specific colors and represented by larger, italicized, Arabic numbers and described by
using GiS software (Pcrveen et al.. 2004 and Alexis, et al, 2010). These mapping
units are much fewer in number and are described in a rather generalized form for easy
comprehension. What the user of this information ought to do first is to find out in
which mapping unit this area or site of interest (farmland) falls on the ‘Soils and Land
Suitability’ map. For that purpose, the map has been prepared in paper color prints
along with the related topographic map sheet. The transparent film of the Soils and
Land Suitability map should then be placed on the relevant pan of the topographic
sheet so that the geographical features drawn on the former get exactly superimposed
on the latter (NRCS, 1999).
6.2 Soil Mapping Units
The soil mapping units are described briefly with respect to their total extent in the
area, component soils series and their proportion, spotting characteristics of each soil
series, their major limitations/hazards for tree plantation and suitability for specific
tree species. For the sake of simplicity, some generalization has been done so that a
maximum of three important soil series that occupy more than 90 percent of the area
under any unit have been described with respect to only a few main distinguishing
characteristics (Shahid et al, 1998-99). The spotting soil characteristics considered
and the terms used for their description are as defined below.
Depth is effective thickness of the soil material above an inert or non-soil material
(sand, bedrock etc.); three depth classes are considered, i.e. deep (>100cm),
moderately deep (50-100cm) and shallow (<50cm) (Sheikh and Soomro 2006).
Drainage is the condition of the soil with respect to wetness or natural removal of
excess water, affecting aeration of the plant root zone; five terms arc used, i.c,
excessively drained (generally dry, water removed very rapidly, water table below
150cm depth), somewhat excessively drained (water removed rapidly, water table

148
below 1 50 cm depih), well drained (water removed readily, water tabic below 150 cm
depth), moderately well drained (water removed somewhat slowly or water table at
150 to 200 cm depth), imperfectly drained (water removed very slowly, water tabic at
100 to 150 cm depth) and poorly drained (water not removed naturally, water table at
50 to 100 cm depth). Calcarcousness indicates the amount of carbonates/lime present
in the soil material. (Rodrigo et al,2005 ). Structure describes the status of soil with
respect to its development; three terms are used, i.e. stratiRed (thin layers of different
material clearly identified; no structural development), weakly structured (the material
homogenized to at least 50cm depth, with no clear stratification) and moderately
structured (the material homogenized and showing well formed peds). (Hamid et at.,
2006). Salinity/sodicity presence of excess salts (salinity) and/or pH more than 8.5
which generally reflects >15% exchangeable sodium (sodicity); four terms are used,
i.e. “non-saline, non-sodic” (no salinity, pH <8.5), “slightly saline-sodic" (slight
salinity, pH S.6-8.8), “saline-sodic” (moderate to strong salinity, pH >8.8) and
“saline/sodic surface" (slight salinity and/or pH >8.5 in the surface soil only) (Herbst,
2001), while Soil texture describes the proportion of sand, silt and clay in the soil
material; seven classes are used, i.e. sandy (sand, loamy sand or loamy fine sand),
coarse loamy (sandy loam, fine sandy loam or loamy very fine sand), loamy (loam),
silty (sill, silt loam or very fine sandy loam), fine loamy (clay loam or sandy clay
loam), fine silly (silty clay loam), and clayey (silty clay, sandy clay or clay). (Harper,
2000). With respect to topography/slope, all soils should be regarded as level, with a
slope of <1%, unless described otherwise. The symbols used for land suitability (SI,
S2, S3 and N).
6.3 Land suitability for forest trees
The soil mapping units mentioned above were further grouped on the basis of
similarity in suitability and management requirements of their component soils for
planting forest trees. Such groups, called as ‘Land Suitability Mapping Units’, arc
described in Table with respect to their component soil mapping units, spotting
characteristics and proportion of important soil components, suitability of each soil
component for selected tree species and specific soil management
requiremenis/improvement suggestions. The proportion of the component soil series is

149
described in terms of 'dominant', ‘major', ‘considerable' and 'minor' which
represent >80%, 51-80%, 20-50% and <20% of the total area under the unit
respectively (Paul, 2007). The terms used for describing the soils and their proportions
are the same (Tabl3 6.1 to 6.17). The land suitability is described in terms of classes as
defined below (Carroll, 2004).
SI:Highly suitable for planting the relevant tree species; no or a minor limitation;
highly responsive to improved management and inputs; good for nurseries.
S2:Moderately suitable for planting the relevant tree species; moderate limitation(s)
of inadequate rooting depth, low water availability, and salmily/sodicity or impeded
drainage etc; fairly responsive to improved management and inputs.
S3; Marginally (or poorly) suitable for planting the relevant tree species; severe
limitations of too shallow rooting depth, low water/nutrients availability,
salinity/sodicity or impeded drainage etc; not much responsive to improved
management/inputs or requires too high inputs to be economical
improvement.
N: Not suitable for planting the relevant tree species; may support the plants with special
techniques involving high inputs but not economic to do so (Herbst, 2001).
for
It is important to point out that the Land suitability mapping units have been somewhat
more generalized than the soil mapping units in the sense that some minor soil
components described for the former, though significantly different from the major or
dominant ones, have been ignored in the latter because of their small extent and for the
simplification needed to make differentiation of the units relatively plant able for the
lion-technical farmer and Forest staff.
It may also be clarified that the land suitability for various forest species has been
assessed with the assumption that the species would be planted and grown for wood
production on commercial basis, rather than as a common practice. The species rated
as *N’ (not suitable) or as ‘S3” (marginally suitable) simply imply that their
planting is not economically feasible or is going to give very low return because of
slow growth rate and/or low quality of wood obtained, or special carc/high investment
is needed in terms of water, fertilization, amendments etc. for its planting which may
not be practical.

150
6.4 RAWALPINDI TEHSIL
Rawalpindi district, Agrowlogical Zone V-(Barani)
Location and Extent; The area under report is located in Rawalpindi District of the
Punjab Province* It lies between 33*ORJ N and 33 41' N latitudes and 72 37' li to 73 l&'E
longitudes. The climate of the area is classified as Humid Subtropical continent. The
mean annua] rainfall is 1142.1 mm, most of which falls during late summer (monsoon)
season. The mean daily summer and winter temperatures are 29,8C and 1J.3C
respectively. Mean daily maximum summer and mean daily minimum winter
temperatures arc 35.7 C and 3.7 *C respectively* The following major landforms with
specific nature of soils and hydrological conditions are distinguished in the area as loess
plains: This Iandform is charactered by the soils developed in wind deposited material*
This highly credible material, commonly known as loess, ranges in thickness from 60cm
to 20m, Past erosion, which is still active, has distorted the original level surface of most
of this landform from a minor degree to deeply dissected gullies. This landform
comprises the alluvial deposits of Soan River and its tributaries along their courses. Three
subdivisions of this landform mapped in the area are described as Active Floodplains,
Sub recent Floodplains and Dissected River. Soan River system mainly affects the
hydrology of the area* Highly credible nature of the soil material in most of the area has
caused the rivers to maintain their beds at considerably lower level than the surroundings,
which has rendered the rivers to contribute very low to the aquifer recharge. Thus the
rivers act merely as a mean of drainage in most of the area except the floodplains along
their courses where they contribute to the ground water recharge.
The original vegetation of the area was over thorn thicket Savannah, which has been
almost cleared except in the mountainous part. Vegetation cover of other species in
uncultivated areas has been reduced by over cutting/giazing; however, climatic
conditions arc favourable for their further growth. Dry-farmed cultivation oflood crops is
the main land use ofthe area except a minor part, which is under irrigated agriculture. In
the plains the most common species are Kikar {Acacia arabica), tier {Ztyphus jujuba ),
Poplar, Bakain, Shisham (Dalbergia sissoo), Mulberry {Morns alba) and grasses like
Palwan and Lhabal as reflected in Table 6.1 and Fig 6.1.
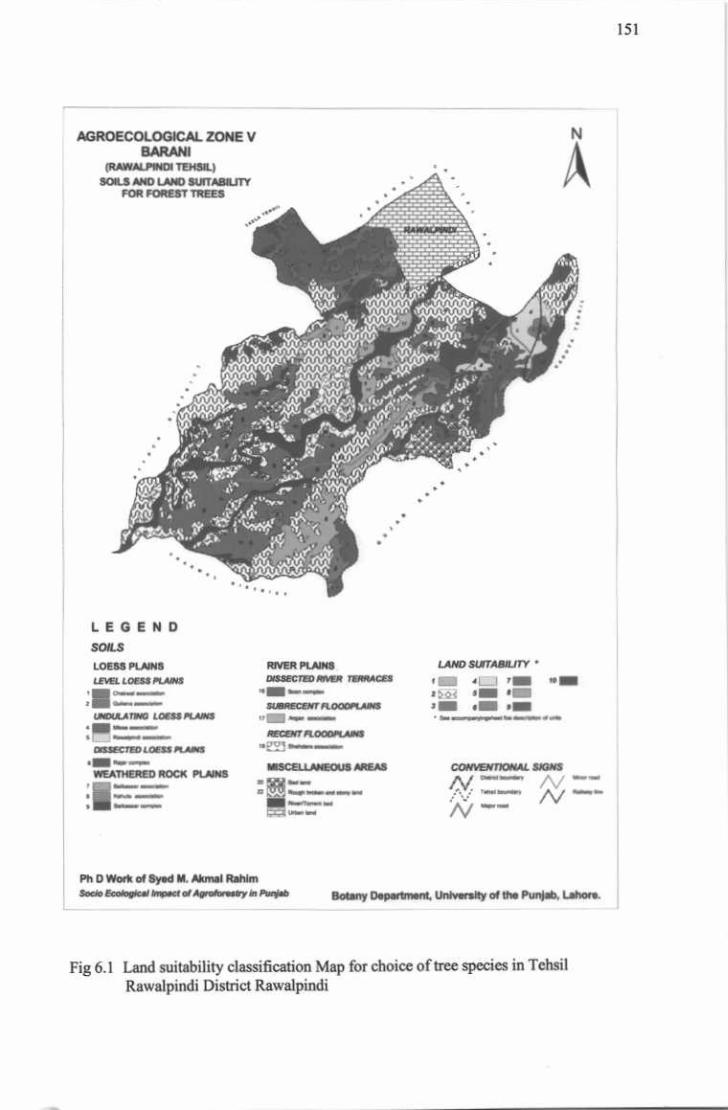
151
NAGROECOLOGICAL ZONE V8ARAN I
[RAWALPINDI TEHM.)
SOILS WO LAW SJJfTABIUTYFOR FOREST TREES
A-ÿ
:
/• r,lIÿRAAAJ yk fl :ÿ 'i ,
VÿJf% *“""J
'AMM
*
*.
LEGEND
SOILS
LOESS FLAWS
uiatowihAM
LAND SUITABILITY *
t
WER PLAINSrtl
4 j •m t «i*i *.< r| •1•IuouiMt LDmuM it|
:ÿ
COWVWnONAL SISKSWEATHERED ROCK RUMS
/V /vI A/
/V
Pti D Work of By*d M. Akmal Rahim
Botany Daparlmant Untvar»H> of lh* Punjab. Labor*
Fig 6.1 Land suitability classification Map for choice of tree species in Tehsil
Rawalpindi District Rawalpindi

152
Table 6.1: Land Suitability Mapping Units -Rawalpindi Tehsil: Component Soils, Land Suitability for Forest trees andspecific management requirements
LAND SUITABILITY FOR FOREST TREES Specific ManagementftequirerucnlVImprovemcni
Suggestions
I.ANDsurr. COMPONENT
SOU.MAPPING
UNITS
Spotting Characteristics of Component Soils**( proportion of the component soil)
f.n*A Atari*a.1rf!"J VTUt
StUr
Mdam Mod
indictMrtmlItem* Enrol
cmMmiMrMOIMB
VBll.ITJujubmtOorclh. moodtimniI
UNITNo specific menagemail required;ifcfcruse fi?r nurseries
Deep, well drained, part stratified silly/loamy(dominant}soils- irrigated_ S1S1 31S1 S1 81S1 SI S1 S1 SIStJ 17
No specific management required,add organic matter, light doves uf
Deep, well drained mainly stratified Kilty/ loamy(major)soils - irrigated
StSt S1 StSt 81 S1 31 SIS1 SZSI2 19H
faliliHf lo e name toe my soil* amtirrigateat shorter intervals
Deep to moderately deep, somewhat excessively(considerable)drained, strmified coarse loamy_ S3 S2S3 S3 32S3 32 S2 32 S2 S3SI
S2 Adopt appropriate manuremnscrvatiou measure*
S2 SiSt S3 S2 SI SIS2 SI StSI3 I.Z Deep, well drained non-caicarcou* fine silly soilsdominant) _Deep, well drained calcareous line silty soils
(minor)_ S3 S3S1 32 SI SI SI SIS2 S3 SIszAdopt appropriate mcicurcxHucrvation men«nc* and Inaddition soil conservationmeasure* Far gently sloping soil*
Deep, well drained silly soils[major) SI32 SI 32S1 32 S2 SI32 S1 SZSI4 s
Geniiy sloping, deep, well drained silly soils(considerable)with hiÿi lime confirm_ S3S2 S2S3 S3 32 S3 S2 S2S3 S2 S3
Atkipl Jjpprupriate moisture andtoil conservation mensure*
Slopping, deep, well drained, massive loamy soils(dominant) S2S3 S3 52 S3S3 $2 S3 S3 S3S3S35 16
Intricately dissected, loamy soils[minor) N NS3 N N S3N N N N NN
Gently sloping, deep, welt drained loamy soilsdominant) S1S2 31S2 SI 51S2 S1 SI SISI SI6 8
Adopt appropriate moistureaanservationmeasures
Gently sloping, moderately deep over bedrock,[rumor)well drained loamy soils
S3S3 S3 S3 S2 52S3 S3 S3 S3 S3S3

153
si Adopt appropriate rnoirtuic / soilcomcivutiun m<aiurc»
$3 SJ si S3 SI S3Slopping, deep, well drained silty sails(major) with high lime content
Gently sloping, deep, well drained, silty soils(considerable)with high lime content
S3 S3 S37 4 S3S3
S3S3 SIS3 SI SI S2 SIS3 S352 52
S2 Adopt appropriate moistureconservation measures
si(iently sloping, deep, well drained loamy soils (major) $2 St SI SI SI sz 51 SISI SIK 7
Gently sloping, moderately deep over bedrock,(considerable)well drained loamy soils
S3 S3 SI SI S3S2 S3 S3 S3S3S3 S3
Adopt appropriate moisture/S3 toil conservation measures
Slopping, deep, well drained, massive silty soils[major) with high lime content 5253 S3 S3 52 5253 93 S3 52 539 6
Intricately dissected, silty soi Is (considerable)N S3 N NN S3 N N N MN N
Adopt appropnatc moisturerorewrvatior measures and in
>ddilion soil conservation,
measure* (dr silly soils, avoidplanting on sandy soils
Gently sloping, moderately deep to deep over bedrock,[major) well drained loamy silty soils 5333 S3 S2 S3 53 S3 S3 32 S3 S3S3910
Gently sloping, shallow over bedrock, excessively[considerable)drained sandy soils
NN N N N N N NN N NN
* Subject to occasional flooding during high flood.** The characteristics arc generalized for important soil components of each land suitability unitThe proportion of each component is described (within parentheses) in terms of: dominant (>80%), major (50-80%). considerable (20 to 50%) und minor ( <20%),All the soils arc level to nearly level, structured/homogenized, non-saline, non-sodic, porous/pcrmeable, with water tabic beyond 150cm depth and containnegligible to moderate (0-14%) amount of lime, unless described otherwise. The depth is defined in terms of thickness of the rooting zone as: Deep (>
1 00cm) and moderately deep (50-100cm, underlain by sand),

154
6,5 CHAKWAL TEHSIL
ChakwaJ district Agrocclogical Zone V- (Barani)
The urea under report is located in Chakwal District of the Punjab province, it lies
between 32 " 34; N and 33* 13' N latitudes and 72' 28y E to 7'13' E. The climate of
the area is classified as Sub humid Subtropical Continental*- The mean annual
rainfall is 853.2 mm. most of which falls during laic summer (monsoon) season. The
mean daily maximum and minimum temperatures are 30,6*C and 16.4*C
respectively. Mean daily maximum summer and mean daily minimum winter
temperatures are 36.9 C and 6.1 C respectively. The following major landforms with
specific nature of soils and hydrological conditions are distinguished in the area.
This landform is characterized by the soils developed in wind deposited material,
This highly credible material, commonly known as loess, ranges in thickness from
60cm to 20m, Three sub-landforms recognized in the area are described as Level
Loess Plains, Undulating Loess Plains and Dissected Loess Plains. Hydrology of the
area is mainly affected by Soan River and its tributaries. Highly erodible nature of
the soil material in most of the area has caused the rivers to maintain their beds at
considerably lower level than the surroundings, which has rendered the rivers to
contribute very low to the aquifer recharge. Thus the river and its tributaries act
merely as a mean of drainage in the area except the floodplains, where they
contribute to the ground water recharge.
Dry-farmed agriculture is the main land use of the area except a minor part, which is
under irrigated cropping with well/tube well irrigation. Main crops grown include
wheat, maize, oilseeds, groundnut, pulses and millets. The most common plant
species of the area are Acacia arahk a (Kikar), Zizyplms jujuba_(Ber), Dalbergia
sissoo (Shisham). Moms alba (Mulberry), Populous deltoides (Poplar), Melio
azedarach (Bakain), and some grasses like Dicanthium annulatum (Palwan) and
Cvnodon dactylon (Khabal) as described in Table 62 and Fig 62.
The soil mapping units mentioned above were further grouped on the basis of
similarity tn suitability and management requirements of their component soils Tor
planting forest trees. Such groups, called as ‘Land Suitability Mapping Units', are
described in Tabic 62 with respect to their component.

\55
AGROECOLOGICAL ZONE- VBARANI
(CHAKWAL TEH81L)
SOILS ANO LAND SUITABILITYFOR FOREST TREES
N
ALEGENDSOILS
LOESS PLAINS
LEVEL PLAIMS**.a i
i*4 A.-iHI
UHDULATWfG PUUMt mt
*|!«lw| .
v 'fKSSECTED ALAINS
;WEATHERED ROCK PLAINS
"rr arVRM >To?Sl w*1 I
II HrilUHU rÿniAii I WKAJM
UVUÿLA(W
ikr?voOi/'A
i'wlvwwwwuWVAAIvwJ
0.SUBRECEHT fSEDMONT PLAINS
:11g j vo
!mRIVER PLAINSussecTto TwmAce
siasFCE.vr noocft/i*B
trVr mmxmttr
flCCfWT R.OOOKAH
CONVENTIONAL SIGNSLAND surrABturr
/VMSCELLANEOU8 AREAS
uuWj. tatfitnwmi
3£, r 1 •; •JfRVKllii mfl Mui
OMM
rf 4 /V-A/) S&3 s id)I
/V*1 fAy
9B I-
Sat. napiisy L*SS b#®TSoi rtiH rtf Riip< wr:
Pti D Wort of Sy*d M AJonal RaMmFcateyicjtf (nnp»c? .{Qf 4ÿraft«alfy in Puÿatfe Botany Department, Umvareity of tha Punjab. Lahore.
Fig 6.2 Land suitability classification Map for choice of tree species in TehsilCbakwal District Chakwal.

156
Table 6.2: Land Suitability Mapping Units -Chakwal Tehsil: Component Soils, Land Suitability for Forest trees and specificmanagement requirements
Specific ManagementRequireiiicnlg/lmprovumcnl
Suggestions
LAND SUITABILITY EOR I OREST TREESLANDSUIT-
COMPONENTSOILMAPPING
UNITS
Spotting Characteristics of Component Soils**( proportion of the component soil) M*n«aKik*t 'ItKtl Willnw Sirii JtiiaHi NWUiTnLiian; Sim l*opliir i IR . . I1, pi tlsfcsifi
olHiUTY
UNITa*iix
leMr
tmJkaMl ,K*4l
kUkaft— Udkl
•Ut4i.VmiDatt, r*»•
matCtA* Jdt
No specific managementrequired; add organic matter andlight doses of N fertilizer tocoarse loamy noils and irrigate ut
shorter interval*
Deep, wclJ drained, mainly stratified silty.loamy(major)soil$- irrigated SI SI SI SISI SI S2 SI17, 19 St SI SISII
Deep, somewhat eKcesffiively drained, stratified(coflildcrnblc)coar*c loamy soils •irrigated S3 SI SI S2S2 SI S2S2 SI S2 S2 S2
Adopt appropriate moistureconservation mcasiats
Deep, well drained, lilly/loamy soils(dominant) SI S2S2 S2 S2 SI11,14, 24’ SI S2 SI S2S2 SI2
Deep, moderately well drained, clayey soils (minor) S2 S3S2 S2 S2S2 S2 S2 S3S2 SI SIAdopt appropriate moistureconservation measures
Deep, well drained, calcareous fine silty/silty soils(major) SI S2S2 S2 S2 SI S2I, 2, 12’, 13’ SI S3 S2S2 SI3
Deep, well drained, non-calcareou$ line silty soils(considerable) _ SI S2S2 S2 SISI SI SI SI S2 S2SI
Adopt appropriate moistureconservation measures
Deep, moderately well drained, clayey soils(major) SI S2 S2 S333’ S2 S2 S3 S2SI S2 SI S24
Deep, well drained, fine silty/loamy soils(considerable) _ _ SI SIS2 S2 SIS2 S2 SI SI sz S2S2
Adopt appropriate moistureconservation measures
Gently sloping, deep / moderately deep, well drained(dominant) SI SI SI7, 16’, 19’ SI SIS2 SI S2 S2 S2SI S25
loamy wits Steep low hills with little soil cover(minor) N N N NN N N N N NN N
Adopt appropriate soil andmoisture conservation measures
Gently sloping, decp/modctately deep, well drained(majorllonniyfine loamy soils SI S217’, 10’ Si SI SI SIS2 SI S2 S2SI S26
Gently sloping, moderately deep, somewhat(considerable)excessively drained coarse loamy sails
S2 S3S2 SI S2 S2S3 S3 SZ S2 S3S3

157
Moderately deep over rock, moderately well drained(major)cla\'cy soils
21 Adopt appropriate soil andmoisture conservation measures
7 S2 S2 S2 SI S3S2 S2 S2 $2 S2 S2 S3
Steep low hills with little soil cover(considerable) N N N N N N N N N N N N
Moderately deep, well drained, lea myfine loamy soils(minor) _ S2 S2 S2SI SI SI S2 S2 S2 SI S251
Entirety ilopingtetoping. deep, well drained, silty soils(major) with high lime content
cS34.5. i4‘ S3 S2 S2 S2 SI S3 S2 S2 S2 Adopt appropriate moisture and
soil conservation measuresS38
Deep, well drained fine silly soils(considerable) S2 SI52 SI S2 S2 S2 52 S2 SI S251
Sloping, deep, well drained, stratified loamy soils(dnminant)16 Adept appropriate moisture and
soil conservation measuresS3 S3 S3 S2 S3S3 S3 S3 S3 52 S2 S39
Intricately dissected. Loamy soils(minor) N N SN S3 N N N N S3 NNSloping, deep, well drained, silty soils with high(major) S3 S3 S3 S36 52 S3 S3 S2 S2S3 52 S3 Adopt appropriate moisture and
soil conservation measures10
lime contentIntricately dissected, silty soils(considerable)__ N N IV S3 N N N N N S3 N N
Gcnlly sloping, moderately deep to deep, well drained(major) S3S3 S3 S2 S3 S3S3 S3 S3 52 S2 Adopt appropriate moisture and
soil conservation measuresS3
911loamyÿsilty soilsGently sloping, shallow over bedrock,(considerable)excessively drained sandy soils_
N N N N N N N NN IN N N
N.B The soil mapping units bearing ( ' ) have been token from the Reconnaissance Soil Survey Report of Salt Range Area, 1975 *Thc characteristics are for important soil components of eachland suitability unii, The proportion of each component u described (within parentheses) in terms of dominant (>80%). major (50-50%), considerable <20 to 50% j and minor{ <20%), All the soils orelevel to nearly level, structurcd'liomogenized, non-saline, non-sodic, parous/permcablc, with water table beyond 150cm depth and contain negligible to moderate (0-14%) amount of lime, unless describedotherwise. The depth is defined in terms of thickness of the rooting /one as: Deep {> 100cm). Moderately deep (50-100cm, underlain by sand stone/rock) and Shallow (>50cm. underlain by sandstoncfrock).

158
6.6 FATEH JANG TEHSIL
Attock district, Agroeclogical Zone V- (Barani)
The area under report is located in Attock of the Punjab province. It lies between
33 37’ to 33d 59’ N latitudes and 72° 00’ to 72° 50"E longitudes. The hydrology of the
area is greatly influenced by the Indus and Haro rivers. Various kases (local name for
nallah) like Kala, Sugar Nandna, and streams also drained in the area. Since the beds
of these rivers are very deep due to continuous down cutting than their surroundings,
so their contribution towards aquifer recharge is not very significant except the
floodplains. Due to the deep and extensively dissected nature of the area, most part of
the precipitation is drained off without contributing to the ground water. According to
the inferred information, there is no appreciable reservoir of ground water in the main
part of the area. However, minor strips of land along the river / stream courses have
some sizeable / suitable ground water is available which is being used for irrigated
cropping through wells / tube wells. The rain fed cultivation is the dominant land use
in the major part of the area. Irrigated agriculture is practiced only in the sub recent
floodplains of the Indus Rivers and along the main streams passing through the area.
Most of the uncultivated land is used for grazing. The main crops grown are wheat,
grams barley, millets, oil seeds, pulses, etc. Irrigated cropping through open wells is
practiced to grow high value crops like wheat, tobacco, maize, vegetables, fodder, etc.
The uncultivated parts support natural vegetation including mainly, Zizyphus jujuba
(Bcr), Acacia arabica (Kikar), Acacia modesta (Phulai), Zizyphus nummularia
(Malla), Perganum harmala (Hermal), Calotropis procera (Ak), Asphodelus
tem/ifolms (Piazi), Carthamus oxyacantha (Pohli), Cousinia minuta (Leh), Cynodon
dactylon (Khabal), Eleusine Jlaglligera (Chimber), Eragrosiis cynosuroides (Dib),
Hcierotogon controtus (Sariala), Dicanthium mnulatum (Palwan), Saccharum munja
(Sarkanda), Sorghum halepensc (Bam) etc. with the elevation ranging from 316 to 473
meters Table 63 and Fig 63. The climate of the area is classified as arid subtropical
continental. The mean annual rainfall is 584.3 mm, most of which falls during late
summer (monsoon) season are 29°C and 15°C with mean maximum summer and mean
minimum winter temperature being 35.9 C and 7.2 C respectively. The soil mapping
units mentioned above were further grouped on the basis of similarity in suitability and
management requirements of their component soils for planting forest trees. Such
groups, called as ‘Land Suitability Mapping Units1, arc described in Table 6.3 with
units.mappingsoiltheirrespect componentto

159
AGROECOLOG4CAL ZONE* VBARAN I
ATTOCKff ATEHJANG TEHSIL)
SOILS AND LAND SUITABILITYFOR FOREST TREES
N
Aft T T O C M ttH ilL
ft
1
*\
yw\ *
i ;%•.
swwiAn/V]uWsi'
JOEO
#>
a*F
- '
llV
1 .
I«rkr\r. ••. . A- .-. •
SPwwi) »tJI.Nl.lX.*, *a
£7
‘
r . I'V (*•r» '.V /ÿÿOil
>ooc- L-WW n.* §i“K9jmnn
. f>c1 r
mn—BBPlrtjXIS \1U Ll
PEAte|ÿwt/WL<\VMJWV'/I.IWW
\jyu %
4C' •
4V4VWV'A'TMPRfcAAAAivWÿthii
rVvAAuwMy Y*4-
m
AAA>*/**LEGEND
SOILS
*
Buv .‘•i • >%ACTIVE AND RECENT FLOOOF1AWS IAA
HMRECENT FLOODPLAINS
LOESS PLAINS
t*
hwir
ii
is
ife
nii11
WEATHERED ROCK PLAINS
:R LAND SUITABILITY *
< L_1 t\CONVENTIONAL SIGNS
-Hillt
wimtwnimi AREAS /ÿ/i£2 si
A/4 t1 1 A/zm ifTi
Pti D Wort of Sy*d M. Akmai RshimSoetoSeetogtcal knptct 0# Agratormtry*1 Putft Botany OoportmonL University of th« Punjffa, Lihan.
Fig 6.3 Land suitability classification Map for choice of tree species in Tehsil Fetch
Jhang District Attock

160
Table 6.3: Land Suitability Mapping Units -Fetch Jang Tehsil: Component Soils, Land Suitability for Forest trees and specificmanagement requirements
LAND SUITABILITY FOR FOREST TREESt .ANDSUIT¬ABILITYUNIT
Specific ManagementRcq uiremcnts/lmprovemcu t
Suggestions
COMPONENTSOIL
MATTINt,
UMTS
Spotting Characteristics of Component Soils*( proportion of the component soil)
Vt-iWh> Ipfelpk SirTMhiLu I I
AMLiitJh'a
Lmcm,
gfon.AfMrim
JululmMrB*fUKli
lf.mil SatoDM Ormb r„r, Atmc Encmltamal bahllr," jtbtilim crib*
Deep, well drained, loamy/silty soils- irrigated(dominant)
No specific managementrequired; prefer use for nurseries2 SI SI1 SI SI SI SI SISI SI SISI SI
Deep, well drained, line silty soils(doiuliwnt) S3SI SI St SI12 SI SI SI S2 S2S2 S22 Adopt appropriate moisture
conservation measuresDeep, well drained, clayey soils with high lime content(minor) S2 S2S3 S3 S3S3 S3 S3 S3S3 S3 SI
Gently sloping, deep, well drained, fine loamy soils(dominant) Adopt appropriate moisturasotl
conservation measures; avoidplanting on sandy soil
24 S2 S2 SI SI S2S2 S2 S2S2 S2 S2 SI3Shallow, excessively drained ,sandy soils(minor)____ N N NM N N NN N N N N
Gently sloping, deep, well drained, silly soils(major) 52 S3 S216 S3 S3 S2 S2 S2 S2S34 S2 S3
Adopt appropriate maisture/soilConservation measures
S3S3S2 S2S3 S3 S3S2 S3 S3S3 S3with high lime contents Genlly sloping .moderately deep,
well drained, (comudcraWc)graveil> fine silty soils
Gently sloping, deep, well drained, clayey soils(dominant)
Make larger pits, add organicmatter for planting, adopt
appropriate moisture conservulionmeasures
II S3 S3S3 S3 52 S2S3 S3 S3 S2 S3 S35
with high lime content Deep, well drained, fine silty soils(minor) 52 SI S2S2 S2 SIS2 SZ 52 SI SI S2
13, 14, 15 Genlly sloping to stopping, deep, well drained silty/fincsilty (dominant)soils with high lime content
6 Adopt appropriate moisture andsoil conservation measures
S3S3 S3 S2 S2S3 S3 S2 S3 S3 S3S3

161
Gently sloping, deep, well drained cloycy/fine loamy soils(Considerable)
Shallow, well drained, clayey soils (Considerable)
S2S2 S216 S2 SI SI SI SISZ SI SISZ7 Make larger pits, add organicmatter for planting; adopt
appropriate moisture conservationmeasures
NN N N N NN N N NN NSteep rocks with no soil cover(Considerable) NN N NN NN N N N NS
Sloping, deep, well drained, silty/finc silty soils(major) S2 S3S3 S3 S3 S3 S217,1* S3 S3 S3 S2 S3 Adopt appropriate moisture and
soil conservation measures8
with high lime contents Severally dissected silty soils(Considerable)_ N NN N NN N NN N NN
Deep, excessively drained, sandy soils(dominant) Avoid planting1 NN N N9 IN N N NN N NN
Shallow, excessively drained , sandy soils(major) N N27 N N NN N N NN N N10
Avoid plantingSteep rock with no soil cover(considerable)_ N N N N NN N NN N N N
* The characteristics are generalized far important soil components of each land suitability unit,
The proportion oreach component is described (within parentheses) in terms of:dominant {>80%), major (50-80%), considerable (20 to 50%) and minor ( <20%)The depth is defined in terms of thickness of the rooting zone as deep (> 100cm) and Moderately deep (SQ-lOOcm, underlam by sand)
All the soils are level to nearly level, stmcturcdliomogcnized. non-saline, non-sodic, porous/petmcablc. with water table beyond 150cm depth and contain negligible to moderate{(M4%) amount oflime, unless described otherwise.

162
6.7 RAHIM YAR KHAN TEHSIL
Rahim Yar Khan District AgroecJogical Zone III- A
(Sandy Desert)
The area under report is located in Rahim Yar Khan District of the Punjab
province. It lies between 27° 56/ to 28° 52' N latitudes and 70° 00y to 70° 32' .The climate of the area is classified as Arid Subtropical Continental. The mean
annual rainfall is 97.2mm, most of which falls during late summer (monsoon)
season. The mean daily summer and winter temperatures are 33.6°C and 14.5°C
respectively with the mean daily maximum summer and mean daily minimum
winter temperatures being 40.3°C and 5.7°C respectively. There are monthly
variations of rainfall, temperatures, evaporation and relative humidity. The
following major landforms with specific nature of soils and hydrological
conditions are distinguished as Active Floodplains, Recent Floodplains Subrecent
Floodplains and Rolling Sand Plains. Indus River, abandoned channel of Hakra
River and Panjnad Canal system influence the hydrology of the area. The
abandoned channel of Ffakra River provides natural drainage to the area. More
than 60% of the tchsil area is irrigated by the network of Panjnad Canal system.
Rest of the area is either out of the reach of canal command or sandy ridges. A
negligible area (about 2.5%) is under annual flooding by the Indus River. Almost
entire area lias brackish ground water except a narrow strip along the river Indus
where it is of good quality. Irrigated cropping of wheat, gram, oilseed, and pulses
in Rabi and cotton, sugar-cane rice and millets in JCharif with perennial/seasonal
canal supplies supplemented by tube wells is the main land use in major part of
the area. Remaining area is lying uncultivated and is mostly used as poor grazing
land. Natural vegetation includes Prosopis spicigera (jand), Acacia jacquemontii
(jandi), Salvadora oleoides (wan), Capparis aphylia (karir), Tamarix ariiculata
(fiash), Tamarix sp (lai), Calotropis pracera (ak), Desmostachya bipinnata (dab),
A Ihagi camelorum (jawan), Acacia arabica (kikar), Zizyphus jujuba (her) and
Tamarix diocia. (pilchi) Table 6.4 and Fig 6.4.
The soil mapping units mentioned above were further grouped on the basis of
similarity in suitability and management requirements of their component soils for
planting forest trees. Such groups, called as ‘Land Suitability Mapping Units’,
are described in Table 6.4.

163
NAGROECOLOGICAL ZONE lll-ASANDY DESERT
(RAHIMYAR KHAN TEHSIL)
SOILS AMD LAND SUITABILITYFOR FOREST TREES
ALEGENDSMDtnoovuw
1RECCNT FIOOOPLMM3
S .8U8RECCNT FLOODPUWW
yft
> *
* , 1
m
* u*noLumnMmjims
g
o4
*MISCELLANEOUS ARM 4
I!o
o4
’liisiiBnmi 1P**
rtDnM«pTiN
LAND SLiTASttiTY
*t
•Hilti E3 ••KT3f II
isv&CONVENTIONAL SONS
&=~ A/“A/ <*•"-"
T
.‘V *b/V- A/ *i'V 6
Ph D Work of Syvd K Afcmai R*Mn%
Sodb EnMgfcal fc*wcf AÿoAxwOy ft Fta** Botany Department. UnivwiHy of Ihe Punjab, Labor*
Fig 6.4 Land suitability classification Map for choice of tree species in Tehsil Rahim Yar KhanRahim Yar Khan

164
Table 6.4: Land Suitability Mapping Units - Rahim Yar Khan Tehsil: Component Soils, Land Suitability for Forest trees andspecific management requirements
Land C'urtlfMflenr Land Suitability far Forest Trees Specific ManagementRequirements/ ImprovementSuggestions
Suit¬ s'.' ii Spotting Characteristic! of Component Solis**( proportion of the component soil)
MM"'KAV Tntil WIUM irt «-P*ibllHy
UnitMapping
Unit*Mattg.InJlitr
AstdifWcarnal
Urrw. JffKr MfeSalnl. Jtfrf™CTiii
Dalt. -Stiff,
IiullcahrW J;*r*tismu rr/ta "V.'r.
4, 5. 10, tl Deep, well drained silty/loamy sods(dominant! So specific management required;
g rrefer use for nurseriesSI SISi SI SI Si SI SISI SI SII
Deep, well drained, stratified atil ty/loamy soils(major)
Deep, moderately well drained, stratilied clayey soils(considerable)
Make larger pits and add organicmatter for planting; avoid overirrigation / long ponding on clayey
I SI SI SI SISI SI SI SISI SI SI2 SI
S3 S3S2 S3 52 S3 S3S2 S2 S2 S3S3tdili
Deep, moderately well drained clayeyfinc silty soils(dominant)
Make larger pita, add organicmatter for planting: and avoid overirrigalioalong ponding; in additionadd gypsum on saline-*odic soils
15,17 S2 S2 S2S2 S2 S2 S2S2 S2 SI SI S23
I>ccp, moderately well drained, porous salinc-sodie(ntinor)cltycy/fine sifty soils _
N N N N NS3 S2 N NX N N
Deep, well drained, stratified silty/ loamy soils(major)
SI S2 S2 NSI SI S2 S3S2 S2 SI S2IF*4 Make larger pus. add organic
matter for planting; avoid longponding on clayey soils; avoidplanting on sandy soils
Deep, moderately well drained, stratified clayey soils(minor)
Deep, excessively drained sandy soils(minor)
NS3 N N S3 N N N NN N S3
NN N N n XN N N N N X
Undulating, excessively drained, stratified sandy soils(major) Avoid planting on sandy soils; mnki
larger pits, odd organic matter forplanting on silty soils
3 N NN N N N N NN rtf N X5
Deep, well drained, stratified silty soils(considerable) _ SI SI SI SISI SI SI SI SISI SI SI
Deep, excessively drained, stratified sandy soils(major)3F* N N N XN N X N XN N N6 Avoid planting; on sandy soils; mnk<
larger pits, add organic matter and ffertilizer for planting on siltysoilsDeep, well drained, stratified silly soils
(considerable)52 XSI SI S2 S2 S3S2 S2 SI S2 SI

165
NS3 N N NDeep, moderately well drained, sunlifted clayey soil*(major)
Deep, well drained, stratified silly/ lotuny soils(minor)
Deep, excessively drained sandy soils(minor)_
S3 S3 N N NN N2F* Make larger pits and add organic
mailer for plum mg; avoid longponding on clayey soils; avoidilnnting on sandy soils
7S2SI S3 NS2 SI SI S2S2 SI SI S2
N N NN N NN N N S’N N
Make larger pits, add organicmailer for planting; and avoid overirrigation/!ung ponding; in additionadd gypsum on suline-sodic soils
NN N N N N9, 12, !«, Deep, moderately well drained, porous saline-sodic/(dominant)
N S3 N SN S2818
S2 S2 S2 S2S2 S2 S2gypsiferous clayey/ silty soils Deep, moderately welldrained clayey soils (minor)
S2 S2 S1 SI S2
Deep, moderately well drained, porous saline-sodic{dominanDsihy soils Make larger pita, add organic
natter and gypsum for planting onporous saline- sodic soils; avoidplanting on dense saline-sodic soils
N N N NS2 A N7, 8, 13 N S3 S NN9
Deep, tnodcralely well drained, dense saline-sodic(minor)claycy/silty soils_ NN NN N NS3 N NN N N
Deep, moderately well drained, dense saline-sodic(dominant tela ycyffinc silly soils NN N N NN S3 N N Pi14 N N10
Avoid plantingDeep, moderately well drained, porous saline-sodic(minor) clayey soils__ NN N N NN S3 N N NN SI
19, 20,21,
4\ 7\9\12% 13% IS’
NN N NUndulating and rolling, excessively drained, sandysoils (dominant)
N N NN N N N N11Avoid planting
y.B. Port of the t chid has been surveyed / reported in Reconnaissance Soil Survey Reports of Cholittun, 1974 and Dera Ghazi Khan. 1974, The soil mapping units of these areas have been adopted anddesignated by adding single prime ( ‘ ) and double prune ( " ) respectively to their retpeclivc numbers.
* Subject to river Hooding almost every year during monsoon season.•* The characteristics are generalized (or important soil components of each land suitability unit. The proportion of each component is described (within parentheses} in terms of;
dominant {>80%). major (50-80%), considerable (20 to 50%) and minor ( <20%).All the soils are Icvd to nearly level, structured/hortingenized, non-saline, non-sodic, porous, permeable, with water table beyond 150cm depth and contain negligible to moderate (0-14%) amountof lime, unless described otherwise The depth is defined in terms of thickness of the rooting zone as: Deep (> 100cm) and moderately deep (50-100cm. underlain by sand)

166
6.8 BAHAWAL PUR TEHSIL
Kahn will pur District Agroedogical Zone III- A (Sandy Desert)
The area under report is located in Bahawalpur district of the Punjab province. It
lies betwcen28u 57' N to 29°31' N latitudes and 7l°5(y E to 72° 36' E longitudes
The climate of the area is classified as Arid Subtropical Continental, The mean
annual rainfall is 172.8mm, most of which falls during late summer (monsoon)
season. The mean daily summer and winter temperatures are 32.1cC and 19.1°C
respectively with the mean maximum summer and mean minimum winter
temperatures being 38.8°C and 10.9°C respectively. The following three major
landforms with specific nature of soils and hydrological conditions are
distinguished in the area. 1. Flood plains (Active Floodplains and Sub recent
Floodplains) , 2. Sub recent deposits on old river terrace and 3. Rolling sand
plains. The hydrology of the area is influenced by Sutlej and Panjnad Rivers,
These rivers overflow during monsoon season, flooding the adjoining area.
Frequency of floods has diminished under the Indus Basin Treaty. The area is
irrigated by a network of Desert Branch, Bahawalpur distributor and Ahmadpur
Branch of Bahawal canal. Ground water is of good quality and may be used for
supplementary irrigation,
Most of the area is used for general cropping with canal and tube well irrigation.
A large part of the area comprises Cholistan desert mainly uncultivated and arc
used for poor grazing. The main crops grown are cotton, wheat, pulses gram,
fodder.
Natural vegetation includes Salavadora oleoides (wan), Tamarix articulata
(flash) Eieusine jlagellifera (Chhimbcr), Eragrostis cynosuroides (Dib), Alhagi
camelorum (Jawan) Prosopis spiegera (Jand) Capparis aphylla (Karir), Temarix
diocia (Lani) and Cymbopogan Juarancusa (Khcwi). In Cholistan, main species
encountered on sandy ridges are Calligonunt potygonokies (Phog), Aeruve
javanica (Bari) and Calatropis procera (Ak). Datcpalm is also quite common in
the area adjacent to river Tabic 6.5.and Fig 6.5.
The soil mapping units mentioned above were further grouped on the basis of
similarity in suitability and management requirements of their component soils for
planting forest trees. Such groups, called as kLand Suitability Mapping Units’, arc
described in Table 6.5 with respect to their component.

167
AGROECOLOGICAL ZONE tti-ASANDY DESERT
(BAHAWALPUR TEHSIL)
SOILS AND LAND SUITABILITYFOR FOREST TREES
N
Ao 0
\\
.*
>wr - LEGEND
StXLSACTIVE FVOOOPLMNS
fio
I II_J KnHm crnp-.
LT
«
sRfflassaiOMECCNT Dffom o« ou> mvm TWRACE
»(m J0W1W «nuinuwiwruM
oaMvnrTCMH.
OMS n»—t£ Cl
•uW WtSCEL.L M* OUJ WtrA£A/ — T I*|A/ 1H- jOanUnd
i
Ph D Work of Sy*d M. Akmj! RahimSocA>gcntoBAjltni»«OÿA<ÿi|><bmOTinlN«ÿ Botany Dapartmant. Untvaraity of tha Punjab. Labor*
Fig 6.5 Land suitability classification Map for choice of tree species in Tehsil Bahawalpur
district Bahawalpur

166
Table 6.5: Land Suitability Mapping Units- Bahawalpur Tehsil: Component Soils, Land Suitability for Forest trees and specificmanagement requirements
Sail.ability
Specific ManagementRequiremciUs/Iraprovcmcnt
Suggestions
Compo nr111 I.mid Suitability for Forest Trees-..ii
Spotting Characteristics of Component Soils**
< proportion of the component soil)Mappine
Holla*>*• •mawi sw. Ipntpu Fnt
Util I FScUi**»*ÿ
Vang.Mica
CmAtbti. /.iff*
glan.
r,i AM. ficusDolt. lamf.i
final
atmal.
/feme.nfjotl- Mjm.Mica t file?.silfaa arti
Met
No specific management requiteiLprefer use for BUT(cries; make largerpus. add organic nuuer and gypsum lorpluming cm Kllinr-wdic soils
Stl 4. 5, 6.10, 12
Deep, well drained loamysilty/ fine silty soils
Deep, well drained, salinc-sodic silly/ loamy soils
Si SI SI SI(dominantj SI SI St SI S! StSI
N NSI N N N N NN N S3 N(minor)
No specific minutyement required;make larger pin. add organic mailer lor
planting and avoid long ponding eoclayey fail*
SiPeep, well drained, loamy foils (major) SI SI St SI SI SISI SI SISISI119, 202 Deep, moderately well drained clayey will (considerable) 52 S’ sz SISI S2 SI SISI S2 SI SI
Deep, well drained, saline-sodic clayey/linc silty will (minor) N NSI N N N NN N S3 N N
Make larger pit* .add organic mutterfur pluming and uvuid long ponding on
;Utyey foil*, in addition odd gypsumOil taiinc-sodic foil*
SI SIDeep, moderately well drained, clayey soils (major) SI si SI si siSI SI SI SI 52
17. IS3 SI SI SI SISI SI SI SI 51SI SIDeep, well drained, loamy/siiiy toil* (minor) SI
N N NS3 N N N NN N SI NDeep, moderately well drained, ( minor)claycy/finc silty soils_
Make larger pits, add organic matterfor planting; avoid long ponding onclayey soils; avoid planting on sandy
Deep, wdl drained stratified silty sm Is (major) SI SI SI NSI Si st 51 S351 St SI
1\ 2*.2’*
4 N NN 53' N S3 N N NN S3 NDeep, moderately well drained, stratified clayey (considerable)soilit •'Ml'
N N N S NN N N N N N N
Undulating, excessively drained sandy soils (minor)Moderately deep, well drained, stratified jntty wits (major)
underlain by sand at 60 to 90cmMake larger pits . odd organicmutter, irrigate at short interv alsand add light doses of N fertilizers',
avoid planting on sandy soils
SI S3 S3 N S351 SI si SI NST SI
r*5Undulating, excessively drained study wilt N(considerable) N N N N N NN N N N N
Make larger pits, add organic matterand gypsum fur planting on saline-
sodic soils; avoid over irrlgation/longjonding on clayey soils
Deep, well drained, xaltneÿsodic Iwmy-'clayuy toils(major)Deep, well drained, non-saline, non-sod icloamy/silty soilsDeep, moderately well drained, non-saltnc, non-iodicclayey *oili__
N Nft S3 N N N N NN SI N11, 156 Si si SISi SI St 51 SISI SISI SI(considerable)
SISI SI SI51 SI SI SI SISI 51 SI(minor)
Avoid planting on sandy soils;Undulating, excessively drained stratified sandy soils N N N N NN N N N N N N
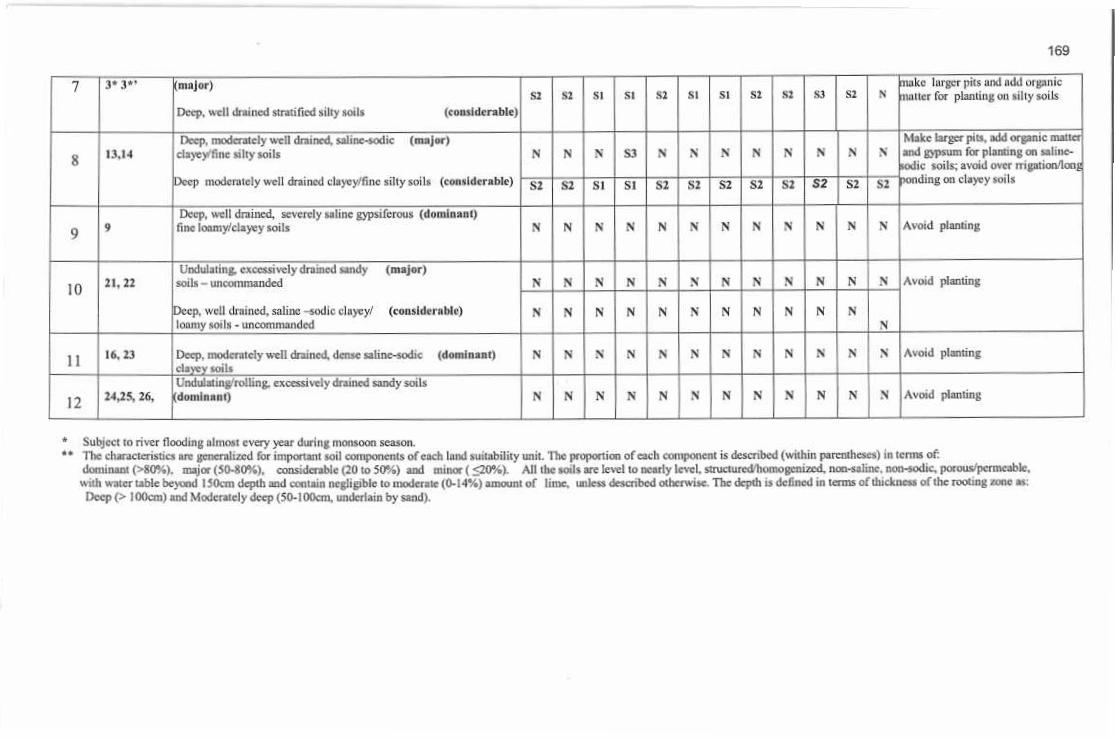
169
make larger piis and iidit organicmiter for planting on silly soils
3*3*’ (major)7NSI SI S2 S3 S2S2 SI S2 SIS2 SI
Deep, well drained stratified silly soils (considerable)
Make larger pits, add organic matterand gypsum for planting on salinc-iddic soils; avoid over mgation/long
' ponding on clayey soils
Deep, moderately well drained, uline-sodic (major)clayey'fine silty soils NN N N NS3 N N N13.N N N N8
Deep moderately well drained clayey/finc silly soils (considerable) S2 S2S2 SI SIS2 SI Si SI SISI SI
Deep, well drained, severely saline gypsiferous (dunlinsill)
fine loomy/clayey soils Avoid plantingN N NN N N N NN N N N99
Undulating, excessively drained sandy (major)soils-uncomrnanded Avoid planlingNN N N N NN N N N11,21 N N10Deep, well drained, saline -sidle clayey/ (consider'able)
loamy soils - uncommondedNN N N NN N N N N N
N
Avoid planlingS S NN N16,23 Deep, moderately well drained, dense salinc-sodic (dominant)clayey Soils
N 19 N N N N N11
Undultding/roUing. excessively drained sandysoils(dominant) Avoid planlingN N NN S N N N24,25, 26, N N N N12
* Subject to river flooding almost every year during monsoon season.** The cliaracieristics ore generalized for important soil components of each land suitability unit. The proportion of each component is described (within pareniheses) in terms of:
dominant (>80%). major (50-80%), considerable (20 to 50%) and minor ( <20%). All the soils are level to nearly level. structured/homogcnizcd non-saline, noo-sodic, porous/permeable,with water table beyond 1SOcm depth and contain negligible to moderate (0-14%) amount of lime, unless described otherwise. The depth is defined in terms of thickness of the tooting ante as;
Deep (> 100cm) and Moderately deep (50-100cm. underlain by sand).

170
6.9 BAHAWAL NIGAR DISTRICT
Agroeclogical Zone III- A (Sandy Desert)
The area underreport is located in Bahawalnagar Tehsil of the Punjab province. It lies
between 29° 32y to 30° l V N latitudes and 72° 51; to 73“24; E longitudes (sec location
map) with the elevation ranging from 155 to 160 meters. It covers an area of 1755.12
square kilometers (175512 hectares).
The climate of the area is classified as Arid Subtropical Continental. The mean annual
rainfall is 196.4mm, most of which fells during late summer (monsoon) season. The
mean daily summer and winter temperatures are 33J°C and 14.6°C respectively. Mean
daily maximum summer and mean daily minimum winter temperatures are 39.2°C and
6.9°C respectively. The following major landforms with specific nature of soils and
hydrological conditions are distinguished in the area. Active Floodplains, Recent
Floodplains, Sub recent floodplains and old River Terrace. Sutlej River traversing
along its northwestern boundary controls the hydrology of the area. The area is
irrigated by the network of Eastern Sadiqia and Fordwah canals. Seepage from these
canals has created water logging and salinity problems in the adjacent areas. Ground
water is generally brackish except small strips along the river and main canals.
Irrigated cropping of wheat, gram, pulses, oil-seeds, fodder, sugarcane, cotton, paddy
and millets is the land use of about 75 percent of the area with irrigation supplies
provided by Eastern Sadiqia and Fordwah canal systems. Rainfall of the area is
insufficient to support dry farming. About 20% of the area is uncultivated either being
uncommanded or sand dunes. Narrow strips of land along the river are cultivated on
residua] Hood moisture. Mango and citrus orchards arc also grown locally in some
parts of fee area. A minor part of area with nearly level to gently undulating coarse
loamy/loamy soils near Bahawalnagar and narrow strips along canals and highways
are under irrigated plantation. Natural vegetation includes Haloxylon recurvum
(Lana), Salsolafeotida ( Lani) Acacia Jaquemontii (Jandi}, Prosopis spiedigera (jand),
Saccharum munja (Sarkanda), Eragrostis cynosuraides (Dab) Afhagi cameforum
(Jawan) and Dalbnergia sisso (Shisham),Tamarix diocia. (Pilchi), Tamarix articulata
(Farash), Zizyphus jujuba (Ber) and Acacia arabica (Kikar) Table 6.6 and Fig 6.6. The
soil mapping units mentioned above were further grouped on the basis of similarity in
suitability and management requirements of their component soils for planting forest
trees. Such groups, called as ‘Land Suitability Mapping Units', are described in
Table 6.6.

171
NAGROECOLOGICAL ZONE lll-ASANDY DESERT
{BAHAWALNAGAR TEHSIL)
SOULS ANO LAM) SUITABILITYFOR FOREST TREES
Ac'
4V
" ffc.' ‘£*E*
\4
fc-”fl 4
4
4t, f
;y9 ~'lt# t
tf
i m
f1
fATi•-I rf
I >V'N r/—«ÿ *LEGEND
SOILSwiNEnocwuM
l€ f*I
*Rfcexrnooof-ua** a
%<
MNUWCCMT FLOODPLAM*
**%
ty I
out mvw iXMucf CONVEHTK3NAL SIGNSLAND SUITABiUTY
1 <5I
co « •*ini«£3f
IHCCLLANCOU* ARMSI 'V.
1E-:Ph D Work of Sy«d M. Akm*l Rahim
Botany OtpwtnwnL Untv«Ky of U» Punjab. L«»w«.
Fig 6.6 Land suitability classification Map for choice of tree species in Tehstl Bahawalnagar
District Bahawalnagar

172
Table 6.6: Land Suitability Mapping Units — Bahawalnagar Tehsil: Component Soils, Land Suitability lor lorest trees and specific
management requirements
Specific ManagementRequiremenlv'lmprn veim.nl
Suggestions
Land Suitability for Forest TreesLandSuit-
CodiponcntSon
MappingUnit.
Spotting Characteristics of Component Soils**( proportion of (he component soil)
w5T VrTOOI\f0*lability i
UnitiMtkmInjitw
AlhiiWrf
Afefla SoftMU
I EmivlIfoowO jitfafUitU/mbJPart.
ilawHI*nUitt jumbMlfWto
No specific ircmugciiKiit required;ureter use for nurseries
__No spewiic management rttfmrcd,
Ttcfcr use for nulseries, make lalgri pits
tint add 01 guide mailer ll>i pluming on' clayey wnl*
S1S1 SIS1 S11 S1S1S1 S1S1 S15, 24 (dominant)Deep, well drained loamy's i tty soils__Deep, well drained silty soils
Deep, moderately well drained clayey soils
SI
S1S12 SISIS1S1 StS1S1 SIS1(dominant)20 Si
SIS2 SIS2 S2(minor) S2 S2S1S2 S1 SIS2
Avoid over imgaiioft'long ponding, make larger pits and add organic
matter for plantingS23 SIS2S2SI S28282StSIDeep, moderately well drained, clnycy/fino silty soils12 (dominant) S2S2
SISISISIDeep, well drained silty soils (minor) StSISIStSISISISI
Make larger pit,. avoid over irrigation
md add organic mancr for planting,
irrigate cotree loamy soil* at shorterintervali and add light dote*of Nfertilizer
S24 S2S2S282S2SISIis StDeep, moderately well drained clayey soils St(major) SI82
SISI(considerable) S2S2 S2Deep, somewhat excessively drainedcoarse loamy soils
____ S2 S252SI 52SIS2
Make larger pit,, udd organic mailer.
Irrigate at thorter interval » and add_ ighl dose* ot' N Icrtilizcr; avoidN slanting <W «ndy »oits.
5 siS252S2S2 SIS2 SIS37 Deep, somewhat excessively drained, coarse loamy soils (dnimetanij
Undulating, excessively drained sandy soils
SISI
NN(minor) NH N NNNNN
NS2SISI S3SISISISt SIDeeiVinodjcralcly deep, well drained, stratified sdty Soil-. (major) SISIMake larger pita and add organic matter
for planting; avoid long ponding an
clayey soil*; avoid planting on •aunty
toil*
6 2* NNNS3 NNNS3 HS3NIN(minor)Deep, moderately well dluinod, Vlruliflcd clayey anils
(minor)Undulating, excessively drained sandy coils. SNNNINNNN INNN N
I Make larger pin, add organic nutter
find gypsum for planting ort calmc-eodic
(toils
SNNsNNNNSIS3(major) NSl>cep, moderately well drained, imrous valine-indieelayey/tonniy soda7 26
SISISIsi SISI SISISI SISISIh>ecp, WTII drained, non-vilitie. imn-sodic loamy '.oils (considerable)
Make larger pit, and add organic matter[for planting; avoid over oilgauntlong
Deep, moderately well drained, stratiTied clayey soils (major)SN NNNS3NS3 NN S3Nl*8

173
N [ponding oiidiiycy soilsSIS2 l" S2 S3SISISISISISI j S3
(considerable)well drained. stratified Mlty soilsMjJte larger pit), add I'rjiur.te
andcypwim foe pta.rAuig9 mutterNNNNNNNNS3S3IVN(dominant)Deep, moderately well drained, porous sallno-sodlc
eleyey/loamy soils_ _13.18
Provide adequate drainage system.
irrigate carefully and add organic•natter;also add gypsum for planting onsaline-sodic sols
_____NIVsN MS3NNS3S3NN(dominenf;10 Deep. Imperfectly drained loamy sods
Deep, Imperfectly drained, sahne-sodic loamy sols
14.1$NNIVNNINS3S3NN(minor)
Avoid pfitnPng on sandy soils; nukelarger pit* and ndd organic mailer lor
planting on silty soils
NNNNNNNNNNMN(domlntnt)Undulating, excessively drained sandy soilsII v*
NSIS3S3S3SISIS2SISIS2S2(minor)Deep, wot! drained, stratified sillysoilsNo nil problem; cxplure lire
possibilitiesto provide imenioa
NNNNNNNNNNN
(Jnwinanl)tz l>etp. well drained, tnu <-mman<k‘d silty .namy unis21NIV NN NNN NNN(major)thuMaling to rolling, excessvety drained sandy >oils Avoid planting
13 33NNINN NNNN\NNN
(eonthltraUt)Uccp, well drained loair.y toilssubject to buna!
* Subject to occasional Hooding during high flood.*’ The characteristics arc generalized tar important soil components of each land suitability unit. The proportion of each component is described (within parentheses) in terms of:
dominant (>80%), major (50-110%), considerable (20 to 50%) and minor ( <20%). All the soils are level to nearly level, struetured/lioinogcnizcd, non-saline, noti-sodic, porous/pcrmeablc,
water tabic beyond 150cm depth and contain negligible to moderate (0-14%) amount of lime, unless described otherwise. The depth is defined in terms of thickness ul the rooting rone as:
Deep (> 100cm) and Moderately deep (50-1OOcrn, underlain by sand).
with

174
6.10 MUZAFFAR GARH DISTRICT
Agroeclogical Zone III- B (Sandy Desert)
The area under report is located in Muzaffargarh district of the Punjab province. It
lies between 29a38/ to 30°38y N latitudes and 70°49/ to 71° 45' E longitudes (see
location map) with the elevation ranging from 11° to 13° meters. It covers about
2,384,32 square kilometers 238,432 hectares). The climate of the area is classified
as Arid Subtropical Continental. The mean annual rainfall is 186.8mm, most of
which fells during late summer (monsoon) season. The mean daily summer and
winter temperatures are 32.03°C and 18.4°C respectively with the mean maximum
summer and mean minimum winter temperatures being 38.6°C and 10.3°C
respectively. The following major landforms with specific nature of soils and
hydrological conditions are distinguished in the area. Floodplains (Active
Floodplains, Recent Floodplains and Sub recent Floodplains) and sub recent
deposits on old river terrace. The hydrology of the area is influenced by river
Chcnab and the irrigation system. The river overflows during monsoon and
inundates the flood belt. Flooding greatly contributes to the ground water recharge
and the residual flood moisture is used to grow winter crops in flood belt. The area
is irrigated by a network of Rangpur and Thai canals. Taunsa- Panjnad link also
passes through the area. Seepage from the irrigation system has caused high water
table conditions mainly in the western part of the Tehsil.
Most of the area is used for irrigated general cropping with canals and tube wells,
The crops grown arc mainly cotton, wheat, maize, sugarcane and fodder. Mango,
date palms and citrus orchards arc grown locally in the area.
Natural vegetation includes Acacia arabica (Kikar) Cynodon dactylon (khabbal),
Eleusine Jlagellifera (Chhimbcr), Salvadora oieoides (wan), Prosopis spiegera
(land) Capparis aphylta (Karir), Tamarix articulata (Farash) TamarLx diocia (Lani)
and Cymbopogan juarancusa (khewi) Table 6.7 and Fig 6.7.
The soil mapping units mentioned above were further grouped on the basis of
similarity in suitability and management requirements of their component soils for
planting forest trees. Such groups, called as ‘Land Suitability Mapping Units’, are
described in Table 6.7.
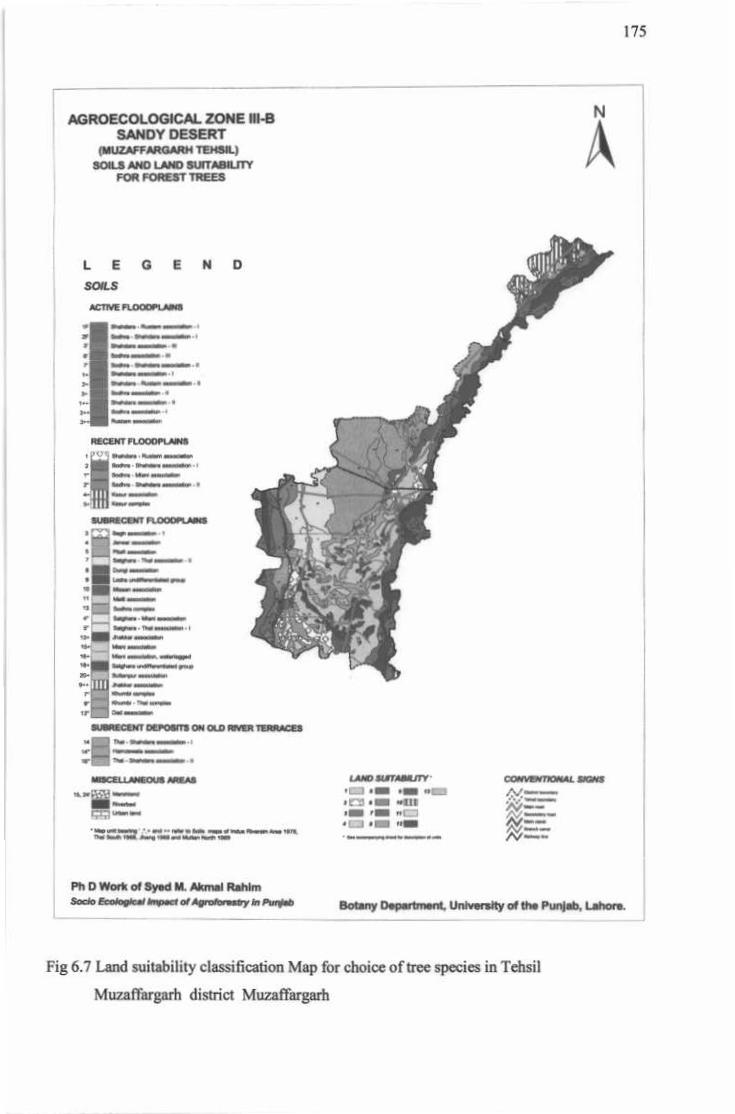
175
NAGROECOLOGICAL ZONE Hl-BSANDY DESERT
{MUZAFFARGARH TEHSJL)
SOtLS AMO LAND SUCTABtLfTVFO« FOREST TREES
A
G E N DL
SOILS
I i
(s.
njxamim
1Mf
>*•
I V<
i M'*
?ÿ
K*
LAND XUTAMJTV COHV&mOHAL
&Si o <oi•m n
'G3 ȣ"
&<w" /V
Pit D Work of Syed M. Akmal Rahim
Botany Dapartmant Unlvarvlty of tha Punjab, Labor*.
Fig 6.7 Land suitability classification Map for choice of tree species in Tehsil
MuzafTargarfi district Muzaffargarh

176
I able 6.7: Land Suitability Mapping Units - MuzalTargarh Tehsil: Component Soils, Land Suitability for Forest trees and specificmanagement requirements
Land | ComponentSuit¬
ability
Specific ManagementRequirementv’lmproveim-nt
-Suggestions
l.iirnl Suitability for l-'nrest TreesMfl Spotting Characteristics of Component Soils**
( proportion of the component soil) KULU jl iwahpJ Wiis llpAr Iplej Ftfwli Srwm ILMappingUnits
flplr B«rSitnudMitalinm
Unit Mctith".indie*
i Aim
mjne.
fiea, /«•«!T
img.l'ama,l uea. AtaJ.
mdhaRetfb, Itanib. f.HtaL .tttiz.
Irbdt
Atae.rellit.arrx
exit* nlfntL ImiL
20’1 Deop, well drained slBy/loemy sotH (dominant) No specific man-i jteraerit required.prefer UK Tor nuiwric*
$1 5t SISI SI SI SI51 Sf SISI $1
Nn specific management required:avoid planting onshallow fitlymils, male laigei put. add organic
mailer and avoid over niguikirv'longponding on clayey sods
1 1.3 |Deep, well drained, part stratified silly fine silly soils (major)
Shallow over sand, excessively drained silty toils (minor)
Deep, medera lely well drained clayey soils (minor)
SI SI sisj_ M St StSI SI "l SISI
S3 S3 NS3 S3 N N N 5S3 S3
SIsz szSI SI sz SI SIsz SISI S2
Deep, wefl drained stratified siltyAoamy toils (dominant)
Deep, excessively drained, stratified sandy soils (minor)part with (fin sitty cover
Make huger pit* and add organicmanor for planting; avoid
planimon
SZ SI ssi SI SI S3 SISI SIsz St3 3"
N sandy toilsNN NN NN NN N NN
Mate l.irger pits, add organic nunier
and avoid over imsah otv'longKinding on clayey soils
Deep, moderatoly well drained clayey soils[dominant)
SI SI SZ SI SI SISI SISI SI SI sz11. 15*. 16"4
St SISI SI SISI SI SISI SI si51Deep well drained silty soils (minor)
| Deep, well drained, stratified silly wills((major)
Make laigcr pilx and add organic
nuttei lor plaining; avoid lungponding on clayey soils, avoidplanting on sandy seals
SI51 S NSI 51 S352 SI SI SI SI1*5. 1**,2**, 1***,3"*
5
N NN N S3 V N 5N S3 S3S[ Deep, moderately well drained stratified clayey Mile (considerable)
Undulating, excessively drained samly soilsNN %N N N NN NN N
(minor)
Ihovulc adequate drainage. makelurgci pits and add organic mailer lorplanting, avoid planting on sandymils _ _ _
S3SI 51SI SZ 52 52SZ s: si si521", 2"6 Deep imperfectly drained, stratified silly soils
Undulating, cvcessivdy drained sandy anils(major)
(considerable) KN N S NN N NN N N N
Deep, excessively drained, stratified sandy anils[major) part with thm silty cover
Deep moderately deep, well drained. Jlrati lied (considerable)
silty anils
Avoid planting rm sandy soils; makelarger pits and add organicmatter forplanting on sHty soils
7 2. I"K, 6’*, NN SN N V NN N N NN7'*, 3'», IM
SZSISI SI sz NSt SI S351 SZ St
IVovide adequate irrigation lorcaching excess suits; mttlre larger pitsdd organic mailer and avoid overmiration un clayey soils
s 4.5 1 Deep, moderately well drained, severely salale (dominant)gyypsrtcroiis, clayey,'silty soil*Deep, modern lely well drained, noti-nulinc, non-stalk inor)
1ÿ7*7 mUl
_ N N NN 5N S3 N SIN 5J
52.52 51SZ 51 SZ si52 St SISI SI

177
Mate larger pii*. n£d or-jÿmie
fniHrrand gypsum ibr *void irt«
lfrigsUooflong ponding on dnyay
Doop, moderately ivc-ii dromcd. porous sÿine-sodic
[dominant) r.'ayey tods S N s.1 s: M N S N N N Na. 109
Dec:. mooflra;ci:-r- well cr.j rrud, non-soJ.-ie. nofi-soorc
(minor)clayey toils
__ s: SI SI Si SI SI S3 SI si SI M50*3
SI
Deep, well dr-uniÿi, mainly BtraiifitHJ, salne-sodic silly soils(major!
N N S3 SJ X y X N N N N N Make larger pit-.. i4d nrÿJiuc
matter and gypsum fin' [ilontiug;avoid planting on sandy sails
5*.109"* N N NN N N N N N N N
Undulating. oxcirvuvely drained sandy soils(conslderabh]
Deep, moderaldylimpdrfwUy wall drained, danse(major) N X Avoid plantingN N N N M N N N N Ntl 7. 4", 5”
snlne-aodfcj cl ay*iy/s H ly soils U nddatlng sandy soils[minor)
N iM N N N N V N N N N N
SI si si si SI si si M M M Si SIDeep, imped eedy dre rurd clayoy/fine silty soils[minor)
Deep, moderately well drained, dense eallne-sarftc(dominant) clnyeyfln# silly sal-39, 13*, is* Avoid paintingN N N 51 S V N y X NII
Deep. rroderaletyivaii drained, porous satme-sodio(minor)cieyey silty amis
N N S3 SI N N V \ X N V N
Umtuial m£, (itcHiH'lv drained sandy sods[mi jar) N K M Avoid planting13, U.7'1.
9", iJT\
y N y N N \ N x13
Deep, somewhat eveevsively [trained,
loamy/silly suits UIKIIIII Handed(Considerable)14",16” N N N y x x X X X X X
iV. ft Par of (tic (cjisit turn bate surveycel! i v purred in kcemmiiissanee Soil Survey Rcporrs of Indus Rivemin Area (1H)78), TtinL Souili (I !W£). Hung Afei ( I (i(iH j mid Mu limi North 1 1 9W) Tlic suit mapping unite of this urea haveheen iLitiiptcd and dcsi gnatud hy ,nM :iy, ( 1
I, ('*), ( + ), (++) m lheir respective numbers,
4 Subject tD river flood ins ill morn every ye nr during inonioon season.4 4 rliii characteristics an: generalized for important soil components of each land suitability unit. The proportion of each component is described (within parenthews) id terms of:
dominant (>&0%), major (5fl-K()%). oouidereblc (20 lo 50%) and minor ( <20%). AH the soils are level lu nearly level, stnjfltowltiomogcnjzod, nun-saline, non-sodk, pornos/pcmicahlc. will)
writer table beyond 1 50cm drpili noJ eon tain negli|jible 10 moderate (0-14%) amount ul lime, unless described odicrvsisc. The depth is defined it) icrui* ol thickness of the rociing zone us;
Deep (> 100cm) and ModerateJy deep (50-100cm. underlain by sand).

17a
6.11 DERA GHAZI KHAN DISTRICTAgroeclogical Zone III- B (Sandy Desert)
The area under report is located in Dera Ghazi Khan District of the Punjab
province. It lies between 29° 55' to 30° 3l' N latitudes and 70° 10' to 70° 54' Elongitudes .The climate of the area is classified as Arid Subtropical Continental.
The mean annual ramfiill is 186.8mm, most of which falls during late summer
(monsoon) season. The mean daily summer and winter temperatures are 34.1°C and
ISiTC with the mean maximum summer and mean minimum winter temperatures
being 39.8cC and 5,9°C respectively. The area comprises two distinct land types
namely, Piedmont Plains commonly known as Derajat and River Plains forming an
elongated strip between Sulaiman Range and the Indus River. These land systems
are further subdivided into following major landforms with a brief description on
the basis of specific nature of soils and hydrological conditions distinguished in the
area. River plains (Active and Recent floodplains, Sub recent floodplains) and
Piedmont plains (Recent piedmont plains, Sub recent piedmont plains and
Pleistocene piedmont terraces).
The Indus River along with its tributaries originating from Sulaiman Range
influences the hydrology of the area. A network of D.G. Khan Canal, Dajal Cana)
and Rajanpur Branch together with some other inundation canals irrigates the non-
flooded areas of the river plains and adjoining piedmont plains. Mithwan, Vidor,
Sakhi Sarwar and Son arc the major torrential streams whose water is diverted by
the local farmers for cultivation. Some of them discharge directly into the Indus.
River floods, surface and subsurface flow from the hilts and seepage from the
irrigation system are the main sources of groundwater recharge. The floodplains
and locally lower skirts of the piedmont urea, underlain by river alluvium arc in the
fresh groundwater zone. Irrigated cropping is the main land use in the floodplains
and adjoining parts of the piedmont plains. Main crops grown arc wheat, cotton,
rice, grams and millets together with mango orchards and date-palm grooves.
Torrent-watered cropping is prevalent in some parts of the piedmont plains. Main
crops grown are sorghum, oilseeds and millets Table 6.8 and Fig 6.8. The soil
mapping units mentioned above were further grouped on the basis of similarity in
suitability and management requirements of their component soils for planting
forest trees. Such groups, called as Land Suitability Mapping Units’, are
described in Table 6,8.

179
AGROECOLOGICAL ZONE 111-6SANDY DESERT
(DERA GHAZI KHAN TEHSIL)
SOILS AND LAND SUTTABJUTYFOR FOREST TREES
N
A
'1JJ !
i; \v. \m \LEGEND
SOW.S'Vjiiflt
«
*
**ACTIVE FLOODPLAINS r
Pm s£3 [< L*' FLOOOPUUWS
L)Nw i
a 3 *
15 V •
i!:i1-C3
m:ffir
Si-mi
i*11'HIE
"! 1/ r,
-im»o—:Sililr
cowvEwrroMAi SKJWSLAND SUtTABIUTY
.* *./ Wlonn
/ft-A/ Svanloy IM
* : :
winiiArt >«EZ3- r|
/V«AZl4TlEB«-~
il*4* MM 1«F|.
A/
Ph D Work of Syod M Akmal R«hlm
Botany Department Univ*r»ity of the Punjab. Labor*.
Fig 6.8 Land suitability classification Map for choice of tree species in Tehsil Dera Gazi
Khan district Dera Gazi Khan

180
Table 6.8: Land Suitability Mapping Units-Dera Gazi Khan Tehsil: Component Soils, Land Suitability for Forest trees andspecific management requirements
LandSuit-
CumpoaentSoil
MappingUnits
Lund Suitability fur Forest TreesSpecific Management
Rcquircmcntv ImprovementSuggestions
Spotting Characteristics of Component Soils**( proportion of the component soil)
ability M»(vB-riotShBI Mill Ktkir
Unitc
Aimi.l*Jhm
Mitti#.tndk*
Com,
myir.
Irtiiloir*
fir Ml
rrttoFieHI
Itni-t'llent turn
X<**-J'llJWil.M.arti
MUMi
No specific management required:nuxe larger pilv add organic nulla
Tor planting and avoid over irrigation)tong pondingCHI clayey soil*
l 3’, 5.6.15a, Iha
Deep, well drained, part stratified city loamy Milt (dominant)
Deep, moderate!* well drained, port stratified clayey soils (minor)
SISI SI $1 SISI si si SIsi sisi
SI SI SI SISI SISISISI SISI SI
No specific management required,make larger pit*. add ut game matterfor planting on clayey soilsand avoidover in i pul km' long ponding; in addit¬ion -,.l,t usnsiUTt l,s pnl*
2 4 Deep, well drained, silly, loamy roilsDeep, moderately well drained clayey noilsDeep, moderate) y well drained, laline-sodjc
SI SISI SI StSI(considerable)(rtmsidernblc)
(minor)
SI SISI SISI SISI SISI SI SIsz S2SI SISI SIsiN NN NS3 NS3 N NN SIN
L.I.ivrv j|ilti miR
Make larger pits end add organic
maUor, avoid over Irrigation/ longponding; no specific managementrequired for silty,toamy soils
3 13 Deep, moderately well drained clayey toils SI siSI SI SIS2 S352S2 St SI(majorl SI
Deep, well drained silty/loamy noils SI S3 SI51 S1 S1S1 S1S1 £1(considerable) 51Si
Slake larger pits, add organic nutter Tea
darning and avoid ova irngntiatV long
bonding
4 10s Deep, moderately well drained, clayey soils ofpiedmont pains •irrigated
SI si SI52 SI SI S2si(dominant) SI SI SISI
5 2" Make larger [tils, add organic nutterand avoid ova irrigation long
ponding;, no specific managementrequired for tilty/loamv milt
Deep, moderately well drained. strati lied clayc y soft (dominant)
Deep, welt drained strnri lied silly soil*
S3 S3S3 S3S3 S3 SISI SIS3 SIS3
SI Si SISI SISiSI SI SIiminor) SI SISI
Make Saiga piis. add organic muter furA 14 Deep, moderately well drained clayey soils
with shrink-swell characteristic*Deep, moderately well drained clayey mils
S3 S3S3 53 S3 S3(major) S3 S3 S353 S3S3planting and avoid over irrigation/ long
pondingSI si52 52 S2 SISI SI(considerable) SI Si SISI
A* nnl planting on candy soils; ::uspecific nuiugcmcnl required forsilty,loamy soils
7 10 Undulating, evccinvrly drained sandy wils
Deep, well drained, silty.' loamy urns_ft SS N 5S s N(dominant) 5 N N N
SI siSI SI(minor) SI SI SISI SISI 51St

181
Avoid planting on mndy MJII*. makelarycr pita mid udd organic matter furplaining; ovmdovcr imgaliua lungponding on clayc) M>I1»
___H 6'*, 7‘* N NNUndulating, excessively drained, randy soils
Deep, well drained, stratified silty soilsDeep, moderately well drained, stratified clayey sods
N NNN NN N(major)(conshlrrabte)
(minor)
N NNSISISI S2SI SI SISiSI SINNN S3 S NSS3 S3N NS
Make larger pits, odd organic matterand gypsum lor planting on safmo-sodlc soils. no specific management
I required lor normal siity/taamy soils
9 N«. II Deep, wdl drained, saline-wdic silty,'t tnycy soils
Deep, well drained, non-rallne, non-iodic silty soils
NIS N VNNN N(dominant) N SI
K»SISI SI SI SISt SI SISI(minor) SISI
10 Adopt appropriate mcisturnconservation measures
15.1*. 27Id. II, 27
NDeep, well dm used, clayey/ silty soils tortenl-watered (dominant SI S3 NN N NN N S3SIN
II Avoid pluming19.15, It,18 NPiedmont terrace* wills linlc development potential (dominant )
for field Cure,wry due to acute moisture shortage andnil line arid I ty
NN hi NN NN NNN
N.B-I TIIB soil mapping units hearing ( ' ) refer to the Tefistl area surveyed and reported untin Reconnaissance Soil Suivey Report of Indus R iverain AreaS B-3 Mapping units with suffix (a) represent irrigated areas
Subject to river Hooding almost every year during monsoon season.** The characteristics ate generalized for important soil components of each land suitability unit. The proportion of each component is described (within parentheses) in terms of
dominant p80%), major (50-80%), considerable (20 to 50%) and minor ( <20%).All the soils are level to nearly level, structured/homogenized, nan-saline, non-sodic, porous'permeable, with water tabic beyond 150cm depth mid contain negligible to moderate (0-1 4 4)
amount of Itmc. unless described otherwise. The depth is defined in terms of thickness of the rooting zone as:Deep (> 100cm) and Moderately deep (50-100ctn, underlain by sand),

182
6.12 KHUSHAB DISTRICT
Agroeclogical Zone III- B (Sandy Desert)
The area under report is located in Khushab District of the Punjab province. It lies
between 31° 59" N to 32° 43' N latitudes and 71° 42' E to 72° 37' E longitudes (see
location map) with the elevation ranging from 185 to 137° meters. It covers an area
of 4,133.06 square kilometers (413,306 hectares). Tire climate of the area is
classified as Semiarid Subtropical Continental. The mean annual rainfall is
310.5mm, most of which falls during late summer (monsoon) season. The mean
daily summer and winter temperatures are 3I.30C and 17.4°C with the mean
maximum summer and mean minimum winter temperatures being 38.2°C and 9.3°C
respectively. The following major landforms with specific nature of soils and
hydrological conditions are distinguished in the area. Recent floodplains, sub recent
floodplains, sub recent deposits on old river terrace, Old wind resorted river terrace,
old loess plains, mountainous land and weathered rock plains and Sub recent and
old piedmont plains. Jhclum River traversing along the eastern boundary of the
Tehsil and Thai canal system including Nurpur Distributory and Hadali Branch
mainly controls the hydrology of the area. A considerable deprcssional part of
piedmont plains and northern part of Thai is irrigated by this canal system. Seepage
from canals as well as due to ineffective drainage by hill torrents large depressions!
area is suffering from high water table at its confluence with Sub recent and recent
floodplains. In Recent and Sub recent floodplains ground water quality is generally
good due to the aquifer recharge during high floods. In piedmont plains and inter
mountain valleys, there is no other source of irrigation water except rains. Locally
patches are under irrigation by springs and hill torrents. Rain fed cultivation
of wheat, gram and millets, locally supplemented by hill torrents and springs is the
main land use in piedmont plains, loess plains and weathered rock plains. Part of
the piedmont plains and sub recent deposits on old river terrace is under irrigated
cropping with canal supplies. Rest of the area is cither dry farmed or lying
uncultivated, used for poor grazing. In floodplain areas agriculture is practiced on
residual flood moisture supplemented by tube wells. The main crops grown are
generally wheat, gram, sugarcane and fodder. The soil mapping units mentioned
above were further grouped on the basis of similarity in suitability and management
requirements of their component soils for planting forest trees. Such groups, called
‘Land Suitability Mapping Units', are described in Table 6.9 and Fig 6.9
some
as

183
NAGROECOLOGICAL ZONE III- BSANOY DESERT(KMUSHAB TEHSIL)
SOILS AND LAND SUITABILITYFOR FOREST TREES
Aion
v-,
u*nt #ÿ
rJ T*
.<L
LEGENDSOILSRECENT FLOOOPLAWR WEATHERED ROCK PLAINS
a
:S n
BUBRECENT PIEDMONT PLAINSLAND SUITABILITY
*i—i rmm >«i 111 1
«QM-H f£2BUBRECENT DEPOSITS ON aOLD NVR TERRACE OLD PIEDMONT PLAINS *| ml*1
*
WCONVENTIONAL SIGNS
rv A</V /vwn|
/V«* /V/VOLD WAND RB»OftTEO MUR TERRACE A/
LOESS PLAINS
» «tfKl
1*
Ph D Worft of Syad M. Atonal Rahim
Botany Dapartmant, Unlvaralty of tha Punjab, Labor*.
Fig 6.9 Land suitability classification Map for choice of tree species in Khushab district
Khushab

184
Table 6.9: Land Suitability Mapping Units Khushab Tehsil: Component Soils, Land Suitability for Forest trees and specificmanagement requirements
Land Land Suitability for Forest TreesComponentSoilSuit- Spotting Clmrncterislics of Component Soils**
( proportion of the component soil)ftwr HlQlifaftr fpSc fptr Hut*u Brft'ÿrtur iLiknr L'HIStip/ HsfnifHability Mapping
Units ShiUnitsh Specific Management
Keq uircments/lmprovemept
Suggestions
am
/litpfaJujull-
EIKII MtUiindl
M Q4IU9 Silli Lee*,
*t*°-Armu
ModelA***Indki
Bomb Aeat
nilDli ilhj lnbUJtboicrib*Oatb
ihnuiiSI siDeep, wul| drained, 'tltiyi'loumy soil?- imputed ( major) SI SI si Sl St SI SI SI SI SI
No specific iiMiiin'euwi-.i required; ittikeLarger pits, add organic nmHcT'liglH doses
ul'N fertiliser for plant mg an coarse loamynoils and irrigate at ahorler intervals
1 S'Deep, aomewluu excessively drained,
coarse loamy viiJ* irrigated(cun*idcruble) SI SJSI 52 SI SI si Sl SI SI SI SI
NN N S3 N S3 N NS3 S3 N S3Deep. excessively drained. candy soils- irrigated__Deep, wet) drained, stratified city-fine salty toils- irrigated (major)
(minor)
Sl Sl Sl SI SI St SI Sl siSI 51
S1 No Specific management required;make larger pits, add organic matteravoid over irrigation / long ponding
on clayey soils
Deep, moderately mil drained, slratifiedclayey soil*- irrigated
( mlnor)I lUM'.r
si S3 S3 S3 S3 S3 SI S3S3 S3 S3 Sl
Moderately deep Over Hand, nett drained, stratifiedsilty/eoarsc luairiy --nils- undated
_Deep, mOcJoraldy wall drained, clayey soils - Irrigated (dominant)
(minor)
(miner)S3 S3 S3 S3 S3 SI S3 SISI S3 S3 52
Sl S3 S3 SI Sl SI .S3SI S3 S3 523 3, 34, 3’ SIMake larger pits, mid Organic mutter urn!
avoid over irrigation!Jong pondingDeep, well drained, fine s itty/l on rr.y soils - irrigatedSI Sl Si M SI SI SI Sl SISI St Si
Deep, somowhol excessively drained,
(conilderablti)
coarse loamy sods- irrigated
Deq>. excessive!) drained, sandy soils- irrigated (considerable)
52 S3 S3 S3 SI SI S3 S3SI S3 S3 SI4Mite Larger pits, add organ w matter and Nfalilno for planting on coal to loamy soils
and irrigate at thurlwt intervals: avoidp&tumg on sandy salts
S3 N N N S3 N N N.Sl N S3
N N N N X N NN N N N XIJnduljune deep, excessively drained, sandy soils (minor)
Deep, well rtmlnod, fine ioamy/silty soils si si S3(dominant) S3 S3 S3 SI S3 S3 Sl S3 SIs
Adopt adequate muisturc eonsci vntlonmeunure*
Deep, somewfiut nxcessively drained, coarse
loamy soils
(minor)lft. 24
S3 S3 S3S3 S3 S3 SI S3 S3 S3 S3 S3
(dominant)Deep, well drained, fine silty/loamy soils53S3 S3 S3 S3 S3 S3 K2 S3 S3 S3 S3 Adopt adequate moisture conservation
measure*6 9, 12,22
Deep, moderately well drained, clayey sods (minor) S3 S3 S3 51 S3 S3 S3 S3 S3 S3 53 S3
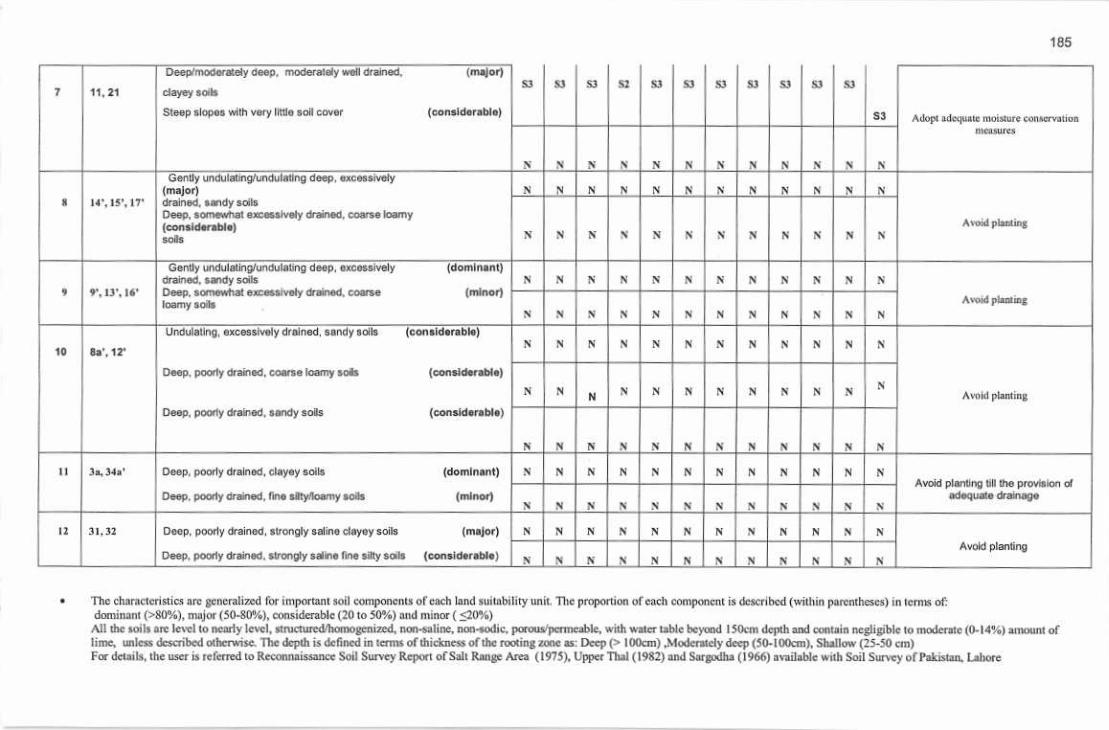
185
Deep-' 'iiodcrately dees. modergnyy wall drained.
clayey 30b
Steep slopes with vury little soli cnvur
1 major)
S3 SJ Si si S3 si SiS3 S3 S3 S31 11.21
(censidoraLdD) S3 Adopl adeqiuta muisiuri eeiuarvulioantffliurcs
> V N \ V N .v Pt s N s NGcrlly urLtuialÿng/undplaiinQ deep, excessively
(major)drained, sandy soilsDeep, somewhat UKcesiJvdy drsnn«iL coarse loamy(considerable)
N N PI N N. N N Pi N_N NH 14*, 15’, IT'
Avoid plir.iinÿN M Pi \ S N N N N N SSOitS
Gently udduleUng/nridulaiing deep, excess ivelyoraineo, sandy soilsDeep, somewhat excessively draned, coarseloamy soils
(dominant)N N Pi N N N N N N N N
(minor)t **, 13', lb'Avtvd plinlmj
N V N H M N N N Pr N % N
Undulating, excessively drained, sandy soils (Conaidarable)N N N N N N N N N Pi N N
10 la', 12'
Deep, poorly drained , coarse loamy soils (conslctorabta)NN N S PI N IV N Pi IS N AwW pLaniinpN
Deep, pooÿiy drained, sandy soils (considerable)
N N N N N M \ IV Pi IS
Deep- poorly drained, clayey sells
Deep, poorly craned. lino silty loamy 30.Is
II 3«, 34s’ (dominant) N N N N Pi N N PI N N PI NAvoid plsnllng till the provision of
adequate drainage(minor)N X N % M N X X N \ N s
II 31,32 (major)
Deep, poorly drained, strongly sel me line silty s»is f considerable]
Deep, poorly drained, strongly saline clayey soils N NN N X N N It PI PI Pf NAvoid planting
N \ N N Pi N N PiV
The charat Lei i sties a re generalized for important .soil components of each land suitabilityimil The proportion of each component is described (within parentheses) in terms of:dominant (>80%), major f50-SG%), considerable (20 to 50®/n) und minor ( <20%)All rhe soiis arc level to nearly level, siruciured'liomojtetiizEd, non-saline, ntw-sodic. parous/pcrmeable, with water table beyond 150tm depth and Liuiuiin negligible to moderate (0-14%)irtviuni orlime, unless described otherwise The depth is defined in terms of thickness of the routine rode as- Deep t L lOUcmj .Moderately deep ( 5tMOOcni]L Shallow (25-50 cm)
For details, the user is referred Lo Reconnaissance Soil Survey Report of Salt Range Area (1575), Upper Thai t [lS2j and Sargodha (I96£) available wuli Soil Survey of Pakistan, Jjhure
«

186
6.13 MIANWALI DISTRICT
Agroeclogical Zone III- B (Sandy Desert)
The area under report is located in Mianwall District of the Punjab province. It
lies between 32° to' N to 33Q 0l' N latitudes and 71° !(/ E to 71° 58' E
longitudes. The climate of the area is classified as Semiarid Subtropical
Continental. The mean annual rainfall is 310.5mm, most of which falls during
late summer (monsoon) season. The mean daily summer and winter
temperatures are 313°C and 17.4“C with the mean maximum summer and
mean minimum winter temperatures being 38.2°C and 9.3°C respectively. The
following major landforms with specific nature of soils and hydrological
conditions are distinguished in the area. Active and recent floodplains, Sub
recent floodplains. Old river terrace. Sub recent deposits on old river terrace,
Old wind resorted river terrace. Re-deposited old loess plains, weathered rock
plains ,sub recent piedmont plains and old piedmont plains. The Indus River
traversing along the western boundary of the Tehsil and the Thai Canal System
running through the center of the area mainly controls its hydrology, A
considerable area in the south including a part of the piedmont plains is
irrigated by this canal system. Cheshma-Jhelum Link also runs through the
western pan but does not provide irrigation. Seepage from the canal system
has created high water table conditions at places in the adjacent areas. In
piedmont plains and inter-mountain valleys, there is no source of irrigation
water, Locally some patches are under irrigation by springs and hill torrents.
Rain fed dry farmed cultivation of wheat, gram and millets locally assisted
with hill torrents and springs is main land use in piedmont plains and weather
rock plains. In floodplains, agriculture is practiced on residual flood moisture
supplemented by tube wells. The main crops grown are generally wheat, gram,
sugarcane and fodder. Natural vegetation includes Acacia arabica (Kikar)
Cynodon dactylon (Khabbal), Eleusine jhgeliifera (Chhimber), Saivadora
Oleoides (wan), Prosopis spicgcra (Jand) Capparis aphylla (Karir), Tamarix
articulata (Farash) TemarLx diocia (Lani) and Cymbopoganj juarancusa
(Lhewi) Table 6.10 and Fig 6.10.The soil mapping units mentioned above were
further grouped on the basis of similarity in suitability and management
requirements of their component soils for planting forest trees. Such groups,
called as ‘Land Suitability Mapping Units’, arc described m Tabic 6.10.

187
N
AAGROECOLOGICAL ZONE lll-BSANDY DESERT
IMIANWAU TEHSJL)
SOILS AND LAND SUITABILITYFOR FOREST TREES
n
3 *-ÿ 4 »
0. *LEGEND
BBiaSOLSMTnVE AMO RECENT FLOOOPl.AJNS
l :
mmJmHUBHECBIT FUMOnJUNB
Mmnimucn
9DEPOSIT1CM OU) RIVER TTMACU
MR!
v jOj
0 <>m
oiDWMD naoHTCii wvEn THMcea
mHummocuuiuiMs
«m
MATHEmo ROCM MM*
pi r ; -
I 'o iC3o
•OOrfr* :
9LAND SUtTABIUTY CONVENTIONAL SIONS
/V4« *| •| w, VJM »K3} * nmm “wr~i «
>V‘V7i fs/
r'l
BB*-- '
Ph D Work of Syad M Atonal Rahim*>«*> Ecotoftc* InprO at Aomtormtry *> Pw*at> Botany Daoartmant, Unlvaralty of tha Punjab. Lahora.
Fig 6.10 Iÿand suitability classification Map for choice of tree species in Mianwali
district Mianwali

188
Tabic 6.10: Land Suitability Mapping Units Mianwali Tehsil: Component Soils, Land Suitability for Forest trees and specificmanagement requirements
Specific ManagementRequirements:Improvement
Suggestions
ComponentSoil
Land Suitability far Korcsl t reesLandSuit* Spalling Character!sties af Component Sait**
( proportion or the component soil)ElsinLpklpl* PWWrÿr•hility Mapping MaulSJ*I
JujutfiiAndktdie*
Unit t-rmt o*«,
Wei(ifltw
-\fottnUnit Hrl:« Ttfaimh
rttbaIhilhnunw
P°p*
drllol
tearant
irlhti
No specific management required,prefer use for nurseriesS Deep, well drained, uitty/fine silty soil*- irriÿulcd.I (dominant S152 S1SIsi S131 S1St S1S1 31
No specific management required,prefer use for nurseries, avoidplanting on sandy soils
: Deep, well drained, loamy ' silly scilr-un gated25. 24ir. loir4\5‘
(dominant! 31S1 31$1 SI31 S2S1 SI31 S1 SI
Deep, excessively drained, sandy soils mainly irrigated (minor)
NS3 NS3 S3 NJN NN _NS3 S3Mate larger pita, uckl uTgimiL. mutterand avoid over irrigation / lungPOIKUBM__22ir, 34 ir Deep, moderately well drained, clayey,'line till) soils (dnmlnnnt)3 3333 S232 S231 S2S3 S2S3 S1S2
Moke larger pits, add organic matter
and light doses ofN feriiliner forplanting and irrigate at sbnrlctintervals, avoid planting on sandy soils
6',T Deep, well drained, coarse loamy soi'v-tmgjitcd4 (dumlnahil 52S3 3252 S232 S2S3 32S3 S2S2
Deep, excessively drained, sandy soils mainly irrigated (minor|
N NS3 S3 NS3 N_N NNS3S3Make larger pita and add organic
matter for planting; avoid planting on
randy tOiD1,S,# Deeprooderalrly deep over rand, well drained.
stratified silty soilsDctsp. excessively draired. strntitied mndy soilsport with thin silly cover)
5 (dominant) S332 S1 5231 S1 N32 S1S1 32S2
(minor)
N NN NN M NN N NN NAvoid pluming on sandy soil a. makelarger pits, add organic matter andlight dons of N fertiJiaer for plantingon coarte loamy soils and irrigate at
shorter intervals
8*, 9\10',
J3\ IS*, 16*
Deep, extensively drained, sandy gbils-irrlgaiod
Deep, somewhat excessively dra tned, courseloamy sorii-tmgatedUndulating deep, excessively drained, sandy sortsconsiderable)
__Deep, excessively drained, stratified sandy soils
pan with Lhtn silly ctiver
Deep/moderately doop over sand, woll drained,considerable)stratified sdiy soils
(conitderable)6 N NS3 NNN N N S3S3 S3S3
(considerable)S3til SI S3SI S3SI SIS3 S3SI S3
NNN NN N N NN N NN
(major)Avoid plummy on study soils; makelinger pus and add organic nudler forplanting on silty sois
7 2,6" NN NN NN N NN NN N
S3 SI_N_SI SISI SISI si SIS2 SIDeep, well drained, loamy soils (dominant)
Adopt adequate moistureSI S38 SI24, 26, 6". S3 S3S3 SISI SIS3 S3S3

189
conservation measures: avoidplanting on sandy soils
Gently undulating1 undulating, deep, excessivelydrained, sandy soils
(minor)7", 9"
N N S s N N N SN _N_ IS Mdopt adequate rrnmtureconservationmeasures
Moderately deep over sandstone. well drained,
luomy.'Tne Snamy soils(dominant)
ir\12"9 33 Si S2 S2 S3S3 S3 Si S3 S3 S3S3
S N N N N NN N N N N NShallow over sandstone, excessively drained, sandy soils (minor)
Adopt adequate moistureeonservauion measures; avoid longponding
Deep, moderately well drained, clayey soils (dominant)10 10".3d S3 S3 S3 S3S3 S2 S3 S3 S3 S3S3 S3
S3S3 S3 Si S3 Si Si SiS3 S3 S3 siDeep wed drained, loamy soils[minor)
Adopt adequate moistureGently undulating, deep, well drained, gravellyfine foamy/tcamy soils
Deep, well drained, fine loamy SOfe{minor)
(dominant)11 28" S3 S3 S3S3 S3 S3 S3 S3 S3 S3S3 S3conservation measures
S3 S3S3 S3 S2 S3 Si SIS3 S3 S3 Si
Adopt adequate measureconservation measures
Deep, writ drained, fine siltylioamy soilsII 22 (major) S3S3 S3 Si S3 Si S2 S2S3 S3 S3 S2
Deep, moderately wel drained, clayey soli[considerable)
S3 S3 S3S3 SI S3 S3 S3 S3 SIS3 S3
Avoid planting on sandy soils; adoptadequate soil- moisture conscnaban
measures
(major)Gently undulating-' undulating, deep, excessivelydrained, sandy wiltDeep, well drained. loamy/sdly sods(considerable)
13 27, 28, 29 to N N NN to to to to toto to
S3 si SI S2 SI S2 S3S3 S3 S3 si S3
Avoid plantingSloping shallow over sandstone. excessively: drained, sandy soilsSleep to very steep rocks with liulo soil cover
(major)23"13 NN N N to to N N NN N N
(considerable)
>N N N N V N NN N N 3
Avoid plantingUndulating deep, excessively drained, sandy antis19' (datninahtlIS M N N hi N N Nto N N N to
* Subject to annual flooding during monsoon icrwlt alto includes » minor irrigated partThe characteristics ate generalized for Important veil components of each land suitability unit The proportion of each component is described (within parentheses) in terms of dominant (>80%), major (50-80%),
considerable (10 to 50%) and minor ( <20%). All the soils are level <o neatly level, stractured'hoinogcnizcd. mw-uililie, nsm-sndic, puroua'permcnble, with wa(« table beyond |5Ucm depth and contain negligible to
moderate (0-14“i) amount of lime, unless described otherwise The depth l* defined in (mm o( lit ukness of tile rooting zone as: Deep l> 100cm) Moderately deep (JtMOOcm). SHolion (25-50 cm)
190
6.14 OKARA DISTRICTAgroeclogical Zone IV- A (Northern Irrigated Plains)
The area is located in Okara District of the Punjab province. It lies between 30°
317 to 31° 09 N latitudes and 73° 13; to 73° 50ÿ E longitudes (see location map)
with the elevation ranging from 192 to 195 meters. It trovers 1,872.20 square
kilometers (187,220 hectares).The climate of the area is classified as Semiarid
Subtropical Continental. The mean annual rainfall is 367.3 mm, most of which
falls during late summer (monsoon) season. The mean daily summer and winter
temperatures arc 30j<>C and 17.1°C respectively with the mean maximum
summer and mean minimum winter temperatures being 36.9°C and 9.3°C
respectively. The Annual Potential Evapo-transpiration is 1550 mm. The monthly
variations of rainfall, temperatures, evaporation and relative humidity, as
calculated from the last 30 years (1961 to 1990) meteorological data of nearest
station Faisalabad (Pakistan Meteorological Department, Lahore), arc as follows.
The following four major landforms with specific nature of soils and hydrological
conditions are distinguished in the area as Active Floodplains, Recent Floodplains
Sub recent Floodplains old river Terrace.
Ravi River making the north/northwestem and old bed River Beas the
southwestern boundary of the Tehsil along with the irrigation network of Lower
Bari Doab Canal control the hydrology of the area. The area is irrigated by Lower
Bari Doab Canal system especially Gugera Branch and Okara distributaries. A
narrow belt along the old bed of Beas bears some drainage problem. The deep
groundwater is generally brackish especially in the Old river terrace but of
good/useable quality in floodplains.
Most of the Tehsil area is under irrigated general cropping of wheat, maize,
cotton, sugarcane, millets, oilseeds, tobacco, vegetables and fodders with
perennial canals supplemented by tube wells. Other important crops include
orchards of citrus, mango and guava. Natural vegetation has been cleared in most
of the area for cultivation however, uncultivated parts comprising mainly saline-
sodic soils support natural vegetation including mainly Acacia arabica (kikar),
Salvadora oleodies (wan), Cynodon dactylon (Khabbal), Cymbopogan spp
(Khcwi grass), Capparis aphylla (Karir), Salsolafoetida (tani), AJhagi camelorum
(jawanh), Calotropis procera (ak) and Eleusene jlagellefera (dumber grass).
Planted trees include Acacia irtdica (kikar), Populus aiba (poplar), Eucalyptus sp>,
Dalbergia sissoo (shisham). Bomb celba (simal), Table 6.11 and Fig 6.11.
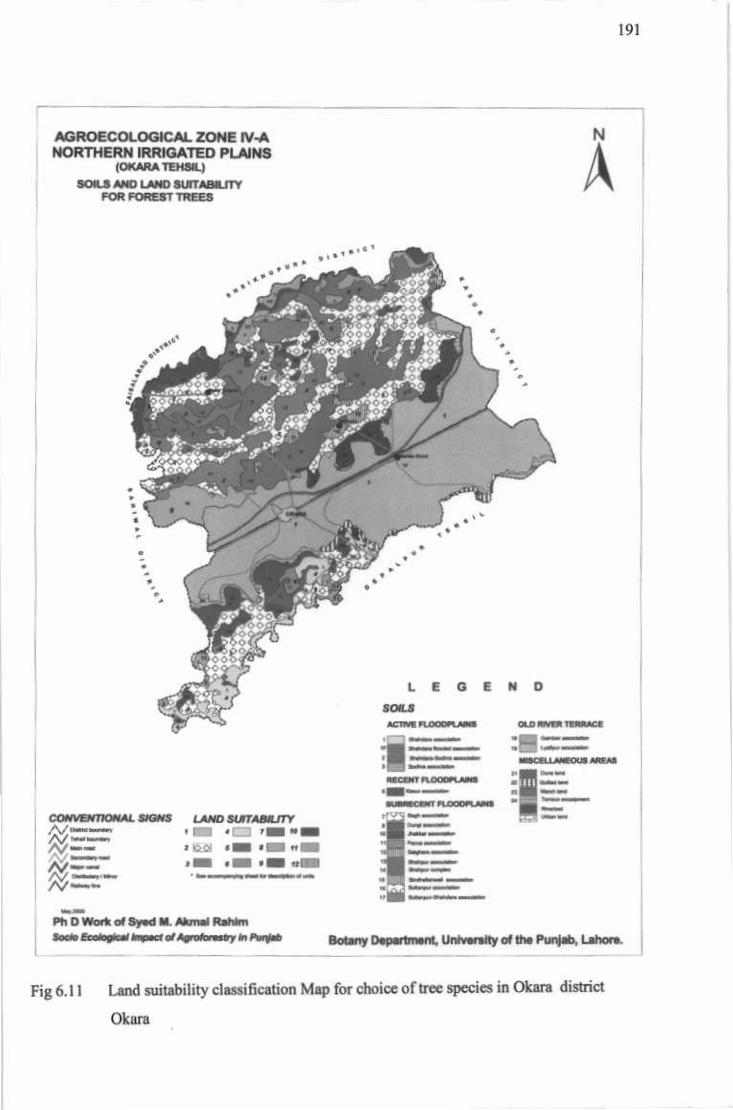
191
NAGROECOLOGICAL ZONE 1V-ANORTHERN IRRIGATED PLAINS
(OKARA TEMSIL)
SOLS AND LAND 5UTTABILITYFOR FOREST TREES
A* * *
- >
mmsuma?/
yA; mzti4
4
m«
*
& *i abooJr;
LEGEND:
" V SO(LS
ACTWB DLOOOKAM OLD mvot TCARKC
fl MM
liween njoomjm*
FUWfUM
OONIÿOTONAL SK3MS LAND SUfTAMMJTY
‘IMWIA/ *A/'—
A/ * KuH « *
A/ » >*l
/v
Ph 0 Work of Sy*d M. Akmal Rahimffippllp IknpKf CMjf fry Jfl Fiirrffiaf] Botany Department, University of tha Punjab, Lahore
Fig 6.11 Land suitability classification Map for choice of tree species in Okara district
Okara

192
Table 6.11: Land Suitability Mapping Units Okara Tehsil: Component Soils, Land Suitability for Forest trees and specificmanagement requirements
LandSuit*
ability
Unit
Lund Suitability for Forest TreesComponentSoil
MappingUnits
Spotting Characteristics of Component Soils**(proportion of the component soil)
Specific ManagementReq uiremenIs/ImprovemtMit
Suggestions
Ml I KiLir Tool SWIM KWH
FOplW
AvMkulka
Saint AMi Hang.hulka
SOthtliaeal. VetoDalit BankCtUta
fopa. Meat.tail) DM•cadi alialAuaa drlL mbit
No specific management required:use for nurseries and planting of hiÿivalue specks
Deep, well drained siltyloomy soils iiMM19 S1 S1 SI SIS1 S1 S1 SI SIS1 SII SI
No specific management required,prefer use for nurseries; make largerpits, irrigate at shorter intervals andadd light doses of N fertiliser_
7, 16 Deep, well drained silty soils
Moderately deep, well drained silty soils
S1 S1 S1 SI SI2 (dominant) S1 S1 S1 SI SISi SI
(minor) S2 S2 S2 S2 S2S2 S2 S2 $2 SZ SZS2
Make larger pits, add organic matter,
irrigate at shorter interval! and addlight doses of N fertilizers for plantingon moderately deep soils_
S2S2 S2 S2 SZ17 Moderately deep, well drained, pan stratified silly soils
Deep, well drained silty soils
S2 S2 S2 S2(major) S2 S2 S23
S1 S1(considerable) S1 Si S1S1 S1 S1 S1 5151SI
S2 Make larger pits, add organic matter,
irrigate at shorter intervals and addlight doses of N fertilizers for plantingon moderately deep soils: avoidplanting an sandy soil*
S2 S2 S2 52S2 S2 S21 Moderately deep, well drained, stratified silty soils
Deep, well drained, stratified silty soils
Undulating, excessively drained, sandy soils
(considerable)
(considerable)
(minor)
S2 52 52 S24
SI51 SI S1 31 S1 51S1 S1 S1 51S1
NN N N NN N N N NN N
IF*, 2* S1 SZ Make larger pits, add organic matterfor planting; avoid planting on sandysoils
Deep, well drained, stratified silty soils
Deep, excessively drained, sandy soils
525 (major) SI SI S2S2 SI SI SIS2 SI
N(considerable) N NN N NS3 N N S3 NS3
S2 Make larger pits, add organic matterfor planting: it ngale carefully to avoidponding; in addition to that addgypsum on salinc-sodic soils_
Deep, moderately well drained clayey sods
Deep, moderately welt drained, porous sahne-sodicfine siltyclayey soils
S2 S3 S2 52 SZ11 (dominant) S2 S2 S1 S26 S2 51
N(minor) H N N NN S3 52 N SN N

193
Make larger pits, add organic matterfor planting: irrigate carefully to avoidponding; avoid planting on densesaline-sodic soils __
13,14 Deep, moderately well drained, clayey soils
Deep, moderately well drained, dense saline-sod ic
claycy/ftnc silty soils
S37 S2 S2(dominant) S2 SI S2 SI SI S2S2 S2 SI
(minor) N N N SS3 N N NN N Pi N
Make larger pits, add organic matterand gypsum fur planting, irrigatecarefully; avoid planting on densesaline-sodic suits
SIDeep, moderately welt drained, silty soils with sodic substratum (major)
Deep, moderately well drained, dense saline-sodic silty soils (considerable)
Deep, well drained, non-saline, non-sodic silty soils (considerable)
SI S2 SI S2 SISI SI S2 SIS2 S2Hi8NN N N NS N N S3 N NN
S1 SI SI SISI SI 51 SI SI SISI SI
Moke larger pits, add organic matter
and gypsum for planting; irrigatecarefully, avoid ponding in low-lyingareas
V Deep, moderately well drained, porous saline-sodicclayey/tine silty soils
Deep, moderately well drained, non-saline, nun-sodicclayey/fine silty soils _
N N N9 M S2 N N N(dominant) S3 NN N
S3 S2(minor) S2 S2 S2 S2 S2SI S2SZ S2 SI
5, 10 Make larger pits, add organic matterand gypsum for planting: irrigate atshorter intervals and add light doses ofN fertilizers on moderately deep toils
Deep, mainly moderately well drained, mainly stratified, (dominant)saline-sodic silty soils
Moderately deep, well drained, mainly stratified, non-salme, (minor)non-sodic silly soils_
N1U X N NN 53 N NN N S2 X
S2S2 S2 S2 S2 S2 S2 S2S2 S2 S2 S2
3 N Avoid planting on sandy soils; makelarger pits, add organic matter, irrigateat shorter intervals and add light dosesofN fertilizers for planting_
11 Undulating, excessively drained sandy soils N N NN N N N N(dominant) N NN
Moderately deep, well drained silty/loamy soils (minor) S2 S2S2 S2 S2 S2 S2 S2S2 S2 S2S2
Avoid planting on dense saline-sodicsoils; make huger pits, add organicmatter for plnnting on nan-salute, non-sodic soils and avoid ponding
12, IS Deep, moderately well drained dense saline-sodicclaycy/fino silty soils
N N12 (dominant) NS3 N N NN N N NN
Deep, moderately well drained clayeysoils S2(minor) S2 S2S2 S2 SI S2 S2 S3 S2S2 SI
* Subject to river flooding almost every year during monsoon season.** The characteristics urc generalized for important soil components of each land suitability trail. The proportion of each component is described (within parentheses) In terms of: dominant
(>80%), major (50-80%), considerable, (20 to 50%) and minor ( <20%).All the soils are level to nearly level, stmetured/bomogenized, non-saline, non-sodic, porous/permeable, with water table beyond 150cm depth and contain negligible to moderate (0-14%)
amount of lime, unless described otherwise. The depth is defined in terms of thickness of the rooting zone as: Deep (> 100cm) and Moderately deep (50-100cm, underlain by sand).

194
6.15 SAHIWAL DISTRICT
Agroeclogical Zone IV- A (Northern Irrigated Plains)
The area under report is located in Sahiwal District of the Punjab Province, It
lies between 30 24' to 30 56' N latitudes and 72°49' to 73 ° 2l' L longitudes
with the elevation ranging from 1 72 0 to 175° meters. The climate of the area is
classified as Semiarid Subtropical Continental. The mean annual rainfall is
266.4 mm, most of which falls during late summer (monsoon) season. The
mean daily summer and winter temperatures are 33J°C and 14.1°C
respectively with the mean maximum summer and mean minimum winter
temperatures being 39.1°C and 6.6°C respectively. The monthly variations of
rainfall, temperatures, evaporation and relative humidity, as calculated on the
basis of 10 years (1958 to 1967) meteorological data of the nearest station
Sahiwal (Pakistan Meteorological Department, Lahore) are as follows.
The following four major landforms with specific nature of soils and
hydrological conditions are distinguished in the area like active floodplains,
recent floodplains sub recent floodplains old river terrace. Ravi River making
the north/northwestern and old bed of Bcas the southwestern boundary of the
Tehsil along with the irrigation network of Lower Bari Doab Canal controls
the hydrology of the area. The area is irrigated by Lower Bari Doab Canal
system. A narrow belt along the old bed River Beas bears some drainage
problem. The deep groundwater is generally brackish in the old river terrace
but of good/useable quality in floodplains.
Most of the Tehsil area is under irrigated general cropping of wheat, maize,
cotton, sugarcane, millets, oilseeds, tobacco, vegetables and fodders with
perennial canals supplemented by tube wells. Other important crops include
orchards of citrus, mango and guava. Natural vegetation has been cleared in
most of the area lor cultivation however, uncultivated parts comprising mainly
saline-sodic soils support natural vegetation including mainly Acacia arabica
(kikar), Salvadora oleodies (wan), Cynodon dactylon (Khabbal), Cymbopogan
(Khewi grass), Capparis aphylla (Karir), Salsola foetida (lani), Alhagi
camelortim (jawanh), Caqlotropis procera (Ak) and Eleusene Jlagellefera
(chimber grass). Planted trees include Acacia indica (Kikar), Populus alba
(poplar), Eucalyptus sp., Dalbergia sissoo (Shishum), Bomb celba (Simal)
Table 6.12 and Fig 6.12.

195
AGROECOLOGICAL 20NE IV-ANORTHERN IRRIGATED PLAINS
(SAHWALTEHSIL)
SOILS AND LAND SUITABILITYFOR FOREST TREES
N
A
LEGEND *
"SCHLS/ACTIVE FLOODPLAINS
4*
Slfj
1 T; ; it1
JmViRECENT ROOOPUUN3
•milSU8RECEHT FLOODPUUHS
mm
iOLD RIVER TERRACE
*i .* S
A
-I•.A
V.\ «i
..*•*, if
3: O'1ÿ#
ML”MISCELLANEOUS AREAS
1=?CONVENTTCWAL StGHSLAND SUTTABIUTYfSf.» ItITT7f 4 m>y—/»•—i-
«ixs • * IT
A/l> I1OK/VIhMWiif
Ph 0 WorV of Syed M. Atunal Rahim
Soclo Ecologies!Impact of Agrofonmlry In PbnM) Botany Department, University of the Punjab, Lahore.
Fig 6,12 Land suitability classification Map for choice of tree species in Sahiwal district
Sahiwal

196
Table 6.12: Land Suitability Mapping Units Sahiwal Tehsil: Component Soils, Land Suitability for Forest trees and specificmanagement requirements
Laud Suitability for Forest TreesLundSuit-
ComponentSpotting Characteristics of Component Soils**
( proportion of the component soil)Specific Management
Requirements/ImprovcmentSuggestions
Soil tfWlHSira MJUtfi iMiuaHE |M" t&ju Toot Wild*>.!i . !IMability Mapping
Unlls3nil
UnitSfi-Js llltmib Mica
AlHi. I .Ulrfljc.WHt.
Sail*Dalb.
LoadI’apn, Aeat.
MilMIIML aliaMtNo speti tic mnnagemeni requited;use for nurseries nnd planting of highvalue species191 Deep, well drained altyloamy soils S1(dominant)! si S1 S1 S1 SI SI SIS1 SI SI SINo specific management required,prefer use for nurseries; make largerpits, irrigate ai shorter intervals andadd light doses of N fertilizer
2 7.16 S1 S1 St SIDeep, well drained sdty soils
Moderately deep, well drained silty soils
(dominant) S1 S1 SI StS1 S1 SISI
S2S2 S2 S2 S2 SI S2 S2(minor) S2 SI S2S2Moke larger pits, add organic matter,
irrigate at shorter intervals and addlight doses of N fertilincra for plantingon moderately deep soils
___3 6, 17 SZ S2 S2S2 S2 S2Moderately deep, well drained, part stratified silty soils
Deep, well drained silty soils_S2 S2 S2(major] S2 S2S2
S1 S1 S1 SI(considerable)! si SI S1 S1S1 Si S1S1Make larger pits, odd organic mutter,
irrigate at shorter intervals and addlight doses of N fertilizers for plantingon moderately deop soils; avoidplanting on sandy soils
1 S2 S24 S2 S2 S2 S2Moderately deep, well drained, stratified silty soils
Deep, well drained, stratified silty soils
Undulating, excessively drained, sandy soils
S2 S2 S2S2 S2 S2(considerable)
(considerable)
(minor)
S1 S1 S1S1 S1 SI S1S1 S1 S1 S1SI
NN N N N N NN N NN N
Make larger pits, add organic matterfor planting; avoid planting on sandysoils
5 IF*, 2* S1Deep, well drained, stratified silty soils 52SI 51 SI 52 51(major) SI SI SI SIS2
Deep, excessively drained, sandy soils (considerable)| S3 N NN NN S3 N NN S3 N
Moke larger pits, odd organic matterlor planting; irrigate carefully to avoidponding; in addition to that addgypsum on salmc-sodic soils
6 II S2Deep, moderately well drained clayey soils
Deep, moderately well drained, porous salinc-sodicfine silty/clayey soils
_____S2 S3 52 S2S2 S2 S1 S1 S2 SZ(dominant) S2
N(minor) S3 S2 N N NN N N N NN
Moke larger pits, odd organic matterlor planting; irrigate carefully to avoidponding; avoid planting on densesaline-sod ic soils
7 13, 14 Deep, moderately well drained, clayey soils
Deep, moderately well drained, dense salinc-sodicclayey soils__
52(dominant) SZ 52 S3 52 SZ S252 S2 SI SI52
(minor) N N N N NN N N NN N S3

197
Make larger pin, add organic mailer
and gypsum Toe planting, irrigatecurehilly; avoid planting on densesaiine-sodic soils
Deep, moderately well drained, silly soils with sodic substratum (major)
Deep, moderately well drained, dense saline-sodic silty soils (considerable)
Deep, well drained, non-saline, noo-sodic silly soils (considerable)
S2 SI $2 SI SI S2 S2 S2 SI sz SI SI188N N N N S3 N N N N N N N
SI SI SI SI SI SI SI SI SI SI SI SI
Deep, moderately well drained, porous salinc-sodicdnycyfine silly soils
Deep, modcraidy well drained, non-saline, non-sodicdaycy/fine silty soils_
(dominant)9 N N N S3 SI N N N N9 N N N Make larger pits, add organic mutterand gypsum for planting; irrigatecarefully, avoid ponding in low-lyingareas
(minor) S2 S2 S2 SI SI S2 S2 S3 S2 SZ S2 S2
Deep, mainly moderately well drained, mainly stratified. (dominant\)salinc-sodic silty soils
Moderat ely deep, well drained, mainly stratified, non-saline, (minor)
non-sodic silty soils
5,10 N N N S3 S2 N N N N N N Moke larger pits, add organic matterand gypsum fur planting irrigate tit
shorter intervals and add light dosesof N fertilizers on mod. deep soils
10 N
SI SI SI SISI S2 SI SI SI S2SI S2
Undulating excessively drained sandy soils (dominant)3 N N N N11 N N N N N Avoid planting on sandy soils; makelarger pits, add organic matter,
irrigate at shorter intervals and addUnfit doses of N fertilizers for planting
N N N
Moderately deep, wdl drained silly/loamy soil* (minor) S2 S2 S2 S2 SI S2 S2 SI S2 SI S2 S2
Deep, moderately well drained dense salinc-sodicclayey-'silty sot Is
(dominant)12, 20 N12 IS IS N S3 N N N N N N Avoid planting on these soilsN
* Subject to river flooding almost every year during monsoon season.
** The characteristics arc generalised for important soil components of each land suitability unit. The proportion of each component is described (within parentheses) in terms of:dominant (>80%), major (58-80%), considerable, (20 to $0%) and minor (<20%).All the soils are level to nearly level, structured/homogenized, non-saline, non-sodic, paroustpermeahie, with water table beyond 150cm depth and contain negligible to moderate <0-N%)amount of time, unless described otherwise. The depth is defined in terms of thickness of the rooting zone as: Deep (>100cm) and moderately deep (50-100cm, underlain bj sand).

198
6.16 CHICHAWATNI TEHSIL
Agroeclogical Zone IV- A (Northern Irrigated Plains)
The area under report is located in Sahiwal District of the Punjab province. It lies
between 30° 10' to 30° 43' N latitudes and 72° 23' to 72° 56/ E longitudes (see
location map) with the elevation ranging from 165 to 170 meters. It covers
1,631.21 square kilometers (163,121 hectares). The climate of the area is
classified as Semiarid Subtropical Continental. The mean annual rainfall is 266.4
mm, most of which fells during late summer (monsoon) season. The mean daily
summer and winter temperatures are 33.3°C and l4.1tfC respectively with the
mean maximum summer and mean minimum winter temperatures being 39.1°C
and 6.6°C respectively. The following four major landforms with specific nature
of soils and hydrological conditions are distinguished in the area, Active
Floodplains, Recent Floodplains Sub recent floodplains and old River Terrace.
Ravi River making the north/norlhwestem and old bed of Beas the southwestern
boundary of the Tehsil along with the irrigation network of Lower Bari Doab
Canal controls the hydrology of the area. The area is irrigated by Lower Bari
Doab Canal system. A narrow belt along the old bed of Beas bears some drainage
problem. The deep groundwater is generally brackish in the old river terrace but
of good/useable quality in floodplains. Most of the Tehsil area is under irrigated
general cropping of wheat, maize, cotton, sugarcane, millets, oilseeds, tobacco,
vegetables and fodders with perennial canals supplemented by tube wells. Other
important crops include orchards of citrus, mango and guava. Natural vegetation
has been cleared in most of the area for cultivation however, uncultivated parts
comprising mainly saline-sodic soils support natural vegetation including mainly
Acacia arabica (Kikar), Salvadora oleodies (wan), Cynodort dactylon (Khabbal),
Cymbofxtgan (Khewi grass), Capparis aphylla (Karir), Salsola foetida (Lani),
Albagi camelorum (Jawanh), Calotropis procera (Ak) and Eleusene Jlagellefera
(Chitnbcr grass). Planted trees include Acacia indica (Kikar), Popuhis alba
(poplar), Eucalyptus sp.. Dalbergia sissoo (Shisbam), Bomb celba (Simal) Fig
6.13 and Table 6.13, The soil mapping units mentioned above were forther
grouped on the basis of similarity in suitability and management requirements of
their component soils for planting forest frees. Such groups, called as ‘Land
Suitability Mapping Units', arc described in Table 6.13 with respect to their
component soil mapping units, spotting characteristics.

199
AGROECOLOGICAL ZONE (V-A
NORTHERN IRRIGATED PLAINS{CHICHAWATNI TEH3IL)
SOILS AND LAND SUITABILITYFOR FORE8T TREES
N
Aa'
*'* ft
t* Y \\t
•4fl , i
*t
**1
.A *1]O *
I , SR • / */,nik *t
4> o •:•
*** fij 9* rWO >%ÿI*
— y_o>6offo<
R#>GOOOO«MP
tv 1L
K
§9**
'N|LEGENDSOILSACTIVE FLOOOPLMW OLD RIVER TERRACE LAND SUITABILITY- I r « IIIIJm ii«
It t i ft«
iRECENT FLOODPLAINS IttSCELLANEOUS AREAS>|
SUBRECENT FLOODPLAINS Mrj CONVENTIONAL SIGNS
At*mUtamwt
?
1-3 JHir?
141
»»5IT|
Pti 0 Wort; of Syvd M. AkmaJ R*h<lmSoelo EcaJopfctS Impact of AgratarMfry fa Pwÿtb
Fig 6.1 3; Land suitability classification Map for choice of tree species in Chichawatni
District Chichawatni
Botany Dapartmont, University of tha Punjab, Labor*

200
Table 6. 13: Land Suitability Mapping Units Chichawatni Tehsil: Component Soils, Land Suitability for Forest trees and specific
management requirements
I jnidl KallHltl Illy liar Pt'rttli Titf*I «nd
Friiii-
CompoitmiSprririt M•Mfccmcfil
KdjuIttibciilAiI tn|i ravciiicHt Su ji t*lFrirfl MjrariJiiy. Ch*r»0l»rtrikft arCanrpaiu’ni
( pi npurttaivi ijC tin* cnnBjinnfisl AditSim JiiiVtfill NeemKlkju tocajyp ttikotn Toot Wsllcm Manj-nKhinlwJ
ability Mapping
II nilsIP I'opluT$iiHulCult
IWJ. AzadiS't*tJ—*
SaHt Atbiz.itM
VWTI-E»cwl-tamil
ME JtnWHii,
CtAtPnpri.
m!*ti Miletadf Win
Nil iprnlk mmutcmml mauled.use lor nuraenos and ptiinUng of hlgll
value aperies _31 SI31 SI si SI SI1 S1 S1 SI51SIHoop, sv(H| drained srltyloamy soilsis (domlfmnl)
No ipecific rruBWKCnwnl enquired,pituhri mr fdrrninrnu. nuke lllfsrp>t»_ iiriKMr si ilwvf imorvili and•ild liiila iluur*of S tribluti
SI Si31 SI SIS12 si siStSt SISt?. I* Deep wed drained silty tot* (dominant)
SI32 S2 SI s:32 Si SIS2S3 S3SIModerately deep. well drifted silty spin [minor)
32 32 Mnko lurgei pi Is, add organic matter,Irrigate el shorter i morval* and addfight dotes of N tolilizon for plantingon _
32 S332 3232 323 32 3232SI3, 17 Moderately deep, well drained, part slraUfted silty soils (major)
31 S1 S131 3131 5131 SI51 SIStPoop drained may aols
MakO larger pile, add organic mattertor ptinlliuj. avoid pluming on sandy
32 SI S2SIsi StSI st St* SISI 31IKM* Deep, mil drained, sunufuil (jllyndi (major)
N M: it 1NNN NN NS,1 NS.1 S3NDeep, cktcmively Pruned, nukly soils (reaiidrrablr)
Mam larger pita, add organic mailerfor planning; irrigate car<dally to avoidponding, In addHron lo that addgypsum on salmo-sodic sals
3232 32S232 52 S3S 31 SI32 32 S2II. U Deep, moOoratoty wefl drained dayrry todi (dominant)
N NN N NN32 HH S3N NDeep, moderately wull drained salmo-aodicr»ne aiHy'elayey salts_ (minor)
Man* larger pits, add organic matter
»nd gyptum tor planting , mgotecnrofulty avo»d plonimg on densesaPtie-SOdic soils
SI SiSI SIDeep, moderately aid drained, sity sort* with socSc sutravoivrr (major)
Deep, moderately welt drained, dense ssline-eodic sdty *tnl« (considersbird
Deep, wull drained, norvaalmo, non-sodlc kilty soils (considerable)
SI SI31 SI MSI 31SIt13 hf NN NN NN s? ft3 N N
31 St SISt sist SISI SIsi SI SI
Make larger pits, add organic matterand gypsum for planting. .regale
carefully avtui ponding in tow-lyingmeat
N N7 N N NH N NS3 SI,S s9 Deep, moderately wall drainea, porous sikno-sodk;
daynytene sdty sods
Deep moderately welt drained, non-salme, non-sodlcdayayfflna siity soils_ _
(dominant)
31 SIS3 SI SIM SI32 SIS3 3131(minor)
Make larger pits, add ergarue mallurand gypsum for ptanling. irrigate at
N N3 N N NN NSJ si NS N5. 10 Deep, mplnty moderately well drained. mainly stratified (dominant)

201
short* iniiHvals and add light do*** ol
N Iwsliiors oo moderately deep sodsIsaline-sodc silty »o>ts
Moderately (feeo. well drained mmniy strntiSed, non-saline
non-sodic illy soda
SISIs:S2 SISISIS2SISIS2SI(minor)
Avoid pianlmg on landy sorts; mHko
larger pit), add organic matter, imspte
at (Sorter interval* and add light do»w
lorNlartihlura for olanllnu__
NNHMNNNNNNNN9 (dominant), Undulating, eacesiuveiy drained sandy son*3SISI919132SISI91SIS292SI
(minor)Moderatel y deep, wall tfrane-d siltyloamy strife
Avoid plsniinp <Hidcn.ie lalner-rodic
soik no specific sniutcsnnn lornon- due,ora-soJk rtliy »iU
NNNNNNNS3NNNN10 Deep, moderately wait drained demo saHne-sodle silly sells (dominant)
(minor)
zasi siSISISISISISISISISISI
poop, well drained, non-a aline,'non-sotHc wlty Mile
Avoid planting on dense salwie-sodicMil); make larger pits, add organic
matter lor planting on non-amino, nerv-sod*c clayey sods end avead ponding
NNNNSsS3 hNXN11 (dominant)[Deep, moderately won donned donse sahno-sodlcdnywy/silly soils
peep, moderately well drained, rton-saiine/non-eodtc clayey sods (minor)
II32SISIszS3SISISIStSISISI
* Subject to river flooding almost every war during monsoon season.
generalized for important soil components of each land suitability unit. The proportion of each component is described (within parentheses) in terms of:
dominant (>80%), major (50-80%), considerable, (20 to50%) and minor ( <20%).
All the soils are level to nearly level, structured/homogenized, non-saline, non-sodic. porous/permeable, with water table beyond lSOcnt depth and contain negligible to moderate (0-14%)
amount of lime, unless described other wise. The depth is defined in terms of thickness of the rooting zone as: Deep f> /00cm) and Moderately deep (SO-100cm, underlain by sand).
•* The charanensties are

202
6.17 MULTAN DISTRICT
Agroeclogical Zone IV- A (Northern Irrigated Plains)
The area under report is located in Multan District of the Punjab province. It lies
between 29°48/ to 30° 26 N latitudes and 71°16/ to 71°49y E longitudes wiLh the
elevation ranging from -123 to 125 meters. It covers about 2,006.7 square
kilometers (200,670 hectares). The climate of the area is classified as Arid
Subtropical Continental. The mean annual rainfall is 186.8mm, most of which
falls during late summer (monsoon) season. The mean daily summer and winter
temperatures arc 34.PC and 15.5°C with the mean maximum summer and mean
minimum winter temperatures being 39.8°C and 5.9cC respectively. The
following landforms with specific nature of soils and hydrological conditions arc
distinguished in the area, active floodplains, Recent Floodplains and Sub recent
flood plains
Hydrology of the area is affected by River Chenab and Old bed of Beas forming
the northwestern and southern boundaries respectively. The later also provides
natural drainage to the area. High floods during monsoon inundate the area
along River Chenab usually for a few days. The area is nrigaied by a network
of Multan and Shujaabad Branches. Ground water quality is good and is being
used as a supplementary source of irrigation. Most of the area is used for
irrigated general cropping with canal and tube wells. The main crops grown are
cotton, wheat, millets and fodder. Mango, date-palm and citrus arc foe most
common orchards. Natural vegetation includes Acacia arabica (kikar), Cynodon
dactyhn (khabbal), Eleusine JIageili/era (chhimber), Zizyphus nummularia
(mallah), Zizyphus jujuba (ber), Salvadora oleoides (wan), Prosopis spicigero
(jand) Capparis aphylia (karir), Tamarix ariiculata (farash) Tamara diocia (lai)
and Cymbopogan juarancusa (khewi) Fig 6.14 and Table 6.15.
The soil mapping units mentioned above were iurther grouped on the basis of
similarity in suitability and management requirements of their component soils
for planting forest trees. Such groups, called as Land Suitability Mapping
Units', arc described in Table 5.14 with respect to their component soil mapping
units, spotting characteristics and proportion of the important component soils,
suitability of each soil for selected tree species and specific soil management
requirements/improvemenl suggestions.
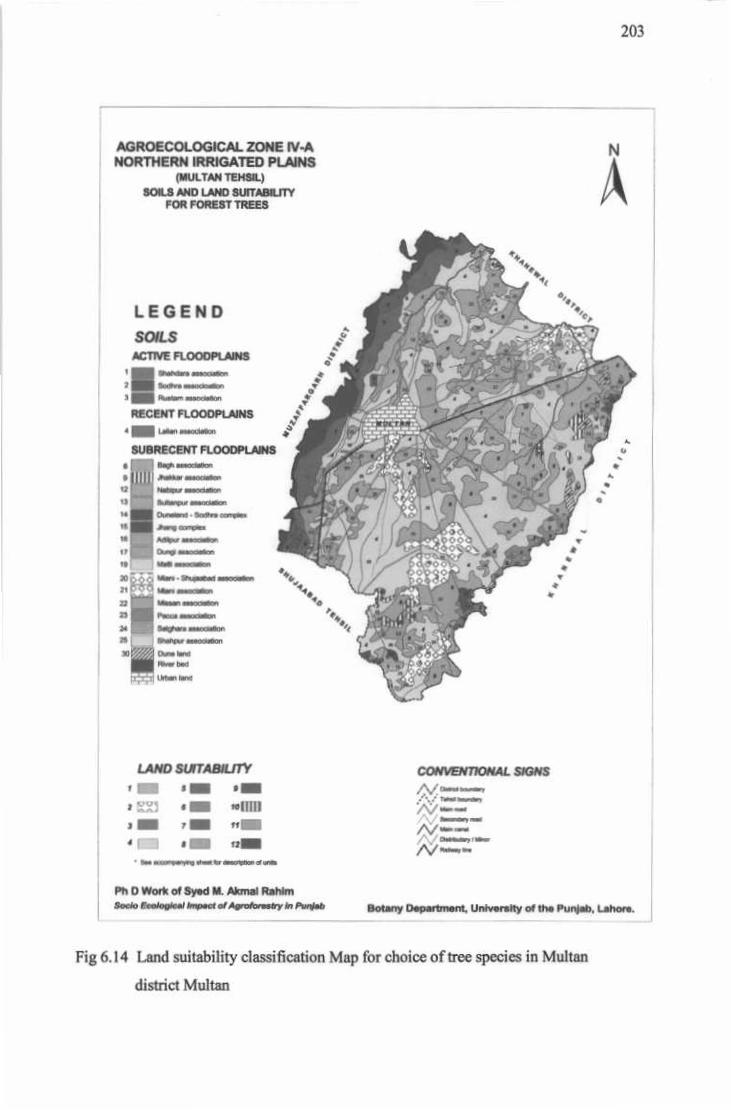
203
AGROECOLOGICAL ZONE tV-ANORTHERN IRRIGATED PLAINS
(MULTAN TEHSIL)
SOILS AND LAND SUITABILITYFOR FOREST TREES
N
A\
V\
%LEGEND
SOILSACTIVE FLOOOPLAWS
% m _/
m
*
1 Si i- CCIO / ’'ÿ'7/ « - n'( : ' , j/ i
1 *,HRECENT FLOODPLAINS
/4 Ljriian HtaeUryari
f.* Ar».SUBRECENT FLOODPLAINShÿMddrim
tj»> * f
ii# r *•-«•
*m ' Krt %
M." e o
9 I
'710005 \ '
Iflfe •JkA y
f /# wJ*-r **r *s 3A *
*s *
\•*
k<H*fj
i* V #ri:iT
*1 V/yy/X KHWOM
*71: ilman**
LAND SUITABILITY CONVENTIONAL SfGNS
/Vt **imi»SKJ •
-V.«T1 A/--/V. .f\/WH
4
*1
Pt) 0 Work of Syad M. Akmal RahimSoclo Vatoglcml Impmcl of AgroforMy In Botany O*p*rtmoot. Unhrerekty ot tha Puiÿab, Lahore,
Fig 6.14 Land suitability classification Map for choice of tree species in Multan
district Multan

204
Table 6. 14: Land Suitability Mapping Units Multan Tehsil: Component Soils, Land Suitability for Forest trees and specificmanagement requirements
I-Iiml Sditilhilih for forest TreesComponentLandSuit¬ability
Specific MunanertieinReqiiircments/lmpnivenivnt
Suggestion*
Spotting Characteristic* of Component Soils**( proportion of the component soli)
ft TnotSoil w w.MappingUnits
Mniu PKI|UII
Unit Mb,
ihsaar*r*. At*r.
carnalUclia Salic libiZ bta*+
labdt MicaW. AUKU
Micacctba J.-li gjg* alba baba lamb
Deep, well drained silty/loamy sols[dominanl}
6, 12.13 SI St SI1 SI St SI SI SI SI No specific management required; preferuse for nurseries
SI SI SI
Deep, well drained fine silty/lomy soils (dominant)20, 212 SI SI SI SI SI SI SI SI Si SI SI SI No specific management required;add organic mace* and gypsum forplanting on clayey soils _Deep, moderately well drained clayey seal* (minor) S2 S2 SI SI S2 SIS2 S2 S2 SI S2SI
Deep, well drained stratified *ihysoil*
Deep, moderately well drained stratified clayey soil* (considerable)
(major)3 4 St SISI SI SI SI SI SI SI Moke larger pits and add organic mailerfor planting; avoid over irrigation I longponding on dayey soils
SI SI St
S2S3 S2 SI S2 S3 S3 52 S3 S3S3 S3
Deep, moderately well drained clayey soils(major)
Deep, well drained fine silty soilsconsiderable)__
19.25 SI4 52 S2 SI S2S2 S2 52 S2 S2 SI Make larger pit* end add organicmatter for planting; avoid overrrrtgaUon/long ponding by rain water
S2
SI SI SI SI SI SI SI SI SI SI SI SI
Deep, moderately wen drained, stratified dayey sals(major)
Moderately deep, well drained, stratified silty soilsconsiderable) ____
3* S3 $2 S25 SI S2 S3 S3 S3 S3 Make larger pits and add organicnailerfor planting; avoid long ponding ondayey soils
S2 S3 S3
S2 S2 52 S2 S2 S2 52 S352 N S3 N
Deep, moderately well drained clayey soils
Deep, moderately well drained, salinc-sodicclayey/fine silty soils
23 (major) $26 52 $1 SI S2 S2S2 S2 S2 S2 S2 S2 Make larger pits, add organic matter forplanting; and avoid over irrigaliou/longponding; in addition add gypsum onsalinc-sodic noils
(considerable) N N S3 S2 N NN N N N N N
Moderately deep, welt drained, stratified silty sails
Deep, excessively drained, stratified sandy toil*_(considerable)
(major)7 SII* S2 SI S2 S2 S2S2 S3 S3 N NS3 Moke larger pits, add organic matter andlight doses of N fertilizer fur planting:avoid planting on sandy soilsN NN N N N SN N N N N
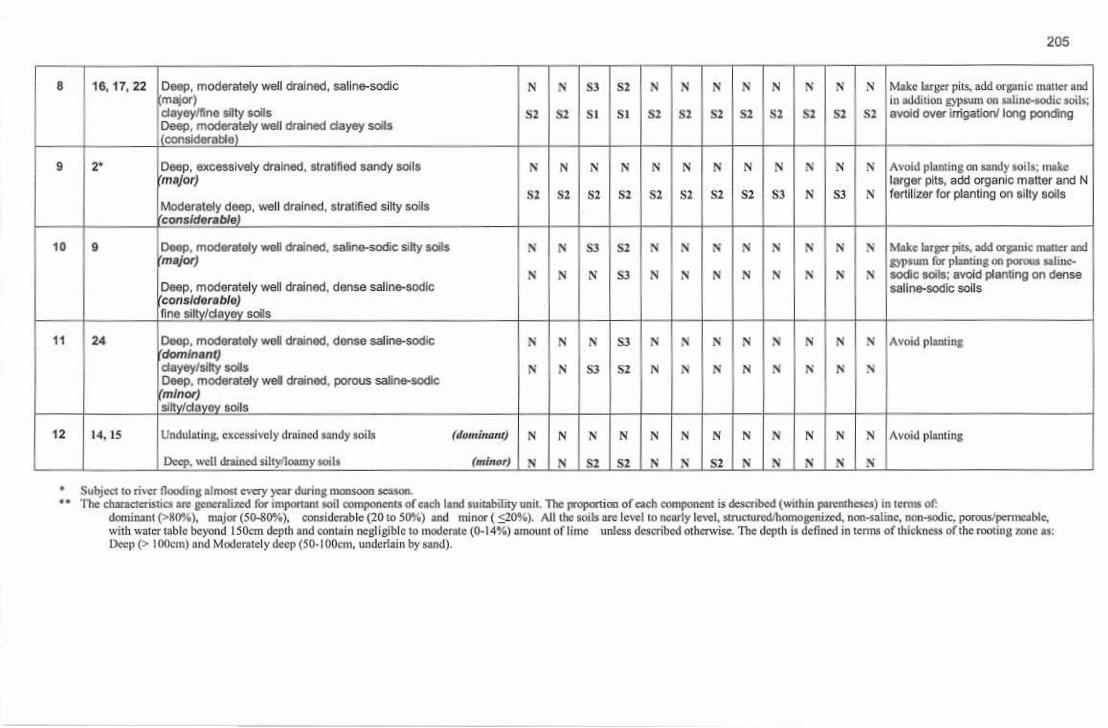
205
8 16, 17, 22 Deep, moderately well drained, sallne-sodic[major)dayey/fine silty salsDeep, moderately well drained clayey soBs(considerable) _
Make huger pits, add organic matter andin addition gypsum on saline-sodic soils;avoid over irrigation! long ponding
N N N N N N NN N S3 S2 N
S2 S2 S2 S2 S2 S2S2 S3 SI SI $2 52
9 Deep, excessively drained, stratified sandy soils[mayor)
Moderately deep, well drained, stratified silty soils[cons/deraNeJ_
Avoid pluming on sandy soils; makelarger pits, add organic matter and Nfertilizer for planting on silty soils
2* N N N N NN N N N N N
S2 S2 si S2 S2 S3 N 53 N52 S2 S2
10 Deep, moderately well drained, saline-sodic silty soils'major)
Deep, moderately well drained, dense saline-sodic(conskiorablo)fine sllty/dayey soils_
9 Moke larger pits, add organic matter andgypsum for planting on porous salinc-sodic soils; avoid planting on densesallne-sodic soils
N N N N NN N S3 S2 N N N
N N S3 N N N N N N N NS
11 24 Deep, moderately well drained, dense saline-sodicdominant)dayeyfsilty soilsDeep, moderately well drained, porous saline-sodic(minor)silty/clayey soils_
Avoid plantingN NS N S3 hi hf N N \ N N
N N M NN N S3 SI IN N hi N
12 Undulating, excessively drained sandy soils Avoid planting14,15 (dominant) NN N N N N IN N N N N N
Deep, well drained silty/loamy soils (minor) N N N NN N S2 S2 N N S2 hi
* Subject to river flooding almost every year during monsoon season.*• The characteristics are generalized for important soil components of each land suitability unit. Hie proportion oreach component is described ( within parentheses) in terms of:
dominant{>80%). major (50-80%), considerable (20 to 50%) and minor ( <20%). All the soils arc level to nearly level, slructured/homogcnized, non-saline, non-sodic, porous/ permeable,with water table beyond 1 50cm depth and contain negligible to moderate (0-14%) amount of time unless described otherwise. The tlepth is defined in terms of thickness of the rooting zone as:Deep (> lOOcrn) and Moderately deep (50-lOOcm, underlain by sand),
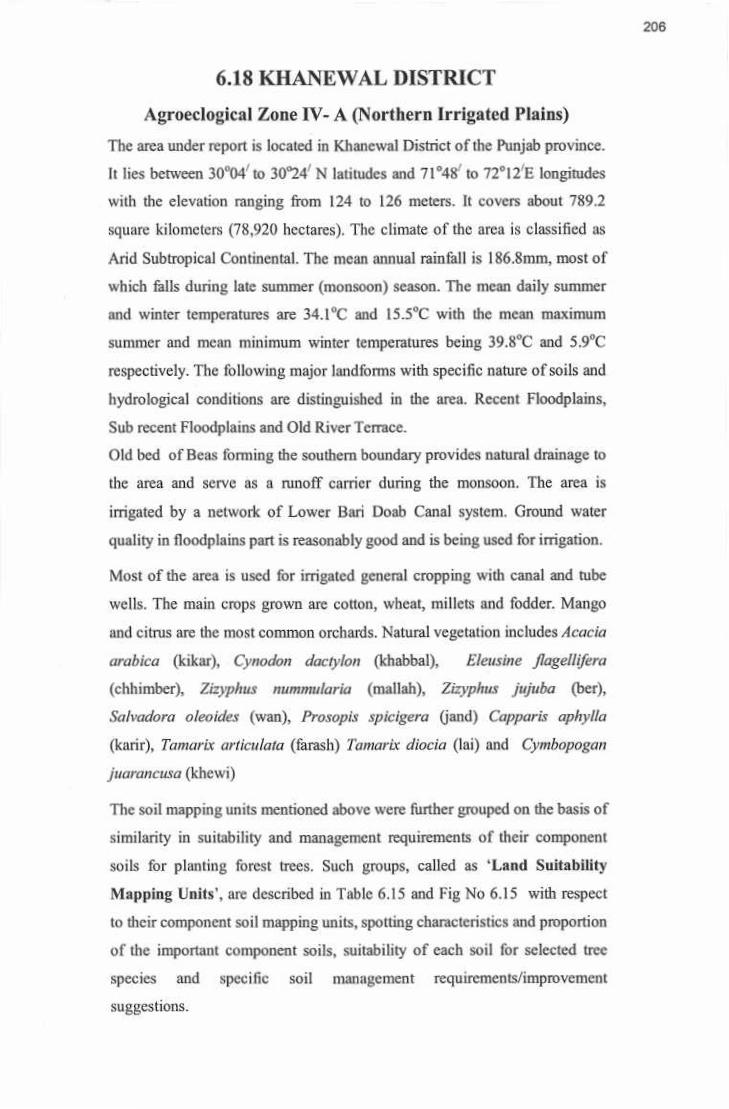
206
6.18 KHANEWAL DISTRICT
Agroeclogical Zone IV- A (Northern Irrigated Plains)
The area under report is located in Khanewal District of the Punjab province.
It lies between 30°04' to 30°24' N latitudes and 71°48' to 72,,I2/E longitudes
with the elevation ranging from 124 to 126 meters. It covers about 789,2
square kilometers (78,920 hectares), The climate of the area is classified as
Arid Subtropical Continental. The mean annual rainfall is 186.8mm, most of
which fells during late summer (monsoon) season. The mean daily summer
and winter temperatures are 34.1flC and 15.5°C with the mean maximum
summer and mean minimum winter temperatures being 39.8°C and 5.9°C
respectively. The following major landforms with specific nature of soils and
hydrological conditions are distinguished in the area. Recent Floodplains,
Sub recent Floodplains and Old River Tcrrace.
Old bed of Beas forming the southern boundary provides natural drainage to
the area and serve as a runoff carrier during the monsoon. The area is
irrigated by a network of Lower Bari Doab Canal system. Ground water
quality in floodplains part is reasonably good and is being used for irrigation.
Most of the area is used for irrigated general cropping with canal and tube
wells. The main crops grown are cotton, wheat, millets and fodder. Mango
and citrus are the most common orchards. Natural vegetation includes Acacia
Eleusine Jlagelliferaarabica (kikar), Cynodon dactyfon (khabbal),
(chhimber), Zizyphus nummularia (mallalt), Zizypitus jujuba (ber),
Salvadorÿ oieoides (wan), Prosopss spicigera (jand) Capparis aphylia
(karir), Tamarix articulata (farash) Tamarix diocia (lai) and Cymhopogan
juarancusa (khewi)
The soil mapping units mentioned above were further grouped on the basis of
similarity in suitability and management requirements of their component
soils for planting forest trees. Such groups, called as 'Land Suitability
Mapping Units', arc described in Table 6.15 and Fig No 6.15 with respect
to their component soil mapping units, spotting characteristics and proportion
of the important component soils, suitability of each soil for selected tree
species and specific soil management requirements/improvement
suggestions.

207
NAGROECOLOGICAL ZONE IV-ANORTHERN IRRIGATED PLAINS
(KHANEWALTEKSIL)
SOILS AND LAND SUTTABILITYFOR FOREST TREES
A",4‘
****.„„
A
h
LEGENDSOILSRECENT FLOODPLAINS
c
t
4 o«c.:519UBRECENT FLOOORLAIN5
™ ft *i
'ii u .
A*i
,v*4
.* an
mssf- .H 744I1_ÿ
n t
I - !4% y h<1
% *%'s'-1T Ihÿiwotto+,
>•»f
%23 I t» V rIM
n
OLD RIVER TERRACE
S VIHAKI DIVTRICT«wrviLrtK un
MISCELLANEOUS AREAS
CUM MM
LAND surrABILITY CONVENTIONAL SIGNS
/V»JSiitxi « A/M
T «>1 A/- 1 Ay/V
IblHMMMi
Pti D Work of Syod M Akmal RlNmSorio Ecological Impact atAgro*orm*y In Punjab Botany Oopartmont, Unhwrslty of tfw Punjab, Lahora.
Fig 6.15 Land suitability classification Map for choice of tree species in Khanewal
district Khanewal

208
Table 6. 15: Land Suitability Mapping Units Khanewal Tehsil: Component Soils, Land Suitability for Forest trees and specificmanagement requirements
I .and Suitability for FurcstTrccs Specific ManagementRequirements/lmprwement
Suggestions
CompuncutLandSpotting Characteristics of Component Soils*
( proportion of the component soil)Suit- s„i| L*nhl> «rb Ipfal)* (utStU*i
Tnÿm, AoU rkm fiemability MappingUnits
Atsf. AJHL Lmc*. M*ng.Mki
r<mWin ffflio. *«W-tiupp rrfSp trtft ghm.Unit
6, 12, 13, Deep, well drained silty/loamy soils(dominant)
No specific management required: preferuse for nurseries
1 SI SI SI SI SISI SI SI SI St SI SI26
2 20 Deep, well drained fine silty/loiny soil*
Deep, moderately well drained clayey soils
(dominant) No specific management required; makelarger pits and add organic nutter forplanting; avoid over Irrigation / longponding on clayey soils
SI SI Si SiSI SI St Si Si si si si
(minor) S2 S2 S2 S2 S2 S2 S2SI S2 SI SI S2
No specific management required; makelarger pits and add organic matter forplanting; avoid over irrigation 1 longponding on dayey sods_
Deep, well drained stratified silty soils
Deep, moderately well drained stratified clayey soils (considerable)
SI3 4 (major) SI SI SI St SI St SI SISI SI SI
S3 S2 S3 S3S2 S2 S3 S3 S2 S3 S3S3
Deep, moderately well drained dayey soils(major)
Make larger pits, odd organic nutter,
avoid over IrrigallorVlong ponding ondayey soils
4 25 52 S2 SI SIS2 S2 SI SI S2 52 S2 S2
SI SI SI SISI SI SI SI SI SI St SIDeep, well drained fine silty soils
(considerable)_Deep, moderately well drained clayey soils(major)
Deep, moderately well drained, selino-sodlc[considerable)clayey/Hne sflty soils_
Make larger pits, add organic mutter,avoid over inigaUon/long ponding ondayey soils; in addition add gypsum
5 23 SI $2 SI52 52 SI SI S2 S2 S2 S2 S2
S3 52 N N N N IN N IN NN Nonsaline-sodic soils
6 Deep, well drained, saline-sodic silty loaniy soils8,10.11, (major) Make larger pits, add organic nutter
and gypsum for planting on saline-sodic
N N N N N XN N S3 SI N X27
Deep, well drained silty/loamy soils (considerable) SI St SI SI SI StSI SI SI SI SI SIsoils

209
7 Make larger pits, add organic muiicr andgypsurn for planting on saline- sodic soils;
avoid over inigatlon/long ponding onclayey soils_
17. 21 Deep, moderately well drained, saline-sodicdayey/Gnc silty soilsDeep, moderately well drained clayey soils
N N(major) N N N N N NS3 S2N N
(considerable) S2 S2 S2 S2S2 S2 S2S2 SI SI S2SI
8 9 Make larger pits, add organic mutter andgypsum for planting on porous saline-sodic soils; avoid planting on densesoils
Deep, moderately well drained, saline-sodic silty soils'major)
Deep, moderately well drained, dense sallne-sodlc(considerable)Fine siltyidayey soils
N N N NN N N NN S3 S2N
NN N N NN X NN N N S3
9 Avoid planting on dense ulinc-sodic soils:make larger pits, add organic matter endgypsum for planting on porous soils
7 Deep, moderately well drained, dense saline-sodic sifty soils''mayor)
Deep, well drained, porous saline-sodic silty soils'considerabia)_
N SN N NN N N NN S S3
NH X N NS3 N XN N S2
10 24, 28 Avoid plantingDeep, moderately well drained, dense saline-sodic{(dominant)' ClayeyJsilty sate_
N NX X NN N N NS N S3
11 Avoid planting on sandy soils15 Undulating, excessively drained sandy soils
Deep, well drained silty/loamy soils_NN N N(dominant) N N NX N N N N
(minor) SI SI SI SI SISI SI SI SISI SI SI
• The characteristics are generalized for important soil components of each land suitability unit. The proportion ofcfclJ niw4nwv»lirw non-sodic, porous'pcrmeable. with
Dccp(=> 100cm) and moderately deep (50-100cm, underlain by sand).

210
6.19 VEHARl DISTRICT
Agrocclogical Zone IV- A (Northern Irrigated Plains)
The area under report is located in Vehari District of the Punjab province. It lies
between 29° 48' to 30° 14' N latitudes and 72° 07' to 72° 44' E longitudes (see
location map) with the elevation ranging from 154 to 156 meters. It covers about
1456.6 square kilometers (145,660 hectares). The climate of the area is classified
as Arid Subtropical Continental. The mean annual rainfall is 186.8mm, most of
which fells during late summer (monsoon) season. The mean daily summer and
winter temperatures are 34.lt and 15.5°C respectively with the mean maximum
summer and mean minimum winter temperatures being 39.8°C and S.9°C
respectively. The following landforms with specific nature of soils and
hydrological conditions are distinguished in the area, Active floodplains recent
floodplains and Sub recent Floodplains. Sutlej River mainly influences the
hydrology of the area; however, old bed of Beas provides natural drainage in the
northwestern part of the Tehsil. High floods during monsoon inundate the area
along Sutlej for few days. An irrigation network of Pakpatlan and Mailsi Canals
irrigates the area. Ground water quality is reasonably good and is being used as a
supplementary source of irrigation. Most of the area is used for irrigated general
cropping with canals and tube wells. The main crops grown arc cotton, wheat,
millets and fodder. Mango, date- palm and citrus are the most common orchards.
Natural vegetation includes Acacia arahica (kikar), Cynoclon dactylon (khabbal),
Eleusine Jlagellifera (chhimber), Zizypbus nummularia (mallah), Zayphus jujuba
(ber), Salvadora oleoides (wan), Prosopis spicigera (jand) Capparis aphylla
(karir), Tamarix articulata (farash) Tamarix diocia (lai) and Cymbopogart
juarancusa (khewi) Table 6.16 and Fjg 6.16. The soil mapping units mentioned
above were further grouped on the basis of similarity in suitability and
management requirements of their component soils for planting forest trees. Such
groups, called as 'Land Suitability Mapping Units', are described in Table 5.16
with respect to their component soil mapping units, spotting characteristics and
proportion of the important component soils, suitability of eacli soil for selected
tree species and specific soil management requirements/improvement suggestions.
The proportion of the component soil series is described in terms of ‘dominant\
*major\ 'considerable' and *minor’ which represent >80%, 51-80%, 20-50% and
<20% of the total area under the unit respectively.

211
AGROECOLOGICAL ZONE IV - ANORTHERN IRRIGATED PLAINS
(VEMARI TEH3IL)
SOILS AMO LAND SUITABHJTYFOR FOREST TREES
N
A
%
«XU•
mmi N #•‘
*«“ i|f
%«
>i *i. ,
* 9t f
V.< T
*IIP*
nfj *
#
•S v* t
V(:iA
VpO,‘
sc*'. .>
1
*"fLEGENDSOILS
ACTIVE FLOOOHJUW
% Xv*-9
XSTV£SUWECEWI FLOOO«JW«
1 LAND SUfTABILITY CONVENTIONAL SIGNS/y/Sr.«l « t|
m ••HIDi® • /v7'***r| Ml>1
WSCEkLAMEOUS AREAS •na • u i
>cnÿc---Pti D VHMk of Syed M. Atonal Rahim
$ochEcotogk*tr*»c1<XAgn**wt*ytnAnl*b Botany Department, Univeralty of the Punjab. Lahore.
Fig 6.16 Land suitability classification Map for choice of tree species in Vehari District
Vehari

212
Table 6. 16: Land Suitability Mapping Units Vehari Tehsil: Component Soils, Land Suitability for Forest trees andspecific management requirements
SpcdAc ManagementRci|ulrcments/lmprovcmeiil
Suggestions
Lund Suitability for Kurus t TreesLand ComponentIIMII'I Jim AH NccmSpotting Cliarsictvristies of Component Soil***
( proportion or the component moil)
Turn Willuw Sirb Ma«||i>Suit- Soil Kikir IEUCMIÿI
ability MappingUnits
MilUnit Atttz Manx-
iadiewAtadiindtea
Vitnu Salickvml), Earitcarnal
MtOar.adl
Acac.
nitalL I'.JJIIV6atU IcM•Mo.nlia *I
No specific management required; preferuse for nursenes; nuke larger pits, addorganic mailer and gypsum for plantingon saline- sodtc soils
1 SI5. S', «, 6' Deep, well drained foamy/silty soils[dominant)
St SI SISI SI SIsi SI SISI SI
NN N N NS2 N NN S3 NNDeep, moderately well drained, saline-sotfic loamy/sitty soils
(minor)_
Make larger pits and add organic matterfor planting on clayey and stratified siltysoils; avoid over irrigation on clayeyioils_
2 4.4’. 18 Deep, well drained fine luumy/rtratilicd silty soils (major) SI SI Si SJSI SI SISI SI SI SI SI
Deep, moderately well drained pari stratifiedclayey soils
(considerable) S2S2 S2 S2 S2SI S2 SISI S2 SI S2
No specific management required; nukelarger pits, add organic matter andgypsum for planting on saline- italic will
3 SIir, 12 Deep, well drained, silly/loamy soils(major)
Deep, moderately well drained, saiine-sadic silty soilsconsiderable)_____
SISI St SI SISI SI SI SISI SI
NN NN N N NN S3 NN S2
Make larger pits, add organic matter andlight doses of N fertilizer for planting;avoid over Imgatlon/loog ponding ondayey soils
4 2 Moderately deep, well drained, stratified silty soils[major)
Deep, moderately well drained, stratified dayey soils[considerable)_
S3 N S3 NSI SI S3S2 SISI S2 S2
S3 S3S3S2 S2 S3 S3 S2 S3SJ SI S2
Make larger pit*, add organic matter andlight dwelt of N fertilizer fur planting;avoid planting on sandy soils
5 1,1" Moderately deep, well drained, stratified silty sods(major)
Deep, excessively drained, stratified sandy soilsconsiderable) __
S3 NSI S3 S3 NSI SI S2 S2S2 S2
N N N NN N NN NN N N
Make larger pits, add organic matter forplanting; and avoid over imgatiotVlongponding; m addition add gypsum onsalitiL-sodic roils
6 SI S217, 23’ Deep, moderately well drained clayey soils SI S2(major) SI SI S2 S2SI S2 SI 52
Deep, moderately well drained, ulinc-sodicclave y/Enc silty soils
(considerable) N : NN N N NS3 S2 NN N NI

213
Make larger pus, add organic inailer andin addition gypsum on saline-sodic soils;
avoid over Irrigation/ long ponding
7 NDeep, moderately well drained, salinc-sodkeluycy/finc silly soilsDeep, moderately well drained clayey soils
(major) N N N15, 17’ $2 N N N NN N S3
(considerable) S2 S2 SiSI SI Si Si 52S2 SI SiSI
Make larger pits and add organic nutterfor planting, provide adequaterogationfor leaching excess salts
NB 9 Deep, well drained, severely saline gypsiferous(dominant)fine loamy/silty and dayey soilsDeep, well drained, non-saline, non-sodic loamy/silty soils(minor)__
S2 N N N52 N N NN S3N
SISI SI SISI SI SISI SI SISI 51
Make larger pits, add organic matter andgypsum on saline-sodic soils
9 a Deep, well drained, saline-sodic silty soils(major)
Deep, moderately well drained dayey sals(considerable)_
N NN N N N NN S3 S2 SiN
N S3 NS3 S3S2 S2 SI S2 52S2 Si
Avoid planting on sandy soils; makelarger pits, add organic matter and
Deep, excessively drained, stratified sandy soils'major}
Moderately deep, well drained, stratified sifty soils'considerable) _ _
10 3 N N NN N N NN N NN N
ighlS3 Nsz 52 S3 S3 NSi si si S2 Sidoses of N fertilizer for planting
11 19 Deep, moderately well drained, dense saline-sodic'dominant)clayey/fine silty soilsUndulating, excessively drained sandy soils(minor) __
Avoid plantingN N N NN N N NN N S3N
N NN N N N NN N N NN
12 Avoid planningN13, 14’ Undulating. excessively drained sandy soils
Deep, well drained silty/loamy soils_f dominant) N NN N N N NS N N N
(minor) N N N NN S2 N N 52 NN si
N.B. Part of the tehsil has been surveyed i reported in Reconnaissance Soil Survey Reports of Multan North. !9tiV and Bahomdmtgur. 1971. The soil mapping units of these unfits have been adapted and designated by adding
single prime I ') anddouble prime(") respectively to their respective numbers.* Subject to river Hooding almost every year during monsoon season.* * The characteristics are generalized fix important soil components of each law) suitability unil. The proportion of cadi component is described (within parentheses) in terms of:
Dominant (>90%), major (50S0%), considerable (20 to 50%) and minor (<20%). All (lie soils tac level to nearly level, struclured'homogenized, non-saline, non-sodtc, perousfpermeabte,with water table beyond 150cm depth and contain negligible to moderate (0-14%) amount of lime, unless described otherwise Tltc depth is defined in terms of thickness of the rooting zone as:Deep (> IOthm) amt Moderately deep (56-100cm, underlain by sand),
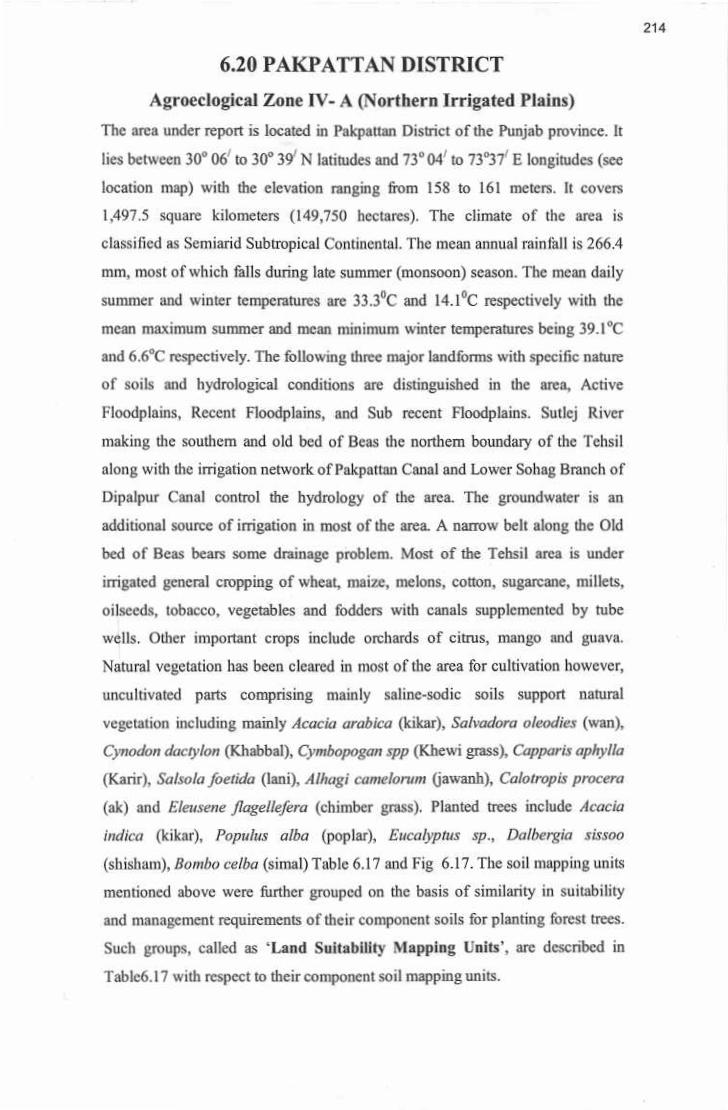
214
6.20 PAKPATTAN DISTRICT
Agroeciogicai Zone IV- A (Northern Irrigated Plains)
The area under report is located in Pakpattan District of the Punjab province. It
lies between 30° 06J to 30° 39ÿ N latitudes and 73° 04' to 73037'1 E longitudes (see
location map) with the elevation ranging from 158 to 161 meters. It covers
1,497,5 square kilometers (149,750 hectares). The climate of the area is
classified as Semiarid Subtropical Continental. The mean annual rainlall is 266.4
mm, most of which fells during late summer (monsoon) season. The mean daily
summer and winter temperatures are 33.3°C and 14.1°C respectively with the
mean maximum summer and mean minimum winter temperatures being 39.I*C
and 6.6°C respectively. The following three major landforms with specific nature
of soils and hydrological conditions arc distinguished in the area. Active
Floodplains, Recent Floodplains, and Sub recent Floodplains. Sutlej River
making the southern and old bed of Beas the northern boundary of the Tchsil
along with the irrigation network of Pakpattan Canal and Lower Sohag Branch of
Dipalpur Canal control the hydrology of the area. The groundwater is an
additional source of irrigation in most of the area. A narrow belt along the Old
bed of Bcas beats some drainage problem. Most of the Tehsil area is under
irrigated general cropping of wheat, maize, melons, cotton, sugarcane, millets,
oilseeds, tobacco, vegetables and fodders with canals supplemented by tube
wells. Other important crops include orchards of citrus, mango and guava.
Natural vegetation has been cleared in most of the area for cultivation however,
uncultivated parts comprising mainly saline-sodic soils support natural
vegetation including mainly Acacia arabica (kikar), Satvadora obodies (wan),
Cynodon dactylon (Khabbal), Cymbopogan spp (Khewi grass), Capparis aphylla
(Karir), Satsoia foetida (lani), Alhagi camelorum (jawanh), CabtropLs procera
(ak) and Ehusene flageilefera (chimber grass). Planted trees include Acacia
indica (kikar), Populus alba (poplar), Eucalyptus sp., Dalbergia sissoo
(shisham), Bombo celba (simal) Tabic 6.17 and Fig 6.17. Tire soil mapping units
mentioned above were further grouped on the basis of similarity in suitability
and management requirements of their component soils for planting forest trees.
Such groups, called as ‘Land Suitability Mapping Units’, arc described in
Tablc6.1 7 with respect to their component soil mapping units.

215
NAGROECOLOGICAL ZONE IV- ANORTHERN IRRIGATED PLAINS
(PAKPATTAN TEHSJt)
SOILS AND LAND SUITABILITYFOR FOREST TREES
A*
A
* * « e r
§LM *v;'4 " J cA -V
t
** 4 '
*_VJ rIff
* ft9
f
* 9*99% ;
99 tA
14*ti * %
V « t 5< *
fI
*Lt #>
tm
* LEGEND
SOILSACTIVE FLOOOPLNNS
*
%
=RECENT FLOOOPLAJMS
*«|
*8U8AECENT FLOODPLAINSCOHVEMTKMAL SKIMS
|/VA/*/V«—~ LAND SUITABILITY
n M/V t
/V. Ill t libd * •i/V
>
- SH aceomewifing II«I fc* tteKrtgrtHn <* unite
Ph D Work or Syod M Akmal RahimBotany Dopartmant. umv*r*tty at tha Punjab. Labor*.of A, rrtnPutÿmb
Fig 6,17 Land suitability classification Map for choice of tree species in Vehari
District Pakpattan

216
Table 6. 17: Land Suitability Mapping Units Pakpaitan Tehsil: Component Soils, Land Suitability for Forest trees and specificmanagement requirements
ComponentSol!
MappingUnits
Land Land Suitability for Forest TreosSpotting Characteristics of Component Soils**
( proportion of the component soil)Suit- Specific Management
Requirements/1mprovementSuggestions
v. >i - Stflfc Muli|P Juicum MwafllKikur tiurlv|i Twrtability
SirailUnit
A»Uhtdiem
MfU. Mel., AliitIfht
Hut.FML MirIMk nvi Ar.r,
Celt, iM
No specific management required.prefer use for nurseries; nuikc larger
pits, irrigate at shorter intervals andadd light doses of N fertilizer_
1 7, 16 Deep, well drained silly soils
Moderately deep, well drained silty soils
81 S1 SI SI SI(dominant) S1 S1 S1 S1 SI SISI
(minor) S2 S2 SZ82 S2 S2 S2 S2 S2 S2S2S2
Make larger pits, add organic matter,
irrigate at shorter intervals and addlight dotes of N fertilizers forplanting on moderately deep soils
82 32 S2 522 S2 82Moderately deep, welt drained, part stratified silty soils
Deep, well drained, pan stratified silly soils
(dominant) 32 82 S2 SZ52S2
SI S1 SI(miliar) S1 81 S1S1 S1 S1 S1 S1SI
Make larger pits, add organic matterfor planting; irrigate carefully andavoid ponding of water
__3 6 Deep, moderately well drained, stratified clayey soils S3 S2 S2(dominant) S1 S1 S2 S2 52 S2S2 S2 S2
Deep, well drained, stratified qtysoils 82 82(minor) S1 S1 S1 S1 SI S252 S1 S1S2
82 Make larger pits, add organic matter,
irrigate at shorter mtcrvitls and addlight dose* of N fertilizers for plantingon moderately deep soils; avoidplanting on sandy soils
_4 1 S2 S2 S2Moderately deep, well drained, stratified silty soils
Deep, well drained, stratified siltysoils
Undulating, excessively drained, sandy soils
S2 S2 32 S2 52 S2(considerable)
(considerable)
(minor)
S2 82
S1S1 S1S1 si S1 S1Si S1 S1 S1 31
NN N N N NN NN N N N
5 Make larger pits, add organic matterfor planting, irrigate carefully to avoidponding; ill addition to that addgypsum on saline-sodic soils__
82 S2II Deep, moderately well drained clayey soils
Deep, moderately well drained, porous saline-sodicfmc silty/dnycy soils
(dominant) S1 S2 S2 S3 S2 5232 52 S2 S1
(minor) N NS3 N N N NN N N 32 N
Make larger pits, add organic matter
for planiing; avoid planting on sandysoils
IF* Deep, well drained, stratified silty soils
Undulating, excessively drained, sandy soils
32 S16 (major) S2SI S2S2 SI SI St SI SISI
(considerable) N NN NN N NN N 15 N N

217
Deep, moderately well drained, porous saline-aodicclayey/ft tie silty soils
Deep, moderately well drained, non-saline, non-sodicdayey'finc silty soils_
9 |dominant) N N7 N N S3 S2 N N NN N N Make larger pits, add organic matterand gypsum lor planting; irrigatecarefully, avoid ponding in low-lytngareas
(minor) S2 S3S2 S2 SI S2 52 52SI S2 S2 S2
Deep, mainly moderately well drained, mainly stratified, (dominant)snlinc-sodic silty soils
Moderately deep, well drained, mainly stratified, non-saline. (minor)
non-sodic sihy soils____
5, 10 N N ft N8 N S3 S2 N N N N N Make larger pits, add organic mutterand gypsum for planting; irrigate atshorter intervals and add light dosesof N fertilizers on mod, deep soilsS’ S2 S2S2 S2 S2 SI S2 S2 S2S2 S2
4 Deep, moderately well drained, stratified dense salinc-sodicclayey soils
Deep, moderately w ell drained porous solinc-sodic siltysoils
Moderatelydeep, well drained, stratified sihy soils
N(major) N N N S39 N N N N N N N Avoid planting on sulinc-sodic soils;make larger pits, add organicmu tier, irrigate at shorter intervals andadd light doses of N fertilizers forplanting on moderately deep soils
(minor) N N N S3 S2 N N N N 14N N
iminar> S2 S2 S2 S2 S2 S2 S2 S2 32 S2S2 S2
Undulating, excessively drained sandy soils3 (dominant) N N N10 N N N N N N N N N Avoid planting on sandy soils; makelarger pits, add organic matter,irrigate at shorter intervals and addlight doses of N fertilisers tor plant ins
Moderately deep, well drained silty/loamy soils (minor) S2 S2 S2 S2 S2S2 S2 S2 S2 S2 S2 S2
* Some parts of the unit are subject to flooding by river once in 3 to 5 years.
•* The characteristics arc generalized for important soil components of each land suitability unit- The proportion of each component is described (within parentheses) in terms of;
dominant (>89%), major (59-80%), considerable, (20 to 50%) and minor ( <20%),All the soils art level to nearly level, stnicturrdOtomogenized, non-saline, non-sodic, porous/permeable, with water table beyond J50cm depth and contain negTtgihie to moderate (0-14%)amount of lime, unless described otherwise. The depth is defined in terms of thickness of the rooting zone as: Deep (> 100cm) and Moderately deep (50-!00cm. underlain by sand).

210
6.21 Discussion
The land suitability classification would help the agrofbrester and fanners
interested in planting on their farm lands suitable species of trees for different soils
in the Punjab province. Selection of sites and the species suitable for a particular
type of soil would go a long way to help the agroforester. Without this information
it would not be possible for him to select a particular tree species for a particular
site. The agroforester would not have to run around for assistance. He would get it
right at the spot. The resources available to the agroforestcr would be used
properly and diligently without wastage of the time and money. It would help him
in identifying the land management. It would be easy for the farmers to match thespecies for different alternatives and he shall be able to evaluate the land for its usefor a meaningful assessment. There are different reports available for the use of
GuttnianÿP0(p'fitat'°n cmPs ef>- ty Gregory and
The wortprediction
"here soil
“ '» “ndersland asphi®
“ S,e
10 advMtag, He wouW
°W* Monmion and
ph"%. Otsoy mwk™'ly nuUbkorbis ,and
<Pani“> -odeKn, (2007> *d." *fe
"**"**-«c ation£**"*+**; (2<>09) WC'P “> ®sWs„g lJ.'’rnmn knd
““ Planning <’fa®nc“"u'*< land
K CKps-
maPs are notA8rt>eclogical
North20ÿ, such as
w SouUi. Only be j,
** raiionallysuitability
used
as
I
with fo be Practical andventure ror fc“s been
os, Water
Successfuj AJ”AIfy been
whfehorb
res'fy 3Ion"'WauiWdein;As“'iabtesi
forestry J,ma6c conditio
“PKKquiskfi,.
8ferais ofeiite is
er facilitics. Pÿtnotcd inand soil
<ftd BredPunjab
A,aPs Of Ja„d
yandquality
forestry<200}> ForeaPrince wjlho races have ‘radifiomy **n<ific and
Portant in
asadopts
“p an tffioie
‘“‘‘ability js 'ary im°'dcr “> build
nt bee
2JS

218
6.21 Discussion
The land suitability classification would help the agroforestcr and formers
interested in planting on their farm lands suitable species of trees for different soils
in the Punjab province. Selection of sites and the species suitable for a particular
type of soil would go a long way to help the agroforester. Without this information
it would not be possible for him to select a particular tree species for a particular
site. The agroforester would not have to run around for assistance. He would get it
right at the spot. The resources available to the agroforcster would be used
properly and diligently without wastage of the time and money. It would help him
in identifying the land management. It would be easy for the fanners to match the
species for different alternatives and he shall be able to evaluate the land for its use
for a meaningful assessment. There are different reports available for the use of
suitability classification with related to different crops e.g. Rice by Gregory and
Guttman, (2002), Potato and post mining land assessment by Baker, (1991).
The work of Ziadat, (2007) emphasizes the use of soil attributes derived from the
prediction model to provide an alternative source of soil infonnation in areas
where soil maps are not available. Soils from all over the Punjab in a variety of
Agroeclogical zones, such as Barani, sandy deserts and irrigated plains in the
North or South. Only he has to understand as to how the available information and
be rationally used to his advantage. He would also be able to classify his land
suitability as highly suitable; moderately suitable or even as unsuitable for the
planting. Ozsoy and Aksoy, (2007) and Ertural el at., (2009) applied fuzzy
(partial) modeling with former knowledge based classification of agricultural land
suitability classification for optimum land use planning, A suitability map will
help in assessing whether land or any other area is likely to be practical and
successful for sustainable development of an intended venture for forestry along
with agriculture crops. In many instances Agro forestry has been promoted in
regions which are unsuitable in terms of climatic conditions, water and soil quality,
and other facilities. A suitable site is a prerequisite for successful Agroforestry as
did Brady and Weils, (2002), Forest trees have traditionally been grown in the
Punjab province without adopting any scientific and systematic inputs. As such,
Maps of land suitability is very important in order to build up an efficient tree
218

219
production network. In the present study, land evaluation has been performed
through suitability classification by using the data of soil characteristic in relation
to land inundation type, soil toxicity and ground water level under a Geographic
Information System (G1S) environment by Hussain et a!., (2007) and Ziadat,
(2005), A suitability map has been produced that shows the suitable area for forest
trees species in various district of the Punjab province. An efficient Agra forestry
system requires proper planning and timely management of available agricultural
land areas under appropriate requirements of the trees of those areas. Obviously
such a practice includes an evaluation of land capability and determination of
suitability of each of these areas for forestty species suited to that soil. The role of
land characteristics is extremely important in tree / wood production activities.
Such characteristics are determined by a number of issues namely site quality,
water table, water source and marketing etc. All these factors collectively
determine the suitability of a given area for a particular type of afforestation as
mentioned by Dawes and Goonciilleke, (2003). Furthermore it would facilitate the
achievement of acceptable land use suitability and/or capability through the use of
appropriate land resource assessment techniques on agriculture land for
afibrestation and it will ensure that adequate land resource data is collected to
enable proper assessment of land suitability and/or capability in various districts of
the Punjab province. Land suitability classification maps arc more refined and
apply to the capacity of land resources to sustain particular forms of land use for
the selection of species for forestry, For this reason, land suitability techniques
have generally superseded land capability assessments and are recommended for
use in the field of the Agriculture and Forestry especially in Agroforcstry as
described by Brady and Weil (2002). Hossain, (2001) also mentioned such Land
suitability Maps have equal potential for two or more uses (c.g. Agriculture and
Forestry), the preferred land use option should be the one that is the most viable in
the area i.e. one which represents the "highest and best” use of that land. The
information in this chapter would help him to pin point the well drained,
particularly drained, waterlogged, sloping or gently sloping lands and guide him to
choose of appropriate tree species. This particular information has been
summarized for several districts of the Punjab and would provide a wealth of
219

220
useful information to enable him to choose the correct species in the particular
lone*
Attock. Rawalpindi, Chakwal (Agroctlogical Zone V- Barani). Vegetation
includes Kikar (Acacia arabica), Bcr {Zizvphus jujuba), Poplar, Bakain, shisham
(Dalbergia slssoo), Mulberry {Moms alba) and grasses like Palwan and Khabal
(Table 6.1 to 6,3). Ishfeq et ai. 2007 studied fruit trees under these agro climatic
cond[lions,
The Agroeclogical Zone III- A, which comprise of Sandy Desert includes the
district Rahim Yar Khan, Bahawalpur, Bahawalnagar, the best grown species of
plant was proposed as Prosopis spicigera (Jand), Acacia jacquemontii (Jandi),
Salvador# oleoides (wan), Capparis aphylta (Karir), Tamarix articulata (Frash),
TamarLx sp (Lai), Acacia nilottea (Kikar), Zizyphus jujuba (Ber) and Tamarix
diocia. (Pilchi) (Table 6.4 to 6,7). The environmental conditions including low
water table and less organic matter in sandy soil which are basic need for
planlArecs. Recently Qureshi and Bhalti, (2009) described the desert vegetation of
Sind desert but the data is with relation to their medicinal values. Muzaflajgarh,
Dera Gait Khan, Khushab, Mianwali (Agroeclogical Zone ME B Sandy Desert),
Vegetation includes Acacia arabica (Kikar), Eleusine flagellifera (Chhimbcr),
Salvadora okoides (Wan), Prosopis spiegera (Jand) Capparis aphylla (Karir),
Tamarix articulata (Farash) Tamarix diocia (Lani) and Cymbopogau jitarancusa
(Khewi) (Table 6,7 to 6.10). Sheikh and Soomra, 2006 worked on desertification
and discussed the role of vegetation in these areas.
Okara, Sahiwal, Chachawatni, Multan, Khanewai, VchaH, Pakpatlan
(Agroeclogical Zone IVA Northern Irrigated Plains), vegetation includes Acacia
arabica (Kikar), Salvadora oleodies (Wan), Capparis aphylla (Karir), Salsola
foetida (Lani), Calotropis procera (Ak), Planted trees include Acacia indica
(kikar), Populus alba (poplar), Eucalyptus sp,, Dalbergia sissoo (Shisham), Bombo
Celba (Simal) (Table 6.11 to 6.17), Bhutla and Chaudhry, (2000) described the
vegetation of drained soil of these areas.
These results are comparable with estimates of soil attributes using Ihe soil map.
An important feature is Ihe spatial distribution of the predicted soil attributes,
which is provided in more detailed form than what the soil map provides as done
by Ziadat, (2007), Pau1,(2007) and Ozsoy and, Aksoy, (2007).
220

221
CHAPTER VII
DISCUSSION, CONCLUSIONS AND RECOMMENDATIONS
Forest area under the control of the Forest Departments in Pakistan is only 4.8
million hectare (ha). Per capita area is less than 0.3 ha as compared to the world
average of one ha. Precipitation is little and erratic. The country thus falls in arid and
semi arid zone. The meager forest resource has been eroded gradually over a period
of time due to administrative, political and bureaucratic failings aided by defective
legislation, unsustainable policy and complete lack of awareness by the people who
seldom realize that environmental degradation is taking its toll in all the spheres of
development (Hussain et a/,, 2003). Although during the last 50 years or so the
Public Forest area has increased from 2 to 4.8% of the land area, but the human
population has also swelled from 50 million in 1947 to 170 million in 2009
(Shinwari, 2003). Similarly the livestock has also increased from 30 million heads to
120 million heads, adversely affecting the forest floors and the Range lands. The
young regeneration and the very roots of meager grasses and bushes are devoured by
hungry and emaciated livestock which freely roam around in the depleted forested
areas, the ruined Range lands and the divested countryside (Economic Survey, 2006-
07). The literature has indicated that the planting on agricultural and marginal lands
all over the world has given significant results and has contributed handsomely to
bridge the gap between supply and demand. If tree planting by the farmers is
required anywhere in the world, watersheds, plains and deserts of Pakistan need the
highest priority to redo the barren, bare desolate and ravened lands while the
watersheds need a vegetal cover to save the reservoirs from silting up and flood
havoc. The deserts provide an eternal grazing ground to the livestock and to save the
crops, orchid’s habitat and people from ravages of hot and cold wind tree plantation
campaign is being conducted in the deserts of Thai & Cholistan and so are several
watershed management projects in the high hills (Baig etal. 2008).
The country does not have many options to improve the situation as the slate forests
cannot be expanded further due to consistent demand for agricultural produce.
Neither can additional water be spared to undertake forestry operations. Even if new

222
areas are earmarked for planting trees, enough funds are not available. Moreover, the
5 year development projects prepared with all the zeal and vigor fail to achieve the
desired targets because there are financial cuts across the board during the operation
of the project and there are no maintenance funds for perpetuation of trees planted or
Range lands reseeded. Seasoned timber could be used but it becomes excessively
costly and so are the alternative construction materials. Tree planting on farm and
marginal lands by motivating the farmer and providing some incentives appears to
be the only possible option. And why not when it has proved to be an effective tool
to get additional wood on one hand and improve the socio economic status of the
farmer resulting in poverty alleviation on the other (Anon, 2000). Agroforeslry
concepts and perception defining agroforestry system of land management and as to
why it is such a useful programme have been discussed in introduction. History of
agroforestry or social forestry development in the Punjab has also been traced
highlighting the role of various successive provincial governments to promote the
cause. One veiy important aspect of social forestry is that the trees raised by the
farmers on their land not only serve as a hedge against emergencies requiring
additional money but also serve as an important buffer between ihe state forests and
the farm lands, Instead of cutting or stealing trees from the commercial slate forest,
the farmer can always fall back upon the trees readily available on his own farm.
Another important aspect of the tree planting on marginal lands is that certain tree
species adapt themselves on waterlogged and saline soils. Tree planting for a couple
of years causes land reclamation and earlier pronounced as a waste land, it once
again becomes euHivatablc and productive (Sangha et at., 2005). Nitrogen fixing
trees play a positive role towards that. Additionally the trees balance foe ecological
equilibrium due to recycling of nutrients, improving foe humus layer, affect foe
microclimate, suppress weeds, improve soil structure and soil fertility, save animals
dung grazing in these farm plantations for manure and meet the foci, fodder and
small timber requirements (Botha, 2006). In order to study foe farm plantations of
the Punjab Province of Pakistan, which was based on physiography, ecology,
climate, soil agriculture crops, water availability, and ground water and of course foe
natural and planted tree species, the province has been divided into four agro-
ecological zones. These include Sandy deserts 111, A & B, Barani V and Northern

223
irrigated plains IV Climate, rainfall, original vegetation, agricultural crops and fruits
growing in the zones.
The results of the surveys conducted for collection of relevant data, according to the
questionnaire, have given very indicative results. Methodology and correlation
between the linear plantations and compact plantations has been discussed. Based on
personal communication, the results of survey have been evaluated indicating the
methods of tree planting, the choice of species, spacing used, whether agriculture
crops have been planted or not, whether the trees are sold standing or are converted
into various sizes by the farmer before sale etc. Although, reluctantly, but some of
the tree farmers did come out with the figures of money they had earned by planting
trees. After coming to the conclusion that agroforcstry is helpful to the tree fanner
both socially and economically, some additional measures have been suggested to
further promote agroforestry / social forestry. Some additional information regarding
the possible markets for farm grown wood rate of growth of various species,
management operations, availability of seeds, and plants, the best season for planting
etc was also asked for by some enthusiastic agroforcstcre and were duly provided the
requisite answers which were discussed in simitar studies conducted by Hussain et
a/., (2003) and Schwendenmann, et ai. (2010).
By growing trees, along with agriculture crops there is a iremendous increase in the
total output per unit of land, making full use of the available land fertility at different
depths. Some tree species like Shisham, Albizzias, janier (Sesbanea acgyptiaca) and
lple Iple are nitrogen fixing and improve the soil fertility. In case ofagroforestry, the
type of soil is one of the major factors for the classification of different suitable
species of plants. A comparison of the characteristics of soils under various farm
plantations necessitates a prior evaluation of their particle size composition in order
to ascertain whether the soils were texturally similar (Dixon et ai, 2001). The soil
texture is a very important component of soil from the point of view of agroforestry.
The analysis of the soil texture carried out in the target zones revealed information
that was utilized in the development of Soil and Land Suitability Maps. The results
of the present study highlighted the feet that among the four Agroecological zones
studied, the proportion of sand first decreased and then increased with increasing soil

224
depth, showing a sharp rise at a depth of more than 161 cm. Silt and day followed a
quadratic trend, whereby initially increasing and then dropping.
Organic matter (OM) was mostly found in the top soil and followed a decreasing
trend with increasing soil depth. Nitrogen content was not uniform in all the four
zones studied, with zone 111 B showing highest quantities. No obvious relationship
between the amount of nitrogen present and depth of soil could be detected, except
for Zone III B, where it decreased as the depth increased. Phosphorous, was high in
Zone IV, followed by Zone VB and Zone ill B. There was no apparent relationship
between phosphorus and depth of soil. It was further observed that phosphorous
could not be delected beyond the depth interval of 50- 200 cm.
Both CEC and EC were found to be significantly different in all of the four zones,
with highest values of EC and CEC being recorded for Zone VB and a zero value
from 36-60 cm depth interval up to more than 161 cm depth. Zone V B showed
maximum value than others. Regarding to depth Zone IV A and Zone V B showed
zero value as from 36-60cn depth interval to 161+ cm depths. While Zone Ul.B
showed maximum EC value, it was found to decrease in Zone 111A. Similar findings
were reported by Krogh et at., (2000). pH value shows no difference regarding
zone. Zone III A has extensively lower value for pH of 6.57 as compared to all other
three zones. The effect of different tree species on soil pH varies in the first ten
centimeters of the topsoil. Nevertheless, the mean pH difference in soil was between
0.2 and 0.4 pH unit (Huntington and Robertson, 1994). The results of this
investigation revealed that although CEC and pH values did not vary considerably in
relation to depth, the EC values appeared to be affected with variation in soil depth.
CO3, HCOj, Cl and SO4 were delected in all zones except Zone 111 A. The zone wise
differences tor COj and HCOj were found to be negligible. The quantity of SO4 in
Zone lll.B differed only slightly from that of Zone I11.B and Zone IV A, whereas, it
was notably different from that of Zone IV.A. Similar trend was observed for C03,
with regards to depth in the soil. For HCO3, differences were found regarding
different depth levels. There were highly variable results for SO4. At 13.23cm depth
level, maximum SO4 was found while COj value decreased till 60cm depth and then

225
almost remained same up to 80cm depth (Andrew, 1999). Moreover, COj value
decreased (ill 60 cm and then remained almost the same up to 80 cm depth.
A result for Ca+Mg varies in different zones with respect to Ca+Mg. In Zone 111.A,
Ca+Mg were absent. Almost similar values of Ca+Mg ware found in Zone 1V.A and
Zone V.B but different from value of Ca+Mg in Zone 11I.B as described by Ben-and
Epena, (1999). For potassium value was found to be slight different for Zone.Ill A
and Zone 11I.B but Zone IV.A and Zone V.B show maximum values. Both sodium
and SAR were not different regarding Zones as mentioned in similar study by
Krogh, et ai (2000). For Zone 11 .A Sodium and SAR were not found. Depth had
highly considerable effect for on Ca+Mg and results showed that maximum Ca+Mg
was found in upper layers as compared lower side. Differences among depth levels
for potassium showed that maximum K. was found at 13.23cm depth and minimum
at 81.160cm. Similarly Sodium radically differs with the depth of soil. Maximum
amount of Sodium was found at 24.35cm depth and minimum was at depth >161cm,
as depth increases sodium decreases (Ahmad, et al., 2006). The value of SAR at
ddferetU levels of depth is also found highly different. Maximum SAR was found at
24.35cm depth level which did not differ significantly from that of 13.23cm,
36.60cm, and 61.80 cm depth levels.
On the land surface of the world there extends a mantle of vegetation, a living fabric
of plant communities under trees of farm plantations that is diverse and suitable in its
response to environment, varied in its structure and composition, expressive of
biological productivity of the land, interesting and aesthetically appealing to man
(Shephard, 1995). This mantle of vegetation, we see now in many areas is being
subjected to accelerating destruction. Many ecological and anthropogenic factors
may be involved, salinity is one of them and is of prime importance (Brown, 2001).
In this study we have tried to see how the different communities relate to one
another and express their environments. At the top of these considerations the basic
aim was to produce structure, composition and classification of the community,
types of the saline areas of Ferozewala (district Sheikhupura) using a standard
terminology being comparable with the phytosociologicai work earned out in the
European and Anglo-American countries. A special advantage of these
investigations is the production of environmental data which provide insight into the

226
important factors operative in the habitat e.g. soil pH, level of salinity, moisture
level, grazing and extent of vegetation cover. Salt affected soils are generally poorer
in species than non-saline soils. The distribution of these species appears to be
controlled mainly by cdaphic conditions. These species appear to be selected out by
the highly saline environment gradient from the most to the least salt tolerance, with
other ecological factors playing a secondary role. It was observed that successful
species are also successfully competitive, they are generally limited to saline
environments indicating either a requirement for excess sail tolerance or inability to
compete with plants with less extreme environment. Thus a few of the most salt
tolerant taxa, namely, Suaedafivticosa, Kochia indica, Diplachnefitsca and A(riplex
crassifolia arc limited to saline environment while other species such as
Desmostachya bipinnata, Sporobolus arabicus, Capparis sp, Alhagi maurorum are
limited to moderate to weak saline substrata and still other species such as Eleusine
sp, Ppiypogon mnnspeliensis, Cenchrus sp, and imperata cylindrica have more
general distribution on a xeric to slightly saline soil. The dominant and constant
species in Ihe sampled area are Suaeda fruticosa, Kochia indica, Diplachne jusca,
Desmostachya bipinnata, Alhagi maurorum, Sprobolus arabicus, Pohpogon
monspeliensis, Erythrae ramosissima, Vetevieria zyzanioides; Imperata cylindrical
Scirpus maritimus and Typha angustata. The frequent species are Rumex dentatus;
Chenopodium album, C. murale, Conyza ambigua, Cynodon dactylon etc, and many
companion species are also given in each association.
Several general changes in vegetation composition were seen, such as reduced
salinity, increase in growth form i.e, height (See association Suaedetumfruticosae),
increase in density or increase in species number i.c. diversity (Sec association
Polypogaetum monspeliensae), were recorded. Similar observations were reported
by Flowers (1934) and Ungar (1968) who noted that generally there Is a sharp
decrease in species diversity with even a low increment of soil salinity and then
further drop in diversity until only one or two species are left which arc capable of
tolerating extreme salinity. The ecological limitations for the structure, composition
and distribution of various plant communities recognized are edaphic (physical and
chemical), biotic (grazing), soil moisture level and competitive ability of the
members of the next community in holoscrc, The connection between ecological
characteristics and plant communities (structure, composition, distribution)

227
described show that despite over-lapping with the ecological requirements, a clear
segregation exists between requirements ofdiffercnl associations.
Taking analytic (quantitative and qualitative) and synthetic characteristics into
consideration, the vegetation is grouped into twelve associations. Three associations,
Kochieturn indieurn, Diplachnetum fuscae and Alhagietum maurorae, belong to the
vegetation type of annual herb communities. Two associations, Scirpetum maritimae
and Typhetum angustitae form the vegetation types of emergent sedge and reed
swamp vegetation at the margin of open brackish water. Seven associations are
described from salty vegetation dominated by perennial chenopods and grasses. The
relative concentrations of the major ecological gradient expressed in terms of their
ratio are of interest in determination of the ecological affinities of the association.
Twelve associations may be arranged in scries according to sodium concentration
tolerance that is Suaedetum fruticosae, Desmostochyetum bipirinata, Erythrae
poiypogaetum, Monspel iensae, Veteviarietum zyzanioide Scirpetum maritime,
Alhagietum maurorae. Imperatum cylmdrieae, Diplachnetum Jiisca, Kochietum
indicum Poiypogaetum monspeliensae. Sporobolettim arabicae and Typhetum
angustitae, Diplachnetum juscae Suaedetum fruticosae, Desmostochyetum
monspeliensis > Scirpetum maritimae). Erythraeo poiypogaetum monspeliensa,
Veteviarietum zyzanioide, Imperatum cylindrieae. Typhetum angustata. Kochietum
indica. Sporoboletum Arabica. There might have been certain variations in these
tolerance ranges, had more soil samples been taken. Although direct quantitative
comparison is different, the tolerance levels of the association are related to different
plant communities described by Unger (1974) for the inland salt pan of the U.SA
Out of all fticsc associations described Suaedetum fruticosae and Atriplicetum
crassifoliae arc major associations with a number of sub associations and variants
(Qayyum 1982) which colonize more or less every type of saline habitat. In this
survey these were left out and only few Rclev’es were taken.
It is possible to work out several relationships between these associations on the
basis of salt concentration and moisture content in the substrata. The initial colonizer
on highly saline soil with certain mesic conditions is Suaeda Jhiticosa. Spregula
rubra will appear, if these conditions remain static but Spregula rubra being a spring
annual will disappear. Other annuals such as Atriplex crassifoiia and Koehia indica
are subsequent colonizers. Subsequent colonization of the habitats is by
228
Desmostuchya bipitinaia, which being perennial and deep rooted tends to colonize
jteric and dusty habitats. Further colonization seems to be in the direction of
degradation and further may lead to the development of either xenc or mcsic
conditions. A degraded association {Veteviarietum zyzanioides) rises to prominence
on sodium poor soil, rugged soil and waste land. With the passage of time, this may
tend to develop in to the flora typical of moist waste land (Chenopodium species and
Amarantus viridus). From Desmostochyetum bipinnatae it may lead to more xeric
and annual species such as from Sjxiroboletum arabicae to Polypgactum
monspeliensae to lmpcratum cylindrieae. Further Joss in salinity level and an
increase in water table lead to mesic conditions via Dicanthium annulatum. 11 may
lead to sub hydric conditions. Further rise in water table and fall in salt contents lead
to Scirpetum maritimae and Typheturn angusfitiie associations, typical of marshy
land.
In addition to describing the structure, composition and inter-relationship of plant
communities, the other aim of this work was to produce an inventory of vegetation
types comparable with Zurich Montpellier school of thought. The classification of
these units into a hierarchy involved several difficulties. One of the main difficulties
was the non availability of local literature of community types from local habitats.
Thus information had to be extracted from literature based on research carried out in
places other than local habitats. Taking these difficulties into consideration and the
classification proposed by different workers for the similar type of habitat, Capman
(1958), Ueaftink <1962), Shimwcll (1971), Waiscl (1972), Adam (1977), Mirza
(1978) as a base, the following classification of the halophytic communities of
Fcrozewala (District Sheikupura) is being proposed.
Cakiletea maritimac. R.Tx. el Praising 1950.L Cl.
Thera-suaedetalia Br.— B1 ctde, Bob’s 1957. cm. Beeftink 1962.o.
A. Them -Suaedion. Br - Br - BII931, 1933, em¬it.Tx. 1950.
Association Kochietom indicum, SuaedoKoehictum hirsutae — Br. Bl. 1928.Sub-association. Kocluetosum md icum
Sub-association. Desmostachyetosum bipinnatae

229
Association. Suacdum fruticosac
Association. Diplacrnietum fuscac
Sub-association. Diplachnetosum fuscac
Sub-association. Alhagetosum maurarae
o. I>esmostachyctalia bipiiuiatac
A. Desmostachyion
Association. Desmostachyotum bipinnatae
Association. Alhagictum maurorac
Association. Sporoboletum arabicac
Association. Polypogaetum monspcticrisae
Sub-association, Polypogoetosum monspeliensae
Sub-association. Erythraeiosum ramosissmae
Subÿassocialton. Aihagietosum mournrae
Association. Etythraco polypoganctum Monspeliensae
Association. Vetcvierietum zyzanioides
Association. Imperatum cylindrieac
2. CL Phragnitetea Tux. ct prog 1942.
o. Phragmitetalia (W. Koch) Tux et. Preg 1942,
A. Phrugmition W. Koch 1926,
Association. Scirpetum marimae
Sub-association Imperataetosum Cylindrieac
Sub-association Dicanlliictosum Annulatac
Association Typhetum anguslitae
The final aim of the study was to prepare the maps for the agro fanners on the basis
ofland suitability classification to guide the land users/planners in such a way so as
to put the land resources to the most beneficial use on sustained basis without
deteriorating the resources as well as the environment. The term Land Evaluation
refers to assess the suitability for forest trees of different tracts ofland mapping units
for specific kind of use and to find out the land management alternatives that would
be physically and financially practicable and economically viable (Rodrigo et

230
a/,.2005). The present study paralleled with the research conducted by Rodrigo et
a/,.{2005) who assessed the suitability for forest frees of different tracts of land
mapping units for specific kind of use and worked out the land management
alternatives that would be physically and financially practicable and economically
viable in terms of 'Land Evaluation’. Soils and Land Suitability Maps of various
Agroeclogical /ones reveal land resource information that can be helpful for
different users for the execution of certain projects for instance in Fami Forestry
Extension Programme by die Punjab Forest Department 'Phis suitability
classification would help the agroforeslcr and alt those interested in planting on their
farm lands in choosing suitable species of trees for different soils in the Punjab.
Selection of sites and the species suitable for a that particular site would go a long
way to help the agroforesters. The agroforeslcr would not have to run around for
assistance. He would get it right at the spot without any lack of contradiction. The
resources available to the agroforcster would be used properly and diligently without
wastage of the time and money. It would also help him in identifying the land
management alternatives and farmer shall be able to evaluate the land its use for a
meaningful assessment. It would specifically assist him to match the species for
different soil all over the Punjab in a variety of Agroeclogical zones, such as Barani,
sandy deserts and irrigated plains in the North and South. All that would be required
of him would be to understand the possible ways through which the available
information could be rationally used to his maximum advantage as done by Haile, et
ai, (2010). The information would also enable him to classify bis land suitability in
terms of highly suitable, moderately suitable or even as unsuitable for the planting.
Additionally it would assist him to pin point the well drained, particularly
waterlogged, sloping or gently sloping lands and provide guidelines to choose
appropriate tree species. This particular information has been summarized for several
districts of the Punjab e.g. Rahim Yar Khan, Bahawalpur, Bahawalnagar.
(Agroeclogical Zone III- A) (Sandy Desert), Muzaffargarh. Dcra Gazi Khan,
Khushab, Mianwali (Agroeclogical Zone 111- B) (Sandy Desert), Okara, Sahiwal,
Chtchawalni, Multan, Khanewaf, Vehari, Pakpaltan (Agroeclogical Zone IV A
(Northern Irrigated Plains) ,Attock, Rawalpindi ,Chakwal ( Agroeclogical Zone V
(Barani)

231
CONCLUSION
Pakistan is virtually facing wood famine on one hand and an ecological disaster on
the other. Being thickly populated the province of the Punjab is the worst hit. Fuel
wood is selling @ Rs.I20/- per mound and Deodar timber fetches the price of
Rs.2500/- per eft, Shisham is equally costly and it not uncommon to find a demand
price of Rs.2000/- eft. How can the poor afford to pay such an exorbitant price?
With the growth in population @ 2.5% the current demand for wood shall also
increase over whelming in the same ratio if not at a faster rate due to better living
standard, demands for a more comfortable life and expected upsurge in literacy rate
etc. It is quite apparent that tire government would not be able to spare more land,
water and resources for tree planting. The only possible and practical option left to
the nation is to strive for more trees planting on (arm and marginal lands through the
help and association of the agricultural community. The important point which has
also to be noted is that livelihood of thousands of people in the rural areas depends
on the local wood based industries for which the major source of raw material are
the trees on the farm lands (MAANICS, 2003-04). A Pakistani village is traditionally
self sufficient in wooden items of daily use and does not get raw material from the
city markets. It is only the assorted trees on the farm and marginal lands which come
to his rescue. Most of the agroforesters were of the opinion that the trees in their
farms were helpful in more than one way. Not only the trees readily provided fodder,
fuel, small timber, shade and shelter and protection from hot and cold winds,
improved environment and biodiversity but also were a very useful source to
improve their socio-economic condition through sale of wood, especially when there
were crop failures due to natural calamities. The sale of wood was very handy to
meet some emergent expenses on religious ceremonies, marriages of children, or
payment of schooi/college fees, In fact trees served as a hedge against all unforeseen
emergencies. The outcome of the present survey is supported by the findings of
Zubair and Chris (2005) who reported that if fanners thought that trees were in any
way adverse to their way oflife, they would never have planted them on their land,
According to other surveys conducted by Punjab Economic Research Institute
(PF.RI), the number of trees per acre was 17 in 1999 and it was increasing with time.
That is why even now 90% of fuel wood requirements and 55% timber requirements

232
arc being met from the trees grown by the farmers on their land, though the potential
is much more,
The field visits conducted during this study were actually an eye opener and
provided firsthand knowledge regarding important land use in the province and the
present scenario of forests and forestry in Pakistan. How fragile the fabric of the
ecological system has become, has been deliberated upon and the way it is affecting
the environmental health and stability has been amplified. There is a special
reference to forestry situation in the Punjab, The location of the province,
population, topography, soils & climate has been briefly touched upon. Land use
pattern of the province is of special significance. There are six forest types, some are
natural while others are man-made. The major crops grown by the farmer have also
been indicated. Tree planting could be popular with big land owners but the tenants
who know that they are on a particular piece of land for a short period of 1-3 years
arc not interested in planting or looking after the trees. Knowing that the trees belong
to the owner there is little attraction for the tenant or lessee to maintain them. Rather
they would even over pnine the tree to get more light for the agricultural crops or
hack them with axes (Khan. 2001).
Several constraints against the tree planting can be enumerated but these can be
mitigated to a large extent by scientific explanations and setting up of mode!
plantations. The issues need a very tactful handling by the extension staff of Forestry
and Agricultural departments. Tree fanners have to be formed into such energetic
allies who after conversion into an agroforcsters become publishers themselves
propagating the cause of tree planting. The usual objection to tree planting so often
raised by the farmer has to be settled only by a person who knows all about the
system. However the extension workers should not paint a very rosy picture about
the agroforestry or social forestry programme as the proof of a good pudding is only
when one cats it. There are several requisites and remedial measures to clarify all the
usual objections. One important issue has always to be kept in mind and that is that
the agroforcstcr is interested only in economic and social gains and shall seldom
bother about biodiversity, environment or that the trees absorb CCh and release
oxygen for a healthy and prosperous life which is far from it (Gaulam et al, 2003).

233
Several case studies regarding tree-crops interface have been discussed, the most
prominent of which are the studies conducted by the Pakistan Forest Institute
Peshawar (PF1) Punjab Forestry Research institute, Faisalabad (PFR1) and farmers
themselves. Examples of tree planting by farmer all over the country are not far to
seek. Most of these have been helpful in increasing the crop yields although some
adverse affects have also been recorded. These adverse effects can nevertheless be
considerably reduced by adopting some practicable measures such as proper
orientation of rows, digging of a trench between the trees and die agriculture crops;
making a road along with tree belt instead of elsewhere in the farm; sowing shallow
rooted leguminous crops like Trifolium in a strip along the tree bell etc (Hafeez,
1998).
One important lesson learnt from this study is that tempo of tree planting campaign
has to be shifted to rural areas rather than the “Walks” or banner hoisting in the big
cities. The movement has to be spear-headed by a well trained and devoted team of
extension experts. The campaign has to be consistent and sustainable, targeting a
much larger number of rural populations. Additionally, service of a village ImamTthe local doctor, the school head master, the Lambardar, the Patwari, the GLrdawar,
the Tehsildar etc have to be harnessed as the villages are likely to pay more attention
to their words rather than a government functionary who has been their adversary
since ages (Akbar et at., 2000).
The study lias clearly emphasized the point that the contribution to the Scio-
economic uplift of the country by the agroforcstcr has to be realized and that he
should be fully rewarded for his great effort in reducing the gap between the supply
and demand of wood and wood products. This could be achieved through provision
of suitable incentives or not just lip service or a few words of appreciation. The
successful agroforestry should be awarded cash prizes, shields and certificate for
commendable performance as described by Dennis, 2005 and Kasongo, el aL. 2010).
The relationship between forming and tree is of overriding importance for the future,
It is the agricultural and marginal land where (here is maximum scope for tree
planting. No one can deny the paramount claim of agricultural on land but lrom
socio-economic point of view and the complementary roles the trees play in
fostering agriculture, it is necessary in the farmers own interest to plant more trees
on his land to make himself supporting in his day to day requirements of wood and

234
wood products (Hussain,1999). Some common combinations for the agroforestry
system of land use being practiced are indicated below:
Tree species Agricultural crons
Poplars Wheat, Maize, Turmeric, Sugar cane,
Vegetable fodder.
Wheal, Cotton, Sunflower, Turmeric
Maize, Sunflower, vegetables, fodder
Turmeric, Wheat, Maize, Vegetables,
Medicinal plants.
Gram, Wheat, Tara Meera, Sarson.
Eucalyptus
Semal
Shisham
Faresh
A special advantage of this investigation is the production of environmental data
which provides insight into the important factors operative in the habitat e.g. soil pH,
level of salinity, moisture level, grazing and extent of vegetation cover. Salt affected
soils are generally poorer in species than non-saline soils. The distribution of these
species appears to be controlled mainly by cdaphic conditions. These species appear
to be selected out by the highly saline environment gradient from the most to the
least salt tolerance, with other ecological factor* playing secondary role
Recommendations
> Formation of Village Woodlot Commiltees would play a major role in
afforestation and disposal of wood as they would be in a influential and
commanding position to appeal to, and motivate religious personnel and to
obtain assistance from local doctor, lumberdar, opinion leaders and other people
for forwarding recommendit ions to the Government to improve the Socio¬
cultural conditions of agrofarmerx. This can be done by giving economic
benefits such as provision of incentives to the farmers in the shape of free
supply of plants or any monetary benefits as well as facilities of soft loans and
credits to agrofarmers and insuamcc of forest crops along with incentive to
forestry staff associated with agroforestry.
> The best combinations of agricultural crops and trees should be identified by
calculating cost benefit ratio including tangible and intangible benefits resulting

235
in poverity allevation programme like development of infrastructure and other
facilities. North-South orientation of the tree rows will cause less crop depression
and delay harvesting of grain crops such us wheat, maize, barley, etc in close
vicinity of the tree belt as crop closer to ihc belt takes a few more days to mature
and ripen. If harvested at die same lime with rest of the field, the grain gets
shriveled leading to lesser yields. Further, it is recommended that shallow rooted
and shade tolerant crops such as Trifolium (beiseem) or other fodder crops
should be grown near tree rows as a direct competelion would not develop,
resulting in better yield. Leguminous trees such as AIbizzia procera, Leucaena
leucocephala (Iple Iple) and Pithecolobriim duke (jungle jaleba) etc. (the tree
rows) should be grown so that instead of exerting competition they fix the
atmospheric nitrogen and improve lire soil quality. They have also open crowns
and thus are less shady. In compact plantations, wider spacing of 6 x 6 meters or
even more reduces competition with agricultural crop if under planted. Widely
spaced plants/trees gain diameter at a much faster rate and become barveslable
early fetching some good returns. Growing trees and agricultural crops together
would help the farmers economically as they would recover part of the
investment through sale of annual agricultural crops and trees would serve them
as an investment in the bank.
> To satisfy the demand of end users so far as size and species are concerned, there
is need of development of tree farmer -wood user links. Establishment of a
viable marketing system, proper livestock management, establishment of tree
associations and demonstration centers and special measures for sale of farm
grown wood is suggested.
> In order to further offset the effect of trees on agriculture crops, following
measures must being gradually understood by the tree farmers. Instead of making
the crop-delivery-roads in the center of the field, make them close to the tree
belt. This would save them from crop depression effect as there would be no
crop on the road. Roads arc needed anyway in a large farm for transit of
commodities. Interaction and understanding among the three agencies involved
i.e_ Forest Depanment, the tree fanner and the wood based industry has to be
complete and composite. The forest department should make more technical
tnput, while the tree farmer has to know the market demands of the tree species,

236
the size needed to enable him to convert the trees grown by him on his farm and
the preferences and requirements of the wood based industry.
> The forest department has to revise the existing legislation to improve and
facilitate the production and transportation of wood from the farm to the market
At present the tree farmer is facing a lot of difficulty due to existing regulations
and enactments causing hindrances in smooth transit of wood.
> Forest Department employees working in extension job should be provided with
more incentives such as transport, better allowances and special pays so that they
are well-satisfied and earn due respect in the society and with the farming
communities enabling them to work with more zeal and enthusiasm for
promotion of the cause for which they are working.
> The tree farmers need special training in nursery and plantation management for
which special courses should be arranged by the Forest Department at suitable
places. The projects reviewed so far by the Forest Department have indicated
that women are equally keen to raise plants. They should he provided with the
opportunities to enable them to sharpen their skills and to play their requisite role
in improving the country’s landscape. Further more assesment of improvement
in envimoment and biodiversity as well as general landscape and removal of
monotony by removal of the bias of agriculture department through pursuation
and motivation and imparting role of women to persuade men folk towards tree
planting.
> More emphasis on extension and publicity campaigns for creation of awareness
among the tree farmers along with the amendment of rigid taws as well as with
revision of curricula and role of forestry institution for infusion of agroforestry
is recommended. No doubt, the seminars, ‘mclas’ and meetings help in tree
planting by farmers but it is at the spot farmer's training, which is more helpful.
Thus demonstration plantations raised on tree farmer’s land can be more helpful
in producing good results.
> Forest Department should provide assistance in the form of land leveling, land
development and soil conservation to encourage tree planting. The persistent
suspicion and doubt in the mind of tree farmers that the government is
persuading them to plant trees as an excuse for land grabbing should be removed
through extension agents by their well-organized efforts.

237
> A number of studies on agroforestry system of land management have already
been undertaken. The results should be passed on to the end users so that they
can derive some benefit out of the findings. Marginal or wastelands are
traditionally the grazing grounds for millions of livestock. When convened to
tree plantations this resource is lost to the grazers. Planting fodder Irces and
shrubs should do the trick. Agroforcstry programme has to be institutionalized to
make it a consistent and sustainable effort. It is important because the
communities oflen opt for such a programme with immediate financial gains in
view without bothering for sustainability of the process. This tendency has to be
curbed through motivation, persuasion and demonstration.
> In agroforcstry programme invariably certain disagreements arise due to some
misunderstanding or conflict. This gives a chance to inherently biased mischief-
makers to create a negative influence on the tree farmers. Such disputes, if any,
have to be resolved with efficient and skillful handling of the situation by all the
concerned parties, especially the extension agents. If the Government has to
spend some money on land development and tree planting, it is appropriate that
members of the village community arc employed on the job. Such a positive step
would attract more cooperation and help from the people. Experience has shown
that the village doctor, mosque Imam, school headmasters and the village
headman can exert a lot of influence on the local people. If their services are
utilized to deliver the message, success of a tree-planting programme on farm
lands can be assured and is certain to succeed, h is hoped that when the tree
formers slart getting economic benefits due to a responsive market situation and
there is enough cooperation and understanding between the wood producers and
wood users, the sustainability is bound to come and the former would continue to
grow trees as an alternate cash crop.
> Presently the Extension staff is inadequate and is not properly trained for the job.
Extension organization should be strengthened on the lines of agriculture
department. Enough technical material is not available for proper guidance of the
nee farmers. It is essential that a complete package is prepared and delivered to
the tree former including instructions and guidance for site preparation for choice
of species for different sites, planting techniques and management and harvesting
of tree crops.

238
> It would inculcate lot of confidence in the tree tanner if the wood based industry
signs an agreement with him at the time of planting assuring him that the
industry would pick-up his woody materials if he matures and manages the tree
crops according to the requirement of the industry. A data bank should be
established at all the District headquarters wherein information such as species
planted, age, diameter, general condition of trees and the price the tree former
would like to get has to be stored. The wood based industry should also provide
similar information such as name and address, type of industry, species and size
requirement and possible negotiable price. This computed information should be
reviewed every quarter. The forest department should persuade the tree Tanners
to establish cooperatives for marketing of farm products.
> More cooperation and collaboration is needed between sister departments such as
Forest, Agriculture. Irrigation and Power, Livestock and Dairy Development,
Highways etc for promotion of social forestry encouragement to the agroforester.
Advantages of social forestry programme should be well advertised on T.V,
Radio and in print media, highlighting the importance of social forestry for a
wood starved and environment degraded country. Usually long maturity period
of perennial tree crops discourages the tree fanner as he cannot wail for long to
get some reasonable income. Incentives such as free supply of planting material
and interest free bank loans may be considered.
> It has been proved beyond any doubt Ural agroforestty is sure to be the critical
element in future rural development and poverty alleviation of the masses,
specifically based on trees as a renewable resource. Tree planting campaigns and
programmes should become very attractive to resource poor fomilies surviving
on marginal agricultural lands in terms of increasing productivity, better
distribution of benefits and as a panacea for financial instability. In the process
the tree formers would definitely bring a change in the otherwise drab and
desolate environment of the country and shall earn much needed additional
bucks. Tree farmers who produce surplus woody material for fuel in directly
save the animal dung, which otherwise would have been used for foci purpose
and thus the unused animal dung would improve soil fertility, eventually leading
to bumper agricrops.

239
> This study represents a pilot study with regards to Ihe development of Soil and
Land Suitability Maps, as the work was restricted to 17 Districts of the Punjab.
The undoubted utility of such maps based on the valuable land resource
information being generated, makes it imperative that the same may be extended
to the rest of the districts of Punjab as the next step and later for other provinces
too, for it not only assists the agrofarmers but also alleviates of poverty,
consequently enhancing the gross economy at die national level.
> Moreover, it is suggested that in order to make the information more effective, the
maps and the related information may also be translated in Urdu, Ihe national
language, so as it make it easily understandable to the stakeholders, many of
whom may not be well versed with English. The soil texture analysis of various
Agroeclogical /ones and Ihe consequent recommendation of the associated
suitable species, aids the agrofarmers to pick out the best possible option.
Keeping in view the vast area of the county affected by salinity, producing low
yields, it is highly recommended that this study should be carried out for such
salinity hit areas, so as to utilize the potential of the land maximally.
Furthermore, stress should be laid on the fodder grasses and nitrogen fixing plant
species that are not only economically viable but also add to the fertility soil of
the land.

240
CHAPTER 8
References
Ackerman, Ilse L.; Constantino, Regtnaldo; Gauch Jr, Hugh G.; Lehmann,
Johannes; Riha, Susan J.; Fernandes, Erick C, M. (2010), Termite
(Jmecta: Isoptera) Species Composition in a Primary Rain Forest and
Agroforests in Central Amazonia Biotropica, Volume 41, Number ,
March 009, pp. 6-33(8)
Adam, M, (1977). A key to the plant communities of salt marshes of England,
Botany School, Cambridge University Press, pp.
Adomado, Henry A. and Masao Yoshida (2008), Crop Suitability and Soil
Fertility Mapping using Geographic Information System (CIS)
Agricultural Information Research Vol. 17 (2008) , No. 2 pp.60-68
Aguiar, Maria; Maia, Stoicio; Xavier, Francisco; Si Mendonga,
Eduardo: Filho, Jo2o; Oliveira, Tedgenes. (2020). Sediment. nutrient
and water losses by water erosion under agroforestry systems in the
semi-arid region in northeastern Brazil Agroforestry Systems, Volume
79, Number 3, July 2010 , pp. 277-289(13) Springer
Aguiar, Maria; Maia,Sto6do; Xavier, Francisco; Si Mcndonga,
Eduardo; Filho, Joao; Oliveira, Tcdgenes .(2010). Sediment, nutrient
and water losses by water erosion wider agroforestry systems in the
semi-arid region in northeastern Brazil . Agroforestry Systems, Volume
79, Number 3, July 010 , pp. 77-89(13).
Ahmad, J. (1998). Changing perspectives onforestpolicy. IUCN p. 12.
Ahmad, N. (1993), Water Resources of Pakistan, Shah/ad Nazir, 61-B/2,
Gulberg 111, Lahore, Pakistan, pp.
Ahmad, S.A., Ghafoor, M., Qadir. A. and Aziz, M.A. (2006). Amelioration ofa calcareous saline-sodic soil by gypsum application and different crop
rotations. Int. J. Agri. Biol., 8: 142-6.
Ahmed, J. and Mahmood, F. (1998). Changing perspectives on forest policy:

241
Policy that works for forests and people. London, UK: International
Institute for Environment, pp.
Ahmed, M., Hussain, T., Sheikh, A.H., Hussain, S.S. and Siddique, M.F.
(2006). Phytosociology and structure of Himalayanforestsfrom differentclimatic zones of Pakistan. Pak.1Bot 38(2)361-83.
Ahmed, M.N., Khan, M„ Wahab, S., Hamza, M.F., Siddiqui, K„ Nazim, M.
and Khan, M.U. (2010). Description and structureof Oleaferruginea
(Royle)forest ofDir Lower District of Pakistan. Pak. J. Bot., 41(6): p.
2683.
Akbar, G., Baig, M.B. and Asif, M. (2000). Social aspects in launching
projects in developing countries.Science Vision, 5:52-58.
AL-Busaidi, A.S. and Cookson, P. (2003). Salinity-pH relationships in
calcareous soils. Agricult, and Mar. Sci., 8: 41-6.
Alexandra, B. and Benites, J. (2005). The importance of soil organic matter ,
Key to drought-resistant soil and sustained food and production Food
and Agriculture organization of the united nations Rome, 2005, FAO
Soils Bulletin, pp. 80.
Alexis,Stervins; Garcia-Montero,Luis; HemiindezÿAna; Garcia-
Abril,Antonio; Pastor,Jesus. (2010).&»7fertility and CIS raster models
for tropical agroforestry planning in economically depressed and
contaminated Caribbean areas (coffee and kidney bean plantations) .
Agroforcstry Systems, Volume 79, Number 3, July 010 , pp. 381-
391(11), Springer
Allen, S.E. (1974). Chemical analysis of ecological material. Edited by Stewart,
E. Allen, Black Well Scientific Publications, Oxford, pp.
Amjad, M., and Khan, N. (1996). Forestry statistics of Pakistan. Pak. Forest
Inst. Peshawar, pp.
Andrew, N.R. (1999). Remote Sensing for Earth Sciences: Manual of Remote
Sensing, (ed, 3rd), vol. 3, John Wiley and Sons Inc, USA pp. 3- 52 &
LI 1- 188 (Write the complete pages of the book)

242
Anon, (1980). Agro ecological regions of Pakistan: Social and Plant resources
Division. Pak. Agri. Res. Council. Islamabad, pp. 52
Anon, (1980). Pakistan census of agriculture', province report: Punjab.
PP-
Anon, (1991).ÿ guide to a global environment. World FAO Resources p. 383
Anon, (2000). Communities andforestry management in South Asia (SGCIFM)
In; The Report of working group for community involvement in forest
management, pp.
i.
... —* JViv.1
__""7—: crctn...
Ashraf, B.M. (1994). Utilization of salt affected and water logged soils ofPunjab through natural vegetation. Final Technical Report, 1WASR1
Research Project, pp.
Ashton, M.S. and Montagnini, F. (1999). The silvicultural basis foragroforestry systems. CRC Press, Bexa Raton, FL. 278 p.
Avila, M. (1995). FAO Technical Paper 3: Agroforestry Systems - Concepts and
classification Series title: ILRI Training Manual - 2, pp.
Baig, M.B., Shabbir, A. and Nowshad, K, (2008). Germplasm Conservation of
Multipurpose Trees and their Role in Agroforestry for Sustainable
Agricultural Production in Pakistan, lnt. J. Agric. Biol., 10: p. 2.
Baker, D.E. and Eldcrshaw, V.J. (1993). Interpreting soil analyses foragricultural land use in Queensland. Division of Land Use and Fisheries,
Department of Primary Industries. Brisbane, pp.
Bargali, K., Usman, M. and Joshi, M. (1998). Effect of forest covers on certain
site and soil characteristics in fCumaun Himalayas. Ind. J. Forestry,
21(3): 224-227
Barkman, J.J. (1976). Code of phytosociological nomenclature vegetation.
32(3): 131 185.
Bartlett, G.N., Craze, B„ Stone, M.J. Crouch. R. (1994). Guidelines for

Z43
Analytical Laboratory Safety. Department of Conservation and Land
Management, Sydney, pp
Ben-Dor, E., Irons, J.R. and Epena. G.F. (1999). Soil reflectance; Remote
Sensing for earth sciences: manual of Remote Sensing. 3 ed., vol. 3,
edited by Andrew N. Renees. John Wiley and Sons Inc. pp 111-188
Benjamin T.J., Hoover, W.L., Seifert, J.R. and Gillespie, A.R. (2000),
Defining competition vectors in a temperate alley cropping system in the
Mid IVestem USA: 4. The economic return of ecological knowledge.
Agroforestry System, 48; 79-83
Bhutta M.N. and M R. Chaudhry, (2000biological Control of Water logging
In Role of Drainage and Challenges in 2lst Century: Proceedings 8lh
ICID International Drainage Workshop held in New Delhi, 31st January
to 4th February, 2000, Void 1 page 33-45.
Bisselcua, D.H.B.; Missoup, Avidal, S. (2010). Biodiversity Conservation,
Ecosystem Functioning, and Economic Incentives under Cocoa
Agroforesliy Intensification Conservation Biology, Volume 23, Number
5, October 2009 , pp. 1176-1184(9)
BofTa, J.M. (1999). Agroforesliy parklands in sub-Saharan Africa. Food and
Agriculture Organization of the United Nations, Rome, pp
Boggs, K. (2000), Classification of community types, successional sequences
and land scapes of the Copper River Delta, Alaska. Gen. Tech. Rep.
PNW-GTR-469. US Department of Agriculture, Forest Service, Pacific
Northwest Research Station, Portland, OR. 244 p.
Borden, D. and Gtese, R.F, (2001). Baseline studies of the clay minerals
society source clays: Cation exchange capacity measurements by the
ammonia-electrode method. Clays and Clay Minerals, 49(5):444-45
Botha, J. (2006). The viability of conservation and social forestry nurseries in
outh Africa. Publ. Ph. D Thesis, University of the Witwatersrand,
Johannesburg, South Africa. pp,
Brady, N.C and R.R. Weib (2002), The Nature and Properties of Soils (13th

244
edition), Prentice Hall, New Jersey (2002),
-r*”" VJ
Brand le. J.R„ L. Hodges, and J. Stuthma. (1994). Windbreaks and specialty
crops for greater profits. In; WJ. Rielveld, (ed.) Proc. Symp.
Agroforestry and Sustainable Systems, U.S. For. Scrv. Gen. Tech, Rep.
RM-GTR-261 , Rocky Mountain For, Range Exp. Stn., Ft. Collins, CO,
pp. 81-91
Brown, G. (2001). Center for Forestry and Ecology*. Available by Alabama
A&M University, School of Agricultural and Environmental Sciences,
Department of Plant and Soil Science, http://sacs.aamu.edu/
SPS/Foreslry.html
Bruhn, J.; Abright, N.;MihaiL, J. (20101 Forest farming of wine-cap
Stropharia Agrofbrestiy Systems, Volume 79, Number , June 010 , pp.
67-75(9)mushrooms
Bunce, R.G.H., Bair, CJ., Gillespie, M.IC, Howard, D.C.H., Scott, W.A.,
Smart S.M., Van dc Poll, H.M. and Watkins, J.W. (1999).
ECOFACT research report series. Volume Vegetation of the British
Countryside - The Countryside Vegetation System. DETR, London, pp.
Calegari, A. and Alexander. 1. (1998). The effects of tillage and cover crops on
some chemical properties of an Oxisol and summer crop yields in south
western Parang Brazil. Adv. Geo. EcoL, 31: 1239“!246.
Cao, Fu-liang; Kimmins, J.; Jolliffe, P,; Wang, J.(2010). Relative competitive
abilities andproductivity in Ginkgo and broad bean and wheat mixtures
in southern China. Agroforestry Systems, Volume 79, Number 3, July
010,pp.369-380(1). Springer.
Carroll, S., Gooneiilleke, S. and Dawes, L. (1995). OFramework for soil
suitability evaluation for sewage effluent renovation. £nv. Geol., 46(2):
195-20S.
Carter-Martin R. (1993). Soil Sampling and Methods of Analysis Soil
245
foundation ofsoil Sciences, Lewis Publishers, Canadian Society of
Soil Sciences. pp,
Caviglia, J. and Kahn J. (2001). “Diffusion of Sustainable Agriculture in the
Brazilian Tropical Rain Foresl: A Discrete Choice Analysis.” Economic
Development and Cultural Change. 49(2):31 1-334,
Chandrshekhran, C. (1987) .Expert Consultation on Inter sectoral linkages
Dec, 15-18* 1 987; Forests and Food Security KAO, Bangkok, pp,
Chapman, SB., 1976. Methods in plant ecology. Black Well Scientific
Publications, Oxford Printing Press, London, pp. 576,
Chaudhary, M.R., Sadiq, M., llamecd, A. and Ullah, T. (1983.) Effects ofmoisture and water salinity levels on soilproperties and crop yields Publ.
No. 128, MonaRec. Project, Bhalwal, Pakistan, pp. 1-35
Cbaudhri, LI. (1953). The vegetation of waterlogged areas of District
Sheikhupura Govt. ofPunjab. Pak.J. For, 3: 74-83,
Chaudhri, LI. and Sheikh, M Y. (1996), Halophytic flora of saline and
waterlogged areas, Agri. PaL, 20: 405-414.
Cirtis, J.T. and Mcintosh, R.P, (1951/ An upland forest continuum in the
prairie forest border region of Wishconsin. Ecology, 32:476-96
Clements, F.E, (1904). Development and structure of vegetation. Rep. Bot.
Survey, Nebr,7.pp.
Corwin, D.L and Lesch S.M,(2005). Apparent soil electrical conductivity
measurements in agriculture USDA-ARS, George R Brown Jr.,
alinity Laboratory, 450 West Big Springs Road, Riverside, CA 92507-
617, USAComputcrs and Electronics in Agriculture 46 (2005) 11-43
Craig, E, Wilkinson K, (2004). Nitrogen Fixing Trees-A Brief Introduction.
The Over story is distributed by Agrofoncstry Net, Inc.t P.O. Box 428,
Holualoa, Hawaii 96725 USA.
Curtis, J.T, and R.R. Mc-lntosh, (1951 ). The interrelations of certain analytic
and syntheticphytosociobgical characters. Ecol., 31: 434—55
Dawes and Goonetilleke, (2003). An Investigation into the role of site and soil

246
characteristics in onsite sewage treatment. Environmental Geology,
44(4): 467-477.
DeVelice, R., Hubbard, CJ., Bogjÿ, K., Boudreau, S., Potkin, M., Boucher.
T. and Werthcim. C. (1999). Plant community types of the Chugach
National Forest; South Central Alaska. Tech. Pub, R., 10, pp, 76. US
Department of Agriculture, Forest Service, Chugach National Forest,
Alaska Region, Anchorage, AK. 375 p,
Dimopoulos, Panayolis; Raus, Thomas; Mucina, Ladislav; Tsiripidis,
loannis(2010). Vegetation patterns and primary succession on sea-bom
volcanic islands (Santorini archipelago, Aegean Sea. Greece)
Phytocoenologia, Volume 40, Number 1, March 010 , pp. 1-14(14)
Dixit .S & Sreenath, D. 1993. A study on the attitude offarmers towards social
forestry programmes. National research center for cashew, J Puttur,
Dakshina Kannada, Karnataka, India, pp.
Dixon, HJ., Doores, J.W., Joshi, L. and Sinclair F.L. (2001). Agroecological
Knowledge Toolkit for Windows: Methodological Guidelines, Computer
Software and Manual for AKT5. School of Agricultural and Forest
Sciences, University of Wales, Bangor, UK, 171 pp.
Drury, C.F., Ng, H.Y.F., Serem, VJC. Tan, C.S. and Gaynor, J.D. (2000).
Modeling and testing of the effect of tillage, cropping and water
management practices on nitrate leaching in clay loam soil. Agric. Water
Manage, 43:111- 131.Economic Survey of Pakistan Report, (2004-2005) Ministry of Economic
affairs Division, Government of the Pakistan, Islamabad, pp.
Eduardo A.C. C. (2006). Soil Characteristics for Qualitative Sangiovese Wine
Production in Tuscany (Italy) In; From the Experimental Vineyard to the
Land Evaluation 18th World Congress of Soil Science, July 9-15, 2006 -Philadelphia, Pennsylvania, USAISSN 0943-0105 (Print) 1432-0495.
46(2): 195-208.

247
Erturul, Aksoy, Gdkhan Os:soy and M. Sabri Dirim. (2009). Soil
mappingapproach in GIS using Landsat satellite imagery and DEMdata
African Journal of Agricultural Research Vol. 4 ()]), pp, 1295-1302,
November, 2009 Available online at http://www.acadcmicjounrals.org
/AJAR ISSN 1991-637X © 2009 Academic Journals
F.A.O, (1988). Sustainable and effective management system far community
forestry* Rccoftc, Winrcck international, Fond Foundation and regional
wood energy development programme, pp.
Flowers, S. (1957), Vegetation of the great Salt Lake Region. Botart. Gazz.. 95:
353-418.
Forest Sector Master Plan (1992), Ministry of Agriculture Division,
Government of the Pakistan, Islamabad, Pakistan, pp.
Forestry Statistics of Pakistan PFI Peshawar (2004). Pakistan Forest Institute
Peshawar, Ministry of Environment Islamabad, pp.
Franzel, S,, Cooper, P* and Denning, G.L (2001). Scaling up the benefits ofagro forestry research: lessons teamed and research challenges.
Development in Practice, I 1(4): 524-534
Frey, Gregory E.; Mercer, D. Evan; Cubbage, Frederick W,; Abt, Robert C.
(2010), Economic Potential of Agrofarestry and Forestry in the Lower
Mississippi Alluvial Valley with Incentive Programs and Carbon
Payments Southern Journal of Applied Forestry, Volume 34, Number 4,
November 010 , pp* 176-185(10) Society of American Foresters
Gautam, Madan, K.. E. Roberts, H. and Bijay K.S* (2003), Community Based
Leasehold Approach and Agroforestry Technology for Restoring
Degraded Mill Forests and Improving Rural Livelihoods in Nepal ,Paper
presented at Rural Livelihoods, Forest and Biodiversity Conference, 19-
23 May 2003 Bonn, Germany* pp.
Gebrehiwot, K. (2004), 77ie development of dry land Agrofarestty in Ethiopia.
Paper presented at the 1CRAF Dry land Agroforestry Workshop, 1-3
September 2004. pp.

248
Gillcr, K.E., (2001\ Nitrogen Fixation in Tropical Cropping Systems (cd. 2’*d),
CAB International, Wallingford (2001). pp.
Gomes, I.C., Paula, N. And Resend Ic, J.l. (1989). Profile ofsmall and medium
size farms afforested in the Zonada Mata, minas Gerais. Deptt, De
economic rural, UFV, Brazil, pp,
GOP (2006-2007). Economic Survey of Pakistan. Ministry. Finance. Economic
Division, Islamabad, pp.
Gregory, G. and Gunman H. (2002). Developing appropriate interv entionsfor
rice-fish cultures. In: Edwards P,Little DC, Demainc H (cds) Rural
aquaculture, CAB1 Publishing, Wallingford, UK, pp 15-28
Gregory, G. Guttman. H. (2002) Developing appropriate interventionsfor rice-
fish cultures. In: Edwards P,Little DC, Demaine H (eds) Rural
aquaculture,CAB! Publishing, Wa I li ngford, UK, pp 15-28
Habarurema, E. and Steiner, K.G. (1997). Soil suitability classification by
farmers in southern Ruanda Source: Geoderma, Volume 75, Number 1,
January 1997 , pp. 75-87(13).
Hafccz, M. (1998). Agroforestry Scries: volume I to VI, handbooks, Punjab For.
Res. Inst. Faisalabad Pakistan, pp.
Haider, A, and Qaiser, M. (2009), The Enthnobotany of Chitral Valley,
Pakistan with particular references to Medicinal Plants. Pak. J. Bot.,
41(4): 2009-2041
Haider, W. (1995). Policy andstrategy issues in trading and marketing of wood
fuels. Regional course on trade in wood fuels related products
(RWMDP). Pakistan Forest Institute, Oct. 1-4, 1995. Peshawar. PP
Haile, Solomon G.;Nair, Vimala D.';Nair, P. K. Ramachandran. .(2010)
Contribution of trees to carbon storage in soils of silvopastoral systems
in Florida, USA Global Change Biology, Volume 16, Number 1,
January 010 , pp. 47-438(1) .Wiley-Blackwell.
Hamid, V.S. - Filleky GY. - Algaidi A.A. - Kristdf K. - Issa 1. A. - Hamuda
H.E.A.F. (2006): Kinetic model of CaCQ3 dissolution in different soil

249
types. Proceedings of VI. National Scientific Conference with
International Participation "Ecology & He of VL National Scientific
Conference with International Participation "Ecology & Health 2006"
18th May 2006. Plovdiv, Bulgaria, pp: 279-284.
Harper, RJ.. McKissock, L, Gilkes, R.J., Carter, DJ. and Blackwell, P.S,
(2000), A multivariate framework for interpreting the effects of soil
properties, soil management and land use on water repellency. J.
Hydrology, 231-232: 371-83.
Hatch, C.R. and Naughton, G.G. (1994). Marketing of multipurpose tree
products in Asia. Using Industrial wood markets to sustain farm forestry:
The Pakistan Experience. Proceedings of an international worieshop,
Bagnio, Philippines. Crafts-man press ltd., Philippines, pp. 169,
Herbst, D.B. (2001). Gradients of salinity stress, environmental stability and
water chemistry as a template for defining habitat types and
physiological strategies in inland salt waters. Hydrobiologia, 466: 209-
219.
Higgs, E.S. (1997). What is good ecological restoration? Conservation Biology,
11(2): 338-348.
Holzmucller, Eric J.(20D9). Toward Agroforestry Design: An Ecological
Approach. Forest Science, Volume 55, Number 4, August 009 , pp. 374-
3750-Society of American Foresters.
Hossain, M. Shahadat & Sayedur Rahman Chowdhury .E Nani Gopal Das
E M. Moshiur Rahaman. (2007). Multi-criteria evaluation approach to
CIS-based land suitability classification for tilapia farming in
Bangladesh Received: 4 February 2007 / Accepted: 13 April 2007 !
Published online: 25 May 2007 Springer Science + Business Media
B.V. 2007.
Hubbard, B.D. Fairclolh, B. and Long, A. (1999). Recreation optionsfor your
forestland. Fact sheet SS FOR 4. School of Forest Resources and
Conservation, Florida Cooperative Extension Sendee, Institute of Food

250
and Agricultural Sciences, University of Florida, pp.
Hussain, S,S„ Arshad, M.K. and Shahzad, A,M. (2003). Mountains of
Pakistan: Protection, Potential and Prospects. Islamabad: Global Change
Impact Studies Centre, pp. 133-232.
Hussain, W.R. (1999). Existing agroforestry system in the Punjab" a study
conducted by Punjab forest department under Punjab forest sector
development Project, Punjab Forestry Research Institute, Gatwala,
Faisalabad. pp.
Isbell, R.F. (2002). The Australian Soil Classification, CS1RO Publishing,
Collingwood, Victoria, Australia, pp
Jablonski, L.M, Wang, X.Z. and Curtis, P.S. (2002). Plant reproduction under
elevated CO:conditions: a meta-analysis of reports on 79 crop and wild
species. AW Phytol. 156: 9-26
Jordan, C.F. (1998). Exploring agroforestry opportunities in the South.
Southern Agroforestry In; Alley Cropping, pp, 14,1-14,5 In; P.G,
Confcrencc sponsored by the Natural Resources
Conservation Service, the US Forest Service, and Alabama A&M
University. Oct. J99B. Huntsville, AL.
Jose, A.1. (2002). Package of Practices Recommendations. Crops. 12lh Edition,
Kerala Agricultural University, Trichur. 278p
Jose, G. and Escobedo, M. (1999). Establishment and agronomic productivity
of Silvopastoral systems with Pelibuey Sheep in Yucatan, Mexico
Copyright © 1999 Agro-ecology Research Group, Last modified; pp
Kang, B.T. F.K. Akinnifesi and D.O, Ladipo. (1994). Performance of selected
woody agroforestry species grown on an Alfisol and an Ultisol in the
humid lowland of West Africa and their effects on soil properties. J.
Trap. For, Set., 7: 303-312
Kang, B.T., L. Reynolds, and A-N. Att-Krah (1990). Alley farming. Advances
Agron. 43: 315-359.
Kasongo, R, K.; VanRanst, E,;Vcrdoodt, A.; Kanyankagolc, P,;Baert, G.
Cannon (e<L)t

251
(2010). Impact ofAcacia auriculiformis on the chemicalfertility ofsandy
soils on the Bateke plateau. D.R, Congo Soil Use and Management,
Volume 5, Number 1, March 009 , pp. 1-7(7)
Kato, M.S.A., Kato, O.R., Denich, M. and Vlek, P.L.G. (1999). Fire-freealternatives to slash-and-bum for shifting cultivation in the eastern
Amazon region: the role offertilbers. Field Crops Res., 62: 225-237.
Kershaw, K.A. (1973). Quantitative and Dynamic Plant Ecology. Arnold,
London. pp
Khan, M.M. (1989), Economic analysis of agroforestry options for small
irrigatedfarms in Punjab, Professional paper in partial fulfillment of the
requirements for the degree of master of science Colorado state
university fort Collins, Colorado, pp.
Khan, N., Ahmed, M., Wahab, M. and Ajaib. M. (2010a). Studies along an
altitudinalgradient in (Accepted Pak.J. Bot.)
Khan, N., Ahmed, M., Wahab, M. and Ajaib. M. (2010b). Size class structure
and regeneration potential of Monotheca buxifolia and associated tree
species District Dir Lower Pakistan, (Accepted Pak. J. Bot.)
Khan, N.A. (2001). Social Forestry Vcreus Social Reality: Patronage and
Community-Based Forestry in Bangladesh. Gatekeeper Series No. 99.
International Institute of Environment and Development, London, pp
Kim. W. and Elcvilch, C. (2004). Multipurpose Windbreak Design: Balancing
Function and Yields. 2nd Ed. The Over story no. 32 Agioforestry Net,
Inc. Publisher: Permanent Agriculture Resources ISBN: 0-9702544-3-1
Kim. W. and Elevitch, C. (2004). Multipurpose Windbreak Design: Balancing
Function and Yields. 2nd Ed. The Over story no. 32 Agroforestry Net,
Inc. Publisher Permanent Agriculture Resources ISBN: 0-9702544-3-1
Kitalyi, A., Nyadzi, G. and Oduol, P.A. (2004), The Ngitili System as a
platform for agroforestry in the dry lands, In: Annual Review of
Agroforcstry Science and Innovation Planning Forum: The World Agro
forestry Centre (ICRAF) Nairobi, 20-25th September 2004. Nairobi:

252
World Agno forestry Centre (1CRAF).
Krogh, L., H. Breuning and M.H. Grave, (2000). Cation exchange capacity
pedo-transfer function for Danish soils. SoilPlant ScL. 50: 1—12
Kumar, M., Sharma C.M. and Rajwar, G.S. (2004).
community structure and diversity of a sub-tropical forest of Gartiwal
Himalayas. Indian Forester, 130(2): 207-214
Kumar, Sandecp' Udawatta, Ranjith; Anderson, Stephen .(2010) Root
length density and carbon content of agroforestry and grass buffersunder grazed pasture systems in a Hapludalf .Agroforestry Systems,
Volume 80, Number 1, September 010 , pp. 85-96(1)
Lassoie, J.P. and Buck, L.E. (2000). Dewlopment of agroforestry as an
integrated land use management strategy. In; H.!£. Garrett, W.J.
Rietveld, and R.F. Fisher (eds.) North American Agroforestry: An
Integrated Science and Practice. American Society of Agronomy,
A study on the
Madison WI. pp. 1-29.
Lassoie, J.P., Huxley, P. and Buck, L.E. (1994). Updating our ideas about
agroforestry education and training. Agroforestry. Syst.. 28:5-19.
Lavelle, P. and Spain, A. (2001). Soil Ecology. Doidrecht, The Netherlands,
Kluwer Academic Publishers, pp.
MAANICS International (Pvt.) Limited, Islamabad, (2003-04). Ministry of
Environment, Government of Pakistan, Islamabad. Report.
Fe; Rahola, Roberto Ani,Damasa; Rahola,Magcale-Macandog,
Princess; Vidal, Nifio. (2020). Enhancing the food security of upland
farming households through agroforestry in Claveria. Misamis Oriental,
Philippines Agroforeslry Systems, Volume 79, Number 3, July 2010 , pp.
327-342(16) Springer
Margesin et al., (2005). Manual for soil Analysis - Monitoring and assessing
Soil Bioremediation Volume 1,2,3 Springer
Mcrtz, Ole; Bruun, Thilde Bech; Fog, Bjamc; Rasmussen, Kjeld; Agergaard,
Jyttc, .(2010) Sustainable land use in Tikopia: Food production

253
and consumption in an isolatedagricultural system Singapore Journal of
Tropical Geography, Volume 31, Number 1, March 010 , pp. 10-6(17)
Merwin M.L. (1990). The Status, Opportunities and Needs for Agroforestry in
the United States Association for Temperate Agrofbrestry Report. H.E.
"Gene" Garrett, President School of Natural Resources, University of
Missouri, Columbia, Missouri.
Mignaut, Thomas; Senterre, Bruno; Milller, Jonas V.;Lejoly,
Jean; Parmentier, Ingrid,(2010) Shrubby andforestfringe communities
of the inselberg - rainforest ecotone in Atlantic Central Africa. Plant
Ecology and Evolution, Volume 143, Number, July 010, pp, 18-
137(10)
Mirza, R.A, (1978), Ecological studies in the inland halophytic vegetation ofthe British Isa. Vnpublis. Ph.D Thesis, Vol. II, University of Manchester.
pp.
Minta, R.A., and Bashir, M. (1996). Phytosociological study of Saline and
waterlogged soils of Sarghoda Tehsil, Sulfania, 1(1) 27-37.
Mishra, A„ Mishra, L., Sharma, C.M. and Sharma, S.D. (2002), Community
structure and growing stock Gaihwal, Himalaya. Annals of forestry,
10(2): 233-242.
Montambault, J, and Alavalapati, J. (2005). Socioeconomic research in
agroforestry; a decade in review. Agroforestry Systems, 65(2): 151-161
Mueller, and Heinz (1974). Aims and methods of Vegetation Ecology. Jhon
Wiley and sons, London, pp
Mueller, D.B. and H. Ellcnbeig, 1974. Aims and Method of vegetation Ecologyr
p. 200. John Wiley and Sons, Inc., New Yoik.
N’Goran, A., Gnahoua, G.M., Oualou, K. and Balle. P. (2002). Evolution of
maize yield after tree fallow in a humid forest zone of Cote d’Ivoire.
Cahiers d 'Etudes el de Recherches Francophones/Agricultures, 11:145—
149.
Nair, P.K.R. (1987), Agroforestry system in major ecological zones of the tropic

254
and subtropics, ICRAF woriung paper No. 47.
Najera, Andrea; Simonetti, Javier A.(2020). Enhancing Avifauna in
Commercial Plantations Conservation Biology, Volume 24, Number
1, February 2010 , pp. 319-324(6) Wiley-Blackwell
Naz, N., Hameed, M., Ashraf, M,, Ahmad, R. and Arshad, M. (2009), Eco-
motphic variation for salt tolerance in some grasses from Cholistan
Desert, Pakistan. Pak. J. Bot., 41: 1707-1714.
Naz, N., M, Hameed, M.S.A. Ahmad, M. Ashxuf and M. Arshad. (2010). Is
soil salinity one of the major determinants of community structure under
arid environments? Commun, Ecol., (in press),
Nel, J.L., Richardson, D.M., Rouget, M., Mgidt, T., Mdzeke, N.P., Le
Maitre, D.C., van Wilgen, B.W., Schonegevel, L., Henderson, L. and
Neser, S. (2004). A proposed classification of invasive alien plant
species in South Africa-, towards prioritizing species and areas for
management action. S. Afr. J. ScL, 100: 53-64.
Nisscn, T.M., Midmore, DJ.r Keeler, A.G. (2001). Biophysical and economic
tradeoffs of intercropping timber with food crops in the Philippine
uplands. AgriculturalSystems. 67: 49-69.
NRCS (1999) Soil taxonomy: a basic system of soil classification for making
and interpreting soil surveys - 2nd EDN. Agriculture Handbook No.436,
Natural ResourcesUnited States Department of Agriculture,
Conservation Service, Washington, DC
NRCS, (1999). Soil taxonomy: a basic system of soil classification for making
and interpreting soil surveys (ed. 2nd). Agriculture Handbook No.436,
United States Department of Agriculture, Natural Resources
Conservation Service, Washington, DC. pp.
Otsuka, K„ Suyanto, S., Sonobc, T„ Tomich, T. (2001). Evolution of Land
Tenure Institutions and Development of Agroforestry: Evidence from
Customary Land Areas of Sumatra." Agric. Econ 25: 85-101.
Owino, F. (2005). Improving multipurpose tree and shrub species for

255
agroforestry systems. J. Agrofor. Syst.. 19(2): 0167- 4366 (Print) 1572-
9680.
Ozsoy G, Aksoy E (2007). Characterization, classification and agricultural
usage of vertisols developed on neogene aged calcareous marl parent
materials. J. Biol. Environ. Sci, 1(1): 5-10.
Pakistan Economic Survey (2004-2005). Ministry of Finance. Econ. Division,
Islamabad, Pakistan National Conservation Strategy (1990). Ministry of
Agriculture Division, Islamabad, pp.
Pakistan National Conservation Strategy (1990), Ministry of Finance. Econ.
Division, Islamabad. Pakistan National Conservation Strategy (1990).
Ministry of Agriculture Division, Islamabad, pp.
Pakistan National Conservation Strategy, (2006). Government of Pakistan
(EUAD) in collaboration with lUCN-the world conservation Ministry of
Agriculture, Government of the Pakistan, Islamabad, pp.
Pakistan National Conservation Strategy, (2006). Ministry of Agriculture
Division, Islamabad
Pallardy, S.p Gibbins, D, and Rhoads, J. (2002), Above and below-ground
biomass production by two-year-old poplar clones on floodplain sites in
the lower Midwest, U.S.A. In; W. Schrodder and J. Kort (eds.)
Proceedings of the Seventh Biennial Conference on Agroforestiy in
North America. August, 13-15, 2001, Regina, Sask-, Canada, pp. 34-39.
Pansak, W.; Hitger, T. Lustana, B.; Kongkaew, T.; Marohn, C.; Cadisch,
G.(2010) Assessing soil conservation strategiesfor upland cropping in
Northeast Thailand with the Wa Nu LCAS model , Agroforestry Systems,
Volume 79, Number , June 010 , pp. 13-144, Springer view search results
Paul F. Anderson . (2007), G1S Descriptive Modeling of Soil Suitability for
Agriculture in Iowa Comparing Modem and Historic Soil Classifications,
Iowa Slate University, Additional historical information about land sales
in Polk County, GLO Soil Classification , General Land Office Research
Department of Landscape Architecture, Iowa State University.!2 April

256
2007,
PERI {2000), Impact Evaluation Report. Farm plantation raised in Punjabt
Punjab Economic Research Institute (PERI) Gulbcrg, Lahore Pakistan.
PP-
Perveen Farida , Ryota Nagasawa, Md. Imtiaz Uddin and Hossain K.
Dclowar (2004)Crt>p land suimbiiity analysis using a muliicriteria
evaluation and G1S approch, United Graduate School of Agricultural
Sciences, Tottori University, Japan and Faculty of Agriculture, Tottori
University, Japan
Pfefferkor, S.S., Rizkt, P.P., Noviana, K. and Laxman, J, (2005). Land
tenure, agioforestry adoption, and reduction of fire hazard in a forest
zone: A case study from Lampung, Sumatra, Indonesia World
Agroforestry Centre, Southeast Asia Regional Office, PO Box 161,
Bogor 16001, Indonesia; Agroforestry System, 5:1-1L Springer 2005
DO! 10.1007/s11258-004-1413-2
Poore, M.E.D. (1955). The use of Phytosociologtcal methods in Ecological
investigations. Part IV.Jour. Ecoi. 44, 28:50.
Puri, S.l and Nair, P.K.R. (2004), Agroforestry research for development in
India: 25 years of experiences of a national program. Agroforestry
Systems, 61(1-3): 437-452.
Qadir, et at. (1966). A phytosociological survey of Karachi University Campus’
vegetation, 13, 359-362.
Qayyum, A. (1982). A phytosociological study of salt affected areas around
Lahore. Unpub. M.Sc. Thesis, Govt, Collage, Lahore, pp.
Qurcshi, M.A., Iqbal, R.M„ Hussain, C.A. and Ahmad, F. (1998-99). Soil /
Salinity Survey Reclamation Division, Lower Bari Doab Canal, Govt.
of the Punjab, Irrigation and Power Department, pp,
Qureshi, Rahmatullah and G.R. Bhatti (2009), Folkore uses ifAmaranthaceae Family fi-om NARA desert Pakitan Pak. J. Boi,, 41(4):
1565-1572,2009.

257
Rao, Nil, (1989). A fforestation and poverty alleviation. IncL J. for.. vol.?(2):
90-95
Ratterman. C, Joe, J„ John C. and Sarah, H. (2002). What are the effects of
Deforestation on the Local Climate and what are the Global Implications
of this question Tropical Marine Ecology of the Florida Keys,
Everglades, & San Salvador, Bahamas, pp,
Roberts, (1977) biodiversity in Pakistan An TUCN Publication, pp.
Rodrigo S. Sicat Emmanuel John M. Carranza and Uday Bhaskar Nidnmolu
Fuzzy. (2005). Modeling offarmers' knowledgefor land suitability
classification Agricultural Systems Vol 83, issue l, jan 2005,
Rutter, A.J. and Sheikh, K.H. (1962). A survey of vegetation of waste lands
round Lahore and its relation to soil conditions. Btologia, (2).
Saha, R.; Ghosh, P.K.; Mishra, V.K.; Majumdar, B.; Tomar, J,M,S. (2010).
Can agroforestry be a resource conservation tool to maintain soil health
in the fragile ecosystem of north-east India? Outlook on Agriculture,
Volume 39, Number 3, September 010 , pp. 191-196(6) IP Publishing
49-75
Ltd
Salam, M., A. Noguchi, A., Koike, T. and Factors, M. (2005). Influencing the
sustainedparticipation offarmers in participatoryforestry: a case study
in central Sal forests in Bangladesh. Journal of Environmental
Management, 74:0301-4797
Sanchez, P.A., Buresli, RJ. and Leaky, R.R.B. (1997), Trees, soils and foodsecurity, Phil Trans. R. Soc. London, Scr. B, 353, pp, 949-961,
Sanchez, P.A., Burcsh, R.J., Leaky, R.R.B. (1997). Trees, soils and foodsecurity, Phil. Trans. R. Soc. London, Ser. B. 353, pp. 949- 961.
Sanchez. P.A.(1995). Science in Agroforestry. Agrofor. Sysf., 30: 5-55.
Sangha, K.K., Jalota R.K. and Midmorc DJ. (2005), Impact of tree clearing
on soil pH and nutrient availability in grazing systems of central
Queensland, Australia. Austr J. Soil Res., pp. Publication Dale:
01/01/2005

258
Scheir, SJ, 2004. Domestic wood markets for small farm agroforestry in
developing countries. World Agioforestry Congress Compendium.
Schmelz. R. M.: ROmbke, J. (2010). Three new species of Hemienchytraeus
(Enchytraeidae, Oligochaeta) from Amazonian forest soil Journal of
Natural History, Volume 39, Number 3, 005 , pp- 967-986(0)
Schwendenmann, Luitgard; Vddkamp, Edzo; Moser, Gerald; Hfilscher,
Dirk; Ktthler, Michael; Clough, Yann;Anas, Iswandt; Djajakirana,
Ddictrich; Leitner,
Bcate; Propastin,
Sstefan; Hertef
Christoph; Michalrik,
Pavel; Tjoa, Aiyen; Tschamtkc, Teja;Van Straaten, Oliver, .(2010)
Gunawan; Erasmi,
Dantela; Leuschner,
Effects of an experimental drought on the functioning of a cacao
agroforestry system. Sulawesi. Indonesia Global Change Biology,
Volume 16, Number 5, May 010, pp. 1515-1530(16).
Shuh et al (1964). Phytosociological study offlora of Rawalpindi, Lahore and
Multan districts.
Shamsi, R.A., Baig, S. and Bodla, M.A. (1994). Utilization of salt affected and
water logged soils of Punjab through natural vegetation, Final Technical
Report, tWASRl Research Project, pp,
Shurrna, K. L.; Raju, K. Ramachandra; Das, S. IC; Rao, B. R. C.
Prasad; Kulkami, B. S.; Srinivas, K.; Grace, J. Kusuma; Madhavi,
M.; Gajbhiye, Pravin. (2010). Soil Fertility and Quality Assessment
under Tree-, Crop-, and Pasture-Based Land-Use Systems in a RainfedEnvironment Communications in Soil Science and Plant Analysis,
Volume 40, Numbers 9-10, May 009 , pp. 1436-1461(6)
Sheikh, B.A and G.H. Soomro (2006) Desertification: causes, consequences
and remedies Pak. J. Agri., AgriL Engg., Vet. Sc. 22(1)2006
Sheikh, B.A and GJ3, Soomro (2006) Desertification; causes, consequences
and remedies Pak. J. Agri., Agril, Engg., Vet. Sc. 22(1)2006
Sheikh, M.I and Bukhari, A.S. (1996). Azad Jammu and Kashmir Natural
Resources and Environmental Survey. July, 1996. IUCN-Pak.

2S9
Programme - A Study, pp.42
Sheikh, MX (198!). Management study of Eucalyptus camaldulensis. Tech.
Rep, Pak. For. Instt. pp. 21
Sheikh, MX (1981a). Management study of hybrid Poplars. OFinal Tech. Rep.
Pak. For. Instt. pp. 51.
Sheikh, MX (1986). Approaches in watershed management in areas affected by
over grazing and misuse of range-land resources. FAO conservation
guide 14. “Start. App. and Syst, In Integ. Watershed management, pp.
85-99.
Sheikh, MX (1987). Forest andforestry in Pakistan. G.T.Z.and Pak. For. Instt.,
PSR: Spinzer Printing Press: 25: illus.
Sheikh, M.I. (1990). Agro-forestry systems adopted in Pakistan with particular
reference to the economics question of land tenure and other institutional
factors. Report prepared for FAO, Bangkok pp.104
Sheikh, MX (1991). Windbreaks & agro-forestry in Pakistan. Proc. of 2ndInternational Windbreaks Agroforestry Symposium, Ontario, Canada,
June 2-7. p. 224-227
Sheikh, M.I. (1992). Desertification and appropriate technologies in the
management ofarid lands. Paper written for Pak. National
Commission for UNESCO, Ministry of Education, Islamabad pp.1 1
Sheikh, MX (1993). Trees of Pakistan. Winrock Institute for Agri. Dev. GOP
USAID, Islamabad: 142 p.
Sheikh, M.I. (2000). Punjab Forest Sector Dev. Project. PC-I (Revised) pp.
229. PFSDP (Punjab Forest Sector Development Project), Punjab Forest
Department, Lahore.
Sheikh, M.I. and Jan. A. (1987). Study on forestry co-operatives in North West
Frontier Province. FAO, pp. 140,
Sheikh, M.I. and Riaz Qureshi. (1992), Extent ofsalt affected and waterlogged
land in Pakistan. A case study. Pakistan Forest Institute Peshawar.
Sheikh, MX, Bukhari, A.S. and Khan, A.Q. (2000), Design of Management

260
Plan of Lai Sohanra Irrigated Plantation with appendices and annexurc
PFSDP (Punjab Forest Sector Development Project, Lahore, pp.206
Sheikh, MX, Bukhari, A.S. and Khan. A.Q. (2000). Baseline survey of three
irrigated plantations viz; Changa Manga, Lai Sohanra and Kundian. Pun,
For. Sector Dev. Project, pp. 152.
Sheikh, MX, Bukhari, A.S. and Khan, A.Q. (2000). Design of Management
Plan of Changa Manga Irrigated Plantation, with appendices and
annexure PFSDP (Punjab Forest Sector Development Project), Lahore.
pp.205.
Sheikh, MX, Bukhari, A.S. and Khan. A.Q. (2000). Irrigated Plantation ofthe Punjab. Initial surveys. Interim report. PFSDP (Punjab Forest Sector
Development Project, Lahore), pp. 154.
Sheikh. M. I and Nico Marcar. (1991).Guide to tree planting on saline sodic
and water loggedsoils. For. Planning. & Dev. Project. GOP-USA1D. pp.
1-6.
Shephard, M.E. (1995). Plant community ecology and classification of the
Yakutat Foreland. Alaska. Tech, report R10-TP-56. US Department of
Agriculture, Forest Service, Alaska Region, Tongass Nalional Forest,
Chatam Area, Sitka, Alaska in cooperation with the Alaska Natural
Heritage Program, Environment and Natural Resources Institute,
University of Alaska, Anchorage, Anchorage, AK. 267 p
Shimwell, D.W. (1971).Tfae Description and Classification of vegetation.
London. Sidgqisk and Jackson. pp322
Shinwari ZK. Khan AA, Nakaikc T.(2003). Medicinal and other important
plants ofDistrict Swat. Ethno-botany Project WWF-P, Peshawar, pp.
Shouket, S.S. and Qadir S.A. 1997. Multivariate analysis of vegetation of
calcareous hills around Karachi, Vegetation, 23: 253-273.
Siddiquc, K.M, Ayaz, and Iqbal Mohammad. (1997). Wood-fuel energy in
Pakistan, Pakistan forest institute, Peshawar, 57.
Sikka, A.K., Madhu, M., Tripathi, K.P,, Singh, D.V., Chand, S.*

261
Jeevarathnam, K., Selvi. V., Raghupathy, R. and Sam, MJ, (2002).
Participatory watershed management under IWDP at Salaiyur
watershed. Workshop on watershed development under IWDP
Proceedings, DRDA, Coimbatore, Tamil Nadu, India, p. 1 1-18.
Simons, AJ. and Leakey, R.R.B. (2004). Tree domestication in tropical
agroforestry. Agrofor, Sys., 61:167-181. Joun; of For. 10(2) p. 117-
126
Singh G., S. Mutha and N. Bala.(20O5). Effect of tree density on productivity ofa Prosopis cineraria agroforestry system in North Western India.
Copyright © 2007 Published by Elsevier Ltd.
Singh, Surcndra Kumar; Kumar, Mahesh ; Sharma, Brij Kishore Tarafdar,
Jagadish Chandra.(2010), Depletion of Organic Carbon, Phosphorus,
and Potassium Stock Under a Pearl Millet Based Cropping
System in the Arid Region of India. Arid Land Research and
Management, Volume 1, Number , April 007 , pp. 119-131(13)
Soil Survey of Pakistan Report, (2005), Soil Survey of Pakistan Government
of Pakistan , Multan Road, Lahore, pp.
Sood, K.K. (2003). Factors affecting tree growing in traditional Agroforestry
Systems in Western Himalaya, India, Unpub. Ph.D thesis, University ofAberdeen, Scotland, pp,
Strong, N. and Jacobson, M.G. (2006). A case for consumer-driven extension
programming: agroforestry adoption potential in Pennsylvania.
Agroforestry Syst., 68: 43-52.
Sunderiin, W.D. (1997). An ex-post methodology for measuring poor people’s
participants in social forestry: an example from Java, Indonesia.
Agroforestry Systems. 37: 297-310. Kluwer Academic Publishers.
Netherlands
. Tansley, A.G. (1999). Types of British Vegetation. Cambridge University Press,
Cambridge.UK Biodiversity Group Tranche 2. Action Plans, vol. V:
marilime species and habitats. UKBG/English Nature, Peterborough, pp.

161
Tauseef and Mirza R.A. (1999). Determination of salinity status of some plants
community types from saline and water logged areas of Jaranwala
Tehsil, Faisalabad. M.Sc. Thesis, GC Lahore (P.U).
Tian, G., Salako, F.K. and Ishida, F. (2001). Replenishment of C, N, and P in
a degraded Alfisol under humkl tropical conditions: effect of fellow
species and litter polyphenols. SoilSci.f 166: 614-621.
Tonye, Ibewiro, B, and Duguma, B. (1997). Residue management of a
planted fellow on an acid soil in Cameroon: crop yields and organic
matter fracLions, Agrojor. Syst., 37:199-207,
Tonquebiau, E. (1990). Introduction to the Concepts of Agroforestry. ICRAF
Working Paper, 59: 1 22p
Uddin, M.S., Choudary, H,, Ud-din, M,B.f Halim, M.A., Khan, MAS.A. and
Hossain, M,M. (2006)„ RoJe of Part icipatory Agroforestry on community
development Insal.Shorea robusta Forest area, Bangladesh. Irtt. J.
Sustain. Agrii Tech, An on tine Journal of "G-Science
Implementation and Publication. 2(5): 19-25.
UHah Inayat and Sheikh, M.l. (i960). Afforestation campaign under the Thai
Dev. Auth. Pak. pp.
Unger, 1. A. (1972). Inland halophyte of the United State Salt Marsh symp.
Biology of Halophytes, 2: 235-305, A.1.B.S, Meeting Ed. Remiold a
Queen Acad, Press.
Unger, LA. (1968).Species-soil relationships on the great salt plains of northern
Oklahoma. Amer Midi. Natur., 80: 392-406,
USAD. (1 995). A report on UnitedState Aid Programmefor Pakistanforpromotion of the Farm Forestry in Pakistan 1985-1995, Government of
the Pakistan, Minisiiy of Agriculture of the Pakistan, pp.
Vicreck, L.A., Dymess, C.T. Batten, A.R. and Wenzlick. KJ. (1992). The
Alaska Vegetation Classification. Gen, Tech. Rep. PNW-GTR-286. US
Department of Agriculture, Forest Service, Pacific Northwest Research
Station, Portland, OR. 278 p.

263
Vitt, D.li, (1995). An overview of factors that influence the development of
Canadian peat lands. Memoirs of the Entomological Society of Canada,
169: 7-20.
Wahub, ML, Ahmed, M. and Khan, N. (2008). Phytosociology and dynamics
of some pine Ibrest of Afghanistan. Pak. J. Bot, 40(3): 1071-1079.
Waisel, Y, (1972). Biology of Halophyte. Academic press, New York. pp.
Whittaker, R.H. (1980). Classification of Plant Communities, Dr W. Junk, The
Hague, The Netherlands
Wilgen, V.B.W., de Wit, M.P., Anderson, HJ., Maitre, LJ3.C., Kobe, I. M.fNdala, S.f Brown, B. and Rapholo, M.B. (2004). Costs and benefits of
biological
Wu, B. and Pretty, J. (2004). Social connectedness in marginal rural China:
The case of farmer innovation circles in Zhidan, north Shaanxi. Agric.
Hum. Values. 21: 81-92.
XBoix, B.T., Fayos, A., Calvo-Cascs, A-C. and Imcson, M. (2001). Soriano-
Solo-lnfluence of soil properties on the aggregation of some
Mediterranean soils and the use of aggregate sizc and stability as land
degradation indicators. Catena. 44: 47-67,
Ziadal, FM. (2005). Analyzing digital terrain attributes to predict soil attributes
fora relatively large area. Soil Set, Soc. Am. I. 69: 1590- 1 599,
Ziadal, FM.(2007). Landsuitability classification using different sources of
information: Soil maps andpredicted soil attributes in Jordan.
Geoderma 140:73-80.
Zuhair, M. and Garforth, C. (2005). Farm level tree planting in Pakistan: The
Role of Farmers* Perceptions and Attitude, pp.

264
APPENDIX A
FOR ASSESSMENT OF 4 OR MORE YEAR OLD FARMERPLANT PLANTIONS
Part- A
1. Name of the owner (Agro forestry Farmers)
2. Address
3, Location of the plantation
4. Land self owned, on lease or as a tenant.
5. Site conditions / Soil / Saline / waterlogged
6. Species planted,
7. Preference of tree species
8. Pattern / design of planting (single trees, rows, along water lousier,
Along field borders, block, Plantation with agri crop.
9. Plants obtained from own nursery or from else where.
10. If else where, whether government nursery, private nursery.
11 Did you pay for the seeding? If so. how much?
12.Season/Year of planting.
13.Who approached / motivated you for planting.
14.Number of plants planted / Area.
15.Original spacing.
16. If agri-crops raised, which one and for how many years

265
17. Effecl of trees on agriculture crops if any.
18-Part- B
19, Number of plants surviving. (Percentage)
20.Protection of problems.
21. Insects / diseases or damage by other agencies such as rates, wild boar, rabbits,
porcupine etc.
22.Age and approximate dia and height of tree
23.Cultural operations done if any
* Cleaning
• Pruning
• Thinning
24. If so, method of sale: standing/converted/ roadside depots.
25.Yield obtained. Volume and weight.
26.Amount realized.
27.Who where the buyers,
28. If final felled, when? And method of sale:
Standing/ converted/ roadside depot.
29.Sold in the form of fuel/logs/ bailies / poles/posts
30.Amount realized. Gross and Net income.
31.Buyers: Local people/outsiders.
32. Are you aware of end uses/possible wood users/size required by the wood based
industry?
33.Was it profitable to grow trees? If yes, how and why, If No, the reasons and
constraints?

266
34.What are the requisites to make tree growing more attractive an agro
forestry as system.
35.Do you need help from the forest staff for raising of nurseries or
management of the Piantations? If so in what form.
36.Would you continue to grow private nurseries?
37.Would you grow nurseries for the Forest Department, if so desired by the
department.
38.Any other relevant information like setting up of cottage industries such as
silkworm
39. rearing (Sericulture) or Beekeeping (Apiculture).
40.If so what is the extant and sale of production.
41.Any difficulty in marketing of the produce (cocoons, siik yam bony)

African Journal of Environmental Science and Technology Vol. 4(10), pp. 639-650, October 2010Available online at hlipJ/www.acacfefri icjournafs.org/AJESTISSN 1S91-637X©2010 Academic Journals
Full Length Research Paper
Agroforestry trends in Punjab, PakistanSyerf Muhammad Akmal Rahim1’, Shahida Hasnain2 and Shamsi RA3
i Punjab Forest Department, Pakistan.department of Microbiology and Molecular Genetics, Faculty of Life Sciences, University of Punjab, Pakistan.
3Department of Botany. University of the Punjab Lahore, Pakistan.
Accepted 24 August, 2010
Pakistan in general and the province of Punjab in particular have a narrow toreSt resource. More than90% of the fuel wood and about 72% of timber requirements are being met from trees growing on theprivate farm lands, based on agro forestry / social forestry t community forestry as compared with thestale torests. It is obvious that trees have to be grown in conjunction with agricultural crops on privatefarm lands. The main objectives of the study pertain to agro forestry trend In Punjab, Province ofPakistan along wilh the identification of the agroecloglcal zones of the province including evaluation ofadaptation level of agro forestry interventions; assessment of the aptitude of agro-foresters towardstree planting and hurdles in expansion of the agro forestry. For this, a survey of 257 farm plantations(FP) was conducted in 20 districts of the Punjab Province and more than 257 agro-farmers wereInterviewed through a prescribed performs. However, a correlation between linear and compact designsof the agro forestry was established. From the study of the survey results, it has also been noticed thatout of 257 FP, only three FP belonged to the lessees and 254 belonged to land owners. It was also notedlhat number of FP considerably Increased during 1995 to 2000, when the Punjab forest departmenttransferred technology and provided various incentives and financial subsidies. The farmers canfurther increase ft, if the government revives financfalrtechnicai incentives and marketing facilities.
Key words: Agro Forestry, linear and compact design, land tenure, agroecloglcal zones, spacing.
INTRODUCTION
Pakistan Is a unique combination of deserts, alluvialplains, low and high hills, valleys and a tong coast line.The diversity in climate and soil is well reflected in theecological distribution of fauna and flora. The climate isgenerally arid subtropical. The average rainfall is 250mm, while some of the driest regions receive less than123 mm annually (Hussain et al. , 2003). There is widerange of rainfall starting from 100 mm in the south to1Q00 mm in the north. Pakistan has the largestcontiguous canal irrigation system in the world; but If notfor it, the country would have been a vast unproductivedesert (Shlnwarl, 2003J. With independence in 1947, thenew born country's meager natural resources had to bearthe brunt of refugees from across the border. Trees werecut mercilessly, and subsequently, the nexus betweenthe contractor and the forester played havoc with thecountry's tree cover, rendering the state of affairs into analmost irreversible situation (GOP, 2006 - 2007).
The country has a narrow forest resource base extendingover only about 4.8% (4.59% excluding farmlandplantations) of its area, which is insufficient to provide themalarial needs of the growing population and expandingindustry, and to retard and arrest the Ongoing environ¬
mental and ecological degradation process. The situationIs further aggravated by the natural, but unevendistribution of the forest resources. Almost 80% of theproductive forests are located in the north (Hazara,Malakand, Azad Kashmir and Northern areas, whereas80% of the population and wood based industry islocated in the southern and central parts of Pakistan(Pakistan Economic Survey, 2004 2005),
Pakistan's fast growing population of about 152.53million is dependent for its wood and wood productsrequirement on a meager forest resource base of 4.2million hectares (The Pakistan National Conservationstrategy, 2006). The per capita forest area thus is only0.0265 ha (Pakistan Economic Survey. 2004 05),compared to the world average of one hectare. Onlyt/3rd of the total forest area is productive, white the restis of environmental and protective value only (Anon,’Corresponding author. E-mail: rahimakmakgthoimail.com.

Afr. J. Environ, $d. Technol.640
1991; Ahmad, 1998). It Is becoming increasingly dilficultto meet the demands of the growing population for fuelwood, fodder, agriculture implements and raw materialrequired for wood based industries (Cavjglia and Kahn,2001). There is no doubt that scanty tree cover is theresult of the gross mismanagement of forests in the past.The development of modem infrastructure anddevelopmental pressure has further facilitated destructionof meager tree cover in the country (Baig el al.. 2008). inthat the forests are open to a multitude of adversefactors. Apart from climatic and edaphic hurdles in theexpansion ol the tree cover, the socio economic issuesare very acute and critical. The evil practices ofencroachment on forest and range lands, cultivation onsleep slopes, intentional fires, etc. have played havocwith the scanty tree cover in the country culminating In achain of ecological disasters (Olsuka et ai., 2001).
Anyone on tour to the Punjab province will find manytrees on private farms as boundary markers, shade treesand windbreakers, It would also be dearly visible thatmany more could be accommodated in between. Despitethe unscientific and unplanned planting on farmlands, theprivate farmland plantations are currently contributingtour times as much of the timber and nine times as muchof the fuel wood that are being produced by state forasts(Sheikh et al., 2000). It is very unfortunate that enoughresources are not being devoted to support farm loreslryto the level warranted by its potential importance as aproductive resource and the basis of secondaryenterprise for the farmers growing agricultural crops. Assuch, farmland plantations deserve much more attentionand resource allocation by the forest department thanheretofore lor the growing of trees in a scientific manner(Hafeez, 1998)
Agroforeslry is a traditional method ot combining treeswith agricultural crops or pasture, so that multiple benefitscan be achieved from the same land management.Kalinganlre et al. (2008) defined “Agroforestry as adeliberate integration of woody components withagricultural and pastoral operation on the same piece ofland either in a spatial or temporal sequence in such away lhat both ecological and economical interactionoccurs between them." Trees on farmland improve themicroclimate and II is not uncommon to feel the coolingeffect of the trees on a hoi summer day. Trees thusprotect us. our animals and houses from blazing sun insummer and cold winds in winter (Simons and Leakey,2004) The limits Of production from particular soils areconditioned by quaiily and management practices. Thusthe activities which are basic for the promotion of theOptimum land use are: land resources inventories.assessment ol degradation hazards, evaluation olproduction capacity, improvement of soil fertility, landreclamation combating desertification and integrated landuse planning (Baig et ai., 2008). The potentialcontribution of trees to soil improvement is one of themajor assets of agroforestry in general (Sanchez et al.,
1997). The enhancement of soil fertility by trees isconspicuous in studies which compare productivity olcrops grown on soils formed under tree canopies and oncontrol soils in open sites (Craig and Wilkinson, 2004).Differences in soil fertility as demonstrated by in situ cropproductivity differ at varying distances from the tree(Botha. 2006). Generally, higher soil nutrient status undertree cover is reflected in the mineral content of understory herbaceous species (Tonye et al., 1997). Soilinfertility is the resul of the pressure on the land due to acontinuous cycle of crop growing without allowing il torest, II. therefore, should be realized that in order toensuro optimum land use, it is important that a country'sland resources should be assessed in terms of suitabilityat different levels of inputs for different types of land usesuch as agriculture, grazing and forestry. In manydeveloped and developing countries, this integrated landuse has been given the names of agroforestry,agrosllvopastoral activity etc. where trees are beinggrown In conjunction with agricultural crop and wherelarge herds of livestock are being raised underagrosilvopastora! system of land use (Gebrehiwot, 2004),
Pfefferkorn (1999) suggests that if a large amount ofgenetic diversity has been removed from the system, acomplete replacement of taxa would require a long periodof time. Migration in the basin was remarkably rapid anda return lo diversity levels took less than 5 mill ton years.Regionally restricted environmental changes can alsoaccount for different recovery rates in different regionsMonsoonal climatic conditions favored a more rapidrecovery in South Africa (Jablonski, 2002).
The primary processes held responsible for theformation of high fertility around trees relate to enhancedbiological processes associated with the seasonal andlong term return of nulrients accumulated in trees to thesoil through litter fall, root decay and exudation, and theirmineralization, as well as leaching of nutrients stored incanopies. Soil texture sometimes differs according totree size. Reasons behind these variations related to treesize are not dearly understood (Sangha el al., 2005).Increases in organic matter and improved microclimaticconditions trees enhance soil microbial and enzymaticactivity, decomposition and physical characteristics (Tianet al., 2001). When this is compared to open sites,
biological activity is two to three times higher. Fine soillost through wind erosion may be intercepted by irees
and deposited through fall and stem flow. Trees alsoincrease soil nitrogen availability due to Nitrogen fixation(N goran el al.. 2002). Increased fertility under Irees mayalso be due to bird droppings and this is integrated inlivestock, dung deposition by animals which rest and leedunder Iree shade. The tree effect may be morepronounced where livestock is excluded than in naturalagrosilvopastoral systems (Anon, 2000). Small treesinduce little fertility change in their soil environment andproduce significantly less organic litter and root turnoverinputs. Unlike larger trees, small ones also had no dung

Rahim el at. 641
deposited beneath them. Nutrient enrichment by treesincreases with tree size. Young trees do not seem toinfluence the size of the nutrient pool significantly, andthat the nutrient concentration of sub canopy soilsexpands with tree size (Brown. 2001). More specificinformation is needed on the dynamics of soil fertility withincreasing tree size in relation to the performance ofassociated crops, and recommendations on size/age andrelated conditions of tree-stands from which increasednutrient availability can potentially generate enhancedcrop yields (Sangha et al.t 2005). Trees may alsoincrease system productivity by reducing nutrient lossesthrough leaching in deep soil and reduced soil erosion(Dove, 2003). Trees may increase the overall systemproductivity by increasing nutrient availability throughnilrogen fixation and deep rooting, and their enlargedabsorptive capacity associated with mycorrhizae andfungal infection. However, even though these processesmay be important in particular sites with appropriate soliconditions and water availability, there are limitations tothese processes (Botha, 2006).
The major objectives of this study were theidentification and elaboration of agroclimatic edaphiczones of Punjab from the view point of agroforestry,assessment of environmental I ecological impact offarmland plantation, impact on biodiversity, effect on soilfertility and soil environment. It also included Iheevaluation of the adoption level of agroforestry interven¬tions. extension of biological approach to wastelanddevelopment, quantification of the sodal contribution ofagroforestry over a period of time, study of the tree-cropinterface and monetary gains / losses to the tree farmersalong with preference of tree species by the farmer inrelation to agro climatic zones and assessment of theaptitude of agnoforesters towards tree planting. The studyof agroforestry heiped in the development of linkagebelween wood producers and wood users, which helpedin removing the hurdles in the expansion of theagroforestry as land use system and exploration of woodmarkets for the produced wood enhancement.
and quality of people's participation, etc (Kitaiyi et al.,
2004).Based on the above considerations, the following
Criteria have been used for the selection of Iherepresentative zones: climatic and edaphic considera¬tions physiography and ecology; extern of forest andagricultural resources in each zone; site specificity: waterlogging, salinity, commanded and uncommandcd areaand other landlorms; the level of biological diversity;socio-economic needs of the communities living in thezone; their agricultural practices and soil fertility. Thesocio-cultural status of the communities (that is, theadequacy or otherwise of irrigation water) include sub soilwater and the degree of similarity and comparability(Figure 1). This follows the four broad based agro-ecological zones of Punjab where the study has beenconducted.
Agro ecological Zone lll-A — Sandy deserts
This zone covers a part from certain districts of Sindh;and from the province of Punjab, this region covers thedistricts of Rahim Yar Khan, Bahawalpur, Bahawalnagarand the Cholistan desert, characterized by elongated NE-SW oriented sand ridges formed by eoiian (pertaining lowind) agencies. The climate is arid (desert) sub-tropicalwith very hot summer and mild winter, but the winter ispractically rainless. The original tree vegetation consistsof Prasopis cineraria, Saivadora oleokfes, Tamarixaphylla and Tecoma undulate, whereas, the shrubsinclude Cailigonum polygonoides. Calotropis procera,
Salsola toetida and Haioxylon spp. Major grass speciesinclude Cymbopogon javarancusa and Pennisetumdivisum However, the vegetation is sparse and loppedheavily for fuel, fodder and hutments.
Agro ecological Zone lll-A and B-Sandy deserts
This region (Thai) covers the districts of Muzalfargarh,Mianwafi, Bhakkar, Khushab and Layyah with variousforms of sand ridges and dunes including, longitudinal,transverse sand sheets with silty and clayey deposits thatoccur in narrow strips. The sand ridges are 5 to 15 mhigh, Between the sand ridges, there are hollows whererunoff water is collected after the rain. In the central partsof the desert, large elongated channels and theiralignment suggesl lhal they were formerly occupied bythe shitting courses of river Indus, The desert is quiteprofusely dotted with vegetation comprising dwarf trees.The climate is arid to semi-arid sub-tropical continentaland the mean monthly highest maximum temperaturegoes up to 45,6‘C, while in winter, it goes from 5.5 to1.3*C. The region, in general experiences occasionalfrost with mean annual rainfall of 150 to 350 mm,increasing from south to north. The original vegetation
CRITERIA FOR DIVISfON INTO AGRO ECOLOGICALZONE
Some criteria are quantitative such as percentage ofvegetation cover in a particular ecological zone, that is,land available for timber production, total growing stock,its level of productivity, density of woody vegetation thatcan safeguard soil from erosion and provide refuge lo thenatural fauna etc. There are other criteria which arequalitative or descriptive only, such as those relating tothe role of the trees in the optimal land use of the tract,supply of wide range of products and services critical torIhe welfare of local population, sodal needs of thesurrounding communities that influence the existence otthe trees and utilization of the forest produce, the level

642 Afr. J. Environ. $c*. Technol.
AGRO ECOLOGICAL REGIONSPAKISTAN
N
A
IVb,
vni
iLEGEND-oc
Htohn.Southern UilgaMnaln
MB Stndy Omit |A)
Dm S-w*y D***n (B)
Norttum IrrtgBiBd Plain
Mil Northern Irrlgtlw) Plain
Danl Unh
VI WK MtHKlUira
,m Horihtm Dry Mountain*
/rA- d
Wmwn Dry Mountain*
DiyWHIrnPlllHU
Sulalman Plrdmont(X
Manwttentl boundary
District boutidwy
Ph D Work Of Syorf M. Akmal Rahim
Sotro CcoKHBtMl at Hsrofc™[ry In Punjab Botany Dapartmaol. Univ*r*lty erf th* PunjJtl. Labor*
Figure1. Agtoecoiogtcai zones d Pakistan.
and Gujranwala are covered by this region. The land is
lying between Sutlej and Jhelum Rivers, having arelatively flat surface although there are some remnantsof old river channels. This region is canal irrigated. Itsclimate has been changed from arid to humid through theworld's largest canal system. The soils in this zone aresandy loam to clayey loam. Along the rivers, narrowstrips of new alluvium are deposited during the rainyseason when the rivers are in spate. In the northern partof the region, dominant soils are loam and clay loam withweak structure, white the clayey soils are also quite
important, as they cover about 40% of the area. It is themost important area of the country from the agriculturalpoint ol view.
consists of trees such as Acacia nilotica, Prosopiscineraria. Salvadora oleoides. Tamarix aphytia andshrubs like Calligonum po/ygonoictes, Tamarix dioca,Caiotropis procera and Zizyphus nummularia which havebeen heavily damaged due to indiscriminate grazing andon account of conversion ot land to agriculture. The grasscover includes Eieusine compressa. Lasirus hirsutus,
Saccharum benglense and Panicum antidotale.
Agro ecological Zone IV-A- Northern irrigated plains
The districts of Sahiwal. Lahore, Kasur, OkaraFaisalabad, Jhang and part of Multan. Gujrat. Sheikhupura

643Rahim et al.
Location and extentThe climate can be divided into two parts. Thenortheastern halt has semi-arid (steppe) sub-tropicalcontinental type of climate where the mean maximumdaily temperature in summer goes up to 39.5°C and themean monthly maximum temperature is 45°C. In winter.the mean minimum daily temperature is 6,2‘C with
occasional cold spells when the mean monthly minimumlemperalure (alls down to 2*C. The mean annual rainfallranges from 300 to 500 mm in the north. The originalvegetation consists of trees such as Acacia modesta, A.nilotica. Prosopis cineraria, Tamarix aphylta. Zizyphusspp. and shrubs like Cailigonum, Sueda fruticosa, Rhaiyastricta. Acacia jacquemontii etc. These are lopped forlodder, fuel and construction of hutments in the villages.The major grass species are Elousine. Lasiurus, Panicumcymbopogan and Saccharum.
The province of Punjab lies belween 27°AZ to 34'02north latitudes and 69 S' to 75“23' east longiludes. Itstoial geographical area approximates 20.63 millionhectares. It is surrounded by the provinces of NWFP andBaluchistan on the north and west, the province of Sindhin the south and India on the east. Lengthwise, it extendslo aboul 1,078 km from north to south and widthwise, to616 km from east to west (Hussain et al.. 2003).
Population
Of all the provinces, the Punjab is the most populous with74.32 million people inhabiting it. About 70% of thepopulation lives in villages, mostly dependent uponagriculture for their livelihood Literacy rate is less than30% (Economic Survey of Pakistan, 2006 - 2007).Agro ecological Zone V - Baranl (rain fed)
The sail range. Pothwar plaleau and Himalayan piedmontplains form this region. Climatically, a small narrow beltlying along the mountains is nearly humid, whereas in thesouthern part, it is semi-arid and hot. The narrow belt hasthe summer mean maximum daily temperature of about38°C with frequent cold sfMlis, The mean monthly rainfallis approximately 200 mm in summer and 36 - 50 mm inwinter (December - February).
Topography
The land forms consist of almost leveled alluvial plainsexcept Salt Range which elevates from 500 - 1000 m andis the dividing line between southern plains and northernplateau of Pothohar which on average has 450 maltitude. The southern alluvial plains of Bahawalpur lie atthe minimum altitude of 150 m above sea level, whereasPatriate hills (Murree) are perched at the highest altitudeof 2500 m (Hafeez, 1998).STUDY AREA
The Punjab province is extremely deficient in forestresources with only 2.08% of the total area underproductive forest cover. The province happens to be themost populous of all ine provinces of Pakistan (Sheikh elai„ 2000). With constant increase in demand of foodgrains for the fast growing population, more areas cannotbe spared for raising forest plantations. One ot theoptions is to raise trees along with agricultural crops onthe same piece of land called agro forestry. Agro forestryas land use is a collective name for the practices wherewoody perennials (trees, shrubs, palms, bamboos etc)are deliberately used on the same land management unitas agricultural crops and/or animals or boih, either insome form of spatial arrangement or temporal sequenceoften tor maximum net return from this joint productionsystem (Khan, 1989). The farmers in irrigated areas arealready practicing agro forestry in some form tosupplement fuel wood and timber production of theprovince thereby increasing their own personal total farmincome (Ahmad, 1998). They have been practicingdifferent models and patterns of agro forestry systems ina haphazard way. So far. these systems have not beenproperly documented (Sheikh, 2000). The geographicalfeatures of the Punjab as a whoie, land use pattern,administrative and agro-ecologtcal zones, vegetationtypes, etc are explained under.
Soils
Two types of soils are encountered in the province: (i) oldalluvial soils which are highly fertile plains, irrigatedIhrough a world famous canal system as well as gullied.ravined and dissected Barani lands of Pothohar plateauwhich are deep and relatively fertile and (ii) sandy desertsof Thai and Cholistan covering about 20% ot theprovinces landmass. These are unstable due to windblown sands and are calcareous and infertile in nature(Soil Survey of Pakistan Report, 2005).
Climate
Climatically, Punjab falls in three zones on the basis ofrainfall such as: (i) arid deserts of Thai and Cholistan with300 mm below annual rainfall, (ii) semi arid areas ofsouthern Punjab and Pothohar with 300 - 600 mm rainfalland (iii) dry subtropical tract ol central and north Punjaband Salt Range with annual rainfall ranging from 600 -1200 mm. Temperatures in summer may exceed 50'C atcertain places. In winter, lew areas experience frost for aShort period, while rains in monsoon torm the bulk, thatis, two third of the total rainfall. The rest of the rain falls in

Air. J. Environ. Sci. Technol.644
to grow and survive.Table 1. Survey of various farm plantations in variousdistricts of Punjab,
Farm plantationsDistrictNo. METHOOOLOGV26Attock
ChakwalJhang
Toba take sing
FafcalabadSheikupura
LahoreGujranwala
Hafizgbad
KasurOharaSahiwalPakpatton
KhaniwatMultanVehariMuzatfargartighar
Dora gazi khanBahawalpur
Rahim yar khan
tSurvey has bean widely used In Pakistan in the past to collectInformation on forest resource use, Table 1 Indicate live detail of thesurvey area,
102103124
125Questionnaire preparation
After a review ot the literature (Sheikh, 1993). a questionnaire wasdrafted The questionnaire was also discussed with a few leadingTree termers of Punjab. This contained questions on social aspectsol the tree termers, demographic profile, economic aspects anddesign of agroforestry. The requite information was duly recordedIn two separate parts of the Performa in which 'Part A" deait withgeneral information such as site condition, species prole rencs,patterns or design of planting, source of the planting stock, numberol plants pfantad, spacing adopted, the agncutural crops raisedalong with trees and effect If any on the yield ol the agriculturalcrops due to shade or competition lor wafer and nutrients, in 'PahB', the nature of questons was a little different: the farmer wasasked about the number or planis surviving, prelection problems;insects or diseases, whether he had carried out any culturaloperat on or not. etc. He was further asked as to how much moneyhe had made through the sale of trees. Another question askedwas: Did he gel any technical help from the Fornsl Department toraise nursery or to plant trees, and whether according to Nm. ifgrowing trees in conjunction with agriculture crops helped himeconomically and socially. With the evaluation of all the data, it waspossible to draw the following conclusions leading torecommendations and guidelines of the agro foresters of thePunjab
196207
108
109
510411
12 613 2514 2115 11
16 1317 1318 4
19 520 21Total 257
winter season. Moreover, the southern part experiencesless rainfall (Hussain el al., 2003),
RESULTS AND EVALUATIONLand use
Based on the surveys conducted by the author andreview of studies conducted earlier, the importantfindings, pertaining to agro forestry that has emerged, aregiven below,
Agriculture is the major land use in Punjab, with [he
cultivated area being 12 mha (million hectare) or 58.46%of the total land area. A sizeable area of 7,15 mha istermed as wild land which has some potential forproduction other than agriculture, Out of this, 0.57 mhaare under the control of fhe forest department formanagement as "range lands'. Per capita availability ofthe cultivated area is 0.16 ha, while the forest area perperson is only 0.009 ha as compared to ihe worldaverage ot one ha per capita. However, it shows highpopulation density for a scarce resource (Sheikh et al.,2000).
The province of the Punjab has highly diversifiedlandscape and environment Extensive Old Riverterraces, recent and sub recent river plains, piedmontplains and sandy deserts with sand dunes of differentheights and shapes are the major land forms wherevariations in soil forming factors have given rise !o avariety of soils. Large areas have also become waterlogged and saline due to seepage from canals with highrate of evaporation leaving whitish sail deposits over thesurface (Shamsi et al., 1994) The latter types of soilspermit only a specific type of vegetalion (Halophytes)
Trend of raising trees on farm lands
Till the year 2000, there has been an increasing irend inthe planting ol different trees species, but it has gonedown a little due lo marketing difficulties and cessation olactivities by the Forest Department, There are manyhindrances in the free movement of wood from differentparts of the country due to restrictions imposed by theProvincial Forest Departments. Also, farmers do notknow the size and specif icalions in which they shouldconvert their farm-grown wood for ready marketing.There is a persistent campaign of vilification against agroforestry launched by the Agricullure Department andFigure 2 reveals that the maximum numbers of farmplantations (65%) were raised during the period of 1995 -2000 when the World Bank aided programme was inforce transferring technology and monetary incentives

Rahim el al. 645
broad categories of land tenures (Sheikh, 1990).
Landlord system, under which the land is owned by anindividual in the lorm of a large land estate, is sometimesextending over a number of villages. Presentproprietorship system, under which land is owned insmalt lots by the individuals who with the help of familytabor cultivate the land and Riyatwah sy$1em\ underwhich the land Is held directly for the state on tenancywith full security of tenancy. Technically, the ownershiprests with the state, but practically as long as theoccupant pays the land rent, he retains the possession ofland (Suyanto et al.. 2005). However, his rights to holdthe land are usually inheritable and transferable.
It has been observed that the lessees generally do notwant trees in their leased land because ihey think that themajor beneficiary would be the owner of the land and thatthe lessee would only bear the increased shade withdetrimental effect on the agricultural crops. Under thecurrent land tenure system, the short term tenants shungrowing of trees on the land lor obvious reason ofshading of crops and Interfering with their root system.
On the other hand, the owner cultivators prefer to growtrees along with the crops as the practice helps monetarygains and soil conservation and improvement (Place andHazell. 1993). It was also recorded that out of 257 farmplantations (Figure 3}, 3 were lessee and 254 were ownerplanted.
If land holding is small, the farmer will not be ready toplant trees. It is only the landlord with big holding whowould be able to spare land for trees even to thedetriment of agri-crop because he would be able lo affordany losses in grains if at all, realizing that the trees arelike money in the bank and could be cashed like moneyany time (Noviana and Joshi, 2005), The interestingsituation came after the analysis of the survey data thatmajority of the farm plantations were raised on landholding of about 20 acres (86%) that is, 223 out of 257(Figure 4).
»ljfl 180 !% ISO|140
120
I TOO Is soo 60
II ar3 ™
_2 0'ÿ-X
2001-TOTAL1996-1985- 1991-1995 2000 20051990
Figure 2. Trend at raising farm plantations in Punjab.
illLesseeTotal Owner
Figure 3. Land tenure.
- HO3s 11®
I «
Choice of species
Atthough planting of the environmentalist lobbydiscourages the planting of 'eucalyptus', there are clearadvantages in planting this tree species. For examplethey are oasy to grow, have a tremendous rate ol growth,not liked by livestock and are multipurpose in end use.The propaganda against the eucalyptus has been doneby environmentalists and administration (Pattanayak etal, 2003). The results of the survey revealed (Figure 5)that (87%) agro-farmers preferred eucalyptus, while iherest of the fanners (13%) grow other trees like shishum.kikar, etc along with eucalyptus.
01 to is 11 la so 71 la lo
in tcr*s
J0t»4e 41 ka 13a
Figure 4. Land bolding.
(Nissan et al„200i).
Land tenure and its effects on agro forestry practices
The land tenure system, which prevails in Pakistanparticularly in the Punjab province these days, hasevolved under the Influence of changing social andpolitical perspectives over a period of more than a centuryand a half. From the legal point of view, there are three
Choice of agroforestry design
As a matter of routine, the Iree farmers prefer to plant

646 Afr. J, Environ, Sci, Techrtol.
300
* 250 -
|200
§ 150 -100 -
5
a.
t50—E0
Total Eucalyptus Mix tree
Figure 5. Correlation between linear and compact farm plantations.
Li102
too« 98
1 "a. 94
1
|92
o go
L\ 86
Z 36
84
82
Llnuf piltgrti UlWContp patternCompact pattern
Figure 6, Choice ot agrotoreslry design.
l»r
£ '* I-|'Ll_im
B
2o£
IE9
UrvCompTotal Linear Compact
Figure 7. Farm plantation under eucalyptus.
crop shows less effect and is more visible when trees areplanted in rows. A large number of studies all over theworld on the effect of trees on agriculture crops have
trees on their land in rows or multiple of rows as in thiscase, trees occupy less space and the land meant foragriculture is not reduced (Figures 6 and 7), Also, the

Rahim et al, 647
120t]
£ ioo -
£
aBO
ft§
I I40O
ii 20.oE
z £>
10X10 SXS 10X6 mis
Spacing
Figure 8. Paltarn/spaclrvg.
indicated the benevolent effect on the crops and that iswhy row plantation is preferred on other designs such asinter cropping, planting in odd comers of the land, etc(Suyanto et at,, 2G05). However, the farmer has to beadvised to grow the specific tree species in saline andwater logged areas, lor example, eucalyptus in waterlogged areas and eucalyptus, babul farash, terminaiiason saline soils like (hurries in Sindh), while shisham,albizzia, poplar etc on agriculture land with plenty ofirrigation water (Owino, 2005).
agriculture crops like jawar, sugarcane etc, while 40%farmers did not prefer the agriculture crops, but instead,only preferred to grow the Irees on their farm lands (Agusel al., 2002), About 1.9% fanners preferred rice andwheat in their farm lands and 0.8% preferred vegetableson their farm plantations (Figure 9).
DISCUSSION
Trees on farms are an important resource to supplementthe fragile annual crops economy and they can trap andrecycle nutrients at a different deeper level of the soil, Alan adequate and compatible density, they can helpcontrol water togging. Certain nitrogen fixing legume andother tree species can provide inexpensive supplies ofvaluable nitrogenous fertilizer via the incorporation or leaflitter in soil (Sangha et at., 2005). Another importantadvantage of trees on farmlands is supplementing farmeconomy without much of additional efforts and expenses(Khan 1989). Farmland planting of trees is tike fixeddeposit available In the rainy days or at the time of needor laiiure of crops due to natural calamities. Often, theunexpected expenditures such as weddings, lunerat orduring economic recessions can be met from the returnof farmland trees (Pakistan National ConservationStrategy, 1990). In view ot the economic and environ¬mental Importance of trees being grown by the farmerson their lands. It was felt very important to undertakeextensive tours of 257 farm plantations spread overvarious agro ecological zones of the Punjab.
Most of the agro-foresters were of the opinion that thetrees in their farms were helplul in more than one wayNot only that the trees readily provided fodder, fuel, smallUmber, shade, shelter and protection from hot and coldwinds, improved environment and biodiversity, but alsowere a very useful source to improve their socio¬economic condition through sale of wood, especiallywhen there were crop lailures due to natural calamities
Pattern,'spacing
The spacing in agro forestry design is very important forthe agro-foresters. Those who are more interested in thetrees, try to increase the number of trees by reducing thespace in between. Farmers who prefer agriculture cropstry to increase the spacing of trees to reduce their effectson the yield of the crops (Khan and Chaudhry 2007). Theresult of survey revealed that 58 FP (21.8%) preferredthe spacing of 10 feet apart, while majority of the farmers113 FP (44%) adopted the spacing of 5 feet apart.However, about 54 FP (21%) farmers preferred 10 feetrow to row distance and 6 feet tree to tree distance(10x6) (Samsuzzaman et al., 2002). A few larmers, thatis, about 13.2% preferred 15 feet apart to give moreemphasis on agriculture crops as this spacing allows freemovement of agricultural machinery (Figure 8).
Preference of the agriculture crops
The choice of the tree species also depended on thepreference ol the agriculture crop by the agro-farmers.The survey of farm plantations revealed that about 39%of the farmers preferred the wheat only in agroforestry inboth linear and compact designs of agroforestry and7.5% farmers also preferred the wheat along with other

646 Air. J. Environ. Sd, Technoi.
uo
m too .
3 so
o
Q.60§
IO «
X)
E »
z0
Wh«Mor4y Wh***other crops Wh«at«nd rre* only V«£4tsbU onN Ho acncufture
Type of crops
Figure 9. Preference ol the agriculture crop.
(Wu and Pretty, 2004). The sale ol wood was very handyto meet some emergent expenses on religious ceremonies,marriages of children or payment of schootfcollege fees.In fact, trees served as a hedge against all unforeseenemergencies (Strong and Jacobson. 2006), They furtherthought that if irees in any way were adverse to their wayof life, the farmers would never have planted trees ontheir land (Sofia, 1999).
According to some other surveys conducted by PunjabEconomic Research Institute (PERI, 1999). the number oftrees per acre was 17 and it was increasing, Thai is whyeven now, 90% of fuel wood requirements and 55%timber requirements are being met from the trees grownby the farmers on their land, though the potential is muchmore (Sheikh, 2000 ).
By and large, the rural population continues to be poor,eking out a living from a low morsels of grain and thrivingon Ihe milk From goats, sheep and camel. As such, waysand means have lo be delineated to improve their loLHowever, a natural disaster could ruin their agriculturalcrops dashing their hopes for a better future (PERI,1999).
There is an adverse propaganda by the agriculturedepartment that trees interfere with spraying ol agri-cropsand suppress yields. Also, there is lack of awareness ofthe problems, related with tree farmers and educationamongst farmers and the people who matter in decisionmaking. Lack ol adequate forest extension services andcontinuity of agroforestry programmes and sustainabilityresult to absence of marketing facilities for woodproduced under agroforeslry. Furthermore, too many rulesand regulations hinder inter provincial movement ofwood, for example, marketing of poplars wood grown in
the northern pari of the country, while the industry islocated in the south in different provinces (Sheikh, 2000).
NGOs, who always suggest not planting trees for fearof reduction In agricullure crop output, should ratherconvince the tree farmers that trees serve as a hedgeagainst calamites/emergenries such as floods, drought,heavy rains etc. When the agri-crops are destroyed dueto natural calamities, the farmers can sell the trees to tideover the difficult situations (Hafeez, 1998), A seriousdraw back in agriculture production is the fragmentationof farms into two or more separate holdings.Fragmentation is the result of social laws of inheritanceand acquisition through marriage. Also, it inhibits theefficiency ol Iaiming operations. Very often, the Iragmentsare far apart so that the movement of personnel, workanimals, agricultural equipment and even the Irrigationoperations becomes difficult (Schorr, 2004).
The most important criterion for the success ofagroforeslry program is the association and physical andmental involvement of the local population at various tiersot the community. They have to play a very fundamentalrole in identifying the needs which could be dovetailed intheir socioeconomics, land ownership and sustainable lifespectrum leading to much needed prosperity in the longrun (Franzel et al„ 2001).
ACKNOWLEDGEMENTS
The authors are grateful to their colleagues from thelorest department for providing help and assistance in thesurvey of the farm plantations and especially Mr. M. I.Sheikh, ex-chief conservator ot the forests, Punjab and

Rahim at al. 649
lor agroiorestty In (ho dry lands Annual Review or AgrolorosfrySconce and Innovation Planning Forum The Wort} Agra forestry
Corn* (1CRAF j Nairobi. 20 2bin September 2004. Nairobi: WorldAgio loiesiry Centre (tCRAF)
M Goran A, Gnahoua GM, Ouetou K. Dale P (2002) Evolution of mazeyietd after tree lallc* m a humid TOJDST rone of Cate d'Ivoire. Cahiorsd Eludes et de Retberches Francophones ApnctJtures (Francs) it
(2002) 00 MS 149Nissun TM Mrdmore DJ. Keefejf AG (2001) Biophysical and economy
tradeails ol tnrorcropping timber with lood crops in the PhJtppinouplands Agoc Sysl „ 67(2091 ): 49 60.
Noviana K. Jmht LS (2005). Lend tenure, agroknestry adoption, andreduction ol Hr* hazard In a forest ions: A case study from Lampung.Sumatra. Indonesia Agroforestry System (2005) 651-11 Spender2005 OOl lD.IOOTfel 1258'Q04 1413-2 World Aÿdorftsliy Centre.Souiheast Asi3 Regional Office H) Boi 161 Bogot II>0GIIndonesia
Otsirta K, Suyanto S. SonoCo T, Torrucft T (2001) 'Evotulw of LandTorture Institutions and Development o' Agrotorestry: Evidence tramCustomary Land Areas ol Sumatra." Agile Eton , 25: SSiOl
Owmo F (2005) Improving multipurpose tree and shrub speoes <«agroforestry systems j. Agrotnr SyM . Sponger Netherlands, 0i6?4366 (Pnnt) 1572-9660 (Ontmo)i9i!August. 1992 Thur, Sept 29.
farmer DG. Pakistan Forest Institute. Peshawar and mytwin brother Syed Muhammad A|mal Rahim Conservatorof Forests Sargodha.
REFERENCES
Ague F, Ginnngs AN. Van NcmrthvijA M (2Q02J Pilthan leknoogiagroforestry-konserYasi lanah untufc areal pertonian berbasis kopi dr
Sumbor Jays. Lampung Beni World Agrofor. Cenire-ICRAFSoutheast Asia Bogor. Indonesia, p 60
Ahmad J ( t996).Changing perspectives on loros: policy- IUCN p 12.Anon (1991). A guide to a global environment World FAQ Resources
p 383Anion (2000). Communities and toresTry mansgoment m South Asia
(SGCIFM) The repon by working group or community involvement inICKWT management.
Anon (1980) Pakistan census ol agriculture; province report PunjabAgncutiuroi census organilAlton, suuisucaJ division, gownmeni olPakistan.
Bug MB Shabbir A. Nowshad K (2008) Germ plasm Conservation olMultipurpose Trees and their Role m Agro'orostiy lor SustainedAgricultural Production m Pakistan, lot. J. Agnc. U>oi . 10. 2
Sorts JM (1999). Agro lorostry partlands m sub- Saharan Atnca Foodand Agncuti ire Organization of The Unnod Ninons. Rome
Botha J (2006) The motility ol conservation and social forestrynurseries in South Alnca. PhD Thesis. University at iheWitWHitarvand. Johannesburg. South Africa
Brown G (2001) Center Fw Forestry end Ecology Available byAlabama AiM University, School ol Agnaiiural and EnvironmentalSoences. Department ol Plant and Soil Sciencehnpj'/saes oamj.edu/ SPSfForostry.titna.
Cavtgtia J. Kahn J (2001). 'Ddlusion of Sustainable Agncufiuie in meBrazilian Tropical Ram Forest A Discrete Choice Analysis * EtonDev Cult Change. 45(2): 3tt 334
Craig 6. Wilkinson K (2004) tetragon Firing frees- A Brief IntroductionThe Over story is distributed by Agrolomslfy Net, Inc., P.Q. Bo* 42b.Hokiataa Hawaii 96725 USA
Oove MR (2003). Brtler shade throveng light on polities end ecology incontemporary Pakistan. Hum. Og . 62(3f 229 241
Ecoeomc Survey of Pakistan (2006-2007). Ministry oi FinanceEconomic Division. Islamabad
Fran;el S. Cooper P. Denning GL (2001) Scaling up the benelits olagio lotestiy research: lessons teamed and research challengesDev Pract., 11(4): 524-534.
Gebrehiwot K (2004). The development of dry land Agroforestry inEthiopia Paper presented at the tCRAF Dry land AgrolorestryWorkshop. 13 September 200*
GOP (2006 2007) Economic Survey ol Pakistan Min. FinanceEconomic Division. Islamabad.
Hale#! M (1998) Agro forestry senes volume l10 Vt. handbooksPunjab For. Res Inst. Faisalabad Pakistan
Hussain SS. Anhad MK. Shohaad AM (2003). Mountains of Pakistan;
Protection. Polcntfat and Prospects Islamabad: Global ChangeImpact Studies Centre. 133-232.
Jabtonski LM. Wang XZ. Gums PS (2002) Ptart reproduction underelevated CWcontkirons: a meia anaiysis el reports on 79 crop andmid spernes New PhytiH . 156 9 26
Kalinganire A. Weber X. Uwamanya A. Kooo B (2006). improving ruraltrvdihoods through domeslrcanon of indigenous fruit trees m ihr-Portlands ol the Sahel In Indigenous Fiwl Trees in the Tropics:
Domestication. UtlLtaierr and ComrnorcialuafjOn Wortl AgroIrmEryCentro Nairobi CABI Publishing. W.iJlingfotd. UK. p. 186-203.
(than MM (1989) Economic analysts oT agroforestry options for smallifnga'ud farms in Punjab. Proiesstonal paper m partial futUtment olthe requrtemehts lor the Degree ol Master nt Science Colorado StoleUniversity lad Calms. Colorado.
Khan GS. ChamSwy KA (2007). Effea of spacing and plan; density onthe growth ol poplar {Populws dWomAfs) frees under agto-loreslrysystem Pak. J. Ago. S*a., 44(2): 2007.
Krtniyi A. Nyadzi G. Oduol PA (2004) The Ngadi System as a plarioim
2005Pakisien Economic Survey (2004-2005). Ministry el Finance Eton
Onnsion. IslamabadPakistan National Conservation Strategy (1990). Ministry of Agriculture
OiMSJan. Islamabad.Pennnayak SK. Mercer D£. Sills E, Yang X (2003) Taking stock ol
agroforestry adoption studies Agrolor Sysl . 57) 173-186PERI (1999). Impact Evaluation Ftepod Farm plantation raised In
Punjab. Punjab Eton Res Inst (PERI) Gulberg. Lahore PakistanpfetTerfcbr.
Suyonio S. Rirki PP. Nowanu K. Lasman J (2006). Land tenure.agrolorestry Adoption, and reduction d Ike huard in a tornl zone: Acase study from Umpung. Sumatra. Indonesia World Agoforostiy
Cenlra. Southeast ASM RegienaJ Ottica. P O Bor 161. Bogut 16001.Indonesia; Agroforestry Systom (2005) 65:1-11 Sponger 2005 DOt10 l007rsl12584»4-1413-2
Samsuiiaman S. All MA. Momin MA. Kalum MR, Udd.n MM (2002)Tree-crop interacTxms as aitected by tree spacing and pruning
management m Banÿadesh Indian For . 128(1 1): 1231 1244.Sanchez PA. Bteesh RJ. Leaky RR0 (1997) Trees, soils and rood
security, phi Trans. R Soe London. Ser. 6 353 (1997). pc 949-961
Songha KK. Jaioui RK. Mtdmore DJ (2905) Impact ol tree clearing onsoil pH and hutiiem averiab44y m grtumg systems of centralQueensland. Australia Amir J. Soil R« Publication Data:01181)2005
Scherr SJ (2804). Domestic wood markets far sma> farm agroforestry mdeveloping countries World Agrolomiry Congress Compendium
Shamsi RA. ShaCkf B. Ashot BM (1994). Utitizatien or salt arretted andwater logged tods of Punjab through natural vegetation Finaltechnical report. (WASRI research project
Sheikh Ml (1999) Agro-forestry systems adopted >n Pakistan withparticular it-fomnco to the economics question ol land lonuie endother institutional Iacton Report prepared for FAQ. Bangkok, p. 104.
Sheikh Ml Bukhari AS. Khan AO (2808). Bosnime survey of Threeplantations viz Change Manga. Lai Sohanra end Kundien
pp. 152 Pb. For. Seder Dev. ProjectShflikn Mi (1993). Trees of Pakistan. Winrock Institute lor Agn. Dev.
GOPUSAfDShmwari ZK. Khan AA. Nnkflk* T (2003) Mecticinai and other mpodaiu
plants of Duthct Swat Eihnobotsny Project WWF-P. PeshawarSimons AJ. Leakey RRB (2004). Tree domesucaiion In tropical
agroforeslry. Agrotot. Sys 6i- t67-i8fSoi Simmy at Pakistan Report (2005) Sok Survey ol Pakistan Muhan
Road . Lahore. PakistanStrong N. Jacobson MG (2806) A case for consumer onven extension
programming agrotorostry adoption potential in Pennsylva'iiti Agmlowlry Sysl . 68: 43-52.
Pakisian National Conservation Strategy (2806) Government of

$50 Afr. J. Environ, Sd, Techrtol.
Pa&siarHEuiAD) (in coiiiitwaiion win lUCN- tho world conservaironunion), CIDA ana UMOP, 2M£
Tran G, Soiaka FK, Itfiidn F (2Ctn; Red-enishment at C. N, and P in adegraded Alfisol under humid UopicaJ conditions: effsci of fallowsecies and fitter polyphenols. Soil Sci., 1 &B: 61J 621.
Tony® J ibewrro B, Dugema E Hsvdu* ntaregemeni aoanled fafev on an awf soil in Cameroon- crop yields am organicmatter iractorts. Agrotor. Sys., 37: IB&-2JQ7.
Wu B. ftBily J (20041. Social cooneciadmss in marginal rural ChinaThe case of tenner innovation circles m yfhfttan, north Shaanxi. Agric.Hum, Values, 21:Bl-92.

African Journal of Agricultural Research
www.academicjoumals.org/ajar
ACCEPTANCE OF MANUSCRIFf
Accepted 9m November, 2010
Punjab Forest Department,Pakistan.
Email: rah i [email protected]
Re: AJAR-10-941 Rahim et at,
Dear Dr. Syed Muhammad Akmal Rahim,
I am pleased to accept your manuscript "Land suitability classification of choice ispecies in District Rahim Yar Khan, Punjab, Pakistan/' for publication in theJournal of Agricultural Research. It will be published in the November issue of the jIn due course, you will receive the proof of the manuscript from the editorialPiease review the proof carefully for accuracy and consistency.
Thank you for your support of the African Journal of Agricultural Research.
Congratulations!
i
Yours sincerely,
Prof. N.A. Amusa
Editor, African Journal of Agricultural ResearchE-mail: [email protected]
http:// www.academiciournals.ora/AJAR
Copyright © 2022 FDOKUMEN


![Complexitat i fenomen (socio)lingüístic [Complexity and (socio)linguistic phenomenon]](https://static.fdokumen.com/doc/165x107/63130623c32ab5e46f0c3b37/complexitat-i-fenomen-sociolingueistic-complexity-and-sociolinguistic-phenomenon.jpg)