Ethiopia: A socio-economic study
16
Journal of Business Management and Administration Vol. 1(5), pp.59-74, November, 2013 http://www.peakjournals.org/sub-journals-JBMA.html ISSN: 2329-2954 ©2013 Peak Journals Review Ethiopia: A socio-economic study Haradhan Kumar Mohajan Accepted 15 October, 2013 Ethiopia is considered to be one of the oldest nations in the world but at present its socio-economic condition is not satisfactory. It is the second most populous country in Sub-Saharan Africa. It is rated the poorest and most heavily indebted countries of the world, ranked last out of 208 countries. About 26% of the populations of the country, mostly women and rural residents, are living with their income less than one dollar a day. In terms of health and welfare, it ranks among Africa’s and the world’s poorest nations and the infant mortality rate is among the highest in the world. Political instability is another major problem of Ethiopia for the socio-economic development. In this paper, an attempt has been taken to discuss socio-economic circumstances of Ethiopia. Key words: Child marriage, food aid, food price inflation, political instability, poverty, food security. INTRODUCTION Ethiopia is one of the largest countries in Africa. It is a landlocked country, so that it has no sea port. It is the second most populous country in Sub-Saharan Africa next to Nigeria and the third on the continent and 14 th in the world. It is considered to be one of the oldest nations in the world. Archaeologists discovered a 3.5 million year old fossil skeleton in Ethiopia and they also believe that East Africa‟s Great Rift Valley is the site of humankind‟s origins (Ethiopian History, 2011). The Ministry of Health of Ethiopia expressed that the main causes of Ethiopia‟s poor health conditions are high poverty rate, low income levels, low education levels, poor access to health services, insufficient access to clean water, and insufficient healthcare facilities. The infant mortality rate is among the world‟s highest in Ethiopia, at 116 deaths/1000 live births and child mortality is 184 deaths/1000 (United Nation Development Project, UNDP, 2003). Life expectancy at birth was about 56.56 years in 2012 (59.21 years for females, 53.99 years for males). About 20% of poor rural households are female-headed (African Development Bank, AfDB, 2003). Child labor is a common situation in Ethiopia (Table 1). In rural areas, parents with low economic status arrange for their children, as young as 8 years of age, to work for others on a contract basis. Ethiopia receives more food aid than any other country in the world, but it remains the poorest country and the aid does not improve the country. Food insecurity is the single greatest barrier to sustainable development in Ethiopia, which affects up to 5 million people annually and many Ethiopians depend on food aid from abroad. Since the early 1970s, Ethiopia has suffered extreme economic and political chaos. Catastrophic droughts and famines, protracted and devastating civil war are common in Ethiopia. During the intensified civil war in the late 1980s and early 1990s, many people left their villages and migrated to urban areas or other unaffected areas. Prior to 1974, the country was ruled by a traditional monarchy, infamous for its land-tenure policies. COUNTRY BRIEFING Federal Democratic Republic of Ethiopia is one of the largest countries in Africa. Its Legislature is Federal Parliamentary Assembly, which consists of two chambers: (i) The House of Federation (Upper Chamber), (ii) The House of Peoples‟ Representatives (Lower Chamber). Its capital city is Addis Ababa, which is also the greatest city of the country, the country‟s commercial, manufacturing, and cultural center. Its area is 1,127,127 Faculty of Business Studies, Premier University, Chittagong, Bangladesh. E-mail: [email protected]
-
Upload
premieruniversity -
Category
Documents
-
view
0 -
download
0
Transcript of Ethiopia: A socio-economic study

Journal of Business Management and Administration Vol. 1(5), pp.59-74, November, 2013 http://www.peakjournals.org/sub-journals-JBMA.html ISSN: 2329-2954 ©2013 Peak Journals
Review
Ethiopia: A socio-economic study
Haradhan Kumar Mohajan
Accepted 15 October, 2013
Ethiopia is considered to be one of the oldest nations in the world but at present its socio-economic condition is not satisfactory. It is the second most populous country in Sub-Saharan Africa. It is rated the poorest and most heavily indebted countries of the world, ranked last out of 208 countries. About 26% of the populations of the country, mostly women and rural residents, are living with their income less than one dollar a day. In terms of health and welfare, it ranks among Africa’s and the world’s poorest nations and the infant mortality rate is among the highest in the world. Political instability is another major problem of Ethiopia for the socio-economic development. In this paper, an attempt has been taken to discuss socio-economic circumstances of Ethiopia. Key words: Child marriage, food aid, food price inflation, political instability, poverty, food security. INTRODUCTION Ethiopia is one of the largest countries in Africa. It is a landlocked country, so that it has no sea port. It is the second most populous country in Sub-Saharan Africa next to Nigeria and the third on the continent and 14
th in
the world. It is considered to be one of the oldest nations in the world. Archaeologists discovered a 3.5 million year old fossil skeleton in Ethiopia and they also believe that East Africa‟s Great Rift Valley is the site of humankind‟s origins (Ethiopian History, 2011).
The Ministry of Health of Ethiopia expressed that the main causes of Ethiopia‟s poor health conditions are high poverty rate, low income levels, low education levels, poor access to health services, insufficient access to clean water, and insufficient healthcare facilities. The infant mortality rate is among the world‟s highest in Ethiopia, at 116 deaths/1000 live births and child mortality is 184 deaths/1000 (United Nation Development Project, UNDP, 2003). Life expectancy at birth was about 56.56 years in 2012 (59.21 years for females, 53.99 years for males). About 20% of poor rural households are female-headed (African Development Bank, AfDB, 2003). Child labor is a common situation in Ethiopia (Table 1). In rural areas, parents with low economic status arrange for their children, as young as 8 years of age, to work for others on a contract basis.
Ethiopia receives more food aid than any other country
in the world, but it remains the poorest country and the aid does not improve the country. Food insecurity is the single greatest barrier to sustainable development in Ethiopia, which affects up to 5 million people annually and many Ethiopians depend on food aid from abroad. Since the early 1970s, Ethiopia has suffered extreme economic and political chaos. Catastrophic droughts and famines, protracted and devastating civil war are common in Ethiopia. During the intensified civil war in the late 1980s and early 1990s, many people left their villages and migrated to urban areas or other unaffected areas. Prior to 1974, the country was ruled by a traditional monarchy, infamous for its land-tenure policies. COUNTRY BRIEFING Federal Democratic Republic of Ethiopia is one of the largest countries in Africa. Its Legislature is Federal Parliamentary Assembly, which consists of two chambers: (i) The House of Federation (Upper Chamber), (ii) The House of Peoples‟ Representatives (Lower Chamber). Its capital city is Addis Ababa, which is also the greatest city of the country, the country‟s commercial, manufacturing, and cultural center. Its area is 1,127,127
Faculty of Business Studies, Premier University, Chittagong, Bangladesh. E-mail: [email protected]
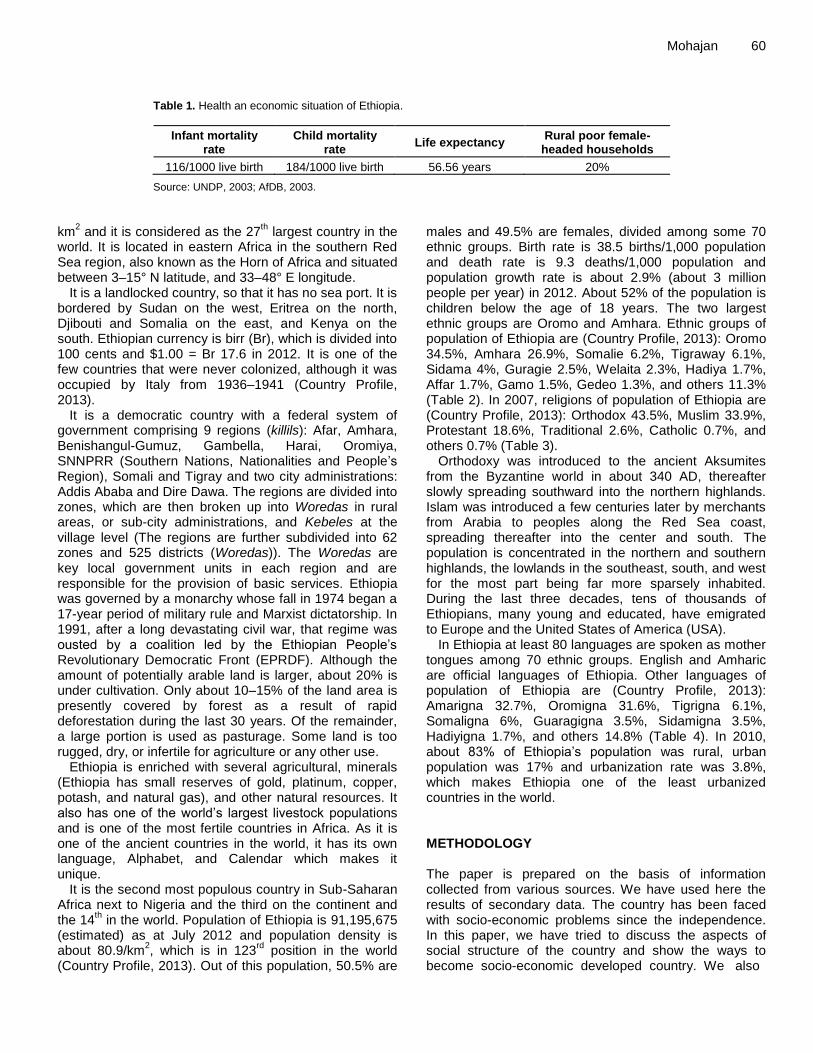
Mohajan 60
Table 1. Health an economic situation of Ethiopia.
Infant mortality rate
Child mortality rate
Life expectancy Rural poor female-
headed households
116/1000 live birth 184/1000 live birth 56.56 years 20%
Source: UNDP, 2003; AfDB, 2003. km
2 and it is considered as the 27
th largest country in the
world. It is located in eastern Africa in the southern Red Sea region, also known as the Horn of Africa and situated between 3–15° N latitude, and 33–48° E longitude.
It is a landlocked country, so that it has no sea port. It is bordered by Sudan on the west, Eritrea on the north, Djibouti and Somalia on the east, and Kenya on the south. Ethiopian currency is birr (Br), which is divided into 100 cents and $1.00 = Br 17.6 in 2012. It is one of the few countries that were never colonized, although it was occupied by Italy from 1936–1941 (Country Profile, 2013).
It is a democratic country with a federal system of government comprising 9 regions (killils): Afar, Amhara, Benishangul-Gumuz, Gambella, Harai, Oromiya, SNNPRR (Southern Nations, Nationalities and People‟s Region), Somali and Tigray and two city administrations: Addis Ababa and Dire Dawa. The regions are divided into zones, which are then broken up into Woredas in rural areas, or sub-city administrations, and Kebeles at the village level (The regions are further subdivided into 62 zones and 525 districts (Woredas)). The Woredas are key local government units in each region and are responsible for the provision of basic services. Ethiopia was governed by a monarchy whose fall in 1974 began a 17-year period of military rule and Marxist dictatorship. In 1991, after a long devastating civil war, that regime was ousted by a coalition led by the Ethiopian People‟s Revolutionary Democratic Front (EPRDF). Although the amount of potentially arable land is larger, about 20% is under cultivation. Only about 10–15% of the land area is presently covered by forest as a result of rapid deforestation during the last 30 years. Of the remainder, a large portion is used as pasturage. Some land is too rugged, dry, or infertile for agriculture or any other use.
Ethiopia is enriched with several agricultural, minerals (Ethiopia has small reserves of gold, platinum, copper, potash, and natural gas), and other natural resources. It also has one of the world‟s largest livestock populations and is one of the most fertile countries in Africa. As it is one of the ancient countries in the world, it has its own language, Alphabet, and Calendar which makes it unique.
It is the second most populous country in Sub-Saharan Africa next to Nigeria and the third on the continent and the 14
th in the world. Population of Ethiopia is 91,195,675
(estimated) as at July 2012 and population density is about 80.9/km
2, which is in 123
rd position in the world
(Country Profile, 2013). Out of this population, 50.5% are
males and 49.5% are females, divided among some 70 ethnic groups. Birth rate is 38.5 births/1,000 population and death rate is 9.3 deaths/1,000 population and population growth rate is about 2.9% (about 3 million people per year) in 2012. About 52% of the population is children below the age of 18 years. The two largest ethnic groups are Oromo and Amhara. Ethnic groups of population of Ethiopia are (Country Profile, 2013): Oromo 34.5%, Amhara 26.9%, Somalie 6.2%, Tigraway 6.1%, Sidama 4%, Guragie 2.5%, Welaita 2.3%, Hadiya 1.7%, Affar 1.7%, Gamo 1.5%, Gedeo 1.3%, and others 11.3% (Table 2). In 2007, religions of population of Ethiopia are (Country Profile, 2013): Orthodox 43.5%, Muslim 33.9%, Protestant 18.6%, Traditional 2.6%, Catholic 0.7%, and others 0.7% (Table 3).
Orthodoxy was introduced to the ancient Aksumites from the Byzantine world in about 340 AD, thereafter slowly spreading southward into the northern highlands. Islam was introduced a few centuries later by merchants from Arabia to peoples along the Red Sea coast, spreading thereafter into the center and south. The population is concentrated in the northern and southern highlands, the lowlands in the southeast, south, and west for the most part being far more sparsely inhabited. During the last three decades, tens of thousands of Ethiopians, many young and educated, have emigrated to Europe and the United States of America (USA).
In Ethiopia at least 80 languages are spoken as mother tongues among 70 ethnic groups. English and Amharic are official languages of Ethiopia. Other languages of population of Ethiopia are (Country Profile, 2013): Amarigna 32.7%, Oromigna 31.6%, Tigrigna 6.1%, Somaligna 6%, Guaragigna 3.5%, Sidamigna 3.5%, Hadiyigna 1.7%, and others 14.8% (Table 4). In 2010, about 83% of Ethiopia‟s population was rural, urban population was 17% and urbanization rate was 3.8%, which makes Ethiopia one of the least urbanized countries in the world. METHODOLOGY The paper is prepared on the basis of information collected from various sources. We have used here the results of secondary data. The country has been faced with socio-economic problems since the independence. In this paper, we have tried to discuss the aspects of social structure of the country and show the ways to become socio-economic developed country. We also

Table 2. Ethnic groups of population of Ethiopia.
Ethnic groups In percent (%)
Oromo 34.5
Amhara 26.9
Somalie 6.2
Tigraway 6.1
Sidama 4
Guragie 2.5
Welaita 2.3
Hadiya 1.7
Affar 1.7
Gam 1.5
Gedeo 1.3
others 11.3
Source: Country Profile, 2013.
Table 3. Religions of population of Ethiopia.
Religions Populations (%)
Orthodox 43.5
Muslim 33.9
Protestant 18.6
Traditional 2.6
Catholic 0.7
others 0.7
Source: Country Profile, 2013.
Table 4. Languages of populations of Ethiopia.
Languages Populations (%)
Amarigna 32.7
Oromigna 31.6
Tigrigna 6.1
Somaligna 6
Guaragigna 3.5
Sidamigna 3.5
Hadiyigna 1.7
others 14.8
Source: Country Profile, 2013.
stressed on the recent results of the various studies. HISTORY OF ETHIOPIA Ethiopia is considered to be one of the oldest nations in the world. Archaeologists discovered a 3.5 million year old fossil skeleton in Ethiopia and they also believe that
J. Bus. Manage. Adm. 61 East Africa‟s Great Rift Valley is the site of humankind‟s origins (Ethiopian History, 2011). Lucy, one of the oldest human fossils to be found, was discovered in Ethiopia. During the 1
st millennium BC, Semitic people from Saba
(Hebrew Sheba) crossed the Red Sea and conquered the Hamite on the coast of what was eventually to become the Ethiopian Empire. The powerful Kingdom of Axum emerging in the fourth century BC to control its height an area that covers present northern Ethiopia, Eritrea, and Yemen and stretches into parts of northern Sudan and Southern Saudi Arabia.
After some civilizations passed through northern Ethiopia the first Ethiopian Empire was established around 1270 by the Salomonic Dynasty (so called because the kings claimed direct descent from the biblical king Solomon and the queen of Sheba). Axum converted to Christianity, belonging to the same tradition as the Coptic Christians of Egypt. Early in the 10
th
century, the Solomonid Dynasty was overthrown and replaced by the Zagwe Dynasty, the ruling family of a region on the central plateau known as Lasta. Warriors from the Islamic state of Adal with their Leader Gragn Ahmed invaded Ethiopia beginning about 1527 but Ethiopians defeated the Muslims in 1543. Menelik II (1844–1913) was emperor of Ethiopia between 1889 and 1913. He founded Addis Ababa as the capital city in 1889. The defeat of Haile Selassie I in 1974 was followed by a socialist military dictatorship under Mengistu Haile Mariam (known as Derg). In March 1975, the monarchy was abolished, and Ethiopia became a republic which is a new era of political openness. The invasion from Somalia in 1977 was followed by an extended civil war. Between 1977 and 1978 an estimated 100,000 people suspected of being enemies of the government were killed or disappeared in the name of the Red Terror. Mengistu created the Worker‟s Party of Ethiopia (WPE) in 1984 as Ethiopia‟s official Marxist-Leninist party and prepared a new constitution to make Ethiopia a Marxist-Leninist people‟s republic. In 1987, the new constitution was proclaimed and the People‟s Democratic Republic of Ethiopia declared, modeled after the Soviet system of government and the new assembly elected Mengistu as civilian president of Ethiopia. In the late 1980s, Ethiopia lost the support of the Soviet Union, which frustrated political and economic development of Mengistu government. In May 1991, the Eritrean People‟s Liberation Front (EPLF) took complete control of Eritrea, and the Ethiopian People‟s Revolutionary Democratic Front (EPRDF) took control of Addis Ababa and Mengistu escaped in Zimbabwe. After a referendum in 1993, Eritrea declared its independence and became independent state from Ethiopia in the same year. In June 1994, the EPRDF won 484 out of 547 seats in a democratic Constituent Assembly. In August 1995, the country was renamed the Federal Democratic Republic of Ethiopia and Meles Zenawi became prime minister of Ethiopia.
In mid-1998, quarrel broke out between Ethiopia and Eritrea along the countries‟ border, with each side accusing the other of seizing territory. The border had not been precisely marked out when Eritrea became independent from Ethiopia in 1993. By early 1999, hundreds of thousands of troops had been sent to the border by the both countries and the dispute created a cruel war. Tens of thousands of soldiers died in the fighting before a cease-fire was declared in 2000 under the auspices of the United Nations (UN) and established the Eritrea-Ethiopia Boundary Commission (EEBC) to delimit and demarcate the border. In April 2002, the EEBC issued its determination and declared that the symbolically important town of Bodme was on the Eritrean side of the boarder. Drought, famine, war and ill-conceived policies brought millions to the verge of starvation in the 1970s and 1980s in Ethiopia. EDUCATION IN ETHIOPIA In Ethiopia, the Federal Ministry of Education is responsible for setting and maintaining national education standards and policies. It can change the broad educational planning and programming for the development of the education system. It can also determine curriculum for secondary and higher education, establish higher educational institutions, and provide technical assistance for regions (Ministry of Education, 2002). Progress in education in Ethiopia has coincided with substantial reductions in poverty and improvements in food security, health and nutrition.
Ethiopia has a 1,700-year tradition of elite education linked to the Orthodox Church, followed by Quoranic schools in the 17
th century. In Ethiopia, modern education
officially started in 1908 with the opening of Menelik II School in Addis Ababa. The secular higher education was initiated in 1950 with the founding of the University College of Addis Ababa.
Since Ethiopia emerged from 17 years of civil war in 1991, access to education became an essential part to improve the economic development significantly. The Ethiopian government, in partnership with donors, has invested heavily in improving access to education. In Ethiopia, stress in mother tongue is put in education which is one of the best policies on the African continent (Heugh et al., 2007). The attempts taken by the Ethiopian government to increase the educated people in the country to alleviate poverty are as follows: 1. Abolishing school fees. 2. School feeding programmes. 3. Alternative basic education for out-of-school children in remote areas and adult literacy programmes. 4. Increasing expenditure on school construction and maintenance. 5. Hiring and training thousands of new teachers, are of
Mohajan 62 administrators and officials. The government of Ethiopia has launched an Education Sector Development Programme (ESDP) for academic years 2002–2003 through 2004–2005, commonly referred to as ESDP-II and has boosted its financial effort on behalf of education. Education expenditure has also increased as a proportion of the overall government budget from 9.5 to 16.8% and higher education budget has risen from 14.9 to 23% from 2001–2002 to 2002–2003 respectively. Education expenditures were 5.5% of GDP in 2007.
The enrolment of girls in education in Ethiopia is low compared to boys. This is mainly affected by the insecurity, cultural beliefs, sexual harassment by male classmates and teachers. Also in rural areas, they travel long distance from home to schools, which make them vulnerable to rape, early pregnancy and sexually transmitted diseases. On the other hand, the number of schools, teachers and school facilities between rural and urban areas and between regions are not equitably distributed (Shiferaw, 2003). Primary and secondary education system Education is free from primary through university level and is compulsory on the primary level for students between the ages of 7 and 13. Primary schools are scattered throughout the country, but secondary facilities are found only in larger urban areas. As a result, enrollments decline drastically from the primary to the secondary level, and secondary facilities are severely overtaxed. Primary education, grades 1–6, begins at 7 years of age; secondary education, grades 7–12, at 15. After completing tenth grade, students are separated into university-bound candidates, who receive concentrated academic instruction, and those who receive commercial, polytechnic, teacher, or other professional training. Only 47% (52.9% of boys, 42% of girls) of children in the appropriate age-group attended primary school in 2006 and 55.2% (57.2% of boys, 53.2% of girls) in 2009. Only 13% of children in the appropriate age-group attended (15% of boys, 10% of girls) at the secondary level. In 2003, adult literacy rate was around 42.7% (male 50.3%, female 35.1%).
In 1992, about 80% primary school-age children were out of school. About 3 million students were in primary school in 1994–1995, but in 2008–2009, primary enrolment had risen to 15.5 million, which is an increase of over 500% and secondary school enrolment also grew from 400,000 to 2 million. In 1994–1995, the gross enrolment ratio (GER) was 31.7% for girls and for boys 20.4%. In 2008–2009, GER become 90.7% for girls and 96.7% for boys. Education outcomes have improved rapidly in all regions, but Afar and Somali, remain far behind the rest of the country, with net enrolment ratios
24.4 and 31.6%, respectively. Student enrolment has increased between at all levels from 1994–1995 to 2004–2005 as follows: 1. Primary level (grades 1–8) which increased from 3 million to 11.4 million. 2. Secondary level (grades 9–12) which jumped from 400,000 to 953,212. 3. Technical, Vocational Education and Training (TVET) institutions which increased from 3,000 to 106,305. Technical and vocational education and training (TVET) Technical and vocational education and training (TVET) plays a vital role in producing and meeting the demand for middle level skill of the different industries in the country. During the last three decades, half a dozen specialized technical colleges were established. About 60% of formal TVET is provided in the form of regular programmes and the rest 40% in evening programmes. Enrolment figures in formal TVET programmes show a fair gender balance with 51% female students and 49% males. Some vocational training programs like dressmaking, hairdressing, and cookery are associated with girls and women.
The aims of the national TVET strategy are to create and further develop a comprehensive, integrated, outcome based and decentralized TVET system for Ethiopia, strengthen working organizations in view of making TVET institutions centers for technology transfer, to create a coherent framework for all actors and stakeholders in the TVET system, to establish and capacitate the necessary institutional set-up to manage and implement TVET in Ethiopia and to ensure a quality management system (QMS), to improve the quality of TVET (formal and non-formal) at all levels and make it responsive to the needs of the labor market, to facilitate the expansion of relevant TVET offers in Ethiopia which are crucial to national development, to strengthen the private training market and encourage enterprises to participate in the TVET system, to empower women and rural people through skills development, to ensure equal access of women and people with special needs to TVET, to strengthen the culture of self-employment and support innovation in the Ethiopian economy, in particular in the emerging regions, to develop a sustainable financing system for TVET with efficient and cost-effective delivery systems and management structures, and to build the necessary human capacities to effectively manage and implement TVET (Killian et al., 2009).
The number of trainees attending TVET programs increased from 353,420 in 2009–2010 to 799,548 in 2010–2011. Of the total trainees in TVET, 214,897 were trained in government institutions and the rest by NGOs
J. Bus. Manage. Adm. 63 (non-government organizations). Higher education At present, Ethiopia has 32 public universities. The public universities are also made to admit students in line with the 70:30 strategies between science and technology on one hand and social science on the other. During 2010–2011, a total number of 75,348 undergraduate students graduated at national level and 6,250 students graduated at post graduate level. Education facilities for disabilities Children with disabilities are amongst the most marginalized groups in Ethiopia and they are generally excluded from educational services. These disable children cannot mix with the normal children. Men do not marry such girls; however, some men may take them as lovers or concubines when their wives are infertile. In urban areas, there are some schools for disable children. In these schools, there is a shortage of braille materials for the blind students. There is an association of blind persons in Bahir Dar, where the regional government provides blind children with a stipend of Birr 240 per month and Birr 380 per year for clothing but there is no support for feeding. The government of Ethiopia should take attempts to educate all the disable children (Mekonnen and Feye, 2010). Major difficulties in Ethiopian education Major problems of the education sector in Ethiopia are as follows (Shiferaw, 2003): 1. Low budget allocation. 2. Low quality of education. 3. Low enrolment at all levels compared with the school age children. 4. Gender and regional disparity in enrolment. 5. Lack of awareness on gender equality. 6. Higher student teacher ratio. 7. Demand for child labor both in rural and urban areas is a major barrier for children‟s access to school and drop out. 8. Absence of required number of textbooks. 9. Inadequate number of qualified teachers at all levels. Dropout from rural schools starts in grade 5 (ages 12 and above) and is more prominent among boys than girls. Some of the reasons of dropout of school are as follows (Mekonnen and Feye, 2010): 1. Lack of financial support to continue education.

Mohajan 64
Table 5. Sanitation facilities in Ethiopia.
Sanitation Improved (%) Unimproved (%)
Urban population 29 7.1
Rural population 8 92
Total population 12 88
2. Lack of support to attend high school which is located more than 10 km away. 3. When they find it difficult to cope up with studies. 4. Some due to addictions to chat and need for money. 5. Peer pressure when children reach age of teenage years. 6. Some parents encourage their children to go overseas so that they can send remittances home. HEALTH AND NUTRITION IN ETHIOPIA In terms of health and welfare, Ethiopia ranks among Africa‟s and the world‟s poorest nations. Health indicators are generally poor and the health care system is wholly inadequate. In 2009, health expenditure was 3.6% of GDP. The infant mortality rate is among the world‟s highest in Ethiopia, at 116 deaths/1000 live births and child mortality is 184 deaths/1000 (United Nation Development Project, UNDP, 2003). In 2012, this rate is reduced to 60.9 deaths/1,000 live births (male: 69.5 deaths/1,000 live births and female: 52 deaths/1,000 live births), (Country Profile, 2013).
Life expectancy at birth was about 56.56 years in 2012 (59.21 years for females, 53.99 years for males). About 20% of poor rural households are female-headed (African Development Bank, AfDB, 2003). For the years 2000–2005, the average number of children per woman was estimated at 6.1. In 2012, this rate was reduced to 5.39 children born/woman. Beginning of 2002, the Ethiopian government had adopted a development strategy called “Sustainable Development and Poverty Reduction Program (SDPRP)” centered on the principal goal of reducing poverty in the country. The aims of SDPRP are to progress toward universal primary education, to improve the quality of teaching and learning achievements to the whole system, and to produce a trained workforce that is responsive, in quantity and skills mix, to the demands of the country‟s modernizing economy.
The Ministry of Health of Ethiopia expressed that the main causes of Ethiopia‟s poor health conditions are high poverty rate, low income levels, low education levels, poor access to health services, insufficient access to clean water, and insufficient healthcare facilities. The shortage of health care professionals is also a major problem in Ethiopia, which causes doctors and nurses to be overworked and to become exhausted, ultimately
creating more problems. Health care providers become unsympathetic, unethical, mismanaged, and disinterested when overwhelmed (Dejene, 2003). Children under the age of 5 years underweight were 34.6% in 2005. Physician density was 0.022 physicians/1000 population in 2007. Hospital bed density was 0.18 beds/1,000 population in 2008.
More than 94% of Ethiopian births take place at home because most women live in remote areas where they are unable to research a health facility in time to deliver. About 61% of these births are delivered with the assistance of a relative or some other untrained person, and 5% are delivered with no assistance. One in 14 Ethiopian women face the risk of death during pregnancy and delivery; one in every 13 Ethiopian children dies before his or her first birthday, and one in 8 dies before age five (Surafel, 2012). In 2010, maternal mortality rate was 350 deaths/100,000 live births.
Most of the households (64%) use unclean water. There is a large variation among rural and urban households with only 25% of rural households having access to clean water against to more than 90% of urban households. Access to sanitation facilities in the form of pit latrines is limited to 28% of households; and the vast majorities (68%) do not have access to any kind of toilet facility. Among rural households, more than 78% do not have any toilet facility, and only 20% have pit latrines. About 77% of rural families still need to travel more than 20 km to get to a hospital (Tefferi and Endeshaw, 2006).
Sanitation facilities in Ethiopia are very poor. Most of the people are deprived from modern sanitation facilities; as a result they suffer from various contagious diseases. The rural people have low facility of sanitation than that of urban. The facilities are given in Table 5 (Country Profile, 2013):
Chronic malnutrition can affect children for life, stunting the growth, brain development and immune systems, which leave the victims vulnerable to a host of illnesses. Local and international aid and health workers estimated that 10 to 20% children of the country are malnourished and 15% is considered a critical situation. Development in health sector of Ethiopia In 2010–2011 fiscal year, a total of 34,382 health extension workers were deployed in rural areas. About 1,278 health extension workers were trained and

J. Bus. Manage. Adm. 65
Table 6. HIV/AIDS infected people in Ethiopia.
Ethiopia 2001 2002 2003 2004 2005 2006 2007 2008 2009 2010
HIV infected people (m) 3 3 2.1 1.5 1.5 1.5 1.5 1.5 0.98 0.98
Table 7. HIV/AIDS infected death in Ethiopia.
Ethiopia 1999 2001 2003 2007
HIV infected deaths 280,000 160,000 120,000 67,000
deployed as gap fillers and 1,322 prospective heath extension workers were undertaking a training program. The number of urban health extension workers increased to 3,916 in 2010–2011 from 3,401 in 2009–2010. More than 3,299 health centers are necessary to provide basic health service to Ethiopian but it has 2,660 at the end of 2010–2011.
Family planning training was provided to 27,744 health extension workers, and 2,336 health extension supervisors to strengthen the services up to 2011. The Demographic and Health Survey (DHS) of 2011 revealed that the contraceptive prevalence rate has reached 29%. Ante natal service coverage to 53% and the service was provided in 2011 to 2,404,279 mothers leading to an achievement 82.2% in 2014. Post natal service coverage to 42.1% in 2010–2011 by providing the service to 1,231,099 delivering mothers. Deliveries attended by skilled health personnel increased from 15.7% in 2009–2010 to 16.6% in 2010–2011.
Antiretroviral therapy coverage among people with advanced HIV infection are: about 3% in 2004, 13% in 2006, 33% in 2008 and 45% in 2009. HIV-infected pregnant women who received antiretroviral drugs to reduce the risk for mother-to-child transmission are: 5% in 2004, 10% in 2006 and 40% in 2009. HIV infection in Ethiopia The rate of HIV/AIDS infection is decreasing due to public consciousness; various steps are taken by the government and non-government organizations (NGOs). In 2001, about 3 million people were HIV/AIDS infected but in 2010, this figure become 0.98 million. The HIV/AIDS infected people in Ethiopia are given in Table 6. In Ethiopia, the death of HIV/AIDS infected people is decreasing due to social consciousness and use of antiretroviral therapy. The death tally of HIV/AIDS infected people from 1999 to 2007 are given in the Table 7.
In 2003 alone, there were an estimated 197,000 new human immunodeficiency virus (HIV) infections, 98,000 new acquired immune deficiency syndrome (AIDS) cases
and 90,000 deaths due to HIV/AIDS in Ethiopia. There were a total of 128,000 HIV-positive pregnancies and an estimated 35,000 HIV-positive births. A total of 4.6 million children under 17 years are orphan and vulnerable children (OVC), of which 537,000 were orphaned due to AIDS. Among children aged 0–14 years, there were 35,000 new HIV infections, 25,000 new AIDS cases and 25,000 deaths (Figure 1). The HIV prevalence in 2003 was higher among women (5%) than men (3.8%) and higher in the urban (12.6%) than the rural population (2.6%).
The highest HIV prevalence rate is 8.6% for the age range of 15–24 years, and 8.1% for the age group 25–34, and 6.3% for the age group 35–49 years. It is believed that heterosexual and mother-to-child transmission account for almost all HIV infections in the country. The spread of prostitution including child prostitution in urban areas is also a contributing factor to the spread of HIV/AIDS. On the other hand, HIV prevalence rate is gradually rising in rural areas due to high rates of mobility, displacement, and the prevalence of harmful traditional practices (Tefferi and Endeshaw, 2006).
According to a school of HIV/AIDS coordinator in Amhara, occurrence of HIV/AIDS among the general public and students are as follows (Mekonnen and Feye, 2010): 1. Migrant women exposed to sexual violence or sexual favors in town. 2. Early marriage of young girls to an elderly man with multiple sexual partners. 3. Rich rural men having concubines in town (multiple partners). 4. Expansion of sex video/movie rental houses. 5. Married urban men in town having concubines in addition to wives. 6. Expansion of chat and shisha houses where unprotected sex is practiced. 7. Expansion of night clubs in towns. 8. Expanding level of commercial sex. 9. Early onset of sex among the general public, usually unprotected. 10. Due to misconception on HIV/AIDS small children

Mohajan 66
0
100,000
200,000
300,000
400,000
500,000
600,000
HIV AIDS Deaths
New infacted people
Orhan children
New infected children
Figure 1. HIV/AIDS situation in Ethiopia in 2003. Source: Prepared by the author.
(age 5) attending evening classes are raped; because they supposed to be free from HIV virus. 11. School location in wooded and isolated area and lack of fence as in Del Chebo school, revenge by persons living with HIV/AIDS and deliberate acts of contaminating others. 12. Child trafficking and gender based violence among children. AGRICULTURE IN ETHIOPIA In Ethiopia, agriculture is the main source of income but the sector is not well developed. Hence the development of the Ethiopian economy heavily depends upon the speed with which agricultural growth is achieved. Smallholders cultivate over 96% of the total agricultural land of the country. In 2009, about 43% of the gross domestic product (GDP), 60% of exports, and 85% of total employment was generated from this sector (Central Intelligence Agency, CIA, 2009). The backward in agriculture is because of insufficient market information, poor quality, unstable price, lack of trust among trading partners, and uncoordinated markets. Ethiopia is landlocked and mountainous, and many agricultural production areas are remote, resulting in high transport costs.
Four major farming systems for Ethiopia are, seed-farming, enset-planting, shifting cultivation, and pastoral complexes (Westphal, 1975). Total crop production in 2010–2011 estimated to 221.8 million quintals; that is, 17.34 quintals/hectare which exceeds the production level of 2009–2010 of 202.46 million quintals. Ethiopian government planned to neutralize 6,170 hectares of land with acidic soil by treating it with lime, but only 1,470 hectares of land was neutralized due to shortage of time. About 818,050 tons (86% of expected) of fertilizer and 1,028,400 tons (50% of expected) improved seed have
been distributed and 3,034,000 of hectares of land were covered with organic manure in 2010–2011. It has taken steps to improve livestock production and productivity and produces 438,337 cross-bred cattle and 157,801 cross-bred milk cows (Figure 2). It produces and applied 114.4 million doses of vaccines on cattle to increase the production of livestock (Federal Democratic Republic of Ethiopia, 2012).
The government of Ethiopia owns all the land. Smallholders produce more than 90% of the total agricultural output and cultivate close to 95% of total cropped land. The government takes policy on commercialization of both on small and large farms. About 13 million farmers are smallholder but they combine to produce 95% of the country‟s agricultural gross domestic product (GDP). It is estimated that between 2000 and 2008, about 80% of new agricultural land was converted from forests, woodlands or shrub lands.
In Ethiopia, agriculture directly supports about 80% of the population in terms of employment and livelihood, contributes more than 40% of the country‟s GDP, generates about 90% of the export earnings, and supplies around 75% of the raw material requirement of agrobased domestic industries (Ministry of Finance and Economic Development, MOFED, 2010). The increased production of flowers, oilseeds, vegetables, and fruits and livestock, cereal production contributes more than 60% to agricultural GDP (Mulat et al., 2007). About 8% of workers are employed in industry, and the remaining 12% are occupied in government and services.
In Ethiopia, most agricultural production takes place in the Dega and Weyna Dega zones, where land productivity has traditionally coincided with the densest rural populations. Most of the producers in these zones are smallholders, who have on average less than a hectare of land per household. The most important field crops grown in Ethiopia are maize, teff, wheat, and

J. Bus. Manage. Adm. 67
0
200,000
400,000
600,000
800,000
1,000,000
1,200,000
Crop(000Q) Fertilizer (tons) Seed (tons) Cattle (cross
bred)
Cow (cross
bred)
Figure 2. Situation of agriculture of Ethiopia in 2013. Source: Prepared by the author.
sorghum, while coffee is the major agricultural export crop. Next to coffee, Enset (false banana), spices, Chat, root crops, fruits and vegetables were grown by the majority of farmers.
Teff is the preferred staple food in much of the highlands. It can be grown under a wide variety of agro-climatic conditions, such as elevations from zero to 2,800 m above sea level, under a similarly wide variety of moisture, temperature, and soil conditions. Its optimal growing conditions coincide with its traditional production areas: 1,800–2,100 m above sea level, average annual rainfall of 750–1,000 mm, and average annual temperature of 10–27°C. Maize is becoming more widely grown throughout Ethiopia, but it is less tolerant of cold than teff, barley, and wheat. It accounts for the largest share of production by volume at 18.8%. It has a shallow root system, making moisture availability in upper soil strata important and requires an annual rainfall of 800–1,500 mm. More than 60% of maize production comes from the Oromia region, followed by Amhara with about 20% of total production. In addition to food grain, maize residues are also used as fodder, fencing materials, and cooking fuel. Sorghum cultivated about 17% of all area planted with cereals and for about 18% of production. Relative to other cereals, it has good tolerance for both drought and is also tolerant of excess water conditions but it is sensitive to cold temperatures and is rarely found at higher altitudes. Wheat accounts for similar shares of national cereal production as sorghum with 17% of planted area and 19% of production. Ethiopian wheat produces at 1,600–3,200 m above sea level, with average annual rainfall of 400–1,200 mm and average annual temperatures of 15–25°C. Barley produces in very higher land where other crops are rarely grown (between 500 and 2,300 m above sea level). It is grown by about a third of all cereal producers and occupies about 9% of cultivated land. Enset (false banana) is an important staple, which is only cultivated in Ethiopia, in large parts of the southern highlands, where it has been estimated
that more than 10 million people depend on enset for food, fiber, and other uses. It is planted at elevations ranging from 1,100 to 3,100 m above sea level, although its optimal range is 2,000–2,750 m above sea level with average annual temperatures of 10–21°C. It does not tolerate frost and it is not drought resistant (Chamberlin and Schmidt, 2011). Extension of agriculture in Ethiopia To feed the large and growing population of Ethiopia, agricultural production has to be increased by improving the agricultural productivity per land area because most of accessible fertile lands have been cultivated. The total fertilizer use has increased from 250,000 tons in 1995 to 400,000 tons in 2008 (Spielman et al., 2010). The cooperatives currently supply about 56% of the total of fertilizer by short-term credit on fertilizer purchases to farmers under a 100% credit guarantee scheme by the regional governments. The largest source of such agricultural credit is the Commercial Bank of Ethiopia (CBE) serving more than 2.5 million farmers.
Agricultural extension service in Ethiopia started in 1953 with the establishment of the then Imperial Ethiopian College of Agriculture and Mechanical Arts (IECAMA), currently known as Alemaya University. The extension service of the college focused on improved poultry production, horticulture, tree seedling production and distribution, improved wheat varieties, and apiculture. Before 1975, the Ethiopian agricultural policy focused mainly on the interests of landowners. During 1975–1991 period, peasants (small land owner farmers) associations were set up for small farmers. The agricultural sector was divided into three farming systems: individual, state and producers‟ cooperatives (Azadi et al., 2011).
In 1991, the Ethiopian People‟s Democratic Revolutionary Front occupied Addis Ababa. A new constitution was adopted, which stated that all the lands

Mohajan 68
Table 8. Inflation rate of consumer products from 1999 to 2012 in Ethiopia.
Ethiopia 1999 2000 2001 2003 2004 2005 2006 2007 2008 2009 2010 2011 2012
Inflation rate (%) 4 5 6.8 17.8 2.4 11.6 13 17.2 44.4 8.5 7 33.2 21.7
belong to the state. The small-scale farmers could lease the land from the local government but many small-scale farmers are still too poor to buy modern technologies (Lightbourne, 2007). There are around 12 million peasant farmers, more than half of which have less than 1 hectare of land and mostly cultivate for their own consumption. Genetically modified (GM) crops are usually more resistant to pests and fewer crops will consequently be lost in harvest. Hence the farmers spend less money on pesticides; they will be able to invest more in new seeds or other agricultural inputs so that application of GM crops can increase productivity, as compared with their current conventional crops. The rich farmers can earn more products, and can use more modern technology. The peasants are often subsistent and cannot bring their harvest to the market and compel to sell their product in low prices. A peasant farmer has to walk for half a day to reach local markets where the prices are up to 70% lower than in urban markets and he has no more capital for investment in improved seeds, more land, irrigation systems or other agricultural tools (Azadi et al., 2011).
The application of genetically modified (GM) crops in Africa is new and at an experimental stage; so that it is an expensive treatment for farmers to undertake. For GM crops, farmers will need to buy new seeds every season, which the farmers are often unable to afford (Wu and Butz, 2004). Government would not subsidize the small farmers to buy improved seeds but will subsidize the bigger, state-owned farms. If GM crops become available in Ethiopia, they will only be available to the wealthier farmers. The application of GM crops can improve the agricultural productivity and sustainability, but equitability cannot be stimulated and might even worsen the gap between socioeconomic classes (Azadi et al., 2011). In Ethiopia, 95% farmers dependent on rainfall and drought will be affected severely if they use GM crops; hence, GM crops cannot be adopted by small farmers in Ethiopia. Only 8% of the Ethiopian peasants are able to apply pesticides. Smallholders cannot apply pesticides properly and they will be victim of great loss from pest and drought. Coffee production in Ethiopia Ethiopia produces and exports one of the best highland coffees in the world. The coffee sub-sector is very important to the Ethiopian economy, and generated about $335 million or 41% of the foreign exchange earnings in 2005 (National Bank of Ethiopia, NBE, 2006). In Ethiopia,
coffee is primarily cultivated by smallholders, either cultivating coffee on their own farms or picking semi-wild/wild coffee. Smallholder coffee accounts for approximately 95% of total coffee production. There are about 20,000 ha of plantation coffee, consisting mainly of state farms of the estimated 600,000 ha of land cropped with coffee. Coffee growers in Ethiopia have been exposed to price fluctuations and impacts of unpredictable and uncontrollable shocks.
Domestic and world coffee prices have declined and remained very low for much of the late 1990s and early 2000s. It is estimated that the sub-sector impacts on approximately 15% of the population, and around 20% of the land area (McMillan et al., 2003). SECURITY OF FOOD IN ETHIOPIA Ethiopia is a country with a history of chronic hunger. Food insecurity and malnutrition are major barriers to development in Ethiopia. About 7 million people are chronically food insecure and up to 13 million are seasonally foods insecure. In the poorest countries like Ethiopia, soaring of food price is unbearable. Bread wheat is one of the major cereal crops grown in Ethiopia. Ethiopia is the largest wheat producer country in Sub-Saharan Africa with a potential expansion area of more than 1.4 million hectare (ha). Inflation in Ethiopia In 2005, inflation began to rise in Ethiopia. The inflation rate steadily increased from 3.4% in 2004 to 13.6% in 2006, a record rose in 44.9% in 2008, increased 33% in 2011 and 21.7% in 2012 (Table 8). The inflation rate of consumer products fluctuated in the last decade and lowest inflation was 7% in 2010 (Country Profile, 2013).
In July 2008, food prices in Ethiopia had rose to an unprecedented level, on average 92% higher than twelve months earlier. It faces the highest rate of inflation in its history and the highest in the world next to Zimbabwe in 2008. The price of main staple food maize in 2008 was 130% higher than the 2004–2008 average (Famine Early Warning System Network, FEWS NET, 2009). The price of cereals, increased by 113% while that of spices rose by 102% but the price of meat increased by only 48%, which is more intensively consumed by richer families. Taxes on food were reduced in 84 countries between 2006 and 2008 of which 76 countries have cut food
J. Bus. Manage. Adm. 69
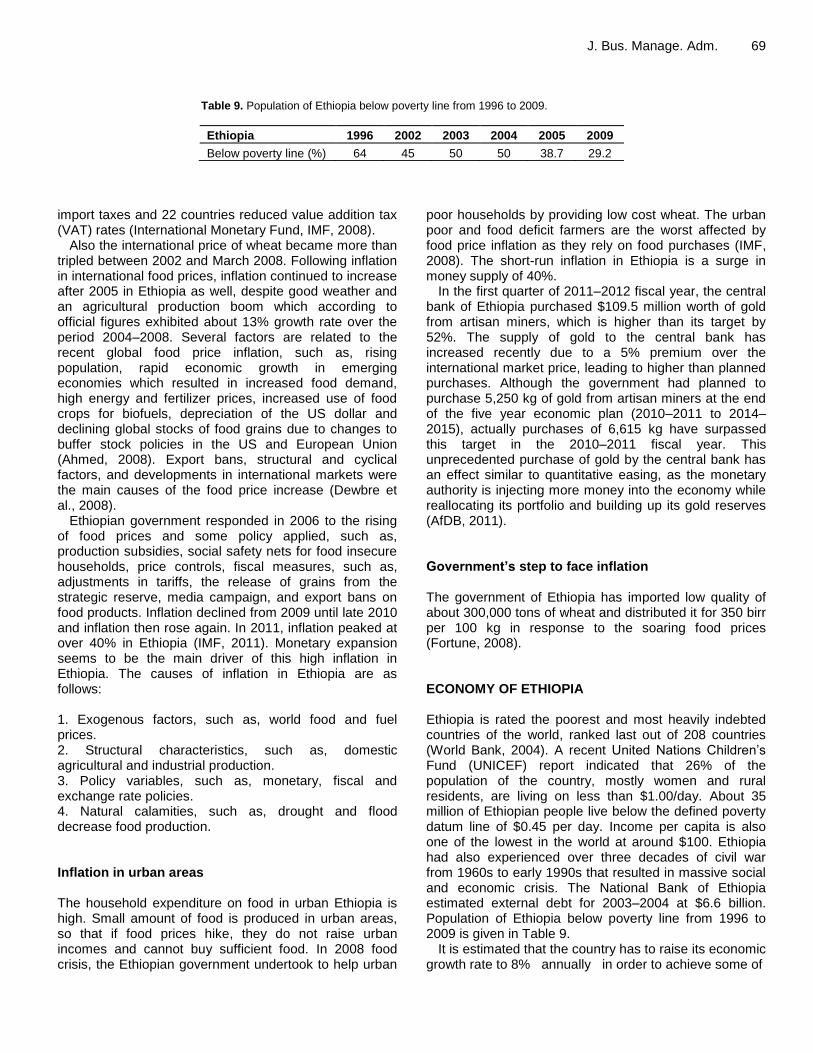
Table 9. Population of Ethiopia below poverty line from 1996 to 2009.
Ethiopia 1996 2002 2003 2004 2005 2009
Below poverty line (%) 64 45 50 50 38.7 29.2
import taxes and 22 countries reduced value addition tax (VAT) rates (International Monetary Fund, IMF, 2008).
Also the international price of wheat became more than tripled between 2002 and March 2008. Following inflation in international food prices, inflation continued to increase after 2005 in Ethiopia as well, despite good weather and an agricultural production boom which according to official figures exhibited about 13% growth rate over the period 2004–2008. Several factors are related to the recent global food price inflation, such as, rising population, rapid economic growth in emerging economies which resulted in increased food demand, high energy and fertilizer prices, increased use of food crops for biofuels, depreciation of the US dollar and declining global stocks of food grains due to changes to buffer stock policies in the US and European Union (Ahmed, 2008). Export bans, structural and cyclical factors, and developments in international markets were the main causes of the food price increase (Dewbre et al., 2008).
Ethiopian government responded in 2006 to the rising of food prices and some policy applied, such as, production subsidies, social safety nets for food insecure households, price controls, fiscal measures, such as, adjustments in tariffs, the release of grains from the strategic reserve, media campaign, and export bans on food products. Inflation declined from 2009 until late 2010 and inflation then rose again. In 2011, inflation peaked at over 40% in Ethiopia (IMF, 2011). Monetary expansion seems to be the main driver of this high inflation in Ethiopia. The causes of inflation in Ethiopia are as follows: 1. Exogenous factors, such as, world food and fuel prices. 2. Structural characteristics, such as, domestic agricultural and industrial production. 3. Policy variables, such as, monetary, fiscal and exchange rate policies. 4. Natural calamities, such as, drought and flood decrease food production. Inflation in urban areas The household expenditure on food in urban Ethiopia is high. Small amount of food is produced in urban areas, so that if food prices hike, they do not raise urban incomes and cannot buy sufficient food. In 2008 food crisis, the Ethiopian government undertook to help urban
poor households by providing low cost wheat. The urban poor and food deficit farmers are the worst affected by food price inflation as they rely on food purchases (IMF, 2008). The short-run inflation in Ethiopia is a surge in money supply of 40%.
In the first quarter of 2011–2012 fiscal year, the central bank of Ethiopia purchased $109.5 million worth of gold from artisan miners, which is higher than its target by 52%. The supply of gold to the central bank has increased recently due to a 5% premium over the international market price, leading to higher than planned purchases. Although the government had planned to purchase 5,250 kg of gold from artisan miners at the end of the five year economic plan (2010–2011 to 2014–2015), actually purchases of 6,615 kg have surpassed this target in the 2010–2011 fiscal year. This unprecedented purchase of gold by the central bank has an effect similar to quantitative easing, as the monetary authority is injecting more money into the economy while reallocating its portfolio and building up its gold reserves (AfDB, 2011). Government’s step to face inflation The government of Ethiopia has imported low quality of about 300,000 tons of wheat and distributed it for 350 birr per 100 kg in response to the soaring food prices (Fortune, 2008). ECONOMY OF ETHIOPIA Ethiopia is rated the poorest and most heavily indebted countries of the world, ranked last out of 208 countries (World Bank, 2004). A recent United Nations Children‟s Fund (UNICEF) report indicated that 26% of the population of the country, mostly women and rural residents, are living on less than $1.00/day. About 35 million of Ethiopian people live below the defined poverty datum line of $0.45 per day. Income per capita is also one of the lowest in the world at around $100. Ethiopia had also experienced over three decades of civil war from 1960s to early 1990s that resulted in massive social and economic crisis. The National Bank of Ethiopia estimated external debt for 2003–2004 at $6.6 billion. Population of Ethiopia below poverty line from 1996 to 2009 is given in Table 9.
It is estimated that the country has to raise its economic growth rate to 8% annually in order to achieve some of

Mohajan 70
0
10
20
30
40
50
1996 2000 2005 Rural Urban Malnutrition
Figure 3. Poverty and malnutrition in Ethiopia. Source: Prepared by the author.
the Millennium Development Goals (MDGs), particularly the one which addresses both the financial and non-financial poverty (Killian et al., 2009). Some of these are related to infrastructure, human development, rural development, food security, and capacity-building. These new directions include greater commercialization of agriculture, enhancement of private sector development, industry, urban development and a scaling-up of efforts to achieve the MDGs (MOFED, 2004).
The poverty headcount, which stood at 46% in 1996 and 44% in 2000, fell to 39% in 2005. However, it is still a long way from achieving the MDGs of Ethiopia by 2015 due to its beginning low level. The poverty in the rural areas (47%) is higher than in urban areas (33%), and 49% of the total population is considered under-nourished (Figure 3).
The basis of the economy is rainfed agriculture, so that the crop production fluctuates widely according to yearly rainfall patterns, food production decreases due to drought. It is lands of an estimated 7 million pastoralists who tend a large number of livestock, a large portion of them are found in the dry lowlands of the east, southeast, and south that are suited to pastoralism but not farming. Since the early 1990s, the country has received financial support for economic reforms from the International Monetary Fund (IMF) and the World Bank (WB).
Its total gross domestic product (GDP) in 2011 was $94.878 billion (in purchasing power parity, PPP) and per capita GDP in 2011 was $1,092. In 2012, real growth rate GDP was 7% (Country Profile, 2013). Gross national income (GNI) in 2009 was $27.03 billion and GNI per capita in 2009 (in PPP) was $930 and per capita gross national product (GNP) is about $235 (Ministry of Finance and Economic Development, MOFED, 2010). Literacy rate is 42.7% (male 50.3% and female 35.1%).
The country has deposits of coal, gemstones, kaolin, iron ore, soda ash, and tantalum, but only gold is mined in significant quantities. The country produce about 90% of its electricity from hydropower; hence, electricity generation is dependent on abundant rainfall. Ethiopians
rely on forests for nearly all of their energy and construction needs; the result has been deforestation of much of the highlands during the last three decades. In 2006, unemployment rate of youth ages 15–24 was 24.9% (male of 19.5%, female of 29.4%). In Ethiopia, more than 92% of rural households live in their own dwelling units and only 1.2% live in rented houses.
In urban areas, 43% of households live in their own houses while 49% live in rented units. Most of the dwellings (85.8%) are mostly one or two smaller room units. About 44% of rural households live within 5 km from food markets. For one out of four rural households, the nearest food market is 10 or more kilometers away. About one-third of households need to travel 20 or more kilometers to reach the nearest micro finance services. The proportion with financial services within 5 km is 77% in urban and 17% in rural areas. About 71% of households use kerosene for lighting, while 15% use firewood and only about 13% use electricity. In rural areas, only 0.4% of the population use private electricity for lighting, and another 0.8% has access to shared connections. 75.3% of urban residents use electricity. Almost all rural households (98.9%) and more than 24% of urban households do not use electricity.
A substantial majority of households both in urban and rural areas have to travel less than 10 km to reach the nearest primary school. Secondary schools are less accessible with only 27% of households living within a 5 km radius and 50% farther than 15 km from the nearest secondary school. POVERTY IN ETHIOPIA In 1973, during the Imperial regime, about 3 million Ethiopians were affected by food shortages and total excess mortality in the country about 250,000 (Kidane, 1989). A decade later, during the „Marxist-Leninist‟ Derg regime, approximately 7.8 million Ethiopians were caught struggling for survival, out of which excess mortality was

conservatively estimated at 700,000 (Kidane, 1990). A prolonged drought between 1984 and 1986 plunged the country into famine. During the 1980s, an estimated 1 million Ethiopians died from starvation as a result of famine.
The present government of Ethiopia has taken various steps of reduction of poverty especially in rural areas, such as, Agricultural Development-Led Industrialization (ADLI), Sustainable Development and Poverty Reduction Program (SDPRP), etc. The government has stressed on the development of agriculture, food security and vulnerability, export development, private sector development, tourism, mining, infrastructure, health and education. Ethiopian women are economically, socially, culturally and politically disadvantaged in the enjoyment of equal rights, in accessing opportunities, decision-making processes, and basic services. The main causes of poverty in Ethiopia are as follows: 1. The dynamics of population growth. 2. Very low productivity, structural bottlenecks. 3. Dependence on unreliable rainfall. 4. Being land locked combine to pose serious challenges. With the fast growth in rural population, the farms tilled by farming households have become increasingly fragmented. EFFECTS OF CHILD MARRIAGE IN ETHIOPIA Even in the 21
st century, dozens of countries around the
world have practice of marriage of girls at the teen age and it is a deep traditional roots. In Ethiopia, the law stipulates that marriage for girls younger than 18 is illegal, but knowledge of and respect for the law is limited and early marriage is at its most severe in Ethiopia. The practice of child marriage is the highest in Amhara region of Ethiopia (girls in Amhara region are married starting from the age of 5). Most cases, teen age girls are married with older men; which affects the level of communication, mutual understanding, and the balance of influence within the family, and it gives the man considerably more control than that held by his aged wife. Teen age girls are forced in the marriage by their parents and elder persons of the community and the guardians do not inform their daughter before marriage and do not know the groom before the wedding. Some cases men are polygamy and their wives are of teen aged.
Child marriage usually terminates education, and it has a serious negative effect on their health and their income and earnings and decision making capacities. Some ever-marriage girls leave school due to child bearing and household works. Some marriage girls are compelled to terminate education for the disapproval of their husbands.
Due to child marriage, both men and women have previous marital experience due to divorce and
J. Bus. Manage. Adm. 71 remarriage. Some poor parents take macha (money paid to the girl‟s family by the boy‟s family upon agreement to marriage) and arrange marriage of their children daughters. Parents are not aware of the negative consequences of early marriage. Women who marry in the child stage are likely to bear more children than those who marry in their mature stage. Pregnancy at a teen age creates various obstetric problems. Teen age mothers have less ability to make decisions about their nutrition, health care, and household management. Child married girls face significant physical pain associated with sexual intercourse as a result of the physiological immaturity of their sexual organs.
To decrease early marriage, the awareness must be created to the parents, community members, and youths. Proper advertisement is needed about the negative consequences of early marriage. Government must be active about the application of the early marriage related laws. Teachers can help girls negotiate with their parents. Religious leaders can create awareness among the communities about the harmful dimensions of the child marriage.
The fundamental reasons behind parental decisions regarding early marriage are as follows (Mekonnen and Feye, 2010): 1. Low value for education. 2. Maintaining virginity of girls. 3. Parental wish to see the generation continue and have children live close by. 4. Access to labor by the family of the groom. 5. To get „pay-back‟ from financial and material contributions rendered for other families who wedded their children. 6. Having married sons and daughters is a sign of status. 7. Security through having a large family. CHILD LABORERS IN ETHIOPIA Child labor is a common situation in Ethiopia. In rural areas, parents with low economic status arrange for their children, as young as 8 years of age, to work for others on a contract basis. Boys between the ages of 8 and 15 are hired as cattle herders at a payment of 6–7 quintal of grain per annum. Boys over 15 years of age are hired as farm helps and paid 7–8 quintal per annum. It is a live-in job whereby the employer provides food and shelter. During peak agricultural seasons, boys from poor households are hired at Birr 15 per day.
Girls are employed as domestic workers for cooking, cleaning house, look after babies or for income generation activities of making local drinks, marketing, etc. and are paid a monthly salary of Birr 40–50 in rural areas and up to Birr 100 in urban areas. Girls may experience sexual exploitation while working in urban areas. Employers are not required to send hired laborers

Mohajan 72
Table 10. The export and import of Ethiopia from 1998 to 2012.
Ethiopia 1998 1999 2002 2003 2004 2005 2006 2007 2008 2009 2010 2011 2012
Export ($billion) 0.42 0.46 0.44 0.43 0.54 0.56 0.61 1.09 1.55 1.64 1.73 2.75 3.16
Import ($billion) 1.25 1.25 1.54 1.63 1.96 2.1 2.72 4.11 6.9 6.95 7.52 9.7 10.6
to school. Sometimes children dropout from school and come to the street for various reasons and some of them are as follows (Mekonnen and Feye, 2010): 1. Poverty and food insecurity. 2. Divorcees from early marriage. 3. Children who run away from early marriage. 4. Parents‟ refusal to send children to school. 5. Disagreement with parents or verbal and physical abuses by care givers. 6. Family disturbance. 7. Child trafficking. 8. Peer pressure. EXPORT AND IMPORT IN ETHIOPIA In 2009, Ethiopia‟s total export was about $1,640 million, and the total import was $7,600 million. In 2011, total export was about $2.75 billion and import was about $9.694 billion and in 2012 the corresponding figures became $3.163 billion and $10.6 billion respectively (Country Profile, 2013). The export and import of Ethiopia from 1998 to 2012 are given in Table 10.
Coffee is Ethiopia‟s major export, accounting for 60% or more of average annual export earnings, but its value fluctuates widely depending on worldwide production. Oilseeds (sesame and Niger seed) are the second largest export item after coffee in which more than 3 million smallholders are involved in its production. Japan is the biggest world importer of sesame seed, which is an important component of Japanese cooking. In the second half of 2006, the main export markets for Ethiopian sesame seed were China, Israel and other countries in the Middle East and Turkey. About 78% of exports of Ethiopia come from a handful of primary sector industries, for example, from coffee, oilseeds, the leaves of the chat bush (a mild stimulant popular in Somalia and Yemen), etc. Of the remaining 22% of exports, comes from four industries: i) cut flowers, sugarcane, leather, beeswax, ii) gold, iii) meat and meat products, and iv) clothing and textiles.
In 2000–2001, the National Bank of Ethiopia (NBE) estimated the largest principal exports by value as: coffee $174.7 million (m), leather and leather products $74 m, chat $61 m, oilseeds $30.7 m and gold $28 m. In 2011, exports partners are; Germany 14.2%, China 12.2%, Belgium 7.8%, Saudi Arabia 6.8%, US 6.3% and Italy 5.1%.
Ethiopia imports a large range of consumer and capital goods. In the past, imports came primarily from Europe, especially Italy and Germany, and from India. In more recent years, China has become a major supplier of goods. Saudi Arabia supplies fuel and refined petroleum products, making it by far the largest supplier in terms of percent of total imports. Imports commodities are food and live animals, petroleum and petroleum products, chemicals, machinery, motor vehicles, cereals, etc. In 2011, imports partners are; Saudi Arabia 10%, China 9.9%, USA 7.6% and India 4.6%. Ethiopia is a net importer of refined soybean and palm oil. Palm oil is mainly imported from Malaysia, Singapore and the United Arab Emirates. Italy is the major supplier 75% of soybean oil, followed by Turkey 10% (Unites States Department of Agriculture, USDA, 2011). POLITICAL INSTABILITY IN ETHIOPIA Since the early 1970s, Ethiopia has suffered extreme economic and political chaos. Catastrophic droughts and famines, protracted and devastating civil war are common in Ethiopia. During the intensified civil war in the late 1980s and early 1990s, many people left their villages and migrated to urban areas or other unaffected areas. Prior to 1974, the country was ruled by a traditional monarchy, infamous for its land-tenure policies. The conflict along Eritrea-Ethiopia boarder, ongoing violent conflict in Somalia and in the Ogaden region of Ethiopia, and the potentially violate aftermath of South Sudan independence in July 2011 all have an impact on domestic politics in the country.
Security threats from local opposition parties, such as, the Coalition for Unity and Democracy (CUD), the Ogaden National Liberation Front (ONLF), regional rivals, internal revolution, the Diaspora, and overflow effects from neighboring civil wars are the headache of the Ethiopian government. MEDIA IN ETHIOPIA There are 3 daily newspapers; Addis Zemen (state-owned), Ethiopian Herald (state-owned), and The Daily Monitor (private), 4 other main papers; 12 radio stations (top three radio stations are Sheger Addis, Fana FM, and Zami) and one main television station (state owned Ethiopian Television) in Ethiopia. There are two news

agencies: Walta Information Centre (private, pro-government), and Ethiopian News Agency (state-owned). About 447,300 internet usage was in 2009 but the speed is weakening outside urban areas. Entry into the journalism profession is free, and government imposes no licensing, restrictions, or special rights for journalists. Electronic media, especially radio, remain the most influential information reaching the rural areas where most Ethiopians live. The government controls most of Ethiopia‟s radio stations, news papers and television stations. The government continues to enact ever more draconian and highly subjective media laws, such as the 2009 Anti-Terrorism Proclamation. The government of Ethiopia used the law to force the closure of the independent Addis Neger in late 2009, dealing a serious blow to key independent voices in the country. Sixteen years after the birth of free press in Ethiopia, tolerance to different views is still in its early stages (Media Sustainability Index, 2009). Cell phone users reached to 9.9 million by 2010. FOREIGN AID IN ETHIOPIA During the post-World War II era, Ethiopia received small amounts of economic development aid from such countries as the USA and Sweden. Ethiopia has been structurally in food deficit since at least 1980. In Ethiopia, drought and crop failure or livestock death has been the major cause of famine. During the last few decades, Ethiopia has been receiving a large share of food aid shipments to Sub-Saharan Africa. An average of 760 thousands tone of food aid came during 1993 to 2003, which was about 10% of total domestic grain production. The major donors are the USA, the EU and the UN World Food Programme (WFP). The aid inflow was only 156 thousand metric tons in 1996 for good harvest, which was the lowest and the maximum inflow was during 2000, more than 1.3 million metric tons.
Most of this aid inflow was wheat about 80% of the total aid and non-cereal food stuffs was 8.7%. This food aid has saved millions of lives in regions where droughts have often escalated into catastrophic famines over the past few decades.
Food insecurity is the single greatest barrier to sustainable development in Ethiopia, which affects up to 5 million people annually and many Ethiopians depend on food aid from abroad. This chronic situation is worsened dramatically during periods of drought. Drought is especially disastrous in Ethiopia because more than 80% of people live off the land, and agriculture drives the economy, accounting for half of all domestic production and 85% of exports. Drought in 2000 left more than 10 million to seek emergency food aid. In 2003, up to 13.3 million Ethiopians needed relief assistance.
Ethiopia has experienced recurrent droughts and agro-ecological imbalances, which caused extreme volatility in
J. Bus. Manage. Adm. 73 domestic food production. Poor governance and civil wars also affect the food security. In 2011, about 2.8 million people needed food assistance due to high inflammation. In the last decade, food aid has also been increasing rapidly in pastoral areas. In Somali region, more than a quarter of the population (about 1 million) needs food aid. Effects of food aid Food aid increases the supply of food in the country which reduces food prices, as they sell some of the relief materials in the market, which reduces food prices. The local farmers are compelled to sell their products with loss and ultimately discourage domestic production. Many experts express their opinion that food aid policies are responsible for keeping the poor. Food aid helps temporarily to the poor, as they find it without any labor but it has effects for the long term. Since the beneficiaries become idol and always expect for relief and do not work or cultivate, so that government of the developing countries every year imports food. Food aid is given only by wheat, which is bought from the farmers of rich countries. Hence the farmers of rich countries gain economically and encourage cultivating more. On the other hand, farmers of aid receiving countries face loss, as the relief materials decrease the market price of the country (Levinsohn and McMillan, 2007). Relief assistance is a humanitarian operation aimed at preventing starvation and death caused by drought, floods and war. But it could not be as a regular basis. At the grass roots political level, food aid is also billed as a „gift‟ to the people in order to promote political sympathy and secure influence.
Ethiopia receives more food aid than any other country in the world, but it remains the poorest country and the aid does not improve the country. At present, there are 5 to 6 million people of Ethiopia in rural areas that need food aid on a non-stop basis, even in good harvest years. If the Ethiopian government can create more net sellers than net buyers then the poverty will decrease but food aid will not do. Food aid will benefit net food buyers and harm net food sellers. The people must be adjusted with substitute foods to decrease poverty. As food aid decrease prices in the local market, the importers show low interest to import food, because they fear to face loss.
A great amount of the food never gets to the neediest families, for whom it is intended but some better-off farmers receive aid, as the distributors distributed it among their relatives. Food aid system used over decades does not help Ethiopia to go forward instead it has created many problems. Foreign aid is needed in education, health, job creation, small industries, agricultural reforms, infrastructure and poverty reduction programmes.

CONCLUSION In this paper, we have tried to describe agriculture, poverty, economic development, food insecurity, health and treatment, political situation, education in some detail. Although it is the poorest country in the world, it has prosperity to become middle income country. The government of the country must stress on education, birth control and infrastructure development. It should increase amount of export than amount of import. In agriculture, modern technologies must be applied and irrigation facilities must be applied where possible. REFERENCES AfDB (2003). Ethiopia agricultural support project, appraisal report,
agricultural and rural development department, 217 North, East and South. Tunis: AfDB.
AfDB (2011). Inflation dynamics in selected east African countries: Ethiopia, Kenya, Tanzania and Uganda, AfDB Brief. Afr. Dev. Bank, Tunisia.
Ahmed S (2008). Global food price inflation: implications for South Asia, policy reactions and future challenges, Pol. Res. Work. Paper No. 4796. Washington, DC: The World Bank.
Azadi H, Talsma N, Ho P, Zarafshani K (2011). GM crops in Ethiopia: a realistic way to increase agricultural performance? Trends in Biotech. 29(1):6-8.
Central Intelligence Agency, CIA (2009). The World Factbook. July, 2009. https://www.cia.gov/library/publications/the-world-factbook/geos/et.html
Chamberlin J, Schmidt E (2011). Ethiopian agriculture: a dynamic geographic perspective, development strategy and governance division, Int. Food Pol. Res. Inst.–Ethiopia strategy support program II, Working Paper No. 017, Ethiopia.
Country Profile (2013). Country profile of Federal Democratic Republic of Ethiopia 2013.
Dejene T (2003). Health situation in Ethiopia, German Ethiopian Association, Retrieved.
Dewbre J, Giner C, Thompson W, von Lampe M (2008). High food commodity prices: will they stay? Who will pay? Agric. Eco. 39:393-403.
Ethiopian History (2011). Retrieved from http://www.selamta.net/history.htm
Famine Early Warning System Network (FEWS NET) (2009). Ethiopia food security update. Addis Ababa: FEWS NET.
Federal Democratic Republic of Ethiopia (2012). Growth and transformation plan (2010/11-2014/15), Ann. Prog. Rep. for F.Y. 2010/11, Ministry of Finance and Economic Development June 2012, Addis Ababa.
Fortune (2008), Soft heart hard head. Vol.9 No. 441. October 12 edition, Addis Ababa.
Heugh K, Bogale B, Benson C, Yohannes M (2007). Final report: study on medium of instruction in primary schools in Ethiopia, Commissioned by the Ministry of Education.
IMF (2008). Food and fuel prices-recent developments, Macroeco. Imp. and Pol. Resp., Washington DC: http://www.imf.org/external/np/pp/eng/2008/091908.pdf
IMF (2011). The Federal Democratic Republic of Ethiopia: second review of the arrangement under the exogenous shocks facility-staff
Mohajan 74
report; press release on the executive board discussion; and statement by the executive director for the Federal Democratic Republic of Ethiopia, Country Report No. 10/339, Washington DC: Int. Mon. Fund.
Kidane A (1989). Demographic consequences of the 1984-1985 Ethiopian famine. Demography 26(3):515–522.
Kidane A (1990). Mortality estimates of the 1984-85 Ethiopian famine. Scand. J. Soc. Med. 18(4):281-286.
Killian M, Tendayi G, Augustine T (2009). An assessment of partnerships between technical vocational education and training and its stakeholders in the development of Ethiopian SMEs, Economia, Seria Manage. 12(2):39-56.
Levinsohn J, McMillan M (2007). Does food aid harm the poor? Household evidence from Ethiopia, in globalization and poverty, edited by Harrison A, Na. Bur. of Eco. Res., University of Chicago Press.
Lightbourne M (2007). Organization and legal regimes governing seed markets and farmers‟ rights in Ethiopia, J. Af. Law 51:285-315.
McMillan M, Tigneh A, Agnofir Y, Moges K, Teshome A (2003). Ethiopia: trade and transformation challenges, agriculture and trade diagnostic trade integration study, 8(2), Addis Ababa, Ethiopia.
Media Sustainability Index (2009). Federal Democratic Republic of Ethiopia.
Mekonnen E, Feye B (2010). Social assessment of the education sector: Amhara national regional state, Soc. Dev. Dir., social assessment in Ethiopia.
Ministry of Education: Ethiopia (2002). Education sector development program action plan-II, Addis Ababa: United Printers Plc.
Ministry of Finance and Economic Development (MOFED) (2010). Growth and transformation plan (GTP) 2010/11-2014/15. Addis Ababa: MOFED.
MOFED (2004), Millennium development goals report: challenges and prospects for Ethiopia, Ministry of Finance and Economic Development (MOFED) of the Federal Democratic Republic of Ethiopia and United Nations Country Team, Addis Ababa.
Mulat D, Fantu G, Tadelle F (2007). Exploring demand and supply factors behind the new developments in grain Prices in Ethiopia: Key issues and hypotheses. Addis Ababa: DFID/ Ethiopia.
NBE (2006). Quarterly Bulletin, 21(2), Addis Ababa, Ethiopia. Shiferaw M (2003). Are the millennium development goals (MDGs)
feasible? Can the deadlines be met particularly for education and gender? The case of Ethiopia.
Spielman DJ, Byerlee D, Alemu D, Kelemework D (2010). Policies to promote cereal intensification in Ethiopia: The search for appropriate public and private roles. Food Pol. 35:185-194.
Surafel F (2012). Assessing and improving Ethiopia‟s health care services, Thesis: Barrett Honors College, Arizona State University.
Tefferi H, Endeshaw Y (2006). Country analysis: Ethiopia. UNDP (2003). Human development indicators 2003, Web:
http://www.undp.org/hdr2003/indicator/index.html USDA (Unites States Department of Agriculture) (2011). Foreign
agricultural service, oilseeds: World Market and Trade Archives. Westphal E (1975). Agricultural systems in Ethiopia, Agric. Res. Rep.
826, Wageningen. World Bank (2004). World bank indicators database. Web:
http://www.worldbank.org/data/databytopic/GNIPC.pdf Wu F, Butz WP (2004). The future of genetically modified crops,
Lessons from the green revolution, rural area network design (RAND), chapters 2–4.