Conceptualising Long-Term Socio-ecological Research (LTSER): Integrating the Social Dimension
Upload
khangminh22Category
view
0download
0
KFRI Research Report 125(ii)
SOCIO-ECONOMIC AND ECOLOGICAL ASPECTS
OF DEVELOPING BAMBOO RESOURCES IN
HOMESTEADS OF KERALA
PART – II : ECONOMIC AND MANAGEMENT ASPECTS
C.N. Krishnankutty
KERALA FOREST RESEARCH INSTITUTE
PEECHI, THRISSUR
November 1998 Pages: 62

CONTENTS
Page File
Abstract vi r.125(ii).2
1 Introduction 1 r.125(ii).3
2 Demand and Supply of Bamboo in Kerala
2
r.125(ii).4
3 Marketing of Bamboo from Home-gardens
4
r.125(ii).5
4 Pattern of Bamboo Trade and Retail Markets
18
r.125(ii).6
5 Socio-economic Aspects of Bamboo Weaving Communities
27
r.125(ii).7
6 Cost-benefit Analysis of Bamboo in Mixed Cropping Home-garden System
38
r.125(ii).8
7 Development of Bamboo Resources in Home-gardens
50
r.125(ii).9
8 Summary and Conclusions 53 r.125(ii).10
9 References 56 r.125(ii).11
10 Appendices 57 r.125(ii).12
ABSTRACT
Bamboo is one of the crop components of the home-garden ecosystem in Kerala. This study was initiated with the objectives of analysing the socio-economic and ecological aspects of developing bamboo resources in home-gardens of Kerala. The report of the study is presented in two parts. Part I covers the ecological aspects as well as the strengths and weaknesses of traditional practices in home-garden bamboo cultivation and presents two case studies on promotion of bamboo in home-gardens. This report, Part II, examines the economic and management aspects of bamboo in home-gardens of Kerala.
As a first step, the demand for bamboo in Kerala during the year 1993-94 was estimated and the sources-wise supply was quantified. The contribution of home-gardens in the total supply was assessed and a market study was carried out to identify the marketing channels of bamboo moving from home-gardens through wholesale depots to final users. A survey of bamboo felling areas in home-gardens was also conducted for estimating the farm-gate price, marketing costs as well as profitability of bamboo trading in wholesale depots, for reviewing the current bamboo management and for examining the performance of bamboo clumps which were managed at different levels by households. A census survey of wholesale bamboo depots was also conducted to examine the pattern of sale and to identify the retail markets. Since the weaving communities mainly depend on bamboo from home-gardens, a household survey was conducted in Sambava and Kavara Communities for examining the value addition in weaving and the problems regarding bamboo availability and price. For evaluating the economic position of bamboo crop among different crop components including trees in mixed cropping home-garden system, a new methodology was developed by devising formulae to compute the mean benefit and mean cost per ha per annum of each crop component and then the benefit-cost ratio. Data, collected through a sample survey of bamboo growing home-gardens in two villages, were used for the cost-benefit analysis. The results of each component of this study are summarised below.
The study revealed that the estimated demand for bamboo in Kerala during the year 1993- 94 was 169,000 metric tonnes of which industries accounted for 38%, export for 22% and household and other sectors for 40%. Of the total supply of bamboo in Kerala, home- gardens contributed 63% and forests the remaining 37%. Nearly all the bamboo from forests was utilised by the pulp industry within Kerala, whereas that from home-gardens went for industrial and non-industrial uses within and outside Kerala.
The home-garden bamboo market is dominated by wholesale depots based in Palakkad District, which has traditionally been one of the bamboo growing centres in the State. Bamboo production and marketing during 1993-94 provided direct employment for 409,000 operational days, in rural areas, of which 54% was accounted by socially and economically weaker sections of the society.
The market study showed that Bambusa bambos is the only species collected from home- gardens and traded through the wholesale depots. Of the total quantity of bamboo traded through the depots during the year 1993-94 , 71% came from home-gardens in Palakkad District, although shortage within the district in recent years has forced the depots to buy from home-gardens in neighbouring districts (27%) and further from those in far away districts (2%). The estimated average farm-gate price of a standing bamboo culm varies from Rs. 13 (small culm) to Rs. 75 (big culm) with Rs. 38 per an average sized culm during 1994.
vi

Socio-economic condition of the bamboo growing households, awareness of local market demand seem to influence the farm-gate price of bamboo.
willingness to sell and
Age, green colour, length and weight of bamboo poles are the most important determinants of price at the depots, although there is some seasonal variation in price as depots try to off-load surplus stock at the end of peak season. The price of bamboo received by the farmer is 40% of its wholesale price, indicating a fair return for the bamboo crop for which no inputs or expenditures are incurred. The estimated average net income of a bamboo supplying agent of the depot is around Rs. 47,000 and net profit of an average wholesale depot is Rs. 201,000 per annum, revealing that the returns are relatively modest.
The survey of wholesale bamboo trade indicated that export to the nearby state of Tamil Nadu accounted for 66% and that to Karnataka 20% of the total of 43384 metric tonnes of bamboo sold during the year 1993-94. The quantity of bamboo used for industrial and non- industrial uses within Kerala was only 14%. The main use of bamboo poles in Tamil Nadu is as banana supports which accounted for 41% of the total quantity exported to Tamil Nadu. Most of the export to Karnataka was for pulping. Although the real price of bamboo poles has been increasing at a compound rate of 7.2% per annum, the trend in export of bamboo to Tamil Nadu is on the decline. This is partly due to the availability of favourably priced casuarina poles, but may also be due to shortage of bamboo from home-gardens in Kerala.
Socio-economic survey of two bamboo weaving communities showed that weaving contributed 55% (in Sambava households) and 71% (in Kavara households) of the total annual income of Rs. 19,500 and Rs. 16,300 respectively from all sources during the year 1995-96. The estimated value addition per working weaver is Rs.17 per working day. Although it is relatively small compared to the income of the unskilled people working in other sectors, it is important for their livelihood since alternative employment opportunities are limited due to social and cultural factors. Timely availability of bamboo, increasing price of bamboo culms, inadequacy of cash for the purchase of a whole clump, reduction in the demand for products made of bamboo due to competition with substitutes are some of the major problems faced by the bamboo weaver households.
Benefit-cost analysis showed that bamboo crop has the second economic position in the two village studied using the criterion of net benefit per ha per annum at 18% land rent. As per the estimated benefit-cost ratios of 2.9 and 2.2 respectively in the two villages, bamboo crop ranked first in the former village and second position in the latter village. Therefore, the bamboo component has at least a second position among the components of seasonal and annual crops, perennial cash crops and tree crops. It is also noted that perennial cash crop component ranked first, tree crops third and seasonal and annual crop component fourth, at 18% land rent. The high benefit-cost ratio for bamboo crop is due to the negligible inputs. The high ratio reported for bamboo crop is not a recommendation to increase the bamboo component at the cost of other types of crops. If well managed, bamboo has a potential for good returns in the villages studied.
Well managed bamboo clumps with a cutting cycle of 6 to 8 years had better performance than poorly managed 20 to 25 years old clumps in terms of culm size, pole output, and product-mix. Bottom poles of 18 feet (5.4m) accounted for 54% of the harvest in well managed clumps, 35% in moderately managed 12 to 15 years old clumps and 17% in poorly managed old clumps. This shows that well managed clumps give a higher output of lengthy poles which in turn fetch a higher price. The estimated mean percentage of weight of poles to
vii

total weight of the bamboo material in the clump varies from 77% in poorly managed clumps to 92% in well managed clumps. Due to the higher proportion of high graded long poles and pole-output, well managed clumps provide high and sustainable income.
A farmer growing or maintaining bamboo in a well managed home-garden will (i) prefer Bambusa bambos species, (ii) prune the thorn annually, (iii) adopt a 6 to 8 years period cutting cycle, (iv) cut the culms above the first inter-node and (v) protect the emerging shoots and young culms while felling. This package will increase the out-turn of bamboo, improve the proportion of quality poles, enhance farm income, reduce felling cost and make the produce attractive to traders.
In the development of bamboo resources in home-gardens, particularly in Palakkad and nearby districts, the wholesale depots have a crucial role to play. Bulk purchasers from other States are attracted to Kerala only because of the existence of the wholesale market and efficiency of the depots. When there is no organised market, bamboo crop can have only the status of a miscellaneous crop and no economic return can be expected. Therefore, it has to be born in mind that the apparent profitability of bamboo in the villages studied may not be replicable in other villages without market advantages.
There is a need for a mechanism by which a package of practices for improved management of bamboo in home-gardens is popularised among farmers and they are made aware of the harvesting practices of bamboo clumps as well as the market demand.
viii

1. INTRODUCTION
Bamboo is one of the crop components of the home-garden ecosystem in Kerala. Being a marginal crop in home-gardens, not much studies are available on its ecological and economic aspects. The present study, Socio-economic and ecological aspects of developing bamboo resources in homesteads of Kerala, a pioneering attempt to throw light on the above aspects, was funded by the Overseas Development Administration’s Forestry Research Programme through the Natural Resources Institute, UK. The final report of the study is presented in two parts - Part I and Part II. Part I covers the ecological aspects as well as the strengths and weaknesses of traditional practices in home-garden bamboo cultivation and presents two case studies on promotion of bamboo in home-gardens. Part II, this report, covers the economic and management aspects of bamboo in home-gardens of Kerala. 1.1 Objectives
The objectives of this study (Part II) are i)
ii)
iii)
iv)
v)
vi)
to estimate the sector-wise demand for bamboo and source-wise supply in Kerala for the year 1993-94;
to identify the marketing channels of bamboo from home-gardens in Kerala and to analyse the price of bamboo, marketing cost as well as the profitability of bamboo trading in the wholesale depots;
to examine the sector-wise sale of bamboo through wholesale depots and to identify the retail markets;
to estimate the quantum of employment generated in the production and wholesale marketing of bamboo;
to quantify the value addition in bamboo weaving and its contribution in the total income of weaver households;
to identify the problems faced by the weaver households in the availability of bamboo and marketing of products;
vii) to carry out a cost-benefit analysis of bamboo crop in relation to other type of
viii) to evaluate the current management practices of bamboo crop in home- developing bamboo
crops in mixed cropping home-garden system and
gardens and to suggest improved management for resources and thereby generating higher farm income.
1.2 Organisation of the report
The report is presented in 8 sections including the introduction (Section 1). Estimates of demand and supply of bamboo in Kerala for the year 1993-94 and contribution of home-gardens in the total supply are presented in Section 2. The marketing channels of bamboo from home-gardens to final users are illustrated in Section 3. Further, the structure of the bamboo markets, organisational set up of wholesale bamboo depots, sources of supply, mode of purchase and sale are described. The farm-gate price, cost of felling and transportation and the price determinants at the wholesale depots and price spread from home-garden to final user are analysed in the same section. Profitability of bamboo trading in wholesale
1

depots is also dealt with in the same section. Section 4 presents the sector-wise sale of bamboo through the depots, the retail markets and trends in price and export demand for bamboo. Employment generated in the production of bamboo in home- gardens to wholesale marketing is also estimated in this section. Section 5 examines the value addition in bamboo weaving and its contribution in total income of the weaver households. Problems faced by the weaver households regarding bamboo availability and marketing are also discussed in this section. An innovative methodology developed and formulae devised for the estimation of mean benefit and mean cost per ha per annum in respect of bamboo and other types of crop components in mixed cropping home-garden systems are described in Section 6. The results of the cost-benefit analysis are also presented in this section . The present management and felling practices of bamboo crop in home-gardens, including estimation of proportion of quality poles and product-mix obtained from different types of bamboo clumps felled, are reviewed in Section 7. Some suggestions for developing bamboo resources in home-gardens and thereby generating higher income from bamboo crop for the households are also discussed in this section . The conclusions emanating from the study are summarised in the last section.

2. DEMAND AND SUPPLY OF BAMBOO IN KERALA
Bamboo is used for a variety of purposes. The demand for bamboo by the industries, households and other sectors in Kerala and for export is met from the bamboo available in the forests and home-gardens of the State. The demand for bamboo in various sectors in Kerala was estimated for the year 1987-88 and the different sources of supply was identified in an earlier study by Kerala Forest Research Institute (Krishnankutty, 199 1). The study indicated that home-gardens are the major sources of bamboo supply in Kerala.
In this study, the estimates of sector-wise demand and source-wise supply of bamboo in Kerala have been updated for the year 1993-94. The methodology adopted for estimating the demand and supply of bamboo for the year 1993-94, sources of data and the results are presented in this section.
2.1 Methodology
As adopted in Krishnankutty (1991), the demand for bamboo during the year 1993-94 is taken, in this study, as the effective demand which includes the quantity of bamboo used in industries, households and other sectors and for export during the year 1993-94.
Grasim Industries Ltd., a private sector pulp mill and Hindustan Newsprint Ltd., a public sector newsprint unit are the two industries using bamboo in Kerala'. The quantity of bamboo collected from different sources and utilised by them were computed based on the data provided by those industries.
mat and basket Bamboo is used by rural households for house construction,
Punalur Paper Mills Ltd., another private sector mill, was lying closed since 1986. I
2

weaving and for other purposes. Although per capita consumption of bamboo in Kerala has declined due to the availability of substitutes, it is likely that the number of bamboo users increases with population growth. This makes it difficult to estimate the total demand and in this study the demand for the household sector for the year 1993-94 has, therefore, been considered to be the same as that for the year 1987-88 estimated in Krishnankutty (1991).
Bamboo is also used for scaffolding and as supports for concreting in construction. For such uses, bamboo is collected from home-gardens or purchased from bamboo depots. The quantity of bamboo purchased from depots and used for the above uses is estimated based on the data collected through a survey of wholesale bamboo depots. The quantity obtained from home-garden and used for the same by households have not been estimated. Export demand for bamboo has been estimated based on data compiled from registers maintained at inter-state border forest check-posts.
2.2 Estimate of demand and supply for the year 1993-94
No attempt has been made to analyse supply constraints and capacity utilisation. At the present time, there is insufficient data to assess unmet demand from the major consumers of bamboo and baseline data for estimating supply are unavailable.
Table 2.1 shows the nature of demand for bamboo from various sectors and supply from different sources during the year 1993-94 in Kerala. The demand is estimated as 169,000 metric tonnes. Pulp-based industries accounted for 38.3 %, export 22.2%, household and other uses 39.5% of the total demand for bamboo. Of the total supply of bamboo, home-gardens contributed 63% and forests 37%.
Table 2.1. Demand and supply of bamboo in Kerala in the year 1993-94
1 Quantity
(metric % tonne)
64,902 38.34
37,4883 22.15 66,887 39.5 1
Deman Consuming sectors
Supply Quantity
Sources of (metric I % supply to consuming sectors Forests Home-gardens Home-gardens Home-gardens
Pulp-based industry
1,69,277
Export Household and ther uses2 Total 100.00 Forests
Home-gardens * Hindustan Newsprint Ltd. has started import of bamboo from Assam since 1994-95.
2,439 I 1.44 I 37.488 22.15 66,887 39.51
1,06,814 163.10 I
2 The estimate of the quantity of bamboo used in the household sector does not include the quantity of bamboo illicitly collected from forests and used by households for various purposes. Other uses include bamboo used as supports for concreting and as scaffolding and various miscellaneous uses.
3

2.3. Contribution of home-garden in the supply of bamboo The requirement of bamboo by the household and other uses is almost met
from home-gardens. The quantum of bamboo exported to the neighbouring states of Tamil Nadu and Karnataka is also contributed by home-garden. Thus, home-garden formed the major source of bamboo supply in Kerala State.

3. MARKETING OF BAMBOO FROM HOME-GARDENS
Bamboo resources in home-gardens move through the wholesale depots to different end-uses within and outside Kerala. The producers of bamboo are the farmers/households who either plant or retain the bamboo grown naturally and maintain in their home-gardens. The most common species of bamboo found in the home-gardens of Kerala is Bambusa bambos (Krishnankutty, 1988) which is the thorny bamboo. Although other species like B. vulgaris and Dendrocalamus strictus are also found in some home-gardens, only B. bambos3 is collected and traded by the wholesale depots which play a dominant role in the marketing. This section deals with the marketing channels, history of wholesale bamboo depots, their growth, location, structure and organisational set up. Thereafter, the functioning of the depots from purchase of bamboo from home-gardens to sale of the products is also explained in this section.
3.1. Methodology
A census survey of wholesale bamboo depots in Kerala was conducted and information on source of supply, mode of collection, number of supplying agents and workers were gathered. Interviews were also held with veteran bamboo traders for getting historical information, functioning of the depots, changes in the number of units over time, etc.
A sample survey was conducted in home-gardens of Palakkad District, where bamboo was felled and supplied to the wholesale depots, for estimating the average farm-gate price of bamboo, costs of felling and transportation and for identifying the price determinants. Home-gardens were identified based on information provided by the depot traders and thirty such home-gardens were selected for data collection. Information on purchase price, number of clumps, number of culms in each clump, number of truck-loads of poles and 'leftover' obtained, costs of felling, etc. were collected at the time of felling the clumps. Apart from these information, brokerage, cost of transportation and miscellaneous marketing costs were collected. Clumps were classified into those having small, medium, big and very big culms4. Using the purchase price of each clump and number of culms, farm-gate price per culm of different sizes is estimated. The trucks, loaded with bamboo collected from the
3Two varieties, more solid and less hollow (locally known as Karingali mula) and less solid and more hollow (locally known as Polla mula), are found. The former variety is preferred to the latter due to strength, durability, higher pulp output and weight.
Culms with diameter below 5 cm at the bottom were considered as small, 5 - 7.5 as medium, 7.5 - 4
10 as big and above 10 cm as very big.
4

sample home-gardens were weighed at weigh bridge and the net weight of bamboo per load was recorded. Using these data and purchase price of the whole clump, average purchase price and weight of bamboo per truck-load were estimated. For further analysis, an average truck-load of bamboo is taken as the unit. Bamboo is collected from different home-gardens in a locality by agents to make up a truck-load for supplying to depots. Purchasers from wholesale depots also buy quantity of one or more truck-loads.
Costs of felling and transportation include brokerage, cost of felling, cutting the culms into pieces, finishing the pieces into poles, head loading, hire charges of bullock-cart and truck, loading and unloading charges, fee of pass for transport of bamboo from home-gardens and related informal expense5. Average expenditure on all these items per load was computed by taking the weighted mean of the costs of different truck-loads collected during the survey. For identifying price determinants6, multiple linear regression analysis was done taking price of individual pole at the wholesale depot (P) as regressand and length (L), girth (G) and weight (W) of the poles as regressors.
Gross margin at the depot is the difference in the buying and selling price of bamboo. This includes the working cost of depot and the remuneration to management. The buying and selling prices of poles of different lengths and grade were collected from selected depots. The rate of gross margin at the wholesale depot was also estimated using the regression model Ps = (l+r)Pb + e where Ps denotes the wholesale price of poles, Pb, the buying price (that is the price paid to the supplying agents by the depots), r represents the rate of gross margin and e, the random error term.
Profitability analysis requires data on farm-gate price of bamboo, costs of felling and transportation, depot working cost including, salaries, wages and other expenses7. The average price received by the supplying agents from the depots (the price paid by the depot) per truck-load of bamboo was estimated from data collected through the survey. The margin of the supplying agent per load was computed as the difference between the average price received by the agent from the depot and the sum of average purchase price, cost of felling and transportation per load. The average working cost of depot per load was also computed from data collected from selected depots8.
5Permission is home-garden. pass from the
required from the Forest Department for cutting and transporting bamboo from Although, the fee of pass is negligible, the informal expenses for getting the required Forest Department is substantial.
Apart from data on length, girth and weight collected for studying variation in grading, prices of individual pieces were also collected for identifying the price determinants.
7This includes cost of kerosene for lighting, telephone and electricity where available, rent for office and storage yard, depreciation for furniture, interest on working capital, expense for export- way permit and stationery.
8The sum of all the cost incurred at the depot was divided by total number of truck-load of bamboo
6
sold during the year 1993-94 to arrive at the average working cost of depot per load.
5

The wholesale price of bamboo (consisting of poles and leftover) per load was estimated as WlPl + W2P2 where W1 and W2 represent the weight (in metric tonne) of poles and the leftover respectively contained in one load, PI and P2 denote wholesale price of poles9 per metric tonne and price received from Hindustan Newsprint Ltd. for leftover per metric tonne respectively. Marketing margin per load at the wholesale depot was calculated as the difference between the wholesale price received and the sum of the cost of bamboo purchased and the working costs of the depot. Profitability analysis of the depot was done based on the marketing margin per load and the total number of loads transacted during the year 1993-94.
A survey of retail depots was also conducted in one selected consumption centre at Pollachi, in Tamil Nadu, for finding the retail price of bamboo. An attempt was made to estimate the retail price of a truck-load of bamboo poles so as to link the retail price with the wholesale price and farm-gate price of bamboo. At retail depots, it takes often more than a month to dispose of the entire load. Unfortunately, the price received for each lot that makes up a load could not be obtained. However, retail price of different sizes of culms was estimated from the retail price at Pollachi for studying the price spread of bamboo culm10.
Agriculture
Fishing Others
3.2 Marketing channels of bamboo
Supports for banana, betel vines and grape vines; fruit pluckers, implements, fence, etc. Fish-net frame, fishing rod, etc. Framework for earthen bunds11 ladder, cattle stay, fence,
Home-gardens are the major source of bamboo supply in Kerala and contributed 63% of the total supply (see Table 2.1). The marketing channels of bamboo from home-gardens are illustrated in Figure 1. Bamboos extracted from home-gardens are used in construction, industry, agriculture, fishing and for miscellaneous purposes (see Table 3.1). Bamboo collected from home-gardens is also
Table 3.1. Sector-wise end-uses of bamboo
I Consuming. sector I End-uses I Houses, sheds, panthal, concreting supports, 1 I Construction 1 scaffolding.. etc.
I Industries I Pulp, mats. baskets. handicrafts. furniture. etc. I
I platform for bullock-cart, gate, rowing pole for country I I boats, ferry, etc.
The wholesale price of poles per metric tonne was estimated from the wholesale price per load and weight of poles in different loads.
10Price spread refers to the difference between the price paid by the
9
final user and the price received by the producer.
Considerable quantity of bamboo has been use in framework for earthen bunds particularly in the 1 1
kole lands of Thrissur District. Kole lands are low lying paddy fields below the mean sea level.
6

Figure 1 : Marketing channels of bamboo from Kerala home-gardens
Direct collection and
Bamboo from Kerala Home-gardens
Primary Depots
I
i
1
Export L Wholesale Bamboo Depots i Palakkad District
Hindustan Newsprint
Limited
Kerala Retail Depots
Construction Weaving Agriculture Fishing Other Uses
Tamil Nadu Retail Depots
I I
Tamil Nadu
Farmers
Tamil Nadu i Other Users
L. Mysore Paper Mills Limited
Karnataka Retail Depots
Karnataka Other Users
I I
Other States in India
7

utilised as raw material in the Hindustan Newsprint Ltd. and for weaving mats, baskets, etc. by the weaving communities in the State. For many uses in different sectors listed above, bamboo from home-gardens does not reach any organised market, but goes to the final users directly. However, most of the bamboo obtained from home-gardens are marketed through primary as well as wholesale depots in Kerala12. The primary depots are very few and the main function of these isolated depots is to cater only the local requirement of bambooI3. The number of wholesale depots functioned during the year 1994 was 35. The wholesale depots cater the requirements within Kerala as well as the export demand.
the wholesale depots, bamboo moves to retail depots in Kerala14. From such retail depots, it is sold for local use such as house construction, making fence, weaving mats and baskets. etc. Hindustan Newsprint Ltd. purchases bamboo from home-gardens and the 'leftover' from the wholesale depots for pulping.
Bamboo is exported to Tamil Nadu, where, it is sold in retail by depots for construction purposes and other uses. The bamboo poles are also purchased in bulk by farmers from Tamil Nadu for using them as supports for the banana crop for protection against wind. Considerable quantity of the 'leftover' is also sold to Mysore Paper Mills Ltd. in Karnataka State15. Bamboo is also sold to depots in Karnataka for retail sale in very small quantities. Marginal quantities are also sold to other states like Andhra Pradesh, Pondicherry and Gujarat for industrial and agricultural uses.
From
3.3 History of wholesale bamboo depots
There were several bamboo collecting centres in and around Nilambur during the 1940's. Bamboo was abundant in the forests of Nilambur. Substantial quantities were exploited and sold to consuming centres in the neighbouring State of Tamil Nadu. For the collection and sale of bamboo, certain depots came into existence. During the late 1950's, government restricted the supply of bamboo from forests only to the Grasim Industries. This had resulted in the decline in the supply of bamboo to the depots at Nilambur. In this situation, the bamboo traders who were supplying bamboo to Tamil Nadu searched for other sources of supply. This led to the establishment of one private depot at Palakkad town and afterwards the number increased to four. These depots collected most of the bamboo from home- gardens in Palakkad District for sale to Tamil Nadu. Accessibility to Tamil Nadu
12Primary depots are the smallest depots where bamboo is purchased
bamboo is felled for the primary depots, the 'leftover' is left in
either directly from home- sold. 'Leftover' is not available in the primary depots.
the felling site itself and gardens or from small-scale traders and When used for fencing and as fuel.
l 3 There are 11 primary depots in the district of Thrissur, 5 in Malappuram, 1 in Palakkad.
Bamboo is also purchased from home-gardens and sold by certain retail depots in small quantities.
15Most often, certain items of poles are not sold and hence stocked for a long time. Such items are
14
included in the 'leftover' and sold to paper mills.
8
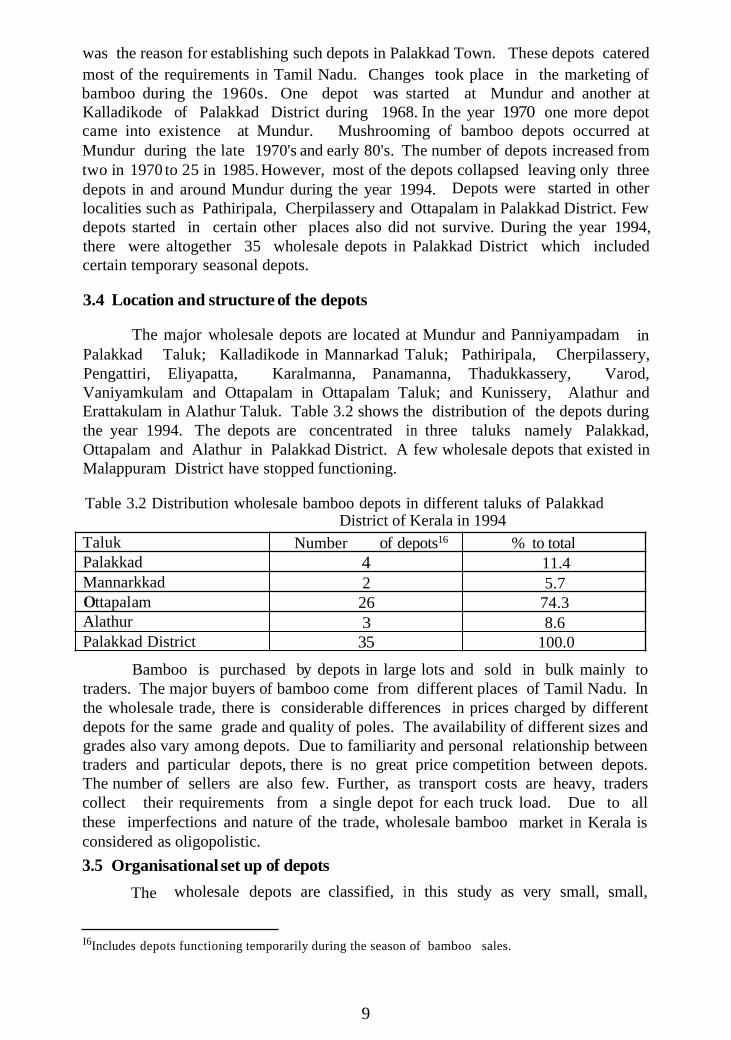
was the reason for establishing such depots in Palakkad Town. These depots catered most of the requirements in Tamil Nadu. Changes took place in the marketing of bamboo during the 1960s. One depot was started at Mundur and another at Kalladikode of Palakkad District during 1968. In the year 1970 one more depot came into existence at Mundur. Mushrooming of bamboo depots occurred at Mundur during the late 1970's and early 80's. The number of depots increased from two in 1970 to 25 in 1985. However, most of the depots collapsed leaving only three depots in and around Mundur during the year 1994. Depots were started in other localities such as Pathiripala, Cherpilassery and Ottapalam in Palakkad District. Few depots started in certain other places also did not survive. During the year 1994, there were altogether 35 wholesale depots in Palakkad District which included certain temporary seasonal depots.
Taluk Palakkad Mannarkkad 0 ttapal am Alathur Palakkad District
3.4 Location and structure of the depots
Number of depots16 % to total
Table 3.2 Distribution wholesale bamboo depots in different taluks of Palakkad District of Kerala in 1994
4 11.4 2 5.7
26 74.3 3 8.6 35 100.0
The major wholesale depots are located at Mundur and Panniyampadam in Palakkad Taluk; Kalladikode in Mannarkad Taluk; Pathiripala, Cherpilassery, Pengattiri, Eliyapatta, Karalmanna, Panamanna, Thadukkassery, Varod, Vaniyamkulam and Ottapalam in Ottapalam Taluk; and Kunissery, Alathur and Erattakulam in Alathur Taluk. Table 3.2 shows the distribution of the depots during the year 1994. The depots are concentrated in three taluks namely Palakkad, Ottapalam and Alathur in Palakkad District. A few wholesale depots that existed in Malappuram District have stopped functioning.
Bamboo is purchased by depots in large lots and sold in bulk mainly to traders. The major buyers of bamboo come from different places of Tamil Nadu. In the wholesale trade, there is considerable differences in prices charged by different depots for the same grade and quality of poles. The availability of different sizes and grades also vary among depots. Due to familiarity and personal relationship between traders and particular depots, there is no great price competition between depots. The number of sellers are also few. Further, as transport costs are heavy, traders collect their requirements from a single depot for each truck load. Due to all these imperfections and nature of the trade, wholesale bamboo market in Kerala is considered as oligopolistic. 3.5 Organisational set up of depots
The wholesale depots are classified, in this study as very small, small,
I6Includes depots functioning temporarily during the season of bamboo sales.
9

medium and big. The criterion adopted for classification of depots is based on the total turnover during the year 1993-94. The depots whose turnover is below 500 metric tonnes per year come under the category of 'very small' depots. The depots whose turnover is 500 to 1000, those with 1000 to 2000 and those above 2000 metric tonnes per year come under the categories of 'small', 'medium' and 'big' depots respectively.
Size of Depots
Most of the depots are managed under individual proprietorship (see Table3.3). The depots consist of a small office building/shed and a storage area
Table 3.3. Distribution of depots according to size and ownership
Number of depots under different ownership
Indi vi du a1 Partnership Total
Very small
S ma1 1
Medium
Big Total
8( 100.0) 0(0.0) 8( 100.0)
12( 100.0) 070.0) 12( 100.0)
7 (70.0) 3 (3 0 .O) 1 O( 100.0)
3(60.0) 2(40.0) 5( 100.0)
30(85.7) 5( 14.3) 35( 100.0)
where bamboo is stacked. The storage area ranges from 360 to 2800 m2. In most cases, the office wall and roof are thatched with coconut leaf on bamboo poles or split bamboo. The office furniture consists of a table and a bamboo platform of 0.6 m high for the length of the shed. In certain big depots, the office has more substantial facilities with electricity, telephone, etc.
The individual owner or one of the partners controls the depot. In partnership firms, the partners are often close relatives. The pattern of employment per depot is shown in Table 3.4. The number of employees including the working proprietor per depot ranges from two in very small depot to 12 in very big depot.
Table 3.4. Average number of persons employed in the different categories of
Total 2 3 8 3.6 Area of bamboo collection
Home-gardens are the source of bamboo marketed through the depots. The
10

percentage distribution of bamboo purchased by different categories of depots from different regions during the year 1993-94 is presented in Table 3.5. Of the total quantity of bamboo sold through depots, home-gardens in Palakkad District contributed the major share (70.9%), followed by the neighbouring districts of Thrissur and Malappuram (26.8%). The collection from home-gardens in far away districts of Kannur and Kasaragod was only marginal (2.3%).
Palakkad District
Table 3.5. the year 19
I I Thrissur and Kannur and Malappuram Districts Kasaragod Districts
Size of depot
50.0
92.2
Verv small 50.0 0.0 100.0
6.7 1.1 100.0 Small
73.9
Big 58.5
70.9
Medium 24.1 2.0 100.0
38.1 3.4 100.0
26.8 2.3 100.0 All
Bamboo purchased from home-gardens in different districts during 3-94 (in percentage)
3.7 Mode of purchase and role of agents
Bamboo is purchased by the depots in two ways either directly or through agents (see Fig. 1). The agents are financed by the depots. They negotiate with the households who are usually identified by load brokers17, settle on a price, fell, size the culms into poles according to depot specifications and transport the finished products to the depot. The advance received by the agent is settled when the products are supplied to the depot. There are 3 to 40 agents per depot during the season of bamboo sales and 1 to 12 during slack season depending upon the size of the depots. Some depots maintain cutting workers for directly collecting bamboo. One interesting observation is that most of the newly started bamboo depots collect bamboo directly.
3.8 Cost of felling and transportation
Felling starts immediately after full payment of the price agreed upon is made. There are 3 to 6 workers per agent for cutting bamboo. After a preliminary pruning, culms are felled one at a time and sized for the maximum out-turn of good quality poles. The length of each piece is determined on the basis of girth and straightness of the culm. The sized culms are then finished into poles at the site itself.
Different products available during felling of bamboo culms are poles and the 'leftover'. Straight, matured and green pieces of 3 m and above, from the bottom to top of the culm, are referred as 'poles'. Other pieces below 3 m; bent,
17Brokers are those persons who bring together the farmers who are producers of bamboo and the supplying agents for the business. Their charge is called brokerage which is claimed either from the farmer/agent or both.
11

damaged, and split pieces; deformed, shriveled and immature culms are included under 'leftover''18. Poles from the bottom portion of the culm are locally known as thatta, that from the middle but the first segment as polla, and the second as madhurupoottu, that from the top as odavu and that from the extreme top as korna. Trade classification is based on the length of the pole and type of culm portion. The different lengths usually available for poles are 3.0, 3.6, 4.2, 4.8, 5.4, 6.0, 6.6, and 7.2 m (10, 12, 14, 16, 18, 20, 22 and 24 feet respectively). End-uses of bamboo poles of different lengths are identified and given in Table 3.6. Poles are used for making houses, agricultural implements, fence and as supports for crops, scaffolding, etc. They are also used for weaving mats, baskets, etc. The bamboo 'leftover' is exclusively used for pulping. The pulp-based industry obtain the major quantity of bamboo raw-material from the forests19.
Table 3.6. General-uses of bamboo poles of different sizes
Size classification
22-24 feet (6.6-7.2 m) long bottom piece
10-24 feet (3.0-7.2 m) long bottom piece
10-20 feet (3.0-6.0 m) long bottom piece
10-16 feet (3.0-4.8 m) long bottom piece
10-12 feet (3.0-3.6 m) long bottom piece
10 feet (3 m) long bottom piece
10-24 feet (3.0-7.2 m) long middle piece
10 feet (3m) long middle piece
14-20 feet (4.2-6.0 m) long top piece
10- 16 feet (3.0-4.8) long top piece
End-uses
Beams, fish-net frames, framework for earthern bunds
Beams
Pillars, scaffolding poles
Supports for banana plants
Concreting supports, rafters, ladder
Ice-cream stick, incense-stick, platform for bullock-carts, bamboo powder for polishing needles
Mats, baskets, handicrafts, beams, rafters
Ice-cream stick, incense-stick
Rowing poles for country boats
Fruit pluckers, rafters
The poles and the 'leftover' are transported to the depots by bullock carts, trucks or tractor-trailers. From the felling sites to the road side, the poles are carried as head-loads. Where the distance from the home-gardens to the depot is short, bullock-carts are most commonly used.
Table 3.7 shows costs of felling and transportation for a truck-load of
Thorns obtained while pruning the culms are excluded. They are left in the home-gardens and are used 18
for fencing.
Grasim industries Ltd. has an exclusive contract with the Government of Kerala to sccure bamboo from the forests for pulping.
19
Bamboo from the forests are extracted by this unit.
12

bamboo. Average cost of felling and transportation is Rs.7916 per truck-load. Among different cost components, cost of felling accounts for about half of the total cost.
Table 3.7 Cost of felling and transportation per truck-load of bamboo
S1.No. Components Amount per load (Rs.) % to total
1 2 3 4 5
Cost of felling 3 904.00 49.3 Transportation 1600.00 20.2
Brokerage 425.00 5.4 Fee for transportation pass 11.50 0.2
Loading and unloading0 850.00 10.7
* Others include informal expenses for getting pass for transportation of bamboo from home- garden, travel, etc.
6 7
3.9 Grading of poles at the depots
0 thers * 1 125.00 14.2 Total 791 5.50 100.0
When the poles arrive at the depots, they are classified as bottom, middle and top portion. The trade classification of bamboo is described in Table 3.6. Poles of different lengths are further sub-classified on the basis of diameter and its uniformity. In bamboo grading, different terms such as super, special, No. 1, No.2, etc. are used to indicate quality. Age girth and weight are the common criteria. There is no standardisation in grading between depots. For instance, grade 1 of a particular item in a small depot may be grade 3 in big depots. The grade specifications are variable in most of the depots (see Appendix-I). Usually the number of various items among depots vary from 20 to 60. The graded poles are stacked in the storage yard. The 'leftover' obtained is also stocked in the yard and supplied to either Mysore Paper Mills Ltd. in Karnataka State or Hindustan Newsprint Ltd. in Kerala in bulk quantities.
Size of culm Farm-gate price (Rs.)
3.10 Farm-gate price
Small Medium Big Very big Average 12.70 19.60 42.80 75.00 37.50
Farm-gate price of bamboo is the lumpsum amount at which the standing bamboo clumps in the home-garden are bought by the depot/supplying agent. This is the price received by the farmer. The price of a bamboo culm varies from Rs. 12.70 for small to Rs. 75/- for very big culm with an average of Rs. 37.50 (see Table 3.8). The estimated purchase price of one truck-load of bamboo, weighing 10.8 metric tonnes, is Rs. 8500.
Table 3.8. Farm-gate price of a standing bamboo culm in home-garden during the year 1994
The factors which affect farm-gate price of bamboo at home-gardens are numerous. Socio economic conditions of the household, willingness to sell the
13

clump and awareness of the market demand are some of them. When bamboo is in competition with agricultural crops or where bamboo grows on disputed boundaries, the clumps usually are sold. Bamboos are also sold when the land is required for construction and other purposes. In these situations, the price at which bamboo is sold is relatively low.
Willingness of the household to sell the clump is an important factor. The aged members who are culturally associated with trees and bamboo usually never permit the destruction of such natural wealth. There is a belief that destruction of such natural wealth will diminish the prosperity of the household. This was seen in certain home-gardens, where very old bamboo clumps are still maintained. If bamboo in such home-gardens is sold considering the immediate need of the household for cash, high prices are sought to be realised.
Farmers are, generally, not willing to sell bamboo during monsoon. This is mainly due to the fact that new shoots emerge during south-west monsoon. However, households belonging to lower income group sell bamboo during monsoon for meeting immediate cash requirements. Most of the farmers are not aware of the market price of bamboo. These lead to realisation of low price for bamboo.
3.11 Price determinants at the depot
There are several factors which determine the price of bamboo poles at the wholesale depot. When the poles are supplied by the agent to the depots, fixing of price for different items is done by the depot. Usually the depot owner finances the supplying agent on the agreement that the agent should supply at the depot a quantity of bamboo poles worth at least the advance received. There are instances where agents have absconded after taking an advance from the depots20. The loss suffered by the depot in such instance is often partially transferred to their other agents and purchasers.
The traders and farmers from Tamil Nadu do not buy bamboo if its green colour is faded. With the loss of colour, the price comes down. The rate of disposal of the bamboo poles determines the efficiency of a depot. Longer storage results in loss of colour and lower prices21. Therefore, depot owners with huge stock will sell poles to bulk customers even at lower prices and sometimes on credit.
Apart from the factors that affect price of bamboo poles at the depots, the was examined using the effect of length, girth and weight of poles on price
These may be the reasons that certain newly started depots collect bamboo from home-garden directly although they have very limited number of supplying agents. These depot owners are formerly clerks or supplying agents of other depots and who have gained expcrience in the business.
Bamboo poles with a particular end-use is diverted for other uses. For instance, the decayed items of 18 feet (5.4 m) length are sold as supporting poles for concreting, after cutting away the decayed portion at the top. The prices realised for those items are relatively very low. The shriveled pieces are sold as raw material for pulping.
2 0
21
14

regression analysis. The results are summarised in Tables 3.9 and 3.10. The multiple correlation co-efficients along with adjusted R2 in brackets in respect of small, medium and big depots are presented in Table 3.9. Among different relations, the highest adjusted R2 value is observed for the relation of price versus length and weight and is consistent in small, medium, and big depots. That is, 78% of the variation in prices is explained by length and weight of the poles in all the depots. Their estimated regression equations are presented in Table 3.10. In small depots,
of bamboo polesSize of depot
Small
Medium
Big
All
Table 3.9 Multiple correlation coffecient of price versus length, girth and weight
length girth weight length, length, girth, length,
weight girth weight weight girth.
0.59 0.73 0.75 0.78 0.87 0.79 0.87 (0.35)# (0.53) (0.56) (0.60) (0.76) (0.63) (0.75) 0.86 0.60 0.84 0.87 0.94 0.84 0.94 (0.75) (0.35) (0.70) (0.761 (0.89) (0.71) (0.88) 0.77 0.80 0.88 0.88 0.90 0.88 0.80 (0.59) (0.64) (0.77) (0.78) (0.8 1) (0.77) (0.8 1 ) 0.69 0.6 1 0.84 0.75 0.88 0.84 0.88 (0.48) (0.38) (0.71) (0.60) (0.78) (0.71) (0.77)
Table 3.10. Estimated regression equation of price(P) versus length(L) and weight(W) of bamboo poles
76% of the variation in prices is explained by the respective lengths and weight of pole, 89% in medium and 8 1 % in big depots. Taking all depots together, 78% of the variation in prices is explained by the length and weight of poles. Therefore, the length and weight of poles have significant role in determining the price of that pole at the wholesale depot apart from other factors discussed earlier.
The rate of gross margin (r) of bamboo poles sold at selected depots is presented in Table 3.1 1. The rate of margin ranges from 13% for poles of top portion to 18% for poles of bottom. Among poles of bottom portion, short poles have received high gross margin (1 9%) whereas long poles have only 16%.
15

Table 3.11 Rate of gross margin of bamboo poles sold at wholesale depots
n
30
24
54
26
8
88
I
I I
r %
19
16
18
16
13
18
Items
Bottom Portion - Short
- Long
- All
Estimated equation R2*
Ps=1.19 Pb 0.99
Ps=l.16 Pb 0.97
Ps=1.18 Pb 0.99
Middle Portion
Top Portion
All
* All are statistically significant at 1 % probability level. Pb and Ps represent the buying price and the wholesale price respectively.
Ps= 1.16 Pb 0.99
Ps=l.13 Pb 0.97
Ps=1.18 Pb 0.98
3.12 Profitability of bamboo trading in wholesale depots
The average price received by supplying agent from the depot (cost of bamboo purchased by the depot) per truck load of poles and leftover together is estimated as Rs. 17989. The average working cost of depot per truck load is worked out as Rs. 2084 (see Table 3.12). The average wholesale price of bamboo per metric tonne is estimated as Rs. 2145 and price received for leftover at the depot is Rs. 1050 per metric tonne. The weight of poles and leftover contained in a truck-load of bamboo from the home-gardens was found to be 10.8 metric tonne of which poles accounted for 9.277 metric tonne (85.9%) and the leftover 1.523 metric tonne (14.1 %). The wholesale price of one load of poles and leftover together is worked out as Rs. 21498.
1 2 3
Table 3.12. Average working cost of wholesale depot per truck load of bamboo
Land rent Interests on working capital Salaries, wages, etc .
SI.No. 1 Components I Amount per load (Rs) I % to total
4 5 6
Cost of export-way permit 11.00 0.5 Other expenses 224.30 10.8 Total 2084.05 100.0
42.50 150.00 1656.25
2.0 7.2 79.5
Estimates of the price of bamboo at home-garden, the net margin of the supplying agent and that of the wholesale depot per truck load of bamboo are summarised in Table 3.13. The price received by the farmer is 40% of the wholesale price and rest 60% is the gross marketing margin. This indicates a fair return for a crop for which no inputs or expenditure is incurred. The net margin of the supplying agent is Rs. 1574 (7.3%). On an average 12.3 man-days are required for collecting one truck load of bamboo by the agent and a maximum of 30 loads may be collected per annum. Based on this, the net income of the supplying agent comes around Rs. 47,000 per annum.
16

Table 3.13. Marcketing margin per truck load of bamboo sold at wholesale depots
Sl.NO Components Amount per truck load of' bamboo (Rs)
1 Price at home-garden 8.5 00.00
3 Net margin of the supplyins agent 1,573.50 4 Working cost of depot 2.084.05
2 Cost of felling and transportation 7.91 5.50
i Net margin of the Wholesale depot 1.424.95 2 1.498 00 Price at wholesale depot(Tota1)
The profitability of an average depot is shown in Table 3.14. The net margin of the wholesale depot is Rs. 1425, which is 6.6% of the price at the depot. The net profit per annum worked out is Rs. 201,000. Profitability analysis reveals that the returns are modest considering the amount advanced, goodwill created and markets served.
Table 3.14. Profitability of an average wholesale marketing depot during 1993-94
during 1993-94.
% to total 39.5 36.5 7.3 9.8 6 6
100.0
Net margin of the wholesale depot (Rs. per truck load)
Mean number of truck loads of bamboo sold during the year 1993-94 per depot*
N e t profit o f the wholesale depot per year (Rs)
3.13 Price spread of home-garden bamboo
*The seasonal depots are excluded
1425
200925
Table 3.15 shows the price spread of a single culm moving from home- gardens to the final user. For an average culm, the price spread is from Rs. 37.50 to Rs. 132.10 from the home-gardens to the final user. Of the price paid by the final user, the producer's share is 28.4% ranging from 22.1% for a small culm to 31.2% for a very big culm. Culms of larger size fetch more price at the wholesale as well as retail markets.
Table 3.15 Price spread of a single bamboo culm from home-gardens to final user during 1993-94
* The figure in brackets is percentage to retail price.
17

4. PATTERN OF BAMBOO TRADE AND RETAIL MARKETS
This section describes the sector-wise sale of bamboo through the wholesale depots within and outside Kerala. Seasonality of sale is examined and the retail markets are identified. Further the trends in price and export demand are examined. The employment generated in production of bamboo from home-gardens to wholesale marketing is also estimated in this section.
4.1. Methodology
Data on quantity of bamboo sold in different sectors within and outside Kerala collected through the census survey of depots were used for examining the sector-wise sale during the year 1993-94. Based on data on the month-wise export of bamboo during the period 1988-89 to 1993-94 compiled from the registers maintained at the border forest check-posts, seasonality of sale was studied. Data on number of truck-loads of bamboo and destination were also collected for the year 1993-94 to identify the retail markets outside Kerala.
Based on prices of bamboo poles for the period 1967-68 to 1993-94 collected through interviews with several veteran bamboo traders, average price per metric tonne for each year was worked out. The time series of current prices was converted into real prices for analysing the trend22.
In this study, production of bamboo refers to the quantity of bamboo extracted from home-gardens and supplied to the wholesale depots. Employment generated in production and marketing includes the employment created from the time of felling of bamboo to the sale of the products at the wholesale depots. The employment generated in production was estimated based on data collected through the survey of home-gardens (see section 3.1). The average quantum of employment of agents, brokers, labour used in felling and finishing, head- loading, transporting, loading, unloading and sorting were worked out per truck- load of bamboo. The average employment per load was multiplied by the total number of loads sold through the wholesale depots to arrive at the employment generated in production of bamboo.
Total number of persons in different categories such as working proprietor, manager, workers and other staff in various depots during the year 1993-94 was estimated based on data collected through the census survey of the wholesale depots. Total number of persons in each category in the depots of various sizes multiplied by the respective average number of working days, were added together to provide the employment generated during the sale of bamboo in wholesale depots.
22 The change in current prices over time is attributed to I ) a real The effect of inflation is eliminated by deflating the current prices, with All India wholesale indices with base year 1981-82 = 100, to real prices.
change in price and i i ) inflation. price
18

4.2 Destination and sector-wise sale
Size of
Table 4.1 presents the destination and sector-wise sale of bamboo through depots during the year 1993-94. The total quantity sold is estimated as 43384 metric tonnes of which 5 big depots accounted for 40.3%, 10 medium depots 30.4%, 12 small depots 24.2% and the 8 very small depots the remaining 5.1%. Of the total quantity, bamboo used within Kerala was only 5896 metric tonnes which accounted for 13.6%. The quantity exported to Tamil Nadu was 28718 metric tonnes (66.2%) and that to Karnataka and other states was 8771 metric tonne, 20.2% of the total.
within Kerala I to Tamil Nadu I to Karnataka Total I Quantity (in metric tonne) sold
Table 4.1. Destination and sector-wise sale of bamboo through depots during the year 1993-94
Depot
Very small
Small
Medium
Big
All
Constru- Agri- ctions culture and others
281.8 0.0 (12.9)# (0.0)
767.8 193.2 (7.3) (1.8)
1461.2 135.5 (11.1) ( 1 .O)
2083.1 0.0 ( 1 1.9) (0.0)
4593.9 328.7 (10.6) (0.8)
Hindustan News Print Limited
48.7 (2.2)
236.6 (2.2)
295.9 (2.2)
392.3 (2.2)
973.5 (2.2)
Agri- Depots culture
771.1 661.0 (35.2) (30.1)
4916.5 2584.7 (46.7) (24.6)
4782.6 3603.5 (36.2) (27.3)
6369.8 5028.5 (36.5) (28.8)
16840.0 11877.7 (38.8) (27.4)
Mysore Paper Mills
390.5 (17.8)
(15.7)
2653.6 (20.1)
3267.3 (18.7)
7968.9 (18.4)
1657.5
* Includes the quantity moved to other states like Pondicherry, Andhra Pradesh and Gujarat. The
# The figures in parentheses are percentages to total. quantity is very negligible and hence not separately shown.
Depots*
39.3 2 192.4 (1.8) (1 00.0)
(1.7) (1 00.0)
264.6 13 196.9 (2.1) (100.0)
331.0 17472.0 (1.9) (100.0)
(1.8) (100.0)
166.8 10523.1
801.7 43384.4
4.3 Seasonality
Figure 2 shows the percentage distribution of month-wise sale of bamboo through the depots to Tamil Nadu during the period 1988-89 to 1993-94 (see Appendix-2 also). Month-wise sale from December to March are higher than the other months in all years indicating the seasonality of sale.
4.4. Retail markets and final use
The bamboo sold through the depots is used for construction and miscellaneous purposes within and outside Kerala. Of the total quantity sold through the depots, use in constructions and miscellaneous purposes accounted for
19

N 0
1,
12
10
- S s - C ro s
6
4
2
a
Figure 2: Monthly export of bamboo from depots in Palakkhad, Kerala to Tamil Nadu from 1988 - 1994, oxpressed as a percentage of the annual total (metric tonnes)
e 0 .
0 .
* . ' .
-0- 198889 % - - 6 - .1990 91 % -f- 1992-93 %
-Q- iga9-9o yo -X- 1991-92 % + 1993-94 %
Jan Feb Mar Aug Sep Oct Nov Dec Apr May Jun Jul

Table 4.2 Export of bamboo poles from the depots to different places in Tamil Nadu23
Places Salem Pollachi Anthiyur Erode Dindigal Gopalapuram Madurai Pothannur Parimathivelur Ambur Ney veli Trichy Mohannur Kattuputhur Thottiyam Other places"
during the year 1993-94 Quantity (metric tonne)
3153.6 2484.0 1609.2 1144.8 1069.2 1026.0 993.6 572.4 496.8 42 1.2 4 10.4 399.6 367.2 356.4 270.0
10065.6 24840.0
% to total 12.70 10.00 6.48 4.6 1 4.30 4.13 4.00 2.29 2.00 1.70 1.65 1.61 1.48 1.43 1.09
40.53 100.00 All place
* Includes a number of places in Tamil Nadu and a few places in pradesh and Gujarat.
Pondicherry, Andra
10.6% in different places within Kerala (see Table 4.1). The demand from these sectors in Tamil Nadu is met from the bamboo sold through the retail depots there, which accounted for 38.8% of the total quantity of bamboo sold from the wholesale depots. Table 4.2 shows the export of bamboo poles to different places in Tamil Nadu during the year 1993-94. The data includes both the quantity of bamboo taken by retail depots and that for other purposes. Figure 3 (see Appendix- 3 also) indicates the spread of several consumption centres within and outside Kerala.
Use of poles in agriculture sector is in the form of supports for crops like banana, plantain, betel vines, etc. The quantity of bamboo poles purchased from depots and used as supports for banana within Kerala is only marginal (0.8%). It is estimated that about 27.4% of the total quantity of bamboo sold through the depots is directly used as supports for banana in Tamil Nadu (see Table 4.1). Bamboo poles are also purchased by farmers from the retail depots for using them as supports for banana.
The demand for poles as supports is seasonal during the month from December to March24 (see Appendix-3 also). Casuarina poles are used as a substitute for
This does not include the quantity of bamboo sold from depots in Alathur Taluk and moved to Tamil Nandu through the inter-state exits where there are no forest check-posts. The total quantity given will not tally with that in Table 4.1
During the season, most of the depots in Palakkad District are involved in collecting supporting poles for banana. The traders stock as much quantity as possible expecting increased demand for supporting poles from banana cultivators. Sometimes this will lead to increased stocking in most of the depots. When the season is over, in certain depots banana supporting poles are accumulated leading loss to the trader.
23
24
21

Figure 3. Trading of rural bamboo from wholesale depots in Palakkad District
32
bamboo poles. Increasing availability and relatively lower price of casuarina poles are likely to reduce the demand for bamboo poles in Tamil Nadu.
Green middle portions are used for weaving baskets to store and transport fruits such as tomato, orange etc. Bamboos from the retail depots are also used in smaller quantities by industrial units for manufacturing ice-stick, incense-stick, etc.
The bamboo 'leftover' from the wholesale depots caters the paper industry in Kerala and Karnataka State. Hindustan Newsprint Ltd. and Mysore Paper Mills Ltd. are the only two consumers of 'leftover'.
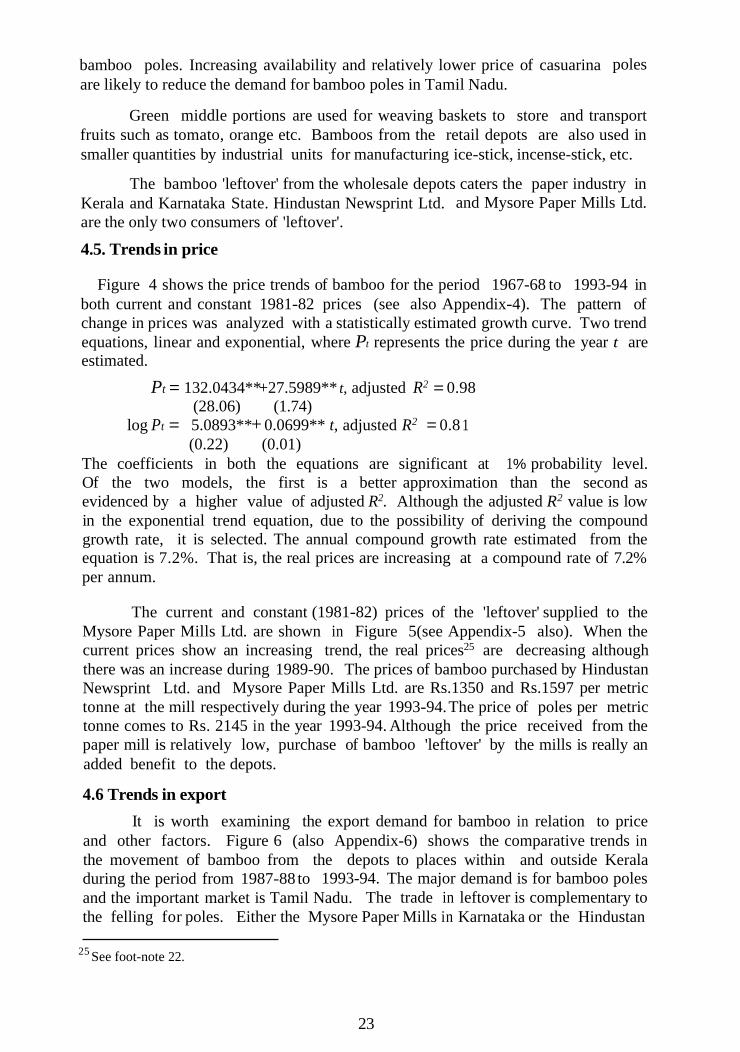
4.5. Trends in price
Figure 4 shows the price trends of bamboo for the period 1967-68 to 1993-94 in both current and constant 1981-82 prices (see also Appendix-4). The pattern of change in prices was analyzed with a statistically estimated growth curve. Two trend equations, linear and exponential, where Pt represents the price during the year t are estimated.
Pt = 132.0434** +27.5989** t, adjusted R2 = 0.98 (28.06) (1.74)
log Pt = 5.0893** + 0.0699** t, adjusted R2 = 0.8 1
The coefficients in both the equations are significant at 1 % probability level. Of the two models, the first is a better approximation than the second as evidenced by a higher value of adjusted R2. Although the adjusted R2 value is low in the exponential trend equation, due to the possibility of deriving the compound growth rate, it is selected. The annual compound growth rate estimated from the equation is 7.2%. That is, the real prices are increasing at a compound rate of 7.2% per annum.
(0.22) (0.01)
The current and constant (1981-82) prices of the 'leftover' supplied to the Mysore Paper Mills Ltd. are shown in Figure 5(see Appendix-5 also). When the current prices show an increasing trend, the real prices25 are decreasing although there was an increase during 1989-90. The prices of bamboo purchased by Hindustan Newsprint Ltd. and Mysore Paper Mills Ltd. are Rs.1350 and Rs.1597 per metric tonne at the mill respectively during the year 1993-94. The price of poles per metric tonne comes to Rs. 2145 in the year 1993-94. Although the price received from the paper mill is relatively low, purchase of bamboo 'leftover' by the mills is really an added benefit to the depots.
4.6 Trends in export
It is worth examining the export demand for bamboo in relation to price and other factors. Figure 6 (also Appendix-6) shows the comparative trends in the movement of bamboo from the depots to places within and outside Kerala during the period from 1987-88 to 1993-94. The major demand is for bamboo poles and the important market is Tamil Nadu. The trade in leftover is complementary to the felling for poles. Either the Mysore Paper Mills in Karnataka or the Hindustan
See foot-note 22. 25
23

t3 P
Figure 4: Price trends of bamboo sold through depots in Palakkhad, Kerala for selected years from 1967 to 1994
! I __ I3 Curtent cost
BlConstant piice (1931 -82)
1967-68 1974-75 1979-80 1984-85 1989-90 1993-94

Fig 5: Price of bamboo waste supplied from depots in Palakkhad, Kerala to Mysore Paper Mills from 1987 - 1994
2500
2000
0, r r 0 m - 0 1500 L. - E $ 1000
L 0) n
P d a9
500
0 ' I
1989-90 1990-91 1991 -92 1992-93 1993-94 1987-88 1988-89
Fig 6: Movement of bamboo from depots in Palakkhad to Kerala and neighbouring states from 1987 - 1994
70000
60000
50000
40000
30000
Total
To Tamil Nadu
J- To Karnataka
/
Within Kerala d
0 1987-88 1988-89 1989-90 1990-91 1991-92 1992-93 1993-94
-
25

Newsprint Ltd. in Kerala absorbs the leftover. The movement of bamboo towards Karnataka (mainly to Mysore Paper Mills) was compiled from the registers of Vazhikadavu border forest check-post. The transport of bamboo within Kerala was studied using data from the forest check-post located at Ramanattukara (between Thrissur and Kozhikode Districts) and at Vaniyampara (between Palakkad and Thrissur Districts) (Appendix-7). As there are several alternate roads, the data presented is to be considered as partial. It can also be seen that the trend in the movement of bamboo to various markets is fairly stable with a slight downward trend. The proportion of poles and leftover is also fairly constant. The movement of bamboo poles to Tamil Nadu is declining at a compound rate of 5.4% per annum whereas the price of bamboo is increasing at a compound rate of 7.2% per annum. It is reported by bamboo traders that the growing stock of bamboo has been declining rapidly. Initially most of the bamboo coming to the markets were
Category Employment per truck load of bamboo EmploymentMinimum Maximum Mean Mandavs 1
during 1993-94 (mandays per year
I
Table 4.3. Employment generated in production of bamboo from home-gardens
collected from home-gardens in Palakkad District only. But, of late, bamboo is being collected from the neighbouring districts of Thrissur and Malappuram also (see Table 3.5). Very recently, traders collected bamboo from places in distant districts like Kannur and Kasaragod (see Table 3.5 and Appendix-8). These facts reveal that the bamboo resources are getting depleted and the reduction in the export may be due to decline in supply.
4.7 Estimate of employment in production and marketing
Table 4.3 and 4.4 show the estomate of employment generated in productionof bamboos from home gardens and the generated during sale of bamboo at the
I % Agents Brokers Felling & finishing Head load - Men
7.3 16.8 12.3 49729 14.1 3.3 8.0 5.6 2264 1 6.4 32.0 80.0 48.8 197298 55.8 1.0
# Others include workers involved in transporting, loading, unloading and sorting.
3.0 2.0 8086 2.3 -Women
Others 4.0 18.0 8.3 33557 9.5 8.3 14.0 10.4 42047 11.9
26
Number of persons Employment Category Very small Small Medium Big
depot depot depot depot per year Working proprietor 8 12 10 5
Depot workers 8 12 30 35 Clerk, watcher, etc. - 12 30 15
Manager - 10 5
Total 16 , 36 , 80 60
Table 4.4. Employment generated during the sale of bamboo at wholesale depots
mandays %
during the year 1993-94
9195 16.5 4575 8.2 24445 44.0 17385 31.3
, 55600 , 100.0

depots respectively. Felling of bamboo and finishing accounted for most of the employment generated (55.8%) and women head-loading accounted for 9.5% of the employment generated in production of bamboo from home-garden. Of the employment generated during sale, depot workers accounted for the major share (44.0%). The total employment generated in production and marketing is estimated as 409,000 mandays of which women labour accounted for 8.2%.
Bamboo cutting is strenuous and risky. It also requires skill to avoid thorns and snakes. Traditionally, the socially and economically backward communities of Sambava, Kavara and Paraya who are known as Mulayans (literally bamboo workers) are engaged in this task. Almost all the workers, engaged in cutting and finishing of bamboo, belong to this caste. The majority of depot workers also belong to this category. Therefore, about 222,000 workers comprising of 54.2% of the total employment in production and marketing of bamboo belong to socially and economically backward class. Apart from this, some head load workers and a few workers and agents belong to this community26.

5. SOCIO-ECONOMIC ASPECTS OF BAMBOO WEAVING COMMUNITIES
The weaving communities in Kerala mostly depend on bamboo from home- gardens. The livelyhood of these socially and economically weaker sections depends on the bamboo availability in home-garden. The socio-economic condition of bamboo weaving communities, the economics of the household production system and the problems faced by the weaver households are examined in this section.
5.1. Methodology
Bamboo weavers in Kerala belong to 'Scheduled Castes'. Among the districts in Kerala, Palakkad has the highest Scheduled Caste population and then Thrissur District. Of the total Scheduled Caste population in the State, Palakkad and Thrissur Districts together accounted for 27% (Government of Kerala, 1988). Moreover, home-gardens in Palakkad and Thrissur Districts are the major sources of bamboo supply to the different consuming sectors in Kerala and for export (Krishnankutty, et al., 1995). Considering the above facts, Palakkad and Thrissur Districts were selected and this study was confined in these two districts. The study was based on data collected through a socio-economic survey of 26 bamboo weaving colonies in the above two districts.
5.2 Socio-economic situation
The bamboo weaving communities are socially and economically backward sections of the society. In Kerala, bamboo weaving has been traditionally performed by people belonging to Sambava, Paraya and Kavara Communities which are classified under 'Scheduled Castes'. Very rarely, people belonging to 'Scheduled Tribes' also engage in bamboo weaving. For example, a 'Kurava' family in Nandankilai Kavara colony in Palakkad District carries out bamboo weaving. It is, perhaps, due to their life
One depot owner also belongs to this caste. He started his business recently with the help of a 26
government sponsored loan.
27

within the Kavara colony and thereby they learned the art of weaving.
In most of the districts in Kerala, bamboo weavers belong to either Sambava or Paraya whereas those in Palakkad District belong to Kavara. The survey of bamboo weaving colonies in Thrissur District revealed that most of the weaver household belong to Sambava Community. Sambava colonies in Thrissur District and Kavara colonies in Palakkad District alone were considered in the present study. The social and economic conditions' of the weaver households are discussed below.
Community No. of persons per household
The weaver households of both Sambavas and Kavaras live in clusters. Thesize varies from 4 to 30 houdseholds per cluster. The average household size is 5.5
Table 5.1. Average size of Sambava and Kavara households
Male Female Total Sambavas 2.6 2.9 5.5
persons in Sambavas households and 5.9 persons in Kavara households. The average number of females per households in both the communities is the same (see Table 5.1).
Kavaras 3.0 2.9 5.9
A comparison on the mode of living of Sambava and Kavara communities revealed that the standard of living of the former is much better than that of the latter. The neatness of Sambava families are far better than Kavaras. The mode of dressing of Sambavas is similar to that of high caste Hindus. Sambavas usually wear simple and neat dress whereas most of the Kavaras are not bothered about the dress and not even ready to wash it properly. It is observed that the Kavaras are much indifferent to social progress as compared to Sambavas. Most of the weavers are addicted to liquor. The social backwardness in both of the communities is partly due to the feeling that bamboo weaving is not remunerative and has no social acceptability.
Majority of households inherited their home-garden from their forefathers and some of them have received land from the government under the Lakh House Scheme. Table 5.2 presents the percentage distribution of weaver households on the basis of size of home-garden. Of the total number of Sambava households. 29% of the weaver households have land holding with size above 0.04 ha whereas almost all the weaver Kavara households in the sample have land holding with size below 0.04ha. None of them has land holding with size above 0.1 ha in both of the communities.
Table 5.2. Percentage distribution of weaver households according to size of home-garden
I Size of home-garden
(in ha) Community
Sambava Kuvara
Below 0.02 0.02 - 0.04 0.04 - 0.10
31.5 39.7 28.8 0.0
24.1 75.9
All 100.0 100.0
The housing conditions of the Sambavas are generally better than that of the Kavaras when the size and roof pattern of houses are taken into consideration (Table 5.3 and 5.4). Most of the houses of both the communities are small in size. About 69% of
28

Size Type of roof of house of house*
Very small Small Medium
* In this study, houses having plinth area below 10 m2 are considered as very small, 10-25 m2 as small, 25-50 m2 as medium and above 50 m2 as big.
the houses of Sambavas are tiled and small to medium in size whereas only 36% of the house of Kavaras come under the above category. The government has provided land free of cost, grant for constructing houses and other basic facilities for the upliftment of these weaker sections. But, it is reported that most of them have not even made the foundations of houses with the money granted by the government. This is clearly observed in the case of Kavarus. They are still living in thatched small huts. In many cases, the hut consists of one room and all the family members are forced to live together. This adversely affects their hygiene and sanitation. Whereas most of the Sambava families have small beautiful houses constructed with and even without the financial assistance provided by the government.
Table 5.5. Percentage distribution of bamboo weavers according to education level
Table 5.3. Percentage distribution of residential houses of weaver Sambava households according to size and type of roof
Thatched huts Thatched & tiled Tiled All
on bamboo rafters
9.0 1.8 12.6 23.4 3.6 2.7 52.3 58.6 0.9 0.9 16.2 18.0
Big 0.0 0.0 0.0 0.0
All 13.5 5.4 81.1 100.0
Size Type of roof of house of house*
Very small Small Medium Big All
The level of literacy is 76% Sambava in households and 40% in Kavara households (Table 5.5). The adult education programme launched by the State
Table 5.4. Percentage distribution of residential houses of weaver Kavara households according to size and type of roof
Thatched huts Thatched & tiled Tiled All
20.7 ‘5.2 17.2 43.1 3.4 17.2 34.5 55.1 0 0 1.8 1.8 0.0 0.0 0.0 0.0
24.1 22.4 53.5 100.0
on bamboo rafters
Educational level
29
Community Sambava Kavara
Illiterate Students Lower primary Upper primary High school Beyond High School All
24.3 59.8 13.5 5.7 14.5 15.2 15.4 11.0 14.4 8.0 17.9 0.3
100.0 100.0

Government has helped majority of the weavers to read and write along with their traditional job. The higher illiteracy in Kavara households is due to the fact that they, generally, send their children for other types of works even at the age of 10 years.
Community
The Sambavas send their children to school. Some of them have Secondary School Leaving Certificate pass and above qualifications (18%) and even have government job. The improvement in education and technical knowledge has led to the lack of interest in weaving in most of the Sambava households.
~
Number of households Weaver Non-weaver Total
5.3 Pattern of employment
Formerly, all the households belonging to Sambava and Kavara Communities were engaged in bamboo weaving. Due to cultural and social reasons, certain households which were carrying out weaving have discontinued their traditional job. The distribution of weaver and non-weaver households in the sample Sambava colonies in Thrissur and Kavara colonies in Palakkad District is presented in Table 5.6. Non-weaver households are those where the members are formerly weavers and presently not carrying out weaving. The data show that bamboo weaving is presently carried out only in about 55% of the Sambava households and 69% of Kavara households. In the remaining 45% and 3 1 % of the Sambava and Kavara households respectively, the members, who were formerly engaged in weaving, took up some other job. This is due to the availability of alternative employment in other sectors particularly in agriculture and construction sectors.
In the Sambava community, the average number of working members per weaver household is 2 persons whereas in the Kavara households it is 3 persons (Table 5.7). The female working members are more in both the communities showing the dominance of females in this cottage industry.
Table 5.6. Distribution of weaver and non-weaver households in sample Sambava colonies in Thrissur and Kavara colonies in Palakkad Districts
Sambava
Kavara
All
111 89 200 (55.5) * (44.5) ( 100.0) 58 26 84
(69.0) (3 1 .0) (100.0) 169 115 284 (59.5) (40.5) ( 100.0)
Community
Sambava Kavara
Table 5.7. Average number of working members per household and working days per month
Working members Working days per month Male Female Total
0.8 1.3 2.1 20.7 1.4 1.6 3.0 19.0
30

The age class distribution of working members in the Sambava and Kavara weaver households are presented in Table 5.8. Of the total number of weavers in the Sambava households, 52% of them are above age 50 years whereas only 31% of the total number of weavers in Kavara households are more than 50 years old. On the other hand, the number of weavers having age below 30 years is 12% in Sambava households and 37% in Kavara households. More over, when the number of male weavers having
Table 5.8. Percentage distribution of working members in the Sambava and Karava weaver households on the basis of age
Age (in years) Below 20
20 - 30 30 - 40 40 - 50 50 - 60 60 - 70
Above 70
All
Male 0.4 4.7 5.6 6.5 7.8
10.4 3.0
38.4
Sambava
Female 0.9 6.0 7.0
16.8 15.9 12.0 3 .0
61.6
Total 1.3
10.7 12.6 23.3 23.7 22.4 6.0
100.0
Male 1.7 9.7 9.7 6.7
11.9 5.7 1.1
46.5
Kavara
Female 8.5
17.0 5.7 9.7 8 .o 4.0 0.6
53.5
Total 10.2 26.7 15.4 16.4 19.9 9.7 1.7
100.0
age below 30 years in Sambava households is 5% of the total, in Kavara households it is 11%. This indicates that the number of male youngsters in both the communities are low. With the increase in the level of education and availability of remunerative employment in other sectors, the weavers do not prefer the weaving job. This is already evident in the case of Sambava households where most of them are doing works in fields other than bamboo weaving. Present generation of Sambavas shows a trend towards a change from traditional job to other types of work having social status. If this trend continues, the possibility of vanishing the bamboo weaving cottage industry cannot be ruled out.
5.4 Pattern of household income
The average annual income of weaver households from different sources is estimated based on data collected through the sample survey. Table 5.9 shows the average annual income from different sources of a Sambava household and Table 5.10 presents that of a Kavara household. The average annual income from all sources is estimated as Rs.19502 in Sambava household and Rs.16322 in Kavara household. It indicates the relative economic position of an average weaver household of Sambava and Kavara.
For both the Sambavas and Kavaras, the most important source of income is bamboo weaving. Of the total household income of a weaver family, bamboo weaving contributed on an average 47% in Sambava household and 73% in Kavara households. Wage labour is the secondary source of income in both Sambava and Kavara households. The contribution of other works such as job in government or industrial units, tailoring etc. to the total income in Sambava households is about 20%, that in Kavara households is only 8%. The contribution of home-gardens in the total income of both the communities is negligible in the sample households.
31

Table 5.9. Average annual income (Rs) of a weaver Sambava household
Source of income
Source of income
Annual income of household members Male Female Children
Bamboo weaving
Wage labour
Home-garden
Others
Bamboo weaving
Wage labour
Home-garden
Total
6578.10 5357.10 (40.30)* (32.80)
2232.85 827.50 (13.70) (5.00)
-
Annual incomeMale
Others
Total
3726.80 (19.1)*
5301.60 (27.20)
-
3010.30 (1 5.40)
12038.70 (61.70)
806.00 3 10.75 150.00 (4.90) (2.00) (0.90)
96 16.95 6495.35 2 10.00
of household Female
5309.60 (27.2)
1018.20 (5.20)
794.50 (4.10)
I (58.9) I (39.8)
members Children
( 1 .3)
58.30 (0.3)
209.50 (1.10) -
0.00
With respect to the income from bamboo weaving, the contribution offemale members is more than that of male in Sambava households where as the contribution of male workers is more than that of the females in Kavara house holds(Table 5.11). This is due to the fact that weaving is carried out only by
Table 5.11. Percentage distribution of average anuual income
Home- garden -
-
73.30 (0.40) -
73.30 (0.40)
Community Weavers Sambava Kavarn
generated through bamboo weaving by male and female workers
Male 41.0 55.1 Female 58.4 44.9 Chi1dren 0.6 0.0
100.0 100.0
Total
9094.70 (46.6)
6529.30 (3 3.50) 73.30 (0.40)
3 804.80 (19.50)
19502.10 ( 100.00)
* The figure in parentheses are percentages to total income from all sources by all members.
Table 5.10. Average annual income (Rs) of a weaver Kavara household
0.00 (0.00) 60.00 (0.40) -
Home- garden
-
0.00 (0.00)
Total
11935.20 (73.10)
3 120.35 (19.10)
0.00 (0.00)
1266.75 (7.80)
I
* The figure in parentheses are percentages to total income from all sources by all members.
The contribution of children in the total income through bamboo weaving is low. This shows their lack of interest in the traditional job.
32

the old members in Sambava households (see also Table 5.8) and the others are engaged in other types of works. The employment opportunities for male members of the Kavara households in cooli works and other sectors are limited due to socio- cultural reasons. This has led to the relatively full time involvement in bamboo weaving.
Process
Procurement Preparation of sliver Weaving
All
Marketing
5.5 Household Production of Bamboo Mats and Baskets
Weaving of bamboo mats, baskets, etc. is carried out in households and the system of production is household production. The different products and their end-uses are shown in Table 5.12.
An important feature of bamboo weaving in household is the collective participation of all the members of the family in weaving . Another feature is that this work has no specific time for beginning and ending as in the case of works in other sectors. Usually, weavers work during the time from sun rise to sun set. The weaving house wives participate in the production process interspersed with other household activities and looking after their children.
Table 5.12. Local names of important bamboo products and their uses
Time Percentage
2 - 6 9.5 10- 16 30.9 16 - 24 47.62 - 8 12.0
30 - 54 100.0
(in hrs/culm)
Local names of products Uses a) Large mats 1. Panambu For drying paddy, tapioca, pepper, ginger,
b) Baskets 1. Parakotta 2. Chorukotta
3. Mannukotta 4. Chanakakotta 5. Meenkotta 6. Chavarukotta 7. Pazhakotta 8. Vettilathattu
turmeric, copra, arecanut, etc. in sun light For measuring paddy after harvest. For keeping boiled rice for dinner in connection with marriages and other functions For carrying soil For carrying cow-dung For carrying fish For collecting and transporting leaf litter For transporting fruits For carrying betel leaf
c) Winnower 1. Muram For winnowing rice, gram, etc 2. Kombumuram For winnowing paddy
The different stages in the household production are procurement of bamboo culms, preparing slivers, weaving and marketing. The distribution of time for different stages is given in Table 5.13. The activities in each stage are discussed below.
Table 5.13. Time required for different activities in the production process (per culm)
33

5.5.1. Procurement of bamboo culms
The only raw material required in the household production of mats, baskets, etc. is bamboo culms and the first stage in the production process is its procurement. The different sources of bamboo for weaving are own home-garden, other home-garden, private depots and forests. The contribution of different sources of bamboo used for weaving in sample households is given in Table 5.14. Bamboo is usually procured by most of the households from the nearer or even distant home-garden. About 62% of the weaver households depend on other home-garden for bamboo. Bamboo is often purchased from private bamboo depots by weaver households particularly in Palakkad District. Weavers residing nearby the forests mainly rely upon bamboo available in the forest. Bamboo is also collected from own home-garden by a few weaver households, but the quantity collected was very negligible.
Procurement of culms is usually done by the male members of the weaving family. Only in the absence of males, it is performed by the females. Cutting of a single bamboo culm of weavable quality from a big clump is very difficult as well as
Table 5.14. Percentage distribution of sample households on the basis of sources of bamboo used for weaving
Sources
Own home-garden Other home-garden and farm lands Private bamboo depots Forests
I All
% number of household
0.15 61.79 27.08 10.98 100.00 I
risky and it requires expertise. Certain weavers do not know cutting culms safely from a big clump. Such weavers have to depend upon others and have to pay the cutting charges in addition to the cost of bamboo. Similarly, in some cases they have to make payments for transporting bamboo from far away places to their household.
5.5.2. Preparation of slivers, weaving and marketing
Preparation of slivers (colloquially known as taking ali) is the second stage in the production process. The culm is cut at the nodes with a big knife or small axe into different pieces so as to get a minimum number of two inter-node length. Each such piece is again split into four so as to get two lengthy split pieces free of node. The two lengthy split pieces with nodes are again cut at the nodes into pieces which are used for making frame or ribs. From the split lengthy pieces without nodes, slivers are prepared.
Taking slivers is the most important technical work. It is time consuming and risky. It is the process of taking veneers of lowest thickness with a small sharp knife from the split bamboo pieces having a specified width. There are two methods of taking slivers adopted by weavers - colloquially known as 'Palakavazhi' and 'Orainvazhi'.
'Palakavuzhi' is the process of taking slivers horizontally and 'Orumvazhi' is taking slivers vertically. Taking slivers vertically is better than taking them
34

horizontally. Vertical slivers are more strong since each has the inner and the outer layer of the culm. In the case of horizontal slivers, the outer one is more strong than the inner one. The slivers from the extreme inner portion of the culm are weak and they become waste. However, products weaven with horizontal slivers are beautiful and more preferred by consumers.
Taking slivers is done by both male and female weavers. The thickness of slivers differs from one product to another. For example, making mats requires slivers with more thickness and making winnowers requires thin slivers. Products weaven with thin slivers are more beautiful than those weaven with thick slivers.
Weaving of the slivers is the actual process of making products having varying size, shape and quality. Weaving is relatively more easier than the other activities. The speed of weaving differs from one person to another, from male to female and from one caste to another. It is generally observed that the Kavaras weave quicker than the Sambavas. When the weaving process is over, ribs and frames are to be made and fitted depending upon the product which is being made. For example, for mats, ribs are to be made and fitted; for baskets and winnowers, frames are to be made and fitted. When the making of the product is completed, there is a final touch to finish by trimming the fibrous material in the products with scissors.
Procurement of bamboo, cutting and splitting is generally done by the male members. Taking slivers is done by both male and female workers. Weaving of slivers is performed by both sex but the major part is performed by females. It is reported that the females are experts in making winnowers and mats whereas males in making baskets of different size for various purposes. Making frames and ribs is performed by males. In their absence, females also attend in making frames and ribs for products such as winnowers, baskets, etc.
There is no organised market for the bamboo products made by the weavers. For selling the products, it is required to go to each doorstep and from there to another. Generally, female members go for selling the products. In certain places, the weavers go to the village market in the evening for selling the products. They usually return home only after selling the products and purchasing the required household consumption goods with the money so obtained.
Apart from the village markets within the locality of the weaver household, the products are also sold either to consumers in nearby villages directly or through retailers and wholesalers. Usually, the weavers get more return by selling the products to consumers directly than selling to retailers or wholesalers. So most of the products are usually sold within the locality itself, provided that there is local demand. However, items such as fruit and betel leaf baskets, packing baskets, etc., are made only with the orders received from the retailers and wholesalers.
5.5.3. Value addition in household production
Value added refers to the difference between the value of finished products and the value of raw materials used. The value added in the household production of bamboo mats, baskets, etc., was estimated for the weaver households in Sambava and Kavara Communities. The details. are presented in Table 5.15. The value added per household per annum ranges from Rs.9095 in Sambava households to Rs.11935 in Kavara households. Although the value added per working member per annum differs
35
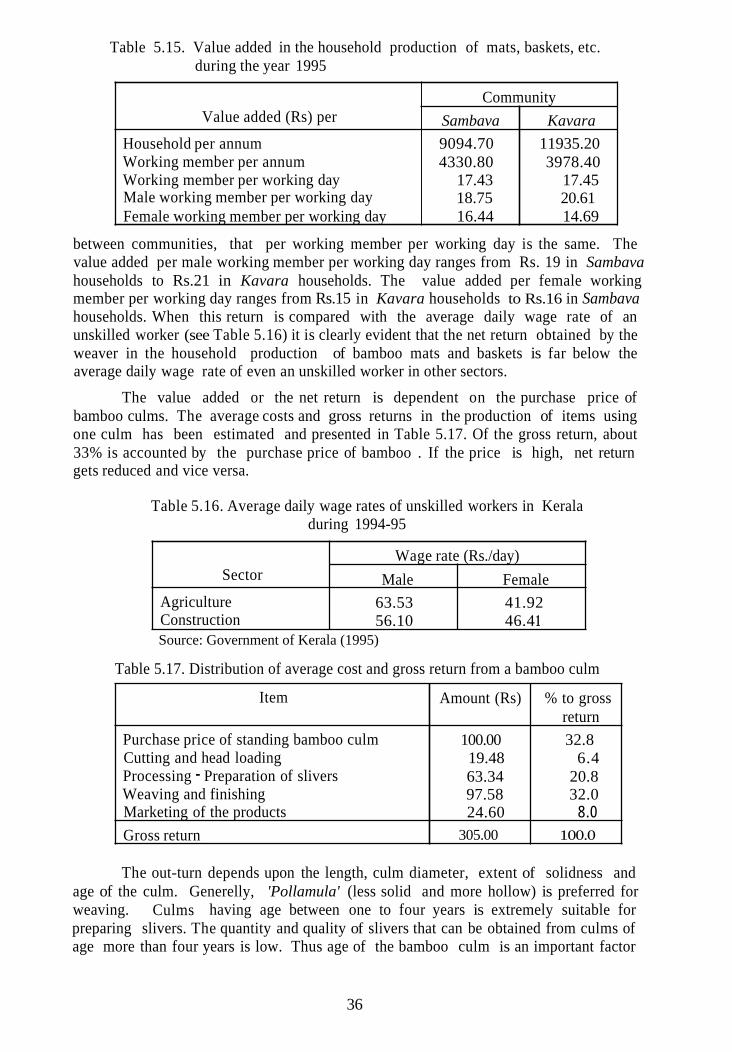
Table 5.15. Value added in the household production of mats, baskets, etc. during the year 1995
Value added (Rs) per
Household per annum Working member per annum Working member per working day Male working member per working day Female working member per working day
Community Sambava Kavara
9094.70 11935.20 4330.80 3978.40
17.43 17.45 18.75 20.61 16.44 14.69
between communities, that per working member per working day is the same. The value added per male working member per working day ranges from Rs. 19 in Sambava households to Rs.21 in Kavara households. The value added per female working member per working day ranges from Rs.15 in Kavara households to Rs.16 in Sambava households. When this return is compared with the average daily wage rate of an unskilled worker (see Table 5.16) it is clearly evident that the net return obtained by the weaver in the household production of bamboo mats and baskets is far below the average daily wage rate of even an unskilled worker in other sectors.
The value added or the net return is dependent on the purchase price of bamboo culms. The average costs and gross returns in the production of items using one culm has been estimated and presented in Table 5.17. Of the gross return, about 33% is accounted by the purchase price of bamboo . If the price is high, net return gets reduced and vice versa.
Sector
Agriculture Construction
Table 5.16. Average daily wage rates of unskilled workers in Kerala during 1994-95
Wage rate (Rs./day) Male Female
63.53 41.92 56.10 46.4 1
Item
Purchase price of standing bamboo culm Cutting and head loading Processing - Preparation of slivers Weaving and finishing Marketing of the products Gross return
The out-turn depends upon the length, culm diameter, extent of solidness and age of the culm. Generelly, 'Pollamula' (less solid and more hollow) is preferred for weaving. having age between one to four years is extremely suitable for preparing slivers. The quantity and quality of slivers that can be obtained from culms of age more than four years is low. Thus age of the bamboo culm is an important factor
Culms
Amount (Rs) % to gross
Source: Government of Kerala (1995)
Table 5.17. Distribution of average cost and gross return from a bamboo culm
return 100.00 32.8 19.48 6.4 63.34 20.8 97.58 32.0 24.60 8.0
305.00 100.0
36

determining the volume of slivers and thereby the out-turn of products which also affects the net return.
Table 5.18. Product-mix available from an average sized bamboo culm and gross returns
Product-mix
Muram Chorukotta Chanakakotta Mannukotta Meenkotta Kailukotta
Total
No. of items Time (in hrs)
4 14 2 4 4 12 2 5 1 2 8 5
21 42
Price/product (Rs.) 25.00 15.00 25 .OO 12.50 10.00 5.00
(in Rs.)
40 305
Type of products to be made also influence the return. If only one item is made from a culm, say 10 winnowers, then the gross returns is Rs.250. On the other hand, if a combination of different products is made, then the gross return is 305 (Table 5.18). With the same time and raw material, more items can be produced and more money can be saved. Generally, weavers produce a mix of products from a single culm. This practice would reduce the wastage of bamboo also.
5.6. Problems Faced by Weaver Households
The major problems faced by the weaver household are with regard to availability of bamboo and marketing of products as well as other socio-economic issues.
5.6.1. Availability of bamboo
The most important problem faced by the weavers is with respect to the availability of bamboo. Bamboo will not be available as and when required. If bamboo is timely available, the weavers can continue their work. But, what is usually happening is that the weavers have to wander home-garden here and there for procuring bamboo. Usually, individual culm is not sold to weavers. Generally, the owners having bamboo prefer to sell full clump to customers rather than selling an individual culm. The purchase of full clump enables the weaver to work continuously even for a week or month. Also, it fetches more return due to low price per culm. However, purchasing of full bamboo clump is usually not possible by the weaver households due to inadequacy of cash.
Increasing demand for bamboo poles in construction sector particularly for scaffolding is a major reason for non-availability of bamboo. Non-availability particularly in summer season within the village compels the weavers to move to other places for weaving. Certain weavers belonging to Kavara community in Palakkad District move to some places in Kannur and Kozhikode Districts during summer for reed weaving, where they spent four to six months in rented houses and return back to their own houses during the rainy season. Non-availability of bamboo has also led to the use of reed by weavers who traditionally usedbamboo.
The need for setting up of an agency in the form of Bamboo Weavers Co-
37

operative Society within a Panchayat or Taluk level may be suggested for the purchase of bamboo clumps and distribution to weavers. However, the functioning is expected to be practically inefficient and the institutions are likely to be closed due to mismanagement and lack of co-operation as already occurred in certain reed weavers co-operative societies.
5.6.2. Marketing problems
Lack of organised markets for bamboo products is another problem. Due to this, the weavers have to spent their precious time and energy for walking from one door step to another for selling products even without taking food. In such situation, low priced selling of products is a common feature. Since the weavers are born, live and die in poverty, they have to sell the products immediately after making. Such situation is exploited by the consumers. In certain places, finished bamboo products are exchanged for other consumption goods such as paddy, tapioca, tubers, etc. The retailers and wholesalers exploit the poor weavers by purchasing products at low price and selling at higher prices to consumers.
Introduction of substitute products mainly from plastics has reduced the demand for bamboo products in recent times. The plastic substitutes are handsome as well as durable and readily available in any shop. People generally prefer the plastic products, resulting in the reduction in the demand for bamboo products.
5.6.3. Socio-economic issues
The socio-economic conditions of bamboo weaver households are not sound and clearly indicate that they live below poverty line, although there are few exceptions. The relatively large family size of the weaver households is an important reason for this situation apart from other factors. It is reported that most of the weavers continue weaving occupation mainly due to non-availability of alternate employment. The number of people who took up weaving out of liking as a livelihood is very negligible. This is due to the fact that weaving is deemed as a low occupation having no social status. Due to these reasons, young generation are not at all interested in taking up bamboo weaving as a means of livelihood.

6. COST- BENEFIT ANALYSIS OF BAMBOO IN MIXED CROPPING HOME-GARDEN SYSTEM
Bamboo is a cash earning crop grown in the home-gardens of Kerala. Generally not much input or expenditure is required for growing bamboo in home-gardens whereas most of the seasonal, annual and cash crops require high labour and inputs. Thus, a financial cost-benefit analysis of bamboo crop in relation to other types of crops in mixed cropping home-gardens assumes special significance.
Estimation of benefit-cost ratios for different crops in a mixed cropping home- garden system has not been attempted so far. Among the many complexities, the estimation of area under each crop, age and growing stock of each tree, the stream of costs and benefits and valuing the growing stock of each tree are the major ones. Volume tables of trees in home gardens are not available for estimating volume of standing trees. Adopting an innovative method, these complexities were simplified by devising different formulae and benefit-cost ratios for different crop components
38

within a mixed cropping home-garden system with bamboo. The methodology adopted for the home-garden survey, the formulae devised for the estimation and the results are presented in this section.
6.1 Methodology
6.1.1. Study area and data base
This study is confined to two selected revenue villages - one in Central Mid-land Zone and the other in Low Rainfall Dry Zone. For selecting the villages, one community development block each was selected from the above zones. The selected blocks are Wadakkanchery Block in Thrissur District (Central Mid-land Zone) and Kuzhalmandam Block in Palakkad District (Low Rainfall Dry Zone). Villages, where bamboo grows in home-gardens, were identified after visiting all the revenue villages in the selected blocks. One such village was randomly selected in each of the two blocks. The villages selected are Peringandur (with an area of 41 1 ha) in Wadakkanchery Block and Kuthannur (with an area of 2451 ha) in Kuzhalmandam Block. The preliminary work for the survey was done during June-July period. and the detailed survey was conducted during August, 1996.
Both the selected villages grow bamboo in most of the home-gardens. Peringandur Village has better water availability and therefore, perennial cash crops such as arecanut (Areca catechu) and coconut (Cocos nucifera) are intensively cultivated. It is also close to a major wholesale market for arecanut (Pazhanji Town). Kuthannur Village, on the other hand, is relatively drier and the intensity of cultivation of perennial cash crops is low. Coconut is the main cash crop. Tree and seasonal/annual crop components are relatively more in Kuthannur Village.
All the households in the selected revenue villages were visited and the bamboo growing home-gardens were listed. At the time of listing, information on the number of bamboo clumps and home-garden size were gathered. The bamboo growing home- gardens in each of the selected villages were stratified on the basis of size of home- garden and number of bamboo clumps. The three land holding classes considered are 0.04 to 0.20 ha, 0.20 to 0.40 ha and above 0.40 ha. Home-gardens having size below 0.04 ha were excluded in this study. The two classes taken based on number of clumps are (i) one or two clumps' and (ii) three or more clumps. From each of the above 6 categories of bamboo growing households, 10 each were chosen at random in each village.
Data on costs of and benefits from different crops in home-gardens of selected households for the crop year 1995-96 were collected using a questionnaire and crop details were recorded in a proforma. Data on cost of seed or seedling, costs of hired labour used, cultural operations, manuring, irrigation, harvesting, etc. and different benefits in respect of individual crops were gathered from the head of household by holding personal interview. Data on crop details were recorded by a team of field assistants. For each seasonal and annual crop, either the area or number of plants and for each perennial crop the number of plants or palms were recorded in the proforma. For estimating the growing stock of palms, the height of each palm by species was also assessed. For each tree, girth at breast height (1.37 m from the ground) was measured for estimating the volume of standing tree and crown diameter for calculating the area occupied by the tree. The age of each tree was also assessed in consultation with the household members to arrive at the mean annual value of each tree. For estimating the
39

volume, trees having gbh above 15 cm alone were considered in this study, as saplings below 15 cm gbh have only negligible fuelwood value. Further, it is not sure whether such trees will survive. For estimating the growing stock of bamboo, the number of culms standing in different culm-diameter classes' and number of stumps in each clump were recorded in the proforma. The ground space occupied by the crown of each clump was also assessed. The age of each clump was determined in consultation with the household members. Data pertaining to the sample households in a selected village were used for the cost-benefit analysis for that village.
6.1.2. Classification of crops in home-gardens
The different crop components in a mixed cropping home-garden system are seasonal and annual crops, perennial cash crops, tree crops and bamboo as well as miscellaneous crops (Chundamannil et al., 1993). Seasonal and annual crops include all vegetables, pulses, tubers, betel vines (Piper betle), pineapple (Ananas comosus), banana (Musa paradisiaca), plantain, etc. Perennial cash crops include coconut, arecanut, pepper (Piper longum), cocoa (Theobroma cacao), nutmeg (Muristica fragrans), etc. Palms like palmyra (Borassus flabellifer) and Indian sago (Caryota urens) are sporadically found in home gardens. Although palmyra and Indian sago are not strictly cash crops, in this study they were included under perennial cash crop component. Tree crop component consists of all trees except those considered as perennial cash crops. Miscellaneous crops include fodder grass, Gliricidia sepium and Pandanus tectorius which are generally grown on the boundaries of home-gardens. Bamboo and different crop components except miscellaneous crops were considered for the financial cost-benefit analysis in this study.
6.1.3. Benefits from different crops
Annual return from different crops vary from food to non-food materials. The benefits from seasonal and annual crops are mainly food materials which are harvested after some months or within a year from the date of sowing or planting. The benefits from perennial cash crops are food and non-food materials which are available every year after the crops start yielding. In addition to yields, crops such as coconut and palmyra provide fuel materials such as leaf and sheath during the entire life span.
Trees provide mainly timber and fuelwood. Apart from the production of wood, trees of certain species, when mature, have annual returns of fruits, fodder or green manure or both. For example, jack (Artocarpus heterophyllus) trees provide fruits and fodder; mango (Mangifera indica) trees contribute fruits and green manure; cashew (Anacardium occidentale) trees give nuts; tamarind ( Tamarindus indica) and kudupuly (Garcinia gummi-gutta) produce condiment. Bamboo clumps provide poles and thorns whereas the miscellaneous crops provide fodder, green manure, twigs, etc. The final returns from trees are timber and fuelwood which will be obtained only when the trees will be felled. Palms such as coconut, palmyra and arecanut will provide beams, poles or fuelwood when they will be felled. Fuelwood is obtained while clearfelling of crops like cocoa when they become senile.
6.1.4. Valuation of benefit per annum in a home-garden
The annual benefit from a particular crop in the home-garden is defined as the gross value of all produce available from that crop during the crop year 1995-96 irrespective of whether the produce are sold for cash or used for home consumption.
40

The gross value of the produce from each seasonal or annual crop is estimated as the sum of the values of all outputs from each crop. When only the data on quantity of produce could be obtained, the weighted average price of the produce in the village was used to arrive at the gross value of the produce of the crop.
For each perennial crop, the quantity of the annual yield of each item was multiplied by the weighted average price of each item to obtain the gross value. Many perennial crops have woody biomass with different wood value. For example, a standing coconut palm, if felled, fetches a price for the wood depending on the age and height of the palm. On the other hand, perennial crops such as pepper does not have any residual value for the biomass. To obtain the annual value of woody biomass, the current value of the standing palm or plant was divided by its age. The benefit per annum from each perennial crop is, therefore, the sum of the value of the annual yield and the annual value of the woody biomass of all palms or plants.
For estimating the annual benefit in terms of wood from a standing tree, the method adopted is described below. During the survey of home-gardens, the girth at breast height of each tree was measured. Since there is no volume tables for trees in home gardens of Kerala, the Volume Tables of Nair (197 1) for forest trees of Kerala was relied upon for calculating the volume of a standing tree as done in Krishnankutty (1990) for estimating the growing stock of trees in home-gardens of Kerala. In Nair (1971), regression equations for different species to estimate the commercial volume of a standing tree for a given girth are provided. In the present study, commercial timber volume of trees is estimated based on the regression equations using the girths of each tree. Although regression equations for estimating the fuelwood volume are not available, fuelwood volume for different girth classes of trees are given in the above publication. In this study, fuelwood volume of a standing tree is estimated using the regression equation fitted for the data on fuelwood volume and girth of the tree. Trees, for which volume tables are not available, were classified! into evergreen and deciduous. The commercial timber and fuelwood volumes of trees of evergreen species are estimated using the regression equation fitted for the data on commercial timber and fuelwood volume for the 'miscellaneous evergreen species'. The volumes of trees of deciduous species are estimated in a similar manner using data for the 'miscellaneous deciduous species' of Nair (197 1).
Stumpage value of a tree is the price obtainable for the standing tree. It was then arrived at by multiplying the volumes of commercial timber and fuelwood with the respective stumpage values of commercial timber and fuelwood. The stumpage values have been estimated in consultation with timber traders and agents in and around the locality. For the valuation based on wood value, trees were classified into four groups viz., as adopted in Krishnankutty (1990). Trees in the high value class include teak (Tectona grandis), rosewood (Dalbergia latifolia), etc. For trees in this group and trees in the medium value class such as jack, anjily (Artocarpus hirsutus), venga (Pterocarpus marsupium), etc., actual stumpage value based on age and girth class of each tree was used. Trees in the low value class include mango, aryaveppu (Azadirachta indica), mulleelam (Zanthoxylum rhetsa), kanjiram (Strychnos nux-vomica), etc., and those in the very low value class include cashew, vatta (Macaranga peltata), ungu (Pongamia pinnata), matty (Ailanthus triphysa), etc. For trees where the specific stumpage value could not be determined, an average stumpage value of similar trees was used. The benefit from the wood component per annum from a tree was calculated by dividing the stumpage value
high value, medium value, low value, and very low value
41

of the commercial timber and fuelwood of the tree with its age. The benefits per annum from all trees of different species were added together to arrive at the benefit per annum of the tree crop component.
For estimating the annual benefit from bamboo, the following method was adopted. If the current year’s production of new culms alone is considered, it is not appropriate since they are immature and unsold. Moreover, with the age of the clump, the rhyzome spreads and the number of new culms increases each year till flowering and the current year’s production of new culms does not represent the mean production per annum. The methodology for estimating the mean annual benefit from bamboo is similar to that adopted for estimating the mean annual benefit from trees. The number of standing culms and the number of stumps were counted and classified into different culm diameter classes. The current stumpage value of the clump was found out by multiplying the number of culms in each diameter class with the respective stumpage price of the culm in the locality. The mean annual benefit from each clump was obtained when the current stumpage value was divided by the age of the clump. The annual benefit by way of harvesting thorn from a clump was quantified by multiplying the number of bundles of thorn harvested during the reference year 1995-96 with the price per bundle in the locality. The benefit per annum from bamboo crop was obtained as the sum of the mean annual benefits from all clumps.
6.1.5. Valuation of cost per annum in a home-garden
As in the valuation of benefit per annum, the valuation of costs was also done with reference to the crop year 1995-96. Costs of cultivation include cost of crop cultivation and cost on capital. Cost of crop cultivation includes value of seed (home produced plus purchased), value of fertilisers and organic manure, value of pesticides, hired labour, fuel and lubricants for operating farm machinery, payment for hiring plough animals and implements, irrigation charges, imputed cost of family labour used for crop cultivation, etc.
Most of the trees in home gardens have been either planted with seed or seedling available within the home-garden or obtained free from neighbours (for example, jack, mango, tamarind, etc.). In the villages studied, the existing bamboo clumps are the remanance of the natural growth in the locality. Households without bamboo can obtain bamboo rhyzome for planting from neighbouring home-gardens free of cost. For perennial crops, on the other hand, the cost of seedling has to be considered. In this study, the cost of seedling of perennial crop was accounted by taking the current price of seedling of each crop divided with the age of each individual plant or palm. For example, with the annual cost, the sum of current seedling cost of coconut divided with the respective age of each palm, was added to obtain the cost of cocdnut crop.
Cost on capital includes cost incurred for land development, interest on agricultural loans taken for the purchase of farm machinery and other purposes, value of annual land rent and depreciation to capital. Among the costs on capital, the imputed value of land rent alone was considered in this study as it was difficult to arrive at an annual figure on other costs for each crop. In the case of agricultural loan availed by the household, the entire amount was not spent for agricultural purposes, and it was not possible to apportion the amount among different crops. In this study, the cost of crop cultivation and imputed value of annual land rent were considered for the valuation of costs for different crops.
42

Land rent was imputed for each crop on the basis of the area occupied by each crop. The complexity of estimating the area occupied by each crop in a mixed cropping home garden system is quite evident. The two approaches that can be adopted are i) to take the crown area of seasonal or annual crops and climbers and canopy area of palms and trees and ii) to take the area of root spread. Relatively the crown and canopy areas are easier to assess than the area of the root system. Therefore, in this study, the crown or canopy area was taken. However, the results depend on the accuracy of estimating the area under each crop.
When the area under each crop is considered using the area occupied by the crown or canopy, the area under all crop components sometimes exceeds the actual area of home-garden. For imputing the land rent for each crop, the land rent was, first of all, computed for the area of home-garden and then distributed proportionately on the basis of the gross area under each crop.
The annual land rent was imputed as a percentage of the average land value during 1996 in the village. During the survey of bamboo growing home-gardens, an assessment was made on land value in each village by holding discussions with veteran farmers, land selling brokers and revenue authorities. There is no marked difference between the average land prices in both villages for agricultural land, although commercial lands near the township and on the road sides have a wide range of values. The average land price used for both of the villages in this study is Rs 2,47,100 ha-1.
For each crop component, a land rent has been imputed on the basis of the area occupied by each crop. There is a convention in forestry that 7% of the land value can be considered as the land rent. Forest lands globally have few alternative uses and therefore, a low land rent is charged for options within forestry. For agricultural land, on the other hand, there is very high potential for alternative uses and the opportunity costs are higher. Different approaches can be made to arrive at an appropriate land rent. The first one is to take the rate of interest available to depositors in commercial banks. A land owner has the option to sell the land and then deposit the money so received in the bank. The interest available from the bank can be considered as the minimum opportunity cost for the land. Another approach is to take the rate of change in land value in the locality. Due to increasing population, increasing income and overall development, land prices in Kerala have been growing rapidly. This is much higher than the rate of interest available to cash deposits in banks. Therefore, instead of using a single rate as the land rent, four different rates from 6 to 18% of the land value were used for calculating the annual land rent.
6.1.6 Calculation of benefit and cost per annum per hectare in a home-garden
For calculating the benefits from a crop and the costs incurred per unit area, the area under that crop in the home-garden is essentially required. There is no definite method by which the actual area under each crop can be measured in mixed cropping system, because it varies from home-garden to home-garden depending upon the fanner's practice. A large number of crops ranging from seasonal to perennials and trees of different species in various age classes are often grown in intimate mixtures in a home- garden. Therefore, the area of the home-garden was taken for calculating the benefit and cost per annum per ha for each crop component in a home-garden.
43
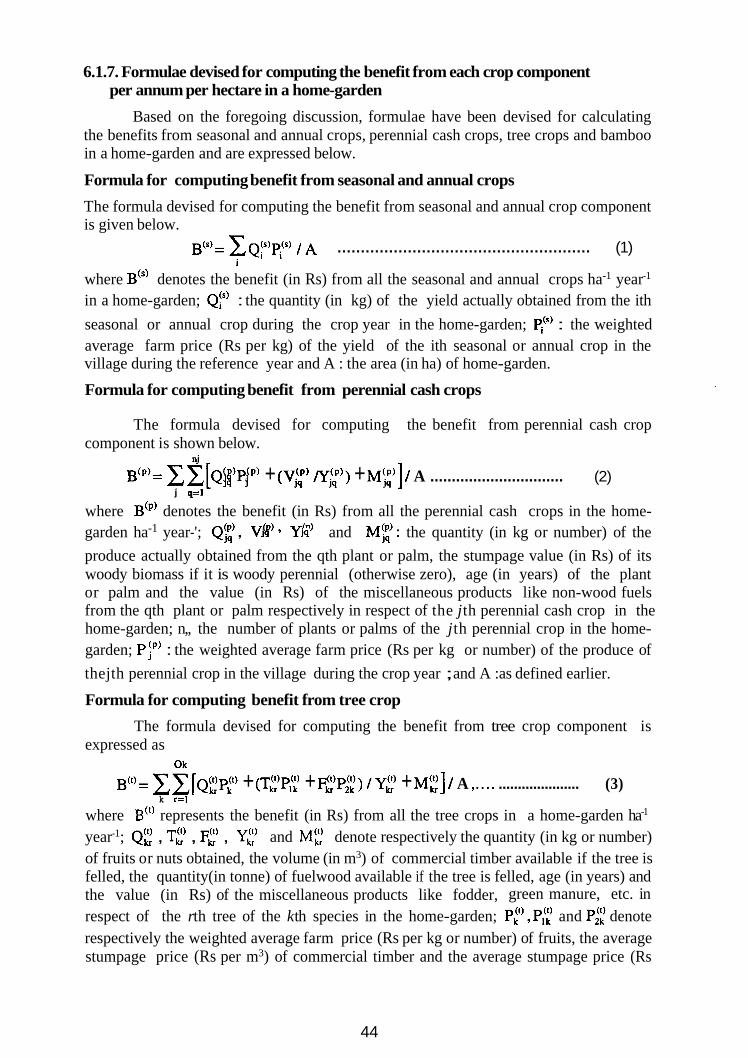
6.1.7. Formulae devised for computing the benefit from each crop component per annum per hectare in a home-garden
Based on the foregoing discussion, formulae have been devised for calculating the benefits from seasonal and annual crops, perennial cash crops, tree crops and bamboo in a home-garden and are expressed below.
Formula for computing benefit from seasonal and annual crops
The formula devised for computing the benefit from seasonal and annual crop component is given below.
B(')= Q:)p:) / A ...................................................... (1) i
where B(') denotes the benefit (in Rs) from all the seasonal and annual crops ha-1 year-1
in a home-garden; Q:' : the quantity (in kg) of the yield actually obtained from the ith seasonal or annual crop during the crop year in the home-garden; pi(') : the weighted average farm price (Rs per kg) of the yield of the ith seasonal or annual crop in the village during the reference year and A : the area (in ha) of home-garden.
Formula for computing benefit from perennial cash crops
The formula devised for computing the benefit from perennial cash crop component is shown below.
nj
B(p)= F,Y,[Q~p)P!p) J9 J + (V,!,"' /Yig"') + Mi:']/ A ............................... (2) j q=l
where B(p) denotes the benefit (in Rs) from all the perennial cash crops in the home- garden ha-1 year-'; QE, V"' jq ' Y'p' jq and ME): the quantity (in kg or number) of the produce actually obtained from the qth plant or palm, the stumpage value (in Rs) of its woody biomass if it is woody perennial (otherwise zero), age (in years) of the plant or palm and the value (in Rs) of the miscellaneous products like non-wood fuels from the qth plant or palm respectively in respect of the jth perennial cash crop in the home-garden; n,, the number of plants or palms of the jth perennial crop in the home- garden; Pip' : the weighted average farm price (Rs per kg or number) of the produce of thejth perennial crop in the village during the crop year ; and A :as defined earlier.
Formula for computing benefit from tree crop
expressed as The formula devised for computing the benefit from tree crop component is
Ok ~~
B@)= F,T[QEPf) + (TE'P;: + e)Pi:) / YL) + ME] / A ,.... ..................... (3) k r=1
where B(') represents the benefit (in Rs) from all the tree crops in a home-garden ha-1 year-1; QE , TE) , F:) , Yf and MC denote respectively the quantity (in kg or number) of fruits or nuts obtained, the volume (in m3) of commercial timber available if the tree is felled, the quantity(in tonne) of fuelwood available if the tree is felled, age (in years) and the value (in Rs) of the miscellaneous products like fodder, green manure, etc. in respect of the rth tree of the kth species in the home-garden; Pf), P,f and Pi: denote respectively the weighted average farm price (Rs per kg or number) of fruits, the average stumpage price (Rs per m3) of commercial timber and the average stumpage price (Rs
44

per tonne) of fuelwood of the kth tree species in the village during the reference year; ok: the number of trees of kth species in the home-garden; and A :as defined earlier.
Formula for computing benefit from bamboo crop The formula devised for calculating the benefit from bamboo component is expressed below.
B@)= %[ (cN$P:’ / Y,”’) + Mf’PF’ / A , .............................. (4) g=l d 1
where B‘b’ stands for the benefit (in Rs) from all the bamboo clumps in a home-garden ha-1 year-1; N$ , Y,“’ and MI’ : the number of bamboo culms in the dth culm-diameter class , age (in years) and the quantity of thorn (in number of bundles) obtained respectively in respect of the gth clump during the reference year; P:) and PF’ : the weighted average stumpage price (in Rs) of a bamboo culm in the dth diameter class and that (in Rs per bundle) of thorn respectively in the village ; A: the area (in ha) of home-garden and m :the number of clumps within it.
6.1.8 Formulae devised for computing the cost of each crop component per annum per hectare in a home-garden
The formulae devised for calculating the cost for seasonal and annual crop, perennial cash crop, tree crop and bamboo components are expressed below.
C(S)= c[Cp) + ( R / G)AIs)]/A .................................................. ( 5 ) i
C(t) = cc[CE +(c‘,“ /YE))+(R/G)AL)] /A ............................. (7) k r=l
g=l
where C“), C”), C(t) and C‘b) represent the cost in (Rs) ha-1 year-1 in home-garden for all seasonal and annual crops, for all perennial cash crops, for all tree crops and for all bamboo clumps respectively; C[“’, C g , CE and C@’ g denote respectively the cost (in Rs) incurred for - the ith seasonal or annual crop including cost of seed or seedling, the qth plant or palm of the jth perennial crop excluding cost of seedling and , the rth tree of the kth species excluding cost of seedling and gth bamboo clump excluding cost of
denote the cost (at current price in Rs.) of seedling or rhyzome; c , c k
seedling of the jth perennial crop, kth tree species and bamboo respectively; A:’) : the area occupied (in ha) by all plants of the ith seasonal or annual crop; A:’’ : the area (in
ha) of the foliage or crown of a plant or palm of thejth perennial crop; A:) : the area (in
ha) occupied by the rth tree of the kth species; A:) : the area (in ha) occupied by the crown of the gth bamboo clump; R: imputed annual land rent (Rs) of the area of home- garden; G: gross area (in ha) occupied by all the crop components in a home-garden such
(P) (t) and c(b)
45

that ok m
G = Z A ; ' ) + Z n j A y ) + F , y , A c ) + C A P ' ; and the other notations are as j k r=l g=l
defined earlier.
6.1.9. Estimation of mean benefit, mean cost and benefit-cost ratio
The benefit (in Rs) ha-1 year-1 for each crop component - (i) seasonal and annual crops, (ii) perennial cash crops (iii) tree crops and (iv) bamboo- have been calculated for each household in the sample using the formulae 1 ,2 ,3 and 4 respectively. Similarly, the cost (in Rs.) ha-1 year-1 for each of the four crop components have been computed for each household in the sample using the formulae 5 ,6 ,7 and 8 respectively. The mean benefit (B) and the mean cost (C) ha-1 year-1 for each crop component in each village are estimated using the benefit and cost ha-1 year-' of each crop component in the sample households in each village. The annual net benefit and benefit-cost ratio (B/C ratio) of each crop component are obtained by subtracting C from B and dividing B with C of each component respectively.
6.2. Results of Cost-Benefit Analysis
For comparing the costs and benefits of bamboo with that of other crop components, two criteria (i) the annual net benefit criterion and (ii) the benefit-cost ratio were used. The results of the cost-benefit analysis (CBA) are presented here.
6.2.1. CBA using the annual net benefit criterion
The estimated average cost for and average benefit from different crop components ha-1 year-1 in home-gardens in Peringandur Village are presented in Table 6.1. The average annual cost ha-1 is estimated to be about Rs.5500 of which Rs.4000 was accounted by the perennial cash crop component. Trees and bamboo component accounted for only a negligible amount. The average annual benefit from all crops ha-1 is estimated to be around Rs.30,000. The contribution of perennial crops is nearly half. Although the annual cost incurred for tree and bamboo crop components is negligible, the potential benefit which is the mean annual value of the growing stock is substantial.
Table 6.1. Average cost and benefit per ha-1 year-1 in home-gardens in Peringandur Village (Rs.ha-1 year-1)
Table 6.2 shows the estimated average cost and benefit ha-1 year-1 in home-gardens in Kuthannur Village. The average annual cost ha-1 is much lower in Kuthannur Village as the cost for the perennial crop component is only Rs 750. Here also, the average annual costs of the tree and bamboo components are negligible. Here the highest benefit is from the tree crop component. The return from bamboo is almost equal to that from seasonal and annual crop component for which a high annual cost compared to bamboo was incurred.
46

Crop component Seasonal and annual crops Perennial cash crops Trees Bamboo All crop components
* The land rent is imputed as a percentage of average land value of Rs.247,100 ha-1 during 1996 in the village.
Average cost Average benefit 1220.14 3569.91 75 1.44 5478.14
5.80 78 1 1.68 0.88 3433.83
1978.26 20293.55
Table 6.5 shows the net benefit ha-1 year-1 for different crops at different rates of land rent in Peringandur village. Taking different rates of land rent, the relative net benefits remain the same except for the tree crop component which declines rapidly with increasing rate of land rent. At 18% land rent, the net benefit from tree crop component is negative. The highest net benefit is from perennial cash crops.
Crop component
Seasonal and annual crops Perennial cash crops Trees Bamboo All crop components
47
Average cost inclusive of land rent at various rates of land rent*
6% 9% 12% 18% 1855.55 2002.91 2150.26 2444.97 4499.70 4750.90 5002.10 5504.50 3600.99 5401.48 7201.98 10802.96 498.29 747.43 996.58 1494.87
10454.52 12902.72 15350.92 20247.31
Crop component
Seasonal and annual crops
Perennial cash crops
Trees
Bamboo
All crop components
Average cost inclusive of land rent at various rates of land rent*
6% 9% 12% 18%
1599.04 1788.80 1978.57 2358.1 1
1049.73 1199.12 1348.52 1647.30
3477.94 5216.91 6955.88 10433.82
528.86 793.29 1057.72 1586.58
6655.57 8998.13 11340.69 16025.80
* The land rent is imputed as a percentage of average land value of Rs.247,100 ha-1
Table 6.4. Average cost inclusive of land rent ha-1 year-1 in home-gardens in
during 1996 in the village.
Kuthannur village (Rs.ha-1 year-1)
Using 6,9,12 and 18% of land value as annual land rent, the average cost ha-1
year-1 for different crops was calculated. They are given in Tables 6.3 and 6.4 for Peringandur and Kuthannur Villages respectively. Using the costs inclusive of land rent and benefits ha-1 year-1 for different crops, the net benefits were worked out.
Table 6.3. Average cost inclusive of land rent ha-1 year-1 in home-gardens in Peringandur village (Rs.ha-l year-1)
Table 6.2. Average cost and benefit ha-1 year-1 in home-gardens in Kuthannur Village (Rs.ha-1 year-1)

Bamboo retains the second place at all rates of land rent. The bamboo and tree crop components show very similar net benefits at 6% land rent. At higher rates, because of relatively larger canopy cover, net benefit from trees decreases with increase in land rent.
Crop component
Seasonal and annual crops Perennial cash crops Trees Bamboo
All crop components
Table 6.5. Average net benefit ha-1 year-1 in home-gardens in Peringandur
Net benefit at various rates of land rent
6% 9% 12% 18%
253 1.94 2384.58 2237.23 1942.5 1
9419.54 9168.34 8917.13 8414.73
3887.43 2086.94 286.44 -3314.54
3929.23 3680.08 3430.94 2932.65
19768.14 17319.94 14871.74 9975.65
Crop component
Seasonal and annual crops Perennial cash crops
Bamboo All crop components
Trees
Net benefit at various rates of land rent 6% 9% 12% 18%
1970.87 1781.10 1591.34 121 1.80 4428.41 4279.01 4129.62 3830.84
2904.97 2640.53 2376.10 1847.24 13637.98 11295.42 8952.86 4267.74
4333.74 2594.77 855.80 -2622.14
6.2.2 CBA using the benefit-cost ratio
Table 6.7 shows the estimated benefit-cost ratio (B/C ratio) for different crops at various rates of land rent in Peringandur Village. At all rates of land rent, bamboo has the highest B/C ratio. Partly because of the negligible annual cost and partly because of the fact that the benefit was calculated on the basis of growing stock and its potential value, the B/C ratio of bamboo is the highest among different types of crops. The nearness to the market, accessibility of the traders to the bamboo clump and ability of the farmer in negotiating with the bamboo traders determine whether the potential value is realised by the farmer. In Peringandur Village, even perennial cash crops have a lower B/C ratio even at 18% land rent. Even with a high B/C ratio for bamboo, other type of crops continue to be grown in the village as the potential benefit from
48
Table 6.6 shows the net benefits ha-1 year-1 for different crops at different rates of land rent in Kuthannur village. The relative net benefits from different crops are similar to that of Peringandur Village. The only difference is that at 6% rate of land rent, the net benefit from the tree crop component is higher than that from bamboo. But this changes at 9% rate of land rent where bamboo attained the second place and continued to hold the second position at higher rates of land rent.
Table 6.6 Average net benefit ha-1 year-1 in home-gardens in Kuthannur v i 11 age (Rs.ha-1 year-1)
In both the villages, bamboo had the second place in net benefit among different crop components. Even under 18% land rent, bamboo has a positive net benefit while the tree crop component has only negative net benefit.

I
Crop component
Seasonal and annual crops Perennial cash crops
Trees
Bamboo
All crop components
Table 6.8 gives the estimated B/C ratio for different crops in Kuthannur Village. Here, bamboo has only a second place after perennial cash crops except at 6% land rent. The intensity of cultivation and use of inputs for perennial crops in Kuthannur Village are low and therefore the B/C ratio is quite high. The labour cost is also lower in Kuthannur Village.
In both the villages, the B/C ratios for seasonal and annual crop component and tree crop component are almost identical at all rates of land rent. The higher B/C ratio for bamboo in Peringandur Village in comparison with that in Kuthannur Village needs some explanation. Although the same species Bambusa bambos is grown in both
Table 6.8. Benefit-cost ratios for different crops in home-gardens in Kuthannur village
B/C ratio at various rates of land rent
6% 9% 12% 18%
2.365 2.191 2.040 1.794
3.093 2.930 2.783 2.529
2.080 1.386 1.040 0.693 8.885 5.924 4.443 2.962
2.891 2.342 1.969 1.493
B/C ratio at various rates of land rent
Seasonal and annual crops Perennial cash crops Trees 3amboo All crop components
49
2.233 1.996 1.804 1.514 5.219 4.568 4.062 3.326 2.246 1.497 1.123 0.749 6.493 4.329 3.246 2.164 3.049 2.255 1.789 1.266
the villages, the bamboo culms in Peringandur Village have better growth and larger size than that in Kuthannur Village. Apart from ago-climatic differences, intensive cultivation of perennial cash crops with inorganic fertilisers and irrigation in Peringandur Village have their effect on the bamboo crop which is grown on the margins. The higher value of the standing bamboo crop in Peringandur Village gives a higher B/C ratio.
The profitability of a produce depends on the net return that can be realised in the market. As the agricultural economy in Kerala is highly commercialised, there is a thriving market for most of the agricultural produce. The nearness of market centres is an added advantage for the producers. For example, the nearness of the wholesale arecanut market at Pazhanji induces to grow arecanut in Peringandur Village. The location of several wholesale bamboo depots in Palakkad District makes bamboo growing profitable in both Peringandur and Kuthannur Villages. When there is no organised market, bamboo can have only the status of a miscellaneous crop and no economic return can be expected. Therefore, it has to be born in mind that the apparent profitability of bamboo in both the study villages may not be replicable in other villages without market advantages.
bamboo was not realised by all farmers. Table 6.7. Benefit-cost ratios for different crops in home-gardens in Peringandur
village

7. DEVELOPMENT OF BAMBOO RESOURCES IN HOME-GARDENS
Current home-garden management and felling practices are discussed in this section. Measures for developing bamboo resources in home-gardens and thereby increasing farm income are also suggested here.
7.1 Methodology
For examining the performance of bamboo clumps which were managed at different levels by households, data on number of culms in different clumps, culm girth, length and number of poles from different portions of the culms felled, weight of leftover obtained and labour used for felling were collected through the survey of bamboo felling in home-gardens. The data were recorded at the time of felling27. At the home-garden level, the quality of bamboo management varied. The different levels of management can be categorised as well managed, moderately managed and poorly managed. Depending on the size of the home-garden, different clumps are found. Based on the level of management, each clump was classified in to the three groups mentioned above. On enquiry, it was found that all the well managed clumps visited belonged to the age group 6 to 8 years28. moderately managed clumps were of 12 to 15 years. The poorly managed clumps were of around 20 to 25 years age. The clumps in the category of poorly managed were not felled within the memory of the household.
The
7.2 Current farm management practices
Size of land holding in Kerala differs from very small to large. Even a small home-garden, particularly in the district of Palakkad, consists of a house, a minimum number of trees, bamboos and seasonal as well as annual crops as under growth. Bamboo is utilized in the household for making shed, panthal, ladder, etc. and thorns for fencing. Most often, bamboo is sold and fetches marginal income to the household. In home-gardens of larger size, there may be many bamboo clumps and most of them are planted on boundaries. Apart from income generated by other crops in the land, for which substantial amount of investment is necessary, bamboo provides additional income to the households without any investment. There are instances where bamboo, grown well on boundaries, were exhausted after felling29. This was mainly due to the ignorance in the management practices adopted by the household and wrong felling practices done by traders.
271t was observed that the method of felling is clearfelling retaining new shoots in some home- garden.
281n this study, age of bamboo refers only to the period since the last felling and not the age of the rhyzhome. 29For instance, bamboo was planted on boundaries not for realizing income to the households but for protecting the land which is not even cultivated. Lack of interest of the household members in for the undevelopment of the land. Marginal income was realized by selling the bamboo. During that time, the household was not aware of the market price of bamboo and was cheated by the traders. A particular segment was sold in an year and another in the next year and so on.
After a series of felling, all the clumps were exhausted except some clumps here and there.
agriculture and low dependence on land for income may be the reasons
50

Table 7.1 shows the percentage distribution of culms according to diameter in bamboo clumps of different age and level of management. Of the total number, 82% of culms had diameter above 7.5 cm in well managed, 89% in moderately managed and only 66% in poorly managed clumps. Very big culms accounted for 32% in the first, 41% in the second and only 10% in the third category. Big and
Level of management and age of clumps felled We11 managed (6-8 years) Moderately managed ( 12- 15 years) Poorly managed (20-25 years) All clumps
Table 7.1. Distribution of culms according to diameter in different groups of bamboo clumps felled (in percentage)
Mean number of culms Mean labour (mandays) per clump per clump p er 100 culm 37.8 3.43 9
32.5 2.29 7
63.8 7.34 12
40.0 3.66 9
Level of management and age of clumps felled
Well managed (6 - 8 years) Moderately managed
(12-15 vears) Poorly managed (20-25 years)
Diameter 4 . 0 5.0-7.5 * 0.6 I 5.1 I 29.0
at bottom (in cm) I
100.0
48.0 140.9 I 100.0
55.6 I 10.3 - 1 100.0
The product- mix obtained from bamboo clumps felled in the three categories is presented in Table 7.3. Poles, above 18 feet long, from bottom portion accounted for 54% in well managed, 35% in moderately managed and only 17% in poorly managed old clumps. This shows that well managed clumps give a higher output of lengthy poles in all categories. As longer poles are graded high and have a higher price, the advantage of maintaining well managed clumps is obvious.
30Due to the great variability in the weight of culms and lack of such information in literature, an effort was made to find the weight of different sizes of fresh green culms at felling. 240 culms in different localities were weighed using two spring balances maintaining each culm in horizontal suspension. The results are given in Appendix-9.
51
very big culms have more weight (Appendix-9)30. They fetch more income and have more market demand. As the felling cycle or the age is different for comparing the annual production, Table 7.1 shows that the returns from poorly managed older clumps is very low compared to well managed younger clumps.
Table 7.2 shows the mean number of culms per clump and the labour used for felling. It can be seen that labour required for felling is more for culms in poorly managed clumps than that for moderately and well managed clumps.
Table 7.2. Labour requirement for felling

Poorly managed
82.9 17.1 0.0 100 75.3 24.7 100 10.1 89.9 100
The above discussion reveals that well managed clumps in the age group 6-8 years showed better performance in terms of culm size, pole-output, product-mix, labour requirement and income.
Level of management Well managed
Moderately managed
Poorly managed
All clumps
7.3 Current felling practices
Poles Leftover Total 1.384 0.123 1 .507
0.816 0.107 0.923
0.995 0.295 1.290
1.065 0.175 1.240
(9 1.9) (8.1) (100.0)"
(88.4) (11.6) ( 100.0)
(77.2) (22.8) ( 100.0)
(85.9) (14.1) ( 100.0)
Methods of felling bamboo in various localities are different. In most of the areas in Palakkad district, the thorns are pruned with a crooked knife fitted at the end of a long bamboo pole. Then the bottom of the culm is cut with a big chopper or
31The distribution of different poles in different categories and different groups of clumps was recorded (Table 7.3). Weight of different lengths of poles in various categories were taken and multiplied with the respective number to obtain the average weight distribution per clump shown in Table 7.4.
52
Table 7.4. gives the out-turn of felled bamboo in poles and leftover31. The percentage of weight of poles to total weight of the clumps (poles and leftover together) is 86% varying from 77% for poorly managed clumps to 92% for well managed clumps. The proportion of poles is higher in well managed clumps, so that a higher income can be expected. Poorly managed clumps have a higher proportion of low value left over.
Table 7.4. Poles and leftover obtained from different groups of bamboo clumps felled (Quantity in metric tonne)
Table 7.3. Product-mix obtained from different groups of bamboo clumps felled

axe and dragged away32. In some localities in Thrissur district, the thorns are pruned away by climbing the culm. This is highly risky and labour intensive.
Felling of culms is usually done considering the convenience of cutting. Culms are cut at the same level as that of the ground so as to get maximum length of the culm. Retaining of the youngest culms or new shoots are not insisted by the farmers. If all the culms and new shoots are removed, more years are necessary to get culms of larger girth size. However, there are cases where the farmers are aware of the advantage of retaining the youngest culms or new shoots.
7.4 Suggestions for improved management of bamboo in home-gardens for deriving higher income
During the survey of home-gardens where the bamboo was felled and supplied to depots, it was found that except for a few home-gardens with enterprising farmers, the bamboo is poorly managed and not considered as a crop. Often, bamboo comes up naturally and in lands not intensively cultivated establishes and regenerates naturally. Farmer's ignorance on species preference in the market, quality specifications for different end-uses, relative price and management techniques for better product-mix as well as higher income are important reasons for the poor management of bamboo in home-gardens. Households, mainly dependent on non-farm source of income and where active members to work or to manage crop are lacking, are indifferent to improved techniques.
A farmer growing bamboo in a well managed home-garden will (i) prefer Bambusa bambos species, (ii) prune the thorn annually, (iii) adopt a 6-8 year period felling cycle, (iv) cut the culms above the first inter-node and (v) protect the emerging shoots and young culms while felling. This package will increase the out-turn of bamboo, improve the proportion of quality poles, enhance farm income, reduce felling cost and make the produce attractive to traders.
Currently, legal restrictions exist for cutting and transporting bamboo from home-gardens. Considerable amount of effort is necessary for getting the required pass (permit from Forest Department) for cutting and movement of bamboo from home-gardens. A major portion of the miscellaneous cost incurred in marketing is the informal If such procedures are liberalized, a further reduction in marketing cost can be achieved.
expenses for getting such pass and permit.

8. SUMMARY AND CONCLUSIONS
The estimates of sector-wise demand for bamboo in Kerala, source-wise supply and contribution of home-gardens, and results of various surveys on marketing of bamboo from home-gardens, bamboo trade and retail markets, bamboo weaver
321t is observed that cutting culms with knife is better than that with axe. Axe is convenient when culms are standing very close. The difference in use of tools is due to the practicc traditionally gained by the cutters.
53

households, cost-benefit study and bamboo management practices in home-gardens are summarised here.
The demand for bamboo in Kerala during the year 1993-94 is estimated as 169,000 metric tonnes of which export accounted for 22%, industries 38% and household and other sectors 40%. Of the total supply of bamboo during the same year, home-gardens contributed 63% and forests the remaining 37%. Nearly all bamboo from forests is utilised only by the pulp industry within Kerala, whereas that from home-gardens goes for industrial and non-industrial uses within and outside Kerala.
The home-garden-bamboo market is dominated by wholesale depots based in Palakkad District which has traditionally been the bamboo growing centres for the State. Bamboo production and marketing during 1993-94 provided direct employment of 409,000 operational days, in rural areas, of which 54% was accounted by socially and economically weaker sections of the society.
Bambusa bambos is the only species collected from home-gardens and traded through the whosesale depots. Of the total quantity of bamboo traded through the depots, 7 1 % came from home-gardens in Palakkad District, although shortage within the district in recent years have forced the depots to buy from neighbouring districts, (27%), and further, from home-gardens in far away districts (2%). The estimated average farm-gate price of a standing bamboo culm varies from Rs. 13 (small culm) to Rs. 75 (very big culm) with Rs. 38 per an average sized culm during 1994. Aside from the market itself, the socio-economic condition of the households, willingness to sell and awareness of local market demand for bamboo seem to influence the farm-gate price.
Age, green colour, length and weight of bamboo poles are the most important determinants of price at the depots, although there is some seasonal variation in price as depots try to off-load surplus stock at the end of peak season. The gross margin of the wholesale depot is 18% of the cost of bamboo purchased by the depot from the agents. The price of bamboo received by the farmer is 40% of its wholesale price, indicating a fair return for the bamboo crop for which no inputs or expenditure are incurred. The estimated average net income of a supplying agent is around Rs. 47,000 and net profit of an average wholesale depot is Rs. 201,000 per annum, revealing that the returns are relatively modest.
The pattern of sale of bamboo through the wholesale depots indicated that most of the bamboo is exported to the neighbouring States of Tamil Nadu and Karnataka. Of the total quantity of 43384 metric tonne of bamboo sold during the year 1993-94, export to Tamil Nadu accounted for 66% and that to Karnataka 20%. The quantity of bamboo used for industrial and non-industrial uses within Kerala was only 14%. The quantity sold to retail depots for various uses accounted for 59% and that to farmers directly for using as banana supports 41% of the total quantity exported to Tamil Nadu. Most of the material exported to Karnataka was for pulping.
The trade of bamboo with Tamil Nadu appears to be in decline, although the This is partly due to the availability of real prices have increased considerably.
54

favourably priced casuarina poles, but may also be due to shortage of bamboo from home-garden in Kerala.
The socio-economic study of two weaving communities showed that there are differences in social, cultural and economic features between the communities. The level of literacy is 76% in Sambava households and 40% in Kavara households. Women play an important role in bamboo weaving. The share of women in weaving is comparatively higher than their counterpart. Their participation extends to most stages of production process apart from looking after her family.
The average annual income is estimated as Rs.19,500 in Sambuva households and Rs. 16,300 in Kavara households during the year 1995-96. The most important: source of income is bamboo contributed on an average 55% (in Sambava households) and '7 1 % (in Kavara households) of the total income from all sources. The value added per working weaver is estimated as Rs.17 per working day which is insufficient to meet the daily household needs. Although it is relatively small compared to the income of unskilled people working in other sectors, it is important for their livelihood since alternative employment opportunities are limited due to social and cultural factors. However, in recent times the opportunities of employment in other sectors increase the contribution of other works in total income.
weaving which
Timely availability of bamboo, difficulties involved in marketing, increasing price of bamboo culms, inadequacy of cash for the purchase of a whole clump and reduction in the demand for products made of bamboo due to competition with substitutes are some of the major problems encountered by the bamboo weaver households.
The cost-benefit analysis using the net benefits and B/C ratios shows the relative economic position of bamboo among different crop components. But various other criteria and priorities exist for the farmer in choosing or retaining a particular crop-mix in the home-garden. In a mixed cropping home-garden system, different types of crops and bamboo are complementary to each other and integrated as an ecological and economic system. Comparison between bamboo and different types of crop components as done in this study, is not intended to promote one type of crop against another as all components have their place and role. The home-garden system with bamboo, as seen in the two villages, has evolved over several decades and is now in more or less optimum balance. The high B/C ratio reported for bamboo crop is not a recommendation to increase the bamboo component at the cost of other types of crops. If well managed, bamboo has a potential for good returns in the villages studied.
Well managed bamboo clumps with a felling cycle of 6 to 8 years had better performance than poorly managed very old clumps in terms of culm size, pole output, product-mix, high and sustainable income. Bamboo is an important economic crop. Even without any inputs, bamboo grows well and fetches good returns. A little more attention to pruning, timely harvesting managing each bamboo clump can improve growth, returns and aesthetics.
and
55

In the development of bamboo resources in home-gardens, particularly in Palakkad and nearby Districts, the wholesale bamboo depots have a crucial role to play. Bulk purchasers from other States are attracted to Kerala only because of the existence of the wholesale market and efficiency of the depots. When there is no organised market, bamboo crop can have only the status of a miscellaneous crop and no economic return can be expected. Therefore, it has to be born in mind that the apparent profitability of bamboo in the villages studied may not be replicable in other villages without market advantages. A package of practices for improved management of bamboo in home-gardens also needs to be developed and popularized among farmers. They should also be made aware of the felling practices of bamboo clumps in home-gardens as well as market, quality specifications, end uses, relative prices and destination of bamboo poles and other products.

REFERENCES Chundamannil, M., Krishnankutty, C.N. and Rajan, A.R. ( 1993). Socio-economic
study of farm forestry : a survey of four villages in Kerala. KFRI Research Report No. 90. Kerala Forest Research Institute, Peechi, India. 66p.
Government of Kerala (1995). Economic Review 1995. State Planning Board,
Government of Kerala (1988). Statistics for planning 1988, Department of Economics
Krishnankutty, C.N. (1988). Bamboo resources in the home-gardens of Kerala : In Rao, I.V.R., Gnanaharan, R. and Sastry, C.B. (eds) “Bamboos : Current Research”, Proceedings of the International Bamboo Workshop, 14-1 8, November, 1988, Cochin, India: 44-46.
Krishnankutty, C.N.,Blowfield, M.E. and Boa, E. (1995). Bamboo marketing in Kerala, India : a study for the Integrated Rural Bamboo Project. R2295 (c). Natural Resources Institute, U.K., vii + 55p.
Krishnankutty, C. N. (1991). Market study of bamboo and reed in Kerala. In: Bamboo (India): Silviculture, management and utilisation of bamboo resources of Kerala. Final Technical Report (April 1987-April 199 1). Kerala Forest Research Institute, Peechi, India: 77-92.
Krishnankutty, C.N. (1990). Demand and supply of wood in Kerala and their future trends. KFRI Research Report No. 67, Kerala Forest Research Institute, Peechi, India. 66p.
Nair, N.R. (1971). Commercial volume tables for the forest trees of Kerala. Kerala
Thiruvananthapuram.
and Statistics, Thiruvananthapuram.
Forest Department, Thiruvananthapuram.
56

Appendix - 1 Average weight, length and bottom girth of bamboo poles sold at depots
Trade name
24 feet bottom No. 1
24 feet bottom No.2
24 feet bottom No.3 24 feet bottom No.4
22 feet bottom No. 1
22 feet bottom No.2
20 feet bottom No. 1
20 feet bottom No.2
20 feet middle No. 1
20 feet middle No.2
20 feet middle No.3
20 feet middle No.4
18 feet bottom No.1
18 feet bottom No.2
18 feet bottom No.3
18 feet bottom No.4
18 feet bottom N o . 5
18 feet middle No. 1
18 feet middle No.2
18 feet middle No.3
Weight (kg)
26.45
18.60
15.60
9.60
Small depots
Length (m)
6.86
5.41
5.44
5.45
Bottom girth (cm)
29.50
27.38
29.25
21.00
Weight (kg)
36.55
32.80
-
27.60
20.35
14.30
8.40
29.70
21.50
20.80
18.60
20.15
NA
9.70
Medium depots
Length (m)
7.34 7.44
5.83
5.80
5.91
5.90
5.57 5.01
5.66
5.53
5.88
NA
5.58
Bottom girth (cm)
32.12
33.70
33.12
28.75
29.00
25.62
33.62
30.65
28.50
27.50
35.12
NA
27.50
Weight (kg)
50.76
40.02
37.15 28.90
46.50
35.50
24.75
22.90
25.60
19.10
NA
8.30
44.40
34.30 26.25
24.76
23.55
18.10
15.00
12.65
Big depots
Length (m)
6.96
6.89
6.99 6.7 1
6.68
6.65
5.62
5.67
5.81
5.75
NA
5.89
5.73
5.58
5.5 1
5.73
5.67
5.77
5.72
5.69
Bottom girth (cm)
43.25
32.62
33.50
28.88
38.12
30.88
30.50
27.25
41.12
31.38
NA
21.50
40.62
34.75
29.38
28.88
26.00
3 1.25
25.62
24.88
NA - Not available during the survey
Two depots each were selected from the categories of small, medium and big depots. Measurements of bottom girth, length and weight of five randomly chosen pieces of most of the items in the selected depots were recorded and used examining the variability of grading in different depots.
Contd.. .
57

Appendix - 1 contd.. ...
3.26
3.07
3.18
3.15
Trade name
23.12
23.62
20.12
17.38
6 feet bottom No. 1
6 feet bottom No.2
6 feet bottom No.3
6 feet bottom No.4
16 feet bottom No.1
16 feet bottom No.2
14 feet bottom No.1
14 feet bottom No.2
14 feet bottom No.3
14 feet bottom No 4
14 feet bottom No 5
14 feet middle No. 1 14 feet middle No. 2
14 feet middle No.3 14 feet middle No.4
12 feet bottom No. 1
12 feet bottom No.2
12 feet bottom No.3
12 feet bottom No.4
10 feet bottom No. 1
10 feet bottom No.2
10 feet bottom No.3
10 feet bottom No.4
Weight (kg)
20.95
16.40
11.10
20.15
15.60
7.60
6.45
7.25
5.90
5.75
4.05
11.75
8.40
5.20
2.62
Small depot
xngth (m)
4.84
4.63
4.57
4.07
4.20
4.20
4.21
4.26
4.20
4.24
4.36
3.13
3.02
3.37
3.35
Bottom girth (cm)
31.38
24.75
21.88
28.62
28.62
19.88
17.62
22.62
23.38
20.33 21.25
26.38
22.75
20.50
17.82
Weight (kg)
23.25
NA
11.65
5.65
25.40
19.30
15.90
8.75
7.10
8.75 6.90
5.00
3.60
22.60
12.70
10.50
4.70
12.75
8.2
5.05
2.00
Medim depots
xngth (m)
4.40
NA
4.99
5.07
4.44
4.25
4.35
4.53
4.43
4.53 4.35
4.26
4.39
3.76
3.65
3.55
3.64
Bottom Weight girth (kg) (cm)
30.38
NA
22.62
23.12
33.38 30.12
25.50
27.25
21.88
27.25 26.00
22.38 20.50
32.38
26.88
23.38
21.12
30.85 NA
13.80
13.15
12.30
5.75
24.85
19.60
13.85
8.05
6.80
NA 6.25
NA
NA
NA
11.80
15.00
4.85
11.37
7.20
4.45
2.50
Big depot:
Length (m)
5.07 NA
4.43
5.20
4.79
4.54
4.27
4.21
3.88
4.14
3.92
NA
4.00
NA
NA
NA
3.24
3.46
3.36
3.31
3.06
3.33
3.39
Bottom girth (cm)
34.50 NA
23.62
23.00
25.30
18.12
30.88
29.00
23.62
20.62
16.88
NA 18.88
NA
NA
NA
19.88
21.62
20.00
24.15
18.75
16.25
11.75
NA - Not available during the survey
58

Appendix - 2 Month-wise export of bamboo poles from the depots to Tamilnadu* during 1988-89 to 1993-94
Quantity
2181.6 4298.4 2192.4 2332.8 2138.4 1965.6 1630.8 2494.8 3812.4 3445.2 3801.6 3758.4
(Quantity** in metric tonne)
%
6.41 12.61 6.44 6.85 6.28 5.77 4.79 7.33
11.20 10.12 11.16 11.04
Month
APRIL MAY JUNE JULY AUGUST SEPTEMBER OCTOBER NOVEMBER DECEMBER JANUARY FEBRUARY MARCH
1988-89
Quantity
2224.8 2181.6 2224.8 2127.6 1792.8 1933.2 2 106.0 2343.6 3315.6 4698.0 4147.2 4298.4
33393.6 TOTAL * Includes quantity move
%
6.66 6.53 6.66 6.37 5.37 5.79 6.3 1 7.02 9.93 14.07 12.42 12.87 100.00) to a
1989-90
Quantity
2667.6 2667.6 1976.4 1987.2 2052.0 1598.4 1522.8 2613.6 4233.6 4579.2 3693.6 3747.6 33339.6
few places in Pondicherry, Andhra Pradesh and Gujrat
%
8.00 8 .OO 5.93 5.96 6.15 4.79 4.57 7.84 12.70 13.74 1 1.08 11.24 100.00
1990-91
34052.4 I 100.00
1991-92
Quantity
2689.2 2300.4 2 106.0 1825.2 1954.8 1965.6 1728.0 1933.2 3823.2 4222.8 4147.2 4 136.4
32832.0
%
8.19 7.01 6.4 1 5.56 5.96 5.99 5.26 5.89 11.64 12.86 12.63 12.60 100.00
1992-93
Quantity
1976.4 2300.4 2 160.0 1803.6 1825.2 1436.4 1879.2. 2257.2 2937.6 3898.8 3477.6 3153.6
29 106.0
%
6.79, 7.90 7.42 6.20 6.27 4.94 6.46 7.76
10.09 13.40 11.95 10.82 100.00
1993-94
Quantity
1792.8 1987.2 1738.8
1630.38 1566.0 766.8
1998.0 2019.6 3142.8 3002.4 2937.6 2257.2
24840.0
%
7.21 8 .oo 7.00 6.57 6.30 3.09** * 8.04 8.13 12.65 12.09 11.83 9.09 100.00
***
** This does not include the quantity of bamboo sold from depots in Alathur Taluk. There are no forest check-post at the inter-state exists from Alathur to Tamil Nadu Reduction in export is caused by the national strike for about two weeks by the transporting agencies
59

Monts Other
places*
745.2
734.4
637.2
626.4
507.6
205.2
831.6
788.4
1231.2
1252.8
1436.4
1069.2
10065.6
40.53
April
May June
July
August
September
October
November
Decembcr
January
February
March
Total
%
Total**
1792.8
1987.2
1738.8
1630.8
1566.0
766.8
1998.0
2019.6
3142.8
3002.4
2937.6
2257.2
24840.0
100.00
Salem Dindi-
gal 75.6
75.6
64.8
108.0
86.4
32.4
64.8
21.6
129.6
140.4
151.2
118.8
1069.2
4.30
248.4
291.6
302.4
226.8
205.2
97.2
259.2
367.2
334.8
356.4
270.0
194.4
3 153.6
12.70
Gopala
puram
32.4
0.0
108.0
54.0
54.0
43.2
172.8
129.6
140.4
97.2
75.6
118.8
1026.0
4.13
Appendix -3 Month-wise export of bamboo poles from the depots to different places in Tamil Nadu during the year 1993-94
Pollachi
205.2
259.2
205.2
226.8
216.0
97.2
248.4
205.2
226.8
172.8
226.8
194.4
2484.0
10.00
(Quantity in metric tonnes)
Anthi- Erode
Y 151.2 32.4
54.0 162.0
43.2 97.2
108.0 54.0
64.8 97.2
108.0 86.4
118.8 97.2
162.0 97.2
356.4 140.4
183.6 129.6
172.8 75.6
86.4 75.6
1609.2 1144.8
6.48 4.61
21.6
64.8
43.2
75.6
54.0
21.6
21.6
32.4
54.0
21.6
0.0
10.8
421.2
1.70
21.6
97.2
54.0
43.2
43.2
0.0
21.6
21.6
21.6
32.4
32.4
21.6
410.4
1.65
Madu-
rai
97.2
151.2
97.2
86.4
86.4
21.6
75.6
64.8
43.2
64.8
97.2
108.0
993.6
4.00
Potha-
nnur
21.6
21.6
0.0
0.0
0.0
0.0
0.0 10.8
129.6
259.2
108.0
21.6
572.4
2.29
Parima
thivelur
32.4
32.4
0.0
0.0
0.0
0.0
0.0
10.8
118.8
64.8
194.4
43.2
496.8
2.00
Ambur Neyveli Trichy
54.0
0.0
43.2
10.8
75.6
0.0 43.2
10.8
32.4
75.6
43.2
10.8
399.6
I .6l
Moha-
nnur
54.0
10.8
0.0 10.8
0.0
0.0
10.8
43.2
64.8
32.4
43.2
97.2
367.2
1.48
Kattu
puthur
0.0
0.0
43.2
0.0
75.6
54.0
32.4.
54.0
54.0
32.4
10.8
0.0
356.4
I .43
Thotti
yan 0.0
32.4
0.0
0.0
0.0
0.0
0.0 0.0
64.8
86.4
0.0
86.4
270.0
1.09
* Include most places in Tamil Nadu and a few places i r Pondicherry, Andhra Pradesh and Gurajat. ** This does not include the quantity of bamboo sold from depots in Alathur Taluk. There is no forest check-post at the inter-state exists from Alathur to Tamil Nadu.
60

Appendix - 4
Year
1987-88 1988-89 1989-90 1990-9 1 199 1-92 1992-93
NA - not available
Price trends of ba I
Within Outside Kerala Kerala Tamil Nadu Karnataka Total,
15476 NA 5494 NA 14407 33394 2057 49858 8586 33340 10383 52309 2171 34052 22862 59085 1102 32832 21 104 55038 2322 29 106 1603 3303 1
1993-94 454 24840 7969 33263
quantity
Year
1993-94
967-68 969-70 974-75 979-80 984-85 989-90
mboo poles sold through wholesale depots I
I Price Rs. per metric tonne
Current price 36 70 250 400 800 1200 2145
I98 1-82 constant price 110 208 402 517 665 724 865
Appendix 5
1987-88 1988-89 1989-90 1990-9 1 199 1-92 1992-93 1993-94
Year Current price 1050 729 1050 1300 1300 1300 1330 1597
198 1-92 constant price Price Rs. per metric tonne
679 785 712 626 582 644
Source : Poabson Company Ltd
61
Appendix - 6 Movement of bamboo from depots within and outside Kerala during 1987-88 to 1993-94
(Quantity in metric tonne)
Price of bamboo ‘left over’ sold from wholesale depots to Mysore Paper Mills Ltd.

Year Kannur Kozhikode Thrissur Ernakulam Kottayam Other places
172.8 97.2 21.6 54.0 15098.4 32.4 183.6 43.2 108 .O 140.4 13867.2 64.8 237.6 108.0 21.6 129.6 7905.6 183.6 183.6 54.0 0 54.0 1803.6 75.6 86.4 64.8 97.2 10.8 820.8 21.6
162.0 43.2 64.8 32.4 1987.2 32.4 151.2 97.2 118.8 10.8 75.6 0
1987-88 1988-89 1989-90 1990-9 1 199 1-92 1992-93 1993-94
Total
15476.4 14407.2 8586.0 2170.8 1101.6 2322.0 453.6
Year Kozhikode Kannur Way anad Kasaragod1987-88 21.6 0 0 0 1988-89 10.8 10.8 0 0 1989-90 21.6 0 0 0 1990-9 1 10.8 0 0 0 199 1-92 10.8 10.8 21.6 0 1992-93 0 151.2 10.8 10.8 1993-94 10.8 367.2 0 15 1.2
* The data is partial. It pertains to the forest check-posts at Ramanattukara in Kozhikode District and Vaniyampara in Thrissur District. Quantity of bamboo moved to northern districts is recorded at the forest check-post at Ramanattukara. Most of the quantity from the depots was moved to the southern districts through an alternate route where there is no forest check-post. Vaniyampara check-post accounted only for a small part of the total quantity moved to southern districts.
Total 21.6 21.6 21.6 10.8 43.2
172.8 529.2
Appendix - 8 Incoming of bamboo from home-gardens of northern districts of Kerala to the wholesale
Sizes of culm Mean weight per culm (in kg)
Small 22.15 (5.31)*
Very big 88.25 (4.55)
Medium 42.1 1 (1.66) Big 58.71 (3.13)
Weighted average 47.50 21
Number equivalent to one metric tonne
45 24 17 11
* Figures in the parantheses are standard errors.
62
* The data compiled from forest check-post at Ramanattukara is partial since it does not include the movement through alternate route.
Appendix - 9
Weight of bamboo culms of different size in home-gardens
Appendix - 7 Movement of bamboo from the depots to different districts in Kerala*
(Quantity in metric tonne)
Copyright © 2022 FDOKUMEN