
A Socio Economic Profile of Butterworth
84
Butterworth Profile Page 1 of 84 A Socio Economic Profile of Butterworth Produced by: The Eastern Cape Socio-Economic Consultative Council 1999 Ecsecc
-
Upload
khangminh22 -
Category
Documents
-
view
0 -
download
0
Transcript of A Socio Economic Profile of Butterworth

Butterworth Profile Page 1 of 84
A Socio Economic Profile of Butterworth
Produced by: The Eastern Cape Socio-Economic Consultative Council
1999
c Ecsecc
Butterworth Profile Page 2 of 84
CONTENTS
EXECUTIVE SUMMARY
1. Introduction and overview of study 1
Introduction 1
Butterworth seen as a failed experiment 2
The key question 3
Studies on Butterworth 3
This study 4
Investigating the socio-economic profile – areas of focus
of the study 5
2. Development planning in Butterworth – a historical account 6
Introduction 6
The early period 7
The period of the industrial decentralisation strategy 7
The post 1994 period 15
(i) The election of the TLC and development
planning 15
(ii) The emergence of tensions between the TLC
and stakeholders in the Butterworth area 17
(iii) The economic and development summit held
in July 1998 18
3. A demographic profile of Butterworth 19
Introduction 19
An overview of population growth in Butterworth 19
The size of the population of Butterworth 21
Population characteristics 23
(i) Age-sex distribution and dependency 23
(ii) Education 24
(iii) Health indicators 25
4. Analysing the local economy 27
Butterworth Profile Page 3 of 84
Introduction 27
Natural resources 28
(i) Mining and minerals 28
(ii) Water 28
(iii) Agriculture 28
The industrial sector 29
(i) The creation of the industrial sector 29
(ii) The growth of the industrial sector 31
(iii) The decline of the industrial sector 34
The commercial sector 38
The retail sector 38
Small, medium and micro-enterprises 39
Government and related services 39
Infrastructure 40
Employment patterns and features in the labour market 41
(i) Employment by sector and occupation 41
(ii) Skills level in the area 44
5. Development stakeholders 47
Introduction 47
The ANC, COSATU, SACP alliance 47
SANCO 48
The Presidential Projects Team 49
The Gcuwa Training Centre 50
Educational Institutions 51
Traditional Authorities 51
Business Groups 52
Masibambane Small Business Association 52
The TLC and Municipality 52
The ECDA 53
NGOs 53
6. What the government is doing 54
The Presidential Projects Team 54
The participation of the provincial and national government
departments in the July 1998 summit 54
The Department of Transport 55
The Department of Labour 55
The need for political intervention 55
Butterworth Profile Page 4 of 84
7. Local economic development – constraints and possibilities 56
Introduction 56
Butterworth industries under industrial decentralisation – a limited
contribution to the local economy 56
(i) The former RSA and Traskei governments as the
main actors in development programmes 56
(ii) Ownership of industries in Transkei by country of origin 57
(iii) The view that Butterworth must attract industries 58
(iv) Limited contribution by industries to local economic and
people development 59
Competing for investments with „better‟ areas in South Africa 63
The envisaged role of local government in LED 64
Currents within the Butterworth Municipality 65
Expecting development and progress from a cash-strapped TLC
and Municipality 67
8. Conclusion 69
9. Recommendations 71
Appendix – List of stakeholders interviewed

Butterworth Profile Page 5 of 84
Executive Summary
In Butterworth, a difference must be made between the failure of the plans and
strategies of the past, and the failure of the „people of Butterworth‟ to become
responsible for their destiny as a community under the new political dispensation.
Development planning in Butterworth can be divided into various phases. There is
the earlier period in the development of the town when Butterworth was for many
decades just one other small town in South Africa. There is the period of the
industrial decentralisation strategy pursued by the apartheid state. After 1994, the
local government elections saw a TLC at the centre of local development
initiatives, the inclusion of the community of Butterworth, its interest groups and
stakeholders in charting the future of the town. The envisaged role of the TLC
changed as tensions arose between the TLC and the greater community of
Butterworth. An impasse developed. Concern about the state of affairs in
Butterworth, especially the lack of progress in economic, social and development
planning, saw the holding of the Butterworth Regional Economic and
Development Summit in July 1998. The summit marks the present phase of a
renewed effort to again engage the Butterworth community in development
planning.
Butterworth’s period of industrial boom was short-lived as political changes
and developments in South Africa as well as the former Transkei changed the status
quo under which Butterworth industries operated. There was intense labour unrest
in 1989/90 in Butterworth. The oppressed and the exploited workers heightened
their resolve to undermine the homeland system and stake a claim in South Africa
as citizens of the Republic of South Africa. The political changes were
accompanied by the closure and exodus of many firms from the Butterworth
industrial centre.
According to estimates the size of the population of Butterworth grew from 281
in 1891, to 2769 in 1970, about 33 370 in 1990 to just over 60 000 in 1997. There
Butterworth Profile Page 6 of 84
is evidence that suggests that the population of Butterworth is increasing even in
the present period. It is difficult to provide an exact indication of the size of the
population. However informal settlements are rising in many parts of Butterworth.
The growth in the number of people involved in „informal trade‟ in the CBD is
suggestive of a migration of people from rural areas into the town in search of
better opportunities.
Butterworth’s economy can be divided into various sectors comprising of (i) the
shrinking industrial sector, (ii) a steady commercial sector and (iii) an apparently
growing retail sector.
Butterworth does not have any major or substantial economically exploitable
mineral deposits. The area has an ample, dependable water supply having been able
to adequately supply the water-dependent industrial sector that developed in the
area. Some researchers (Hofmeyr and Maasdorp (1993)) have suggested that the
area „was more suited to agriculture‟. The full agricultural potential of the area
remains largely unexplored. The Ncora irrigation scheme that was established in
the early 1980s to boost local agricultural production but indications are that it did
not succeed.
The retail sector in Butterworth is showing positive growth and appears to be very
stable. The Masibambane Small Business Association represents the interests of the
small business operators in the Butterworth area. The caravans, containers, shacks
and selling tables are operated by the members of the association. The Butterworth
CBD is highly congested with hawkers in nearly every yard of the town‟s
pavements.
Butterworth has a number of establishments that can categorised as government and
related services. The town and its townships has a hospital, the magistrate courts,
the municipality with its divisions, police station, public works and the many
education institutions. Employment patterns and features of the labour market show

Butterworth Profile Page 7 of 84
that the government is the main employer in the area. Before, it was the town‟s
manufacturing establishments that provided the highest employment.
Skills levels in the Butterworth area are low. However the area has tremendous
potential for the development of relevant skills for local economic growth. There
are many able and willing institutions that can provide skills and training.
The following were identified as important stakeholders in Butterworth:- The
ANC, COSATU, SACP alliance, SANCO, The Presidential Projects Team, The
Gcuwa Training Centre, Educational Institutions, Traditional Authorities, Business
Groups, the Masibambane Small Business Association, the TLC and the
Municipality.
The following government departments and units were seen to be making
positive contributions in the area. The Presidential Projects Team is seen as making
critical intervention in development planning. The attendance by the Premier of the
Province, the participation of the provincial and national government departments
in the July summit is viewed positively as it draws attention to the challenges in
Butterworth. The departments of Transport and Labour are seen as involved in the
provision of solutions. Stakeholders felt there is a need for firm, decisive
government intervention that will bring about a final and lasting solution in
Butterworth.
Strategies are needed to provide an enabling environment for the local economy of
Butterworth to grow. The phase of industrial employment has disappeared, new
ways of generating employment and creating opportunities for economic growth
have to be devised.
One of the key indications that came out of this study, which is important for local
economic development, is that Butterworth needs strong leadership, unity and
clear plans on how to generate social and economic development.

Butterworth Profile Page 8 of 84
It remains highly unlikely that Butterworth can re-emerge as an industrial centre
under the current political and workers rights climate. When the impact of the
incentive-driven industrialisation in Butterworth is critically appraised, it becomes
rather difficult to conclude that the industrial establishments that were in
Butterworth had any substantial benefit to the local population. The positive impact
from industrialisation remained rather low and superficial, and grossly exaggerated.
A consideration of employment levels created by industries and an investigation of
the contribution to local people development is suggestive of an era of exploitation
rather than substantial industrial growth.
Strategies that are geared towards attracting outside (national and international)
investment in Butterworth have enormous challenges to overcome. With the levels
of both foreign and local investment low in an economy that is experiencing a
slump, Butterworth has to compete with many areas that have far superior
advantages. The key improvements that are urgently needed to attract investment in
the area are a better infrastructure, an improved skills base, transport facilities, road
networks, better human performance and efficiency levels.
Attracting industries into the local industrial sector is not a guarantee for the
generation of jobs. Modern production is technology – intensive and industries are
employing less workers who are highly trained. Butterworth lacks this industrial
skills base.
Local government is supposed to be playing the leading role in LED. This is where
the most serious and critical of Butterworth‟s challenges lie presently. For local
government to lead LED, managers and planners who are very skilled and
dynamic are needed. It is people who have the „know how‟, people who can
broker large investment deals for the area. Largely it is people with an insight into
social development who have the dynamism to interact with government at national
and provincial levels, international investors, NGOs, influential private individuals,
Butterworth Profile Page 9 of 84
etc. The challenge to lead LED needs leaders who are not going to „wait to see what
the government wants to do‟. The Butterworth municipality is bankrupt. There are
tensions between the TLC and some of the managers in the municipality.
The following recommendations are seen as the best path for development for
Butterworth:-
The involvement and participation of the local population in creating an economic
future for the area
Local economic development networks and links must be created. Reservations with
attracting industries to Butterworth – evidence shows that the Butterworth industries
had a limited impact in the social development and upliftment of the area.
Butterworth needs strong leadership and competent managers in critical areas of the
municipality and governance.
Small business development and wealth creation
The complete spectrum of small businesses needs to be explored
Local participation in the local economy
Public-private partnerships
The resolution of the Butterworth conflict
There are advantages that Butterworth has because of its location.
Government procurement policy and contracts
Butterworth Profile Page 10 of 84
1. Introduction and overview of study
Introduction
Butterworth has received a sizable and noticeable amount of attention from the
media, researchers, scholars, policy makers and key decision-makers in the
provincial and national government levels. Butterworth is comparatively a small
town in a predominantly rural setting in the former Transkei homeland. The town
has been part of many developmental initiatives by both the former apartheid state
as well as the present South African government. Umtata and Butterworth were
identified as „keynote towns‟ by the Presidential Project Team which is currently
involved in facilitating development in many of the former Ciskei and Transkei
towns.
The town of Butterworth and the events that have unfolded involving stakeholders,
interest groups and the Transitional Local Council (TLC) - the envisaged driving
force in local economic and social development, have drawn the attention of the
public and has been regularly in the news. The article that featured in the Sunday
Times of 15 November 1998 and the many others in the Eastern Cape daily, the
Daily Despatch, paint a picture of a town and its citizens living through a turbulent
phase. This is happening after what many have seen as „the golden period of
industrial growth in Butterworth‟.
The many marches, during which businesses in the central business district are
forced to shut down, have become so common that in the words of one of the
managers interviewed … we no longer see them, we plan around them, we all seem
to have grown too accustomed to the frustrations, the delays in deliveries, the
collapse in services … banks that are forced by circumstances to close … at times
we cannot pay our employees. During the visit of the Deputy President, the main
street, which is part of the national N2 drive-through the town, was deliberately
littered with refuse and debri collected from the local dump.
Butterworth Profile Page 11 of 84
A tour of Butterworth‟s Zithulele and Ibika industrial townships show many factory
buildings lying empty, unoccupied and unused. Rusted rail sidings have become
overgrown with bushes and shrubbery, tall silos which were once part of a milling
company stand idle as stray cattle graze in what must have been once well kept
front gardens of industrial establishments during Butterworth‟s boom period that
fell flat. The site of the town and its surrounds, events like the resignation of the
mayor of Butterworth, the opening of the Gcuwa Training Centre, the
malfunctioning traffic lights, the many street hawkers that cover every yard of the
town‟s pavements, the development summit addressed by the Premier of the
Province and the Minister of Trade and Industry … all add to a complex unfolding
situation of a community with major challenges, a community immersed in
disagreements and tensions, but showing convincing signs of trying to find
solutions and face the challenges that will secure prosperity for the town and its
citizens.
Butterworth seen as a failed experiment
Some observers and commentators have dismissed Butterworth as a failed
experiment, a disaster waiting to happen (Sunday Times 15 November 1998), a
wreck, a town overwhelmed by decay, a disintegrating shell‟ (cited by Hosking and
Haines, November 1997). Butterworth has been seen as a good example reflecting
the failure and collapse of the shortsightedness of the apartheid policy which gave
birth to the now-defunct homelands with their hardly-viable „overnight paper-
towns‟. The failure and criticism has not been restricted to the apartheid-homeland
era. Butterworth has also been seen as presently being on a sure path to complete
failure under the new developmental local government paradigm. This is viewed as
an endemic problem affecting many local authorities in South Africa.
Butterworth Profile Page 12 of 84
The key question
The question is – is Butterworth an experiment that failed? Was it intended to
succeed in the first place? What is the basis, what are the arguments, what fact and
evidence can be brought forth to conclusively and undoubtedly proclaim all efforts
so far as having been without success and mainly futile? What are the issues, what
are the views of those that are part of what appears to be the complex milieu of
Butterworth‟s social and economic decline and stagnation. Importantly, is there any
evidence of attempts to tackle the current developmental problems and issues
facing the town? When past development of the Butterworth area was undertaken,
how was the development initiated and maintained? What stake and interest did the
community have on the planning, the development and the future of the area?
Surely there is a difference between the failure of the plans and strategies of the
past, and the failure of the „people of Butterworth‟ to become responsible for their
destiny as a community.
Studies on Butterworth
A fair amount of studies have been undertaken on Butterworth. These studies, data
collection, surveys and documentations were undertaken by the former Transkei
government, individual researchers and institutions. The different studies were
designed to serve varied purposes and illuminate theoretical and factual
perspectives on the town of Butterworth as an area and as part of a wider policy
framework and practice. The main focus on Butterworth has been studies of the
town as part of the Industrial Decentralisation Policy with the incentive scheme,
Sarpong (1990), Dewar et al (1984). In the former Transkei, attempts were made to
compile data and create profiles of Transkei‟s industrial growth. The Transkei
Industrial Surveys and studies by the DBSA and the Transkei Development
Corporation provide mostly statistical profiles of industries in Butterworth. These
were augmented by Transkei population censuses and documents such as the 1987
Butterworth Master Plan, a development blueprint for the town created during the
homeland era. In 1993 a study on the economic potential of Butterworth was
Butterworth Profile Page 13 of 84
undertaken by the University of Natal‟s Economic Research Unit. Other studies
and documents in the recent past include the Butterworth Structure Plan (second
draft - November 1997) prepared for the Presidential Project Team and the TLC,
the Hosking and Haines (November 1997) study „Butterworth – Development
Policy Lessons‟ commissioned by Ecsecc, the July 1998 Butterworth Regional
Economic and Development Summit, and J. Abankwa‟s unpublished Masters thesis
entitled „An investigation of labour relations in the former Transkeian‟ submitted to
the Sociology Department, University of Fort Hare.
This study
Different from the studies cited above, this study seeks to accomplish several
undertakings. The study will attempt to go beyond the impressions and investigate
the views and perceptions of those involved in the social, political and economic
life of the town and its surrounding areas.
Firstly, the wisdom and views from the existing literature will be analysed.
Secondly and more importantly, the critical focus of the study is to identify the
stakeholders and key actors and those likely to provide decisive and productive
action in shifting Butterworth from its present situation and condition. The views
and perceptions of the social actors, the stakeholders, interest groups and those
involved in the social, political and economic dynamic of Butterworth will be
brought forth with the aim of identifying Butterworth‟s current development
network and possibilities for renewed development planning and local economic
development.
Thirdly, from the two above undertakings, solutions, possibilities and proposals for
the future will be provided through a process integrating and merging literature
with „the conditions on the ground‟ as seen by the stakeholders.
Butterworth Profile Page 14 of 84
Investigating the socio-economic profile – areas of focus of the study
To produce a sound and balanced insight into the issues, problems and possibilities,
a thorough historical account of development planning in Butterworth is presented.
This is important for the purpose of knowing what has succeeded and failed and for
what reasons. A good understanding of development issues, past and present, will
assist in the formulation of better strategies for local social and economic
development. Accounts of the demographic profile and the salient features of the
local economy of Butterworth are presented. As gathered and emanating from the
interviews conducted, „Butterworth‟s development network‟ is presented. The
„development network‟ part cites those who are the crucial actors and stakeholders
in current and future development planning. The role of government in
Butterworth, at both the provincial and national levels was investigated and is
presented. Issues on local economic development and proposals for economic and
people growth formed a key aspect of this study. The important issues and
considerations that were seen to hold the key to the prosperity of the town and its
inhabitants are presented.
Butterworth Profile Page 15 of 84
2. Development planning in Butterworth – a
historical account
Introduction
The history of development planning in Butterworth is closely associated and
strongly linked to the political history of the present South African society.
Butterworth is a town whose history, experience of economic planning and
development, and the perceived current decline are a reflection of the role the town
has played in the many development strategies pursued under the guidance of
different political ideologies. Butterworth as a town was established on land
occupied by the indigenous Xhosas and still remains completely enclosed by land
belonging to aMazizi. Founded by Methodists as a mission station, it went on to
serve as a military outpost, was envisaged to become a key industrial centre under
the Transkei homeland system, and is today under the control of a TLC, a body
elected as South Africa emerges into a new democratic dispensation.
Development planning in Butterworth can be divided into various phases. There is
the earlier period in the development of the town and Butterworth was for many
decades just one other small town in South Africa. There is the period when
Butterworth was one of the focal points as a result of the industrial decentralisation
strategy pursued by the apartheid state. After the 1994 democratic elections in
South Africa, development planning in Butterworth entered another phase. The
local government elections saw a TLC at the centre of local development
initiatives. This phase was characterised mainly by the inclusion of the community
of Butterworth, its interest groups and stakeholders in charting the future of the
town. However the envisaged role of the TLC changed as tensions arose between
the TLC and the greater community of Butterworth. An impasse developed as co-
operation between the TLC and stakeholders in Butterworth became difficult and
was subsequently curtailed. Concern about the state of affairs in Butterworth,
especially the lack of progress in economic, social and development planning, saw

Butterworth Profile Page 16 of 84
the holding of a Butterworth Regional Economic and Development Summit in July
this year (1998). The summit marks the present phase of a renewed effort to again
engage the Butterworth community in development planning.
The early period:
Sarpong (1990) provides a concise history and understanding of the role the town
of Butterworth played in its early days in the last century. “Butterworth was
founded as the first mission station in Transkei by the Methodists in 1827. The core
of the town at the time consisted of only the Methodist church and accommodation
units for the missionary workers … the settlement grew with the establishment of
commercial activities such as shops, and other ancillary services to serve both the
missionary workers and rural communities. Impetus to growth was provided when
Butterworth was selected as the military headquarters of the British troops during
(what some known as) the Kaffir wars of the 1870s and 1880s. The Drill Hall, now
the Town Hall was built in 1897 and the first municipal council meeting was held
there on 30th
May 1904” (Sarpong 1990:118-9).
The languid nature of the town changed as the apartheid state implemented the
policy of separate development. The homeland system was the key aspect and
bedrock of this policy. Butterworth happened to be within the boundaries of the
declared Transkei homeland territory. Development planning for the area thus
became part of the Transkei homeland development planning.
The period of the industrial decentralisation strategy:
Apartheid aimed at separating South Africa‟s race groups, confining them to
separate residential areas and territories as well as providing them with different
identities. One of the greatest threats to the apartheid state, which served the
interests of a white minority, was the existence within the Republic of South Africa
Butterworth Profile Page 17 of 84
of large numbers of the oppressed. The masses of the oppressed constituted a
majority because of the size of the black population. In order to reduce the numbers
of specifically Africans in white urban South Africa, and thus reduce what was
seen as a political threat, Africans were, through coercive measures, declared to be
non-South Africans belonging to ethnic nations with their own separate homeland
states.
To pursue the racial separation, the bantustan strategy was adopted. The central
feature of the bantustan strategy was “the recognition by the National Party
strategists that no political rights could be granted to Africans within a common
South African framework without inevitably provoking the demand for full
political rights within that common framework and without setting in motion a
process over which they would soon lose control – a process which would
inevitably result in open war or complete capitulation” (Molteno cited in Zille
1983) … the bantustan strategy was devised to provide a method of political
participation for Africans that would not threaten the maintenance of power in
white hands (Zille 1983). The apartheid planners created homeland territories for
the homeland citizens. This was to enforce and ensure their exclusion from white-
controlled South Africa save only as migrant labourers. In order to entrench the
racial separation and exclusion, homelands had to be made attractive, so that
Africans could have viable lives in their „own states‟ where they could find
employment and exercise their political rights.
Dividing the land of South Africa into ethnic compartments, occupied by different
ethnic groups with their own states and administrations was at the core of the
apartheid system. The policy of industrial decentralisation, conceived as far back as
1956, reflected the main thrust at racial separation through separate economic
development as the apartheid planners aimed at “finding gainful employment for
the Bantu population with the least disruption of their home and communal life on
the principle of taking the employment opportunities to the areas where labour was
readily available” (Kutzenberg 1973 cited in Sarpong 1990). In short, homelands
Butterworth Profile Page 18 of 84
had to have industries that could employ their own citizens with the consequence
that the Bantus will not be part of white South Africa.
Systematic planning was initiated to launch the industrial decentralisation strategy
which, according to Zille(1983) could not “be separated from the (apartheid)
government‟s political and constitutional aims”. According to Sarpong (1990), in
June 1960 incentives were announced for industries wishing to locate in the border
areas. These factors took the form of tax incentives. A Board for the
Decentralisation of Industry was created to implement these proposals.
Due mostly to the lack of infrastructure and the marketing requirements of many
industries, the border area industrialisation policy achieved limited success. Few
industries took advantage of the tax incentives offered and these only moved to
areas where their requirements were not unduly disrupted. The limited success that
was achieved with the border industrialisation programme and the increasing social
and political problems being experienced at the four metropoles, necessitated the
introduction of coercive measures to control industrial expansion at the metropoles.
This was in the form of the Physical Planning and Utilisation of resources Act (Act
No 88 of 1967) the Act placed limits on the expansion of certain industrial
activities in the industrialised areas of the country.
To ensure the effective implementation of the strategy, the government provided
increasing funding for infrastructure development in selected homeland areas so
that industrial centres could be established. Committees to co-ordinate the
implementation and evaluation of the success and failure of the strategy were
constituted. Importantly and crucial to attracting predominantly white-owned South
African industries, attractive incentives were provided.
In 1965 “the government realised that there was also a need to extend the policy to
other areas where black labour surpluses existed if success was to be attained in
utilising industrial location to take opportunities to areas of labour surpluses.

Butterworth Profile Page 19 of 84
Accordingly it was announced in September 1968 that incentives were to be
offered to white industrialists wishing to invest in black homelands (Sarpong
1990:131)
In Sarpong (1990), it is further stated that the policy was also revised when it was
realised that the lack of suitable infrastructure at the border areas was hampering
the smooth operation of the scheme. The large areas that needed to be provided
with the necessary infrastructure and the limited funds available made it imperative
that the infrastructure could only be provided at selected centres.
However determined the apartheid state was in ensuring racial separation, it was
not in a position to gratuitously pour funds for infrastructure development in all
homeland towns and major centres. Infrastructure was only provided at selected
centres. This development introduced the concept of selecting growth points so
they could be provided with the necessary infrastructure … in Transkei the two
decentralised areas, Umtata and Butterworth were … designated as growth points
… Butterworth was one of the Industrial Development Points in the Transkei
(Sarpong, 1990)
In 1971 the government appointed a Growth Points Committee as an arm of the
Board for the Decentralisation of Industries to select growth points where industrial
developments were to be promoted. In 1975 the National Physical Development
Plan (NPDP) was announced which laid emphasis on the creation of development
regions. It defined 38 regions and a hierarchy of settlements within each region.
The hierarchy consisted of planned metropolitan areas (ie. areas with sufficient
growth potential to grow into metropolitan centres), growth poles (ie. areas with
sufficient growth potential to grow into independent cities in future), principal
towns (ie. those that would house regional services) and finally growth points. In
Transkei the two decentralisation areas, Umtata and Butterworth were designated
as growth points. With the attainment of independence of the first homeland,
Transkei, the Bantu Investment Corporation was renamed the Corporation for
Butterworth Profile Page 20 of 84
Economic Development (CED) to co-ordinate developments in the homelands.
(Sarpong, 1990).
As a result of the industrial decentralisation policy, Butterworth changed from
being a small town to having industries attracted into the area by the incentives.
There was nonetheless a modest success in terms of attracting industries. The initial
thrust of the industrial decentralisation strategy did not produce the expected result
of a massive migration of industries and the creation of new ones in the growth
points. The population of Butterworth showed a noticeable rate of growth from the
early 1970s as industrialists, workers and job seekers converged on the town. In
1973 a township with 3000 houses was built with the obvious aim of housing
labour for the envisaged industrial growth.
The limited success of the industrial decentralisation strategy became a cause for
concern for the apartheid planners. “Unless the government undertakes a major
decentralisation programme, the entire tradition of political pluralism in South
Africa must be mortally endangered” (AB le Grange, a senior economist with
Benso, cited in Zille, 1983) “The original strategy had failed to entrench the
population distribution necessary to provide a basis for ethnic political partition.
This [was] clearly reflected in recent statistical studies reflecting population
projections for the year 2000 … a major cause of the state‟s inability to control
population distribution more effectively was the failure of the previous
decentralisation schemes to create the jobs required within or near „homeland‟
boundaries to prevent people migrating to urban areas in search of work … there is
also agreement on the reasons for this failure: it did not pay businessmen to
establish industries in the remote areas where the government wished to see
economic growth (Zille 1983:61-63).
The Good Hope Conference held in 1981 reformulated the industrial
decentralisation strategy “The plan envisaged the demarcation of South Africa into
a number of development regions (functional regions). There was also a
Butterworth Profile Page 21 of 84
recognition and demarcation of regions requiring more development aid than
others. New industrial decentralisation packages (concessions) were announced.
The concessions granted to each centre depended on the position of the region
along a scale of development priority regions. Region D was accorded the highest
development priority and accordingly it [had] some of the most attractive
concessions available. Butterworth happened to be located in region D (Sarpong
1990:134).
The restructured industrial decentralisation strategy had noticeable results in a
number of the demarcated industrial development points. It was as a result of the
second wave, the revised incentive scheme that from 1983 Butterworth experienced
a surge in industrial growth as a number of industries took advantage of the
incentive scheme offered. The 1990 Transkei Industrial Survey notes that only
7.5% of industries operating in Transkei (including Butterworth) as at 1990 were
established before independence in 1976; 22.4% were established during the period
1976 and 1981 before the revision of the industrial decentralisation strategy. This
means that 70% of all industrial establishments operating in Transkei as at 1990
were established under the revised incentive scheme. Butterworth was the main
centre of industrial activity in the former Transkei. Butterworth accounted for 48%
of all industrial establishments in 1990. The establishment of industries in
Butterworth peaked at 115 industries in 1989 (Transkei Industrial Survey 1990/93
cited in Abankwa, 1998).
This period of industrial growth in Butterworth was, as indicated, an outcome of
deliberate development planning centred around the provision of attractive
incentives. In 1987, under George Matanzima‟s Transkei government, a Master
Plan was developed for the Butterworth area. Dr Bikitsha, the chief of Amazizi,
interviewed during the study, served under George Matanzima‟s government and
affirmed that “… we produced a Master Plan – the DBSA was involved in the
development of the plans … the plans were for all the towns of Transkei and they
detailed the way development and planning should take place”. The Butterworth
Butterworth Profile Page 22 of 84
Structure Plan (Second Draft) prepared by Wanklin and Associates in collaboration
with Stemele Bosch and Associates in November 1997 for the Transitional Local
Council and the Presidential Projects Team does refer to and cite this 1987 Master
Plan.
Butterworth‟s period of industrial boom was short-lived as political changes and
developments in South Africa as well as the former Transkei greatly changed the
status quo under which Butterworth industries operated. Transkei had a military
ruler, Bantu Holomisa, who was supportive of the banned „peoples organisations‟
and had numerous clashes with the apartheid state. Bantu Holomisa remained
sympathetic to the exploited, lowly paid workers in Butterworth industries and
allowed workers to start and operate trade unions freely in Butteworth. There was
intense labour unrest in 1989/90 in Butterworth. The oppressed and the exploited
workers heightened their resolve to undermine the homeland system and stake a
claim in South Africa as citizens of the Republic of South Africa. The release of
Nelson Mandela and other political leaders who had served long terms in jail under
the repressive apartheid state became a clear sign that the social and political fabric
of South African society were changing irreversibly. These political changes were
accompanied by the closure and exodus of many firms from the Butterworth
industrial centre. Hosking and Haines (1997) in a study on Butterworth noted that
“Since 1990, 20 companies affiliated to the Border-Kei Chamber of Business have
closed … relocations and closures continued in 1997. In the last six months of that
year, three large industries closed down. In April 1997 South African Breweries
closed down its plant resulting in the loss of 340 jobs … in May 1997, Premier
Milling closed its plant and in June 1997, Tramatex closed down resulting in the
loss of 888 jobs. One of the main industrial areas is now almost entirely comprised
of empty factories”. The decline of the incentive-driven industrialisation in
Butterworth, and Transkei in general, marked an end of an era in development
planning for the area.
Butterworth Profile Page 23 of 84
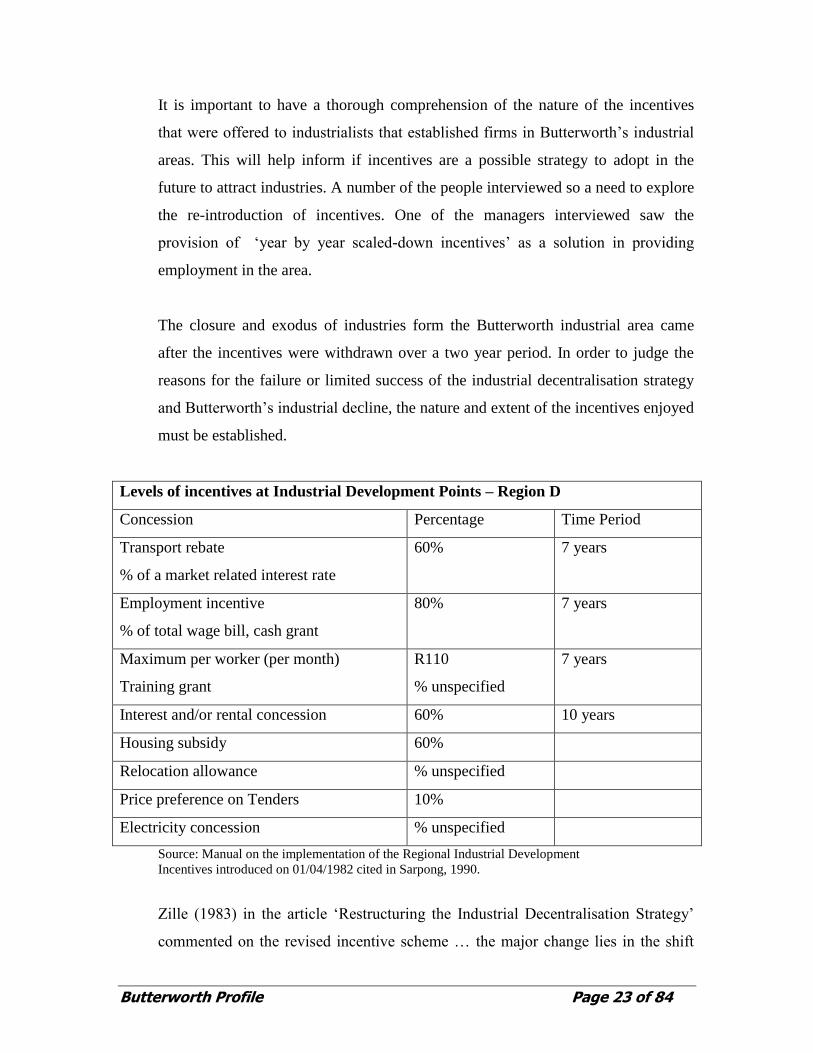
It is important to have a thorough comprehension of the nature of the incentives
that were offered to industrialists that established firms in Butterworth‟s industrial
areas. This will help inform if incentives are a possible strategy to adopt in the
future to attract industries. A number of the people interviewed so a need to explore
the re-introduction of incentives. One of the managers interviewed saw the
provision of „year by year scaled-down incentives‟ as a solution in providing
employment in the area.
The closure and exodus of industries form the Butterworth industrial area came
after the incentives were withdrawn over a two year period. In order to judge the
reasons for the failure or limited success of the industrial decentralisation strategy
and Butterworth‟s industrial decline, the nature and extent of the incentives enjoyed
must be established.
Levels of incentives at Industrial Development Points – Region D
Concession Percentage Time Period
Transport rebate
% of a market related interest rate
60% 7 years
Employment incentive
% of total wage bill, cash grant
80% 7 years
Maximum per worker (per month)
Training grant
R110
% unspecified
7 years
Interest and/or rental concession 60% 10 years
Housing subsidy 60%
Relocation allowance % unspecified
Price preference on Tenders 10%
Electricity concession % unspecified
Source: Manual on the implementation of the Regional Industrial Development
Incentives introduced on 01/04/1982 cited in Sarpong, 1990.
Zille (1983) in the article „Restructuring the Industrial Decentralisation Strategy‟
commented on the revised incentive scheme … the major change lies in the shift

Butterworth Profile Page 24 of 84
away from tax concessions to direct cash payments, linked to the number of
workers employed. In the top priority Eastern Cape/Ciskei area, for example, a
monthly cash payment of R110 per worker will be paid to each industrialist for
seven years. In addition the area qualifies for a 60% rail rebate, a 50% discount on
harbour charges at East London and a minimum 60% interest subsidy as well as
subsidies on electricity, housing and training‟.
As stated earlier, it was only after the introduction of the revised incentive scheme
that Butterworth saw all its factory space occupied. The high level of the
attractiveness of the incentives was captured during the interview with Mr
Campbell of Suntex in Butterworth. He noted that “…when I came to Butterworth,
there was no space for factories … you could not get a factory, there was a waiting
list”.
The post 1994 period
As political change took root in South Africa, the historic national elections were
held in April 1994. These were followed by local government elections held in
1995 except in the Western Cape and KwaZulu Natal where elections took place on
29 May 1996 and 26 June 1996 respectively. In the post-apartheid period, local
government has been given a crucial role to play in the economic and social
development of local areas.
(i) The election of the TLC and Development Planning
The local government framework that the South African government has adopted,
is that of a developmental local government. Developmental local government is
defined as “local government committed to working with citizens and groups
within the community to find sustainable ways to meet their social, economic and
material needs and improve the quality of their lives (White Paper on Local
Butterworth Profile Page 25 of 84
Government, 9 March 1998). Local municipalities have been given very important
responsibilities and role in the economic upliftment and economic development of
areas under their control. The constitution of the Republic of South Africa (1996),
itself based on an earlier interim constitution, mandates local government to:
provide democratic and accountable government for local communities
ensure the provision of services to communities in a sustainable manner
promote social and economic development
promote a safe and healthy environment
encourage the involvement of communities and community organisations in the
matters of local government
From these responsibilities, Transitional Local Councils have to play a leading role
in local economic development and development planning in general, while
working in close co-operation with stakeholders and interest groups. The
Butterworth Transitional Local Council did, initially, adopt this perspective. It
worked with the many community organisations in the Butterworth area in seeking
and formulating a common vision for the future of the town. There is record and
evidence of attempts at co-operative and inclusive local government. The
Butterworth Structure Plan (Second Draft) prepared for the Transitional Local
Council and the Presidential Project Team in November 1997 by the consultants
Wanklin and Associates in collaboration with Stemele Bosch and Associates is an
indication of democratic, participatory and inclusive development planning in the
post-1994 period. The Structure Plan was intended to contribute towards integrated
development planning as prescribed by the Development Facilitation Act. In the
Butterworth Structure Plan, under the heading „public participation‟, it is noted that
Butterworth has held two major public participatory workshops dealing with
planning, development, strategic issues and needs of the town. These functions
were:-
The Consultative Workshop for Short and Medium Term
Intervention 20 March 1996, held at the Eastern Cape Technikon with the
Butterworth Profile Page 26 of 84
Presidential Project Team, TLC, Municipal officials and Community
Representatives.
Butterworth TLC Strategic Planning Session, 21 and 22 February
1997 held at Trenneries Hotel; attended by the Presidential Project Team, TLC,
Municipal Officials` and Community Representatives.
(ii) The emergence of tensions between the TLC and stakeholders in the
Butterworth area
There is evidence of serious tensions between the Butterworth Transitional Local
Council and a greater part of the Butterworth community. Working relations
between the council and the management of the municipality are strained,
discounting any possibilities of close co-operation and the provision of decisive
legitimate leadership. This transpired clearly during interviews and was pointed out
by nearly all stakeholders interviewed as well as by council members and the
municipal management interviewed. The source, reasons, causes and issues on the
current stand-off between the Butterworth Transitional Local Council and the many
community organisations are beyond the brief of this study.
The many marches, the call for the resignation of the Transitional Local Council,
the forced closure of businesses in the CBD, the use of municipality vehicles in the
deliberate littering of the Butterworth CBD before the visit of the deputy state
president, the article on Butterworth in the Sunday Times (15/11/1998) and the
many others in the Daily Despatch, the continued call for a rent and rates boycott
that the business sector has been asked to join, the resignation of the mayor of
Butterworth during this study, the deliberate exclusion of the Transitional Local
Council in recent developments aimed at re-launching participatory development
planning, are without doubt evidence that all is not well between the community of
Butterworth and the Transitional Local Council.
(iii) The economic and development summit held in July 1998
Butterworth Profile Page 27 of 84
As indicated by the evidence above, development planning in Butterworth had
reached a point of stagnation. This was a cause for concern among stakeholders in
the area. The member of the Presidential Project Team interviewed echoed this
concern “… at one stage we wanted to pull out of Butterworth because of no
movement. We will call a meeting and it will be deliberately boycotted … there is a
great frustration in putting money into projects where you are not sure whether you
will pull through … you will go to hold a meeting in Butterworth, when you get
there there will be two meetings, one organised by the mayor and another organised
by SANCO”.
It is clear that, for whatever reasons, the TLC is no longer providing vision and
leadership in the Butterworth area. The Butterworth Regional Economic and
Development Summit was initiated by regional stakeholders – the organised
business community, the tripartite alliance and the office of the MEC for Economic
Affairs and Finance. The summit was attended and addressed, among others, by the
Premier of the Eastern Cape Province, the Minister of Trade and Industry as well as
a representative from the national Department of Transport. Very conspicuous, was
the exclusion and absence of the mayor and members of the Butterworth
Transitional Local Council in the planning for the summit as well as the
deliberations that ensued among the participants.
The successes of this initiative remain to be seen. The political climate will have to
be conducive as constitutionally the Transitional Local Council is declared as the
body with the responsibility to drive economic and social development. The
summit is nonetheless a significant step towards initiating, yet again, development
planning and harnessing all the initiatives by the various stakeholders. Of
paramount importance is the assembling of stakeholders in the area, the discussions
and charting a way-forward in the presence of and the participation of important
provincial and national decision makers.
Butterworth Profile Page 28 of 84
3. A demographic profile of Butterworth
Introduction
The demographic characteristics (Human Development Index, infant mortality, age
/ sex distribution, etc) of the population of Butterworth reflect, to a large extent, the
population trends and characteristics of similar towns in the Eastern Cape province.
Institutions such as the DBSA, the CSS have undertaken studies in the Eastern
Cape, including in these studies the population of Butterworth.
Evidence of population increase shows that the changes in the number of
inhabitants of the town are related to the history and outcomes of development
planning in the area. There are two aspects to be considered in looking at the
demographic profile of Butterworth. The first is the extent of poverty and social
indicators in rural areas of South Africa especially the former homelands. Second is
the location of Butterworth as a town surrounded by rural areas and its growth and
attractiveness as an industrial centre.
In the following sections an attempt is made to create a demographic profile of
Butterworth from the sparse sources that have tried to shed light on Butterworth‟s
population size and other characteristics.
An overview of population growth in Butterworth
According to estimates the size of the population of Butterworth grew from 281 in
1891, to 2769 in 1970, about 33 370 in 1990 to just over 60 000 in 1997. The
marked growth in the size of the population from 1970 was a direct result of the
growing attractiveness of the town after factories were established in the area.

Butterworth Profile Page 29 of 84
Population Growth of Butterworth 1970 - 1985
Year Population % growth
1970 2769
1980 25994 22.90
1985 27343 5.19
Source: IMDS Census figures, Transkei, cited in Sarpong 1990.
The above table indicates that Butterworth experienced an astronomical increase
in population from the 1970s. The rapid growth of the population resulted in
Butterworth having the highest percentage of urban population per square
kilometre in the whole of Transkei. The percentage of urban to rural population in
the Butterworth District stands at 36.22% while that for the second district,
Umtata, stands at only 28.53% (Transkei Profile, IMDS 1985 in Sarpong, 1990)
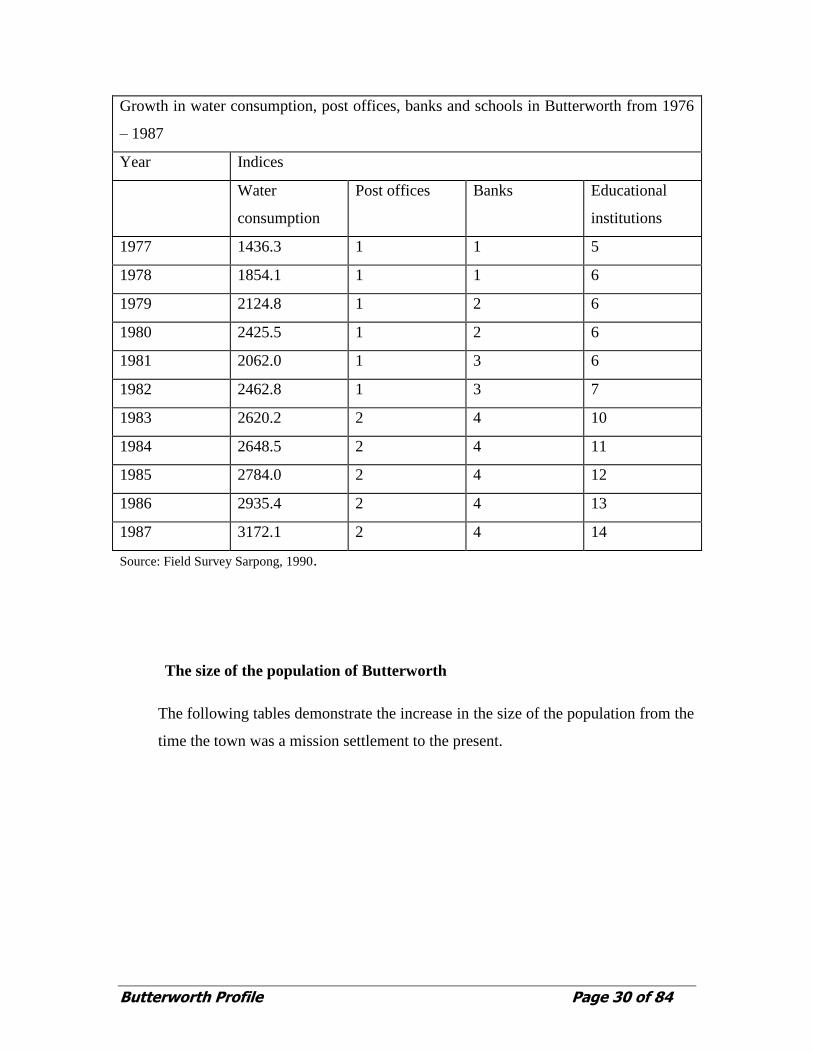
The growth of facilities such as educational institutions and banks in the area, and
the consumption of water (industrial and residential) are pointers of population
growth in the area.
Butterworth Profile Page 30 of 84
Growth in water consumption, post offices, banks and schools in Butterworth from 1976
– 1987
Year Indices
Water
consumption
Post offices Banks Educational
institutions
1977 1436.3 1 1 5
1978 1854.1 1 1 6
1979 2124.8 1 2 6
1980 2425.5 1 2 6
1981 2062.0 1 3 6
1982 2462.8 1 3 7
1983 2620.2 2 4 10
1984 2648.5 2 4 11
1985 2784.0 2 4 12
1986 2935.4 2 4 13
1987 3172.1 2 4 14
Source: Field Survey Sarpong, 1990.
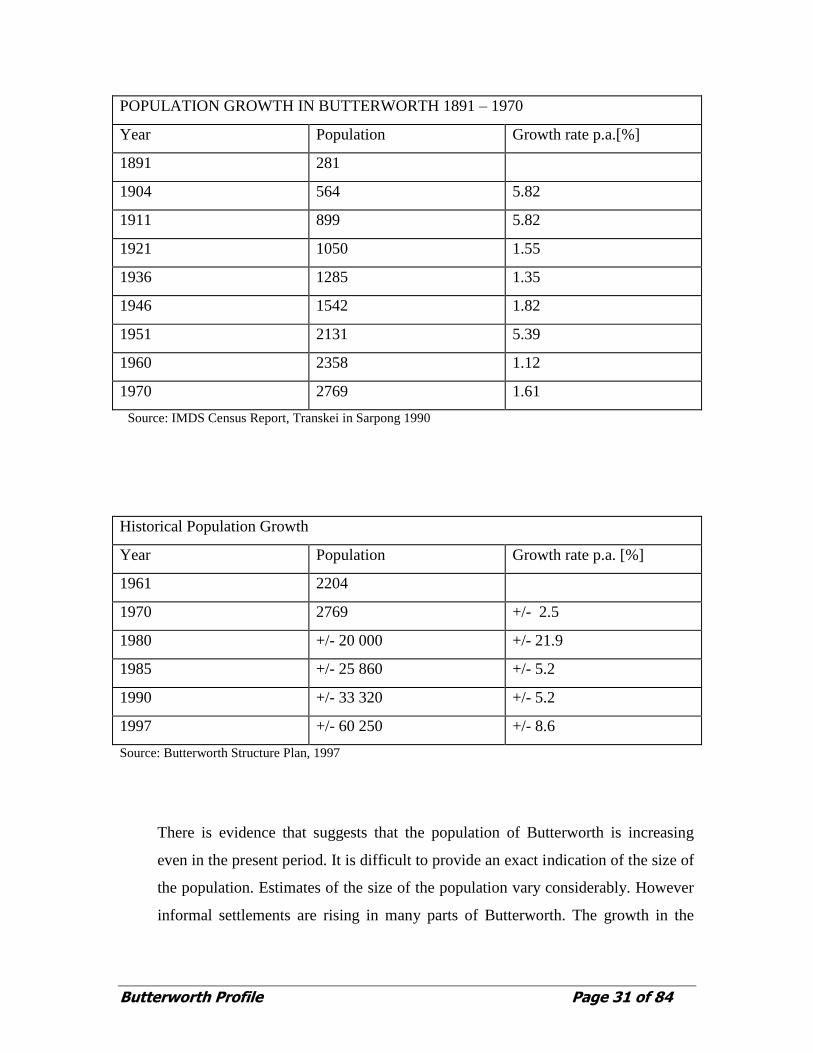
The size of the population of Butterworth
The following tables demonstrate the increase in the size of the population from the
time the town was a mission settlement to the present.
Butterworth Profile Page 31 of 84
POPULATION GROWTH IN BUTTERWORTH 1891 – 1970
Year Population Growth rate p.a.[%]
1891 281
1904 564 5.82
1911 899 5.82
1921 1050 1.55
1936 1285 1.35
1946 1542 1.82
1951 2131 5.39
1960 2358 1.12
1970 2769 1.61
Source: IMDS Census Report, Transkei in Sarpong 1990
Historical Population Growth
Year Population Growth rate p.a. [%]
1961 2204
1970 2769 +/- 2.5
1980 +/- 20 000 +/- 21.9
1985 +/- 25 860 +/- 5.2
1990 +/- 33 320 +/- 5.2
1997 +/- 60 250 +/- 8.6
Source: Butterworth Structure Plan, 1997
There is evidence that suggests that the population of Butterworth is increasing
even in the present period. It is difficult to provide an exact indication of the size of
the population. Estimates of the size of the population vary considerably. However
informal settlements are rising in many parts of Butterworth. The growth in the
Butterworth Profile Page 32 of 84
number of people involved in „informal trade‟ in the CBD is suggestive of a
migration of people from rural areas into the town in search of better opportunities.
Population characteristics
The following demographic indicators describe the population of Butterworth.
(i) Age-sex distribution and dependency
Factors that will affect the age-sex composition of the population of Butterworth
are the migration of men to the big industrial cities of South Africa and the flood of
women into the town from the rural areas. It has been noted that relatively few
people move into Eastern Cape from other provinces. The population of the area is
likely to have more women than men.
Population estimates indicate that “Eastern Cape‟s African population is relatively
young, with children under the age of 15 constituting more than 44% of the total
African population (48% of males and 41% of females) in Eastern Cape. With such
an age structure, the youth dependency ratio, or the proportion of youth to adults
(15 years or more)- a ratio of 0.84 to 1 is very high. This means that, for every
hundred adults over the age of 15, there are 84 children to support (CSS Living in
the Eastern Cape: Selected Findings of the 1995 October Household Survey, p10).
This is characteristic of underdeveloped areas.
Butterworth remains a better area to migrate to than remain in the impoverished
rural areas. Indications are that women from the rural areas move into the town in
search of employment and to engage in the many forms of informal trade available
in the town. The high concentration of people in Butterworth as indicated by the
Butterworth Profile Page 33 of 84
squatter settlements and congestion in the town make it ideal for small
entrepreneurs who want to provide themselves with a means to survive.
The composition of street traders show a large proportion of women. Families in
squatter settlements are usually female headed households displaced by economic
factors.
The Butterworth area is likely to have a large youth population as well. The area
has a number of educational institutions at various levels (primary, secondary and
high schools, training colleges and a technikon)
(ii) Education
In considering the education level of the inhabitants of the Butterworth area, the
areas of origin of the present population have to be taken into account in any
analysis. Factory managers who were interviewed indicated low levels of education
and skills among their workers. These were predominantly people who came from
rural areas and had hardly any previous work experience. It is fair to assume that
there are still people who are in the 19-45 age group who come into the town from
rural areas. These people will have little or no education.
Over the few years the education profile of the town has changed. The African
townships of Butterworth have a number of schools with pupils receiving an
education. These pupils come out with relatively better levels of literacy than the
„immigrants‟ from the rural areas.
The technikon and the branch of the University of Transkei contribute in raising the
level of education in the area. The housing developments in the African townships
that cater for the civil servants such as teachers, nurses, clerks indicate a small
sector of the Butterworth population that has more than an elementary education.
Butterworth Profile Page 34 of 84
To place Butterworth within the Eastern Cape province and South Africa, the
following findings from the 1995 October Household Survey show low levels of
schooling and educational attainment for Africans. “Access to education in Eastern
Cape varies by population group and gender. This is inline with the national picture
… 37% of African males and 34% of African females … have not received any
secondary school qualification (higher than standard 5). Moreover, 84% of Africans
… have not attained standard 10 (CSS Living in the Eastern Cape: Selected
Findings of the 1995 October Household Survey, p14).
(iii) Health indicators
There are no area-specific health indicators that are available for Butterworth.
However observations of the physical conditions and circumstances under which
people live do allow inferences to be made, but with caution. There are a number of
indicators that allow a depiction of Butterworth‟s health levels. The physical
environment, the types of dwellings, energy sources used in the households, access
to clean water, health facilities, sanitation, levels of unemployment are all factors
that must be considered in providing a picture of the health of the population.
The residential areas in the „old town‟, the properties that were developed for the
„key personnel‟, and the townships that were developed in Butterworth all have tap
water and water borne sewerage in the households.
Water provision in the squatter settlements is through the use of communal taps as
the areas developed through the „land invasion‟ strategies. There is no water and
sewerage reticulation. The water in the Siyanda squatter settlement is provided, as
stated by a senior manager in the municipality interviewed, on a humanitarian
basis. The absence of water and sewerage reticulation does not augur well for the
state of the health of those who live in the squatter settlements. The Siyanda

Butterworth Profile Page 35 of 84
squatter settlement is taken to be outside of the municipal boundary of Butterworth,
but de facto the inhabitants are part of the town and the Butterworth area.
The high human density, the impure water that flows through the settlement
especially during heavy rains suggests high levels of disease among children who
are most susceptible. This is further compounded by the abject poverty that
characterises South Africa‟s squatter settlements.
In Butterworth, the informal settlement situation is exacerbated by the shortage of
housing in the area as more, mostly poor people, immigrate into the area. Shacks
are springing up nearly everywhere in Butterworth. This contributes to low levels
of health for the area which any development initiative will have to take into
account.
There is only one hospital in Butterworth that caters for the increasing numbers
attracted to the town. This hospital caters as well for people from the surrounding
areas including the comparatively „better‟ areas such as Idutwya. The hospital is
under refurbishment. Like other hospitals in the former Transkei and Ciskei, it does
not meet the health and treatment needs of the inhabitants of the Butterworth area.
This view was strongly expressed by the town clerk and other community leaders
interviewed. The lack of proper health facilities is seen as a contributing
disincentive in attempts to attract high caliber and skilled people to settle in the
area.

Butterworth Profile Page 36 of 84
4. Analysing the local economy
Introduction
For the purpose of analysing the local economy, Butterworth‟s economy can be
divided into various sectors comprising of (i) the shrinking industrial sector, (ii) a
steady commercial sector and (iii) an apparently growing retail sector. There are
clear indications that the town has a large and rising small enterprise base as
indicated by the proliferation of selling stalls, tables, containers and caravans that
constitutes the town‟s informal economy. An analysis of past and present trends of
the local economy show that aspects such as the position and location of the town,
has over the years provided different economic limitations and opportunities. The
town, its inhabitants and surrounding communities did benefit, albeit mildly, from
the modest industrial establishments that once flourished in the area.
Over the years, other aspects of the Butterworth economy have grown. As noted in
the Butterworth Structure Plan (Second Draft – November 1997) the town has
“developed into a major service centre for the region, where there are over 240
registered businesses (apart from the industry) as well as a large informal sector.
These businesses include estate agencies, hotels, supermarkets, general dealers,
shoe and clothing stores, garages and filling stations, butcheries, bakeries, furniture
shops, cafes, restaurants, dry cleaners, hairdressers, workshops, taxis, livestock
speculators, funeral parlours, florists, construction companies, banks, financial
institutions and attorneys offices”.
To further analyse the local economy and its salient features, a comprehensive
discussion of each sector is undertaken below.
Natural resources
Butterworth Profile Page 37 of 84
(i) Mining and minerals
Butterworth and its surrounding areas do not have any major or substantial
economically exploitable mineral deposits. In 1985 mining accounted for only
0.4% of employment in Butterworth (Table 4 – Butterworth Structure Plan) The
limited mining in Butterworth is from the local quarry which in 1991 had a GGP of
only R20 000 (DBSA July 1996 cited in Hosking and Haines, November 1997)
(ii) Water
In the Butterworth Structure Plan it is noted that „a predominant feature of the town
is the Gcuwa river and the iCegcuwana river which forms a tributary‟. The area has
an ample, dependable water supply having been able to adequately supply the
water-dependent industrial sector that developed in the area.
(iii) Agriculture
The agricultural potential of the area has been cited by some researchers. Hofmeyr
and Maasdorp (1993) suggested that the area „was more suited to agriculture‟.
Agriculture accounted for only 2.4% of Butterworth‟s GGP in 1991. The real value
of output declined by 34.5% between 1980 and 1991 (Hosking and Haines,
November 1997). The full agricultural potential of the area remains largely
unexplored. The Ncora irrigation scheme that was established in the early 1980s to
boost local agricultural production did not succeed as, in the opinion of one of the
people interviewed „there was no real involvement of the local people, there was
little training provided and hardly any support given, very few people benefited
from the scheme‟.
The industrial sector
Butterworth Profile Page 38 of 84
Between 1970 and now, Butterworth experienced different waves of both growth
and decline in the local economy. Before 1970 there were no industrial
establishments in Butterworth. The waves of growth and decline were brought
about by the opening and the short-lived settlement of industries in BTW. The
industrial decentralisation strategy was the main factor behind growth in the
industrial sector. The lucrative incentives, some of which were open to abuse by the
industrialists, were the key attractions that saw industries establishing themselves in
Butterworth. It must be noted that these incentives were provided only in certain
targeted areas in the former Republic of South Africa and homelands. Under the
revised 1982 industrial decentralisation strategy, Region D under which
Butterworth was, had the most attractive of the incentive package.
In the following section, Butterworth‟s industrial sector, or what remains of it, as
one interviewee commented, will be discussed looking at both its past and present.
The discussion will start at the time when Butterworth attracted its first industries,
when one could talk, however minimal it was, of the contribution to the local GGP
by an „industrial sector‟.
(i) The creation of the industrial sector
In 1973 a „black township‟ was built in Butterworth. This development was
indicative of the plans that were being implemented. The township was to house
workers that were to be employed by the „newly-created‟ industrial sector in
Butterworth. Transkei was granted independence in 1976 and there was a conceited
effort to create an industrial sector for the Transkei homeland.
The effects of the regional development policy were such that at independence in
1976 Transkei as a whole had 35 manufacturing plants (Sarpong, 1990). The
Butterworth Profile Page 39 of 84
following extract from Sarpong (1990) traces the early developments of the
industrial sector in Butterworth.
After the selection of Butterworth as an industrial development point in 1971, the
government of both Transkei (after independence) and the Republic of South
Africa co-ordinated efforts to provide infrastructural facilities. This began in 1972
and entailed the extension of water and electricity facilities, provision of industrial
sites and the building of townships. The following table indicates expenditure that
was directed at supporting the new industrial sector.
Xhosa Development Expenditure (later TDC) – 1973
Development of industrial township R621 461
Water schemes R213 023
Electricity supply R 97 956
Housing for key white personnel R3 133 653
Erection of factories for leasing to entrepreneurs R2 239 746
Source: Horrell, 1973 cited in Sarpong, 1990,p140
From the table it can be deduced that 49.7% of the total expenditure was used to
provide housing for „key white personnel‟. This led to the attraction of the first four
industries to Butterworth in the same year. The continued expansion of
infrastructural facilities, especially after independence and the reviewed industrial
decentralisation strategy, attracted more industries.
The establishment of the first industries also necessitated the establishment of a
Transkei Development Corporation (TDC) office in Butterworth to provide support
to the industries. The process of creation of infrastructure, the establishment of
more industries and the creation of a TDC expanded work opportunities in
Butterworth and in turn attracted many people. In the course of time the need for
increased housing for the industrial employees required the building of new
Butterworth Profile Page 40 of 84
industrial townships (thereby providing more work), and the increased local
population invited the establishment of service industries.
The first two industrial townships (Ibika and Umsobomvu) built in 1973 contained
three thousand houses in all. These townships were built close to the two industrial
sites for the accommodation of industrial workers. A Transkei Industrial Survey
conducted in 1990 showed that only 7.5% of industries operating in Transkei were
established before independence. This indicated an existing, but limited industrial
sector in Transkei, including Butterworth.
(ii) The growth of the industrial sector
It was the revised industrial decentralisation strategy that saw more industries
coming to Butterworth. The Butterworth area attracted more industrial
establishments than Umtata which enjoyed the same lucrative incentives for
industrialists. The reason for this is that Butterworth, compared to Umtata is nearer
the port at East London and this was an important consideration for the
industrialists. The number of industries in Transkei had increased from the early
1970‟s to a total of 115 in 1989 (Transkei Industrial Surveys 1990 and 1993). At its
peak in 1989, 51 large-scale manufacturing firms were located in Butterworth –
almost half the number in Transkei as a whole (Hosking and Haines, November
1997).

Butterworth Profile Page 41 of 84
No. of firms established in Transkei 1983 – 1989
Year No of new firms Total (Transkei)
1983 - 64
1984 16 79
1985 6 82
1986 4 84
1987 9 90
1988 17 102
1989 16 115
Source: Transkei Industrial Survey 1990/93
Within Butterworth‟s industrial sector, manufacturing had the highest employment
and consequently contributed the most in the local economy. Butterworth‟s GGP
(Gross Geographic Product) in 1980 and in 1990 demonstrates the dominance of
the manufacturing sector over others.
Butterworth - GGP at Factor Cost at Constant 1990 Prices
By Kind of Economic Activity (R‟000s)
Economic
activity
1980 GGP (R‟000s) 1991 GGP (R‟000s)
Agriculture and forestry 6 805 4 454
Quarrying 6 20
Manufacturing 95 765 81 222
Electricty, water 19 587 2 961
Construction 7 375 9 378
Trade, catering 42 901 14 336
Transp, communication 6 013 7 052
Finance, real estate 12 854 11 992
Services 36 156 57 187
Total 227 463 188 601
Source: DBSA, July 1996 cited in Hosking and Haines, November 1997
Butterworth Profile Page 42 of 84
The growth of the industrial sector had the positive spin-offs in the growth of other
economic activities such as the service sector, housing, revenue for the municipality
and general growth of the local economy.
The industrial sector in Butterworth, at its peak, had firms which produced varied
products. A presentation of the type of industries that were in Butterworth will
throw light on the kind of industrial establishments that once occupied the now
largely empty factories.

Butterworth Profile Page 43 of 84
Industries by type in Butterworth, 1990 and 1993
Type 1990 1993
Food 2 2
Drink 2 1
Textiles 7 4
Clothing 6 5
Leather 3 1
Footwear 1 0
Wood 0 0
Furniture 0 0
Printing 2 0
Chemical 5 3
Rubber 1 0
Plastic 2 3
Glass/pottery 2 3
Cement/iron/steel 3 2
Metal 7 6
Electronic 3 1
Transport 2 3
Other 3 1
Total 51 35
Source: Transkei Industrial Survey, 1990/93
(iii) The decline of the industrial sector
As the established industries in Transkei (and Butterworth) reached the peak in
1989, the political landscape in both the former Transkei homeland and South
Africa was rapidly changing. The February 2 speech in 1990 by the former South
African state president FW De Klerk heralded the unbanning of political
organisations and the release of eminent political prisoners such as Nelson
Butterworth Profile Page 44 of 84
Mandela. This was a clear sign of irreversible gains that had been made by the
democratic forces fighting apartheid. In the former Transkei, many factors operated
in tandem to reverse the upward trend in the establishment of industries in
Butterworth.
When the industrial decentralisation strategy was implemented in Butterworth,
especially the revised incentive-driven policy, Transkei was under a repressive,
„puppet‟ homeland leadership that „towed Pretoria‟s line‟. Wages were very low in
the industries operating in Transkei to such extent that it would be proper to speak
of super-exploitation. Trade unions were not allowed to operate in any industry in
Transkei. The overthrow of the homeland state and the installation of military rule
by Bantu Holomisa, a man clearly supportive of the anti-apartheid forces, marked
the beginning of the undoing of what some have seen as the industrial prosperity of
Butterworth.
The withdrawal of incentives made the situation untenable for many of the
industries whose profit margin greatly rested on the incentives. One of the
managers interviewed stated that the concessions were very much built into the
company‟s financial planning.
The labour unrest in 1989, with industries in Butterworth severely affected, was
serious enough to warrant the appointment of the Wiehahn Commisssion in
December 1989 to look into labour matters in Transkei.

Butterworth Profile Page 45 of 84
The establishment and closure of industries
Year New firms
established
Firms closed Net gain / loss Balance
existing
1983 - - - 64
1984 16 1 +15 79
1985 6 3 +3 82
1986 4 2 +2 84
1987 9 3 +6 90
1988 17 5 +12 102
1989 16 3 +13 115
1990 15 23 -8 107
1991 9 19 -10 97
1992 5 20 -15 82
1993 2 7 -5 77
Source: Transkei Industrial Survey 1990/93
The above table clearly indicates the downward trend that started in 1990. The
closure of 8 industries in 1990, 10 in 1991, 15 in 1992 was a beginning of the trend
which continues even today. The number of industries that were closed is rather
high and severe for an area with such a small industrial sector.
Location of industries in Transkei 1990 and 1993
Location 1990 1993
No. % No. %
Butterworth 51 48 35 46
Umtata 30 28 21 27
Ezibeleni 18 17 14 18
Others (Sawmills) 8 7 7 7
107 100 77 100

Butterworth Profile Page 46 of 84
In the current period the situation has worsened. More and more factories are lying
vacant as it appears impossible to arrest the decline of the industrial sector in
Butterworth.
Manufacturing firms in Butterworth – October 1997
Firm Type of product No. of employees
Albany Baker Bread 110
Autocat Catalytic Converters 90
Acrytex Blankets 800
Braun Engineering Exhaust Systems 140
Butterworth Metal Water Tanks, Guttering 112
Crisburd Galvanised water tanks 50
Gcuwa Concrete Cement building blocks 70
Golden Products Cutlery 140
Suntex Textiles 220
TBI Sorghum Beer 160
Transkei Wire Wire, nails, etc 200
Universal Metals Metal stoves 75
Total 2167
Source: Hosking and Haines, November 1997.
This is a far cry from the total occupancy of factory space experienced in the late
1980s.
Hosking and Haines in their November 1997 study of Butterworth state that since
1990, 20 companies affiliated to the Border-Kei Chamber of Business have closed
– just over three per year, representing 5 106 employees and a total investment of
R162,02m. Relocations and closures continued in 1997. In the last six months of
that year, three large industries closed down. In April 1997 South Africa Breweries
closed down its plant resulting in the loss of 340 jobs. In May 1997, Premier
Butterworth Profile Page 47 of 84
Milling closed its plant and in June 1997, Tramatex closed down resulting in the
loss of 888 jobs.
Acrytex which is cited in the above table closed down operations in November
1998 resulting in the loss of jobs. Transkei Wire Industries also stopped production
in its factory at the Zithulele Industrial Towship. The workers were given
retrenchment packages as the factory is now operating as a warehouse with
products coming from the parent company in the Reef.
The commercial sector
Butterworth has established banks in the CBD. Standard Bank and First National
Bank have fairly large and well established operations. There are as well a number
of insurance houses that cater for the large civil service comprising of teachers, and
other civil servants employed in the many government departments.
The retail sector
The retail sector is made up of wholesalers, supermarkets, clothing and furniture
shops, hawkers (discussed under SMMEs below) and filling stations. This is the
sector that is showing positive growth and appears to be very stable. Butterworth
has many wholesalers and supermarkets retailing goods for household
consumption. Weir‟s and Metro are two large wholesalers located at the Zithulele
industrial area. There is a large paraffin depot located in the industrial area which
supplies small traders from the rural areas around Butterworth. Paraffin remains a
commonly used household fuel in rural areas and in the squatter settlements.
In the CBD there are many supermarkets and eateries catering for the multitudes
that frequent the town daily. Clothing and furniture stores occupy many of the
shops in the town of Butterworth. There are no less than 6 different furniture shops

Butterworth Profile Page 48 of 84
in the town. Along the main road in the town there are five filling stations all
within a kilometre.
Small, Medium and Micro Enterprises
The Masibambane Small Business Association represents the interests of the small
business operators in the Butterworth area. The caravans, containers, shacks and
selling tables are operated by the members of the association. The Butterworth
CBD is highly congested with hawkers in nearly every yard of the town‟s
pavements. Shoes, bags, sunglasses, clothing, perfume, combs. Sweets, cigarettes,
fruit and vegetables, traditional medicines are among the many wares that are
displayed and sold.
In the words of the chairperson … the association has about 3 000 members … we
understand that people have no money ... this includes the Butterworth town, the
townships and the rural areas . There are full time hawkers, people employed in
other jobs and members who are inactive but awaiting opportunities on projects.
There are other small business operators who are renting space in the factories and
engaged in economic activities such as sewing. One of the women selling clothing
who was interviewed stated that she was selling for a local woman who had a small
sewing establishment in one of the factories.
Government and related services
Butterworth has a number of establishments that can categorised as government and
related services. The town and its townships has a hospital, the magistrate courts,
the municipality with its divisions, police station, public works and the many
education institutions. Employment patterns and features of the labour market show
Butterworth Profile Page 49 of 84
that the government is the main employer in the area. Before it was the town‟s
manufacturing establishments that provided the highest employment.
Infrastructure
Compared to other rural towns in the region, Butterworth has a sound
infrastructure. This is as a result of the industrial decentralisatiopn policy which
saw millions of rands invested in infrastructure development. The main
shortcoming with regards to the infrastructure is that it has not been properly
maintained primarily because of a lack of funds by the municipality and other
institutions in the area. The problem area that was cited constantly by the
interviewees with regard to the infrastructure was the old water pipelines that often
collapse, burst and leak. Under „Engineering Issues‟ in the Butterworth Structure
Plan it is noted that „the pipework reticulation in the CBD area is very old and has
to be continually repaired‟. This affects water reticulation and leads to the water
cuts that many of the town‟s inhabitants and the remaining industrialists complain
about.
A drive around the industrial areas, the CBD and the townships shows well
developed tarred roads inter-linking the CBD, industrial and residential areas. Some
of the roads in the townships do have potholes and need repairing. However all
formal areas of Butterworth are adequately served – with access to all individual
erven. Despite the poor condition of some of the roads there remains reasonable
access to all properties under all weather conditions.
All erven in Butterworth, except Zizamele Township and the informal settlements
are served by waterborne reticulation system. Zizamele Township has pit latrines,
but application has been made to the MIP for funds to provide basic infrastructure
for a waterborne system (Butterworth Structure Plan).
Butterworth Profile Page 50 of 84
Employment patterns and features in the labour market
(i) Employment by sector and occupation
South Africa as a whole is experiencing high levels of unemployment.
Unemployment in the Eastern Cape province was estimated at 41% in 1995
(Strategic Economic Plan Green Paper 1996) There are strong indications that
unemployment is high in Butterworth. The mushrooming informal sector that is
showing signs of rapid growth, as indicated by the membership of the
Masibambane association, is obviously an instance of self-employment in the
absence of jobs in the area. The decline in the industrial sector that provided limited
employment opportunities further exacerbated the situation. The rising squatter
settlements and informal houses that are being erected on the sides of the main
roads is evidence indicating that more and more people are abandoning rural life
and descending on Butterworth to look for work.
In 1985 employment by sector in Butterworth was as follows:
Butterworth: Employment by sector (1985)

Butterworth Profile Page 51 of 84
Sector Number Percent
Manufacturing 6 849 56.0
Government 1 224 10.0
Semi-government 612 5.0
Household 560 4.5
Mining 47 0.4
Agriculture 51 0.4
Retail / wholesale 834 6.8
Educational 421 3.4
Hotel / catering 31 0.2
Transport 199 1.7
Service 879 7.2
Financial services 45 0.4
Professional 13 0.1
Total 12 234 100
Source: IMDS Census Survey, 1985 in Sarpong 1990, p147
The following extract from the Butterworth Structure Plan (Second Draft) explains
the town‟s employment in the various sectors.
In 1985 the largest employer was the manufacturing sector in Butterworth which
accounted for 56% of all employed people in the area. Manufacturing was followed
by the government which accounted for 15% of total employment in Butterworth.
With the continued closure of industries the situation has changed significantly. By
1993 total employment in the manufacturing sector had gone down to 5 000
(Hofmeyr and Maasdorp, 1993) The DBSA estimated that in 1989 the
economically active population was 17 000 (DBSA, 1990)
The employment distribution depicted in the above table differs considerably from
the average sectoral distribution in the province (Table below). Generally there is a
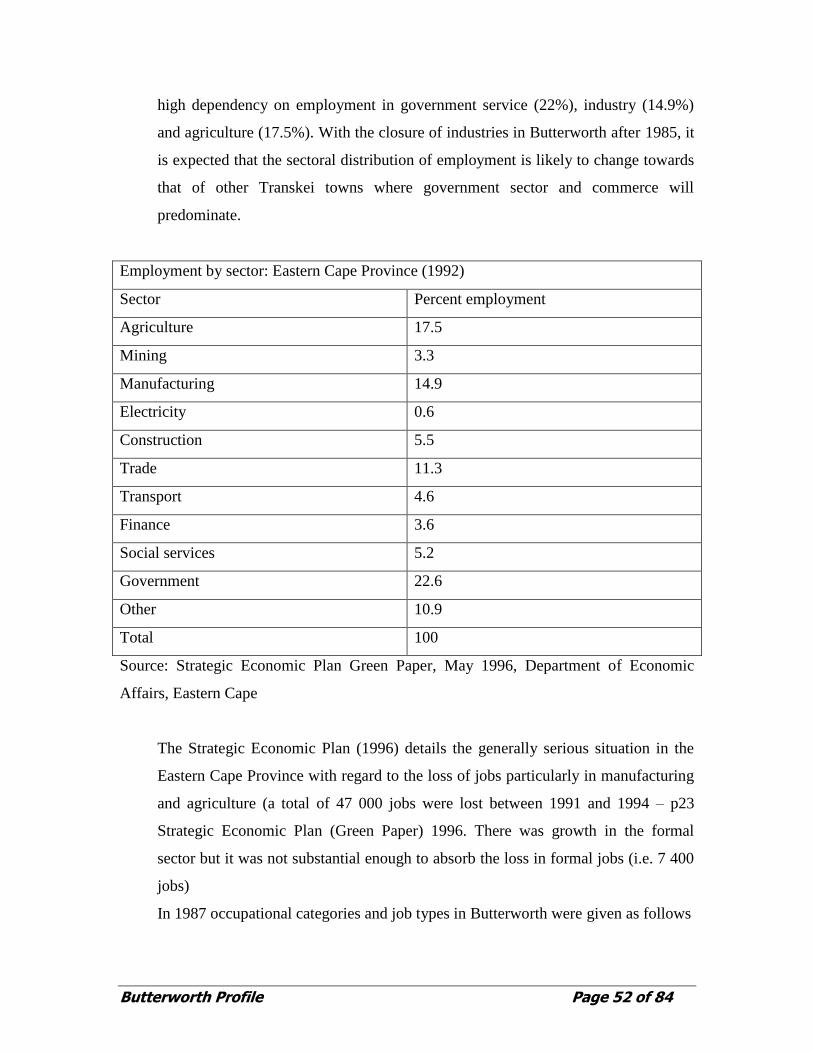
Butterworth Profile Page 52 of 84
high dependency on employment in government service (22%), industry (14.9%)
and agriculture (17.5%). With the closure of industries in Butterworth after 1985, it
is expected that the sectoral distribution of employment is likely to change towards
that of other Transkei towns where government sector and commerce will
predominate.
Employment by sector: Eastern Cape Province (1992)
Sector Percent employment
Agriculture 17.5
Mining 3.3
Manufacturing 14.9
Electricity 0.6
Construction 5.5
Trade 11.3
Transport 4.6
Finance 3.6
Social services 5.2
Government 22.6
Other 10.9
Total 100
Source: Strategic Economic Plan Green Paper, May 1996, Department of Economic
Affairs, Eastern Cape
The Strategic Economic Plan (1996) details the generally serious situation in the
Eastern Cape Province with regard to the loss of jobs particularly in manufacturing
and agriculture (a total of 47 000 jobs were lost between 1991 and 1994 – p23
Strategic Economic Plan (Green Paper) 1996. There was growth in the formal
sector but it was not substantial enough to absorb the loss in formal jobs (i.e. 7 400
jobs)
In 1987 occupational categories and job types in Butterworth were given as follows
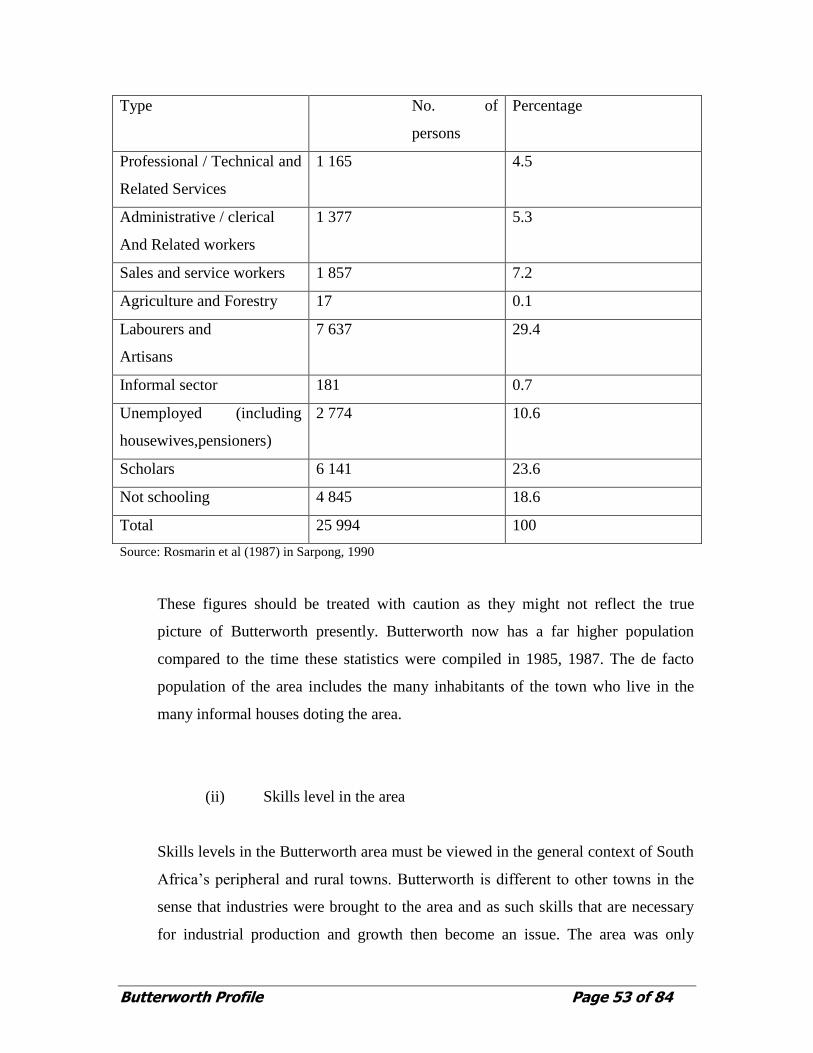
Butterworth Profile Page 53 of 84
Type No. of
persons
Percentage
Professional / Technical and
Related Services
1 165 4.5
Administrative / clerical
And Related workers
1 377 5.3
Sales and service workers 1 857 7.2
Agriculture and Forestry 17 0.1
Labourers and
Artisans
7 637 29.4
Informal sector 181 0.7
Unemployed (including
housewives,pensioners)
2 774 10.6
Scholars 6 141 23.6
Not schooling 4 845 18.6
Total 25 994 100
Source: Rosmarin et al (1987) in Sarpong, 1990
These figures should be treated with caution as they might not reflect the true
picture of Butterworth presently. Butterworth now has a far higher population
compared to the time these statistics were compiled in 1985, 1987. The de facto
population of the area includes the many inhabitants of the town who live in the
many informal houses doting the area.
(ii) Skills level in the area
Skills levels in the Butterworth area must be viewed in the general context of South
Africa‟s peripheral and rural towns. Butterworth is different to other towns in the
sense that industries were brought to the area and as such skills that are necessary
for industrial production and growth then become an issue. The area was only
Butterworth Profile Page 54 of 84
developed when the policy makers decided to start an industrial sector in
Butterwoth. One of the expenditures in the Butterworth area prior to the growth of
industries was the building of proper housing for „skilled, key white personnel‟.
At the height of its industry Butterworth had no more than 60 factories, mostly in
the clothing, textile, food and beverage sectors. The fact is that prior to the
industrial phase, inhabitants of the area did not have the relevant industrial skills.
Most of the industries in Butterworth stayed for less than ten years. The training
and real transfer of industrial skills during such a short period will remain marginal.
Further, the levels of employment, as will be argued later, provided by
Butterworth‟s industries was rather low.
The 1996 DBSA Eastern Cape: A Human Development Profile states that the
quality of schooling in the Eastern Cape is also extremely low. The managers
interviewed commented on the, understandably, low levels of skills in the area.
„Numeracy and literacy and job skills are very low … labour is very green, it is
mostly people from rural areas … the average standard of education is 5 to 7 … it is
very basic … there is a lot of effort and money in training labour … unlike in East
London and places such as Durban where you just put and ad in the paper and you
get the people you want‟ commented one manager, … we took people about ten
years ago … they could only operate two machines, but now a weaver can operate
about sixteen machines. We trained our own workers … welders, fitters and turners
and other workers to operate machines.
The Butterworth area has a tremendous potential for the development of relevant
skills for local economic growth. There are many able and willing institutions that
can provide skills training to the people of the area. In the Butterwoth Structure
Plan it is observed that „Butterworth has a strong advantage over other towns in its
vicinity in terms of its institutional capacity for training and the improvement of the
skills levels of the town. The town has within easy reach a campus of East Cape
Butterworth Profile Page 55 of 84
Technikon, and a branch campus of the University of Transkei and Teko
Vocational School‟. There are other training resources and facilities that
Butterworth can utilise. The newly established Gcuwa Training Centre appears to
be doing sterling work in skills training for the small business sector. The Fort Hare
Institute of Government in Bisho is another institution whose expertise can be of
great assistance to the town.
5. Development Stakeholders

Butterworth Profile Page 56 of 84
Introduction
In constructing this profile of development stakeholders in Butterworth, attention
has been paid to the institutions, organisations and government departments that
were seen and cited by the people interviewed as important. It should be raised that
there is an ongoing conflict between major sections of the Butterworth community
and the TLC. Constitutionally the TLC remains the primary structure tasked with
the responsibility for social and local economic development. Within this
understanding the TLC remains an important actor in development issues.
Rather just „identifying development stakeholders‟, some of the views and opinions
included in this section are intended to highlight how some of the people
interviewed see those who are not or no longer important for the development of
Butterworth. The following were identified as development stakeholders in
Butterworth.
The ANC, COSATU, SACP Alliance
There is an important role played by the alliance on development issues in the area.
The members of the alliance interviewed (Mr Mthongana, Mr Janda and Mr
Mlungwana) are all members of the Economic Transformation Desk - ANC
Regional Office. They all pointed to the concerns that the Butterworth community
has about the state of affairs in the area. The important role the alliance is playing is
demonstrable through the initiation of the Butterworth Regional Economic and
Development Forum and the holding of the summit in July 1998. The presence of
the Premier of the Eastern Cape province and the Minister of Trade and Industry at
the summit identifies the alliance as an important stakeholder in development.
There is important work (judging from the information provided by the alliance and
looking at the documentation from the summit) being done in trying to co-ordinate
the re-launch of development in Butterworth. Delegates at the July 1998 summit
engaged themselves in developing a vision for the region, with Butterworth playing
a role. A task team comprising members of the alliance is co-ordinating and
convening clusters with responsibilities in the following areas :-
Butterworth Profile Page 57 of 84
Human resource development To develop a HRD plan including the department of education and training institutions
Infrastructure To develop a strategy for the region
Institution building To develop the appropriate public sector and local government structures driving
development
Economic development
Strategic investment needed
To improve conditions for business to operate and to protect existing businesses
Investigating potential growth points
Accessing government programmes
Community participation
SANCO
SANCO works closely with the alliance and other stakeholders. There are many
undertakings that are carried out together. SANCO is seen as the main force leading
the fight for the removal of the current TLC. In the words of the local general
secretary of SANCO „the TLC is not part of the stakeholders … all members of the
TLC including the town clerk must vacate … this is a call by all Butterworth
structures led by SANCO‟.
SANCO does enjoy support and is greatly influential. During the time this study
was undertaken, a number of marches were held in Butterworth and protesters
streamed in from the townships and the squatter settlements.
SANCO does hold „consultative meetings with the business community especially
those in the CBD. When there is going to be a march, businesses are notified and
asked to shut down. One cannot claim that business agrees but „any march in any
country and anywhere in South Africa is by its very nature disruptive to business ...
business must understand that if there is no political stability they must contribute‟
(SANCO local general secretary). SANCO‟s influence in the Butterworth area was
captured in the words of the representative of the Presidential Project Team
Butterworth Profile Page 58 of 84
interviewed, „you go there (Butterworth) to hold a meeting … you will find that
there is one organised by the mayor and another organised by SANCO‟. The
chairperson of Masibambane Small Business Association stated that the
organisation receives assistance from SANCO and its members always heed
SANCO‟s calls and join the marches.
On participation in development forums the SANCO representative stated that
„there was a vision of launching a Butterworth development forum … to focus on
business and development. We invited to that launch the Presidential Project Team
and this attempt was sabotaged by the then councilors … because all monies of the
govt aimed at development or any sponsors … that money should be put in the
Butterworth Municipality coffers. Because of the Butterworth Municipality
bungling, they take all the money and bank it in one account. We then suspended
the idea of the Butterworth development forum … we took the decision together
with the PPT. In Butterworth there were a number of development forums which
were not co-ordinated to one forum … we wanted to put together these different
forums ... that is the plan that was thwarted by the TLC because they were
deliberately not included … before no one could say they speak for Butterworth as
a whole … only the forum that was launched can … began Butterworth regional
development forum including Tsomo, Nqamakwe, Idutswya, Kentani, Willowvale
which include the Traditional Authorities. We must respect the Traditional
Authorities in the understanding of inclusivity … they must be there … but they
must understand that they are apolitical leaders‟.
The Presidential Projects Team
The Presidential Projects Team came into the area of Butterworth to facilitate
development and contribute in integrated development planning. The Presidential
Projects Team has worked with the TLC and assisted the TLC to commission the
Structure Plan. The team has held consultative workshops pulling together
stakeholders. The Presidential Projects Team was mentioned by all stakeholders as
an important player in development planning in the area. Currently the Presidential

Butterworth Profile Page 59 of 84
Projects Team is involved in the Structure Plan exercise dealing with problems of
congestion, dilapidation, robots that do not work. There is also the Main Street
Project – commissioning a traffic study on Main Street with a look on the informal
traders. The focus is to deal with the main street. From this project the following
critical areas are receiving attention:-
i. infrastructure issues – traffic regulation, repairing robots, improving Main Street,
funding for Street Lighting
ii. Taxis are using the area in an uncoordinated way. Sites belonging to the
government that are in the process of being transferred to the TLC on behalf of
Dept of Transport.
iii. Hawkers facilities will be erected at strategic points to move them off the main
street.
From the responses of the stakeholders interviewed, the Presidential Projects Team
enjoys good standing and reputation.
The Gcuwa Training Centre
The Gcuwa Training Centre is a partnership project between government and
business. It was funded by the Presidential Project Team and South African
Breweries. The Department of Labour supports the project by financing the training
and the Eastern Cape Development Agency provides loans for successful students
(those who have been trained). The project was initiated and is managed by Rutec
(Information Leaflet on the centre).
Highly commendable work is taking place in the centre. On the day the manager of
the centre was interviewed, the place was a hub of activity. A tour of the premises
showed small business people engaged in various activities. The centre does have
an important role to play in the development of micro enteprises and a contribution
to local economic development. Its management structure allows the contribution
of local stakeholders in addressing local needs.
Butterworth Profile Page 60 of 84
Educational Institutions
The Eastern Cape technicon was described as a „very keen institution‟ by the
Presidential Projects Team representative interviewed. The two directors of Siyaya
Civils & Building Contractors interviewed, indicated that they are in discussion
with the technicon to get students to do field work with the company. The
educational institutions in the area can potentially contribute a great deal in skills
development for local entrepreneurs. Specific training can be tailor made for the
needs of the local population. Both the universities of Transkei and Fort Hare can
contribute in the training of municipal management and the TLC. There is a need
for a strong business skills development if local economic development is to
succeed. Dealing with municipal finances, training the local police in community
policing and management, working with different sectors of the population in
development work are interventions that educational institutions in the area can
make.
Traditional authorities
There is no doubt that traditional authorities are important stakeholders in the
Butterworth area. The alliance, SANCO and the Presidential Projects Team
acknowledged and accepted the important role of traditional authorities. The
members of the alliance did state that they invited traditional authorities or made an
attempt to invite them to the summit held in July 1998. The chief of aMazizi
emphasised that “… tribal authorities must be absolutely involved in the
development of the Butterworth area … unless we are going to have different
economic structures ... whatever development takes place must benefit us as well
… there are those who say referring to us that these people are not part of
Butterworth. That is wrong thinking, the notion that a town can exist as an island is
ludicrous. What is happening for the town happens for everyone else … most of
these people do not believe they are residents of Butterworth, they still own plots in
rural areas … they have come here to get money to send home”.
Butterworth Profile Page 61 of 84
The inclusion of traditional authorities and the establishment of working relations
with them will be important for development planning in the Butterworth area.
Business groups
The Butterworth Chamber of Commerce and the Border / Kei Chambers of
Commerce are important stakeholders in the area. The representative of the
Butterworth Chamber of Commerce indicated the close co-operation that exists
with the alliance. Business, mainly in the CBD does get caught in the ensuing
conflict. There are plans to develop the CBD in Butterworth. These will affect
business in one way or the other. For Butterworth to emerge as an organised and
developed town with pleasant surroundings, the role of the business sector is
important. The proliferation of informal trading in the CBD calls for dialogue
between the emerging small traders and established business. The Border / Kei
Chamber of Commerce has a wealth of information on the problems faced by
business and industry. This body can be of help in identifying ways of attracting
outside investment.
Masibambane Small Business Association
This association with its membership of about 3000 has a role to play in LED.
Challenges and problems faced by the emerging micro enterprises are known to the
leadership. The chairman of the association indicated that there are a number of
projects that are at the planning stages in which the Presidential Projects team is
involved. The association works closely with SANCO, ECDA and was present at
the summit in July 1998.
The TLC and Municipality
As indicated elsewhere in this study, the TLC is constitutionally the engine that
should be driving LED. The municipality is to provide the essential services and
maintain the infrastructure. The conflict will have to be resolved and both the TLC
and the municipality bought on board in development planning. The

Butterworth Profile Page 62 of 84
marginalisation of the TLC, understandably so, will, in the long run undermine
progress if the issues are not resolved.
The ECDA
The ECDA has offices in Butterworth. The mission of the ECDA is „to promote
sustainable economic development throughout the Eastern Cape province by
assisting viable business ventures and communities in a businesslike and cost-
effective manner‟. The agency focuses on the following areas:- SMMEs, industry,
foreign investment, community programmes, tourism, advisory services, primary
production and business infrastructure.
NGOs
Butterworth seems not to have any significant NGO sector. ECATU, based in
Umtata, was mentioned to have attended the economic and development summit.

Butterworth Profile Page 63 of 84
6. What the government is doing
When the stakeholders were interviewed, what came out were the views on what
the government, at provincial and national level, is seen to be doing and not doing
in Butterworth. This profile of what the government is doing is from what
stakeholders expressed as well as information obtained from other sources. This is
intended to demonstrate the nature and level of government intervention in the area.
This is discussed under the following:- the Presidential Projects Team, the
participation of the provincial and national government departments in the
economic and development summit, the Department of Transport, the Department
of Labour, and the expressed need for political intervention in the conflict.
The Presidential Projects Team
The work of the Presidential Projects team is discussed in Part 5 under
stakeholders. The Presidential Projects Team represents, in the opinion of
stakeholders interviewed, an important intervention by the government in the
development of the area. The Presidential Projects Team brings to Butterworth
expertise that is crucial in forward planning. The consultative workshops, the
commissioning of the Butterworth Structure Plan and the attempt to work with the
TLC to strengthen the town‟s finances and planning are welcome interventions.
The participation of the provincial and national government departments in
the July 1998 summit
The presence of the Premier of the Eastern Cape Province, the Minister of Trade
and Industry, the MEC for Economic Affairs, Environment and Tourism, and the
representative from the national Department of Transport gave the Butterworth
stakeholders and community confidence that provincial and national government
are working at solutions for the area. The visit of the deputy state president and the
presence of these important decision makers draws attention to the problems and
challenges the people of Butterworth are facing.

Butterworth Profile Page 64 of 84
The Department of Transport
The Minister of Transport and the Director general of the Department have visited
the Kei Cuttings and there are plans to address this challenge. The taking over of
the section of the N2 to be directly under the control of the national Department of
Transport is an indication that Butterworth‟s economic and development challenges
are on the national agenda. Siyaya Civics and Building Contractors is a good
example of how the Department of Transport is promoting black economic
empowerment and skilling. The established roads construction company (Labor
Construction) was awarded the contract to maintain sections of the N2 including
the Kei Cuttings. This company sub-contracted the black owned company to do
patching, drain cleaning, barrier repairs etc. As claimed by the owners of the black
company, there is a transfer of skills to the local people who are employed.
The Department of Labour
This department has contributed to LED by financing the training of local people in
small business development at the Gcuwa Training Centre. Although figures of the
number of people trained and the performance of their small businesses were not
obtained during this study, the range of possible businesses and opportunities for
the unemployed in Butterworth has risen.
The need for political intervention
The view that Butterworth needs a „political solution‟ to its problems was
expressed by many stakeholders. There is a belief that if the government intervened
firmly and decisively, the conflict might end sooner and development and progress
will resume. Government intervention was seen as important because stakeholders
felt that there is no guarantee that conflict and disagreement will end even if all the
members of the current TLC resigned. Government intervention was seen as a way
of bringing about an end and finality in Butterworth‟s turbulent history. Some
stakeholders felt that some of the problems in Butterworth cannot be resolved
through consultation and co-operation between the sides in disagreement. What was
needed as well is intervention at provincial or national government.
Butterworth Profile Page 65 of 84
7. Local economic development – constraints
and possibilities
Introduction
Strategies are needed to provide an enabling environment for the local economy of
Butterworth to grow. The key and important aspects of the local economy that are
exploitable and usable for growth need to be pointed out. As the phase of industrial
employment has disappeared, new ways of generating employment and creating
opportunities for economic growth have to be devised. In suggesting what is
possible and feasible, as gathered during the study, those aspects of Butterworth as
a town and a community that are seen as constraints and possibilities to LED will
be presented.
One of the key indications that came out of this study, which is important for local
economic development, is that Butterworth needs strong leadership, unity and clear
plans on how to generate social and economic development. Further, it must be
emphasised that the solution lies in identifying the real potential of the area and its
people. In identifying the possibilities for local economic development in
Butterworth, firstly, there is a myth that needs to be unraveled – that of seeing the
main thrust of rejuvenating the local economy through attracting industries back to
the area. This will be dealt with first.
Butterworth’s industries under industrial decentralisation – a
limited contribution to the local economy
(i) The former RSA and Transkei governments as the main actors in
development programmes
The involvement of the government through the policy of industrial
decentralisation was the process that led to the emergence of Butterworth as an
industrial centre. The involvement of the government of Transkei through the TDC
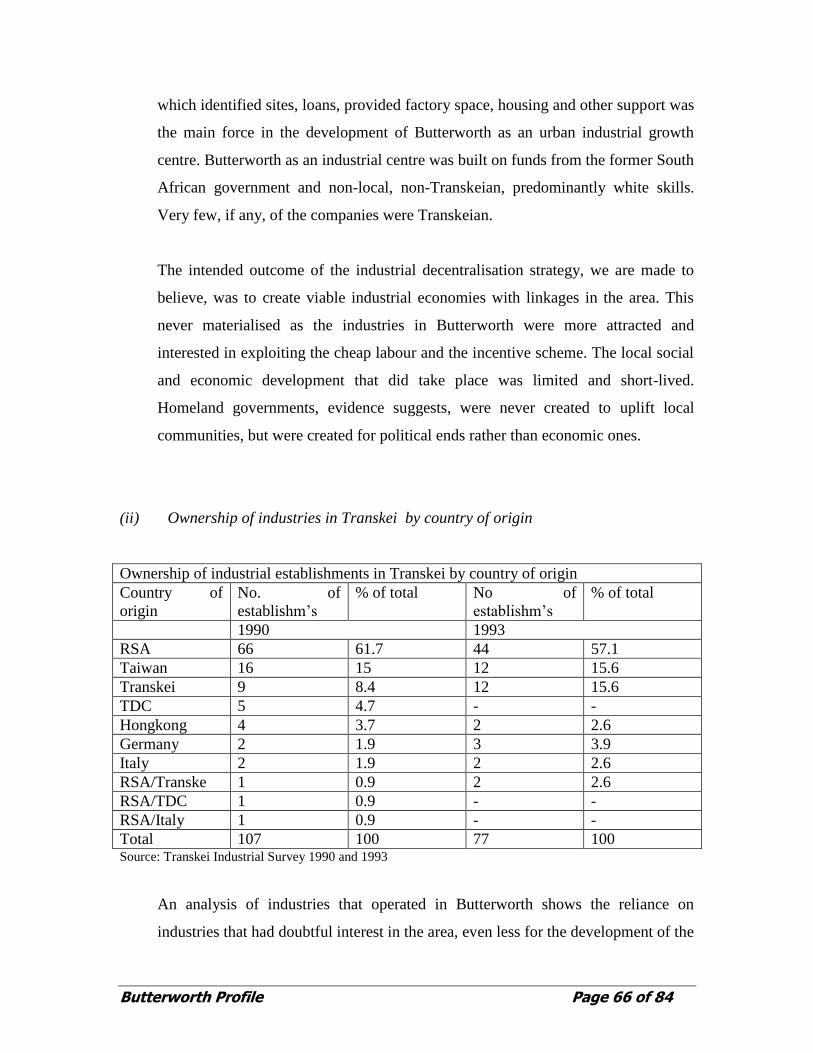
Butterworth Profile Page 66 of 84
which identified sites, loans, provided factory space, housing and other support was
the main force in the development of Butterworth as an urban industrial growth
centre. Butterworth as an industrial centre was built on funds from the former South
African government and non-local, non-Transkeian, predominantly white skills.
Very few, if any, of the companies were Transkeian.
The intended outcome of the industrial decentralisation strategy, we are made to
believe, was to create viable industrial economies with linkages in the area. This
never materialised as the industries in Butterworth were more attracted and
interested in exploiting the cheap labour and the incentive scheme. The local social
and economic development that did take place was limited and short-lived.
Homeland governments, evidence suggests, were never created to uplift local
communities, but were created for political ends rather than economic ones.
(ii) Ownership of industries in Transkei by country of origin
Ownership of industrial establishments in Transkei by country of origin
Country of
origin
No. of
establishm‟s
% of total No of
establishm‟s
% of total
1990 1993
RSA 66 61.7 44 57.1
Taiwan 16 15 12 15.6
Transkei 9 8.4 12 15.6
TDC 5 4.7 - -
Hongkong 4 3.7 2 2.6
Germany 2 1.9 3 3.9
Italy 2 1.9 2 2.6
RSA/Transke 1 0.9 2 2.6
RSA/TDC 1 0.9 - -
RSA/Italy 1 0.9 - -
Total 107 100 77 100 Source: Transkei Industrial Survey 1990 and 1993
An analysis of industries that operated in Butterworth shows the reliance on
industries that had doubtful interest in the area, even less for the development of the
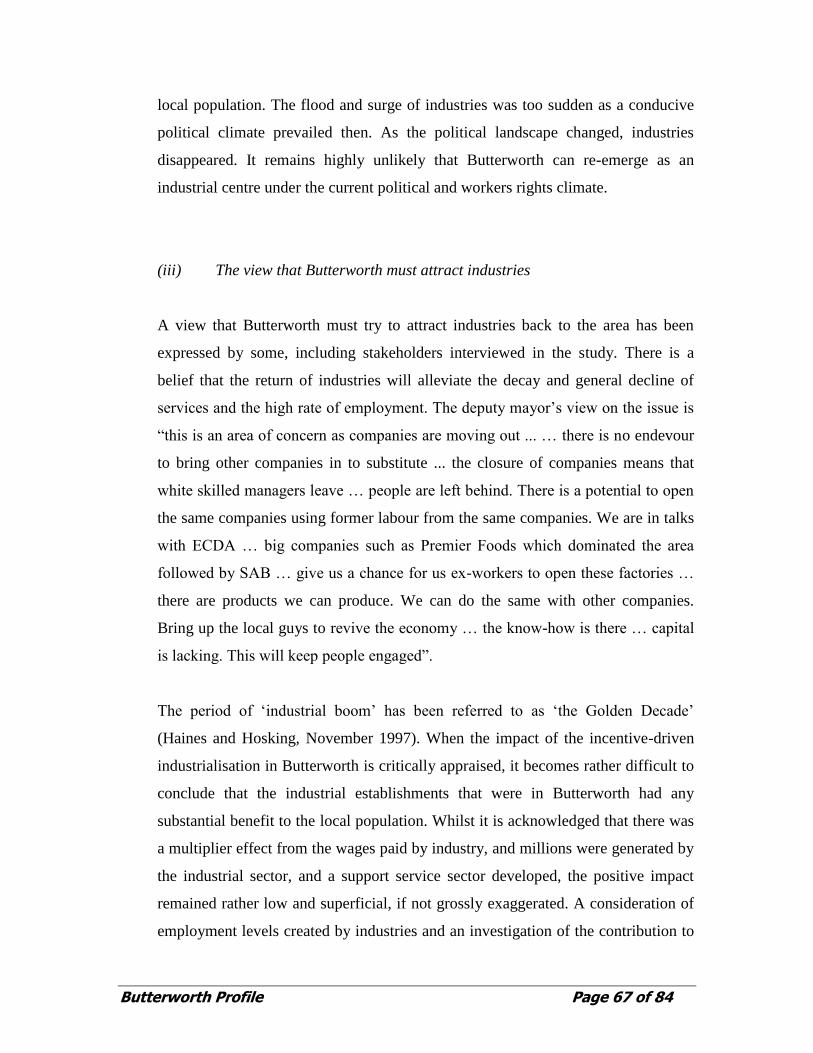
Butterworth Profile Page 67 of 84
local population. The flood and surge of industries was too sudden as a conducive
political climate prevailed then. As the political landscape changed, industries
disappeared. It remains highly unlikely that Butterworth can re-emerge as an
industrial centre under the current political and workers rights climate.
(iii) The view that Butterworth must attract industries
A view that Butterworth must try to attract industries back to the area has been
expressed by some, including stakeholders interviewed in the study. There is a
belief that the return of industries will alleviate the decay and general decline of
services and the high rate of employment. The deputy mayor‟s view on the issue is
“this is an area of concern as companies are moving out ... … there is no endevour
to bring other companies in to substitute ... the closure of companies means that
white skilled managers leave … people are left behind. There is a potential to open
the same companies using former labour from the same companies. We are in talks
with ECDA … big companies such as Premier Foods which dominated the area
followed by SAB … give us a chance for us ex-workers to open these factories …
there are products we can produce. We can do the same with other companies.
Bring up the local guys to revive the economy … the know-how is there … capital
is lacking. This will keep people engaged”.
The period of „industrial boom‟ has been referred to as „the Golden Decade‟
(Haines and Hosking, November 1997). When the impact of the incentive-driven
industrialisation in Butterworth is critically appraised, it becomes rather difficult to
conclude that the industrial establishments that were in Butterworth had any
substantial benefit to the local population. Whilst it is acknowledged that there was
a multiplier effect from the wages paid by industry, and millions were generated by
the industrial sector, and a support service sector developed, the positive impact
remained rather low and superficial, if not grossly exaggerated. A consideration of
employment levels created by industries and an investigation of the contribution to
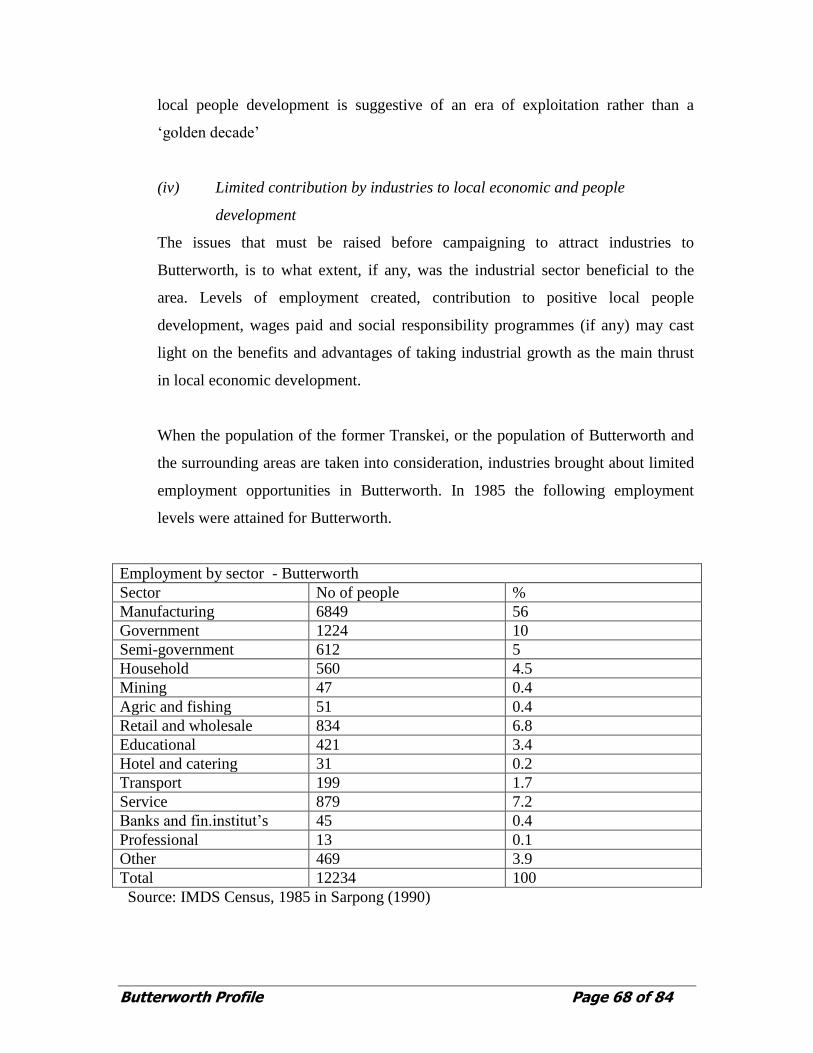
Butterworth Profile Page 68 of 84
local people development is suggestive of an era of exploitation rather than a
„golden decade‟
(iv) Limited contribution by industries to local economic and people
development
The issues that must be raised before campaigning to attract industries to
Butterworth, is to what extent, if any, was the industrial sector beneficial to the
area. Levels of employment created, contribution to positive local people
development, wages paid and social responsibility programmes (if any) may cast
light on the benefits and advantages of taking industrial growth as the main thrust
in local economic development.
When the population of the former Transkei, or the population of Butterworth and
the surrounding areas are taken into consideration, industries brought about limited
employment opportunities in Butterworth. In 1985 the following employment
levels were attained for Butterworth.
Employment by sector - Butterworth
Sector No of people %
Manufacturing 6849 56
Government 1224 10
Semi-government 612 5
Household 560 4.5
Mining 47 0.4
Agric and fishing 51 0.4
Retail and wholesale 834 6.8
Educational 421 3.4
Hotel and catering 31 0.2
Transport 199 1.7
Service 879 7.2
Banks and fin.institut‟s 45 0.4
Professional 13 0.1
Other 469 3.9
Total 12234 100
Source: IMDS Census, 1985 in Sarpong (1990)
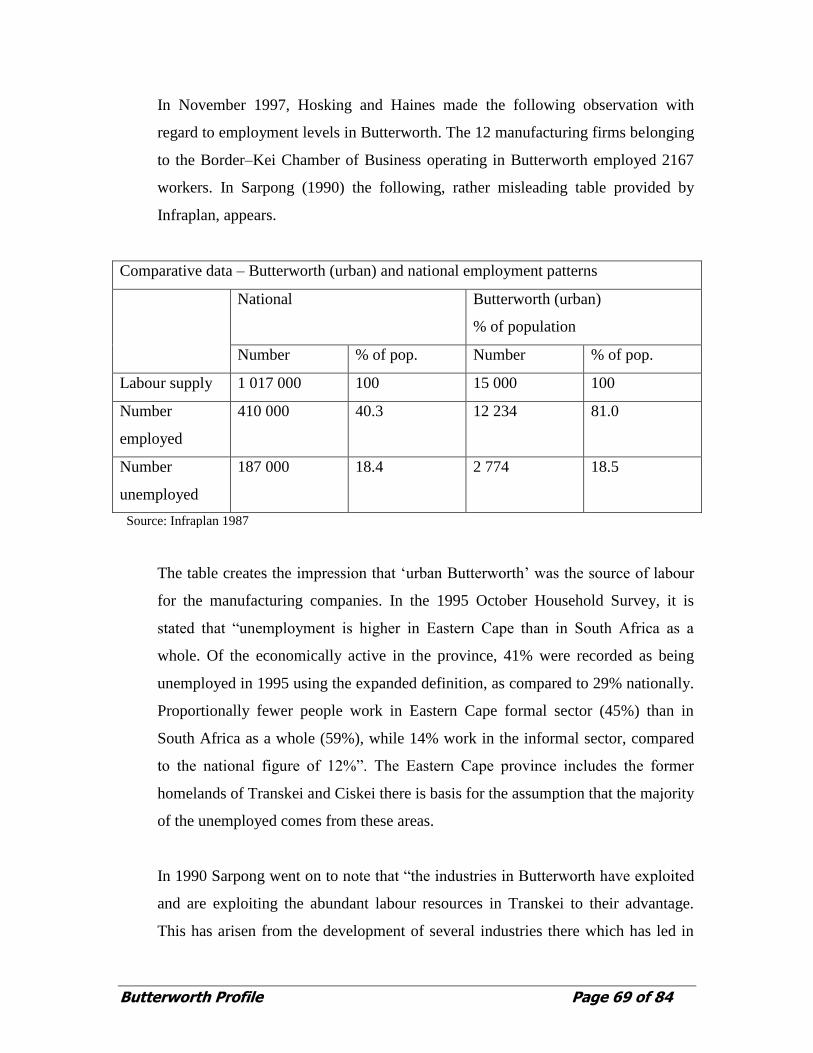
Butterworth Profile Page 69 of 84
In November 1997, Hosking and Haines made the following observation with
regard to employment levels in Butterworth. The 12 manufacturing firms belonging
to the Border–Kei Chamber of Business operating in Butterworth employed 2167
workers. In Sarpong (1990) the following, rather misleading table provided by
Infraplan, appears.
Comparative data – Butterworth (urban) and national employment patterns
National Butterworth (urban)
% of population
Number % of pop. Number % of pop.
Labour supply 1 017 000 100 15 000 100
Number
employed
410 000 40.3 12 234 81.0
Number
unemployed
187 000 18.4 2 774 18.5
Source: Infraplan 1987
The table creates the impression that „urban Butterworth‟ was the source of labour
for the manufacturing companies. In the 1995 October Household Survey, it is
stated that “unemployment is higher in Eastern Cape than in South Africa as a
whole. Of the economically active in the province, 41% were recorded as being
unemployed in 1995 using the expanded definition, as compared to 29% nationally.
Proportionally fewer people work in Eastern Cape formal sector (45%) than in
South Africa as a whole (59%), while 14% work in the informal sector, compared
to the national figure of 12%”. The Eastern Cape province includes the former
homelands of Transkei and Ciskei there is basis for the assumption that the majority
of the unemployed comes from these areas.
In 1990 Sarpong went on to note that “the industries in Butterworth have exploited
and are exploiting the abundant labour resources in Transkei to their advantage.
This has arisen from the development of several industries there which has led in
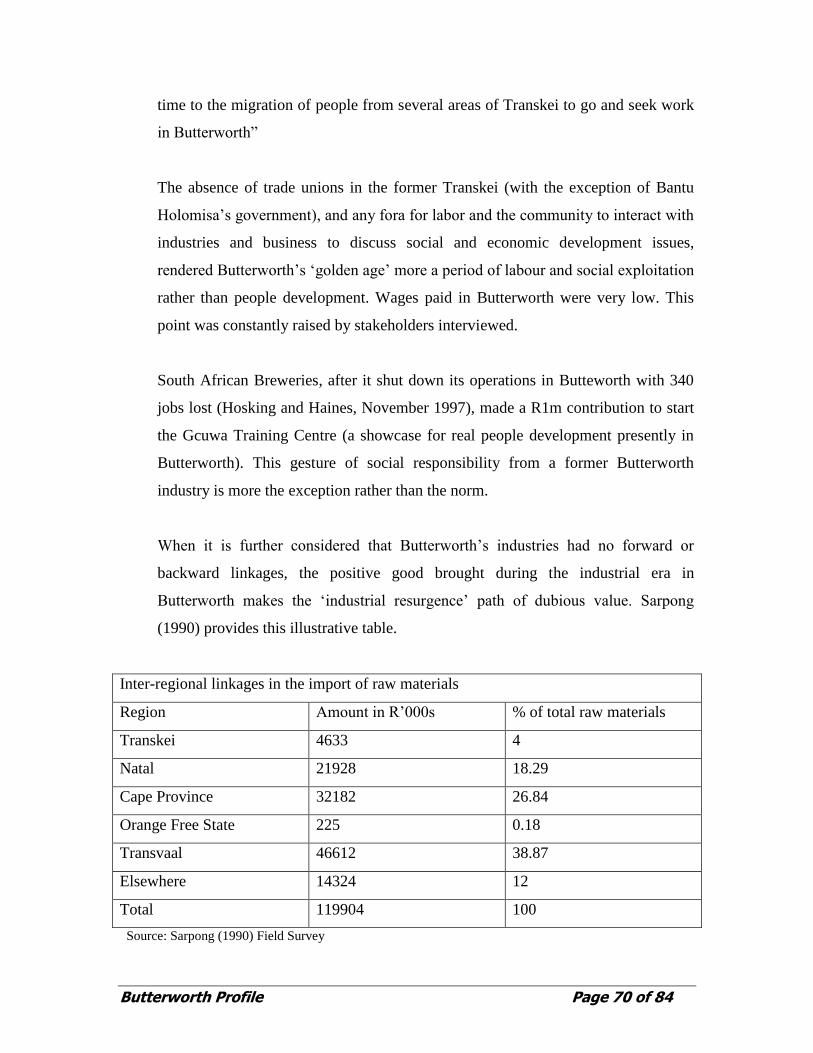
Butterworth Profile Page 70 of 84
time to the migration of people from several areas of Transkei to go and seek work
in Butterworth”
The absence of trade unions in the former Transkei (with the exception of Bantu
Holomisa‟s government), and any fora for labor and the community to interact with
industries and business to discuss social and economic development issues,
rendered Butterworth‟s „golden age‟ more a period of labour and social exploitation
rather than people development. Wages paid in Butterworth were very low. This
point was constantly raised by stakeholders interviewed.
South African Breweries, after it shut down its operations in Butteworth with 340
jobs lost (Hosking and Haines, November 1997), made a R1m contribution to start
the Gcuwa Training Centre (a showcase for real people development presently in
Butterworth). This gesture of social responsibility from a former Butterworth
industry is more the exception rather than the norm.
When it is further considered that Butterworth‟s industries had no forward or
backward linkages, the positive good brought during the industrial era in
Butterworth makes the „industrial resurgence‟ path of dubious value. Sarpong
(1990) provides this illustrative table.
Inter-regional linkages in the import of raw materials
Region Amount in R‟000s % of total raw materials
Transkei 4633 4
Natal 21928 18.29
Cape Province 32182 26.84
Orange Free State 225 0.18
Transvaal 46612 38.87
Elsewhere 14324 12
Total 119904 100
Source: Sarpong (1990) Field Survey
Butterworth Profile Page 71 of 84
This table, Sarpong explains, indicates that the Transvaal in terms of raw materials
imports supplies nearly 40% of the requirements of industries in Butterworth.
When the question „who do you supply your products to?‟ was posed to the
managers at Suntec and Transkei Wire Industries, the response from Suntec was
„we do not supply anybody in Butterworth, all our big customers are in major
centres‟. For Transkei Wire Industries it was „our market is the Border / Kei area …
the factory is only a depot now … we stopped production … in March 1998 we
retrenched about 65 workers … why duplicate manufacturing facilities?‟.
Sarpong also analysed and noted that Butterworth‟s industries had a very weak
financial position which supported the view that industries sprang up in
Butterworth primarily because of the attractive incentives. The weak financial
position of the industries affected their ability to substantially remunerate labour
among other constraints.
All the above factors including others discussed elsewhere in this report (eg Kei
Cuttings) pose significant dilemmas for industrial resurgence in the area. The
following observation from one of the people interviewed summarises the
challenges if local economic development is to come about through industrial
growth.
“The Butterworth thing is a complex thing … it is not just the TLC … they are just
the sherry on top … things started going wrong … there was no unionism in
Transkei … when the Robben Islanders came out … unions started … wages were
low … no unionism … there were incentives (tax holiday for Taiwanese and former
RSA) they were paying starvation wages, they got away with murder … the place
boomed … the government allowed that … when the big boys came out of Robben
Island … the whole thing erupted … there were strikes at the shop floors … the
former government had no clout … if we are honest the thing that made them leave
is because there were no right wages … too used to incentives”.

Butterworth Profile Page 72 of 84
Competing for investment with ‘better’ areas in South Africa
Strategies that are geared towards attracting outside (national and international)
investment in Butterworth have enormous challenges to overcome. With the levels
of both foreign and local investment low in an economy that is experiencing a
slump, Butterworth has to compete with many areas that have far superior
advantages. The key improvements that are urgently needed, among many, to
attract investment in the area are a better infrastrcture, an improved skills base,
transport facilities, road networks, better human performance and efficiency levels.
The situation in Butterworth, which is not beyond rectification, militates against
these. The infrastructure that is in disrepair and decay, the inability of the
municipality to effect proper provision of services, render the attraction of outside
investment to Butterworth a medium to long term strategy rather than something
for the here and now.
The enormity of the economic situation and how it is affecting places such as
Butterworth was expressed by one of the managers interviewed, “ the reasons for
the shutdown are simple … the South African market has shrunk, there are more
competitors, the country has an economic recession and there is no reason to
duplicate manufacturing facilities in these circumstances”.
Attracting industries into the local industrial sector is not a guarantee for the
generation of jobs. Modern production is technology – intensive and industries are
employing less workers who are highly trained. Butterworth lacks this industrial
skills base. Butterworth has been affected by th erise in capital intensive industries.
The manager from Suntex painted this picture. “We implemented a number of
changes after the concessions were removed – we restructured … we use to have
275 – 300 workers ... now we are at about 230 … we had to be much leaner and
had to increase our prices to cover the costs previously covered by concessions.
The concessions were very much built into our financial planning. The concessions
were phased out over a two-year period. Dyeing machines … we bought … you

Butterworth Profile Page 73 of 84
punch in a programme and it does everything ... we employ machines that run
themselves … labour has become very expensive … match high skills with high
productivity. Parts of Africa have abundant labour … in Africa we need low
technology, low wages so that we can employ more people”
This demonstrates the importance of the use of appropriate technology in LED that
will generate more jobs rather than bringing in huge investment that will result only
in a few jobs.
The envisaged role of local government in LED
Local government is supposed to be playing the leading role in LED. This is where
the most serious and critical of Butterworth‟s challenges lie presently. The
Butterworth town is not alone in this dilemma. National government is fully aware
of the shortage of skills and expertise in many TLCs especially in rural towns. In
Butterworth the current conflict makes the situation worse. For local government to
lead LED, managers and planners who are very skilled and dynamic are needed. It
is people who have the „know how‟, people who can broker large investment deals
for the area. Largely it is people with an insight into social development who have
the dynamism to interact with government at national and provincial levels,
international investors, NGOs, influential private individuals, etc. The challenge to
lead LED needs leaders who are not going to „wait to see what the government
wants to do‟.
It is doubtful, depending on what LED is understood to be, to see the current TLC
leadership leading rural towns to prosperity. The critical link lies in forming
networks with NGOs and other community actors who create a dynamic
environment of women development, youth projects, small enterprise development,
skills training, creating markets for local products, promoting tourism and other
beneficial activities in the area.
Butterworth Profile Page 74 of 84
If local government is going to move from being a mere conduit for the
disbursement and allocation of government grants, into a wealth-creating,
prosperity driven establishment, it is doubtful, in South Africa in general, that the
current calibre of people can pull it through.
Currents within the Butterworth municipality
From the interviews conducted (the deputy mayor, the town clerk and senior staff at
the municipality) two important issues emerged.
- there are tensions in the municipality between the TLC and some of the managers
in the municipality. This is not to say that there are clear „battle lines‟ drawn, but
discord is evident.
- there is a concern with skills levels in the TLC and the municipality.
The question „what are the primary responsibilities of a TLC and the municipality‟
was posed to those interviewed in the municipality. This is the view that emerged;
The TLC is the third sphere of government, believed to be closest to the people, it
services the needs of the people - rendering basic services to the community –
water, refuse removal, electricity, maintain roads, traffic control, housing etc. The
TLC is supposed to work hand in hand with government and act as development
agents in the area.
To illustrate current tensions within the municipality and the TLC, the following
responses are presented verbatim:-
„In the past we had unfortunate situation where the council tried to manipulate staff
... councilors tried to give instructions to staff‟.
Butterworth Profile Page 75 of 84
„Councilors are very conscious of the fact they are the people with authority in this
whole town … most of them came into local government in November 1995 …
except the mayor … the tendency is that they do not listen to certain members of
the management … they only listen to their mayor ... there is lack of respect and a
gross ignorance of regulations by council members‟.
„People in Butterworth are all centred around self interest so is the staff in the
municipality (management as such) … staff think councilors are impossible … it is
only certain people within the staff but then are influential with the other staff …
there have been tensions over things like promotions that were seen to be irregular‟.
„Some staff steal information and give it to SANCO ... this spreads mistrust …
knowledge is power … we need to train people, train them not only on skills but on
the code of conduct‟.
„The municipality is highly unionised … to give some background, in 1993/4/5 the
workers in the municipality were very active in formulating party lists and
campaigning for those selected … they were very forceful … unions do not only
protect interests of members but they are also involved in party political matters …
some members of staff are serving as committee members of political
organisations‟.
On the skills level in the municipality and the TLC the following responses were
obtained;
„…we need skilled staff … staff generally is under-qualified in terms of running a
municipality … this applies to councilors as well … a lot of training has been done
with the councilors … we need a lot of training for staff to be able to provide the
services needed‟.
Butterworth Profile Page 76 of 84
„Before 1994 a lot of people resigned, a lot of people left …. There was a skills
drain … here there were people promoted inside to posts they did not qualify for …
there were no skilled people who wanted to come to Butterworth‟.
From the deputy mayor „… the concept of local government is very new …
especially for us blacks in South Africa … it is unfortunate that when people elect
you into office nobody follows up to make sure that you run the public office
properly … you end up relying on your own natural skills … there is a strong need
for councilors to be trained … some people are not doing things according to what
the book requires. We need skills and training in the budget, the mission and the
vision for Butterworth‟.
Expecting development and progress from a cash-strapped TLC
and Municipality
The Butterworth municipality is bankrupt. The municipality is not in a position to
pay even salaries. When the town clerk was interviewed, he mentioned that the
municipality did not have funds to meet its salary obligations. The town treaurer,
during the interview, concurred with this view. Salaries account for 65% of the
municipal budget approved by the TLC and this is based on assumed income which
is not forthcoming. Salaries presently take 80% of whatever monies are receioved
by the municipality. This makes it impossible for the Butterworth municipality to
render and provide even the most essential of services. The municipality, at the
time this study was conducted, is owed R37m which is outstanding debt on rates.
The municipality has gone to the extent of arranging bank overdrafts. The town
clerk stated that interest of over R300 000 is paid to service the rescue loans from
the bank.
Other than income and revenue problems, the municipality is embroiled in the
conflict between Butterworth stakeholders and the TLC. About three weeks before
this study was undertaken, the municipality was closed for four days and all the
Butterworth Profile Page 77 of 84
workers and managers were told to stay at home. To further compound the
municipality‟s revenue problems is the ongoing rent boycott. Even the Masakhane
campaign, once assumed to be successful, fell flat within two months. “Since 1992
there has been an official boycott … Masakhane has not had an impact … we tried
to launch Masakhane for the second time, there was an increase in payment for two
months … there was a drop again. There is mistrust between the community and
leaders in the municipality. Yesterday (Tuesday 17 November 1998) there was a
call for the boycott of payments to the municipality and even business is included
to join the rent boycott this time … this is from SANCO”. These are the words of
one of the managers in the municipality interviewed.
With the prevailing situation and such levels of financial handicap, the Butterworth
TLC and the municipality are unable to engage in the development of the place.
The maintenance infrastructure is impossible without the necessary finance.
Improvements and progress do not seem to be possible presently.
This situation highlights the need for a resolution of the Butterworth conflict as
progress cannot be achieved in the present conditions. In the opinion of the
stakeholders interviewed, the solution lies in a political settlement that can ensure
accountable leadership and the Butterworth community paying rates and for
services from the municipality.
Butterworth Profile Page 78 of 84
8. Conclusion
From the view of an outsider, the Butterworth area presents itself as a community
submerged in conflict and bent on destroying its potential and possibilities for
future development and progress. This is however not the case. This does not mean
that there are no problems of conflict to resolve. When the views of stakeholders
are investigated, when one goes beyond the surface, there is dynamic activity by the
local population to try and take responsibility for the future of the area. Positive
developments are evident, the Gcuwa Training Centre is a showcase of real people
development. The Presidential Projects Team is working with stakeholders to
facilitate the implementation of measures that will rescue the town and forge
integrated development planning. The economic and development summit held in
July 1998 points to a different future to the present state of infrastructure decay,
non-delivery of services and conflict between the TLC and key stakeholders in
Butterworth.
There has been a decline of the industrial sector in Butterworth. This has resulted in
unemployment increasing further. There is migration of people from poverty-
stricken rural areas and this has resulted in the population of the town to increase
dramatically as seen in the informal houses mushrooming everywhere. These
factors have compelled to local population to look at income-generating activities
to sustain their livelihoods. Butterworth has a proliferating informal sector that has
seen nearly every part of the CBD taken over by street traders.
Although the conflict in the town does hinder development and progress, some of
the problems in the Butterworth area, eg the Kei Cuttings, are receiving attention at
national government level.
It remains the responsibility of accountable and firm leadership to explore and
exploit the resources of the people and the area to take them on a path to properity.
Expertise and a willingness to assist already exist in the involvement of bodies such

Butterworth Profile Page 79 of 84
as the Presidential Projects Team. The Butterworth area will have to bring together
its youth, women, political organisations, traditional authorities, business, NGOs,
training institutions etc in the area to change the direction of developments along
the lines presented in the recommendations. There is already stakeholder and local
people involvement in development issues.
Butterworth Profile Page 80 of 84
9. Recommendations
These recommendations are given in the understanding of the best ways to effect
LED in the Butterworth area. They are based largely on the wisdom gained through
the study undertaken and specifically issues and views raised by stakeholders and
those who have researched and written on the area.
The involvement and participation of the local population in creating an
economic future for the area – One of the main advantages of the current
phase in development planning in Butterworth is that it is an initiative that
originates from the concerns of the local people, it is driven by a desire to
change the current situation and explore ways of developing the local economy.
This is indeed a very important development. In as much as assistance from
outside institutions, organisations and the provincial and national government is
needed, at the centre of the current concerns are the people of Butterworth. The
local population must be the centre od LED and LED initiatives, from whatever
source, must focus on the local population.
Local economic development networks and links must be created. Leaders
among the stakeholders must have a dynamic network with NGOs, local
training and education institutions, organisations in other areas and
internationally, government departments, women‟s groups, rural development
organisations etc. These will bring expertise and opportunities to Butterworth.
Reservations with attracting industries to Butterworth – evidence shows
that the Butterworth industries had a limited impact in the social development
and upliftment of the area. Modern industrial production is capital-intensive
which results in low volumes of job creation. Butterworth has to compete with
areas that have better-established infrastructure, skills levels and support
services.
Butterworth Profile Page 81 of 84
Butterworth needs strong leadership and competent managers in critical
areas of the municipality and governance. Even if the disagreements are
resolved, the town needs an efficient and skilled town clerk, works manager and
town treasurer which are key posts for a healthy municipality.
Small business development and wealth creation – the Butterworth area
presently relies heavily on government employment, salaries, grants and
remittances from migrant workers. The small business sector needs to be
developed, supported and promoted. Importantly, markets must be found to
expand the distribution of local products.
The complete spectrum of small businesses needs to be explored and the local
population must be provided with the essential requirements to be self-reliant
than grant-supported
Local participation in the local economy – local consumption, whenever
possible must be directly linked to local produce. There are many products that
can be produced or procured locally that are presently imported into the area by
retailers and wholesalers.
Public-private partnerships – there has been resistance and strong opposition
from the municipality union to public-private partnerships. These need to be
explored as their rejection might be based on lack of understanding rather than
objections in principle. This might diffuse the highly politicised interactions
within the municipality.
The Butterworth conflict – this must be addressed and solutions reached. It must
be lasting solutions. Butterworth continues to receive negative publicity and the
conflict is interfering with development and progress.
Butterworth Profile Page 82 of 84
The advantages of the location of Butterworth – there is a high traffic volume
that passes through Butterworth. The location of the town on the national N2
route holds prospects for the area if properly exploited. Indications are that
there is increase in tourism into South Africa and the Eastern Cape province is a
major tourist attraction because of its scenic beauty. The Butterworth area can
exploit the tourist market and the thousands of travelers that pass through the
town. The retail and service sectors stand to benefit if all the development plans
are executed.
Government procurement policy and contracts – local entrepreneurs who will
employ local labour, must be given opportunities in government contracts
(roads, building of schools, clinics, maintenance of government buildings,
outsourcing, etc) and procurements.
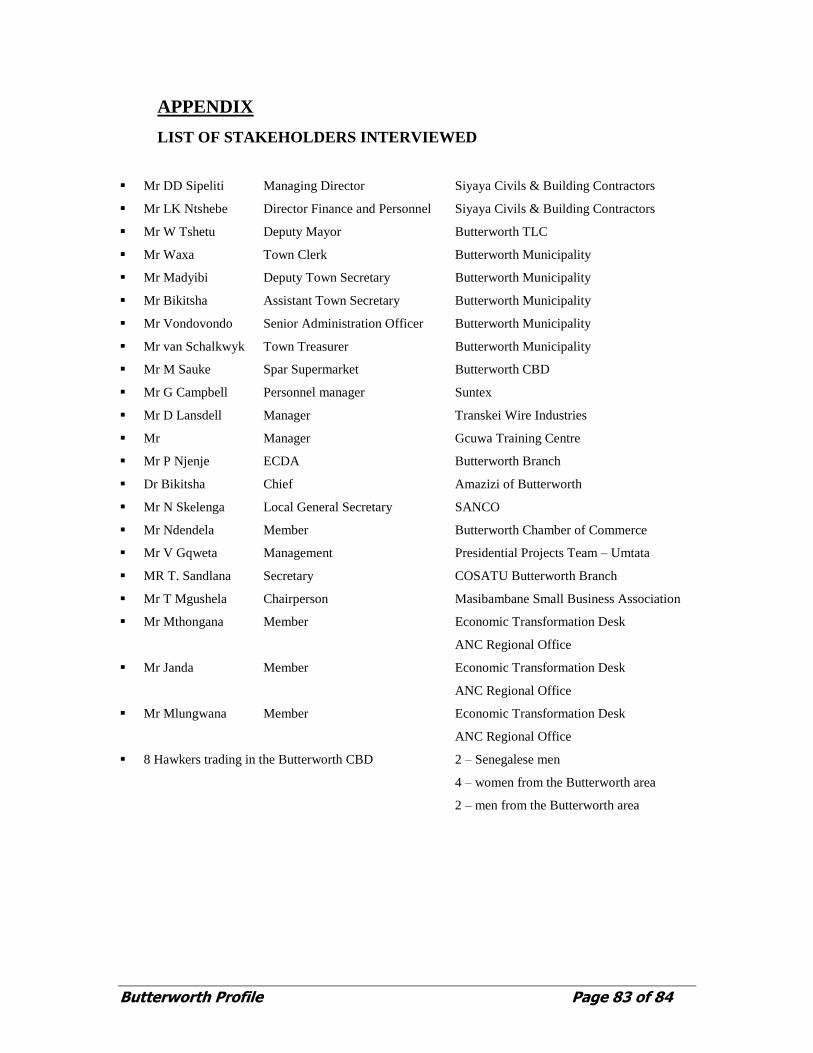
Butterworth Profile Page 83 of 84
APPENDIX
LIST OF STAKEHOLDERS INTERVIEWED
Mr DD Sipeliti Managing Director Siyaya Civils & Building Contractors
Mr LK Ntshebe Director Finance and Personnel Siyaya Civils & Building Contractors
Mr W Tshetu Deputy Mayor Butterworth TLC
Mr Waxa Town Clerk Butterworth Municipality
Mr Madyibi Deputy Town Secretary Butterworth Municipality
Mr Bikitsha Assistant Town Secretary Butterworth Municipality
Mr Vondovondo Senior Administration Officer Butterworth Municipality
Mr van Schalkwyk Town Treasurer Butterworth Municipality
Mr M Sauke Spar Supermarket Butterworth CBD
Mr G Campbell Personnel manager Suntex
Mr D Lansdell Manager Transkei Wire Industries
Mr Manager Gcuwa Training Centre
Mr P Njenje ECDA Butterworth Branch
Dr Bikitsha Chief Amazizi of Butterworth
Mr N Skelenga Local General Secretary SANCO
Mr Ndendela Member Butterworth Chamber of Commerce
Mr V Gqweta Management Presidential Projects Team – Umtata
MR T. Sandlana Secretary COSATU Butterworth Branch
Mr T Mgushela Chairperson Masibambane Small Business Association
Mr Mthongana Member Economic Transformation Desk
ANC Regional Office
Mr Janda Member Economic Transformation Desk
ANC Regional Office
Mr Mlungwana Member Economic Transformation Desk
ANC Regional Office
8 Hawkers trading in the Butterworth CBD 2 – Senegalese men
4 – women from the Butterworth area
2 – men from the Butterworth area

Butterworth Profile Page 84 of 84


![Complexitat i fenomen (socio)lingüístic [Complexity and (socio)linguistic phenomenon]](https://static.fdokumen.com/doc/165x107/63130623c32ab5e46f0c3b37/complexitat-i-fenomen-sociolingueistic-complexity-and-sociolinguistic-phenomenon.jpg)