Influence Of Socio-economic Status On Habitual Physical Activity In 8- To 10-year-old Children
Upload
khangminh22Category
view
1download
0
21
CHAPTER: II
REGIONAL SETUP: PHYSICAL AND SOCIO-ECONOMIC
2.1 Introduction
Vadodara district with 7548.50 Sq km area, is located central part of mainland Gujarat,
lies between 21°49‟19” and 22°48‟37” north latitude and 72°51‟05”and 74°16‟55” east
longitude. It falls in the Survey of India, degree sheets numbered 46B, 46F, 46J & 46G. The
district is bounded in north & northeast by Anand, Panchmahals & Dahod districts, in east & in
south east by Madhya Pardesh & Maharashtra State, in south east by Narmada district & in south
& in west by Bharuch district. Vadodara city, the district headquarter is about 100 km south of
Ahmedabad, is well connected to other parts of the State & Country by network of highways and
railway network.
Vadodara is redesigned in 1997 on the grounds that entire Tilakwada Taluka and a few towns of
Nasvadi Taluka of the district has been moved in recently made Narmada region. Kavant Taluka
has been recently made from Chhota Udaipur Taluka of the district. In this way at present the
district has 12 talukas with 1,553 villages and 16 towns.
Figure 2.1 Taluka Boundaries and Taluka Headquarters of Vadodara District. (Source: CGWB
Report)
Figure 2.1 delineates Administrative boundaries of Vadodara area alongside district head
quarter and taluka limits with taluka head office, Vadodara region is subdivided into twelve

22
Talukas, viz. Vadodara, Savli, Vaghoriya, Sankheda, Jetpur Pavi, Chota Udaipur, Kawant,
Naswadi, Dabhol, Sinor, Karjan and Padra.
2.2 Physical Aspect
2.2.1 Physiography: Vadodara region shapes a piece of the great Gujarat plain. The eastern
segment of the area including the Chhota Udepur, the Kavant, the Jambughoda and the Naswadi
taluka is sloping territory with a few edges, levels and disengaged relict slopes have height in
scope of 150 to 481 m amsl. The south eastern level has the most noteworthy pinnacles of the
region – Amba Dungar and Mandai Dongar 637 m amsl. Whatever is left of the locale, the
western and southern part, involving Mahi and Narmada Doab, is a level plain with delicate
undulating territory have risen in scope of 120 to 20 m amsl. The general rise ranges from 610 m
amsl in east to 20 m amsl in south-west.
A large portion of the western part, containing Mahi – Narmada Doab and northern
alluvial plain is pretty much level territory, have height in extend from 20 to 80 m amsl. There
are some direct tracts, along Mahi, Viswamitri, Dhadahar and Orsang streams, have gorge
landforms, with run of the mill head ward erosional highlighted chasm arrangement in delicate
alluvium. The banks of the Mahi have high vertical cliff, 10 to 25 m stature, for the most part on
left bank; same way left bank of the Narmada likewise has high bluff of 10 to 20 m high on right
bank. Every single such component of Mahi-Narmada Doab, similar to gorge highlights, high
precipice along banks and settled in winding courses with dry and wide sandy stream bed of
middle free waterway frameworks of the Dhadhar and its tributaries show develop waterway
organize and furthermore structural inspire of Doab partition in Recent geographical past.
Figure2.2 shows physiographical varieties of whole Vadodara District. The central part of the
district is low level undulating plain with low level plateau and few relict hills. The area between
the Unch and the Orsang river have aeolian low level stabilized dune with rolling topography.

23
Figure 2.2 Physiography of Vadodara District. (Source: CGWB Report)
The hilly terrains of north - eastern part have residual hill features with more or less flat
topped plateau. Except few volcanic peaks – Phenai Mata Hills and Amba Dungar, all have
plateau or ridge type features and are few tens of meter height than surrounding rocky dissected
plain. The highest plateaus are in south eastern part of the district, marked with rift valley of the
Narmada River towards south.
2.2.2 Geomorphology:
Vadodara district can be divided into two major geomorphic units, eastern hilly, medium
to high relief terrain and the western plain area. The western plain consists of flat low lying
surface and a thick pile of alluvium. The Mahi, Narmda and Vishwamitri rivers had deposited
these thick piles of alluvium in the whole district. The Vadodara Plain occupies central parts of
the district and extends over Padra, Savli, Waghodia, Dabhoi, Karjan, Sinor and Sankheda
talukas. The study area falls in the western part of the district enclosing within the Alluvial Plain
geomorphic unit.
2.2.3 Drainage:
The Mahi River passes through the district. Orsang, Dhadhar, Dev, Goma, Jambuva,
Vishwamitri, Bhukhi Heran, Mesari, Karad, Men, Ani, Aswini and Sukhi are the small rivers.
Minor irrigation dams are constructed across Sukhi and Rami rivers. Geographically, the district
comprises of Khambhat Silt in the south-west, Mahi plain in the north-west, Vadodara plain in
the middle, Orsang-Heran plain in the mid-east, Vindhyan hills in the east and Narmada gorge in

24
the south-east which merges westwards with the lower Narmada Valley. Most of the area of the
region is represented by flood plains having general slope towards the Khambhat Gulf on the
South-west. Figure 2.3 depicts drainage systems presents in study area and major river basins of
Vadodara district.
Figure 2.3 Drainage and major Basins in Vadodara District (Source: CGWB Report)
2.2.4 Geology:
The rocks of the Vadodara district demonstrate an age from Proterozoic to Recent
however a striking components of the region stratigraphy is the aggregate nonattendance of
Paleozoic, and the improvement of just the highest Mesozoic rocks. The south westerly amplified
Precambrian cellar of Peninsular India, the most established rocks of Proterozoic age, are
uncovered in eastern and north eastern piece of the area. Post Cretaceous silt and major volcanic
rocks rest over this south westerly broadened Precambrian storm cellar. Post Cretaceous dregs,
Infra-trappean and Intra-trappean are uncovered as scattered inliers while more youthful volcanic
rocks unit as Deccan trap is very much spoken to as are the Tertiary and Quaternary, however
the Tertiary records are not finished and completely uncovered.
Geographically the zone is level in nature. The western piece of the area, i.e., Savli,
Dabka, Koral, Chandod, Padra, Karjan, Dabhoi and Sinor are for the most part made out of Silty
sand, Clayey residue, fine Sand with Kanker and Gravels. The study area involves various fixes
and extended stores of Quaternary alluvium along the western piece of region close Study zone.

25
Real geography of the Study territory involves Channel-fill, Flood plain and Tidal level stores.
The earth of affidavit is fluvial in nature. The lithology of the Study zone falls under Katpur
Formation of Holocene age. The idea of aquifer of Quaternary alluvium is both limited and un-
restricted in nature. In the western area of the locale the nature of ground water demonstrates a
decent to direct esteem. (Source: Geological Survey of India, 2002).
Table 2.1 Stratigraphic outline of the Vadodara District
Continental sediments – fluvial-marine,
fluvial and Aeolian
Quaternary
Marine and fluvial-marine sediments Tertiary
Unconformity
Basalts of the Deccan Trap with
associated differentiates and intrusive
bodies
Upper Cretaceous to
Lower Eocene
Unconformity
Marine, fluvial-marine and fluvial
sediments
Cretaceous
Unconformity
Crystalline rocks -Metasediments
associated with granite, gneiss and other
mafic rocks
Precambrian (Aravalli)
2.2.5 Soils:
The soils of Vadodara district can be broadly classified into three groups (i) black soils,
(ii) alluvial soils and (iii) hilly soils (Technical Bulletin- Revised (No. 11) – May 1992;
Agriculture Information, Directorate of Agriculture, Government of Gujarat, Ahmedabad.).
Terrains in the district are increasingly and less plain aside from a few slopes. Real piece
of the study area is secured by ordinary to direct prolific soil. Lion's share of Soil sorts in
Vadodara area are dark, yellowish, red and dark delicate. Real products in contemplate zone are
groundnut, cotton, bajri and gram.
The important soil in the region are (1) sandy topsoil, (2) besar and (3) dark. Sandy topsoil
soil which are found in the talukas of Vadodara, Padra and Savli are appropriate for the
development of bajra, tobacco and plantation crops. There is a lot of sub-soil water in sandy
topsoil zone which subsequently has an all-around grew part well water system framework, the
dark soil is an appropriate for development of cotton and is found in the talukas of Karjan, Sihor,

26
Vaghodia, Dabhoi and Sankheda. The sub soil water in these territories is not sufficient and at a
few spots it is saline. The staying three talukas in particular Chhota Udaipur, Jabugam and
Nasvadi have in a one-section dark soil and in another part blended soil. The land in these
territories in sprinkled with little slopes, waterways and gorges.Besar soil are formed by the
admixture of sandy loam and black cotton soil and are found in the whole of Padra taluka, part
of Vadodara, Savli, Jabugam and Vaghodia taluka and in a few villages of Sankheda taluka. The
soil of Vadodara district is mainly black soil. It covers about 3,44,030 hectares’ area and this type
of soil is found in Jetpur Pavi, Chhota-Udaipur, Naswadi, Sankheda, Dabhoi, Karjan and Sinor
talukas. It covers about 45 percent area in the district. Area of Savli, Vadodara, Vaghodia, part
of Dabhoi and Padra regions have sandy loam soil. Padra taluka has saline soil of 25801 hectares.
Soil of the mid plains is deep to very deep with slight slope towards west except in river borders
where it is undulating. Due to high clay content, moisture holding capacity is high and crakes
during dry seasons. Drainable character of mid lands varies from moderately well to poor at some
places and permeability is medium to very low. Due to improper water management practices
and water logging, secondary salinization is observed in mid plains. The soil of Vadodara
District in general possesses neutral to alkaline pH. Electricity conductivity is too low. Organic
carbon as well as Nitrogen content-low, Phosphorus- Mmedium, Potash is high. So, overall, the
soil fertility indices are good from the agriculture point of view.
Figure 2.4 Soil Map of Vadodara District (Source: CGWB Report)

27
2.2.6 Seismicity:
The Gujarat state can be partitioned comprehensively into four structural (Tectonic) zones
(i) The Saurashtra-Deccan Trap Plateau in the west. (ii) The Kutch-Ahmedabad-Surat belt in the
middle. (iii) The Banas Kantha-Sabar Kantha-Panch Mahals transformative volcanic landscape
in the upper east and the Ambadunagar – Rajpipla - Songadh Deccan Trap Plateau in the south -
east (iv) The zone of break frameworks agreeing with the course of the Narmada and the Tapi
streams in the south - east. The locale range falls under zone 3 in the National Zoning Atlas.
2.2.7 Hydrology:
In Vadodara district area, groundwater occurs both as unconfined and confined
conditions. Saturated zones of unconsolidated shallow alluvium and weathered zones, shallow
depth jointed and fractured rocks forms unconfined aquifers, whereas multilayered aquifer below
impervious clay horizons in alluvium formation and interflow zones of basalts, inter-trappean
beds, deep seated fracture zones, shear zones in basalts, granites and gneisses give rise to semi
confined to confined conditions. Generally, the water table follows topographic configuration.
The depth to water is greater in upland areas whereas in valley portion and shallow grounds, the
levels are very close to surface. In hilly terrain of eastern, north- east and south-east part of the
district, spring zones are seen in stream river section; also along the section of the Mahi, the
Narmada and the Orsang rivers. The piezometric surface, mainly in alluvium areas of western
half the district also follows the gentle gradient corresponding to subsurface configuration of
deep aquifer zones.
In major part of the district, in north and almost in eastern half of the district, the hard
rocks, such as phyllite, schist, granite, gneiss, basalt and other sediments such as sandstone,
limestone etc., form aquifers, whereas multilayered alluvium deposits form aquifer system in
remaining central, south-central and western half of the district. The weathered basalts, granite,
gneiss etc., covered by soil / muram and the valley fill & piedmont deposits forms potential
aquifer in the vicinity of rivers and on vast undulating plains adjacent to hilly terrain but their
28
regional continuity and extent are limited due to heterogeneous nature of deposits with limited
thickness and as such rarely exceed a few square kilometers.
Various types of dug wells (DW) are common to both alluvial / soft rock areas and also
in hard rock areas. In unconsolidated formation the depth of dug well is few meter to more than
25 m; while in hard rock areas, generally their depth depends upon weathering zone, through
which they have curbing and below it has naked zone. With declining water levels along with
rapid development, bore well of 30 to 90 m depth are drilled at bottom of dried up dug well
section and such well are termed as dug cum bore well (DCB well), are common in both
unconsolidated & consolidated formation of the district(CGWB). In consolidated rock units,
especially in Deccan Trap areas, horizontal bores at the bottom of the well, with gentle gradient
towards well are common. Large dia, collector type wells, generally for regional water supply or
for industrial uses are common in sandy beds of Mahi and Orsang rivers. To meet large demands
bore well / tube wells are common structures. There are shallow bore wells up to 60 to 80 m
depth both in consolidated and unconsolidated areas. Such bore well, in hard rock areas are
drilled for hand pump and also for irrigation purposes. In unconsolidated arrears, in areas of
Quaternary alluvial deposits having deep aquifer, deep tube wells up to 200 m depth are common.
2.2.8 Water Table:
The movement of ground water in general, from north-east highland to south-west and
western low lying Mahi River estuary zone. In north – east areas and also along area along Mahi
& Narmada River in west and south, the counters show effluent nature of all streams, rivulets
and rivers. The gradient is steep in eastern hilly terrain, a hard rock terrain. It becomes gentler
towards central and western part of semi-consolidated to un-consolidated formation areas.
2.2.9 Climate:
Generally, the climate of Vadodara district during a major part of the year is characterized
by a hot summer and humidity. During winter season, it is never too cold in the district with

29
temperature remaining over 10 degrees. January is the coldest month of the year, with the mean
daily maximum and minimum temperatures of
Table 2.2 Climatology of Vadodara District
Source: Indian Meteorological Department (IMD)
It is hot in the period from March to October with temperatures hovering over 35 °C, with little
respite during monsoon in June, which lasts till the end of September. May is the hottest month
of the year with the mean daily maximum and minimum temperatures of 40.7ºC and 26.1ºC
respectively.
During last ten years, the average rainfall has been recorded in the range of 1000 mm. Months
of October and November are considered as the post monsoon. Predominant wind direction
during winter season (October to April) is from North-east and North-west directions, whereas
during summers, wind blows mainly from West and South-West directions. (IMD)

30
Figure 2.5 Long Term Climatology of Rainfall, Maximum Temperature, Minimum
Temperature, Relative Humidity, and Evapotranspiration (IMD)
2.2.10 Agriculture:
The agriculture is said to be, "the gambling of the monsoon" as it is controlled by
monsoon rainfall which at several times are uncertain, irregular and uneven or unequal. Total
annual rainfall in the district occurs in three or four months, i.e. from June to September. Thus
irrigation for crop production during the rest eight months becomes very essential. Kharif season,
crops like Paddy, Cotton, pulses, and Maize are grown while Rabi crops grown are namely
Wheat, Tobacco, Sugarcane and Maize. In Summer Season mainly crops like groundnut and
Bajri are grown. Horticulture crops are mango, chikoo and tomatoes. The district is the largest
producer of pulses in Gujarat, contributing 14.7% to the total production. Vadodara is among
major fruit producing districts in the State, contributing 11.25 % to the total fruit production ß
The district is a major cultivator of flowers in the State, contributing 16% to the total production,
of them Mogra (33.8%) Marigold (18.3%) and Rose (14.2%) contribute a substantial share.
2.2.11 Irrigation
Both canal and well irrigation facilities are available in the district. The canal irrigation
water has 15.44 percent share while well irrigation contributes about 79.41 percent share of the
total irrigated area of the district. As far as underground water resources are concerned 79.41

31
percent of the total water of the district is utilized. Thus making the use of underground water for
crop production is risky. Therefore, check dams are necessary for the recharging of underground
water and also for minimizing run off water. In the district 665 check dams occupy about 4145
hectares. (Source: Irrigation in Gujarat 2011-12, Directorate of Economics and Statistics.)
2.2.12 Minerals:
Mineral reserves in the district include dolomite, fluoride, black trap, quartz, fluorspar,
agate, gravel, marble, graphite, manganese ore and granite. There are reserves of 7,200 lac tones
of dolomite and 116 lac tones of fluorspar lies in the district. The district accounts for as much
as 98 % of the total production of dolomite in Gujarat. Fluorspar is produced in Kwant tehsil.
The district is rich in minerals and in 1971 it was the State’s largest producer of dolomite.
Feldspar, fluorite, limestone, quartz and soapstone among the major minerals and granite (as
building stone), gravel, quartzite pebbles, kankar, marram, brick earth, ordinary clay and sand,
marble and trap, quartzite and sandstone (as road metal) among the minor minerals are also
commercially worked in the district. (Commissionerate of Geology and Mining). The district has
commercially workable deposits of calcite, manganese or petroleum and natural gas. Mineral
reserves include dolomite, fluoride, black trap, quartz, fluorspar, agate, gravel, marble, graphite,
manganese ore and granite. Dolomite (7,200 lakh tones reserves) and fluorspar (116 lakh tones
reserves) occur only in Vadodara. The district accounts for as much as 98% of the total
production of dolomite in Gujarat. Fluorite is produced in Kavant Taluka. (Statistical Abstract of
Gujarat)
2.2.13 Flora:
Out of the total area of the district, an area of about 741.48 sq. km is covered by forest.
Among them 697.24 sq. km are reserved forest, 5.70 sq. km are protected forest and 38.54 sq.
km are unclassified forest. It accounts for 9.77 percent of the total forest area of the state. The
forest area of the district constitutes 9.82 percent of total geographical area of the district. (Forest

32
Department 2010-2011) The main products of these forests are timber, seasum wood and fire
wood, Mahudo, Amala, Aritha etc. are the minor products
2.2.14 Wild Life:
Forest of Jambughoda sanctuary host habitat of many species among which the leopard
is the top predator here and other animal species include the sloth bears, blue bulls, jackals, wild
boars, four horned antelopes and a variety of reptiles.
2.3 Industrial economy
The industrial clusters include Chemicals & fertilizers, Pharmaceuticals, Biotechnology,
Cotton Textiles, Machine Tools, Glass, Engineering, Tobacco, Fisheries and Dairy. There are
over 18,000 small scale industrial units in Vadodara, in which repairs & services units are
maximum in numbers accounting nearly 5,713 units, 1,923 textiles, 1,615 metal works, 1,357
chemicals, 1,316 equipment’s\machinery, 1,145 rubber & its products, 1,047 food products and
3,840 are misc. units. Other key small scale industries include textiles, metal works, chemicals,
equipment, rubber products and food products etc.885 glass, ceramics & cement, 829 equipment
related to electricity, 753 papers & its products, 601 nonferrous metals, 543 leather, 173 tobaccos
and 56 are misc. units. 9. During the decade of 1988-1997 the key industries segment like
Chemicals, Boilers & Steam generating equipment and glass showed a major increase. The
growth of investments in Chemicals sector excluding fertilizers is almost 98 % over the last
decade 1988-1997. Other industry segments showing growth in investments include sugar,
vegetable oils, fermentation industries & transportation. During 1988-1997-decade maximum
investments were observed in Petrochemicals, Chemicals, Textiles, Plastics and
Pharmaceuticals. Of these, Pharmaceuticals and Chemicals were highly labour intensive and
created maximum employment opportunities. In the last decade 1997-2007 Chemicals and
Pharmaceuticals are also among the top five investment generating sectors. New sectors with
high investments during this period include Infrastructure, Glass and Transportation. The major
sectors which have witnessed maximum investments are Biotechnology and Chemicals &

33
Petrochemicals. Other key sectors are Engineering, Food & Agro, Tourism and Textiles &
Apparels. The Delhi-Mumbai Industrial Corridor passes through Vadodara resulted in a key
destination for attracting industrial investments. Vadodara is the exclusive producer of Dolomite
and Fluorspar in Gujarat offering scope for tremendous growth in the processing industries.
Several Government Companies like GSFC and GACL have their manufacturing plants in the
district. Gujarat‟s leading educational institutions are located in Vadodara offering skilled and
intellectual manpower in abundance quantity to the various industries and for R & D activities.
Proximity of the district with key industrial centers of Gujarat such as Ahmedabad, Bharuch and
Surat could be considered a major driver for growth of the economy. There thirteen Industrial
Estates Sankheda, Jetpur Pavi, Dabhoi, Ranoli (Autonagar), Limda, Por Ramangamdi, Nadesari,
Waghodia, Makarpura, PCC, Savli, Savli Biotech Park and Sehra are at present operating in the
district. Moreover, there are also three Special Economic Zones (SEZs) namely Savli SEZ,
Suzlon SEZ and Nipam Infrastructure Ltd.
2.4 Special Economic Zone
Gujarat has the distinction of being the first state to enact the Special Economic Zone
Act-2004. SEZs are growth engines that can boost manufacturing, augment exports and generate
employment. The Government has enacted Special Economic Zones Act -2004 in order to
provide hassle free operation regime and encompassing state of the art infrastructure and support
services. Board of approval in Ministry of Commerce and Industries, New Delhi has accorded
approvals to 60 SEZs in Gujarat at the end of March -2011. The Total proposed investment by
SEZ Developers is around Rs. 267373.45 crore. (Source: Industries in Gujarat-2010)
2.5 Connectivity and Communication
2.5.1 Road Network:
Vadodara is well connected to all major locations, such as Delhi (1028 km) and Mumbai
(448 km) through DMIC and N. H. 8. N. H. 8 also connects Vadodara with Ahmedabad (111

34
km), Rajkot (294 km), Ankleshwar (84 km) and Surat (167 km)-the major industrial centers of
Gujarat. State highway 6 connects the district with Ahmedabad, Surat, and Rajkot and other
districts. India‟s first National Expressway is located in Gujarat connecting Vadodara to
Ahmedabad (93 km).
Figure 2.6 connectivity of the region
2.5.2 Rail Network:
Vadodara is also well connected with all major locations such as Delhi and Mumbai, as well as
other districts of the State through a Broad Gauge railway line.
2.5.3 Air:
Vadodara city has its own domestic airport at Harni, which is well connected with four metro
cities in India such as Delhi, Mumbai, Chennai and Banglore.
2.5.4 Ports:
No sea port is in this district.
2.6 Demography

35
According to the 2011 Census, the total population of Vadodara district is 41, 65,626
comprising 21, 53,736 males and 20, 11,890 females. This population of the district is about 6.89
percent of the State population and rank at 3rd place among the 26 districts of the state. There
are 12 talukas in the district having 1,533 villages. Out of 1,533 villages 4 villages are
uninhabited. The total urban population in the district is spread over in 25 towns. Out of the total
population of the district 50.41 percent lives in rural areas, while 49.59 percent lives in urban
areas.
The total population of Vadodara taluka is higher than other talukas of the district. The
total population of Vadodara taluka is 48.2 % of the total population of the district. The total
population of Sinor taluka is lower than other talukas of the district. The total population of Sinor
taluka is 1.6 % of the total population of the district. According to the 2001 Census the total
population of the district was 3,641,802. There has been net addition of 523,824 persons during
2001- 2011. The decadal growth rate of district is 14.38 percent. The growth rates for the rural
and urban areas of the district are 5.22 and 25.48 percent respectively. The growth rate of urban
population is comparatively very high in the district. The highest growth of urban population has
taken place in Vadodara Taluka. Population is increased by 14.38 percent during the decade. The
density of population in Vadodara district is 552 per sq. km. against the State average of 308
persons. There are 934 females for every thousand males in Vadodara district.
Figure 2.6 Decennial Growth of Population (Source: CGWB Report)

36
The sex ratios for rural and urban areas of the district are 948 and 920 respectively. It is also
observed that the proportion of female in rural area is higher than that of urban areas. Among the
Taluka, the highest sex-ratio of 989 has been recorded in Chhota Udaipur taluka and the lowest
of 918 is recorded in Padra Taluka. In urban area also Chhota Udaipur has the highest sex ratio
of 968 and the lowest of 907 in Vaghodia Taluka.
The work participation rate is defined as percentage of total workers to total population.
In the same way it is defined for main workers and marginal workers. According to 2011 Census,
the total workers including main and marginal workers constitute 40.65 percent of the total
population of the district. Of the total workers the share of the main workers is 32.66 percent and
the marginal workers is 7.99 percent. The remaining population belongs to the category of non-
workers.
As per 2011 Census, among the main workers’ male participation rate in the district is
52.09 percent and corresponding proportion of female is 11.87 percent. Male and female
marginal workers account for 5.18 and 11 percent respectively. The proportion of female
marginal workers is substantially higher than males, as the females are attending to one or more
economic activities in addition to their household duties to enhance the family income.
2.7 Baroda: Through the Ages
The cultural history of Baroda begins somewhere in the mid-Pleistocene period [about 2,
00,000 years ago], when the early man lived on the banks of the Mahi river. There are evidences
of the existence of the Early Man of the Palaeolithic or Old Stone Age in the Mahi river valley
at a number of sites within 10 to 20 km to the north and north-east of present day Baroda
(Subbarao, B. 1952 Archaeological Exploration in the, Mahi valley., Jour. Baroda University,
Vol.I, Baroda, pp. 34-72)
Around the beginning of the Christian era [about 3 century A.D.], a small township
developed at the same spot as the above mentioned settlement on the right bank of the river.
Around 600 AD, a massive flood in Vishvamitri washed away Ankottaka; its inhabitants took

37
refuse in vadapadraka to the east and a little away from the Vishwamitri. The new settlement of
Vadapadraka (present day Kothi), that grew to the east around 600 AD, perhaps, brought the
development of Ankottaka to an end. Vadapadraka served the administrative centre during
Mauryan, Gupta and Chalukyan rule from 900AD to 1500AD. (Baroda through the ages. M.S.
University Archaeology, Series No.1. Baroda,) Subbarao, B.1953
The wall city of Kille e-Daulatabad was founded further east by the Muslims in 1511 AD.
Located on a plateau and inhabited by Hindus and Muslims, the city was square form with major
roads on east west and north-south axis and at cross junction the dominant institution of Mandvi
was located. The first expansion in 1650AD, was a planned growth to the south (present day
Wadi), mainly inhabited by Muslims. The rule of the Mughal Sultanate came to an end after the
Marathas took over the city and made it their capital in 1725AD, naming it Barode. After the
Treaty Bassein in 1802AD, the British became powerful and constituted themselves as arbitrator
in all transactions of the Gaekwads. They further consolidated their position around 1818AD
after their treatise with the Gaekwads. Subsequently, the establishment of the British Residency,
the Cantonment to the northwest, and the Railway station to the west took place.
The Maratha [Gaekwad’s] conquest of Baroda in 1734 was celebrated by the construction
of the Mandvi gate in 1736 by Malhara. Baroda was ruled by Fateh singh, who died in 1786.
Baroda began to experience the first aspects of urbanization during the rule of Sir Sayajirao
Gaekwad III (1875-1939 AD). Sayajirao III was a visionary and institution builder. Under his
able guidance, the princely state of Baroda became one of the most progressive states in the
country. With the accession of Sayajirao III, in 1875, a new chapter in the history of Baroda
began. In an era, which was marked by peace and order, there was great and constructive progress
in Baroda. The development took place towards the west of Sursagar Lake. In fact, there was
more development towards the west compared to the east and south. The western margin of
development was marked by the Vishwamitri River. (Mehta, 1971).

38
The construction of Ajwa Lake, another land-mark of Baroda was started in 1885 and
completed in 1890. The sole purpose was for the supply of drinking water to Baroda city. The
Surya River, a tributary of Vishwamitri was dammed up for this purpose, and the total capacity
of the reservoir was enough to cater to the needs of nearly 1, 16,420 citizens for 2000 years.
Ankotaka 2 BC‐300 AD Vadapadraka 900 AD‐1500AD
Figure 2.7a Baroda through ages (Source VUDA Report)

39
The catchment of Ajwa Lake lay in the Pavagadh hills, constituted by a series of lava
flows which had undergone magmatic differentiation.
In 1885, several small-scale textile industries came into existence on the western bank of
Vishwamitri River [west of the present railway yard]. It was during this year, that the
underground drainage system of the then existing Baroda city, was commissioned. In 1906, the
walls of the old Baroda fort were broken and connecting roads were made in all directions. The
area to the north of the present palace and residence of the former royal family, was covered by
thick vegetation. The present road connecting Sayajibaug [Kamati Baug] and Dandia Bazar, now
known as Indira Avenue, used to be a tree lined boulevard. In. 1907, the first commercial
building, Khanderao market was built. The city began to receive filtered water through pipelines
in 1894AD.The flow in the entire network was through gravity. Piped sewerage was put in place
in 1896AD. Surface runoff was directed to detention tanks interconnected by storm water drains.
Surplus water from the tanks was directed by underground tunnels to Sursagar. Water from
Sursagar was emptied into the river Vishwamitri when in excess.
In the period between 1907 and 1910, Baroda witnessed the setting up of the first major
industrial concern viz. Alembic Chemicals. In 1943, three large industrial concerns were
established viz. Sarabhai Chemicals, Alembic Glass and Jyoti Limited. These along with
Alembic Chemicals which was set up in 1909 were located on the banks of a small tributary of
the Vishwamitri River, to enable them to dispose-off their effluents easily.

40
Figure 2.7b Baroda state in 1909
In the process, the city witnessed major changes in physical, socio-cultural and economic
fronts. Among the consequent problems of industrialization were the growth in population,
housing, traffic and transportation, pollution, waste disposal and the like. The industrial growth
attracted many rural migrants to the city and Peri-urban areas. The population of Vadodara
Municipal Corporation (VMC) area has almost doubled in decades of 1971-81 and 1981-91 and
the Vadodara Urban Development Authority (VUDA) area population has shown increase of 25-
35 %. This has created tremendous pressure on the city’s infrastructure facilities like housing,
public transport, energy supply, water supply and sewerage facilities. Almost 70-80% of the
district industries are located in the VUDA Area.
The VUDA is spread over 564.56 square km, including a VMC area of 158 square km. The
VUDA area consists of Vadodara city, Vadodara Taluka and small portions of Padra and
Vaghodia Taluka. There are 105 villages in the VUDA area from the three talukas. Studies
2.8 Topography, Natural Drainage and water Bodies
Vadodara has a flat terrain, with five rivers i.e. Mahisagar in the north going along the
boundary of the VUDA whereas the Mini, Vishvamitri, Surya Jambuvai and the Dhadhar flowing
in the south. Apart from this there are smaller drains which cut-across the landscape and form
important part of the natural drainage system. Vadodara city has a general slope from east to west
and north to south.

41
2.9 Demographic Dynamics
2.9.1 Population Density
The density of population are most important factor which shows the pressure on the
resource, expressed as the number of people per unit of area. For the VUDA region higher rate
of density shown in city area whereas medium or low density shown in city peripheral and lowest
density shown in village or along to the VUDA boundary.
The density of population in city region was increased from 1981 to 2011. In 1981 it was
5000 to 8000l, 8000-10000 in 1991 and more than 10000 persons was increased in 2001 and
2011. The population density of Padra town has rapidly increased in 2011. (Figure 2.8) this also
suggest that the prospects of coming up of twin city cannot be declined.
Figure 2.8 Density of Population of VUDA Area
2.9.2 Sex Ratio
Sex ratio or gender ratio describe the number of females per 1000 of males. Sex ratio is
a valuable source for finding the population of women. (Census of India). The sex ratio in 1981
it’s about 800-900 in city and some peripheral villages. Simultaneously the villages and city area
sex ratio was increased from 1991 to 2011. About 900 to 1000 females was increased to per 1000

42
males in city and almost all surrounding villages besides Hinglot, Khatmba, Ajitpura, and
Kajapur these are the villages has more than 1000 sex ratio were shown in 2011. The skewed
ratio in the chani , ranoli nandesari villages are owing to the industrial characteristics and huge
influx of migrant workers.
Figure 2.9 Sex Ratio of VUDA Area
2.9.3 Literacy Rate
The literacy rate change from 1981 to 2011. About 60 % literacy shown in 1981. More
than 60% literacy rate was increased in city and some their peripheral village area in 1991 e.g
Jawaher nagar, Sikanderpura. Alomost 60 to 80 % of literacy rate has increased in 2001 then that
increasing trend is observed about more than 80% in city and most of the villages of VUDA
region in 2011.(Figure 2.10). Due to the education facilities and various government schemes for
uplifting the literacy rate to boost the growth and improve the socio-economic condition of the
people, has proved to be efficient.

43
Figure 2.10 Literacy Rate of VUDA Area
2.9.4 Worker Population
The worker demographic of the VUDA region are different according to the variation of
the work of people in various sector. It seems changes from the earlier to present year. The
scenario change with types of worker with their business. The VUDA region 1981 to 2011 census
data taken for the measuring or analyzing the changes in various sector especially in agriculture
field.
Percentage of worker to total population, percentage of agriculture marginal to total
population, percentage of agriculture sector to total population were calculated for 1981, 1991,
2001 and 2011 which shows the extreme changed in working sector and agriculture worker
sector.
Figure 2.8 shows the working population to total population was increasing from 1981 to
2011. In 1981 20-40 % worker population was identified, it has increased up to 10- 20 % because
of small new business were developed, agriculture sector field was utilize using new techniques,
this kind of activity happened along outer city region of the VUDA region, Continuously in year
of 2001 and 2011, the area of working sector has tremendously change, it increased more than

44
80 % of worker because of coming up of new non agrarian economy like service sector, industrial
sector and various types of the small scale business. This worker comes under the main worker
population.
Figure 2.11 Percentage of Worker to Total Population
2.9.5 Agriculture Marginal Worker
The Agriculture Marginal Workers are those workers who had not worked for the major
part of the reference period i.e. less than 6 months. (Census: Indian Economic Service). For the
VUDA region the agricultural marginal worker scenario has shown a change in a decade between
1991 and 2001. Agriculture marginal was stabled in from 1981 to 1991, it less than 20% marginal
population was include, whereas in year of 2001 and 2011 is increased in large scale, shows most
outer part of the Vadodara city. Sokhda, Asoj, Bhayli, Jaspur, Chandsad, Varnama these are the
villages shows more than 80% agriculture marginal worker (Figure 2.12). Industries, IT
companies, market sector, small homemade business are highly occupied in Vadodara city along
with Harni OG and Channi Villages, as the result lowest percentage of marginal population

45
identified over there in 2001 and 2011(Figure 2.12) this is due to inclusion in the city limits and
influence of the service sector economy of the city.
Figure 2.12 Percentage of Agriculture Marginal Worker
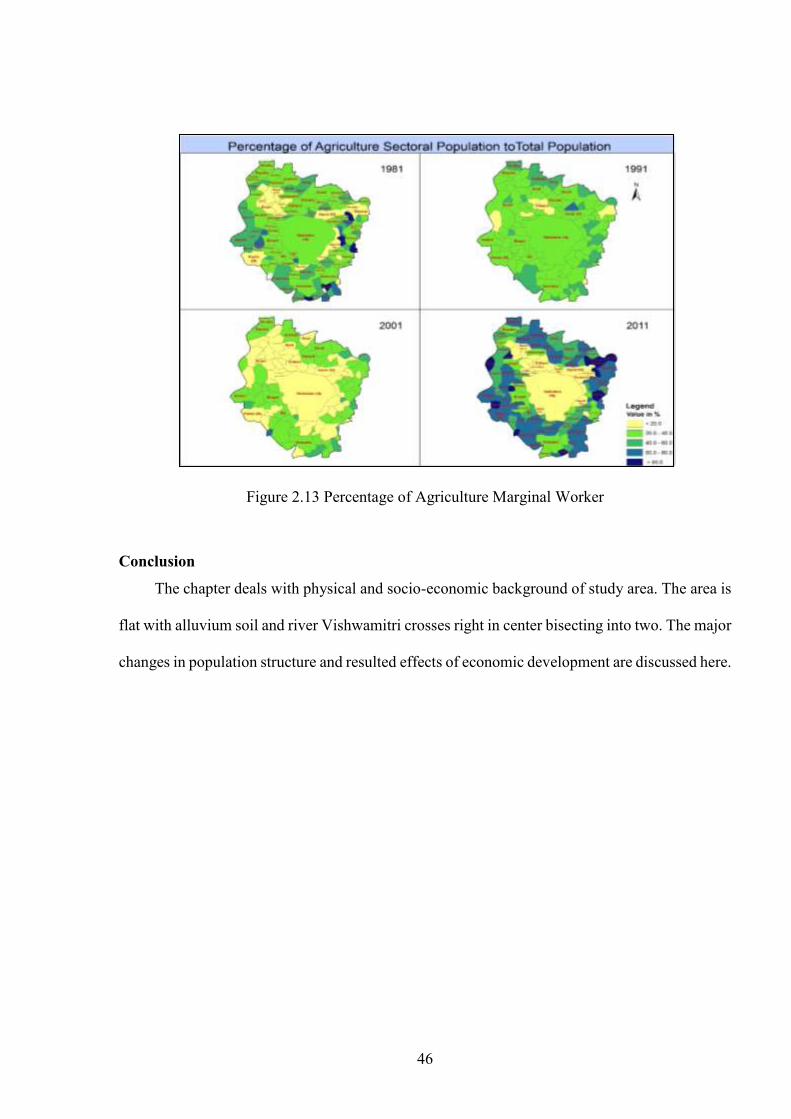
2.9.6 Agricultural Sector Population
Agricultural sector was developing day to day because of the new agriculture instruments,
irrigation techniques, water supply, modern seeds, which applied for the agriculture field as result
crop growth and various types of food was generated. In Figure 2.10 shows that, depending on
agriculture sector people to total population was increased from 1981 to 2011. Almost 20% -40%
population was involved in agriculture sector in 1981 and 1991, then percentage deceased in
some villages in 2001.
In 2011 again its ideally increased agriculture sector population with 60% to 80% (figure
2.13). Overall trend is seen in the form of the villages which the proximity to the industrial
regions and city had a lower values as which has differentiated the region from 1991 onwards.
The increase share of the workers are also attributed to the classification interval of the categories,
as the intervals were kept equal for the temporal comparisons.
46
Figure 2.13 Percentage of Agriculture Marginal Worker
Conclusion
The chapter deals with physical and socio-economic background of study area. The area is
flat with alluvium soil and river Vishwamitri crosses right in center bisecting into two. The major
changes in population structure and resulted effects of economic development are discussed here.
Copyright © 2022 FDOKUMEN