FORAGING DEPTHS OF SEA OTTERS AND IMPLICATIONS TO COASTAL MARINE COMMUNITIES
Upload
sorbonne-frCategory
view
0download
0
PRIMARY RESEARCH PAPER
Small-scale variability in the size structure of scleractiniancorals around Moorea, French Polynesia: patterns acrossdepths and locations
Mehdi Adjeroud Æ Morgan S. Pratchett ÆMarie C. Kospartov Æ Christophe Lejeusne ÆLucie Penin
Received: 6 March 2007 / Revised: 14 March 2007 / Accepted: 24 March 2007 / Published online: 13 June 2007� Springer Science+Business Media B.V. 2007
Abstract The size structure of coral populations
is influenced by biotic and physical factors, as well
as species-specific demographic rates (recruit-
ment, colony growth, mortality). Coral reefs
surrounding Moorea Island are characterized by
strong environmental gradients at small spatial
scales, and therefore, we expected that the size
structure of coral populations would vary greatly
at this scale. This study aimed at determining the
degree of spatial heterogeneity in the population
size structure of two coral taxa, Pocillopora
meandrina and massive Porites spp., among
depths (6, 12, and 18 m) and among locations
(Vaipahu, Tiahura and Haapiti) representing
different exposure to hydrodynamic forces. Our
results clearly underlined the strong heterogene-
ity in the size structure of both P. meandrina and
massive Porites spp., with marked variation
among depths and among locations. However,
the lack of any consistent and regular trends in
the size structure along depths or among loca-
tions, and the lack of correlation between size
structure and mean recruitment rates may suggest
that other factors (e.g., stochastic life history
processes, biotic interactions, and disturbances)
further modify the structure of coral populations.
We found that the size structure of P. meandrina
was fundamentally different to that of massive
Porites spp., reflecting the importance of life
history characteristics in population dynamics.
Keywords Coral reefs � Scleractinian corals �Spatial patterns � Population structure �Size-frequency distribution � Life histories
The abundance of scleractinian corals varies
greatly in time and space, and understanding
these patterns often requires an appreciation of
Handling editor: I. Nagelkerken
M. Adjeroud (&) � L. PeninEcole Pratique des Hautes Etudes, UMR 5244CNRS-EPHE-UPVD, Laboratoire ‘‘EcosystemesAquatiques Tropicaux et Mediterraneens’’, Universitede Perpignan, Avenue Paul Alduy, Perpignan Cedex66860, Francee-mail: [email protected]
M. Adjeroud � L. PeninCentre de Recherches Insulaires et Observatoire del’Environnement, Papetoai, Moorea BP 1013, FrenchPolynesia
M. S. PratchettARC Centre of Excellence for Coral Reef Studies,James Cook University, Townsville Q4811, Australia
M. C. KospartovCenter for Marine Studies, The University ofQueensland, St Lucia Q4072, Australia
C. LejeusneCentre Oceanologique de Marseille, UMR 6540,DIMAR, rue de la batterie des lions, 13007 Marseille,France
123
Hydrobiologia (2007) 589:117–126
DOI 10.1007/s10750-007-0726-2
spatial and temporal variation in population
dynamics (Connell et al., 1997; Hughes et al.,
1999). However, scleractinian corals are very
slow-growing and long-lived organisms, such that
traditional census techniques used to measure
demographic rates (e.g., following the fate of
individuals over time) require long-term studies
(see Connell et al., 1997). Alternatively, informa-
tion on population dynamics may be extracted
from data on age- or size structure of local
populations (Ebert, 1981; Sebens, 1983; Lewis,
1989; Barry & Tegner, 1990; Vermeij & Bak, 2002).
For colonial organisms, such as scleractinian
corals, ecological and demographic processes such
as growth, mortality and fecundity are strongly
correlated with colony size (Hughes & Jackson,
1980, 1985; Soong, 1993), and variation in the size
structure of coral populations has been used to
infer spatial patterns in their population dynamics
(e.g., Done, 1988; Bak & Meesters, 1998; Fong &
Glynn, 1998, 2001; Meesters et al., 2001).
Interpreting data on population size structure
of scleractinian corals and extracting meaningful
biological information can be difficult (Vermeij &
Bak, 2002). The size structure of coral popula-
tions is structured by a number of opposing
processes (e.g., recruitment rates versus whole
colony mortality, intrinsic growth rates versus
partial mortality) and different combinations of
demographic rates may produce essentially sim-
ilar size structures (Hughes & Jackson, 1980;
Hughes, 1984; Bak & Meesters, 1998). In general,
the size structure of coral populations is positively
skewed, where populations are comprised mainly
of smaller colonies and relatively few large
colonies (Hughes & Jackson, 1985; Babcock,
1991; Soong, 1993; Bak & Meesters, 1998). The
degree of skewness in coral populations varies
among species, reflecting differences in their
underlying life history characteristics (Hughes &
Jackson, 1985; Babcock, 1991) and most impor-
tantly, differences in their intrinsic growth rates
relative to probabilities of injury and mortality.
Size structure also varies among populations of
the same coral species, mostly due to differences
in disturbance regimes (Gilmour, 2004) and water
quality (e.g., nutrients and turbidity; Bak &
Meesters, 1999; Meesters et al., 2001; but see
Lewis, 1997). Although rarely considered, the size
structure of coral populations may also vary
among different reef habitats, independently of
water pollution (Vermeij & Bak, 2002).
The purpose of this study was to examine, for
the first time in the Central Pacific, small-scale
(within-reef) variation in the size structure of two
dominant groups of corals with highly contrasting
life history characteristics, Pocillopora meandrina
and massive Porites spp., among depths (6, 12,
and 18 m), and among locations (Vaipahu, Tiah-
ura and Haapiti) on outer reef slopes at Moorea
(17�30¢ S, 149�50¢ W), Society Islands, French
Polynesia. Pocillopora meandrina is characterized
by relatively high recruitment rates, fast-growth
rates and short generation time (Laboute, 1985;
Gleason 1996; Magalon et al., 2005; Adjeroud
et al., 2005, 2007). In contrast, massive Porites are
long-lived species with relatively low recruitment
rates and slow growth rates, but high resistance to
perturbations, long life duration and large colony
size (Gleason, 1996; Bessat et al., 1997; Adjeroud
et al., 2005, 2007; Penin et al., 2007). Several
species of massive Porites have been recorded
from reefs around Moorea, including P. austral-
iensis (Vaughan, 1918), P. lobata (Dana, 1846),
and P. lutea (Edwards and Haime 1851), which
are the dominant species on reef slopes. All
species of massive Porites, which cannot be
discriminated in situ, were pooled into a single
taxonomic group.
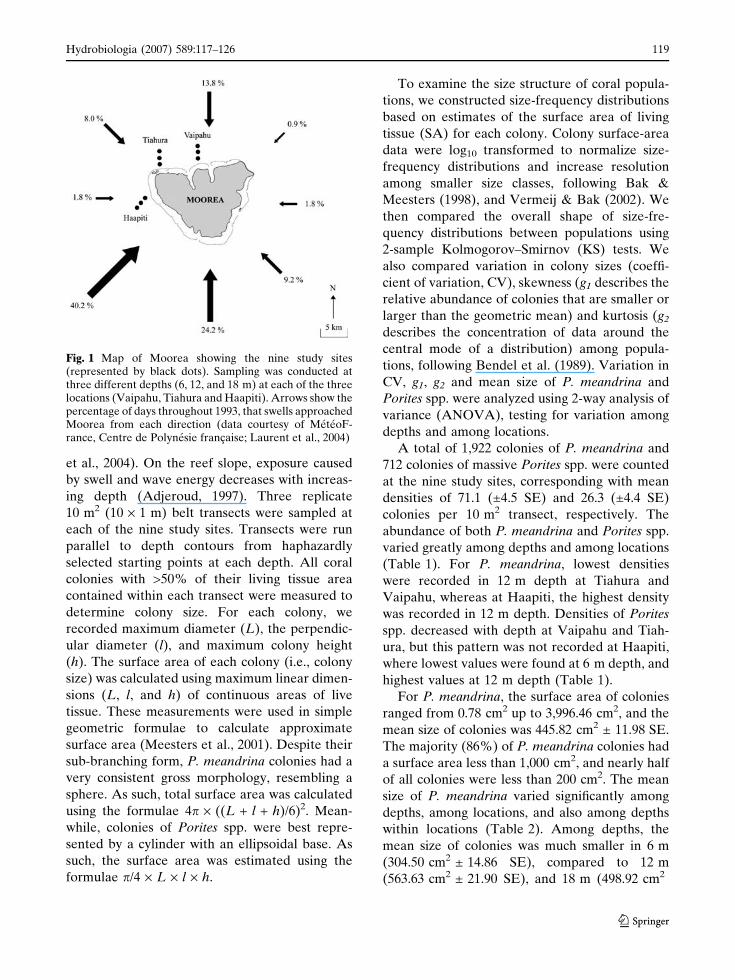
To explore spatial variation in size structure,
coral colonies of P. meandrina and massive
Porites spp. were measured in April–May 2001
along replicate belt transects at three different
depths (6, 12, and 18 m) at each of the three
locations (Vaipahu, Tiahura, and Haapiti), giving
nine study sites (Fig. 1). At each location, the
linear distance between depth sites was 50–70 m,
depending on the reef slope morphology. The
three locations vary greatly in their exposure to
hydrodynamic forces (Adjeroud, 1997; Laurent
et al., 2004; Fig. 1). Haapiti is the most exposed,
being directly exposed to south-western swells
which prevail throughout much of the year and
generate large swells and considerable wave
energy, whereas Vaipahu and Tiahura are shel-
tered from south-western swells, but are directly
exposed to the more moderate northern swells
which occur during summer months (Laurent
118 Hydrobiologia (2007) 589:117–126
123
et al., 2004). On the reef slope, exposure caused
by swell and wave energy decreases with increas-
ing depth (Adjeroud, 1997). Three replicate
10 m2 (10 · 1 m) belt transects were sampled at
each of the nine study sites. Transects were run
parallel to depth contours from haphazardly
selected starting points at each depth. All coral
colonies with >50% of their living tissue area
contained within each transect were measured to
determine colony size. For each colony, we
recorded maximum diameter (L), the perpendic-
ular diameter (l), and maximum colony height
(h). The surface area of each colony (i.e., colony
size) was calculated using maximum linear dimen-
sions (L, l, and h) of continuous areas of live
tissue. These measurements were used in simple
geometric formulae to calculate approximate
surface area (Meesters et al., 2001). Despite their
sub-branching form, P. meandrina colonies had a
very consistent gross morphology, resembling a
sphere. As such, total surface area was calculated
using the formulae 4p · ((L + l + h)/6)2. Mean-
while, colonies of Porites spp. were best repre-
sented by a cylinder with an ellipsoidal base. As
such, the surface area was estimated using the
formulae p/4 · L · l · h.
To examine the size structure of coral popula-
tions, we constructed size-frequency distributions
based on estimates of the surface area of living
tissue (SA) for each colony. Colony surface-area
data were log10 transformed to normalize size-
frequency distributions and increase resolution
among smaller size classes, following Bak &
Meesters (1998), and Vermeij & Bak (2002). We
then compared the overall shape of size-fre-
quency distributions between populations using
2-sample Kolmogorov–Smirnov (KS) tests. We
also compared variation in colony sizes (coeffi-
cient of variation, CV), skewness (g1 describes the
relative abundance of colonies that are smaller or
larger than the geometric mean) and kurtosis (g2
describes the concentration of data around the
central mode of a distribution) among popula-
tions, following Bendel et al. (1989). Variation in
CV, g1, g2 and mean size of P. meandrina and
Porites spp. were analyzed using 2-way analysis of
variance (ANOVA), testing for variation among
depths and among locations.
A total of 1,922 colonies of P. meandrina and
712 colonies of massive Porites spp. were counted
at the nine study sites, corresponding with mean
densities of 71.1 (±4.5 SE) and 26.3 (±4.4 SE)
colonies per 10 m2 transect, respectively. The
abundance of both P. meandrina and Porites spp.
varied greatly among depths and among locations
(Table 1). For P. meandrina, lowest densities
were recorded in 12 m depth at Tiahura and
Vaipahu, whereas at Haapiti, the highest density
was recorded in 12 m depth. Densities of Porites
spp. decreased with depth at Vaipahu and Tiah-
ura, but this pattern was not recorded at Haapiti,
where lowest values were found at 6 m depth, and
highest values at 12 m depth (Table 1).
For P. meandrina, the surface area of colonies
ranged from 0.78 cm2 up to 3,996.46 cm2, and the
mean size of colonies was 445.82 cm2 ± 11.98 SE.
The majority (86%) of P. meandrina colonies had
a surface area less than 1,000 cm2, and nearly half
of all colonies were less than 200 cm2. The mean
size of P. meandrina varied significantly among
depths, among locations, and also among depths
within locations (Table 2). Among depths, the
mean size of colonies was much smaller in 6 m
(304.50 cm2 ± 14.86 SE), compared to 12 m
(563.63 cm2 ± 21.90 SE), and 18 m (498.92 cm2
Fig. 1 Map of Moorea showing the nine study sites(represented by black dots). Sampling was conducted atthree different depths (6, 12, and 18 m) at each of the threelocations (Vaipahu, Tiahura and Haapiti). Arrows show thepercentage of days throughout 1993, that swells approachedMoorea from each direction (data courtesy of MeteoF-rance, Centre de Polynesie francaise; Laurent et al., 2004)
Hydrobiologia (2007) 589:117–126 119
123
± 25.02 SE). Moreover, the mean size of
P. meandrina at Vaipahu (396.42 cm2 ± 20.06
SE) was smaller than at Tiahura (552.64 cm2 ±
26.66 SE) or Haapiti (418.15 cm2 ± 17.11 SE).
For massive Porites spp., the mean size of
colonies (6,200.95 cm2 ± 1,958.77 SE) was much
higher than for P. meandrina. In 18 m depth at
Vaipahu and Haapiti, populations of Porites spp.
comprised relatively few, but very large (up to
1,067,316 cm2) colonies. By comparison, local
populations of Porites spp. comprised high den-
sities of relatively small (minimum size: 1.17 cm2,
but mostly <2,000 cm2) colonies in 6 m and 12 m.
There was a significant variation in the mean size
of Porites spp. among depths, but the patterns of
depth variation varied among locations (Table 2).
The mean colony size of Porites spp. increased
consistently with increasing depth at Vaipahu and
Haapiti, but this trend was not observed at Tiahura
(Table 1). Among depths, the mean size of Porites
spp. was greatly reduced at 12 m (1,477.85 cm2 ±
270.05 SE) and 6 m (2,581.76 cm2 ± 397.73 SE),
compared to 18 m (35,383.92 cm2 ± 15,124.36
SE). The mean size recorded at Tiahura
(2,968.30 cm2 ± 563.10 SE) was much smaller
than at Haapiti (5,865.40 cm2 ± 2,798.70 SE) and
Vaipahu (8,040.10 cm2 ± 3,771.98 SE).
Overall size-frequency distributions for both
P. meandrina and massive Porites spp. were
strongly and positively skewed, with a prepon-
derance of colonies in the smallest size-classes
(Fig. 2a, 3a). For P. meandrina, log-transformation
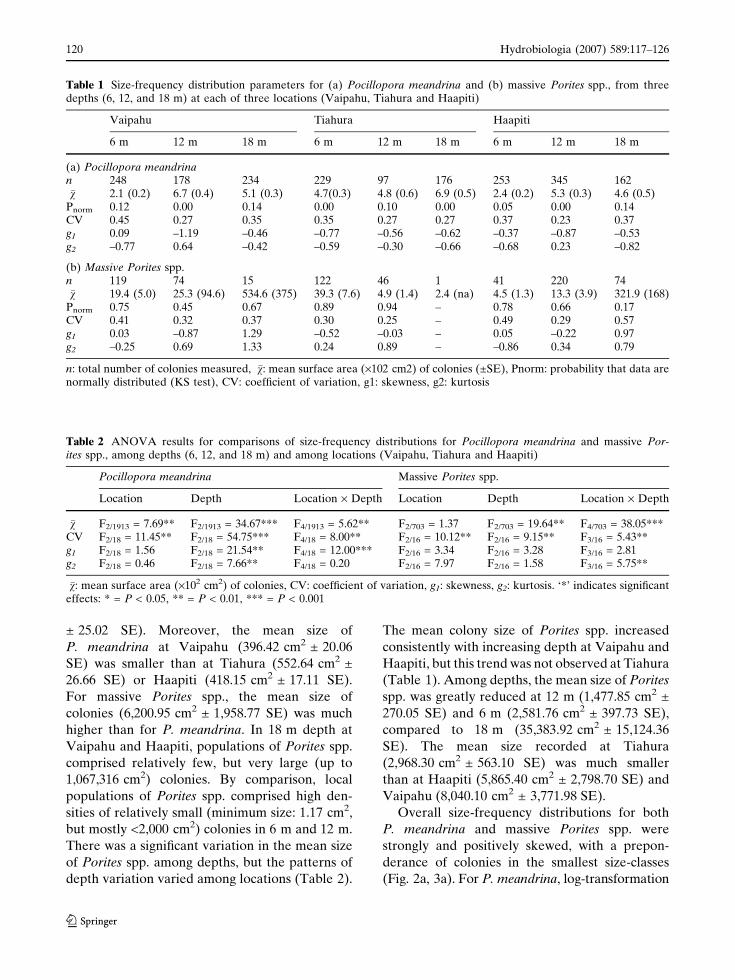
Table 1 Size-frequency distribution parameters for (a) Pocillopora meandrina and (b) massive Porites spp., from threedepths (6, 12, and 18 m) at each of three locations (Vaipahu, Tiahura and Haapiti)
Vaipahu Tiahura Haapiti
6 m 12 m 18 m 6 m 12 m 18 m 6 m 12 m 18 m
(a) Pocillopora meandrinan 248 178 234 229 97 176 253 345 162�v 2.1 (0.2) 6.7 (0.4) 5.1 (0.3) 4.7(0.3) 4.8 (0.6) 6.9 (0.5) 2.4 (0.2) 5.3 (0.3) 4.6 (0.5)
Pnorm 0.12 0.00 0.14 0.00 0.10 0.00 0.05 0.00 0.14CV 0.45 0.27 0.35 0.35 0.27 0.27 0.37 0.23 0.37g1 0.09 –1.19 –0.46 –0.77 –0.56 –0.62 –0.37 –0.87 –0.53g2 –0.77 0.64 –0.42 –0.59 –0.30 –0.66 –0.68 0.23 –0.82
(b) Massive Porites spp.n 119 74 15 122 46 1 41 220 74�v 19.4 (5.0) 25.3 (94.6) 534.6 (375) 39.3 (7.6) 4.9 (1.4) 2.4 (na) 4.5 (1.3) 13.3 (3.9) 321.9 (168)
Pnorm 0.75 0.45 0.67 0.89 0.94 – 0.78 0.66 0.17CV 0.41 0.32 0.37 0.30 0.25 – 0.49 0.29 0.57g1 0.03 –0.87 1.29 –0.52 –0.03 – 0.05 –0.22 0.97g2 –0.25 0.69 1.33 0.24 0.89 – –0.86 0.34 0.79
n: total number of colonies measured, �v: mean surface area (·102 cm2) of colonies (±SE), Pnorm: probability that data arenormally distributed (KS test), CV: coefficient of variation, g1: skewness, g2: kurtosis
Table 2 ANOVA results for comparisons of size-frequency distributions for Pocillopora meandrina and massive Por-ites spp., among depths (6, 12, and 18 m) and among locations (Vaipahu, Tiahura and Haapiti)
Pocillopora meandrina Massive Porites spp.
Location Depth Location · Depth Location Depth Location · Depth
�v F2/1913 = 7.69** F2/1913 = 34.67*** F4/1913 = 5.62** F2/703 = 1.37 F2/703 = 19.64** F4/703 = 38.05***CV F2/18 = 11.45** F2/18 = 54.75*** F4/18 = 8.00** F2/16 = 10.12** F2/16 = 9.15** F3/16 = 5.43**g1 F2/18 = 1.56 F2/18 = 21.54** F4/18 = 12.00*** F2/16 = 3.34 F2/16 = 3.28 F3/16 = 2.81g2 F2/18 = 0.46 F2/18 = 7.66** F4/18 = 0.20 F2/16 = 7.97 F2/16 = 1.58 F3/16 = 5.75**
�v: mean surface area (·102 cm2) of colonies, CV: coefficient of variation, g1: skewness, g2: kurtosis. ‘*’ indicates significanteffects: * = P < 0.05, ** = P < 0.01, *** = P < 0.001
120 Hydrobiologia (2007) 589:117–126
123

of colony surface area greatly increased centering
of the size-frequency distribution around the
mean (Fig. 2b), though the log-transformed dis-
tributions were deviated significantly from nor-
mality (KS test, P < 0.01). After transformation,
the distribution was actually negatively skewed
(g1 = –0.59) and platikurtic or flattened
(g2 = –0.55). The overall size-frequency distribu-
tion of Porites spp. was found to be normal (KS
test, P = 0.81), but slightly positively skewed
(g1 = 0.07) and highly leptokurtic (g2 = 0.43).
The overall size-frequency distribution for P.
meandrina was significantly different to that of
Porites spp. (KS test, P < 0.01).
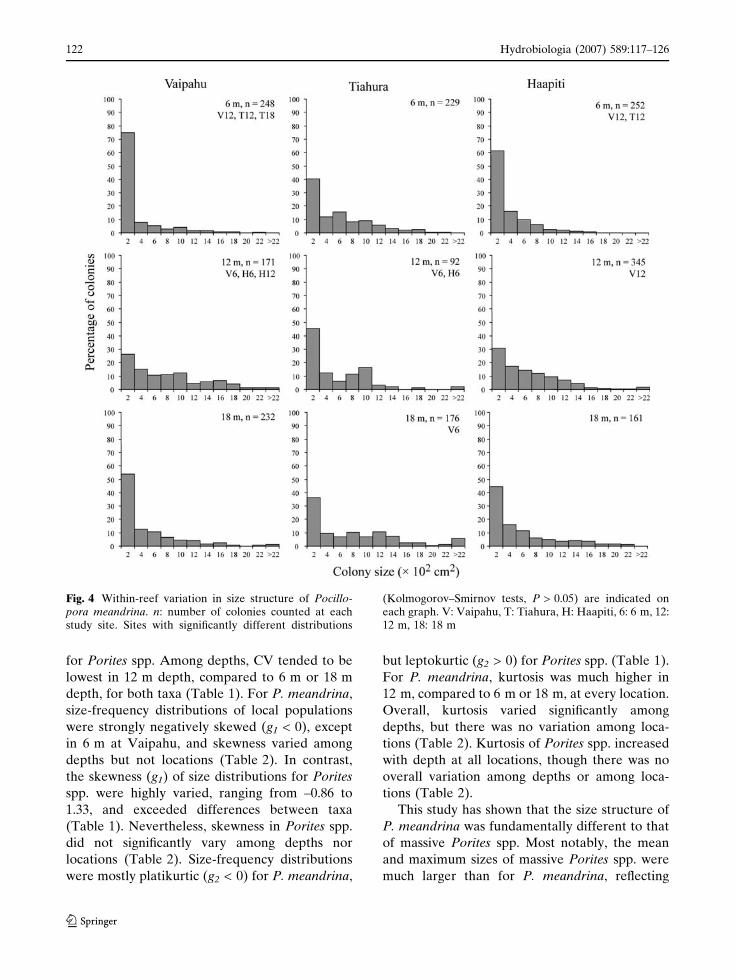
Within taxa, size-frequency distributions varied
among depths and among locations. For example,
strong differences in size-frequency distributions
of P. meandrina occurred at Vaipahu, between
populations in 6 m vs. 12 m (Fig. 4). Size-fre-
quency distributions of P. meandrina were mostly
significantly different from normality (Table 1),
and the proportion of colonies in the smallest
size-class (< 200 cm2) varied greatly among depths
and among locations, ranging from 26% to 75%. In
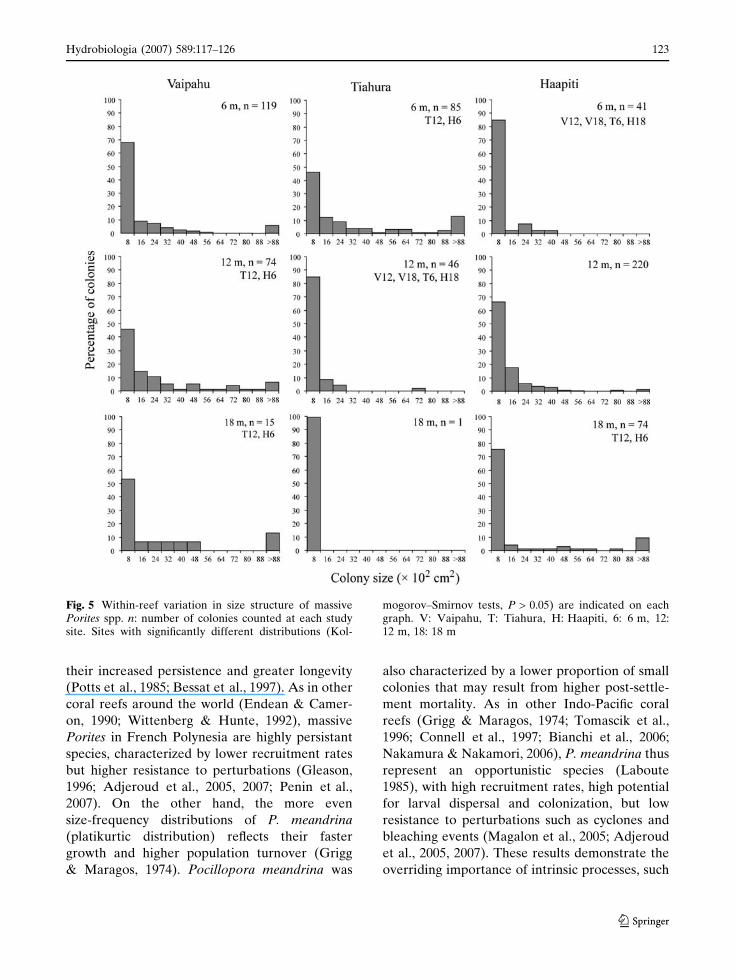
contrast, size-frequency distributions of Porites
spp. populations were all normal (Table 1). For
Porites spp., the typical size-frequency distribution
(e.g., in 6 m at Vaipahu) comprised large numbers
of very small (< 800 cm2) as well as few large
colonies (up to 1,067,316 cm2). However, in 12 m
at Tiahura and in 6 m at Haapiti, the largest
colonies of Porites spp. were only 6,446 cm2 and
3,534 cm2, respectively, and virtually all colonies
were less than 800 cm2 (Fig. 5).
Significant spatial variation in size-frequency of
P. meandrina and massive Porites spp. was also
apparent from comparisons of coefficient of
variation (CV), skewness (g1) and kurtosis (g2;
Table 1). At Moorea, CV was very similar
between P. meandrina (0.34) and Porites spp.
(0.37). ANOVA revealed that CV varied signif-
icantly among locations, among depths, and also
among depths within locations, for both taxa
(Table 2). Among locations, CV was highest at
Vaipahu for P. meandrina, but highest at Haapiti
Fig. 2 Size structure for Pocillopora meandrina at Moo-rea. Size-frequency distributions are shown for (a) un-transformed estimates of colony surface area and (b)log10 transformed estimates of colony surface area. Datawere pooled across depths and locations. n = 1,922colonies
Fig. 3 Size structure for massive Porites spp. at Moorea.Size-frequency distributions are shown for (a) untrans-formed estimates of colony surface area and (b) log10
transformed estimates of colony surface area. Data werepooled across depths and locations. n = 712 colonies
Hydrobiologia (2007) 589:117–126 121
123
for Porites spp. Among depths, CV tended to be
lowest in 12 m depth, compared to 6 m or 18 m
depth, for both taxa (Table 1). For P. meandrina,
size-frequency distributions of local populations
were strongly negatively skewed (g1 < 0), except
in 6 m at Vaipahu, and skewness varied among
depths but not locations (Table 2). In contrast,
the skewness (g1) of size distributions for Porites
spp. were highly varied, ranging from –0.86 to
1.33, and exceeded differences between taxa
(Table 1). Nevertheless, skewness in Porites spp.
did not significantly vary among depths nor
locations (Table 2). Size-frequency distributions
were mostly platikurtic (g2 < 0) for P. meandrina,
but leptokurtic (g2 > 0) for Porites spp. (Table 1).
For P. meandrina, kurtosis was much higher in
12 m, compared to 6 m or 18 m, at every location.
Overall, kurtosis varied significantly among
depths, but there was no variation among loca-
tions (Table 2). Kurtosis of Porites spp. increased
with depth at all locations, though there was no
overall variation among depths or among loca-
tions (Table 2).
This study has shown that the size structure of
P. meandrina was fundamentally different to that
of massive Porites spp. Most notably, the mean
and maximum sizes of massive Porites spp. were
much larger than for P. meandrina, reflecting
Fig. 4 Within-reef variation in size structure of Pocillo-pora meandrina. n: number of colonies counted at eachstudy site. Sites with significantly different distributions
(Kolmogorov–Smirnov tests, P > 0.05) are indicated oneach graph. V: Vaipahu, T: Tiahura, H: Haapiti, 6: 6 m, 12:12 m, 18: 18 m
122 Hydrobiologia (2007) 589:117–126
123
their increased persistence and greater longevity
(Potts et al., 1985; Bessat et al., 1997). As in other
coral reefs around the world (Endean & Camer-
on, 1990; Wittenberg & Hunte, 1992), massive
Porites in French Polynesia are highly persistant
species, characterized by lower recruitment rates
but higher resistance to perturbations (Gleason,
1996; Adjeroud et al., 2005, 2007; Penin et al.,
2007). On the other hand, the more even
size-frequency distributions of P. meandrina
(platikurtic distribution) reflects their faster
growth and higher population turnover (Grigg
& Maragos, 1974). Pocillopora meandrina was
also characterized by a lower proportion of small
colonies that may result from higher post-settle-
ment mortality. As in other Indo-Pacific coral
reefs (Grigg & Maragos, 1974; Tomascik et al.,
1996; Connell et al., 1997; Bianchi et al., 2006;
Nakamura & Nakamori, 2006), P. meandrina thus
represent an opportunistic species (Laboute
1985), with high recruitment rates, high potential
for larval dispersal and colonization, but low
resistance to perturbations such as cyclones and
bleaching events (Magalon et al., 2005; Adjeroud
et al., 2005, 2007). These results demonstrate the
overriding importance of intrinsic processes, such
Fig. 5 Within-reef variation in size structure of massivePorites spp. n: number of colonies counted at each studysite. Sites with significantly different distributions (Kol-
mogorov–Smirnov tests, P > 0.05) are indicated on eachgraph. V: Vaipahu, T: Tiahura, H: Haapiti, 6: 6 m, 12:12 m, 18: 18 m
Hydrobiologia (2007) 589:117–126 123
123
as reproductive strategies and colony growth, in
structuring coral populations (Hughes & Jackson,
1985; Bak & Meesters, 1999; Meesters et al.,
2001).
This study has also shown that the size struc-
ture of coral populations can vary enormously
over relatively small spatial scales, within reefs.
Variation in the size structure of P. meandrina
and Porites spp. at Moorea was much greater than
for any of the 11 species studied by Meesters
et al. (2001), in which spatial variation in size
structure of populations was attributed to heavy
urbanization, and associated environmental deg-
radation at some locations. Locations selected in
the present study were far removed from sites of
heavy urbanization and there were no obvious
direct anthropogenic impacts (dredging, construc-
tion activities, sewage discharge) at any of the
sampling locations (Adjeroud et al., 2002). Thus,
our results underlined that large differences in the
population size structures may be independent of
any major differences in environmental degrada-
tion (cf. Meesters et al., 2001), and suggest that
researchers must be very cautious when inter-
preting differences in size-frequency distributions
among coral populations in different locations or
over time.
While there was significant spatial variation in
the size structure of both P. meandrina and
massive Porites spp., we failed to detect any clear
and regular patterns of variation among depths
for the three locations examined, as well as no
consistent differences between exposed (Haapiti)
and less exposed locations (Tiahura and Vai-
pahu). This lack of any consistent trends may
suggest that other factors (e.g., stochastic life
history processes, biotic interactions, and distur-
bances) further modify the structure of coral
populations. Spatial variation in the size structure
of corals may also be caused by variation in rates
of recruitment, colony growth, injury and/or
mortality, all of which can vary over relatively
small spatial scales (Baird & Hughes, 1997).
Strong heterogeneity in rates of recruitment was
found among the nine study sites around Moorea,
with significant variation across depths and loca-
tions (Adjeroud et al., 2007). However, we failed
to detect any correlation between recruitment
rates (annual or seasonal mean rates) and
size-frequency distribution parameters for the
two taxa examined (Pearson correlation coeffi-
cient, P > 0.01).
Variation in the size structure of local coral
populations has important implications for the
subsequent fate (persistence and resilience) of
taxa in different reef environments (Done, 1988).
Since fecundity is positively correlated to colony
size (e.g., Hughes & Jackson, 1985; Babcock,
1991), populations comprised entirely of small
colonies would be less likely to reproduce and
persist through time, compared to populations
comprising large numbers of colonies with high
reproductive output. In this study, we found that
some localized populations comprise many large
colonies, and probably make a disproportionate
contribution to reproductive output, compared to
other populations that are comprised exclusively
of small, and probably non-reproductive, colo-
nies. At the scale of 10s to 100s of kilometers,
dispersal of larvae may provide continual input of
new recruits, as found for P. meandrina in French
Polynesia (Magalon et al., 2005) and thus, facil-
itate the occurrence of corals in even the most
marginal reef environments (Meesters et al.,
2001). It is important, therefore, to consider
population dynamics, and not just patterns of
abundance, when studying ecological processes
(e.g., disturbances) and their effects on popula-
tions. Multi-scale studies of population size struc-
tures may provide valuable insights into the scale
at which ecological processes affect populations
(e.g., Done, 1988; Bak & Meesters, 1999).
Acknowledgements This manuscript was greatlyimproved following discussions with DC Afzal, AHBaird, RPM Bak and TP Hughes, and critical commentsmade by anonymous reviewers. This research wassupported by grants from the Plan Pluri FormationEPHE, from ‘‘La Fondation d’Entreprise Total’’, fromthe Ministere de l’Outre-Mer, and from the ResearchProgrammes BioAqua (Delegation a la Recherche de laPolynesie francaise, DRRT, ANR) and CoralDiv (ANR).
References
Adjeroud, M., 1997. Factors influencing spatial patterns oncoral reefs around Moorea, French Polynesia. MarineEcology Progress Series 159: 105–119.
Adjeroud, M., D. Augustin, R. Galzin & B. Salvat, 2002.Natural disturbances and interannual variability of
124 Hydrobiologia (2007) 589:117–126
123
coral communities on the outer slope of Tiahura(Moorea, French Polynesia): 1991–1997. MarineEcology Progress Series 237: 121–131.
Adjeroud, M., Y. Chancerelle, M. Schrimm, T. Perez, D.Lecchini, R. Galzin & B. Salvat, 2005. Detecting theeffects of natural disturbances on coral assemblages inFrench Polynesia: a decade survey at multiple scales.Aquatic Living Resources 18: 111–123.
Adjeroud, M., L. Penin & A. Carroll, 2007. Spatio-tem-poral heterogeneity in coral recruitment aroundMoorea, French Polynesia: implications for popula-tion maintenance. Journal of Experimental MarineBiology and Ecology 341: 204–218.
Babcock, R. C., 1991. Comparative demography of threespecies of scleractinian corals using age- and size-dependent classifications. Ecological Monographs 61:225–244.
Baird, A. H. & T. P. Hughes, 1997. Spatial variation incoral recruitment around Lizard Island. Proceedingsof the 8th International Coral Reef Symposium 2:1207–1210.
Bak, R. P. M. & E. H. Meesters, 1998. Coral populationstructure: the hidden information of colony size-fre-quency distributions. Marine Ecology Progress Series162: 301–306.
Bak, R. P. M. & E. H. Meesters, 1999. Population structureas a response of coral communities to global change.American Zoologist 39: 56–65.
Barry, J. P. & M. J. Tegner, 1990. Inferring demographicprocesses from size-frequency distributions: simplemodels indicate specific patterns of growth and mor-tality. Fishery Bulletin US 88: 13–19.
Bendel, R. B., S. S. Higgins, J. E. Teberg & P. A. Pyke,1989. Comparison of skewness coefficient, coefficientof variation and Gini coefficient as inequality mea-sures within populations. Oecologia 78: 394–400.
Bessat, F., M. Boiseau, A. Juillet-Leclerc, D. Buigues & B.Salvat 1997. Tomodensimetrie et mesures du rapportisotopique 18O/16O sur Porites lutea a Mururoa (Po-lynesie francaise): une nouvelle approche pour ap-prehender l’influence du rayonnement sur lacroissance corallienne annuelle. Comptes Rendus del’Academie des Sciences de Paris, Sciences de la Vie320: 659–665.
Bianchi, C. N., C. Mori, M. Pichon, F. Benzoni, P. Col-antoni, G. Baldelli & M. Sandrini, 2006. Dynamicsand pattern of coral recolonization following the 1998bleaching event in the reefs of the Maldives. Pro-ceedings of the 10 th International Coral Reef Sym-posium, 30–37.
Connell, J. H., T. P. Hughes & C. C. Wallace, 1997. A30-year study of coral abundance, recruitment, anddisturbance at several scales in space and time. Eco-logical Monographs 67: 461–488.
Done, T. J., 1988. Simulation of recovery of pre-distur-bance size structure in populations of Porites speciesdamaged by the crown of thorns starfish Acanthasterplanci. Marine Biology 100: 51–61.
Ebert, T. A., 1981. Estimating mortality from growthparameters and a size distribution when recruitment isperiodic. Limnology and Oceanography 26: 764–769.
Endean, R. & A. M. Cameron, 1990. Acanthaster plancipopulation outbreaks. In Dubinsky, Z. (ed.), CoralReefs. Elsevier, Amsterdam, 419–437.
Fong, P. & P. W. Glynn, 1998. A dynamic size-structuredpopulation model: does disturbance control sizestructure of a population of the massive coral Gar-dineroseris planulata in the Eastern Pacific? MarineBiology 130: 663–674.
Fong, P. & P. W. Glynn, 2001. Population abundance andsize-structure of an eastern tropical Pacific reef coralafter the 1997–98 ENSO: a simulation model predictsfield measures. Bulletin of Marine Science 69: 187–202.
Gilmour, J. P., 2004. Size-structures of populations of themushroom coral Fungia fungites: the role of distur-bance. Coral Reefs 23: 493–504.
Gleason, M. G., 1996. Coral recruitment in Moorea,French Polynesia: the importance of patch type andtemporal variation. Journal of Experimental MarineBiology and Ecology 207: 79–101.
Grigg, R. W. & J. E. Maragos, 1974. Recolonization ofhermatypic corals on submerged lava flows in Hawaii.Ecology 55: 387–395.
Hughes, T. P., 1984. Population dynamics based on indi-vidual size rather than age: a general model with areef coral example. American Naturalist 123: 778–795.
Hughes, T. P. & J. B. C. Jackson, 1980. Do corals lie abouttheir age? Some demographic consequences of partialmortality, fission and fusion. Science 209: 713–714.
Hughes, T. P. & J. B. C. Jackson, 1985. Populationdynamics and life histories of foliaceous corals. Eco-logical Monographs 55: 141–166.
Hughes, T. P., A. H. Baird, E. A. Dinsdale, N. A. Molts-chaniwskyj, M. S. Pratchett, J. E. Tanner & B. L.Willis, 1999. Patterns of recruitment and abundanceof corals along the Great Barrier Reef. Nature 397:59–63.
Laboute, P., 1985. Evaluation des degats causes par lespassages des cyclones de 1982–1983 en Polynesiefrancaise sur les pentes externes des atolls de Tikehauet de Takapoto (Archipel des Tuamotu). Proceedingsof the 5th International Coral Reef Congress 3: 323–329.
Laurent, V., K. Maamaatuaiahutapu, J. Maiau & P. Var-ney, 2004. Atlas climatologique de la Polynesiefrancaise. MeteoFrance, Papeete.
Lewis, J. B., 1989. Spherical growth in the coral Siderastrearadians (Pallas) and its survival in disturbed habitats.Coral Reefs 7: 161–167.
Lewis, J. B., 1997. Abundance, distribution and partialmortality of the massive coral Siderastrea siderea ondegrading coral reefs at Barbados, West Indies.Marine Pollution Bulletin 34: 622–627.
Magalon, H., M. Adjeroud & M. Veuille, 2005. Patterns ofgenetic variation do not correlate with geographicaldistance in the reef-building coral Pocilloporameandrina in the South Pacific. Molecular Ecology 14:1861–1868.
Meesters, E. H., M. Hilterman, E. Kardinaal, M. Keetman,M. de Vries & R. P. M. Bak, 2001. Colony size-fre-quency distributions of scleractinian coral popula-
Hydrobiologia (2007) 589:117–126 125
123
tions: spatial and interspecific variation. MarineEcology Progress Series 209: 43–54.
Nakamura, T. & T. Nakamori, 2006. Population dynamicsof hermatypic coral communities on reef slope vs. reefflat at Shiraho, Ishigaki Island, southwest Japan.Proceedings of the 10th International Coral ReefSymposium, 460–477.
Penin, L., M. Adjeroud, M. Schrimm & H. S. Lenihan,2007. High spatial variability in coral bleachingaround Moorea (French Polynesia): patterns acrosslocations and water depths. Comptes Rendus deBiologies 330: 171–181.
Potts, D. C., T. J. Done, P. J. Isdale & D. A. Fisk, 1985.Dominance of a coral community by the genusPorites (Scleractinia). Marine Ecology Progress Series23: 79–84.
Sebens, K. P., 1983. Structure and growth rates in popula-tions of colonial and solitary invertebrates. In Reaka,
M. L. (ed.), The Ecology of Deep and Shallow CoralReefs, Vol. 1(1). NOAA Undersea Research Program,9–15.
Soong, K., 1993. Colony size as a species character inmassive reef corals. Coral Reefs 12: 77–83.
Tomascik, T., R. van Woesik & A. J. Mah, 1996. Rapidcoral colonization of a recent lava flow following avolcanic eruption, Banda Islands, Indonesia. CoralReefs 15: 169–175.
Vermeij, M. J. A. & R. P. M. Bak, 2002. Inferring demo-graphic processes from population size structure incorals. Proceedings of the 9th International CoralReef Symposium 1: 598–593.
Wittenberg, M. & W. Hunte, 1992. Effects of eutrophisationand sedimentation on juvenile corals. I. Abundance,mortality and community structure. Marine Biology112: 131–138.
126 Hydrobiologia (2007) 589:117–126
123
Copyright © 2022 FDOKUMEN