Nomenclatural Notes on Garcinia (Clusiaceae) from Madagascar and The Comoros
Upload
independentCategory
view
3download
0
ORIGINAL ARTICLE
Austronesian genetic signature in East African Madagascarand Polynesia
M. Regueiro Æ S. Mirabal Æ H. Lacau Æ J. L. Caeiro ÆR. L. Garcia-Bertrand Æ R. J. Herrera
Received: 22 August 2007 / Accepted: 6 November 2007 / Published online: 14 December 2007
� The Japan Society of Human Genetics and Springer 2007
Abstract The dispersal of the Austronesian language
family from Southeast Asia represents the last major
diaspora leading to the peopling of Oceania to the East and
the Indian Ocean to the West. Several theories have been
proposed to explain the current locations, and the linguistic
and cultural diversity of Austronesian populations. How-
ever, the existing data do not support unequivocally any
given migrational scenario. In the current study, the genetic
profile of 15 autosomal STR loci is reported for the first
time for two populations from opposite poles of the Aus-
tronesian range, Madagascar at the West and Tonga to the
East. These collections are also compared to geographi-
cally targeted reference populations of Austronesian
descent in order to investigate their current relationships
and potential source population(s) within Southeast Asia.
Our results indicate that while Madagascar derives 66.3%
of its genetic makeup from Africa, a clear connection
between the East African island and Southeast Asia can be
discerned. The data suggest that although geographic
location has influenced the phylogenetic relationships
between Austronesian populations, a genetic connection
that binds them beyond geographical divides is apparent.
Keywords Austronesian expansion � Madagascar �Tonga � Samoa � Autosomal STRs
Introduction
The Austronesian diaspora is believed to have been initi-
ated by the migration of the Lapita peoples from Taiwan
around 5,500 years ago, who settled throughout Southeast
Asia, the Pacific and Madagascar in the Indian Ocean just
off the coast of East Africa. According to Ruhlen (1994)
this oceanic transversal postdates the migration of Neo-
lithic farmers from southern China (8,000 BP), who
ventured across the Strait of Formosa and into Taiwan.
Two main theories have been proposed to explain the
Austronesian dispersal to Southeast Asia and the Pacific:
the ‘‘entangled-bank’’ and ‘‘express-train’’ hypotheses. The
first states that Polynesian inhabitants derive from Mela-
nesian stock rather than originating recently in Asia
(Terrell et al. 1997; Hagelberg 1999; Kayser et al. 2000,
2006; Oppenheimer and Richards 2001a, b; Hurles et al.
2002), while the latter espouses Formosan origins and a
rapid dispersal through Micronesia into Polynesia (Melton
et al. 1995; Bellwood 1997; Lum 1998; Green 1999; Ha-
gelberg et al. 1999; Diamond 2000; Gray and Jordan 2000;
Trejaut et al. 2005). The ‘‘express-train to Polynesia’’
model further stipulates that proto-Austronesians arrived in
Taiwan around 5,500 BP and had reached the Philippines by
5,300 BP (Gray and Jordan 2000). From the Philippines two
M. Regueiro and S. Mirabal contributed equally to this manuscript.
Electronic supplementary material The online version of thisarticle (doi:10.1007/s10038-007-0224-4) contains supplementarymaterial, which is available to authorized users.
M. Regueiro � S. Mirabal � H. Lacau � R. J. Herrera (&)
Department of Biological Sciences, Florida International
University, University Park, OE 304, Miami, FL 33199, USA
e-mail: [email protected]
J. L. Caeiro
Seccion de Antropoloxia, Facultade de Bioloxia,
Universidade de Santiago de Compostela, Galicia, Spain
R. L. Garcia-Bertrand
Department of Biological Sciences, Colorado College,
Colorado Springs, CO, USA
123
J Hum Genet (2008) 53:106–120
DOI 10.1007/s10038-007-0224-4

diverging routes seem probable, a western trajectory
resulting in the colonization of Malaysia, the Indonesian
archipelago and Madagascar, and an eastern course leading
to the settlement of Borneo, Sulawesi, New Guinea and,
finally, Western Polynesia around 3,200 BP (Gray and
Jordan 2000).
The island of Madagascar, located at the western fringes
of this dissemination, is separated from continental East
Africa by the Mozambique Channel, spanning a mere
300 miles (Singer et al. 1957). The Malgache language is a
member of the Malayo-Polynesian offshoot of the Aus-
tronesian family, nevertheless certain words are Bantu in
origin (Dahl 1951, 1988; Singer et al. 1957; Adelaar 1995).
Phenotypically, the Malagasy showcase a widespread array
of physical features ranging from Asiatic to sub-Saharan
African and mosaics of the two (David 1940; Singer et al.
1957). Although several studies have established that both
African and Southeast Asian populations have contributed
to Madagascar’s gene pool, the relative proportions and
specific source populations remain unclear.
Early research based on the ABO blood group led to the
hypothesis that a Malagasy tribal population, the Hova
people, arose from the admixture of Mongoloid migrants
from Malaya with Madagascar’s native inhabitants (David
1940). A similar study based on the Rh factor determined
that about 65% of Madagascar’s gene pool is of Bantu
descent while the remaining 35% can be traced to Indo-
nesia (Singer et al. 1957). More recent studies have
established clearer connections to the former two ancestral
populations (Migot et al. 1995; Hewitt et al. 1996) and
mtDNA analyses have found traces of the ‘‘Polynesian
motif’’ on the island (Soodyall et al. 1995). Moreover, a
study including both Y-chromosome and mtDNA lineages
tracks the Southeast Asian influence to Borneo and reports
that only 38% of the Malagasy mtDNA and 55% of Y-
chromosomal lineages are of African descent (Hurles et al.
2005).
At the other extreme of the expansion lies Polynesia, a
region encompassing several island chains including the
Samoan and Tongan archipelagos. Samoa and Tonga are
closely linked not only geographically but historically as
well. During the Austronesian spread across the Pacific, it
is believed that migrants first settled in Samoa and, after a
migrational hiatus lasting approximately one thousand
years, expanded into Tonga and the rest of Polynesia
(Soljak 1946). While more phylogenetic studies have been
conducted on these Pacific islands than on Madagascar, a
dichotomy exists between data generated from Y-chro-
mosomal and mtDNA studies. Analyses utilizing Y-
chromosome data delineate close ties between Melanesia
and Polynesia and only indirect connections to Asia (some
of the Y-chromosomes present in Melanesia do originate in
Asia) (Hagelberg et al. 1999; Kayser et al. 2000, 2006;
Hurles et al. 2002). Kayser et al. (2000) have thus proposed
the ‘‘slow-boat’’ theory postulating that Austronesians
originated in Asia and traversed slowly through Melanesia
allowing for extensive genetic interactions between the
migrants and Melanesian natives.
On the other hand, mtDNA studies have established
clear links between Northeast and Southeast Asia and the
Pacific populations (Melton et al. 1995; Lum 1998;
Hagelberg et al. 1999; Trejaut et al. 2005; Kayser et al.
2006). Trejaut et al. (2005) elaborate that the mtDNA
phylogeny of populations within this region parallels the
linguistic topology suggesting that the Austronesian
expansion has a Formosan origin. In turn, Kayser et al.
(2006) showed that the Polynesian people displayed a
greater proportion of paternally derived Melanesian lin-
eages while maternal inheritance patterns reveal close
genetic ties with Asian groups. Their findings indicate
that 65.8% of Polynesian Y-chromosomes and 6% of
mtDNAs are of Melanesian descent, while 28.5% of
Y-chromosomes and 93.8% of mtDNAs are of Asian
ancestry (Kayser et al. 2006).
The current project was undertaken to assess the con-
tribution of East Asian source populations to Austronesian
groups as geographically distant as Tonga and Madagascar
(approximately 8,000 nautical miles). An additional goal of
this study is to identify the sub-Saharan African groups that
have had an impact on the gene pool of the Madagascar
populace. For the aforementioned purposes, the two Aus-
tronesian populations from Tonga and Madagascar were
compared to geographically targeted Austronesian and
African collections across a set of 15 autosomal short
tandem repeat (STR) loci.
Autosomal STRs are hypervariable markers that,
because of their large number of alleles, high heterozy-
gosity, abundance, and widespread distribution throughout
the genome are especially useful in elucidating recent
human evolutionary history (Jorde et al. 1997; Rowold and
Herrera 2003; Perez-Miranda et al. 2005; Shepard et al.
2005; Shepard and Herrera 2006; Ibarra-Rivera et al.
2007). In addition, they may provide the high resolution
needed in order to assess phylogenetic relationships among
closely related populations (Rowold and Herrera 2003).
With the battery of autosomal STR markers employed in
this study, we aim to provide a more representative gen-
ome-wide genetic profile of populations instead of relying
on phylogenies derived entirely on uniparentally derived
haplotypes. Our results indicate that while Madagascar
derives most of its gene pool from the African continent, a
genetic connection to Southeast Asia can also be discerned.
Furthermore, the Malayo-Filipino group is outlined as the
major Austronesian contributor to Madagascar, Tonga and
Samoa, although influences from Formosa can also be
appreciated in the three populations.
J Hum Genet (2008) 53:106–120 107
123
Materials and methods
Populations, sample collection and DNA isolation
Two populations of Austronesian descent Madagascar
(n = 67) and Tonga (n = 51), were characterized. Peripheral
blood samples were collected from unrelated individuals in
EDTA Vacutainer tubes. Genealogical information was
recorded for a minimum of two generations to establish
regional ancestry. DNA was extracted by the standard phe-
nol–chloroform method (Novick et al. 1995; Antunez de
Mayolo et al. 2002). Subsequent to ethanol precipitation, the
purified DNA samples were stored as stock solutions in
10 mmol/l Tris–EDTA at -80�C. All collections were per-
formed while adhering to the ethical guidelines put forth by
the institutions involved in the research project.
Reference populations
A total of 15 reference populations were used for com-
parison in this study, each providing data for the 15 STR
loci under scrutiny. The geographical locations of all col-
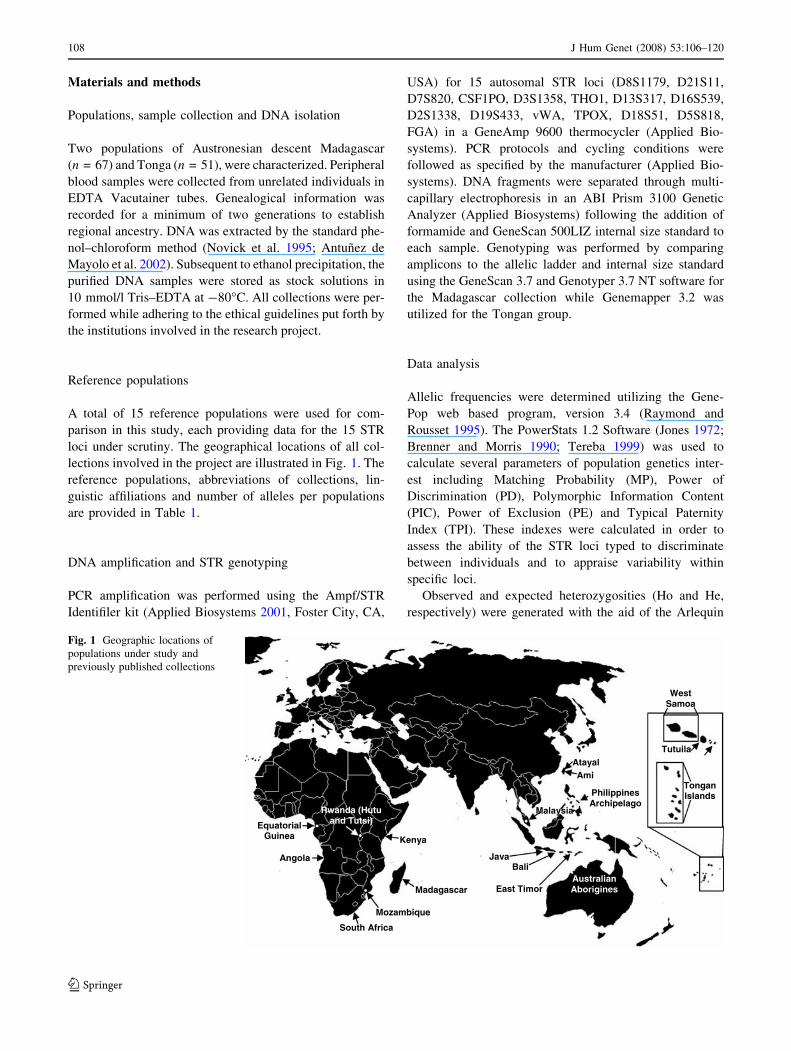
lections involved in the project are illustrated in Fig. 1. The
reference populations, abbreviations of collections, lin-
guistic affiliations and number of alleles per populations
are provided in Table 1.
DNA amplification and STR genotyping
PCR amplification was performed using the Ampf/STR
Identifiler kit (Applied Biosystems 2001, Foster City, CA,
USA) for 15 autosomal STR loci (D8S1179, D21S11,
D7S820, CSF1PO, D3S1358, THO1, D13S317, D16S539,
D2S1338, D19S433, vWA, TPOX, D18S51, D5S818,
FGA) in a GeneAmp 9600 thermocycler (Applied Bio-
systems). PCR protocols and cycling conditions were
followed as specified by the manufacturer (Applied Bio-
systems). DNA fragments were separated through multi-
capillary electrophoresis in an ABI Prism 3100 Genetic
Analyzer (Applied Biosystems) following the addition of
formamide and GeneScan 500LIZ internal size standard to
each sample. Genotyping was performed by comparing
amplicons to the allelic ladder and internal size standard
using the GeneScan 3.7 and Genotyper 3.7 NT software for
the Madagascar collection while Genemapper 3.2 was
utilized for the Tongan group.
Data analysis
Allelic frequencies were determined utilizing the Gene-
Pop web based program, version 3.4 (Raymond and
Rousset 1995). The PowerStats 1.2 Software (Jones 1972;
Brenner and Morris 1990; Tereba 1999) was used to
calculate several parameters of population genetics inter-
est including Matching Probability (MP), Power of
Discrimination (PD), Polymorphic Information Content
(PIC), Power of Exclusion (PE) and Typical Paternity
Index (TPI). These indexes were calculated in order to
assess the ability of the STR loci typed to discriminate
between individuals and to appraise variability within
specific loci.
Observed and expected heterozygosities (Ho and He,
respectively) were generated with the aid of the Arlequin
Manuan Islands
Mozambique
South Africa
Madagascar
Kenya
Rwanda (Hutu and Tutsi) Equatorial
Guinea
Angola
Malaysia
Atayal Ami
Philippines Archipelago
Java Bali
WestSamoa
Tongan Islands
Tutuila
Australian Aborigines East Timor
Fig. 1 Geographic locations of
populations under study and
previously published collections
108 J Hum Genet (2008) 53:106–120
123

software package, version 2.000 (Levene 1949; Guo and
Thompson 1992; Schneider et al. 2000) to ascertain
departures from Hardy–Weinberg equilibrium (HWE)
expectations and heterozygote deficiencies. Statistical sig-
nificance was assessed before and after applying the
Bonferroni correction (a = 0.05/15 = 0.0033 for 15 loci).
Table 1 Populations analyzed
Population Abbreviation Allelesa Location Languageb Linguistic affiliationc Refs.
Samoa SAM 117 West Polynesia Samoan Austronesian, Malayo-Polynesian,
Central-Eastern, Eastern
Malayo-Polynesian, Oceanic
Shepard et al. (2005)
Tonga TON 115 West Polynesia Tongan Austronesian, Malayo-Polynesian,
Central-Eastern, Eastern
Malayo-Polynesian, Oceanic
This study
Malaysia MAL 156 Southeast Asia Malay Austronesian, Malayo-Polynesian,
Malayic, Malayan, Local Malay
Seah et al. (2003)
Philippines PHI 128 Southeast Asia Tagalog Austronesian, Malayo-Polynesian,
Meso Philippines, Central
Philippine, Tagalog
De Ungria et al. (2005)
Ami AMI 111 Southeast Asia Amis Austronesian, East Formosan, Central Shepard et al. (2005)
Atayal ATA 89 Southeast Asia Atayal Austronesian, Atayalic Shepard et al. (2005)
East Timor ETI 145 Melanesia Nuclear
Timor/Papuan
Specific dialect not reported Souto et al. (2005)
Bali BAL 118 Indonesia Indonesian Austronesian, Malayo-Polynesian,
Malayic, Malayan, Local Malay
Shepard et al. (2005)
Java JAV 129 Indonesia Indonesian Austronesian, Malayo-Polynesian,
Malayic, Malayan, Local Malay
Shepard et al. (2005)
Madagascar MAD 129 Indian Ocean Malagasy Austronesian, Malayo-Polynesian,
Barito, East, Malagasy
This study
Kenya KEN 139 East Africa Swahili Niger-Congo, Atlantic-Congo,
Volta-Congo, Benue-Congo,
Bantoid
Shepard and Herrera
(2006)
Rwanda (Tutsi) TUT 144 East Africa Rwanda-Rundi Niger-Congo, Atlantic-Congo,
Volta-Congo, Benue-Congo,
Bantoid
Regueiro et al. (2004)
Rwanda (Hutu) HUT 164 East Africa Rwanda-Rundi Niger-Congo, Atlantic-Congo,
Volta-Congo, Benue-Congo,
Bantoid
Shepard and Herrera
(2006)
Mozambique
(Maputo)
MOZ 168 East Africa Ronga Niger-Congo, Atlantic-Congo,
Volta-Congo, Benue-Congo,
Bantoid
Alves et al. (2004)
South Africa
(Cape Town)
SAF 144 South Africa Zulu-Bantu Niger-Congo, Atlantic-Congo,
Volta-Congo, Benue-Congo,
Bantoid
Kido et al. (2007)
Equatorial
Guinea
EGU 154 West Africa Bantu Niger-Congo, Atlantic-Congo,
Volta-Congo, Benue-Congo,
Bantoid
Alves et al. (2005)
Angola
(Cabinda)
ANG 149 West Africa Kongo Niger-Congo, Atlantic-Congo,
Volta-Congo, Benue-Congo,
Bantoid
Beleza et al. (2004)
Australian
Aborigines
AUS 161 Australia Australian Specific dialect not reported Eckoff et al. (2007)
East Timorese
Australians
ETA 151 Australia Australian Specific dialect not reported Eckoff et al. (2007)
a Number of alleles present in the populationb Language represents the most widespread tongue within the region. Most are official languagesc URL for resource http://www.ethnologue.com
J Hum Genet (2008) 53:106–120 109
123

Ancestry-informative markers were identified based on
average Fst distances as described by Collins-Schraam
et al. (2002, 2003, 2004) in order to determine whether
the markers included in our analysis provide tangible
data on the descent of Austronesian populations and to
delineate STR loci especially robust for discriminating
among Austronesian peoples. Fst distances were esti-
mated using the program Arlequin, version 2.000 (Weir
and Cockerman 1984). Significance was assessed at
a = 0.05.
A correspondence analysis (CA) was performed utiliz-
ing the NTSYSpc 2.02i software (Rohlf 2002) and a
Maximum Likelihood (ML) tree, based on Fst distances
(Reynolds et al. 1983), was constructed with the software
PHYLIP 3.52c (Felsenstein 2002) in order to deduce
phylogenetic relationships between the populations under
analysis. Bootstrap analysis involved 1,000 replications.
The DISPAN program (Ota 1993) was employed to
estimate inter, intra and total population genetic variance
components (Gst, Hs and Ht, respectively). For this pur-
pose, populations were partitioned into five groups:
1 Austronesian-speaking (Ami, Atayal, Bali, Java, Mad-
agascar, Malaysia, Philippines, Samoa and Tonga);
2 Austronesian-speaking excluding Madagascar (all other
populations included in the previous group);
3 Melanesians (Australian aborigines, East Timorese
residing in Australia, East Timor);
4 Niger-Congo-speaking (Angola, Equatorial Guinea,
Hutu, Kenya, Mozambique, South Africa, Tutsi); and
5 All populations (including all populations encompassed
by the first, third and fourth groups).
The Carmody program’s G test (Carmody 1990),
employing the Bonferroni adjustment (a = 0.05/146 =
0.000342) to minimize type I errors, was conducted to
detect any statistically significant genetic differences
between populations. P values at or below a are presumed
to indicate heterogeneity between population pairs whereas
values above a suggest that the two do not differ
significantly from each other and are thus genetically
homogeneous.
Admixture tests were conducted in order to ascertain
the genetic contribution of source populations to descen-
dant populations using the SPSS 14.0 statistical software
package (Long et al. 1991; Perez-Miranda et al. 2006). In
these estimations, it is assumed that the loci studied are
selectively neutral and the extant collections examined
large enough to mitigate the potential impact of bias
sampling. Admixture proportions reveal the genetic con-
tributions of groups of populations to the gene pool of the
hybrid collection (population suspected of representing a
genetic collage composed of differing sources). Yet, they
may also reflect shared ancestry rather than direct
geneflow between parent and hybrid populations given
that in the process of elucidating relationships, allelic
frequencies and distributions are employed as bases for
comparison. In other words, gene flow from a source
population to both hybrid and parental groups instead of a
direct relationship between the latter two are possible. In
addition, the populations that are selected as parentals
may potentially affect the contribution proportions, espe-
cially if they are closely related. Barnholtz-Sloan et al.
(2005) have indicated that STR loci can provide useful
admixture information; however, exact proportions are to
be taken cautiously.
For Madagascar, the parents consisted of grouped
populations based on biogeographical location. Two
groups, Africans (Angola, Equatorial Guinea, Rwanda
Hutu, Kenya, Mozambique, South Africa and Rwanda
Tutsi) and Southeast Asians (Ami, Atayal, Bali, Java,
Malaysia and Philippines), were used as parents in the
first analysis. The second admixture assessment employed
sub-groups of the previous determination: Taiwanese
Aborigines (Ami and Atayal), Indonesian (Java and Bali),
Malayo-Filipino (Malaysia and the Philippines), West
Africa (Angola and Equatorial Guinea) and East Africa
(Rwanda Hutu, Kenya, Mozambique, South Africa and
Rwanda Tutsi).
Another set of admixture tests was performed using
Samoa and Tonga individually as hybrid populations.
These two populations were compared against Southeast
Asians and Melanesians as well as to subsets of these
assemblages: Taiwanese Aborigines (Ami and Atayal),
Indonesian (Java and Bali) and Malayo-Filipino (Malaysia
and Philippines).
Results
Intra-population diversity
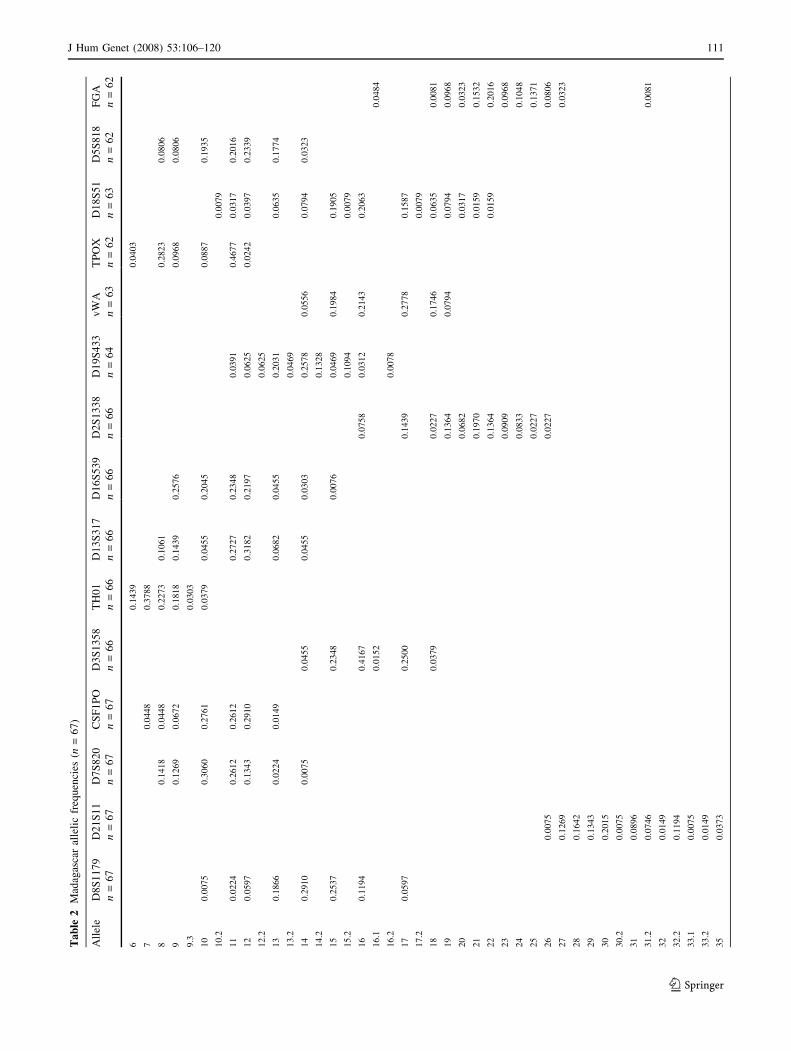
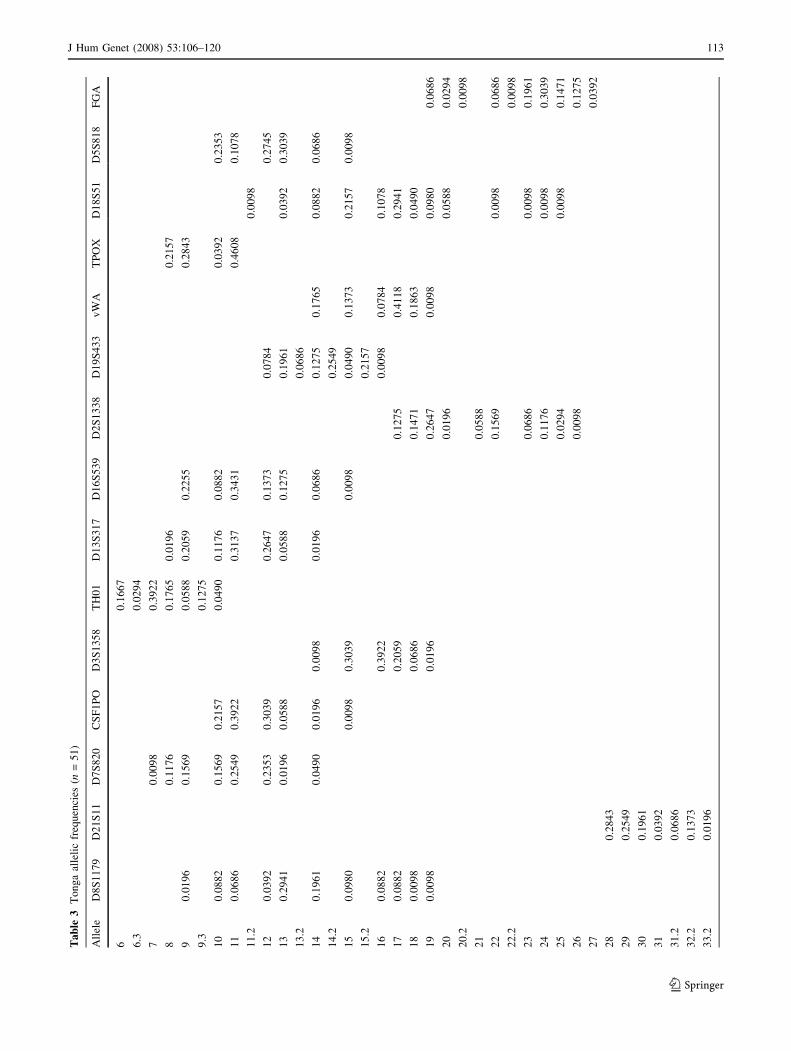
Allelic distributions for Madagascar and Tonga are listed
in Tables 2 and 3, respectively, along with observed and
expected heterozygosities (Ho and He, respectively),
HWE P values and several important population genetics
indexes including MP, PD, PIC, PE and TPI. The Mad-
agascar collection exhibits a substantially higher number
of alleles than that of Tonga (129 vs. 115, respectively) a
difference expected due to its proximity and possible gene
flow from continental sub-Saharan Africa. Although it is
not the purpose of this paper to offer a detailed account of
allelic frequencies, the presence of alleles 26 and 33.1 of
D21S11 and 16.1 and 31 of FGA in Madagascar and their
absence from other Austronesian populations is notewor-
thy. This may reflect gene flow from the highly diverse
African mainland where they have been previously
110 J Hum Genet (2008) 53:106–120
123
Ta
ble
2M
adag
asca
ral
leli
cfr
equ
enci
es(n
=6
7)
All
ele
D8
S1
17
9D
21
S1
1D
7S
82
0C
SF
1P
OD
3S
13
58
TH
01
D1
3S
31
7D
16
S5
39
D2
S1
33
8D
19
S4
33
vW
AT
PO
XD
18
S5
1D
5S
81
8F
GA
n=
67
n=
67
n=
67
n=
67
n=
66
n=
66
n=
66
n=
66
n=
66
n=
64
n=
63
n=
62
n=
63
n=
62
n=
62
60.1
439
0.0
403
70.0
448
0.3
788
80.1
418
0.0
448
0.2
273
0.1
061
0.2
823
0.0
806
90.1
269
0.0
672
0.1
818
0.1
439
0.2
576
0.0
968
0.0
806
9.3
0.0
303
10
0.0
075
0.3
060
0.2
761
0.0
379
0.0
455
0.2
045
0.0
887
0.1
935
10.2
0.0
079
11
0.0
224
0.2
612
0.2
612
0.2
727
0.2
348
0.0
391
0.4
677
0.0
317
0.2
016
12
0.0
597
0.1
343
0.2
910
0.3
182
0.2
197
0.0
625
0.0
242
0.0
397
0.2
339
12.2
0.0
625
13
0.1
866
0.0
224
0.0
149
0.0
682
0.0
455
0.2
031
0.0
635
0.1
774
13.2
0.0
469
14
0.2
910
0.0
075
0.0
455
0.0
455
0.0
303
0.2
578
0.0
556
0.0
794
0.0
323
14.2
0.1
328
15
0.2
537
0.2
348
0.0
076
0.0
469
0.1
984
0.1
905
15.2
0.1
094
0.0
079
16
0.1
194
0.4
167
0.0
758
0.0
312
0.2
143
0.2
063
16.1
0.0
152
0.0
484
16.2
0.0
078
17
0.0
597
0.2
500
0.1
439
0.2
778
0.1
587
17.2
0.0
079
18
0.0
379
0.0
227
0.1
746
0.0
635
0.0
081
19
0.1
364
0.0
794
0.0
794
0.0
968
20
0.0
682
0.0
317
0.0
323
21
0.1
970
0.0
159
0.1
532
22
0.1
364
0.0
159
0.2
016
23
0.0
909
0.0
968
24
0.0
833
0.1
048
25
0.0
227
0.1
371
26
0.0
075
0.0
227
0.0
806
27
0.1
269
0.0
323
28
0.1
642
29
0.1
343
30
0.2
015
30.2
0.0
075
31
0.0
896
31.2
0.0
746
0.0
081
32
0.0
149
32.2
0.1
194
33.1
0.0
075
33.2
0.0
149
35
0.0
373
J Hum Genet (2008) 53:106–120 111
123

reported (e.g., D21S11 26 and 33.1 in Angola and
Equatorial Guinea).
Three loci (D8S1179, vWA and D5S818) in the Mad-
agascar population and one locus (D2S1338) in Tonga
depart from HWE predictions at a = 0.05 (Tables 2, 3).
Yet, after applying the Bonferroni correction (a = 0.0033),
no loci diverge from HWE expectations.
Relevant population genetic parameters including
Combined Matching Probability (CMP), Combined Power
of Discrimination (CPD), Combined Power of Exclusion
(CPE) and Average Heterozygosities are provided in
Supplementary Table 1. Intra-population variances (Hs)
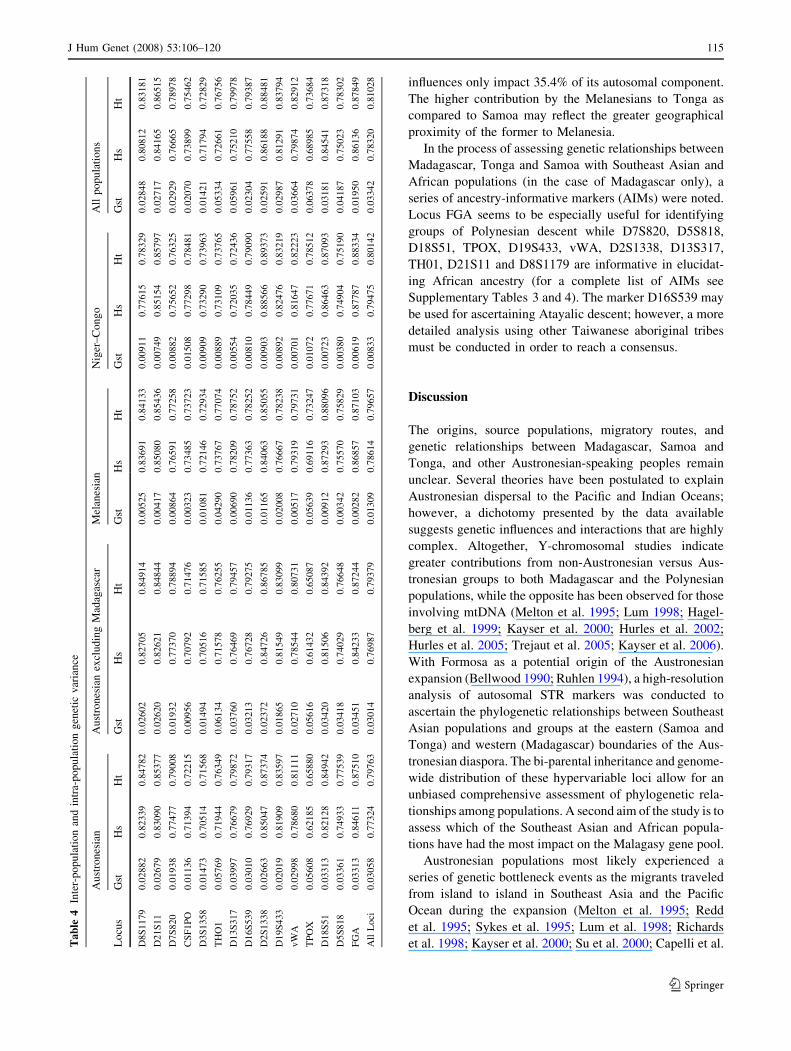
are presented in Table 4. Of all four categories, the
Austronesian group [Indonesian (Java and Bali), Mada-
gascar, Malaysia, the Philippines, Samoa, Taiwanese
Aborigines (Atayal and Ami) and Tonga] possesses the
lowest overall intra-population variance (Hs = 0.77324 in
Table 4), while the Niger–Congo speaking populations
[Kenya, Rwanda (Hutu and Tutsi), Mozambique, Equato-
rial Guinea, South Africans and Angola] display the
highest (Hs = 0.79475) even when compared to the all
populations group (Hs = 0.78320).
Inter-population diversity
In order to assess the phylogenetic relationships among all
populations, G tests and CA and ML analysis were per-
formed. In addition, Gst values were generated to ascertain
inter-population variance. Potential parental contributions
to hybrid populations were determined by admixture
analyses.
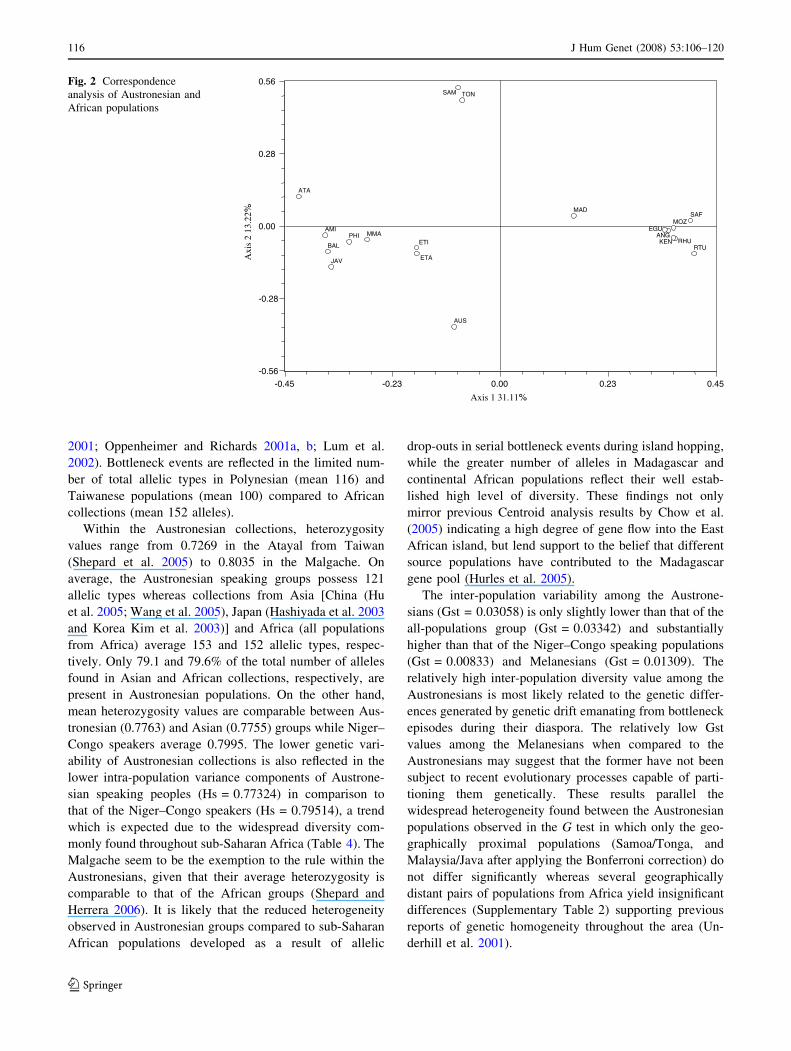
Within the CA (Fig. 2), three clearly defined clusters are
apparent: Southeast Asian, African and Polynesian (Samoa
and Tonga). Madagascar, although positioned closer to the
African cluster, clearly strays from the latter in the direc-
tion of the Southeast Asian group. Within the Southeast
Asian cluster, the Taiwanese aborigines (Ami and Atayal)
display a considerable degree of genetic separation from
each other with the Atayal partitioning away into the upper
left quadrant, in spite of their geographic vicinity and
sharing an extensive common border. The East Timorese
populations segregate at an intermediate point from the
Southeast Asian assemblage and the Australian aborigines
population while the collections from Samoa and Tonga
are found close to each other in the upper left quadrant
distant from all other groupings. It is notable that the
Melanesian Australian and East Timorese partition most
distant from the Polynesian collections along the Y axis
than any other group of populations, arguing for genetic
differences between the two. The African cluster exhibits a
tight grouping of populations. Altogether, the CA mirrors
known biogeographical demarcations.Ta
ble
2(c
on
tin
ued
)
All
ele
D8
S1
17
9D
21
S1
1D
7S
82
0C
SF
1P
OD
3S
13
58
TH
01
D1
3S
31
7D
16
S5
39
D2
S1
33
8D
19
S4
33
vW
AT
PO
XD
18
S5
1D
5S
81
8F
GA
n=
67
n=
67
n=
67
n=
67
n=
66
n=
66
n=
66
n=
66
n=
66
n=
64
n=
63
n=
62
n=
63
n=
62
n=
62
Ho
0.7
910
0.8
358
0.8
358
0.7
761
0.7
424
0.7
424
0.6
818
0.7
576
0.8
636
0.8
750
0.7
937
0.7
258
0.8
730
0.7
742
0.9
839
He
0.8
001
0.8
750
0.8
018
0.7
900
0.7
105
0.7
545
0.7
896
0.8
257
0.8
828
0.8
562
0.8
067
0.6
877
0.8
881
0.8
284
0.8
834
HW
E0.0
475
0.7
075
0.3
955
0.4
979
0.1
809
0.2
879
0.2
598
0.2
530
0.9
920
0.3
781
0.0
075
0.7
182
0.8
978
0.0
244
0.8
504
MP
0.0
924
0.0
381
0.0
973
0.1
072
0.1
561
0.1
148
0.0
776
0.0
872
0.0
331
0.0
527
0.1
000
0.1
498
0.0
391
0.0
723
0.0
458
PD
0.9
076
0.9
619
0.9
027
0.8
928
0.8
439
0.8
852
0.9
224
0.9
128
0.9
669
0.9
473
0.9
000
0.8
502
0.9
609
0.9
277
0.9
542
PIC
0.7
646
0.8
544
0.7
508
0.7
232
0.6
551
0.7
104
0.7
532
0.7
508
0.8
636
0.8
314
0.7
673
0.6
354
0.8
582
0.7
970
0.8
639
PE
0.5
825
0.6
671
0.6
671
0.5
555
0.4
969
0.4
969
0.4
007
0.5
228
0.7
219
0.7
447
0.5
873
0.4
693
0.7
407
0.5
521
0.9
675
TP
I2.3
929
3.0
455
3.0
455
2.2
333
1.9
412
1.9
412
1.5
714
2.0
625
3.6
667
4.0
000
2.4
231
1.8
235
3.9
375
2.2
143
31.0
000
Ho
,O
bse
rved
Het
ero
zyg
osi
ty;
He,
Ex
pec
ted
Het
ero
zyg
osi
ty;
HW
E,
Har
dy
–W
ein
ber
gE
qu
ilib
riu
mP
val
ues
;M
P,
Mat
chin
gP
rob
abil
ity
;P
D,
Po
wer
of
Dis
crim
inat
ion
;P
IC,
Po
lym
orp
hic
Info
rmat
ion
Co
nte
nt;
PE
,P
ow
ero
fE
xcl
usi
on
;T
PI,
Ty
pic
alP
ater
nit
yIn
dex
112 J Hum Genet (2008) 53:106–120
123
Ta
ble
3T
on
ga
alle
lic
freq
uen
cies
(n=
51
)
All
ele
D8
S1
17
9D
21
S1
1D
7S
82
0C
SF
1P
OD
3S
13
58
TH
01
D1
3S
31
7D
16
S5
39
D2
S1
33
8D
19
S4
33
vW
AT
PO
XD
18
S5
1D
5S
81
8F
GA
60
.16
67
6.3
0.0
29
4
70
.00
98
0.3
92
2
80
.11
76
0.1
76
50
.01
96
0.2
15
7
90
.01
96
0.1
56
90
.05
88
0.2
05
90
.22
55
0.2
84
3
9.3
0.1
27
5
10
0.0
88
20
.15
69
0.2
15
70
.04
90
0.1
17
60
.08
82
0.0
39
20
.23
53
11
0.0
68
60
.25
49
0.3
92
20
.31
37
0.3
43
10
.46
08
0.1
07
8
11
.20
.00
98
12
0.0
39
20
.23
53
0.3
03
90
.26
47
0.1
37
30
.07
84
0.2
74
5
13
0.2
94
10
.01
96
0.0
58
80
.05
88
0.1
27
50
.19
61
0.0
39
20
.30
39
13
.20
.06
86
14
0.1
96
10
.04
90
0.0
19
60
.00
98
0.0
19
60
.06
86
0.1
27
50
.17
65
0.0
88
20
.06
86
14
.20
.25
49
15
0.0
98
00
.00
98
0.3
03
90
.00
98
0.0
49
00
.13
73
0.2
15
70
.00
98
15
.20
.21
57
16
0.0
88
20
.39
22
0.0
09
80
.07
84
0.1
07
8
17
0.0
88
20
.20
59
0.1
27
50
.41
18
0.2
94
1
18
0.0
09
80
.06
86
0.1
47
10
.18
63
0.0
49
0
19
0.0
09
80
.01
96
0.2
64
70
.00
98
0.0
98
00
.06
86
20
0.0
19
60
.05
88
0.0
29
4
20
.20
.00
98
21
0.0
58
8
22
0.1
56
90
.00
98
0.0
68
6
22
.20
.00
98
23
0.0
68
60
.00
98
0.1
96
1
24
0.1
17
60
.00
98
0.3
03
9
25
0.0
29
40
.00
98
0.1
47
1
26
0.0
09
80
.12
75
27
0.0
39
2
28
0.2
84
3
29
0.2
54
9
30
0.1
96
1
31
0.0
39
2
31
.20
.06
86
32
.20
.13
73
33
.20
.01
96
J Hum Genet (2008) 53:106–120 113
123

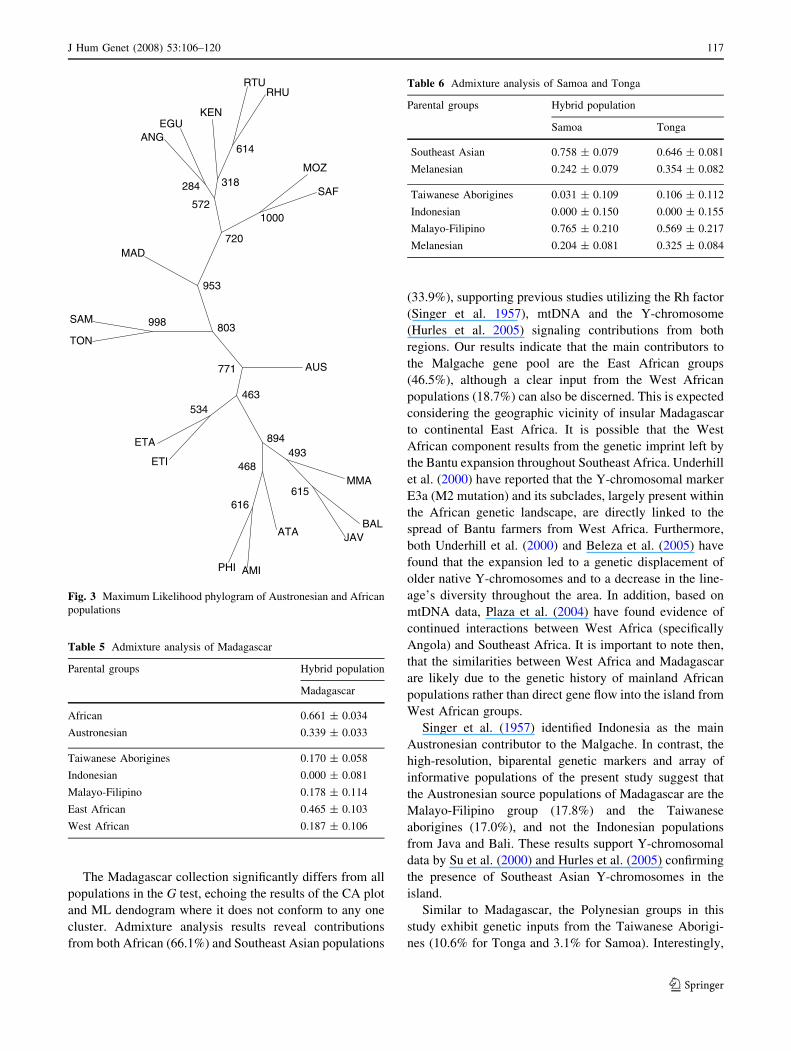
Both the African and Southeast Asian clades are well
delineated in the ML dendrogram (Fig. 3) which corrob-
orates the phylogenetic relationships portrayed by the CA.
However, in contrast to the isolated positions of Samoa and
Tonga in the CA, these two Pacific Austronesian popula-
tions cluster close to the Australian/East Timorese
collections found adjacent to the Southeast Asian groups in
the ML tree. Madagascar occupies an intermediate posi-
tion, between the African clade and the Polynesian
populations.
Inter and total variance components (Gst and Ht,
respectively) are reported in Table 4. Inter-population
variance is considerably higher among the Austronesian-
speaking populations (Gst = 0.03058) when compared to
the Niger–Congo-speaking collections (Gst = 0.00833).
Excluding Madagascar from the Austronesian group yields
a mere 1.4% decrease in the Gst value, suggesting that this
high inter-population diversity is a characteristic of Aus-
tronesian populations as a whole rather than attributable to
the geographical outlier, Madagascar. The total variance,
however, is highest amongst the Niger–Congo-speaking
populations (Ht = 0.80131), corroborating the high genetic
diversity of sub-Saharan African groups.
All pair-wise population comparisons except for Samoa/
Tonga, Kenya/Angola and Kenya/Equatorial Guinea
revealed statistically significant genetic differences as
ascertained by G tests (Supplementary Table 2). The
application of the Bonferroni correction for type I errors
rendered the differences between Java/Malaysia, Mozam-
bique/Kenya, Mozambique/South Africa, Hutu/Kenya and
Angola/Equatorial Guinea insignificant also.
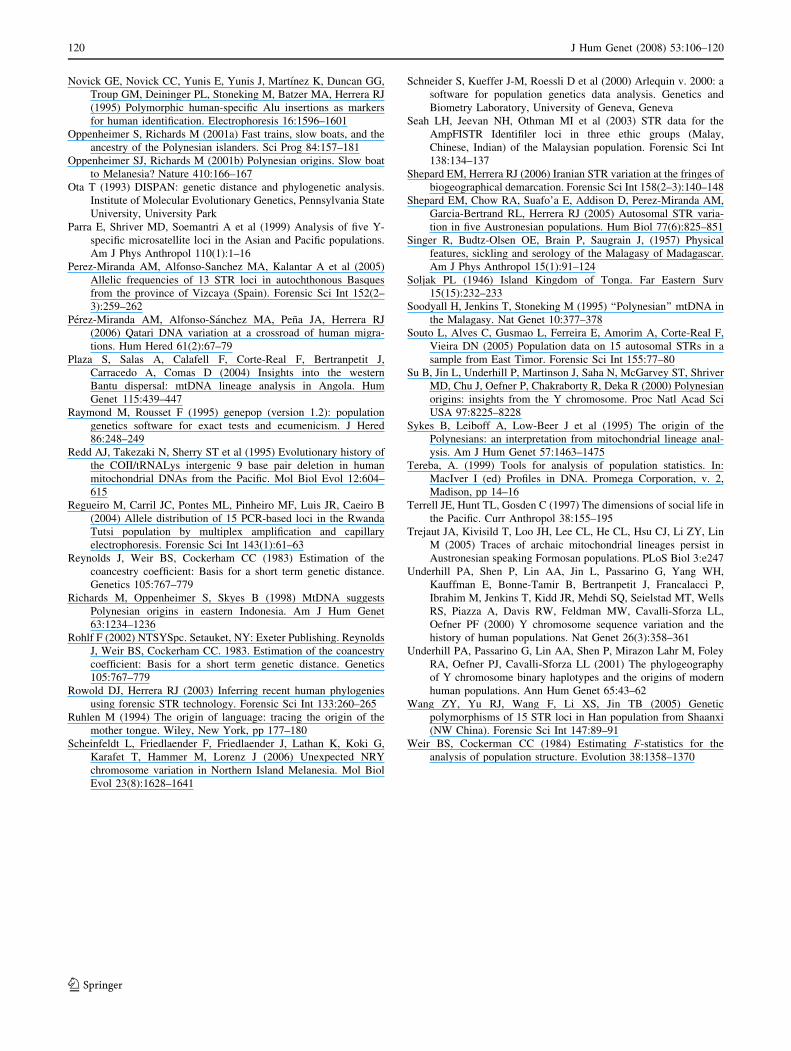
Admixture analyses performed to assess the genetic
contributions of groups of populations to the Madagascar
collection are presented in Table 5. The results indicate
that the African input to the Malgache autosomal gene pool
is 66.1% while the Southeast Asians contribute 33.9%.
Analyses employing subgroups reveal that the Taiwanese
aborigines and the Malayo-Filipino assemblages contribute
17.0 and 17.8%, respectively, of the Malagasy’s autosomal
component while the East African group is shown to be the
major contributor to the island (46.5%). Interestingly, no
input from the Indonesian groups (Bali and Java) was
detected through the analysis.
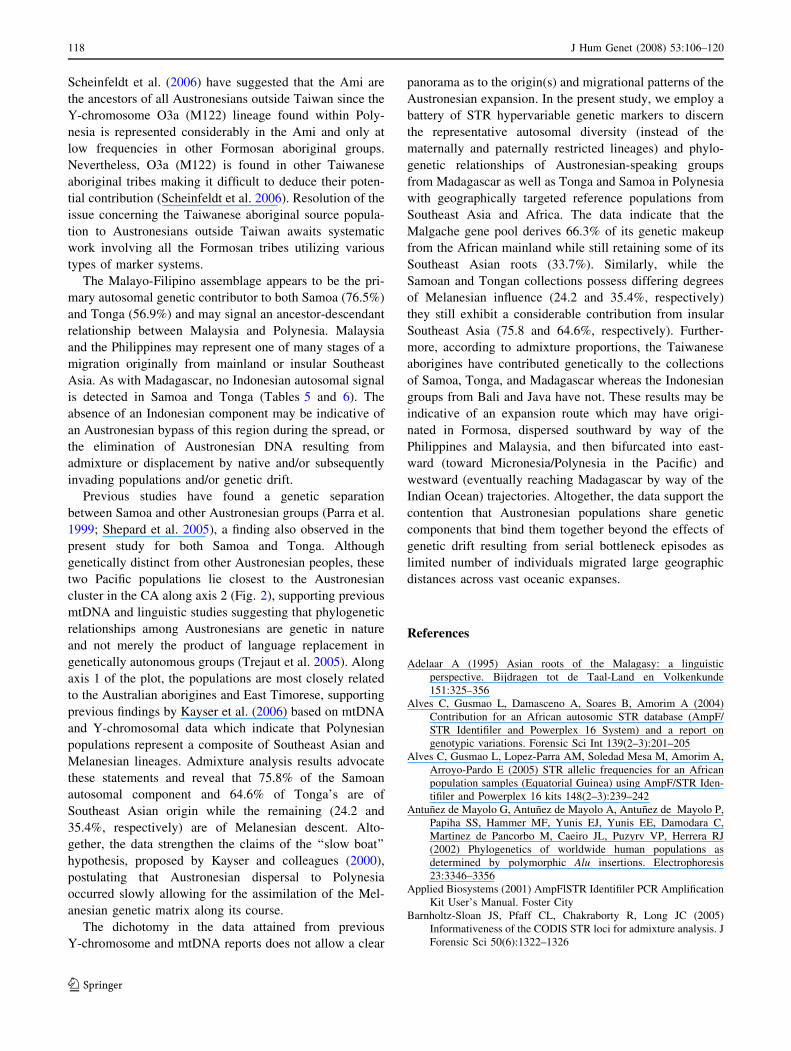
It is notable that Samoa and Tonga’s gene pools derive
from the same genetic sources as the Malgache within
Southeast Asia (Tables 5 and 6). The Taiwanese aborigines
provide 3.1% of the Samoan autosomal component and
10.6% of the Tongan collection. The Malayo-Filipino
group, in turn, contributes 76.5 and 56.9% to Samoa and
Tonga, respectively. Altogether, Samoa derives 75.8% of
its gene pool from Southeast Asian groups and only 24.2%
from Melanesian populations. Similarly, Southeast Asian
contributions to Tonga are 64.6% while MelanesianTa
ble
3(c
on
tin
ued
)
All
ele
D8
S1
17
9D
21
S1
1D
7S
82
0C
SF
1P
OD
3S
13
58
TH
01
D1
3S
31
7D
16
S5
39
D2
S1
33
8D
19
S4
33
vW
AT
PO
XD
18
S5
1D
5S
81
8F
GA
Ho
0.7
64
70
.74
51
0.7
84
30
.74
51
0.6
86
30
.74
51
0.7
84
30
.80
39
0.9
02
00
.90
20
0.7
64
70
.60
78
0.8
43
10
.82
35
0.8
03
9
He
0.8
73
20
.79
81
0.8
21
80
.71
04
0.7
13
30
.77
19
0.7
78
70
.79
15
0.8
52
50
.82
86
0.7
46
90
.67
64
0.8
38
30
.76
80
0.8
63
5
HW
E0
.44
52
0.2
61
30
.40
84
0.5
36
20
.97
05
0.9
00
90
.89
09
0.9
80
90
.03
47
0.7
01
60
.40
34
0.0
52
00
.93
59
0.8
02
10
.48
37
MP
0.0
52
70
.08
73
0.0
71
10
.16
34
0.1
34
20
.08
73
0.0
95
00
.08
34
0.0
74
20
.07
27
0.1
22
60
.19
11
0.0
58
80
.10
96
0.0
68
8
PD
0.9
47
30
.91
27
0.9
28
90
.83
66
0.8
65
80
.91
27
0.9
05
00
.91
66
0.9
25
80
.92
73
0.8
77
40
.80
89
0.9
41
20
.89
04
0.9
31
2
PIC
0.8
17
40
.75
89
0.7
87
70
.64
98
0.6
54
00
.73
45
0.7
35
20
.75
41
0.8
26
30
.79
64
0.7
03
00
.59
61
0.8
11
10
.72
05
0.7
97
4
PE
0.5
35
30
.50
14
0.5
70
30
.50
14
0.4
07
30
.50
14
0.5
70
30
.60
63
0.7
99
40
.79
94
0.5
35
30
.30
04
0.6
81
40
.64
34
0.6
06
3
TP
I2
.12
50
1.9
61
52
.31
82
1.9
61
51
.59
38
1.9
61
52
.31
82
2.5
50
05
.10
00
5.1
00
02
.12
50
1.2
75
03
.18
75
2.8
33
32
.55
00
Ho
,O
bse
rved
Het
ero
zyg
osi
ty;
He,
Ex
pec
ted
Het
ero
zyg
osi
ty;
HW
E,
Har
dy
–W
ein
ber
gE
qu
ilib
riu
mP
val
ues
;M
P,
Mat
chin
gP
rob
abil
ity
;P
D,
Po
wer
of
Dis
crim
inat
ion
;P
IC,
Po
lym
orp
hic
Info
rmat
ion
Co
nte
nt;
PE
,P
ow
ero
fE
xcl
usi
on
;T
PI,
Ty
pic
alP
ater
nit
yIn
dex
114 J Hum Genet (2008) 53:106–120
123
influences only impact 35.4% of its autosomal component.
The higher contribution by the Melanesians to Tonga as
compared to Samoa may reflect the greater geographical
proximity of the former to Melanesia.
In the process of assessing genetic relationships between
Madagascar, Tonga and Samoa with Southeast Asian and
African populations (in the case of Madagascar only), a
series of ancestry-informative markers (AIMs) were noted.
Locus FGA seems to be especially useful for identifying
groups of Polynesian descent while D7S820, D5S818,
D18S51, TPOX, D19S433, vWA, D2S1338, D13S317,
TH01, D21S11 and D8S1179 are informative in elucidat-
ing African ancestry (for a complete list of AIMs see
Supplementary Tables 3 and 4). The marker D16S539 may
be used for ascertaining Atayalic descent; however, a more
detailed analysis using other Taiwanese aboriginal tribes
must be conducted in order to reach a consensus.
Discussion
The origins, source populations, migratory routes, and
genetic relationships between Madagascar, Samoa and
Tonga, and other Austronesian-speaking peoples remain
unclear. Several theories have been postulated to explain
Austronesian dispersal to the Pacific and Indian Oceans;
however, a dichotomy presented by the data available
suggests genetic influences and interactions that are highly
complex. Altogether, Y-chromosomal studies indicate
greater contributions from non-Austronesian versus Aus-
tronesian groups to both Madagascar and the Polynesian
populations, while the opposite has been observed for those
involving mtDNA (Melton et al. 1995; Lum 1998; Hagel-
berg et al. 1999; Kayser et al. 2000; Hurles et al. 2002;
Hurles et al. 2005; Trejaut et al. 2005; Kayser et al. 2006).
With Formosa as a potential origin of the Austronesian
expansion (Bellwood 1990; Ruhlen 1994), a high-resolution
analysis of autosomal STR markers was conducted to
ascertain the phylogenetic relationships between Southeast
Asian populations and groups at the eastern (Samoa and
Tonga) and western (Madagascar) boundaries of the Aus-
tronesian diaspora. The bi-parental inheritance and genome-
wide distribution of these hypervariable loci allow for an
unbiased comprehensive assessment of phylogenetic rela-
tionships among populations. A second aim of the study is to
assess which of the Southeast Asian and African popula-
tions have had the most impact on the Malagasy gene pool.
Austronesian populations most likely experienced a
series of genetic bottleneck events as the migrants traveled
from island to island in Southeast Asia and the Pacific
Ocean during the expansion (Melton et al. 1995; Redd
et al. 1995; Sykes et al. 1995; Lum et al. 1998; Richards
et al. 1998; Kayser et al. 2000; Su et al. 2000; Capelli et al.Ta
ble
4In
ter-
po
pu
lati
on
and
intr
a-p
op
ula
tio
ng
enet
icv
aria
nce
Au
stro
nes
ian
Au
stro
nes
ian
excl
ud
ing
Mad
agas
car
Mel
anes
ian
Nig
er–
Co
ng
oA
llp
op
ula
tio
ns
Lo
cus
Gst
Hs
Ht
Gst
Hs
Ht
Gst
Hs
Ht
Gst
Hs
Ht
Gst
Hs
Ht
D8S
1179
0.0
2882
0.8
2339
0.8
4782
0.0
2602
0.8
2705
0.8
4914
0.0
0525
0.8
3691
0.8
4133
0.0
0911
0.7
7615
0.7
8329
0.0
2848
0.8
0812
0.8
3181
D21S
11
0.0
2679
0.8
3090
0.8
5377
0.0
2620
0.8
2621
0.8
4844
0.0
0417
0.8
5080
0.8
5436
0.0
0749
0.8
5154
0.8
5797
0.0
2717
0.8
4165
0.8
6515
D7S
820
0.0
1938
0.7
7477
0.7
9008
0.0
1932
0.7
7370
0.7
8894
0.0
0864
0.7
6591
0.7
7258
0.0
0882
0.7
5652
0.7
6325
0.0
2929
0.7
6665
0.7
8978
CS
F1P
O0.0
1136
0.7
1394
0.7
2215
0.0
0956
0.7
0792
0.7
1476
0.0
0323
0.7
3485
0.7
3723
0.0
1508
0.7
7298
0.7
8481
0.0
2070
0.7
3899
0.7
5462
D3S
1358
0.0
1473
0.7
0514
0.7
1568
0.0
1494
0.7
0516
0.7
1585
0.0
1081
0.7
2146
0.7
2934
0.0
0909
0.7
3290
0.7
3963
0.0
1421
0.7
1794
0.7
2829
TH
O1
0.0
5769
0.7
1944
0.7
6349
0.0
6134
0.7
1578
0.7
6255
0.0
4290
0.7
3767
0.7
7074
0.0
0889
0.7
3109
0.7
3765
0.0
5334
0.7
2661
0.7
6756
D13S
317
0.0
3997
0.7
6679
0.7
9872
0.0
3760
0.7
6469
0.7
9457
0.0
0690
0.7
8209
0.7
8752
0.0
0554
0.7
2035
0.7
2436
0.0
5961
0.7
5210
0.7
9978
D16S
539
0.0
3010
0.7
6929
0.7
9317
0.0
3213
0.7
6728
0.7
9275
0.0
1136
0.7
7363
0.7
8252
0.0
0810
0.7
8449
0.7
9090
0.0
2304
0.7
7558
0.7
9387
D2S
1338
0.0
2663
0.8
5047
0.8
7374
0.0
2372
0.8
4726
0.8
6785
0.0
1165
0.8
4063
0.8
5055
0.0
0903
0.8
8566
0.8
9373
0.0
2591
0.8
6188
0.8
8481
D19S
433
0.0
2019
0.8
1909
0.8
3597
0.0
1865
0.8
1549
0.8
3099
0.0
2008
0.7
6667
0.7
8238
0.0
0892
0.8
2476
0.8
3219
0.0
2987
0.8
1291
0.8
3794
vW
A0.0
2998
0.7
8680
0.8
1111
0.0
2710
0.7
8544
0.8
0731
0.0
0517
0.7
9319
0.7
9731
0.0
0701
0.8
1647
0.8
2223
0.0
3664
0.7
9874
0.8
2912
TP
OX
0.0
5608
0.6
2185
0.6
5880
0.0
5616
0.6
1432
0.6
5087
0.0
5639
0.6
9116
0.7
3247
0.0
1072
0.7
7671
0.7
8512
0.0
6378
0.6
8985
0.7
3684
D18S
51
0.0
3313
0.8
2128
0.8
4942
0.0
3420
0.8
1506
0.8
4392
0.0
0912
0.8
7293
0.8
8096
0.0
0723
0.8
6463
0.8
7093
0.0
3181
0.8
4541
0.8
7318
D5S
818
0.0
3361
0.7
4933
0.7
7539
0.0
3418
0.7
4029
0.7
6648
0.0
0342
0.7
5570
0.7
5829
0.0
0380
0.7
4904
0.7
5190
0.0
4187
0.7
5023
0.7
8302
FG
A0.0
3313
0.8
4611
0.8
7510
0.0
3451
0.8
4233
0.8
7244
0.0
0282
0.8
6857
0.8
7103
0.0
0619
0.8
7787
0.8
8334
0.0
1950
0.8
6136
0.8
7849
All
Loci
0.0
3058
0.7
7324
0.7
9763
0.0
3014
0.7
6987
0.7
9379
0.0
1309
0.7
8614
0.7
9657
0.0
0833
0.7
9475
0.8
0142
0.0
3342
0.7
8320
0.8
1028
J Hum Genet (2008) 53:106–120 115
123
2001; Oppenheimer and Richards 2001a, b; Lum et al.
2002). Bottleneck events are reflected in the limited num-
ber of total allelic types in Polynesian (mean 116) and
Taiwanese populations (mean 100) compared to African
collections (mean 152 alleles).
Within the Austronesian collections, heterozygosity
values range from 0.7269 in the Atayal from Taiwan
(Shepard et al. 2005) to 0.8035 in the Malgache. On
average, the Austronesian speaking groups possess 121
allelic types whereas collections from Asia [China (Hu
et al. 2005; Wang et al. 2005), Japan (Hashiyada et al. 2003
and Korea Kim et al. 2003)] and Africa (all populations
from Africa) average 153 and 152 allelic types, respec-
tively. Only 79.1 and 79.6% of the total number of alleles
found in Asian and African collections, respectively, are
present in Austronesian populations. On the other hand,
mean heterozygosity values are comparable between Aus-
tronesian (0.7763) and Asian (0.7755) groups while Niger–
Congo speakers average 0.7995. The lower genetic vari-
ability of Austronesian collections is also reflected in the
lower intra-population variance components of Austrone-
sian speaking peoples (Hs = 0.77324) in comparison to
that of the Niger–Congo speakers (Hs = 0.79514), a trend
which is expected due to the widespread diversity com-
monly found throughout sub-Saharan Africa (Table 4). The
Malgache seem to be the exemption to the rule within the
Austronesians, given that their average heterozygosity is
comparable to that of the African groups (Shepard and
Herrera 2006). It is likely that the reduced heterogeneity
observed in Austronesian groups compared to sub-Saharan
African populations developed as a result of allelic
drop-outs in serial bottleneck events during island hopping,
while the greater number of alleles in Madagascar and
continental African populations reflect their well estab-
lished high level of diversity. These findings not only
mirror previous Centroid analysis results by Chow et al.
(2005) indicating a high degree of gene flow into the East
African island, but lend support to the belief that different
source populations have contributed to the Madagascar
gene pool (Hurles et al. 2005).
The inter-population variability among the Austrone-
sians (Gst = 0.03058) is only slightly lower than that of the
all-populations group (Gst = 0.03342) and substantially
higher than that of the Niger–Congo speaking populations
(Gst = 0.00833) and Melanesians (Gst = 0.01309). The
relatively high inter-population diversity value among the
Austronesians is most likely related to the genetic differ-
ences generated by genetic drift emanating from bottleneck
episodes during their diaspora. The relatively low Gst
values among the Melanesians when compared to the
Austronesians may suggest that the former have not been
subject to recent evolutionary processes capable of parti-
tioning them genetically. These results parallel the
widespread heterogeneity found between the Austronesian
populations observed in the G test in which only the geo-
graphically proximal populations (Samoa/Tonga, and
Malaysia/Java after applying the Bonferroni correction) do
not differ significantly whereas several geographically
distant pairs of populations from Africa yield insignificant
differences (Supplementary Table 2) supporting previous
reports of genetic homogeneity throughout the area (Un-
derhill et al. 2001).
-0.45 -0.23 0.00 0.23 0.45
-0.56
-0.28
0.00
0.28
0.56
DAM
NOT
A IM
A AT
MAS
LAB
VAJ
AMMIHP
ZOM
A GN
UTRUHRNEK
FAS
UGE
A SU
ATE
ITEA
xis
2 13
.22%
Axis 1 31.11%
Fig. 2 Correspondence
analysis of Austronesian and
African populations
116 J Hum Genet (2008) 53:106–120
123
The Madagascar collection significantly differs from all
populations in the G test, echoing the results of the CA plot
and ML dendogram where it does not conform to any one
cluster. Admixture analysis results reveal contributions
from both African (66.1%) and Southeast Asian populations
(33.9%), supporting previous studies utilizing the Rh factor
(Singer et al. 1957), mtDNA and the Y-chromosome
(Hurles et al. 2005) signaling contributions from both
regions. Our results indicate that the main contributors to
the Malgache gene pool are the East African groups
(46.5%), although a clear input from the West African
populations (18.7%) can also be discerned. This is expected
considering the geographic vicinity of insular Madagascar
to continental East Africa. It is possible that the West
African component results from the genetic imprint left by
the Bantu expansion throughout Southeast Africa. Underhill
et al. (2000) have reported that the Y-chromosomal marker
E3a (M2 mutation) and its subclades, largely present within
the African genetic landscape, are directly linked to the
spread of Bantu farmers from West Africa. Furthermore,
both Underhill et al. (2000) and Beleza et al. (2005) have
found that the expansion led to a genetic displacement of
older native Y-chromosomes and to a decrease in the line-
age’s diversity throughout the area. In addition, based on
mtDNA data, Plaza et al. (2004) have found evidence of
continued interactions between West Africa (specifically
Angola) and Southeast Africa. It is important to note then,
that the similarities between West Africa and Madagascar
are likely due to the genetic history of mainland African
populations rather than direct gene flow into the island from
West African groups.
Singer et al. (1957) identified Indonesia as the main
Austronesian contributor to the Malgache. In contrast, the
high-resolution, biparental genetic markers and array of
informative populations of the present study suggest that
the Austronesian source populations of Madagascar are the
Malayo-Filipino group (17.8%) and the Taiwanese
aborigines (17.0%), and not the Indonesian populations
from Java and Bali. These results support Y-chromosomal
data by Su et al. (2000) and Hurles et al. (2005) confirming
the presence of Southeast Asian Y-chromosomes in the
island.
Similar to Madagascar, the Polynesian groups in this
study exhibit genetic inputs from the Taiwanese Aborigi-
nes (10.6% for Tonga and 3.1% for Samoa). Interestingly,
Table 6 Admixture analysis of Samoa and Tonga
Parental groups Hybrid population
Samoa Tonga
Southeast Asian 0.758 ± 0.079 0.646 ± 0.081
Melanesian 0.242 ± 0.079 0.354 ± 0.082
Taiwanese Aborigines 0.031 ± 0.109 0.106 ± 0.112
Indonesian 0.000 ± 0.150 0.000 ± 0.155
Malayo-Filipino 0.765 ± 0.210 0.569 ± 0.217
Melanesian 0.204 ± 0.081 0.325 ± 0.084
AUS
MMA
BALJAV
615
493
ATA
AMIPHI
616
468
894
ETI
ETA
534463
771
TON
SAM 998
MAD
ANGEGU
284
KEN
RTURHU
614
318
572
MOZ
SAF
720
953
803
1000
Fig. 3 Maximum Likelihood phylogram of Austronesian and African
populations
Table 5 Admixture analysis of Madagascar
Parental groups Hybrid population
Madagascar
African 0.661 ± 0.034
Austronesian 0.339 ± 0.033
Taiwanese Aborigines 0.170 ± 0.058
Indonesian 0.000 ± 0.081
Malayo-Filipino 0.178 ± 0.114
East African 0.465 ± 0.103
West African 0.187 ± 0.106
J Hum Genet (2008) 53:106–120 117
123
Scheinfeldt et al. (2006) have suggested that the Ami are
the ancestors of all Austronesians outside Taiwan since the
Y-chromosome O3a (M122) lineage found within Poly-
nesia is represented considerably in the Ami and only at
low frequencies in other Formosan aboriginal groups.
Nevertheless, O3a (M122) is found in other Taiwanese
aboriginal tribes making it difficult to deduce their poten-
tial contribution (Scheinfeldt et al. 2006). Resolution of the
issue concerning the Taiwanese aboriginal source popula-
tion to Austronesians outside Taiwan awaits systematic
work involving all the Formosan tribes utilizing various
types of marker systems.
The Malayo-Filipino assemblage appears to be the pri-
mary autosomal genetic contributor to both Samoa (76.5%)
and Tonga (56.9%) and may signal an ancestor-descendant
relationship between Malaysia and Polynesia. Malaysia
and the Philippines may represent one of many stages of a
migration originally from mainland or insular Southeast
Asia. As with Madagascar, no Indonesian autosomal signal
is detected in Samoa and Tonga (Tables 5 and 6). The
absence of an Indonesian component may be indicative of
an Austronesian bypass of this region during the spread, or
the elimination of Austronesian DNA resulting from
admixture or displacement by native and/or subsequently
invading populations and/or genetic drift.
Previous studies have found a genetic separation
between Samoa and other Austronesian groups (Parra et al.
1999; Shepard et al. 2005), a finding also observed in the
present study for both Samoa and Tonga. Although
genetically distinct from other Austronesian peoples, these
two Pacific populations lie closest to the Austronesian
cluster in the CA along axis 2 (Fig. 2), supporting previous
mtDNA and linguistic studies suggesting that phylogenetic
relationships among Austronesians are genetic in nature
and not merely the product of language replacement in
genetically autonomous groups (Trejaut et al. 2005). Along
axis 1 of the plot, the populations are most closely related
to the Australian aborigines and East Timorese, supporting
previous findings by Kayser et al. (2006) based on mtDNA
and Y-chromosomal data which indicate that Polynesian
populations represent a composite of Southeast Asian and
Melanesian lineages. Admixture analysis results advocate
these statements and reveal that 75.8% of the Samoan
autosomal component and 64.6% of Tonga’s are of
Southeast Asian origin while the remaining (24.2 and
35.4%, respectively) are of Melanesian descent. Alto-
gether, the data strengthen the claims of the ‘‘slow boat’’
hypothesis, proposed by Kayser and colleagues (2000),
postulating that Austronesian dispersal to Polynesia
occurred slowly allowing for the assimilation of the Mel-
anesian genetic matrix along its course.
The dichotomy in the data attained from previous
Y-chromosome and mtDNA reports does not allow a clear
panorama as to the origin(s) and migrational patterns of the
Austronesian expansion. In the present study, we employ a
battery of STR hypervariable genetic markers to discern
the representative autosomal diversity (instead of the
maternally and paternally restricted lineages) and phylo-
genetic relationships of Austronesian-speaking groups
from Madagascar as well as Tonga and Samoa in Polynesia
with geographically targeted reference populations from
Southeast Asia and Africa. The data indicate that the
Malgache gene pool derives 66.3% of its genetic makeup
from the African mainland while still retaining some of its
Southeast Asian roots (33.7%). Similarly, while the
Samoan and Tongan collections possess differing degrees
of Melanesian influence (24.2 and 35.4%, respectively)
they still exhibit a considerable contribution from insular
Southeast Asia (75.8 and 64.6%, respectively). Further-
more, according to admixture proportions, the Taiwanese
aborigines have contributed genetically to the collections
of Samoa, Tonga, and Madagascar whereas the Indonesian
groups from Bali and Java have not. These results may be
indicative of an expansion route which may have origi-
nated in Formosa, dispersed southward by way of the
Philippines and Malaysia, and then bifurcated into east-
ward (toward Micronesia/Polynesia in the Pacific) and
westward (eventually reaching Madagascar by way of the
Indian Ocean) trajectories. Altogether, the data support the
contention that Austronesian populations share genetic
components that bind them together beyond the effects of
genetic drift resulting from serial bottleneck episodes as
limited number of individuals migrated large geographic
distances across vast oceanic expanses.
References
Adelaar A (1995) Asian roots of the Malagasy: a linguistic
perspective. Bijdragen tot de Taal-Land en Volkenkunde
151:325–356
Alves C, Gusmao L, Damasceno A, Soares B, Amorim A (2004)
Contribution for an African autosomic STR database (AmpF/
STR Identifiler and Powerplex 16 System) and a report on
genotypic variations. Forensic Sci Int 139(2–3):201–205
Alves C, Gusmao L, Lopez-Parra AM, Soledad Mesa M, Amorim A,
Arroyo-Pardo E (2005) STR allelic frequencies for an African
population samples (Equatorial Guinea) using AmpF/STR Iden-
tifiler and Powerplex 16 kits 148(2–3):239–242
Antunez de Mayolo G, Antunez de Mayolo A, Antunez de Mayolo P,
Papiha SS, Hammer MF, Yunis EJ, Yunis EE, Damodara C,
Martinez de Pancorbo M, Caeiro JL, Puzyrv VP, Herrera RJ
(2002) Phylogenetics of worldwide human populations as
determined by polymorphic Alu insertions. Electrophoresis
23:3346–3356
Applied Biosystems (2001) AmpFlSTR Identifiler PCR Amplification
Kit User’s Manual. Foster City
Barnholtz-Sloan JS, Pfaff CL, Chakraborty R, Long JC (2005)
Informativeness of the CODIS STR loci for admixture analysis. J
Forensic Sci 50(6):1322–1326
118 J Hum Genet (2008) 53:106–120
123

Beleza S, Alves C, Reis F, Amorim A, Carracedo A, Gusmao L (2004)
17 STR data (AmpF/STR Identifiler and Powerplex 16 System)
from Cabinda (Angola). Forensic Sci Int 141(2–3):193–196
Beleza S, Gusmao L, Amorim A, Carracedo A., Salas A (2005) The
genetic legacy of western Bantu migrations. Hum Genet
117:366–375
Bellwood P (1990) From Late Pleistocene to Early Holocene in
Sundaland. In: Gable C, Sofer O (eds) The World at 18,000 BP,
vol 2. Unwin Hyman, London, pp 255–263
Bellwood P (1997) Prehistory of the Indo-Malaysian Archipelago,
revised edn. University of Hawai’i Press, Honolulu
Brenner C, Morris J (1990) Paternity index calculations in single
locus hypervariable DNA probes: validation and other studies.
In: Proceedings for the international symposium on human
identification 1989. Madison, Promega, pp 21–53
Capelli C, Wilson JF, Richards M, Stumpf MP, Gratrix F, Oppen-
heimer S, Underhill PA, Pascali VL, Ko R, Goldstein DB (2001)
A Predominantly indigenous paternal heritage for the Austrone-
sian speaking peoples of Insular Southeast Asia and Oceania.
Am J Hum Genet 68:432–443
Carmody G (1990) G-test. Carleton University, Ottowa
Chow RA, Caeiro JL, Chen SJ, Garcia-Bertrand RL, Herrera RJ
(2005) Genetic characterization of four Austronesian-speaking
populations. J Hum Genet 50(11):550–559
Collins-Schramm HE, Kittles RA, Operario DJ, Weber JL, Criswell
LA, Cooper RS, Seldin MF (2002) Markers that discriminate
between European and African ancestry show limited variation
within Africa. Hum Genet 111:566–569
Collins-Schramm HE, Chima B, Operario DJ, Criswell LA, Seldin
MF (2003) Markers informative for ancestry demonstrate
consistent megabase-length linkage disequilibrium in the African
American population. Hum Genet 113:211–219
Collins-Schramm HE, Chima B, Morii T, Wah K, Figueroa Y,
Criswell LA, Hanson RL, Knowler WC, Silva G, Belmont JW,
Seldin MF (2004) Mexican American ancestry-informative
markers: examination of population structure and marker
characteristics in European Americans, Mexican Americans,
Amerindians and Asians. Hum Genet 114:263–271
Dahl OC (1951) Malgache et Maanyan: une comparison linguistique.
Egede Intitutett, Oslo
Dahl OC (1988) Bantu substratum in Malagasy. E tudes Ocean Indien
9:91–132
David R (1940) Le probleme anthropobiologic Malgache. Bull Acad
Malgache 23:1–31
De Ungria M, Roby R, Tabbada K, Rao-Coticone S, Tan M,
Hernandez K (2005) Allele frequencies of 19 STR loci in a
Philippine population generated using AmpFlSTR multiplex and
ALF singleplex systems. Forensic Sci Int 152(2–3):281–284
Diamond JM (2000) Taiwan’s gift to the world. Nature 403:709–710
Eckoff C, Walsh SJ, Buckleton JS (2007) Population data from sub-
populations of the Northern Territory of Australia for 15
autosomal short tandem repeat (STR) loci. Forensic Sci Int
171:237–249
Felsenstein J. (2002) Phylogeny inference package (PHYLIP),
Version 3.6a3. Distributed by author. Department of Genetics,
University of Washington, Seattle
Gray RD, Jordan FM (2000) Language trees support the express-train
sequence of Austronesian expansion. Nature 405:1052–1055
Green RC (1999) Integrating historical linguistics with archaeology:
insights from research in Remote Oceania. Indo-Pacific Prehis-
tory Assoc Bull 18:3–16
Guo S, Thompson E (1992) Performing the exact test of Hardy–
Weinberg proportion for multiple alleles. Biometrics 48:361–
372
Hagelberg E, Goldman N, Li´o P, Whelan S, Schiefenhovel W, Clegg
JB, Bowden DK (1999) Evidence for mitochondrial DNA
recombination in a human population of island Melanesia. Proc
R Soc Lond B 266:485–492
Hashiyada M, Itakura Y, Nagashima T, Nata M, Funayama M (2003)
Polymorphism of 17 STRs by multiplex analysis in Japanese
population. Forensic Sci Int 133:250–253
Hewitt R, Krause A, Goldman A, Campbell G, Jenkins T (1996) b-
globin haplotype analysis suggests that a major source of
Malagasy ancestry is derived from Bantu-speaking Negroids.
Am J Hum Genet 58:1303–1308
Hu SP, Yu XJ, Liu JW, Cai KL (2005) Analysis of STR polymor-
phisms in the Chao Shan population in South China. Forensic Sci
Int 147:93–95
Hurles ME, Nicholson J, Bosch E, Renfrew C, Sykes BC, Jobling MA
(2002) Y chromosomal evidence for the origins of oceanic-
speaking peoples. Genetics 160:289–303
Hurles ME, Sykes BC, Jobling MA, Forster P (2005) The dual origin
of the Malagasy in Island Southeast Asia and East Africa:
evidence from Maternal and Paternal Lineages. Am J Hum
Genet 76:894–901
Ibarra-Rivera L, Mirabal S, Regueiro MM, Herrera RJ (2007)
Delineating genetic relationships among the Maya. Am J Phys
Anthropol (in press)
Jones DA (1972) Blood samples: probability of discrimination.
J Forensic Sci Soc 12:355–359
Jorde LB, Rogers AR, Bamshad M et al (1997) Microsatellite
diversity and the demographic history of modern humans. Proc
Natl Acad Sci USA 94:3100–3103
Kayser M, Brauer S, Wiss G, Schiefenhovel W, Underhill PA,
Stoneking M (2000) Melanesian origin of Polynesian Y chro-
mosomes. Curr Biol 10:1237–1246
Kayser M, Brauer S, Cordaux R, Casto A, Lao O, Zhivotovsky LA,
Moyse-Faurie C, Rutledge RB, Schiefenhoevel W, Gil D, Lin
AA, Underhill PA, Oefner PJ, Trent RJ, Stoneking M (2006)
Melanesian and Asian Origins of Polynesians: mtDNA and Y
chromosome gradients across the Pacific. Mol Biol Evol
23(11):2234–2244
Kido A, Dobashi Y, Fujitani N, Hara M, Susukida R, Kimura H, Oya
M (2007) Population data on the AmF/STR Identifiler loci in
Africans and Europeans from South Africa. Forensic Sci Int
168(2–3):232–5
Kim YL, Hwang JY, Kim YJ, Lee S, Chung NG, Goh HG, Kim CC,
Kim DW (2003) Allele frequencies of 15 STR loci using
AmpFlSTR Identifiler kit in a Korean population. Forensic Sci
Int 136:92–95
Levene H (1949) On a matching problem arising in genetics. Ann
Math Stat 20:91–94
Long JC, Williams RC, McAuley JE, Meids R, Partel R, Tregellas M,
South SF, Rea AE, McCormick B, Iwaniec U (1991) Genetic
variation in Arizona Mexican Americans: estimation and inter-
pretation of admixture proportions. Am J Phys Anthropol
84:141–157
Lum JK (1998) Central and Eastern Micronesia: genetics, the
overnight voyage, and linguistic divergence. Man Culture
Oceania 14:69–80
Lum JK, Jorde LB, Schiefenhovel W (2002) Affinities among
Melanesians, Micronesians, and Polynesians: a netral, biparental
genetic perspective. Hum Biol 74(3):413–430
Melton T, Peterson R, Redd AJ, Saha N, Sofro ASM, Martinson J,
Stoneking M (1995) Polynesian genetic affinities with Southeast
Asian populations as identified by mtDNA analysis. Am J Hum
Genet 57:403–414
Migot F, Perichon B, Danze PM, Raharimalala L, Lepers JP,
Deloron P, Krishnamoorthy R (1995) HLA class II haplotype
studies bring molecular evidence for population affinity
between Madagascans and Javanese. Tissue Antigens
46:131–135
J Hum Genet (2008) 53:106–120 119
123
Novick GE, Novick CC, Yunis E, Yunis J, Martınez K, Duncan GG,
Troup GM, Deininger PL, Stoneking M, Batzer MA, Herrera RJ
(1995) Polymorphic human-specific Alu insertions as markers
for human identification. Electrophoresis 16:1596–1601
Oppenheimer S, Richards M (2001a) Fast trains, slow boats, and the
ancestry of the Polynesian islanders. Sci Prog 84:157–181
Oppenheimer SJ, Richards M (2001b) Polynesian origins. Slow boat
to Melanesia? Nature 410:166–167
Ota T (1993) DISPAN: genetic distance and phylogenetic analysis.
Institute of Molecular Evolutionary Genetics, Pennsylvania State
University, University Park
Parra E, Shriver MD, Soemantri A et al (1999) Analysis of five Y-
specific microsatellite loci in the Asian and Pacific populations.
Am J Phys Anthropol 110(1):1–16
Perez-Miranda AM, Alfonso-Sanchez MA, Kalantar A et al (2005)
Allelic frequencies of 13 STR loci in autochthonous Basques
from the province of Vizcaya (Spain). Forensic Sci Int 152(2–
3):259–262
Perez-Miranda AM, Alfonso-Sanchez MA, Pena JA, Herrera RJ
(2006) Qatari DNA variation at a crossroad of human migra-
tions. Hum Hered 61(2):67–79
Plaza S, Salas A, Calafell F, Corte-Real F, Bertranpetit J,
Carracedo A, Comas D (2004) Insights into the western
Bantu dispersal: mtDNA lineage analysis in Angola. Hum
Genet 115:439–447
Raymond M, Rousset F (1995) genepop (version 1.2): population
genetics software for exact tests and ecumenicism. J Hered
86:248–249
Redd AJ, Takezaki N, Sherry ST et al (1995) Evolutionary history of
the COII/tRNALys intergenic 9 base pair deletion in human
mitochondrial DNAs from the Pacific. Mol Biol Evol 12:604–
615
Regueiro M, Carril JC, Pontes ML, Pinheiro MF, Luis JR, Caeiro B
(2004) Allele distribution of 15 PCR-based loci in the Rwanda
Tutsi population by multiplex amplification and capillary
electrophoresis. Forensic Sci Int 143(1):61–63
Reynolds J, Weir BS, Cockerham CC (1983) Estimation of the
coancestry coefficient: Basis for a short term genetic distance.
Genetics 105:767–779
Richards M, Oppenheimer S, Skyes B (1998) MtDNA suggests
Polynesian origins in eastern Indonesia. Am J Hum Genet
63:1234–1236
Rohlf F (2002) NTSYSpc. Setauket, NY: Exeter Publishing. Reynolds
J, Weir BS, Cockerham CC. 1983. Estimation of the coancestry
coefficient: Basis for a short term genetic distance. Genetics
105:767–779
Rowold DJ, Herrera RJ (2003) Inferring recent human phylogenies
using forensic STR technology. Forensic Sci Int 133:260–265
Ruhlen M (1994) The origin of language: tracing the origin of the
mother tongue. Wiley, New York, pp 177–180
Scheinfeldt L, Friedlaender F, Friedlaender J, Lathan K, Koki G,
Karafet T, Hammer M, Lorenz J (2006) Unexpected NRY
chromosome variation in Northern Island Melanesia. Mol Biol
Evol 23(8):1628–1641
Schneider S, Kueffer J-M, Roessli D et al (2000) Arlequin v. 2000: a
software for population genetics data analysis. Genetics and
Biometry Laboratory, University of Geneva, Geneva
Seah LH, Jeevan NH, Othman MI et al (2003) STR data for the
AmpFISTR Identifiler loci in three ethic groups (Malay,
Chinese, Indian) of the Malaysian population. Forensic Sci Int
138:134–137
Shepard EM, Herrera RJ (2006) Iranian STR variation at the fringes of
biogeographical demarcation. Forensic Sci Int 158(2–3):140–148
Shepard EM, Chow RA, Suafo’a E, Addison D, Perez-Miranda AM,
Garcia-Bertrand RL, Herrera RJ (2005) Autosomal STR varia-
tion in five Austronesian populations. Hum Biol 77(6):825–851
Singer R, Budtz-Olsen OE, Brain P, Saugrain J, (1957) Physical
features, sickling and serology of the Malagasy of Madagascar.
Am J Phys Anthropol 15(1):91–124
Soljak PL (1946) Island Kingdom of Tonga. Far Eastern Surv
15(15):232–233
Soodyall H, Jenkins T, Stoneking M (1995) ‘‘Polynesian’’ mtDNA in
the Malagasy. Nat Genet 10:377–378
Souto L, Alves C, Gusmao L, Ferreira E, Amorim A, Corte-Real F,
Vieira DN (2005) Population data on 15 autosomal STRs in a
sample from East Timor. Forensic Sci Int 155:77–80
Su B, Jin L, Underhill P, Martinson J, Saha N, McGarvey ST, Shriver
MD, Chu J, Oefner P, Chakraborty R, Deka R (2000) Polynesian
origins: insights from the Y chromosome. Proc Natl Acad Sci
USA 97:8225–8228
Sykes B, Leiboff A, Low-Beer J et al (1995) The origin of the
Polynesians: an interpretation from mitochondrial lineage anal-
ysis. Am J Hum Genet 57:1463–1475
Tereba, A. (1999) Tools for analysis of population statistics. In:
MacIver I (ed) Profiles in DNA. Promega Corporation, v. 2,
Madison, pp 14–16
Terrell JE, Hunt TL, Gosden C (1997) The dimensions of social life in
the Pacific. Curr Anthropol 38:155–195
Trejaut JA, Kivisild T, Loo JH, Lee CL, He CL, Hsu CJ, Li ZY, Lin
M (2005) Traces of archaic mitochondrial lineages persist in
Austronesian speaking Formosan populations. PLoS Biol 3:e247
Underhill PA, Shen P, Lin AA, Jin L, Passarino G, Yang WH,
Kauffman E, Bonne-Tamir B, Bertranpetit J, Francalacci P,
Ibrahim M, Jenkins T, Kidd JR, Mehdi SQ, Seielstad MT, Wells
RS, Piazza A, Davis RW, Feldman MW, Cavalli-Sforza LL,
Oefner PF (2000) Y chromosome sequence variation and the
history of human populations. Nat Genet 26(3):358–361
Underhill PA, Passarino G, Lin AA, Shen P, Mirazon Lahr M, Foley
RA, Oefner PJ, Cavalli-Sforza LL (2001) The phylogeography
of Y chromosome binary haplotypes and the origins of modern
human populations. Ann Hum Genet 65:43–62
Wang ZY, Yu RJ, Wang F, Li XS, Jin TB (2005) Genetic
polymorphisms of 15 STR loci in Han population from Shaanxi
(NW China). Forensic Sci Int 147:89–91
Weir BS, Cockerman CC (1984) Estimating F-statistics for the
analysis of population structure. Evolution 38:1358–1370
120 J Hum Genet (2008) 53:106–120
123
Copyright © 2022 FDOKUMEN