Site response estimation in the Vittorio Veneto area (NE Italy) Part 1: geophysical measurements and...
17
369 Site response estimation in the Vittorio Veneto area (NE Italy) Part 1: geophysical measurements and in situ soil characterization A. VUAN 1 , E. PRIOLO 1 , A. RESTIVO 1 , C. BARNABA 1 , G. LAURENZANO 1 , A. MICHELINI 2 , P. DI BARTOLOMEO 1 and M. ROMANELLI 1 1 Istituto Nazionale di Oceanografia e di Geofisica Sperimentale, Udine, Italy 2 Istituto Nazionale di Geofisica e Vulcanologia, Roma, Italy (Received: November 18, 2005; accepted: March 21, 2007) ABSTRACT In 1936, the Vittorio Veneto (Treviso, NE Italy) area was heavily hit by a M=5.8 earthquake that occurred about 20 km from the city. The damage distribution was heterogeneous, suggesting the influence of site effects. In order to assess the seismic response of this area, surveys were conducted consisting of seismic noise measurements (Nakamura’s approach), reference site spectral ratios (RSSR) of weak earthquakes and shallow seismic refraction profiling. The horizontal-to-vertical spectral ratios (HVSR) from the ambient noise measurements reveal clear resonant peaks with variable HVSR amplitudes. The large amplitude of most peaks suggests an impedance contrast at shallow depths. The RSSR of about 40 weak events provide quantitative estimates of the seismic amplification in the northern part of Vittorio Veneto. Two sites, located on the left bank of the river, show high values of amplification, about 5 times larger than the signal amplitude at the reference sites, with a narrow-band peak at a frequency of about 5 Hz. The results generally agree with the HVSR resonant frequencies. In addition, a shear wave velocity profiling based on the inversion of Rayleigh waves has been performed at some sites. The technique consists of a surface wave analysis on both single and multichannel seismic records to retrieve the phase and group velocity of the Rayleigh wave fundamental mode and an inversion of the dispersion curves to obtain S-wave velocity models. The resulting equivalent S-wave velocity profiles are then constrained to match the observed HVSR fundamental resonant frequencies. 1. Introduction The area of Vittorio Veneto (see Fig. 1) is prone to earthquakes. On October 18, 1936, it was hit by a M=5.8 event localized at about 20 km from the city, that caused a very heterogeneous damage distribution, with maximum MCS intensity of IX, suggesting the occurrence of site effects. The maximum damage occurred in the south-western part of the Vittorio Veneto area (Fig. 2; CEN area) and in the Vittorio Veneto town centre (VVC). Severe damage was caused here and some buildings collapsed. Before the 1936 earthquake, the area had been struck by several other, important historical earthquakes, such as the 1776 Tramonti event (MCS intensity VIII-IX), the 1873 Belluno event (MCS intensity X), and the 1695 Asolo event (MCS intensity IX). Blind active faults exist within the area (Poli et al., 2008), while other potential, seismogenic structures Bollettino di Geofisica Teorica ed Applicata Vol. 49, n. 3-4, pp. 369-385; September-December 2008 © 2008 – OGS
-
Upload
independent -
Category
Documents
-
view
0 -
download
0
Transcript of Site response estimation in the Vittorio Veneto area (NE Italy) Part 1: geophysical measurements and...

369
Site response estimation in the Vittorio Veneto area (NE Italy)Part 1: geophysical measurements and in situ soil characterization
A. VUAN1, E. PRIOLO1, A. RESTIVO1, C. BARNABA1, G. LAURENZANO1, A. MICHELINI2,P. DI BARTOLOMEO1 and M. ROMANELLI1
1 Istituto Nazionale di Oceanografia e di Geofisica Sperimentale, Udine, Italy2 Istituto Nazionale di Geofisica e Vulcanologia, Roma, Italy
(Received: November 18, 2005; accepted: March 21, 2007)
ABSTRACT In 1936, the Vittorio Veneto (Treviso, NE Italy) area was heavily hit by a M=5.8earthquake that occurred about 20 km from the city. The damage distribution washeterogeneous, suggesting the influence of site effects. In order to assess the seismicresponse of this area, surveys were conducted consisting of seismic noisemeasurements (Nakamura’s approach), reference site spectral ratios (RSSR) of weakearthquakes and shallow seismic refraction profiling. The horizontal-to-verticalspectral ratios (HVSR) from the ambient noise measurements reveal clear resonantpeaks with variable HVSR amplitudes. The large amplitude of most peaks suggests animpedance contrast at shallow depths. The RSSR of about 40 weak events providequantitative estimates of the seismic amplification in the northern part of VittorioVeneto. Two sites, located on the left bank of the river, show high values ofamplification, about 5 times larger than the signal amplitude at the reference sites,with a narrow-band peak at a frequency of about 5 Hz. The results generally agreewith the HVSR resonant frequencies. In addition, a shear wave velocity profilingbased on the inversion of Rayleigh waves has been performed at some sites. Thetechnique consists of a surface wave analysis on both single and multichannel seismicrecords to retrieve the phase and group velocity of the Rayleigh wave fundamentalmode and an inversion of the dispersion curves to obtain S-wave velocity models. Theresulting equivalent S-wave velocity profiles are then constrained to match theobserved HVSR fundamental resonant frequencies.
1. Introduction
The area of Vittorio Veneto (see Fig. 1) is prone to earthquakes. On October 18, 1936, it washit by a M=5.8 event localized at about 20 km from the city, that caused a very heterogeneousdamage distribution, with maximum MCS intensity of IX, suggesting the occurrence of siteeffects. The maximum damage occurred in the south-western part of the Vittorio Veneto area (Fig.2; CEN area) and in the Vittorio Veneto town centre (VVC). Severe damage was caused here andsome buildings collapsed. Before the 1936 earthquake, the area had been struck by several other,important historical earthquakes, such as the 1776 Tramonti event (MCS intensity VIII-IX), the1873 Belluno event (MCS intensity X), and the 1695 Asolo event (MCS intensity IX). Blindactive faults exist within the area (Poli et al., 2008), while other potential, seismogenic structures
Bollettino di Geofisica Teorica ed Applicata Vol. 49, n. 3-4, pp. 369-385; September-December 2008
© 2008 – OGS

370
Boll. Geof. Teor. Appl., 49, 369-385 Vuan et al.
are argued. In order to assess the seismic response in Vittorio Veneto and map the local effects due to
different shallow soils (see Priolo et al., 2008), field surveys based on the integration of differentseismological methods, were carried out.
First, we conducted a study based on the analysis of environmental noise recordings,following Nakamura’s approach (1989). This well known technique is based on the observationthat “the vertical component is not subject to the very important site effects suffered by thehorizontal components and may thus be used to measure ground motion incident to the very localsite conditions” (Lermo and Chavez-Garcia, 1993). Recent studies (Bard, 1999; Faeh et al., 2001)have confirmed the close connection between horizontal-to-vertical spectral ratios (HVSR) andthe ellipticity of surface waves (Nogoshi and Igarashi, 1970). Thus, the ratio between thehorizontal and vertical spectral components of motion can reveal the presence of amplificationpeaks due to the presence of an impedance contrast at some depth, and provide a first order
Fig. 1 - Base map of the study area, showing the location of Vittorio Veneto (black diamond) and the epicentre of theM=5.8, October 18, 1936 Cansiglio earthquake.

371
Site response in Vittorio Veneto: part 1 Boll. Geof. Teor. Appl., 49, 369-385
estimate of the spatial distribution of the amplification. The use of microtremors for siteamplification studies has become quite popular in recent years for many reasons. For instance, itallows for significant reductions in field data acquisition time and costs; it does not require anongoing earthquake sequence; and it does not require the long and simultaneous deployment ofseveral instruments to collect a useful data set.
The site response has also been estimated at eight sites located in the northern part of VittorioVeneto (see Fig. 2; SRV and VVC) by computing the spectral ratios of two reference sites (RSSR)for a data-set of weak earthquakes recorded during a period of about six months. The methodused to estimate the RSSR is the generalized inverse technique (GIT). And was originallyproposed by Andrews (1986), and allows is to determine spectral ratios for each component ofthe seismic signal with respect to one or more pre-defined reference sites (Field and Jacob, 1995;Hartzell et al., 1996; Bonilla et al., 1997; Parolai et al., 2000; Michelini and Govoni, 2001).
The RSSR computed at these points by comparison with HVSR measurements at the samesites helped in the amplitude calibration of the whole HVSR data set to allow the mapping of boththe resonant frequency and the corresponding amplification level [details on the procedure arebetter explained in Priolo et al. (2008)].
In order to gain a better understanding of the shear wave distribution with depth, some shallowseismic refraction survevs have been carried out. A surface wave analysis has been performed onmulti-channel records as well as on single-station records acquired simultaneously. Rayleighwaves contain important pieces of information, which are strictly related to the S-wave velocityprofile. Recent field tests demonstrated the accuracy and consistency of calculating near-surfaceS-wave velocities using multi-channel analysis of surface waves [MASW, e.g., Xia et al. (2002)].In seismic prospecting, the application of these techniques is increasing since they are notinvasive and present significant economical advantages in comparison with down-hole and cross-hole methods. In this study, we took advantage of the HVSR information (i.e. the frequency ofthe HVSR peak) to constrain the inversion of the 1-D S-wave velocity profile of soils.
2. Geological description of the area
The study area belongs to the Southalpine domain and the main tectonic structures are southand south-east verging thrust faults. The city of Vittorio Veneto is located on the southern slopesof the Belluno Pre-Alps. The city extends length wise from NNW to SSE, where the outlet of theMeschio River goes into the Venetian plain. The city is located on Quaternary deposits, while thepre-Quaternary substratum only outcrops in the surrounding zones. Different soil types outcropin this area (see Fig. 2 for reference). Lacustrine or peat deposits are found in old Serravalle(SRV) along a 200 m wide gorge, north of Serravalle castle and in Ceneda (CEN). Pelites andsands, of alluvial or colluvial origin, characterize the town centre of Vittorio Veneto (VVC), whilesouthwards, where the modern city settlement is growing, surface sediments become coarser(gravels and cobbles; VVN). Several alluvial fans surround the city. They originate from thelateral streams and tributary rivers that flow from the mountain flanks. In general, they arecomposed of relatively fine sediments (commonly silt, clay or sand). Debris and glacial depositsoutcrop both west and east of the investigated area. A more detailed description of the localgeology with maps of the Quaternary deposits is given in this volume (Avigliano et al., 2008).

372
Boll. Geof. Teor. Appl., 49, 369-385 Vuan et al.
Fig. 2 - Base map of the Vittorio Veneto municipal area showing the location of the seismic noise acquisition sites(black circles), temporary seismic stations for reference site spectral ratios of weak earthquakes (white squares) andrefraction lines (black solid lines) used for the surface waves analysis.

373
Site response in Vittorio Veneto: part 1 Boll. Geof. Teor. Appl., 49, 369-385
3. Horizontal to vertical spectral ratios
3.1. Data acquisition and processing
Seismic noise was recorded at about 100 different sites (Fig. 2). Data was acquired using twodifferent types of portable seismic stations, namely Orion Nanometrics and MarsLite Lennartz,all equipped with three component 1 Hz Lennartz Le-3C sensors. These sensors have a flatfrequency response between 1 and 80 Hz. Below 1 Hz, the instrument response decays atapproximately 10 db/octave so that the signal-to-noise ratio is high enough to compute thespectral ratios down to the frequency of about 0.2-0.5 Hz. At each site, microtremors wererecorded for a minimum time of twenty minutes. The sampling interval was set at 100 Hz, toguarantee reliable spectral estimates up to 30 Hz.
The mean H/V ratio is estimated from HVSR measurements computed on a set of runningtime windows. Outliers are manually removed at the pre-processing stage, producing a set ofseparate data time windows. We used a window length of 180 seconds with a 10% overlap. Aminimum of six running time windows, for a total length of 20-30 minutes, were used todetermine the mean HVSR. For the generic i-th time window, the signal was processed asfollows:
1) DC removal and linear detrending; 2) 5% cosine tapering; 3) computing the horizontal component of motion as vectorial sum of the two horizontal
components; 4) computing the square root of the power spectral density (PSD) of the horizontal and vertical
components (Hi and Vi, respectively); 5) computing the {H/V}i = Hi/Vi ratio; and 6) estimating the average H/V and the associated
error by the median and standard deviation of the {H/V}i population, respectively. In such processing, the PSD (step 4) is computed using methodologies for the analysis of
noisy signals, i.e. the Welch’s (Welch, 1967) or Burg’s (Kay and Marple, 1981) methods, and nosmoothing is applied in the spectral ratio computation (step 5). In our tests, the two methodsprovide very similar estimates.
3.2. Results
The final dataset consists of HVSR estimates from seismic background noise at about 100sites. The frequency band of analysis is 0.5-22 Hz, which is the most important for seismicengineering purposes. The amplitude of the seismic noise recorded at all sites in the VittorioVeneto municipal area is generally large, as a result of many anthropic activities (e.g., machinery,cars, etc). The HVSR standard deviation is generally low, confirming an overall stability of theestimations. Most sites display clear resonant peaks, with variable HVSR amplitudes, while onlyfew of them feature a flat response. Fig. 3 shows the peak resonance frequencies and thecorresponding HVSR amplitude at each site. The colour and size of the circles indicate H/V peakfrequency and amplitude respectively. White circles (i.e. in SRV) indicate sites with very low H/Vamplitude or flat response. The measured peak frequencies have then been interpolated in orderto visually enhance the spatial distribution. The resulting map suggests the presence of fourdistinct zones characterized by different resonance frequencies. North of the Serravalle gorge,SRV features resonant frequencies in the 3-5 Hz range. South of it, VVC shows resonance

374
Boll. Geof. Teor. Appl., 49, 369-385 Vuan et al.
Fig. 3 - HVSR amplitude in the frequency range 0.5-22 Hz. The colour and size of the circles indicate peak frequencyand amplitude of the HVSR, respectively. White circles indicate sites with very low H/V amplitude or flat response.The value of resonance frequency is also indicated along the iso-frequency lines computed by interpolating the peakfrequencies.

375
Site response in Vittorio Veneto: part 1 Boll. Geof. Teor. Appl., 49, 369-385
frequencies, from 3 to 10 Hz, which increase further south. For instance, VVN, the area of recentexpansion of the town, features very high resonant frequencies (10-20 Hz). Finally, at CEN thefundamental frequency ranges from about 8-9 Hz toward the valley centre to a very low value ofabout 1.3 Hz, in the heart of the quarter. The lowest frequencies are retrieved in the western,oldest part of CEN. This area suffered the strongest damage during the 1936 Cansiglioearthquake. In Fig. 4, we show examples of HVSR estimates in the four areas: site Z03 for SRV,site A13 for VVC, sites T05 and D09 for VVN and CEN, respectively.
4. Reference site spectral ratios of weak earthquakes
4.1. Data acquisition and processing
Ten seismic stations (the same type as those described in the previous section) were deployedin SRV and VVC areas (see Fig. 2) from December 2001 to July 2002. Three stations (VV06,
Fig. 4 - HVSR estimated at four different sites in the Vittorio Veneto area. The name of the site is indicated at the topof each panel for each site, the top panel represents the HVSR (thick line) plus/minus the first standard deviation (thinlines), while the bottom panel represents the PSD computed for the horizontal (solid line) and vertical (dashed line)components.

376
Boll. Geof. Teor. Appl., 49, 369-385 Vuan et al.
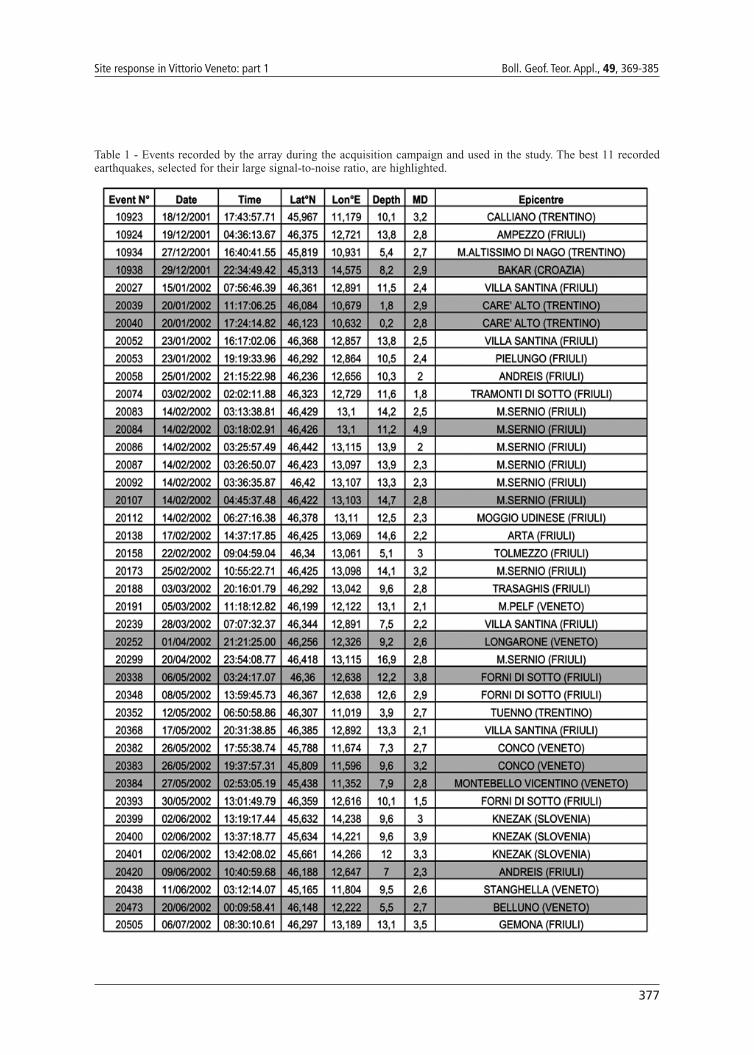
VV07 and VV10; see Fig. 2) were installed on outcropping limestone bedrock and chosen asreference sites. The remaining stations were deployed on the Quaternary cover (alluvial, fluvio-glacial and lacustrine deposits). A total of 40 events were recorded (Table 1). Their epicentraldistances for Serravalle vary between 15 and 200 km, approximately. The distribution of theback-azimuths spans a broad circular sector comprised, anticlockwise, between N120°E andN160°W. In order to calculate the spectra of the recorded seismograms, the whole dataset wasfirst re-sampled at 100 sps, in order to have all data sampled similarly. The Fast Fourier Transform(FFT) was calculated on a constant, 5.12 s analysis window comprising the S-wave arrival. Themean and the trend were removed from the extracted time series and a 5% cosine taper wasapplied before the FFT. The window starting points were automatically defined on eachseismogram on the basis of a time-distance relation and an S-wave estimated velocity, in such away as to always contain the onset of S-waves. Finally, the window length, selected as input,assured us that all the main shear phases and part of their codas would contribute to the spectrum.The horizontal components were summed as a complex time series, using the technique of Steidl
Fig. 5 - Horizontal component spectral ratios (RSSR) computed for each station with respect to the average value ofthe 3 reference sites (VV06, VV07, VV10) lying on the bedrock for all 40 recorded events of Table 1. Shaded areacorresponds to ±1σ of the single measurements around the calculated mean value at each frequency.
377
Site response in Vittorio Veneto: part 1 Boll. Geof. Teor. Appl., 49, 369-385
Table 1 - Events recorded by the array during the acquisition campaign and used in the study. The best 11 recordedearthquakes, selected for their large signal-to-noise ratio, are highlighted.

378
Boll. Geof. Teor. Appl., 49, 369-385 Vuan et al.
et al. (1996). The amplitude spectrum of complex time series provides the total amplitude ofhorizontal motion at a given frequency, preserving the phase between components. Overall, 388spectra were used, considering both horizontal and vertical component records spectra, each onedetermined on the basis of 204 points with frequency increments of 0,098 Hz from 0 to 20 Hz.Finally, spectral values typical of each station were retrieved by averaging the relevant traces’spectra over the entire frequency range.
4.2. Results
Spectral ratios for each station, calculated on the average of the 3 reference sites, wereproduced for all 40 events recorded by the array (see Fig. 5). In detail, the results show that theamplification levels measured at all three reference sites (VV06, VV07 and VV10) are alwayslower than 2 (see Fig. 5). The VV06 spectral ratio curve, in particular, is constant around unityover the whole frequency range (i.e. null amplification). Also, results for station VV10, locatedon the steep flank of the Sant’Augusta Hill, show no substantial amplifications either, suggestingthe absence of topographically induced amplifications which could theoretically have beenexpected.
Results for VV01 and VV02, both located on alluvial and lacustrine deposits, reveal maximumamplifications of about 5 and 8 times, respectively. Both amplifications occur within a sharplydefined peak at 5 Hz. The spectral ratios for the horizontal components show fairly symmetricalpeak sides, a typical signature of sharp 1-D impedance contrast between overlying flat layers.
Station VV04, also deployed over a sequence of composite incoherent deposits, recorded thelargest overall amplifications after sites VV01 and VV02. VV04 features maximum levels ofamplification about 4-5 times larger than the reference sites at frequencies between 6 and 9 Hz.At the same time, a pretty sharp relative minimum of the spectral ratio for the horizontalcomponent is peculiar to this site at about 4.5 Hz.
Finally, sites VV03, VV05, VV08 and VV09 have very similar behaviour compared to eachother for what concerns their horizontal components. Maximum relative amplitudes reach ingeneral a value of 3, for frequencies above 5 Hz, after a slight, constant increase of the spectralratio curve at lower frequencies. A relative minimum is also well developed at 5 Hz, especiallyfor site VV08.
It is important to stress that the results obtained here are robust, regardless of the direction ofthe incoming wave field. This is well demonstrated by the small error bars in the spectral ratiosof Fig. 5. In addition, we can rule out, with some confidence, that the results are affected by theinfluence of buildings on free field ground motion, as sensors were installed inside of them. Inthis regard, HVSR returned the same amplification peak frequencies in whole of the monitoredarea (see Fig. 6). The main peak amplitudes often disagree though, HVSR amplitudes beingusually higher than those derived from the classical RSSR.
Some discrepancies exist also between the horizontal and vertical RSSR (see Fig. 6): thecurves generally have different shapes at frequencies beyond 6 Hz. The vertical component RSSRresults for sites VV01 and VV04 look different from the horizontal component ones, showingresonant peaks at high frequencies which bear, however, little importance for engineeringpurposes.
As for possible non linearities in the soil response, in the case of strong ground shaking, this

379
Site response in Vittorio Veneto: part 1 Boll. Geof. Teor. Appl., 49, 369-385
aspect cannot be addressed with the dataset used in this study as it consists primarily of fairlysmall earthquakes.
5. In situ measurement of shear wave velocities of shallow soils from surface wavesanalysis and inversion
5.1. Data acquisition and processing
A surface wave analysis has been performed on three shallow seismic refraction profiles thatwere collected at two sites in Vittorio Veneto, namely site A and site B in the map of Fig. 2. Here,we estimate the near surface vertical structure of the sites, i.e. the S-wave velocity and averagethickness of the weathered layer. The seismic profiles consist of an off-end, 105 m long spread-line at site A, and two crossed lines (N-S and E-W oriented) at site B. In all cases, data wereacquired using a 12-channel seismograph, with inter-receiver spacing of 5 m and 1 ms samplinginterval. For these shallow seismic refraction surveys (e.g. see Fig. 7), a surface wave analysiswas performed to retrieve the Rayleigh wave dispersion curves. Phase and group velocity for thefundamental mode and first higher mode of Rayleigh waves was estimated by 2-D transforms(Frequency-Time Analysis and F-K transforms) of the seismic records in the frequency range 8-30 Hz (Fig. 8). In addition, the McMechan and Yedlin (1981) technique was applied to obtainphase velocity dispersion from an array of seismic traces.
Fig. 6 - HVSR and RSSR comparison at some sites.

380
Boll. Geof. Teor. Appl., 49, 369-385 Vuan et al.
The observed phase and group velocities can be used to determine the S-wave velocity andsoil thicknesses. Phase and group velocities depend primarily on the shear wave velocity and areinsensitive to usual variations of density and compressional wave velocity with depth. Since theinversion of the surface wave dispersion properties generally leads to smoothed equivalent S-wave velocity profiles with no evidence of sharp impedance contrasts, we use the informationcontained in the seismic noise spectral ratios (HVSR) to constrain the solutions of the inversion.The S-wave distribution versus depth is left free to vary at the top, while a homogeneous layer isimposed at the bottom. An iterative, weighted inversion method is used (Herrmann and Ammon,2002), which allows velocity discontinuities in the resulting model to be force. One can fix thelayer thicknesses and invert for velocity, or fix the velocities and invert for layer thickness. Inorder to evaluate the stability of the results, several inversion runs of 10-20 iterations each areperformed using different starting models, smoothing, and damping. The constrained linear
Fig. 7 - Seismic survey at site B. Surface waves, as well as the air wave are well identified.

381
Site response in Vittorio Veneto: part 1 Boll. Geof. Teor. Appl., 49, 369-385
inversion provides a number of possible models, which display sharp velocity contrasts orvelocity gradients and feature a fundamental frequency coherent with the observed HVSR. Thevariability of the shear wave velocity models obtained here is strictly dependent on theuncertainties in the dispersion curve measurement and in the estimation of the resonantfrequencies.
5.2. Results
At site A, the constrained inversion provides a family of equivalent models which display asharp velocity contrast between 17 and 20 m (Fig. 9). All these models feature a resonantfrequency at 6 Hz as independently estimated by the noise HVSR analysis.
At site B, the interpretation provides a family of S-wave velocity models which feature, ashear wave velocity gradient in the shallowest part and a velocity contrast at about 12-13 m.These models are also confirmed by the results of a down-hole sounding to 80 m depth, whichreveals the presence of a thick clay level (~10 m), while a monotonous sequence of coarse gravelcharacterizes the stratigraphic column at depth.
Fig. 8 - Rayleigh wave group (top panel) and phase (bottom panel) dispersion curves for A and B (see Fig. 2 forlocation) investigated sites.

382
Boll. Geof. Teor. Appl., 49, 369-385 Vuan et al.
6. Discussion From the information provided by the geological studies, geophysical drillings and down-hole
measurements which were available for this area, we have found evidence of a correlationbetween the HVSR results, the RSSR results and the geology of the study area. At two test siteswe have also linked the resonance frequency resulting from the HVSR analysis to the underlyingshear wave velocity structure. As the map of the Quaternary soils shows, the surface geology thatcharacterizes the Vittorio Veneto basin is rather simple at a local scale (see Poli et al., 2008), andwe are confident that the resulting velocity structures can be extrapolated further away from the
Fig. 9 - S-wave velocities (left panels) and P/S-wave velocity ratio (right panels) for the two sites A and B (top andbottom panel, respectively). Site B features a velocity gradient variation at 12-13 m depth and high P/S-wave velocityratios at the surface. A deeper impedance contrast is found at about 17-20 m depth below site A.

383
Site response in Vittorio Veneto: part 1 Boll. Geof. Teor. Appl., 49, 369-385
test sites with a good approximation. The map of the fundamental frequency estimated from thenoise HVSR suggests that the area can be divided into four zones.
The first zone is the area of Old Serravalle village (SRV). Here the HVSR analyses featurefundamental frequencies in the range 3-5 Hz. The geological map outlines the presence of thinsediments here (i.e. silt and peat), and the available drillings do not detect the geological bedrockdown to a depth of 30 m. However, since SRV is located near a deep gorge, we cannot rule outthat the peak frequencies resulting from the HVSR are due to a topographic effect and, inparticular, correspond to the fundamental mode of vibration of the gorge itself.
In Serravalle (VVC), the historical heart of Vittorio Veneto, the HVSR feature resonancefrequencies between 3 and 10 Hz, with higher frequency towards the south. The only drillingperformed within the project, at site B (Fig. 2), reaches a depth of 80 m. Down to this depth noevidence of a geological bedrock has been found. The down-hole measurement points out thepresence of a thick clay level in the first 10 m and, below that, a sequence of fluvial and glacialdeposits of coarse gravels. The resulting shear wave velocities are 200-400 m/s and 750-1200 m/sfor the clay and gravel layers, respectively.
The third zone (VVN) defines the area of major expansion of the city. Here, a much higherHVSR resonant frequency has been found (10-20 Hz). The available information coming fromthe geology and the stratigraphy (locally, at few points), show a bulk presence of gravel, theabsence of thin deposits at shallow depth, as well as the probable rise of the bedrock (i.e. thecontact of the fluvial-glacial sediments with the underlying formation) to a depth of about 50 m.Therefore, the high HVSR fundamental frequencies are explained by both an increase of theshear wave velocity and a thinning trend of the uppermost Quaternary levels.
Finally, at Ceneda (CEN) we found peak frequencies decreasing from about 8-9 Hz in thecentre of the valley, close to the Meschio River, to 1.3 Hz towards the western edge of the basin.The lowest, overall frequencies (i.e. 1.3-1.4 Hz, in the map of Fig. 3) have been found exactly inthe part of town which suffered the most severe damage during the 1936 Cansiglio earthquake.At present, no information on the elastic parameters of the soils exist for this area. The availablegeological data show the presence of a clay lens expanding from the west side eastward, with athickness of about 20 m. This lens was originated by the lateral Cervada creek (Fig. 2) andextinguishes a few hundred meters eastwards. It seems a reasonable explanation for the lowresonance frequencies found in this zone. The surrounding area features frequencies between 4.5and 11 Hz and it is characterized by an underlying structure similar to VVN, although with anincreased depth of the geological bedrock to about 60-70 m.
7. Conclusions
The results of this study indicate that the amount of local site seismic amplification in theVittorio Veneto municipal area, as determined from the HVSR on microtremors and the RSSR onweak earthquakes, can be relevant. In most sites, HVSR and RSSR display a clear peak,suggesting the presence of a soil-bedrock impedance contrast. Overall, the pattern of the HVSRindicates the presence of four zones which can be associated with the shallow geology and/orwith topographic effects.
The HVSR results computed from seismic noise at Serravalle have been compared with site

384
Boll. Geof. Teor. Appl., 49, 369-385 Vuan et al.
effects estimated at some nearby sites using the RSSR technique. The comparison shows thatalthough the two techniques provide consistent estimates of the fundamental frequency, the mainpeak amplitude values often disagree, the HVSR ones derived from seismic noise being usuallyhigher than those derived from the classical spectral ratios. Two sites, located on the left bank ofthe valley, show high values of amplification, 5 times larger than a signal amplitude at thereference sites, in correspondence to well discernible peak frequencies of 5 Hz. RSSR results forthe other stations show smaller amounts of site amplification spreading over a broad range offrequencies and they generally agree with HVSR resonant frequencies.
A surface wave analysis, performed using shallow seismic refraction data at two sites in thearea of Serravalle-Vittorio Veneto centre, provides a set of S-wave velocity models, whosefundamental frequencies match those estimated independently by the HVSR technique.
Additional information coming from geological studies, refraction seismic lines, geophysicaldrillings and down-hole measurements have been used in order to correlate the shallowgeological structure with the estimated resonance frequency, and constrain possible solutions inthe inversion process.
Acknowledgments. This work was partially funded by the National Group for the Defence AgainstEarthquakes (GNDT), under the project ‘Scenarios of seismic damages in Friuli and Veneto’. We wouldlike to thank Eliana Poli and colleagues of the Univeristà di Udine for the material provided and the supportin the definition of the geology of the investigated area. We thank also Cristiano Cecotti for making thedata of the shallow seismic profiles available. Special thanks are addressed to the people of Vittorio Venetofor their willingness and interest during the field work. The base map of Vittorio Veneto used in Figs. 2 and3 was used by courtesy of Geoplan © ( http://www.geoplan.it/).
REFERENCES Andrews D.J.; 1986: Objective determination of source parameters and similarity of earthquakes of different sizes. In:
Das S., Boatwright J. and Scholz C.H. (eds), Geophysical Monograph 37, American Geophysical Union,Washington, D.C., U.S.A., pp. 259-267.
Avigliano R., Poli M.E. and Zanferrari A.; 2008: Geology of the Vittorio Veneto basin (NE Italy). Boll. Geof. Teor.Appl., 49, 357-368.
Bard P.Y.; 1999: Microtremor measurements: a tool for site effect estimation? In: Irikura K., Kudo K., Okada H. andSasatani T. (eds), The effects of surface geology on seismic motion. Recent progress and new horizon on EGSstudy. Proc. of the Second Int. Symp. on the Effect of Surface Geology on Seismic Motion. Vol. 3, A. A. Balkema,Rotterdam and Brookfield, pp. 1251-1282.
Bonilla L.F., Steidl J.H., Lindley G.T., Tumarkin A.G. and Archuleta R.J.; 1997: Site amplification in the San FernandoValley, California: variability of site-effect estimation using the S-wave, coda and H/V methods. Bull. Seism. Soc.Am., 87, 710-730.
Faeh D., Kind F. and Giardini D.; 2001: A theoretical investigation of average H/V ratios. Journal of Seismology, 145,535-549.
Field E.H. and Jacob K.H.; 1995: A comparison and test of various site response estimation techniques, including threethat are non reference-site dependent. Bull. Seism. Soc. Am, 85, 1127-1143.
Hartzell S.H., Leeds A., Frankel A. and Michael J.; 1996: Site response for urban Los Angeles using aftershocks of theNorthridge earthquake. Bull. Seism. Soc. Am., 86, 168-192.
Herrmann R.B. and Ammon C.J.; 2002: Computer programs in Seismology. VOLII-Version 3.20.

385
Site response in Vittorio Veneto: part 1 Boll. Geof. Teor. Appl., 49, 369-385
Kay S.M. and Marple S.L.; 1981: Spectrum analysis – A modern perspective. Proc. IEEE, 69(11), 1380-1419.
Lermo J. and Chàvez-Garcìa F.J.; 1993: Site effect evaluation using spectral ratios with only one station. Bull. Seis.Soc. Am., 83, 1574-1594.
McMechan G.A. and Yedlin M.Y.; 1981: Analysis of dispersive waves by wave field transformation. Geophysics, 46,869-874.
Michelini A. and Govoni A.; 2001: Site amplification from earthquake data in Fabriano, Central Italy. Rivista Italianadi Geotecnica, 2, 118-130.
Nakamura Y.; 1989: A method for dynamic characteristics estimation of subsurface using microtremor on the groundsurface. Q.R. of R.T.R.I., 30, 25-33.
Nogoshi M. and Igarashi T.; 1970: On the propagation characteristics of microtremor. J. Seism. Soc. Japan, 23, 264-280 (in Japanese with English abstract).
Parolai S., Bindi D. and Augliera P.; 2000: Application of the Generalized Inversion Technique (GIT) to a microzonationstudy: numerical simulations and comparison with different site-estimation techniques. Bull. Seism. Soc. Am., 90,286-297.
Poli M.E, Burrato P., Galadini F. and Zanferrari A.; 2008: Seismogenic sources responsible for destructive earthquakesin north-eastern Italy. Boll. Geof. Teor. Appl., 49, 301-313.
Priolo E., Poli M.E., Laurenzano G., Vuan A. and Barnaba C.; 2008: Site response estimation in the Vittorio Venetoarea (NE Italy). Part 2: mapping the local seismic effects in the urban settlement. Boll. Geof. Teor. Appl., 49, 387-400.
Steidl J.H., Tumarkin A.G. and Archuleta R.J.; 1996: What is a reference site? Bull. Seism. Soc. Am., 86, 1733-1748.
Welch P.D.; 1967: The use of Fast Fourier Transform for the estimation of Power Spectra: a method based on timeaveraging over short, modified, periodograms. IEEE Trans. Audio Electroacoustics, 15, 70-73.
Xia J., Miller R.D., Park C.B., Hunter J.A., Harris J.B. and Ivanov J.; 2002: Comparing shear wave velocity profilesinverted from multichannel surface wave with borehole measurements. Soil Dynamics and EarthquakeEngineering, 22, 181-190.
Corresponding author: Alessandro VuanDipartimento Centro di Ricerche SismologicheIstituto Nazionale di Oceanografia e di Geofisica SperimentaleVia Treviso 55, 33100 Udinephone: + 39 040 2140370; fax: + 39 040 327307; e-mail: [email protected]