
Evolution and dynamics of a fold-thrust belt - Geophysical ...
28
Geophysical Journal International Geophys. J. Int. (2015) 201, 683–710 doi: 10.1093/gji/ggv005 GJI Geodynamics and tectonics Evolution and dynamics of a fold-thrust belt: the Sulaiman Range of Pakistan Kirsty Reynolds, 1 Alex Copley 1 and Ekbal Hussain 2 1 COMET, Bullard Labs, Department of Earth Sciences, University of Cambridge, Cambridge, United Kingdom. E-mail: [email protected] 2 COMET, School of Earth and Environment, University of Leeds, Leeds, United Kingdom Accepted 2015 January 5. Received 2015 January 4; in original form 2014 June 10 SUMMARY We present observations and models of the Sulaiman Range of western Pakistan that shed new light on the evolution and deformation of fold-thrust belts. Earthquake source inversions show that the seismic deformation in the range is concentrated in the thick pile of sediments overlying the underthrusting lithosphere of the Indian subcontinent. The slip vectors of the earthquakes vary in strike around the margin of the range, in tandem with the shape of the topography, suggesting that gravitational driving forces arising from the topography play an important role in governing the deformation of the region. Numerical models suggest that the active deformation, and the extreme plan-view curvature of the range, are governed by the presence of weak sediments in a pre-existing basin on the underthrusting Indian Plate. These sediments affect the stress-state in the over-riding mountain range and allow for the rapid propagation of the nose of the range and the development of extreme curvature and laterally varying surface gradients. Key words: Seismicity and tectonics; Continental neotectonics; Dynamics: gravity and tectonics; Dynamics: seismotectonics. 1 INTRODUCTION Plan-view curvature of geological structures and range-front to- pography has long been a recognized and debated feature of both ancient and active fold-thrust belts (e.g. Argand 1924; Carey 1955; Hindle & Burkhard 1999; Marshak 2004). Though poorly under- stood, the relationship between the size and shape of a mountain range, surface deformation, and continental rheology, is key to our understanding of mountain-building processes. As the largest active mountain ranges on Earth, much of the body of work surround- ing this topic has focused on the Tibetan Plateau and the Andes (e.g. Argand 1924; Su´ arez et al. 1983; Dewey et al. 1988; Eng- land & Houseman 1988; Isacks 1988; Molnar & Lyon-Caen 1989; Whitman et al. 1996; Lamb & Hoke 1997; Barke et al. 2007; Royden et al. 2008). However, a full understanding of continental tectonics and rheology requires knowledge of the deformation, evolution and dynamics of not just the planet’s largest and most rapidly deforming regions, but also of smaller deformation zones (e.g. Batt & Braun 1999; Macedo & Marshak 1999; Nissen et al. 2011b). A lack of published data, extremely limited geodetic coverage and difficulty of access mean there have been relatively few studies of the western part of the Himalaya–Tibetan Plateau system, where the Himalaya curve to the southwest into the lobate fold-thrust belts of Pakistan. The widest of these, the Sulaiman Range (Fig. 1a), forms a strongly curved, asymmetric lobe with ∼300 km across-strike width. This range has experienced plentiful earthquakes during the instrumental period, and has been the subject of several competing hypotheses about the behaviour and mechanics of fold-thrust belts (Humayon et al. 1991; Jadoon & Khurshid 1996; Haq & Davis 1997; Macedo & Marshak 1999; Bernard et al. 2000; Reiter et al. 2011). In this paper, we study the Sulaiman Range in order to gain insights into the dynamics and evolution of the range, and the mechanics of curve formation. We present source parameters determined by inversion of tele- seismic body waves for 10 moderate-sized (≥M w 5.2) earthquakes in the Sulaiman Range. Using these focal mechanisms and depths, along with observations of topography, seismicity, gravity anoma- lies (F¨ orste et al. 2011) and geodetic data (Szeliga et al. 2012), and building on previous authors’ examination of the geology, we first assess the kinematics of the range. We then discuss the evi- dence for determining the main factors governing the dynamics of the range, and present numerical models to provide insights into its deformation and evolution. 1.1 Tectonic setting The western part of the Himalayan collision zone is comprised of a series of NNE–SSW left-lateral strike-slip faults (of which the well-known Chaman Fault is the westernmost), together with a ribbon of fold-thrust belts to the east (Fig. 1; Wellman 1966; Abdel- Gawad 1971; Lawrence & Yeats 1979; Farah et al. 1984; Stein et al. 2002; Szeliga et al. 2012). These fold-thrust belts divide Pakistan C The Authors 2015. Published by Oxford University Press on behalf of The Royal Astronomical Society. 683 Downloaded from https://academic.oup.com/gji/article/201/2/683/568354 by guest on 03 February 2022
-
Upload
khangminh22 -
Category
Documents
-
view
0 -
download
0
Transcript of Evolution and dynamics of a fold-thrust belt - Geophysical ...

Geophysical Journal InternationalGeophys. J. Int. (2015) 201, 683–710 doi: 10.1093/gji/ggv005
GJI Geodynamics and tectonics
Evolution and dynamics of a fold-thrust belt: the SulaimanRange of Pakistan
Kirsty Reynolds,1 Alex Copley1 and Ekbal Hussain2
1COMET, Bullard Labs, Department of Earth Sciences, University of Cambridge, Cambridge, United Kingdom. E-mail: [email protected], School of Earth and Environment, University of Leeds, Leeds, United Kingdom
Accepted 2015 January 5. Received 2015 January 4; in original form 2014 June 10
S U M M A R YWe present observations and models of the Sulaiman Range of western Pakistan that shednew light on the evolution and deformation of fold-thrust belts. Earthquake source inversionsshow that the seismic deformation in the range is concentrated in the thick pile of sedimentsoverlying the underthrusting lithosphere of the Indian subcontinent. The slip vectors of theearthquakes vary in strike around the margin of the range, in tandem with the shape of thetopography, suggesting that gravitational driving forces arising from the topography play animportant role in governing the deformation of the region. Numerical models suggest that theactive deformation, and the extreme plan-view curvature of the range, are governed by thepresence of weak sediments in a pre-existing basin on the underthrusting Indian Plate. Thesesediments affect the stress-state in the over-riding mountain range and allow for the rapidpropagation of the nose of the range and the development of extreme curvature and laterallyvarying surface gradients.
Key words: Seismicity and tectonics; Continental neotectonics; Dynamics: gravity andtectonics; Dynamics: seismotectonics.
1 I N T RO D U C T I O N
Plan-view curvature of geological structures and range-front to-pography has long been a recognized and debated feature of bothancient and active fold-thrust belts (e.g. Argand 1924; Carey 1955;Hindle & Burkhard 1999; Marshak 2004). Though poorly under-stood, the relationship between the size and shape of a mountainrange, surface deformation, and continental rheology, is key to ourunderstanding of mountain-building processes. As the largest activemountain ranges on Earth, much of the body of work surround-ing this topic has focused on the Tibetan Plateau and the Andes(e.g. Argand 1924; Suarez et al. 1983; Dewey et al. 1988; Eng-land & Houseman 1988; Isacks 1988; Molnar & Lyon-Caen 1989;Whitman et al. 1996; Lamb & Hoke 1997; Barke et al. 2007; Roydenet al. 2008). However, a full understanding of continental tectonicsand rheology requires knowledge of the deformation, evolution anddynamics of not just the planet’s largest and most rapidly deformingregions, but also of smaller deformation zones (e.g. Batt & Braun1999; Macedo & Marshak 1999; Nissen et al. 2011b). A lack ofpublished data, extremely limited geodetic coverage and difficultyof access mean there have been relatively few studies of the westernpart of the Himalaya–Tibetan Plateau system, where the Himalayacurve to the southwest into the lobate fold-thrust belts of Pakistan.The widest of these, the Sulaiman Range (Fig. 1a), forms a stronglycurved, asymmetric lobe with ∼300 km across-strike width. Thisrange has experienced plentiful earthquakes during the instrumental
period, and has been the subject of several competing hypothesesabout the behaviour and mechanics of fold-thrust belts (Humayonet al. 1991; Jadoon & Khurshid 1996; Haq & Davis 1997; Macedo& Marshak 1999; Bernard et al. 2000; Reiter et al. 2011). In thispaper, we study the Sulaiman Range in order to gain insights intothe dynamics and evolution of the range, and the mechanics of curveformation.
We present source parameters determined by inversion of tele-seismic body waves for 10 moderate-sized (≥Mw5.2) earthquakesin the Sulaiman Range. Using these focal mechanisms and depths,along with observations of topography, seismicity, gravity anoma-lies (Forste et al. 2011) and geodetic data (Szeliga et al. 2012),and building on previous authors’ examination of the geology, wefirst assess the kinematics of the range. We then discuss the evi-dence for determining the main factors governing the dynamics ofthe range, and present numerical models to provide insights into itsdeformation and evolution.
1.1 Tectonic setting
The western part of the Himalayan collision zone is comprisedof a series of NNE–SSW left-lateral strike-slip faults (of whichthe well-known Chaman Fault is the westernmost), together with aribbon of fold-thrust belts to the east (Fig. 1; Wellman 1966; Abdel-Gawad 1971; Lawrence & Yeats 1979; Farah et al. 1984; Stein et al.2002; Szeliga et al. 2012). These fold-thrust belts divide Pakistan
C© The Authors 2015. Published by Oxford University Press on behalf of The Royal Astronomical Society. 683
Dow
nloaded from https://academ
ic.oup.com/gji/article/201/2/683/568354 by guest on 03 February 2022

684 K. Reynolds, A. Copley and E. Hussain
Figure 1. Geology and tectonic setting of the Sulaiman Range. (a) Regional setting. Brown lines are country boundaries; grey circles are >Mw5.2 earthquakelocations from the EHB catalogue (Engdahl et al. 1998); white arrow is the MORVEL plate velocity vector of India relative to stable Eurasia (DeMets et al.2010); red box shows the Sulaiman Range region shown in Fig. 3. (b) Overview map of the Sulaiman Range with mountainous regions commonly named inthe literature (MBH – Mari Bugti Hills, LR – Loralai Range, SR – Sulaiman Range); tectonic features in black; faults named in red; and settlements in blue.Black dots are palaeomagnetic sample sites from Klootwijk et al. (1981), with rotation of sediments relative to Indian basement shown (if any). Dashed greyareas are Indian basement highs after Hunting Survey Corporation Ltd (1960), Auden (1974) and Humayon et al. (1991) and gravity data from Forste et al.(2011) (KJH – Khairpur-Jacobabad High, MKH – Mari-Kandikot High). (c) GPS surface velocities relative to India from Szeliga (2010) and Szeliga et al.(2012) and thickness contours of Cretaceous sediments from Kazmi & Rana (1982).
topographically and tectonically into a mountainous belt runningfrom the Salt Range in the NE down to the Sulaiman and KirtharRanges in the SW, which sits beside the flat lowlands of the IndianPlate (Fig. 1). The strike-slip faults merge into the E–W folds and
thrusts of the Makran convergence zone, where oceanic lithosphereof the Arabian Plate is being subducted beneath Afghanistan (con-sidered to behave as part of Eurasia) (Jacob & Quittmeyer 1979;Lawrence et al. 1981; Treloar & Izatt 1993; Vernant et al. 2004);
Dow
nloaded from https://academ
ic.oup.com/gji/article/201/2/683/568354 by guest on 03 February 2022

Evolution and dynamics of a fold-thrust belt 685
and link it to the Himalayan convergence zone in the north, whereIndian continental lithosphere is underthrusting Eurasia.
Unlike northern India, where the convergence direction is at ahigh angle to the plate boundary, the western boundary of the In-dian Shield runs at a highly oblique angle to the predicted rela-tive motion between India and Eurasia in this region (Fig. 1). Thisplate boundary must therefore accommodate a significant amountof left-lateral shear. The small convergent component of the rela-tive motion, along with the buoyancy forces resulting from elevationcontrasts (as discussed later), also leads to shortening along this mar-gin. The result is a wide, transpressional plate boundary zone thatgenerates diffuse seismicity from northeast Afghanistan to westernPakistan (Quittmeyer & Jacob 1979; Prevot et al. 1980), and whichaccommodates relative plate motion by a combination of strike-slipfaulting in the Chaman fault system and thrust faulting in the foldbelt to the southeast (Bernard et al. 2000; Szeliga et al. 2012). Acomponent of the N–S convergence may also be taken up by left-lateral motion on strike-slip faults within the fold-thrust belt, suchas the Kingri Fault (Rowlands 1978; Humayon et al. 1991; Bernardet al. 2000, Fig. 1b). As the Eurasian Plate margin and accompa-nying fold-thrust belts rotate from NNE–SSW in northern Pakistanto E–W in the Makran region, fault traces showing dominantlyleft-lateral motion curve to the southwest and may become activethrusts, or reactivate older structures in a strike-slip sense. Thisregion produced the 2013 September 24 Mw7.7 strike-slip event(Avouac et al. 2014).
1.2 Previous work
Some previous attempts to explain the geometry, topography andtectonics of the Sulaiman Range have focussed on modelling thefold-thrust belt as a thin-skinned frictional wedge overlying the rigid,underthrusting Indian Plate (Humayon et al. 1991; Davis & Lillie1994; Haq & Davis 1997; Macedo & Marshak 1999). Observationsof surface geology and seismic reflection profiles from the easternand southern range front indicate duplex-style thrusting under a pas-sive roof thrust (Banks & Warburton 1986; Humayon et al. 1991;Jadoon et al. 1993). Using arguments from critical wedge theory(e.g. Davis & Engelder 1985; Dahlen 1990), the great across-strikewidth, flat top and gentle taper are taken as evidence for the pres-ence of a weak basal decollement, thought to be provided by thinEocambrian salt or evaporites, such as those seen in the Salt Rangeto the north (Sarwar & De Jong 1979; Banks & Warburton 1986;Humayon et al. 1991). Both Haq & Davis (1997) and Macedo &Marshak (1999) use sandbox models to investigate the developmentof the Sulaiman Range. Haq & Davis (1997) infer the presence of afault-bounded rigid block at the western boundary of the SulaimanRange, which is free to translate along the Chaman Fault and gen-erate a variety of structures in the foreland basin sediments thrustagainst it. However, Macedo & Marshak (1999) suggest that theadvancement of the Sulaiman Range is basin-controlled. They notethat the apex of the lobe coincides with the depocentre of a packageof Mesozoic sediments (Fig. 1c). Using critical taper theory, theyargue that less internal deformation is needed to maintain a criticaltaper angle in the region of deeper sediment and so the fold-thrustwedge would be expected to advance more rapidly into this region.Humayon et al. (1991) and Davis & Lillie (1994) emphasize thegreat thickness of the stratigraphic sequence, postulating that be-cause the range interior is made up of a very thick sedimentarysequence dominated by fine carbonate muds, conditions at the basewill favour ductile deformation. They suggest that though the sur-
face deformation is characterized by duplex thrusting, the lowerportion of the sedimentary sequence deforms in a ductile manner,sliding over (and remaining mechanically coupled to) the Indianbasement.
Bernard et al. (2000) used body waveform modelling to constrainthe source parameters of 10 earthquakes that occurred between 1964and 1985. They observed that the slip vectors of thrust events wereapproximately perpendicular to the local orientation of the rangefront, following the curvature of the lobe. They produced a modelof the region subject to both the relative motion between India andAfghanistan and gravitational driving forces, with an imposed weakzone representing the Chaman Fault. They did not include the Indianbasement underthrusting the range.
We build upon these previous studies by obtaining well-constrained focal parameters for additional earthquakes, and byconstructing a dynamic model to investigate the major controls onthe deformation and evolution of the topography. We use the combi-nation of new focal mechanisms and our dynamic models to identifythe most important factors governing the dynamics of the range, anddistinguish between the hypotheses put forward by other authors.Our models and results shed new light on the factors controlling thebehaviour of this mountain range, and are applicable to fold-thrustbelts in general.
2 G E O L O G I C A L S E T T I N G
The Sulaiman Range (in this paper taken to mean the whole lobatefold thrust belt, including the Sulaiman Range in the east, the inte-rior Loralai Range and the southern Mari-Bugti Hills, Fig. 1b) is thewidest of the Pakistani fold-thrust belts (Fig. 1b). It is composed ofa passive margin sequence of Mesozoic platform carbonates, sands,muds, shales and volcanics which show a deep-water affinity to thenorth. These deposits transition to younger siliciclastic sedimentsshed from the newly forming Himalaya from the Eocene onwardsand deposited in a shallow-water deltaic environment analogousto the modern-day Indus delta-fan system (Eames 1951; Humayonet al. 1991; Treloar & Izatt 1993; Qayyum et al. 1996, 2001; Kassiet al. 2009). The sedimentary sequence was deposited in a largebasin off the western Indo-Pakistani subcontinent; the southwesterncontinuation of the remnant Neo-Tethys Ocean being consumed tothe north throughout the early Cenozoic (Qayyum et al. 1997). Justeast of the Chaman fault this sequence is known as the KatawazBasin sequence. The same time-transgressive clastic sequence ex-tends into the Sulaiman foredeep (Treloar & Izatt 1993) and istopped by younger Himalayan molasse. The Sulaiman Range istherefore the uplifted and deformed passive margin sequence of thenorthwestern edge of the Indian Plate, now accreted to eastern edgeof the Afghan Block and being underthrust by the Indian Plate.
Seismic profiles and borehole data indicate that the cover se-quence (in this paper taken to mean all sediments of Mesozoic ageand younger, sitting atop crystalline basement) is >8 km thick atthe eastern range front, and thickens to the northwest to ∼14 kmat the Kingri Fault (Fig. 1b) and over 20 km in the range interior,due to tectonic shortening (Banks & Warburton 1986; Humayonet al. 1991). Seismic reflection profiles indicate that the depth tobasement increases to the NW (Humayon et al. 1991). This, takentogether with the large stratigraphic thickness of platform sedimentsand the presence of ophiolite bodies thrust on top of this sequencein the range interior (Hunting Survey Corporation Ltd 1960), sug-gests that the Sulaiman Range may be underlain by thinned passivemargin, not full thickness continental crust. Shear wave velocity
Dow
nloaded from https://academ
ic.oup.com/gji/article/201/2/683/568354 by guest on 03 February 2022

686 K. Reynolds, A. Copley and E. Hussain
models produced from surface wave data give higher than expectedvelocities for the lower crust in this region, suggesting that transi-tional to oceanic crust may underlie parts of the Sulaiman Range(Chun 1986).
2.1 Shortening
Though there has been significant uplift in the Sulaiman Range—Auden (1974) notes that Jurassic limestones have been uplifted over6 km above the regional level—it is not clear how much shorteninghas occurred. Jadoon (1991), Humayon et al. (1991) and Banks &Warburton (1986) all estimate as much as 50–60 per cent shorteningof the sedimentary sequence, based on seismic reflection data andpalinspastic restoration. This approach has a number of caveats: (1)The curved morphology of the anticlinal ridges (concealing buriedthrusts) suggests that the path material follows towards the marginsof the fold-thrust belt is curved; i.e. the cross-sections are oblique tothe transport direction. (2) The seismic reflection data only cover asmall portion of the cross-sections—the frontal folds of the southernand eastern range fronts—and they do not penetrate deep enough toimage the basement. (3) Due to a lack of stratigraphic constraints inthe range interior, no allowance has been made for thickening of thesedimentary units; however, from the direction of collision we mightexpect that the basin in which the cover sequence was depositedmay have deepened towards the west. (4) Estimating shorteningby restoring cross-sections implicitly assumes the deformation isbrittle, however Jadoon (1991) postulates that the cores of the frontalanticlines have been filled by ductile flow of fine-grained carbonates;a mechanism that is likely to operate on a larger scale at depth inthe range interior, where the stratigraphic sequence is much thickerand therefore the temperatures hotter (Davis & Lillie 1994).
3 T O P O G R A P H Y A N D G R AV I T YA N O M A L I E S
The Sulaiman Range is conspicuous due its extensive width(∼500 km) compared to its along-strike length (∼300 km), andits extreme plan-view curvature. In contrast to the narrow ranges oneither side, it forms a large, asymmetric, flat-topped lobe, slightlyinclined to the southeast, with an average elevation of 2 km (Fig. 1).Steep range fronts mark the east and west sides, similar to thosealong the margins of the Kirthar Range to the south, and in con-trast to the gentle, southerly dipping apex (Fig. 2). Discontinuous,arcuate, anticlinal ridges mark the trend of 10–20-km-wavelengthsurface folding, which form curved lines in plan view and convergeat the endpoints of the lobe (Fig. 1b). Many of the frontal foldsconceal blind thrusts, the majority of which verge towards the In-dian foreland (Banks & Warburton 1986; Bernard et al. 2000). Enechelon anticlinal folding along the linear eastern range front islikely to accommodate N–S left-lateral shear between the SulaimanRange and the narrow highlands to the NNE via oblique thrusting.This style of accommodation is less developed on the western rangefront, which forms the eastern border of the Sibi Syntaxis (Fig. 1b).No thrust faulting has been recognized in the folded Katawaz Basinsediments in the interior of the Sulaiman Range (Lawrence et al.1981).
Flexure due to topographic loading produces long-wavelengthasymmetric signals in the free air gravity anomaly on the marginsof the range (Fig. 2). The absence of a large negative anomaly ad-jacent to the nose of the range implies less loading of the Indianlithosphere than elsewhere along the range front, suggesting a thin-ner sedimentary load than elsewhere in the Sulaiman Range (andthe Pakistan fold belts in general). The ∼150 km wavelength of thegravity anomalies on the margins of the range indicates an elasticthickness of >∼30 km, as is also seen where India underthrusts the
Figure 2. Topography and gravity anomaly of the Sulaiman Range. Map shows SRTM30 topography overlain with EIGEN6C free-air gravity anomaly (Forsteet al. 2011). This gravity model has a degree and order of 1440, which can resolve features with a ≥14 km half wavelength (Forste et al. 2013). Red is apositive gravity anomaly, blue negative. Profiles a–c show filtered long-wavelength (100 km Gaussian filter) topography (upper panel) and gravity anomaly(lower panel) along section.
Dow
nloaded from https://academ
ic.oup.com/gji/article/201/2/683/568354 by guest on 03 February 2022

Evolution and dynamics of a fold-thrust belt 687
Himalaya (Jackson et al. 2008). Sparse seismicity within northernIndia extends to depths of ∼45 km (Craig et al. 2012). Taken to-gether, these results imply that the Indian lithosphere is cool andstrong (e.g. Jackson et al. 2008).
4 A C T I V E D E F O R M AT I O N
4.1 GPS
The geodetic data available for the Sulaiman Range is very limited,with no coverage in the centre of the range (Fig. 1c). Velocitiesnear the Chaman fault represent a combination of the motion ofAfghanistan relative to India and the interseismic strain accumula-tion around the N–S-striking left-lateral strike-slip faults. Estimatedvelocities further east, within the SW section of the Sulaiman lobe,show the roughly southeastwards motion of the range interior to-wards the interior of the Indian Plate (at ∼10–20 mm yr−1).
4.2 Seismicity
4.2.1 Previous work
Instrumental and historical evidence shows that the Sulaiman Rangeand surrounding area exhibits a high level of seismic activity, thoughevents with a magnitude ≥Mw6 are infrequent and only three ≥Mw7events have occurred in the last century (Fig. 3). As the SulaimanRange is a remote and sparsely populated mountainous desert, itis not unexpected that there is very little documented evidence ofearthquakes prior to the late 19th century (Ambraseys & Bilham2003b). We briefly describe some of the significant events in theSulaiman Range region, summarized from Ambraseys & Bilham(2003b).
The first significant earthquake to be described in detail in thisregion was the 1892 December 20 Chaman earthquake (Griesbach1893), after which the Chaman Fault is named. Anecdotal evidencesuggests the Chaman Fault has produced surface-rupturing earth-quakes prior to this (Quittmeyer & Jacob 1979; Armbruster et al.1980). Observations of offset railway lines and surface fissuring nearthe town of Chaman, on the Pakistan–Afghanistan border, show thatthis was a left-lateral strike slip event with a component of verticalmotion (Griesbach 1893; Quittmeyer & Jacob 1979; Armbrusteret al. 1980; Ambraseys & Bilham 2003b). Surface observations atthe time indicate that the fault ruptured along a 16–32 km segment(Griesbach 1893; Ambraseys & Bilham 2003b).
No large (≥Mw6) earthquakes have occurred on the ChamanFault during the instrumental period. Five moderate events occur-ring between 1974 and 1978 had mechanisms consistent with leftlateral motion on a NNE–SSW striking fault (blue mechanisms onFig. 3a), and two of these (from 1975) are known to have rupturedthe surface (Jackson & McKenzie 1984). GPS velocities indicatethat at least part of the fault has a shallow locking depth of ∼3 kmand a slip rate of 8–17 mm yr−1 (Szeliga et al. 2012), howeverthere are no well-constrained earthquake centroid depths for eventsoccurring on the Chaman Fault.
Three significant earthquakes occurred in the northern KirtharRange and Sibi Syntaxis area, contiguous in both space and time;the 1931 Mw6.8 Sharigh, 1931 Mw7.3 Mach and 1935 Mw7.7Quetta earthquakes (Szeliga et al. 2009) (solid yellow circles onFig. 3a). The mechanism of the 1931 Sharigh event is not known(Quittmeyer & Jacob 1979). Remeasurement of a levelling line,together with structural interpretation of seismic reflection data
suggests the Mach earthquake was a thrust event that ruptured aW-dipping, blind ramp-and-flat system on the eastern range front ofthe northern Kirthar Range (Bannert 1992; Szeliga et al. 2009). The1935 Quetta earthquake was a surface-rupturing left-lateral strike-slip event (Quittmeyer & Jacob 1979; Armbruster et al. 1980) thatoccurred on a fault parallel to the Mach event and ∼100 km west ofit (Ambraseys & Bilham 2003b). This is a structurally complex re-gion, where the NNE–SSW trending Kirthar Range meets the NW–SE thrusts of the western Sulaiman Range (Fig. 1b), and which hasalso seen several recent damaging earthquakes. A Mw6.9 and Mw6.7double event occurred in the Sibi Syntaxis area on 1997 February27 (orange mechanisms on Fig. 3). Analysis of InSAR interfero-grams and elastic dislocation modelling has revealed coseismic slipon two buried thrust faults; the NW fault rupturing between depthsof 10 and 20 km and showing no link between coseismic uplift andsurface topography, the SE showing slip up to ∼4 km depth andcoseismic uplift along an anticline (Nissen et al. 2011a). A pair ofMw6.4 strike-slip earthquakes also occurred NE of Quetta on 2008October 28 and 29 and were followed by a sequence that culmi-nated in a Mw5.7 aftershock on 2008 December 9. The region ofthis seismic sequence has been the subject of several differing stud-ies. An early LandSat imagery study by Kazmi (1979) postulatedthe existence of extensive NNW–SSE basement lineaments runningthrough the area, underneath the cover sequence. MonaLisa & Jan(2010) and Yadav et al. (2012) suggest slip occurred on one or morefaults parallel to this trend, on the basis of seismological studies.Using GPS data, Khan et al. (2008) also inferred slip on NW–SEorientated faults at depths around the expected basement–cover in-terface, though it is not known whether the faulting ruptured thebasement, cover or both. Conversely, Szeliga (2010) used a com-bination of teleseismic waveform data and InSAR data to modelthe source parameters and proposed a bookshelf-faulting model,with clockwise rotation of blocks bounded by parallel NE–SW left-lateral strike-slip faults. More recently, both Pezzo et al. (2014)and Pinel-Puyssegur et al. (2014) inverted InSAR data to modelthe source parameters and slip distributions for these events, andproposed a combination of right-lateral motion on large NW–SEfault planes, bounding a region of clockwise-rotating blocks withleft-lateral motion on smaller NE–SW faults. Aside from some N–S trending fissures, no surface rupture was observed in this region(Szeliga 2010), and the trend of pre-existing surface folding is atodds with the orientation of the proposed fault geometries. Thissuggests that surface folding is decoupled from faulting deeper inthe sedimentary sequence, or that the deformation style has evolvedthrough time. Despite the controversy over the kinematics in thisarea, it is clear that it accommodates significant right-lateral shearbetween the Sulaiman Range and the Kirthar Ranges.
4.2.2 New waveform-modelling results
Building on the work of Bernard et al. (2000), we carried out tele-seismic waveform inversion for 10 moderate-sized (Mw≥ 5.2) earth-quakes from 1995 to 2008, that have not previously been analysedin detail. The Global Digital Seismogram Network (GDSN) broad-band seismograms were filtered at 15–100 s to remove the highfrequency part of the record, which is sensitive to source com-plexity and local variations in velocity structure, leaving only thelong-period signal in which the earthquake approximates a pointsource. The events could then be modelled as point sources usingthe MT5 algorithm of McCaffrey et al. (1991) and Zwick et al.(1994), which simultaneously inverts P and SH waveform data for
Dow
nloaded from https://academ
ic.oup.com/gji/article/201/2/683/568354 by guest on 03 February 2022

688 K. Reynolds, A. Copley and E. Hussain
Figure 3. Seismicity of the Sulaiman Range. Events with magnitudes ≥Mw5.2 shown. Events from the Global CMT catalogue occurring prior to 2010 areshown at the relocated EHB epicentres. (a) Focal mechanisms coloured by author and scaled according to magnitude. Epicentral locations shown for historicalevents from Ambraseys & Bilham (2003b). (b) Focal mechanisms coloured by rake. (c) Focal mechanisms and centroid depths constrained by body waveforminversion. Coloured as for (a). (d) Thrust slip vectors. Horizontal component of motion plotted for both nodal planes, showing motion of NW side relative toSE side (grey – GCMT focal planes solutions, black – mechanisms constrained by body waveform inversion).
source time function, strike, dip, rake, moment and centroid depth.This method generates synthetic seismograms and solves iterativelyfor the source parameters that give a minimum misfit between theobserved waveform and synthetics within the inversion window. Afull description of this routine method can be found in Taymaz et al.(1991) and Nabelek (1984). This technique refines the accuracy ofsource parameter estimates made by routine catalogues such as theGCMT, particularly for the centroid depth. Typical errors are ±4 kmfor depth, ±10◦ for strike, ±5◦ for dip and ±10◦ for rake (Molnar& Lyon-Caen 1989; Taymaz et al. 1991). Sensitivity is determinedby fixing a parameter, for example depth, at a range of values andletting all other parameters vary during multiple inversions. The fit
of the synthetic to the observed seismograms is then compared atsuccessive values of the fixed parameter to determine the range overwhich a reasonable fit has been found. Fig. 4 shows an example re-sult for body waveform inversion of an event that occurred on 1997March 20.
The minimum misfit solutions of the earthquakes we have studiedare shown in Table 1, full waveform inversion results are shown inAppendix A, and focal mechanisms are plotted on Fig. 3 [along withthose of the 10 events from 1966 to 1985 modelled by Bernard et al.(2000); the double event from 1997 modelled by Rickerby (2010);26 events from the Global Centroid Moment Tensor catalogue;first motion solutions from Jackson & McKenzie (1984) and the
Dow
nloaded from https://academ
ic.oup.com/gji/article/201/2/683/568354 by guest on 03 February 2022

Evolution and dynamics of a fold-thrust belt 689
Figure 4. Body waveform inversion results for a Mw5.6 event that occurred near Harnai, on 1997 March 20. The upper panel shows all seismograms invertedfor P waveforms, the lower those for SH waveforms. The title gives the date (yyyy-mm-dd) and moment magnitude of the event; the subtitle gives the focalmechanism parameters (strike/dip/rake/centroid depth/scalar moment) obtained via the inversion. Seismograms are labelled with the station name (e.g. NRIL)and alphabetic tag (e.g. A), assigned (in alphabetical order) according to azimuth, clockwise from north. Seismograms are plotted around the appropriate lowerhemisphere projections of the focal sphere (P or SH) at their approximate station azimuth and the tag is plotted on the lower hemisphere projection at the pointof intersection of the ray path. Observed seismograms are plotted with a solid line, synthetics with a dashed line, and the ticks mark the window of data usedin the inversion. Black and white circles show the P- and T-axes, respectively. The amplitude scale (micrometres) is given to the bottom left of the focal sphere(N.B. for visual clarity, this may differ for P and SH waveforms). The source–time function (STF) is plotted under the P hemisphere, the seismogram timescalebelow.
Dow
nloaded from https://academ
ic.oup.com/gji/article/201/2/683/568354 by guest on 03 February 2022

690 K. Reynolds, A. Copley and E. Hussain
Table 1. Teleseismic body waveform modelling results.
YYYY MMM DD Lat (◦) Long (◦) Strike 1 Dip 1 Rake 1 Strike 2 Dip 2 Rake 2 Depth (km) M0 (Nm) Mw
1995 May 31 30.257 67.984 077 85 99 196 10 29 22 8.5 × 10¹⁶ 5.21997 Mar 4 29.405 68.748 058 74 11 325 79 164 6 4.6 × 10¹⁷ 5.71997 Mar 20 30.125 68.022 322 10 158 074 86 81 22 3.1 × 10¹⁷ 5.61997 Aug 24 30.100 67.944 262 16 77 096 74 94 16 2.9 × 10¹⁷ 5.61997 Sep 7 29.981 67.768 323 14 140 092 81 79 20 9.9 × 10¹⁶ 5.31999 Jun 26 29.991 69.436 034 40 73 236 52 104 6 2.8 × 10¹⁷ 5.61999 Jul 12 29.979 69.432 028 35 82 218 55 96 5 3.7 × 10¹⁷ 5.62008 Oct 28 30.597 67.299 296 71 145 039 57 23 11 4.2 × 10¹⁸ 6.32008 Oct 29 30.518 67.515 331 72 172 064 82 18 14 3.2 × 10¹⁸ 6.32008 Dec 9 30.433 67.414 062 65 −5 154 85 −155 22 2.3 × 10¹⁷ 5.5
locations of pre-instrumental earthquakes from Ambraseys & Bil-ham (2003b)].
Considering our earthquake source inversion results, along withprevious studies, the seismicity of central Pakistan can be summa-rized as follows.
High-angle reverse faulting occurs in an arcuate band across thenose of the Sulaiman lobe (Fig. 3b). The earthquakes occur close tothe steep topographic front on the east and west sides of the lobe,but are spread over, and set back from, the end of the gently inclinednose. Modelled fault plane strikes follow the shape of the lobe andthe strikes of arcuate surface folds, so that slip vectors fan out aroundthe range front, but are slightly oblique to its strike (Fig. 3d), in-dicating that the thrust transport direction is obliquely radial to therange front. The close association of thrust-fault orientation withrange-front geometry indicates that the thrusting may be driven bytopographic contrasts, as discussed below. Well-constrained cen-troid depths are shallower than 11 km in this band (Fig. 3c). Theaverage magnitude is ∼Mw5.5, which corresponds to rupture on a∼5 × 5 km fault plane, assuming a displacement-length ratio of5 × 10−5 (Scholz 1982). Given that the sedimentary pile is >8 kmthick at the range front, and deepens to the NW to over 20 km (Banks& Warburton 1986; Humayon et al. 1991; Jadoon et al. 1993), andthat these thrust faults have centroid depths dominantly in the range5–10 km, it is likely that the seismicity is contained wholly withinthe cover sequence; i.e. that the Indian continental basement is notinvolved. Some deeper, low-angle thrust events occurring in theSibi Syntaxis region have modelled centroid depths in the range of16–22 km—depths approaching the expected interface between thesedimentary pile and Indian basement. Unlike the thrusting in therest of the Sulaiman lobe, these events had one nodal plane dippingat <30◦, suggesting that they may give the dip and depth of thecover–basement interface.
There are a number of strike-slip events located within the Su-laiman lobe, in the same area as the thrust faulting (Fig. 3), thatcan be grouped as follows: (1) events occurring near the nose ofthe range, which have N–S P-axes and E–W T-axes. (2) Eventsoccurring in the east of the range, which are located along or neara mapped strike-slip fault, the Kingri Fault (Fig. 1b). (3) A groupof three events from an earthquake and aftershock sequence thatoccurred near Quetta in 2008. For these three events we obtainedbest-fitting mechanisms with strike-slip to oblique thrust motion onhigh-angle fault planes, in good agreement with those obtained bySzeliga (2010) (discussed above). Our centroid depths are in therange 11–22 km, which is deeper than those for strike-slip eventselsewhere in the Sulaiman Lobe.
No significant seismicity has been observed during the instru-mental period in the interior plateau-like region of the SulaimanRange. For the section of the Chaman Fault between 31◦N and
34◦N there is no documented evidence of a significant earthquake(Ambraseys & Bilham 2003a). Comparison of moment release cal-culations for the last century and strain rate and velocity field mod-els indicates that there is a large seismic moment deficit in theSulaiman Range, and along this section of the Chaman Fault inparticular (Bernard et al. 2000; Ambraseys & Bilham 2003b). Thisdeficit may be due in part to our short period of observation, but alsoraises the possibility that strain may be accommodated by ductilemechanisms within the carbonate- and mud-rich sedimentary pilemaking up the Sulaiman Range.
5 DY NA M I C M O D E L L I N G
This section describes numerical models that have been producedin order to provide insights into the forces and rheology generatingthe observed topography and deformation of the Sulaiman Range.We designed models in order to investigate the dynamic controlson the long-wavelength (≥100 km) topography and deformation inthis region; they are not intended to replicate the exact geometry ofindividual anticlines or faults, but the first-order characteristics ofthe entire region.
5.1 Model rheology and dynamics
The lateral change in topography from elevated mountain to low-lying plains results in a horizontal gradient in gravitational potentialenergy. This gradient results in a horizontal force that acts to min-imize the difference in potential energy by reducing the elevationcontrast between highland and lowland by thinning the mountainsand thickening the lowlands. This force will act parallel to topo-graphic gradients. In contrast, the relative motion between bound-ing plates will result in a force with the same orientation throughouta collision zone. The rapid along-strike variations in shorteningdirection (fanning thrust slip vectors in Fig. 3d) in the SulaimanRange, which largely mirror the changing strike of the range, im-ply that gravitational forces acting on topographic contrasts play animportant role in the behaviour of this region.
We chose to use the simplest model setup that includes the physicsrequired to match our observations of the Sulaiman Range. We fol-low previous authors in exploring the dynamics of mountain rangesby approximating their behaviour as that of a viscous fluid (e.g.England & McKenzie 1982; Houseman & England 1986; Royden1996; Flesch et al. 2001; Bendick et al. 2008). For the rheology ofthe Sulaiman Range we use a constant-viscosity Newtonian fluid.
This type of model implicitly assumes that the behaviour of thedeforming region is continuous. The interior of the Sulaiman Range(the plateau-like area NW of the seismically active band along
Dow
nloaded from https://academ
ic.oup.com/gji/article/201/2/683/568354 by guest on 03 February 2022

Evolution and dynamics of a fold-thrust belt 691
the range front) is largely aseismic, and is made up of a ∼20 kmsequence of fine grained carbonates and shales. Ductile deformationmechanisms (e.g. pressure-solution or diffusion creep) are likely tooperate, particularly towards the bottom of the thick sedimentarypile. These mechanisms are known to occur in shale and carbonatesediments at relatively low temperatures (as low as ∼200 ◦C) (Rutter1983), and will result in a Newtonian viscous rheology. This styleof deformation has been suggested both for the Sulaiman Range(Davis & Lillie 1994) and geologically similar regions, such as theIndo-Burman Ranges (Copley & McKenzie 2007). Examples ofductile deformation have been observed in shales and carbonatesexposed in the cores of folds in the hinterland of the SulaimanRange, and is inferred from seismic lines to occur in the coresof the frontal anticlines (Jadoon et al. 1993). Combined with theregional seismic moment deficit (Bernard et al. 2000; Ambraseys& Bilham 2003b), it is likely that aseismic, ductile processes areimportant in the Sulaiman Range. We therefore assume a Newtonianfluid rheology. For simplicity, we use a constant viscosity in ourmodel; this is a representation of the average mechanical propertiesof the Sulaiman Range. We discuss later the effects of using a morecomplex rheology.
The Indian Plate is thought to maintain its strength along itsmargins, where it is underthrusting the Tibetan Plateau and Indo-Burman Ranges (e.g. Nabelek et al. 2009; Copley et al. 2011).Thermal modelling of the Indian Shield suggests that the Indianlower crust is slow to heat up as it underthrusts Tibet, retainingits strength and acting as a rigid base to the warmer material above(Craig et al. 2012). Therefore we follow Copley (2012) in modellingthe Sulaiman Range as a viscous fluid over-riding a rigid base.These conditions are equivalent to the ‘Type 3’ model of Bendick& Flesch (2013), where the dominant style of deformation is theshearing of a weak layer over a stronger substrate. Bernard et al.(2000) investigated the dynamics of the Sulaiman Range using a‘Thin-Viscous-Sheet’ numerical model. That type of model assumesthat there are negligible shear stresses exerted on the base of thedeforming layer, and therefore that there are no vertical gradientsof horizontal velocity (i.e. no underthrusting). Our model differsfrom theirs because we model the Indian Shield as a rigid base tothe Sulaiman Range, which exerts shear stresses upon the base ofthe deforming layer.
Well-established fluid-dynamic theory shows that topographi-cally induced pressure gradients will cause a pile of viscous fluidon a rigid base to flow outwards and form a circle in plan view,with a flat top, steep sides and radial horizontal surface velocityvectors (e.g. Huppert 1982). This simple picture does not explainall the features we observe in the Sulaiman Range—the range frontdoes not form a perfect arc but an elongate lobe, and the thrust slipvectors are slightly oblique to the range-front curvature. The highdegree of curvature, strong asymmetry, the gentle gradient downthe nose (compared to the steep east and west topographic fronts),and the oblique transport direction observed in the Sulaiman Rangesuggest that some additional factor is controlling the evolution ofthe range. In this section, we investigate what could lead to the lat-eral variations in topographic slope and the extensive across-strikewidth of the Sulaiman Range compared to adjacent ranges.
Changing the boundary conditions on the base of a flowing layer,for example, the degree of coupling to an underlying substrate,will change the characteristics of the deformation and the resultingtopography (e.g. Ellis 1996). Reducing the degree of coupling tothe substrate will result in a gentler surface gradient and highersurface velocities (McKenzie et al. 2000). The Sulaiman Rangehas propagated much further over the Indian foreland than adjacent
fold-thrust belts, though they have presumably been extant for ap-proximately the same length of time. It also has a gentle topographicslope down the apex of the lobe (Fig. 2, profile b), in stark compar-ison to the steep-fronted Kirthar Range to the south. This suggeststhat the Sulaiman Range has a lower degree of basal coupling to theunderthrust Indian lithosphere than the fold-thrust belts either side.
Kazmi & Rana (1982) show Cretaceous sedimentary isopachcontours on their geological map of Pakistan (Fig. 1c), revealinga pre-existing basin on the Indian plate, adjacent to the SulaimanRange, with a depocentre that coincides with the apex of the range.It is likely that this depocentre contains weak sedimentary hori-zons which could act as detachment horizons. The exact nature ofthese units is not known. Sarwar & De Jong (1979) and Banks &Warburton (1986) suggested the presence of thin Eocambrian saltor evaporites, such as those seen in the Salt Range to the north.Although salt has been found in a well 200 km east of the Sulaimanrange front, it is not observed in seismic profiles across the rangefront (Humayon et al. 1991) nor is there any surface evidence ofsalt tectonics. However there are a number of active mud volcanoesscattered across the Sulaiman Range (Hunting Survey CorporationLtd 1960), indicating the presence of overpressured shales withinthe sedimentary sequence (Fig. 1b). These would also act as weakdecoupling horizons.
In our model we will examine the effects of lateral variations inmechanical coupling (due to weak horizons contained within thepre-existing Mesozoic basin) on the tectonics of the range. Macedo& Marshak (1999) first suggested that the tectonics of the SulaimanRange were basin-controlled, though as a result of varying sedimentthicknesses, not sediment rheology. Other authors (e.g. Sarwar & DeJong 1979; Banks & Warburton 1986) have previously suggestedthe tectonics are influenced by the presence of weaker sedimentaryhorizons. We build upon their work by constructing a numericalmodel to test the dynamic implications of an advancing fold-thrustbelt interacting with a pre-existing basin containing weak sediments.
5.2 Model setup
For simplicity, we model the Sulaiman Range as a Newtonian vis-cous fluid with a constant viscosity. Using the method of Copley(2008), the equations for fluid flow in the absence of inertial forcesare solved in three dimensions. Velocity fields are calculated usingthe finite difference method. The driving forces are the imposedboundary conditions (described below), and gravity acting on to-pographic contrasts. Time-stepping is achieved by rewriting theincompressibility condition as a diffusion equation (Pattyn 2003),which is then solved using a Crank–Nicolson joint implicit–explicitscheme (Press et al. 2007).
We assume a constant viscosity for the entire layer, of 1020 Pa s.This is in the range of the viscosity Copley & McKenzie (2007)found for the Indo-Burman Range, 1019–1020 Pa s, which is a litho-logically similar fold-thrust belt in an analogous setting on the east-ern margin of the Indian Plate. The rate of propagation of the modelmountain range, but not the resulting patterns of topography anddeformation, depend upon the choice of the viscosity, and we willdiscuss later the effects of choosing different values.
The model domain consists of a viscous layer, which has a rigidand deformable lower boundary (meaning the horizontal velocityis constrained to zero, but vertical motions can occur in order forthe model topography to be isostatically compensated McKenzieet al. 2000) (Fig. 5). This boundary condition represents the rigidunderlying Indian lithosphere and is equivalent to that used by
Dow
nloaded from https://academ
ic.oup.com/gji/article/201/2/683/568354 by guest on 03 February 2022

692 K. Reynolds, A. Copley and E. Hussain
Figure 5. Initial numerical model setup and boundary conditions. Lower right insets show resultant velocity–depth profiles through the model viscous fluid.Lower left inset shows orientation of x-, y- and z-axes and dimensions of the model domain.
Bendick et al. (2008) and Copley & McKenzie (2007) to model thearea of the Tibetan Plateau that overlies the underthrusting Indianlithosphere. Our assumption of isostatic equilibrium neglects theflexural strength of the underthrusting Indian lithosphere. However,such an assumption has a minimal effect on the applicability ofour model results. McKenzie et al. (2000) compared the behaviourof a thin fluid layer flowing over a rigid, isostatically compensatedbase with one flowing over a horizontal base (which is equivalentto the end-member situation in which the Indian lithosphere has ahigh enough elastic strength that it is undeformed by the load ofthe overthrust mountain ranges). They found that the behaviour ofthe currents was the same, with the exception that the isostaticallycompensated current flowed more rapidly, by a scalar factor relatedto the thickness of the compensating root. As described below, theage and rates of motion in the Sulaiman Ranges are relatively poorlyknown, and are not used in assessing the results of our models.Instead we focus on the shape of the topography and the locationand orientation of active deformation. These features of the modelresults are not affected by whether or not the range is isostaticallycompensated.
We impose an initial topography along one end of the model—a thin, linear mountain range with triangular cross-section—suchthat the y = 0 boundary has a constant elevation of 2000 m. Asour model range is isostatically compensated, this surface elevationcorresponds to a layer thickness of 20 km, which is similar toestimates of the depth to the basement under the Katawaz basin(Banks & Warburton 1986; Humayon et al. 1991). This materialrepresents the thickened and uplifted strata of the passive continentalmargin that now forms the Pakistani fold-thrust belts. Elsewhere,the viscous layer is thin, with a flat topography, representing thesediments overlying the Indian Plate distant from the SulaimanRange. Provided this layer thickness is small compared with the
elevation of the range, it has little influence on the model behaviour(McKenzie et al. 2000).
Along the y = 0 boundary (Fig. 5) we impose a zero horizontal ve-locity gradient in the y-direction (on both horizontal components ofthe velocity), which assumes that material from an unseen reservoircan be drawn in passively behind the advancing model mountainrange (Copley 2012). This condition is equivalent to there being areservoir of crust that can be drawn into the Sulaiman Range (i.e.the thickened continental margin sediments in the region of theKatawaz Basin, and the highlands of north Afghanistan). The rangepropagates across the model domain due to gravity acting on theelevation contrasts. At very high values of y (distant enough thatthe propagating flow does not interact with them) we impose rigidboundary conditions (i.e. the horizontal velocity is zero). At thelateral edges of the model domain (in the x-direction) we imposea reflection boundary condition. In order to simulate the presenceof weak horizons in a pre-existing basin in the foreland, we set theshear stresses on the base to be zero at intermediate values of x(blue-shaded area on Fig. 5). This boundary condition is equivalentto the range over-riding a weak substrate, and has the effect of min-imizing vertical gradients of horizontal velocity (Fig. 5). As such,the model behaviour in this region approximates that of a ‘Thin-Viscous-Sheet’ model (e.g. Houseman & England 1986; Fleschet al. 2001), flowing between areas where the flow is coupled to thebase.
This model is designed to capture the key physical effects thatwould result from the propagation of a mountain range over a later-ally variable lower boundary, and therefore is useful in investigatingthe first-order effects on range deformation and topography. Wecompare the results of this model with the kinematics and topog-raphy of the actively deforming Sulaiman Range. We note that theseismic deformation that does occur in the Sulaiman Range is likely
Dow
nloaded from https://academ
ic.oup.com/gji/article/201/2/683/568354 by guest on 03 February 2022

Evolution and dynamics of a fold-thrust belt 693
to provide a good representation of the geometry of the strain, butnot the rate (as is the case in other better-studied fold-thrust belts,such as the Zagros Mountains of Iran (e.g. Nissen et al. 2011b)).While our viscous fluid model cannot reproduce topographic fea-tures on a scale related to a single seismic event (≤10 km), we cancompare the orientation of the resultant model horizontal strain ratefield with that inferred from our observations of seismicity. It iswell known that the heterogeneous nature of faulted rocks meansthat slip in individual earthquakes may not exactly represent theunderlying stress state, or the strain calculated from a rheologicallyhomogeneous model. However, the variation in slip vector orienta-tions around the Sulaiman Range is much larger than could resultfrom such effects. We compare our model results to this first-orderrange-scale (i.e. ≥100 km) variation in the orientation of activedeformation, and not the more minor local heterogeneities.
5.3 Model results
Cross-sections through the model mountain range after an elapsedtime of 15 Ma (shown in Fig. 6) reveal that while the entire rangefront has advanced in the y-direction, the portion in the centre, over-riding the shear-stress-free lower boundary, has propagated muchfurther than the portion at either side, where the basal horizontalvelocity is constrained to be zero (Fig. 6b). This is similar to thegeometry of Sulaiman Range, which has formed a wide lobe, com-pared to the adjacent thinner fold-thrust belts (e.g. Kirthar Range),which have not. The model also produces similar topographic gra-dients to those observed in the Sulaiman Range and the adjacentmountain ranges to the north and south; at the edges of the modeldomain the model ranges are thin and have steep topographic fronts,whereas in the centre there is a flat-topped lobe with steep rangefront on either side, and a gentle slope down the apex. These lateraldifferences in topographic slope are a direct consequence of the lat-eral variations in lower boundary condition; the gentle slopes formabove the stress-free base, and the steep slopes where the rangeencounters a rigid lower boundary (e.g. McKenzie et al. 2000).
Cross-sections through the centre of the model topography atsuccessive time intervals during its evolution (Fig. 6c) reveal thatas the range front advances, the range interior maintains a very lowsurface gradient while the initial steep topographic front that weimposed becomes gentler with time. This lessening of the gradientof the nose of the flow demonstrates that the topography we haveseen in our models results from the presence of the laterally variablelower boundary condition, and not our initial conditions.
The horizontal surface velocity field shows significant horizontalvariations due to the lateral change in basal boundary condition(Fig. 6a). On the margins of the model (where we impose zero basalhorizontal velocity) the flow is strongly coupled to the base andthe magnitude of the surface velocity is small; in the centre of themodel (where we impose zero basal horizontal shear stress) the flowcan slip freely over the base and so much larger surface velocitiesare observed. In this central portion of the range the velocities arelimited by drag from the slower-moving regions on the lateral edgesof the range, resulting in the most rapid velocities being in the centreof the mountain belt.
The horizontal strain rate tensor (Fig. 6a) shows that at the surfacethe model mountain range is undergoing little or no horizontal straintowards the back and centre of the range, but strong compressivestrain towards the nose, and there are regions of equal compressiveand extensional horizontal strain rate on either side (equivalent to
horizontal shear on vertical planes, i.e. strike-slip faulting). Thispattern is similar to that revealed by the seismicity of the SulaimanRange; we observe thrust faulting around the nose (Fig. 3), anaseismic interior, and strike-slip faulting [e.g. the left-lateral KingriFault (Fig. 1b)] and en echelon folding on the east and west margins.The orientation of the maximum compressive strain rate axes fan outround the model range front and are oblique to it, as is the case forthe thrust slip vectors in the Sulaiman Range (Fig. 3). At the marginsof the model, where basal horizontal velocity is constrained to bezero, the compressive strain rate axes are orientated perpendicularto the range front. This matches the direction of thrusting observedin the Kirthar Range. In models with no along-strike variation in thebasal boundary conditions, this pattern is present across the wholemodel—equivalent to there being no Sulaiman lobe and the thinKirthar Range extending the whole way along the western borderof the Pakistani lowlands.
6 D I S C U S S I O N
Sarwar & De Jong (1979), Banks & Warburton (1986) andHumayon et al. (1991) previously suggested that the SulaimanRange advances over weak sediments, and Macedo & Marshak(1999) proposed that the propagation of Sulaiman fold-thrust beltis controlled by the presence of a pre-existing basin on the In-dian foreland. These authors considered the Sulaiman Range tobehave as a frictional wedge. Davis & Lillie (1994), however, arguethat the thickness of the carbonate-rich sedimentary section allowsfor ductile deformation of the range and mechanical coupling tothe underthrust Indian lithosphere. Here, we have brought togetherthese ideas along with our observations of topography, seismicityand additional data from earthquake source modelling to producea dynamic model of the Sulaiman Range. We have used numericalmodels, and compared the model surface velocity field, topographyand horizontal strain rate with what we observe in the SulaimanRange. Our analysis of earthquake focal mechanisms and topog-raphy indicates that the propagation of the Sulaiman Range overIndia is driven by gravitational forces acting on topographic con-trasts. Our simple dynamic model implies that lateral variationsin topographic slope around the Sulaiman Range, and the greateracross-strike width of the range relative to adjacent fold-thrust belts,are controlled by relatively weak sediments in a pre-existing basinin the foreland that act to reduce shear stresses at the base of therange (Fig. 7).
Our work builds on the previous work of Bernard et al. (2000),and differs because of our inclusion of a laterally variable lowerboundary condition on the propagating mountain range. Based uponnew observations and compilations of gravity data (Fig. 2; Forsteet al. 2011), the gravity anomalies within the lowlands of Pakistanimply that relatively strong Indian lithosphere is underthrusting thefold-thrust belts of western Pakistan. We have therefore chosento model the mountain ranges as overlying this Indian lithosphere,rather than using the approach of Bernard et al. (2000), in which thebase of the model everywhere has zero shear stress, and there are novertical gradients in horizontal velocity (i.e. no underthrusting). Wealso consider the evolution of our model topography with time, andcompare this to the present-day topography of the Sulaiman Range,which was not undertaken by Bernard et al. (2000). Our model is inagreement with that of Bernard et al. (2000) on the importance ofgravitational driving forces. Our additional conclusions regardingthe role of the pre-existing basin on the Indian shield stem from thedifferences described above.
Dow
nloaded from https://academ
ic.oup.com/gji/article/201/2/683/568354 by guest on 03 February 2022

694 K. Reynolds, A. Copley and E. Hussain
Figure 6. Model results at 15 Myr (a). Left-hand panel: horizontal surface velocity field (black arrows) overlain on model topography. Right-hand panel:Principal axes of horizontal strain rate. Red and blue lines are principal axes of compressive and extensional strain rate, scaled according to magnitude. (b)Cross-sections through model topography at x = 20 (across-strike, zero horizontal velocity at the base), x = 250 (across-strike, zero shear stress on the base)and y = 200 (along-strike). Initial topography shown in red, model topography at 15 Myr in brown. (c) Evolution of range front topography. Cross-sectionsthrough model topography at x = 250 after 2.5, 5, 10, 15 (brown) and 20 Myr. Initial topography in red.
In our model we do not attempt to include any complex geometricinformation about the size and shape of the postulated pre-existingsedimentary basin in the foreland. Given that the basin appears tobe the main factor controlling the relative advancement of this fold-thrust belt in western Pakistan, it follows that the shape and lateralextent of this basin will control the direction in which the Sulaiman
Range has propagated. We suspect that this effect governs second-order features of the Sulaiman Range, such as the asymmetry ofthe lobe, although there is insufficient data to justify adding thisadditional complexity to our models.
It is important to consider the effects of pre-existing basementtopography on the behaviour of the Sulaiman Range. Fig. 1 shows
Dow
nloaded from https://academ
ic.oup.com/gji/article/201/2/683/568354 by guest on 03 February 2022

Evolution and dynamics of a fold-thrust belt 695
Figure 7. Summary cartoon of the development of the Sulaiman Range.
the spatial extent of basement highs known to exist outboard ofthe range; it should be noted their geometry is not well known.The Khairpur–Jacobabad high trends NNW–SSE, subparallel to theSulaiman Range, though it is not known to extend underneath thethick sedimentary sequence within the mountains. Such basementfeatures could lead to the development of lobate range fronts tomountain ranges propagating over thick sediments between base-ment highs. However, there are two lines of reasoning which sug-gest the influence of basement topography plays a minor role inthe development of the Sulaiman Range when compared with thelateral variability of the lower boundary condition described above.Firstly, although basement topography could result in the presenceof a lobate range front, without the presence of a laterally variablelower boundary the dramatic along-strike variations in surface slopewould not be produced. Secondly, the ranges to either side of base-ment highs would be expected to propagate a similar distance inthe absence of other factors. The anomalous extent of the SulaimanRange compared with the other fold belts to the north and southsuggests that other factors control the deformation, such as the lat-erally variable lower boundary condition that we model. Appendix Cshows the results of a model which includes basement topography,but not lateral variability in the lower boundary condition, whichillustrates these points (Supplementary material).
The Jacobabad High is a low, broad and relatively small featureof the basement relief, with a wavelength of ∼100 km, a maximumamplitude of 1.3 km, limited surface expression (in the form ofoutcrops of Eocene rocks) and with up to 3 km sediments depositedon top (Hunting Survey Corporation Ltd 1960; Auden 1974; Razaet al. 1989, Fig. 1). It is positioned to the southwest of the SulaimanRange, beyond the range front, rather than right in the apex of theSibi syntaxis (as would be expected if it acted as a promontoryimpeding or diverting the advance of the fold-thrust belt). However,this basement high played an important role in forming discretesedimentary basins in western Pakistan, in particular separatingthe depocentres for Jurassic–Tertiary sediments now uplifted inthe Kirthar Ranges in the west and the Sulaiman Range in theeast (Auden 1974; Smewing et al. 2002). Indeed, this may havebeen crucial in limiting the spatial extent of particular stratigraphichorizons, such as the weak shales or muds we propose control theadvancement of the Sulaiman Range relative to the Kirthar Ranges.
We therefore think that basement topography has only played anindirect role in governing the deformation, by limiting the area ofdeposition of the pre-existing basin on the Indian plate, and thereforegiving rise to the lateral variation in geology and rheology that wemodel (Fig. 7).
In our dynamic model we allow material from an unseen reservoirto be drawn passively into the model domain, behind the advancingrange front. This is equivalent to there being a reservoir of crust thatcan be drawn into the Sulaiman Range, i.e. the highlands of northeastAfghanistan (Fig. 2b). The curved fold axes that extend as far NWas the Katawaz basin (at ∼68◦E 32◦N; Fig. 2) suggest that thismotion is occurring, and that the structural fabric is being deformedby motion of crustal material into the Sulaiman Ranges from theNW. It is also possible that the ∼30–40◦ bend in the Chaman Faultadjacent to the Sulaiman Range is related to this passive transportbehind the propagating range. Such a style of boundary conditionhas previously been implemented in models of a variety of mountainranges (e.g. Copley 2012), and implies that the material being drawninto the range has a similar effective viscosity as the propagatingrange, or is weaker.
Palaeomagnetic studies lend support to the dynamic model pro-posed in this paper. Klootwijk & Radhakrishnamurty (1981) findthat uplifted Jurassic limestones in the central Sulaiman Rangehave rotated 50◦ clockwise relative to Indian basement since atleast the middle Eocene, but possibly as late as the Plio-Pleistocene(Lawrence et al. 1981; Klootwijk 1984, Fig. 1b). This rotation isnot observed in Kirthar Range to the southwest, nor at the youngrange front in the far eastern Fort Munro region. Rotations aboutvertical axes would be expected in the range interior in the modelresults shown in Fig. 6, with the same sense of rotation as observedby Klootwijk & Radhakrishnamurty (1981).
There are very few absolute dates available for the lithologicalunits of the Sulaiman Range, and hence uncertainty on the age ofthe fold-thrust belt itself. This is compounded by the oblique natureof the collision and a limited understanding of the pre-collisionalboundary configuration (Treloar & Izatt 1993; Qayyum et al. 1996).The dearth of surface velocity data, lack of knowledge of the stratig-raphy at depth, and uncertainty about the age of the Sulaiman Rangemean that we are unable to constrain its viscosity using our model.It should be noted, however, that the value of the viscosity does not
Dow
nloaded from https://academ
ic.oup.com/gji/article/201/2/683/568354 by guest on 03 February 2022

696 K. Reynolds, A. Copley and E. Hussain
affect the behaviour or topographic evolution of the range, only therate at which the range evolves. Biostratigraphic constraints fromnorthern Pakistan (Beck et al. 1995), the timing of emplacement ofophiolites within the Sulaiman Range (Alleman 1979; Gnos et al.1997) and Indian Plate motion reconstructions (e.g. Copley et al.2010) put an upper bound of ∼55 Ma for the initial collision ofIndia with Asia in the region of the Sulaiman Range. Age con-straints from faunal assemblages in the Katawaz Basin sediments ofthe northwestern Sulaiman Range, together with structural obser-vations from field mapping, suggest that the Sulaiman Range wasuplifted in the early Miocene, and that the major period of defor-mation began before the Pliocene (Hunting Survey Corporation Ltd1960; Humayon et al. 1991; Qayyum et al. 1997; Kassi et al. 2009;Kasi et al. 2012). If we take ∼10–55 Ma as the range of possibleages of the Sulaiman Range, then the average viscosity required toreproduce the observed topography is 1019–1020 Pa s.
As discussed above, our model horizontal strain-rate field is con-sistent with the general spatial distribution of thrust and strike-slipearthquakes observed in the Sulaiman Range, and includes a zone oflow strain rate in the interior of the model range comparable with theaseismic zone in the Sulaiman Range. However, our model showsstrong compressive strain right at the front of the lobe, whereassignificant thrust faulting earthquakes are absent from the immedi-ate range front of the nose of the Sulaiman Range, and are insteadset back from the range front. As the most recently uplifted partof the range, containing the youngest material, this is no surprise.Geological maps show that the nose of the Sulaiman Range and thearea immediately ahead in the foreland are covered by recent mo-lasse (Hunting Survey Corporation Ltd 1960), shed from the rangefront. The cover sequence of the Indian Shield is also comprisedof a significant proportion of Indus floodplain gravels and clasticmaterial shed from the Himalaya to the north (Qayyum et al. 2001).It is likely that much of the material in this area is not consolidatedenough to be able to fail in earthquakes, hence the lack of seismicity.However, thickening and consolidation probably permits the seis-mic activity observed in a band across the nose, set back from therange front (Fig. 3). Further thickening and heating would result inthe dominance of ductile deformation, as implied by the aseismicmaterial to the north of the band of earthquakes.
For simplicity we used a constant-viscosity Newtonian fluid tomodel the Sulaiman Range. Using results from previous studies wecan examine how our model results would change if more complexrheologies were used. The inclusion of non-Newtonian behaviour[used to model dislocation creep (e.g. Hirth & Kohlstedt 2003), anddeformation on faults if the stress exponent is sufficiently large (e.g.Sonder & England 1986)] would change the details of the modelresults, but not the large-scale features we interpret. Non-Newtonianbehaviour would focus the deformation into narrower zones, but thedifference in topographic slope and deformation style between theareas with differing lower boundary conditions would be maintained(Gratton et al. 1999; Copley & McKenzie 2007). As discussed byCopley & McKenzie (2007), in the region with a stress-free base, themotions are governed by the layer in the overlying material whichhas the highest effective viscosity. For the case of a rigid base, themotions are governed by the viscosity structure within the entirethickness of the overlying material. Changes in the details of theviscosity structure can therefore make changes in the relative ratesof propagation for a given rheological structure, but the featuresof the model we interpret here (the lateral variations in surfaceslope, and the location and orientation of the active deformation)are dominantly controlled by the lateral variation in lower boundarycondition that we model.
The effects we discuss in the Sulaiman Range may be importantelsewhere along the fold-thrust ranges of the Alpine-Himalayan belt.In the frontal portion of the Zagros Mountains of Iran, known asthe Simply Folded Belt, much of the medium-magnitude seismicityoccurs in the lower sedimentary cover and the thrust strikes followthe orientation of the range front (Nissen et al. 2011b). However, theGPS-derived convergence rate is only accounted for in part by thetotal seismic moment release across the range (Jackson & McKenzie1988; Masson et al. 2005), therefore it is thought that aseismicprocesses are important in this fold-thrust belt (Nissen et al. 2011b).The deformation in the SFB is strongly influenced by the presenceof Hormuz salt at the base of the cover sequence and evaporiticdetachment horizons throughout (McQuarrie 2004; Sherkati et al.2005). While the Sulaiman Range forms a wide lobe, the map-viewgeometry of the Zagros mountain front is much more linear. Thisis thought to be due to its large along-strike length resulting incurvature requiring a long time to develop (Copley 2012). Despitethat, the range front does exhibit some second order sinuosity, withlobes and embayments on a scale of ∼200 km. These are thoughtto be due to the respective presence or absence of a basal salt layer(McQuarrie 2004; Nissen et al. 2011b), similar to the relativelyweak Mesozoic sediments under the Sulaiman Range, and mayhave a similar effect in reducing the shear stress transmitted to thebase of the deforming cover sequence by the rigid plate underneath.
7 C O N C LU S I O N S
(1) We present teleseismic body waveform inversion results for10 moderate-sized earthquakes in the Sulaiman Range, showingthat this is an active fold-thrust belt characterized by shallow thrustfaulting close to the range front, strike-slip faulting towards themargins, and an aseismic interior. The seismicity appears to berestricted to the sedimentary sequence and does not involve theunderthrusting Indian Shield.
(2) The fanning of thrust slip vectors around (and at an obliqueangle to) the highly curved range front indicates that gravitationaldriving forces play a role in controlling the deformation. The prop-agation of this lobe, and the resulting topography, is likely to becontrolled by the presence of low viscosity units in the pre-existingforeland cover sequence.
(3) Numerical modelling of the Sulaiman Range as a viscous flowpropagating over a laterally variable base reproduces the first-ordertopography and geometry and generates a model surface velocityfield and horizontal strain rate field compatible with the observedseismicity.
A C K N OW L E D G E M E N T S
This study forms part of the NERC- and ESRC-funded project‘Earthquakes Without Frontiers’. Our thanks go to Jerome Neufeldfor many interesting coffee-time discussions, and James Jacksonand Dan McKenzie, for comments on the manuscript. We thankChris Morley and one anonymous reviewer for helpful commentson the manuscript.
R E F E R E N C E S
Abdel-Gawad, M., 1971. Wrench movements in the Baluchistan Arc andrelation to Himalayan-Indian Ocean tectonics, Geol. soc. Am. Bull., 82(5),1235–1250.
Dow
nloaded from https://academ
ic.oup.com/gji/article/201/2/683/568354 by guest on 03 February 2022

Evolution and dynamics of a fold-thrust belt 697
Alleman, F., 1979. Time of emplacement of the Zhob Valley ophiolites andBela ophiolites, in Geodynamics of Pakistan, pp. 215–242, eds Farah, A.& De Jong, K.A., Geological Survey of Pakistan.
Ambraseys, N. & Bilham, R., 2003a. Earthquakes in Afghanistan, Seism.Res. Lett., 74(2), 107–123.
Ambraseys, N. & Bilham, R., 2003b. Earthquakes and associated deforma-tion in northern Baluchistan 1892–2001, Bull. seism. Soc. Am., 93(4),1573–1605.
Argand, E., 1924. La tectonique de l’Asie, in Conference devant le congresgeologique international (XIIIe session), 1922, Bruxelles, pp. 171–372.
Armbruster, J., Seeber, L., Quittmeyer, R. & Farah, A., 1980. Seismic net-work data from Quetta, Pakistan: the Chaman fault and the fault relatedto the 30 May 1935 earthquake, in Proceedings of the International Com-mittee on Geodynamics, Group 6, Peshawar, Vol. 13, pp. 129–142.
Auden, J.B., 1974. Afghanistan-west Pakistan, Geol. Soc., Lond., Spec.Publ., 4(1), 235–253.
Avouac, J.-P. et al., 2014. The 2013, Mw 7.7 Balochistan earthquake, ener-getic strike-slip reactivation of a thrust fault, Earth planet. Sci. Lett., 391,128–134.
Banks, C.J. & Warburton, J., 1986. ‘Passive-roof’ duplex geometry in thefrontal structures of the Kirthar and Sulaiman mountain belts, Pakistan,J. Struct. Geol., 8(3–4), 229–237.
Bannert, D.N., 1992. Structural Development of the Western Fold Belt,Pakistan, no. 80–81 in Geologisches Jahrbuch Reihe B, Bundesanstalt furGeowissenschaften und Rohstoffe und den Geologischen Landesamternin der Bundesrepublik Deutschland, Hannover.
Barke, R., Lamb, S. & MacNiocaill, C., 2007. Late Cenozoic bendingof the Bolivian Andes: new paleomagnetic and kinematic constraints,J. geophys. Res.: Solid Earth, 112(B1), doi:10.1029/2006JB004372.
Batt, G.E. & Braun, J., 1999. The tectonic evolution of the Southern Alps,New Zealand: insights from fully thermally coupled dynamical modelling,Geophys. J. Int., 136(2), 403–420.
Beck, R.A. et al., 1995. Stratigraphic evidence for an early collision betweennorthwest India and Asia, Nature, 373, 55–58.
Bendick, R. & Flesch, L., 2013. A review of heterogeneous materials andtheir implications for relationships between kinematics and dynamics incontinents, Tectonics, 32(4), 980–992.
Bendick, R., McKenzie, D. & Etienne, J., 2008. Topography associated withcrustal flow in continental collisions, with application to Tibet, Geophys.J. Int., 175(1), 375–385.
Bernard, M., Shen-Tu, B., Holt, W.E. & Davis, D.M., 2000. Kinematics ofactive deformation in the Sulaiman Lobe and Range, Pakistan, J. geophys.Res., 105(B6), 13 253–13 279.
Carey, S.W., 1955. The orocline concept in geotectonics, Proc. R. Soc.Tasmania, 89, 255–288.
Chun, K.-Y., 1986. Crustal block of the western Ganga Basin: a fragment ofoceanic affinity?, Bull. seism. Soc. Am., 76(6), 1687–1698.
Copley, A., 2008. Kinematics and dynamics of the southeastern margin ofthe Tibetan Plateau, Geophys. J. Int., 174, 1081–1100.
Copley, A., 2012. The formation of mountain range curvature by gravita-tional spreading, Earth planet. Sci. Lett., 351–352, 208–214.
Copley, A. & McKenzie, D., 2007. Models of crustal flow in the India-Asiacollision zone, Geophys. J. Int., 169, 683–698.
Copley, A., Avouac, J.-P. & Royer, J.-Y., 2010. India-Asia collisionand the Cenozoic slowdown of the Indian Plate: implications forthe forces driving plate motions, J. geophys. Res., 115(B3), B03410,doi:10.1029/2009JB006634.
Copley, A., Avouac, J.-P., Hollingsworth, J. & Leprince, S., 2011. The2001 Mw 7.6 Bhuj earthquake, low fault friction, and the crustal sup-port of plate driving forces in India, J. geophys. Res., 116, B08405,doi:10.1029/2010JB008137.
Craig, T.J., Copley, A. & Jackson, J.A., 2012. Thermal and tectonic con-sequences of India underthrusting Tibet, Earth planet. Sci. Lett., 353–354(C), 231–239.
Dahlen, F.A., 1990. Critical taper model of fold-and-thrust belts and accre-tionary wedges, Ann. Rev. Earth planet. Sci., 18, 55–99.
Davis, D.M. & Engelder, T., 1985. The role of salt in fold-and-thrust belts,Tectonophysics, 119(1–4), 67–88.
Davis, D.M. & Lillie, R.J., 1994. Changing mechanical response duringcontinental collision: active examples from the foreland thrust belts ofPakistan, J. Struct. Geol., 16(1), 21–34.
DeMets, C., Gordon, R.G. & Argus, D.F., 2010. Geologically current platemotions, Geophys. J. Int., 181(1), 1–80.
Dewey, J.F., Shackleton, R.M., Chengfa, C. & Yiyin, S., 1988. The tectonicevolution of the Tibetan Plateau, Phil. Trans. R. Soc. Lond., A: Math.Phys. Sci., 327(1594), 379–413.
Eames, F.E., 1951. A contribution to the study of the Eocene in westernPakistan and western India: A. The geology of standard sections in thewestern Punjab and in the Kohat district, Quart. J. Geol. Soc., 107(1–4),159–171.
Ellis, S., 1996. Forces driving continental collision: reconciling indentationand mantle subduction tectonics, Geology, 24(8), 699–702.
Engdahl, E.R., van der Hilst, R.D. & Buland, R., 1998. Global teleseismicearthquake relocation with improved travel times and procedures for depthdetermination, Bull. seism. Soc. Am., 88(3), 722–743.
England, P. & Houseman, G., 1988. The mechanics of the Tibetan Plateau[and discussion], Phil. Trans. R. Soc. Lond., A: Math. Phys. Sci.,326(1589), 301–320.
England, P. & McKenzie, D., 1982. A thin viscous sheet model for conti-nental deformation, Geophys. J. Int., 70(2), 295–321.
Farah, A., Abbas, G., De Jong, K.A. & Lawrence, R.D., 1984. Evolution ofthe lithosphere in Pakistan, Tectonophysics, 105, 207–227.
Flesch, L.M., Haines, A.J. & Holt, W.E., 2001. Dynamics of the India-Eurasia collision zone, J. geophys. Res., 106(B8), 16 435–16 460.
Forste, C. et al., 2011. EIGEN-6—a new combined global gravity fieldmodel including GOCE data from the collaboration of GFZ-Potsdam andGRGS-Toulouse, in Proceedings of the EGU General Assembly Confer-ence Abstracts, Geophysical Research Abstracts, Vol. 13.
Forste, C. et al., 2013. EIGEN-6C2—a new combined global gravity fieldmodel including GOCE data up to degree and order 1949 of GFZ Pots-dam and GRGS Toulouse, in Proceedings of the EGU General AssemblyConference Abstracts, Vienna, Austria, Geophysical Research Abstracts,Vol. 15, EGU2013-4077-1, p. 4077.
Gnos, E., Immenhauser, A. & Peters, T., 1997. Late Cretaceous/early Tertiaryconvergence between the Indian and Arabian plates recorded in ophiolitesand related sediments, Tectonophysics, 271(1–2), 1–19.
Gratton, J., Minotti, F. & Mahajan, S.M., 1999. Theory of creepinggravity currents of a non-Newtonian liquid, Phys. Rev. E, 60(6),6960–6967.
Griesbach, C.L., 1893. Notes on the earthquake of Baluchistan on the 20thDecember 1892, Rec. Geol. Surv. India, 26, 57–64.
Haq, S.S.B. & Davis, D.M., 1997. Oblique convergence andthe lobate mountain belts of western Pakistan, Geology, 25(1),23–26.
Hindle, D. & Burkhard, M., 1999. Strain, displacement and rotation associ-ated with the formation of curvature in fold belts; the example of the Juraarc, J. Struct. Geol., 21(8–9), 1089–1101.
Hirth, G. & Kohlstedt, D., 2003. Rheology of the upper mantle and themantle wedge: a view from the experimentalists, in Inside the SubductionFactory, Geophysical Monograph 138, pp. 83–105, ed. Eiler, J., WileyOnline Library.
Houseman, G. & England, P., 1986. Finite strain calculations of continen-tal deformation: 1. Method and general results for convergent zones,J. geophys. Res., 91(B3), 3651–3663.
Humayon, M., Lillie, R.J. & Lawrence, R.D., 1991. Structural interpretationof the eastern Sulaiman foldbelt and foredeep, Pakistan, Tectonics, 10(2),299–324.
Hunting Survey Corporation Ltd 1960. Reconnaissance geology of partof west Pakistan: a Colombo Plan Cooperative project, Government ofCanada (for the Government of Pakistan), Toronto.
Huppert, H.E., 1982. Propagation of two-dimensional and axisymmetricviscous gravity currents over a rigid horizontal surface, J. Fluid Mech.,121, 43–58.
Isacks, B.L., 1988. Uplift of the central Andean plateau and bending of theBolivian orocline, J. geophys. Res.: Solid Earth (1978–2012), 93(B4),3211–3231.
Dow
nloaded from https://academ
ic.oup.com/gji/article/201/2/683/568354 by guest on 03 February 2022

698 K. Reynolds, A. Copley and E. Hussain
Jackson, J.A. & McKenzie, D., 1984. Active tectonics of the Alpine-Himalayan Belt between western Turkey and Pakistan, J. geophys. Res.,77, 185–264.
Jackson, J.A. & McKenzie, D., 1988. The relationship between plate motionsand seismic moment tensors, and the rates of active deformation in theMediterranean and Middle East, Geophys. J. Int., 93(1), 45–73.
Jackson, J.A., McKenzie, D., Priestley, K. & Emmerson, B., 2008. Newviews on the structure and rheology of the lithosphere, J. Geol. Soc.,165(2), 453–465.
Jacob, K.H. & Quittmeyer, R.C., 1979. The Makran region of Pakistan andIran: trench-arc system with active plate subduction, in Geodynamics ofPakistan, pp. 305–318, eds Farah, A. & De Jong, K.A., Geological Surveyof Pakistan.
Jadoon, I.A.K., 1991. Thin-skinned tectonics on continent/ocean transitionalcrust, Sulaiman Range, Pakistan, PhD thesis, Oregon State University,OR.
Jadoon, I.A.K. & Khurshid, A., 1996. Gravity and tectonic model across theSulaiman fold belt and the Chaman fault zone in western Pakistan andeastern Afghanistan, Tectonophysics, 254(1–2), 89–109.
Jadoon, I.A.K., Lawrence, R.D. & Lillie, R.J., 1993. Evolution of forelandstructures: an example from the Sulaiman thrust lobe of Pakistan, south-west of the Himalayas, Geol. Soc., Lond., Spec. Publ., 74(1), 589–602.
Kasi, A.K., Kassi, A.M., Umar, M. & Manan, R.A., 2012. Revised lithos-tratigraphy of the Pishin Belt, northwestern Pakistan, J. Himalayan EarthSci., 45(1), 53–65.
Kassi, A.M., Kelling, G., Kasi, A.K., Umar, M. & Khan, A.S., 2009. Con-trasting Late Cretaceous-Palaeocene lithostratigraphic successions acrossthe Bibai Thrust, western Sulaiman Fold-Thrust Belt, Pakistan: their sig-nificance in deciphering the early-collisional history of the NW IndianPlate margin, J. Asian Earth Sci., 35(5), 435–444.
Kazmi, A.H., 1979. Active fault systems in Pakistan, in Geodynamics ofPakistan, pp. 285–294, eds Farah, A. & De Jong, K.A., Geological Surveyof Pakistan.
Kazmi, A.H. & Rana, R.A., 1982. Tectonic Map of Pakistan.Khan, M.A. et al., 2008. Preliminary geodetic constraints on plate boundary
deformation on the western edge of the Indian plate from TriGGnet (Tri-University GPS Geodesy Network), J. Himalayan Earth Sci., 41, 71–87.
Klootwijk, C.T., 1984. A review of Indian Phanerozoic palaeomagnetism:implications for the India-Asia collision, Tectonophysics, 105, 331–353.
Klootwijk, C.T. & Radhakrishnamurty, C., 1981. Phanerozoic palaeomag-netism of the Indian Plate and the India-Asia collision, Geodyn. Ser., 2,93–105.
Klootwijk, C.T., Nazirullah, R., De Jong, K.A. & Ahmed, H., 1981. Apalaeomagnetic reconnaissance of northeastern Baluchistan, Pakistan,J. geophys. Res., 86(B1), 1–18.
Lamb, S. & Hoke, L., 1997. Origin of the high plateau in the central Andes,Bolivia, South America, Tectonics, 16(4), 623–649.
Lawrence, R.D. & Yeats, R.S., 1979. Geological reconnaissance of theChaman fault in Pakistan, in Geodynamics of Pakistan, pp. 351–358,eds Farah, A. & De Jong, K.A., Geological Survey of Pakistan.
Lawrence, R.D., Yeats, R.S., Khan, S.H., Farah, A. & De Jong, K.A., 1981.Thrust and strike slip fault interaction along the Chaman transform zone,Pakistan, Geol. Soc., Lond., Spec. Publ., 9(1), 363–370.
Macedo, J. & Marshak, S., 1999. Controls on the geometry of fold-thrustbelt salients, Geol. soc. Am. Bull., 111(12), 1808–1822.
Marshak, S., 2004. Salients, recesses, arcs, oroclines, and syntaxes—a re-view of ideas concerning the formation of map-view curves in fold-thrustbelts, in Thrust Tectonics and Hydrocarbon Systems: AAPG Memoir 82,pp. 131–156, ed. McClay, K.R., AAPG Special Volumes.
Masson, F., Chery, J., Hatzfeld, D., Martinod, J., Vernant, P., Tavakoli, F.& Ghafory-Ashtiani, M., 2005. Seismic versus aseismic deformation inIran inferred from earthquakes and geodetic data, Geophys. J. Int., 160,217–226.
McCaffrey, R., Zwick, P. & Abers, G., 1991. SYN4 Program, IASPEI Soft-ware Library, 3, 81–166.
McKenzie, D., Nimmo, F., Jackson, J.A., Gans, P.B. & Miller, E.L., 2000.Characteristics and consequences of flow in the lower crust, J. geophys.Res., 105(B5), 11 029–11 046.
McQuarrie, N., 2004. Crustal scale geometry of the Zagros fold–thrust belt,Iran, J. Struct. Geol., 26(3), 519–535.
Molnar, P. & Lyon-Caen, H., 1989. Fault plane solutions of earthquakes andactive tectonics of the Tibetan Plateau and its margins, Geophys. J. Int.,99, 123–153.
MonaLisa & Jan, M. Q., 2010. Geoseismological study of the Ziarat(Balochistan) earthquake (doublet?) of 28 October 2008, Curr. Sci., 98(1),50–57.
Nabelek, J. et al., 2009. Underplating in the Himalaya-Tibet collision zonerevealed by the Hi-CLIMB experiment, Science, 325(5946), 1371–1374.
Nabelek, J.L., 1984. Determination of earthquake source parameters frominversion of body waves, PhD thesis, M. I. T., Dept. of Earth, Atmosphericand Planetary Sciences.
Nissen, E., Craig, T.J., McMullan, K., Parsons, B.E., Rickerby, A. & Wright,T.J., 2011a. The 27 February 1997 Sibi double-earthquake (Mw 6.9, 6.7)in the Sulaiman range of Pakistan—implications for the tectonics of fold-and-thrust belts and for earthquake triggering mechanisms, in Proceed-ings of the AGU Fall Meeting Abstracts, San Francisco, p. B8.
Nissen, E., Tatar, M., Jackson, J.A. & Allen, M.B., 2011b. New views onearthquake faulting in the Zagros fold-and-thrust belt of Iran, Geophys.J. Int., 186, 928–944.
Pattyn, F., 2003. A new three-dimensional higher-order thermomechani-cal ice sheet model: basic sensitivity, ice stream development, and iceflow across subglacial lakes, J. geophys. Res.: Solid Earth, 108, 2382,doi:10.1029/2002JB002329.
Pezzo, G., Merryman Boncori, J.P., Atzori, S., Antonioli, A. & Salvi,S., 2014. Deformation of the western Indian Plate boundary: insightsfrom differential and multi-aperture InSAR data inversion for the 2008Baluchistan (Western Pakistan) seismic sequence, Geophys. J. Int.,198(1), 25–39.
Pinel-Puyssegur, B., Grandin, R., Bollinger, L. & Baudry, C., 2014. Multi-faulting in a tectonic syntaxis revealed by InSAR: The case of the Ziaratearthquake sequence (Pakistan), J. geophys. Res.: Solid Earth, 119(7),5838–5854.
Press, W.H., Teukolsky, S.A., Vetterling, W.T. & Flannery, B.P., 2007. Nu-merical Recipes, 3rd edn, The Art of Scientific Computing, CambridgeUniv. Press.
Prevot, R., Hatzfeld, D., Roecker, S.W. & Molnar, P., 1980. Shallow earth-quakes and active tectonics in eastern Afghanistan, J. geophys. Res.,85(B3), 1347–1357.
Qayyum, M., Niem, A.R. & Lawrence, R.D., 1996. Newly discovered Pa-leogene deltaic sequence in Katawaz basin, Pakistan, and its tectonicimplications, Geology, 24(9), 835–838.
Qayyum, M., Lawrence, R.D. & Niem, A.R., 1997. Molasse-delta-flyschcontinuum of the Himalayan orogeny and closure of the PaleogeneKatawaz remnant ocean, Pakistan, Int. Geol. Rev., 39(10), 861–875.
Qayyum, M., Niem, A.R. & Lawrence, R.D., 2001. Detrital modes andprovenance of the Paleogene Khojak Formation in Pakistan: implicationsfor early Himalayan orogeny and unroofing, Geol. Soc. Am. Bull., 113(3),320–332.
Quittmeyer, R.C. & Jacob, K.H., 1979. Historical and modern seismicity ofPakistan, Afghanistan, northwestern India, and southeastern Iran, Bull.seism. Soc. Am., 69(3), 773–823.
Raza, H.A., Ahmed, R., Ali, S.M. & Ahmad, J., 1989. Petroleum prospectssulaiman sub basin, pakistan, Pak. J. Hydrocarb. Res., 1, 21–56.
Reiter, K., Kukowski, N. & Ratschbacher, L., 2011. The interaction of twoindenters in analogue experiments and implications for curved fold-and-thrust belts, Earth planet. Sci. Lett., 302(1–2), 132–146.
Rickerby, A.G., 2010. Multidisciplinary analysis of the 1997 Quetta earth-quake, Master’s thesis, Dept. of Earth Sciences, Bullard Laboratories,University of Cambridge, Cambridge.
Rowlands, D., 1978. The structure and seismicity of a portion of the southernSulaiman Range, Pakistan, Tectonophysics, 51, 41–56.
Royden, L., 1996. Coupling and decoupling of crust and mantle in conver-gent Orogens: implications for strain partitioning in the crust, J. geophys.Res.: Solid Earth, 101(B8), 17 679–17 705.
Royden, L.H., Burchfiel, B.C. & van der Hilst, R.D., 2008. The geologicalevolution of the Tibetan Plateau, Science, 321(5892), 1054–1058.
Dow
nloaded from https://academ
ic.oup.com/gji/article/201/2/683/568354 by guest on 03 February 2022

Evolution and dynamics of a fold-thrust belt 699
Rutter, E.H., 1983. Pressure solution in nature, theory and experiment, J.Geol. Soc., 140(5), 725–740.
Sarwar, G. & De Jong, K.A., 1979. Arcs, oroclines, syntaxes: the curvaturesof mountain belts in Pakistan, in Geodynamics of Pakistan, pp. 341–350,eds Farah, A. & De Jong, K.A., Geological Survey of Pakistan.
Scholz, C.H., 1982. Scaling laws for large earthquakes: consequences forphysical models, Bull. seism. Soc. Am., 72(1), 1–14.
Sherkati, S., Molinaro, M., Frizon de Lamotte, D. & Letouzey, J., 2005.Detachment folding in the central and eastern Zagros fold-belt (Iran): saltmobility, multiple detachments and late basement control, J. Struct. Geol.,27(9), 1680–1696.
Smewing, J.D., Warburton, J., Daley, T., Copestake, P. & Ul-Haq, N., 2002.Sequence stratigraphy of the southern Kirthar fold belt and middle Indusbasin, Pakistan, Geol. Soc., Lond., Spec. Publ., 195(1), 273–299.
Sonder, L.J. & England, P., 1986. Vertical averages of rheology of the con-tinental lithosphere: relation to thin sheet parameters, Earth planet. Sci.Lett., 77(1), 81–90.
Stein, S., Sella, G.F. & Okal, E.A., 2002. The January 26, 2001 Bhuj earth-quake and the diffuse western boundary of the Indian Plate, in PlateBoundary Zones, pp. 243–254, eds Stein, S. & Freymueller, J.T., Geody-namics Series 30, American Geophysical Union.
Suarez, G., Molnar, P. & Burchfiel, B.C., 1983. Seismicity, fault plane so-lutions, depth of faulting, and active tectonics of the Andes of Peru,Ecuador, and southern Colombia, J. geophys. Res.: Solid Earth (1978–2012), 88(B12), 10 403–10 428.
Szeliga, W., 2010. Historical and modern seismotectonics of the Indian Platewith an emphasis on its western boundary with the Eurasian plate, PhDthesis, University of Colorado, CO.
Szeliga, W., Bilham, R., Schelling, D., Kakar, D.M. & Lodi, S., 2009. Foldand thrust partitioning in a contracting fold belt: insights from the 1931Mach earthquake in Baluchistan, Tectonics, 28(5), 1–13.
Szeliga, W., Bilham, R., Kakar, D.M. & Lodi, S.H., 2012. Interseismic strainaccumulation along the western boundary of the Indian subcontinent,J. geophys. Res., 117(B08404), doi:10.1029/2011JB008822.
Taymaz, T., Jackson, J.A. & McKenzie, D., 1991. Active tectonics of thenorth and central Aegean Sea, Geophys. J. Int., 106(2), 433–490.
Treloar, P.J. & Izatt, C.N., 1993. Tectonics of the Himalayan collision be-tween the Indian Plate and the Afghan Block: a synthesis, Geol. Soc.,Lond., Spec. Publ., 74(1), 69–87.
Vernant, P. et al., 2004. Present-day crustal deformation and plate kinematicsin the Middle East constrained by GPS measurements in Iran and northernOman, Geophys. J. Int., 157(1), 381–398.
Wellman, H.W., 1966. Active wrench faults of Iran, Afghanistan and Pak-istan, Geol. Rund., 55(3), 716–735.
Whitman, D., Isacks, B.L. & Kay, S.M., 1996. Lithospheric structure andalong-strike segmentation of the Central Andean Plateau: seismic Q, mag-matism, flexure, topography and tectonics, Tectonophysics, 259(1), 29–40.
Yadav, R.B.S., Gahalaut, V.K., Chopra, S. & Shan, B., 2012. Tectonic impli-cations and seismicity triggering during the 2008 Baluchistan, Pakistanearthquake sequence, J. Asian Earth Sci., 45, 167–178.
Zwick, P., McCaffrey, R. & Abers, G., 1994. MT5 Program, IASPEI softwarelibrary.
A P P E N D I X A : WAV E F O R M I N V E R S I O NR E S U LT S
The minimum misfit solutions for waveform modelling of 10 eventsin the Sulaiman Range are presented in Figs A1–A10. Each figure issplit into two panels; the upper showing all seismograms inverted forP waveforms, the lower those for SH waveforms. The title gives thedate (yyyy-mm-dd) and moment magnitude of the event; the subti-tle gives the focal mechanism parameters (strike/dip/rake/centroiddepth/scalar moment) obtained via the inversion. Seismograms arelabelled with the station name (e.g. NRIL) and alphabetic tag (e.g.A), assigned (in alphabetical order) according to azimuth, clock-wise from north. Seismograms are plotted around the appropriatelower hemisphere projections of the focal sphere (P or SH) at theirapproximate station azimuth and the tag is plotted on the lowerhemisphere projection at the point of intersection of the ray path.Observed seismograms are plotted with a solid line, synthetics witha dashed line, and the ticks mark the window of data used in theinversion. Black and white circles show the P- and T-axes, respec-tively. The amplitude scale (micrometres) is given to the bottom leftof the focal sphere (N.B. for visual clarity, this may differ for P andSH waveforms). The source–time function (STF) is plotted underthe P hemisphere, the seismogram timescale below.
Grey, starred station names indicate that the data was not usedin the final inversion but are provided for comparison. For nodalplanar stations, or stations with excessive noise, the direct arrivalsare expected to have a very low amplitude compared to the back-ground station noise, so it is not always possible to pick a directarrival time for realigning the synthetic seismograms; often onlythe depth phases show clear arrivals in the broad-band data. Inthis case the seismograms are not included in the final inversionbut are displayed to show the fit of the synthetics to the depthphases. The horizontal component data for stations TRI and MDTappears to be reversed in polarity compared with nearby stationsfor all the events we modelled. The seismograms from these sta-tions have been flipped for display, but not included in the finalinversion.
Dow
nloaded from https://academ
ic.oup.com/gji/article/201/2/683/568354 by guest on 03 February 2022

700 K. Reynolds, A. Copley and E. Hussain
Figure A1. Minimum misfit solution for the earthquake of 31st May 1995.
Dow
nloaded from https://academ
ic.oup.com/gji/article/201/2/683/568354 by guest on 03 February 2022

Evolution and dynamics of a fold-thrust belt 701
Figure A2. Minimum misfit solution for the earthquake of 4th March 1997.
Dow
nloaded from https://academ
ic.oup.com/gji/article/201/2/683/568354 by guest on 03 February 2022

702 K. Reynolds, A. Copley and E. Hussain
Figure A3. Minimum misfit solution for the earthquake of 20th March 1997.
Dow
nloaded from https://academ
ic.oup.com/gji/article/201/2/683/568354 by guest on 03 February 2022

Evolution and dynamics of a fold-thrust belt 703
Figure A4. Minimum misfit solution for the earthquake of 24th August 1997.
Dow
nloaded from https://academ
ic.oup.com/gji/article/201/2/683/568354 by guest on 03 February 2022

704 K. Reynolds, A. Copley and E. Hussain
Figure A5. Minimum misfit solution for the earthquake of 7th September 1997.
Dow
nloaded from https://academ
ic.oup.com/gji/article/201/2/683/568354 by guest on 03 February 2022

Evolution and dynamics of a fold-thrust belt 705
Figure A6. Minimum misfit solution for the earthquake of 26th June 1999.
Dow
nloaded from https://academ
ic.oup.com/gji/article/201/2/683/568354 by guest on 03 February 2022

706 K. Reynolds, A. Copley and E. Hussain
Figure A7. Minimum misfit solution for the earthquake of 12th July 1999.
Dow
nloaded from https://academ
ic.oup.com/gji/article/201/2/683/568354 by guest on 03 February 2022

Evolution and dynamics of a fold-thrust belt 707
Figure A8. Minimum misfit solution for the earthquake of 28th October 2008.
Dow
nloaded from https://academ
ic.oup.com/gji/article/201/2/683/568354 by guest on 03 February 2022

708 K. Reynolds, A. Copley and E. Hussain
Figure A9. Minimum misfit solution for the earthquake of 29th October 2008.
Dow
nloaded from https://academ
ic.oup.com/gji/article/201/2/683/568354 by guest on 03 February 2022
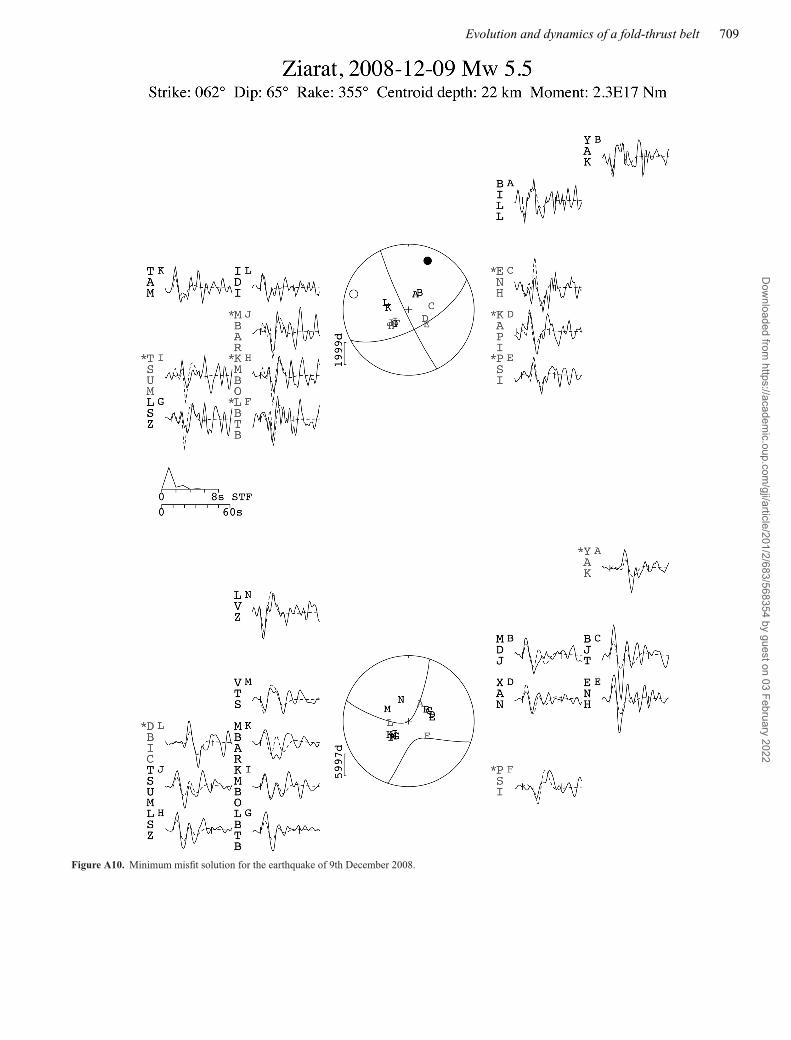
Evolution and dynamics of a fold-thrust belt 709
Figure A10. Minimum misfit solution for the earthquake of 9th December 2008.
Dow
nloaded from https://academ
ic.oup.com/gji/article/201/2/683/568354 by guest on 03 February 2022

710 K. Reynolds, A. Copley and E. Hussain
S U P P O RT I N G I N F O R M AT I O N
Additional Supporting Information may be found in the online ver-sion of this article:
Appendix B. Earthquake parameters.
Appendix C. Additional model results. (http://gji.oxfordjournals.org/lookup/suppl/doi:10.1093/gji/ggv005/-/DC1).
Please note: Oxford University Pres is not responsible for the contentor functionality of any supporting materials supplied by the authors.Any queries (other than missing material) should be directed to thecorresponding author for the article.
Dow
nloaded from https://academ
ic.oup.com/gji/article/201/2/683/568354 by guest on 03 February 2022