Simulation of earthquake ground motion for generation of ...
10
Simulation of earthquake ground motion for generation of artificial accelerograms J. A. Abdalla 1 & Y. M. Hag-Elhassan 2 1 Department of Civil Engineering, American University of Sharjah 2 Formerly, University of Khartoum, Sudan Abstract The determination of strong ground motion acceleration-time history is vital for the evaluation of the dynamic response of existing structures and also for the earthquake resistant design of new structures. The determination of such strong ground motion records is usually obtained by using accelerometers to record the strong motion parameters in the event of earthquakes. The lack and scarcity of accelerometers for recording strong ground motion acceleration-time history in some seismically vulnerable mega-cities necessitates the use of simulation for artificial generation of these records. This paper simulates ground motion acceleration-time history using stochastic processes. The ground acceleration is modelled as a Gaussian stationary process and the non-stationary acceleration- time history is obtained by applying an envelope or shape function to the stationary process. The power spectral density used for this process is a function of the earthquakes’ magnitudes, epicentral distances, and sites soil condition. The generated acceleration-time history can be used to assess the vulnerability of existing buildings to earthquakes and also for the earthquake resistant design of new buildings. Keywords: artificial accelerogram, simulation of ground motion, stochastic processes. 1 Introduction Earthquakes are among the most destructive natural disasters. The life and economic loss which may result from a severe earthquake striking a densely populated area, is a direct consequence of damage and collapse of buildings. There are several densely populated mega-cities that are located in a soft deposit © 2005 WIT Press WIT Transactions on The Built Environment, Vol 81, www.witpress.com, ISSN 1743-3509 (on-line) Earthquake Resistant Engineering Structures V 83
-
Upload
khangminh22 -
Category
Documents
-
view
0 -
download
0
Transcript of Simulation of earthquake ground motion for generation of ...
Simulation of earthquake ground motion for generation of artificial accelerograms
J. A. Abdalla1 & Y. M. Hag-Elhassan2 1Department of Civil Engineering, American University of Sharjah 2Formerly, University of Khartoum, Sudan
Abstract
The determination of strong ground motion acceleration-time history is vital for the evaluation of the dynamic response of existing structures and also for the earthquake resistant design of new structures. The determination of such strong ground motion records is usually obtained by using accelerometers to record the strong motion parameters in the event of earthquakes. The lack and scarcity of accelerometers for recording strong ground motion acceleration-time history in some seismically vulnerable mega-cities necessitates the use of simulation for artificial generation of these records. This paper simulates ground motion acceleration-time history using stochastic processes. The ground acceleration is modelled as a Gaussian stationary process and the non-stationary acceleration-time history is obtained by applying an envelope or shape function to the stationary process. The power spectral density used for this process is a function of the earthquakes’ magnitudes, epicentral distances, and sites soil condition. The generated acceleration-time history can be used to assess the vulnerability of existing buildings to earthquakes and also for the earthquake resistant design of new buildings. Keywords: artificial accelerogram, simulation of ground motion, stochastic processes.
1 Introduction
Earthquakes are among the most destructive natural disasters. The life and economic loss which may result from a severe earthquake striking a densely populated area, is a direct consequence of damage and collapse of buildings. There are several densely populated mega-cities that are located in a soft deposit
© 2005 WIT Press WIT Transactions on The Built Environment, Vol 81, www.witpress.com, ISSN 1743-3509 (on-line)
Earthquake Resistant Engineering Structures V 83
and are not far from seismically active faults. As scientifically proven, soft deposit tends to magnify earthquake accelerations several times even if the epicentral distance is several hundreds of km away as was the case with Mexico City 1985 earthquake. Unless the buildings were designed to resist earthquake forces, such magnified ground acceleration may result in severe damage to buildings causing many fatalities and casualties. The problem of earthquake resistant design of structural frameworks has been recognized by engineers for many years, but it is only recently (1950’s) that the most significant progress has been made. These advances resulted from many factors including: (1) increasing availability of strong ground motion records in some parts; (2) the introduction of statistical approaches in analysis and design; (3) improved understanding of the dynamic behavior of heavily loaded structures; and (4) increasing availability of high-speed digital computers and powerful software for nonlinear dynamics analysis of structures. Unfortunately the availability of strong motion records does not apply to many seismically active areas. An earthquake is usually defined by a collection of responses (acceleration, velocity or displacement) in time known as response history or time history. If the observations can be predicted, the process is called deterministic. If however, the observations can only be defined in terms of probability statements, the process is referred to as non-deterministic or stochastic. The truly random nature of earthquake phenomena can be realistically represented only by statistical mathematical models. Analyses that have used actual recorded data of particular earthquakes are equivalent to a deterministic approach, and provide an unsatisfactory basis for developing response statistics. Although the deterministic aspects of these analyses become less restrictive when effects of a large number of past earthquakes are studied, the opportunity to investigate response for a spectrum of reconstructed earthquakes is limited by the relatively small number of existing records of strong motion earthquakes and their total absence in some cases. These concerns give rise to the use of simulated earthquakes time histories to represent ground motion. As a recommended alternative, simulation of earthquake ground motion has the advantage that they can produce as many sample records as desired. The simulations can be devised to be consistent statistically with past earthquakes, or varied to emphasize particular adverse aspects in anticipation of future earthquakes or reflects the local site condition. This paper simulates earthquake excitation in Khartoum and artificially generates ground acceleration time histories of earthquakes using spectral analysis. Although simulation of earthquakes’ time histories becoming less important due to increase in availability of earthquakes’ records and the wide spread of strong ground motion accelerograms, this is not the case in many part of the world where there is still moderate earthquake activity rate. Therefore, the necessity and importance of such research stem from the lack of strong ground motion records for Khartoum as a megacity with moderate seismic activity rate. The rest of the paper is organized as follows. In the following sections, characterization of earthquake ground motion models will be presented, followed by power spectral density
© 2005 WIT Press WIT Transactions on The Built Environment, Vol 81, www.witpress.com, ISSN 1743-3509 (on-line)
84 Earthquake Resistant Engineering Structures V
functions and then simulations of earthquake ground motion for Khartoum followed by results, discussion and conclusions.
2 Earthquake motion characterization models
The recorded accelerograms of earthquakes may be used to represent earthquakes at a site. As indicated, in this study, simulated earthquakes time histories are generated from an appropriate power spectrum. Over the years acceleration time histories are simulated by several researchers, especially prior to the instrumentation era, using different models. Early models for artificial generation of acceleration ground motions were proposed by Housner [1], Kanai [2] and Tajimi [3]. White noise stationary random models, based on Kanai-Tajimi models, were then suggested by Bycroft [4] and Housner and Jennings [5]. Non-stationary stochastic models were later introduced by Amin and Ang [6], Iyengar and Iyengar [7], Saragoni and Hart [8] and Hsu and Bernard [9]. Furthermore, Wong and Trifunac [10] proposed a narrow frequency band model that can be used in conjunction with an empirical scaling function for characterization of amplitudes and duration of strong motion acceleration. The model resulted in accelerograms that have non-stationary frequency. In this model the frequency bands were selected narrow enough such that the group velocity is approximately constant throughout the frequency range. Under the assumption that strong motion earthquakes result primarily from surface waves in a layered medium resting on a semi-infinite rock formation, Shinozuka et al. [11] proposed a method to derive the expression for the Rayligh wave that produces acceleration at the ground surface with a specified power spectral density. In this method the ground acceleration is modeled as a Gaussian stationary processes and the power spectral densities used for these processes are function of earthquake's magnitude, and epicentral distance. Pires and Tang [12] proposed a model that uses either a Gaussian white noise or a filtered Gaussian white noise with a uniform power spectral density function over the entire frequency range. They used the Fast Fourier Transform (FFT) approach to simulate input support acceleration time history that corresponds to a periodic random process. Hwang and Jaw [13] had simulated the stationary acceleration time history by the following expression: Rofooei et al. [14] proposed a model based on the generalized non-stationary Kanai-Tajimi model in which both the non-stationary amplitude and frequency are incorporated into the model. The model was able to accurately capture the non-stationary features of actual earthquake accelerograms.
3 Power spectral density functions
Most of the earthquake characterization models presented above have used the Kanai-Tajimi [2, 3] Power Spectral Density (PSD) function, or its variations, to generate the acceleration time history. The Kania-Tajimi power spectral density function is in the following form:
© 2005 WIT Press WIT Transactions on The Built Environment, Vol 81, www.witpress.com, ISSN 1743-3509 (on-line)
Earthquake Resistant Engineering Structures V 85
oG
cb
c
cb
aG
+
−
+
=2
2
22
22
41
41)(
ωω
ω
ω (1)
Housner and Jennings [5] had used Kania-Tajimi power spectral density function )(ωG of equation (1) where ω : is the natural frequency of linear oscillator which ranges from 2.1 rad/sec (corresponding to natural period T = 3.0 sec.) to 21 rad/sec (corresponding to natural period T = 0.3 sec.); a = 0.2196/t; t = equivalent duration of strong motion earthquake = 30 sec.; b = 0.64; c = 15.56. Other forms of power spectral density functions had been suggested by several investigators such as Park et al. [15], Shinozuka et al. [11], Lee et al. [16] and Elghadamsi et al. [17], Pires and Tang [12], and Hwang and Jaw [13]. Each form has different parameters and parameters’ range values. In this study the triple-filter power spectral density function suggested by Lee et al. [16] is used. To overcome the singularities of Kanai-Tajimi at small frequencies, the Kanai-Tajimi PSD function has been further filtered in these low frequency regions. One such filter was proposed by Clough-Penzien and augmented by High-Pass. Lee et al. [16] had used Kanai-Tajimi [2, 3], Clough-Penzien [18] and High-Pass filters to get a new form of Normalized Power Spectral Density (NPSD) function as follows:
oGfHfHfHfNPSD 23
22
21 )()()()( = (2)
where Kanai-Tajimi (KT) filter is given by:
+
−
+
= 22
2
2
21
21
41)(
KT
KT
KT
KT
ff
ff
ff
fH
KT
ξ
ξ (3)
Clough-Penzien (CP) filter is given by:
+
−
= 22
4
22
21
)(
CPCP
CP
CP
ff
ff
ff
fH
ξ
(4)
© 2005 WIT Press WIT Transactions on The Built Environment, Vol 81, www.witpress.com, ISSN 1743-3509 (on-line)
86 Earthquake Resistant Engineering Structures V
High-Pass (HP) filter is given by:
+= 22
22
3 )(Af
ffH (5)
where: f = cyclic frequency of vibration; KTf is Kanai-Tajimi ground cyclic
frequency of vibration; KTξ is Kanai-Tajimi ground damping ratio; CPf is
Clough-Penzien cyclic frequency of vibration; CPξ is Clough-Penzien damping
ratio; A is High-Pass constant; and oG is normalized white noise ground intensity. The values of the above parameters depends on the type of soil whether soft, intermediate or hard. Site located on alluvium or other low velocity deposit will be classified as "soft", site located in soft type rock are classified as "intermediate" and site located on solid basement rock will be classified as "hard". Lee et al. [16] had developed frequencies, damping ratios and other parameters for different types of soils. These values are used in this study.
4 Simulation of earthquakes’ ground motion for Khartoum
The acceleration-time history consists of two modes, stationary and non-stationary. The non-stationary acceleration-time history mode is more comprehensive and the acceleration has variable spectral density. In this study the stationary acceleration model proposed by Hwang and Jaw [13] is used to generate the non-stationary acceleration time history. A normalized triple filtered power spectral density function proposed by Lee et al. [16] is used with Hwang and Jaw [13] stationary model. A normalized non-stationary acceleration time history is then generated by normalizing the stationary acceleration time history and then multiplying it by the peak ground acceleration at expected locations where histograms are going to be generated. Hwang and Jaw [13] simulation for the stationary acceleration time history is as follows:
)cos()(2)(1
nk
N
kks tSta
f
φωωω +∆−= ∑=
(6)
where the parameters has been adjusted to reflect local site conditions. )( kS ω is the power spectral density function, herein we used the triple-filter Normalized Power Spectral Density (NPSD) as given in equation (2); fN is number of frequency interval = 25; πω 2=f is the natural cyclic frequency;
fu Nωω =∆ is circular frequency, which is uniformly distributed between
2.1 and 21 rad/sec as suggested by Housner and Jennings [5], ω∆ = 2.1,
© 2005 WIT Press WIT Transactions on The Built Environment, Vol 81, www.witpress.com, ISSN 1743-3509 (on-line)
Earthquake Resistant Engineering Structures V 87
frequency increment; uω is the cut off frequency; kω = ω∆k , k = 1, 1.375,
1.750, 2.125, ..., 10; nφ = thn = random phase angle, uniformly distributed between 0 and 2π . The normalized non-stationary time history )(tam , is obtained by applying
an enveloped function )(tf by a stationary time history )(tas , and then
normalized by the absolute maximum of the acceleration time history )(max ta as given in equation (7)
max
)()()(a
tftata sm = (7)
where: )(max ta is the absolute maximum of )(tas ; )(tf is an envelope function. Several envelope functions had been suggested by Preumon [19], Orabi et al. [20] and Austin et al. [21], among others. In this study a function suggested by Orabi et al. [20] which of the following form is used.
≤
≥=
−
analysis) stationary-non(for 000
tttee
tfct
o)( (8)
where: 1sec54.0 −=oe and 1sec2.0 −=c
Finally, the non-stationary acceleration time history )(ta g is obtained from
the product of a specified peak ground acceleration )(tap and the normalized
non-stationary acceleration time history )(tam as shown before in equation (9)
)(*)()( tatata mpg = (9)
A computer program is written to generate acceleration-time history for several earthquakes in Sudan as shown in Figure 1 and Figure 2.
5 Results and discussion
Table 1 shows the predicted peak ground acceleration at Khartoum area due to several earthquake events with different magnitudes and epicentral distances. Figure 1 and Figure 2 acceleration-time histories for two earthquakes as artificially generated in Khartoum area. Although the artificially generated acceleration-time history is sensible, however, there is a great deal of statistical
© 2005 WIT Press WIT Transactions on The Built Environment, Vol 81, www.witpress.com, ISSN 1743-3509 (on-line)
88 Earthquake Resistant Engineering Structures V
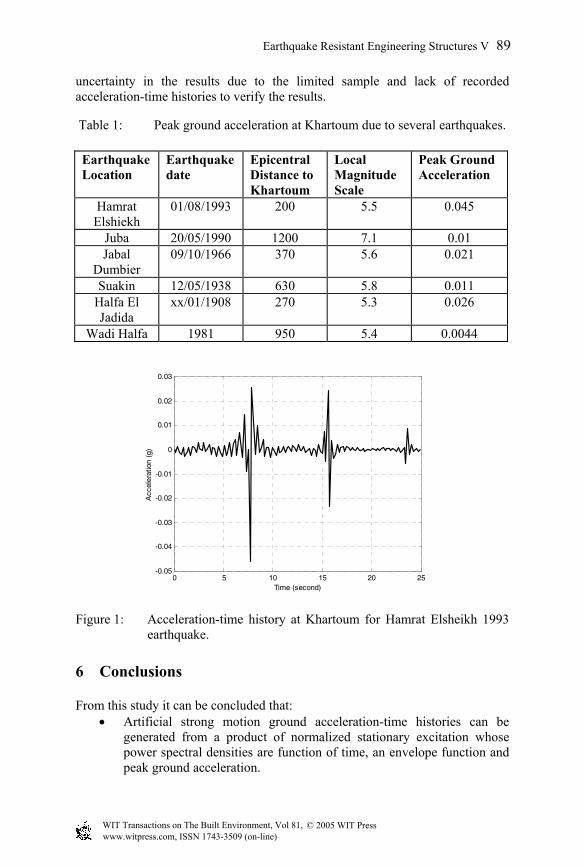
uncertainty in the results due to the limited sample and lack of recorded acceleration-time histories to verify the results.
Table 1: Peak ground acceleration at Khartoum due to several earthquakes.
0 5 10 15 20 25-0.05
-0.04
-0.03
-0.02
-0.01
0
0.01
0.02
0.03
Time (second)
Acc
eler
atio
n (g
)
Figure 1: Acceleration-time history at Khartoum for Hamrat Elsheikh 1993 earthquake.
6 Conclusions
From this study it can be concluded that: • Artificial strong motion ground acceleration-time histories can be
generated from a product of normalized stationary excitation whose power spectral densities are function of time, an envelope function and peak ground acceleration.
Earthquake Location
Earthquake date
Epicentral Distance to Khartoum
Local Magnitude Scale
Peak Ground Acceleration
Hamrat Elshiekh
01/08/1993 200 5.5 0.045
Juba 20/05/1990 1200 7.1 0.01 Jabal
Dumbier 09/10/1966 370 5.6 0.021
Suakin 12/05/1938 630 5.8 0.011 Halfa El Jadida
xx/01/1908 270 5.3 0.026
Wadi Halfa 1981 950 5.4 0.0044
© 2005 WIT Press WIT Transactions on The Built Environment, Vol 81, www.witpress.com, ISSN 1743-3509 (on-line)
Earthquake Resistant Engineering Structures V 89
0 5 10 15 20 25-12
-10
-8
-6
-4
-2
0
2
4
6x 10
-3
Time (second)
Acc
eler
atio
n (g
)
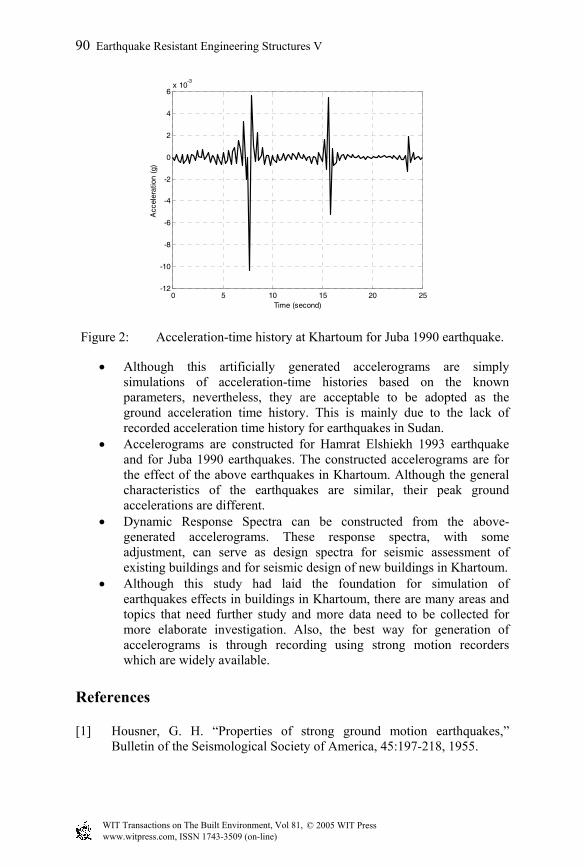
Figure 2: Acceleration-time history at Khartoum for Juba 1990 earthquake.
• Although this artificially generated accelerograms are simply simulations of acceleration-time histories based on the known parameters, nevertheless, they are acceptable to be adopted as the ground acceleration time history. This is mainly due to the lack of recorded acceleration time history for earthquakes in Sudan.
• Accelerograms are constructed for Hamrat Elshiekh 1993 earthquake and for Juba 1990 earthquakes. The constructed accelerograms are for the effect of the above earthquakes in Khartoum. Although the general characteristics of the earthquakes are similar, their peak ground accelerations are different.
• Dynamic Response Spectra can be constructed from the above-generated accelerograms. These response spectra, with some adjustment, can serve as design spectra for seismic assessment of existing buildings and for seismic design of new buildings in Khartoum.
• Although this study had laid the foundation for simulation of earthquakes effects in buildings in Khartoum, there are many areas and topics that need further study and more data need to be collected for more elaborate investigation. Also, the best way for generation of accelerograms is through recording using strong motion recorders which are widely available.
References
[1] Housner, G. H. “Properties of strong ground motion earthquakes,” Bulletin of the Seismological Society of America, 45:197-218, 1955.
© 2005 WIT Press WIT Transactions on The Built Environment, Vol 81, www.witpress.com, ISSN 1743-3509 (on-line)
90 Earthquake Resistant Engineering Structures V
[2] Kanai, K. “Semi-empirical formula for the seismic characteristics of the ground motion,” Bulletin of Earthquake Research Institute University of Tokyo 35:309-325, 1957.
[3] Tajimi, H. A. “A statistical method of determining the maximum response of a building structure during an earthquake,” Proceedings of the Second World Conference in Earthquake Engineering (2WCEE), Science Council of Japan, 781-798, 1960.
[4] Bycroft G. N. “White noise representation of earthquake,” ASCE Journal of Engineering Mechanics, 86:1-16, 1960.
[5] Housner, G. H. and Jennings, P. C. “Generation of artificial earthquakes,” ASCE Journal of Engineering Mechanics, 90 (1): 113-150, 1964.
[6] Amin, M. and Ang, A. H. S. “Nonstationary stochastic model of earthquake motions. ASCE Journal of Engineering Mechanics, 94: 559-583, 1968.
[7] Iyengar, R. N. and Iyengar K. “Non-stationary random process models for earthquake accelerograms,” Bulletin of the Seismological Society of America, 59:1163-1188, 1969.
[8] Saragoni, G. R. and Hart, G. C. “Simulation of artificial earthquake,” Journal of Earthquake Engineering and Structural Dynamics, 2:249-267, 1974.
[9] Hsu, T. I. and Bernand, M. C. “A random process for earthquake simulation.” Journal of Earthquake Engineering and Structural Dynamics, 6(4): 363-374, 1978.
[10] Wong, H. L. and Trifunac, M. D. “Generation of strong motion accelerograms,” Journal of Earthquake Engineering and Structural Dynamics, 7: 509-527, 1979.
[11] Shinozuka, M., Kameda, H. and Koike, T. “Ground strain estimate for seismic risk analysis,” ASCE Journal of Engineering Mechanics, 109(1): 175-190, 1983.
[12] Pires, J. A., Tang, M. “Statistic of hysteretic energy dissipated under random dynamic load” ASCE Journal of Structural Engineering Division, 116(8): 1706-1721, 1990.
[13] Hwang, H. H. M. and Jaw, J. W. “Probabilistic damage analysis of structures.” ASCE Journal of Structural Engineering, 116(7): 1992-2007, 1990.
[14] Rofooei, F. R., Mobarake, A. and Ahmadi, G. “Generation of artificial earthquake records with a nonstationary Kanai-Tajimi model,” Engineering Structures 23: 827-837, 2001.
[15] Park, Y. J., Wen, Y. K. and Sang, A. H. “Random vibration of hystertic systems under bi-directional ground motion” Journal of Earthquake Engineering and Structural Dynamics, 14: 543-557, 1986.
[16] Lee, C-T, Elghadamsi, F. E. and Mohraz, B. “Smooth power spectral density of accelerograms and its application to multi-degree-of-freedom system.” NSF Report, School of Engineering and Applied Science, SMU, Dallas, Texas, 1986.
© 2005 WIT Press WIT Transactions on The Built Environment, Vol 81, www.witpress.com, ISSN 1743-3509 (on-line)
Earthquake Resistant Engineering Structures V 91
[17] Elghadamsi, F. E., Mohraz, B. Lee, C. T. and Moayyad, P. “Time-dependent power spectral density of earthquake ground motion,’ Journal of Soil Dynamics and Earthquake Engineering, 7(1): 15-21, 1988.
[18] Clough, R. W and Penzien, J. Dynamic of Structures. McGraw-Hill, 1993. [19] Perumont, A. “The generation of spectrum compatible accelerograms for
the design of nuclear power plants,” Journal of Earthquake Engineering and Structural Dynamics, 12: 481-497, 1984.
[20] Orabi, I. I., Goodarz, A. and Lin, S. “Hysteretic column under earthquake excitations,” ASCE Journal of Engineering Mechanics, 115: 33-51, 1989.
[21] Austin, M. A., Pister, K. S. and Mahin, S. A. “A methodology for computer-aided design of earthquake resistant steel structures,” Earthquake Engineering Research Center, University of California at Berkeley, EERC Report No. 85113, 1985.
© 2005 WIT Press WIT Transactions on The Built Environment, Vol 81, www.witpress.com, ISSN 1743-3509 (on-line)
92 Earthquake Resistant Engineering Structures V