Predicted ground motion after the L’Aquila 2009 earthquake (Italy, M w 6.3): input spectra for...
32
Bull Earthquake Eng (2011) 9:199–230 DOI 10.1007/s10518-010-9238-y ORIGINAL RESEARCH PAPER Predicted ground motion after the L’Aquila 2009 earthquake (Italy, M w 6.3): input spectra for seismic microzoning B. Pace · D. Albarello · P. Boncio · M. Dolce · P. Galli · P. Messina · L. Peruzza · F. Sabetta · T. Sanò · F. Visini Received: 24 May 2010 / Accepted: 16 December 2010 / Published online: 6 January 2011 © Springer Science+Business Media B.V. 2011 Abstract After the April 6th 2009 L’Aquila earthquake ( M w 6.3), where 306 people died and a further 60,000 were displaced, seismic microzoning investigations have been carried out for towns affected by a macroseismic intensity equal to or greater than 7 MCS. Based upon seismotectonic data, historical seismicity and strong motion records, we defined input spectra to be used in the numerical simulations of seismic microzoning in four key munici- palities, including the town of L’Aquila. We adopted two main approaches: uniform hazard response spectra are obtained by a probabilistic seismic hazard assessment introducing some time-dependency for individual faults on the study area; a deterministic design spectrum is computed from magnitude/distance pairs extracted by a stationary probabilistic analysis of historical intensities. The uniform hazard spectrum of the present Italian building code represents the third, less restrictive, response spectrum to be used for the numerical simula- tions in seismic microzoning. Strong motions recordings of the main shock of the L’Aquila sequence enlighten the critical role played by both the local response and distances metric for sites located above a seismogenic fault; however, these time-histories are compatible with the uncertainties of a deterministic utilization of ground motion predictive equations. As recordings at very near field are rare, they cannot be neglected while defining the seismic input. Disaggregation on the non-Possonian seismotectonic analysis and on the stationary B. Pace (B ) · P. Boncio · F. Visini GEOSISLAB, Università degli Studi “G.D’Annunzio”, Chieti Scalo, Italy e-mail: [email protected] D. Albarello Università degli Studi di Siena, Siena, Italy M. Dolce · P. Galli · F. Sabetta · T. Sanò Dipartimento di Protezione Civile, Rome, Italy P. Messina C.N.R., Istituto di Geologia Ambientale e Geoingegneria, Rome, Italy L. Peruzza OGS, Istituto Nazionale di Oceanografia e Geofisica Sperimentale, Sgonico, TS, Italy 123
-
Upload
independent -
Category
Documents
-
view
3 -
download
0
Transcript of Predicted ground motion after the L’Aquila 2009 earthquake (Italy, M w 6.3): input spectra for...
Bull Earthquake Eng (2011) 9:199–230DOI 10.1007/s10518-010-9238-y
ORIGINAL RESEARCH PAPER
Predicted ground motion after the L’Aquila 2009earthquake (Italy, Mw 6.3): input spectra for seismicmicrozoning
B. Pace · D. Albarello · P. Boncio · M. Dolce ·P. Galli · P. Messina · L. Peruzza · F. Sabetta ·T. Sanò · F. Visini
Received: 24 May 2010 / Accepted: 16 December 2010 / Published online: 6 January 2011© Springer Science+Business Media B.V. 2011
Abstract After the April 6th 2009 L’Aquila earthquake (Mw 6.3), where 306 people diedand a further 60,000 were displaced, seismic microzoning investigations have been carriedout for towns affected by a macroseismic intensity equal to or greater than 7 MCS. Basedupon seismotectonic data, historical seismicity and strong motion records, we defined inputspectra to be used in the numerical simulations of seismic microzoning in four key munici-palities, including the town of L’Aquila. We adopted two main approaches: uniform hazardresponse spectra are obtained by a probabilistic seismic hazard assessment introducing sometime-dependency for individual faults on the study area; a deterministic design spectrumis computed from magnitude/distance pairs extracted by a stationary probabilistic analysisof historical intensities. The uniform hazard spectrum of the present Italian building coderepresents the third, less restrictive, response spectrum to be used for the numerical simula-tions in seismic microzoning. Strong motions recordings of the main shock of the L’Aquilasequence enlighten the critical role played by both the local response and distances metricfor sites located above a seismogenic fault; however, these time-histories are compatiblewith the uncertainties of a deterministic utilization of ground motion predictive equations.As recordings at very near field are rare, they cannot be neglected while defining the seismicinput. Disaggregation on the non-Possonian seismotectonic analysis and on the stationary
B. Pace (B) · P. Boncio · F. VisiniGEOSISLAB, Università degli Studi “G.D’Annunzio”, Chieti Scalo, Italye-mail: [email protected]
D. AlbarelloUniversità degli Studi di Siena, Siena, Italy
M. Dolce · P. Galli · F. Sabetta · T. SanòDipartimento di Protezione Civile, Rome, Italy
P. MessinaC.N.R., Istituto di Geologia Ambientale e Geoingegneria, Rome, Italy
L. PeruzzaOGS, Istituto Nazionale di Oceanografia e Geofisica Sperimentale, Sgonico, TS, Italy
123
200 Bull Earthquake Eng (2011) 9:199–230
site-intensity estimates reach very similar results in magnitude-distance pairs identification;we interpret this convergence as a validation of the geology-based model by historical obser-vations.
Keywords Time-dependent probabilistic seismic hazard assessment ·Site-Intensity approach · Ground Motion · Response Spectra · L’Aquila earthquake
1 Introduction
Observations of post-earthquake damage patterns often reveal substantial variability at shortdistances from the epicentre, as well as collapse and severe damage at great epicentral dis-tances. Examples of these phenomena, such as the consequences of the Mw 6.3 Abruzzoearthquake occurred on April 6, 2009, were frequent in the municipality of L’Aquila (e.g. theOnna village), or even in a few relatively distant municipalities, such as S. Pio delle Camere(Castelnuovo). Construction quality is likely to play a major role in the variable levels ofdamage, but causes quite often have to be investigated in terms of the different local seismicamplification effects arising due to the lithostratigraphic and morphological characteristics,as studied by seismic microzoning (SM).
Depending on the different settings and purposes, SM studies can be carried out at dif-ferent levels of analysis with increasing complexity, according to the following three levels(Gruppo di lavoro 2008):
• Level 1 is a preparatory level consisting of a collection of pre-existing geological, geo-physical and geotechnical data analysed in order to qualitatively classify the territoryinto homogenous seismic microzones;
• Level 2 incorporates the quantitative elements associated with the homogenous zones andgenerates an SM including quantitative evaluation of expected ground motion amplifi-cation factors by using standard Vs profiles parameterized on the basis of field datacollected for that purpose;
• Level 3 generates an SM map with detailed analyses (Local Seismic Response evalua-tions) in particular areas.
With application to the reconstruction in Abruzzo, a level 2–3 SM based on the above crite-ria was carried out for those towns that were affected by a macroseismic intensity equal toor greater than 7 MCS. Field activities involved about 150 researchers and experts from 8Italian Universities (L’Aquila, Chieti-Pescara, Genova, Torino, Firenze, Basilicata, Roma1,Siena), from 7 research centres (CNR, INGV, AGI, ReLuis, ISPRA, ENEA, OGS), and from4 regional institutions (Lazio, Emilia-Romagna, and Toscana Regions; Province of Trento).The Italian Department of Civil Protection coordinated the team.
Activities were organized under 10 thematic tasks. Among these, the results of Task 6,Definition of Design Earthquakes for Numerical Simulations, are the subject of this paperand were developed by the present authors. Based on seismotectonic data, historical seis-micity and strong motion records, elastic response spectra were assimilated as input for thenumerical simulations of the SM.
The analyses carried out for the seismic input characterization followed two differentapproaches:
(a) A probabilistic approach based on the combination of stationary and time-dependentseismogenic sources of the Abruzzo region, for the definition of Uniform Hazard Spec-tra (UHS).
123
Bull Earthquake Eng (2011) 9:199–230 201
(b) A deterministic approach based on the selection of a design earthquake derived fromthe disaggregation of the hazard, from magnitude/distance pairs extracted by proba-bilistic analysis of historical intensities, and from strong motion recordings acquiredduring the Abruzzo seismic sequence.
2 Seismotectonic context, historical seismicity and geology-basedseismogenic sources
The Apennine area surrounding the L’Aquila town is a mountain region formed by ridgesof prevailing carbonate rocks and intramountain tectonic depressions filled by continentaldeposits. The main structure of this part of the Apennines was shaped between the LateMiocene (Messinian) and the Early-Middle Pliocene by SW–NE directed compressional tec-tonic forces, which initiated NE-verging fold-and-thrust structures. Since Late Pliocene—Early Pleistocene times, the compressional structures have been displaced by normal faultsdriven by SW–NE oriented tensional forces, creating the intramountain tectonic depressions(e.g, Lavecchia et al. 1994). The extensional tectonics is presently active along the entireaxial zone of the Apennines, as testified by field geology and paleoseismology (Bosi 1975;Galadini and Galli 2000; Bosi et al. 2003; Galli et al. 2008; Messina et al. 2009a), geodeticdata (D’Agostino et al. 2008), instrumental seismology (Pondrelli et al. 2006) and seismo-tectonic studies (Pace et al. 2002; Boncio et al. 2004a). The active normal faults strike onaverage NW–SE, with local variations to ∼W–E or WNW–ESE, and dip to the SW or tothe SSW (Fig. 1). Most of the historical earthquakes of the Apennine area can be linked tonormal faulting, and the L’Aquila 2009 seismic sequence is the most recent expression ofsuch an active tectonic process.
Geological, seismological and geodetic data indicate that the April 2009 seismic sequencereactivated two major faults of the central Apennines active normal fault systems (for geo-logical data see Boncio et al. 2010; EMERGEO Working Group 2009; Falcucci et al. 2009a;Galli et al. 2009 Gali, 2010, ISPRA at www.apat.gov.it, Messina et al. 2009a; for seismolog-ical data see Chiarabba et al. 2009; Cirella et al. 2009; Pondrelli et al. 2009; for geodetic datasee Anzidei et al. 2009; Atzori et al. 2009 and Walters et al. 2009). The April 6 main shock(Mw 6.3), and probably the April 7 strong aftershock (Mw 5.6), reactivated the SW-dippingPaganica normal fault, for a total sub-surface length of about 20 km in the NW-SE direction(fault 4 in Fig. 1). The April 9 strong aftershock (Mw 5.4) occurred about 18 km north ofthe main shock and reactivated the southern portion of the SW-dipping Mt. Gorzano normalfault (fault 1 in Fig. 1). The hypocentral depths were mostly within the upper 10 km of thecrust, with a nucleation depth of ∼9.5 km for the April 6 main shock, but the entire rangeof seismogenic depths associated with the seismic sequence seem to be around 14–15 km(Chiarabba et al. 2009; Cirella et al. 2009). The main seismogenic sources dip to the SW atan average angle of 50–55 (Chiarabba et al. 2009; Pondrelli et al. 2009).
2.1 Historical seismicity
The investigated area has been struck frequently by moderate earthquakes, and by some ofthe strongest events ever to have occurred in central Italy.
Since its foundation in the late 13th century, L’Aquila has been hit by earthquakes sev-eral times: the Italian database of macroseismic intensities DBMI04 (Stucchi et al. 2007)reports 10 events before 2009, with site intensities Is ≥VII MCS, while heavy disruption(Is = IX MCS) occurred following events on September 9, 1349, November 27, 1461, and
123
202 Bull Earthquake Eng (2011) 9:199–230
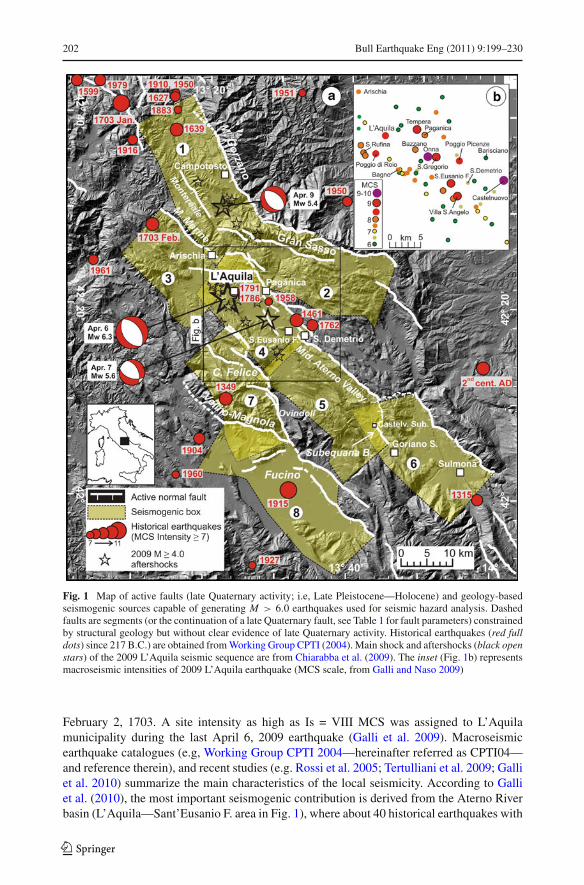
Fig. 1 Map of active faults (late Quaternary activity; i.e, Late Pleistocene—Holocene) and geology-basedseismogenic sources capable of generating M > 6.0 earthquakes used for seismic hazard analysis. Dashedfaults are segments (or the continuation of a late Quaternary fault, see Table 1 for fault parameters) constrainedby structural geology but without clear evidence of late Quaternary activity. Historical earthquakes (red fulldots) since 217 B.C.) are obtained from Working Group CPTI (2004). Main shock and aftershocks (black openstars) of the 2009 L’Aquila seismic sequence are from Chiarabba et al. (2009). The inset (Fig. 1b) representsmacroseismic intensities of 2009 L’Aquila earthquake (MCS scale, from Galli and Naso 2009)
February 2, 1703. A site intensity as high as Is = VIII MCS was assigned to L’Aquilamunicipality during the last April 6, 2009 earthquake (Galli et al. 2009). Macroseismicearthquake catalogues (e.g, Working Group CPTI 2004—hereinafter referred as CPTI04—and reference therein), and recent studies (e.g. Rossi et al. 2005; Tertulliani et al. 2009; Galliet al. 2010) summarize the main characteristics of the local seismicity. According to Galliet al. (2010), the most important seismogenic contribution is derived from the Aterno Riverbasin (L’Aquila—Sant’Eusanio F. area in Fig. 1), where about 40 historical earthquakes with
123
Bull Earthquake Eng (2011) 9:199–230 203
epicentral intensities Io≥V MCS (maximum Io = X MCS, Mw ∼ 6.4 on 1461) have occurred.Others events originated north of Campotosto and in the Arischia area (respectively, 15 and16 earthquakes with Io≥V MCS), where the strongest one occurred on February 2, 1703(Io = X MCS, Mw 6.7).
In brief, after a strong but local earthquake that occurred in 1315 (Mw 6.0 in CPTI04), thefirst event that rocked L’Aquila, its neighbouring villages and castles, was an event in 1349(Mw 6.5 in CPTI04). Actually, this earthquake is considered a cascade event, with separateepicentral areas involving dozens of localities spread all along the entire central-southernApennines. While it is accepted that the strongest main shock (Mw 6.7) was generated by theAquae Iuliae Fault (about 50 km southward of Fucino basin; Galli and Naso 2009), the sub-contemporary main shock hitting the Abruzzo area (causing damage from the Salto Valleyarea to Sulmona, and 800 casualties in the area referred to as L’Aquila as reported by the localcontemporary chronicler, Buccio di Ranallo, fourteenth century) has not yet been assignedto a known seismogenic structure. A possible association with the Campo Felice—Ovindoliseismogenic structure was proposed by Pace et al. (2006) (see Table 1).
About one century later, L’Aquila was hit again by a Mw 6.4 earthquake (CPTI04), onNovember the 27th, 1461. Many private and public buildings and most of the churches wererazed to the ground, but thanks to some foreshocks that alerted the inhabitants, deaths wereonly ∼70 in L’Aquila, and less than 150 in the whole mesoseismal area (as described by thecontemporary chronicles of d’Angeluccio, fifteenth century, and de Tummolillis, fifteenthcentury). This event rocked the same villages hit by the 2009 earthquake, and particularlyCastelnuovo, Onna, Poggio Picenze and Sant’Eusanio Forconese (all with intensities IX–XMCS; see their location in Fig. 1b), as well as the more distant locality of CastelvecchioSubèquo (Is ∼ VIII–IX MCS; Galli et al. 2009); similarly to the 2009 event, there was quite along seismic sequence lasting from November 1461 to March 1462, with several large shockscausing further damages.
More local earthquakes were felt also during the sixteenth and seventeenth centuriesalong the Aterno Valley, but none of them caused heavy damage. However, on February 2,1703, a devastating earthquake (Mw 6.7) razed L’Aquila to the ground (IX MCS) along withall the villages along the Upper Aterno Valley. This earthquake happened two weeks afteranother main shock (January 14, Mw 6.7), which was located just a few tens of kilometersto the northwest, in the Norcia area (upper-left corner of Fig. 1); together, they representthe strongest seismic sequence that has ever occurred in this sector of the Apennines, withabout 9,000 casualties. Also in this case, most of the villages struck by the 2009 event suf-fered comparable effects (VIII–IX MCS in Poggio Picenze, San Gregorio, Sant’EusanioForconese, Paganica, Bazzano, Onna, Santa Rufina, Tempera), and Castelnuovo reached XMCS. Historical accounts described the opening of long chasms along the foothill boundingthe Aterno River valley; they have been investigated by means of paleoseismological analyses(Moro et al. 2002; Galli et al. 2010), thus implying the association of the February 2 shockwith the Upper Aterno Fault System (seismogenic box 3 in Fig. 1).
On October 6, 1762 another earthquake hit the region but again at only a few localities(Castelnuovo, IX–X MCS; Poggio Picenze, IX MCS; Barisciano, VIII–IX MCS) alreadydamaged by the previous events. Two other moderate shocks caused damage to L’Aquila in1786 and in 1791 (Is–VII MCS).
During the twentieth century, an event occurred on June 24, 1958 (Mw ∼ 5; Rossi et al.2005), with Is = VII MCS effects felt in several villages (i.e, Bazzano, Onna, San Demetrione’ Vestini); the mesoseismic area mimics the one that generated by the 2009 event, butscaled by several MCS degrees.
123
204 Bull Earthquake Eng (2011) 9:199–230
Tabl
e1
Para
met
ers
ofth
ege
olog
y-ba
sed
seis
mog
enic
sour
ces
mod
elle
dfo
rse
ism
icha
zard
Seis
mog
enic
sour
ceL
(km
)D
(km
)W
(km
)A
km2
Slip
rate
(mm
/a)
[tim
ein
kyr]
(ref
.)
No.
pale
o-eq
s[t
ime
inky
r](r
ef.)
His
tori
cale
qs[M
w]
M1
(RL
D)
M2
(RA
)M
3(M
0)
Mod
elsl
ipra
te(m
m/a
)(1
s)M
odel
MM
odel
Tm
(1)
Mt.
Gor
zano
28.4
a15
.019
.655
60.
7–1.
1[2
0–30
](5
)2
[8.2
](8
)16
39[6
.3]
6.6
6.7
6.7
0.7
(0.3
5)6.
719
27
0.5
[8.2
](5
,8)
Nor
ther
npo
rtio
n0.
7[8
00]
(11)
(2)
Gra
nSa
sso
28.7
15.0
19.6
562
0.6–
1.0
[13–
18]
(1)
4[1
8](1
,9)
/6.
66.
76.
70.
7(0
.35)
6.7
1110
0.68
[31.
5](6
)W
este
rnpa
rt(3
)M
t.M
arin
e–M
t.Pe
ttino
21.5
14.0
18.3
393
0.3–
0.4
[23–
32]
(5)
Mt.
Mar
ine
5[1
5](7
)M
t.M
arin
eFe
b.17
03[6
.7]
6.4
6.6
6.6
0.5
(0.1
)6.
612
13
0.5–
0.9
[23–
32]
(5)
Mt.
Petti
no(4
)Pa
gani
ca20
.014
.018
.336
60.
24[2
4.8]
(14)
Ana
lyse
sin
prog
ress
1461
[6.5
]6.
36.
56.
50.
7(0
.1)
6.3
531
0.4
[450
](1
3)(5
)M
iddl
eA
tern
oV
alle
y–Su
b-eq
uana
Bas
in
29.0
14.0
18.3
530
0.3–
0.4
[150
–250
](5
)no
rth.
part
>1
[2.6
](1
5)Su
bequ
ana
Bas
in
/6.
66.
76.
70.
3(0
.15)
6.7
2660
0.3
[900
–100
0](t
his
pape
r)ce
ntra
lpar
t(6
)Su
lmon
a23
.515
.019
.646
00.
5–0.
7[9
00–1
000]
(5)
No
data
IIce
nt.A
D(?
)6.
56.
66.
60.
7(0
.1)
6.6
996
0.4–
0.8
[36–
60]
(12)
123
Bull Earthquake Eng (2011) 9:199–230 205
Tabl
e1
cont
inue
d
Seis
mog
enic
sour
ceL
(km
)D
(km
)W
(km
)A
km2
Slip
rate
(mm
/a)
[tim
ein
kyr]
(ref
.)
No.
pale
o-eq
s[t
ime
inky
r](r
ef.)
His
tori
cale
qs[M
w]
M1
(RL
D)
M2
(RA
)M
3(M
0)
Mod
elsl
ipra
te(m
m/a
)(1
s)M
odel
MM
odel
Tm
(7)
C.F
elic
e–O
vind
oli
26.5
13.0
17.0
449
0.8–
1.4
[250
](5
)C
.Fel
ice
3[7
](2
)13
49[6
.5]
(?)
6.5
6.6
6.7
1.0
(0.1
)6.
778
8
1.1
[18]
(5)
C.
Felic
e0.
8–1.
2[7
](2
)(8
)Fu
cino
38.0
13.0
17.0
645
0.4
[400
](5
)M
arsi
cana
f.9
[19.
8](3
)19
15[7
.0]
508
AD
6.8
6.8
6.9
1.0
(0.1
)7.
012
56
0.5–
1.0
[10–
18]
(4)
Para
sano
0.5–
1.4
[10–
18]
(4)
Serr
one
0.7–
0.8
[900
–100
0](5
)M
agno
la0.
4–1.
0[1
0–18
](4
)M
agno
la
Lfa
ult
leng
th;
Dth
ickn
ess
ofth
ese
ism
ogen
icla
yer;
Wdo
wn-
dip
leng
th(c
alcu
late
dfo
ran
aver
age
dip
of50
);
Afa
ult
area
(LxW
).Sl
ipra
tear
eth
em
inim
umva
lues
ofth
eve
rtic
alco
mpo
nent
(i.e
.,th
row
rate
s).T
henu
mbe
rofp
aleo
eart
hqua
kes
reco
gniz
edon
the
faul
tsin
the
time
span
repo
rted
insq
uare
brac
kets
(in
kyr)
are
refe
renc
ed(r
ef.)
like
that
:(1
)Gir
audi
and
Frez
zotti
(199
5);(
2)Pa
ntos
tiet
al.(
1996
);(3
)Gal
adin
iand
Gal
li(1
999)
;(4)
Picc
ardi
etal
.(19
99);
(5)G
alad
inia
ndG
alli
(200
0);(
6)G
alli
etal
.(20
02);
(7)M
oro
etal
.(20
02);
(8)
Gal
adin
ian
dG
alli
(200
3);
(9)
Gal
adin
iet
al.(
2003
);(1
0)Sa
lvi
etal
.(20
03);
(11)
Bon
cio
etal
.(20
04b)
;(1
2)G
ori
etal
.(20
09);
(13)
Mes
sina
etal
.(20
09b)
;(1
4)B
onci
oet
al.
(201
0);
(15)
Falc
ucci
etal
.(2
009b
).H
isto
rica
las
soci
ated
eart
hqua
kes
with
date
and
Mw
are
take
nfr
omW
orki
ngG
roup
CPT
I(2
004)
;qu
estio
nm
arks
for
hist
oric
alea
rthq
uake
sin
dica
tedo
ubtf
ulas
soci
atio
n.M
1an
dM
2ar
em
axim
umm
agni
tude
sfr
omW
ells
and
Cop
pers
mith
(199
4)em
piri
calr
elat
ions
hips
from
subs
urfa
ceru
ptur
ele
ngth
(RL
D)
and
rupt
ure
area
(RA
),re
spec
tivel
y;M
3is
the
max
imum
mag
nitu
defr
omth
eex
pect
edsc
alar
seis
mic
mom
ent(
M0),
unde
rth
eas
sum
ptio
nof
cons
tant
stra
indr
op(3
×10−
5;S
elva
ggi1
998)
.Mod
elsl
ipra
te(t
he1
σun
cert
aint
yis
indi
cate
din
brac
kets
),M
odel
M(m
agni
tude
)and
Mod
elT m
(ave
rage
recu
rren
cetim
eof
the
max
imum
expe
cted
eart
hqua
ke)
are
the
valu
esus
edfo
rse
ism
icha
zard
anal
ysis
aT
hele
ngth
ofth
eM
.Gor
zano
norm
alfa
ulti
nclu
des
the
20km
-lon
gse
gmen
tsho
win
gcl
ear
evid
ence
ofla
teQ
uate
rnar
yfa
ultin
g(G
alad
inia
ndG
alli
2000
)pl
usth
eco
ntin
uatio
nto
the
NW
ofth
esa
me
stru
ctur
e,w
ithou
tcon
stra
ints
onla
teQ
uate
rnar
yfa
ultin
g,ba
sed
onst
ruct
ural
geol
ogy
anal
yses
(alo
ng-s
trik
eva
riat
ion
ofQ
uate
rnar
ydi
spla
cem
ents
;Bon
cio
etal
.200
4a)
123
206 Bull Earthquake Eng (2011) 9:199–230
Outside broad Aterno Valley area (as described above), a strong contribution to the seis-mic hazard of the investigated zones is derived from the earthquakes generated by the FucinoFault System, such as the January 13, 1915 Mw 7 event. The effects of this earthquakewere dramatic (Io XI MCS), since it devastated most of the villages built around the ancientFucino Lake, causing more than 33,000 deaths. In L’Aquila and surrounding villages alongthe Aterno River, the earthquake caused damage corresponding to degree VII–VIII MCS,and up to VIII–IX (e.g. Sant’Eusanio Forconese, Bagno Piccolo).
Finally, another strong event outside the Aterno Valley occurred in 1639 (Mw 6.3). Itstruck Amatrice and its surroundings village, and has been tentatively linked with the partialrupture of the Mt. Gorzano Fault (Castelli et al. 2002; Boncio et al. 2004b).
2.2 Geology-based seismogenic sources
In order to define the earthquake potential in the study area, we considered the most importantactive faults, capable of generating earthquakes larger than M 6.0 (Fig. 1). The seismogenicsources employed here are derived from the integration of two previously published datasets(Galadini and Galli 2000; Boncio et al. 2004a), supplemented by data gathered by some ofthe present authors since 2004. The Database of Individual Seismogenic Sources DISS byINGV (http://diss.rm.ingv.it/diss/) has been not considered in this work because it is incom-plete at least in this region, as confirmed by the absence of the L’Aquila 2009 earthquakeseismogenic source. The model published by Boncio et al. (2004a) was used for seismichazard analyses in central Italy by Pace et al. (2006); starting from their results, we focusedour analysis only on individual sources lying within a distance of about 40–50 km from theApril 6, 2009 seismogenic fault. Nearly all the major earthquakes that have occurred in theL’Aquila surroundings can be assigned to this group of faults; therefore most of the seismicpotential that the national seismic hazard map (Working Group MPS 2004) can focus on islocated in an elongated stripe of high hazard that can now be assigned to smallest individualpatches. As we are interested in localities which are located near these faults (towns affectedby a macroseismic intensity equal to or greater than 7 MCS), the contribution of more distantindividual faults can be considered negligible.
The faults were parameterized in terms of length, attitude, kinematics and slip rate thanksto surface geological data (mainly from Galadini and Galli 2000). Their 3D geometry, usedin shaping the seismogenic sources (seismogenic boxes, SB; Fig. 1), was defined using theapproach and data of Boncio et al. (2004a); the depth distribution of seismicity, the thermo-mechanical constraints imposed on the bottom of the seismogenic layer, and the definition ofa first-order segmentation pattern were implemented by local seismicity data of the Abruzzoregion, pre- and post-2009 earthquakes (Boncio et al. 2009, and seismotectonic data fromthe L’Aquila sequence). This integration of previous and new data allowed us to define anupdated model of seismogenic sources that slightly differs from the one described by Paceet al. (2006). In particular, the geometries of the Paganica and Middle Aterno Valley sources(no. 4 and 5 in Fig. 1; nos. 12 and 13 in Pace et al. 2006) were modified according to theseismotectonics of the L’Aquila 2009 earthquake. The Fucino SB (no. 8 in Fig. 1; no. 22 inPace et al. 2006) now incorporates the eastern portion of the SB no. 20 (Velino-Magnola)of Pace et al. 2006, in order to obtain a better match between the calculated seismogenicpotential and the magnitude of the 1915 earthquake (M ∼ 7.0; Galadini and Galli 2000 andreferences therein). The western portions of the SB no. 20 and the SB no. 10 (Montereale)described by Pace et al. (2006) were not considered here due to the continually scarce, orcontroversial, geological constraints regarding their primary seismogenic role.
123
Bull Earthquake Eng (2011) 9:199–230 207
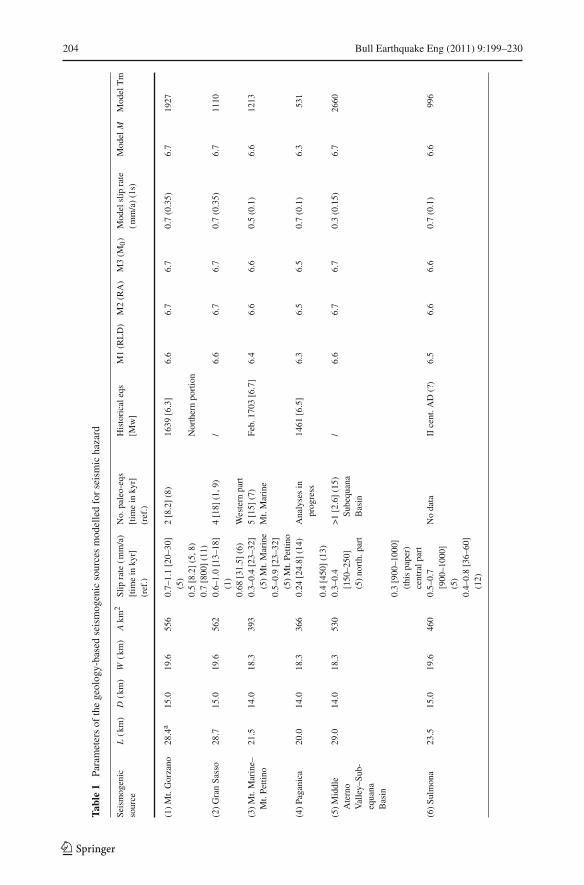
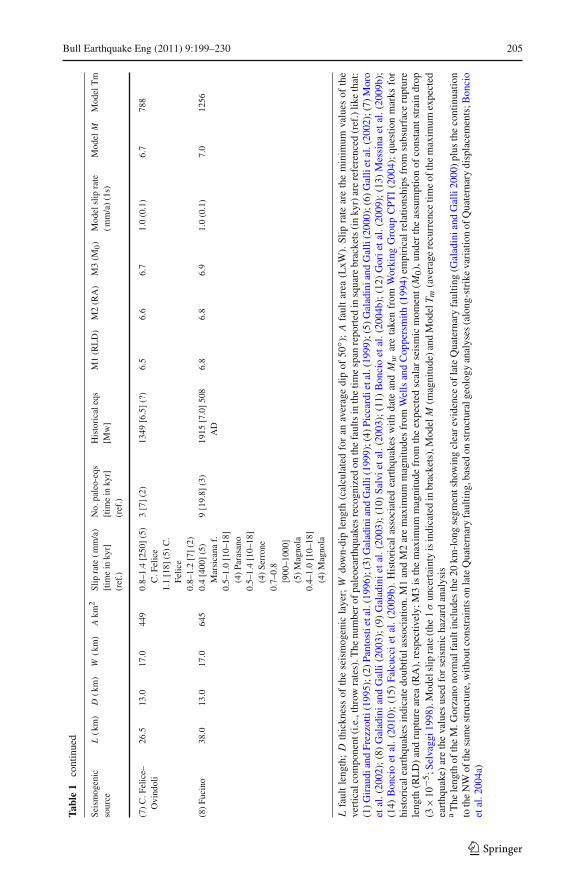
The geometric and kinematic parameters of each geology-based seismogenic source aresummarized in Table 1. All the faults are constrained by detailed geological and morpho-tectonic studies aimed at ascertaining their repeated activity during the late Quaternary,mostly during the last ∼20 ky (see Boncio et al. 2004a and Galli et al. 2008 for a review).The faults are also constrained by at least one paleoseismological trench aimed at detectingpre-historical earthquakes and the associated coseismic offsets, recurrence times and averageslip rate (see Galli et al. 2008 for a review). The Sulmona fault (no. 6) is the only fault withoutpaleoseismological data, but its present activity is documented by field evidence of repeatedsurface ruptures affecting post-last glacial maximum deposits (Gori et al. 2010).
Within the fault system reported in Fig. 1, we defined a first-order segmentation patternin order to estimate the maximum expected magnitude. Consequently, we identified a setof master faults, comprising structures considered to be continuous within the seismogenicdepth and that can be reactivated in their entirety during the same earthquake. The masterfaults of the central Apennines encompass examples of (a) large isolated fault segments(e.g. Mt. Gorzano, Sulmona) and (b) systems of closely-spaced segments, overlapping orlinked by connecting structures, that are considered part of a single large structure contin-uous at depth (Gran Sasso, Mt. Marine—Mt. Pettino, Middle Aterno Valley—SubequanaBasin, Campo Felice—Ovindoli and Fucino systems). The April 6, 2009 earthquake is anexample of closely-spaced, right-stepping segments joining at depth into a continuous faultthat ruptured during a single large earthquake. Paleoseismological data help in defining themaster fault, when the same event is recognized on different segments of the system (e.g.Fucino: Michetti et al. 1996; Galadini and Galli 1999; or Campo Felice—Ovindoli: Pantostiet al. 1996; Salvi et al. 2003). The most uncertain structure, in terms of along-strike continuityat depth, is the Middle Aterno Valley—Subequana Basin system, which includes two mainfaults (Fig. 1): the Middle Aterno fault can be reasonably considered a continuous SE-strik-ing major fault about 20 km long (Galadini and Galli 2000); the Subequana Basin fault isa SE-striking fault about 5 km long, in right-stepping relationship with the Middle Aternofault. Although the surface geology does not provide conclusive evidence for their linkageduring the late Quaternary, they are considered here as linked by a connecting normal faultstriking ∼N-S, dipping to the W and offsetting the pre-Quaternary bedrock (APAT 2005;Vezzani and Ghisetti 1998); the total length of this hypothesized master fault is therefore29 km. In general the master faults lengths analyzed in this paper range from 20 to 38 km(Fig. 1, Table 1).
Concerning the fault slip rates, the values reported in Table 1 are minimum values of thevertical component of slip rate (i.e, the throw rates). The throw rates range from ≥0.3 to1.4 mm/a (see Table 1 for chronological intervals and references). Given the uncertaintiesaffecting these measurements, mostly due to timing uncertainties, the reported values areconsidered here approximately equal to the slip rate along the fault (“Model slip rate” inTable 1). Correcting for the fault dip (50 on average) increases slip rates by about 0.1 mm/awith respect to the throw rates, largely within the epistemic uncertainties.
The 3D geometry of the master faults has been defined by assuming an average faultdip over the entire seismogenic layer and by constraining the thickness of the seismogen-ic layer. The average fault dip of the seismogenic faults in the Abruzzo area was fixed at50 by Boncio et al. (2004a); observation of the L’Aquila 2009 earthquake indicates thatthis value is a reasonable assumption. The thickness of the seismogenic layer is constrainedby well-located instrumental seismicity and thermo-mechanical modelling of the transitiondepth from brittle-frictional to plastic flow mechanisms (Boncio et al. 2004a, 2009). Theseismogenic thickness is not homogeneous across the area, as it is dependent on the heatflow. In the Abruzzo Apennines, the regional surface heat flow decreases from west to east
123
208 Bull Earthquake Eng (2011) 9:199–230
(from 50–60 mW/m2 to ≤40 mW/m2, Pasquale et al. 1997). This geothermal heat fluxgradient leads to a small (but appreciable) increase in seismogenic thickness from west toeast: beneath the master faults (Table 1) it varies from ∼13 to ∼15 km.
Finally, the seismogenic boxes (SB) reported in Fig. 1 are the projection at the surfaceof the 3D master faults. Other parameters needed to model these faults in a probabilisticseismic hazard framework, such as the size of the maximum earthquake and its recurrencetime, are derived by resorting to the experience of the so-called LASSCI model (see Section3 below). The geology-based sources proposed here therefore represent a consensus updateof previously defined sources, in light of the occurrence of the L’Aquila earthquake, andare limited to the area of main interest for reconstruction and seismic retrofitting after thequake.
3 Response spectra from a layered probabilistic seismic hazard model (LASSCI)
The LASSCI model (LAyered Seismogenic Source model in Central Italy) is an earthquakerupture forecast model developed in the early 2000s (Peruzza and Pace 2002; Pace et al. 2006;Peruzza et al. 2007), based on a schematic representation of different seismogenic sources,formally combined together into a probabilistic seismic hazard assessment, under stationaryand time-dependent perspectives.
The LASSCI model contains three separate layers of seismogenic sources, namely thebackground level (BK), the seismotectonic provinces (SP), and individual faults capable ofmajor earthquakes (seismogenic boxes SB, see Sect. 2). Briefly, the BK layer covers the lowerrange of magnitude (2.5 < M ≤ 5.4), and the seismicity rates are obtained by truncated GRrelationships for cells centred on a 0.1 × 0.1 grid. The a and b parameters are computedover a search radius of 20 km from the cell’s centre. The SP layer returns expected ratesof medium-to-large earthquakes following a traditional Cornell-type approach, assuming ahomogeneous distribution of earthquakes in space, GR frequency-magnitude relationship,and stationary process with respect to time: this layer includes major events (M ≥ 5.5) thatcannot be assigned to recognised faults (further details on SP characterization can be foundin Pace et al. 2006). Finally, for the SB, the expected seismic rates are based on the geometryand kinematics of the faults, and different earthquake recurrence models have been assignedon the basis of historical and instrumental earthquake association.
The original model started being updated in early 2009, when it was formatted for submis-sion to an international validation test (Collaboratory for the Study of Earthquake Predictabil-ity CSEP, Schorlemmer et al. 2006, 2009; Italy Testing Region at http://www.cseptesting.org/regions/ita); the changes (Peruzza et al. 2011; Pace et al. 2010) introduced new constraintson fault recurrence times of SB sources, and treat the BK layer as being homogeneous in theSP’s.
In this study we used the same layer of BK sources used for CSEP update of the originalLASSCI model (details in Pace et al. 2010). Focused on a small area inside the extensionalApennine SP, the contribution of the external SP’s, defined as in Pace et al. (2006), is neg-ligible even if formally considered. About SB sources, as previously described in Sect. 2,the fault geometries have been slightly revised after a consensus evaluation and in the lightof the 2009 L’Aquila seismic sequence with respect to the original SB’s published in Paceet al. (2006). Characteristic magnitude and its mean recurrence time have been recomputedby introducing an error propagation scheme (described in Peruzza et al. 2010, and alreadyused for CSEP update of the model, see details in Peruzza et al. 2011). Their values are givenin Table 1. Regarding the model of earthquake recurrence, all faults have been modelled
123
Bull Earthquake Eng (2011) 9:199–230 209
with an asymmetric Gaussian bell, centred on the maximum magnitude allowed by the faultdimension (characteristic event s.s.), and using −3s and +1s for the lower and upper bound,respectively; this asymmetry reduces the critical impact of the highest magnitudes on seismicmoment release on the two sides—M < Mmax; M > Mmax—of the bell. By scaling properlythe occurrences of each magnitude class sampled around Mmax, the total amount of seismicmoment is set equal the seismic moment released by the long-term, maximum event alone,to preserve the seismic moment budget at the source.
About stationarity, or time-dependent assumptions, usually, seismic hazard maps intendedfor regulation are time-independent, as they portray a long-term average hazard and are notaffected by the time of the last earthquake rupture. This attribute makes the maps wellsuited for use in building codes, where the long-term life of a structure and its resilienceto earthquake shaking must be considered. As stated by the International Commission onEarthquake Forecasting for Civil Protection after the L’Aquila earthquake, in its docu-ment Operational Earthquake Forecasting: State of Knowledge and Guidelines for Utili-zation1 exceptions to this rule have been developed for specific areas (e.g. Japan: EarthquakeResearch Committee 2005; California: Field et al. 2009); these exceptions incorporate time-dependence for the best known faults in the branches of complex logic trees. Even if someof these results were not entered into the national map (e.g. Petersen et al. 2008) localauthorities use them for planning (the California Earthquake Authority for earthquake insur-ance, for example). Developments to existing models are allowing even more complex timedependency.
In Italy, the National Seismic Hazard Maps (Working Group MPS 2004) were last updatedin 2004; they are fully time-independent and do not address to individual faults. Despite theprovisions given by the law (Ord. 3274/03, available at zonesismiche.mi.ingv.it/documen-ti/gazzetta.pdf), no periodic revision has been proposed at present to include new researchresults on earthquake faults, crustal deformation and earthquake ground shaking. The na-tional map shows a homogeneous high hazard over a long and wide stripe in the cen-tral and southern Apennines; this region is taken as belonging to the same seismogeniczone, and the PGA values and uniform hazard spectra are nearly identical along the entirezone, thus neglecting the details of active faulting knowledge available in this sector of theApennines.
As the occurrence of a significant earthquake like the 2009 event should be retrospectivelyused to check the performances of stationary and time-dependent approaches, we exploredfour different reference models for SB sources, adopting on the structure of the LASSCIframework. The models range from a stationary assumption coherent with the methodologi-cal scheme of the national seismic hazard map for regulation (Working Group MPS 2004), toa time-dependent approach applied to SB sources only, computed before and after the April6 earthquake. The four models are as follows:
1. LADEPOIS: all the individual SB’s are treated as Poissonian; this is the hypothesis mostsimilar to the existing seismic hazard map, even if we use individual sources (the SB’s)instead of the large seismotectonic zones of ZS9 (Working Group MPS 2004).
2. LADE (LAyered Design Earthquake): we introduced time-dependency by adopting thesimplest time-dependent process, namely the renewal process, using the formulation ofBrownian passage time (BPT) distributions (Matthews et al. 2002), starting from the
1 Time-dependent forecasting models have been developed for specific areas in Japan, China, and U.S. Nationalprotocols for the operational use of medium-term and short-term forecasts have not yet been established. InCalifornia, however, short-term forecasts are updated hourly based on seismicity activity, and operationalprocedures have been established for the utilization of short-term forecasts www.ias\discretionary-pei.org/downloads/Ex_Sum_v5_THJ9_A4format.pdf.
123
210 Bull Earthquake Eng (2011) 9:199–230
time elapsed since the last maximum event for each source. The model has been ret-rospectively applied on March 30, 2009: the Paganica SB (4 in Fig. 2) thereby has anelapsed time equal to 548 years (the last event was on 1461/11/26);
3. LADE1: time-dependency assumptions follow LADE, but with the elapsed time of thePaganica source set to zero, after the April 6 earthquake occurrence; the source is there-fore “switched off”;
4. LADE2: sources with relatively short elapsed times, having time-dependent earthquakeprobabilities smaller than those under stationary assumptions, are treated as Poisso-nian (they are: 3-Pizzoli-Pettino; 4-Paganica; 8-Fucino); the other sources include time-dependency. This approach is precautiounary.
The seismic hazard computations were performed using the well-known code SEISRISKIII (Bender and Perkins 1987; LaForge 1996), over an area of about 50 km around L’Aquila,and in particular at four selected sites: L’Aquila, Arischia, San’Eusanio Forconese andGoriano Sicoli (see Fig. 1). In Fig. 2 we reported the expected peak ground acceleration(PGA) values (defined as the acceleration with a 90% of probabilities of not being exceededin 50 years), obtained by the four recurrence models (LADEPOIS, time-independent fore-cast; LADE, forecast at 30 March 2009; LADE1, forecast at 30 April 2009; LADE2 forecastat 30 April 2009) and by three different ground motion predictive equations (GMPE), takenfrom Ambraseys et al. (1996); Sabetta and Pugliese (1996) and Akkar and Bommer (2007).
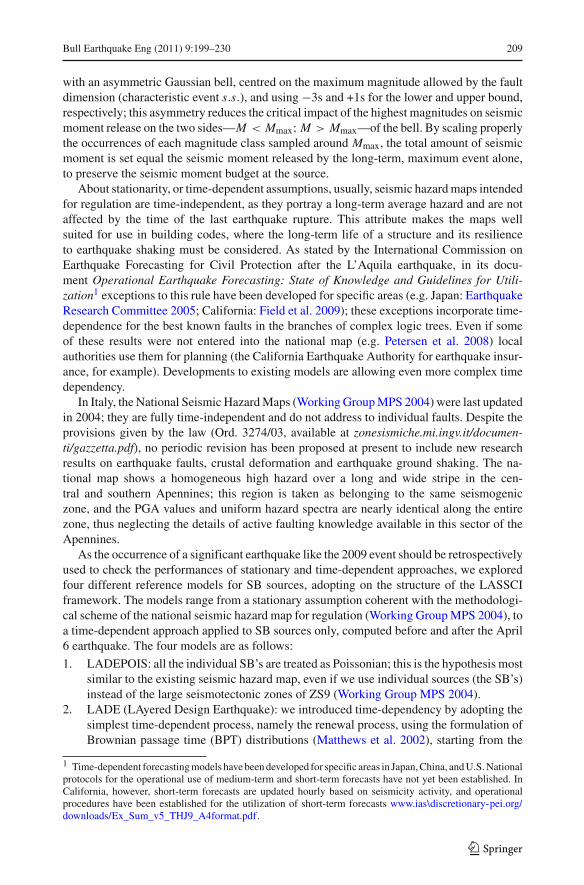
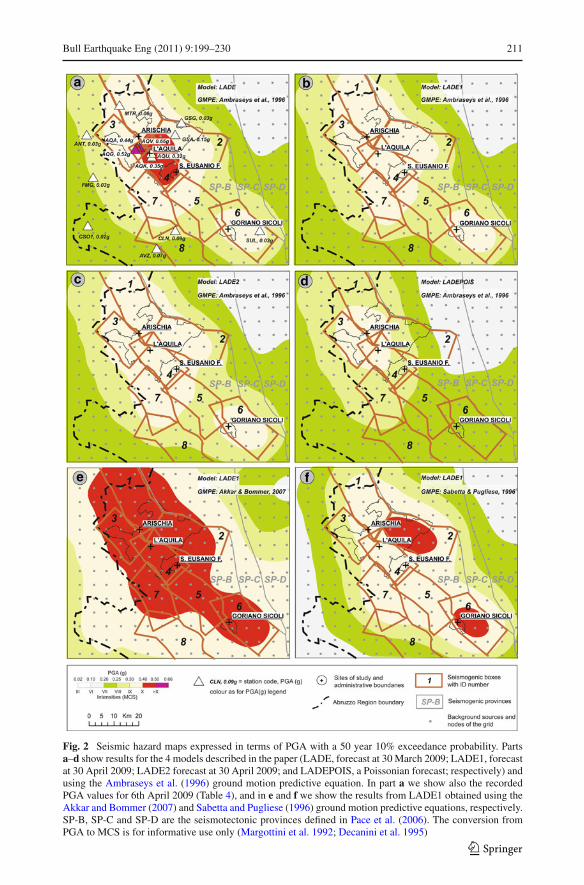
Some explanation is required with respect to the map prior to the M = 6.3 earthquake(Fig. 2a). PGA values exceeding 0.4 g are due to the high earthquake probability assignedto the Paganica source. With an occurrence probability of ∼33% for a characteristic event inthe 50 years after March 2009, the fictitious recurrence time of an M ∼ 6.3 event is equal to124 years. Fictitious recurrence time is computed by solving the equivalence of probabilitiesgiven by:
PTdep = Ppois = 1 − e−t/Tfict (1)
where PTdep is the conditional probability obtained by the BPT model, Ppois is the poissonianprobability, and t is the observation period (50 years).
As the map represents a 475 year return period, for the Paganica SB we can assume a prob-ability of having at least one characteristic event to be about 98% (P = 1 − e−475/124), andtherefore the PGA in this SB approaches that of a deterministic scenario. Very similar resultshave been obtained with the LASSCI fault model updated for the CSEP Italian test, reportedby Peruzza et al. 2011. Even if a hazard model cannot be validated by a single earthquake,the results from the LADE model are consistently in agreement with the PGA measurements(Fig. 2a). LADE1 (Fig. 2b) differs from the previous models only in the “absence” of thePaganica characteristic earthquake source (where the probability of occurrence drops to zeroafter April 6); the PGA level remains high, for the contribution of BK and nearby sourcein both the northern Abruzzo and Sulmona areas (SB 6). If we tentatively introduce pois-sonian behaviour for the SB’s ruptured in historical time (LADE2, Fig. 2c), the differenceis barely noticeable on the map, with only a slight increase of PGA values towards to thesouth-west. These differences are better shown in Fig. 3, where the single values of PGAfor the 4 key municipalities are plotted. In Fig. 2d, where all the sources are assumed tofollow a Poisson process in time, a general decrease of the expected PGA is observed, evenif the use of well-defined individual seismogenic sources allows computation of PGA valueshigher than those of the official national hazard map (Working Group MPS 2004, MPS04in Fig. 3). In the last two frames (Fig. 2e, f), starting from the LADE1 model (Fig. 2b), wehave changed the GMPE, following Akkar and Bommer (2007) and Sabetta and Pugliese
123
Bull Earthquake Eng (2011) 9:199–230 211
Fig. 2 Seismic hazard maps expressed in terms of PGA with a 50 year 10% exceedance probability. Partsa–d show results for the 4 models described in the paper (LADE, forecast at 30 March 2009; LADE1, forecastat 30 April 2009; LADE2 forecast at 30 April 2009; and LADEPOIS, a Poissonian forecast; respectively) andusing the Ambraseys et al. (1996) ground motion predictive equation. In part a we show also the recordedPGA values for 6th April 2009 (Table 4), and in e and f we show the results from LADE1 obtained using theAkkar and Bommer (2007) and Sabetta and Pugliese (1996) ground motion predictive equations, respectively.SP-B, SP-C and SP-D are the seismotectonic provinces defined in Pace et al. (2006). The conversion fromPGA to MCS is for informative use only (Margottini et al. 1992; Decanini et al. 1995)
123
212 Bull Earthquake Eng (2011) 9:199–230
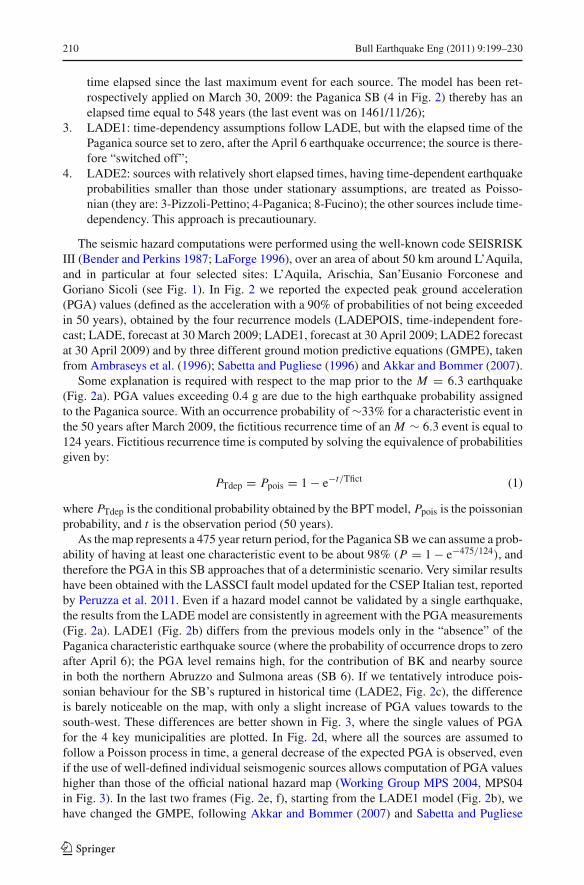
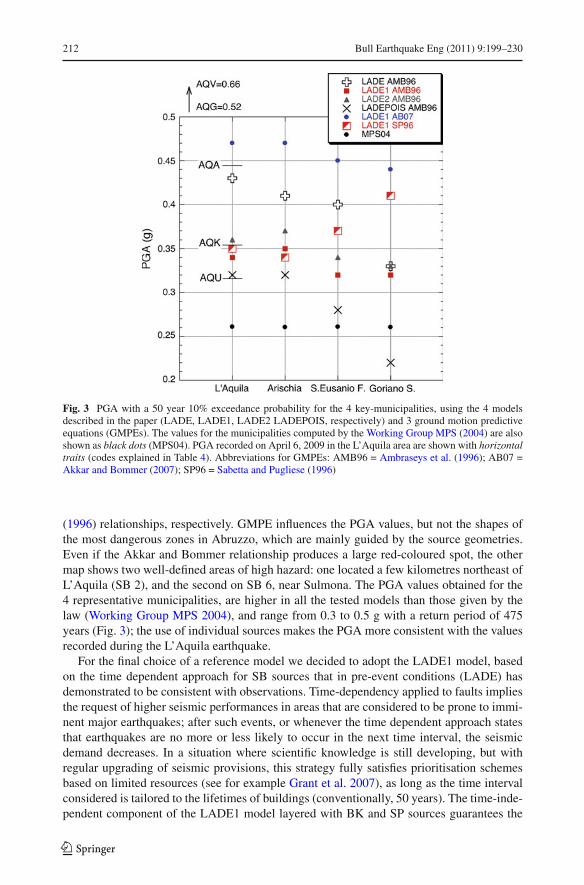
Fig. 3 PGA with a 50 year 10% exceedance probability for the 4 key-municipalities, using the 4 modelsdescribed in the paper (LADE, LADE1, LADE2 LADEPOIS, respectively) and 3 ground motion predictiveequations (GMPEs). The values for the municipalities computed by the Working Group MPS (2004) are alsoshown as black dots (MPS04). PGA recorded on April 6, 2009 in the L’Aquila area are shown with horizontaltraits (codes explained in Table 4). Abbreviations for GMPEs: AMB96 = Ambraseys et al. (1996); AB07 =Akkar and Bommer (2007); SP96 = Sabetta and Pugliese (1996)
(1996) relationships, respectively. GMPE influences the PGA values, but not the shapes ofthe most dangerous zones in Abruzzo, which are mainly guided by the source geometries.Even if the Akkar and Bommer relationship produces a large red-coloured spot, the othermap shows two well-defined areas of high hazard: one located a few kilometres northeast ofL’Aquila (SB 2), and the second on SB 6, near Sulmona. The PGA values obtained for the4 representative municipalities, are higher in all the tested models than those given by thelaw (Working Group MPS 2004), and range from 0.3 to 0.5 g with a return period of 475years (Fig. 3); the use of individual sources makes the PGA more consistent with the valuesrecorded during the L’Aquila earthquake.
For the final choice of a reference model we decided to adopt the LADE1 model, basedon the time dependent approach for SB sources that in pre-event conditions (LADE) hasdemonstrated to be consistent with observations. Time-dependency applied to faults impliesthe request of higher seismic performances in areas that are considered to be prone to immi-nent major earthquakes; after such events, or whenever the time dependent approach statesthat earthquakes are no more or less likely to occur in the next time interval, the seismicdemand decreases. In a situation where scientific knowledge is still developing, but withregular upgrading of seismic provisions, this strategy fully satisfies prioritisation schemesbased on limited resources (see for example Grant et al. 2007), as long as the time intervalconsidered is tailored to the lifetimes of buildings (conventionally, 50 years). The time-inde-pendent component of the LADE1 model layered with BK and SP sources guarantees the
123
Bull Earthquake Eng (2011) 9:199–230 213
expected ground motion to be as high as the 100% Poisson model (see Fig. 2b, d), andtherefore it has been considered as the most appropriate to the aims of the microzoningproject.
3.1 Uniform hazard spectra
With the LADE1 model we have calculated uniform hazard spectra (UHS) at 10% exceed-ance probability in the next 50 years, starting from 30 April 2009 (namely, the return periodof the equivalent Poisson process is 475 years) using different GMPE’s as follows:
• Sabetta and Pugliese (1996) (SP96). The GMPE is based on the analysis of 95 Italianwaveforms, recorded during 17 earthquakes occurring before 1985 with 4.6 ≤ M ≤ 6.8(Ml or Ms). The equation, valid for epicentral distances (Repi), gives the maximum ofthe two horizontal components of ground motion; it has been slightly corrected for nor-mal fault kinematics following the Bommer et al. (2003) methodology and applied torock conditions. To apply the required adjustments between different magnitude scales,we used the methodologies described in Ambraseys and Free (1997) and Sabetta et al.(2005).
• Ambraseys et al. (1996) (AMB96). The GMPE is based on the analysis of 422 wave-forms of 157 earthquakes in Europe and adjacent regions. The equation is formulatedfor the “Joyner and Boore” distance (Rjb) defined as the closest distance to the surfaceprojection of the fault rupture, and returns the maximum value of the horizontal com-ponents of ground motion. In order to apply the correction between Rjb and Repi andbetween geometrical mean and maximum value of the horizontal components, we usedthe methodologies described by Scherbaum et al. (2004) and Sabetta et al. (2005).
• Akkar and Bommer (2007) (AB07). The GMPE is based on the analysis of 532 wave-forms, recorded during 132 European earthquakes, more than half of which occurred inItaly, with 5.0 ≤ M ≤ 7.6(Mw). The equation uses the Rjb distance, returns the geo-metrical mean of the horizontal components and is based on normal faulting and rockconditions.
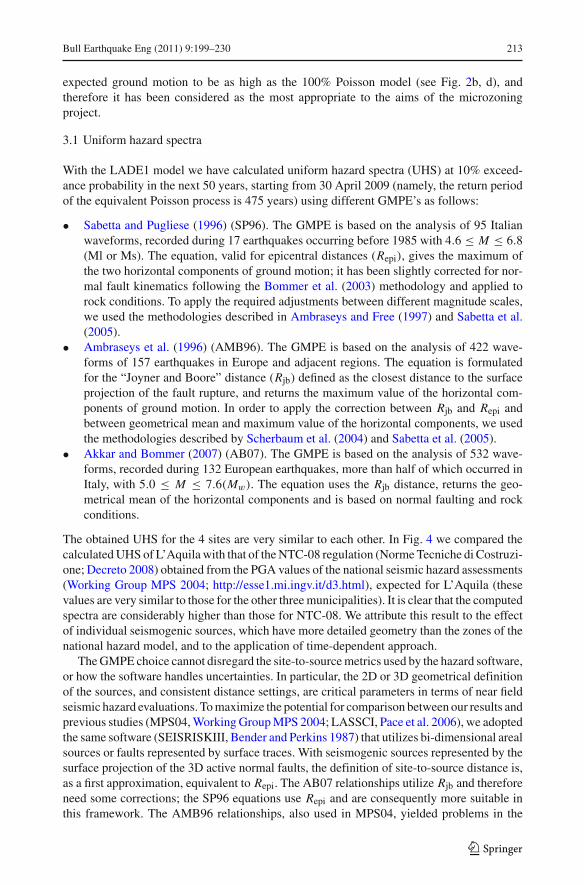
The obtained UHS for the 4 sites are very similar to each other. In Fig. 4 we compared thecalculated UHS of L’Aquila with that of the NTC-08 regulation (Norme Tecniche di Costruzi-one; Decreto 2008) obtained from the PGA values of the national seismic hazard assessments(Working Group MPS 2004; http://esse1.mi.ingv.it/d3.html), expected for L’Aquila (thesevalues are very similar to those for the other three municipalities). It is clear that the computedspectra are considerably higher than those for NTC-08. We attribute this result to the effectof individual seismogenic sources, which have more detailed geometry than the zones of thenational hazard model, and to the application of time-dependent approach.
The GMPE choice cannot disregard the site-to-source metrics used by the hazard software,or how the software handles uncertainties. In particular, the 2D or 3D geometrical definitionof the sources, and consistent distance settings, are critical parameters in terms of near fieldseismic hazard evaluations. To maximize the potential for comparison between our results andprevious studies (MPS04, Working Group MPS 2004; LASSCI, Pace et al. 2006), we adoptedthe same software (SEISRISKIII, Bender and Perkins 1987) that utilizes bi-dimensional arealsources or faults represented by surface traces. With seismogenic sources represented by thesurface projection of the 3D active normal faults, the definition of site-to-source distance is,as a first approximation, equivalent to Repi. The AB07 relationships utilize Rjb and thereforeneed some corrections; the SP96 equations use Repi and are consequently more suitable inthis framework. The AMB96 relationships, also used in MPS04, yielded problems in the
123
214 Bull Earthquake Eng (2011) 9:199–230
Fig. 4 Acceleration response spectra, at 5% damping and for rock sites. LADE1 is the chosen time-dependentmodel, with forecast at 30 April 2009 (details in the text); abbreviations for GMPEs: AMB96 = Ambraseys etal. (1996); AB07 = Akkar and Bommer (2007); SP96 = Sabetta and Pugliese (1996); NTC-08 475 years; soilA = Norme Tecniche di Costruzione (Decreto 2008) obtained from the PGA values of the national seismichazard assessments (Working Group MPS 2004)
very near field, and the UHS show anomalous patterns at low periods due to the contributionto hazard given by the background layer (Fig. 4).
Another troubleshooting issue in the GMPE’s is the magnitude-dependent uncertainty.For example, the pronounced bump in the AB07 curve of Fig. 4 is due to this dependency:in any case, there are controversial opinions regarding the use of σ = f (M) (e.g. Musson2009).
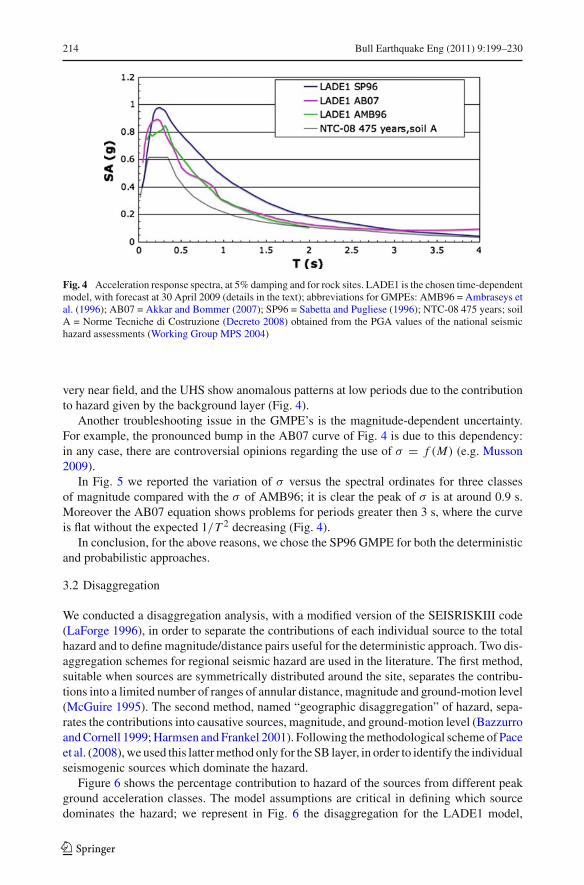
In Fig. 5 we reported the variation of σ versus the spectral ordinates for three classesof magnitude compared with the σ of AMB96; it is clear the peak of σ is at around 0.9 s.Moreover the AB07 equation shows problems for periods greater then 3 s, where the curveis flat without the expected 1/T 2 decreasing (Fig. 4).
In conclusion, for the above reasons, we chose the SP96 GMPE for both the deterministicand probabilistic approaches.
3.2 Disaggregation
We conducted a disaggregation analysis, with a modified version of the SEISRISKIII code(LaForge 1996), in order to separate the contributions of each individual source to the totalhazard and to define magnitude/distance pairs useful for the deterministic approach. Two dis-aggregation schemes for regional seismic hazard are used in the literature. The first method,suitable when sources are symmetrically distributed around the site, separates the contribu-tions into a limited number of ranges of annular distance, magnitude and ground-motion level(McGuire 1995). The second method, named “geographic disaggregation” of hazard, sepa-rates the contributions into causative sources, magnitude, and ground-motion level (Bazzurroand Cornell 1999; Harmsen and Frankel 2001). Following the methodological scheme of Paceet al. (2008), we used this latter method only for the SB layer, in order to identify the individualseismogenic sources which dominate the hazard.
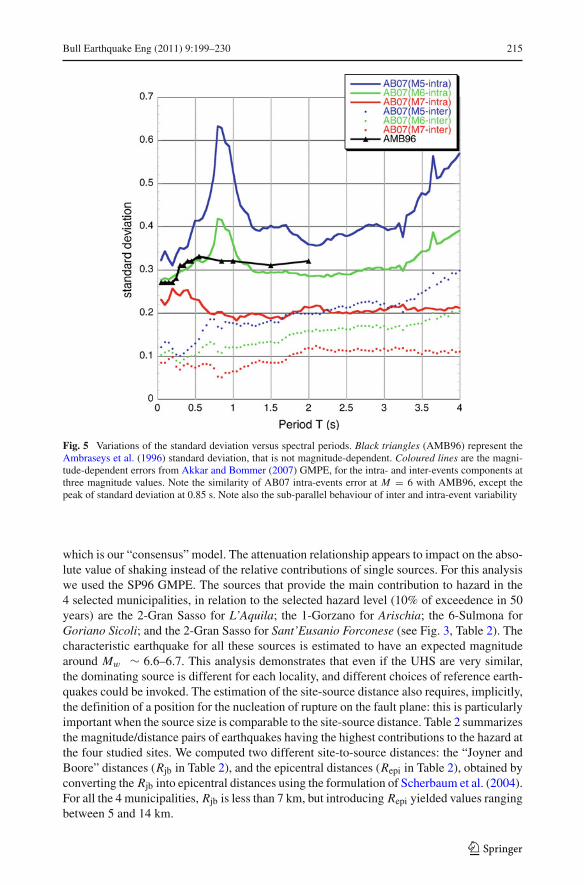
Figure 6 shows the percentage contribution to hazard of the sources from different peakground acceleration classes. The model assumptions are critical in defining which sourcedominates the hazard; we represent in Fig. 6 the disaggregation for the LADE1 model,
123
Bull Earthquake Eng (2011) 9:199–230 215
Fig. 5 Variations of the standard deviation versus spectral periods. Black triangles (AMB96) represent theAmbraseys et al. (1996) standard deviation, that is not magnitude-dependent. Coloured lines are the magni-tude-dependent errors from Akkar and Bommer (2007) GMPE, for the intra- and inter-events components atthree magnitude values. Note the similarity of AB07 intra-events error at M = 6 with AMB96, except thepeak of standard deviation at 0.85 s. Note also the sub-parallel behaviour of inter and intra-event variability
which is our “consensus” model. The attenuation relationship appears to impact on the abso-lute value of shaking instead of the relative contributions of single sources. For this analysiswe used the SP96 GMPE. The sources that provide the main contribution to hazard in the4 selected municipalities, in relation to the selected hazard level (10% of exceedence in 50years) are the 2-Gran Sasso for L’Aquila; the 1-Gorzano for Arischia; the 6-Sulmona forGoriano Sicoli; and the 2-Gran Sasso for Sant’Eusanio Forconese (see Fig. 3, Table 2). Thecharacteristic earthquake for all these sources is estimated to have an expected magnitudearound Mw ∼ 6.6–6.7. This analysis demonstrates that even if the UHS are very similar,the dominating source is different for each locality, and different choices of reference earth-quakes could be invoked. The estimation of the site-source distance also requires, implicitly,the definition of a position for the nucleation of rupture on the fault plane: this is particularlyimportant when the source size is comparable to the site-source distance. Table 2 summarizesthe magnitude/distance pairs of earthquakes having the highest contributions to the hazard atthe four studied sites. We computed two different site-to-source distances: the “Joyner andBoore” distances (Rjb in Table 2), and the epicentral distances (Repi in Table 2), obtained byconverting the Rjb into epicentral distances using the formulation of Scherbaum et al. (2004).For all the 4 municipalities, Rjb is less than 7 km, but introducing Repi yielded values rangingbetween 5 and 14 km.
123
216 Bull Earthquake Eng (2011) 9:199–230
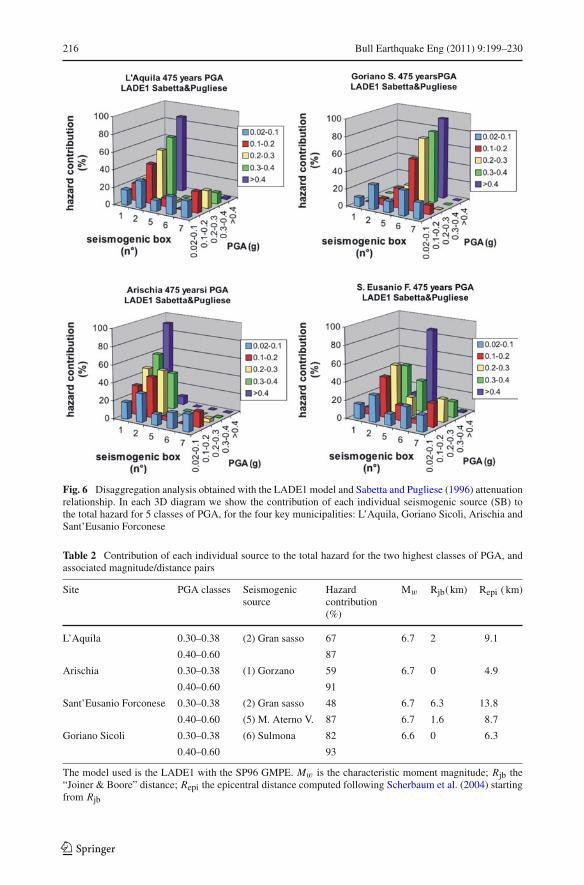
Fig. 6 Disaggregation analysis obtained with the LADE1 model and Sabetta and Pugliese (1996) attenuationrelationship. In each 3D diagram we show the contribution of each individual seismogenic source (SB) tothe total hazard for 5 classes of PGA, for the four key municipalities: L’Aquila, Goriano Sicoli, Arischia andSant’Eusanio Forconese
Table 2 Contribution of each individual source to the total hazard for the two highest classes of PGA, andassociated magnitude/distance pairs
Site PGA classes Seismogenicsource
Hazardcontribution(%)
Mw Rjb( km) Repi ( km)
L’Aquila 0.30–0.38 (2) Gran sasso 67 6.7 2 9.1
0.40–0.60 87
Arischia 0.30–0.38 (1) Gorzano 59 6.7 0 4.9
0.40–0.60 91
Sant’Eusanio Forconese 0.30–0.38 (2) Gran sasso 48 6.7 6.3 13.8
0.40–0.60 (5) M. Aterno V. 87 6.7 1.6 8.7
Goriano Sicoli 0.30–0.38 (6) Sulmona 82 6.6 0 6.3
0.40–0.60 93
The model used is the LADE1 with the SP96 GMPE. Mw is the characteristic moment magnitude; Rjb the“Joiner & Boore” distance; Repi the epicentral distance computed following Scherbaum et al. (2004) startingfrom Rjb
123

Bull Earthquake Eng (2011) 9:199–230 217
4 M–D pairs from probabilistic analysis of site historical intensities
Another analysis was performed on macroseismic data (experienced historical intensities), forselecting different magnitude/distance pairs representative of seismic hazard at the four sitesconsidered. These results are useful for the deterministic approach, but require specific proce-dures to manage the peculiar properties of intensity data (that are ordinal, discrete and definedover a finite non-metric scale) in the frame of a coherent probabilistic approach. A procedureof this kind was first proposed by Magri et al. (1994) and progressively improved (for the mostrecent developments, see Albarello and Mucciarelli 2002; D’Amico and Albarello 2008).andapplied for seismic hazard assessment in Italy can be found in Azzaro et al. (1999, 2008);Mucciarelli et al. (2000, 2008); Albarello et al. (2002); D’Amico and Albarello (2003) andGomez Capera et al. (2010). The bulk of this approach is in the computation of the “expected”number N of earthquakes that in a time window of dimensions equal to the exposure timehave shaken the site under study with intensity larger or equal to an intensity threshold Is .This number is provided by the relationship
ν (Is) =N∑
l=1
Pl(Is) (2)
where the N is the number of earthquakes occurring during the considered time windowand Pl(Is) is the probability that the lth earthquake affected the site with an intensity equalor greater than Is . In fact, a probabilistic evaluation is required to account for uncertaintyrelative to ill-defined intensities (see D’Amico and Albarello 2008 for details). Thus, the roleof a single lth event in the determination of hazard at the intensity threshold Is at the siteunder study, ultimately depends on the value of Pl(Is) that can be considered as a “weight” ofthe single event in the local hazard.In this formalization one can identify those single eventsthat contribute most weight to computed hazard at the intensity threshold Iref . In the presentstudy, Iref values relative to an exposure time of 50 years and an exceedance probability of10%, have been computed for the four sites of Arischia, L’Aquila, S’Eusanio Forconese andGoriano Sicoli. Site seismic histories used for computations have been taken from the histor-ical earthquakes described in Section 1 (see Fig. 1 for epicentral location) by using the Italiandatabase of macroseismic intensities (DBMI04, http://emidius.mi.ingv.it/DBMI04). An Iref
value of IX MCS was obtained for Arischia, L’Aquila and S.Eusanio Forconese, while an Iref
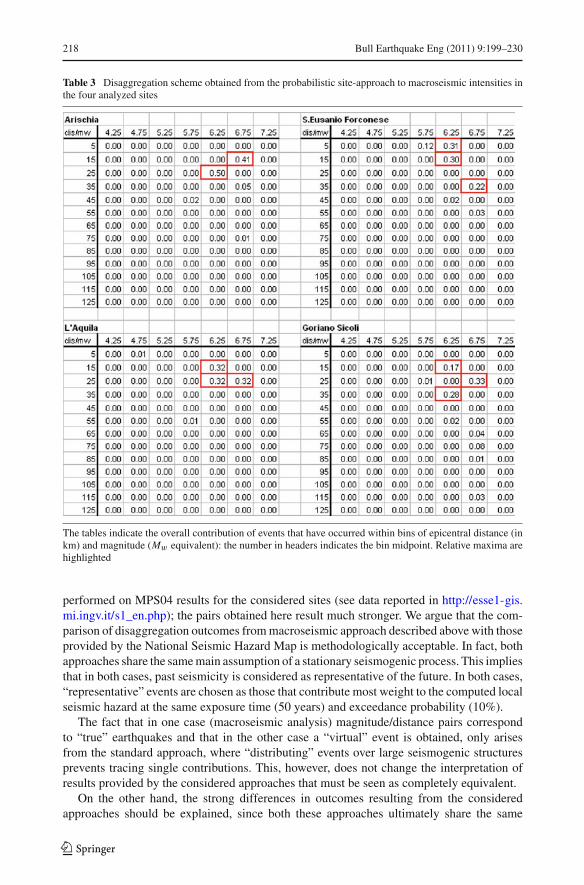
of VIII MCS was obtained for Goriano Sicoli. By taking these values as references, earth-quakes with Pl(Is) values larger than 0 have been selected for each considered site. Relevantepicentral distances and macroseismic magnitudes (Mw compatible) were deduced for eachof these events from the epicentral catalogue CPTI04. Thus, for each site, these values werebinned in classes of epicentral distances (5 km intervals) and magnitude (0.5 units intervals).The weights relative to each earthquake were summed in the relevant distance/magnitude cellto provide a type of “disaggregation scheme” presented in Table 3. Being the representation ofactual earthquakes, the distribution is multimodal, but some clear “polarizations” are shown.On the basis of these data, one representative magnitude/distance pair was selected for eachsite, by considering a “cautious” perspective (i.e, the lower bound of the distance bin and theupper bound of the magnitude bin were selected for the relevant maximum). In this way, thepairs (7 Mw , 10 km), (6.5 Mw, 10 km), (6.5 Mw , 5 km) and (6.5 Mw, 10 km) were selectedfor Arischia, L’Aquila, S.Eusanio Forconese and Goriano Sicoli respectively (see Historicalintensities columns in Table 5). One can note that these results are similar to the ones obtainedby the disaggregation analysis with the non-Poissonian seismotectonic approach (previouschapter), but very different from the values provided by the standard disaggregation scheme
123
218 Bull Earthquake Eng (2011) 9:199–230
Table 3 Disaggregation scheme obtained from the probabilistic site-approach to macroseismic intensities inthe four analyzed sites
The tables indicate the overall contribution of events that have occurred within bins of epicentral distance (inkm) and magnitude (Mw equivalent): the number in headers indicates the bin midpoint. Relative maxima arehighlighted
performed on MPS04 results for the considered sites (see data reported in http://esse1-gis.mi.ingv.it/s1_en.php); the pairs obtained here result much stronger. We argue that the com-parison of disaggregation outcomes from macroseismic approach described above with thoseprovided by the National Seismic Hazard Map is methodologically acceptable. In fact, bothapproaches share the same main assumption of a stationary seismogenic process. This impliesthat in both cases, past seismicity is considered as representative of the future. In both cases,“representative” events are chosen as those that contribute most weight to the computed localseismic hazard at the same exposure time (50 years) and exceedance probability (10%).
The fact that in one case (macroseismic analysis) magnitude/distance pairs correspondto “true” earthquakes and that in the other case a “virtual” event is obtained, only arisesfrom the standard approach, where “distributing” events over large seismogenic structuresprevents tracing single contributions. This, however, does not change the interpretation ofresults provided by the considered approaches that must be seen as completely equivalent.
On the other hand, the strong differences in outcomes resulting from the consideredapproaches should be explained, since both these approaches ultimately share the same
123
Bull Earthquake Eng (2011) 9:199–230 219
seismic databases. A possible interpretation relies on the different use of this information:in one case (the standard approach) seismicity is artificially distributed over large areas(seismogenic regions) while in the other case (macroseismic) locally-felt effects and actualepicenters are considered. This is responsible for a marked difference in the level of “polar-ization” of seismic hazard between the two approaches (see Mucciarelli et al. 2008 for adetailed discussion of this aspect).
If one considers the low level of precision for the epicentral location of historical events,the M–D pairs deduced from the macroseismic approach result in good agreement with thoseprovided by the time-dependent analysis. This agreement is also impressive (and to someextent surprising) because, in the macroseismic approach, no geological information (fun-damental in the time-dependent fault-based model) was considered. One can interpret thisconvergence as an indirect validation of theoretical estimates provided by the LASSCI modelwith historical records.
In conclusion, the disaggregation results obtained in this study suggest M–D pairs tobe considered in the selection of a deterministic design earthquake. By taking into accountrelevant uncertainties in distance metric (location) and magnitude, and the relatively smalldifferences in outcomes obtained by the two approaches for the four towns, one single repre-sentative average M–D pair can be chosen for all sites. This pair has the characteristic Mw 6.7and Repi =10 km.
5 Strong motion recordings of the L’Aquila earthquake and characterizationof a compatible seismic input
L’Aquila seismic sequence provided strong motion recordings of major earthquakes nearbythe causative source, which are not common in waveform databases. The Italian Accelero-metric Archive (http://itaca.mi.ingv.it/ItacaNet/), for example reports only 6 time historiesform M > 6.0 events at Repi < 12 km, and 5 seismograms are those of the April 6, 2009main event. It is therefore mandatory to take into consideration these response spectra in thedefinition of a deterministic seismic input.
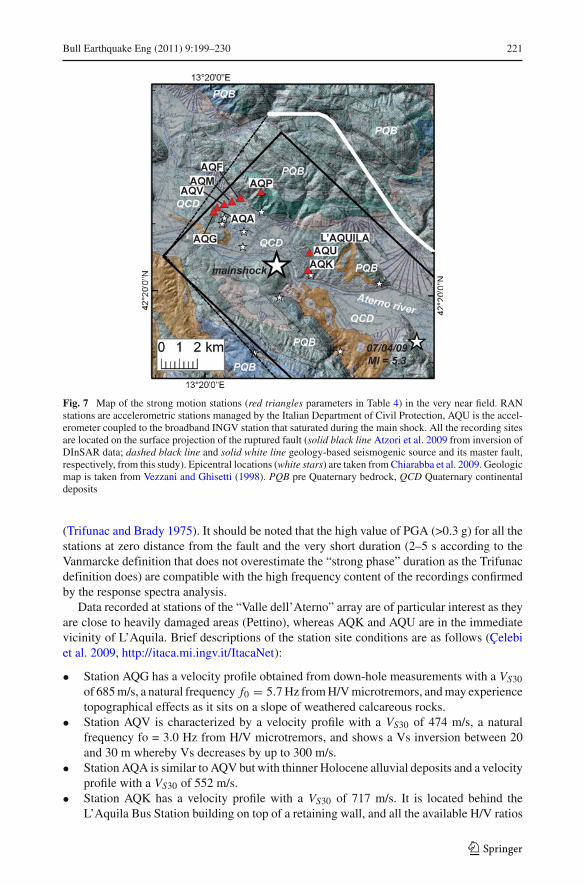
Fifty-eight of the approximately 300 digital strong-motion stations of the Italian StrongMotion Network (RAN, see Gorini et al. 2010 for details on the network) managed by theItalian Department of Civil Protection (DPC) were triggered by the main shock of April 6,2009. In addition, the INGV broadband station AQU, located close to the L’Aquila centre,was also equipped with an accelerometer that recorded the main shock. Figure 7 shows thelocations of the strong motion stations at a distance less than 6 km from the epicentre, togetherwith the surface projection of the ruptured fault. All these stations fall inside the hangingwall of the fault surface projection (Rjb distance equal to zero) and, apart from AQU andAQK, correspond to the “Valle dell’Aterno” array. Only two of the eight stations, AQF andAQP (red triangles in Fig. 7) did not record the main shock due to low power supply of thesolar panels
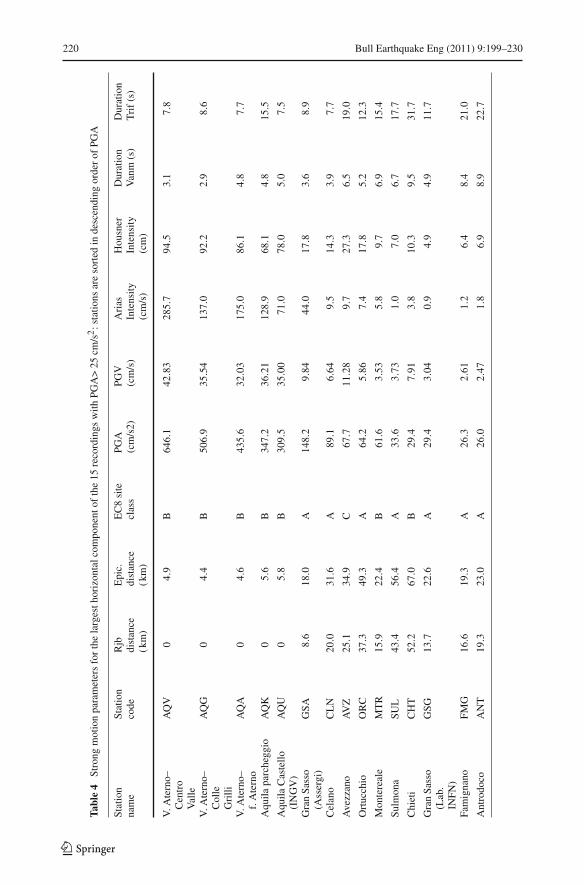
Strong-motion parameters of the main shock for the 15 recordings with PGA > 25 cm/s2
are reported in Table 4 (see Akinci et al. 2009 for details). The first five columns reportthe station name, station code, Joyner-Boore distance (Rjb), epicentral distance (Repi), andstation soil condition described according to the Eurocode EC8 classification, derived fromboreholes Vs measurements collected after the earthquake (http://itaca.mi.ingv.it/ItacaNet).The strong-motion parameters, for the largest value of the horizontal components, are PGA,PGV, Arias Intensity (Arias 1970), Housner Intensity (Housner 1952) and two significantdurations according to the definition of Vanmarcke (Vanmarcke and Lai 1980) and Trifunac
123
220 Bull Earthquake Eng (2011) 9:199–230
Tabl
e4
Stro
ngm
otio
npa
ram
eter
sfo
rth
ela
rges
thor
izon
talc
ompo
nent
ofth
e15
reco
rdin
gsw
ithPG
A>
25cm
/s2:s
tatio
nsar
eso
rted
inde
scen
ding
orde
rof
PGA
Stat
ion
nam
eSt
atio
nco
deR
jbdi
stan
ce(k
m)
Epi
c.di
stan
ce(k
m)
EC
8si
tecl
ass
PGA
(cm
/s2)
PGV
(cm
/s)
Ari
asIn
tens
ity(c
m/s
)
Hou
sner
Inte
nsity
(cm
)
Dur
atio
nV
anm
(s)
Dur
atio
nT
rif
(s)
V.A
tern
o–C
entr
oV
alle
AQ
V0
4.9
B64
6.1
42.8
328
5.7
94.5
3.1
7.8
V.A
tern
o–C
olle
Gri
lli
AQ
G0
4.4
B50
6.9
35.5
413
7.0
92.2
2.9
8.6
V.A
tern
o–f.
Ate
rno
AQ
A0
4.6
B43
5.6
32.0
317
5.0
86.1
4.8
7.7
Aqu
ilapa
rche
ggio
AQ
K0
5.6
B34
7.2
36.2
112
8.9
68.1
4.8
15.5
Aqu
ilaC
aste
llo(I
NG
V)
AQ
U0
5.8
B30
9.5
35.0
071
.078
.05.
07.
5
Gra
nSa
sso
(Ass
ergi
)G
SA8.
618
.0A
148.
29.
8444
.017
.83.
68.
9
Cel
ano
CL
N20
.031
.6A
89.1
6.64
9.5
14.3
3.9
7.7
Ave
zzan
oA
VZ
25.1
34.9
C67
.711
.28
9.7
27.3
6.5
19.0
Ort
ucch
ioO
RC
37.3
49.3
A64
.25.
867.
417
.85.
212
.3
Mon
tere
ale
MT
R15
.922
.4B
61.6
3.53
5.8
9.7
6.9
15.4
Sulm
ona
SUL
43.4
56.4
A33
.63.
731.
07.
06.
717
.7
Chi
eti
CH
T52
.267
.0B
29.4
7.91
3.8
10.3
9.5
31.7
Gra
nSa
sso
(Lab
.IN
FN)
GSG
13.7
22.6
A29
.43.
040.
94.
94.
911
.7
Fam
igna
noFM
G16
.619
.3A
26.3
2.61
1.2
6.4
8.4
21.0
Ant
rodo
coA
NT
19.3
23.0
A26
.02.
471.
86.
98.
922
.7
123
Bull Earthquake Eng (2011) 9:199–230 221
Fig. 7 Map of the strong motion stations (red triangles parameters in Table 4) in the very near field. RANstations are accelerometric stations managed by the Italian Department of Civil Protection, AQU is the accel-erometer coupled to the broadband INGV station that saturated during the main shock. All the recording sitesare located on the surface projection of the ruptured fault (solid black line Atzori et al. 2009 from inversion ofDInSAR data; dashed black line and solid white line geology-based seismogenic source and its master fault,respectively, from this study). Epicentral locations (white stars) are taken from Chiarabba et al. 2009. Geologicmap is taken from Vezzani and Ghisetti (1998). PQB pre Quaternary bedrock, QCD Quaternary continentaldeposits
(Trifunac and Brady 1975). It should be noted that the high value of PGA (>0.3 g) for all thestations at zero distance from the fault and the very short duration (2–5 s according to theVanmarcke definition that does not overestimate the “strong phase” duration as the Trifunacdefinition does) are compatible with the high frequency content of the recordings confirmedby the response spectra analysis.
Data recorded at stations of the “Valle dell’Aterno” array are of particular interest as theyare close to heavily damaged areas (Pettino), whereas AQK and AQU are in the immediatevicinity of L’Aquila. Brief descriptions of the station site conditions are as follows (Çelebiet al. 2009, http://itaca.mi.ingv.it/ItacaNet):
• Station AQG has a velocity profile obtained from down-hole measurements with a VS30
of 685 m/s, a natural frequency f0 = 5.7 Hz from H/V microtremors, and may experiencetopographical effects as it sits on a slope of weathered calcareous rocks.
• Station AQV is characterized by a velocity profile with a VS30 of 474 m/s, a naturalfrequency fo = 3.0 Hz from H/V microtremors, and shows a Vs inversion between 20and 30 m whereby Vs decreases by up to 300 m/s.
• Station AQA is similar to AQV but with thinner Holocene alluvial deposits and a velocityprofile with a VS30 of 552 m/s.
• Station AQK has a velocity profile with a VS30 of 717 m/s. It is located behind theL’Aquila Bus Station building on top of a retaining wall, and all the available H/V ratios
123

222 Bull Earthquake Eng (2011) 9:199–230
Fig. 8 Acceleration response spectra, at 5% damping, of the EW component at station AQV as recorded atthe surface (black line) and deconvoluted at the bedrock (blue line) using SHAKE software
show a remarkable amplification at 0.6 Hz as also demonstrated by De Luca et al. (2005)using weak motion and ambient noise data.
• Station AQU is located in an underground vault beneath the north tower of the L’AquilaCastle at the northeastern corner of the old city of L’Aquila and lies on the same kind ofsoil as that described for AQK.
Using the velocity profile for station AQV, a specific study was implemented for the char-acterization of bedrock ground motion compatible with the main shock recordings. Thedeconvolution analysis from the surface to the bedrock was performed with the SHAKEsoftware package (Schnabel et al. 1972). Results are reported in Fig. 8, and reveal that thealluvial deposits under station AQV amplify the bedrock motion only at periods higher than0.3 s whereas, due to the non-linear response and to the velocity inversion, they dampenmotion at shorter periods. The results of the deconvolution analysis were confirmed by localamplification studies carried out at stations AQK and AQU. Those stations, if subjected tothe above-mentioned bedrock motion, show a significant reduction of the motion at the sur-face due to the filtering effects of the lacustrine sediments, confirming the relatively loweracceleration values recorded at AQK and AQU.
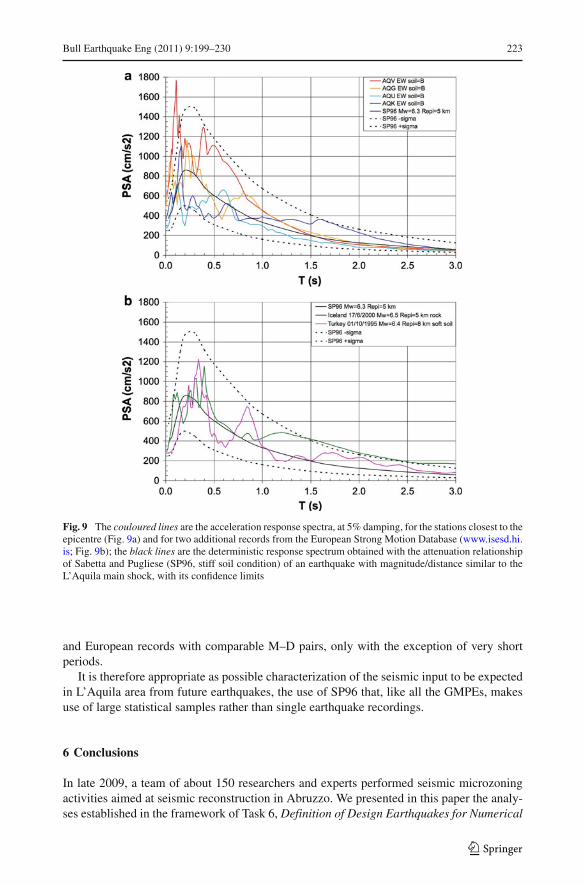
Nonetheless potential source and site effects observed in the L’Aquila area, the choiceof using a deterministic application of GMPE instead of the recorded ground motions dem-onstrated its adequacy. It is illustrated in Fig. 9, which shows the EW component of theacceleration response spectra at 5% damping for the stations AQV, AQG, AQK and AQU(Fig. 9a), and two European earthquakes records (from the European Strong Motion Data-base; www.isesd.hi.is) with comparable M–D pairs (Fig. 9b), together with the responsespectrum derived from the attenuation relationship SP96 (Sabetta and Pugliese 1996) forthe same magnitude and distance from the main shock of L’Aquila sequence. Station AQVyields the highest values at short periods, reaching about 1.8 g at 0.1 seconds, while AQK,with more moderate values at short periods, also exhibits large values at long periods inagreement with the site amplification at 0.6 Hz (1.66 s) revealed by the H/V ratios anddiscussed in the literature (De Luca et al. 2005). The response spectra indicate that theshaking is particularly strong at periods (0.1–0.5 s) that are typical of the 1–5 story build-ings, both in L’Aquila and throughout the region. It is interesting to note that the SP96spectrum, with lower median values than those of the recorded spectra, lies well insidethe ±1 sigma bounds even for the highest spectral values, both for the L’Aquila records
123
Bull Earthquake Eng (2011) 9:199–230 223
Fig. 9 The couloured lines are the acceleration response spectra, at 5% damping, for the stations closest to theepicentre (Fig. 9a) and for two additional records from the European Strong Motion Database (www.isesd.hi.is; Fig. 9b); the black lines are the deterministic response spectrum obtained with the attenuation relationshipof Sabetta and Pugliese (SP96, stiff soil condition) of an earthquake with magnitude/distance similar to theL’Aquila main shock, with its confidence limits
and European records with comparable M–D pairs, only with the exception of very shortperiods.
It is therefore appropriate as possible characterization of the seismic input to be expectedin L’Aquila area from future earthquakes, the use of SP96 that, like all the GMPEs, makesuse of large statistical samples rather than single earthquake recordings.
6 Conclusions
In late 2009, a team of about 150 researchers and experts performed seismic microzoningactivities aimed at seismic reconstruction in Abruzzo. We presented in this paper the analy-ses established in the framework of Task 6, Definition of Design Earthquakes for Numerical
123
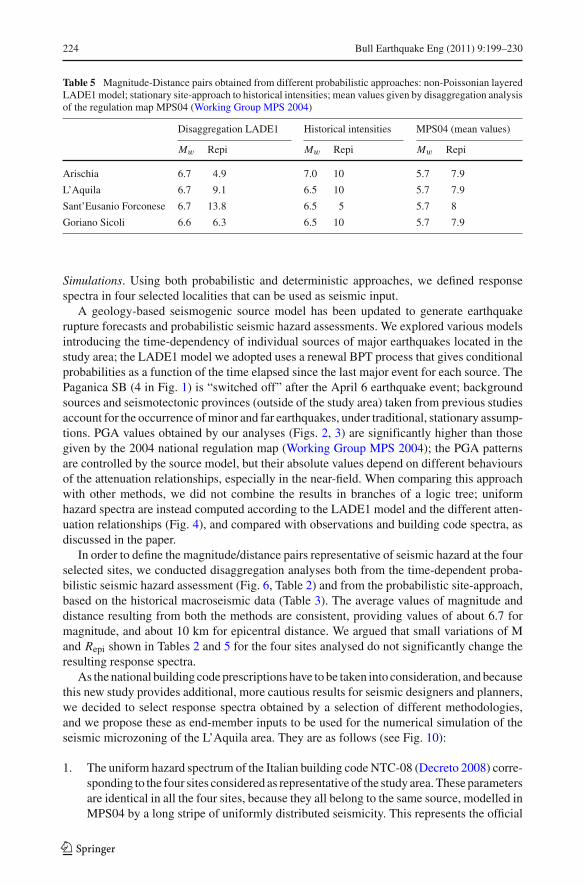
224 Bull Earthquake Eng (2011) 9:199–230
Table 5 Magnitude-Distance pairs obtained from different probabilistic approaches: non-Poissonian layeredLADE1 model; stationary site-approach to historical intensities; mean values given by disaggregation analysisof the regulation map MPS04 (Working Group MPS 2004)
Disaggregation LADE1 Historical intensities MPS04 (mean values)
Mw Repi Mw Repi Mw Repi
Arischia 6.7 4.9 7.0 10 5.7 7.9
L’Aquila 6.7 9.1 6.5 10 5.7 7.9
Sant’Eusanio Forconese 6.7 13.8 6.5 5 5.7 8
Goriano Sicoli 6.6 6.3 6.5 10 5.7 7.9
Simulations. Using both probabilistic and deterministic approaches, we defined responsespectra in four selected localities that can be used as seismic input.
A geology-based seismogenic source model has been updated to generate earthquakerupture forecasts and probabilistic seismic hazard assessments. We explored various modelsintroducing the time-dependency of individual sources of major earthquakes located in thestudy area; the LADE1 model we adopted uses a renewal BPT process that gives conditionalprobabilities as a function of the time elapsed since the last major event for each source. ThePaganica SB (4 in Fig. 1) is “switched off” after the April 6 earthquake event; backgroundsources and seismotectonic provinces (outside of the study area) taken from previous studiesaccount for the occurrence of minor and far earthquakes, under traditional, stationary assump-tions. PGA values obtained by our analyses (Figs. 2, 3) are significantly higher than thosegiven by the 2004 national regulation map (Working Group MPS 2004); the PGA patternsare controlled by the source model, but their absolute values depend on different behavioursof the attenuation relationships, especially in the near-field. When comparing this approachwith other methods, we did not combine the results in branches of a logic tree; uniformhazard spectra are instead computed according to the LADE1 model and the different atten-uation relationships (Fig. 4), and compared with observations and building code spectra, asdiscussed in the paper.
In order to define the magnitude/distance pairs representative of seismic hazard at the fourselected sites, we conducted disaggregation analyses both from the time-dependent proba-bilistic seismic hazard assessment (Fig. 6, Table 2) and from the probabilistic site-approach,based on the historical macroseismic data (Table 3). The average values of magnitude anddistance resulting from both the methods are consistent, providing values of about 6.7 formagnitude, and about 10 km for epicentral distance. We argued that small variations of Mand Repi shown in Tables 2 and 5 for the four sites analysed do not significantly change theresulting response spectra.
As the national building code prescriptions have to be taken into consideration, and becausethis new study provides additional, more cautious results for seismic designers and planners,we decided to select response spectra obtained by a selection of different methodologies,and we propose these as end-member inputs to be used for the numerical simulation of theseismic microzoning of the L’Aquila area. They are as follows (see Fig. 10):
1. The uniform hazard spectrum of the Italian building code NTC-08 (Decreto 2008) corre-sponding to the four sites considered as representative of the study area. These parametersare identical in all the four sites, because they all belong to the same source, modelled inMPS04 by a long stripe of uniformly distributed seismicity. This represents the official
123
Bull Earthquake Eng (2011) 9:199–230 225
Fig. 10 Acceleration response spectra, at 5% damping, for rock sites selected as input for the seismic micro-zoning
prescriptive reference of the Italian regulations for the study area, and provides a lowerbound for the expected seismicity.
2. A probabilistic uniform hazard spectrum obtained by the LADE1 source model, and theSP96 GMPE. As discussed above, even if the spectra are still practically the same atall the reference sites, they pertain to different individual geology-based sources. Thisspectrum gives an upper bound, reaching a maximum spectral value of about 1 g at0.25 s.
3. A deterministic spectrum obtained from the SP96 GMPE for a magnitude-distance pair(Mw 6.7, Repi = 10 km) derived from the two disaggregation analyses described in thepaper. The pairs at each site refer to a different dominant event that should be easilyidentified (in terms of the corresponding fault and historical earthquake) in the disag-gregation analyses. The deterministic spectrum gives intermediate values ranging from0.35 g at 0 s, to 0.8 g at 0.25 s and 0.4 g at 1 s.
In conclusion, we believe that the above-mentioned spectra are the most appropriate to beused as input for the numerical simulation of the seismic microzoning of the L’Aquila area.Time-dependency applied to faults implies the request of higher seismic performances inareas that are considered to be prone to imminent major earthquakes. By introducing time-dependency we are able to tune the Abruzzo seismic hazard estimates to the new resultsreleased by the international scientific community, and adopted by some local authorities(California, Japan) for specific purposes. The agreement in terms of magnitude-distance pairidentification between the non-Poissonian seismotectonic approach and stationary macrose-ismic site-approach is impressive; we interpret this convergence as an indirect validation oftheoretical estimates provided by a layered, geology-based model with historical records.
As scientific knowledge grows faster after a devastating earthquake, and because regularupgrading of seismic provisions is anticipated, we believe our strategy has satisfied the aimsof the project and has provided, for a limited time period, operational guidelines that may beadopted by the relevant authorities for the reconstruction.
Acknowledgments This study was supported by DPC funds in the frame of the Task6, Definition of DesignEarthquakes for Numerical Simulations project. We thank Dario Slejko and an anonymous reviewer for thevery accurate review; their recommendations significantly improved the paper.
123
226 Bull Earthquake Eng (2011) 9:199–230
References
Akinci A, Malagnini L, Sabetta F (2009) Characteristics of the strong ground motions from the 6 April 2009L’Aquila earthquake, Italy. Soil Dyn Earth Eng. doi:10.1016/j.soildyn.2009.12.006
Akkar S, Bommer JJ (2007) Prediction of elastic displacement response spectra in Europe and the MiddleEast. Earthq Eng Struct Dyn 36:1275–1301
Albarello D, Mucciarelli M (2002) Seismic hazard estimates from ill-defined macroseismic data at a site. PureAppl Geophys 159(6):1289–1304
Albarello D, Bramerini F, D’Amico V, Lucantoni A, Naso G (2002) Italian intensity hazard maps: a compar-ison between results from different methodologies. Boll Geofis Teor Appl 43:249–262
Ambraseys NN, Free MW (1997) Surface wave magnitude calibration for European region earthquakes.J Earthq Eng 1:1–22
Ambraseys NN, Simpson KA, Bommer JJ (1996) Prediction of horizontal response spectra in Europr. EarthqEng Struct Dyn 25(4):371–400
Anzidei M, Boschi E, Cannelli V, Devoti R, Esposito A, Galvani A, Melini D, Pietrantonio G, Riguzzi F,Sepe V, Serpelloni E (2009) Coseismic deformation of the destructive April 6, 2009 L’Aquila earthquake(central Italy) from GPS data. Geophys Res Lett 36. doi:10.1029/2009GL039145
APAT (2005) Carta Geologica d’Italia, F.o 359 L’Aquila, scale 1:50,000, APAT (Servizio Geologico d’Italia)and Regione Abruzzo, S.EL.CA, Firenze
Arias A (1970) A measure of earthquake intensity. In: Hansen R (ed) Seismic design for nuclear power plants.MIT Press, Cambridge, pp 438–483
Atzori S, Hunstad I, Chini M, Salvi S, Tolomei C, Bignami C, Stramondo S, Trasatti E, Antonioli A, BoschiE (2009) Finite fault inversion of DInSAR coseismic displacement of the 2009 L’Aquila earthquake(central Italy). Geophys Res Lett 36. doi:10.1029/2009GL039293
Azzaro R, Barbano MS, Moroni A, Mucciarelli M, Stucchi M (1999) The seismic History of Catania. J Seismol3:235–252
Azzaro R, Barbano MS, D’Amico S, Tuvè T, Albarello D, D’Amico V (2008) Preliminary results of proba-bilistic seismic hazard assessment in the volcanic region of Mt. Etna (Southern Italy). Boll Geofis TeorAppl 49(1):77–91
Bazzurro P, Cornell CA (1999) Disaggregation of seismic hazard. Bull Seism Soc Am 89:501–520Bender B, Perkins DM (1987) SEISRISK III; a computer program for seismic hazard estimation. U. S. Geo-
logical Survey, Reston 48Bommer JJ, Douglas J, Strasser F (2003) Style-of-faulting in ground-motion prediction equations. Bull Earthq
Eng 1(2):171–203Boncio P, Lavecchia G, Pace B (2004) Defining a model of 3D seismogenic sources for Seismic Hazard
Assessment applications: the case of central Apennines (Italy). J Seismol 8(3):407–425Boncio P, Lavecchia G, Milana G, Rozzi B (2004) Seismogenesis in Central Apennines, Italy: an integrated
analysis of minor earthquake sequences and structural data in the Amatrice-Campotosto area. Ann Geo-phys 47:1723–1742
Boncio P, Pizzi A, Brozzetti F, Pomposo G, Lavecchia G, Di Naccio D, Ferrarini F (2010) Coseismic grounddeformation of the April 6th 2009 L’Aquila earthquake (central Italy, Mw6.3). Geophys Res Lett. doi:10.1029/2010GL042807
Boncio P, Tinari DP, Lavecchia G, Visini F, Milana G (2009) The instrumental seismicity of the AbruzzoRegion in Central Italy (1981–2003): seismotectonic implications. Ital J Geosci (Boll Soc Geol It)128(2):367–380
Bosi C, Galadini F, Giaccio B, Messina P, Sposato A (2003) Plio-quaternary continental deposits in theLatium-Abruzzi Apennines: the correlation of geological events across different intermontane basins.Il Quaternario 16(1Bis):55–76
Bosi C (1975) Osservazioni preliminari su faglie probabilmente attive nell’Appennino centrale. Boll Soc GeolIt 94:827–859
Buccio di Ranallo (14th cent) Cronaca aquilana (1253c.-1362). In V. De Bartholomeis (ed.) Cronaca aquilanarimata di Buccio di Ranallo di Popplito di Aquila. Fonti per la storia d’Italia, Istituto Storico Italiano,Scrittori, sec. XIV, Rome, 1907, pp LXXI + 346
Castelli V, Galadini F, Galli P, Molin D, Stucchi M (2002) Caratteristiche sismogenetiche della sorgente dellaLaga e relazione con il terremoto del 1639.21 Convegno Nazionale GNTS Roma 19–21 novembre2002, Roma, pp 13–16
Çelebi M, Bazzurro P, Chiaraluce L, Clemente P, Decanini L, De Sortis A, Ellsworth W, Gorini A, KalkanE, Marcucci S, Milana G, Mollaioli F, Oliveri M, Rinaldis D, Rovelli A, Sabetta F, Stephens C (2009)Recorded motions of Mw 6.3 April 6, 2009 L’aquila Earthquake and Implications for Building StructuralDamage. Earthquake Spectra (in press)
123
Bull Earthquake Eng (2011) 9:199–230 227
Chiarabba C, Amato A, Anselmi M, Baccheschi P, Bianchi I, Cattaneo M, Cecere G, Chiaraluce L,Ciaccio MG, De Gori P, De Luca G, Di Bona M, Di Stefano R, Faenza L, Govoni A, Improta L, LucenteFP, Marchetti A, Margheriti L, Mele F, Michelini A, Monachesi G, Moretti M, Pastori M, Piana Agosti-netti N, Piccinini D, Roselli P, Seccia D, Valoroso L (2009) The 2009 L’Aquila (central Italy) MW6.3earthquake: Main shock and aftershocks. Geophys Res Lett 36 L18308, doi:10.1029/2009GL039627
Cirella A, Piatanesi A, Cocco M, Tinti E, Scognamiglio L, Michelini A, Lomax A, Boschi E (2009) Rupturehistory of the 2009 L’Aquila (Italy) earthquake from non-linear joint inversion of strong motion and GPSdata. Geophys Res Lett 36:L19304. doi:10.1029/2009GL039795
D’Agostino N, Avallone A, Cheloni D, D’Anastasio E, Mantenuto S, Selvaggi G (2008) Active tectonics ofthe Adriatic region from GPS and earthquake slip vectors. J Geophys Res 113:B12413. doi:10.1029/2008JB005860
D’Amico V, Albarello D (2003) Seismic hazard assessment from local macroseismic observation: comparisonwith a “standard” approach. Nat Haz 29:77–95
D’Amico V, Albarello D (2008) SASHA: a computer program to assess seismic hazard from intensity data.Seism Res Lett 79(5):663–671
D’Angeluccio F (15th cent) Cronaca delle cose dell’Aquila (1436–1485). In: Muratori LA (ed) AntiquitatesItalicae Medaevi, 6, Milan, vol 174, pp 884–900
Decanini L, Gavarini C, Mollatoli F (1995) Proposta di definizione delle relazioni tra intensita‘ macrosismicae parametri del moto del suolo. Siena: L’ingegneria Sismica in Italia, pp 63–72
De Luca G, Marcucci S, Milana G, Sano’ T (2005) Evidence of low-frequency amplification in the city ofL’aquila, Central Italy, through a multidisciplinary approach including strong- and weak-motion data,ambient noise, and numerical modeling. Bull Seism Soc Am 95:1469–1481
De Tummolillis A (15th cent) Notabilia temporum. In: Corsivieri C (ed) Fonti per la storia d’Italia, Ist. StoricoIt, Scrittori, sec. XV, Rome, 1890, p. 96
Decreto (2008) Approvazione delle norme tecniche per le costruzioni. Gazzetta Ufficiale, n. 29 del 4.2.2008Earthquake Research Committee (2005) Comprehensive study of probabilisitic seismic hazard map for Japan.
Headquarters for Earthquake Research Promotion, Tokyo, Japan, p. 125EMERGEO Working Group (2009) Evidence for surface rupture associated with the Mw 6.3 L’Aquila earth-
quake sequence of April 2009 (central Italy). Terra Nova. doi:10.1111/j.1365-3121.2009.00915.xFalcucci E, Gori S, Peronace E, Fubelli G, Moro M, Saroli M, Giaccio B, Messina P, Naso G, Scardia G,
Sposato A, Voltaggio M, Galli P. e Galadini F (2009a) The Paganica fault and surface coseismic rupturesdue to the April 6, 2009 earthquake (L’Aquila, Central Italy). Seism Res Lett 80. doi:10.1785/gssrl.80.6.940
Falcucci E, Gori S, Moro M, Galadini F, Marzorati S, Ladina C, Piccarreda D, Fredi P (2009b) Evidenzedi fagliazione normale tardo-olocenica nel settore compreso fra la Conca Subequana e la Media Valledell’Aterno, a sud dell’area epicentrale del terremoto di L’Aquila del 6 Aprile 2009: implicazioni sismo-tettoniche. 28 convegno nazionale GNGTS, Trieste, 16–19 November 2009, pp 161–163
Field EH, Dawson TE, Felzer KR, Frankel AD, Gupta V, Jordan TH, Parsone T, Petersen MD, Stein RS,Weldon RJ, Wills CJ (2009) Uniform California earthquake rupture forecast, version 2 (UCERF 2). BullSeismol Soc Am 99(4):2053–2107
Galadini F, Galli P (1999) The Holocene paleoearthquakes on the 1915 Avezzano earthquake faults (centralItaly); implications for active tectonics in the central Apennines. Tectonophysics 308:143–170
Galadini F, Galli P (2000) Active tectonics in the Central Apennines (Italy)—input data for Seismic HazardAssessment. Nat Haz 22:225–270
Galadini F, Galli P (2003) Paleoseismology of silent faults in the Central Apennines (Italy): the Mt. Vettoreand Laga Mts. faults. Ann Geophys 5:815–836
Galadini F, Galli P, Moro M (2003) Paleoseismology of silent faults in the central Apennines (Italy): theCampo Imperatore fault (Gran Sasso Range fault system). Ann Geophys 46:793–813
Galli P, Galadini F, Moro M, Giraudi C (2002) New paleoseismological data from the Gran Sasso d’Italia area(central Apennines) Geoph Res Lett 29 (7). doi:10.1029/2001GL013292
Galli P, Naso G (2009) Unmasking the 1349 earthquake source (southern Italy). Paleoseismological andarchaeoseismological indications from the Aquae Iuliae fault. J Struct Geol 31:128–149
Galli P, Camassi R, Azzaro R, Bernardini F, Castenetto S, Molin D, Peronace E, Rossi A, Vecchi M,Tertulliani A (2009) Il terremoto aquilano del 6 aprile 2009: rilievo macrosismico, effetti di superfi-cie ed implicazioni sismotettoniche. Il Quaternario 22(2):235–246
Galli P, Galadini F, Pantosti D (2008) Twenty years of paleoseismology in Italy. Eart Sci Rev. doi:10.1016/j.earseirev.2008.01.001
Galli P, Giaccio B, Messina P (2010) The 2009 central Italy earthquake seen through 0.5 myr-long tectonichistory of the L’aquila faults system. J Quaternary Sci Rev. doi:10.1016/j.quascirev.2010.08.018
123
228 Bull Earthquake Eng (2011) 9:199–230
Giraudi C, Frezzotti M (1995) Palaeoseismicity in the Gran Sasso Massif (Abruzzo, central Italy). QuaternInt 25:81–93
Gomez Capera AA, D’Amico V, Meletti C, Rovida A, Albarello D (2010) Seismic hazard assessment in termsof macroseismic intensity in Italy: a critical analysis from the comparison of different computationalprocedures. Bull Seism Soc Am (in press)
Gori S, Giaccio, Galadini F, Falcucci E, Messina P, Sposato A, Dramis F (2009) Active normal faulting alongthe Mt. Morrone south-western slopes (central Apennines, Italy). Int J Earth Sci (Geol Rundsch). doi:10.1007/s00531-009-0505-6
Gori S, Galadini F, Galli P, Giaccio B, Messina P, Sposato A, Falcucci E, Dramis F (2010) Active normal fault-ing and large scale gravitational deformation: the case of the Mt. Morrone SW slopes (central Apennines,Italy). Rend Online Soc Geol It 11:23
Gorini A, Nicoletti M, Marsan P, Bianconi R, De Nardis R, Filippi L, Marcucci S, Palma F, Zambonelli E(2010) The Italian strong motion network. Bull Earthq Eng. doi:10.1007/s10518-009-9141-6
Grant DN, Bommer JJ, Pinho R, Calvi GM, Goretti A, Meroni F (2007) A Prioritization Scheme for SeismicIntervention in School Buildings in Italy. Earthquake Spectra 23. doi:10.1193/1.2722784
Gruppo di lavoro MS (2008) Indirizzi e criteri per la microzonazione sismica. Conferenza delle Regioni edelle Province autonome—Dipartimento della protezione civile, Roma, 3 vol. e Dvd
Harmsen S, Frankel A (2001) Geographic deaggregation of seismic hazard in the United States. Bull SeismSoc Am 91:13–26
Housner GW (1952) Spectrum intensities of strong motion earthquakes. Proceedings of Symposium on Earth-quake and Blast Effects on Structures. Earthquake Engineering Research Institute
LaForge R (1996) Implementation of SEISRISK III, USGS, Colorado, Boulder, Open FileLavecchia G, Brozzetti F, Barchi M, Keller J, Menichetti M (1994) Seismotectonic zoning in East-Central
Italy deduced from the analysis of the Neogene to present deformations and related stress fields. SocGeol Am Bull 106:1107–1120
Magri L, Mucciarelli M, Albarello D (1994) Estimates of site seismicity rates using ill-defined macroseismicdata. PAGEOPH 143:618–632
Margottini C, Molin D, Serva L (1992) Intensity versus ground motion: a new approach using Italian data.Eng Geol 33:45–58
Matthews MV, Ellsworth WL, Reasenberg PA (2002) A Brownian model for recurrent earthquakes. BullSeism Soc Am 92:2233–2250
McGuire RK (1995) Probabilistic seismic hazard analysis and design earthquakes: closing the loop. Bull SeismSoc Am 85:1275–1284
Messina P, Galli P, Falcucci E, Galadini F, Giaccio B, Gori S, Peronace E, Sposato A (2009) Evoluzione geo-logica e tettonica quaternaria dell’area interessata dal terremoto aquilano del 2009. Geoitalia 28:24–29
Messina P, Galli P, Giaccio B, Peronace E (2009b) Quaternary tectonic evolution of the area affected by thePaganica fault (2009 L’Aquila earthquake). 28 convegno nazionale GNGTS, Trieste, 16–19 November2009, pp 47–50
Michetti AM, Brunamonte F, Serva L, Vittori E (1996) Trench investigations of the 1915 Fucino earthquakefault scarps (Abruzzo, central Italy): geological evidence of large historical events. J Geophys Res101:5921–5936
Moro M, Bosi V, Galadini F, Galli P, Giaccio B, Messina P, Sposato A (2002) Analisi paleosismologichelungo la faglia del M. Marine (alta valle dell’Aterno): risultati preliminari. Il Quaternario 15:267–278
Mucciarelli M, Albarello D, D’Amico V (2008) Comparison of Probabilistic Seismic Hazard estimates inItaly. Bull Seism Soc Am 98(6): 2652–2664. doi:10.1785/0120080077
Mucciarelli M, Peruzza L, Caroli P (2000) Tuning of seismic hazard estimates by means of observed siteintensities. J Earth Eng 4:141–159
Musson RMW (2009) Ground motion and probabilistic hazard. Bull Earthq Eng 7:575–589Pace B, Boncio P, Brozzetti F, Lavecchia G, Visini F (2008) From regional seismic hazard to scenario earth-
quake for seismic microzoning. A new methodological approach for the Celano project. Soil Dyn EarthqEng 28:866–874
Pace B, Boncio P, Lavecchia G (2002) The 1984 Abruzzo earthquake (Italy): an example of seismogen-ic process controlled by interaction between differently-oriented sinkinematic faults. Tectonophysics350:237–254
Pace B, Peruzza L, Lavecchia G, Boncio P (2006) Layered Seismogenic Source Model and ProbabilisticSeismic-Hazard Analyses in Central Italy. Bull Seism Soc Am 96(1):107–132
Pace B, Peruzza L, Visini F (2010) LASSCI2009.2: Layered Earthquake Rupture Forecast model for centralItaly submitted to CSEP project Annals of Geophysics 53(3):85–97
123
Bull Earthquake Eng (2011) 9:199–230 229
Pantosti D, D’Addezio G, Cinti FR (1996) Paleoseismicity of the Ovindoli-Pezza fault, central Apennines,Italy: A history including a large, previously unrecorded earthquake in the Middle ages (860-1300 A.D.).J Geophys Res 101:5937–5959
Pasquale V, Verdoya M, Chiozzi P, Ranalli G (1997) Rheology and seismotectonic regime in the northerncentral Mediterranean. Tectonophysics 270:239–257
Petersen MD, Frankel AD, Harmsen SC, Mueller CS, Haller KM, Wheeler RL, Wesson RL, Zeng Y, Boyd OS,Perkins DM, Luco N, Field EH, Wills CJ, Rukstales KS (2008) Documentation for the 2008 Update ofthe United States National Seismic Hazard Maps. U.S. Geological Survey, Open-File Report 2008–1128,61 p
Peruzza L, Pace B, Cavallini F (2010) Error propagation in time-dependent probability of occurrence forcharacteristic earthquakes in Italy. J Seismol. doi:10.1007/s10950-008-9131-1
Peruzza L, Pace B (2002) Sensitivity analysis for seismic source characteristics to probabilistic seismic hazardassessment in central Apennines (Abruzzo area). Boll Geofis Teor Appl 43:79–100
Peruzza L, Pace B, Lavecchia G, Boncio P (2007) Reply to “Comment on ‘Layered Seismogenic SourceModel and Probabilistic Seismic-Hazard Analyses in Central Italy’ by Pace B, Peruzza L, Lavecchia G,Boncio P “ by Marzocchi, W. Bull Seism Soc Am 97(5):1766–1768
Peruzza L, Pace B, Visini F (2011) Fault-based earthquake rupture forecast in Central Italy: remarks after theL’Aquila Mw 6.3 event. Bull Seism Soc Am 101(1) (in press)
Piccardi L, Gaudemer Y, Tapponier P, Boccaletti M (1999) Active oblique extension in the central Apennines(Italy); evidence from the Fucino region. Geophys J Int 139(2):499–530
Pondrelli S, Salimbeni S, Morelli A, Ekstrom G, Olivieri M, Boschi E (2009) Seismic moment tensors ofthe April 2009, L’Aquila (Central Italy), earthquake sequence. Geophys J Int. doi:10.1111/j.1365-246X.2009.04418.x
Pondrelli S, Salinbeni S, Ekström G, Morelli A, Gasperini P, Vannucci G (2006) The Italian CMT datasetfrom 1977 to present. Phys Earth Planet Inter 159:286–303
Rossi A, Tertulliani A, Vecchi M (2005) Studio macrosismico del terremoto aquilano del 24 giugno 1958. IlQuaternario 18(2):101–112
Sabetta F, Lucantoni A, Bommer J, Bungum H (2005) Sensitivity of PSHA results to ground motion predictionrelations and logic-tree weights. Soil Dyn Earthq Eng 25(4):317–329
Sabetta F, Pugliese A (1996) Estimation of response spectra and simulation of non-stationary earthquakeground motions. Bull Seism Soc Am 86(2):337–352
Salvi S, Cinti FR, Colini L, D’Addezio G, Doumaz F, Pettinelli E (2003) Investigation of the active Celano-L’Aquila fault system, Abruzzi (central Apennines, Italy) with combined ground-penetrating radar andpaleoseismic trenching. Geophys J Int 155:805–818
Scherbaum F, Schmedes J, Cotton F (2004) On the conversion of source-to-site distance measures for extendedearthquake source models. Bull Seism Soc Am 94(3):1053–1069
Schnabel B, Lysmer J, Seed HB (1972) SHAKE—A computer program for earthquake response analysis ofhorizontally layered sites. EERC Report No 72-12
Schorlemmer D, Jordan TH, Zechar JD, Maechling PJ, Gerstenberger M, Wiemer S (2006) Collaboratoryfor the Study of Earthquake Predictability (CSEP). American Geophysical Union, Fall Meeting 2006,abstract #S12A-01, http://www.cseptesting.org/documents/talks
Schorlemmer D, Jackson DD, Zechar JD, Jordan TH (2009) Collaboratory for the Study of Earthquake Pre-dictability: Design of Prediction Experiments. American Geophysical Union, Fall Meeting 2009, abstract#NH13A-1133
Selvaggi G (1998) Spatial distribution of horizontal seismic strain in the Apennines from historical earth-quakes. Ann Geofisis 41:241–251
Stucchi M, Camassi R, Rovida A, Locati M, Ercolani E, Meletti C, Migliavacca P, Bernardini F, AzzaroR (2007) DBMI04, il database delle osservazioni macrosismiche dei terremoti italiani utilizzate per lacompilazione del catalogo parametrico CPTI04. http://emidius.mi.ingv.it/DBMI04/
Tertulliani A, Rossi A, Cucci L, Vecchi M (2009) L’Aquila (Central Italy) Earthquake: the Predecessors ofthe April 6, 2009 Event. Historical Seismologist. doi:10.1785/gssrl.80.6.1008
Trifunac MD, Brady AG (1975) A study of the duration of strong earthquake ground motion. Bull Seism SocAm 65:581–626
Vanmarcke EH, Lai SP (1980) Strong-motion duration and RMS amplitude of earthquake records. Bull SeismSoc Am 70(4):1293–1307
Vezzani L, Ghisetti F (1998) Carta Geologica dell’Abruzzo, 1:100,000 scale. S.EL.CA, FirenzeWalters RJ, Elliott JR, D’Agostino N, England PC, Hunstad I, Jackson JA, Parsons B, Phillips RJ, Roberts
G (2009) The 2009 L’Aquila earthquake (central Italy): a source mechanism and implications for seismichazard. Geophys Res Lett 36:L17312. doi:10.1029/2009GL039337
123

230 Bull Earthquake Eng (2011) 9:199–230
Wells DL, Coppersmith KJ (1994) New empirical relationships among magnitude, rupture length, rupturewidth, rupture area, and surface displacement. Bull Seism Soc Am 84:974–1002
Working Group CPTI (2004) Catalogo Parametrico dei Terremoti Italiani, versione 2004 (CPTI04), INGV-Bologna, available on-line at: http://emidius.mi.ingv.it/CPTI
Working Group MPS (2004) Redazione della mappa di pericolosità sismica prevista dall’Ordinanza PCM3274 del 30 marzo 2003, Rapporto conclusivo per il Dipartimento di Protezione Civile, INGV, Editor,Milano-Roma
123