Multiple Control of Unidirectional Ac-Dc Step-Up Converters ...
Simulated Study on Nonisolated DC-DC Converters forMPP Tracking for Photovoltaic Power Systems
Barnam Jyoti Saharia, M.ASCE1; and Kamala Kanta Saharia2
Abstract: This paper discusses a comparative investigation of the three basic nonisolated DC-DC converters used as interfaces for maximumpower point tracking (MPPT) in photovoltaic (PV) generators using the direct duty ratio control tracking algorithm. Analysis of buck, boost,and buck-boost converters is undertaken to study the behavior of converter performance with respect to changing atmospheric conditions,in-turn duty ratio variation (as a result of MPPT), and tracking efficiency. As atmospheric conditions change, the operating value of resistanceat the maximum power point (Rmpp) changes. To effectively drive the system at the maximum power yield point, the MPPT algorithm hasto drive the system operation point close to the value of Rmpp for the varying atmospheric profile of change in insolation and temperature.The efficiency of the MPPT algorithm lies in meeting this very requirement. The simulation study shows that, although buck, boost, andbuck-boost converters are used as power converters in MPPT applications, not all converters perform with high efficiency. The effect ofdifferent resistive loads that have values other than Rmpp on converter-side output is considered for the three topologies, and it is observed thatthe buck-boost converter is the only one that is able to track the maximum power point (MPP) under variations in insolation, temperature,and loading effect with the highest tracking efficiency. DOI: 10.1061/(ASCE)EY.1943-7897.0000261. © 2015 American Society of CivilEngineers.
Author keywords: Photovoltaic (PV); DC-DC converters; Maximum power point tracking (MPPT); Tracking efficiency; Hill climb algorithm.
Introduction
The photovoltaic (PV) generation system as a renewable energysource has attracted the attention of researchers in recent decadesbecause it is nonpolluting, renewable, and inexhaustible. Thereis an immense demand for feasible and environmentally friendlyrenewable energy sources to meet future energy requirements asfossil fuel reserves deplete. Solar energy is a viable substitute forfossil fuels among other available renewable energy sources suchas wind, hydroelectric, and geothermal power (Freris and Infield2008). Solar PV generators have been used in small-scale, stand-alone systems at low voltage levels as well as in high-power instal-lations connected in grid mode and operating at medium- orhigh-voltage levels.
The drawback of PV generators is their low conversion effi-ciency. Efficiencies of typical crystalline PV cells are 12–18%,although experimental cells have been constructed that are capableof efficiencies over 30% (Freris and Infield 2008). PV generatorsexhibit nonlinear current voltage (I–V) and power voltage (P–V)characteristics (Liu et al. 2013), a phenomenon that is more seriousin partially shaded conditions because of more than one maximumpower point (MPP). For optimum use, it is important to operate PVgeneration systems in the maximum available power productionstate for an available solar irradiation, temperature, and load. Thus,implementation of maximum power point tracking (MPPT) control
techniques to maximize the available output from a PV generator isan essential constituent of any PV system.
The MPPT control algorithm adjusts the power interface(DC-DC converters) associated with the PV system such thatthe greatest possible power yield is achieved during moment-to-moment variations in insolation level, temperature, and load con-nected to the system. Most investigations have focused on thedevelopment, improvement, and implementation of tracking algo-rithms to achieve MPP operation. Under the changing conditions ofirradiance and temperature, the operating power point of the PVpanel changes, leading the MPPT to change the duty ratio of theDC-DC converter interface such that it matches the operating pointof the converter with the MPP of the PV panel.
However, the behavior of individual interfacing converters withrespect to duty ratio variation in MPPT applications has not re-ceived the required attention. The change in duty ratio has a cor-responding changing effect on converter performance parameters,which may be in violation of the design constraints of the convertertopology such as ripple in inductor current and in output voltage.To develop a PV power generation system with a suitable convertertopology that can track MPP operation, it is imperative to analyzeDC-DC converters used for this purpose and their performancewith respect to tracking ability and behavior with different loadingdemands.
Many researchers are associated with the development and de-sign of a number of MPPT algorithms using different techniques.Takashima et al. (2000) use a curve-fitting technique to calculatethe operating point of the PV panel for a given value of insolationand temperature. Ibrahim et al. (1999) discuss fuzzy logic and look-up tables to identify the PV panel’s MPP locus. Masoum et al.(1998) present computational methods to model I-V characteristicsof solar panels using mathematical equations or numerical approx-imations between solar cell open-circuit voltage and solar cellshort-circuit current to calculate the MPP for different load condi-tions. Noguchi et al. (2002) discuss short current pulse–basedadaptive MPPT for PV systems, observing that a proportional
1Faculty of Engineering, Dept. of Electrical and Instrumentation Engi-neering, Assam Engineering College, Jalukbari, Guwahati, Assam 781013,India (corresponding author). E-mail: [email protected]
2Professor, Dept. of Extension Education, College of VeterinaryScience, Assam Agricultural Univ., Khanapara, Guwahati, Assam781022, India. E-mail: [email protected]
Note. This manuscript was submitted on April 4, 2014; approved onNovember 26, 2014; published online on January 8, 2015. Discussion per-iod open until June 8, 2015; separate discussions must be submitted forindividual papers. This paper is part of the Journal of Energy Engineering,© ASCE, ISSN 0733-9402/04015001(10)/$25.00.
© ASCE 04015001-1 J. Energy Eng.
J. Energy Eng.
Dow
nloa
ded
from
asc
elib
rary
.org
by
HU
NT
LIB
RA
RY
AC
Q D
EPT
on
01/2
7/15
. Cop
yrig
ht A
SCE
. For
per
sona
l use
onl
y; a
ll ri
ghts
res
erve
d.
relationship between the PV panel’s short current and its optimumoperating current can be used to determine the operating point formaximum power output. Al-Atrash et al. (2005) discuss statisticalmodeling of a DSP-based hill-climbing (HC) MPPT algorithm in anoisy environment.
Liu and Lopes (2004) present a new implementation of aperturb-and-observe (P&O) MPPT algorithm that can mitigatethe major drawbacks of perturbation and observation algorithms.Although very popular because of its simplicity and ease of imple-mentation, the P&O technique suffers from slow response speed,oscillations around the MPP in steady state, and even at timestracking the wrong way under rapidly changing atmospheric con-ditions. Incremental conductance (IC) can overcome the problemsassociated with the P&O technique provided the computations arecarried out at fast rates.
Miyatake et al. (2004) use a search algorithm with a Fibonaccisequence for MPPT control. The algorithm shows good trackingperformance even under partial shading. Artificial intelligence–based algorithms using fuzzy logic controllers (Kottas et al.2006), neural networks (de Medeiros Torres et al. 1998;Premrudeepreechacham et al. 2003), and adaptive neuro-fuzzyinference systems (ANFISs) (Abu-Rub et al. 2012; AI-Amoudiand Zhang 2000; Iqbal et al. 2010; Mellit et al. 2008; Albhodhaniand John 2008) are also put into practice for tracking the maximumoperating power point of PV panels. Hohm and Ropp (2003) com-pare four low-cost MPP tracking algorithms and report that theP&O method, if properly optimized, reaches efficiencies in excessof 97%. Esram and Chapman (2007) also compare various trackingalgorithms and focus on the main differences between methodswith respect to PVarray dependency, periodic tuning requirements,implementation complexity, and the like. A comparative study byFaranda and Leva (2008) of 10 widely used MPPT algorithmsshows that the P&O and IC methods perform better than all otheralgorithms. Eltawil and Zhao (2013) present issues encountered inPV systems on the grid side, demand side, and PV side due toMPPTapplications, and discuss possible countermeasures. Enriqueet al. (2005) discuss the application of DC-DC converters as resis-tive emulators for tracking I-V and P-V characteristics.
The use of converters as MPPT interfaces differs widely. In agood number of cases, a different converter topology in combina-tion with a different tracking algorithm is used to track the MPP of aPV panel. The atmospheric conditions to which the PV system issubjected to track the effectiveness of the MPPT algorithm can alsovary. Moreover, the PV panel used and the loads connected at theoutput side of the converter are found to be diverse in many studies.In the absence of a uniform tracking algorithm, PV module, andloads, it becomes difficult to predict with certainty the impact ofthe converter interface on MPPT behavior and system performance.
This paper takes into account the behavior of the PV systemdeploying a MPPT algorithm subjected to varying insolation andtemperature profiles, using three basic nonisolated DC-DCconverters. The tracking efficiency of each converter for a certainset of resistive loads is also studied, and a comparative assessmentof the performance of each is given. Liu et al. (2008a, b) and Seraet al. (2006) observe that HC and P&O techniques are widelyused with commercial systems because of their simple structureand the few measured parameters required in the trackingalgorithm. For its simplicity and ease of implementation, theHC direct duty ratio control algorithm has been selected as thetracking algorithm in this paper.
The rest of the paper is organized in the following manner. InPV Module Modeling, the modeling of a PV generator is under-taken in MATLAB/SIMULINK. Next, DC-DC Converters discussesthe basic operation of nonisolated DC-DC converters. In MPPT
Algorithm Implementation, the MPPT algorithm and its implemen-tation are discussed. To observe the effect of changes in environ-mental and the loading conditions on different converter topologies,a simulated profile of solar insolation and temperature is used as areference inMATLAB/SIMULINK and the analysis is carried out forindividual converters, which are modeled on the same simulationplatform. The effectiveness of the tracker for each converter underchanging conditions of insolation, temperature, and loading isnoted and reported in “Results and Discussion.” The final sectiondraws conclusions from this work.
PV Module Modeling
A solar cell is basically a p-n junction fabricated in a thin wafer ofsemiconductor. The electromagnetic radiation of solar energy canbe directly converted into electricity through the PV effect. Whenexposed to sunlight, photons with energy greater than the band-gapof the semiconductor create electron-hole pairs proportional to theincident radiation, which is responsible for the generation of thephotocurrent.
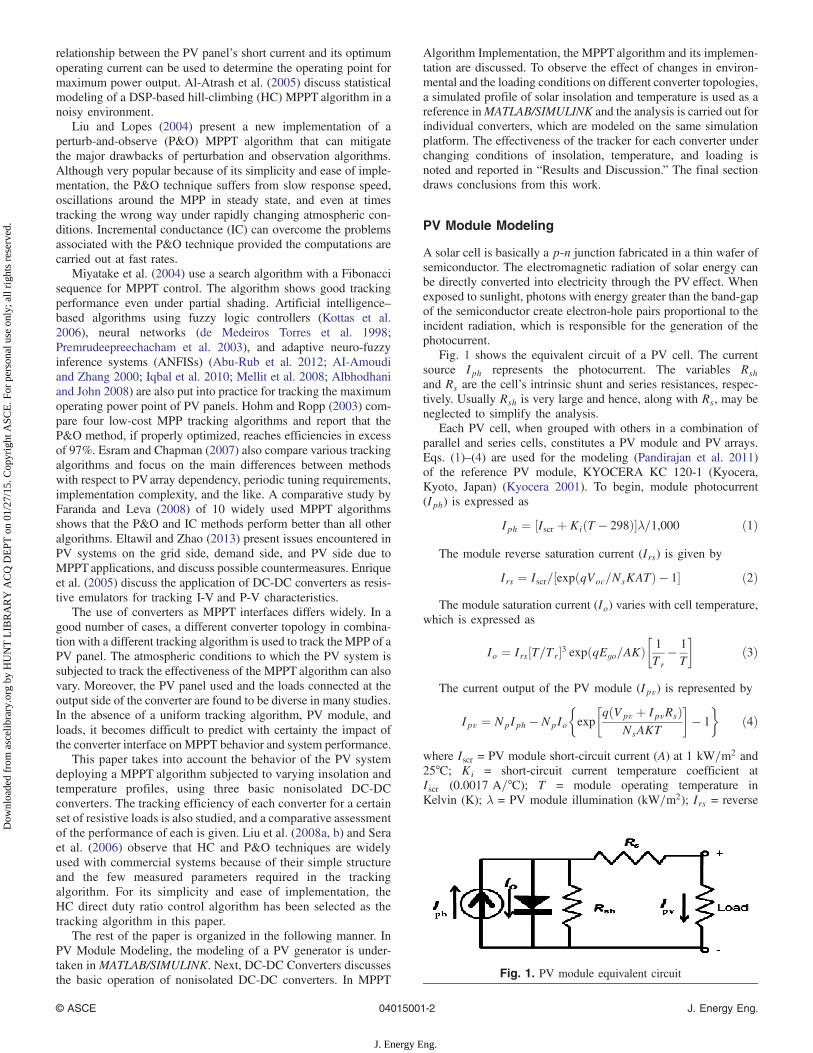
Fig. 1 shows the equivalent circuit of a PV cell. The currentsource Iph represents the photocurrent. The variables Rshand Rs are the cell’s intrinsic shunt and series resistances, respec-tively. Usually Rsh is very large and hence, along with Rs, may beneglected to simplify the analysis.
Each PV cell, when grouped with others in a combination ofparallel and series cells, constitutes a PV module and PV arrays.Eqs. (1)–(4) are used for the modeling (Pandirajan et al. 2011)of the reference PV module, KYOCERA KC 120-1 (Kyocera,Kyoto, Japan) (Kyocera 2001). To begin, module photocurrent(Iph) is expressed as
Iph ¼ ½Iscr þ KiðT − 298Þ�λ=1,000 ð1Þ
The module reverse saturation current (Irs) is given by
Irs ¼ Iscr=½expðqVoc=NsKATÞ − 1� ð2ÞThe module saturation current (Io) varies with cell temperature,
which is expressed as
Io ¼ Irs½T=Tr�3 expðqEgo=AKÞ�1
Tr− 1
T
�ð3Þ
The current output of the PV module (Ipv) is represented by
Ipv ¼ NpIph − NpIo
�exp
�qðVpv þ IpvRsÞ
NsAKT
�− 1
�ð4Þ
where Iscr = PV module short-circuit current (A) at 1 kW=m2 and25°C; Ki = short-circuit current temperature coefficient atIscr (0.0017 A=°C); T = module operating temperature inKelvin (K); λ = PV module illumination (kW=m2); Irs = reverse
Fig. 1. PV module equivalent circuit
© ASCE 04015001-2 J. Energy Eng.
J. Energy Eng.
Dow
nloa
ded
from
asc
elib
rary
.org
by
HU
NT
LIB
RA
RY
AC
Q D
EPT
on
01/2
7/15
. Cop
yrig
ht A
SCE
. For
per
sona
l use
onl
y; a
ll ri
ghts
res
erve
d.
saturation current of the module (A); q = electron charge(1.6 × 10⁻¹⁹ C); Voc = open-circuit voltage (V) of the PV panel;Ns = number of cells connected in series in the PV module;k = Boltzmann’s constant with the value 1.3805 × 10⁻²³ J=K;A = ideality factor with the value 1.2; Io = PV module saturationcurrent (A); Tr = reference temperature in Kelvin (298 K);Ego = band-gap for silicon with the value 1.1 eV; Ipv = outputcurrent of the PV module (A); Vpv = output voltage of the PVmodule (V); and Np = number of cells connected in parallel forthe PV module.
In the mathematical model the cells in series and the cells inparallel have values Ns ¼ 36 and Np ¼ 1.
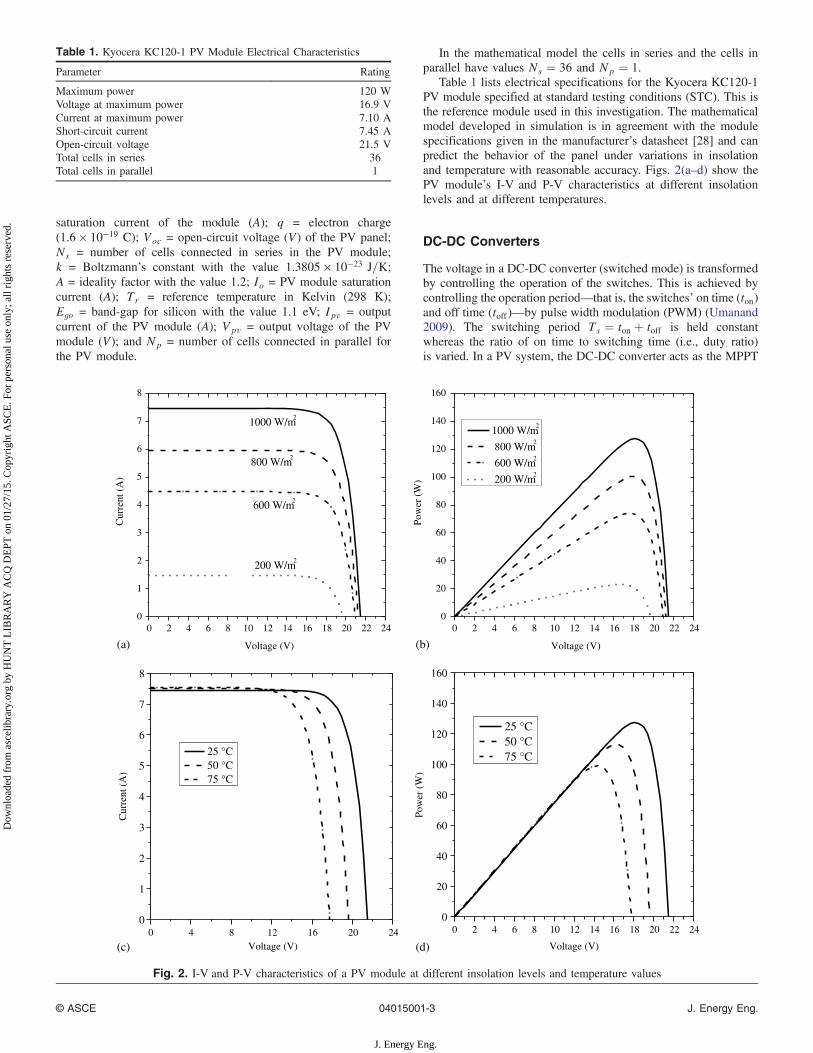
Table 1 lists electrical specifications for the Kyocera KC120-1PV module specified at standard testing conditions (STC). This isthe reference module used in this investigation. The mathematicalmodel developed in simulation is in agreement with the modulespecifications given in the manufacturer’s datasheet [28] and canpredict the behavior of the panel under variations in insolationand temperature with reasonable accuracy. Figs. 2(a–d) show thePV module’s I-V and P-V characteristics at different insolationlevels and at different temperatures.
DC-DC Converters
The voltage in a DC-DC converter (switched mode) is transformedby controlling the operation of the switches. This is achieved bycontrolling the operation period—that is, the switches’ on time (ton)and off time (toff )—by pulse width modulation (PWM) (Umanand2009). The switching period Ts ¼ ton þ toff is held constantwhereas the ratio of on time to switching time (i.e., duty ratio)is varied. In a PV system, the DC-DC converter acts as the MPPT
Table 1. Kyocera KC120-1 PV Module Electrical Characteristics
Parameter Rating
Maximum power 120 WVoltage at maximum power 16.9 VCurrent at maximum power 7.10 AShort-circuit current 7.45 AOpen-circuit voltage 21.5 VTotal cells in series 36Total cells in parallel 1
0 2 4 6 8 10 12 14 16 18 20 22 240
1
2
3
4
5
6
7
8
200 W/m2
600 W/m2
800 W/m2
1000 W/m2
Cur
rent
(A
)
Voltage (V)
0 2 4 6 8 10 12 14 16 18 20 22 240
20
40
60
80
100
120
140
160
Pow
er (
W)
Voltage (V)
1000 W/m2
800 W/m2
600 W/m2
200 W/m2
0 4 8 12 16 20 240
1
2
3
4
5
6
7
8
Cur
rent
(A
)
Voltage (V)
25 °C 50 °C 75 °C
0 2 4 6 8 10 12 14 16 18 20 22 240
20
40
60
80
100
120
140
160
Pow
er (
W)
Voltage (V)
25 °C 50 °C 75 °C
(a) (b)
(c) (d)
Fig. 2. I-V and P-V characteristics of a PV module at different insolation levels and temperature values
© ASCE 04015001-3 J. Energy Eng.
J. Energy Eng.
Dow
nloa
ded
from
asc
elib
rary
.org
by
HU
NT
LIB
RA
RY
AC
Q D
EPT
on
01/2
7/15
. Cop
yrig
ht A
SCE
. For
per
sona
l use
onl
y; a
ll ri
ghts
res
erve
d.
interface between the source and the load. The converter works toadjust its duty ratio (D) to match the requirements of the system.The duty ratio of a converter is defined as
D ¼ tonTs
ð5Þ
Steady-state analyses of converters are governed by two funda-mental laws: volt-second balance and ampere-second balance.These decide DC-DC converter operation (Rashid 2004; Umanand2009). Volt-second balance for an inductor means that the productof the voltage and time in one cycle must be zero under equilibriumconditions. This is expressed as
ZTs
0
VLdt ¼ 0 ð6Þ
where VL = voltage across the inductor.Ampere-second balance, or charge balance, for a capacitor
means that the product of the capacitor current and time shouldbe zero under equilibrium conditions. This is described as
ZTs
0
icdt ¼ 0 ð7Þ
where ic = current through the capacitor.Based on the two laws, the input-output relationship under
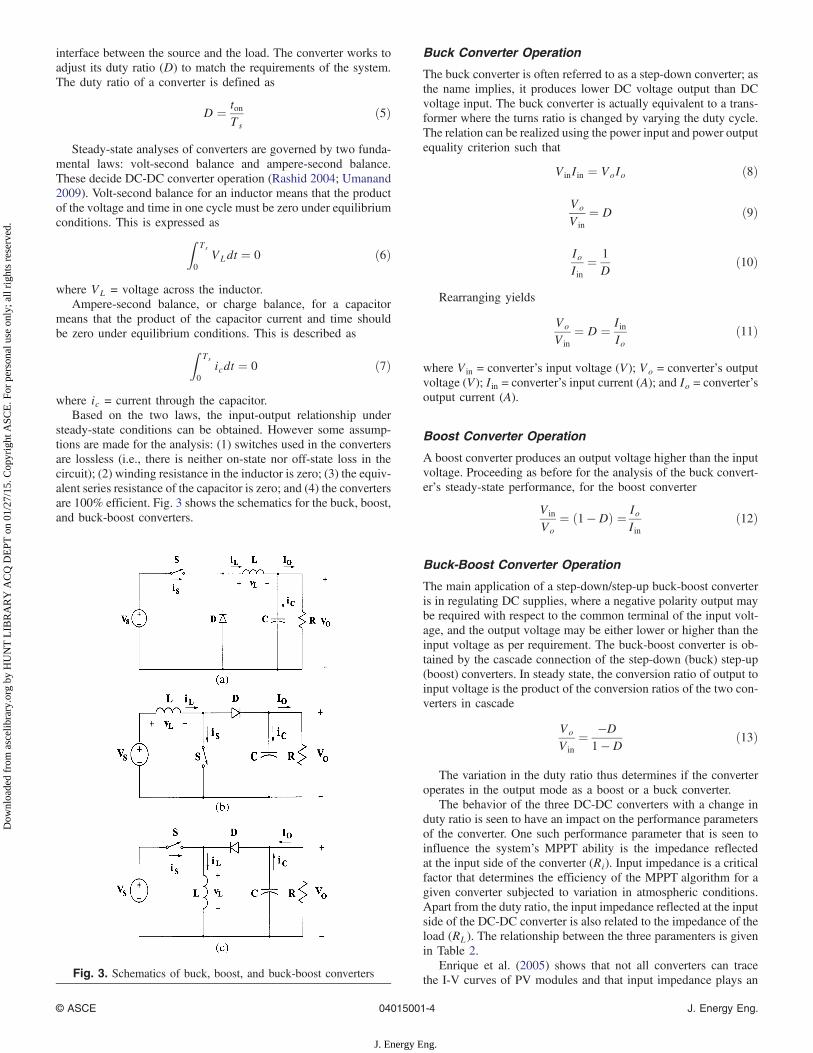
steady-state conditions can be obtained. However some assump-tions are made for the analysis: (1) switches used in the convertersare lossless (i.e., there is neither on-state nor off-state loss in thecircuit); (2) winding resistance in the inductor is zero; (3) the equiv-alent series resistance of the capacitor is zero; and (4) the convertersare 100% efficient. Fig. 3 shows the schematics for the buck, boost,and buck-boost converters.
Buck Converter Operation
The buck converter is often referred to as a step-down converter; asthe name implies, it produces lower DC voltage output than DCvoltage input. The buck converter is actually equivalent to a trans-former where the turns ratio is changed by varying the duty cycle.The relation can be realized using the power input and power outputequality criterion such that
V inIin ¼ VoIo ð8Þ
Vo
V in¼ D ð9Þ
IoIin
¼ 1
Dð10Þ
Rearranging yields
Vo
V in¼ D ¼ Iin
Ioð11Þ
where V in = converter’s input voltage (V); Vo = converter’s outputvoltage (V); Iin = converter’s input current (A); and Io = converter’soutput current (A).
Boost Converter Operation
A boost converter produces an output voltage higher than the inputvoltage. Proceeding as before for the analysis of the buck convert-er’s steady-state performance, for the boost converter
V in
Vo¼ ð1 −DÞ ¼ Io
Iinð12Þ
Buck-Boost Converter Operation
The main application of a step-down/step-up buck-boost converteris in regulating DC supplies, where a negative polarity output maybe required with respect to the common terminal of the input volt-age, and the output voltage may be either lower or higher than theinput voltage as per requirement. The buck-boost converter is ob-tained by the cascade connection of the step-down (buck) step-up(boost) converters. In steady state, the conversion ratio of output toinput voltage is the product of the conversion ratios of the two con-verters in cascade
Vo
V in¼ −D
1 −Dð13Þ
The variation in the duty ratio thus determines if the converteroperates in the output mode as a boost or a buck converter.
The behavior of the three DC-DC converters with a change induty ratio is seen to have an impact on the performance parametersof the converter. One such performance parameter that is seen toinfluence the system’s MPPT ability is the impedance reflectedat the input side of the converter (Ri). Input impedance is a criticalfactor that determines the efficiency of the MPPT algorithm for agiven converter subjected to variation in atmospheric conditions.Apart from the duty ratio, the input impedance reflected at the inputside of the DC-DC converter is also related to the impedance of theload (RL). The relationship between the three paramenters is givenin Table 2.
Enrique et al. (2005) shows that not all converters can tracethe I-V curves of PV modules and that input impedance plays anFig. 3. Schematics of buck, boost, and buck-boost converters
© ASCE 04015001-4 J. Energy Eng.
J. Energy Eng.
Dow
nloa
ded
from
asc
elib
rary
.org
by
HU
NT
LIB
RA
RY
AC
Q D
EPT
on
01/2
7/15
. Cop
yrig
ht A
SCE
. For
per
sona
l use
onl
y; a
ll ri
ghts
res
erve
d.
important role in this regard. The buck converter’s operation subjectto variation in duty ratio is such that the input impedance is alwaysgreater than the connected impedance of the load at the converter’soutput side. Thus, the range of input impedance values for a buckconverter is Ri ≥ RL. On the other hand, input impedance for aboost converter is seen to be less than the load resistance for theconverter’s operation. As duty ratio changes from 0 to unity, inputimpedance changes from Ri ¼ RL atD ¼ 0 to Ri ¼ zero at D ¼ 1.For a buck-boost converter, the operation results in a change in in-put impedance from Ri ≥ RL for D in the range [0,0.5], Ri ¼ RL atD ¼ 0.5, and Ri < RL for D in the range [0.5,1].
MPPT Algorithm Implementation
Liu et al. (2008) and Sera et al. (2006) note that the HC and P&Otechnique is widely used with commercial systems because of itssimple structure and its few measured parameters involved in thetracking algorithm. The advantage of the HC algorithm over theP&O technique is in the fact that the former generates the referenceduty ratio signal in response to perturbation of both power and volt-age as compared with just the perturbation of power in the P&Otechnique, making HC preferable to P&O. For its simplicity andease of implementation, the HC technique of direct duty ratio con-trol has been selected for use as the tracking algorithm in this paper.
Owing to its simple structure and fewer parameters, it is suitable foruse with PV systems for module-integrated electronics. Also, it canbe used with low-cost circuitry and microcontrollers, providing theadded advantage of reduction in overall system cost because a com-plex algorithm with larger sensory circuits decreases the system’soverall cost-effectiveness.
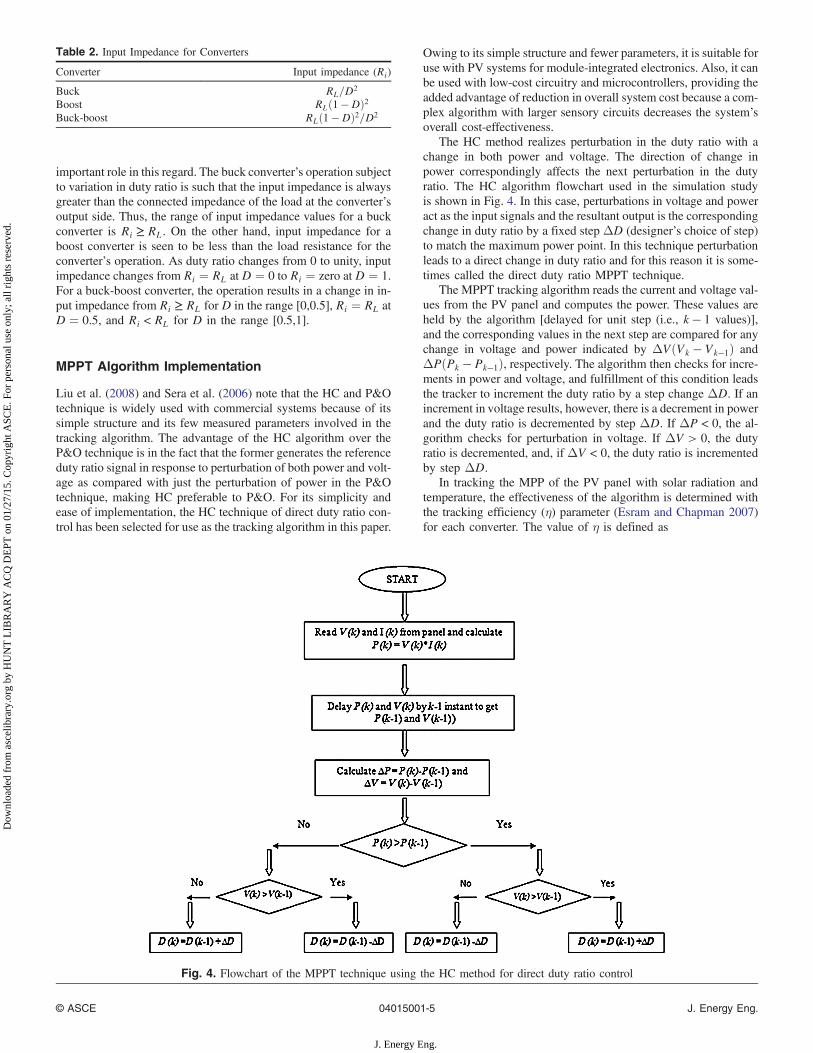
The HC method realizes perturbation in the duty ratio with achange in both power and voltage. The direction of change inpower correspondingly affects the next perturbation in the dutyratio. The HC algorithm flowchart used in the simulation studyis shown in Fig. 4. In this case, perturbations in voltage and poweract as the input signals and the resultant output is the correspondingchange in duty ratio by a fixed step ΔD (designer’s choice of step)to match the maximum power point. In this technique perturbationleads to a direct change in duty ratio and for this reason it is some-times called the direct duty ratio MPPT technique.
The MPPT tracking algorithm reads the current and voltage val-ues from the PV panel and computes the power. These values areheld by the algorithm [delayed for unit step (i.e., k − 1 values)],and the corresponding values in the next step are compared for anychange in voltage and power indicated by ΔVðVk − Vk−1Þ andΔPðPk − Pk−1Þ, respectively. The algorithm then checks for incre-ments in power and voltage, and fulfillment of this condition leadsthe tracker to increment the duty ratio by a step change ΔD. If anincrement in voltage results, however, there is a decrement in powerand the duty ratio is decremented by step ΔD. If ΔP < 0, the al-gorithm checks for perturbation in voltage. If ΔV > 0, the dutyratio is decremented, and, if ΔV < 0, the duty ratio is incrementedby step ΔD.
In tracking the MPP of the PV panel with solar radiation andtemperature, the effectiveness of the algorithm is determined withthe tracking efficiency (η) parameter (Esram and Chapman 2007)for each converter. The value of η is defined as
Fig. 4. Flowchart of the MPPT technique using the HC method for direct duty ratio control
Table 2. Input Impedance for Converters
Converter Input impedance (Ri)
Buck RL=D2
Boost RLð1 −DÞ2Buck-boost RLð1 −DÞ2=D2
© ASCE 04015001-5 J. Energy Eng.
J. Energy Eng.
Dow
nloa
ded
from
asc
elib
rary
.org
by
HU
NT
LIB
RA
RY
AC
Q D
EPT
on
01/2
7/15
. Cop
yrig
ht A
SCE
. For
per
sona
l use
onl
y; a
ll ri
ghts
res
erve
d.
η ¼Rt0 PinstðtÞdtRt0 PmppðtÞdt
ð14Þ
where Pinst = instantaneous power at the operating point ofthe PV module and Pmpp = instantaneous maximum power pointof the PV module under given conditions of insolation andtemperature.
Results and Discussion
MPP Parameters
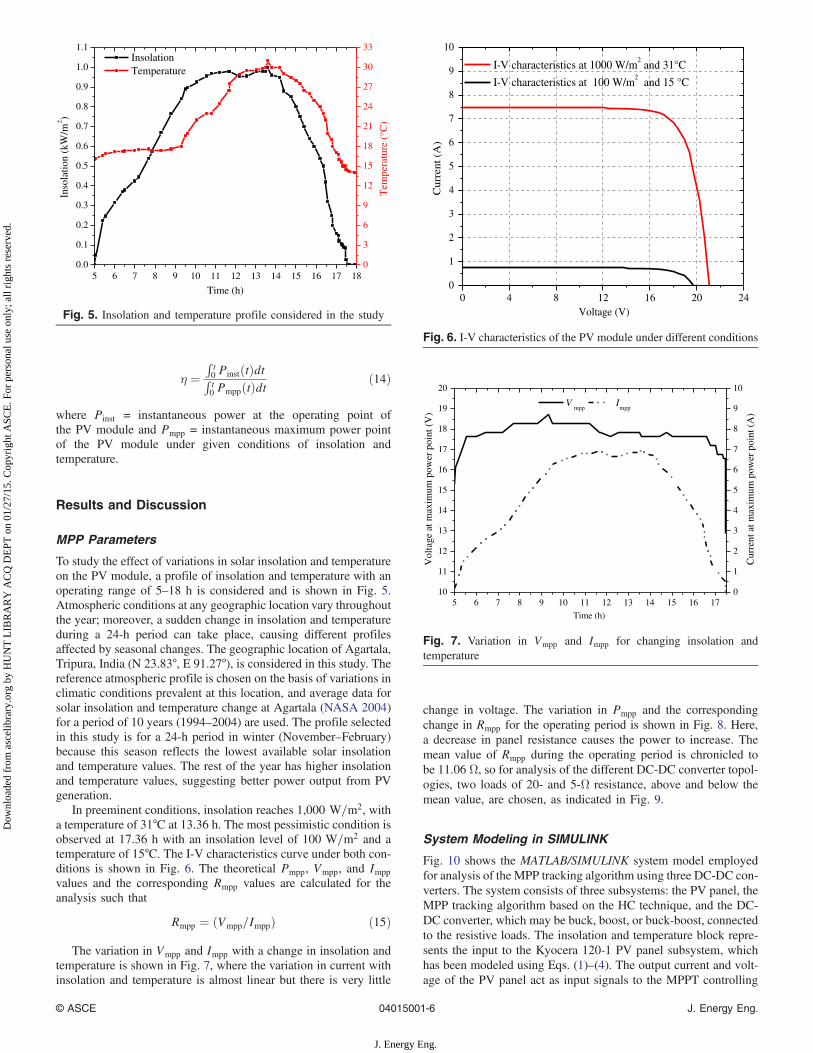
To study the effect of variations in solar insolation and temperatureon the PV module, a profile of insolation and temperature with anoperating range of 5–18 h is considered and is shown in Fig. 5.Atmospheric conditions at any geographic location vary throughoutthe year; moreover, a sudden change in insolation and temperatureduring a 24-h period can take place, causing different profilesaffected by seasonal changes. The geographic location of Agartala,Tripura, India (N 23.83°, E 91.27°), is considered in this study. Thereference atmospheric profile is chosen on the basis of variations inclimatic conditions prevalent at this location, and average data forsolar insolation and temperature change at Agartala (NASA 2004)for a period of 10 years (1994–2004) are used. The profile selectedin this study is for a 24-h period in winter (November–February)because this season reflects the lowest available solar insolationand temperature values. The rest of the year has higher insolationand temperature values, suggesting better power output from PVgeneration.
In preeminent conditions, insolation reaches 1,000 W=m2, witha temperature of 31°C at 13.36 h. The most pessimistic condition isobserved at 17.36 h with an insolation level of 100 W=m2 and atemperature of 15°C. The I-V characteristics curve under both con-ditions is shown in Fig. 6. The theoretical Pmpp, Vmpp, and Imppvalues and the corresponding Rmpp values are calculated for theanalysis such that
Rmpp ¼ ðVmpp=ImppÞ ð15Þ
The variation in Vmpp and Impp with a change in insolation andtemperature is shown in Fig. 7, where the variation in current withinsolation and temperature is almost linear but there is very little
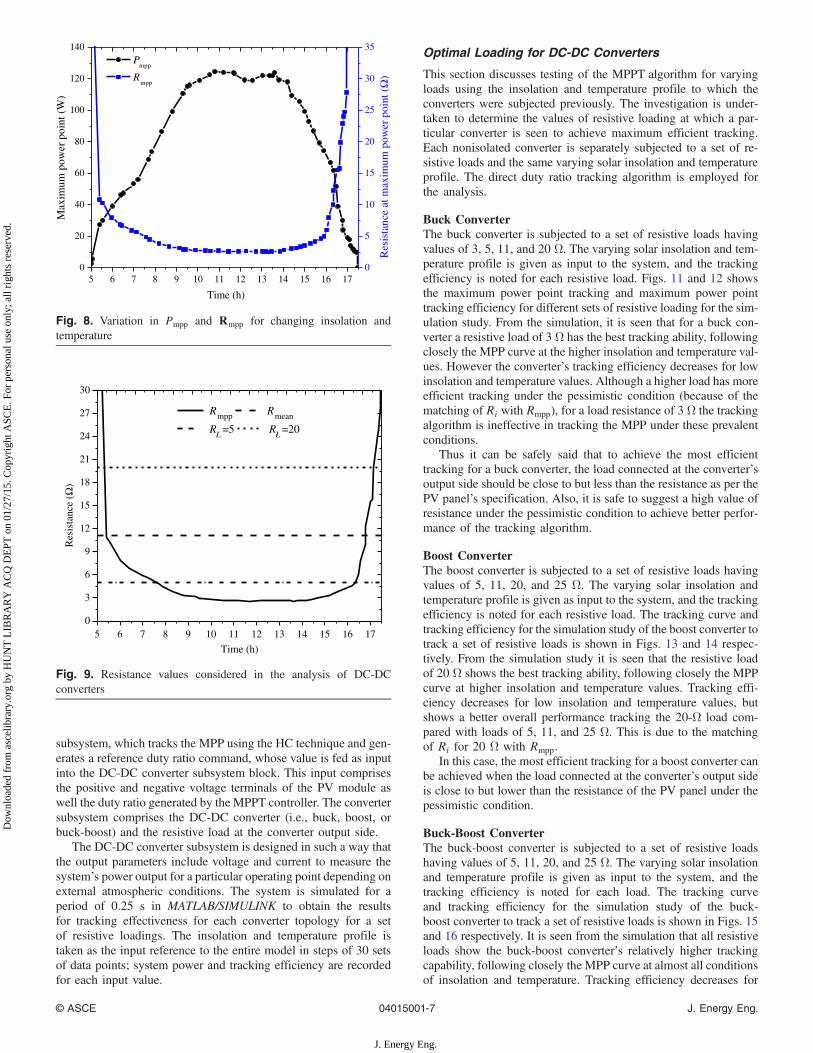
change in voltage. The variation in Pmpp and the correspondingchange in Rmpp for the operating period is shown in Fig. 8. Here,a decrease in panel resistance causes the power to increase. Themean value of Rmpp during the operating period is chronicled tobe 11.06 Ω, so for analysis of the different DC-DC converter topol-ogies, two loads of 20- and 5-Ω resistance, above and below themean value, are chosen, as indicated in Fig. 9.
System Modeling in SIMULINK
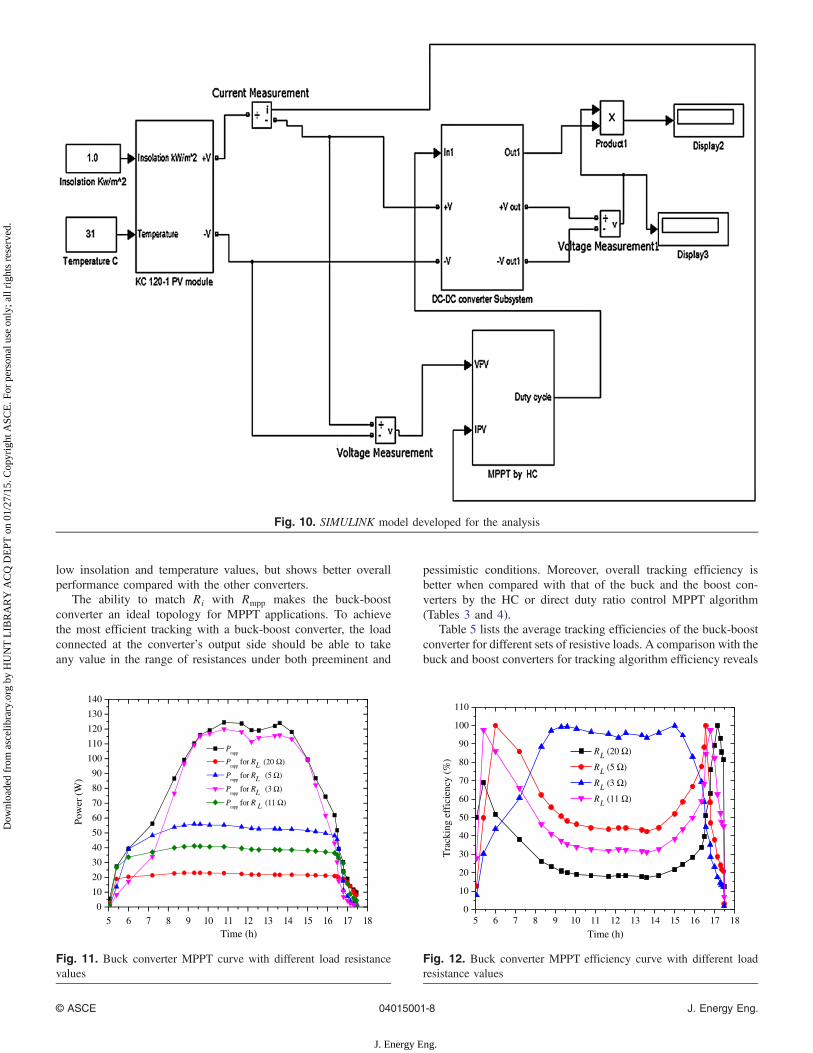
Fig. 10 shows the MATLAB/SIMULINK system model employedfor analysis of the MPP tracking algorithm using three DC-DC con-verters. The system consists of three subsystems: the PV panel, theMPP tracking algorithm based on the HC technique, and the DC-DC converter, which may be buck, boost, or buck-boost, connectedto the resistive loads. The insolation and temperature block repre-sents the input to the Kyocera 120-1 PV panel subsystem, whichhas been modeled using Eqs. (1)–(4). The output current and volt-age of the PV panel act as input signals to the MPPT controlling
5 6 7 8 9 10 11 12 13 14 15 16 17 180.0
0.1
0.2
0.3
0.4
0.5
0.6
0.7
0.8
0.9
1.0
1.1 Insolation Temperature
Time (h)
Inso
latio
n (k
W/m
2 )
0
3
6
9
12
15
18
21
24
27
30
33
Tem
pera
ture
(°C
)
Fig. 5. Insolation and temperature profile considered in the study
0 4 8 12 16 20 240
1
2
3
4
5
6
7
8
9
10
Cur
rent
(A
)
Voltage (V)
I-V characteristics at 1000 W/m2 and 31°C
I-V characteristics at 100 W/m2 and 15 °C
Fig. 6. I-V characteristics of the PV module under different conditions
5 6 7 8 9 10 11 12 13 14 15 16 1710
11
12
13
14
15
16
17
18
19
20
Vmpp
Impp
Time (h)
Vol
tage
at m
axim
um p
ower
poi
nt (
V)
0
1
2
3
4
5
6
7
8
9
10
Cur
rent
at m
axim
um p
ower
poi
nt (
A)
Fig. 7. Variation in Vmpp and Impp for changing insolation andtemperature
© ASCE 04015001-6 J. Energy Eng.
J. Energy Eng.
Dow
nloa
ded
from
asc
elib
rary
.org
by
HU
NT
LIB
RA
RY
AC
Q D
EPT
on
01/2
7/15
. Cop
yrig
ht A
SCE
. For
per
sona
l use
onl
y; a
ll ri
ghts
res
erve
d.
subsystem, which tracks the MPP using the HC technique and gen-erates a reference duty ratio command, whose value is fed as inputinto the DC-DC converter subsystem block. This input comprisesthe positive and negative voltage terminals of the PV module aswell the duty ratio generated by the MPPT controller. The convertersubsystem comprises the DC-DC converter (i.e., buck, boost, orbuck-boost) and the resistive load at the converter output side.
The DC-DC converter subsystem is designed in such a way thatthe output parameters include voltage and current to measure thesystem’s power output for a particular operating point depending onexternal atmospheric conditions. The system is simulated for aperiod of 0.25 s in MATLAB/SIMULINK to obtain the resultsfor tracking effectiveness for each converter topology for a setof resistive loadings. The insolation and temperature profile istaken as the input reference to the entire model in steps of 30 setsof data points; system power and tracking efficiency are recordedfor each input value.
Optimal Loading for DC-DC Converters
This section discusses testing of the MPPT algorithm for varyingloads using the insolation and temperature profile to which theconverters were subjected previously. The investigation is under-taken to determine the values of resistive loading at which a par-ticular converter is seen to achieve maximum efficient tracking.Each nonisolated converter is separately subjected to a set of re-sistive loads and the same varying solar insolation and temperatureprofile. The direct duty ratio tracking algorithm is employed forthe analysis.
Buck ConverterThe buck converter is subjected to a set of resistive loads havingvalues of 3, 5, 11, and 20 Ω. The varying solar insolation and tem-perature profile is given as input to the system, and the trackingefficiency is noted for each resistive load. Figs. 11 and 12 showsthe maximum power point tracking and maximum power pointtracking efficiency for different sets of resistive loading for the sim-ulation study. From the simulation, it is seen that for a buck con-verter a resistive load of 3 Ω has the best tracking ability, followingclosely the MPP curve at the higher insolation and temperature val-ues. However the converter’s tracking efficiency decreases for lowinsolation and temperature values. Although a higher load has moreefficient tracking under the pessimistic condition (because of thematching of Ri with Rmpp), for a load resistance of 3 Ω the trackingalgorithm is ineffective in tracking the MPP under these prevalentconditions.
Thus it can be safely said that to achieve the most efficienttracking for a buck converter, the load connected at the converter’soutput side should be close to but less than the resistance as per thePV panel’s specification. Also, it is safe to suggest a high value ofresistance under the pessimistic condition to achieve better perfor-mance of the tracking algorithm.
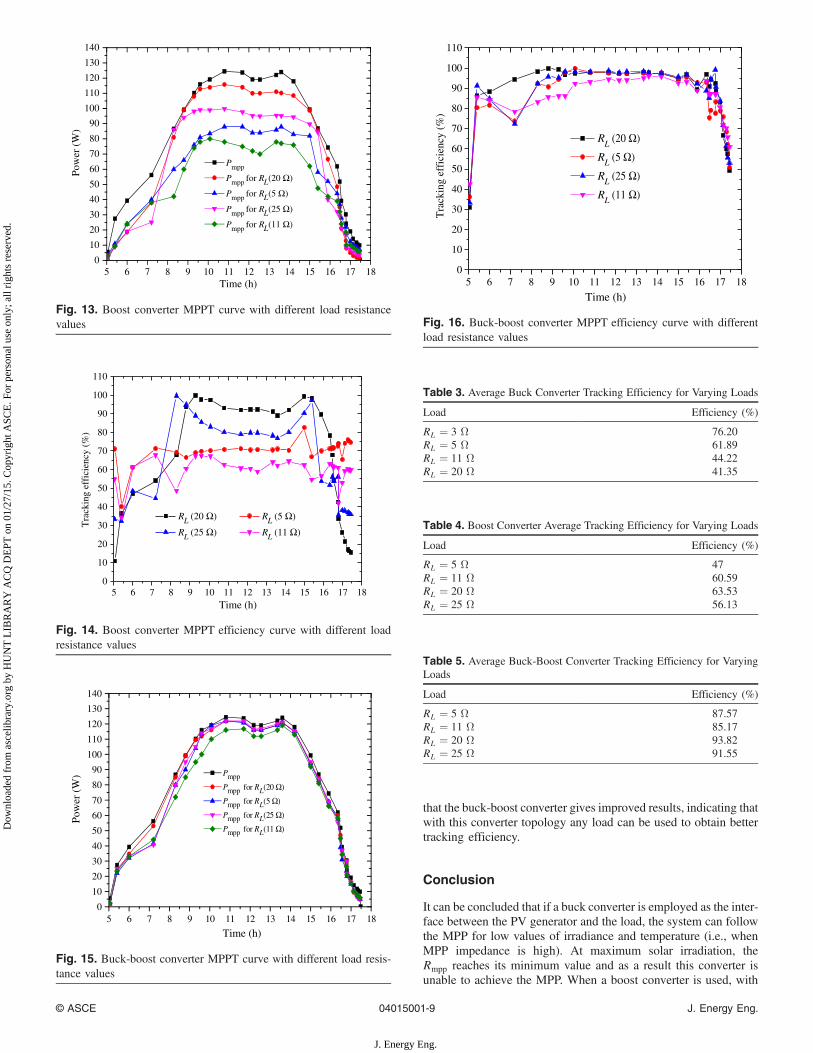
Boost ConverterThe boost converter is subjected to a set of resistive loads havingvalues of 5, 11, 20, and 25 Ω. The varying solar insolation andtemperature profile is given as input to the system, and the trackingefficiency is noted for each resistive load. The tracking curve andtracking efficiency for the simulation study of the boost converter totrack a set of resistive loads is shown in Figs. 13 and 14 respec-tively. From the simulation study it is seen that the resistive loadof 20 Ω shows the best tracking ability, following closely the MPPcurve at higher insolation and temperature values. Tracking effi-ciency decreases for low insolation and temperature values, butshows a better overall performance tracking the 20-Ω load com-pared with loads of 5, 11, and 25 Ω. This is due to the matchingof Ri for 20 Ω with Rmpp.
In this case, the most efficient tracking for a boost converter canbe achieved when the load connected at the converter’s output sideis close to but lower than the resistance of the PV panel under thepessimistic condition.
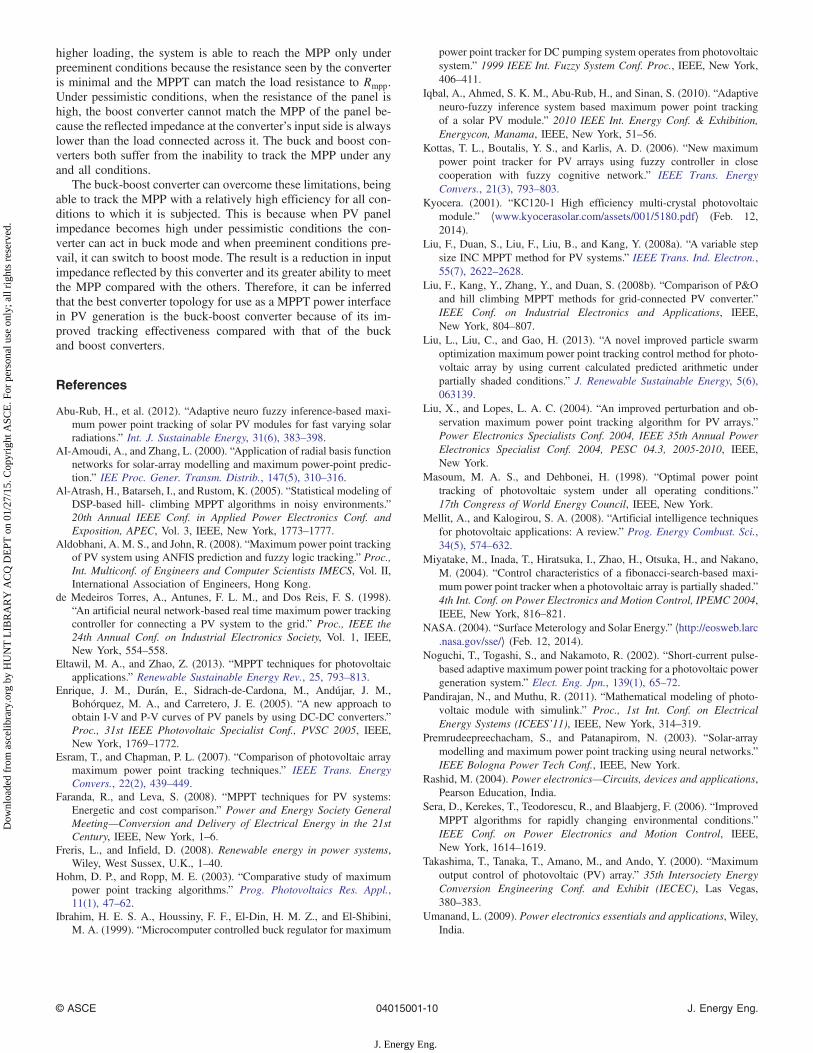
Buck-Boost ConverterThe buck-boost converter is subjected to a set of resistive loadshaving values of 5, 11, 20, and 25 Ω. The varying solar insolationand temperature profile is given as input to the system, and thetracking efficiency is noted for each load. The tracking curveand tracking efficiency for the simulation study of the buck-boost converter to track a set of resistive loads is shown in Figs. 15and 16 respectively. It is seen from the simulation that all resistiveloads show the buck-boost converter’s relatively higher trackingcapability, following closely the MPP curve at almost all conditionsof insolation and temperature. Tracking efficiency decreases for
5 6 7 8 9 10 11 12 13 14 15 16 170
20
40
60
80
100
120
140 P
mpp
Rmpp
Time (h)
Max
imum
pow
er p
oint
(W
)
0
5
10
15
20
25
30
35
Res
ista
nce
at m
axim
um p
ower
poi
nt (
Ω)
Fig. 8. Variation in Pmpp and Rmpp for changing insolation andtemperature
5 6 7 8 9 10 11 12 13 14 15 16 170
3
6
9
12
15
18
21
24
27
30
Res
ista
nce
(Ω)
Time (h)
Rmpp Rmean
RL =5 RL =20
Fig. 9. Resistance values considered in the analysis of DC-DCconverters
© ASCE 04015001-7 J. Energy Eng.
J. Energy Eng.
Dow
nloa
ded
from
asc
elib
rary
.org
by
HU
NT
LIB
RA
RY
AC
Q D
EPT
on
01/2
7/15
. Cop
yrig
ht A
SCE
. For
per
sona
l use
onl
y; a
ll ri
ghts
res
erve
d.
low insolation and temperature values, but shows better overallperformance compared with the other converters.
The ability to match Ri with Rmpp makes the buck-boostconverter an ideal topology for MPPT applications. To achievethe most efficient tracking with a buck-boost converter, the loadconnected at the converter’s output side should be able to takeany value in the range of resistances under both preeminent and
pessimistic conditions. Moreover, overall tracking efficiency isbetter when compared with that of the buck and the boost con-verters by the HC or direct duty ratio control MPPT algorithm(Tables 3 and 4).
Table 5 lists the average tracking efficiencies of the buck-boostconverter for different sets of resistive loads. A comparison with thebuck and boost converters for tracking algorithm efficiency reveals
Fig. 10. SIMULINK model developed for the analysis
5 6 7 8 9 10 11 12 13 14 15 16 17 180
10
20
30
40
50
60
70
80
90
100
110
120
130
140
Pow
er (
W)
Time (h)
Pmpp
Pmpp
for RL (20 Ω)
Pmpp
for RL (5 Ω)
Pmpp
for RL (3 Ω)
Pmpp
for R L (11 Ω)
Fig. 11. Buck converter MPPT curve with different load resistancevalues
5 6 7 8 9 10 11 12 13 14 15 16 17 180
10
20
30
40
50
60
70
80
90
100
110
Tra
ckin
g ef
fici
ency
(%
)
Time (h)
RL (20 Ω)
RL (5 Ω)
RL (3 Ω)
RL (11 Ω)
Fig. 12. Buck converter MPPT efficiency curve with different loadresistance values
© ASCE 04015001-8 J. Energy Eng.
J. Energy Eng.
Dow
nloa
ded
from
asc
elib
rary
.org
by
HU
NT
LIB
RA
RY
AC
Q D
EPT
on
01/2
7/15
. Cop
yrig
ht A
SCE
. For
per
sona
l use
onl
y; a
ll ri
ghts
res
erve
d.
that the buck-boost converter gives improved results, indicating thatwith this converter topology any load can be used to obtain bettertracking efficiency.
Conclusion
It can be concluded that if a buck converter is employed as the inter-face between the PV generator and the load, the system can followthe MPP for low values of irradiance and temperature (i.e., whenMPP impedance is high). At maximum solar irradiation, theRmpp reaches its minimum value and as a result this converter isunable to achieve the MPP. When a boost converter is used, with
5 6 7 8 9 10 11 12 13 14 15 16 17 180
10
20
30
40
50
60
70
80
90
100
110
120
130
140
Pow
er (
W)
Time (h)
Pmpp
Pmpp for RL(20 Ω)
Pmpp for RL(5 Ω)
Pmpp for RL(25 Ω)
Pmpp for RL(11 Ω)
Fig. 13. Boost converter MPPT curve with different load resistancevalues
5 6 7 8 9 10 11 12 13 14 15 16 17 180
10
20
30
40
50
60
70
80
90
100
110
RL (20 Ω) RL (5 Ω)
RL (25 Ω) RL (11 Ω)
Tra
ckin
g ef
fici
ency
(%
)
Time (h)
Fig. 14. Boost converter MPPT efficiency curve with different loadresistance values
5 6 7 8 9 10 11 12 13 14 15 16 17 180
10
20
30
40
50
60
70
80
90
100
110
120
130
140
Pow
er (
W)
Time (h)
Pmpp Pmpp for RL(20 Ω)
Pmpp for RL(5 Ω)
Pmpp for RL(25 Ω)
Pmpp for RL(11 Ω)
Fig. 15. Buck-boost converter MPPT curve with different load resis-tance values
5 6 7 8 9 10 11 12 13 14 15 16 17 180
10
20
30
40
50
60
70
80
90
100
110
RL (20 Ω)
RL (5 Ω)
RL (25 Ω)
RL (11 Ω)
Tra
ckin
g ef
fici
ency
(%
)
Time (h)
Fig. 16. Buck-boost converter MPPT efficiency curve with differentload resistance values
Table 5. Average Buck-Boost Converter Tracking Efficiency for VaryingLoads
Load Efficiency (%)
RL ¼ 5 Ω 87.57RL ¼ 11 Ω 85.17RL ¼ 20 Ω 93.82RL ¼ 25 Ω 91.55
Table 3. Average Buck Converter Tracking Efficiency for Varying Loads
Load Efficiency (%)
RL ¼ 3 Ω 76.20RL ¼ 5 Ω 61.89RL ¼ 11 Ω 44.22RL ¼ 20 Ω 41.35
Table 4. Boost Converter Average Tracking Efficiency for Varying Loads
Load Efficiency (%)
RL ¼ 5 Ω 47RL ¼ 11 Ω 60.59RL ¼ 20 Ω 63.53RL ¼ 25 Ω 56.13
© ASCE 04015001-9 J. Energy Eng.
J. Energy Eng.
Dow
nloa
ded
from
asc
elib
rary
.org
by
HU
NT
LIB
RA
RY
AC
Q D
EPT
on
01/2
7/15
. Cop
yrig
ht A
SCE
. For
per
sona
l use
onl
y; a
ll ri
ghts
res
erve
d.
higher loading, the system is able to reach the MPP only underpreeminent conditions because the resistance seen by the converteris minimal and the MPPT can match the load resistance to Rmpp.Under pessimistic conditions, when the resistance of the panel ishigh, the boost converter cannot match the MPP of the panel be-cause the reflected impedance at the converter’s input side is alwayslower than the load connected across it. The buck and boost con-verters both suffer from the inability to track the MPP under anyand all conditions.
The buck-boost converter can overcome these limitations, beingable to track the MPP with a relatively high efficiency for all con-ditions to which it is subjected. This is because when PV panelimpedance becomes high under pessimistic conditions the con-verter can act in buck mode and when preeminent conditions pre-vail, it can switch to boost mode. The result is a reduction in inputimpedance reflected by this converter and its greater ability to meetthe MPP compared with the others. Therefore, it can be inferredthat the best converter topology for use as a MPPT power interfacein PV generation is the buck-boost converter because of its im-proved tracking effectiveness compared with that of the buckand boost converters.
References
Abu-Rub, H., et al. (2012). “Adaptive neuro fuzzy inference-based maxi-mum power point tracking of solar PV modules for fast varying solarradiations.” Int. J. Sustainable Energy, 31(6), 383–398.
AI-Amoudi, A., and Zhang, L. (2000). “Application of radial basis functionnetworks for solar-array modelling and maximum power-point predic-tion.” IEE Proc. Gener. Transm. Distrib., 147(5), 310–316.
Al-Atrash, H., Batarseh, I., and Rustom, K. (2005). “Statistical modeling ofDSP-based hill- climbing MPPT algorithms in noisy environments.”20th Annual IEEE Conf. in Applied Power Electronics Conf. andExposition, APEC, Vol. 3, IEEE, New York, 1773–1777.
Aldobhani, A. M. S., and John, R. (2008). “Maximum power point trackingof PV system using ANFIS prediction and fuzzy logic tracking.” Proc.,Int. Multiconf. of Engineers and Computer Scientists IMECS, Vol. II,International Association of Engineers, Hong Kong.
de Medeiros Torres, A., Antunes, F. L. M., and Dos Reis, F. S. (1998).“An artificial neural network-based real time maximum power trackingcontroller for connecting a PV system to the grid.” Proc., IEEE the24th Annual Conf. on Industrial Electronics Society, Vol. 1, IEEE,New York, 554–558.
Eltawil, M. A., and Zhao, Z. (2013). “MPPT techniques for photovoltaicapplications.” Renewable Sustainable Energy Rev., 25, 793–813.
Enrique, J. M., Durán, E., Sidrach-de-Cardona, M., Andújar, J. M.,Bohorquez, M. A., and Carretero, J. E. (2005). “A new approach toobtain I-V and P-V curves of PV panels by using DC-DC converters.”Proc., 31st IEEE Photovoltaic Specialist Conf., PVSC 2005, IEEE,New York, 1769–1772.
Esram, T., and Chapman, P. L. (2007). “Comparison of photovoltaic arraymaximum power point tracking techniques.” IEEE Trans. EnergyConvers., 22(2), 439–449.
Faranda, R., and Leva, S. (2008). “MPPT techniques for PV systems:Energetic and cost comparison.” Power and Energy Society GeneralMeeting—Conversion and Delivery of Electrical Energy in the 21stCentury, IEEE, New York, 1–6.
Freris, L., and Infield, D. (2008). Renewable energy in power systems,Wiley, West Sussex, U.K., 1–40.
Hohm, D. P., and Ropp, M. E. (2003). “Comparative study of maximumpower point tracking algorithms.” Prog. Photovoltaics Res. Appl.,11(1), 47–62.
Ibrahim, H. E. S. A., Houssiny, F. F., El-Din, H. M. Z., and El-Shibini,M. A. (1999). “Microcomputer controlled buck regulator for maximum
power point tracker for DC pumping system operates from photovoltaicsystem.” 1999 IEEE Int. Fuzzy System Conf. Proc., IEEE, New York,406–411.
Iqbal, A., Ahmed, S. K. M., Abu-Rub, H., and Sinan, S. (2010). “Adaptiveneuro-fuzzy inference system based maximum power point trackingof a solar PV module.” 2010 IEEE Int. Energy Conf. & Exhibition,Energycon, Manama, IEEE, New York, 51–56.
Kottas, T. L., Boutalis, Y. S., and Karlis, A. D. (2006). “New maximumpower point tracker for PV arrays using fuzzy controller in closecooperation with fuzzy cognitive network.” IEEE Trans. EnergyConvers., 21(3), 793–803.
Kyocera. (2001). “KC120-1 High efficiency multi-crystal photovoltaicmodule.” ⟨www.kyocerasolar.com/assets/001/5180.pdf⟩ (Feb. 12,2014).
Liu, F., Duan, S., Liu, F., Liu, B., and Kang, Y. (2008a). “A variable stepsize INC MPPT method for PV systems.” IEEE Trans. Ind. Electron.,55(7), 2622–2628.
Liu, F., Kang, Y., Zhang, Y., and Duan, S. (2008b). “Comparison of P&Oand hill climbing MPPT methods for grid-connected PV converter.”IEEE Conf. on Industrial Electronics and Applications, IEEE,New York, 804–807.
Liu, L., Liu, C., and Gao, H. (2013). “A novel improved particle swarmoptimization maximum power point tracking control method for photo-voltaic array by using current calculated predicted arithmetic underpartially shaded conditions.” J. Renewable Sustainable Energy, 5(6),063139.
Liu, X., and Lopes, L. A. C. (2004). “An improved perturbation and ob-servation maximum power point tracking algorithm for PV arrays.”Power Electronics Specialists Conf. 2004, IEEE 35th Annual PowerElectronics Specialist Conf. 2004, PESC 04.3, 2005-2010, IEEE,New York.
Masoum, M. A. S., and Dehbonei, H. (1998). “Optimal power pointtracking of photovoltaic system under all operating conditions.”17th Congress of World Energy Council, IEEE, New York.
Mellit, A., and Kalogirou, S. A. (2008). “Artificial intelligence techniquesfor photovoltaic applications: A review.” Prog. Energy Combust. Sci.,34(5), 574–632.
Miyatake, M., Inada, T., Hiratsuka, I., Zhao, H., Otsuka, H., and Nakano,M. (2004). “Control characteristics of a fibonacci-search-based maxi-mum power point tracker when a photovoltaic array is partially shaded.”4th Int. Conf. on Power Electronics and Motion Control, IPEMC 2004,IEEE, New York, 816–821.
NASA. (2004). “Surface Meterology and Solar Energy.” ⟨http://eosweb.larc.nasa.gov/sse/⟩ (Feb. 12, 2014).
Noguchi, T., Togashi, S., and Nakamoto, R. (2002). “Short-current pulse-based adaptive maximum power point tracking for a photovoltaic powergeneration system.” Elect. Eng. Jpn., 139(1), 65–72.
Pandirajan, N., and Muthu, R. (2011). “Mathematical modeling of photo-voltaic module with simulink.” Proc., 1st Int. Conf. on ElectricalEnergy Systems (ICEES’11), IEEE, New York, 314–319.
Premrudeepreechacham, S., and Patanapirom, N. (2003). “Solar-arraymodelling and maximum power point tracking using neural networks.”IEEE Bologna Power Tech Conf., IEEE, New York.
Rashid, M. (2004). Power electronics—Circuits, devices and applications,Pearson Education, India.
Sera, D., Kerekes, T., Teodorescu, R., and Blaabjerg, F. (2006). “ImprovedMPPT algorithms for rapidly changing environmental conditions.”IEEE Conf. on Power Electronics and Motion Control, IEEE,New York, 1614–1619.
Takashima, T., Tanaka, T., Amano, M., and Ando, Y. (2000). “Maximumoutput control of photovoltaic (PV) array.” 35th Intersociety EnergyConversion Engineering Conf. and Exhibit (IECEC), Las Vegas,380–383.
Umanand, L. (2009). Power electronics essentials and applications, Wiley,India.
© ASCE 04015001-10 J. Energy Eng.
J. Energy Eng.
Dow
nloa
ded
from
asc
elib
rary
.org
by
HU
NT
LIB
RA
RY
AC
Q D
EPT
on
01/2
7/15
. Cop
yrig
ht A
SCE
. For
per
sona
l use
onl
y; a
ll ri
ghts
res
erve
d.
Copyright © 2022 FDOKUMEN