Simplified Pushover-Based Earthquake Loss Assessment (SP-BELA) Method for Masonry Buildings
24
SIMPLIFIED PUSHOVER-BASED EARTHQUAKE LOSS ASSESSMENT (SP-BELA) METHOD FOR MASONRY BUILDINGS Barbara Borzi, 1 Helen Crowley, 1 and Rui Pinho 2 1 European Centre for Training and Research in Earthquake Engineering (EUCENTRE), Pavia, Italy 2 Universit ` a degli Studi di Pavia, Pavia, Italy A simplified pushover-based earthquake loss assessment (SP-BELA) method, which was originally developed to study the vulnerability of reinforced concrete buildings has been adapted in the current work to produce vulnerability curves for unreinforced masonry buildings. The main target of the current article is to adopt various components of existing methodologies, which define the capacity of masonry buildings, within the probabilistic framework of SP-BELA to generate vulnerability curves. In the current application, the curves have been calibrated using data related to the structural characteristics of Italian buildings. Although more data on the characteristics of masonry buildings is necessary to increase the confidence in the results presented herein, a validation exercise has nevertheless been carried out to compare the vulnerability curves with independent studies related to the vulnerability of masonry buildings. These preliminary results show that there is a good agreement between the vulnerability predictions, especially for those which apply to the Italian building stock. KEY WORDS: loss estimation, simplified pushover, vulnerability assessment, vulnerability curves, masonry buildings 1. INTRODUCTION Seismic vulnerability is a measure of how prone a building is to damage for a given severity of the ground shaking. The aim of much of the research work dedicated to this subject is to give a mathematical formulation to the vulnerability. The two most largely utilized formulations to describe the vulnerability are: damage probability matrices and vulnerability curves. A curve that describes the conditional probability of being in or exceeding a certain damage limit state for a selected intensity of the ground motion is a vulnerability curve. The same probability in discrete terms is a component of a damage probability matrix. The conditional probability is expressed as: P ik ¼ P½D d i S ¼ s k j (1) International Journal of Architectural Heritage, 2: 353–376, 2008 Copyright Ó Taylor & Francis Group, LLC ISSN: 1558-3058 print / 1558-3066 online DOI: 10.1080/15583050701828178 Address correspondence to Barbara Borzi, European Centre for Training and Research in Earthquake Engineering (EUCENTRE) , Via Ferrata 1, Pavia 27100, Italy. E-mail: barbara.borzi@eucentre.it Received 28 May 2007; accepted 27 November 2007. 353
-
Upload
independent -
Category
Documents
-
view
0 -
download
0
Transcript of Simplified Pushover-Based Earthquake Loss Assessment (SP-BELA) Method for Masonry Buildings

SIMPLIFIED PUSHOVER-BASED EARTHQUAKE LOSSASSESSMENT (SP-BELA) METHOD FOR MASONRYBUILDINGS
Barbara Borzi,1Helen Crowley,
1and Rui Pinho
2
1European Centre for Training and Research in Earthquake Engineering
(EUCENTRE), Pavia, Italy2Universita degli Studi di Pavia, Pavia, Italy
A simplified pushover-based earthquake loss assessment (SP-BELA) method, which was
originally developed to study the vulnerability of reinforced concrete buildings has been
adapted in the current work to produce vulnerability curves for unreinforced masonry
buildings. The main target of the current article is to adopt various components of existing
methodologies, which define the capacity of masonry buildings, within the probabilistic
framework of SP-BELA to generate vulnerability curves. In the current application, the
curves have been calibrated using data related to the structural characteristics of Italian
buildings. Although more data on the characteristics of masonry buildings is necessary to
increase the confidence in the results presented herein, a validation exercise has nevertheless
been carried out to compare the vulnerability curves with independent studies related to the
vulnerability of masonry buildings. These preliminary results show that there is a good
agreement between the vulnerability predictions, especially for those which apply to the
Italian building stock.
KEY WORDS: loss estimation, simplified pushover, vulnerability assessment,
vulnerability curves, masonry buildings
1. INTRODUCTION
Seismic vulnerability is a measure of how prone a building is to damage for agiven severity of the ground shaking. The aim of much of the research work dedicatedto this subject is to give amathematical formulation to the vulnerability. The twomostlargely utilized formulations to describe the vulnerability are: damage probabilitymatrices and vulnerability curves. A curve that describes the conditional probabilityof being in or exceeding a certain damage limit state for a selected intensity ofthe ground motion is a vulnerability curve. The same probability in discrete termsis a component of a damage probability matrix. The conditional probability isexpressed as:
Pik ¼ P½D � di S ¼ skj � (1)
International Journal of Architectural Heritage, 2: 353–376, 2008
Copyright � Taylor & Francis Group, LLC
ISSN: 1558-3058 print / 1558-3066 online
DOI: 10.1080/15583050701828178
Address correspondence to Barbara Borzi, European Centre for Training andResearch in Earthquake
Engineering (EUCENTRE) , Via Ferrata 1, Pavia 27100, Italy. E-mail: [email protected]
Received 28 May 2007; accepted 27 November 2007.
353
where Pik is the probability that the damage state di will be achieved or exceeded for aground motion severity sk and D and S are the variables representing the damage andthe severity of the input motion, respectively.
In this article, a simplified pushover-based earthquake loss assessment method(SP-BELA) for the definition of vulnerability curves is presented. Conceptually, themethod may be applied to any structural typology; however, it is employed herein tostudy the vulnerability of unreinforced masonry buildings. The application ofSP-BELA to nonseismically designed and seismically designed reinforced concretebuildings has already been published in the technical literature (Borzi et al., 2008).
The main components of the SP-BELA methodology for the definition of thestructural capacity of unreinforced buildings that fail as a consequence of an in-planefailure mechanism are:
� The definition of the capacity of a population of buildings based on a prototypestructure, which is carried out using a simplified pushover analysis to obtain thecollapse multiplier ( Equation 4). Other vulnerability methodologies presented in thetechnical literature based on the definition of collapse multiplier are the VULNUSmethod proposed by Bernardini et al. (1990) and the FaMIVEmethod proposed byD’Ayala and Speranza (2002) for unreinforced masonry and historical buildings,respectively. For reinforced concrete buildings, the use of a collapse multiplier in avulnerability methodology has been proposed by Cosenza et al. (2005). The equa-tion for the collapse multiplier used herein is taken from the work of Benedetti andPetrini (1984).
� A displacement-based methodology to compare the displacement capacity anddemand as proposed by Calvi (1999) and further developments of the methodologysuch as those included in DBELA (Pinho et al., 2002; Glaister and Pinho, 2003; andCrowley et al., 2004) mainly adopted for reinforced concrete buildings andMeBaSe Q2
(Restrepo-Velez and Magenes, 2004; 2005a; 2005b], for unreinforced masonrybuildings. Concepts from each of these aforementioned methodologies have beentaken to form the displacement-based framework used herein.
A pushover curve is defined in SP-BELA to combine the definition of thebuilding capacity through a collapse multiplier and the displacement capacity.The use of a pushover curve in a displacement based methodology for assess-ment has the advantage that the vibration period and the collapse mechanismcan be defined on the basis of pushover analysis results and are thus notassumed beforehand. Other methods that use pushover curves to characterizethe building capacity are: HAZUS 99 (Federal Emergency Management Agency[FEMA], 1999); Risk-UE (2001), which is the companion project of HAZUS 99for Europe; and the method proposed by Rossetto and Elnashai (2005), in whichan adaptive pushover technique was used. Although non-linear conventional oradaptive pushover analysis of numerical models of randomly varying buildingswould provide a more robust prediction of the structural capacity, in order toreduce the computational effort of the methodology it is necessary to usesimplified formulae to define the collapse multiplier and collapse mechanisms.Hence, although there are advantages with using pushover analysis in a displace-ment-based method, it should also be borne in mind that a number of simplifi-cations have been implemented herein to ensure computational efficiency.
354 B. BORZI ET AL.
INTERNATIONAL JOURNAL OF ARCHITECTURAL HERITAGE 2(4): 353–376
In the current version of SP-BELA, the input motion severity is describedthrough the peak ground acceleration (PGA) because this is consistent with theparameter commonly used for seismic zonation in current design codes. However,other engineering measures of input motion severity could be used. As a displacementmethod is adopted to decide whether a building will survive the input motion, adisplacement response spectral shape is anchored to each PGA value for which thevulnerability is evaluated. Thus, by adopting a spectral shape, the relationshipbetween the frequency content of the ground motion and the period of vibration ofdifferent classes of masonry buildings is taken into account.
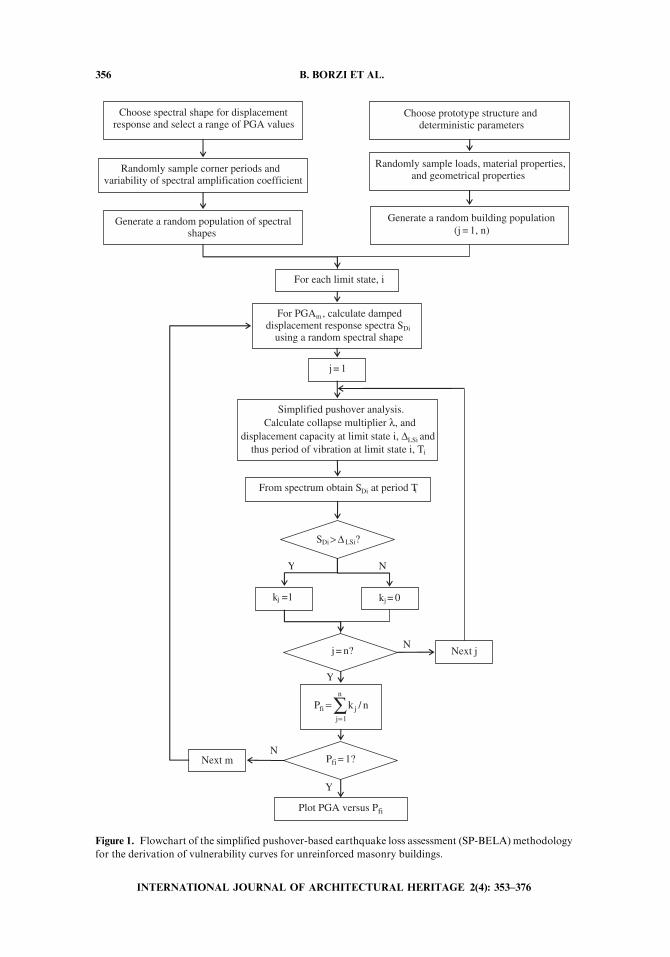
The probabilistic structure in SP-BELA is based on the definition of pushovercurves for each building in a randomly generated dataset. Other methods (e.g.,DBELA and MeBaSe as noted previously) have used the probabilistic framework ofthe first order reliability method (FORM) to calculate the variability in the capacityand the time-invariant reliability formula to convolve the variability in the displace-ment demand and capacity to calculate the probability of failure. SP-BELA imple-ments a simplified pushover methodology whereby a dataset of buildings is randomlydefined through Monte Carlo generation and a pushover analysis is undertaken foreach building of the dataset with a reasonable level of computational effort. Thedisplacement demand is calculated for each building and directly compared with thedisplacement capacity to define whether a given limit state is exceeded; then the totalnumber of buildings exceeding the limit state is calculated. A comparison between thecomputational effort required by the FORM and the SP-BELA probabilistic frame-work based on Monte Carlo simulation has shown that similar results are obtainedbut a considerable reduction of central processing unit runtime is observed with thelatter method. A further advantage of the SP-BELA probabilistic method is that thedimensions of the building dataset can be updated taking into account the fact that,for a certain input motion severity, some buildings survive the lower damage limitconditions and thus should not be considered in the calculation of probability excee-dance for the subsequent limit states (LS).In another regard, when FORM is used, thesame sample size (100%) is used for the probability of exceedance calculation for eachlimit state. To better explain the SP-BELA methodology, the flowchart of Figure 1 ispresented.
2. STRUCTURAL CAPACITY ASSESSMENT
Unreinforced masonry buildings can fail as a consequence of in-plane or out-of-plane failure mechanisms. In the following, the procedure implemented in SP-BELAto define the aforementioned mechanisms is described. The failure mechanisms areassumed to be uncoupled; this assumption is supported by the observed failure ofunreinforcedmasonry during past earthquakes, in which either one or the other failuremechanism has taken place without evidence of interaction.
2.1. In-Plane Failure Mechanism
For unreinforced masonry buildings, which fail as a consequence of an in-planefailure mechanism, the structural capacity can be well represented through a pushovercurve, which represents the base shear force of the structure under a lateral distribu-tion of forces versus the displacement at a control point. When pushover curves are
SP-BELA METHOD FOR MASONRY BUILDINGS 355
INTERNATIONAL JOURNAL OF ARCHITECTURAL HERITAGE 2(4): 353–376
Y
N
Y
N
Y N
Choose prototype structure and deterministic parameters
Randomly sample loads, material properties, and geometrical properties
Generate a random building population (j = 1, n)
j= 1
Randomly sample corner periods and variability of spectral amplification coefficient
Simplified pushover analysis.Calculate collapse multiplier λ, and
displacement capacity at limit state i, ΔLSi and thus period of vibration at limit state i, Ti
kj =1 kj = 0
SDi > Δ LSi?
n/kPn
1jjfi ∑
=
=
From spectrum obtain SDi at period Ti
Choose spectral shape for displacement response and select a range of PGA values
Generate a random population of spectral shapes
Pfi = 1?
For PGAm, calculate damped displacement response spectra SDi
using a random spectral shape
For each limit state, i
j = n? Next j
Next m
Plot PGA versus Pfi
Figure 1. Flowchart of the simplified pushover-based earthquake loss assessment (SP-BELA)methodology
for the derivation of vulnerability curves for unreinforced masonry buildings.
356 B. BORZI ET AL.
INTERNATIONAL JOURNAL OF ARCHITECTURAL HERITAGE 2(4): 353–376

used in a probabilistic framework for the definition of the vulnerability of a certainstructural type, an accurate definition of the capacity curve is not required; thus, asimplified methodology for the calculation of pushover curves can be adopted, asalready described in Borzi et al. (2008) for reinforced concrete buildings. Pushoveranalysis can therefore be undertaken for a large number of buildings with reasonablecomputational effort. During the analysis, the forces increase until the structurereaches a collapse limit condition. The pushover curve is idealized in the simplifiedprocedure through a bilinear curve, and an elastic perfectly plastic behavior isassumed. As a consequence, to define the pushover curve, only the collapse multiplierand the displacement capacities need to be calculated (Figure 2). On the pushovercurve, the displacement capacity can be related to damage conditions that are identifi-able LS as further explained in section 2.1.1 of this article.
2.1.1. Limit State (LS) Definition Three LS conditions have been consideredherein for unreinforced masonry buildings: light damage, significant damage, andcollapse. The light-damage limit condition refers to the situation in which the buildingcan be used after the earthquake without the need for repair and/or strengthening.Beyond the limit condition of significant damage, the building cannot be used after theearthquake without strengthening. Furthermore, this level of damage is such that itmight not be economically advantageous to repair the building. The life safety limitcondition is nevertheless respected, whereas if the collapse limit condition is achieved,the building becomes unsafe for its occupants as it is not capable of sustaining anyfurther lateral force or the gravity loads for which it has been designed.
The damage of masonry structures is usually related to interstory drift capacity(e.g. Calvi, 1999; Restrepo-Velez and Magenes, 2004]. For masonry structures, theselimit conditions have been identified through results from experimental tests. Eachlimit condition has been expressed through a probabilistic distribution, which isneeded when using a probabilistic assessment procedure.
The adopted numerical limits of the interstory drift are summarized in thefollowing bullet points:
1. Light damage limit state (LS1): an average drift of 0.13% with a coefficient ofvariation (cov) of 35% and a normal distribution can be used to identify the lightdamage limit condition (Abrams, 1997; Magenes et al., 1997; Calvi, 1999; Restrepo-Velez, 2003; Ordinanza del Presidente del Consiglio dei Ministri [OPCM], 2003).
λ
Δ
Col
laps
e m
ulti
plie
r
Δy = Δ Δ Δsignificant damage
collapselight damage
Figure 2. Graph of the capacity curve for elastic perfectly plastic structural behavior.
SP-BELA METHOD FOR MASONRY BUILDINGS 357
INTERNATIONAL JOURNAL OF ARCHITECTURAL HERITAGE 2(4): 353–376
2. Significant damage limit state (LS2): an average drift of 0.34% with a cov of 30%and a normal distribution can be used to identify the significant damage limitcondition (Abrams, 1997; Magenes et al., 1997; Calvi, 1999; Restrepo-Velez, 2003;OPCM, 2003).
3. Collapse limit condition (LS3): on the basis of experimental test results, it is notappropriate to identify only a single drift limit for the collapse limit condition forall types of unreinforced masonry.
� For brick masonry with a low percentage of voids (i.e., void percentage ,55%),an average drift of 0.72% and a cov of 35% with a normal distribution isconsidered (Anthoine et al., 1994; Bosiljkov et al., 2003).
� For brick masonry with a high percentage of voids (i.e., void percentage .55%),an adequate number of experimental tests were not available. Hence, the valuessuggested by Restrepo-Velez (2003) for masonry in general have been assumed.An average value of 0.45% with a cov of 30% and a normal distribution isconsidered. To validate this assumption, experimental test results in which thedrift has been pushed to 0.30% have shown that masonry walls in bricks with ahigh percentage of voids do not collapse.
� For masonry in natural stone, an average drift of 0.61% and a cov of 25%with anormal distribution can be assumed (Tomazevic et al., 1992).
2.1.2. Definition of Pushover Curve A masonry wall is able to resist lateral in-plane forces with a combination of flexural, shear, and rocking mechanisms. Ingeneral, in squat walls there will be a larger contribution of the shear mechan-ism, whereas in slender walls, flexural and rocking mechanisms will tend to beactivated. A further classification of the shear failure mechanism can be madebetween that which produces diagonal cracks in the mortar around thebricks or across the bricks (as a function of the relative resistance of the mortarand the bricks) and that which produces horizontal cracks in the mortar alongthe bed joints. A valuable description of the aforementioned failure mechan-isms is documented in Magenes et al. (2000) and Restrepo-Velez and Magenes(2004).
The analysis methodology proposed herein uses the definition of a single-degree-of-freedom (SDOF) system, which is equivalent to the original multi-degree-of-freedom(MDOF) system in terms of mass, stiffness, and displacement capacity. The originalMDOF system has masses (termed mi ) that account for the mass of the floor slabs andmasonry and is subjected to lateral forces (Fi), which for masonry buildings with lessthan five stories (which is an upper limit as a consequence of the structural limits interms of bearing capacity of the material), can be assumed linearly distributed along thebuilding height.
With the objective of defining the displacement capacity of the SDOF system, adeformed shape should be assumed for each limit state condition. Within the elasticrange, a linear deformed shape is considered, whereas for post-yield limit states, a soft-storey mechanism is predicted (Calvi, 1999). It is assumed that the damage will beconcentrated within a certain height (hp) as shown in Figure 3.
Once the deformed shape has been assumed, the displacement capacityassociated with the limit conditions is calculated for the drift values reported in
358 B. BORZI ET AL.
INTERNATIONAL JOURNAL OF ARCHITECTURAL HERITAGE 2(4): 353–376

section 2.1.1 of this article. The displacement capacity of the SDOF system at the limitof elastic behavior (LS1) is given by the equation:
�y ¼ k1 hT dy (2)
where k1 is the coefficient that is multiplied by hT, the total building height, to obtainthe equivalent height of the SDOF system and dy is the drift at the limit of elasticbehavior (Restrepo-Velez and Magenes, 2004). If the building has a regular distribu-tion of masses along the height, k1 is approximately 0.67.
As a consequence of the assumption of a soft-story mechanism, the plasticdeformations are concentrated within the height hp, which is considered herein tocorrespond to the interstory height. For buildings with a large number of openings,the soft-story mechanism should develop over a height that is greater than the openingheight and less than the interstory height. In this case, the use of the interstory heightwould not be conservative because it would increase the building displacement capa-city. This assumption is, however, acceptable because it compensates for the conser-vative assumptions that are typical within a mechanics-based vulnerability methodwhere many contributions to the structural building resistance (e.g., contribution ofpartition walls) are neglected. Therefore, the displacement capacity for the limit statescorresponding to a structure entering the non-linear range is:
�LSi ¼ k1 hT dy þ k2 ðdLSi � dyÞhp (3)
where dLSi is the drift limit state capacity reported in section 2.1.1 of this article.For the evaluation of displacement capacity in the equations noted previously,
the coefficients k1 and k2 need to be defined. For masses uniformly distributed alongthe building height and for walls with amass equal to 30%of the floormass, Restrepo-Velez (2003) has calculated k1 and k2, as summarized in Table 1. These values are validfor the cases where collapse mechanisms are activated within the first two-thirds of thebuilding height.
Once the displacement capacity has been defined, to fully describe the pushovercurve the collapse multipliers have to be calculated. As suggested by Restrepo-Velez
Fi
hT
hi
mi me
he hp
Linear defomed shape
Soft storey defomed shape
Figure 3. Illustration of the multi-degree-of-freedom (MDOF) system and corresponding single-
degree-of-freedom (SDOF) system.
SP-BELA METHOD FOR MASONRY BUILDINGS 359
INTERNATIONAL JOURNAL OF ARCHITECTURAL HERITAGE 2(4): 353–376

andMagenes (2004), the formula given by Benedetti and Petrini (1984) can be used forthe collapse multiplier li at the interstory i:
li ¼1
WT
Pnk¼i
hkWkPnj¼1
hjWj
Ai�ki 1þ
Pnk¼i
Wk
1:5�kiAið1þ �ABÞ
2664
37751=2
(4)
where:
WT is the total weight of the building,Wi is the weight of the floor i, tki is the shearresistance of the masonry at floor i, Ai is the total area of resisting walls at level i in thedirection of application of loads, �AB is the ratio between Ai and Bi with Bi being themaximum area between the area of wall in the loaded direction and the orthogonaldirection, and n is the number of stories.
The building collapse multiplier will be the smallest amongst all of the calculated li:
l ¼ min flig (5)
The formula of li given by Benedetti and Petrini (1984) neglects 3D effects such astorsion due to an eccentricity between the centre of stiffness and the centre of mass ofthe building. Restrepo- Velez and Magenes (2004) have therefore suggested theintroduction of a correction coefficient expressed by:
l ¼ ��1c min flig (6)
The correction coefficient fc has been defined through comparison with results of finiteelement analyses on three-dimensional buildings with the code SAM (SimplifiedAnalysis of Masonry) that has been developed and verified by Magenes and DellaFontana (1998) and Magenes et al. (2000), among others. Through a regressionanalysis on the obtained results, the following formulation of �c has been obtainedby Restrepo-Velez and Magenes (2004):
�c ¼ 5:5�kiLW
LT
þ 0:5 (7)
where LT is the total length of the walls in the direction of loads, and LW is the totallength of the walls without openings in the loaded direction.
Table 1. k1 and k2 coefficients as a function of number of
floors (Restrepo- Velez, 2003)
Floors k1 k2
1 0.790 0.967
2 0.718 0.950
3 0.698 0.918
4 0.689 0.916
5 0.684 0.900
6 0.681 0.881
360 B. BORZI ET AL.
INTERNATIONAL JOURNAL OF ARCHITECTURAL HERITAGE 2(4): 353–376

2.2. Out-of-Plane Collapse Failure Mechanism
In addition to in-plane failure mechanisms, out-of-plane failure mechan-isms play a fundamental role in the overall structural behavior of masonrypanels and their interaction with the building. The nature of the out-of-planefailure mechanism is very complex and is related to the situation of walls panelsthat are not well restrained by structural elements such as tie rods or tie beams.As a consequence of the out-of-plane loads due to the seismic input, the panelscrack and fail with a rocking mechanism. In order to give an overview of thepossible out-of-plane failure mechanisms, various types of collapse mechanismsare shown in Figure 4.
A
CD E
F
B2B1
G
H
1 2 3
Figure 4. Schematic illustration of the types of out of plane collapse failure mechanisms (Restrepo-Velez
and Magenes, 2004; adapted from D’Ayala and Speranza, 2003).
SP-BELA METHOD FOR MASONRY BUILDINGS 361
INTERNATIONAL JOURNAL OF ARCHITECTURAL HERITAGE 2(4): 353–376

The force versus displacement curve that describes the out-of-plane failuremechanism is shown in Figure 5; this relationship is described in more detail inDoherty et al. (2002). In a similar manner to the pushover curve for the in-plane response, this curve represents the force-displacement capacity of anequivalent SDOF system that describes the out-of-plane seismic behavior ofthe wall.
In Figure 5, F0¼ lW is the force corresponding to the activation of therocking mechanism and �u is the displacement corresponding to the systeminstability under the action of static loads. The line connecting F0 and �u
assumes that the system is already cracked before the activation of the motionand the parts of wall panels participating to rocking behave as rigid bodies. Inanother regard, the wall behavior is not exactly rigid—the wall could initially beuncracked; and the point around which the rocking is activated has finitedimensions. For the aforementioned reasons, the real behavior is better repre-sented by the dashed line in Figure 5, which could be idealized with a linear formas shown in the same Figure.
For the out-of-plane mechanisms the only limit condition that can currentlybe considered is between collapse and no-collapse; therefore, the limit statedefines the boundary between a stable and unstable wall. The relationships forthe definition of the parameters in the capacity curve of Figure 5 for each typeof out-of-plane collapse mechanism are documented and validated in Restrepo-Velez and Magenes (2004).
To define in SP-BELA the out-of-plane failure mechanism, only the bound-ary conditions of walls supported at the base and free at the top, and wallssupported at both sides with or without axial load are considered. Complex out-of-plane failure mechanism such as those described in Restrepo-Velez andMagenes (2004) are not included as a consequence of the limited informationwhich is generally available at an urban scale.
Figure 5. Graph of the force-displacement curve for out-of-plane collapse failure mechanism
(Doherty et al., 2002).
362 B. BORZI ET AL.
INTERNATIONAL JOURNAL OF ARCHITECTURAL HERITAGE 2(4): 353–376

In Equations 8 and 9, the displacement capacity and the period of vibration forthe selected boundary conditions are defined, respectively as:
�SL ¼ �u�u ¼�u1þ 0; 75�
1þ�t;Wall supported at both ends with concentrated axial
load on the top
�SL ¼ �u�u ¼�ut;Wall supported at both ends with distributed axial load on the top
�SL ¼ �u�u ¼�ut;Wall supported at the base and free at the top end ð8Þ
TSL ¼
ffiffiffiffiffiffiffiffiffiffiffiffiffiffiffiffiffiffiffiffiffiffiffiffiffiffiffiffiffiffiffiffiffiffiffiffiffiffiffi2�2�2�SLh
�uð1��2Þð1þ�Þgt
s(9)
where t is wall thickness; �u is a safety coefficient that varies between 0.8 and 1(Restrepo-Velez, 2003); C is the ratio between panel axial load and weight of rockinghalf-panel; h is panel height; and �2 is �2/�u ratio that can be defined on the basis ofmortar mechanical characteristics (Doherty et al., 2002).
2.3. Random Variables to Describe Uncertainty in Building Characteristics
In Table 2 the random variables used in SP-BELA to define the structuralcapacity of masonry buildings are summarized. Themean values, standard deviations,and distribution laws, along with the references for each data are all documented. Forthose random variables that feature a constant distribution, the maximum and theminimum values of the distribution are summarized in Table 2.
The number of floors is not the same for all types of masonry buildings becausedifferent kinds of masonry have different bearing capacities and hence may beemployed in buildings with equally varied heights. There is, therefore, a differentupper limit on the number of floors for each masonry type.
In Table 2, �A and �B are the wall percentages on building surface AM such thatAi¼ �A AM and Bi¼ �B AM, respectively, �M is the masonry self weight, hi is theinterstory height, Mi is the unitary mass of the floor slab without accounting for liveload, which is assumed herein to be 200 kg/m2 for the floor and 160 kg/m2 for the roof(snow load). The height hp has been assumed to be equal to the height of the panel forthe analyses carried out herein.
Monte Carlo simulations have been used for the generation of all randomvariables and for those with a normal distribution, the Latin Hypercube algo-rithm — a technique that allows a better representation of the sample in the lowprobability region of the distribution (Helton and Davis, 2003) — has beenemployed.
3. DEFINITION OF DISPLACEMENT DEMAND
3.1. Displacement Spectral Shape for In-Plane-Failure Mechanism
In SP-BELA, a displacement spectral shape is anchored to the PGA values forwhich the vulnerability is calculated. The spectral shape can be defined using theacceleration spectrum proposed by the Italian seismic design regulations (OPCM,
SP-BELA METHOD FOR MASONRY BUILDINGS 363
INTERNATIONAL JOURNAL OF ARCHITECTURAL HERITAGE 2(4): 353–376

Table 2. Random variables used in simplified pushover-based earthquake loss assessment (SP-BELA)
method for the definition of structural capacity of masonry buildings
Variable Masonry type Mean (m)Standard
deviaion (s) Distribution Reference
In-plane failure mechanism
�M Low-quality
natural stone
19 kN/m3 — — Italian
regulations
(OPCM 3274
(2003))
Good-quality
natural stone
20 kN/m3 — —
Bricks with high
% of voids
9 kN/m3 — —
Bricks with low
% of voids
18 kN/m3 — —
�A Low-quality
natural stone
2 story 0.099 0.034 Normal Data collection
forms (GNDT,
Gruppo Nazionale
Difesa Terremoti,
2nd level for
masonry)
3 story 0.104 0.028 Normal
4 story 0.115 0.038 Normal
5 story — — —
Good quality
natural stone
2 story 0.088 0.035 Normal
3 story 0.097 0.034 Normal
4 story 0.101 0.038 Normal
5 story — — —
Bricks with
a high %
of voids
2 story 0.053 0.022 Normal
3 story 0.070 0.040 Normal
4 story — — —
5 story — — —
Bricks with
a low %
of voids
2 story 0.056 0.017 Normal
3 story 0.056 0.013 Normal
4 story 0.056* 0.026 Normal
5 story 0.057 0.027 Normal
�B Low quality
natural stone
2 story 0.140 0.056 Normal Data collection
forms (GNDT
2nd level for
masonry)
3 story 0.149 0.037 Normal
4 story 0.176 0.09 Normal
5 story — — —
Good quality
natural stone
2 story 0.129 0.055 Normal
3 story 0.134 0.045 Normal
4 story 0.132 0.050 Normal
5 story — — —
Bricks with
a high %
of voids
2 story 0.061 0.016 Normal
3 story 0.093 0.050 Normal
4 story — — —
5 story — — —
Bricks with
a low
% of voids
2 story 0.074 0.027 Normal
3 story 0.082 0.027 Normal
4 story 0.082* 0.030 Normal
5 story 0.087 0.056 Normal
Mi Roof Wood 300 kg/m2 50 kg/m2 Normal Italian
structural typeRC-steel 500 kg/m2 100 kg/m2 Normal
Floor type Wood 450 kg/m2 100 kg/m2 Normal
RC-steel 650 kg/m2 100 kg/m2 Normal
tki Low quality
natural stone
30000 N/m2 14000 N/m2 Normal Data collection
forms (GNDT
(Continued)
364 B. BORZI ET AL.
INTERNATIONAL JOURNAL OF ARCHITECTURAL HERITAGE 2(4): 353–376

2003), multiplied by (T/2�)2 to give the displacement spectrum for 5% damping (asnoted in the following equations [Equations 10–13]). This displacement spectrumdiffers from that proposed in Eurocode 8 (CEN, 2003) because the displacementresponse does not reduce to the peak ground displacement at long periods, butremains constant after 2s.
0 � T < TB SDðTÞ ¼ SSTag 1þ T
TB� � � �� 1ð Þ
� �T
2�
� �2
(10)
TB � T < TC SDðTÞ ¼ SSTag � � � �� � T
2�
� �2
(11)
TC � T < TD SDðTÞ ¼ SSTag � � � �TC
T�
� �� �T
2�
� �2
(12)
TD � T SDðTÞ ¼ SSTag � � � � �TCTD
T2
� �� �T
2�
� �2
(13)
Table 2. (Continued)
Variable Masonry type Mean (m)Standard
deviaion (s) Distribution Reference
2nd level for
masonry)
Good quality
natural stone
45000 N/m2 19000 N/m2 Normal
Bricks with
a high %
of voids
105000 N/m2 40000 N/m2 Normal
Bricks with
a low %
of voids
128000 N/m2 59000 N/m2 Normal
hp¼ hpan. All wall types 3.75 m 0.5 m Lognormal Italian
structural type
�AB All wall types 2.50 0.20 Normal Restrepo-
Velez (2003)LT/LW All wall types 0.66 0.10 Normal
Out-of-plane failure mechanism
tpanel Stones 0.4 m 0.05 m Normal Italian
structural typeBricks 0.3 m 0.05 m Normal
�2¼�2/�u All wall types 28% 50% Constant Restrepo-
Velez (2003)
c All wall types 0.50 0.20 Normal
�u All wall types 0.8 1.0 Constant
* The mean value of � for 4-story buildings has been assumed to be equal to that of its 3-story counterparts,
given that the collected field data (based onwhich the values in this table have been produced) for this type of
structures featured some inconsistencies (it gave a value of � for buildings with 4 stories that was lower than
those with 3 stories).
SP-BELA METHOD FOR MASONRY BUILDINGS 365
INTERNATIONAL JOURNAL OF ARCHITECTURAL HERITAGE 2(4): 353–376
where:
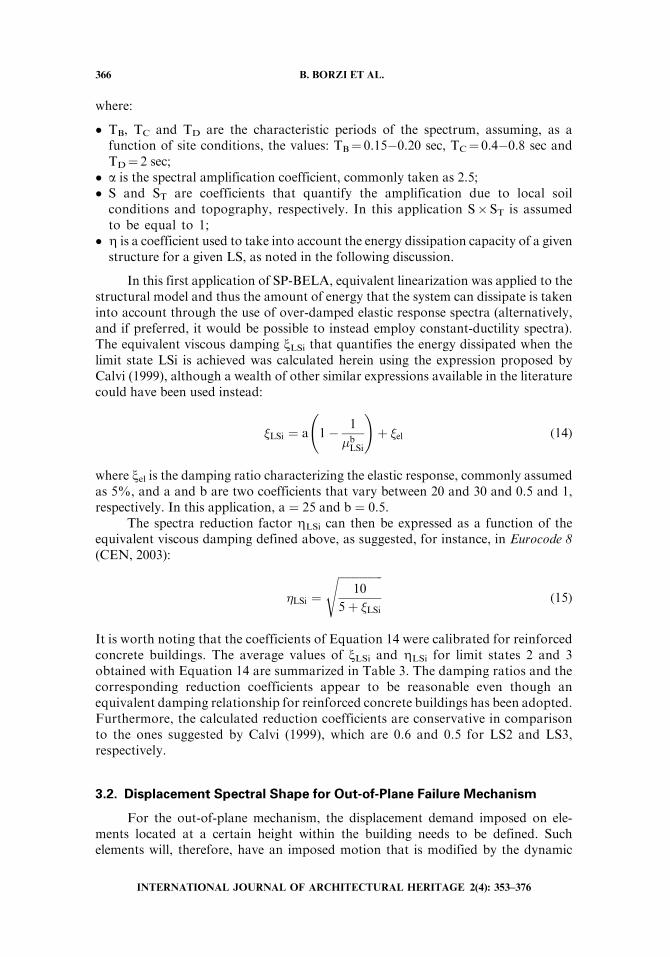
� TB, TC and TD are the characteristic periods of the spectrum, assuming, as afunction of site conditions, the values: TB¼ 0.15�0.20 sec, TC¼ 0.4�0.8 sec andTD¼ 2 sec;
� a is the spectral amplification coefficient, commonly taken as 2.5;� S and ST are coefficients that quantify the amplification due to local soil
conditions and topography, respectively. In this application S� ST is assumedto be equal to 1;
� Z is a coefficient used to take into account the energy dissipation capacity of a givenstructure for a given LS, as noted in the following discussion.
In this first application of SP-BELA, equivalent linearization was applied to thestructural model and thus the amount of energy that the system can dissipate is takeninto account through the use of over-damped elastic response spectra (alternatively,and if preferred, it would be possible to instead employ constant-ductility spectra).The equivalent viscous damping xLSi that quantifies the energy dissipated when thelimit state LSi is achieved was calculated herein using the expression proposed byCalvi (1999), although a wealth of other similar expressions available in the literaturecould have been used instead:
LSi ¼ a 1� 1
bLSi
!þ el (14)
where xel is the damping ratio characterizing the elastic response, commonly assumedas 5%, and a and b are two coefficients that vary between 20 and 30 and 0.5 and 1,respectively. In this application, a ¼ 25 and b ¼ 0.5.
The spectra reduction factor ZLSi can then be expressed as a function of theequivalent viscous damping defined above, as suggested, for instance, in Eurocode 8(CEN, 2003):
�LSi ¼ffiffiffiffiffiffiffiffiffiffiffiffiffiffiffiffi
10
5þ LSi
s(15)
It is worth noting that the coefficients of Equation 14 were calibrated for reinforcedconcrete buildings. The average values of xLSi and ZLSi for limit states 2 and 3obtained with Equation 14 are summarized in Table 3. The damping ratios and thecorresponding reduction coefficients appear to be reasonable even though anequivalent damping relationship for reinforced concrete buildings has been adopted.Furthermore, the calculated reduction coefficients are conservative in comparisonto the ones suggested by Calvi (1999), which are 0.6 and 0.5 for LS2 and LS3,respectively.
3.2. Displacement Spectral Shape for Out-of-Plane Failure Mechanism
For the out-of-plane mechanism, the displacement demand imposed on ele-ments located at a certain height within the building needs to be defined. Suchelements will, therefore, have an imposed motion that is modified by the dynamic
366 B. BORZI ET AL.
INTERNATIONAL JOURNAL OF ARCHITECTURAL HERITAGE 2(4): 353–376

response of the building itself. Thus, in terms of input motion, the masonry panel forthe out-of-plane collapse can be treated in the same way as non-structural elements.Eurocode8 (CEN, 2003) suggests a relationship for the acceleration spectrum, which isto be used to design and verify nonstructural elements:
SAðTÞ ¼ SSTPGA3 1þ z=Hð Þ
1þ 1� Ta=Tð Þ2� 0:5
" #(16)
where z is the height within the building where the element is located, H is thebuilding height and Ta and T are the vibration period of the non-structuralelement (or panel, in this case) and the building, respectively. On the basis of therelationship suggested by Eurocode8, the acceleration imposed on the masonrypanel by the earthquake can thus be calculated. However, a displacement-basedprocedure is implemented in SP-BELA to decide whether or not the panel willrock. The rule to transform the acceleration spectrum into a displacementspectrum (i.e. multiplying by (T/2�)2), is also adopted herein for spectra relatedto elements that experience an input motion that has been modified by thedynamic properties of the building. It is worth noting that this relationshipbetween the acceleration and displacement spectrum has not been sufficientlyverified for nonstructural elements.
In SP-BELA, the following assumptions are made:
� The ratio z/H is equal to 1, as the panels that tend to rock first are the oneslocated on the upper floors as they generally experience the maximum dynamicamplification and have the minimum thickness as a consequence of gravityload design.
Table 3. Average values of damping ratio and corresponding reduction coefficient for each masonry type
Masonry type Stories xLS2 xLS3 ZLS2 ZLS3
Low-quality natural stone 2 story 13.8% 17.3% 0.73 0.67
3 story 11.4% 15.4% 0.78 0.70
4 story 10.6% 14.3% 0.80 0.72
5 story — — — —
Good-quality natural stone 2 story 13.8% 18.0% 0.73 0.66
3 story 11.9% 15.4% 0.77 0.70
4 story 10.6% 14.3% 0.80 0.72
5 story — — — —
Bricks with a high % of voids 2 story 13.8% 15.4% 0.73 0.70
3 story 11.9% 13.8% 0.77 0.73
4 story — — — —
5 story — — — —
Bricks with a low % of voids 2 story 13.8% 18.7% 0.73 0.65
3 story 11.9% 16.6% 0.77 0.68
4 story 10.6% 14.8% 0.80 0.71
5 story 9.5% 13.8% 0.83 0.73
SP-BELA METHOD FOR MASONRY BUILDINGS 367
INTERNATIONAL JOURNAL OF ARCHITECTURAL HERITAGE 2(4): 353–376
� The elastic period of vibration of the building can be used in Equation 16. This isdue to the fact that, for the range of periods that characterize masonry buildings, theelastic period corresponds to the maximum dynamic amplification.
3.3. Random Variables to Describe Uncertainty in Displacement Demand
In the probabilistic procedure used to calculate the vulnerability curves, theuncertainty in the definition of the demand is accounted for by assuming the following:
� The corner periods of the spectrum are random variables having a constant dis-tribution between the maximum and the minimum values (for TB the distribution isbetween 0.15 and 0.20 sec and for TC the distribution is between 0.4 and 0.8 sec).
� The coefficienta (spectral amplification coefficient) has been taken as a randomvariablewith a mean value of 2.5, a standard deviation of 1.1 and a logarithmic distribution.
The sampling of random variables with a normal distribution to describe the uncer-tainty in the displacement demand has been generated using the Latin hypercubealgorithm (Helton and Davies, 2003), as mentioned previously.
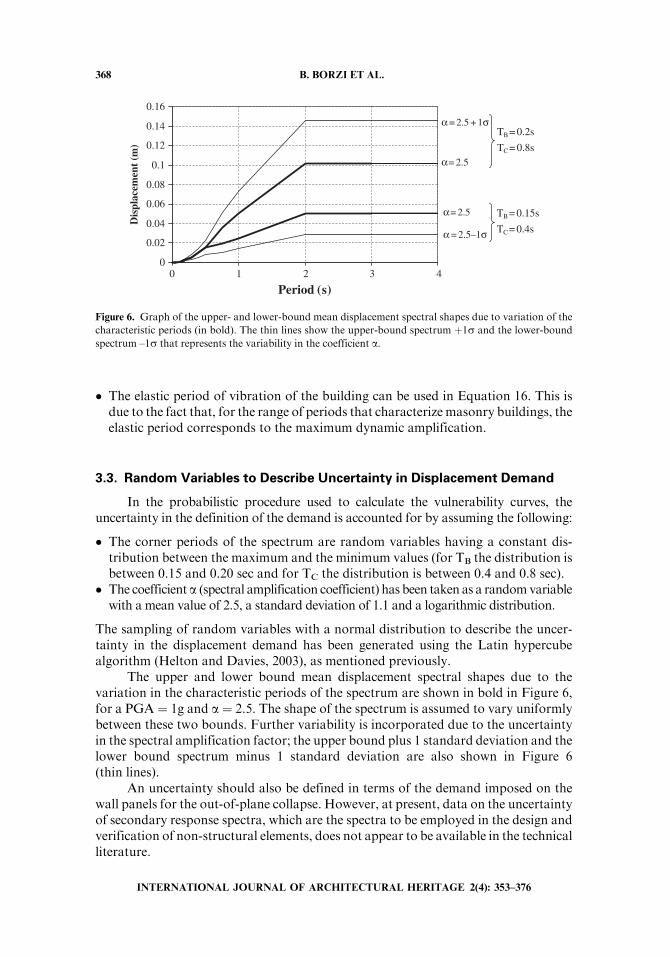
The upper and lower bound mean displacement spectral shapes due to thevariation in the characteristic periods of the spectrum are shown in bold in Figure 6,for a PGA ¼ 1g and a ¼ 2.5. The shape of the spectrum is assumed to vary uniformlybetween these two bounds. Further variability is incorporated due to the uncertaintyin the spectral amplification factor; the upper bound plus 1 standard deviation and thelower bound spectrum minus 1 standard deviation are also shown in Figure 6(thin lines).
An uncertainty should also be defined in terms of the demand imposed on thewall panels for the out-of-plane collapse. However, at present, data on the uncertaintyof secondary response spectra, which are the spectra to be employed in the design andverification of non-structural elements, does not appear to be available in the technicalliterature.
0
0.02
0.04
0.06
0.08
0.1
0.12
0.14
0.16
0 1 2 3 4
Period (s)
Dis
plac
emen
t (m
)
α = 2.5–1σ
TB = 0.15s
TC = 0.4s
α = 2.5
α = 2.5
α = 2.5 + 1σTB = 0.2s
TC = 0.8s
Figure 6. Graph of the upper- and lower-bound mean displacement spectral shapes due to variation of the
characteristic periods (in bold). The thin lines show the upper-bound spectrum þ1s and the lower-bound
spectrum –1s that represents the variability in the coefficient a.
368 B. BORZI ET AL.
INTERNATIONAL JOURNAL OF ARCHITECTURAL HERITAGE 2(4): 353–376

4. VULNERABILITY CURVES
4.1. Derivation of Vulnerability Curves
Vulnerability curves have been calculated with SP-BELA for all masonry types(i.e., low quality natural stone, good quality natural stone, bricks with a high percentof voids and bricks with a low percent of voids) and for each number of floors (up to alimit which depends on the type of masonry). The curves have all been derivedconsidering reinforced-concrete floor slabs because in the simplified model implemen-ted in SP-BELA the floor slab type only has an influence in terms of the floor mass;therefore, to be on the conservative side, a larger mass has been included.Furthermore, very often the timber beams in existing buildings have been reinforcedthrough collaborating RC slabs to reduce their flexibility, which would no longer becompatible with today’s construction standards.
The vulnerability curves are shown in Figures 7–10. These figures highlight thatfor all the masonry types the vulnerability increases with the number of floors. For therange of vibration periods that characterize masonry buildings, an increase in heightcorresponds to an increase in the displacement capacity, but the displacement demandgrows at a higher rate.
2 storeys
010
2030
4050
6070
8090
100
PGA [g]
Pro
babi
lity
LS1 LS2 LS3 LSout-of-plane LS1 LS2 LS3 LSout-of-plane
4 storeys
0 0.05 0.1 0.15 0.2 0.25 0.30
10
2030
4050
6070
8090
100
PGA [g]
Pro
babi
lity
0 0.05 0.1 0.15 0.2 0.25 0.3
Figure 8. Graphs of the vulnerability curves for high quality natural stone masonry.
2 storeys
010
2030
4050
6070
8090
100
0 0.05 0.1 0.15 0.2 0.25 0.3
PGA [g]
Pro
babi
lity
010
2030
4050
6070
8090
100
0 0.05 0.1 0.15 0.2 0.25 0.3
PGA [g]
Pro
babi
lity
LS1 LS2 LS3 LSout-of-plane LS1 LS2 LS3 LSout-of-plane
4 storeys
Figure 7. Graphs of the vulnerability curves for low quality natural stone masonry.
SP-BELA METHOD FOR MASONRY BUILDINGS 369
INTERNATIONAL JOURNAL OF ARCHITECTURAL HERITAGE 2(4): 353–376

In another regard, the vulnerability does not increase when the quality of themasonry reduces, because the reduction of resistance is compensated by an increase ofthe wall resisting area. As a consequence, such an effect produces:
� an increase of the mass to be considered in Equation 4 that corresponds to anincrease of the vulnerability;
� an increase of the shear resistance as a consequence of higher resisting area andhigher axial load on the walls.
The overall effect of these factors leads to a decrease in the vulnerability based on thedata available herein (Table 2). However, it is worth noting that not enough data wereavailable to define all the random variables employed to describe the building
2 storeys
0 0.05 0.1 0.15 0.2 0.25 0.3
0 0.05 0.1 0.15 0.2 0.25 0.3 0 0.05 0.1 0.15 0.2 0.25 0.3
0 0.05 0.1 0.15 0.2 0.25 0.3
PGA [g]
0102030405060708090
100
Pro
babi
lity
0102030405060708090
100
Pro
babi
lity
0102030405060708090
100P
roba
bilit
y
0102030405060708090
100
Pro
babi
lity
LS1 LS2 LS3 LSout-of-plane
LS1 LS2 LS3 LSout-of-plane LS1 LS2 LS3 LSout-of-plane
LS1 LS2 LS3 LSout-of-plane
3 storeys
PGA [g]
4 storeys
PGA [g]
5 storeys
PGA [g]
Figure 10. Graphs of the Vulnerability curves for brick masonry with a low percentage of voids.
2 storeys
0
10
20
30
40
50
60
70
80
90
100
PGA [g]
Pro
babi
lity
LS1 LS2 LS3 LSout-of-plane LS1 LS2 LS3 LSout-of-plane
3 storeys
0 0.05 0.1 0.15 0.2 0.25 0.30
10
20
30
40
50
60
70
80
90
100
PGA [g]
Pro
babi
lity
0 0.05 0.1 0.15 0.2 0.25 0.3
Figure 9. Graphs of the vulnerability curves for brick masonry with a high percentage of voids.
370 B. BORZI ET AL.
INTERNATIONAL JOURNAL OF ARCHITECTURAL HERITAGE 2(4): 353–376
structural capacity and thus the use of different data may lead to different conclusionson the influence of the quality of the masonry. However, the main target of the currentarticle is not to suggest vulnerability curves but rather to describe the SP-BELAmechanics method for the vulnerability analysis of masonry buildings. One issueworth noting is that it has been found that these curves can be adequately representedusing a lognormal distribution which can be very useful when seismic risk analyses at aregional or national scale need to be carried out.
4.2. Comparison with Vulnerability Curves Obtained from Literature
Tovalidate the vulnerability curves produced for unreinforcedmasonry buildings,the SP-BELA curves have been compared with others already published in the technicalliterature. Only the collapse limit state is considered, as it is difficult to compare curvesfor other limit states when they have been derived from independent studies.
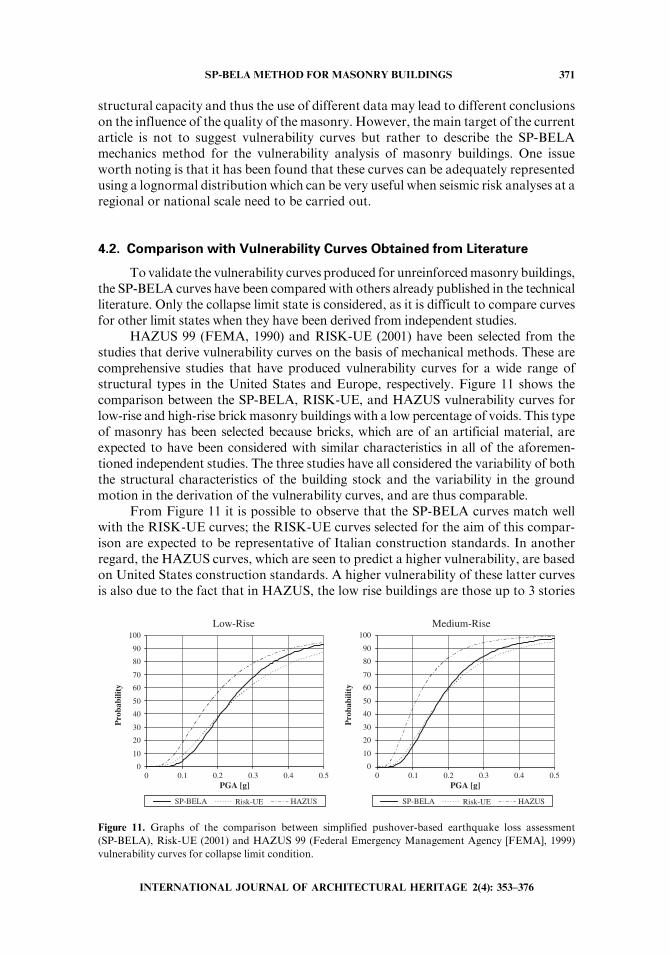
HAZUS 99 (FEMA, 1990) and RISK-UE (2001) have been selected from thestudies that derive vulnerability curves on the basis of mechanical methods. These arecomprehensive studies that have produced vulnerability curves for a wide range ofstructural types in the United States and Europe, respectively. Figure 11 shows thecomparison between the SP-BELA, RISK-UE, and HAZUS vulnerability curves forlow-rise and high-rise brickmasonry buildings with a low percentage of voids. This typeof masonry has been selected because bricks, which are of an artificial material, areexpected to have been considered with similar characteristics in all of the aforemen-tioned independent studies. The three studies have all considered the variability of boththe structural characteristics of the building stock and the variability in the groundmotion in the derivation of the vulnerability curves, and are thus comparable.
From Figure 11 it is possible to observe that the SP-BELA curves match wellwith the RISK-UE curves; the RISK-UE curves selected for the aim of this compar-ison are expected to be representative of Italian construction standards. In anotherregard, the HAZUS curves, which are seen to predict a higher vulnerability, are basedon United States construction standards. A higher vulnerability of these latter curvesis also due to the fact that in HAZUS, the low rise buildings are those up to 3 stories
Low-Rise
0
10
20
30
40
50
60
70
80
90
100
0 0.1 0.2 0.3 0.4 0.5 0 0.1 0.2 0.3 0.4 0.5PGA [g]
Pro
babi
lity
0
10
20
30
40
50
60
70
80
90
100
Pro
babi
lity
SP-BELA Risk-UE HAZUS SP-BELA Risk-UE HAZUS
Medium-Rise
PGA [g]
Figure 11. Graphs of the comparison between simplified pushover-based earthquake loss assessment
(SP-BELA), Risk-UE (2001) and HAZUS 99 (Federal Emergency Management Agency [FEMA], 1999)
vulnerability curves for collapse limit condition.
SP-BELA METHOD FOR MASONRY BUILDINGS 371
INTERNATIONAL JOURNAL OF ARCHITECTURAL HERITAGE 2(4): 353–376

whilst the medium rise are intended to be from four to seven stories. In another regard,in RISK-UE the low-rise buildings are up to 2 stories and the medium rise from threeto five stories and in SP-BELA, 2 stories have been used to represent low-rise and fourstories have been used to represent medium-rise buildings.
To further compare the SP-BELA vulnerability curves with others that are repre-sentative of the Italian construction standards, other Italian studies havebeen considered.The studies include those of Braga et al. (1982), Di Pasquale et al. (2005) andDolce et al.(2003).All the aforementioned studies haveproduceddamageprobabilitymatrices on thebasis of data collected from observed damage during past earthquakes in Italy.
Braga et al. (1982) proposed damage probability matrices based on the damage dataof Italian buildings after the 1980 Irpinia earthquake using the binomial distribution todescribe the damage distributions of a given vulnerability class (A, B, or C) for differentseismic intensities in terms of the MSK (Medveder-Sponheuer-Karnik) scale. Table 4specifies the correspondence between vulnerability classes A, B, and C and the struc-tural type. Di Pasquale et al. (2005) further developed these matrices by transformingthem from the MSK to the MCS (Mercalli-Cancani-Sieberg) intensity scale, for MCSfrom VI and IX, and changed the number of buildings to the number of dwellings sothat thematrices could be used in conjunctionwith the 1991 ItalianNational StatisticalOffice (ISTAT)1 data. To transform the damage probabilitymatrices into vulnerabilitycurves in which the earthquake severity parameter is given by PGA, the relationshipproposed by Guagenti and Petrini (1989) has been adopted herein:
ag ¼ exp ð0:602 IMCS � 7:073Þ (17)
where ag is the PGA in m/s2 and IMCS is the intensity based on the MCS scale.Dolce et al. (2003) have also adapted the damage probability matrices proposed
by Braga et al. (1982) and have added an additional vulnerability class D to representbuildings constructed to modern construction standards, or retrofitted. The matriceshave been kept in terms of the MSK intensity scale and thus the relationship usedherein to relate MSK to PGA is based on the proposal by Margottini et al. (1992) forregional intensity:
ag ¼4:864 � 100:179IMSK
980(18)
Table 4. Relationship between vulnerability class and structural type
Vertical Structure
Horizontal structure
Low-quality
masonry
Average-quality
masonry
Good-quality
masonry
Reinforced
concrete
Vaults/slabs and vaults A A A
Wood slabs with and without
connection beams
A A B
Steel slabs with and without
connection beams
B B C
Reinforced concrete slabs B C C C
Seismic designed buildings D D D D
1www.istat.it
372 B. BORZI ET AL.
INTERNATIONAL JOURNAL OF ARCHITECTURAL HERITAGE 2(4): 353–376

For the current comparison, the uncertainty in the relationships between inten-sity scales and PGA has been neglected, although it is recognized that there is alarge amount of scatter in these relationships. Figure 12 shows the comparisonbetween the SP-BELA curves and those based on the aforementioned Italianstudies; as the latter matrices have not be derived as a function of the number ofstories, they have been compared with the SP-BELA curves for each numbers ofstories from one to four.
From Figure 12 it can be observed that the vulnerability curves of SP-BELAmatch quite well with those from the observational data for vulnerability class A. Inanother regard, the SP-BELA curves are generally more conservative for vulnerabilityclass B. This comparison is, however, satisfactory considering the large variability inthe transformation of intensity to PGA and the fact that the empirical curves do nottake into account the number of stories; finally, it is worth noting that collapse in amechanics-based method is the achievement of a numerical drift limit and it might notactually correspond to the real collapse of the buildings.
5. CONCLUSIONS
Existing mechanics-based methodologies that define the capacity of masonrybuildings have been utilized in the current work for the definition of simplified
Vulnerability class A - Low quality natural stone
Di Pasquale et. al. [2005] Dolce et.al [2003]1 storey 2 storey3 storey 4 storey
Vulnerability class A – Bricks with high % of voids*
Di Pasquale et. al. [2005] Dolce et.al [2003]1 storey 2 storey3 storey
Vulnerability class B - High quality natural stone
Dolce et.al [2003] 1 storey 2 storey3 storey 4 storey
Vulnerability class B – Briczks with low % of voids
Dolce et.al [2003] 1 storey 2 storey3 storey 4 storey
0
10
20
30
40
50
60
70
80
90
100
0 0.05 0.1 0.15 0.2 0.25 0.3
PGA [g]
Pro
babi
lity
0
10
20
30
40
50
60
70
80
90
100
0 0.05 0.1 0.15 0.2 0.25 0.3PGA [g]
Pro
babi
lity
0
10
20
30
40
50
60
70
80
90
100
0 0.1 0.2 0.50.40.3PGA [g]
Pro
babi
lity
0
10
20
30
40
50
60
70
80
90
100
0 0.05 0.1 0.15 0.2 0.25 0.3
PGA [g]
Pro
babi
lity
Figure 12. Graphs of the comparison between simplified pushover-based earthquake loss assessment
(SP-BELA) vulnerability curves and curves produced from Italian vulnerability studies based on observations. Q29
SP-BELA METHOD FOR MASONRY BUILDINGS 373
INTERNATIONAL JOURNAL OF ARCHITECTURAL HERITAGE 2(4): 353–376
pushover curves. A probabilistic framework (SP-BELA) has been applied to generatevulnerability curves using the variability in the pushover curves and the variability inthe seismic demand prediction. The generated vulnerability curves have been cali-brated using the data obtained from Italian masonry buildings for different types ofmasonry and different numbers of stories. It is worth noting, however, that in order toimprove the definition of the vulnerability curves, additional data for each masonrystructural type should be obtained. Therefore, the target of the paper is not to suggestparameters for vulnerability curves, but rather to show how the SP-BELA methodol-ogy, initially applied to reinforced concrete buildings, can also be adopted to study thevulnerability of unreinforced masonry buildings.
Nevertheless, despite the limited data available, the curves presented herein havebeen compared with other vulnerability predictions for unreinforced masonry build-ings based on either observed damage or mechanics-based models. In all cases thecurves are seen to agree well, and particular agreement between the vulnerabilitypredictions presented herein and those specific to Italian masonry buildings isnoted. Further comparisons between the vulnerability curves from observed damagedata in Italy and the mechanics-based curves presented herein are expected to becarried out in the future along with the collection of more detailed data with which theSP-BELA curves can be calibrated.
ACKNOWLEDGEMENTS
The authors wish to express their gratitude to Prof. Gian Michele Calvi for theuseful discussions from which many ideas on the development of the work have beengathered. Many data on the variables adopted in the current study were provided byDr. Guido Magenes and Dr. Luis Restrepo-Velez, who always offered their precioussupport to this research. The uncertainty on the spectral shape that describes thedisplacement demand has been defined through the valuable collaboration with Prof.Julian Bommer. The authors would also like to acknowledge the contribution ofMr. Mauro Onida, who collaborated on aspects related to the programming andimplementation of the procedure in a geographic information system platform. Partof the current work has been carried out under the financial auspices of the ItalianLombardy Region (Regione Lombardia, Direzione Generale della Sanita), the supportof which is therefore also gratefully acknowledged.
REFERENCES
Abrams, D. P. 1997. Response of unreinforced masonry buildings. Journal of EarthquakeEngineering 1(1):257–273.
Anthoine, A., Magenes, G., and Magonettee, G. 1994. Shear compression testing and analysis
of brick masonry walls. In Proceedings of the 10th European Conference on EarthquakeEngineering. Vienna, Austria, 1994. Q8 Q9
Benedetti, D., and Petrini, V. 1984. Sulla vulnerabilita sismica di edifici in muratura: Proposta
su un metodo di valutazione. L’industria delle Costruzioni 149: 66–74.Bernardini, A., Gori, R., and Modena, C. 1990. An application of coupled analytical modelsand experimental knowledge for seismic vulnerability analyses of masonry buildings.
Engineering Aspects of Earthquake Phenomena 3:161–180.
374 B. BORZI ET AL.
INTERNATIONAL JOURNAL OF ARCHITECTURAL HERITAGE 2(4): 353–376
Borzi, B., Pinho, R., and Crowley, H. In press. Simplified pushover-based vulnerability analysis
for large scale assessment of RC buildings. Engineering Structures 30(3):804–820. Q10
Bosilijkov, V., Page, A., Bokan-Bosilijkov, V., and Zarnic, R. 2003. Performance based studiesof in-plane loaded unreinforced masonry walls. Masonry International 16(2):39–50.
Braga, F., Dolce, M., and Liberatore, D. 1982. Southern Italy November 23, 1980 earthquake:Section 5A statistical studyondamagedbuildings and an ensuing reviewof theMSK-76 scale. InProceedings of the 7th European Conference on Earthquake Engineering, Athens, Greece, 1982. Q11 Q12
Calvi, G. M. 1999. A displacement-based approach for vulnerability evaluation of classes ofbuildings. Journal of Earthquake Engineering 3(3):411–438.
CEN. 2003. Eurocode 8: Design of Structures for Earthquake Resistance. Part 1: General Rules,Seismic Actions and Rules for Buildings. Final draft, December 2003.
Crowley, H., Pinho, R., and Bommer, J. J. 2004. A probabilistic displacement-based vulner-ability assessment procedure for earthquake loss estimation. Bulletin of Earthquake
Engineering 2(2):173–219.Cosenza, E., Manfredi, G., Polese, M., and Verderame, G. M. 2005. A multi-level approach to
the capacity assessment of existing RC buildings. Journal of Earthquake Engineering 9(1):1–22.D’Ayala, D., and Speranza, E. 2002. An integrated procedure for the assessment of seismic
vulnerability of masonry structures. In Proceedings of the Twelfth European Conference on
Earthquake Engineering, London, England, 1982. paper no. 561. Q13 Q14
D’Ayala, D., and Speranza, E. 2003. Definition of collapse mechanisms and seismic vulner-ability of masonry structures. Earthquake Spectra 19(3):479–509.
Doherty, K. T., Griffith, M. C., Lam, N., and Wilson, J. 2002. Displacement-based seismicanalysis for out-of-plane bending of unreinforcedmasonry walls,Earthquake Engineering andStructural Dynamics 31:833–850.
Di Pasquale, G., Orsini, G., and Romeo, R. W. 2005. New developments in seismic riskassessment in Italy. Bulletin of Earthquake Engineering 3(1):101–128.
Dolce, M., Masi, A., Marino, M., and Vona, M. 2003. Earthquake damage scenarios of thebuilding stock or Potenza (Southern Italy) including site effects. Bulletin of EarthquakeEngineering 1(1):115–140.
Federal Emergency Management Agency (FEMA) 1999. HAZUS 99. Earthquake LossEstimation Methodology. Technical Manual. Washington, DC: FEMA.
Glaister, S., and Pinho, R. 2003. Development of a simplified deformation-based method forseismic vulnerability assessment. Journal of Earthquake Engineering 7(1):107–140.
Guagenti, E., and Petrini, V. 1989. The case of old buildings: towards a damage-intensity Q15 Q16
relationship [in Italian]. Proceedings of the 4th Italian National Conference on EarthquakeEngineering, , Milan, 145–153.
Helton, L. C., and Davis, F. J. 2003. Latin hypercube sampling and the propagation of Q17
uncertainty in analysis of complex systems.Reliability Engineering & System Safety 81:23–69.Magenes, G., Bolognini, D., and Baggio, C. 2000. Metodi semplificati per l’analisi sismica
non lineare di edifici in muratura. Rome, Italy: CNR-Gruppo Nazionale per la Difesa dai
Terremoti. Available at: http://gndt.ingv.it/Pubblicazioni/Magenes_copertina_con_intestazione.htm (accessedMay 2007).
Magenes, G., and Della Fontana, A. 1998. Simplified non-linear seismic analysis of masonry
buildings. Proceedings of the British Masonry Society 8:190–195.Magenes, G., Kingsley, G. R., and Calvi, G. M. 1997. Seismic testing of a full-scale, two-story
masonry building: Test procedure and measure experimental response. Rome, Italy: Gruppo
Nazionale per la Difesa dai Terremoti.Margottini, C., Molin, D., Narcisi, B., and Serva, L. 1992. Intensity versus ground motion: a
new approach using Italian data, Engineering Geology 33:45–48.Ordinanza del Presidente del Consiglio deiMinistri (OPCM). 2003.Primi Elementi inMateria di
Criteri Generali per la Classificazione Sismica del Territorio Nazionale e di Normative Tecnicheper le Costruzioni in Zona Sismica. G.U. n. 72 del 8-5-2003, n, 3274 del 20 Marzo 20, 2003. Q19
SP-BELA METHOD FOR MASONRY BUILDINGS 375
INTERNATIONAL JOURNAL OF ARCHITECTURAL HERITAGE 2(4): 353–376
Pinho, R., Bommer, J. J., and Glaister, S. 2002. A simplified approach to displacement-based
earthquake loss estimation analysis. In Proceeding of the 12th European Conference onEarthquake Engineering, London, England, paper no. 738. Q20 Q21
Restrepo-Velez, L. F. 2003. A simplified mechanics-based procedure for the seismic risk assess-
ment of unreinforced masonry buildings. Individual Study. Pavia, Italy: ROSE School.Restrepo-Velez, L. F., and Magenes, G. 2004. Simplified procedure for the seismic risk assess-ment of unreinforced masonry buildings. In Proceedings of the Thirteenth World Conferenceon Earthquake Engineering. Vancouver, Canada, paper no. 2561. Q23 Q24
Restrepo-Velez, L. F., and Magenes, G. 2005a. Experimental testing in support of a mechanics-based procedure for the seismic risk evaluation of unreinforced masonry buildings. InInternational Seminar SAHC 2004 Structural Analysis of Historical Constructions, Vol. 2, eds.,
Modena, C., Lourenco, P.B., and Roca P. London, England, Taylor and Francis, 1079–1089.Restrepo-Velez, L.F., andMagenes, G. 2005b. Amechanics-based methodology for the evalua-tion of the seismic risk of unreinforced masonry buildings. ROSE Research Report No.
2005/05.RISK-UE 2001. An advanced approach to earthquake risk scenarios with application todifferent European towns. Available at: www.risk-ue.net (accessed May 2007).
Rossetto, T., and Elnashai, A. 2005. A new analytical procedure for the derivation of displace-ment-based vulnerability curves for populations of RC structures, Engineering Structures7(3):397–409.
Tomazevic, M., Lutman, M., Weiss, P., and Velechovsky, T. 1992. The influence of rigidity offloors on the seismic resistance of old masonry buildings. Ljubljana, Slovenia:. Q27
376 B. BORZI ET AL.
INTERNATIONAL JOURNAL OF ARCHITECTURAL HERITAGE 2(4): 353–376