Mobility and home-range use of Atlantic salmon parr over short time scales
Upload
khangminh22Category
view
2download
0
Short Range Transit Plan
April 2017
2017-2021


2017-2021 SRTP
i
Board of Trustees
Name Appointment
Jean Carter Ryan, Chair City of Columbus Trudy Bartley, Vice Chair City of Columbus
Donald B. Leach, Jr. City of Upper Arlington Philip D. Honsey City of Grove City David Norstrom City of Worthington
Gina R. Ormond City of Columbus Letty Schamp City of Hilliard
Amy M. Schmittauer City of Columbus Craig P. Treneff Franklin County Richard R. Zitzke City of Columbus Vacant City of Columbus Vacant City of Columbus
Vacant Franklin County
Administration
President/CEO W. Curtis Stitt Vice President, Planning & Service Development Michael L. Bradley Vice President of IT/CIO Micheal D. Carroll
Vice President, Operations Emille Williams Vice President, Legal Affairs and General Counsel Christina Wendell Vice President, Communications, Marketing & Customer
Service Robert M. Stutz
Vice President, Human Resources & Labor Relations Kristen M. Treadway Vice President, Finance Jeffrey S. Vosler Vice President, Government Affairs Laura Koprowski
Prepared By
Central Ohio Transit Authority
Department of Planning
Michael McCann, Director
April 2017


2017-2021 SRTP
iii
Table of Contents ..................................................................................................................................................... 3
Table of Tables ........................................................................................................................................................ 11
Table of Figures .......................................................................................................................................................12
1. Introduction ..................................................................................................................................................... 17
1.1 Goals of the Plan .................................................................................................................................... 17
1.2 COTA’s Commitment to the Community ......................................................................................... 17
1.2.1 Vision .................................................................................................................................................... 17
1.2.2 Mission ................................................................................................................................................ 18
1.3 Achieving 25 Million Rides by 2025 ................................................................................................. 18
1.4 Service Plan ........................................................................................................................................... 18
1.4.1 CMAX Cleveland Avenue Bus Rapid Transit.............................................................................. 19
1.5 Supporting the SRTP ........................................................................................................................... 20
1.6 Transportation Improvement Program (TIP) .................................................................................21
1.6.1 Operating Summary of the SRTP and TIP ..................................................................................21
1.6.2 Capital Summary of the SRTP and TIP ....................................................................................... 22
2 Background and Overview ......................................................................................................................... 25
2.1 Growth in Central Ohio ....................................................................................................................... 25
2.2 2016-2040 Long-Range Transit Plan Coordination ..................................................................... 32
2.3 COTA NextGen ...................................................................................................................................... 32
2.4 History of COTA .................................................................................................................................... 33
2.5 Local Funding Efforts .......................................................................................................................... 34
2.5.1 Current Funding ............................................................................................................................... 35
2017-2021 SRTP
iv
2.6 Rider Characteristics ........................................................................................................................... 36
3 Public Involvement ....................................................................................................................................... 48
3.1 TSR Public Involvement ...................................................................................................................... 48
3.2 NextGen Outreach ................................................................................................................................. 51
3.3 CMAX Cleveland Avenue Bus Rapid Transit ................................................................................... 51
4 Service Monitoring and Design Standards ............................................................................................. 53
4.1 Service Categories ............................................................................................................................... 53
4.2 Design Standards ................................................................................................................................. 54
4.2.1 Designing Service ............................................................................................................................. 55
4.2.2 Determining Recommendation for Implementation .......................................................... 59
4.2.3 Evaluate cost of service ............................................................................................................. 62
4.2.4 Analyze Title VI and Environmental Justice Impacts ......................................................... 62
4.3 Service Monitoring ............................................................................................................................... 63
4.3.1 Alignment of Categories with Service Purpose ....................................................................... 65
4.3.2 On-time Performance ................................................................................................................. 66
4.3.3 Missed Trips .................................................................................................................................. 67
4.3.4 Load Standards ............................................................................................................................ 67
4.3.5 Monitoring Service and Addressing Deficiency ................................................................... 68
4.4 Data Collection and Service Change Process ................................................................................. 71
4.5 Bus Stop Design Guide ........................................................................................................................ 72
4.5.1 Purpose .............................................................................................................................................. 72
4.5.2 Goals ............................................................................................................................................... 73
4.6 Bus Stop Spacing Guidelines ............................................................................................................. 73

2017-2021 SRTP
v
4.7 Bus Stop Inventory and ADA Improvements ................................................................................ 75
4.8 Title VI Adherence and Environmental Justice ............................................................................. 75
5 Transit System Redesign Service Plan .................................................................................................... 77
5.1 Fixed-Route Bus Service .................................................................................................................... 77
5.2 Service Plan ........................................................................................................................................... 86
5.3 Service Investment Strategy .............................................................................................................90
5.4 Transit Center and Park & Ride Changes ....................................................................................... 93
5.5 CMAX Cleveland Avenue Bus Rapid Transit .................................................................................. 97
5.5.1 Project Background ......................................................................................................................... 98
5.5.2 CMAX Vehicles ............................................................................................................................ 101
5.5.3 Public Art Program ................................................................................................................... 101
6 Fixed-Route Bus Fleet ................................................................................................................................ 103
6.1 Active Fleet .......................................................................................................................................... 103
6.1.1 Fleet Spare Ratio ............................................................................................................................ 103
6.2 Future Bus Purchases ....................................................................................................................... 103
6.2.1 Funding of Future Bus Purchases .............................................................................................. 103
6.3 The COTA Contingency Fleet Plan .................................................................................................. 107
6.4 Air Quality Improvement Programs and Alternative Fuels ..................................................... 108
6.4.1 Conversion to Compressed Natural Gas (CNG) ....................................................................... 109
6.4.2 Hybrid Electric Diesel Buses ................................................................................................... 109
6.5 Fleet Maintenance Objectives ......................................................................................................... 110
6.6 Other Equipment ................................................................................................................................. 111
6.6.1 Non-Revenue Vehicles ................................................................................................................... 111
2017-2021 SRTP
vi
7 Mobility Services .......................................................................................................................................... 113
7.1 Mainstream Paratransit Services.................................................................................................... 113
7.2 Functional Ability Assessments ....................................................................................................... 116
7.3 Transit System Redesign (TSR) Impacts to Mainstream Services .......................................... 116
7.4 Mainstream Paratransit Fleet .......................................................................................................... 117
7.5 Development of Alternative Mobility Service Delivery Options ............................................ 120
7.5.1 Community Representation ........................................................................................................ 120
7.5.2 Mobility Advisory Board .............................................................................................................. 120
7.6 Future Paratransit Service Activities ............................................................................................. 121
7.7 Accessible Fixed-Route Services ..................................................................................................... 121
7.8 Coordinated Mobility Initiatives and Projects............................................................................. 122
7.8.1 Potential Mobility Management Service Options .................................................................. 122
7.8.2 Travel Training ........................................................................................................................... 122
8 Special Initiatives ........................................................................................................................................ 123
8.1 Reaching 25 million rides by 2025 ................................................................................................. 123
8.1.1 Service Initiatives ........................................................................................................................... 124
8.1.2 Access to Service ........................................................................................................................... 126
8.1.3 Fare Initiatives ................................................................................................................................ 129
8.1.4 Customer Experience Initiatives ............................................................................................ 130
8.2 Connecting to Employment Centers .............................................................................................. 132
8.3 Special Event Services ...................................................................................................................... 132
8.4 Bus on Shoulder (BOS) Program .................................................................................................... 133
8.5 Bicycles and Transit ........................................................................................................................... 134
2017-2021 SRTP
vii
8.6 Pass Programs .................................................................................................................................... 135
8.6.1 Academic Pass Programs ............................................................................................................ 135
8.6.2 Employer Pass Programs ........................................................................................................ 135
8.7 Passenger Information ..................................................................................................................... 136
8.7.1 COTA Customer & Quality Service ............................................................................................. 137
8.7.2 COTA Website, Social Media and Traveler Information Systems ................................. 137
8.7.3 Automatic Vehicle Announcement........................................................................................ 138
8.7.4 Service Change Public Meetings and other Public Communications ........................... 139
8.8 Planning and Community Outreach ............................................................................................... 142
8.8.1 Public Notices ............................................................................................................................. 143
8.8.2 Continuing Outreach ................................................................................................................. 145
9 COTA Facilities ............................................................................................................................................. 146
9.1 Bus Storage, Maintenance and Administrative Office Facilities ............................................ 146
9.1.1 Administrative Offices and Retail Pass Sales Center ............................................................ 146
9.1.2 McKinley Avenue – Bus Storage, Maintenance, and Customer Service Call Center
Facility ............................................................................................................................................................ 147
9.1.3 Fields Avenue Bus Storage and Maintenance Facility .......................................................... 149
9.1.4 Mobility Services – Mainstream and Eligibility Assessment Facility ................................ 150
9.1.5 Street and Remote Maintenance Facility ................................................................................ 152
9.2 Transit Centers .................................................................................................................................... 152
9.2.1 Linden Transit Center - 1394 Cleveland Avenue .................................................................... 152
9.2.2 Easton Transit Center – 4260 Stelzer Road ....................................................................... 153
9.2.3 Near East Transit Center – 1125 East Main Street ............................................................ 155
9.2.4 Northland Transit Center and Park & Ride ......................................................................... 155

2017-2021 SRTP
viii
9.3 Downtown Transit Terminals .......................................................................................................... 156
9.3.1 Spring Street Terminal – 33 West Spring Street ................................................................... 156
9.3.2 COTA Transit Terminal – 25 East Rich Street ..................................................................... 157
9.4 Park & Ride Lots ................................................................................................................................. 157
9.4.1 Future Park and Ride Development .......................................................................................... 163
9.5 Passenger Shelters ............................................................................................................................ 164
9.5.1 Shelter Site Selection Process .................................................................................................... 165
9.5.2 Downtown Shelters .................................................................................................................. 166
9.6 Bus Stop Signs .................................................................................................................................... 166
10 Intelligent Transportation Systems (ITS) .......................................................................................... 167
10.1 Computer Aided Dispatch/Automatic Vehicle Location ........................................................... 169
10.2 Onboard Automated Stop Announcements ................................................................................ 170
10.3 Traveler Information Systems ........................................................................................................ 170
10.4 Electronic Fare Collection .................................................................................................................. 171
10.5 Automated Passenger Counters .................................................................................................... 172
10.6 Fleet Maintenance .............................................................................................................................. 173
10.7 Safety and Security ........................................................................................................................... 173
10.8 Transit Signal Priority (TSP) ............................................................................................................ 174
10.9 Smart Columbus ................................................................................................................................. 174
11 Security and Emergency Services .......................................................................................................... 176
11.1 Passenger and Facility Security ..................................................................................................... 176
11.1.1 Special Duty Officers and Marked Cruisers .........................................................................177
11.1.2 Homeland Security .....................................................................................................................177
2017-2021 SRTP
ix
11.1.3 Identicard/S2 proximity readers ........................................................................................... 178
11.1.4 Closed Circuit Television Cameras (CCTV) ........................................................................... 178
11.1.5 Park and Ride Security ............................................................................................................. 178
11.1.6 Other security devices .............................................................................................................. 178
11.1.7 Contracted security guards..................................................................................................... 179
11.1.8 Evacuation transportation group .......................................................................................... 179
11.1.9 Mobile Emergency Operations Center (EOC) ...................................................................... 180
11.1.10 Other Emergency Service Coordination ............................................................................... 181
11.2 Other Security Initiatives .................................................................................................................. 181
11.3 Ohio Public Transit Association Security Committee ................................................................. 181
11.4 Capital Crossroads Special Improvement District (SID) ............................................................ 181
12 TIP and Financial Plan ................................................................................................................................ 183
12.1 Background .......................................................................................................................................... 183
12.2 Operating Plan .................................................................................................................................... 183
12.3 Local Funding ...................................................................................................................................... 184
12.4 Capital Plan .......................................................................................................................................... 184
12.5 Major Capital Projects ....................................................................................................................... 185
12.5.1 Bus Replacement and Expansion .......................................................................................... 185
12.5.2 CMAX Cleveland Avenue BRT ................................................................................................. 186
12.5.3 Non-Revenue Vehicles ............................................................................................................. 186
12.5.4 Facility Construction Projects ................................................................................................ 186
12.5.5 Strategic Investments – Park and Rides and Turnaround Locations ........................... 187
12.5.6 Other Strategic Investments .................................................................................................. 187

2017-2021 SRTP
x
12.5.7 Intelligent Transportation Systems (ITS) ............................................................................. 188
12.5.8 Bus Stop Shelter and Transit Enhancements ..................................................................... 189
12.6 Achieving 25 million rides by 2025 and the Financial Plan ...................................................... 189
12.7 Financial Summary ............................................................................................................................. 191
Appendix A: List of Acronyms .......................................................................................................................... 194
Appendix B: Transit System Redesign ........................................................................................................... 196
Appendix C: Transit System Redesign Public Meetings ............................................................................ 250
Appendix D: Transportation Improvement Program Draft ...................................................................... 257

2017-2021 SRTP
xi
Table 2-1 Growth in Population and Jobs ........................................................................................................ 26
Table 4-1 Service Categories ............................................................................................................................... 54
Table 4-2 Frequency minimums by Residential and Employment Density ............................................ 57
Table 4-3 Service Standards and Monitoring ................................................................................................. 63
Table 4-4 Load Standards ................................................................................................................................... 68
Table 4-5 Bus Stop Spacing Guidelines ............................................................................................................ 74
Table 5-1 Weekday Time Periods....................................................................................................................... 78
Table 5-2 Janaury 2017 Service Availability by Line Type .......................................................................... 79
Table 5-3 TSR (May 2017) Service Availability by Line Type ...................................................................... 79
Table 5-4 TSR Service Availability by Line Number...................................................................................... 79
Table 5-5 COTA Fares as of January 2017 ....................................................................................................... 83
Table 5-6 TSR System Resource Allocation .................................................................................................... 91
Table 5-7 COTA Park & Ride Lots as of May 2017 ......................................................................................... 95
Table 6-1 Current Roster of Equipment ......................................................................................................... 105
Table 6-2 Active Fleet Bus Replacement Schedule ..................................................................................... 106
Table 6-3 Peak Fleet Utilization 30’/35’/40’ Fixed-Route Buses (Trimester Calendar Year) ........... 107
Table 6-4 Non-Revenue Vehicle Purchases and Estimated Cost by Year .............................................. 112
Table 7-1 Mainstream Report for 2015-2016 ................................................................................................. 115
Table 7-2 Mainstream Fleet Roster as of January 2017 ............................................................................. 118
Table 7-3 Mainstream Vehicle Replacement Schedule ............................................................................... 119
Table 8-1 Service Change Booklet Distribution ............................................................................................. 141
Table 9-1: COTA Park & Ride Lots as of May 2017 ....................................................................................... 159
2017-2021 SRTP
xii
Table 9-2: Average Park & Ride Utilization February 2016 — February 2017...................................... 162
Table 12-1: Financial Summary ......................................................................................................................... 192
Table 12-2: System Capital Program ............................................................................................................... 193
Figure 1-1 Service Hours ....................................................................................................................................... 19
Figure 1-2 CMAX Logo .......................................................................................................................................... 19
Figure 1-3 CMAX Station Rendering.................................................................................................................. 20
Figure 2-1 Columbus Metropolitan Statistical Area (MSA) ......................................................................... 27
Figure 2-2 COTA Service Area ............................................................................................................................ 28
Figure 2-3 Change in Population and Jobs 2015 to 2025 ............................................................................ 29
Figure 2-4 Change in Jobs 2015 to 2025 .......................................................................................................... 30
Figure 2-5 Franklin County and U.S. Unemployment Rate .......................................................................... 31
Figure 2-6 COTA Ridership and Average Ohio Gas Prices ............................................................................ 31
Figure 2-7 2013 OBS Age ..................................................................................................................................... 36
Figure 2-8 2013 OBS Annual Household Income ........................................................................................... 37
Figure 2-9 2013 OBS Employment Status ....................................................................................................... 37
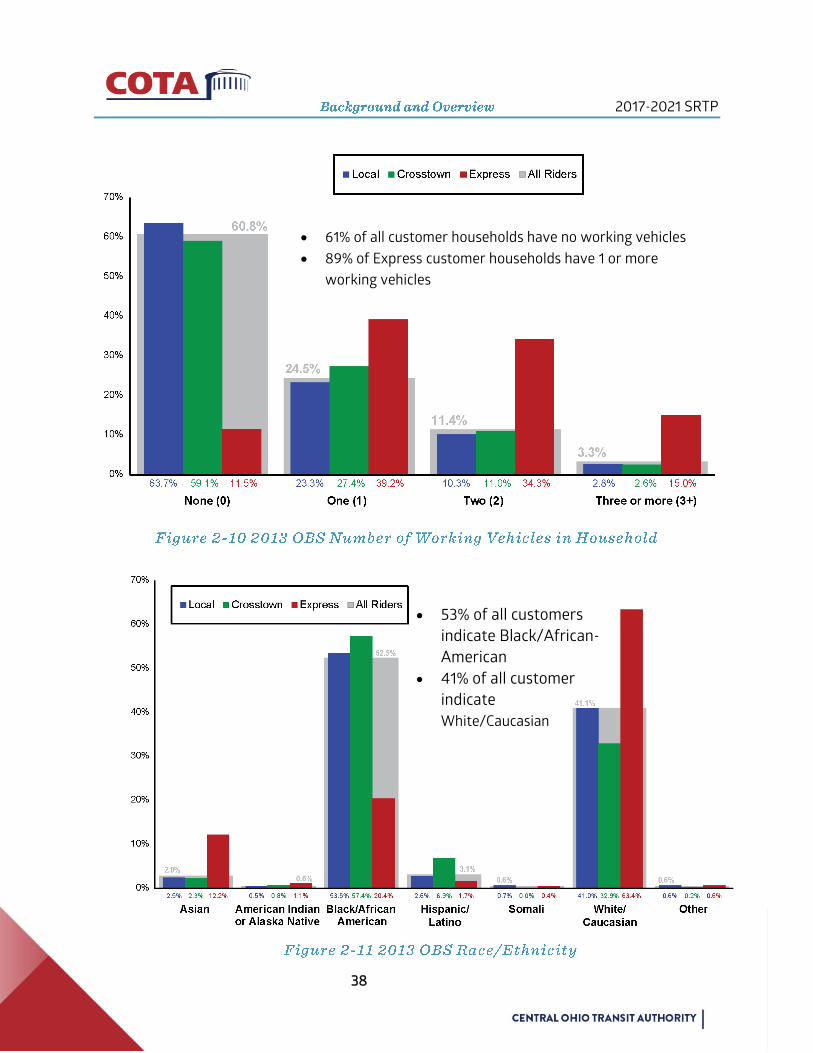
Figure 2-10 2013 OBS Number of Working Vehicles in Household........................................................... 38
Figure 2-11 2013 OBS Race/Ethnicity ............................................................................................................... 38
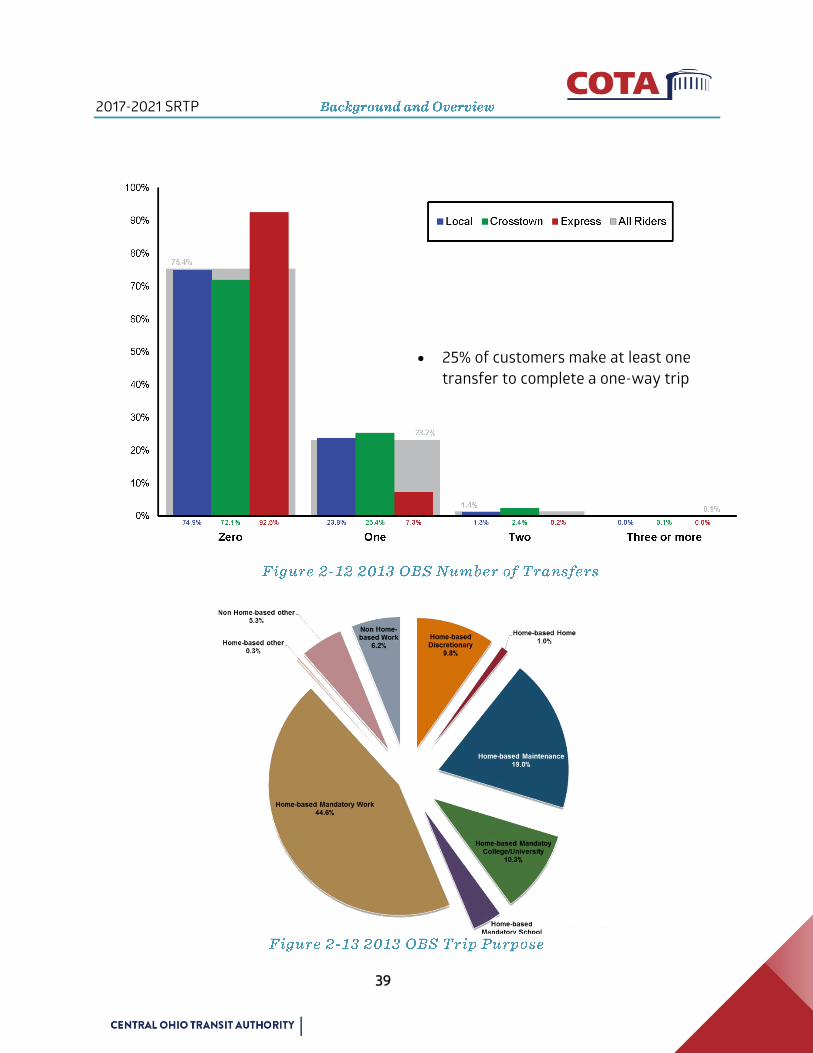
Figure 2-12 2013 OBS Number of Transfers ................................................................................................... 39
Figure 2-13 2013 OBS Trip Purpose .................................................................................................................. 39
Figure 2-14 2016 CSS Passenger Demographics .......................................................................................... 40
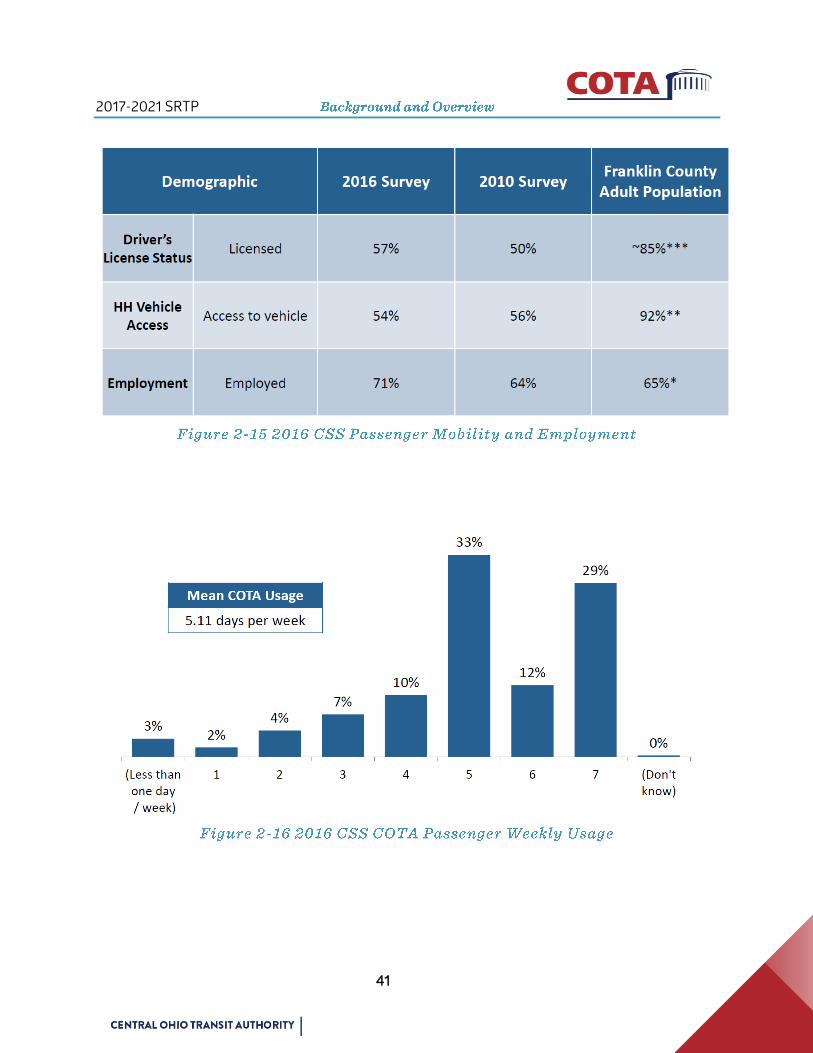
Figure 2-15 2016 CSS Passenger Mobility and Employment ...................................................................... 41
2017-2021 SRTP
xiii
Figure 2-16 2016 CSS COTA Passenger Weekly Usage ................................................................................ 41
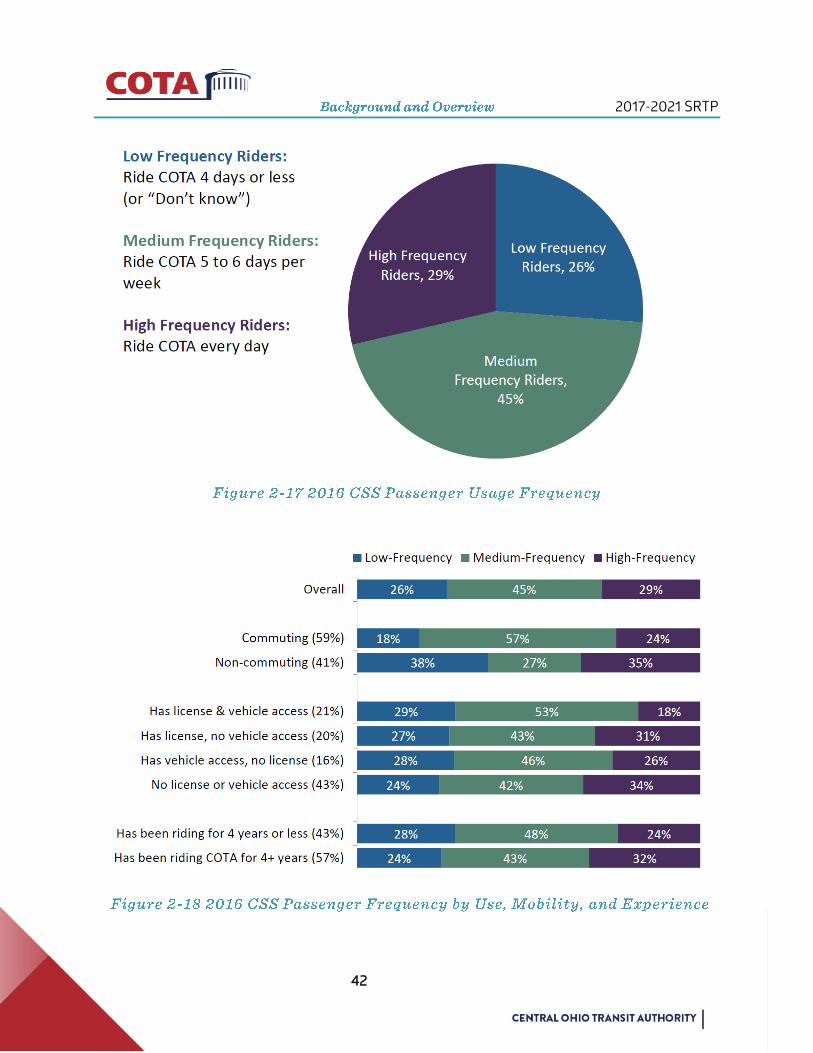
Figure 2-17 2016 CSS Passenger Usage Frequency ...................................................................................... 42
Figure 2-18 2016 CSS Passenger Frequency by Use, Mobility, and Experience .................................... 42
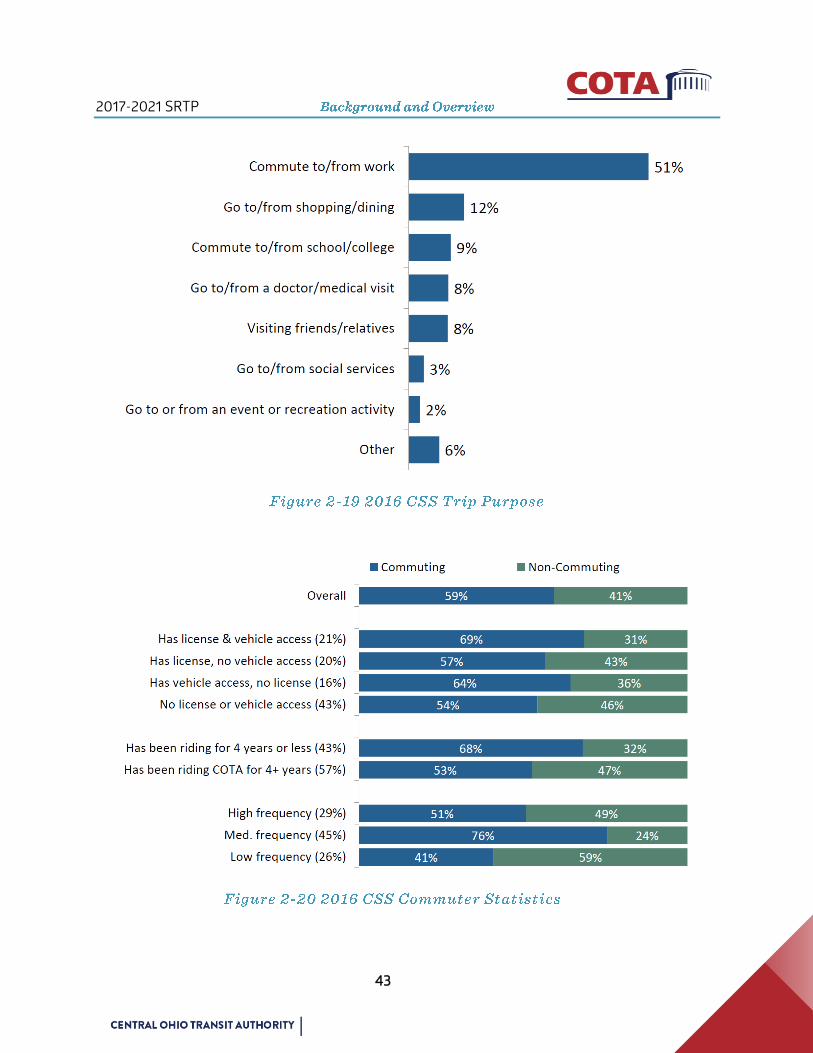
Figure 2-19 2016 CSS Trip Purpose ................................................................................................................... 43
Figure 2-20 2016 CSS Commuter Statistics .................................................................................................... 43
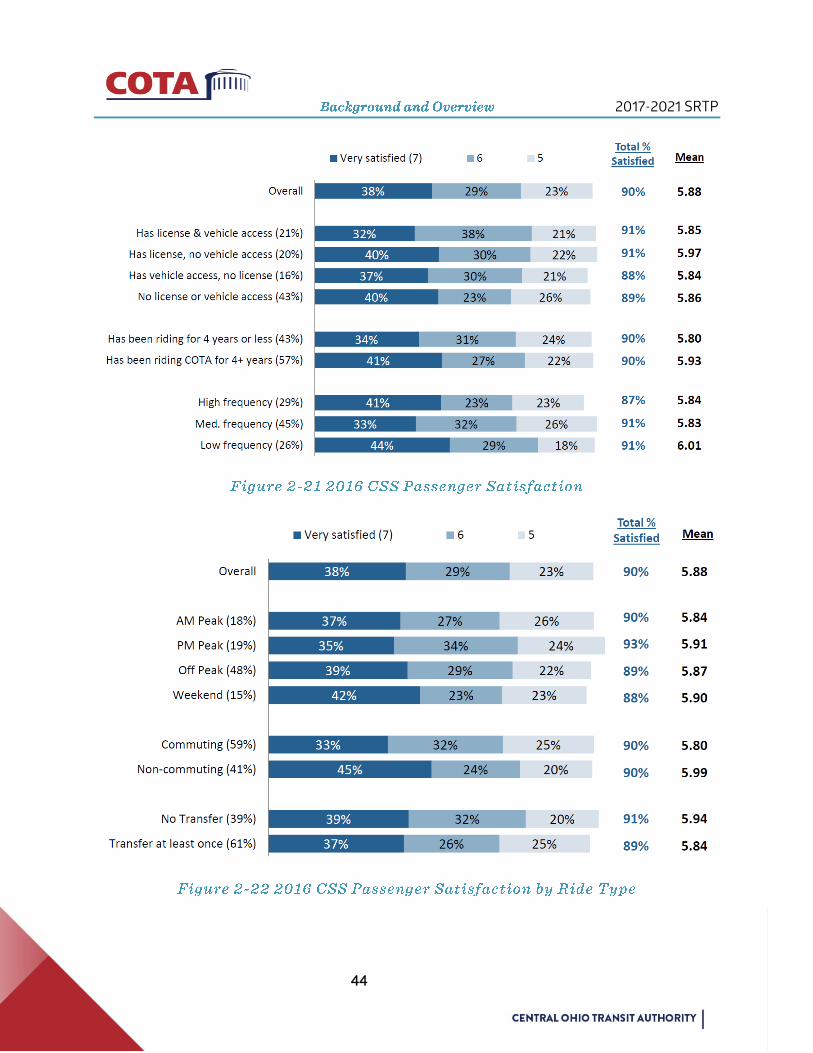
Figure 2-21 2016 CSS Passenger Satisfaction ................................................................................................ 44
Figure 2-22 2016 CSS Passenger Satisfaction by Ride Type ...................................................................... 44
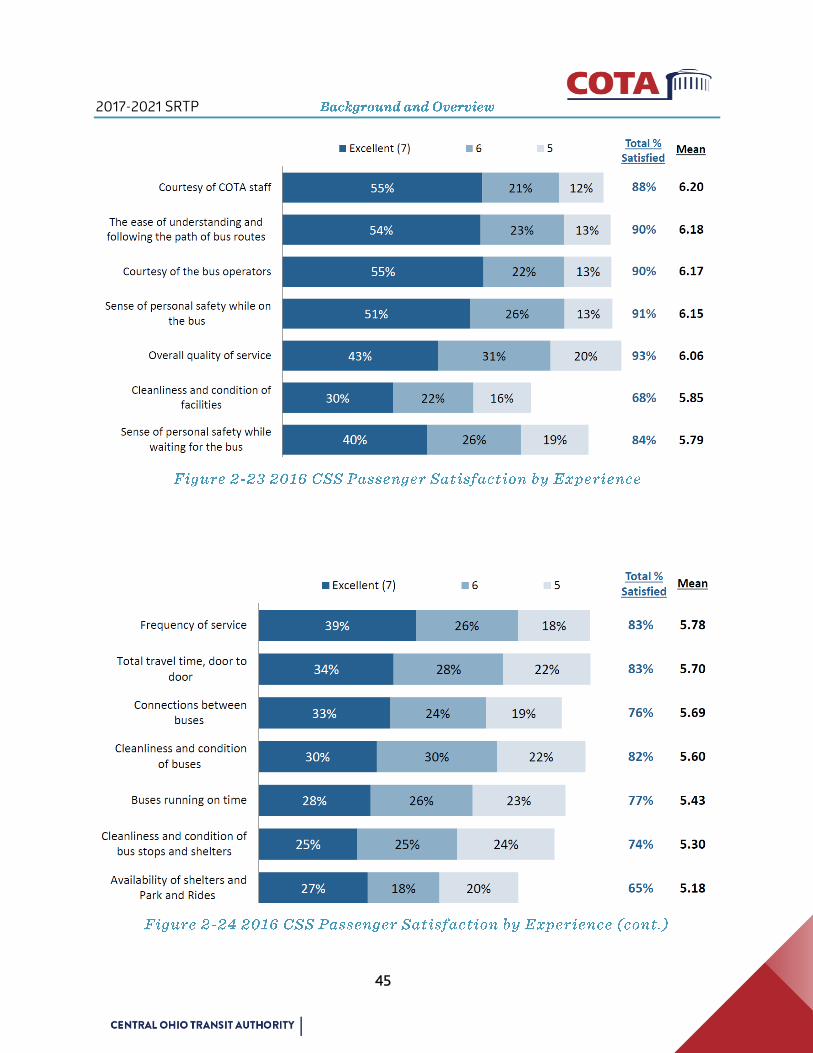
Figure 2-23 2016 CSS Passenger Satisfaction by Experience .................................................................... 45
Figure 2-24 2016 CSS Passenger Satisfaction by Experience (cont.) ....................................................... 45
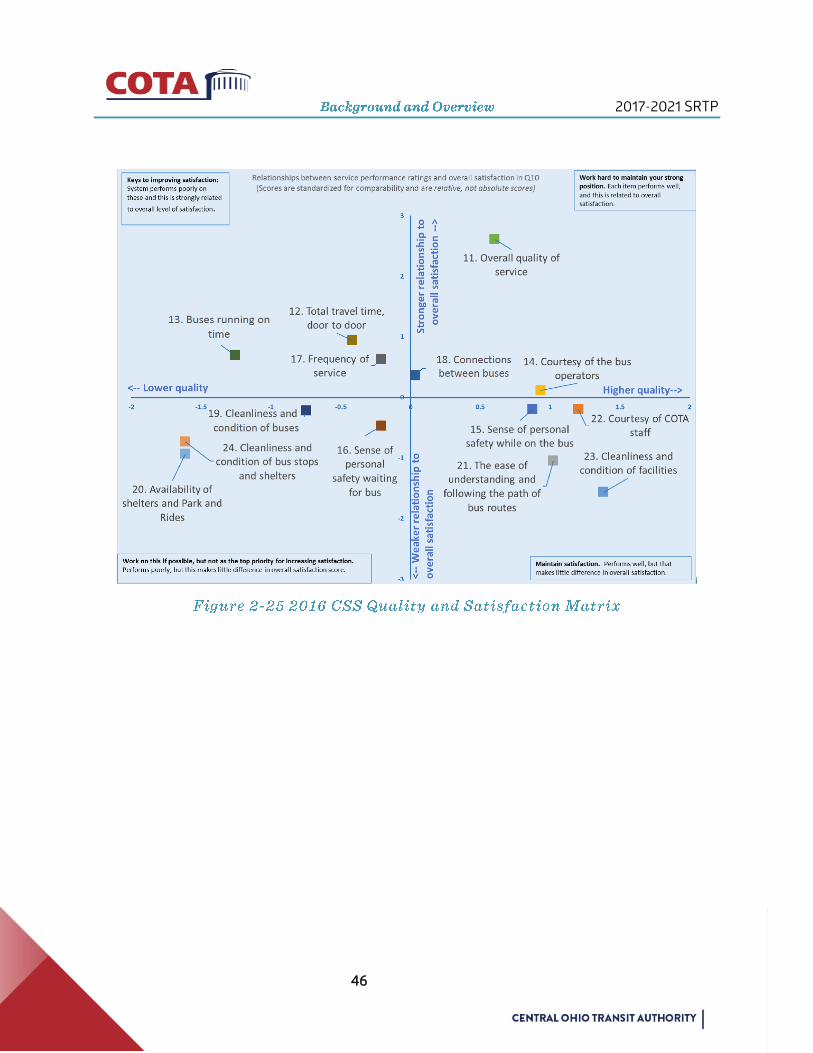
Figure 2-25 2016 CSS Quality and Satisfaction Matrix ................................................................................ 46
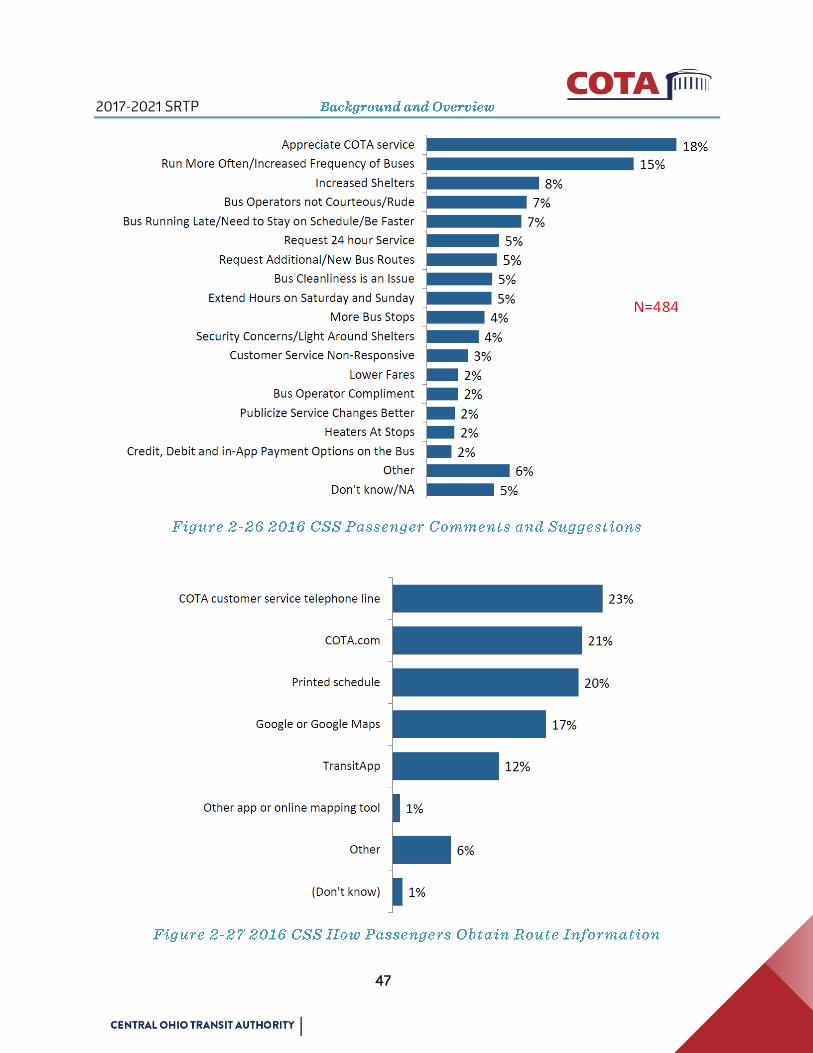
Figure 2-26 2016 CSS Passenger Comments and Suggestions .................................................................. 47
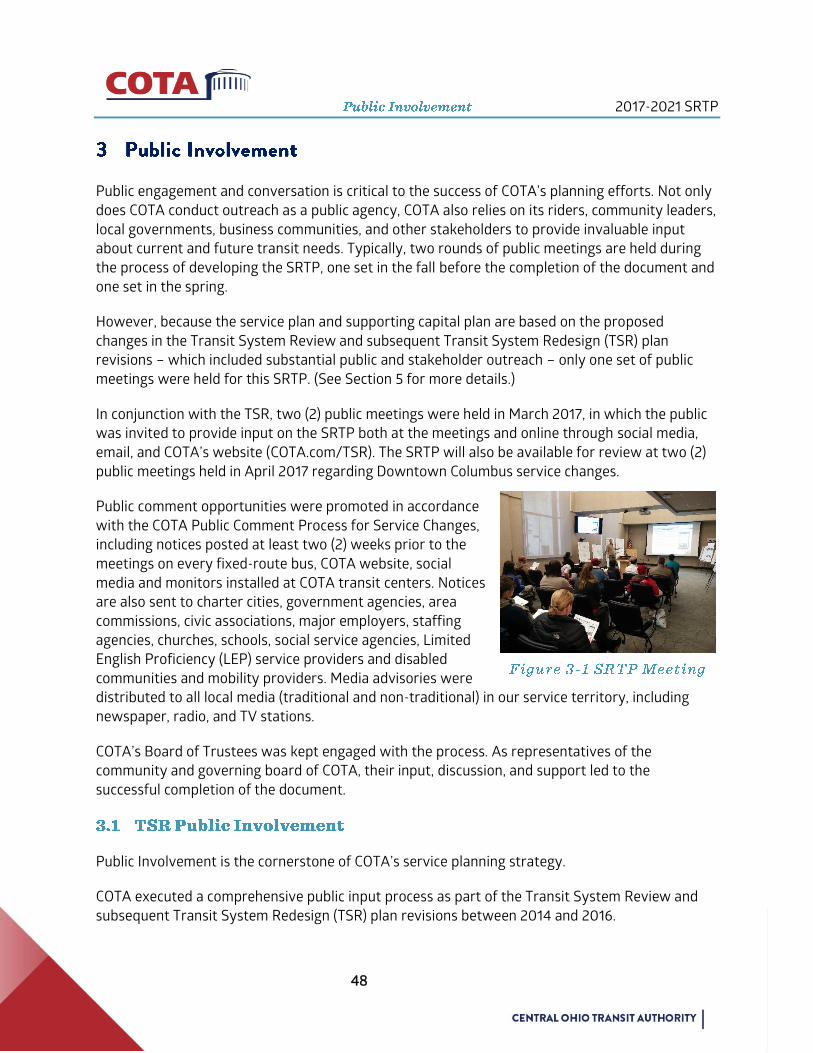
Figure 2-27 2016 CSS How Passengers Obtain Route Information .......................................................... 47
Figure 3-1 SRTP Meeting ...................................................................................................................................... 48
Figure 3-2 TSR 2015 Meeting .............................................................................................................................. 49
Figure 3-3 TSR Advertising Materials ............................................................................................................... 50
Figure 4-1 Ridership Corridor Characteristics ................................................................................................ 56
Figure 4-2 Coverage Corridor Characteristics ................................................................................................ 56
Figure 5-1 Fixed-Route Bus ................................................................................................................................. 77
Figure 5-2 TSR Weekday Service All Day ........................................................................................................ 84
Figure 5-3 TSR Weekday Service after 6 p.m. ................................................................................................ 84
Figure 5-4 TSR Sunday Service .......................................................................................................................... 85
Figure 5-5 TSR Saturday Service ....................................................................................................................... 85
Figure 5-6 Service Hours ..................................................................................................................................... 86
2017-2021 SRTP
xiv
Figure 5-7 Comparison of midday frequency pre and post-TSR ...............................................................88
Figure 5-8 Changes to weekend service hours Post-TSR............................................................................ 89
Figure 5-9 Post-TSR service expansions ......................................................................................................... 89
Figure 5-10 Existing and Planned Park and Rides ......................................................................................... 94
Figure 5-11 CMAX Logo ......................................................................................................................................... 98
Figure 5-12 CMAX Grant Award Announcement ........................................................................................... 99
Figure 5-13 Northland Transit Center Rendering .......................................................................................... 99
Figure 5-14 CMAX Cleveland Avenue BRT Alignment ............................................................................... 100
Figure 5-15 CMAX Station Rendering ............................................................................................................. 101
Figure 5-16 CMAX Vehicle .................................................................................................................................. 101
Figure 6-1 CNG-powered fixed route bus ...................................................................................................... 109
Figure 6-2 Hybrid-electric fixed route bus .................................................................................................... 110
Figure 7-1 Assessment Center ........................................................................................................................... 116
Figure 7-2 Cutaway Vehicle................................................................................................................................ 117
Figure 8-1 Boarding COTA’s Service ............................................................................................................... 123
Figure 8-2 Albany, NY Dedicated Bus Lane .................................................................................................. 125
Figure 8-3 Ontario Ministry of Transportation Transit Development Guideline ................................. 128
Figure 8-4 COTA’s Existing Farebox ............................................................................................................... 130
Figure 8-5 SEPTA Customer Loyalty Program .............................................................................................. 131
Figure 8-6 SmartRide New Albany Logo ....................................................................................................... 132
Figure 8-7 GREAT Logo ...................................................................................................................................... 132
Figure 8-8 I-70 Bus on Shoulder ...................................................................................................................... 133
Figure 8-9 Loading Bicycle on Bus .................................................................................................................. 134
2017-2021 SRTP
xv
Figure 8-10 Bicycle Racks at COTA Spring Street Terminal ...................................................................... 134
Figure 9-1 COTA Administrative Offices and Pass Sales Center .............................................................. 146
Figure 9-2 New McKinley Ave. Transprotation Entrance .......................................................................... 147
Figure 9-3 McKinley CNG Bus Fueling Station.............................................................................................. 148
Figure 9-4 Public CNG Fueling Station Rendering ....................................................................................... 149
Figure 9-5 Fields Ave. COTA Fixed-Route Bus Storage and Maintenance Facility.............................. 149
Figure 9-6 Eligibility Assessment Center ........................................................................................................ 151
Figure 9-7 COTA Mainstream and Eligibility Assessment Facility ............................................................ 151
Figure 9-8 Street and Remote Maintenance Facility .................................................................................. 152
Figure 9-9 Linden Transit Center ..................................................................................................................... 153
Figure 9-10 Easton Transit Center Renovation Rendering ....................................................................... 154
Figure 9-11 Easton Transit Center ................................................................................................................... 154
Figure 9-12 Easton Day Care Center ............................................................................................................... 154
Figure 9-13 Near East Transit Center ............................................................................................................. 155
Figure 9-14 Northland Transit Center/Park & Ride Rendering ................................................................ 155
Figure 9-15 Spring Street Terminal ................................................................................................................. 156
Figure 9-16 COTA Transit Terminal ................................................................................................................. 157
Figure 9-17 Current and Planned COTA Park and Ride Locations ........................................................... 158
Figure 9-18 COTA Passenger Shelter and Trash Receptacle .................................................................... 165
Figure 9-19 Downtown Shelter ........................................................................................................................ 166
Figure 9-20 COTA's New bus stop sign design (far left) covered with current route hood to be
removed on May 1st ............................................................................................................................................ 166
Figure 10-1 Automatic Vehicle Location......................................................................................................... 167
Figure 10-2 COTA Radio Room ......................................................................................................................... 169

2017-2021 SRTP
xvi
Figure 10-3 Online Trip Planner ....................................................................................................................... 170
Figure 10-4 Traveler Information ..................................................................................................................... 171
Figure 10-5 Electronic Fare Payment .............................................................................................................. 171
Figure 10-6 Automatic Passenger Counters ................................................................................................. 172
Figure 11-1 Police Cruiser ....................................................................................................................................177
Figure 11-2 Bomb-sniffing Canine Team ......................................................................................................177
Figure 11-3 VIPR Operation ............................................................................................................................... 178
Figure 11-4 Visible Intermodal Protection Response .................................................................................. 178
Figure 11-5 COTA Mobile Emergency Oerations Center ............................................................................. 180
Figure 12-1 CMAX Grant Award Signigng (Sen. Sherrod Brown and COTA CEO Curtis Stitt) .......... 186

2017-2021 SRTP
17
The Central Ohio Transit Authority (COTA) is the primary provider of public transit services in the
central Ohio region. COTA strives to deliver safe, reliable, and cost-effective transportation
services to the public. To do so COTA biennially develops a five-year plan known as the Short-
Range Transit Plan (SRTP). The SRTP analyzes the transit market in central Ohio and the ability of
the current COTA system to serve the market.
The SRTP serves as a vital tool to assess COTA’s current operations, describe future transit
enhancements, and detail methods for prioritizing expenditures, service, and funding in order to
serve the community’s transit needs. As such, this SRTP incorporates COTA’s Transportation
Improvement Program (TIP) found in Section 12 and Appendix D. The TIP is based on the present
and projected four-year service needs of the area and identifies capital needs, cost projections,
funding requirements, and programmed service improvements.
The service recommendations and policies presented in the SRTP serve to aid in providing a
sustainable transportation system for the central Ohio region. The SRTP also fulfills state, federal,
and regional reporting requirements, and is an important planning document justifying grant
applications to both state and federal governments.
In early 2016, COTA developed three goals to guide the agency into the future to better serve
the central Ohio community. Initiatives and projects in the 2017 SRTP progress towards
achieving achieve these goals.
Ridership
Goal: Achieve ridership of 25 million passenger trips annually by 2025.
Expansion
Goal: Plan and invest in a multi-modal, high-capacity, mass transit system connecting
central Ohio residents to opportunity, economic prosperity and to each other.
Perception
Goal: Be recognized in our communities, our region, and nationally, as an essential
partner in economic development and mobility solutions and as a leader in technological
innovation and sustainability.
The Central Ohio Transit Authority will be the region’s transportation leader.
2017-2021 SRTP
18
The Central Ohio Transit Authority is committed to excellence in serving our stakeholders –
customers, employees and taxpayers. We will deliver quality transportation services and
conduct business courteously, safely, ethically, and reliably. We will demonstrate leadership
that is fiscally responsible and environmentally conscientious.
In 2016, COTA developed a list of initiatives to achieve 25 million rides by 2025. The goal was
established in COTA’s 2016-2040 Long-Range Transit Plan (LRTP). Key to achieving this goal is
developing a bus network that allows riders to live a transit lifestyle.
While the 2016 LRTP positions COTA for the future and speaks broadly to the future of the
authority, this strategy identifies more potentially immediate strategies and initiatives that
are focused on achieving the 25 million-rider goal. The plan includes an analysis of existing
conditions and strategies based around four key factors that influence ridership.
The 2017 SRTP includes specific details about these initiatives in Section 8.1.
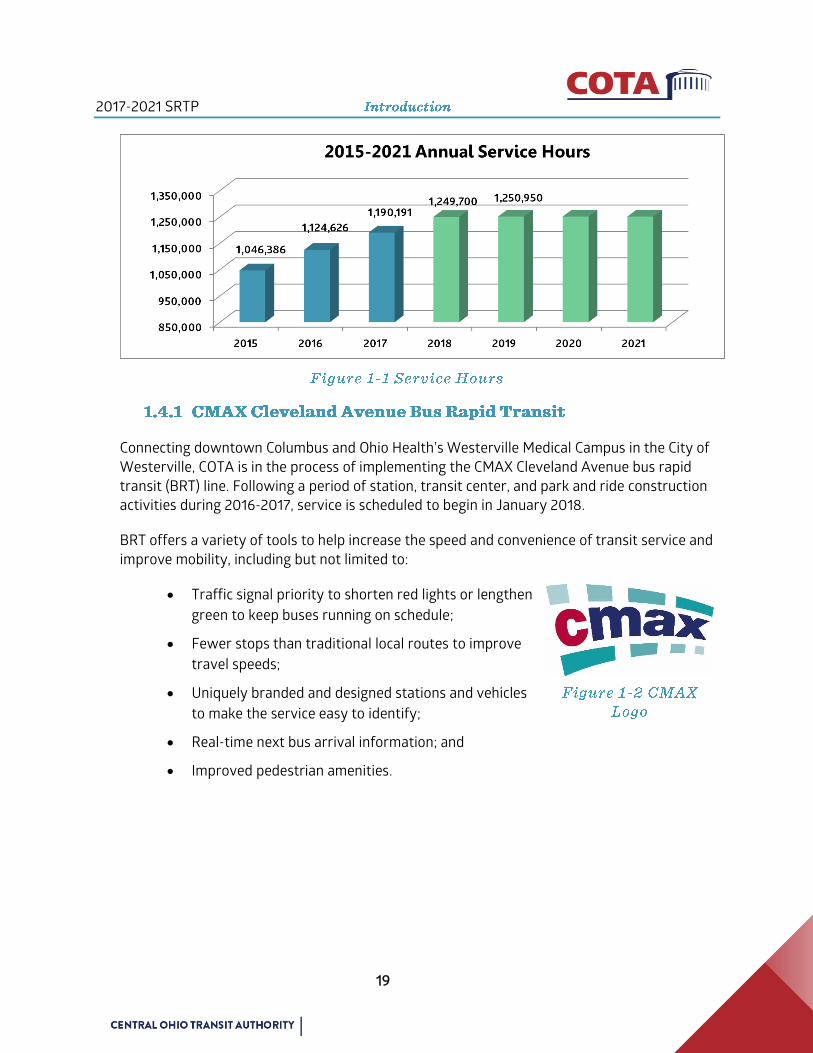
Fixed-route bus service is the backbone of the COTA system. The SRTP calls for a, system-
wide expansion of COTA’s fixed-route bus service, increasing service by about 11 percent
during the 2017 to 2021 timeframe (Figure 1-1). In 2019, COTA reaches the maximum amount
of service hours projected to be supported by the existing 0.5 percent sales tax.
The core of the service plan is the Transit System Redesign (TSR), a complete restructuring of
COTA’s bus network. The TSR is a response to changing development patterns over the last 40
years and in preparation for expected growth of an additional 1,000,000 people and 300,000
jobs by 20501. Changes include improved frequencies, new connections and more weekend
service. Most of the changes will be implemented on May 1, 2017.
In addition to the TSR, the CMAX Cleveland Avenue Bus Rapid Transit (BRT) will open in
January 2018. See Section 5 for more details.
1 getinsight2050.org/
2017-2021 SRTP
19
Connecting downtown Columbus and Ohio Health’s Westerville Medical Campus in the City of
Westerville, COTA is in the process of implementing the CMAX Cleveland Avenue bus rapid
transit (BRT) line. Following a period of station, transit center, and park and ride construction
activities during 2016-2017, service is scheduled to begin in January 2018.
BRT offers a variety of tools to help increase the speed and convenience of transit service and
improve mobility, including but not limited to:
Traffic signal priority to shorten red lights or lengthen
green to keep buses running on schedule;
Fewer stops than traditional local routes to improve
travel speeds;
Uniquely branded and designed stations and vehicles
to make the service easy to identify;
Real-time next bus arrival information; and
Improved pedestrian amenities.

2017-2021 SRTP
20
Project benefits include:
Improved transit service
Improved mobility and
reliability in a congested
corridor
Travel time savings of
approximately 21 percent
More travel options for
corridor residents, visitors
and customers
Improved pedestrian access and safety
Creates opportunities for economic development within the corridor
Premium platforms featuring next-bus arrival information screens
See Section 5.5 for more information about the CMAX project and Section 3.3 for information
about CMAX public involvement. For project updates visit www.cotabrt.com.
Beyond the service plan the SRTP contains initiatives, capital and operating plans and projects
that support the delivery of fixed-route bus service.
The Fixed-Route Bus Fleet plan ensures COTA keeps an up-to-date fleet of 30’, 35’,
and 40’ buses. At the end of 2016 COTA’s bus fleet contained 354 buses, out of
those 122 are fueled by compressed natural gas (CNG). Details about the fixed-
route bus fleet plan are found in Section 6.
Mainstream is COTA’s demand-response mobility option for persons with
disabilities that are prevented from using regular fixed-route services. The SRTP
provides a substantial increase in Mainstream service as the fixed-route network
expands via the TSR. Improvements to Mainstream are found in Section 7
Special Initiatives include projects, services and amenities that provide a better
experience to customers and prepare COTA for the future. This includes initiatives
such as customer services, bus pass programs, special services and bike and bus as
well as specific initiatives to reach 25 million annual rides by 2025. See Section 8
for more details.
2017-2021 SRTP
21
The Facilities plan includes current and future construction projects of COTA’s bus
maintenance and paratransit facilities, park & rides, transit centers and bus stops.
COTA plans to construct a new transit center and park & ride, the Northland
Transit Center, at Cleveland Avenue and SR-161 as well as renovating the Easton
Transit Center. See Section 9 for more details.
Intelligent Transportation Systems represent a range of technologies including,
Computer Aided Dispatch/Automatic Vehicle Location (CAD/AVL), traveler
information, electronic fare payment, transit security systems, Automated
Passenger Counters (APC), vehicle fleet monitoring devices, traffic signal priority,
and a variety of operations and planning oriented applications. This includes
coordination with Smart Columbus, a federal grant funded technology initiative.
See Section 10 for more details.
COTA’s Security and Emergency Services plan protects customers, employees and
the public. Off-duty police officers, video cameras and audio recording capabilities
on buses are a few of the security measures taken by COTA. For more information,
see Section 11.
With consideration given to the changing economic environment, this SRTP serves as a tool to
carefully identify where COTA plans to modify or implement transit resources during 2017-
2021.
The plan has been updated in response to comments and suggestions received over the past
four years from area residents, businesses, government agencies, and other community
stakeholders. The 2018-2021 COTA TIP financial summary can be found in Section 12 and the
2018-2021 TIP summary of projects can be found in Appendix D.
Voters approved Issue 7 in November 2006, and collection of the new tax became effective
April 1, 2007. COTA elected to hold its existing, permanent 0.25% tax in abeyance for the
remaining nine months of 2007. Actual collection of both COTA levies did not begin until
January 1, 2008. Suspending the permanent sales tax was done in order to fulfill a promise to
the community to not increase the overall effective sales tax rate in Franklin County. This
commitment was made in anticipation of an already planned 0.25% reduction in the sales tax
by Franklin County, effective December 31, 2007.
Since the passing of the temporary sales tax in 2006, as planned, between 2008 and 2009
COTA expanded service by an additional 60,000 annual hours of service. Following a severe
economic recession that began in 2008, in 2010 COTA adjusted the planned annual rate of
2017-2021 SRTP
22
service expansion from 60,000 hours of operation to approximately 40,000 hours between
2010 and 2012. In 2013, COTA was able to readjust its service expansion in response to
unexpected economic growth adding, on average, 60,000 hours annually between 2013 and
2014 and 51,000 hours annually between 2015 and 2018, with an increase of about 2,000
hours in 2019.
As central Ohio continues to grow and develop, COTA will adjust its expansion plan as more
service hours become available. Developing areas such as Dublin, Grandview Yard, Italian
Village, and Franklinton generate additional interest in transit and economic growth. In
response, additional service hours will be distributed throughout COTA’s service area, which
includes Franklin, and small portions of Delaware, Fairfield, Union, and Licking Counties.
During 2017-2021, COTA will:
For 2017-2021, COTA will add approximately 126,000 annualized hours of service
per year. Current projections indicate the expansion of service hours will reach the
budgeted, sustainable level of service in 2019. After 2019, minor adjustments will
be made to the network as a result of ongoing service analysis, and;
As fixed-route service expansion occurs, Mainstream and other alternative
mobility related services will continue to be provided. Mainstream is estimated to
expand on an annual basis by approximately 3.5%.
As a result of the proposed service expansion presented in this SRTP, COTA’s projected
operating expenses will increase from approximately $134.4 million in 2017 to $155.3 million in
2021.
During development of this SRTP, COTA’s initial projections of service hours, conducted in the
fall of 2016, were used to plan the service improvements from 2017 to 2021.
Capital items required for public transit service include vehicles, vehicle maintenance facilities,
passenger amenities (such as shelters and benches), transit facilities (e.g., park and
rides/transit centers), various computer and security related systems, etc. Many capital
elements will be required to improve and expand COTA’s transit services over the next five
years, including:
In conjunction with the increase in fixed-route service hours during 2017-2019,
COTA will be reducing its fixed-route active fleet from 357 in 2017 to 333 following
the implementation of the TSR. The procurement process for ordering and delivery
of fixed-route coaches takes approximately 12 to 18 months. On average, COTA will
purchase 28 CNG buses annually from 2017-2021. In 2017, 13 new uniquely

2017-2021 SRTP
23
branded buses for the Cleveland Avenue CMAX BRT service will be added to the
fleet. The BRT fleet will have a separate replacement schedule due to their unique
design and special branding.
During this SRTP cycle, the following vehicles will be replaced:
2017 – Eight 35’ 2005 Gilligs, four 40’ 2005 New Flyers and thirty-two 35’ 2007
Gilligs;
2018 – Ten 30’ 2008 Gilligs and 24 40’ 2008 Gilligs
2019 – Five 40’ 2008 Gilligs, ten 30’ 2009 Gilligs and fourteen 40’ 2009 Gilligs
2020 – Sixteen 40’ 2009 Gilligs, three 30’ 2010 Gilligs and ten 40’ 2010 Gilligs
2021 – Twenty-seven 40’ 2010 Gilligs and two 40’ 2010 Gilligs (hybrid)
COTA will need to replace 89 Mainstream vehicles between 2017 and 2021. An additional
seven vehicles will be purchased to support expansion of Mainstream delivery services.
Park and rides/transit centers: COTA will make a significant investment in the design and
construction of several park and ride/transit center facilities in order to support express-route
service. Locations include:
Winchester Pike and Gender Road to replace the currently leased Park & Ride on
Gender Road;
Northern Lights area park & ride: As part of the proposed CMAX Cleveland Avenue
BRT, the current leased Northern Lights Park & Ride site will be relocated to the
immediate north of the shopping center; and
Northland transit center and park & ride: Also part of the CMAX Cleveland Avenue
BRT project, adjacent to the future Huntington Bank facility, the transit center will
be located near Cleveland Avenue and SR-161. The center is proposed to have an
indoor waiting environment with real time bus arrival information. See sections 5.5
and 9.2 for more details.
COTA is also proposing the following capital projects:
CMAX Cleveland Avenue Bus Rapid Transit (BRT) - BRT offers a variety of tools to
help increase the speed and convenience of transit service and improve mobility;
Bus on Shoulder Program: In September 2015, COTA implemented a second Bus on
Shoulder (BOS) Corridor. The BOS program is in partnership with MORPC and the
Ohio Department of Transportation. Similar to the existing I-70 corridor between
Downtown and SR-256, express buses traveling on I-670 between Downtown and

2017-2021 SRTP
24
I-270 on the east side of Columbus will be able to merge onto the freeway shoulder
to avoid congestion delays. Unlike I-70 which uses the outside (or right) berm,
express buses will utilize the inside (or left) berm of I-670 corridor.
McKinley Avenue Facility Renovation: This facility has been undergoing
renovations to support CNG vehicles. Improvements to the facility will, among
other benefits, improve energy efficiency, reduce greenhouse gas emission, and
improve operational flow efficiencies.
CNG fueling stations for buses are operational as of May 2013 and small vehicle
fueling stations are planned to be installed. COTA will allow other government
entities to fuel vehicles at a specific station.
The total cost of the project is estimated to be $99.5 million. See Section 9.1 for
more details.
Fields Avenue Bus Storage and Maintenance Facility: During 2017-2019, COTA
plans to begin an upgrade to the Fields Avenue Facility to allow for CNG buses and
vehicles to be stored and repaired within the garage.
Mainstream and Eligibility Assessment Center: The facility houses all paratransit
operations, administrative offices, vehicle maintenance and repair areas, and an
eligibility assessment center. During 2017-2019, COTA plans to upgrade the facility.
The SRTP provides the community with a performance and service delivery based approach to
meet immediate transit needs while proactively mapping out strategies to provide workable
and sustainable transit initiatives for the future. Throughout the implementation of this plan,
COTA's Board of Trustees and management staff will continue to work vigorously to provide
affordable, cost effective public transit services to the citizens of central Ohio.
2017-2021 SRTP
25
Over the past decade, both COTA’s ridership and the central Ohio region have experienced
tremendous growth. With additional sales tax funding made possible by the support of central
Ohio voters in 2006, COTA has been able to add more service to its bus network, catalyzing
growth in ridership while other agencies, nationwide, have experienced declining ridership.
Additionally, strong growth in employment and population (particularly a movement back
towards denser, urban areas that support transit use), has helped sustain and grow ridership. In
relation to COTA’s 25 million annual rides by 2025 goal, the Mid-Ohio Regional Planning
Commission (MORPC) predicts current growth trends will add approximately 38,981 jobs and
108,011 residents to COTA’s service area by 2025. Initiatives such as insight20502 predict a much
stronger trend of growth and assume there will be a change in how the region plans its
communities, preferring an increase in denser development and a focus on infill.
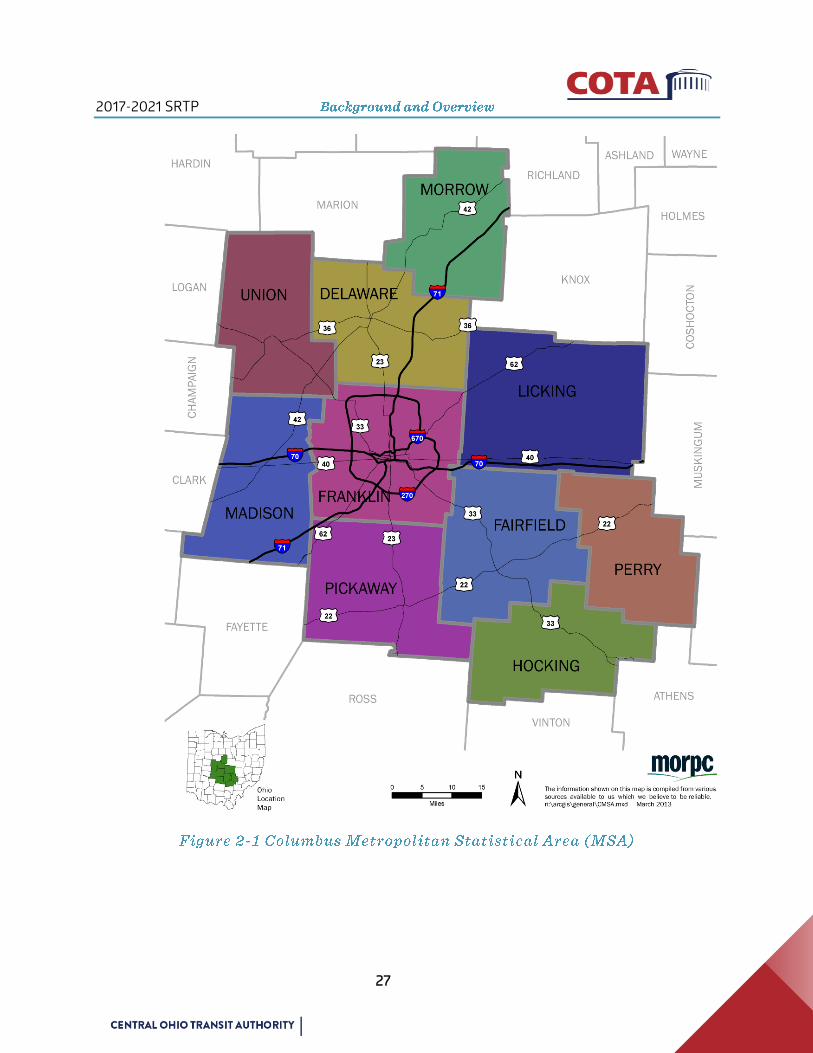
COTA’s service area is within the Columbus Metropolitan Statistical Area (MSA), which
consists of eight counties in central Ohio. The counties include Delaware, Fairfield, Franklin,
Licking, Madison, Morrow, Pickaway, and Union (See Figure 2-1). The 2015 5-year American
Community Survey population estimate for the MSA is 2,021,6323. Franklin County is
estimated to have 1,251,722 people, making it the MSA’s largest county in terms of population.
There are 26 incorporated municipalities in Franklin County. Columbus is the largest city in
Franklin County, with a population of 861,141.
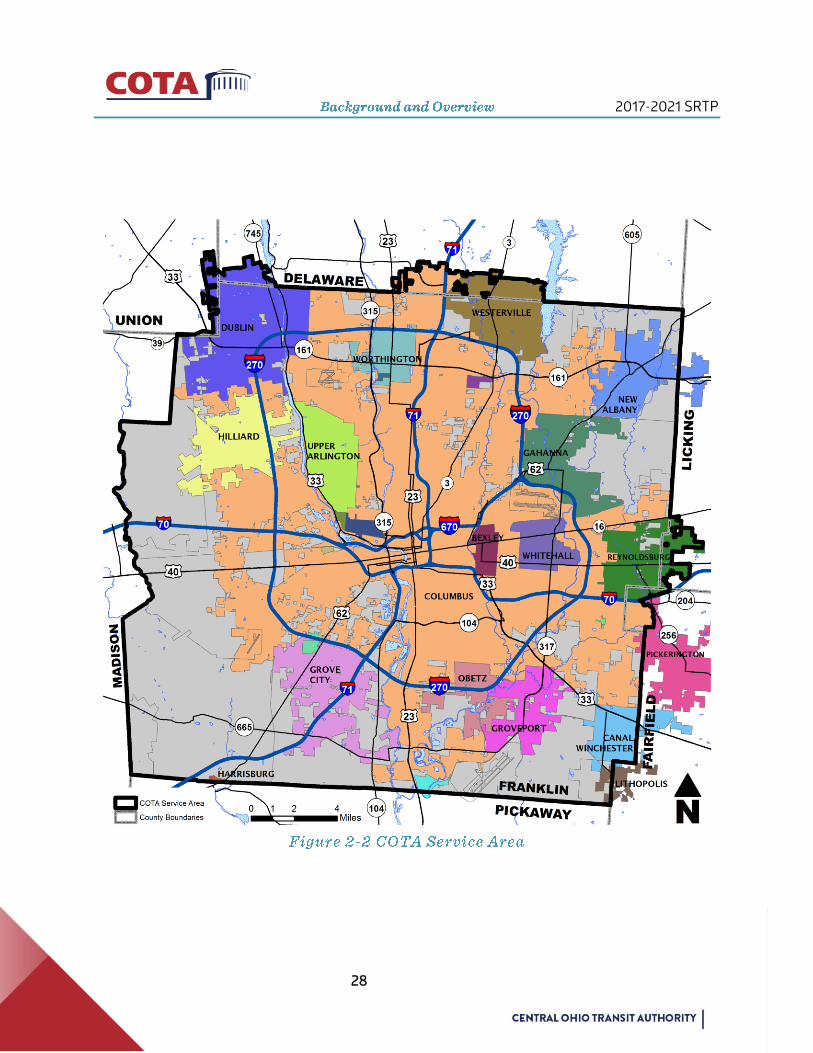
COTA’s service area encompasses Franklin County and parts of Delaware, Union, Licking and
Fairfield counties (See Figure 2-2). Residents from the entire MSA travel to jobs within COTA’s
service area daily, increasing traffic congestion and demand for alternative forms of
transportation to jobs, education and other daily activities. COTA’s service and taxing areas
have a combined population of 1,225,380 (Table 2-1).
The central Ohio region is growing, bucking trends other Midwest cities have experienced of
slow to no growth. MORPC predicts strong population growth in neighborhoods adjacent to
Downtown such as Short North, Franklinton, Hilltop, Grandview Yard and OSU. Additionally,
growth will continue in suburban areas, particularly in denser developments such as Dublin’s
Bridge Street District. Projections based on 2015 development, job and population trends and
2 getinsight2050.org 3 Annual Estimates of the Resident Population: April 1, 2010 to July 1, 2015 Source: U.S. Census Bureau, Population Division Release Date: March 2016

2017-2021 SRTP
26
local plans estimate an 8.8 percent growth in population and 4.4 percent growth in jobs within
COTA’s 562 sq. mi. service area by 2025.
Figures 2-5 and 2-6 below visually show the growth in population and jobs based on MORPC’s
projections of current conditions. Table 2-1 displays the aggregate changes within COTA’s
service area.
In 2014, MORPC and the Urban Land Institute (ULI) Columbus launched insight2050 to develop
various scenarios of how the region would grow if a stronger emphasis was placed on
increasing density. According to projections prepared by insight2050’s 2014 report, the
population in central Ohio is expected to increase by approximately 500,000 by 2050. In May
of 2016, new projections based on recent population shifts and building trends show a
possible population growth of up to 1,000,000 by 2050. These projections encompass the
seven county region, including Franklin County, and do not assign projections to smaller
geographies. http://getinsight2050.org/
This growth will lead to higher demand for transit both due to an increasing number of
commuters, and to an emerging demand for quality transit services to support a transit
lifestyle among young professionals and retired persons. To serve these two transit-
supportive cohorts, service must be frequent and quick while being supported by amenities at
stops and intelligent transportation system (ITS) components, such as real-time bus arrival
information.5
4 Projections provided by the Mid-Ohio Regional Planning Commission as part of the 2016 Metropolitan Transportation Plan Update 5 TransitCenter. Who’s On Board 2016. http://transitcenter.org/ (2016)
2015 2025 ΔPop 2015 2025 ΔJobs
Service Area 1,225,380 1,333,391 108,011 876,752 915,733 38,981
1/4 mi.* 800,752 862,426 61,674 716,171 742,876 26,705*Within 1/4 mile of the TSR Network
2017-2021 SRTP
27
2017-2021 SRTP
28

2017-2021 SRTP
29

2017-2021 SRTP
30

2017-2021 SRTP
31
2017-2021 SRTP
32
Additionally, greater roadway congestion is expected to contribute to an increased need for
mass transit in central Ohio. According to the 2012 Report on Urban Mobility published by the
Texas A&M Transportation Institute, Columbus area drivers spent 41 hours stuck in traffic in
2014, more than any other major city in Ohio. By 2040, MORPC projects an increase of nearly
13% in total roadway congestion within COTA’s service area.
Changing conditions within central Ohio play a key role in how COTA develops plans for the
future. Additional external factors influencing demand for public transit include land use and
development patterns, employment levels, fluctuating gas prices (Figure 2-5 and 2-6), and
socio-economic factors. These are all elements that present both challenges and opportunities
when planning for the future of public transportation in the region. Integrating short-range
initiatives into the Authority’s long-range plans is also critical. A brief description of COTA’s
Long-Range Transit Plan and its components follows.
The goals of the SRTP were developed as part of COTA’s Long-Range Transit Plan (LRTP),
which guides the agency through 2040. Utilizing a variety of methods to ensure public
participation, COTA developed the LRTP in response to the growing transportation needs of
the central Ohio region by providing an expanded, reliable, and safe transit system for the
future.
COTA typically updates the LRTP every four years. The update allows COTA to adjust its plans
based upon current demographic, economic, and traffic conditions, as well as federal and
State funding changes. In addition to the LRTP, in December 2014 COTA launched a long-range
transit planning initiative called COTA NextGen. More information about NextGen is found
below.
As the primary provider of public transit services in central Ohio, COTA is undertaking a long-
range planning effort - NextGen - to identify public transportation needs and opportunities
through 2050.
Central Ohio is growing and changing as the region adds new residents and the preferences
and priorities of current residents change. While other efforts have helped evaluate these
trends and translate them into plans for community growth and development, NextGen will
comprehensively consider how these trends will shape opportunities and demand for public
transportation. Visit www.cota.com/nextgen
NextGen goals:
2017-2021 SRTP
33
Lead the community in envisioning what our public transportation system needs to
accomplish in the coming decades to ensure central Ohioans have access to jobs,
housing, education, and services.
Prepare central Ohio for future growth by identifying transit investments that
integrate with regional plans and goals. Critical regional goals include maintaining
regional competitiveness, minimizing sprawl, and responding to demographic
preferences.
Create transit investment options to support local and regional efforts to develop
transit-oriented and multi-modal communities.
Identify conventional and creative revenue options that offer potential to support
the recommended plan and ensure the plan can be implemented.
This project is being completed in coordination with Connect Columbus, Smart Columbus and
MORPC’s 2040 Metropolitan Transportation Plan (MTP).
In 1970, the Columbus and Southern Ohio Electric Company, the parent corporation of the
Columbus Transit Company (CTC), announced its decision to dispose of the bus company. In
order to preserve transit in the central Ohio region, a group of citizens formed the Advisory
Committee on Transit. One of the Committee's first actions was to lobby the State legislature
to permit the formation of regional transit authorities. Once enacted, the next step was the
creation of COTA.
The agreement creating COTA was authorized by the Franklin County Commissioners and the
City Councils of Bexley, Columbus, Gahanna, Grandview Heights, Grove City, Hilliard,
Reynoldsburg, Upper Arlington, Westerville, Whitehall, and Worthington. A thirteen member
Board of Trustees was created for COTA. The Board of Trustees was composed of eleven
trustees appointed by the mayors of the eleven member cities, and two trustees selected by
the Franklin County Commissioners.
On June 29, 1973, an agreement for COTA to purchase the privately owned bus company from
CTC and the Columbus and Southern Ohio Electric Company was signed. The acquisition was
effective, and COTA began providing transit service on January 1, 1974. Ridership in the last
year of CTC ownership (1973) was 12,975,000 rides total for the entire year.
Since COTA began operating in 1974, the system has grown into an integral part of central
Ohio’s transportation network. During this time, not only has the City of Columbus continued
to grow and prosper, but so have its adjoining suburban communities. In 2008, the agreement
creating the COTA was modified to include the City of Dublin as a member city. The Board of
Trustees currently consists of thirteen members; seven appointed by the City of Columbus,
2017-2021 SRTP
34
two appointed by the Franklin County Commissioners, and four city appointed slots rotated
among the other member cities.
COTA’s existing level of transit service is funded through a 0.5% local sales tax, of which 0.25%
is temporary, federal, and state assistance and farebox receipts. The majority of the funding
(85% as of 2017) is generated from the local sales tax. In 1999, central Ohio voters passed a
ballot initiative, which established for the first time a permanent, local funding source for
COTA.
COTA ridership and service began to grow in the first year of public operation. Ridership
reached its peak in 1985 with 26,700,334 passenger trips and 822,289 hours of operation. In
1986 and 1987, work stoppages negatively affected the amount of service provided and
ridership. In 1988, the downward trend was reversed as both ridership and service increased.
During this same year, COTA went to the taxpayers and requested additional funding in the
form of a local sales tax.
With the defeat of a local sales tax issue in November of 1988, COTA was required to make
significant reductions in service in order to stretch its resources to the November 1989
election. As a result, COTA's ridership dropped in 1989. In November 1989, voters passed a
temporary ten-year, 0.25% sales tax that provided the essential local funds to restore the
productive service eliminated in 1989 and provide for modest growth in the system.
In order to provide financial support for the implementation of COTA’s 1995 Expanded Bus
Plan, COTA placed an additional 0.25% 10-year temporary sales tax issue on the ballot in
November 1995. Following the close defeat of this issue, COTA developed a long-term plan
(Vision 2020) which included both expansion of COTA’s bus service and the introduction of
commuter and light rail service.
Facing the expiration of the 1990 ten-year 0.25% sales tax, COTA sought permanent funding
for existing levels of service and additional funding to implement Vision 2020. Two separate
0.25% sales tax issues, Issues 20 and 21 were placed on the November 1999 ballot for voter
approval. Issue 20 successfully passed and established for the first time in COTA's history a
permanent source of funding; however, Issue 21 did not pass.
Strategic partnerships aimed to expand transit service and increase ridership have been
formed with many local colleges, universities, social service agencies, and businesses. These
partnerships have had a positive impact towards improved transit service in the central Ohio
area, however, as the national economy began experiencing a downward trend in 2001, public
transit systems across the country, including COTA, experienced dwindling local, state, and
federal assistance.

2017-2021 SRTP
35
Over the following several years, COTA’s yearly budgets were negatively impacted by rapidly
increasing healthcare insurance, fuel, and utility costs. During the six-year period from 2001 to
2006, COTA was forced to reduce fixed-route service hours by approximately 25%. In January
2006, in an effort to maintain a balanced and fiscally responsible budget, COTA was forced to
raise fixed-route and mobility service bus fares by an average of 12%. As a result, COTA’s
fixed-route ridership declined to 14,797,951 passengers in 2006.
During these difficult times, COTA recognized that as the region was growing, unmet
transportation needs were also increasing throughout the community. In the fall of 2005,
COTA began soliciting public and community stakeholder input in order to develop the LRTP.
In November 2006, COTA placed before voters a 10-year, renewable 0.25% sales tax levy
(Issue 7). Issue 7 successfully passed, and effective January 1, 2008, has been combined with
COTA’s permanent 0.25% local sales tax approved in 1999.
Since the passing of the temporary sales tax in 2006, as planned, between 2008 and 2009
COTA expanded service by an additional 60,000 annual hours of service. Following a severe
economic recession that began in 2008, in 2010 COTA adjusted the planned annual rate of
service expansion from 60,000 hours of operation to approximately 40,000 hours between
2010 and 2012. In 2013, COTA was able to readjust its service expansion in response to
unexpected economic growth adding, on average, 60,000 hours annually between 2013 and
2014 and 51,000 hours annually between 2015 and 2018, with an increase of about 2,000
hours in 2019.
COTA receives funding from a permanent 0.25% sales tax and the 10-year renewable 0.25%
sales tax. Current funding levels are required in order to continue the planned annual rate of
service expansion from 2017 to 2021. In 2016, the current renewable 0.25% sales tax was
renewed another ten years.

2017-2021 SRTP
36
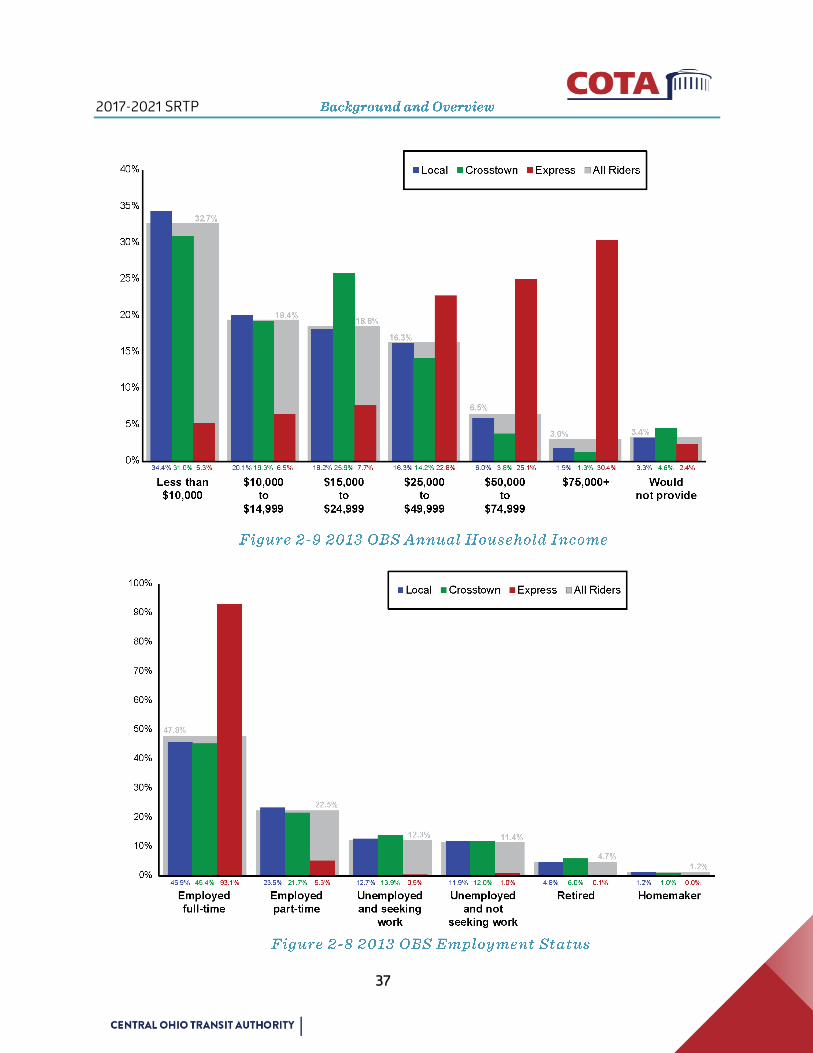
During the spring and fall of 2013, an On Board Survey (OBS) was conducted on all COTA routes.
The survey was conducted with the cooperation of MORPC, ODOT, the FTA, and OSU. The purpose
of the survey was to capture accurate and reliable travel patterns and socio-demographic
characteristics of the community’s transit passengers. The details obtained by the survey are
being utilized to help update MORPC’s regional transportation model, and to assist with future
transit planning and marketing efforts. Some key findings are described in Figures 2-7 through 2-
13.
55% of all customers under 35
71% of Express customers over 35
2017-2021 SRTP
37
71% of all customer households under $25,000
81% of Express customer households over $25,000
70% of all customers employed full or part-time
98% of Express customers employed full or part-time
2017-2021 SRTP
38
61% of all customer households have no working vehicles
89% of Express customer households have 1 or more
working vehicles
53% of all customers
indicate Black/African-
American
41% of all customer
indicate
White/Caucasian
2017-2021 SRTP
39
25% of customers make at least one
transfer to complete a one-way trip

2017-2021 SRTP
40
In the fall of 2016, EMC Research, a market research and opinion firm based in Columbus, Ohio,
conducted a Customer Satisfaction Survey (CSS) on COTA routes. The survey was an on-board
intercept survey conducted by a live interviewer via tablet. The goal of the CSS was to gather
passengers’ feedback on COTA’s service, but it also captured some travel pattern and socio-
demographic data of COTA riders. Highlights of the findings are depicted in Figures 2-14 through
2-27.
2017-2021 SRTP
41
2017-2021 SRTP
42
2017-2021 SRTP
43
2017-2021 SRTP
44
2017-2021 SRTP
45
2017-2021 SRTP
46
2017-2021 SRTP
47
2017-2021 SRTP
48
Public engagement and conversation is critical to the success of COTA’s planning efforts. Not only
does COTA conduct outreach as a public agency, COTA also relies on its riders, community leaders,
local governments, business communities, and other stakeholders to provide invaluable input
about current and future transit needs. Typically, two rounds of public meetings are held during
the process of developing the SRTP, one set in the fall before the completion of the document and
one set in the spring.
However, because the service plan and supporting capital plan are based on the proposed
changes in the Transit System Review and subsequent Transit System Redesign (TSR) plan
revisions – which included substantial public and stakeholder outreach – only one set of public
meetings were held for this SRTP. (See Section 5 for more details.)
In conjunction with the TSR, two (2) public meetings were held in March 2017, in which the public
was invited to provide input on the SRTP both at the meetings and online through social media,
email, and COTA’s website (COTA.com/TSR). The SRTP will also be available for review at two (2)
public meetings held in April 2017 regarding Downtown Columbus service changes.
Public comment opportunities were promoted in accordance
with the COTA Public Comment Process for Service Changes,
including notices posted at least two (2) weeks prior to the
meetings on every fixed-route bus, COTA website, social
media and monitors installed at COTA transit centers. Notices
are also sent to charter cities, government agencies, area
commissions, civic associations, major employers, staffing
agencies, churches, schools, social service agencies, Limited
English Proficiency (LEP) service providers and disabled
communities and mobility providers. Media advisories were
distributed to all local media (traditional and non-traditional) in our service territory, including
newspaper, radio, and TV stations.
COTA’s Board of Trustees was kept engaged with the process. As representatives of the
community and governing board of COTA, their input, discussion, and support led to the
successful completion of the document.
Public Involvement is the cornerstone of COTA’s service planning strategy.
COTA executed a comprehensive public input process as part of the Transit System Review and
subsequent Transit System Redesign (TSR) plan revisions between 2014 and 2016.

2017-2021 SRTP
49
Since the review study began, the TSR was
discussed at more than 50 public meetings
(See Appendix C). Of those meetings, more
than 20 public meetings were held
specifically to provide opportunities for
public comment on the TSR. Additionally, 94
presentations were provided to community
groups and stakeholder leaders during the
comment period.
As part of COTA’s strong commitment to
Title VI of the Civil Rights Act of 1964 and
environmental justice, most meetings (72%) were scheduled in low-income and minority
communities. All ten (10) public comment meetings in 2015 were held in these areas, and 33
community presentations were given to community groups that include low-income and minority
stakeholders.
The public involvement program of the TSR study also included:
Establishing a transit advisory committee (TAC) with representation of a cross‐
section of COTA and community stakeholders while maintaining a workable
number of participants.
Small focus group meetings held at the beginning and at the end of the study to
receive input from difficult to reach market segments.
A web based survey available to the public from January to April 2014 to introduce
and seek input on the TSR. Over 1,250 people responded with 75% of those having
used COTA in the past year.
A steering committee consisting of COTA staff. Regular meetings were held with
this committee as well as updates on study progress provided through conference
call and email communications during the course of the study. Members of the
committee were invited to participate in the Core Planning activities, to assist in
identifying stakeholders for the TAC, and to help identify the market segments for
focus group participation.
Input and feedback from COTA employees such as bus operators and supervisors,
and customer service representatives through one-on-one discussions and on-road
visits.
Presentations to and involvement by the COTA Board of Trustees in order to both
inform them as well as seek their direction. The Board was consulted at three
points in the study.

2017-2021 SRTP
50
The input COTA received from our customers, community leaders and other stakeholders helped
to shape the final plan. Several lines were restructured and realigned to better serve our
customers, particularly transit-dependent communities and commuters.
The final bus network plan was completed in January 2017.
COTA’s public involvement strategy shifted in 2017 from gathering feedback to dispensing
finalized information about the final TSR system. COTA has developed comprehensive plans for
Marketing, Communications and Public Involvement, as well as Community and Government
Relations.
This strategy, currently underway, focuses on meeting customers where they are, by responding
to individual customers’ questions about changes to bus service via a dedicated email address and
information phone number; travel training, and one-on-one interactions by our street team at the
20 highest activity stops in the current system. Our goal is to ensure that all current riders have
the opportunity to understand how changes may affect their daily commute.
Four (4) public meetings are being held (as previously mentioned) in downtown Columbus, to
proactively provide a centralized opportunity to customers to learn about the TSR. Additional
information sessions will be scheduled, as needed.
As part of stakeholder engagement, COTA is
presenting information about the TSR to area
commissions, civic associations, neighborhood
groups, business organizations and other
constituencies. COTA is also engaging high-level
policymakers and thought leaders – including
elected officials and private industry executives –
through one-on-one meetings; personal or
conference phone calls; and/or emails. Outreach
is scheduled according to physical changes to the
COTA system, including bus stop replacements
and transfer zone signage as part of a new,
comprehensive wayfinding system across all
delivery channels launching as part of the TSR.
COTA will also communicate the changes through
a robust marketing and public relations campaign
in traditional media and social media. The
comprehensive marketing plan will incorporate a
creative channel mix of targeted approaches in
various communities and along transit corridors,
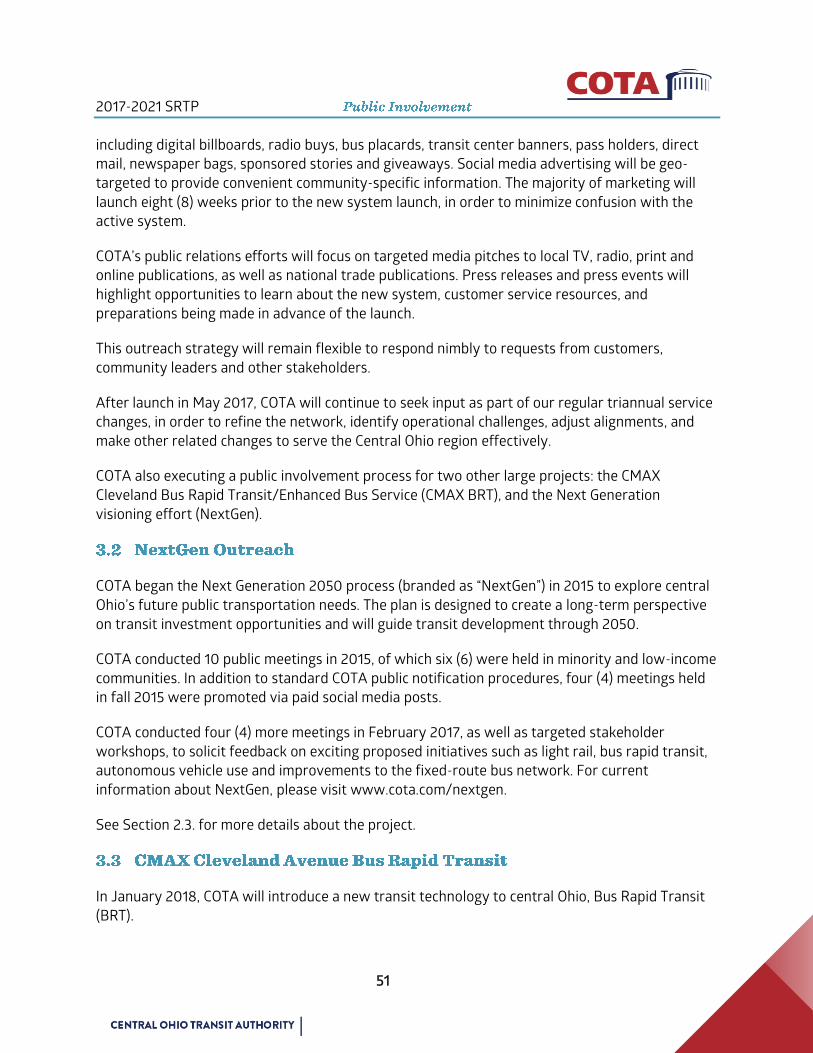
2017-2021 SRTP
51
including digital billboards, radio buys, bus placards, transit center banners, pass holders, direct
mail, newspaper bags, sponsored stories and giveaways. Social media advertising will be geo-
targeted to provide convenient community-specific information. The majority of marketing will
launch eight (8) weeks prior to the new system launch, in order to minimize confusion with the
active system.
COTA’s public relations efforts will focus on targeted media pitches to local TV, radio, print and
online publications, as well as national trade publications. Press releases and press events will
highlight opportunities to learn about the new system, customer service resources, and
preparations being made in advance of the launch.
This outreach strategy will remain flexible to respond nimbly to requests from customers,
community leaders and other stakeholders.
After launch in May 2017, COTA will continue to seek input as part of our regular triannual service
changes, in order to refine the network, identify operational challenges, adjust alignments, and
make other related changes to serve the Central Ohio region effectively.
COTA also executing a public involvement process for two other large projects: the CMAX
Cleveland Bus Rapid Transit/Enhanced Bus Service (CMAX BRT), and the Next Generation
visioning effort (NextGen).
COTA began the Next Generation 2050 process (branded as “NextGen”) in 2015 to explore central
Ohio’s future public transportation needs. The plan is designed to create a long-term perspective
on transit investment opportunities and will guide transit development through 2050.
COTA conducted 10 public meetings in 2015, of which six (6) were held in minority and low-income
communities. In addition to standard COTA public notification procedures, four (4) meetings held
in fall 2015 were promoted via paid social media posts.
COTA conducted four (4) more meetings in February 2017, as well as targeted stakeholder
workshops, to solicit feedback on exciting proposed initiatives such as light rail, bus rapid transit,
autonomous vehicle use and improvements to the fixed-route bus network. For current
information about NextGen, please visit www.cota.com/nextgen.
See Section 2.3. for more details about the project.
In January 2018, COTA will introduce a new transit technology to central Ohio, Bus Rapid Transit
(BRT).
2017-2021 SRTP
52
Construction of the CMAX Cleveland Avenue BRT began in August 2016, along the Cleveland
Avenue corridor between Downtown and Polaris Parkway and Africa Road. CMAX represents a
$48 million investment in the community resulting in upgraded transit and spurring economic
development, of which Congress has approved nearly $38 million toward the project.
CMAX will result in substantial benefits for the more than 200,000 residents in the corridor and
more than 170,000 people working along the corridor. CMAX will feature faster travel times along
the corridor along with specially branded buses, upgraded transit stations and bus stops and
other customer amenities.
The communities along Cleveland Avenue are some of the most economically disadvantaged
communities in Central Ohio. A top goal for the project is to facilitate economic development in
these communities, building on COTA’s commitment to the Linden community with construction
of the Linden Transit Center in 1999.
Since 2010, the investment has been featured prominently at all community meetings, including
with the general public, elected officials, Area Commissions and other stakeholder group
meetings. COTA also hosts regular meetings with government officials and community leaders
through the CEO Advisory Group and Stakeholder Group.
COTA hosted four pre-construction open houses in July 2016 as well as presented to area
commissions. A grant signing ceremony featuring FTA Acting Administrator Carolyn Flowers was
held in June 2016, and a groundbreaking celebration with FTA Regional Administrator for Region 5
Marisol Simon was held in August 2016.
COTA is currently conducting targeted outreach to property owners along Cleveland Avenue,
expanding upon past efforts during the final design phase that concluded in fall 2015. Project
updates are sent to community stakeholders and property owners bimonthly to ensure timely
information during construction. Community stakeholders will receive informational cards with
contact information for a dedicated phone line, monitored by PI staff. The website features an
interactive map with regular updates on construction activities, as well as information about
project benefits. COTA is also maintaining a robust media campaign, both in traditional and social
media.
These efforts will continued to escalate in the lead-up to service launch in January 2018. See
Section 5.5 for more information about the CMAX BRT.

2017-2021 SRTP
53
The Transit System Redesign (TSR) bus network was developed through public input and based on
the concept of allocating resources between two service goals: efficient, high-ridership service
and lower-ridership, coverage service that serves essential locations such as employment centers.
New service design and monitoring standards were developed to support the underlying
principles of the TSR. See Section 5 for more information regarding the TSR.
Performance standards are the primary criteria for route evaluation and recommendation
processes and are applied to both service changes and the design and monitoring of new routes.
Service changes occur every trimester and are designed to improve the productivity of existing
and planned services. They include schedule, frequency, and alignment changes; more information
can be found in Section 4.4.
COTA’s Route and Schedule Design Standards codify good transit planning and operational
practices. These guidelines and standards serve several purposes:
To inform decision-makers, who may not have a background in the transit industry,
about good transit practices;
To provide an objective basis for planning new services and evaluating existing
services;
To serve as a compass for both staff and decision-makers who often may be
caught up in reactive responses to external factors; and
To support the route performance evaluation process and standards described in
the second set of performance monitoring indicators.
A second set of indicators, Route Performance Evaluation Measures, are used in an annual
evaluation of existing services that generate recommendations for service changes designed to
improve the productivity of existing and planned services.
The recommended Route and Schedule Design Standards and Route Performance Evaluation
Process are described in the following sections.
A key part of the TSR is redefining of how service is categorized. Local and crosstown
categories are replaced with frequent (15 minute or better), standard 30-minute and 60-
minute service type categories. The express, peak only, service category changes to rush hour.
An explanation of each category is below.
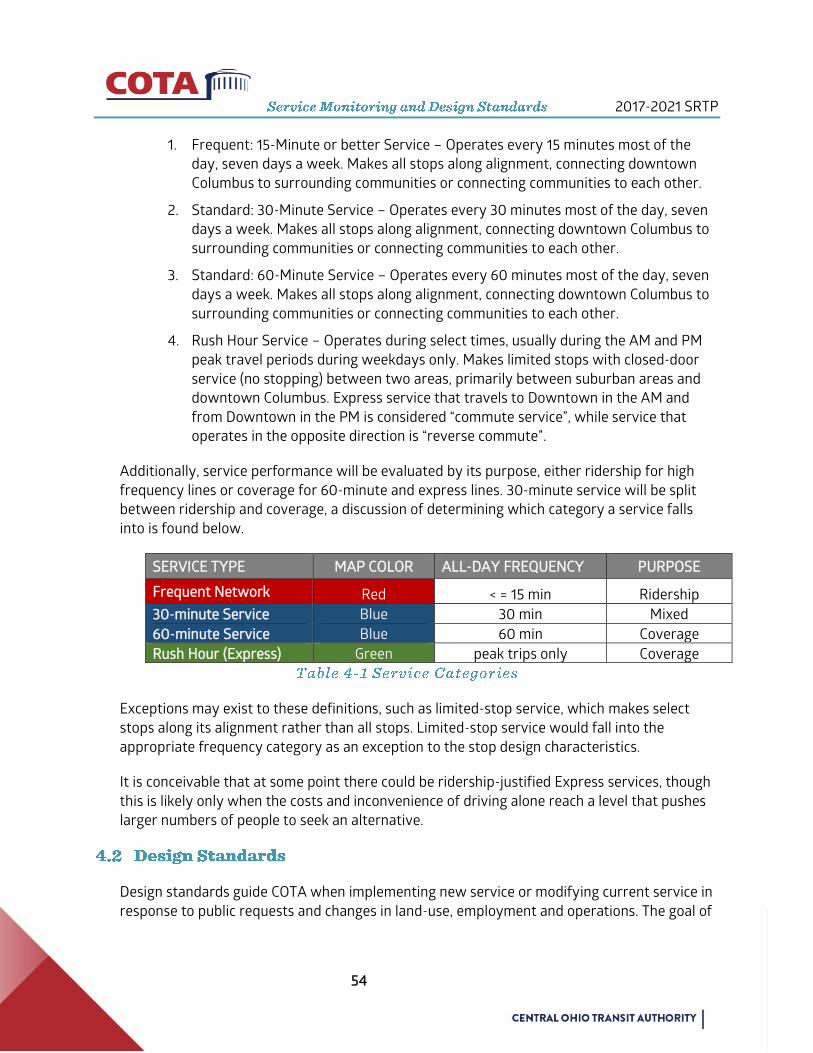
2017-2021 SRTP
54
1. Frequent: 15-Minute or better Service – Operates every 15 minutes most of the
day, seven days a week. Makes all stops along alignment, connecting downtown
Columbus to surrounding communities or connecting communities to each other.
2. Standard: 30-Minute Service – Operates every 30 minutes most of the day, seven
days a week. Makes all stops along alignment, connecting downtown Columbus to
surrounding communities or connecting communities to each other.
3. Standard: 60-Minute Service – Operates every 60 minutes most of the day, seven
days a week. Makes all stops along alignment, connecting downtown Columbus to
surrounding communities or connecting communities to each other.
4. Rush Hour Service – Operates during select times, usually during the AM and PM
peak travel periods during weekdays only. Makes limited stops with closed-door
service (no stopping) between two areas, primarily between suburban areas and
downtown Columbus. Express service that travels to Downtown in the AM and
from Downtown in the PM is considered “commute service”, while service that
operates in the opposite direction is “reverse commute”.
Additionally, service performance will be evaluated by its purpose, either ridership for high
frequency lines or coverage for 60-minute and express lines. 30-minute service will be split
between ridership and coverage, a discussion of determining which category a service falls
into is found below.
SERVICE TYPE MAP COLOR ALL-DAY FREQUENCY PURPOSE
Frequent Network Red < = 15 min Ridership
30-minute Service Blue 30 min Mixed
60-minute Service Blue 60 min Coverage
Rush Hour (Express) Green peak trips only Coverage
Exceptions may exist to these definitions, such as limited-stop service, which makes select
stops along its alignment rather than all stops. Limited-stop service would fall into the
appropriate frequency category as an exception to the stop design characteristics.
It is conceivable that at some point there could be ridership-justified Express services, though
this is likely only when the costs and inconvenience of driving alone reach a level that pushes
larger numbers of people to seek an alternative.
Design standards guide COTA when implementing new service or modifying current service in
response to public requests and changes in land-use, employment and operations. The goal of

2017-2021 SRTP
55
the standards are to provide a systematic process to answer the simple question, “Should this
proposed change in service be implemented?”
The results are recommendations to aid decision makers in determining if a proposal should
be implemented. Four primary steps are taken when considering proposed changes to fixed-
route bus service. While COTA may consider other factors and take additional steps, these
four form the foundation of examining proposed changes.
1. Designing service – This includes a proposed alignment, frequency and span of
service.
2. Determine if service should be implemented – A three step process to determine if
the service would improve the network overall.
3. Evaluate cost of service – Estimation of cost of service.
4. Analyze Title VI and Environmental Justice impacts – Ensure the change in service
does not discriminate against special populations.
Proposed new bus service or modifications to bus service must be designed with a set of
criteria that ensures a high quality, effective design based on the goal of the proposal
(ridership or coverage).
To develop a proposal for new service or modifying current service, the proposal must have a
clear purpose to either generate ridership with 30 minute or better service or serve locations
more difficult to reach, in less dense areas, with less-frequent 30 to 60 minute service, or
express service.
An initial alignment must be drawn based on the purpose of the proposal generally following
the guidelines below:
Ridership lines (higher frequency, higher ridership) should be linear with
minimal to no deviations, serving areas with high population and job density,
ample sidewalk connections and continuous development while not
overlapping other ridership lines. Ridership lines should serve only the busiest
corridors.
Coverage lines (lower frequency, lower ridership) should be designed to serve
as many jobs and population as possible while deviating from the main
alignment only to increase the number of people served. Coverage lines
typically serve suburban areas or areas between two higher-frequency lines
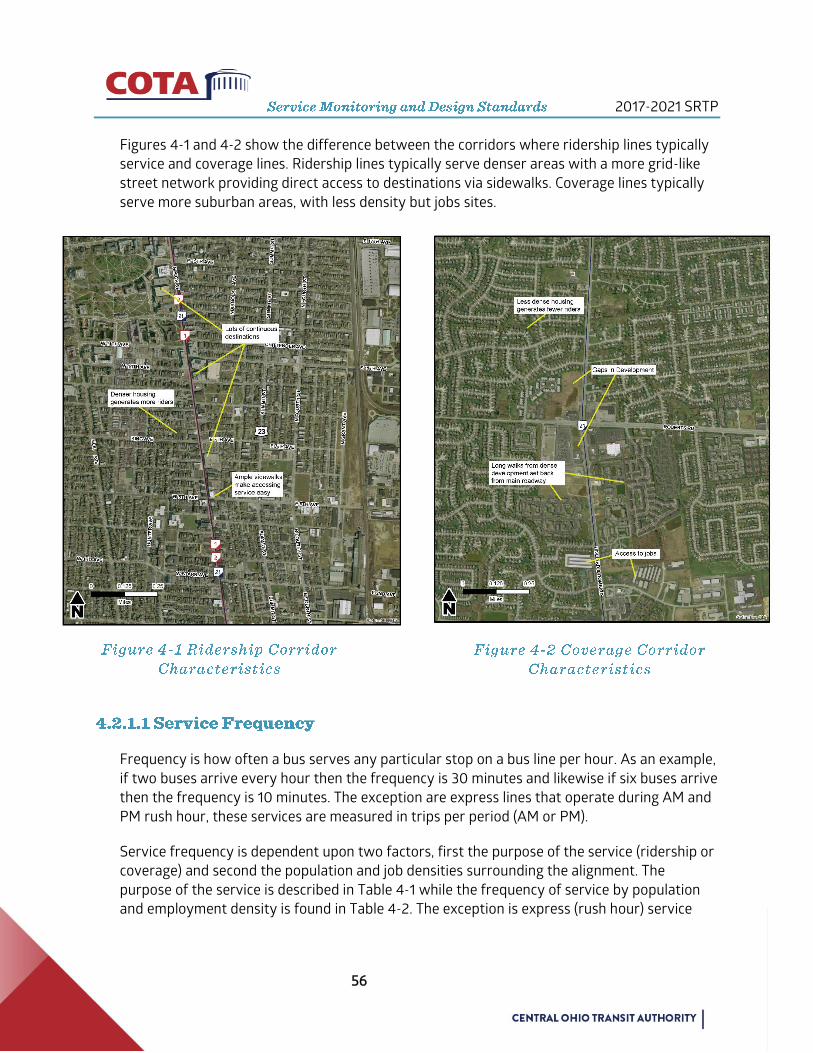
2017-2021 SRTP
56
Figures 4-1 and 4-2 show the difference between the corridors where ridership lines typically
service and coverage lines. Ridership lines typically serve denser areas with a more grid-like
street network providing direct access to destinations via sidewalks. Coverage lines typically
serve more suburban areas, with less density but jobs sites.
Frequency is how often a bus serves any particular stop on a bus line per hour. As an example,
if two buses arrive every hour then the frequency is 30 minutes and likewise if six buses arrive
then the frequency is 10 minutes. The exception are express lines that operate during AM and
PM rush hour, these services are measured in trips per period (AM or PM).
Service frequency is dependent upon two factors, first the purpose of the service (ridership or
coverage) and second the population and job densities surrounding the alignment. The
purpose of the service is described in Table 4-1 while the frequency of service by population
and employment density is found in Table 4-2. The exception is express (rush hour) service
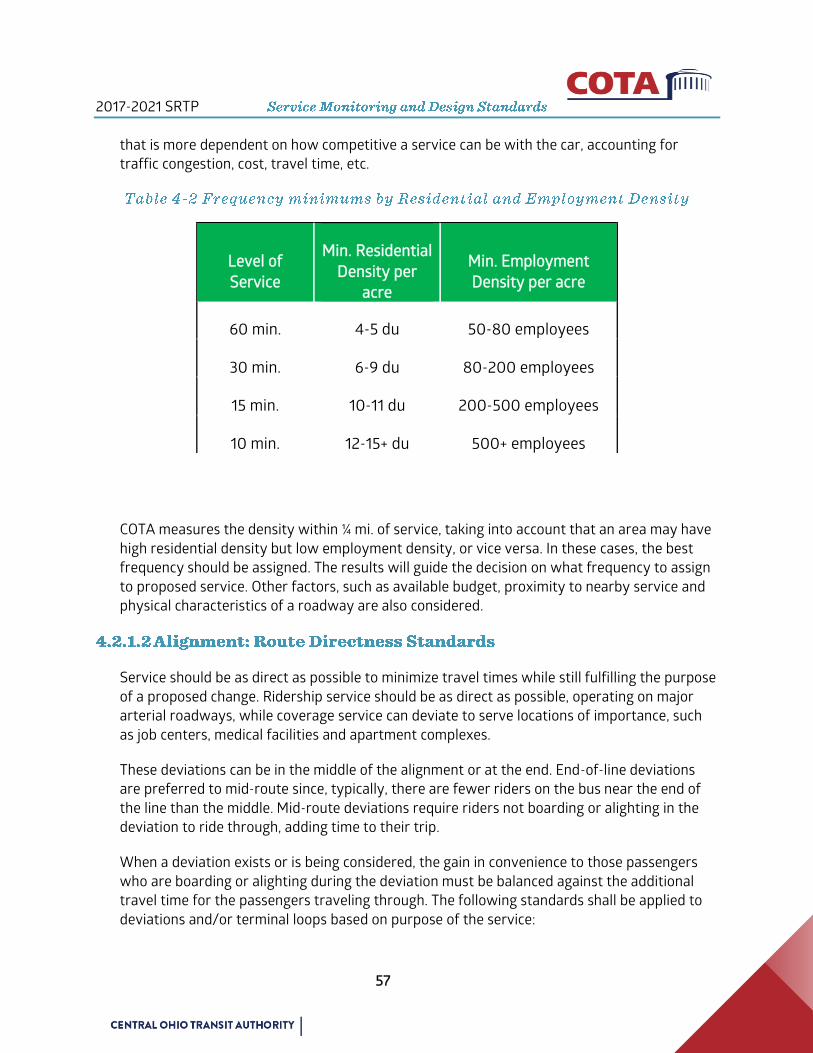
2017-2021 SRTP
57
that is more dependent on how competitive a service can be with the car, accounting for
traffic congestion, cost, travel time, etc.
COTA measures the density within ¼ mi. of service, taking into account that an area may have
high residential density but low employment density, or vice versa. In these cases, the best
frequency should be assigned. The results will guide the decision on what frequency to assign
to proposed service. Other factors, such as available budget, proximity to nearby service and
physical characteristics of a roadway are also considered.
Service should be as direct as possible to minimize travel times while still fulfilling the purpose
of a proposed change. Ridership service should be as direct as possible, operating on major
arterial roadways, while coverage service can deviate to serve locations of importance, such
as job centers, medical facilities and apartment complexes.
These deviations can be in the middle of the alignment or at the end. End-of-line deviations
are preferred to mid-route since, typically, there are fewer riders on the bus near the end of
the line than the middle. Mid-route deviations require riders not boarding or alighting in the
deviation to ride through, adding time to their trip.
When a deviation exists or is being considered, the gain in convenience to those passengers
who are boarding or alighting during the deviation must be balanced against the additional
travel time for the passengers traveling through. The following standards shall be applied to
deviations and/or terminal loops based on purpose of the service:
Level of
Service
Min. Residential
Density per
acre
Min. Employment
Density per acre
60 min. 4-5 du 50-80 employees
30 min. 6-9 du 80-200 employees
15 min. 10-11 du 200-500 employees
10 min. 12-15+ du 500+ employees

2017-2021 SRTP
58
Ridership Lines
To the extent possible, two-way service shall be provided on the same street;
No mid-route our end-on-line deviations or loops shall be operated without
substantial justification
Coverage Lines
To the extent possible, two-way service shall be provided on the same street;
Deviations from the line alignment to serve activity centers will be made only
when the deviation serves more residents and jobs (see Section 4.2.1 for more
information);
Additional time to operate route deviations should not exceed five minutes
(one-way) or 10% of the one-way travel time, whichever is less;
Terminal loops shall not exceed 25% of a route’s total length.
Rush Hour (Express) service shall be routed in the most direct manner possible.
Service that is split into two names, that is two lines that are connected and share the same
number (#2 N. High/E. Main, for example) shall be treated as two distinct lines for this
standard.
It is sometimes more efficient to provide service to a certain area with one route having
several branches than to operate several different routes. In addition, some bus trips on a
route may not go to the end of the line due to very low ridership in that area at a particular
time of day (this is known as a “short-turn”). These actions can result in a system that is much
more difficult for current as well as potential transit passengers to understand and utilize.
Therefore, to provide a user-friendly service and to encourage maximum use of the system by
all current and potential riders, the following standards for branches and short-turn shall
apply:
No line shall have more than two (2) distinct branches;
No line shall have more than one (1) short-turn; and
Service that is split into two names, that is two lines that are connected and
share the same number (#2 N. High/E. Main, for example) shall be treated as
two distinct lines for this standard.
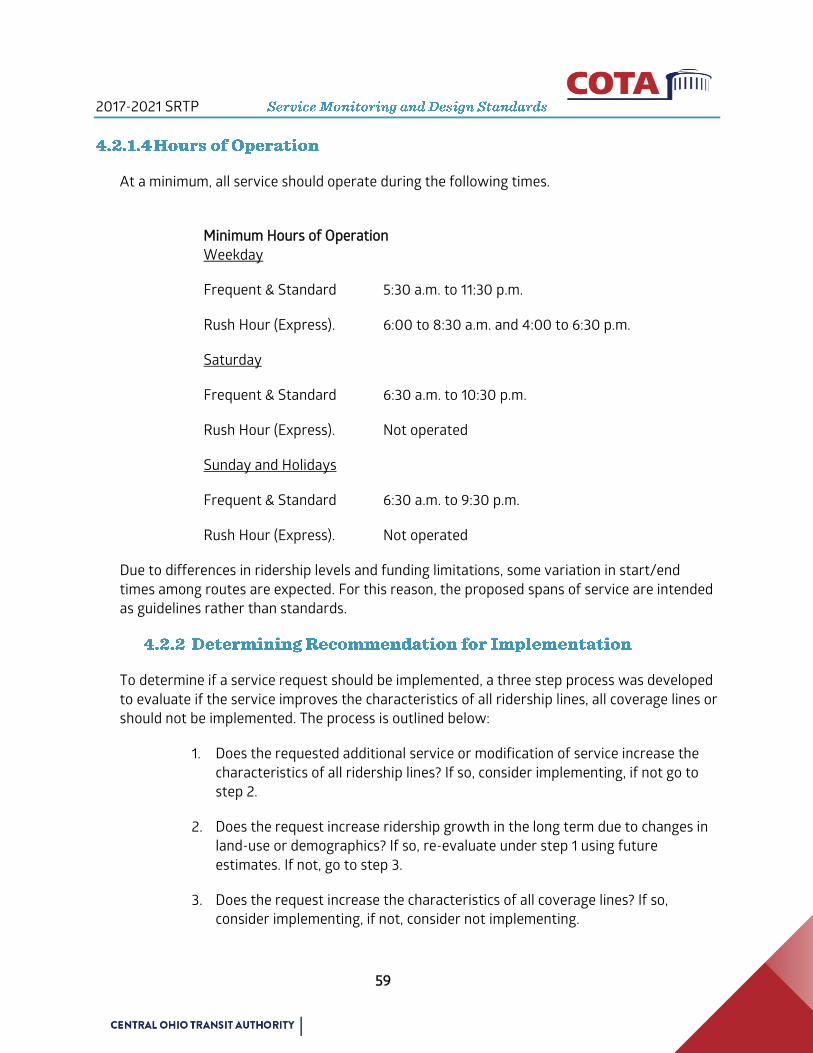
2017-2021 SRTP
59
At a minimum, all service should operate during the following times.
Minimum Hours of Operation
Weekday
Frequent & Standard 5:30 a.m. to 11:30 p.m.
Rush Hour (Express). 6:00 to 8:30 a.m. and 4:00 to 6:30 p.m.
Saturday
Frequent & Standard 6:30 a.m. to 10:30 p.m.
Rush Hour (Express). Not operated
Sunday and Holidays
Frequent & Standard 6:30 a.m. to 9:30 p.m.
Rush Hour (Express). Not operated
Due to differences in ridership levels and funding limitations, some variation in start/end
times among routes are expected. For this reason, the proposed spans of service are intended
as guidelines rather than standards.
To determine if a service request should be implemented, a three step process was developed
to evaluate if the service improves the characteristics of all ridership lines, all coverage lines or
should not be implemented. The process is outlined below:
1. Does the requested additional service or modification of service increase the
characteristics of all ridership lines? If so, consider implementing, if not go to
step 2.
2. Does the request increase ridership growth in the long term due to changes in
land-use or demographics? If so, re-evaluate under step 1 using future
estimates. If not, go to step 3.
3. Does the request increase the characteristics of all coverage lines? If so,
consider implementing, if not, consider not implementing.

2017-2021 SRTP
60
The process accounts for the availability of resources to implement this service and strategies
to take if service is not available. Details are of each step follow.
1. Does the requested additional service or modification of service increase the
characteristics of all ridership lines?
To answer this question, the five characteristics of a proposed change must be measured
against the average of all ridership lines.
Density – Improves average population and employment density of ridership
network with frequencies indicated by dwelling units and employees per acre
(Table 4-2). Denser areas generate more ridership as more people and jobs
have access to transit, increasing transit competitiveness with the personal
automobile. This is calculated by measuring the number of units and employees
within ¼ mi. of the proposed change and comparing this number to the average
of the ridership network.
If the density surrounding the proposed change is greater than the average of
the entire ridership network, then the proposal is considered to serve a dense
area.
Uniqueness - Service does not overlap and compete for riders within 1/4 mi.
Overlapping segments or segments of another line within ¼ mi. of proposed
service are removed from the calculations of the four other metrics unless the
segment with overlapping service requires additional frequency. Need for
additional frequency is determined by examining factors such as whether the
current frequency along a segment matches the need of the surrounding
density and/or if service traveling through these areas is overloaded.
If the total length of overlapping service is less than that of the entire ridership
network, then the proposal is considered unique.
Continuity of Development - Service does not cross large gaps that do not have
any destinations, such as vacant land, bridges and open space. Continuous
destinations are important to generate ridership throughout the day. This is
determined by measuring the linear footage along a line that travels through
these areas.
If the linear footage of areas lacking continuity is less than the average of the
entire ridership network, then the proposal is considered to have continuous
development.
Linearity - Alignment is straight and lowers total deviations in network. This is
calculated by identifying the major trip generators and drawing a straight line
2017-2021 SRTP
61
between the points along the street network finding the shortest path
between nodes. That is then subtracted from the total length of the proposed
line. Major trip generators include employment centers, universities, dense
residential neighborhoods, etc.
If the average is equal to or greater than the average for the entire high-
ridership network then it is linear. If the average is near the average for the
high-ridership network and there is a very strong justification for any
deviations then consider the line linear.
Walkability - Area around service is easy and safe to walk in, improving
passenger safety. This metric is based off of a measure of how walkable an
area is using sources such as Walk Score (www.walkscore.com)
If this score is greater than the entire ridership network then the proposal is
considered walkable.
A proposed change will be considered ridership purpose if the majority of metrics are better
than that of the entire ridership network. If this is true, then COTA will consider implementing
the service. If this is not true, proceed to step 2.
2. Does the request increase ridership in the long term?
If an area served by the proposed change is expected to develop in the near future, that is
more jobs and people will be within ¼ mi. of service, this growth can be included in the
calculations in step 1.
To incorporate potential future ridership potential into the calculation of metrics, identify sites
of future development along a proposed line. Determine if the development is funded or is
likely to be funding by contacting the municipality or government associated with approval of
the development site, the developer or another entity with associated information.
If the site is funded or likely to be funded, ask for the estimated number of dwelling units
and/or employees to be generated by the site. Incorporate those calculations into the density
calculation in step 1. then re-evaluate based on the new numbers.
If the proposed service is then considered a ridership line COTA will consider implementing the
service taking into consideration when the expected development will occur. If not, proceed to
step 3.
3. Does the request increase coverage in an efficient way?
If it is determined that the proposed service is not high-ridership, then evaluate the line based
on coverage.
2017-2021 SRTP
62
Calculate the total number of jobs and residents within ¼ mile of the service, including an
increased service shed for park and rides. Determine the estimated annualized cost of service.
If budget for coverage line exists, determine if the new service improve the coverage
network’s performance. If the cost per resident and job brought into the coverage network is
equal to or higher than the average cost per resident or job of the entire coverage network
then consider implementing as a coverage service.
If no budget for additional coverage services exist, compare the performance of the proposed
service with that of existing service. If it is projected to be higher, that is the cost per resident
or job is greater, then consider reallocating service from lower performing lines.
If not, then consider not implementing the proposed service.
As mentioned in Section 4.2.2, availability of resources to implement changes to service is
dependent on available service hours. If COTA is able to continue to expand service, decision
makers must determine if a proposed change to service should be implemented. If so, the
added service must follow the guidelines of allocation 70 percent of service to ridership
service and 30 percent to coverage.
If resources are not available, that is COTA cannot expand service, then decision makers must
decide if service should be reallocated from likely less productive service to fulfill the
requested service. This must be done while preserving the 70 percent ridership to 30 percent
coverage allocation of resources. Proposed changes to ridership service should be fulfilled by
reallocating resources from ridership lines, while proposed changes for coverage service
should be reallocated from coverage lines.
Specialized services that are developed through partnerships with public and private entities
may not meet COTA’s design standards.
Once it is determined that there are available resources to implement the proposed service, a
Title VI and Environmental Justice impact analysis must occur. As a federally funded and
regulated transit provider through the FTA, COTA has a responsibility to adhere to the
objectives of Title VI of the Civil Rights Act of 1964 as well as the policies set forth in the
Executive Order on Federal Actions to Address Environmental Justice in Minority Populations
and Low-Income Populations (1994).
Part of this adherence is analyzing how proposed changes effect minority and low-income
communities. This analysis compares effected populations to that of COTA’s entire service
area. More information about this process can be found in Section 4.8.
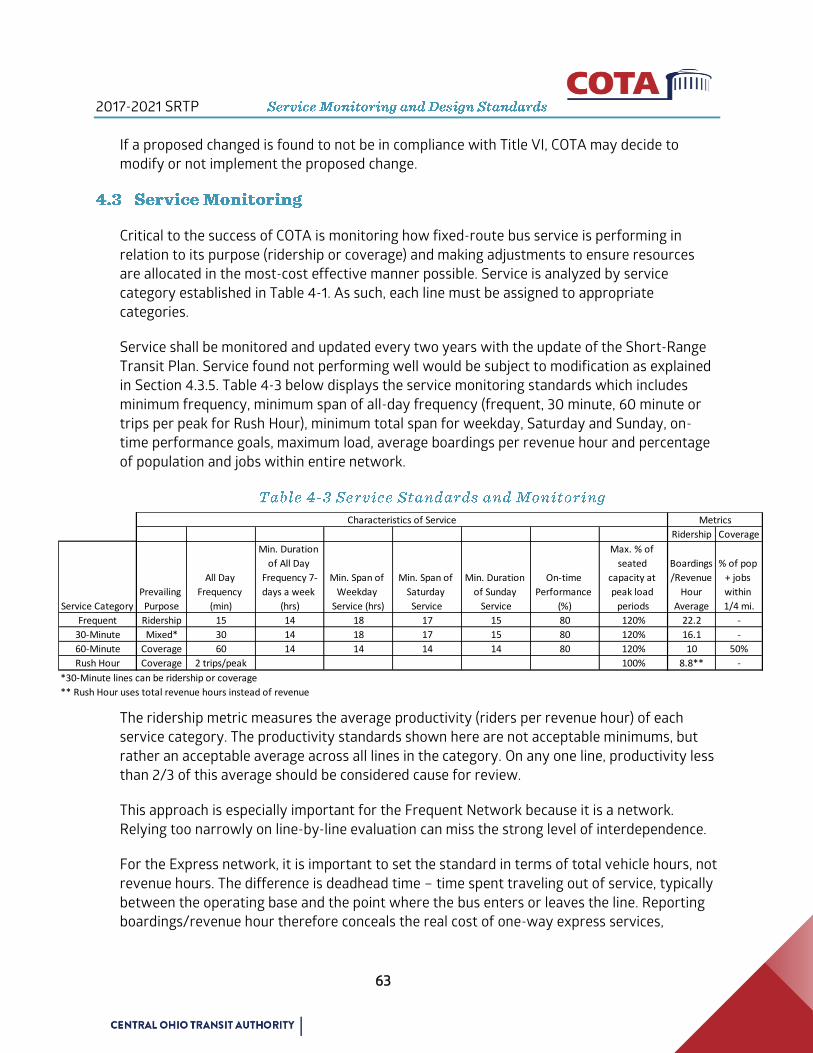
2017-2021 SRTP
63
If a proposed changed is found to not be in compliance with Title VI, COTA may decide to
modify or not implement the proposed change.
Critical to the success of COTA is monitoring how fixed-route bus service is performing in
relation to its purpose (ridership or coverage) and making adjustments to ensure resources
are allocated in the most-cost effective manner possible. Service is analyzed by service
category established in Table 4-1. As such, each line must be assigned to appropriate
categories.
Service shall be monitored and updated every two years with the update of the Short-Range
Transit Plan. Service found not performing well would be subject to modification as explained
in Section 4.3.5. Table 4-3 below displays the service monitoring standards which includes
minimum frequency, minimum span of all-day frequency (frequent, 30 minute, 60 minute or
trips per peak for Rush Hour), minimum total span for weekday, Saturday and Sunday, on-
time performance goals, maximum load, average boardings per revenue hour and percentage
of population and jobs within entire network.
The ridership metric measures the average productivity (riders per revenue hour) of each
service category. The productivity standards shown here are not acceptable minimums, but
rather an acceptable average across all lines in the category. On any one line, productivity less
than 2/3 of this average should be considered cause for review.
This approach is especially important for the Frequent Network because it is a network.
Relying too narrowly on line-by-line evaluation can miss the strong level of interdependence.
For the Express network, it is important to set the standard in terms of total vehicle hours, not
revenue hours. The difference is deadhead time – time spent traveling out of service, typically
between the operating base and the point where the bus enters or leaves the line. Reporting
boardings/revenue hour therefore conceals the real cost of one-way express services,
Ridership Coverage
Service Category
Prevailing
Purpose
All Day
Frequency
(min)
Min. Duration
of All Day
Frequency 7-
days a week
(hrs)
Min. Span of
Weekday
Service (hrs)
Min. Span of
Saturday
Service
Min. Duration
of Sunday
Service
On-time
Performance
(%)
Max. % of
seated
capacity at
peak load
periods
Boardings
/Revenue
Hour
Average
% of pop
+ jobs
within
1/4 mi.
Frequent Ridership 15 14 18 17 15 80 120% 22.2 -
30-Minute Mixed* 30 14 18 17 15 80 120% 16.1 -
60-Minute Coverage 60 14 14 14 14 80 120% 10 50%
Rush Hour Coverage 2 trips/peak 100% 8.8** -
*30-Minute lines can be ridership or coverage
** Rush Hour uses total revenue hours instead of revenue
MetricsCharacteristics of Service
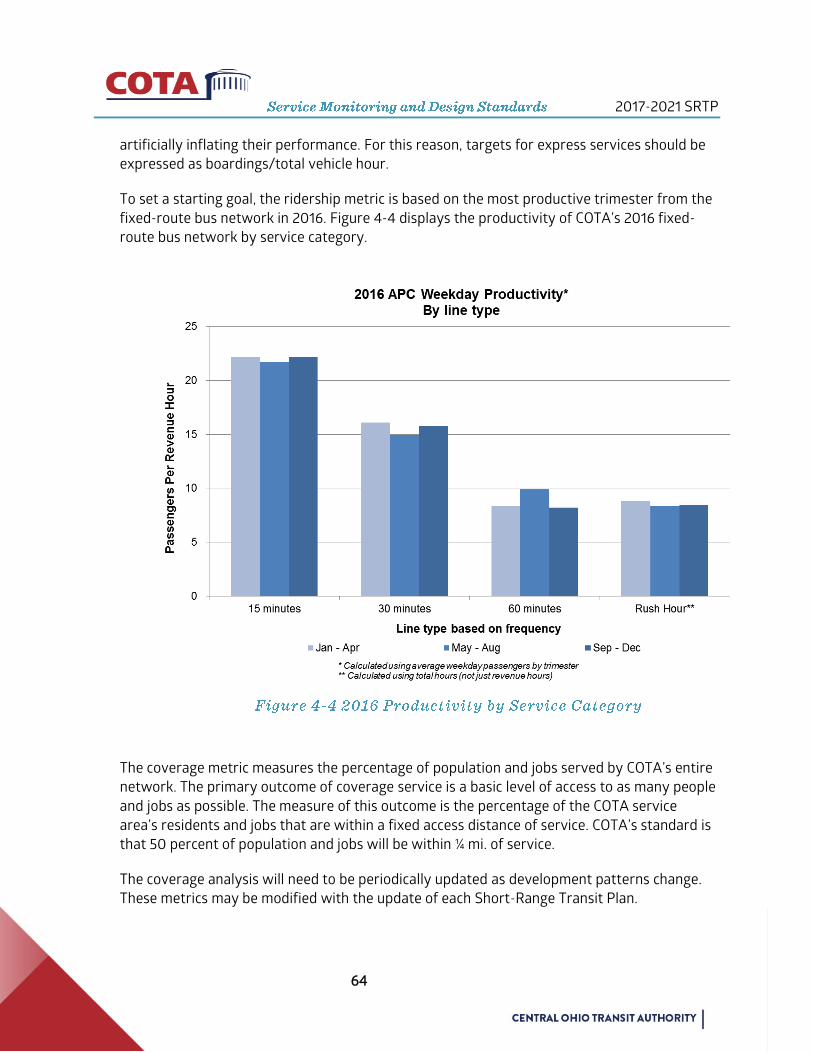
2017-2021 SRTP
64
artificially inflating their performance. For this reason, targets for express services should be
expressed as boardings/total vehicle hour.
To set a starting goal, the ridership metric is based on the most productive trimester from the
fixed-route bus network in 2016. Figure 4-4 displays the productivity of COTA’s 2016 fixed-
route bus network by service category.
The coverage metric measures the percentage of population and jobs served by COTA’s entire
network. The primary outcome of coverage service is a basic level of access to as many people
and jobs as possible. The measure of this outcome is the percentage of the COTA service
area’s residents and jobs that are within a fixed access distance of service. COTA’s standard is
that 50 percent of population and jobs will be within ¼ mi. of service.
The coverage analysis will need to be periodically updated as development patterns change.
These metrics may be modified with the update of each Short-Range Transit Plan.

2017-2021 SRTP
65
The guidelines for allocating 70 percent of resources to ridership service and 30 percent to
coverage service requires a method of assigning routes to one of the two categories.
Assigning a route of one of the two purposes is straightforward except in the case of 30-
minute service.
The following methodology is to be used:
Frequent lines are ridership justified. The expensive concentration of resources on
certain streets is an inefficient way to provide coverage but seems to be essential
for the best ridership outcomes, as demonstrated by the high performance of
frequent lines in the existing network.
Hourly lines are coverage justified. This minimal level of service generates poor
productivity wherever it is operated. Instead, the purpose of this level of service is
about extending a basic level of access to as many people or jobs as possible. This
implies spreading resources thinly across a large area, which is the coverage goal.
Express lines are coverage justified. Currently, the Columbus area lacks the traffic
congestion, downtown-parking costs and other disincentives to driving that would
motivate nine-to-five long-distance commuters to seek alternatives to driving in
large numbers. This may change over time and it is possible that a ridership-
justified express service could emerge in the future.
Half-hourly lines may have a mixture of both purposes. Segments may be:
o Ridership-justified, because they are top performers in the half-hourly
category and ready for promotion to frequent service as soon as resources
permit; or
o Coverage-justified, if the necessary conditions for very high ridership are
not present, but ridership is still high enough to justify the frequency.
Typically, this means that the line is unlikely to graduate into the Frequent
Network, but is more productive than it would be if the service were cut to
hourly.
One challenge of using frequency-based or purpose-based standards is that part of a line may
be in one category and part in another. Many lines in the proposed network have an inner
frequent segment, which is clearly ridership-justified and less frequent tails, or branches that
could be considered coverage-justified.

2017-2021 SRTP
66
In these cases:
If the low-frequency portion of a line is less than 10% of the total revenue
hours, the entire line can be analyzed in the higher-frequency category.
Otherwise, the frequent and infrequent segments will be separated and
assigned to separate categories.
If a low frequency arises from a mid-route split or minor variant, the line will be
identified in the higher-frequency category.
To analyze the productivity of an inner versus an outer line segment, where the inner segment
has higher frequency and usually higher ridership, the following analytical method is used:
For ridership: Using APC data, the total inbound boardings and outbound
alightings6 that occur on the outer segment is identified. These two numbers
are added together to get the total ridership that makes some use of the outer
segment.
This number is subtracted from the total line ridership to get boardings
assignable entirely to the inner frequent segment.
For cost drivers such as vehicle hours or revenue miles:
Using a costing tool such as Transitmix.net, the cost of operating the frequent
inner segment alone, excluding the outer segment, is calculated.
The cost to the inner segment is assigned. The difference between that cost
and the line’s full cost to the outer segment is calculated.
It is not necessary that this calculation be calibrated to actual costs, so long as the percentage
split emerging from the analysis is correct. Several other input versus output metrics can be
counted in similar ways.
To ensure that transit riders have confidence that service will perform reliably in accordance
with the public timetables prepared and distributed by COTA, on-time performance standards
have been established. A vehicle is considered “on-time” when its arrival is from zero to 4
6 This method counts each trip once and does not double-count trips that are entirely within the outer
segment. If there are difficulties with counting alightings, simply count the total inbound boardings and
double, presuming most trips are round trips, to capture the trips alighting in the segment.

2017-2021 SRTP
67
minutes and 59 seconds after the scheduled time. A vehicle is considered “late” when it arrives
five minutes or more after the scheduled time. To improve the quality of service provided on
express lines, in 2010, COTA revised the policy on arriving at stops early.
Express (rush hour) buses can arrive at stops up to five minutes early after leaving the last
stop outside of Downtown in the morning and after leaving the last stop within Downtown in
the evening. Reverse-commute (rush hour) express buses from Downtown to the suburbs are
allowed to arrive five minutes early after leaving the last stop within Downtown in the
morning and after leaving the last stop outside of Downtown in the evening.
It is impossible to achieve and maintain 100% on-time performance due to varying traffic and
weather conditions, construction activity, detours, accidents, and other external factors.
Nevertheless, every effort will be made to ensure that all COTA buses operate on time. The
following on time performance standards shall apply:
80% of all buses should arrive at scheduled time points “on-time.”
If a line or individual trip(s) is consistently running late, COTA will review the
schedule and take remedial actions—such as schedule and/or travel time
modification and improved on-street supervision—at the earliest opportunity.
COTA, like all other transit agencies, misses scheduled trips due to a shortage of drivers,
mechanical problems, or accidents. The percentage of trips operated is defined as the ratio of
trips actually operated divided by the scheduled number of trips. The annual objective shall be
to operate a minimum of 99% of scheduled trips.
The intent of load standards is to balance passenger comfort and safety with operating costs.
These standards define maximum passenger loads at different times of day to ensure
acceptable levels of rider comfort and safety, while providing COTA good operating
efficiencies. The load standards shown below represent the total number of riders as a
percent of the number of seats on the bus:

2017-2021 SRTP
68
These load standards should be applied to the average ridership and number of seats per bus
for a period of 60 minutes. Passenger loading on individual bus trips may exceed the standard.
If the load standard is exceeded for any 60-minute period, COTA will evaluate the potential for
improving the service frequency. If the standard is exceeded for particular trips, but not for a
sustained 60-minute period, COTA will evaluate the possibility of adjusting schedule times to
focus more service before and after the overloaded trip(s).
The maximum time that an individual passenger should be expected to stand on a given trip is
15 minutes. If standards are exceeded, an improvement to frequency should be considered.
The role of service standards is to provide measurable benchmarks against which
performance can be monitored. The standards provide a clear signal when some aspect of
performance is unacceptable. That signal should trigger an evaluation of the problem and a
plan of action for resolving it.
The frequency and nature of monitoring varies by the type of standard:
Frequency, Span, Stop Spacing, and Coverage are the outcome of planning
activities and can be verified for compliance with the standards at the time a
plan is proposed and adopted. System-wide coverage should also be reviewed
whenever updated population and jobs data is available, to observe whether
coverage rates have changed due to shifts in population and job locations even
as the system has remained static.
On-Time Performance is available on at least a monthly basis. These standards
should be achievable on average over each month, though exceptions may be
made for long periods of severe weather. On-time performance problems
should be addressed as quickly as possible.
Time Period Frequent 30-Minute 60-Minute Rush Hour
Weekday
AM, PM peak 120% 120% 120% 100%
Midday 100% 100% 100% 100%
Night 100% 100% 100% 100%
Saturday 100% 100% 100% 100%
Sunday 100% 100% 100% 100%

2017-2021 SRTP
69
Productivity should be achieved as an annual average including a complete
cycle of seasons. Any new service or network element should be allowed to run
an entire year before judgments are made about inadequate productivity of
certain segments. Appropriate marketing – especially distinctive branding and
marketing of the Frequent Network – is a key precondition for success at that
layer.
The following guidelines apply to the monitoring of standards:
Productivity outcomes are the result of an entire network layer of a given
frequency. Thus, the standard presented in the table is the average across the
entire layer that should be achieved, while a deficiency for a single line is
identified only when that line drops below two thirds of that standard. This is
important to ensure that the interdependence of elements of a network is
recognized when a line is declared deficient.
Productivity standards are segment-based, so they will require segment-level
assessment of ridership.
To capture the interdependence of Frequent lines, any low-performing
Frequent line should be analyzed as follows before considering reducing its
frequency:
Does the line have an inner segment which connects with other frequent lines
and outer segments that do not?
If so, look at the productivity of these outer segments in isolation to see if these are the cause
of poor performance.
If so, the segmentation of the line can be revised and the outer segment demoted to a lower
frequency and service category.
Does the line show strong evidence of high transfer volumes at key frequent
network intersections?
If so, assume that any service reduction will cause ridership drops not just on the line under
study but also on the intersecting line.
On-Time performance should be reviewed on the route level based on monthly
reports. It is usually possible to determine whether a delay problem correlates
with a particular route segment, a particular time of day, a particular operator,
or a particular vehicle type. The appropriate action will depend on this analysis.
2017-2021 SRTP
70
Updating Service Purposes as Networks and Performance Change
In the service standards Table 4-3, the purpose column indicates the intention behind each
kind of service: ridership or coverage.
In the future, it will be necessary to update this evaluation as ridership evolves. This updating
is not necessary for monitoring the service standards, since half-hourly services have their
own standards that reflect their mixed purpose, but it is necessary to determine whether the
overall split of the budget between ridership and coverage matches the adopted policy.
The primary challenge is the 30-minute category. Frequent services are all ridership-justified.
Hourly services are all, by definition, coverage services. Express services should be presumed
to be coverage services until they begin to perform in a range where – measured in
boardings/vehicle hour – they begin to match the performance of the Frequent Network. At
that point, a category of ridership-justified Express services can be created.
When determining the purpose of a half-hourly service, the following considerations can be
used.
If the segment’s productivity is in the range of Frequent Network services, then
it is a ridership service.
If the segment’s productivity, compared to that of the total network, is below
the percentile defined by the percentage of the network devoted to coverage,
then it is a coverage service. For example, the current allocation assigns 30% of
service to the coverage goal, so if the productivity of the route is in the bottom
30% system-wide, it can be assigned to that coverage goal.
If ridership is clearly very different on one part of a segment than another,
divide the segment into smaller segments and assign purpose separately and
see if this produces segments satisfying the above criteria.
In certain cases:
If there are clear reasons to expect ridership to improve dramatically soon,
such as imminent development or redevelopment, provisionally assign the line
to the ridership purpose. Any such imminent improvement should be an
improvement in one or more of the necessary features for ridership that arise
from the built form: density, walkability, linearity, and continuity.
If the built environment is mostly unfavorable to transit (in terms of generally
low density, walkability, linearity, and continuity) and shows little sign of
changing for the better, assign the line to the coverage purpose.
2017-2021 SRTP
71
There is no way to remove professional judgment from the process of inferring intentions
from services completely, which is why the allocation of service between ridership and
coverage is a guideline. Allocating service to one of the purposes may change during re-
evaluation processes.
Reviewing 30-minute Purpose Ranking
When a 30-minute segment is assigned to a ridership or coverage purpose, it should be
reviewed in the following terms:
Half-hourly segments categorized as ridership may be in line for promotion to
the Frequent Network as resources permit. However, there may be cases such
as segments driven by a daytime-only or peak demand where the service may
stabilize at 30-minute base frequency for maximum productivity, and continue
to satisfy the standard for a ridership-justified line (i.e. the Frequent Network
standard).
In this case, service should be reviewed by whether its frequency is warranted,
as opposed to the hourly frequency that is typical of coverage service. There
may be extenuating circumstances in some cases – for example, no resources
may be saved by reducing the frequency, or the frequency may be created by
hourly branches further out that cannot be cut further.
Route performance data is used to evaluate service. COTA collects data in a number of ways:
170 buses equipped with Automatic Passenger Counters (APC) provide COTA with
travel time, passenger activity at the bus stop level, passenger load data, and other
statistics used in route planning. As of January 2017, COTA operates an active fleet
of 357 buses; and
Electronic fareboxes collect revenue and ridership data through customer and
driver interaction with the units. COTA's entire active fleet of fixed-route buses is
equipped with these fareboxes.
The current system includes coin/bill insertion (which registers fare input based on
size, so all bills are classified as $1), a magnetic stripe pass read-only swipe reader,
and a Ticket Reading and Issuing Machine. Additionally, the operator has access to
a keypad that allows recording of fares that are not readable by the farebox.
Currently, the fareboxes support exact change cash payments and COTA’s
magnetic fare cards. The 2011 farebox upgrades allow for magnetic verification of
each OSU student ID presented as fare payment. February 2017, COTA entered
2017-2021 SRTP
72
into an agreement with GenFare (a division of SPX) for the upgrade of the fare
management system. The system would encourage the use of pre-paid and mobile
ticketing fare.
The Planning and Service Development Division recommends service changes and then
prepares a list of changes that are reviewed by the Board of Trustees and the President/CEO.
The final set of service changes is then directed to the offices and departments that have
responsibility for the implementation of new service. The division staff monitors the progress
of each service change to ensure the process stays on schedule. Changes are scheduled three
times a year on the first Monday of January, May, and September.
This COTA Bus Stop Design Guide is intended to act as a guide for municipalities and
developers when creating and reviewing development proposals to ensure consistency with
COTA standards for appropriate bus stop design. The manual is available for review and
download at www.COTA.com.
In general, COTA is solely responsible for the siting and installation of new bus stops and
facilities. COTA staff provides recommendations regarding where bus stops will be placed and
what amenities, if any, will be installed. COTA then works with the appropriate jurisdiction to
determine the final location for the bus stop and then obtain the necessary permits for its
installation. If COTA constructs concrete passenger pads or shelters at a bus stop, it is
responsible for ensuring that all federal, state, and local regulations, including the Americans
with Disabilities Act (ADA), are met.
While it is COTA’s role to provide public transit service in the central Ohio region and to install
bus stops, it is the role of municipalities and developers to provide infrastructure for
pedestrians, motorists, and bicyclists to access that transit service. Thus, when new
development or redevelopment occurs at or near an existing COTA bus stop location, it is the
developer’s (or municipality’s) responsibility to ensure that the bus stop can be adequately
served by COTA’s transit vehicles and easily accessed by transit customers while adhering to
ADA requirements.
COTA encourages developers to take existing and proposed bus stops into account from the
beginning of the planning and design processes. Developers and local officials should seek the
guidance of COTA staff when making design decisions on development and local infrastructure
that affect transit stops in the early planning stages to minimize potential conflicts later in the
development process. Please note, that it is the responsibility of the developer to ensure that
all applicable local regulations are met, particularly when they are more stringent than COTA
guidelines.
2017-2021 SRTP
73
These guidelines will help COTA, developers, and municipalities meet the needs of the
community by pursuing the following goals:
Bus stops should be placed in convenient locations that do not compromise the
safety of customers, pedestrians, bicyclists, or vehicles.
Bus stops should be spaced to maximize efficiency of transit service while not
requiring riders to walk excessive distances (i.e. greater than one half mile) to the
nearest bus stop.
Bus stops should be clearly and consistently identifiable with up-to-date
information for riders about services at the bus stop.
Bus stops should have appropriate amenities based on the usage of that stop and
the surrounding land use.
Bus stops should be accessible. Americans with Disabilities Act (ADA)
considerations will be given top priority in the siting and design of new and
existing bus stops.
Bus stops should be well-maintained and free of trash and vandalism.
Facilities surrounding bus stops such as roadways and pedestrian amenities should
be transit-supportive and designed according to sound engineering practices.
Bus stops should be spaced to balance the need for a quick in-vehicle travel time with
consideration given to the distance customers must travel to access the bus stop. When stops
are spaced closely together, customers have convenient access to service; however, closely
spaced stops result in a longer ride for customers because of the number of times the bus
needs to decelerate, come to a complete stop, and then accelerate and re-merge into traffic.
Having fewer stops along a bus route can require some customers to travel further to the
nearest stop, which may be difficult for those with mobility limitations. At the same time,
greater distances between stops reduces the in-vehicle travel time and benefits the transit
agency through reduced maintenance costs of underutilized bus stops. Optimally spacing bus
stops can have positive impacts on the quality of service as well as operational effectiveness
and efficiency.
The following bus stop spacing guidelines (Table 4-6) were developed based on the review of
research studies on the optimal spacing of bus stops, existing bus stop spacing standards at
other transit agencies, and feedback from the public, municipalities, and other stakeholders.
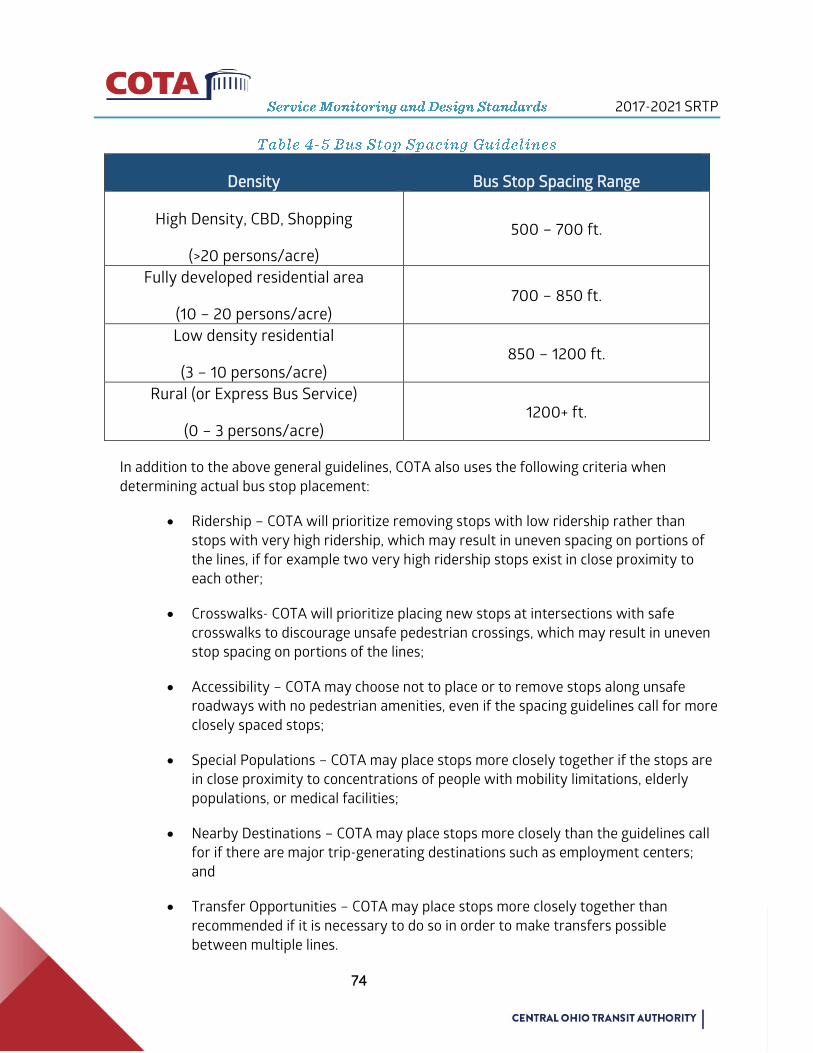
2017-2021 SRTP
74
Density Bus Stop Spacing Range
High Density, CBD, Shopping
(>20 persons/acre)
500 – 700 ft.
Fully developed residential area
(10 – 20 persons/acre) 700 – 850 ft.
Low density residential
(3 – 10 persons/acre) 850 – 1200 ft.
Rural (or Express Bus Service)
(0 – 3 persons/acre) 1200+ ft.
In addition to the above general guidelines, COTA also uses the following criteria when
determining actual bus stop placement:
Ridership – COTA will prioritize removing stops with low ridership rather than
stops with very high ridership, which may result in uneven spacing on portions of
the lines, if for example two very high ridership stops exist in close proximity to
each other;
Crosswalks- COTA will prioritize placing new stops at intersections with safe
crosswalks to discourage unsafe pedestrian crossings, which may result in uneven
stop spacing on portions of the lines;
Accessibility – COTA may choose not to place or to remove stops along unsafe
roadways with no pedestrian amenities, even if the spacing guidelines call for more
closely spaced stops;
Special Populations – COTA may place stops more closely together if the stops are
in close proximity to concentrations of people with mobility limitations, elderly
populations, or medical facilities;
Nearby Destinations – COTA may place stops more closely than the guidelines call
for if there are major trip-generating destinations such as employment centers;
and
Transfer Opportunities – COTA may place stops more closely together than
recommended if it is necessary to do so in order to make transfers possible
between multiple lines.

2017-2021 SRTP
75
The bus stop is the primary location where passengers interact with the transit service. Thus,
it is important that COTA has an accurate and detailed information regarding the physical and
service-related attributes of each bus stop in the system. COTA staff began a detailed
inventory of all bus stops in late 2012. Bus stops are inventoried with a handheld computer
device that can collect several attributes of each bus stop, such as the presence of shelters
and sidewalks, as well as GPS location and photographs.
One of the major goals of this bus stop inventory is to take stock of the pedestrian
accessibility to each of COTA’s bus stops, with particular attention paid to accessibility for
persons with limited mobility and adherence to the standards put forth by the Americans with
Disabilities Act (ADA). With the accessibility information gathered during the bus stop
inventory process, COTA’s long-term goal is to regularly pursue funding opportunities to
improve bus stops and increase accessibility.
In addition to the previously discussed evaluation procedures, COTA's planning process is
sensitive to the needs of minority communities. As a federally funded and regulated transit
provider through the FTA, COTA has a responsibility to adhere to the objectives of Title VI of
the Civil Rights Act of 1964 as well as the policies set forth in the Executive Order on Federal
Actions to Address Environmental Justice in Minority Populations and Low-Income
Populations (1994).
Title VI
The objectives of the FTA Title VI program are as follows:
To ensure FTA-assisted benefits and related services are equitably distributed
without regard to race, color or national origin;
To ensure that both the level and quality of transit services provide equal access
and mobility for any person without regard to race, color or national origin;
To prevent the denial, reduction, or delay in benefits related to programs and
activities that benefit minority populations or low-income populations;
To ensure that access to the planning and decision-making process is open and
provided without regard to race, color or national origin;
To ensure that decisions on the location of transit facilities and services are made
without regard to race, color or national origin; and
2017-2021 SRTP
76
To ensure meaningful access to programs and activities by persons with limited
English proficiency.
These objectives are the basis for the implementation of the FTA Title VI program. To comply
with these objectives, COTA has adopted the suggested methodology and framework set forth
in the Title VI reporting guidelines (FTA Circular 4702.1B) for compliance assessment.
By using this methodology, COTA will monitor and compare performance of all its routes
based on level of service and quality of service criteria. To facilitate this evaluation, COTA will
continue to collect data relating to its service standards, such as load factor, vehicle
assignment, frequency, and on-time performance. These analyses will be conducted on a
route-by-route basis each service change period, thus enabling a system-wide evaluation.
Where a variance exists, these findings will be used to modify service delivery in order to
comply with the Title VI program’s stated objectives.
In 2016, COTA submitted a new Title VI triennial report to FTA, which documented the results
of this methodology and showed COTA’s compliance with the Title VI regulations during years
2013-2016.
Environmental Justice (EJ)
Although no formal report is required, FTA requires transit providers to incorporate
environmental justice and non-discrimination principles into transportation planning and
decision-making processes as well as environmental review for specific projects. The two
primary classes considered are minorities and low-income populations.
Three main principles guide the EJ process:
To avoid, minimize, or mitigate disproportionately high and adverse human health
and environmental effects, including social and economic effects, on minority
populations and low-income populations;
To ensure the full and fair participation by all potentially affected communities in
the transportation decision-making process; and
To prevent the denial of, reduction in, or significant delay in the receipt of benefits
by minority and low-income populations.
EJ policy requires analysis of transit activities if a low-income and/or minority population is
impacted by such activities. The analysis compares the impacts of low-income and minority
populations to those of non-low-income and non-minority populations. COTA reviews the
results of the analysis to guide decision makers in choosing alternative actions that reduce the
difference in impacts between low-income and minority populations and non-low-income and
non-minority populations.

2017-2021 SRTP
77
Currently, COTA provides two transportation services:
fixed-route bus service and paratransit service. The
following section describes COTA’s fixed-route bus
service while paratransit service is detailed in Section 7.
The Transit System Redesign (TSR) forms the
foundation of the 2017-2021 SRTP service plan. As
such, the contents of the service plan will be based on
COTA’s bus system as of May 1, 2017.
Appendix B has detailed maps of each line in the TSR
network as well as a table documenting changes from the current system (January 2017)
compared to the TSR.
The backbone of COTA’s public transit system is fixed-route bus service. Service is provided on a
repetitive, fixed-schedule basis along specific streets, with vehicles stopping to pick up passengers
at, and deliver passengers to, specific bus stop locations. COTA currently operates four types of
fixed-route service: Local, Crosstown, Express and LINK.
With the launch of the TSR on May 1, 2017, the service categories are being redefined based on
operating characteristics. This change will allow riders to better understand the frequency of
service and whether or not a line makes all stops along an alignment or serve only a limited
number of stops. Additionally, service will be monitored and designed based on these categories
(see also Section 4).
Frequent: 15-Minute or better Service – Operates every 15 minutes most of the day, seven
days a week. Makes all stops along alignment, connecting downtown Columbus to
surrounding communities or connecting communities to each other.
Standard: 30-Minute Service – Operates every 30 minutes most of the day, seven days a
week. Makes all stops along alignment, connecting downtown Columbus to surrounding
communities or connecting communities to each other.
Standard: 60-Minute Service – Operates every 60 minutes most of the day, seven days a
week. Makes all stops along alignment, connecting downtown Columbus to surrounding
communities or connecting communities to each other.
Rush Hour Service – Operates during select times, usually during the AM and PM peak
travel periods during weekdays only. Makes limited stops with closed-door service (no
stopping) between two areas, primarily between suburban areas and downtown

2017-2021 SRTP
78
Columbus. Rush hour service that travels to Downtown in the AM and from Downtown in
the PM is considered “commute service”, while service that operates in the opposite
direction is “reverse commute”.
These four categories cover the majority of COTA’s fixed-route service; however, there are a few
exceptions. Some service falls within these categories but contain differences from the definition
of the service category. As an example, a section of the 24 Hamilton, a standard 30-minute line,
operates only during rush hour between Eastland Mall and the Rickenbacker area, even though
this section is not considered a “Rush Hour Service”.
COTA operates service seven days a week. With the implementation of the TSR, all service will
operate seven days a week except for rush hour (express) service, which will only operate
weekdays. Additionally, most lines will operate the complete span of service on weekdays,
Saturdays and Sundays, the exception being select 60-minute lines and rush hour service. Table 5-
1 displays the TSR span of service by day, starting May 1, 2017.
A timed-transfer system, referred to as “Late Night Lineups”, goes into effect at 10:00 p.m. on
weekdays allowing passengers to transfer conveniently Downtown. Currently, the final transfer
trip from Downtown is 12:00 a.m. on weekdays, 12:00 a.m. on Saturdays, and 9:00 p.m. on
Sundays.
COTA offers a late-night line that serves major destinations. The Night Owl provides late-night
service on Thursday, Friday, and Saturday, between Downtown, the Arena District, Short North,
OSU, and the Park of Roses along North High Street from 7:00 p.m. to 2:45 a.m.
Table 5-2 summarizes the TSR fixed-route service by day of week and time of day. Check the
latest schedules for details. Maps of the entire COTA system, as well as evening, Saturday and
Sunday service follow the TSR Service table. COTA’s current passenger fare structure is included
in Table 5-5.
Weekday
Early AM AM MID PM Evening Late Night
Before 6:30 AM 6:30 AM – 9:30 AM 9:30 AM – 3:00 PM 3:00 PM – 6:00 PM 6:00 PM – 10:00 PM After 10:00 PM

2017-2021 SRTP
79
Line Type
Weekday
Saturday
Sunday &
Holiday Early AM AM MID PM Evening Late Night
FREQUENT 92% 100% 92% 100% 92% 92% 92% 92%
30-MINUTE 84% 92% 88% 92% 92% 72% 80% 76%
60-MINUTE 100% 100% 80% 100% 100% 40% 80% 60%
RUSH HOUR (EXPRESS) 47% 100% 6% 97% 41% 3% 3% 3%
Line Type
Weekday
Saturday
Sunday &
Holiday Early AM AM MID PM Evening Late Night
FREQUENT 100% 100% 100% 100% 100% 100% 100% 100%
30-MINUTE 88% 88% 88% 88% 100% 100% 100% 100%
60-MINUTE 100% 100% 100% 100% 100% 40% 100% 100%
RUSH HOUR (EXPRESS) 67% 100% 7% 100% 53% 0% 7% 7%
Line
Weekday
Saturday
Sunday &
Holiday Early AM AM MID PM Evening Late Night
1 X X X X X X X X
2 X X X X X X X X
2L X X X X X X X X
3 X X X X X X X X
4 X X X X X X X X

2017-2021 SRTP
80
Line
Weekday
Saturday
Sunday &
Holiday Early AM AM MID PM Evening Late Night
5 X X X X X X X X
6 X X X X X X X X
7 X X X X X X X X
8 X X X X X X X X
9 X X X X X X X X
10 X X X X X X X X
11 X X X X X X X X
12 X X X X X X
13 X X
21 X X X X X X X
22 X X X X X X X X
23 X X X X X X X X
24 X X X X X X X X
25 X X X X X X X
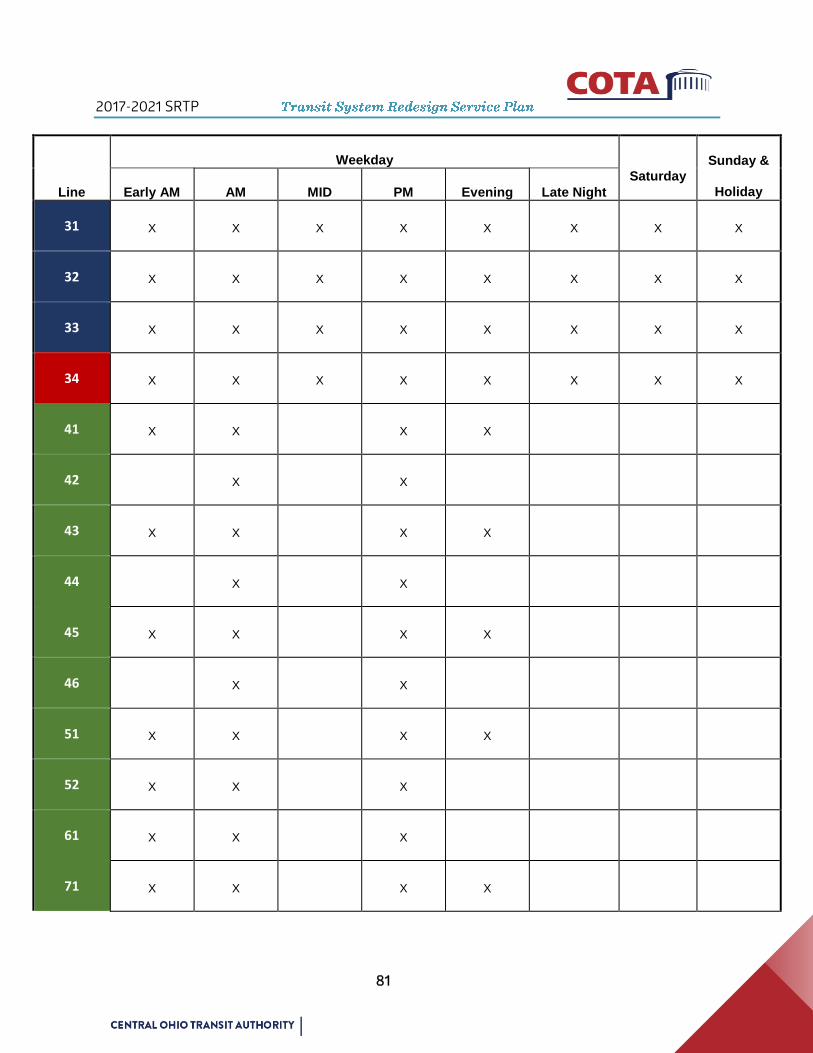
2017-2021 SRTP
81
Line
Weekday
Saturday
Sunday &
Holiday Early AM AM MID PM Evening Late Night
31 X X X X X X X X
32 X X X X X X X X
33 X X X X X X X X
34 X X X X X X X X
41 X X X X
42 X X
43 X X X X
44 X X
45 X X X X
46 X X
51 X X X X
52 X X X
61 X X X
71 X X X X
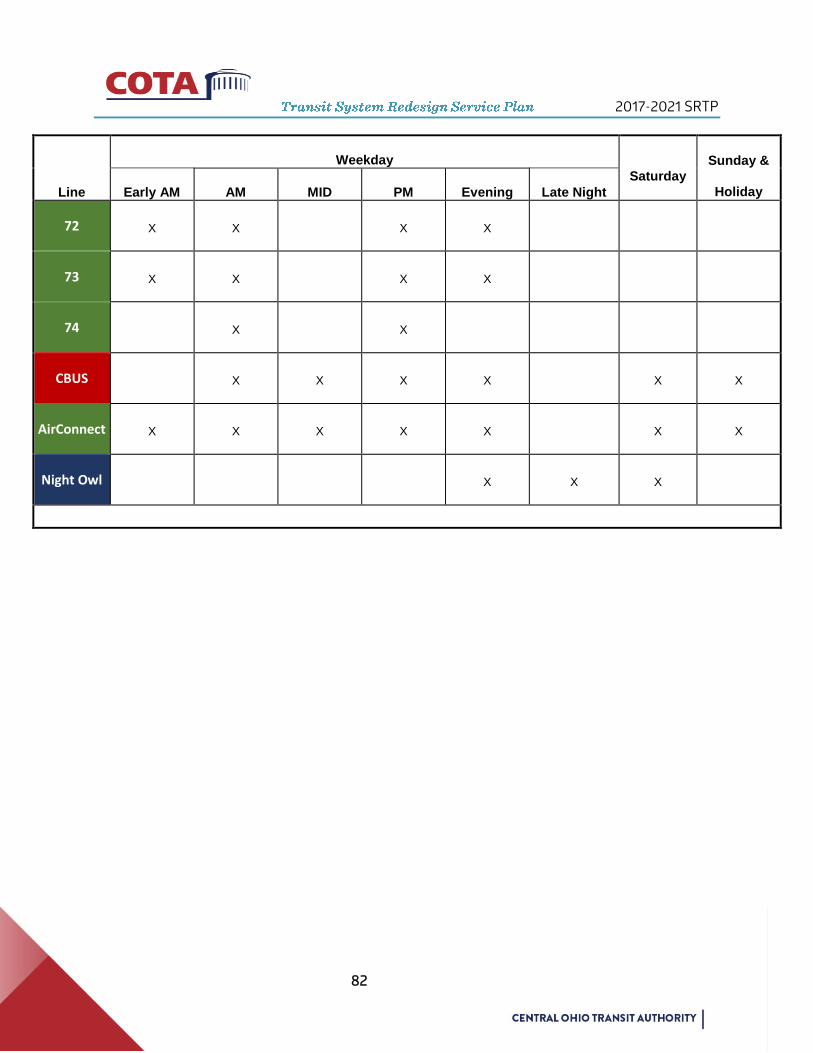
2017-2021 SRTP
82
Line
Weekday
Saturday
Sunday &
Holiday Early AM AM MID PM Evening Late Night
72 X X X X
73 X X X X
74 X X
CBUS X X X X X X
AirConnect X X X X X X X
Night Owl X X X
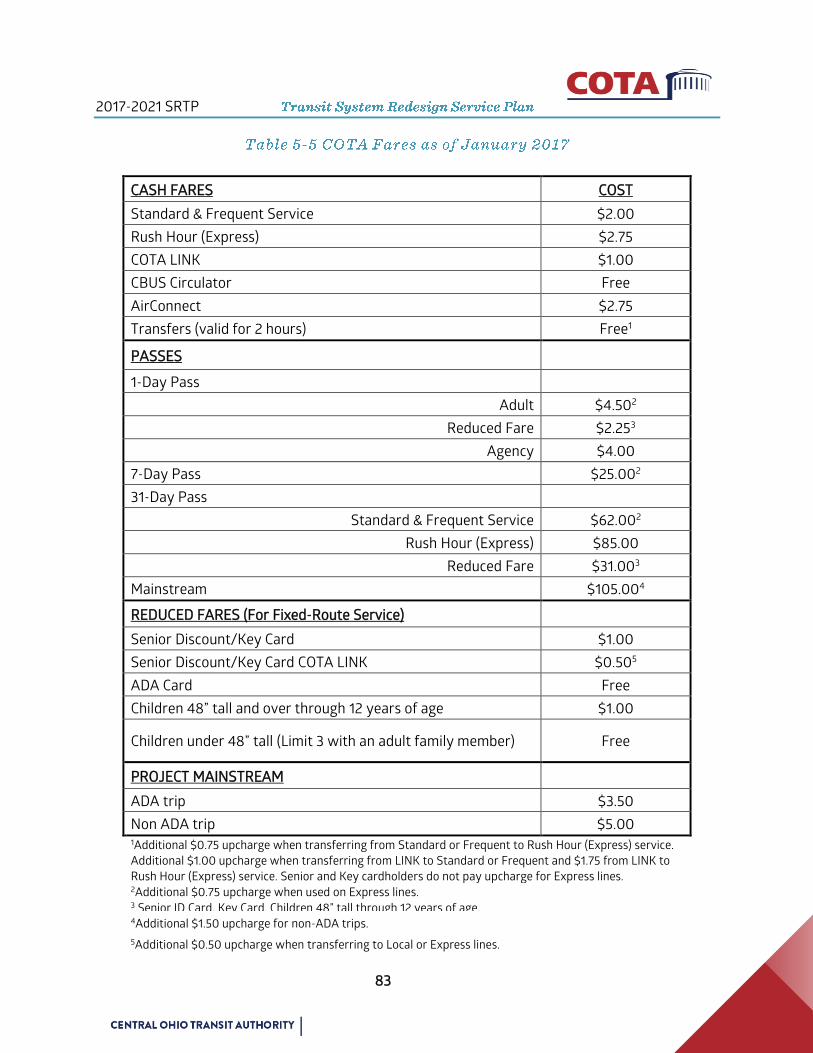
2017-2021 SRTP
83
CASH FARES COST
Standard & Frequent Service $2.00
Rush Hour (Express) $2.75
COTA LINK $1.00
CBUS Circulator Free
AirConnect $2.75
Transfers (valid for 2 hours) Free1
PASSES
1-Day Pass
Adult $4.502
Reduced Fare $2.253
Agency $4.00
7-Day Pass $25.002
31-Day Pass
Standard & Frequent Service $62.002
Rush Hour (Express) $85.00
Reduced Fare $31.003
Mainstream $105.004
REDUCED FARES (For Fixed-Route Service)
Senior Discount/Key Card $1.00
Senior Discount/Key Card COTA LINK $0.505
ADA Card Free
Children 48” tall and over through 12 years of age $1.00
Children under 48” tall (Limit 3 with an adult family member) Free
PROJECT MAINSTREAM
ADA trip $3.50
Non ADA trip $5.00 1Additional $0.75 upcharge when transferring from Standard or Frequent to Rush Hour (Express) service.
Additional $1.00 upcharge when transferring from LINK to Standard or Frequent and $1.75 from LINK to
Rush Hour (Express) service. Senior and Key cardholders do not pay upcharge for Express lines. 2Additional $0.75 upcharge when used on Express lines. 3 Senior ID Card, Key Card, Children 48” tall through 12 years of age. 4Additional $1.50 upcharge for non-ADA trips.
5Additional $0.50 upcharge when transferring to Local or Express lines.
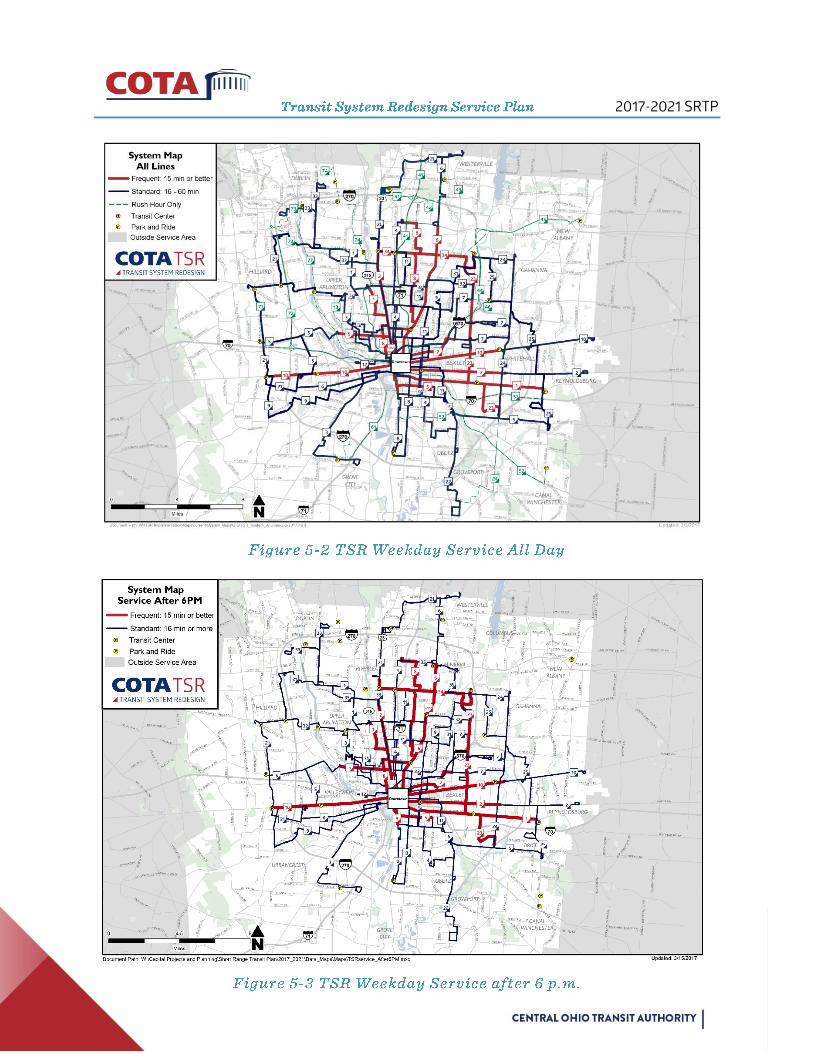
2017-2021 SRTP
84

2017-2021 SRTP
85

2017-2021 SRTP
86
COTA will be able to expand service through 2019, with the TSR serving as the backbone of the
SRTP service plan. Figure 5-6 displays the growth in service hours, which measure how many
hours COTA’s buses are in service, on the street, annually. Since TSR implementation began in
January 2015 through the end of 2019 an additional 277,769 hours, a 28% increase over the end of
2014, will have been added. Much of this increase will occur on May 1, 2017, when the TSR
network is restructured.
Between January 2015 and January 2017 COTA has implemented the following improvements to
the network in preparation for the launch of the TSR:
Improved frequency and span on multiple lines, emphasizing weekend service including
current line 10 W. Broad/E. Broad and 7 Neil/Whittier;
Addition of line 21 Hilliard-Rome;
Launching the AirConnect service,
Addition of line 2L Crosswoods/Polaris, which will be extended to downtown Columbus
via High St. on May 1, 2017; and
Addition of Sunday service and all day extension to Easton Town Center on current line 83
Oakland/Weber.
The TSR is being implemented to respond to changes in development that have occurred over the
last 40 years. As discussed in Section 2, the region has been growing steadily and, along with this
growth, development patterns have seen a shift first towards more suburban designs and areas
and now back towards denser, urban designs. Overall, the region has grown in residents and jobs,
increasing demand for transit.
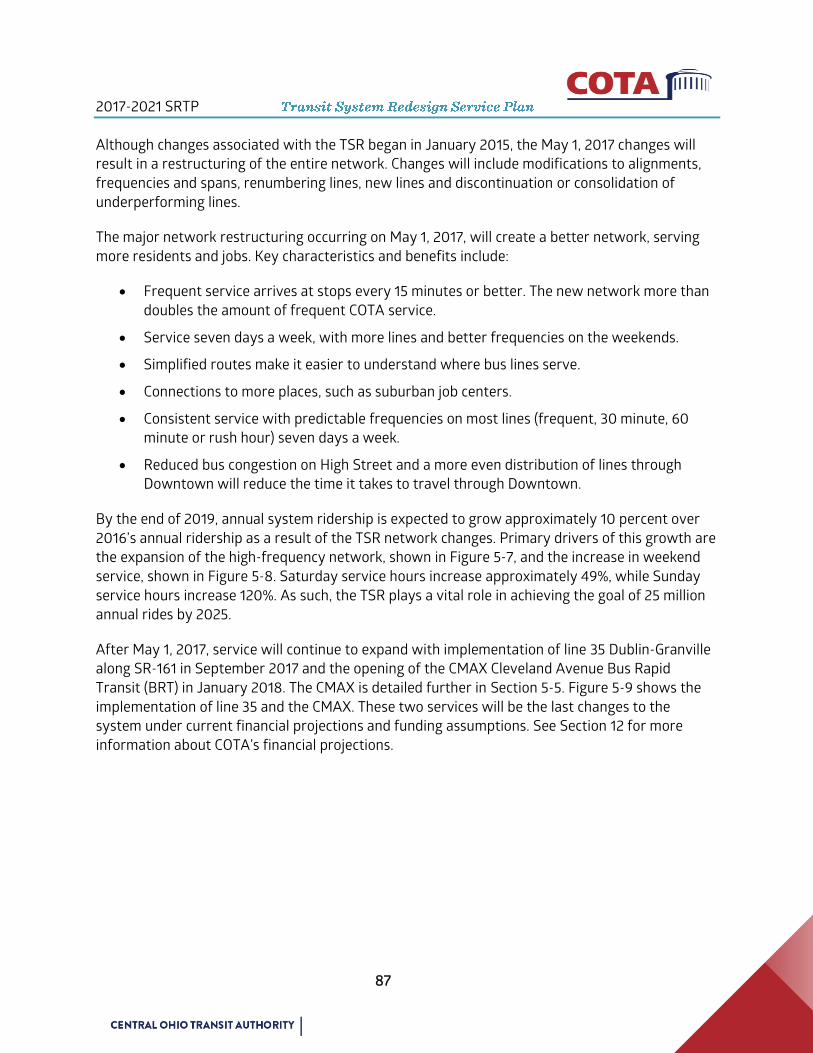
2017-2021 SRTP
87
Although changes associated with the TSR began in January 2015, the May 1, 2017 changes will
result in a restructuring of the entire network. Changes will include modifications to alignments,
frequencies and spans, renumbering lines, new lines and discontinuation or consolidation of
underperforming lines.
The major network restructuring occurring on May 1, 2017, will create a better network, serving
more residents and jobs. Key characteristics and benefits include:
Frequent service arrives at stops every 15 minutes or better. The new network more than
doubles the amount of frequent COTA service.
Service seven days a week, with more lines and better frequencies on the weekends.
Simplified routes make it easier to understand where bus lines serve.
Connections to more places, such as suburban job centers.
Consistent service with predictable frequencies on most lines (frequent, 30 minute, 60
minute or rush hour) seven days a week.
Reduced bus congestion on High Street and a more even distribution of lines through
Downtown will reduce the time it takes to travel through Downtown.
By the end of 2019, annual system ridership is expected to grow approximately 10 percent over
2016’s annual ridership as a result of the TSR network changes. Primary drivers of this growth are
the expansion of the high-frequency network, shown in Figure 5-7, and the increase in weekend
service, shown in Figure 5-8. Saturday service hours increase approximately 49%, while Sunday
service hours increase 120%. As such, the TSR plays a vital role in achieving the goal of 25 million
annual rides by 2025.
After May 1, 2017, service will continue to expand with implementation of line 35 Dublin-Granville
along SR-161 in September 2017 and the opening of the CMAX Cleveland Avenue Bus Rapid
Transit (BRT) in January 2018. The CMAX is detailed further in Section 5-5. Figure 5-9 shows the
implementation of line 35 and the CMAX. These two services will be the last changes to the
system under current financial projections and funding assumptions. See Section 12 for more
information about COTA’s financial projections.

2017-2021 SRTP
88

2017-2021 SRTP
89

2017-2021 SRTP
90
In November 2014, COTA adopted a service allocation policy, directing staff to invest
approximately 70% of bus service into high-ridership lines and 30% into coverage lines, service in
regionally important areas that likely generate low-ridership. This policy is meant as a guideline to
be applied when the TSR is complete and for all future changes to the bus network beyond that
point. This strategy reflects COTA’s current bus network, which also invests approximately 70% of
service in high-ridership lines and 30% in coverage.
High-ridership lines serve corridors such as North High Street., Broad St., W. Fifth Avenue, E. Main
Street, Cleveland Avenue, Livingston Avenue., etc. This service and the surrounding corridor
exhibit universal characteristics that generate high-ridership:
Density – There are many people living and jobs located around the service;
Continuity – The corridor service travels along has few gaps where there are no potential
riders, such as parking lots, vacant lots and rural green space;
Linearity – Service can travel in a reasonably straight line that riders and potential riders
perceive as direct;
Walkability – Service is easy and safe to access, such as a prevalence of sidewalks and
pedestrian crossings;
Uniqueness – Service does not overlap or compete with other service within ¼ mi. unless
the demand within the overlapping and competing area is high.
Coverage lines serve areas that do not exhibit characteristics of high-ridership service, but are
important to serve. These areas include low-density suburban communities, e.g., the Rickenbacker
area, New Albany Business Park, Hilliard-Rome Rd., and Polaris Fashion Place.
Table 5-6 displays the allocation of service of each of the TSR either as ridership, coverage or
both. High frequency lines, 15 minutes or better, are mostly all ridership lines and 60 minute and
rush hour lines are all coverage, while 30 minutes lines are split. Ridership focused lines may have
less frequent branches that fall into coverage service, however the entirety of 15 minute or better
service is classified as ridership. More information about this methodology for determining if a
service falls into the ridership or coverage category is found in Section 4.
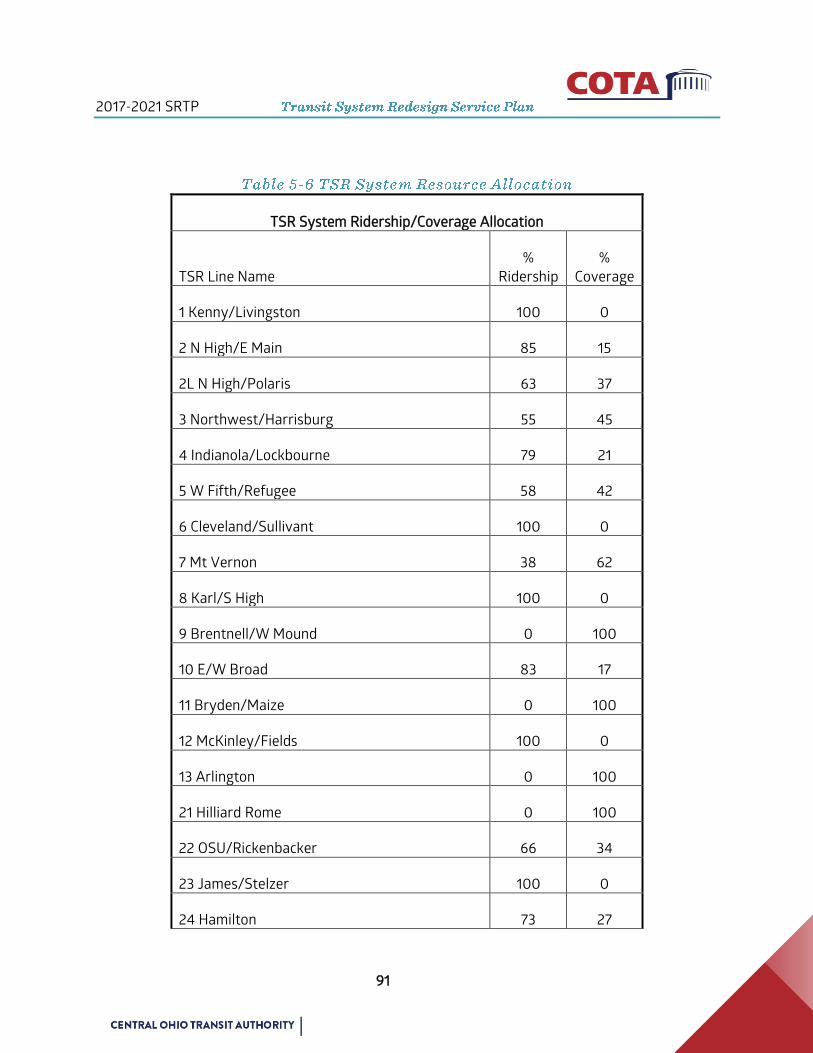
2017-2021 SRTP
91
TSR System Ridership/Coverage Allocation
TSR Line Name
%
Ridership
%
Coverage
1 Kenny/Livingston 100 0
2 N High/E Main 85 15
2L N High/Polaris 63 37
3 Northwest/Harrisburg 55 45
4 Indianola/Lockbourne 79 21
5 W Fifth/Refugee 58 42
6 Cleveland/Sullivant 100 0
7 Mt Vernon 38 62
8 Karl/S High 100 0
9 Brentnell/W Mound 0 100
10 E/W Broad 83 17
11 Bryden/Maize 0 100
12 McKinley/Fields 100 0
13 Arlington 0 100
21 Hilliard Rome 0 100
22 OSU/Rickenbacker 66 34
23 James/Stelzer 100 0
24 Hamilton 73 27
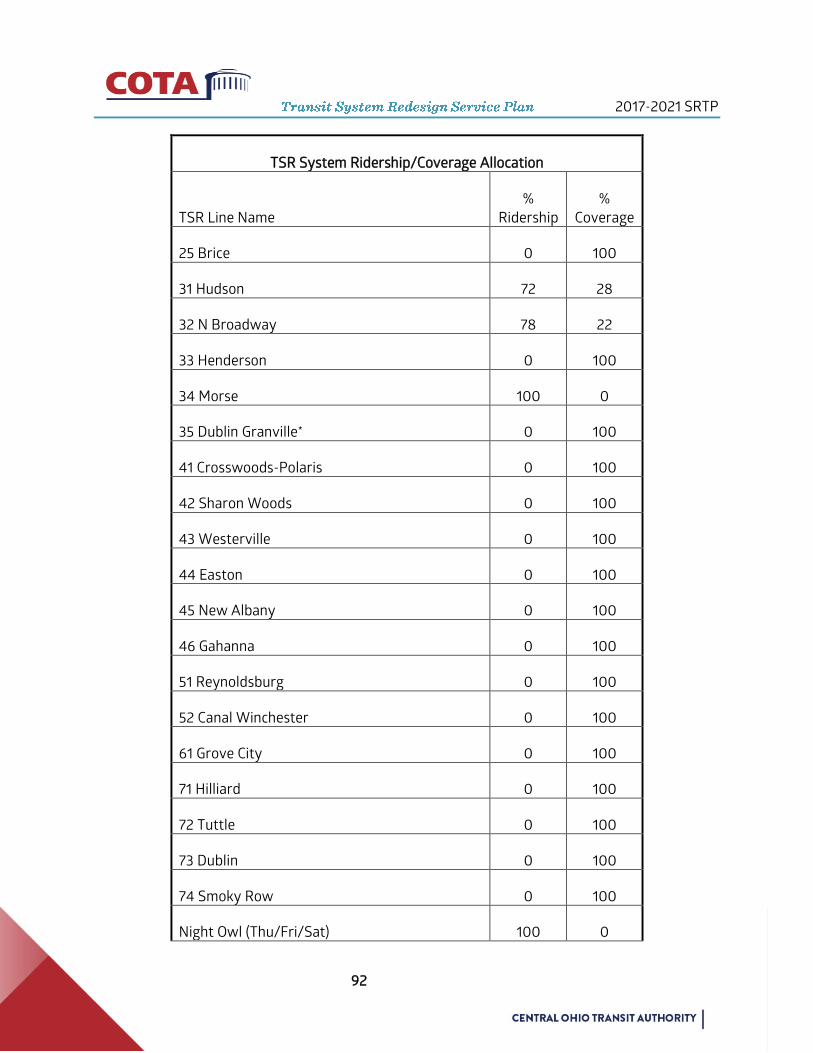
2017-2021 SRTP
92
TSR System Ridership/Coverage Allocation
TSR Line Name
%
Ridership
%
Coverage
25 Brice 0 100
31 Hudson 72 28
32 N Broadway 78 22
33 Henderson 0 100
34 Morse 100 0
35 Dublin Granville* 0 100
41 Crosswoods-Polaris 0 100
42 Sharon Woods 0 100
43 Westerville 0 100
44 Easton 0 100
45 New Albany 0 100
46 Gahanna 0 100
51 Reynoldsburg 0 100
52 Canal Winchester 0 100
61 Grove City 0 100
71 Hilliard 0 100
72 Tuttle 0 100
73 Dublin 0 100
74 Smoky Row 0 100
Night Owl (Thu/Fri/Sat) 100 0

2017-2021 SRTP
93
TSR System Ridership/Coverage Allocation
TSR Line Name
%
Ridership
%
Coverage
Columbus Zoo 0 100
CMAX* 100 0
System wide Total 69.1 30.9
*To be implemented after May 1, 2017 TSR Launch
Since the 2015-2019 SRTP, in the fall of 2016 COTA relocated and opened the newly constructed
Dublin Park & Ride as part of the City of Dublin’s Bridge Street development. With the
implementation of the TSR and launch of the CMAX Cleveland Avenue Bus Rapid Transit project,
COTA plans to open a new transit center and relocate two park and rides. Figure 5-10 shows
current and future park and ride and transit center locations. A description of the three changes
are found below:
As part of the CMAX Cleveland Avenue Bus Rapid Transit project, COTA plans to open a
new transit center and park and ride lot near Cleveland Avenue and SR-161;
Relocate the existing leased Northern Lights Park & Ride to a new COTA-owned location
immediately north of its current location at the Northern Lights Shopping Center;
In the southeast, COTA plans to move the currently leased Canal Winchester Park & Ride
south on Gender Road to a new COTA constructed location at Winchester Pike in 2018.
See Section 9.4 for additional details about Park & Rides.

2017-2021 SRTP
94

2017-2021 SRTP
95
TSR P&R Locations
Site Name Location City Spaces Lines Agreement
1
Broad &
Southampton
1974
W. Broad St. &
Southampton Ave. Columbus 68 10 COTA Owned
2
Crosswoods
1993
7460 Huntington
Park Dr. Columbus 169 2L, 41 COTA Owned
3
Delawanda
2003 4939 N High St. Columbus 58 2, 2L, 33 COTA Owned
4
Dublin Dale Dr.
2016 4450 Dale Dr. Dublin 84
73, Zoo
Bus COTA Owned
5
Easton Transit
2002 4260 Stelzer Rd. Columbus 41
7, 9, 23,
24, 25,
31, 32,
34, 44,
45 COTA Owned
6
Gender Rd.
2010 5336 Gender Rd.
Canal
Winchester 40 52 Lease
7
Great Southern
1974
S. High St. & Obetz
Rd. Columbus 84 8 Lease
8
Griggs Dam
1995
Riverside Dr &
Nottingham Rd. Columbus 16
32, 73,
Zoo Bus
Informal
Agreement
9
Grove City
1984
2321 Old
Stringtown Rd. Grove City 150 3, 61 COTA Owned
10
Hilliard Cemetery
Rd.
1986 4199 Parkway Ln. Hilliard 90 21, 32, 71 COTA Owned
11
Hilliard UMC
2008
5445 Scioto Darby
Rd. Hilliard 37 21, 71 Lease
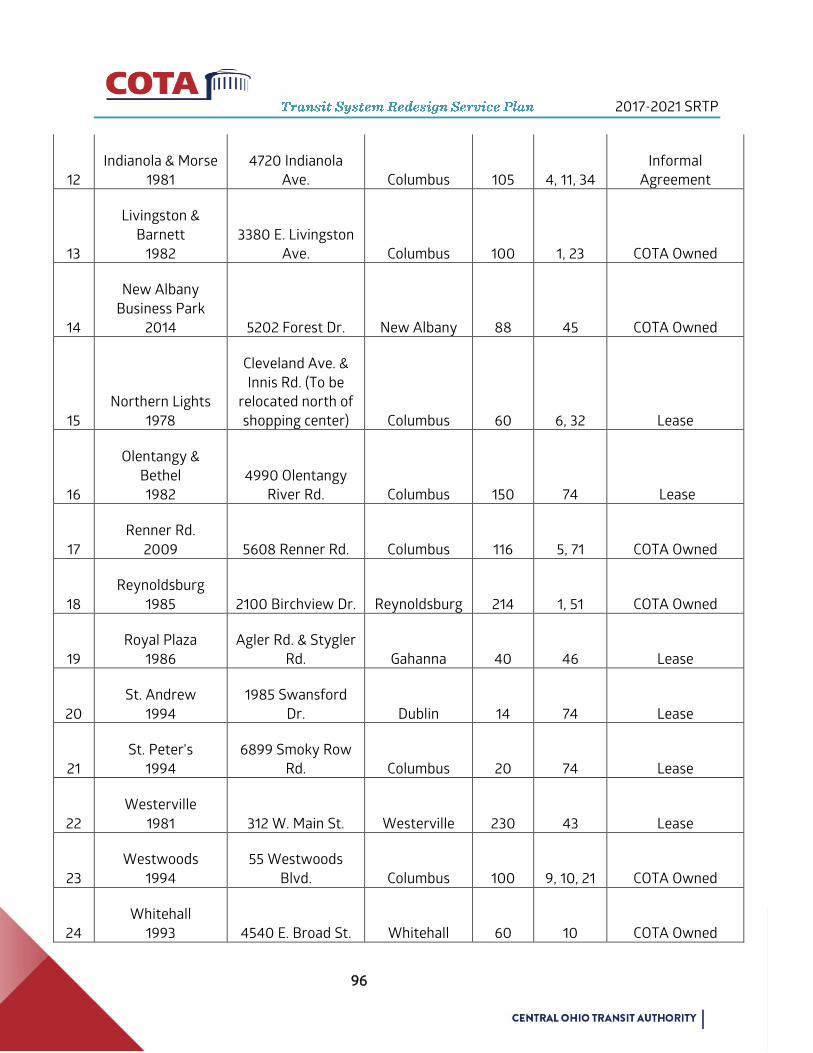
2017-2021 SRTP
96
12
Indianola & Morse
1981
4720 Indianola
Ave. Columbus 105 4, 11, 34
Informal
Agreement
13
Livingston &
Barnett
1982
3380 E. Livingston
Ave. Columbus 100 1, 23 COTA Owned
14
New Albany
Business Park
2014 5202 Forest Dr. New Albany 88 45 COTA Owned
15
Northern Lights
1978
Cleveland Ave. &
Innis Rd. (To be
relocated north of
shopping center) Columbus 60 6, 32 Lease
16
Olentangy &
Bethel
1982
4990 Olentangy
River Rd. Columbus 150 74 Lease
17
Renner Rd.
2009 5608 Renner Rd. Columbus 116 5, 71 COTA Owned
18
Reynoldsburg
1985 2100 Birchview Dr. Reynoldsburg 214 1, 51 COTA Owned
19
Royal Plaza
1986
Agler Rd. & Stygler
Rd. Gahanna 40 46 Lease
20
St. Andrew
1994
1985 Swansford
Dr. Dublin 14 74 Lease
21
St. Peter's
1994
6899 Smoky Row
Rd. Columbus 20 74 Lease
22
Westerville
1981 312 W. Main St. Westerville 230 43 Lease
23
Westwoods
1994
55 Westwoods
Blvd. Columbus 100 9, 10, 21 COTA Owned
24
Whitehall
1993 4540 E. Broad St. Whitehall 60 10 COTA Owned
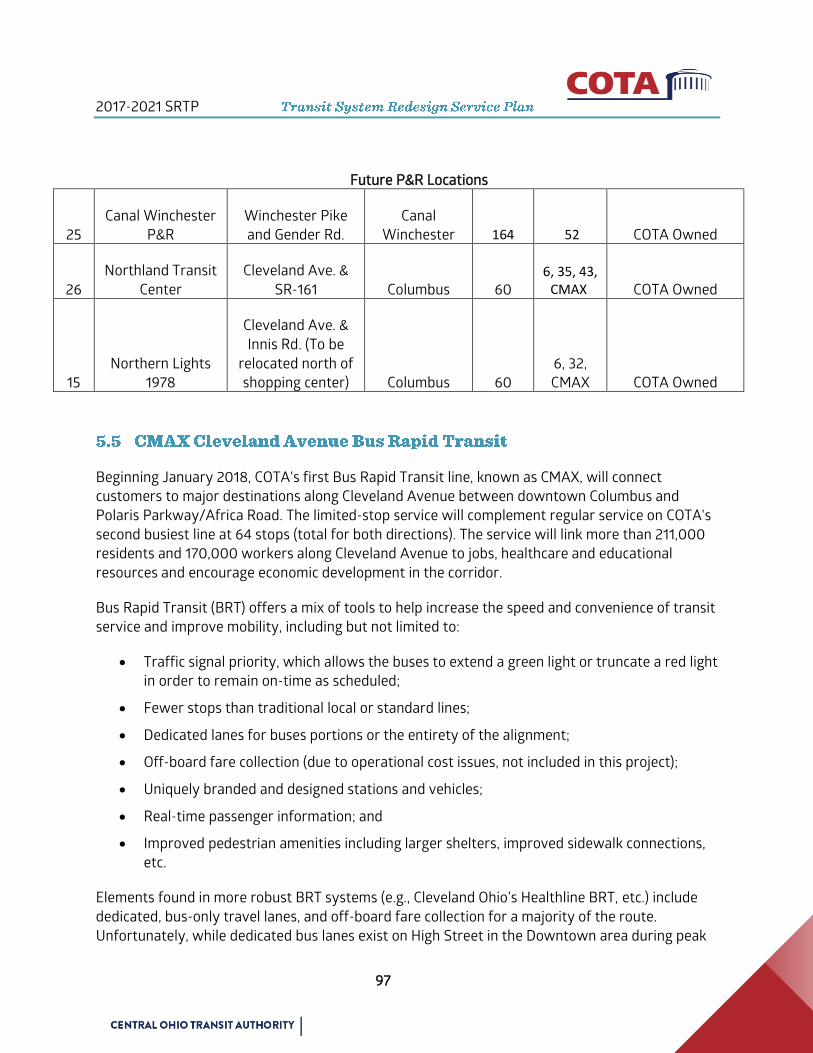
2017-2021 SRTP
97
Future P&R Locations
25
Canal Winchester
P&R
Winchester Pike
and Gender Rd.
Canal
Winchester 164 52 COTA Owned
26
Northland Transit
Center
Cleveland Ave. &
SR-161 Columbus 60 6, 35, 43,
CMAX COTA Owned
15
Northern Lights
1978
Cleveland Ave. &
Innis Rd. (To be
relocated north of
shopping center) Columbus 60
6, 32,
CMAX COTA Owned
Beginning January 2018, COTA's first Bus Rapid Transit line, known as CMAX, will connect
customers to major destinations along Cleveland Avenue between downtown Columbus and
Polaris Parkway/Africa Road. The limited-stop service will complement regular service on COTA's
second busiest line at 64 stops (total for both directions). The service will link more than 211,000
residents and 170,000 workers along Cleveland Avenue to jobs, healthcare and educational
resources and encourage economic development in the corridor.
Bus Rapid Transit (BRT) offers a mix of tools to help increase the speed and convenience of transit
service and improve mobility, including but not limited to:
Traffic signal priority, which allows the buses to extend a green light or truncate a red light
in order to remain on-time as scheduled;
Fewer stops than traditional local or standard lines;
Dedicated lanes for buses portions or the entirety of the alignment;
Off-board fare collection (due to operational cost issues, not included in this project);
Uniquely branded and designed stations and vehicles;
Real-time passenger information; and
Improved pedestrian amenities including larger shelters, improved sidewalk connections,
etc.
Elements found in more robust BRT systems (e.g., Cleveland Ohio’s Healthline BRT, etc.) include
dedicated, bus-only travel lanes, and off-board fare collection for a majority of the route.
Unfortunately, while dedicated bus lanes exist on High Street in the Downtown area during peak
2017-2021 SRTP
98
travel times, Cleveland Avenue does not have the capacity to allow for implementation of
dedicated bus lanes. Due to cost constraints, COTA will not implement an off-board fare collection
system, however, select high boarding activity stations will be outfitted with ticket vending
machines designed to speed-up the boarding process.
In November 2010, COTA was awarded grant funding from FTA’s former Section 5339 Livability
Funding Opportunity: Alternative Analysis Program to investigate BRT and other transit
alternatives in the northeast travel corridor which includes Cleveland Avenue. COTA operates
several lines within this corridor, including the #1 Cleveland Local. As COTA’s second busiest
ridership line, this line experiences frequent standing loads.
An Alternatives Analysis (AA) was conducted in 2011-2012, and in June 2012, COTA’s Board of
Trustees adopted a 15.6 mile Locally Preferred Alternative comprised of a combination of Bus
Rapid Transit (BRT) service operating in mixed traffic primarily along Cleveland Avenue between
downtown Columbus and SR-161 (10.3 miles), with enhanced local service continuing north to
Polaris Parkway (5.3 miles). Additionally, MORPC adopted the project into the region’s
Metropolitan Transportation Plan.
Project benefits include:
Improved transit service
Improved mobility and reliability in congested corridor
Travel savings of 20%
A new Northern Lights park and ride lot
A new Northland Transit Center, which includes a park and ride lot
Improved pedestrian access and safety
Projected 20% increase in ridership in 5 years
More travel options for growing transit-dependent populations
In April 2013, FTA approved entering into the Project Development
phase, which included preliminary engineering (up to 60%) and an
environmental study. The project was awarded environmental
clearance in July 2014, and following completion of preliminary
engineering in August 2014, an FTA Small Starts grant funding
request was submitted in September 2014. Final Design followed
which included completing engineering and design to the 100% level,
acquisition of real estate, development of cooperative agreements
2017-2021 SRTP
99
with the City of Columbus, Franklin County, and the City of Westerville, and several other tasks
necessary to complete prior to start of construction.
In June 2016 an FTA grant was approved for 77% of the
estimated $48.6 million budget, ($37.5 million) federal
funding. The remaining 23%, or $11.2 million, will be
funded from COTA’s local sales tax receipts. In August
2016, construction was initiated, and will continue
through 2017.
Figure 5-14 displays the CMAX Cleveland Avenue BRT
alignment, stations, and transit facilities (Northern
Lights Park & Ride and Northland Transit Center). Figure
5-13 displays a rendering of the Northland Transit
Center currently under construction. Including both
directions, there are 64 designated BRT stations. On
weekdays, the BRT will operate at 10-minute service frequency during peak hours and 15-minute
service frequency during off-peak hours between downtown Columbus and SR-161, and on
weekends, 30-minute service frequency.
BRT buses will operate within existing traffic lanes along the corridor, and to improve on-time
performance, traffic signals will be coordinated along Cleveland Avenue between Fort Hayes and
SR-161 to allow buses priority through intersections if buses are running off schedule. With fewer
stops, BRT travel times can be reduced by 21% over current Local Line 1 Cleveland trip times. An
example rendering of a CMAX station can be found in Figure 5-15.

2017-2021 SRTP
100

2017-2021 SRTP
101
Projected costs and service hours are
programmed into COTA’s 2018-2021 TIP (TIP)
financial model found in Section 12. Major capital
items include 15 new, uniquely branded CNG
powered buses and shelters, construction of a
park and ride in the Northern Lights area, a
transit center and park and ride at 5495
Cleveland Avenue, resurfacing of curb lanes
along Cleveland Avenue between Westerville
Road and SR-161, implementation of signal
priority for buses along Cleveland Avenue, real-time passenger information displays at BRT
stations, and ticket vending machines at select high boarding locations along the route.
Powered by compressed natural gas (CNG), buses will
feature a vibrantly-colored, movement-inspired
exterior design, with sleek, platinum and bright blue
fiberglass seats. Customers will enjoy free on-board Wi-
Fi and power charging ports to keep them connected on
their trip.
Local artists will be featured at 33 stations between Columbus State and the Northland
community. The artwork will be incorporated into transparent panels on rear shelter glass. For
almost two years, the artists worked with COTA, the Greater Columbus Arts Council, Columbus
College of Art & Design, Columbus Art Commission, area commissions, elected officials and
community leaders to develop designs that reflect the culture and history of the diverse
neighborhoods along Cleveland Avenue.
Key to the success of any major service investment such as BRT is close coordination and
partnership with local agencies, community stakeholders, and community leaders. Similar to
efforts established during the AA, development of BRT service requires continued close
coordination with the City of Columbus, City of Westerville, Franklin County, Clinton Township, the
Village of Minerva Park, ODOT, MORPC, and other agency and stakeholder initiatives to help
enhance the corridor by:
Improving mobility options;
Promoting economic development opportunities, and;
Promoting quality and affordable housing.
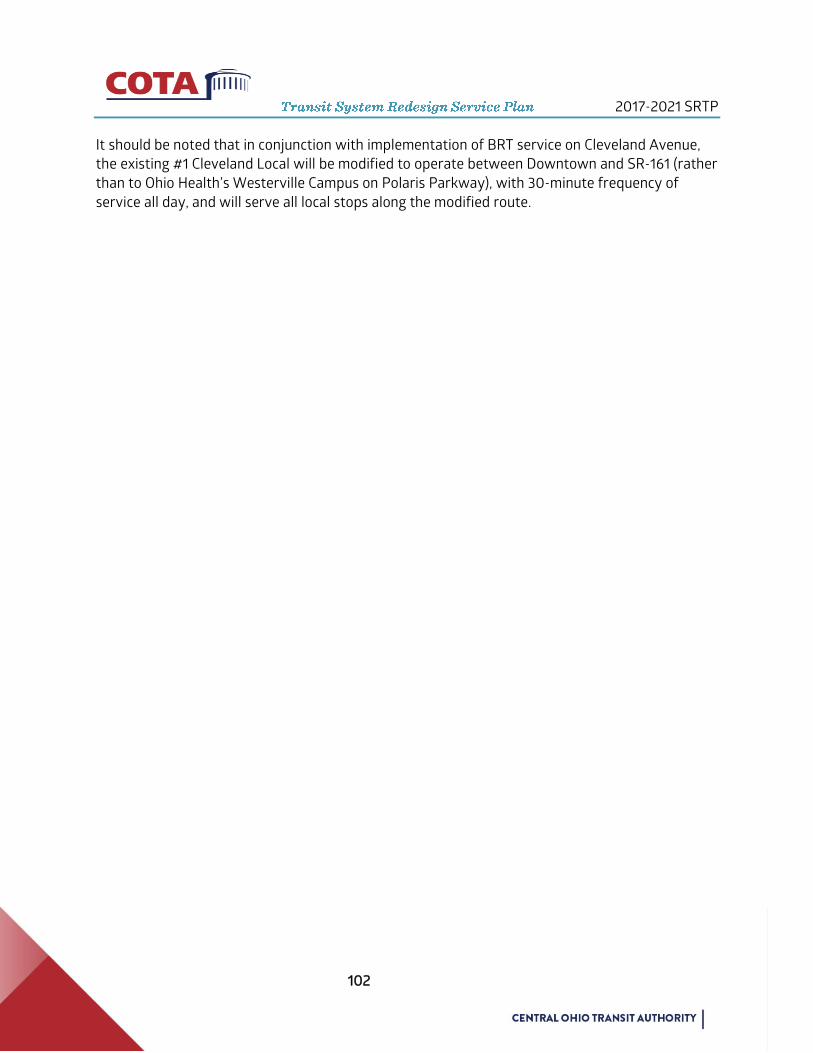
2017-2021 SRTP
102
It should be noted that in conjunction with implementation of BRT service on Cleveland Avenue,
the existing #1 Cleveland Local will be modified to operate between Downtown and SR-161 (rather
than to Ohio Health’s Westerville Campus on Polaris Parkway), with 30-minute frequency of
service all day, and will serve all local stops along the modified route.

2017-2021 SRTP
103
At the end of 2016, COTA operated an active fleet of 354 coaches. An additional nine buses
were kept in reserve as an inactive or contingency fleet, and two buses are inoperable and
scheduled for sale or salvage. COTA also has a “historical” bus that is used for special events
and parades. For more information on COTA’s fleet, including the number of coaches, status,
year of manufacture, manufacturer, and seating capacity, see Table 6-1.
Per Federal Transit Administration (FTA) guidelines, the number of spare vehicles in the active
fleet should not exceed 20% of the number of vehicles operated in the maximum, or “peak”
service time period. As of December 2016, COTA operated 297 buses in the peak service
period. The remaining active vehicles are retained as spares (i.e., for breakdowns,
manufacturer recalls, passenger overload relief, and special service) or for preventive
maintenance (PM).
FTA guidelines state that heavy-duty transit coaches have a minimum 12-year or 500,000-
mile service life. Each year, COTA implements service changes on the first Monday in January,
May, and September. As such, bus replacement and expansion planning efforts are targeted to
meet the vehicle needs for each future service change period. Table 6-2 and Table 6-3 provide
a detailed listing of COTA’s bus replacement schedule and the planned acquisition of
expansion vehicles necessary to carry out the 2017-2021 SRTP service plan as discussed in
Section 5.
As described in Section 1, COTA anticipates an estimated an 11% increase in annual service
hours over the next five years. The procurement process for ordering and delivering fixed-
route buses takes approximately 12 to 18 months. COTA uses a “level buying” program as
much as possible for bus acquisitions to minimize the variable number of buses that are
purchased each year. This approach allows COTA to reduce the average age of the fleet and
increase the fleet size to meet service expansion requirements. In the long term, this program
allows COTA to better plan for the capital expenses related to bus purchases.
Funding for future bus replacement and expansion involves a variety of sources, including
federal Congestion Mitigation and Air Quality (CMAQ), Section 5309 Capital Investment, and
Section 5307 Urban Formula grants, the Ohio Department of Transportation’s (ODOT) Public
2017-2021 SRTP
104
Transit Grant Program funds, and COTA’s local sales tax receipts. CMAQ grants provide
funding for projects and programs in air quality non-attainment and maintenance areas for
ozone (discussed in Section 6.4), carbon monoxide, and particulate matter aimed at reducing
transportation related emissions. CMAQ funds are apportioned to qualifying areas according
to a formula based on population and severity of pollution. In central Ohio, the Mid-Ohio
Regional Planning Commission (MORPC) administers CMAQ funds.
Every two years, MORPC solicits applications for transportation projects and programs that
are located within its transportation planning area. In August 2016, MORPC solicited
applications for awarding funding to projects and programs for State Fiscal Years (SFY) 2018-
2021. Following the public comment period, MORPC conducts final award reviews and funding
recommendations in March 2017. Currently, COTA is scheduled to receive over $12.8 million in
MORPC attributable CMAQ funds during SFYs 2018-2021 to assist in funding future
Compressed Natural Gas (CNG) vehicle replacements
There is formidable competition for federal and state assistance and the availability of various
federal and state monies to fund all future bus replacement and expansion needs is not a
given. COTA will actively pursue other possible sources of capital grant monies, including a
partnership with MORPC to identify opportunities for funding COTA's bus replacement needs.
The successful passage of Issue 7 in 2006 and its voter approved 10-year renewal in
November 2016 has been critical in providing additional local funding resources to help offset
shortfalls in federal and state capital assistance, and in allowing COTA to expand much needed
transit services in central Ohio.

2017-2021 SRTP
105
Ye
ar o
f M
anu
fact
ure
Man
ufa
ctu
rer
Po
we
r
Len
gth
Seat
ing
Cap
acit
y
Equ
ipm
en
t
Nu
mb
er
of
Ve
hic
les
Act
ive Active
Fleet Age
Co
nti
nge
ncy
Spe
cial
Se
rvic
e
Sale
Pe
nd
ing
(years)
2016 GILLIG CNG 40' 39 A/C – Ramp 14 14 0
2016 GILLIG CNG 40' 39 A/C – Ramp 2 0
2016 GILLIG CNG 35’ 32 A/C – Ramp 4 4 0
2015 GILLIG CNG 40' 39 A/C – Ramp 33 33 1
2015 GILLIG CNG 35’ 32 A/C – Ramp 5 5 1
2014 GILLIG CNG 40' 39 A/C – Ramp 21 21 2
2014 GILLIG CNG 35’ 32 A/C – Ramp 7 7 2
2014 GILLIG CNG 30’ 23 A/C – Ramp 8 8 2
2013 GILLIG CNG 40’ 39 A/C – Ramp 18 18 3
2013 GILLIG CNG 35’ 32 A/C – Ramp 12 12 3
2012 GILLIG Diesel 40' 39 A/C – Ramp 23 23 4
2011 GILLIG Diesel 40' 39 A/C – Ramp 37 37 5
2011 GILLIG Diesel 30' 23 A/C – Ramp 3 3 5
2010 GILLIG Diesel 40' 39 A/C – Ramp 37 37 6
2010 GILLIG Diesel Hybrid 40' 39 A/C – Ramp 6 6 6
2010 GILLIG Diesel 30' 23 A/C – Ramp 3 3 6
2009 GILLIG Diesel 40' 39 A/C – Ramp 30 30 7
2009 GILLIG Diesel 30' 23 A/C – Ramp 10 10 7
2008 GILLIG Diesel 40' 39 A/C – Ramp 29 29 8
2008 GILLIG Diesel 30' 23 A/C – Ramp 10 10 8
2007 GILLIG Diesel 35' 32 A/C – Ramp 32 32 9
2005 New Flyer Diesel 40’ 39 A/C – Ramp 5 4 1 11
2005 GILLIG Diesel 35’ 32 A/C – Ramp 11 8 3 11
2004 New Flyer Diesel 40’ 39 A/C – Ramp 5 5
1963 GMC Diesel 40' 53 A/C – Lift 1 1
Total 366 354 9 1 0
Active Fleet
Average Age
(in years)
5.028
Total Fleet As of December 2016 (Note: All buses are ADA accessible)
In-Active

2017-2021 SRTP
106
1. Total Active Fleet is all buses determined to be eligible for active service. Does not include contingency vehicles
and buses, which may be out of service due to a major accident or fire damage.
2. Bus replacement and expansion schedule is based upon expansion of services hour calculated in Q4 of 2012.
Current increase in service hours is greater than listed but only those hours allocated to planned service are listed.
* Active fleet will be reduced in conjunction with the implementation of the Transit System Review. COTA will seek
approval from FTA to sell or transfer the remaining federal investment, or another similar strategy.
** 2 BRT buses will be delivered in 2016 to be used in testing of equipment and will not enter active fleet until Sept.
2017
YEAR MFGPOWER
PLANTLENGTH SEATING BUY QTY Jan-17 May-17* Sep-17 Jan-18 Jan-19 Jan-20 Jan-21 Jan-22
2001 NEW FLYER DIESEL 40' 39 62
2003 NEW FLYER DIESEL 40' 39 10
2004 NEW FLYER DIESEL 40' 39 5
2005 GILLIG DIESEL 35' 39 12 10
2005 NEW FLYER DIESEL 40' 39 5 5
2007 GILLIG DIESEL 35' 32 32 32
2008 GILLIG DIESEL 30' 23 10 10 5 8 0
2008 GILLIG DIESEL 40' 39 30 29 25 29 22 0
2009 GILLIG DIESEL 30' 23 10 10 10 10 10 4
2009 GILLIG DIESEL 40' 39 30 30 30 30 30 30 6
2010 GILLIG DIESEL 30' 23 3 3 3 3 3 3 3
2010 GILLIG DIESEL 40' 39 37 37 37 37 37 37 37 18 0
2010 GILLIG D / HYBRID 40' 39 6 6 6 6 6 6 6 6 0
2011 GILLIG DIESEL 30' 23 3 3 3 3 3 3 3 3 0
2011 GILLIG DIESEL 40' 39 37 37 37 37 37 37 37 37 36
2012 GILLIG DIESEL 40' 40 23 23 23 23 23 23 23 23 23
2013 GILLIG CNG 40' 39 18 18 18 18 18 18 18 18 18
2013 GILLIG CNG 35' 32 12 12 12 12 12 12 12 12 12
2014 GILLIG CNG 40' 38 21 21 21 21 21 21 21 21 21
2014 GILLIG CNG 35' 32 7 7 7 7 7 7 7 7 7
2014 GILLIG CNG 30 24 8 8 8 8 8 8 8 8 8
2015 GILLIG CNG 35' 32 5 5 5 5 5 5 5 5 5
2015 GILLIG CNG 40' 39 33 33 33 33 33 33 33 33 33
2016 UNDECIDED CNG 40' 39 14 14 14 14 14 14 14 14 14
2016 UNDECIDED CNG 35' 32 4 4 4 4 4 4 4 4 4
2016 UNDECIDED CNG - BRT 40' 38 2 **2 **2 **2 2 2 2 2 2
2017 UNDECIDED CNG 30 24 6 6 6 6 6 6 6 6
2017 UNDECIDED CNG 35' 32 7 7 7 7 7 7 7 7
2017 UNDECIDED CNG - BRT 40' 38 13 **13 **13 13 13 13 13 13
2018 UNDECIDED CNG ? ? 28 28 28 28 28
2019 UNDECIDED CNG ? ? 28 28 28 28
2020 UNDECIDED CNG ? ? 28 28 28
2021 UNDECIDED CNG ? ? 28 28
357 314 321 321357 314 321 321 321 321 321 321
269 261 275 275 275 275 275 275
54 53 54 54 54 54 54 54
(entered by hand) Total Active Fleet Size
PEAK FLEET
20% Spare Ratio
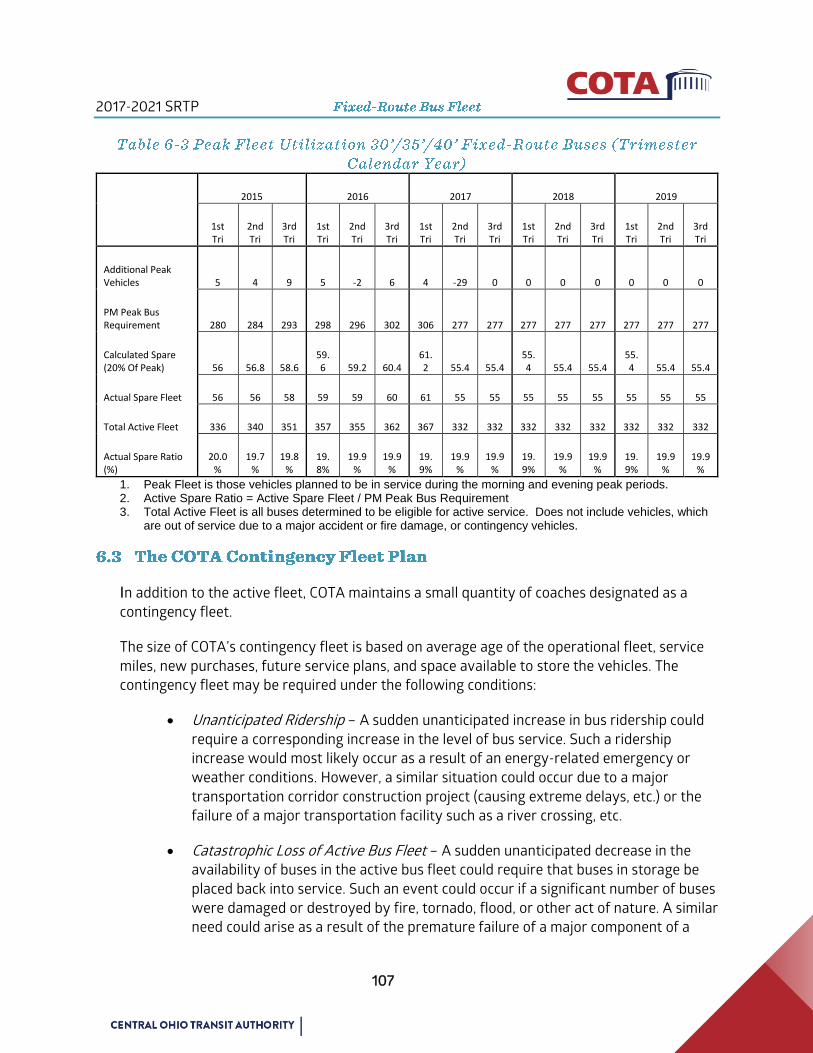
2017-2021 SRTP
107
2015 2016 2017 2018 2019
1st Tri
2ndTri
3rd Tri
1st Tri
2nd Tri
3rd Tri
1st Tri
2nd Tri
3rd Tri
1st Tri
2nd Tri
3rd Tri
1st Tri
2nd Tri
3rd Tri
Additional Peak Vehicles 5 4 9 5 -2 6 4 -29 0 0 0 0 0 0 0
PM Peak Bus Requirement 280 284 293 298 296 302 306 277 277 277 277 277 277 277 277
Calculated Spare (20% Of Peak) 56 56.8 58.6
59.6 59.2 60.4
61.2 55.4 55.4
55.4 55.4 55.4
55.4 55.4 55.4
Actual Spare Fleet 56 56 58 59 59 60 61 55 55 55 55 55 55 55 55
Total Active Fleet 336 340 351 357 355 362 367 332 332 332 332 332 332 332 332
Actual Spare Ratio (%)
20.0%
19.7%
19.8%
19.8%
19.9%
19.9%
19.9%
19.9%
19.9%
19.9%
19.9%
19.9%
19.9%
19.9%
19.9%
1. Peak Fleet is those vehicles planned to be in service during the morning and evening peak periods. 2. Active Spare Ratio = Active Spare Fleet / PM Peak Bus Requirement 3. Total Active Fleet is all buses determined to be eligible for active service. Does not include vehicles, which
are out of service due to a major accident or fire damage, or contingency vehicles.
In addition to the active fleet, COTA maintains a small quantity of coaches designated as a
contingency fleet.
The size of COTA’s contingency fleet is based on average age of the operational fleet, service
miles, new purchases, future service plans, and space available to store the vehicles. The
contingency fleet may be required under the following conditions:
Unanticipated Ridership – A sudden unanticipated increase in bus ridership could
require a corresponding increase in the level of bus service. Such a ridership
increase would most likely occur as a result of an energy-related emergency or
weather conditions. However, a similar situation could occur due to a major
transportation corridor construction project (causing extreme delays, etc.) or the
failure of a major transportation facility such as a river crossing, etc.
Catastrophic Loss of Active Bus Fleet – A sudden unanticipated decrease in the
availability of buses in the active bus fleet could require that buses in storage be
placed back into service. Such an event could occur if a significant number of buses
were damaged or destroyed by fire, tornado, flood, or other act of nature. A similar
need could arise as a result of the premature failure of a major component of a
2017-2021 SRTP
108
group or sub fleet of buses, e.g., an engine or transmission failure, or cracking of
structural frame members.
Bus Unavailability – An event that would require major bus fleet expansion may
well be national in scope (an energy crisis for example). Consequently, many transit
agencies may be attempting to secure additional buses at the same time. This
could result in long lead times to acquire needed buses, which would be prohibitive
in terms of responding to the crisis at hand.
Maintenance – Buses in the contingency fleet are on a 6,000-mile Preventive
Maintenance (PM) schedule in accordance with COTA’s approved Maintenance
Plan. Periodic start-ups will occur between normal PM inspections so that the
fleet remains ready for service at all times. Vehicle history records are maintained
for each bus.
Over the past two decades, an increasing number of alternative fuels and new emerging bus
technologies have been developed and commercialized. Selecting the best fuel and
technologies for COTA’s transit fleet is a high priority. COTA is committed to contributing to
the growth of regional alternative fuel use and to being a leader in environmental
stewardship.
The Environmental Protection Agency (EPA) has mandated a reduction in the emissions of
nitrous oxide, sulfur dioxide, and hydrocarbons. COTA is an active partner with MORPC’s Air
Quality Program, which was formed to address the region’s growing air quality issues. This
program’s membership includes representation from local governments, health-based
organizations, businesses, and environmental interests.
Low-sulfur petro-diesel engine emission reductions mandated by the EPA, offer significant
opportunities for fine particulate matter and ozone improvements. Using alternative engine
fuels, COTA will continue to be proactive in improving air quality in the region. One initiative
COTA has implemented to improve the region’s air quality and quality of life is using
alternative fuels such as CNG and reducing its dependency on petro diesel. As mentioned
above, COTA continues to transition its fleet from diesel buses to CNG buses. This change will
reduce costs and result in quieter buses and cleaner air.
The transition to CNG buses decreases greenhouse gas emissions as compared to the existing
diesel-fueled buses. CNG is a fueling system that is used successfully in many US transit
agencies and is even more prevalent in other countries. This reliable technology achieves
significant air quality improvements.
In April 2004, the EPA designated the central Ohio region as “non-attainment” for failing to
meet minimum air quality standards for ozone. In addition, Franklin, Delaware, Licking, and
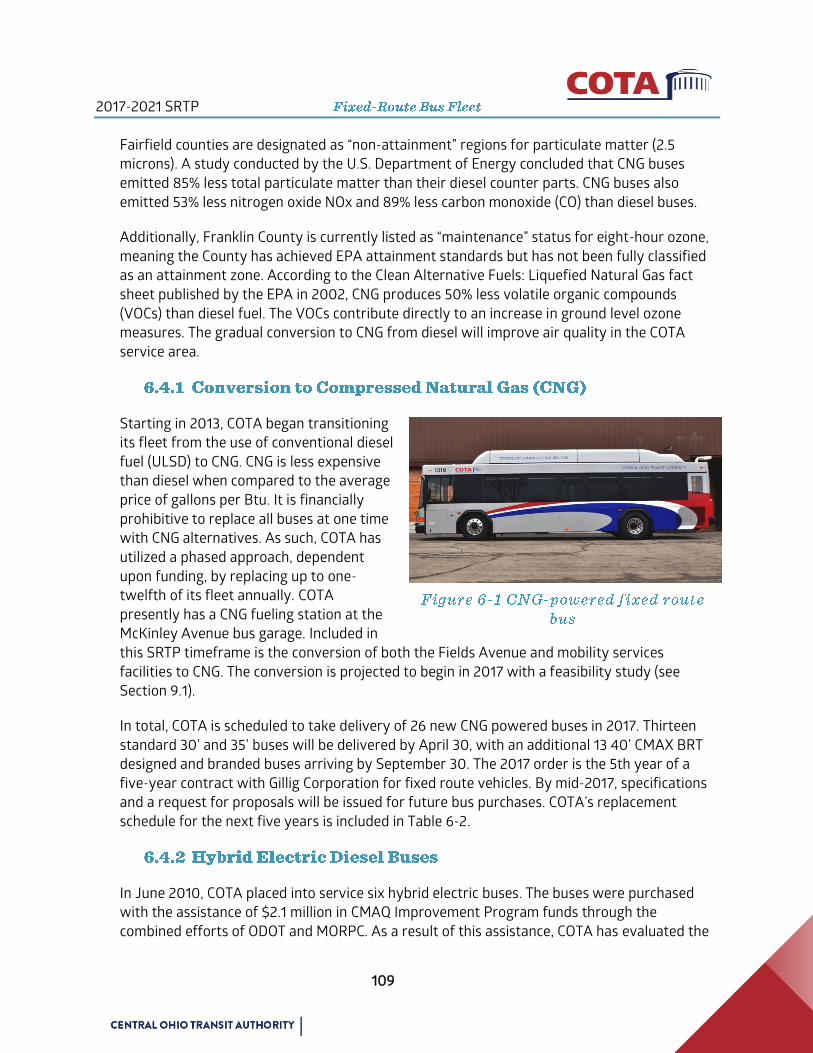
2017-2021 SRTP
109
Fairfield counties are designated as “non-attainment” regions for particulate matter (2.5
microns). A study conducted by the U.S. Department of Energy concluded that CNG buses
emitted 85% less total particulate matter than their diesel counter parts. CNG buses also
emitted 53% less nitrogen oxide NOx and 89% less carbon monoxide (CO) than diesel buses.
Additionally, Franklin County is currently listed as “maintenance” status for eight-hour ozone,
meaning the County has achieved EPA attainment standards but has not been fully classified
as an attainment zone. According to the Clean Alternative Fuels: Liquefied Natural Gas fact
sheet published by the EPA in 2002, CNG produces 50% less volatile organic compounds
(VOCs) than diesel fuel. The VOCs contribute directly to an increase in ground level ozone
measures. The gradual conversion to CNG from diesel will improve air quality in the COTA
service area.
Starting in 2013, COTA began transitioning
its fleet from the use of conventional diesel
fuel (ULSD) to CNG. CNG is less expensive
than diesel when compared to the average
price of gallons per Btu. It is financially
prohibitive to replace all buses at one time
with CNG alternatives. As such, COTA has
utilized a phased approach, dependent
upon funding, by replacing up to one-
twelfth of its fleet annually. COTA
presently has a CNG fueling station at the
McKinley Avenue bus garage. Included in
this SRTP timeframe is the conversion of both the Fields Avenue and mobility services
facilities to CNG. The conversion is projected to begin in 2017 with a feasibility study (see
Section 9.1).
In total, COTA is scheduled to take delivery of 26 new CNG powered buses in 2017. Thirteen
standard 30’ and 35’ buses will be delivered by April 30, with an additional 13 40’ CMAX BRT
designed and branded buses arriving by September 30. The 2017 order is the 5th year of a
five-year contract with Gillig Corporation for fixed route vehicles. By mid-2017, specifications
and a request for proposals will be issued for future bus purchases. COTA’s replacement
schedule for the next five years is included in Table 6-2.
In June 2010, COTA placed into service six hybrid electric buses. The buses were purchased
with the assistance of $2.1 million in CMAQ Improvement Program funds through the
combined efforts of ODOT and MORPC. As a result of this assistance, COTA has evaluated the

2017-2021 SRTP
110
environmental and economic benefits of operating
hybrid electric buses in the central Ohio region. While
this technology has allowed for improved fuel-
economy and reduced reduce noise and overall
emissions, COTA has elected at this time not to
pursue additional hybrid electric bus purchases.
Preventive Maintenance (PM) is a mainstay of COTA’s maintenance efforts. It is COTA’s
intention to improve the PM program constantly, moving from a position of reactive
maintenance to a more deliberate, consistent, and proactive maintenance operation.
The Vehicle Maintenance department is responsible for the development of scheduled COTA
maintenance programs. All programs are reviewed annually for adequacy and applicability.
Manufacturer’s recommendations, historical data on bus system performance, and direct
feedback from bus maintenance provide the foundation for evaluating the PM program’s
effectiveness.
The PM functions outlined are set forth in detailed systematic procedures found in bus
manufacturer’s maintenance manuals and COTA standard practice bulletins, standard
operating procedures, and maintenance directives located at each operating division and
maintenance shop. Completed preventive and corrective maintenance activities are
documented on the appropriate forms, reviewed and certified by a supervisor, and entered
into the reporting system.
The scheduled maintenance program is designed to prolong bus reliability by detecting
potential defects and correcting them before they fail. It also allows equipment requiring
lubrication, measurement, and adjustment to be serviced. Buses are withdrawn from service
at regular mileage-based intervals to permit the following PM actions:
Inspection of equipment to determine its condition compared with established
standards;
Routine service: lubricating, replacing filters, replenishing fluids, and making
adjustments;
Cleaning of exterior and interior surfaces and equipment; and
Scheduled replacement of electrical and mechanical equipment.
The PM inspections are conducted at the following intervals:
2017-2021 SRTP
111
o A-Inspection: This general PM is performed every 6,000 miles. It includes
an oil change, lube service and a general inspection of all major areas as
outlined on the PM checklist;
o B-Inspection: This PM is performed every 12,000 miles and incorporates all
the requirements outlined for the “A” inspection plus additional checks to
some of the major areas of the vehicle, including replacement of fuel filters;
o C-Inspections: This PM is performed every 24,000 miles and includes the
requirements as outlined on the A and B PM’s plus additional detailed
checks into the major areas of the vehicle, including the replacement of
transmission and engine air filters;
o D-Inspection: This PM is performed every 48,000 miles and includes the
requirements as outlined on the A, B, and C PM’s plus additional detailed
checks into the major areas of the vehicle, including replacement of all
fluids and filters; and
o E-Inspection: This PM is performed every 96,000 miles and includes the
requirements as outlined the A, B, C, and D PM’s plus a transmission and
coolant flush.
ADA Equipment: Ramp equipped coaches are inspected during the normal PM
process.
HVAC PM - is “date” based and is scheduled twice a year.
Engine Tune-Up: are “date” based and are scheduled once a year.
In addition to the primary passenger amenities such as buses, park and ride lots, bus stops and
shelters, COTA employs other equipment and facilities as part of a behind-the-scenes effort to
keep operations running efficiently. This equipment is described below.
COTA has established a replacement schedule and identified additional fleet requirements to
support transit operations during this five-year planning horizon. Various types of service
vehicles are distributed among the departments that support operations, including passenger
automobiles and vans, police cruisers, heavy-duty service trucks (bucket, box, flat bed), and
pickup trucks. Over the span of this SRTP, 38 vehicles are scheduled for purchase. COTA staff
utilizes these vehicles for administrative functions, maintaining COTA infrastructure, and

2017-2021 SRTP
112
supporting maintenance activities on the fixed-route fleet. The cost of the non-revenue
vehicles is $478,700 and will be funded from the dedicated local sales tax.
2017 2018 2019 2020 2021
Est. Cost $682,369 $370,000 $485,000 $850,000 $300,000

2017-2021 SRTP
113
COTA’s Mobility Services department is responsible for meeting the requirements of the
Americans with Disabilities Act (ADA) by providing paratransit service that complements fixed-
route service. Paratransit operations serve the elderly and persons with disabilities. Mobility
Services will continue to develop alternative transportation options that exceed COTA’s
traditional fixed-route and paratransit services.
COTA’s vision is to be the region’s transportation leader. This goal includes providing a full service
mobility management system that requires a variety of functions and activities to meet the needs
of the community.
COTA Mainstream Paratransit service is provided for individuals who are unable to use the
regular fixed-route bus service due to a disability. The service is based on ADA eligibility
criteria. Transportation service is provided throughout the COTA service area, which includes
Franklin County and select portions of Delaware, Fairfield, and Licking counties (see Figure 2.2)
Since 2011, COTA has contracted with First Transit, a transportation service provider, to
perform paratransit service operations. The contract cost is negotiated annually.
Operating statistics for Mainstream are monitored on a daily, weekly, and monthly basis. The
service provider contract requires ADA compliance as well as adherence to various
performance standards including:
Zero ADA trip denials;
On-time performance;
Productivity goals for passenger trips per revenue hour;
Missed trips;
On-board monitoring; and
Vehicle maintenance requirements.
Statistical outcomes also include customer-service requests, customer trips, operating
expenses, revenue recovery, and other indicators. Outcomes are tracked and reported
monthly. Information is compared to prior months and prior years to analyze and assess
significant trends or anomalies regarding service delivery. Table 7-1 summarizes Mainstream
operating results for COTA’s calendar years.

2017-2021 SRTP
114
One component in providing alternative methods to traditional mobility service delivery is
COTA’s non-ADA service. Non-ADA service is offered to customers who reside more than ¾
mile away from fixed route service or travel outside of service area but within COTA’s taxing
district.

2017-2021 SRTP
115
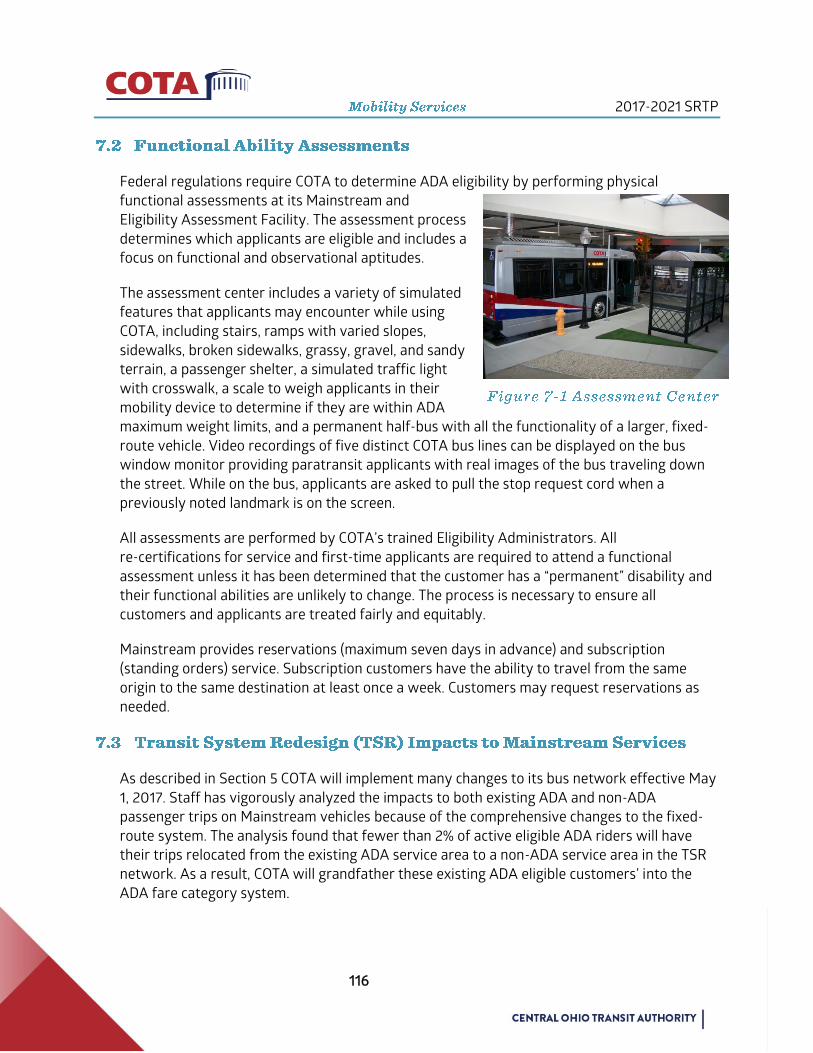
2017-2021 SRTP
116
Federal regulations require COTA to determine ADA eligibility by performing physical
functional assessments at its Mainstream and
Eligibility Assessment Facility. The assessment process
determines which applicants are eligible and includes a
focus on functional and observational aptitudes.
The assessment center includes a variety of simulated
features that applicants may encounter while using
COTA, including stairs, ramps with varied slopes,
sidewalks, broken sidewalks, grassy, gravel, and sandy
terrain, a passenger shelter, a simulated traffic light
with crosswalk, a scale to weigh applicants in their
mobility device to determine if they are within ADA
maximum weight limits, and a permanent half-bus with all the functionality of a larger, fixed-
route vehicle. Video recordings of five distinct COTA bus lines can be displayed on the bus
window monitor providing paratransit applicants with real images of the bus traveling down
the street. While on the bus, applicants are asked to pull the stop request cord when a
previously noted landmark is on the screen.
All assessments are performed by COTA’s trained Eligibility Administrators. All
re-certifications for service and first-time applicants are required to attend a functional
assessment unless it has been determined that the customer has a “permanent” disability and
their functional abilities are unlikely to change. The process is necessary to ensure all
customers and applicants are treated fairly and equitably.
Mainstream provides reservations (maximum seven days in advance) and subscription
(standing orders) service. Subscription customers have the ability to travel from the same
origin to the same destination at least once a week. Customers may request reservations as
needed.
As described in Section 5 COTA will implement many changes to its bus network effective May
1, 2017. Staff has vigorously analyzed the impacts to both existing ADA and non-ADA
passenger trips on Mainstream vehicles because of the comprehensive changes to the fixed-
route system. The analysis found that fewer than 2% of active eligible ADA riders will have
their trips relocated from the existing ADA service area to a non-ADA service area in the TSR
network. As a result, COTA will grandfather these existing ADA eligible customers’ into the
ADA fare category system.
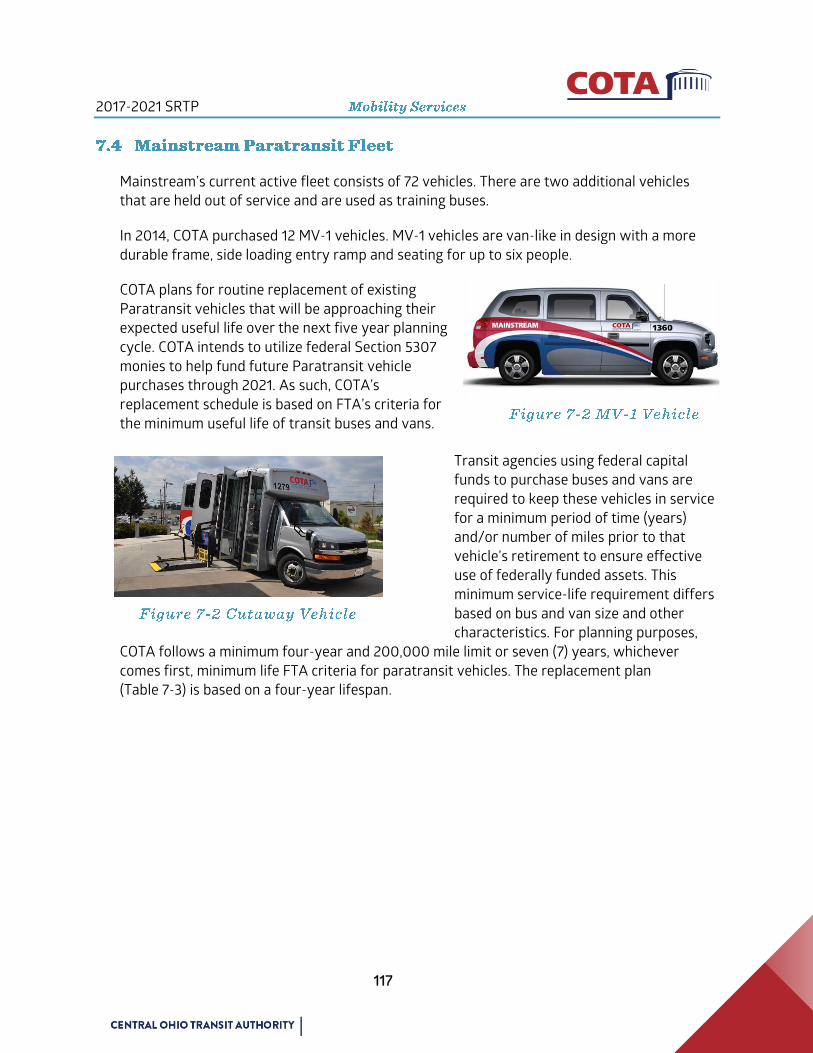
2017-2021 SRTP
117
Mainstream’s current active fleet consists of 72 vehicles. There are two additional vehicles
that are held out of service and are used as training buses.
In 2014, COTA purchased 12 MV-1 vehicles. MV-1 vehicles are van-like in design with a more
durable frame, side loading entry ramp and seating for up to six people.
COTA plans for routine replacement of existing
Paratransit vehicles that will be approaching their
expected useful life over the next five year planning
cycle. COTA intends to utilize federal Section 5307
monies to help fund future Paratransit vehicle
purchases through 2021. As such, COTA’s
replacement schedule is based on FTA’s criteria for
the minimum useful life of transit buses and vans.
Transit agencies using federal capital
funds to purchase buses and vans are
required to keep these vehicles in service
for a minimum period of time (years)
and/or number of miles prior to that
vehicle’s retirement to ensure effective
use of federally funded assets. This
minimum service-life requirement differs
based on bus and van size and other
characteristics. For planning purposes,
COTA follows a minimum four-year and 200,000 mile limit or seven (7) years, whichever
comes first, minimum life FTA criteria for paratransit vehicles. The replacement plan
(Table 7-3) is based on a four-year lifespan.
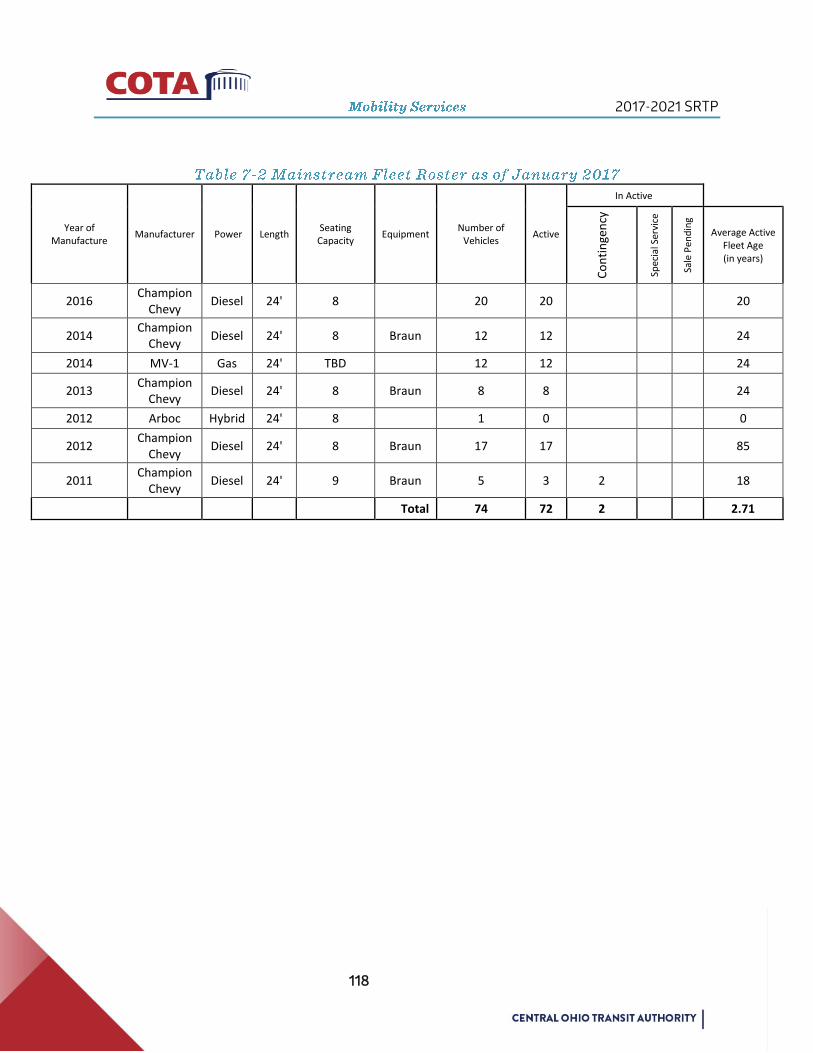
2017-2021 SRTP
118
Year of Manufacture
Manufacturer Power Length Seating Capacity
Equipment Number of
Vehicles Active
In Active
Co
nti
nge
ncy
Spec
ial S
ervi
ce
Sale
Pen
din
g
Average Active Fleet Age (in years)
2016 Champion
Chevy Diesel 24' 8 20 20 20
2014 Champion
Chevy Diesel 24' 8 Braun 12 12 24
2014 MV-1 Gas 24' TBD 12 12 24
2013 Champion
Chevy Diesel 24' 8 Braun 8 8 24
2012 Arboc Hybrid 24' 8 1 0 0
2012 Champion
Chevy Diesel 24' 8 Braun 17 17 85
2011 Champion
Chevy Diesel 24' 9 Braun 5 3 2 18
Total 74 72 2 2.71
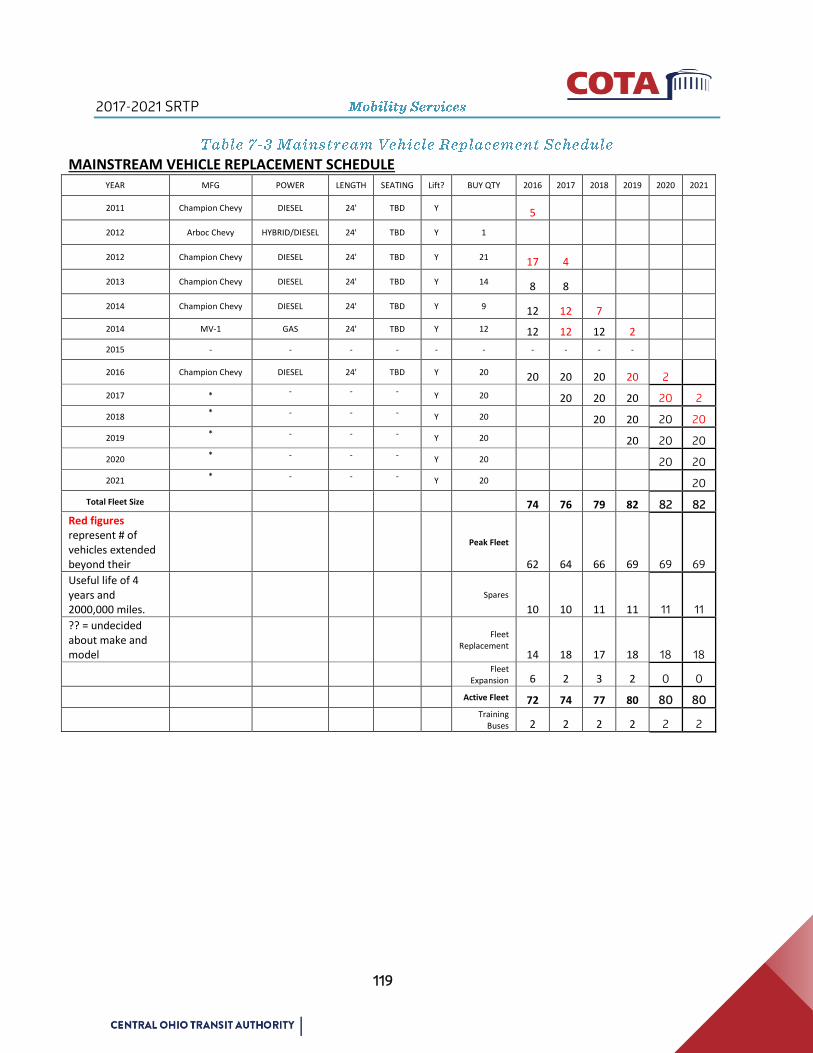
2017-2021 SRTP
119
MAINSTREAM VEHICLE REPLACEMENT SCHEDULE
YEAR MFG POWER LENGTH SEATING Lift? BUY QTY 2016 2017 2018 2019 2020 2021
2011 Champion Chevy DIESEL 24' TBD Y 5
2012 Arboc Chevy HYBRID/DIESEL 24' TBD Y 1
2012 Champion Chevy DIESEL 24' TBD Y 21 17 4
2013 Champion Chevy DIESEL 24' TBD Y 14 8 8
2014 Champion Chevy DIESEL 24' TBD Y 9 12 12 7
2014 MV-1 GAS 24' TBD Y 12 12 12 12 2
2015 - - - - - - - - - -
2016 Champion Chevy DIESEL 24' TBD Y 20 20 20 20 20 2
2017 * - - - Y 20 20 20 20 20 2
2018 * - - - Y 20 20 20 20 20
2019 * - - - Y 20 20 20 20
2020 * - - - Y 20 20 20
2021 * - - - Y 20 20
Total Fleet Size 74 76 79 82 82 82
Red figures represent # of vehicles extended beyond their
Peak Fleet
62 64 66 69 69 69
Useful life of 4 years and 2000,000 miles.
Spares
10 10 11 11 11 11
?? = undecided about make and model
Fleet
Replacement 14 18 17 18 18 18
Fleet Expansion 6 2 3 2 0 0
Active Fleet 72 74 77 80 80 80
Training
Buses 2 2 2 2 2 2

2017-2021 SRTP
120
Due to the potential rising cost of and increased demand for Paratransit service, COTA
continues to explore methods of cost reduction while meeting the transportation needs of the
community.
COTA continues its mission to provide transportation options for Mainstream-eligible
customers. While COTA’s ADA paratransit service is provided within three-quarters of a mile
of fixed route lines, COTA’s non-ADA transportation provides demand response to customers
who want to travel outside of the ADA service area.
Service hours for non-ADA trips are:
Monday-Friday 5:00 a.m. - 10:00 p.m.
Saturday 7:00 a.m. - Midnight
Sunday 7:00 a.m. - 10pm
The current Non-ADA trip fare is $5.00 per trip. Customers must call 24 hours in advance to
schedule service. There is no charge for personal care attendants accompanying passengers.
COTA uses the following initiatives to engage and solicit public input as well as reduce
operating costs.
Staff works closely with members of its Accessible Transportation Advisory Committee
(ATAC). The COTA Board of Trustees recognizes ATAC as community members who can help
improve service by providing customer feedback. The group meets quarterly to discuss
transportation issues, and once a year with members of COTA’s management leadership team.
The COTA Mobility Advisory Board was established to advise the organization on possible
transportation solutions.
The group meets bi-monthly to provide feedback about COTA’s transportation services and
regional demands. The group is comprised of community organizations who are able to offer
advice concerning transportation issues regarding persons with disabilities, older adults and
those who need rides to work. The following organizations are members of the Mobility
Advisory Board:
AARP WorkSearch Foundation
Alvis House

2017-2021 SRTP
121
Central Ohio Area Agency on Aging
Jewish Family Services
Columbus City Schools
Franklin County Department of Developmental Disabilities
Franklin County Department of Job and Family Services
National Church Residences Center for Senior Health dba Heritage Day Health
OSU Extension Service
City of Columbus (Transportation Division)
MORPC
Lifecare Alliance
Franklin County Office on Aging
Columbus State Community College
MidOhio Board of Independent Living Environment
The SRTP includes a projected increase in Mainstream service that addresses existing and
future needs of the community served. As such, Mobility Services plans the following
initiatives during the next five years:
Expand the eligibility assessment process to include trip-by-trip eligibility. This is a
way to evaluate environmental, architectural and transit system barriers in the service
area to better meet the needs of our passengers.
Continue to increase paratransit services to complement fixed-route service increases
and evaluate the service delivery model for non-ADA trips.
An update to the Trapeze scheduling software system that will enable customers to
schedule and confirm trips via the Internet. In addition, customers will have cell phone
access to route and trip information.
COTA continues to improve the accessibility of bus stops based on passenger requests and
information from previous bus stop inventories. Additionally, several Intelligent
Transportation Systems (ITS) projects such as Automated Vehicle Annunciators (AVA) have
been implemented to help improve transit services for individuals with disabilities. Further
information about ITS-related projects can be found in Section 10.
2017-2021 SRTP
122
Coordinated mobility initiatives and projects refers to the development of potential strategies,
activities and projects to improve Mobility Services. This can include partnerships with public
and private providers, agencies and others. The following information describes coordinated
mobility projects.
During the SRTP timeframe, innovative service options and programs have been identified
which include but are not limited to the following areas:
Extend fixed-route service coverage;
Enhance reverse commute service;
Partner with agencies that provide employment van shuttle service;
Partner with agencies for demand-response service;
Partner with agencies on the development of a dial-a-ride program; and
Continue to participate in vanpooling/ridesharing programs.
COTA provides trip-specific travel training to individuals or groups who would like to learn
how to ride the bus.
Travel training sessions will continue to be provided to individuals who are not native-English
speakers, such as members of the Somali and Latino communities.
COTA staff provides an orientation program for new eligible customers. The program is also
offered to customers who have already been certified to use paratransit service. The training
educates customers on how to use Mainstream service effectively and efficiently.
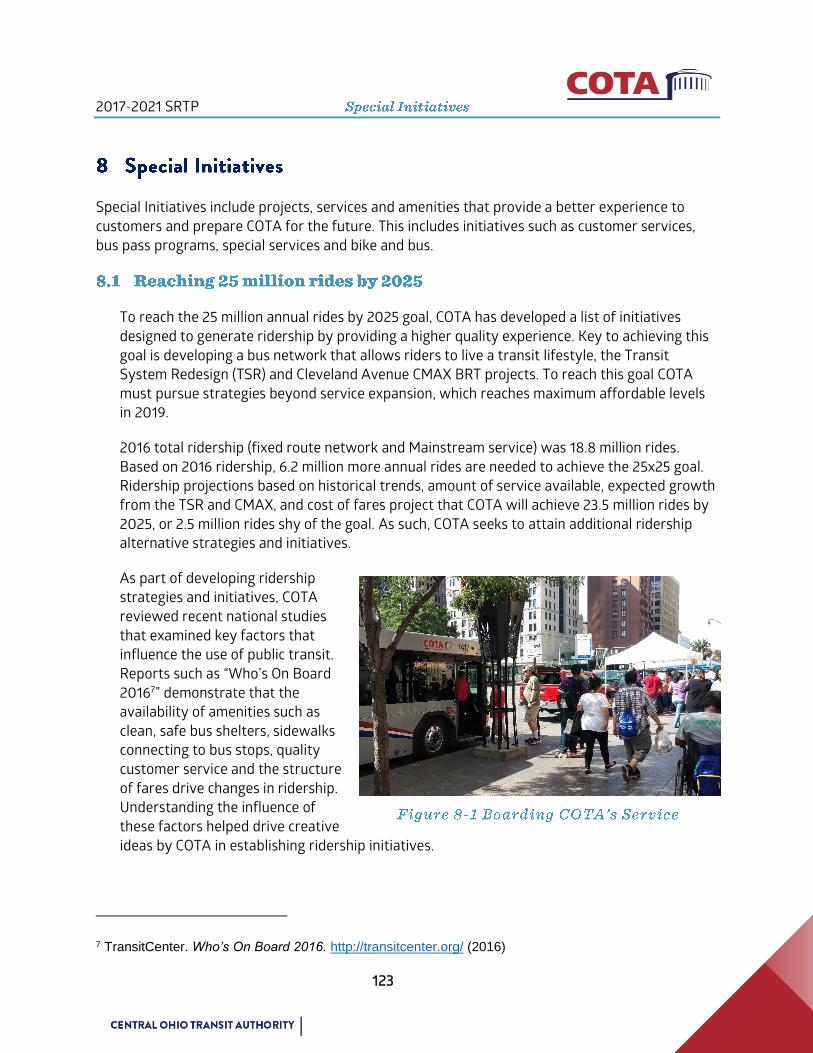
2017-2021 SRTP
123
Special Initiatives include projects, services and amenities that provide a better experience to
customers and prepare COTA for the future. This includes initiatives such as customer services,
bus pass programs, special services and bike and bus.
To reach the 25 million annual rides by 2025 goal, COTA has developed a list of initiatives
designed to generate ridership by providing a higher quality experience. Key to achieving this
goal is developing a bus network that allows riders to live a transit lifestyle, the Transit
System Redesign (TSR) and Cleveland Avenue CMAX BRT projects. To reach this goal COTA
must pursue strategies beyond service expansion, which reaches maximum affordable levels
in 2019.
2016 total ridership (fixed route network and Mainstream service) was 18.8 million rides.
Based on 2016 ridership, 6.2 million more annual rides are needed to achieve the 25x25 goal.
Ridership projections based on historical trends, amount of service available, expected growth
from the TSR and CMAX, and cost of fares project that COTA will achieve 23.5 million rides by
2025, or 2.5 million rides shy of the goal. As such, COTA seeks to attain additional ridership
alternative strategies and initiatives.
As part of developing ridership
strategies and initiatives, COTA
reviewed recent national studies
that examined key factors that
influence the use of public transit.
Reports such as “Who’s On Board
20167” demonstrate that the
availability of amenities such as
clean, safe bus shelters, sidewalks
connecting to bus stops, quality
customer service and the structure
of fares drive changes in ridership.
Understanding the influence of
these factors helped drive creative
ideas by COTA in establishing ridership initiatives.
7 TransitCenter. Who’s On Board 2016. http://transitcenter.org/ (2016)
2017-2021 SRTP
124
Four factors stood out as being most influential on ridership. These factors are summarized
below, with associated description of initiatives following.
Service - First and foremost in making any product more appealing is improving the
product itself. In the case of COTA, our product is public transit service. No other initiatives
will be effective if the service is not meeting people’s needs
Access - Everyone who uses transit spends some portion of their journey in the
environment as pedestrians. Walkable areas with high pedestrian connectivity and
amenities are more conducive to transit usage and, in turn, benefit from the presence of
good transit service, improving the overall experience of using COTA.
Fares - Cost affects people’s purchasing decisions. However, ease of use, both in terms of
paying fares and simplicity of fare structure also has an impact.
Customer Experience - It is critical that COTA strives to go beyond the basic elements that
make transit function and improve all aspects of the experience in a way that transforms it
from a useful service to a preferred and sought after option.
Focusing on enhancing how service is provided, service characteristic initiatives achieve three
primary objectives:
Improving Service Frequency
Decreasing Travel Times and Improving Reliability
Improving Overall Service Design
Currently planned and funded initiatives:
CMAX BRT (In Progress) – The CMAX is COTA’s first foray into constructing and operating
an enhanced mode of transit. Decreasing travel times by approximately 21 percent,
CMAX’s primary benefit to riders is achieved through high frequency service, stations
spaced further apart, and traffic signal priority (TSP) for buses. CMAX is expected to begin
operations in January 2018.
Follow data driven standards for changes to service (In Progress) – Data driven standards
fulfill an important Title VI requirement, ensuring designing and implementing service does
not discriminate against minorities. Additionally, these standards would preserve the
integrity of ridership lines, ensuring that any changes to the line are warranted, proven by
the data. This generates riders by making sure ridership lines have sufficient frequency,
2017-2021 SRTP
125
remain linear, serve walkable areas with continuous development, and do not compete
with other lines. Breaking these design criteria lowers the productivity and ridership.
Revisiting 70-30 ridership coverage split – Potentially modifying the Board adopted
guideline of allocating 70 percent of service to generating ridership and 30 percent to
providing coverage to more heavily favor ridership generating service is an effective
strategy to increasing ridership. Coverage lines are designed to generate fewer riders per
service hour but service important locations, while ridership lines are designed to be much
more productive.
Proposed to be implemented in future planning efforts:
Expanding the high frequency network – Lines with approximately 30 minute frequency
experiencing strong growth in ridership, defined by a new set of service standards, will
warrant entering the high-frequency network. Staff will monitor the performance of the
TSR and expects the new TSR network to reach maximum performance approximately
two years after implementation. Lines identified through this process could be promoted
into the frequent network.
This initiative will be contemplated as part of the NextGen process.
Additional Limited Stop Service – Developing a series of limited stop lines would reduce
travel times, particularly on longer trips on major thoroughfares, such as Broad Street.
Limited stop service would increase competition with the automobile in the suburbs,
improving ridership. Successful limited stop service overlaying frequent service could
indicate that the corridor can support enhanced service, such as BRT. COTA NextGen will
contemplate this strategy.
Dedicated Bus Lanes In-Street – In-street
lanes dedicated to buses would drastically
decrease the travel times and reliability of
bus service. Buses would be able to stop in
the lane, eliminating merge time that exists
when sharing a lane. Additionally, the
required space along the curb would be
much less, as buses can stop in the lane at
bus islands or bulbs.
Coordination with municipal, county and
state governments is critical to obtaining
dedicated lanes as these entities control
the right of way.
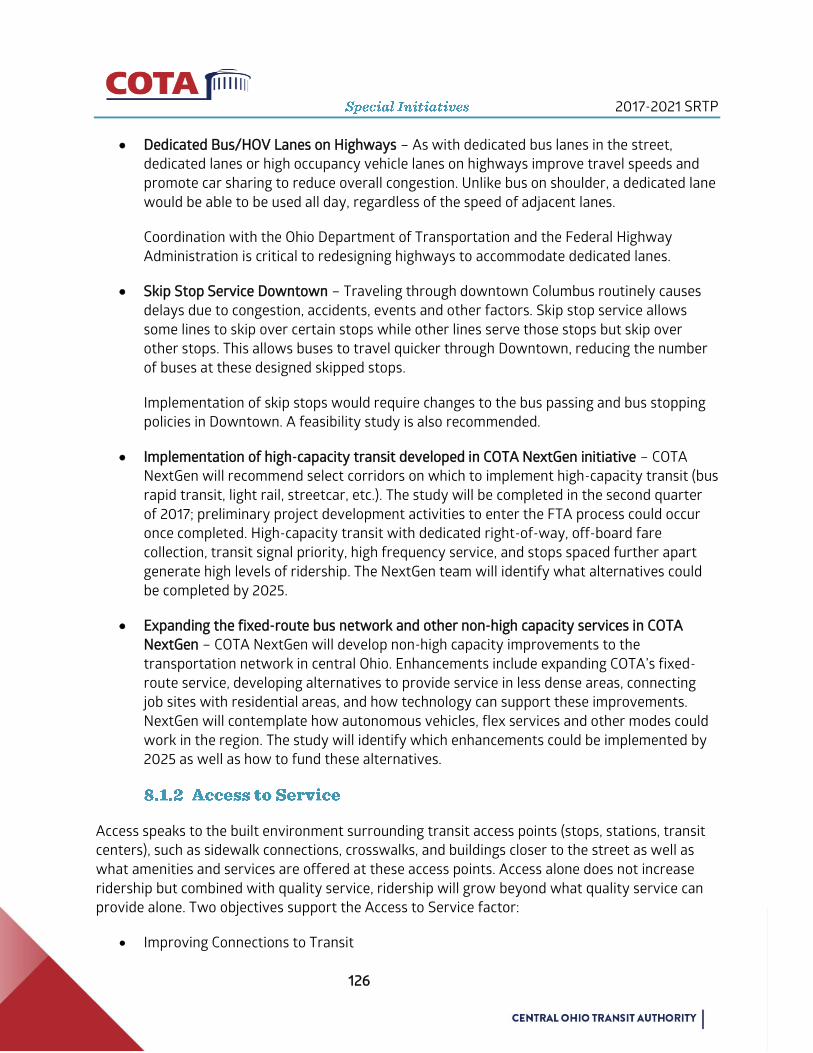
2017-2021 SRTP
126
Dedicated Bus/HOV Lanes on Highways – As with dedicated bus lanes in the street,
dedicated lanes or high occupancy vehicle lanes on highways improve travel speeds and
promote car sharing to reduce overall congestion. Unlike bus on shoulder, a dedicated lane
would be able to be used all day, regardless of the speed of adjacent lanes.
Coordination with the Ohio Department of Transportation and the Federal Highway
Administration is critical to redesigning highways to accommodate dedicated lanes.
Skip Stop Service Downtown – Traveling through downtown Columbus routinely causes
delays due to congestion, accidents, events and other factors. Skip stop service allows
some lines to skip over certain stops while other lines serve those stops but skip over
other stops. This allows buses to travel quicker through Downtown, reducing the number
of buses at these designed skipped stops.
Implementation of skip stops would require changes to the bus passing and bus stopping
policies in Downtown. A feasibility study is also recommended.
Implementation of high-capacity transit developed in COTA NextGen initiative – COTA
NextGen will recommend select corridors on which to implement high-capacity transit (bus
rapid transit, light rail, streetcar, etc.). The study will be completed in the second quarter
of 2017; preliminary project development activities to enter the FTA process could occur
once completed. High-capacity transit with dedicated right-of-way, off-board fare
collection, transit signal priority, high frequency service, and stops spaced further apart
generate high levels of ridership. The NextGen team will identify what alternatives could
be completed by 2025.
Expanding the fixed-route bus network and other non-high capacity services in COTA
NextGen – COTA NextGen will develop non-high capacity improvements to the
transportation network in central Ohio. Enhancements include expanding COTA’s fixed-
route service, developing alternatives to provide service in less dense areas, connecting
job sites with residential areas, and how technology can support these improvements.
NextGen will contemplate how autonomous vehicles, flex services and other modes could
work in the region. The study will identify which enhancements could be implemented by
2025 as well as how to fund these alternatives.
Access speaks to the built environment surrounding transit access points (stops, stations, transit
centers), such as sidewalk connections, crosswalks, and buildings closer to the street as well as
what amenities and services are offered at these access points. Access alone does not increase
ridership but combined with quality service, ridership will grow beyond what quality service can
provide alone. Two objectives support the Access to Service factor:
Improving Connections to Transit

2017-2021 SRTP
127
Improving Stops and Transfers
Currently planned and funded initiatives:
Update Bus Stop Spacing Standards – COTA’s bus stop spacing standards serve as a
guideline to citing the location of bus stops. Stop spacing can effect operational
efficiencies and the ability of customers to access COTA’s service. Ensuring the guidelines
match the goals of the TSR and agency is important to attracting additional riders.
Target improvements to pedestrian infrastructure along transit corridors and between
bus stops and destinations – Improving pedestrian infrastructure between bus stops and
destinations removes a barrier to transit that is often cited as a reason for not using
transit service. Improvements include sidewalks, curb cuts, lighting and crosswalks.
Work with developers and employers to site developments close to transit – As
population and employment in central Ohio continues to grow, location becomes ever
more important. Where new employment centers that have a high percentage of workers
that use public transit are located is a growing concern among both municipalities trying
to attract such centers and the companies will move into the centers. Competition for
employees is strong in the region, transit gives employers a competitive edge, opening up
a larger workforce.
Additionally, building residential neighborhoods near high-frequency transit and with a
site plan that allows quick, easy access to stops is becoming more and more popular,
particularly among young professionals and retired persons.
To accomplish this strategy, COTA must be included in discussions with developers and
site selection professionals. COTA, in turn, must highlight the benefits of locating near
quality transit.
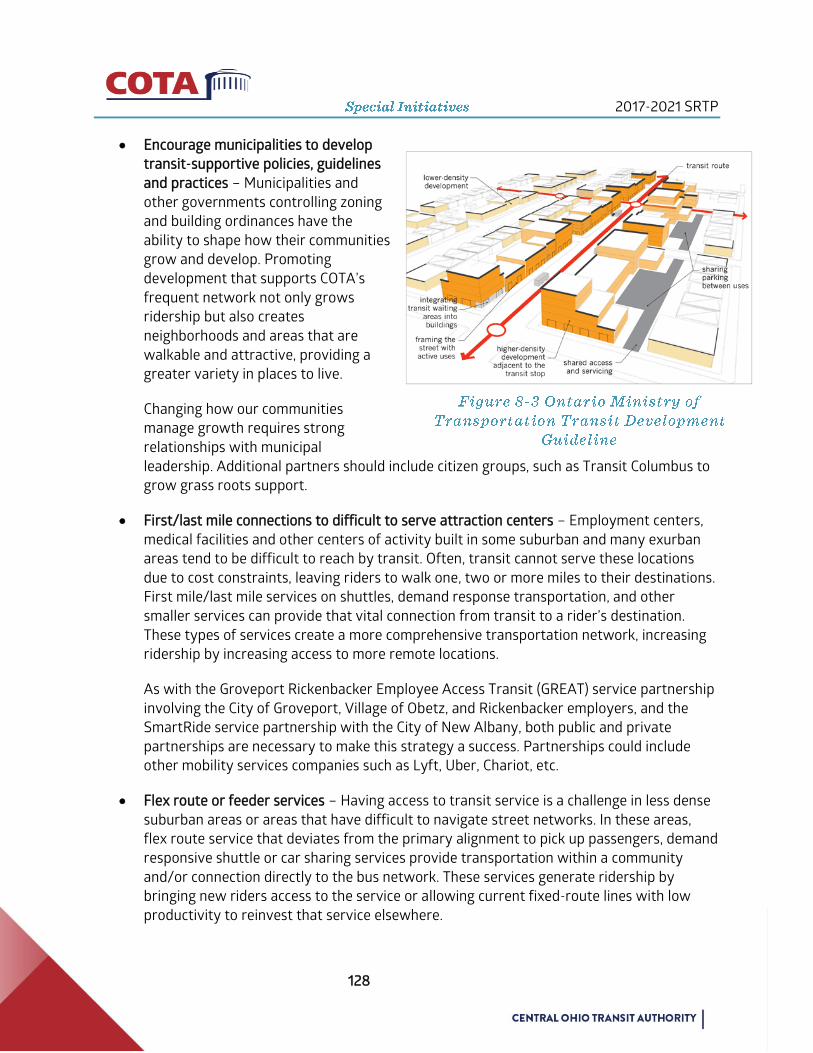
2017-2021 SRTP
128
Encourage municipalities to develop
transit-supportive policies, guidelines
and practices – Municipalities and
other governments controlling zoning
and building ordinances have the
ability to shape how their communities
grow and develop. Promoting
development that supports COTA’s
frequent network not only grows
ridership but also creates
neighborhoods and areas that are
walkable and attractive, providing a
greater variety in places to live.
Changing how our communities
manage growth requires strong
relationships with municipal
leadership. Additional partners should include citizen groups, such as Transit Columbus to
grow grass roots support.
First/last mile connections to difficult to serve attraction centers – Employment centers,
medical facilities and other centers of activity built in some suburban and many exurban
areas tend to be difficult to reach by transit. Often, transit cannot serve these locations
due to cost constraints, leaving riders to walk one, two or more miles to their destinations.
First mile/last mile services on shuttles, demand response transportation, and other
smaller services can provide that vital connection from transit to a rider’s destination.
These types of services create a more comprehensive transportation network, increasing
ridership by increasing access to more remote locations.
As with the Groveport Rickenbacker Employee Access Transit (GREAT) service partnership
involving the City of Groveport, Village of Obetz, and Rickenbacker employers, and the
SmartRide service partnership with the City of New Albany, both public and private
partnerships are necessary to make this strategy a success. Partnerships could include
other mobility services companies such as Lyft, Uber, Chariot, etc.
Flex route or feeder services – Having access to transit service is a challenge in less dense
suburban areas or areas that have difficult to navigate street networks. In these areas,
flex route service that deviates from the primary alignment to pick up passengers, demand
responsive shuttle or car sharing services provide transportation within a community
and/or connection directly to the bus network. These services generate ridership by
bringing new riders access to the service or allowing current fixed-route lines with low
productivity to reinvest that service elsewhere.

2017-2021 SRTP
129
As with first mile/last mile connections, partnerships play a vital role in implementing
these types of services. Both public and private partnerships will need to be pursued.
Improved amenities at bus stops – Bus stop amenities include features such as shelters,
lighting, benches, lean bars, trashcans, stop pads, real-time displays, cameras and schedule
information. Amenities alone cannot generate ridership but rather augment quality
service, making the riding experience higher quality.
Proposed to be implemented in future planning efforts:
Transit centers in areas of high ridership and with high amounts of transfers – Transit
centers make waiting for and transferring between buses convenient and comfortable.
Climate controlled, safe areas with amenities such as real-time schedule information,
seating, bathrooms, and a way to purchase fares makes riding the bus more attractive.
The center must be located in an area of high ridership where many transfers take place to
maximize investment, such as in downtown Columbus.
Additionally, multi-modal connections can be provided with bike facilities and racks, CoGo
(bike share) stations, Car2Go spots, and Greyhound and other inter-urban bus service
stops.
Fare pricing has an impact on transit ridership levels. A delicate balance must be struck
between the entities needed to support operations from a financial perspective and providing
a competitive and affordable product from a price perspective. Many factors are considered as
transit agencies review pricing strategies.
The following initiatives achieve three primary objectives:
Introduce New Technology
Introduce New Fare Programs
Fare Policy Changes
Currently planned and funded initiatives:
2017-2021 SRTP
130
New fare payment system (In Progress) – Installing
fareboxes that provide customers with convenient
options to pay fares, such as with a smart card or
phone application, removes a critical barrier to
accessing service. This initiative, combined with
quality, frequent service, drives and sustains
ridership.
Review fare policies and potentially change fares –
Changes to the policies that determine COTA’s fare
structure to make the system easier to understand
and use would increase ridership. This could include
implementing a flat fare, reducing fares, eliminating
time restrictions on transfers and reducing the fare cost but eliminating free fares.
Focusing on enhancing the overall customer experience, the following initiatives achieve three
primary objectives:
Targeted and Partner Promotions
Augmented Customer Amenities
Enhanced Communications
Each of these objectives contains multiple initiatives, outlined below. Additional initiatives are
found in Appendix A.
Currently planned and funded initiatives:
Customer and Community Insights Program – A customer and community insight program
is used to gather insights, preferences and opinions of riders and non-riders in both
qualitative and quantitative ways that can be used to support and inform decision-making
to enhance the customers' overall experience.
Wi-Fi On Buses (In Progress)– This added amenity is a value add to our service which
allows them the freedom to do work, connect with family and friends all while generating
a savings for them on their monthly mobile data plans.
Online Customer Service – Offering alternative channels that customers can communicate
with COTA for rider information is essential to continue to be a forward thinking
organization that is responsive to shifts in technology and communication.

2017-2021 SRTP
131
Real-time Passenger Alerts (In Progress) – Providing accurate real-time information on
delays for service are imperative to generating the confidence and trust needed for an
individual to rely on transportation and to choose COTA.
Real-time Signage (In Progress) – Real-time signage at stations and major transfer points
can generate the confidence and trust needed for an individual to rely on COTA
Proposed to be implemented in future planning efforts:
Lifestyle/Health/Environmental Campaigns – Framing the conversation and
understanding of transit to appeal to different market segments can extend the reach of
possible riders. Promotions can focus on transit as a
way to improve a person’s overall health, how
environmentally conscience individuals can use
transit to help and support sound sustainable choices,
and how utilizing transit can equate to real savings
that have positive financial benefits to families.
Customer Loyalty Program – Loyalty programs take
on many forms, but a tiered system that rewards
initial loyalty and encourages more purchases is one
that would specifically target the goal of increasing
ridership. With research showing that you need nine
first time customers to equal the purchasing habits of one loyal customer, a tier system
would allow COTA to encourage maximum usage from current riders while incentivizing
new riders to try and continue to us COTA.
Install Unique "placemaking" Bus Stops – Instituting unique bus stops can have a positive
impact on customer perception of COTA's system and draw people to use transit to
experience these unique moments around central Ohio.
Vehicle Type – Adding vehicles that will increase capacity on individual trips can allow for
a re-distribution of service hours that will allow COTA to spread service hours throughout
the network and retain capacity levels on high performing routes.
2017-2021 SRTP
132
There are a large and growing number of employment centers in central Ohio outside of
downtown Columbus. In order to connect customers to suburban job opportunities, COTA
offers several lines that travel to areas with high
levels of job concentration in outlying locations.
Serving job locations in these areas effectively with
transit poses a number of challenges. Job sites are
often spread far apart from one another and the
streets are frequently lacking in pedestrian
amenities, such as sidewalks and crosswalks.
This is commonly referred to as the “first mile/last
mile” issue, where it is difficult for employees using
public transit to get from the transit stop to their
final destination.
In an effort to address this issue, COTA is
collaborating and has collaborated with local
municipalities, employers, and MORPC to provide
solutions to more effectively connect to employment centers.
In 2014, COTA began a partnership with the City of New Albany to launch the SmartRide
shuttle. Funded by New Albany, the service connects COTA’s New Albany Park & Ride to
employers throughout the New Albany International Business Park, which boasts more than
12,000 jobs.
Following the successful implementation of SmartRide, COTA, MORPC, the Village of Obetz
and City of Groveport and employers throughout the Rickenbacker Industrial Park area came
together to develop a similar shuttle service. Launched in September 2015, GREAT operates
seven days a week, connecting to over 20,000 jobs. COTA will continue to look for
opportunities to replicate this successful model in other outlying employment centers.
In 2017, COTA will investigate the feasibility for expanding first mile/last mile services
throughout central Ohio. This could include shuttles and more demand response based type
services, such as partnering with Lyft, Uber, Chariot, etc. Partnerships with the City of
Columbus and surrounding municipalities, private employers and MORPC will be pursued.
COTA will continue to provide supplementary bus service for special events including:
Red, White & BOOM! (Columbus’ downtown Independence Day celebration): COTA
augments its normal fixed-route service with additional trips on local routes as
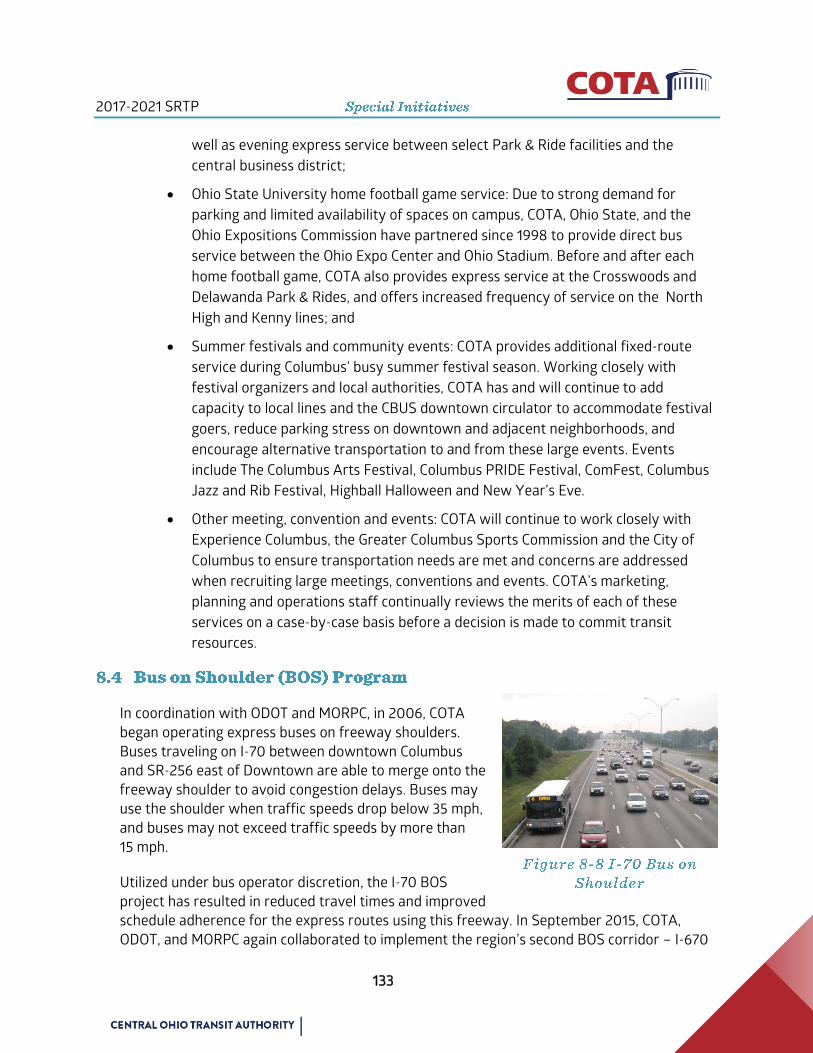
2017-2021 SRTP
133
well as evening express service between select Park & Ride facilities and the
central business district;
Ohio State University home football game service: Due to strong demand for
parking and limited availability of spaces on campus, COTA, Ohio State, and the
Ohio Expositions Commission have partnered since 1998 to provide direct bus
service between the Ohio Expo Center and Ohio Stadium. Before and after each
home football game, COTA also provides express service at the Crosswoods and
Delawanda Park & Rides, and offers increased frequency of service on the North
High and Kenny lines; and
Summer festivals and community events: COTA provides additional fixed-route
service during Columbus’ busy summer festival season. Working closely with
festival organizers and local authorities, COTA has and will continue to add
capacity to local lines and the CBUS downtown circulator to accommodate festival
goers, reduce parking stress on downtown and adjacent neighborhoods, and
encourage alternative transportation to and from these large events. Events
include The Columbus Arts Festival, Columbus PRIDE Festival, ComFest, Columbus
Jazz and Rib Festival, Highball Halloween and New Year’s Eve.
Other meeting, convention and events: COTA will continue to work closely with
Experience Columbus, the Greater Columbus Sports Commission and the City of
Columbus to ensure transportation needs are met and concerns are addressed
when recruiting large meetings, conventions and events. COTA’s marketing,
planning and operations staff continually reviews the merits of each of these
services on a case-by-case basis before a decision is made to commit transit
resources.
In coordination with ODOT and MORPC, in 2006, COTA
began operating express buses on freeway shoulders.
Buses traveling on I-70 between downtown Columbus
and SR-256 east of Downtown are able to merge onto the
freeway shoulder to avoid congestion delays. Buses may
use the shoulder when traffic speeds drop below 35 mph,
and buses may not exceed traffic speeds by more than
15 mph.
Utilized under bus operator discretion, the I-70 BOS
project has resulted in reduced travel times and improved
schedule adherence for the express routes using this freeway. In September 2015, COTA,
ODOT, and MORPC again collaborated to implement the region’s second BOS corridor – I-670
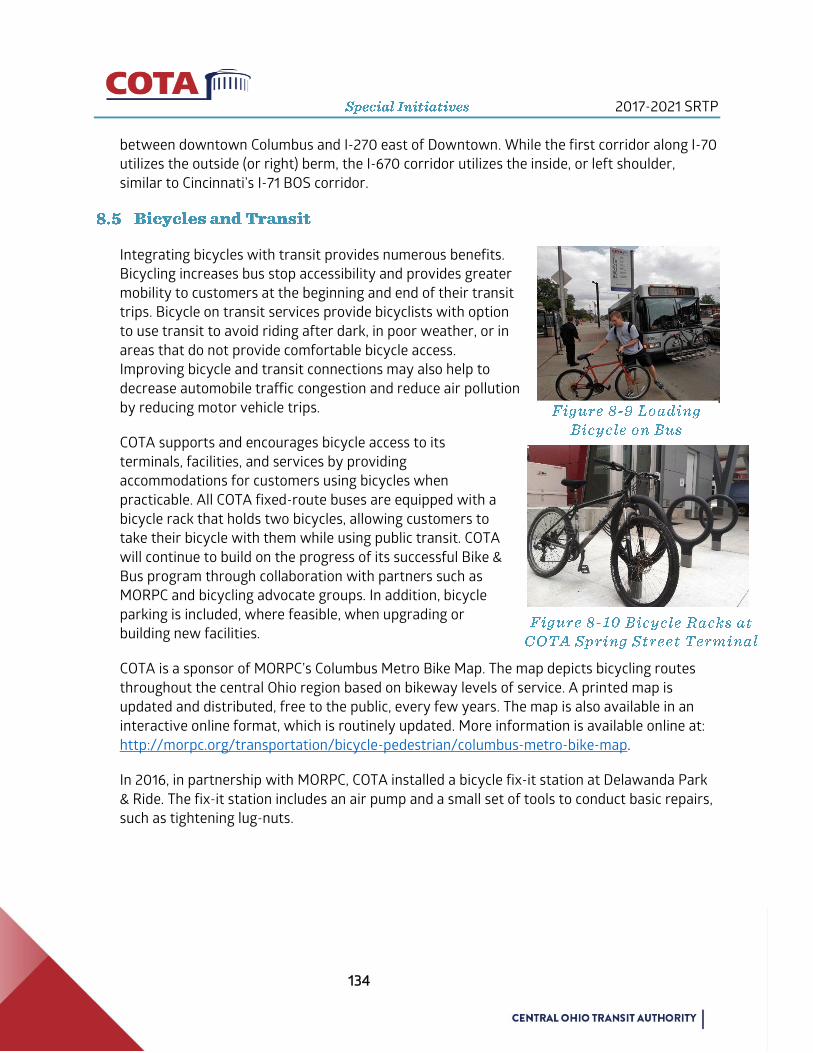
2017-2021 SRTP
134
between downtown Columbus and I-270 east of Downtown. While the first corridor along I-70
utilizes the outside (or right) berm, the I-670 corridor utilizes the inside, or left shoulder,
similar to Cincinnati’s I-71 BOS corridor.
Integrating bicycles with transit provides numerous benefits.
Bicycling increases bus stop accessibility and provides greater
mobility to customers at the beginning and end of their transit
trips. Bicycle on transit services provide bicyclists with option
to use transit to avoid riding after dark, in poor weather, or in
areas that do not provide comfortable bicycle access.
Improving bicycle and transit connections may also help to
decrease automobile traffic congestion and reduce air pollution
by reducing motor vehicle trips.
COTA supports and encourages bicycle access to its
terminals, facilities, and services by providing
accommodations for customers using bicycles when
practicable. All COTA fixed-route buses are equipped with a
bicycle rack that holds two bicycles, allowing customers to
take their bicycle with them while using public transit. COTA
will continue to build on the progress of its successful Bike &
Bus program through collaboration with partners such as
MORPC and bicycling advocate groups. In addition, bicycle
parking is included, where feasible, when upgrading or
building new facilities.
COTA is a sponsor of MORPC’s Columbus Metro Bike Map. The map depicts bicycling routes
throughout the central Ohio region based on bikeway levels of service. A printed map is
updated and distributed, free to the public, every few years. The map is also available in an
interactive online format, which is routinely updated. More information is available online at:
http://morpc.org/transportation/bicycle-pedestrian/columbus-metro-bike-map.
In 2016, in partnership with MORPC, COTA installed a bicycle fix-it station at Delawanda Park
& Ride. The fix-it station includes an air pump and a small set of tools to conduct basic repairs,
such as tightening lug-nuts.

2017-2021 SRTP
135
COTA has developed pass partnerships with The Ohio State University (OSU), Columbus City
Schools (CCS), Columbus College of Art and Design (CCAD) and Capital University by providing
students access to transit services at a reduced cost.
COTA’s partnerships began with OSU began in 1997 and with CCS and CCAD in 2006. The
programs offer students access to any COTA bus with their student identification card. For
unlimited use of the COTA system, OSU students pay a $13.50 fee per semester, and CCAD
provides COTA $18.50 per student per semester. Students from CCS can ride on specified
dates and times at a fare rate of $1.15 per student ride. In 2016, Capital students were
provided access to COTA services via their student ID’s, for a flat rate of $1.50 per ride. These
partnerships serve to provide mobility to students, open up destinations to people unfamiliar
with the city, and attract new riders to COTA who may become long-term transit riders after
graduation.
In addition, COTA has introduced new service around OSU based largely on requests and
recommendations from OSU students. Through the terms of the OSU-COTA pass program
contract, COTA employs an OSU student as a Marketing Intern each year to provide valuable
professional experience while presenting COTA with a unique advantage of student-to-
student marketing. COTA is currently working with CCAD to determine new collaborative
opportunities with students there as well.
Ridership of OSU students represented approximately 7.6% of overall system ridership in
2016. As a result of the strong student support for the partnership the program has led to
numerous improvements to COTA service in the OSU area, effectively connecting OSU to the
entire COTA network. COTA’s TSR plan proposes changes to how the OSU area is served by
transit. In conjunction with OSU’s 2014 Comprehensive Transportation and Parking Plan, the
university operated Campus Area Bus Service (CABS) would serve as the transit option for
moving through the campus area. COTA’s proposed TSR network focuses on improving
connections between OSU and the central Ohio region and would bring customers primarily to
the periphery of the university where they could transfer to CABS to reach destinations within
campus, while also serving important destinations such as the OSU Medical Center complex.
More information about planned changes to COTA’s system can be found in Section 6.
COTA has a strong partnership with Franklin County. Currently Franklin County employees
qualify for a subsidized bus pass that is supported by both the County and COTA. Franklin
County grants employees a 70% discount from passes, which is automatically deducted from
their paycheck. As long as Franklin County has a minimum enrollment of 350 participants,

2017-2021 SRTP
136
COTA offers a 10% discount to the pass. The 2016 cost for an enrolled Franklin County
employee for a Local 31-Day Pass would cost $12.40; the 2016 cost for the same employee for
an Express 31-Day Pass would cost $17.20. After enrolling through County payroll, the cost of
the pass is automatically deducted, and the pass is also automatically activated on the
employee’s photo ID badge.
As of May 2015, Ohio State faculty and staff can receive a $4 discount on Local passes pre-tax
via payroll deduction. Registration is simple through Ohio State’s Employee Self Service portal.
Employees are able to swipe their BuckID as their bus pass once registered. The employee’s
pass offers unlimited Local rides per month. A $.75 upcharge is required for all Express trips
after the BuckID is swiped.
COTA provides information to its customers and other stakeholders in a variety of ways:
Website and social media;
Timetables: COTA designs, updates and produces a printed timetable for every
route with maps, departure and arrival times at timepoints, and other information
for customers;
System Map: COTA designs, updates and produces a large fold out map of COTA’s
system with important customer information and how to use public transit in
central Ohio;
Brochures: COTA designs and produces brochures on various topics to inform new
and existing customers about special programming, how to access public transit in
central Ohio and other topics. A sampling of brochures available include: senior
services, how to ride guide, fares, Catch the CBUS, opportunities for Ohio State
students, and seasonal Summer YouthPass information;
Commuter bulletins: COTA designs commuter bulletins about service changes and
disruptions, special promotions and notifications, opportunities for public input
and public meetings, that are placed on coaches, passenger shelters and impacted
bus stops;
Display monitors: COTA places customer information on display monitors in the
lobby of 33 N. High St,, including public meeting notifications, special promotions,
fares and customer service information;
On-board announcements: COTA places audio announcements of relevant
passenger information on coaches; and
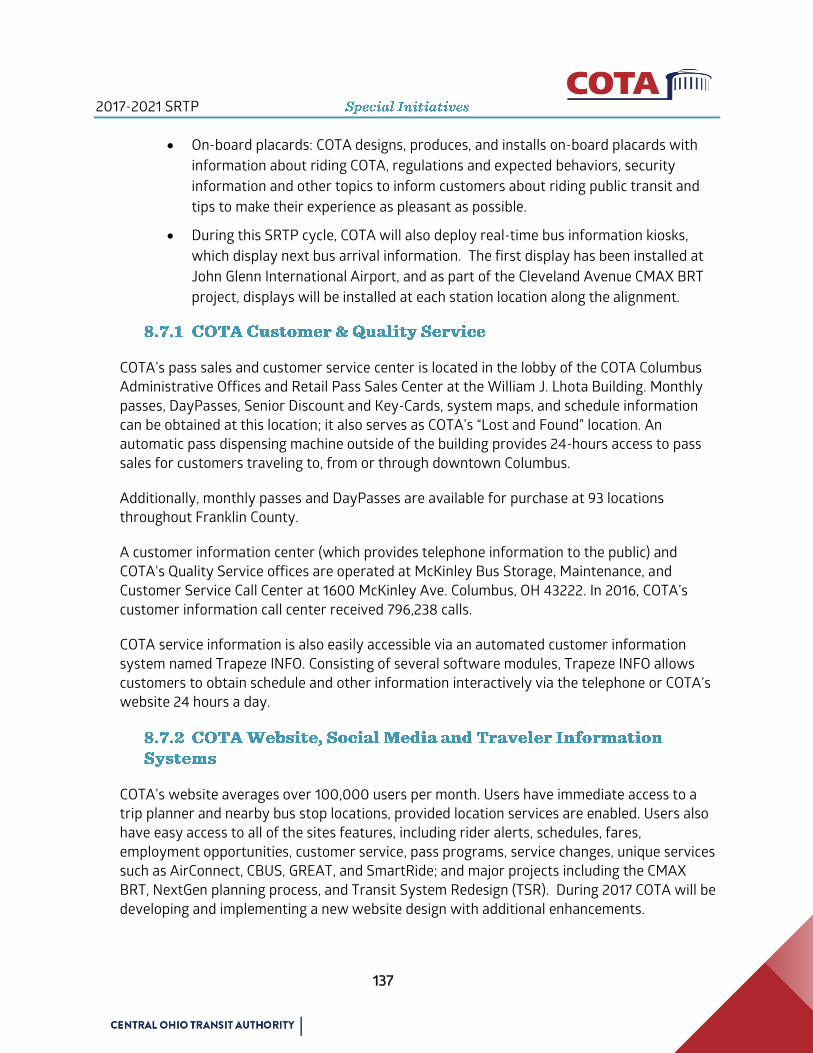
2017-2021 SRTP
137
On-board placards: COTA designs, produces, and installs on-board placards with
information about riding COTA, regulations and expected behaviors, security
information and other topics to inform customers about riding public transit and
tips to make their experience as pleasant as possible.
During this SRTP cycle, COTA will also deploy real-time bus information kiosks,
which display next bus arrival information. The first display has been installed at
John Glenn International Airport, and as part of the Cleveland Avenue CMAX BRT
project, displays will be installed at each station location along the alignment.
COTA’s pass sales and customer service center is located in the lobby of the COTA Columbus
Administrative Offices and Retail Pass Sales Center at the William J. Lhota Building. Monthly
passes, DayPasses, Senior Discount and Key-Cards, system maps, and schedule information
can be obtained at this location; it also serves as COTA’s “Lost and Found” location. An
automatic pass dispensing machine outside of the building provides 24-hours access to pass
sales for customers traveling to, from or through downtown Columbus.
Additionally, monthly passes and DayPasses are available for purchase at 93 locations
throughout Franklin County.
A customer information center (which provides telephone information to the public) and
COTA's Quality Service offices are operated at McKinley Bus Storage, Maintenance, and
Customer Service Call Center at 1600 McKinley Ave. Columbus, OH 43222. In 2016, COTA’s
customer information call center received 796,238 calls.
COTA service information is also easily accessible via an automated customer information
system named Trapeze INFO. Consisting of several software modules, Trapeze INFO allows
customers to obtain schedule and other information interactively via the telephone or COTA’s
website 24 hours a day.
COTA’s website averages over 100,000 users per month. Users have immediate access to a
trip planner and nearby bus stop locations, provided location services are enabled. Users also
have easy access to all of the sites features, including rider alerts, schedules, fares,
employment opportunities, customer service, pass programs, service changes, unique services
such as AirConnect, CBUS, GREAT, and SmartRide; and major projects including the CMAX
BRT, NextGen planning process, and Transit System Redesign (TSR). During 2017 COTA will be
developing and implementing a new website design with additional enhancements.

2017-2021 SRTP
138
The first phase of COTA’s website redesign project began in mid-February 2017, and is
currently underway. The marketing and IT departments have partnered to make decisions on
design, functionality and usability. Currently, the team is working with ZED digital to identify
key changes that need to be made as development begins. The website is on track to launch
late this year, and is predicted to include real time bus tracking, service alert functionality and
online fare payment and route selection.
COTA has a strong presence on Facebook, Twitter and Instagram. These social media outlets
allow us to stay in touch with our customers and the larger community, and educate those
audiences about COTA, the service we provide and the projects underway that will benefit
riders and non-riders. Social media allows our customers a quick digital interface to ask
questions or express concerns that we can immediately engage with. COTA is also on
YouTube, and continuously evaluates other social channels that may be beneficial to our
customers.
Real-time bus tracking launched via Transit App in May 2016, which allows customers to see
their bus moving on a map, and the estimated time of arrival in real-time. Real-time also
launched in the last half of 2016 on COTA.com and Google Maps, giving customers different
platform options to access the information. Both GTFS-static and GTFS-real-time data feeds
are available on COTA’s website for any developer to interpret, consume and build with.
Dozens of apps are available to smartphone users that incorporate COTA’s static/scheduled
information.
As part of the SRTP, COTA will continue to monitor and invest in the latest computer
hardware and software, and Internet technologies available to deliver accurate and timely
transit information to central Ohio residents.
COTA provides announcements over the Automatic Vehicle Annunciator (AVA) system
available on all coaches. The system allows for line or location based announcements, letting
customers know of public meetings, realignments and other important information as
necessary.
The AVA automatically announces and displays next stop information for the benefit of
hearing and vision-disabled passengers. This system also improves service to COTA’s riders,
especially to people not familiar with the stops of a particular route; or, to all riders when
visibility is poor or limited due to nighttime hours or inclement weather conditions.
The AVA System enables COTA to meet or exceed all ADA requirements and is included in all
bus purchases.
2017-2021 SRTP
139
COTA holds public input and comment meetings to discuss service adjustments prior to the
January, May, and September service changes. For each service change period, a minimum of
four public meetings are held to solicit public input regarding potential service modifications.
Two meetings are held three to four months prior to the service change implementation date
in order to encourage public feedback to service proposals, and if feasible, adjustments are
made by staff to the potential modifications. A second set of two community outreach
meetings are held to present the final draft list of modifications, and to solicit additional
feedback.
The purpose of public meetings held prior to making service modifications and adjustments
are to:
Explain potential modifications and adjustments to existing fixed-route service;
Solicit feedback from the general public and customers about potential
modifications and adjustments to existing fixed-route service;
Solicit suggestions from customers and the general public about service
modifications and adjustments;
Learn about potential impacts that proposed service modifications and
adjustments may have on customers, potential customers, businesses and other
stakeholders before changes, modifications and adjustments are planned;
Identify specific needs and desires of COTA stakeholders related to fixed-route
service.
COTA refines and makes changes to its fixed-route services on the first Monday of January,
May, and September of each year. In an effort to gather input from the public and to inform
transit users of all such scheduled changes to service (including major service changes, which
are defined as a 25 percent or more change in annualized service hours on a route) COTA will
adhere to the following procedures.
1 COTA will gather input continually and engage in dialogue with the public through Customer
Service call center contacts, commuter bulletins posted at stops, comments submitted via
cota.com, handouts on buses, comments/requests received via social media (Facebook,
Twitter), letters, engagement of civic organizations and community leaders (including those
representing low-income and minority communities), and regularly scheduled community
outreach and public comment meetings, with an emphasis on low-income and minority
2017-2021 SRTP
140
communities. In addition, COTA will survey its users and employers/employees who have
requested some modification to the transit service or whose input is sought on proposed
changes.
2 Biennially, COTA will prepare an update to the schedule of service improvements for the next
five years, which will be included in the Short Range Transit Plan (SRTP). The service changes
in the SRTP are then reviewed and discussed in the following public meetings: MORPC’s
Community Advisory and Transportation Advisory committees and COTA Board of Trustees.
3 Prior to implementing any service change, COTA will conduct two rounds of public meetings,
including meetings in neighborhoods that will be most directly affected by the change, as
needed. When a proposed change would eliminate service or significantly reduce the span of
service or frequency of service along a route, COTA will actively solicit and consider input
from the affected area through commuter bulletins, additional neighborhood meetings,
and/or on-board surveys. A significant reduction in the span of service on a route is defined
as the elimination of a time period, such as midday service or weekend service. A significant
reduction in the frequency of service on a route is defined as a 100 percent increase or more
in the headway of the route.
4 Two (2) months prior to each service change, the list of proposed modifications is provided to
COTA’s Board of Trustees. Board meetings are open to the public for comments and
discussion.
5 The following activities take place prior to the effective date of all service modifications in
order to inform all stakeholders of the changes:
A minimum of four (4) public meetings will be held to solicit public input regarding
potential service modifications. Two (2) meetings are held three (3) months prior to
the service change implementation date in order to encourage public feedback to
service proposals, and, if feasible, adjustments are made by staff to the potential
modifications based on feedback. A second set of two (2) information meetings will
be held during the month prior to the service change to present the final draft list
of modifications and to solicit additional feedback.
All material from the public meetings (handouts, presentations, etc.) will be
available on the web site and in paper form.
Commuter bulletins will be posted at bus stops affected by a proposed
modification one month prior to implementation. Bulletins posted at bus stops
include a description of the proposed modification, maps (if applicable), and
instructions regarding how to provide feedback to COTA about the proposed
changes. Commuter bulletins will also be posted on COTA buses which indicate the
routes that will be affected. For major service changes, additional warning bulletins
may be necessary as per COTA’s major change criteria.
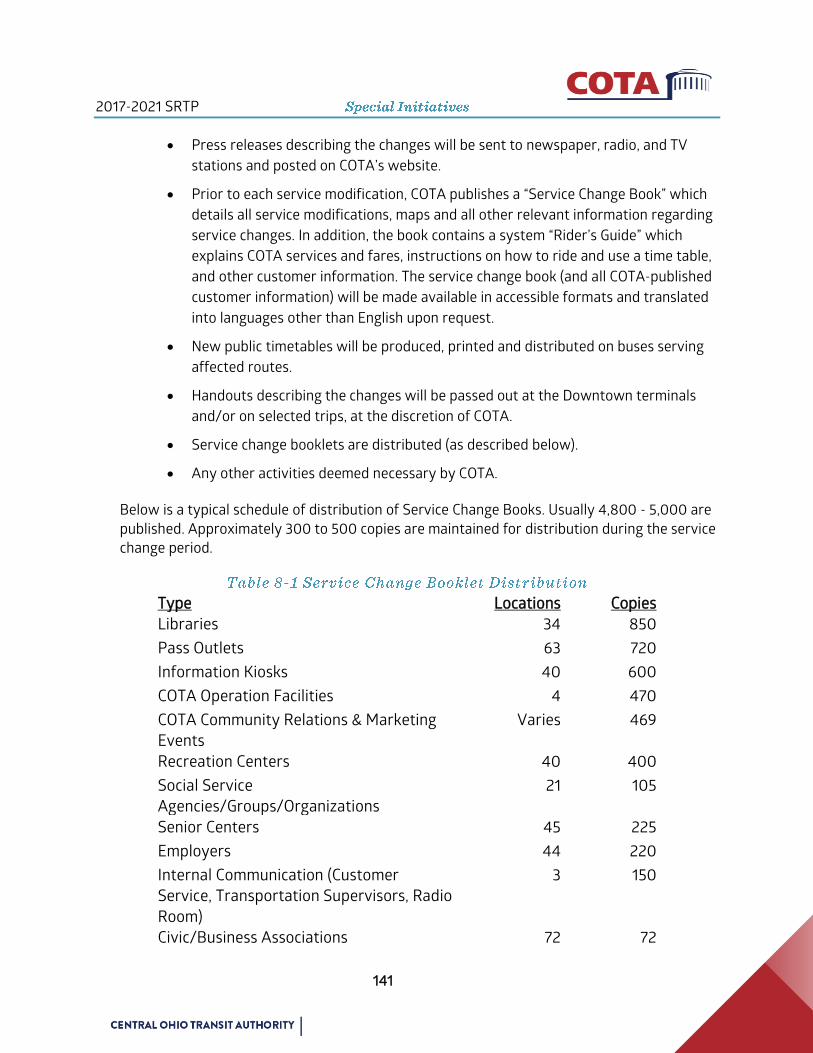
2017-2021 SRTP
141
Press releases describing the changes will be sent to newspaper, radio, and TV
stations and posted on COTA’s website.
Prior to each service modification, COTA publishes a “Service Change Book” which
details all service modifications, maps and all other relevant information regarding
service changes. In addition, the book contains a system “Rider’s Guide” which
explains COTA services and fares, instructions on how to ride and use a time table,
and other customer information. The service change book (and all COTA-published
customer information) will be made available in accessible formats and translated
into languages other than English upon request.
New public timetables will be produced, printed and distributed on buses serving
affected routes.
Handouts describing the changes will be passed out at the Downtown terminals
and/or on selected trips, at the discretion of COTA.
Service change booklets are distributed (as described below).
Any other activities deemed necessary by COTA.
Below is a typical schedule of distribution of Service Change Books. Usually 4,800 - 5,000 are
published. Approximately 300 to 500 copies are maintained for distribution during the service
change period.
Type Locations Copies
Libraries 34 850
Pass Outlets 63 720
Information Kiosks 40 600
COTA Operation Facilities 4 470
COTA Community Relations & Marketing
Events
Varies 469
Recreation Centers 40 400
Social Service
Agencies/Groups/Organizations
21 105
Senior Centers 45 225
Employers 44 220
Internal Communication (Customer
Service, Transportation Supervisors, Radio
Room)
3 150
Civic/Business Associations 72 72

2017-2021 SRTP
142
Chambers of Commerce 12 12
Charter Cities 12 12
ADA/Mainstream Customers (upon request)
Varies Varies
TOTAL >350 >4300
COTA routinely solicits public input and feedback when planning future transit enhancements.
COTA engages robust public involvement and public comment programming to meet all
requirements under Title VI, ADA, and Environmental Justice regulations.
With a focus on soliciting public input and listening to what our customers, community
residents, and businesses have to say about their public transit system, COTA will continue
efforts to utilize this valuable information for improving the bus system. Each year COTA staff
develops a Community Outreach and Education Plan (COEP). Implementation of the COEP has
enabled COTA to develop new constituencies and community partnerships, engage the
community in the planning process, and provided COTA officials with valuable community
input on transit initiatives.
Ongoing outreach activities include, but are not limited to, convening targeted community
leaders for roundtable discussions; serving on various planning committees; delivering
presentations to neighborhood groups, business and social/civic organizations; providing
travel training for immigrant/English as a Second Language groups, and meeting with citizen
advisory groups, local governments, elected officials, etc.
The types of changes for which public meetings are held, in addition to service changes,
include:
Proposed changes to fares;
Establishing new service;
Reducing or discontinuing underutilized service;
Adding or reducing the number of bus stop locations along fixed-routes;
Establishing new park and ride facilities and service; and
Constructing new facilities for transit related activities.
COTA reserves the right to schedule and host public involvement meetings in other
circumstances where COTA service is affected and where COTA stakeholders are
impacted.
2017-2021 SRTP
143
COTA also executes a public involvement process for large projects. COTA is currently
undergoing three major projects: the Transit System Redesign, the CMAX Cleveland Bus Rapid
Transit, and NextGen. See Section 3 for outreach summaries.
COTA informs all stakeholders of public meetings by posting meeting notices on cota.com,
social media (Facebook, Twitter), news media releases, commuter bulletins on every fixed-
route bus, and monitors installed at COTA Columbus Administrative Offices and Retail Pass
Sales Center in the William J. Lhota Building at 33 N. High St. Columbus, OH 43215. Notices are
also posted at bus stops affected by a proposed service modification. Bulletins posted at bus
stops include a description of the proposed modification, maps (if applicable), and instructions
regarding how to provide feedback to COTA about the proposed changes. Meeting notices are
posted two (2) weeks prior to meetings.
In order to ensure that COTA stakeholders are informed about public meetings COTA holds to
solicit comments, ideas and other important feedback about our service, we disseminate
information through as many channels as possible.
COTA’s Corporate Communications department produces and distributes media advisories to
all local media (traditional and non-traditional) in our service territory.
We also send meeting notices to key stakeholders:
Franklin County Board of Commissioners
Charter City Mayors
Columbus City Council
City of Columbus Departmental Public Information Officers
Columbus Community Relations Commission (incl. New Americans Initiative)
City of Columbus Area Commissions
Columbus Chamber of Commerce
Bexley Area Chamber Of Commerce
Clintonville Area Chamber Of Commerce
Dublin Area Chamber Of Commerce
Franklinton Board of Trade
Gahanna Area Chamber Of Commerce
Grandview/Marble Cliff Area Chamber of Commerce
2017-2021 SRTP
144
Grove City Area Chamber Of Commerce
Hilliard Area Chamber Of Commerce
Hispanic Chamber Of Commerce
New Albany Area Chamber Of Commerce
Reynoldsburg Area Chamber Of Commerce
Upper Arlington Area Chamber Of Commerce
Westerville Area Chamber Of Commerce
Whitehall Area Chamber Of Commerce
Whitehall Area Chamber Of Commerce
Worthington Area Chamber Of Commerce
Capital Crossroads / Discovery District Special Improvement Districts
Downtown Residents’ Association of Columbus
Columbus Downtown Development Corporation
Short North Alliance
German Village Society
Greater Linden Development Corporation
Mid-Ohio Regional Planning Commission
Columbus 2020
Experience Columbus (Convention and Visitors Bureau)
Conference Of Minority Transportation Officials
The Ohio State University, including student PAC and T&P officials
Columbus College of Art and Design
Columbus State Community College
Columbus City Schools
COTA Accessible Transportation Advisory Committee (Mobility Services)
COTA Mobility Advisory Board
COTA Advisory Panel
YAY Bikes! (Advocacy Organization)
Consider Biking (Advocacy Organization)
2017-2021 SRTP
145
Transit Columbus (Advocacy Organization)
COTA regularly communicates to its passengers on the website via commuter alerts, planning
project sections, and digital information brochures that feature upcoming events and news
about the COTA system.
On an annual basis, COTA develops a Community Outreach and Education Plan, overseen by
COTA’s Community Relations Manager. COTA’s President/CEO, members of the Leadership
Team; Mobility Services; Planning; Corporate Communications and Marketing staff assist in
the implementation of the plan and other community outreach activities.
The plan serves as a guide in the Authority’s effort to engage and inform all stakeholders
about COTA activities, programs, services, expansion plans and other major initiatives. As a
result, COTA has cultivated new constituencies and community partnerships; engaged the
community in its service planning process; strengthened public involvement in public transit
and increased COTA’s visibility and value throughout central Ohio.
Ongoing outreach activities include, but are not limited to, convening targeted community
leaders for roundtable discussions; serving on planning committees for special projects and
events; serving on organizational Boards; and delivering presentations to neighborhood
groups, business, social and civic organizations. The plan also targets outreach for refugees;
immigrants; English as a Second Language and Limited English Proficiency constituents
offering travel training, bilingual print materials, advertising and marketing activities.
COTA has also hired bilingual customer service office staff and bus operators who speak
Spanish and Somali, two of the largest non-English speaking constituencies in Franklin County.
Each calendar year, COTA makes formal presentations to, conducts and/or participates in over
350 community outreach activities.
COTA also employs a full-time Public Involvement Coordinator. Staff provides strategic and
logistical support for public meetings and outreach events to increase awareness of the
Authority’s capital projects and service initiatives. Staff coordinates with the Planning and
Capital Projects division and project consultants to organize and execute public involvement
activities, including public meetings, stakeholder group meetings and individual meetings with
stakeholders.

2017-2021 SRTP
146
The COTA owned William J. Lhota Building serves as the
administrative offices and is located at 33 North High
Street. COTA moved into this facility in order to assume a
greater presence at Broad and High streets in the
downtown area, a major hub of the bus network and
customer boarding activity. Purchased in 2008 and
relocated to in 2010, COTA’s administrative office, pass
sales center, and an operator relief station are located just
north of the intersection of Broad Street and High Street.
Within the first floor lobby area, customers have
convenient access to the pass sales and customer
information center. This location serves as the main pass
sales outlet for COTA passes, as well as the location where
customers can be photographed in order to obtain a senior
or Key Discount ID Card. Customers have access to free information about COTA services
including route timetables, system maps, service change guides, and rider handbooks as well
as 24-hour access to a ticket vending machine located at the front of the building. This location
also hosts monthly COTA Board meetings and other public outreach meetings, greatly
improving accessibility via public transit.
The upper floors house COTA’s administrative operations. As the building has no parking area,
employees are encouraged to ride COTA to and from work. Most employees have opted for
the convenience of COTA service and are now daily users of the very service they plan,
schedule, and manage each day.
By encouraging transit professionals to ride the bus daily, the community realizes an
environmental benefit by having fewer single occupancy vehicles on the road each day.
Employees provide input and ideas about COTA service through an interactive feature called
“My Ride” available on the company’s intranet website.
Built in 1905, this 78,240 square foot, ten-story building was renovated and designed to meet
Leadership in Energy & Environmental Design (LEED) green building certification
requirements. In 2012, the US Green Building Council (USGBC) awarded the building a “Silver”
certification. This certification further demonstrates COTA’s commitment to improving the

2017-2021 SRTP
147
environment through sustainable site development, water savings, and improved energy
efficiency.
Currently COTA occupies nine floors, including the lower level that contains a driver report
center, an employee wellness center, and a print services office. Of the approximately 24,000
square feet of the space available for lease on the remaining three floors, 16,000 square feet
is occupied by tenants. The remaining 8,000 square feet is expected to be available for lease
during the latter half of 2017.
Located at 1600 McKinley Avenue, this
400,000 square foot bus storage and
maintenance facility was completed in
1980. It has indoor storage capacity for
275 large 40-foot buses. This maintenance
facility can perform all services required
for the bus fleet. It contains both heavy
and light maintenance areas, a body shop,
paint shop, and where the cleaning of the
buses is performed by including two-
automated bus washers. As of March 2017, forty lines operate out of the McKinley Avenue
facility.
This facility also houses COTA’s customer call center as well as several state of the art training
rooms. Housed next to COTA’s radio communications and dispatch operations, this location is
adjacent to COTA’s operational hub.
Following several years of numerous mechanical, electrical, and equipment failures, in 2010,
COTA initiated a multi-phased, multi-year renovation and construction project estimated at
$99.5 million. Completion of the renovations is expected to occur by 2019.
Following is a summary of project improvements completed by phase:
Phase 1 was completed in 2010 at a cost of $7.3 million. During this phase, COTA upgraded
various safety related features, including the replacement of aging vehicle lifts and critical
support equipment in heavy maintenance.
Phase 2 of the capital project was completed in 2013 at a cost of $32.5 million. This phase
consisted primarily of two specific components:

2017-2021 SRTP
148
Construction of a Compressed
Natural Gas (CNG) fueling
station. The commitment to
CNG powered vehicles will
result in air quality
improvement and substantial
reduction in operating fuel
costs.
Recommendations necessary
to meet CNG compliance
standards.
Interior renovations including
upgrades of the HVAC and electrical systems and lighting improvements.
Phase3A/3B construction began in 2014 with an estimated cost of $32 million. This phase
includes several major elements:
A satellite CNG fueling station
CNG compliant bus operations and maintenance
New bus wash equipment
A 30,000 square foot addition housing a new operator dayroom and training areas
Renovation of the second floor administrative areas
HVAC, plumbing and electrical upgrades
The renovation also included:
Improved energy efficiency;
Reduced greenhouse gas emissions;
Meeting all code requirements for CNG operations and ADA accessibility;
Improved operational flow efficiencies and best practices;
Expanded fleet storage capacity from 240 to 275 buses; and
Accommodating current and long-term facility administration programming needs.
The remaining $27.7 million is designated for Phase 3C which includes:
New exterior façade
Test track

2017-2021 SRTP
149
Expand fleet storage capacity to 275 buses; and
Accommodate current and long-term facility administration programming needs;
Miscellaneous interior concrete repairs.
The renovations are designed to meet
LEED Silver certification. LEED design
and construction will result in lower
long-term operating costs.
In 2013, COTA purchased its first 30 CNG
buses; the current CNG fleet totals 124.
The useful life of a transit bus is 12
years, and as such, it is anticipated that
COTA's entire fleet will be converted to
CNG-powered buses by 2025. While fluctuations in fuel prices occur regularly, full conversion
to a CNG-based fleet is projected to generate fuel savings of up to $5 million annually.
Located at 1333 Fields Avenue, this site is one component that makes up what is referred to as
COTA’s Fields Avenue Campus. As described below, the Campus also includes the Mobility
Services facility and the Street and Remote Maintenance facility. The 1333 Fields Avenue
facility, constructed as a one-story 275,130 square foot building in 1984, was designed to
accommodate 180 coaches.
In 2009, COTA undertook a complete renovation of the Fields Avenue facility. The Fields
Avenue renovation allows for the possible future operation of articulated buses from this
facility.
The $18 million Fields Avenue facility renovation
design included innovative, energy-efficient, and
environmentally responsible construction
methods; the building was commissioned
receiving a LEED “Gold” certification. At the time
of its commissioning, it was one of only five LEED
Gold buildings in central Ohio.
As COTA expands its CNG fleet, this facility will be
upgraded to accommodate CNG-fueled vehicles.
The process to determine the feasibility and
conversion of the facility for CNG compliance
began in the first quarter 2017. Full conversion of
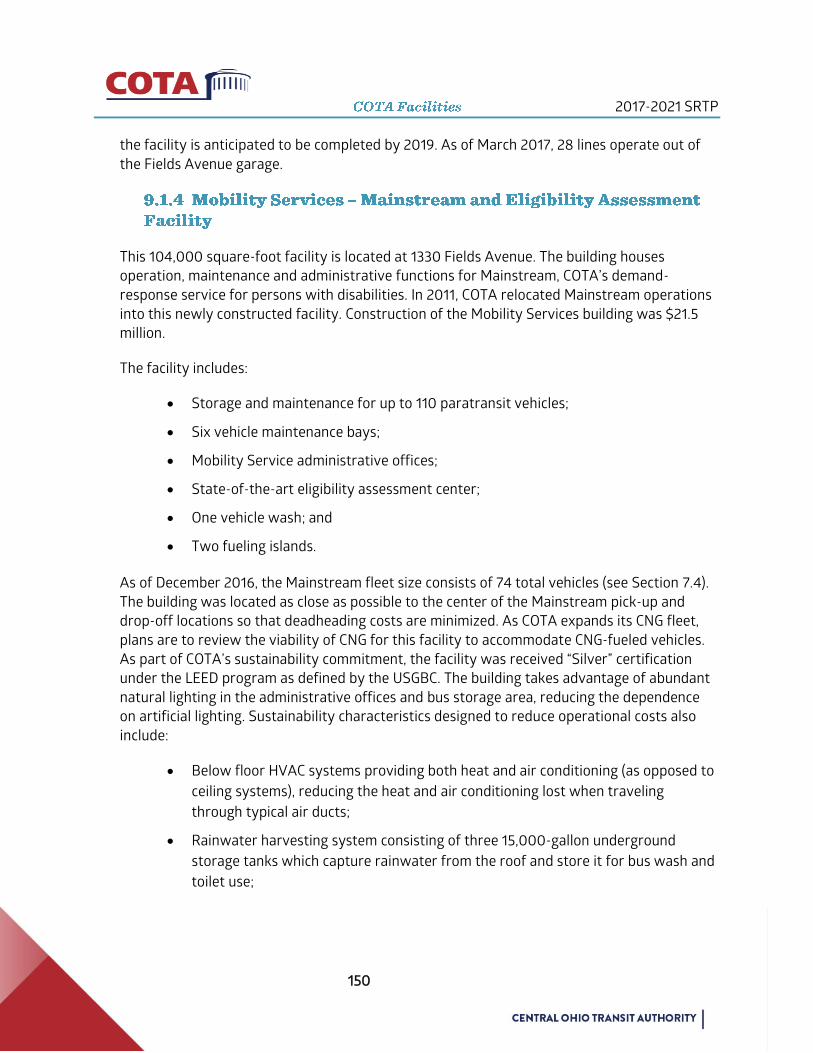
2017-2021 SRTP
150
the facility is anticipated to be completed by 2019. As of March 2017, 28 lines operate out of
the Fields Avenue garage.
This 104,000 square-foot facility is located at 1330 Fields Avenue. The building houses
operation, maintenance and administrative functions for Mainstream, COTA’s demand-
response service for persons with disabilities. In 2011, COTA relocated Mainstream operations
into this newly constructed facility. Construction of the Mobility Services building was $21.5
million.
The facility includes:
Storage and maintenance for up to 110 paratransit vehicles;
Six vehicle maintenance bays;
Mobility Service administrative offices;
State-of-the-art eligibility assessment center;
One vehicle wash; and
Two fueling islands.
As of December 2016, the Mainstream fleet size consists of 74 total vehicles (see Section 7.4).
The building was located as close as possible to the center of the Mainstream pick-up and
drop-off locations so that deadheading costs are minimized. As COTA expands its CNG fleet,
plans are to review the viability of CNG for this facility to accommodate CNG-fueled vehicles.
As part of COTA’s sustainability commitment, the facility was received “Silver” certification
under the LEED program as defined by the USGBC. The building takes advantage of abundant
natural lighting in the administrative offices and bus storage area, reducing the dependence
on artificial lighting. Sustainability characteristics designed to reduce operational costs also
include:
Below floor HVAC systems providing both heat and air conditioning (as opposed to
ceiling systems), reducing the heat and air conditioning lost when traveling
through typical air ducts;
Rainwater harvesting system consisting of three 15,000-gallon underground
storage tanks which capture rainwater from the roof and store it for bus wash and
toilet use;
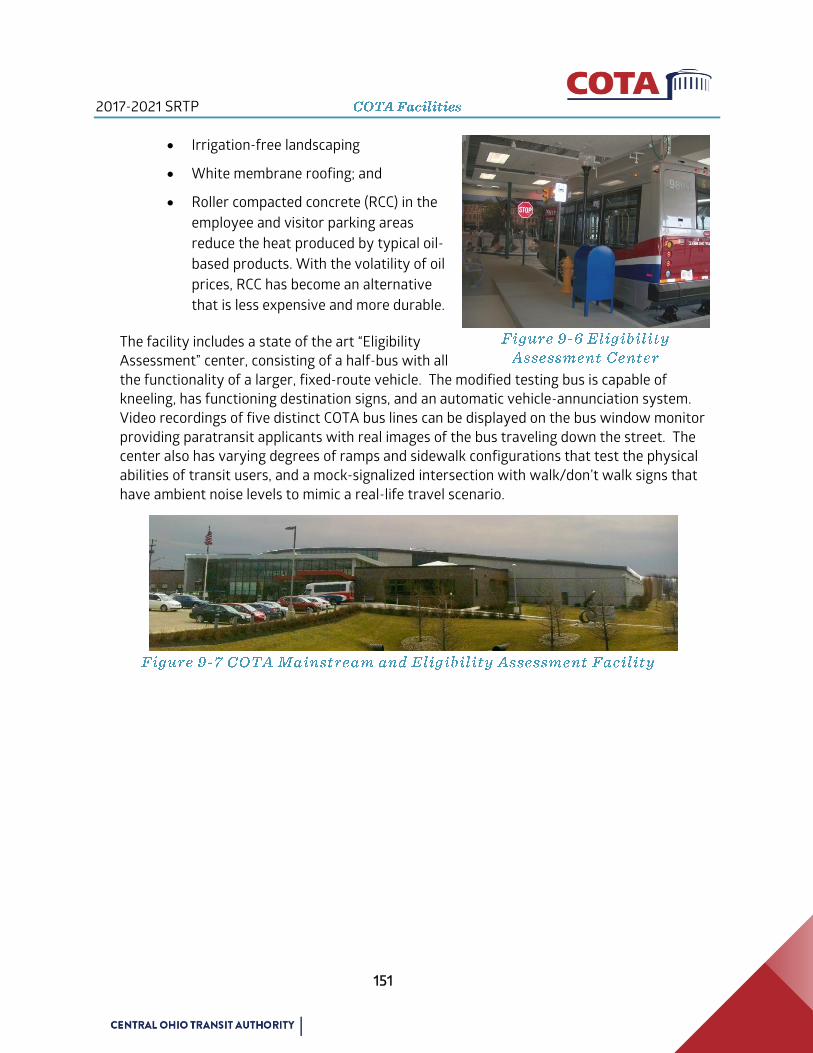
2017-2021 SRTP
151
Irrigation-free landscaping
White membrane roofing; and
Roller compacted concrete (RCC) in the
employee and visitor parking areas
reduce the heat produced by typical oil-
based products. With the volatility of oil
prices, RCC has become an alternative
that is less expensive and more durable.
The facility includes a state of the art “Eligibility
Assessment” center, consisting of a half-bus with all
the functionality of a larger, fixed-route vehicle. The modified testing bus is capable of
kneeling, has functioning destination signs, and an automatic vehicle-annunciation system.
Video recordings of five distinct COTA bus lines can be displayed on the bus window monitor
providing paratransit applicants with real images of the bus traveling down the street. The
center also has varying degrees of ramps and sidewalk configurations that test the physical
abilities of transit users, and a mock-signalized intersection with walk/don’t walk signs that
have ambient noise levels to mimic a real-life travel scenario.

2017-2021 SRTP
152
In 2008, COTA purchased a 2.23-acre site
at 1325 Essex Avenue to house its Street
& Remote department operations. In
2012, COTA performed a renovation and
expansion of the Essex Avenue facility,
which was completed in 2013 for $3.7
million dollars.
The renovation of the existing facility and
the addition of 8,000 square feet of
maintenance/storage space, parking lot
expansion construction of a salt dome,
and installation of mechanical/electrical
systems to meet current operational
demands and future system growth.
The completed renovation project was awarded LEED “Silver” certification. This facility houses
staff and equipment to support the maintenance of bus stops and shelters located throughout
COTA’s approximately 560 square-mile service area. The Street & Remote department
performs a variety of support functions for approximately 3,500 bus stops, including
pavement repairs, concrete work, excavation, installation of sign poles, new passenger shelter
installation, and special event support.
Located at the intersection of Cleveland and 11th Avenues, COTA’s inaugural urban transit
center opened in October 1999. The 20,500 square-foot facility is part of COTA's Livable
Communities Initiative (LCI) project for the Linden area, and includes such amenities as
childcare and health care. Six bus lines currently serve the transit center. In January 2018, this
facility will be also be served by the Cleveland Avenue CMAX BRT line.
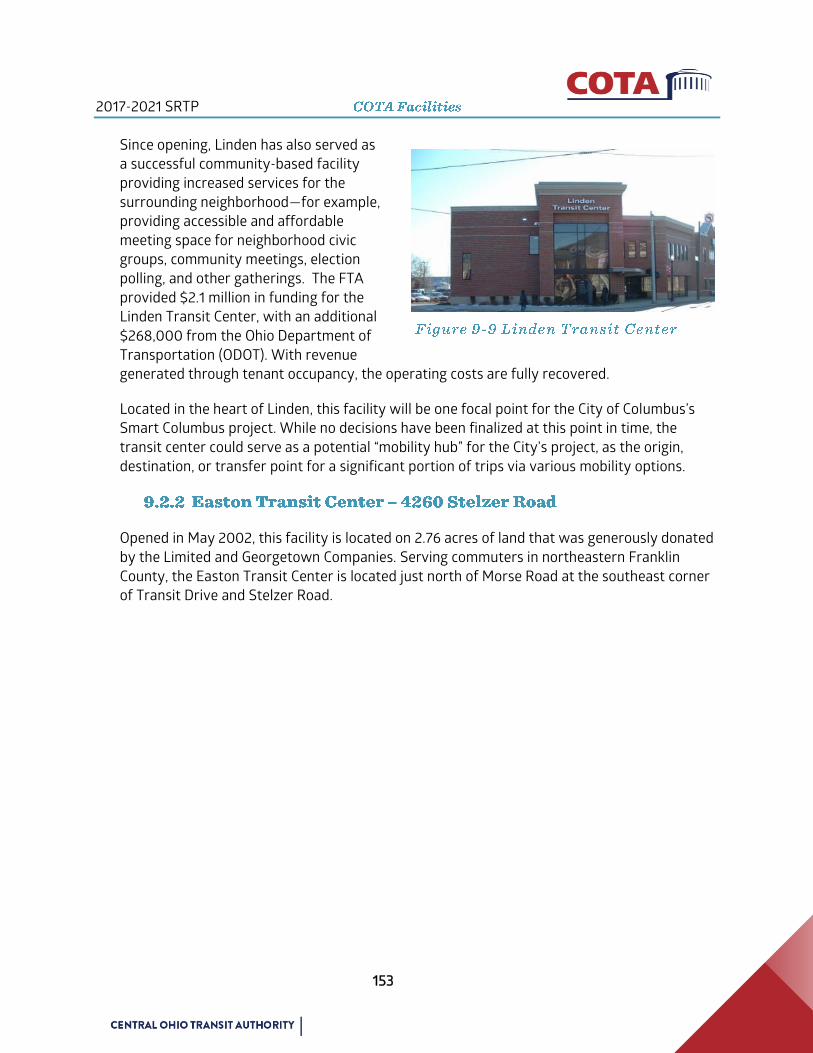
2017-2021 SRTP
153
Since opening, Linden has also served as
a successful community-based facility
providing increased services for the
surrounding neighborhood—for example,
providing accessible and affordable
meeting space for neighborhood civic
groups, community meetings, election
polling, and other gatherings. The FTA
provided $2.1 million in funding for the
Linden Transit Center, with an additional
$268,000 from the Ohio Department of
Transportation (ODOT). With revenue
generated through tenant occupancy, the operating costs are fully recovered.
Located in the heart of Linden, this facility will be one focal point for the City of Columbus’s
Smart Columbus project. While no decisions have been finalized at this point in time, the
transit center could serve as a potential “mobility hub” for the City’s project, as the origin,
destination, or transfer point for a significant portion of trips via various mobility options.
Opened in May 2002, this facility is located on 2.76 acres of land that was generously donated
by the Limited and Georgetown Companies. Serving commuters in northeastern Franklin
County, the Easton Transit Center is located just north of Morse Road at the southeast corner
of Transit Drive and Stelzer Road.
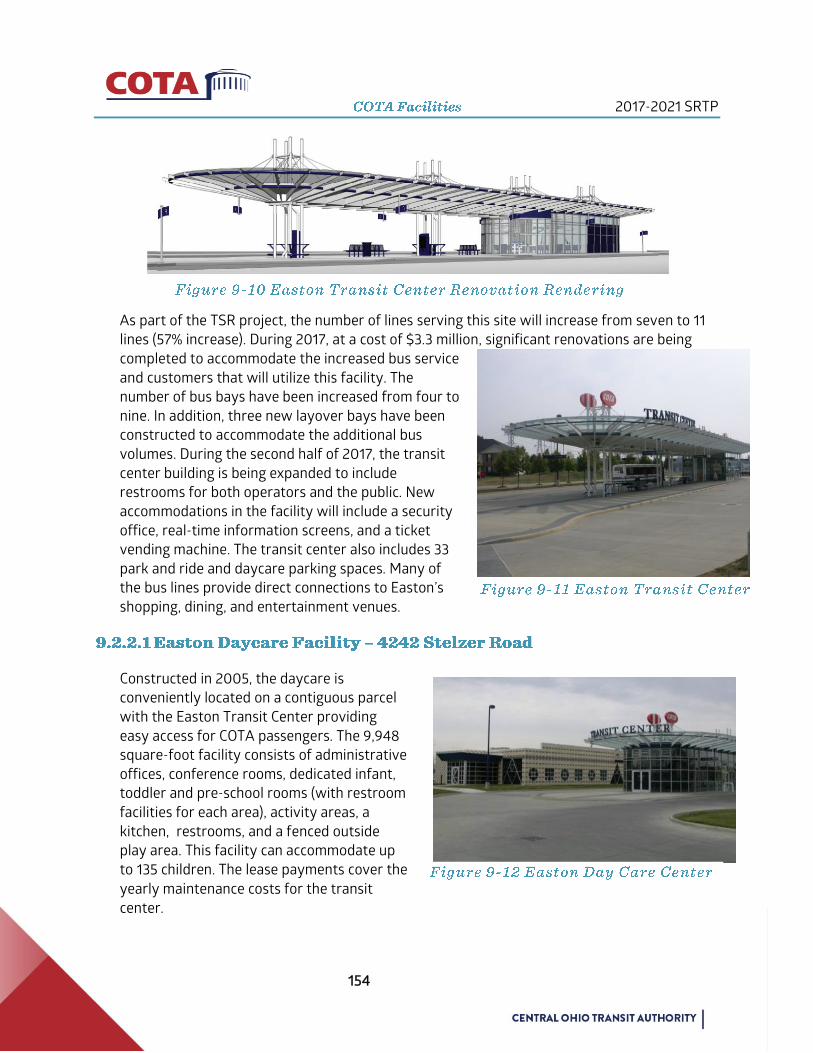
2017-2021 SRTP
154
As part of the TSR project, the number of lines serving this site will increase from seven to 11
lines (57% increase). During 2017, at a cost of $3.3 million, significant renovations are being
completed to accommodate the increased bus service
and customers that will utilize this facility. The
number of bus bays have been increased from four to
nine. In addition, three new layover bays have been
constructed to accommodate the additional bus
volumes. During the second half of 2017, the transit
center building is being expanded to include
restrooms for both operators and the public. New
accommodations in the facility will include a security
office, real-time information screens, and a ticket
vending machine. The transit center also includes 33
park and ride and daycare parking spaces. Many of
the bus lines provide direct connections to Easton’s
shopping, dining, and entertainment venues.
Constructed in 2005, the daycare is
conveniently located on a contiguous parcel
with the Easton Transit Center providing
easy access for COTA passengers. The 9,948
square-foot facility consists of administrative
offices, conference rooms, dedicated infant,
toddler and pre-school rooms (with restroom
facilities for each area), activity areas, a
kitchen, restrooms, and a fenced outside
play area. This facility can accommodate up
to 135 children. The lease payments cover the
yearly maintenance costs for the transit
center.

2017-2021 SRTP
155
In 2005, COTA completed the construction of
the 9,647 square-foot transit center, located on
the southeast corner of East Main Street and
Champion Avenue. Through a partnership with
the Columbus Compact Corporation [a non-
profit 501 (c) (3) organization charged with the
administration of the Department of Housing
and Urban Development (HUD) designated
Empowerment Zone (EZ) for distressed
communities], COTA obtained the 0.74-acre
parcel. The building opened in September 2005
with a medical facility as the major tenant.
With the addition of a cell phone service store,
this facility serves to help attract COTA
customers. COTA passengers are able to wait
inside the facility, which is equipped with comfortable benches. Two bus lines currently serve
the Near East Transit Center. The building’s operating costs are recouped through lease
payment revenues.
As part of the CMAX Cleveland Avenue BRT project, included in the 2017-2021 COTA TIP is
continued development of a new transit center/park and ride facility on the west side of
Cleveland Avenue just south of SR-161/Dublin Granville Road. With a target completion date of
September 2017, the facility will serve as the termini for the high-frequency limited stop BRT
service set to begin in January 2018, and for the underlying Cleveland Avenue standard bus
service which will continue to serve all stops at 30-miute frequency of service between SR-161
and Downtown.
The #1 Cleveland is COTA’s
second busiest line in the
system. With the addition
of BRT, ridership in the
corridor is projected to
grow 20% within the first
five years of BRT operation.
CMAX branded BRT
vehicles will run every 10
minutes during peak
periods, and 15 minutes during off-peak periods on weekdays between downtown Columbus

2017-2021 SRTP
156
and this facility and 30 minutes on weekends/holidays. The 1,230 square foot building is being
designed with six sawtooth bays and will accommodate 60’ articulated buses should they be
purchased in the future.
The transit center building will include a comfortable, climate controlled indoor waiting area
with real-time next bus arrival information, ticket vending machine, and restroom facilities,
the connecting park and ride lot will have approximately 60 parking spaces, pedestrian
sidewalks and attractive landscaping.
As a part of the CMAX project, COTA received 77% federal funding through the FTA’s Small
Starts program. Construction commenced in 2016 and will be completed in 2017 with a
construction cost of $3.3 million.
Additional information regarding the CMAX Cleveland Avenue BRT line can be found in Section
5.5.
COTA has two downtown terminals that are utilized by within the bus network. In support of
COTA’s commitment to convert its fleet from diesel to CNG-fueled vehicles, it was necessary
to make improvements to these facilities, as well as the need to improve customer waiting
areas and amities for increased future use of the sites.
This terminal is located on Spring Street between
High and Front Streets. The terminal was
demolished and completely renovated during 2014
and reopened in February 2015.
The $2.4 million improvement project includes
modifications to make the terminal CNG and ADA
compliant, make all entrances compliant with COTA
standards for minimum clearance, and incorporate
COTA’s new branding initiatives. These
improvements included a new canopy and
structure; new pavement, striping, and indoor
patron waiting areas with way-finding between
stations. New light fixtures, security system, digital signage, ticket vending machine, and
branding have been installed throughout the terminal. Beginning May 1, 2017, the terminal will
be further utilized as part of COTA’s new late-evening line-up operations in the downtown.
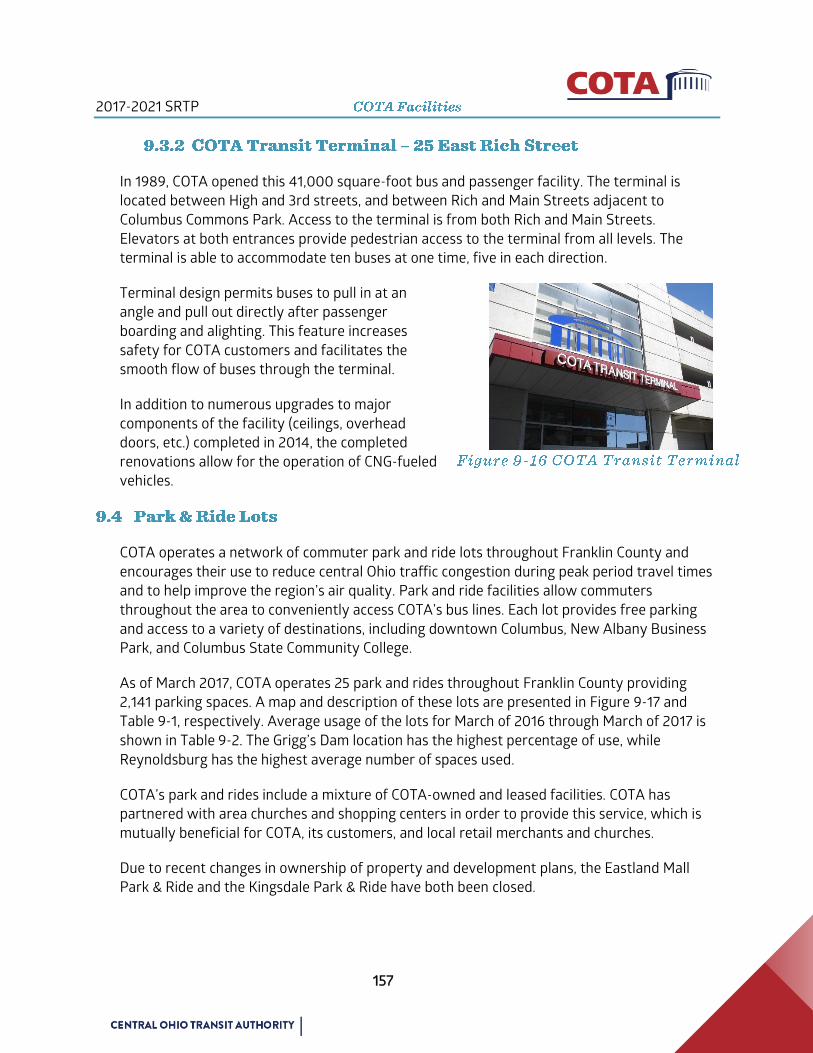
2017-2021 SRTP
157
In 1989, COTA opened this 41,000 square-foot bus and passenger facility. The terminal is
located between High and 3rd streets, and between Rich and Main Streets adjacent to
Columbus Commons Park. Access to the terminal is from both Rich and Main Streets.
Elevators at both entrances provide pedestrian access to the terminal from all levels. The
terminal is able to accommodate ten buses at one time, five in each direction.
Terminal design permits buses to pull in at an
angle and pull out directly after passenger
boarding and alighting. This feature increases
safety for COTA customers and facilitates the
smooth flow of buses through the terminal.
In addition to numerous upgrades to major
components of the facility (ceilings, overhead
doors, etc.) completed in 2014, the completed
renovations allow for the operation of CNG-fueled
vehicles.
COTA operates a network of commuter park and ride lots throughout Franklin County and
encourages their use to reduce central Ohio traffic congestion during peak period travel times
and to help improve the region’s air quality. Park and ride facilities allow commuters
throughout the area to conveniently access COTA’s bus lines. Each lot provides free parking
and access to a variety of destinations, including downtown Columbus, New Albany Business
Park, and Columbus State Community College.
As of March 2017, COTA operates 25 park and rides throughout Franklin County providing
2,141 parking spaces. A map and description of these lots are presented in Figure 9-17 and
Table 9-1, respectively. Average usage of the lots for March of 2016 through March of 2017 is
shown in Table 9-2. The Grigg’s Dam location has the highest percentage of use, while
Reynoldsburg has the highest average number of spaces used.
COTA’s park and rides include a mixture of COTA-owned and leased facilities. COTA has
partnered with area churches and shopping centers in order to provide this service, which is
mutually beneficial for COTA, its customers, and local retail merchants and churches.
Due to recent changes in ownership of property and development plans, the Eastland Mall
Park & Ride and the Kingsdale Park & Ride have both been closed.
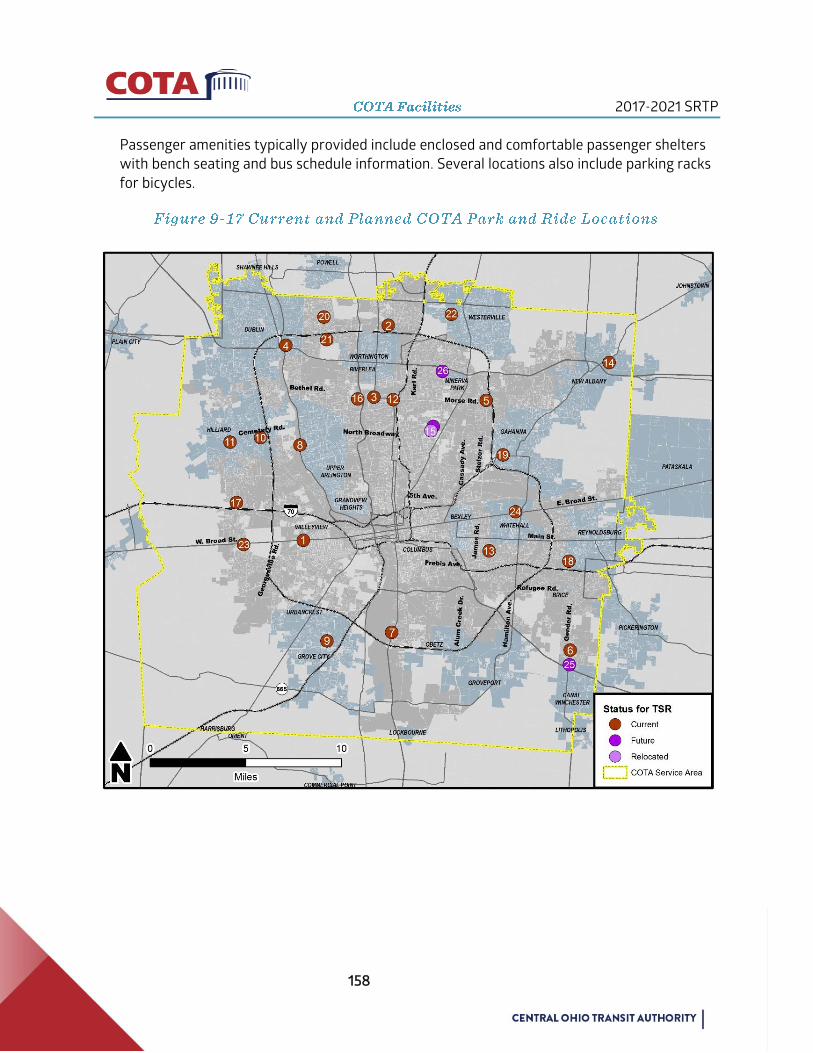
2017-2021 SRTP
158
Passenger amenities typically provided include enclosed and comfortable passenger shelters
with bench seating and bus schedule information. Several locations also include parking racks
for bicycles.
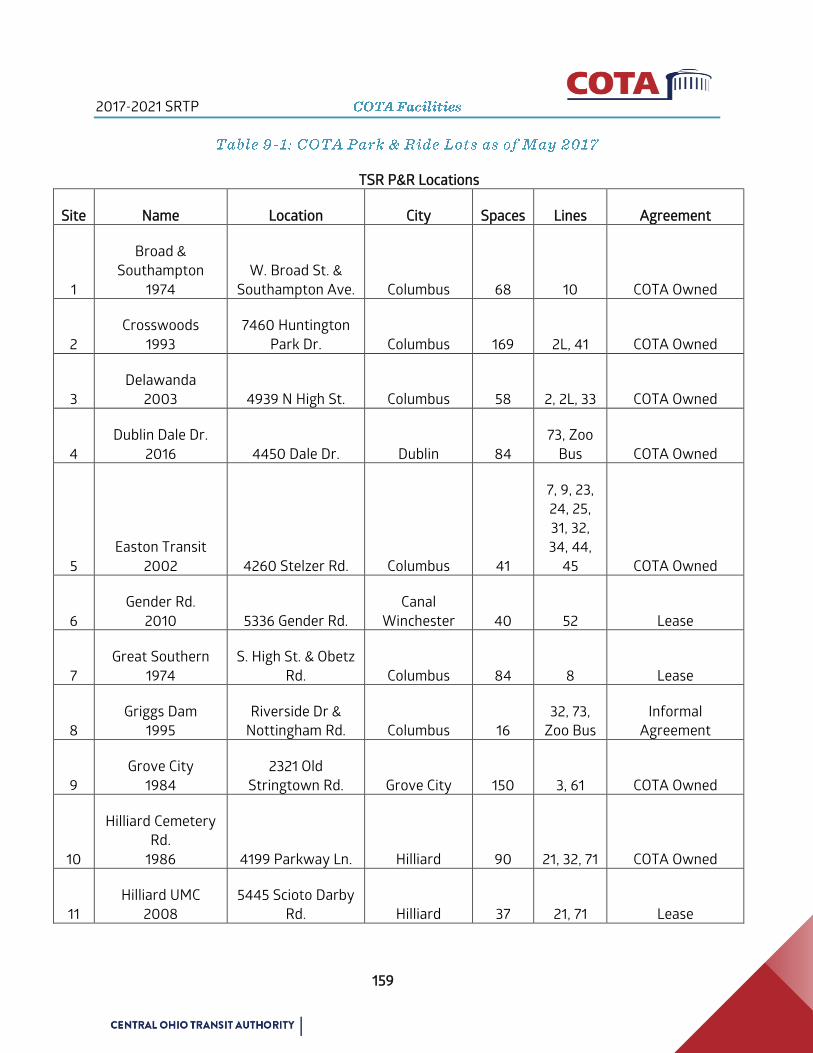
2017-2021 SRTP
159
TSR P&R Locations
Site Name Location City Spaces Lines Agreement
1
Broad &
Southampton
1974
W. Broad St. &
Southampton Ave. Columbus 68 10 COTA Owned
2
Crosswoods
1993
7460 Huntington
Park Dr. Columbus 169 2L, 41 COTA Owned
3
Delawanda
2003 4939 N High St. Columbus 58 2, 2L, 33 COTA Owned
4
Dublin Dale Dr.
2016 4450 Dale Dr. Dublin 84
73, Zoo
Bus COTA Owned
5
Easton Transit
2002 4260 Stelzer Rd. Columbus 41
7, 9, 23,
24, 25,
31, 32,
34, 44,
45 COTA Owned
6
Gender Rd.
2010 5336 Gender Rd.
Canal
Winchester 40 52 Lease
7
Great Southern
1974
S. High St. & Obetz
Rd. Columbus 84 8 Lease
8
Griggs Dam
1995
Riverside Dr &
Nottingham Rd. Columbus 16
32, 73,
Zoo Bus
Informal
Agreement
9
Grove City
1984
2321 Old
Stringtown Rd. Grove City 150 3, 61 COTA Owned
10
Hilliard Cemetery
Rd.
1986 4199 Parkway Ln. Hilliard 90 21, 32, 71 COTA Owned
11
Hilliard UMC
2008
5445 Scioto Darby
Rd. Hilliard 37 21, 71 Lease
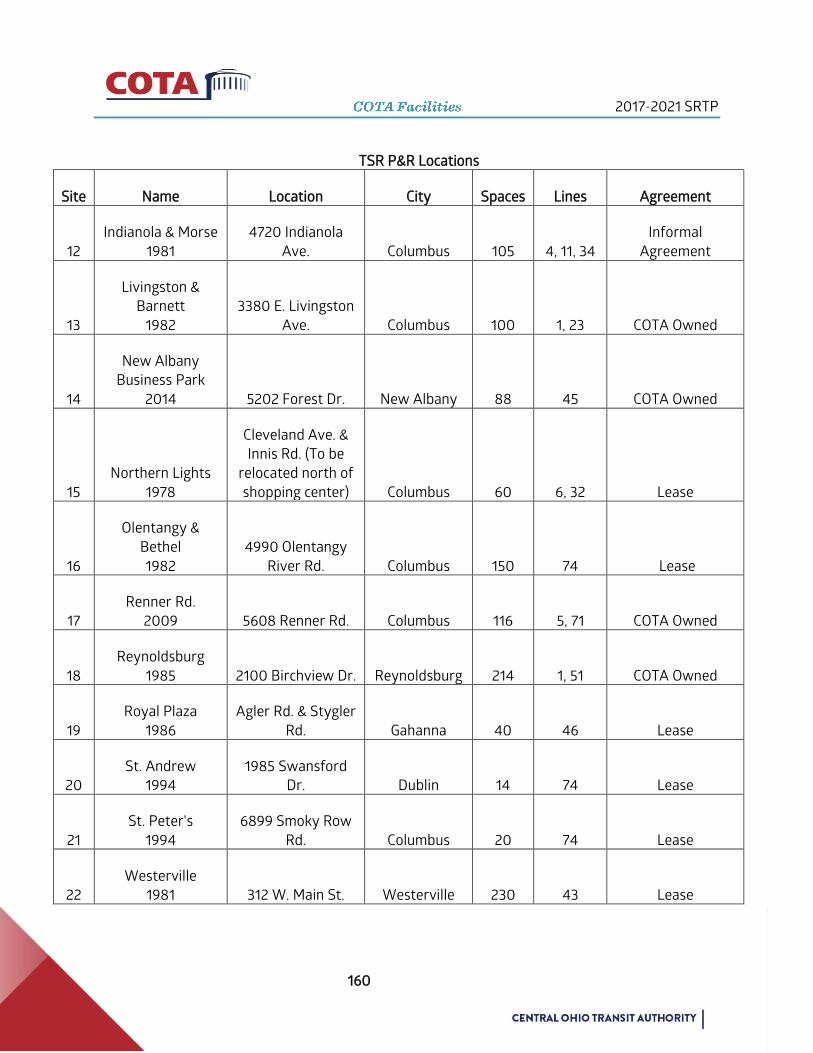
2017-2021 SRTP
160
TSR P&R Locations
Site Name Location City Spaces Lines Agreement
12
Indianola & Morse
1981
4720 Indianola
Ave. Columbus 105 4, 11, 34
Informal
Agreement
13
Livingston &
Barnett
1982
3380 E. Livingston
Ave. Columbus 100 1, 23 COTA Owned
14
New Albany
Business Park
2014 5202 Forest Dr. New Albany 88 45 COTA Owned
15
Northern Lights
1978
Cleveland Ave. &
Innis Rd. (To be
relocated north of
shopping center) Columbus 60 6, 32 Lease
16
Olentangy &
Bethel
1982
4990 Olentangy
River Rd. Columbus 150 74 Lease
17
Renner Rd.
2009 5608 Renner Rd. Columbus 116 5, 71 COTA Owned
18
Reynoldsburg
1985 2100 Birchview Dr. Reynoldsburg 214 1, 51 COTA Owned
19
Royal Plaza
1986
Agler Rd. & Stygler
Rd. Gahanna 40 46 Lease
20
St. Andrew
1994
1985 Swansford
Dr. Dublin 14 74 Lease
21
St. Peter's
1994
6899 Smoky Row
Rd. Columbus 20 74 Lease
22
Westerville
1981 312 W. Main St. Westerville 230 43 Lease

2017-2021 SRTP
161
TSR P&R Locations
Site Name Location City Spaces Lines Agreement
23
Westwoods
1994
55 Westwoods
Blvd. Columbus 100 9, 10, 21 COTA Owned
24
Whitehall
1993 4540 E. Broad St. Whitehall 60 10 COTA Owned
Future P&R Locations
25
Canal Winchester
P&R
Winchester Pike
and Gender Rd.
Canal
Winchester 164 52 COTA Owned
26
Northland Transit
Center
Cleveland Ave. &
SR-161 Columbus 60 6, 35, 43,
CMAX COTA Owned
15
Northern Lights
1978
Cleveland Ave. &
Innis Rd. (To be
relocated north of
shopping center) Columbus 60
6, 32,
CMAX COTA Owned
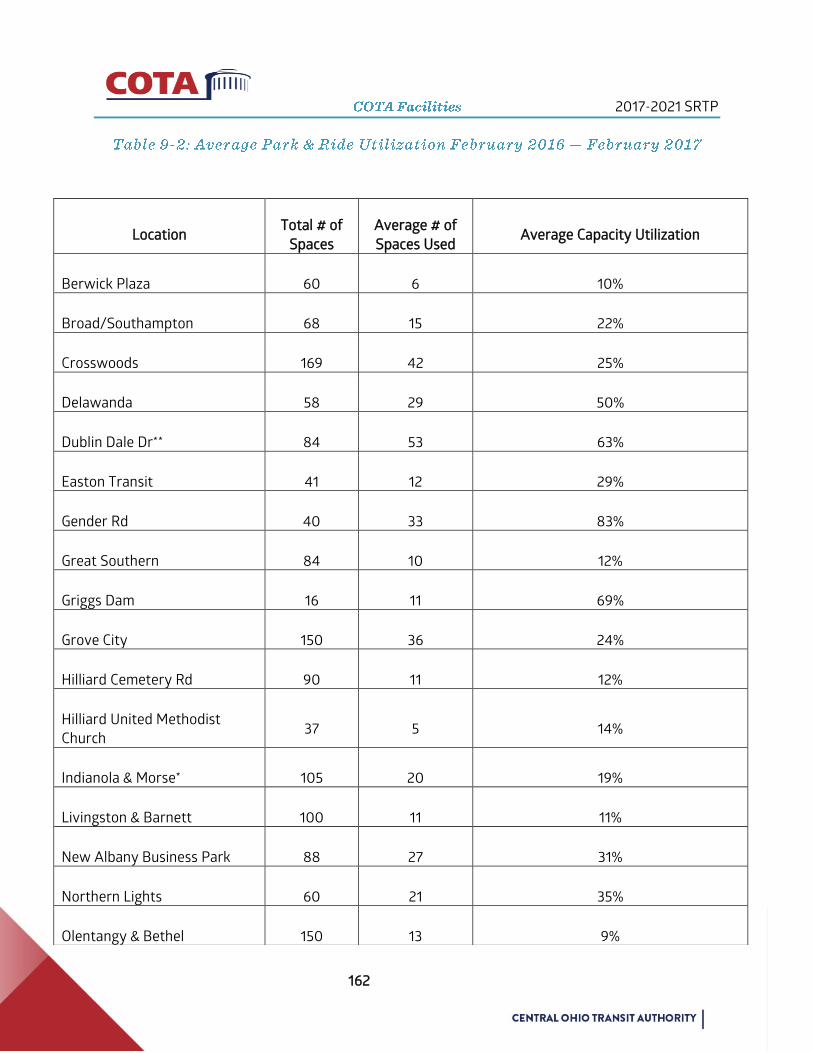
2017-2021 SRTP
162
Location Total # of
Spaces
Average # of
Spaces Used Average Capacity Utilization
Berwick Plaza 60 6 10%
Broad/Southampton 68 15 22%
Crosswoods 169 42 25%
Delawanda 58 29 50%
Dublin Dale Dr** 84 53 63%
Easton Transit 41 12 29%
Gender Rd 40 33 83%
Great Southern 84 10 12%
Griggs Dam 16 11 69%
Grove City 150 36 24%
Hilliard Cemetery Rd 90 11 12%
Hilliard United Methodist
Church 37 5 14%
Indianola & Morse* 105 20 19%
Livingston & Barnett 100 11 11%
New Albany Business Park 88 27 31%
Northern Lights 60 21 35%
Olentangy & Bethel 150 13 9%

2017-2021 SRTP
163
*Actual utilization may vary due to shared use lot
Population growth, volatile gas prices, and an increased awareness of potential cost savings
and environmental benefits derived from the use of public transit remain strong factors for
development of future park and rides.
With the implementation of the TSR and launch of the CMAX Cleveland Avenue Bus Rapid
Transit project, COTA plans to open a new transit center and relocate two park and rides.
Figure 9-X shows current and future Park and Ride changes.
Due to changes in the TSR, Berwick Park & Ride will be discontinued on May 1, 2017.
In January 2018, COTA will relocate an existing leased park and ride on Gender Road to a
future COTA-owned facility in Canal Winchester. The land for this site was purchased along
Gender Road and Winchester Pike. There are additional parcels that are planned to be sold as
part of the purchase to offset the purchase price. The site will be designed and constructed in
2017, with an anticipated opening date of January 2018.
Renner Rd 116 69 59%
Reynoldsburg 214 80 37%
Royal Plaza (Gahanna) 40 11 28%
St. Andrew’s 14 4 29%
St. Peter’s 20 6 30%
Westerville* 230 62 27%
Westwoods 100 16 16%
Whitehall 60 21 35%
TOTAL P&R SPACES 2,141 624 29%
2017-2021 SRTP
164
Included in the 2017-2021 COTA TIP is the development of a new, COTA owned park and ride
facility in the Northern Lights area along Cleveland Avenue as part of the Cleveland Avenue
CMAX BRT Project. The facility will replace the existing leased park and ride location at
Northern Lights Shopping Center, an urban strip mall development and primary destination
within the Cleveland Avenue corridor.
Development of a park & ride in this area has been under consideration for several years, and
aligns with various area plans focused on improvements to the area, including Franklin
County’s Clinton-Mifflin Land Use Plan and City of Columbus Linden Area Traffic Management
Plan. The current #1 Cleveland connects areas of lower income, minority populations to
important employment centers such as downtown Columbus, St. Ann’s Hospital, and
Columbus State Community College. COTA’s existing bus stop and layover location within the
Northern Lights Shopping Center complex is one of the busiest passenger activity stop outside
of the Downtown area, with a combined average of nearly 1,000 boardings and alightings
occurring each weekday.
The #1 Cleveland is COTA’s second busiest line in the system. With the addition of BRT
ridership in the corridor is projected to grow 20% within the first five years of BRT operation.
The leased park and ride location is limited to 60 parking spaces, a passenger shelter on a
concrete passenger platform, and a bus bay area that accommodates only two 40-feet, fixed-
route vehicles. As part of the CMAX BRT project, the new park and ride to be constructed in
2017-2018 will have 129 parking spaces.
Funding has been budgeted in the project costs for the proposed Cleveland Avenue BRT
service (see Section 12.5.2). During 2017, COTA will purchase property that will meet the needs
for expanded service along this area of Cleveland Avenue. It is anticipated construction will be
completed in first quarter 2018. Real estate costs are estimated at $2 million and construction
costs at $1.7 million.
Development of this park and ride has include significant public involvement, including
meetings with officials from Clinton Township, Franklin County, and City of Columbus, area
commissions, civic associations and other community stakeholders, and meetings open to the
general public.
Future park and ride locations are shown in Figure 9-17.
COTA currently owns and maintains approximately 326 passenger shelters, primarily located
at major boarding or transfer locations, park and rides, shopping centers, and medical
facilities. Once the TSR is implemented, COTA will maintain 362 shelters. While COTA strives to
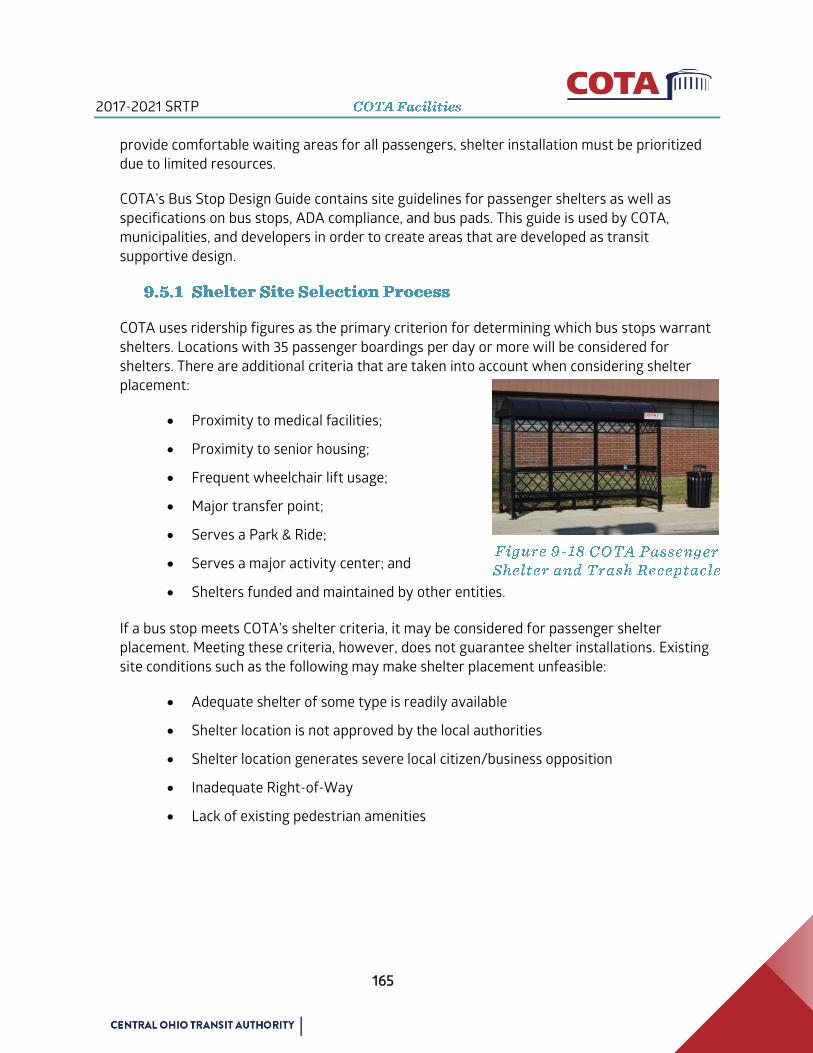
2017-2021 SRTP
165
provide comfortable waiting areas for all passengers, shelter installation must be prioritized
due to limited resources.
COTA’s Bus Stop Design Guide contains site guidelines for passenger shelters as well as
specifications on bus stops, ADA compliance, and bus pads. This guide is used by COTA,
municipalities, and developers in order to create areas that are developed as transit
supportive design.
COTA uses ridership figures as the primary criterion for determining which bus stops warrant
shelters. Locations with 35 passenger boardings per day or more will be considered for
shelters. There are additional criteria that are taken into account when considering shelter
placement:
Proximity to medical facilities;
Proximity to senior housing;
Frequent wheelchair lift usage;
Major transfer point;
Serves a Park & Ride;
Serves a major activity center; and
Shelters funded and maintained by other entities.
If a bus stop meets COTA’s shelter criteria, it may be considered for passenger shelter
placement. Meeting these criteria, however, does not guarantee shelter installations. Existing
site conditions such as the following may make shelter placement unfeasible:
Adequate shelter of some type is readily available
Shelter location is not approved by the local authorities
Shelter location generates severe local citizen/business opposition
Inadequate Right-of-Way
Lack of existing pedestrian amenities
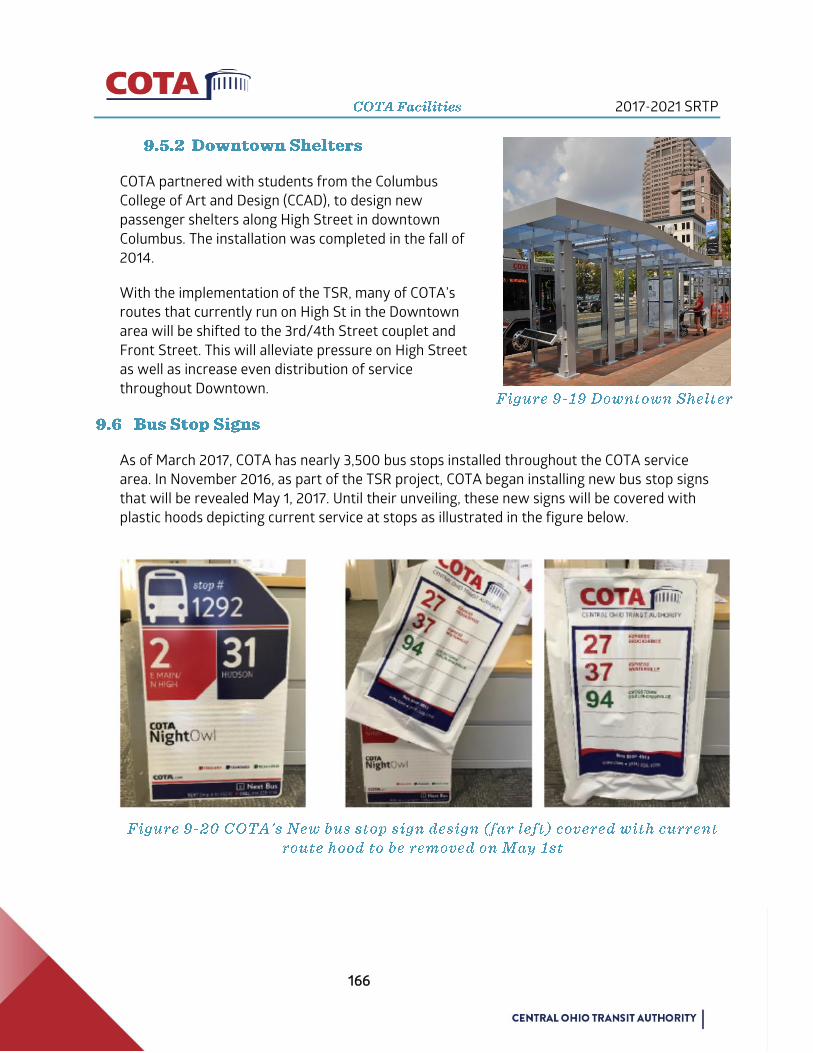
2017-2021 SRTP
166
COTA partnered with students from the Columbus
College of Art and Design (CCAD), to design new
passenger shelters along High Street in downtown
Columbus. The installation was completed in the fall of
2014.
With the implementation of the TSR, many of COTA’s
routes that currently run on High St in the Downtown
area will be shifted to the 3rd/4th Street couplet and
Front Street. This will alleviate pressure on High Street
as well as increase even distribution of service
throughout Downtown.
As of March 2017, COTA has nearly 3,500 bus stops installed throughout the COTA service
area. In November 2016, as part of the TSR project, COTA began installing new bus stop signs
that will be revealed May 1, 2017. Until their unveiling, these new signs will be covered with
plastic hoods depicting current service at stops as illustrated in the figure below.
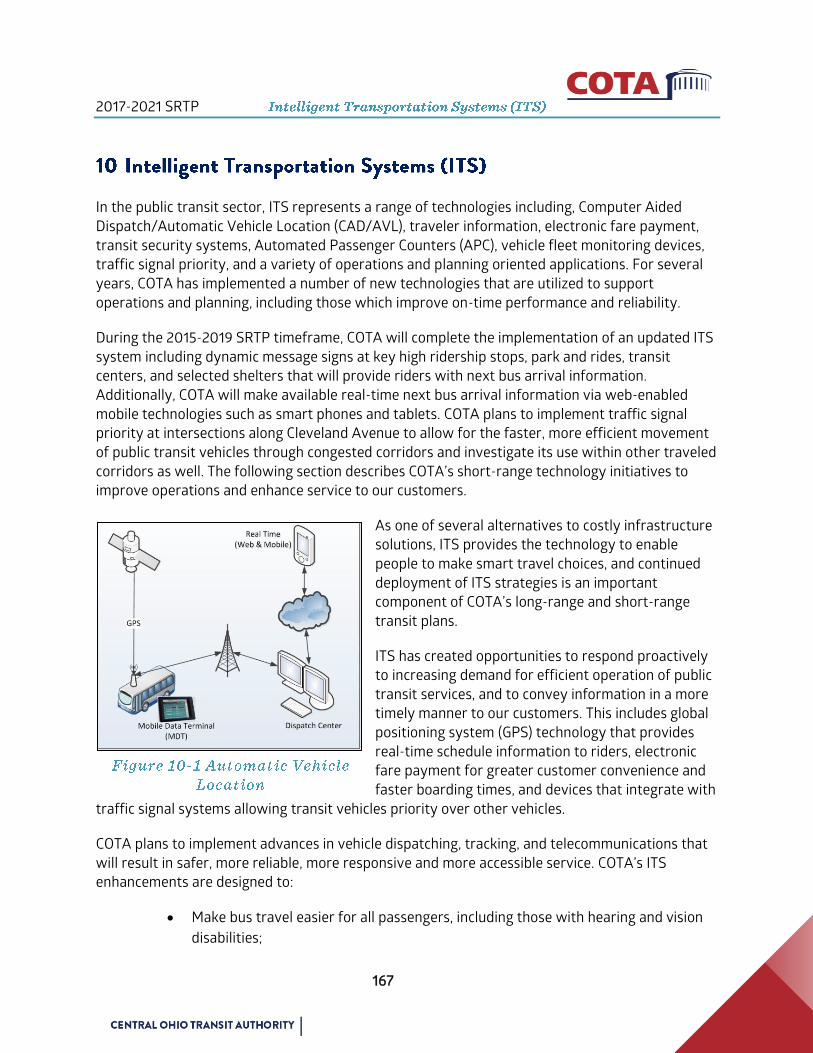
2017-2021 SRTP
167
In the public transit sector, ITS represents a range of technologies including, Computer Aided
Dispatch/Automatic Vehicle Location (CAD/AVL), traveler information, electronic fare payment,
transit security systems, Automated Passenger Counters (APC), vehicle fleet monitoring devices,
traffic signal priority, and a variety of operations and planning oriented applications. For several
years, COTA has implemented a number of new technologies that are utilized to support
operations and planning, including those which improve on-time performance and reliability.
During the 2015-2019 SRTP timeframe, COTA will complete the implementation of an updated ITS
system including dynamic message signs at key high ridership stops, park and rides, transit
centers, and selected shelters that will provide riders with next bus arrival information.
Additionally, COTA will make available real-time next bus arrival information via web-enabled
mobile technologies such as smart phones and tablets. COTA plans to implement traffic signal
priority at intersections along Cleveland Avenue to allow for the faster, more efficient movement
of public transit vehicles through congested corridors and investigate its use within other traveled
corridors as well. The following section describes COTA’s short-range technology initiatives to
improve operations and enhance service to our customers.
As one of several alternatives to costly infrastructure
solutions, ITS provides the technology to enable
people to make smart travel choices, and continued
deployment of ITS strategies is an important
component of COTA’s long-range and short-range
transit plans.
ITS has created opportunities to respond proactively
to increasing demand for efficient operation of public
transit services, and to convey information in a more
timely manner to our customers. This includes global
positioning system (GPS) technology that provides
real-time schedule information to riders, electronic
fare payment for greater customer convenience and
faster boarding times, and devices that integrate with
traffic signal systems allowing transit vehicles priority over other vehicles.
COTA plans to implement advances in vehicle dispatching, tracking, and telecommunications that
will result in safer, more reliable, more responsive and more accessible service. COTA’s ITS
enhancements are designed to:
Make bus travel easier for all passengers, including those with hearing and vision
disabilities;

2017-2021 SRTP
168
Avoid traffic congestion and improve on-time performance;
Provide timely and comprehensive transit information such as real-time “next bus”
arrival information on variable message signs located at key high ridership stops,
park and rides, transit centers and selected shelters;
More timely and easier access to route and schedule information via the use of
current technologies including variable electronic message displays, as well as
improved access through a variety of devices including desktop and laptop
computers, smart phones, and tablets; and
Provide real-time transit performance and customer data via automated reports
and dashboards for COTA management decision making.
Specific components of COTA’s overall ITS initiatives include:
Computer Aided Dispatch/Automatic Vehicle (CAD/AVL);
Onboard automated stop announcements;
Traveler information systems;
Automatic Passenger Counters (APC);
Fleet maintenance technologies;
Safety and security, and
Transit signal priority.
Over the next five years, COTA will pursue implementation of the following technologies:
Upgraded fare management system to allow the payment of fares via mobile
media, smart cards and account based fare management.
More advanced web-based and interactive voice response (IVR) traveler
information systems for both fixed-route and paratransit riders;
Driver training and on-board vehicle monitoring systems;
Transit intelligence system for internal management;
Upgraded mobile data computers in all paratransit vehicles;
Demand response systems to improve paratransit operations and customer
interfaces (e.g., IVR and Internet based reservation capabilities, automated
certification notifications, etc.);
Fleet maintenance technologies, and
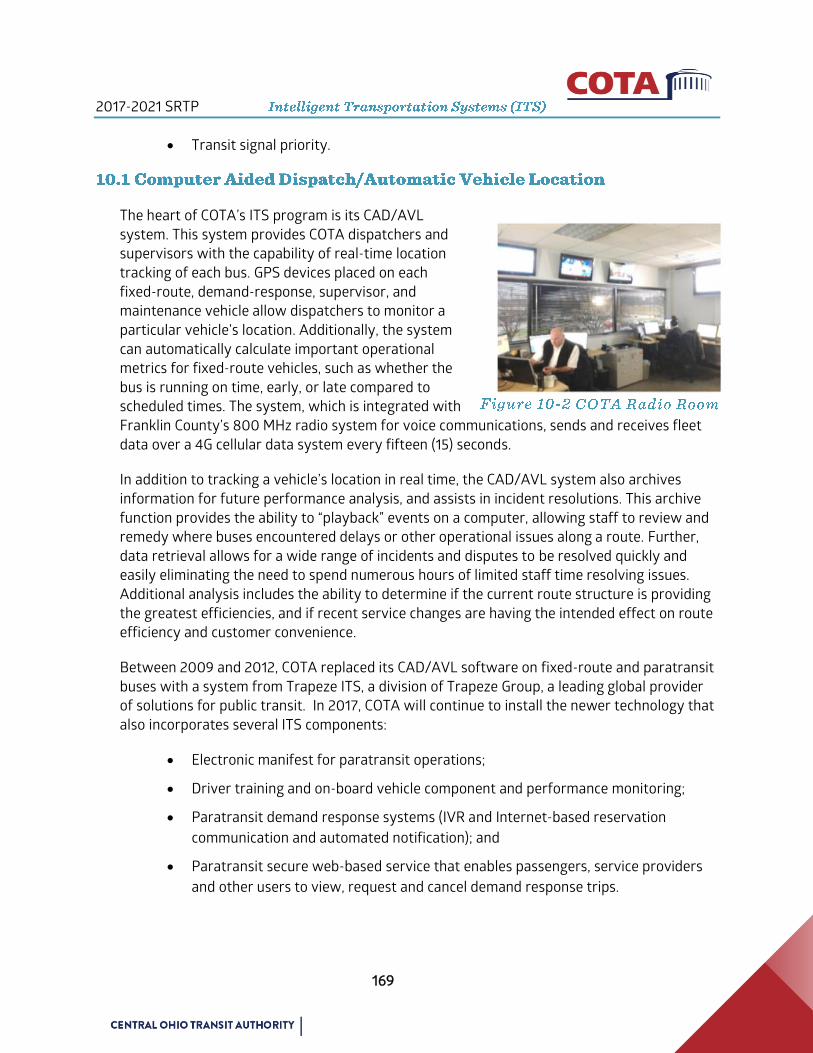
2017-2021 SRTP
169
Transit signal priority.
The heart of COTA’s ITS program is its CAD/AVL
system. This system provides COTA dispatchers and
supervisors with the capability of real-time location
tracking of each bus. GPS devices placed on each
fixed-route, demand-response, supervisor, and
maintenance vehicle allow dispatchers to monitor a
particular vehicle’s location. Additionally, the system
can automatically calculate important operational
metrics for fixed-route vehicles, such as whether the
bus is running on time, early, or late compared to
scheduled times. The system, which is integrated with
Franklin County’s 800 MHz radio system for voice communications, sends and receives fleet
data over a 4G cellular data system every fifteen (15) seconds.
In addition to tracking a vehicle’s location in real time, the CAD/AVL system also archives
information for future performance analysis, and assists in incident resolutions. This archive
function provides the ability to “playback” events on a computer, allowing staff to review and
remedy where buses encountered delays or other operational issues along a route. Further,
data retrieval allows for a wide range of incidents and disputes to be resolved quickly and
easily eliminating the need to spend numerous hours of limited staff time resolving issues.
Additional analysis includes the ability to determine if the current route structure is providing
the greatest efficiencies, and if recent service changes are having the intended effect on route
efficiency and customer convenience.
Between 2009 and 2012, COTA replaced its CAD/AVL software on fixed-route and paratransit
buses with a system from Trapeze ITS, a division of Trapeze Group, a leading global provider
of solutions for public transit. In 2017, COTA will continue to install the newer technology that
also incorporates several ITS components:
Electronic manifest for paratransit operations;
Driver training and on-board vehicle component and performance monitoring;
Paratransit demand response systems (IVR and Internet-based reservation
communication and automated notification); and
Paratransit secure web-based service that enables passengers, service providers
and other users to view, request and cancel demand response trips.
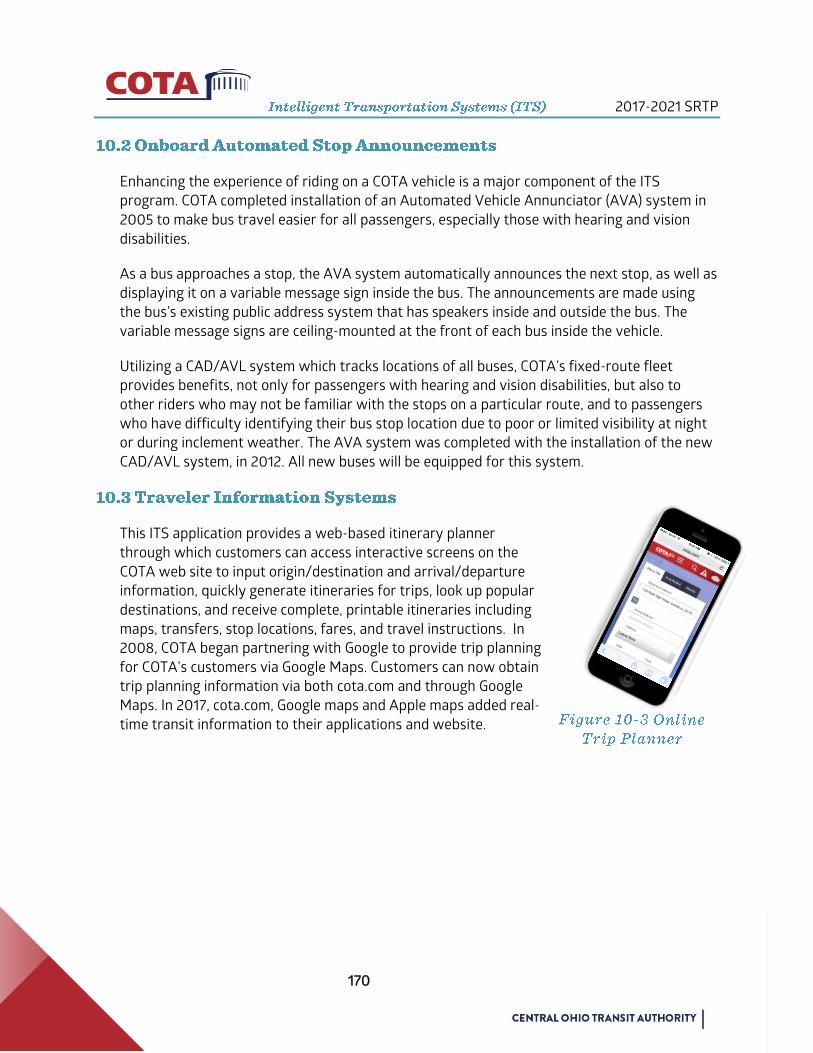
2017-2021 SRTP
170
Enhancing the experience of riding on a COTA vehicle is a major component of the ITS
program. COTA completed installation of an Automated Vehicle Annunciator (AVA) system in
2005 to make bus travel easier for all passengers, especially those with hearing and vision
disabilities.
As a bus approaches a stop, the AVA system automatically announces the next stop, as well as
displaying it on a variable message sign inside the bus. The announcements are made using
the bus’s existing public address system that has speakers inside and outside the bus. The
variable message signs are ceiling-mounted at the front of each bus inside the vehicle.
Utilizing a CAD/AVL system which tracks locations of all buses, COTA’s fixed-route fleet
provides benefits, not only for passengers with hearing and vision disabilities, but also to
other riders who may not be familiar with the stops on a particular route, and to passengers
who have difficulty identifying their bus stop location due to poor or limited visibility at night
or during inclement weather. The AVA system was completed with the installation of the new
CAD/AVL system, in 2012. All new buses will be equipped for this system.
This ITS application provides a web-based itinerary planner
through which customers can access interactive screens on the
COTA web site to input origin/destination and arrival/departure
information, quickly generate itineraries for trips, look up popular
destinations, and receive complete, printable itineraries including
maps, transfers, stop locations, fares, and travel instructions. In
2008, COTA began partnering with Google to provide trip planning
for COTA’s customers via Google Maps. Customers can now obtain
trip planning information via both cota.com and through Google
Maps. In 2017, cota.com, Google maps and Apple maps added real-
time transit information to their applications and website.
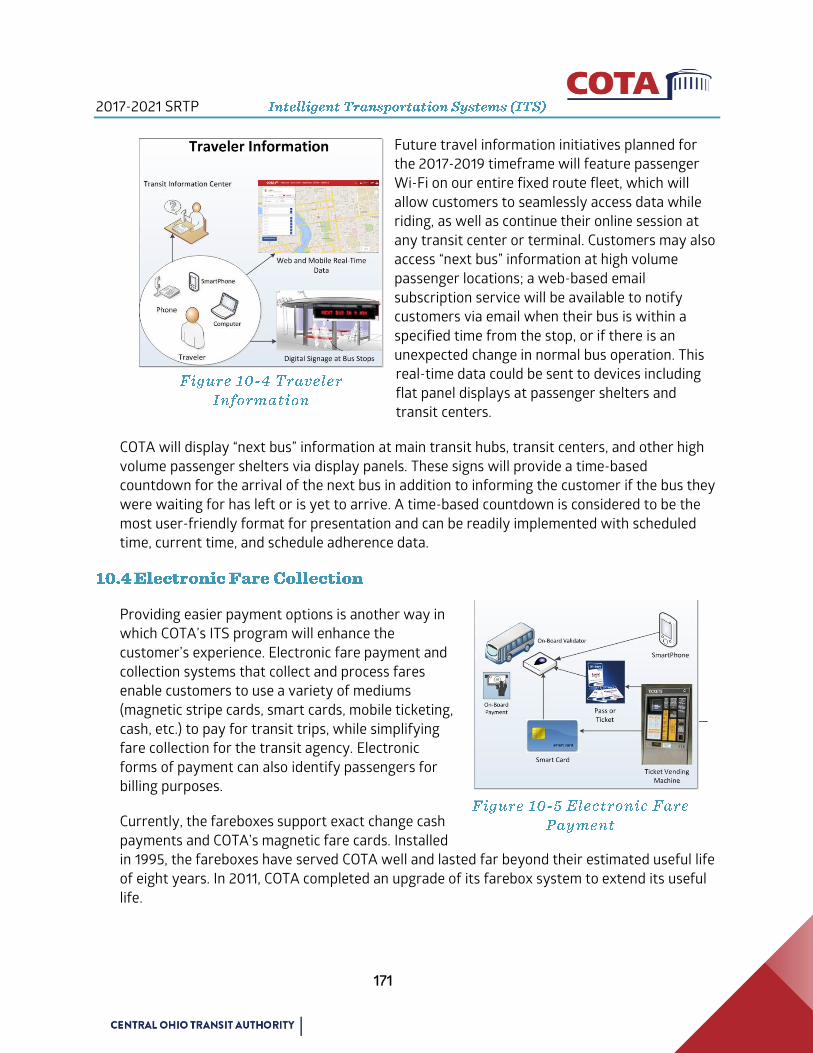
2017-2021 SRTP
171
Future travel information initiatives planned for
the 2017-2019 timeframe will feature passenger
Wi-Fi on our entire fixed route fleet, which will
allow customers to seamlessly access data while
riding, as well as continue their online session at
any transit center or terminal. Customers may also
access “next bus” information at high volume
passenger locations; a web-based email
subscription service will be available to notify
customers via email when their bus is within a
specified time from the stop, or if there is an
unexpected change in normal bus operation. This
real-time data could be sent to devices including
flat panel displays at passenger shelters and
transit centers.
COTA will display “next bus” information at main transit hubs, transit centers, and other high
volume passenger shelters via display panels. These signs will provide a time-based
countdown for the arrival of the next bus in addition to informing the customer if the bus they
were waiting for has left or is yet to arrive. A time-based countdown is considered to be the
most user-friendly format for presentation and can be readily implemented with scheduled
time, current time, and schedule adherence data.
Providing easier payment options is another way in
which COTA’s ITS program will enhance the
customer’s experience. Electronic fare payment and
collection systems that collect and process fares
enable customers to use a variety of mediums
(magnetic stripe cards, smart cards, mobile ticketing,
cash, etc.) to pay for transit trips, while simplifying
fare collection for the transit agency. Electronic
forms of payment can also identify passengers for
billing purposes.
Currently, the fareboxes support exact change cash
payments and COTA’s magnetic fare cards. Installed
in 1995, the fareboxes have served COTA well and lasted far beyond their estimated useful life
of eight years. In 2011, COTA completed an upgrade of its farebox system to extend its useful
life.
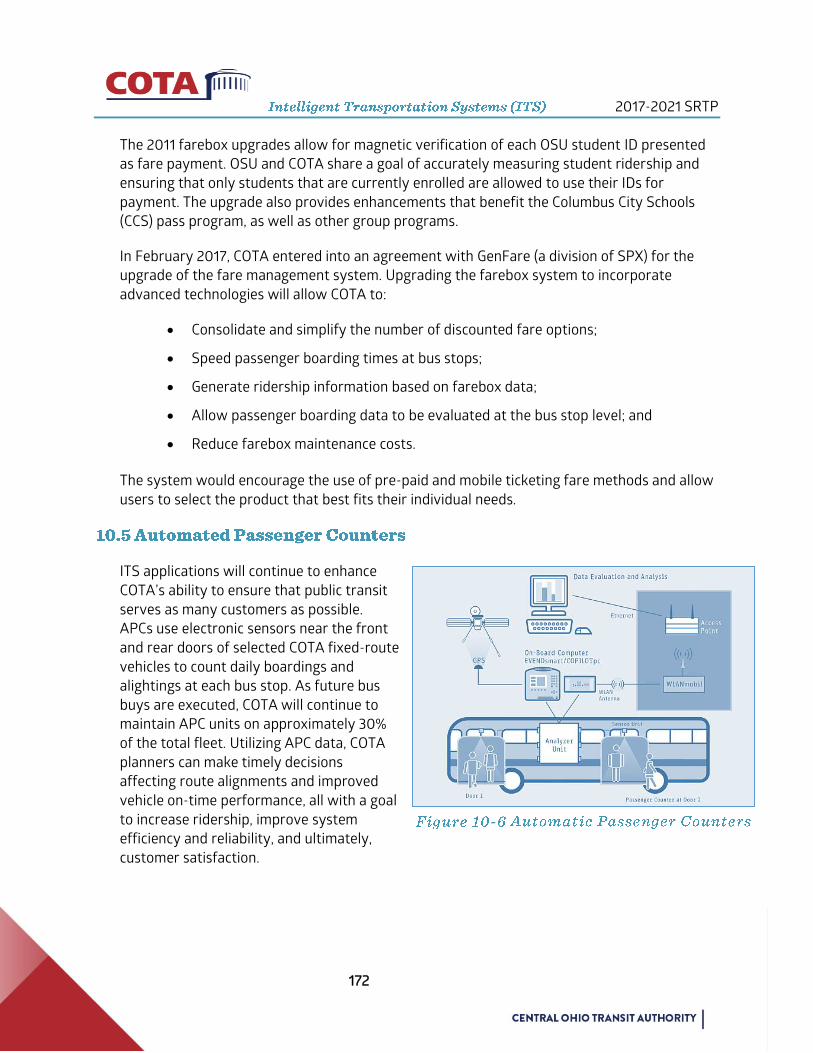
2017-2021 SRTP
172
The 2011 farebox upgrades allow for magnetic verification of each OSU student ID presented
as fare payment. OSU and COTA share a goal of accurately measuring student ridership and
ensuring that only students that are currently enrolled are allowed to use their IDs for
payment. The upgrade also provides enhancements that benefit the Columbus City Schools
(CCS) pass program, as well as other group programs.
In February 2017, COTA entered into an agreement with GenFare (a division of SPX) for the
upgrade of the fare management system. Upgrading the farebox system to incorporate
advanced technologies will allow COTA to:
Consolidate and simplify the number of discounted fare options;
Speed passenger boarding times at bus stops;
Generate ridership information based on farebox data;
Allow passenger boarding data to be evaluated at the bus stop level; and
Reduce farebox maintenance costs.
The system would encourage the use of pre-paid and mobile ticketing fare methods and allow
users to select the product that best fits their individual needs.
ITS applications will continue to enhance
COTA’s ability to ensure that public transit
serves as many customers as possible.
APCs use electronic sensors near the front
and rear doors of selected COTA fixed-route
vehicles to count daily boardings and
alightings at each bus stop. As future bus
buys are executed, COTA will continue to
maintain APC units on approximately 30%
of the total fleet. Utilizing APC data, COTA
planners can make timely decisions
affecting route alignments and improved
vehicle on-time performance, all with a goal
to increase ridership, improve system
efficiency and reliability, and ultimately,
customer satisfaction.
2017-2021 SRTP
173
Included with the CAD/AVL upgrade is the ability to provide enhanced maintenance capability
to the fleet through vehicle component monitoring (VCM). VCM, or Preventive Maintenance
(PM) software, enables automatic monitoring of transit vehicle engine components and
provides warnings to COTA’s maintenance personnel if failures are about to occur. This
element would eventually integrate with COTA’s existing maintenance records software.
To monitor the COTA vehicle, an on-board microcomputer will be connected to various input
devices: engine sensors, GPS receiver, ramp deployment signals, and odometer sensors, which
can record characteristics such as acceleration/deceleration, speed/RPM, engine run time, and
cumulative distance traveled. External sensors can also be connected to the on-board
microcomputer to record temperatures (engine, coolant, interior passenger comfort), road
conditions (vibration), air compression usage (tire pressure), and stress on brakes. When the
vehicle returns to the garage, the data can be downloaded via the wireless local area network
to the maintenance system in order to help maintenance personnel conduct proactive fleet
maintenance in a more timely and efficient manner, reducing overall maintenance costs.
COTA’s future ITS plans also include an Intelligent Vehicle Initiative (IVI). IVI systems are
designed to enhance the safety of the bus by providing crash warning and crash avoidance
capabilities. IVI systems address behaviors including following too close, unintended lane
departures, driving too fast around turns, and other operational characteristics. The plan to
implement IVI technologies is currently being evaluated and is not being planned for
deployment in the 2017-2021 timeframe.
Ensuring the safety of customers and operators is one of COTA’s highest priorities. Over the
last few years, COTA, along with many other public organizations, has expanded interest in
security to include its fleet and facilities. (See Section 11)
Examples of ITS technologies used in ensuring a safe and secure environment include a video
surveillance system, which incorporates three cameras in each fixed-route bus, images from
which are stored automatically to hard drives on the buses. Additional on-board security
features include emergency alarms and other sensitive security features, which allow
dispatchers to monitor situations on the bus and act accordingly. COTA also currently
monitors its facilities with a closed circuit television (CCTV) surveillance system. Finally, each
COTA facility maintains controlled access through a key card system.
Over the 2017-2021 timeframe, COTA will continue to make significant investments in ITS
security and safety technologies. Examples include the CAD/AVL upgrade described above,
and other equipment that will assist COTA in monitoring and responding to situations on
board vehicles, along the routes, and at transit facilities.

2017-2021 SRTP
174
Over the past few years, implementation of various ITS technologies has been conducted by
several local municipalities. For example, the City of Columbus and the Ohio Department of
Transportation (ODOT) have installed real-time cameras at numerous intersections and
highway areas in central Ohio in order to help monitor traffic flow, decrease traffic incident
response times, and improve overall safety of operations.
Another area of ITS integration and partnering with local agencies includes the ability to
interface with the City of Columbus’ traffic signal system and provide COTA buses priority at
certain intersections when buses are running late. Traffic Signal Prioritization, or TSP, enables
a green light or truncates a red light (with certain parameters). The CMAX BRT project will
utilize TSP, and COTA will continue to work closely with City of Columbus to ensure proper
design of the system. COTA staff will also investigate the potential for replicating TSP along
other high ridership and high traffic congestion corridors during the 2017-2021 SRTP
timeframe.
Over the next five years, COTA will continue to pursue diverse ITS technologies to increase
mobility and enhance transit operations by making travel safer, more efficient, cost-effective,
and convenient.
In June 2016, the City of Columbus won the U.S. Department of Transportation (USDOT) $40
million Smart City Challenge. This award has the intent to implement a holistic vision for how
technology can help all residents.
The goals of Smart Columbus are to:
Improve access to jobs through expanded mobility options in major job centers.
Compete globally through smart logistics.
Connect Columbus residents to safe, reliable transportation that can be accessed
by all.
Better connect our visitors to transportation options.
Develop a more environmentally sustainable transportation system.
The anticipated outcome is for Columbus to become the nation’s epicenter for ITS research to
improve safety, enhance mobility, create ladders of opportunity for those who may have been
left behind in the past, and address climate change by reducing greenhouse gas emissions.
COTA is partnering with, and a key contributor to the City of Columbus and Smart Columbus
project teams on fourteen (14) of the fifteen (15) identified working groups to bring to reality

2017-2021 SRTP
175
the vision of the Smart Columbus project. Still early in the process, details of which
technologies will be deployed is still being developed.
For more information please visit www.columbus.gov/smartcolumbus/

2017-2021 SRTP
176
COTA places a high priority on passenger and employee safety and security. As such, it is
important that COTA be prepared to respond to a variety of security-related incidents and
emergencies that may result from natural or human-made disasters.
COTA is an active community partner in regional security and emergency response planning,
playing a vital role in response to and recovery from emergencies and other unexpected
catastrophic events. Such emergencies, especially those that call for the mobilization of
transportation resources, require effective and efficient coordination across a broad spectrum of
agencies. In the event of activation, members of the COTA Security Team report to the Franklin
County Emergency Management & Homeland Security Emergency Operations Center to serve as
ESF (Emergency Support Function) 1 Representative(s).
COTA’s capability to mobilize resources is profoundly affected by the decisions and directives of
others, including law enforcement, fire, emergency medical services, and local and state planning
agencies. To better manage these effects, COTA is actively involved with local, Central Ohio
communities in planning and preparing for emergencies. COTA is prepared to provide specific
functions that are identified in local emergency operations plans. Those functions may include but
are not limited to
The emergency evacuation of citizens from disaster affected areas;
Identification and transportation of citizens with disabilities;
Evacuation of schools and day care centers;
Temporary/in-place sheltering of evacuated citizens; and
Transportation of meals, goods, and supplies to an affected area for victims,
emergency responders, or to support recovery operations, planned security, and
emergency preparedness activities.
Over the past decade, COTA reorganized and increased its security enhancements to ensure
the safety and well-being of its passengers, employees, and facilities and to provide an
environment that is welcoming to customers. To develop an overall picture of the
organization, the Security Department has conducted and participated in Security Risk,
Threat, Vulnerability Assessments, Transportation Security Administration (TSR) Risk
Mitigation Activities for Surface Transportation (RMAST) and TSA BASE Assessments to
determine weaknesses and strengths in the COTA structure. Several areas targeted are as
described below.

2017-2021 SRTP
177
COTA maintains vehicles for use by uniformed Columbus Police Officers. The cars are
equipped with interior red and blue lights, public address systems, sirens, police computers,
and radio equipment. These vehicles allow COTA to double its resources and reduce the time
to respond to coaches in need of assistance.
The computers allow officers to receive
information immediately on an individual’s
criminal status without awaiting the availability
of a police dispatcher to conduct a search. The
radios provide the advantage of direct contact to
the Columbus Division of Police Communications
Room for immediate response from on-duty
police officers, helicopter support, K9 units, etc.,
when warranted.
Police officers ride COTA coaches when
warranted, providing an additional level of protection for customers and operators. At their
discretion, police departments across Franklin County are asked to stop coaches and conduct
a courtesy walk-through. COTA has budgeted $660,000 to hire Special Duty Police Officers
for 2017, with inflationary increases included in each additional year of this plan.
COTA has initiated and maintained several additional standards to enhance its ability to detect
and deter terrorist activities within its system. These deterrents include, but are not limited to:
Bomb-sniffing, canine detection teams –
Members of the TSA, Columbus Division of
Fire Bomb Squad, and the Ohio Highway
Patrol Canine Teams work hand in hand with
COTA to search coaches at pre-determined
locations and COTA facilities to ensure the
safety of passengers, employees, and
equipment during heightened security
conditions. The searches serve as a deterrent
for anyone that may be considering plans to
cause harm to the transit system.

2017-2021 SRTP
178
Visible Intermodal Protection Response (VIPR) –
The TSA, Ohio Highway Patrol, the Ohio State
University Police and the Columbus Division of
Police coordinate with COTA to provide VIPR
Operations during OSU football games, Arnold
Classic, Race for the Cure, Columbus Marathon
and Columbus’ Red, White, and Boom activities.
VIPR provides federal agents, TSA Behavioral
Specialists and police officers to improve the
security of COTA passengers, employees, and
equipment during the busiest days of the year. VIPR officers ride with passengers,
check parked vehicles at park and rides, conduct canine searches on buses, and
scout crowds for suspicious activities.
COTA will continue to ensure enhanced security in and around all facilities. Proximity
identification card readers are located at exterior entrances and exits for transit centers and
terminals while pedestrian gates and employee ID card readers control access of employees,
contractors and visitors to all COTA Facilities. In 2014, the Authority began an overall upgrade
to the access control system to include the renovated areas of McKinley, with Mobility
Services and 33 North Street scheduled for the first quarter of 2017. Remaining COTA facilities
are scheduled to be upgraded with the latest S2 technologies throughout the SRTP timeframe.
CCTV is operational and installed on all COTA fixed route buses and facilities. COTA’s major
facilities have been upgraded to the Pelco system. As each facility undergoes renovation, the
CCTV system will be assessed and equipped with the appropriate technologies.
Surveillance equipment is in operational status at twelve of COTA’s Park and Ride locations. CCTV
is utilized as a deterrent for criminal activity in addition to assisting Local Law Enforcement
Agencies with investigations as warranted. In addition, TSA Security Inspectors preform monthly
site observations to provide high visibility in deterring suspicious activity.
Similar to each bus in COTA’s existing fleet, all bus buys include the following security related
features:
2017-2021 SRTP
179
Exterior destination signs that can be activated to read “Emergency, Please Call
Police,” followed by a silent alarm to COTA’s Radio Room;
Convex mirrors to allow the operator complete vision of passengers;
Bus identification numbers painted on coach tops for easy aerial view (e.g., by
police helicopters);
A GPS radio to provide real-time bus location information; and
Emergency buttons included in an upgraded radio system in order to provide a
priority and second level of priority notification to the Radio Room.
COTA contracts security guard services to protect its main headquarters at 33 North High
Street and two main bus facilities, McKinley Avenue and Fields Avenue locations. In late 2016,
COTA Security enhanced this service by upgrading to 24-hour service 7 days a week at each
facility to enhance the security of employees and assets.
In 2006, COTA, the Mid-Ohio Regional Planning Commission (MORPC), Franklin County
Emergency Management and Homeland Security Agency (FCEMHS), and the City of Columbus,
formed a regional evacuation transportation group to discuss emergency response,
evacuation routing, signage, and transportation resources with agencies in the greater
Columbus area that have a stake in evacuation planning. On a regular basis, this group
discusses the following topics:
Transportation resources;
Evacuation routing and signage;
Review of existing evacuation plans; and
Incident management.
FCEMHS’s vision is to continue to develop and update a regional transportation evacuation
plan that adds to and complements existing emergency preparedness plans. This strategy
contains a summary of transportation options in the event of an evacuation, including
evacuation routes out of the area, fuel and food supply provision routes to the area, shelter
provisions, flexible and static signage, use of various Intelligent Transportation Systems (ITS)
such as radio communications, traffic signal coordination, etc., and law enforcement.
COTA also coordinates closely with the Franklin County Emergency Management Agency
(FCEMA) and Chemical Emergency Preparedness Advisory Council (CEPAC) on evacuation

2017-2021 SRTP
180
training in the event of an emergency. This training has included an annual simulated plane
crash at Port Columbus International Airport, Rickenbacker Air Base, or Bolton Field. In
addition, COTA has been involved in several emergency evacuations (actual and simulated) in
Franklin County in recent years.
During disaster events, it may become necessary to protect citizens by moving or relocating
them from areas of the county that are threatened to areas that are more secure. Conducting
these types of movements is COTA’s primary responsibility as Franklin County’s #1 Emergency
Support Function (ESF) Transportation Coordinator, assisted by support agencies charged
through an ESF as part of the Franklin County Emergency Operations Plan.
“ESF 1 Transportation” is responsible for management of transportation systems and
management of transportation infrastructure during threats or in response to actual incidents.
Activities under this ESF are directed by the Franklin County Emergency Management Agency
and COTA with support from many other transportation industry entities. Transportation
encompasses all transit surface modes, including land-based wheeled vehicles, trucks, and
buses traveling on streets, roads, highways, and bridges; air travel, rail routes; transportation
infrastructures (roads, routes, and bridges) and assets that move people and supplies in and
out of Franklin County.
ESF 1 presents a coordinated approach to manage surface transportation support, services,
and infrastructure essential for emergency response, and to provide public transportation to
temporarily replace or augment services affected in an emergency. It is also responsible for
restoration of the transportation infrastructure following a public emergency and for ensuring
the existence of routes designed to promote the movement of goods, services, equipment, and
personnel toward emergency staging areas and any emergency location.
Evacuation will be undertaken when it is perceived that there is or may soon become an
unacceptable level of risk to health and/or safety of people in a given area.
In March 2013, COTA purchased a mobile EOC to
enhance the effectiveness of COTA’s emergency
response for assistance to Franklin County
Emergency Responders. The Emergency
Management and Homeland Security Agency
identified COTA as the Transit Coordinator for
Franklin County. COTA personnel are responsible for
contacting and assigning other agencies to assist in
evacuations while tracking the number and types of
vehicles, personnel, and assignments involved. The
Mobile EOC is equipped with radios for
2017-2021 SRTP
181
communication with COTA personnel and other agencies, chalkboards, a meeting room,
computers, and other equipment, which will improve communication in and response to
emergencies. COTA plans to replace the mobile EOC in 2020.
COTA is the transportation representative of the Ohio Department of Homeland Security’s
(ODHS) Border/Transportation Security Chemical, Biological, Radiological, Nuclear, and
Explosive (CBRNE) Advisory Committee. The object of this committee is to review and revise
all policies and procedures to protect the borders of Ohio from attacks via waterways, land, or
air. The committee participants include but are not limited to the ODHS, Ohio State Highway
Patrol, Ohio Department of Natural Resources, TSA, Amtrak, CSX Transportation, Norfolk
Southern Railroad, Ohio Central Railroad, Ohio National Guard, Franklin County Sheriff,
Columbus Division of Fire Bomb Squad, Columbus Division of Police, and the United States
Coast Guard.
To help minimize crime and provide increased security for passengers, employees and
facilities, COTA is exploring the possibility of establishing a transit police department either
within the Authority or within the Columbus Police or Sheriff’s Department. The Authority will
analyze crime statistics between the City of Columbus and COTA’s service area; crimes
committed on COTA coaches and property compared to similar crimes at other agencies; and,
determine what additional personnel and funds are needed to protect COTA and its
customers.
In November 2006, members of COTA’s staff recommended and initiated a new Ohio Public
Transit Association (OPTA) Security Sub-Committee. This group has representatives from
every major, and many of the smaller and rural, transportation systems within Ohio. The
members provide training and development for the Security Program Plan, Emergency
Disaster and Contingency Plan, Security Tool Kit ingredients, and procedures for the National
Incident Management System (NIMS).
Specialties and best practices initiatives have been identified and shared with all transit
agencies involved in this effort. Agencies have developed key networking partners to assist in
the planning and design of their particular authority’s security program.
Since COTA’s inception, downtown Columbus has been the heart of COTA’s transit market, and
remains the largest employment center in the central Ohio region. Capital Crossroads is a

2017-2021 SRTP
182
private sector organization created by downtown property owners in 2001. Its primary
purpose is to make downtown Columbus the cleanest, safest, and most attractive commercial
area in central Ohio. Funded by more than 500 property owners, the SID serves a 32-square
block area between the Greater Columbus Convention Center and I-70. The downtown SID
Ambassadors provide safety and cleaning services to the District seven days a week.
COTA continues to be an integral funding partner to the Capital Crossroads SID project.
COTA’s participation in SID funding will protect and enhance COTA’s downtown facilities and
be a great benefit to Authority personnel and its customers. In 2015 COTA renewed its yearly
agreement with the SID, and contributed $100,000 towards providing supplemental
maintenance, security and other essential services within the District.

2017-2021 SRTP
183
The State of Ohio TIP delineates a four-year operating and capital plan. Listed in the TIP tables
on the following pages are COTA’s annual service levels, operating and capital expenses, and
anticipated financing levels.
To avoid confusion, it should be noted that although this program is designed to span four
State fiscal years (2018-2021), it actually covers five fiscal years for the Central Ohio Transit
Authority (COTA). COTA begins its fiscal year January 1, while the State of Ohio begins its fiscal
year July 1, and the Federal Government begins its fiscal year October 1. Therefore, it is
necessary for the span of this document to encompass five COTA fiscal years (i.e., 2017-2021)
in order to meet state and federal requirements of a four-year program.
A discussion of the operating and capital components of the TIP follows.
The 2018-2021 four-year TIP operating plan represents COTA’s continued response to the
growing transportation needs of the central Ohio region by providing an expanded, reliable,
and safe transit system. The following is a summary, with supporting tables, of the four-year
operating component of the TIP including years 2018 through 2021. The most recently
projected data for 2017 has also been included in each of the tables.
Table 12-1 displays the existing and projected bus hours of service. The hours of service
represent implementation of COTA’s Transit System Review (TSR) service plan. The consultant
led TSR analyzed the entire bus system and services, land use changes, the road network,
operating budget and the use of technology. The TSR Final Report recommended
improvements for positive changes to COTA’s bus service and network for the period 2015-
2017, taking into consideration the needs of central Ohio residents, riders, and businesses.
Post completion of the TSR Final Report, COTA refined the recommendations with input from
the public in 2015 and 2016. The TSR was rebranded as the Transit System Redesign in 2016.
In addition to COTA’s permanent .25% sales tax, with the overwhelming passage of COTA’s
additional 10-year renewable .25% sales tax in November 2016, the projected amount of
annual service hours COTA can afford to operate (1,250,950) will be reached by 2019, after
which COTA will not be able to expand service.
Through 2019, the TIP calls for continued, system-wide expansion of COTA’s fixed-route and
paratransit bus service. Overall, the SRTP calls for an 11.8% increase in fixed-route service
hours by 2019. As a result of the increase of fixed-route service coverage, the capital plan

2017-2021 SRTP
184
includes dollars for fleet expansion, and the Mobility Services budget includes funds for a 16%
increase in Mainstream service between 2017 and 2021. Section 7 includes a more detailed
discussion of Mobility Services and Mainstream operations.
The number of vehicle hours directly affects each year’s operating expenses. Direct cost per
hour and indirect expenses as budgeted for 2017 are included in Table 12-1. From 2017 through
2021, the direct cost per hour was increased by approximately 2.5% per year to account for
general inflation and escalating employee benefits costs. A 3.5% increase in cost per year has
been budgeted for expanded Mainstream services in order to offset inflation and increase
service hours in concert with the fixed route.
Operating revenue was estimated based on 2016 operating revenue and historical trends. In
order to keep pace with inflation and to attempt to achieve a target level of 20% farebox
recovery ratio, fare increases have been projected to take effect in 2018 & 2021. In addition,
this plan assumes that the average rate of interest on COTA’s investment portfolio will
continue to be about 1% per year from 2017 to 2021, a significantly lower return on
investment then experienced during previous SRTP cycles.
Section 12.7, the financial summary of the TIP, summarizes the various sources of revenue and
assistance and relates this income to total operating and capital expenses.
In November 1999, COTA won approval by voters to make an existing 10-year 0.25%
temporary sales tax, scheduled to expire in 2000, permanent. In November 2006, Issue 7 was
approved by voters, and created an additional ten-year renewable, 0.25% sales tax to help
fund expanded transit services described in the 2006 LRTP through December 31, 2016.
Projecting the sales tax revenue over the next five years is challenging in part due to a change
at the state level to sales tax on Premiums for Medicaid Managed Care Organizations (MCO’s).
With a removal of sales tax on the MCO’S, COTA will lose an estimated $8 million annually
beginning in July of 2017. After the removal of the MCO sales tax, the TIP analysis assumes
that the tax receipts will grow at an annual rate of approximately 3% for the years 2017 to
2021.
An outline of the Capital Acquisition Plan is provided in Table 12-2. All projects in the 2017
column have been fully funded as outlined by the Authority’s approved budget. Major capital
items in Table 12-2, such as buses, park and rides, and other facilities are described in detail in
Sections 6 and 9 respectively. Major capital items will be funded primarily with Federal
Section 5307 Urbanized Area Formula program grants and Congestion Mitigation Air Quality
(CM/AQ) funds. Total capital expenditures planned for 2017-2021 are just over $323 million.
Major components of the capital program are discussed in Section 12.5.
2017-2021 SRTP
185
Existing federal transportation bill language gives regional transit authorities the latitude to
use their Section 5307 Federal Formula Assistance on the capitalization of maintenance. This
plan assumes that Section 5307 Urban Formula assistance will be utilized for any funding
shortfall from other sources for revenue vehicle replacement and/or other qualifying capital
projects.
The total five-year Capital Acquisitions Plan is projected to cost over $323 million as identified
in Table 12-2. During this SRTP timeframe, COTA is proposing significant capital improvement
investments aimed to strengthen and provide new transit services in the central Ohio area.
Replacement of aging existing coaches and purchasing new coaches necessary to meet fixed-
route and paratransit expansion plans continues to be a priority at COTA.
In addition to the traditional FTA Section 5307 funding, COTA has programmed
federal CMAQ funds and state toll revenue credits in the regional TIP. During SFYs
2017-2021, $15.3 million in MORPC attributable CMAQ funding and state toll
revenue credits will be used towards assisting with the purchase of fixed-route
coaches;
In conjunction with the increase in fixed-route service hours during 2017-2019,
COTA will be reducing its fixed-route active fleet from 357 in January 2017 to 321
following the implementation of the TSR. The procurement process for ordering
and delivery of fixed-route coaches takes approximately 12 to 18 months. On
average, COTA will purchase approximately 28 CNG buses annually from 2017-
2021.
In 2017, 13 new uniquely branded buses for the Cleveland Avenue CMAX BRT
service will be added to the fleet with two spares. The BRT fleet will have a
separate replacement schedule due to their unique design and special branding. As
much as possible, COTA desires to maintain a “smoothing” approach to bus
purchases in order to replace vehicles in a predictable and timely manner, which
allows COTA to ramp up service levels as quickly as possible within financial
constraints; and
COTA currently utilizes 70 vehicles to operate “Mainstream”, a complementary
paratransit service for individuals who are unable to use the regular fixed-route
bus service due to a disability. As the fixed-route system changes from 2017
through 2021, and as the TSR changes are implemented, COTA anticipates
purchasing additional paratransit vehicles to accommodate expected increases in
paratransit service. As a result, the Mainstream fleet is projected to expand each
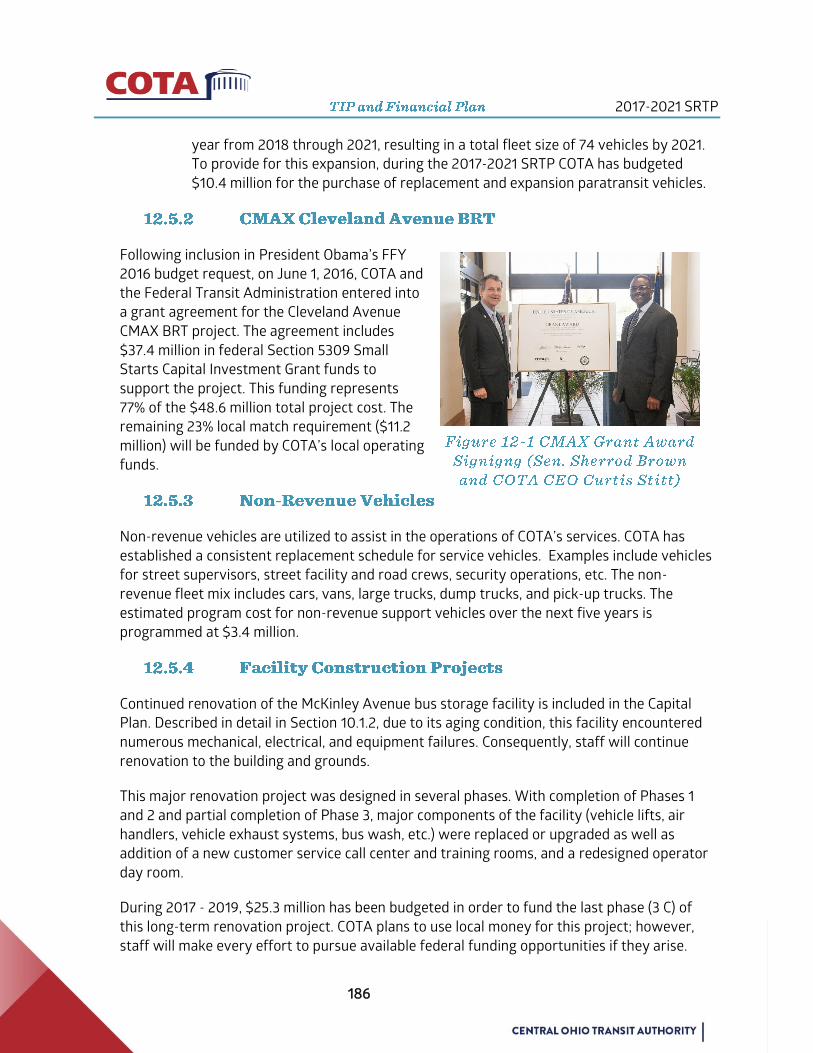
2017-2021 SRTP
186
year from 2018 through 2021, resulting in a total fleet size of 74 vehicles by 2021.
To provide for this expansion, during the 2017-2021 SRTP COTA has budgeted
$10.4 million for the purchase of replacement and expansion paratransit vehicles.
Following inclusion in President Obama’s FFY
2016 budget request, on June 1, 2016, COTA and
the Federal Transit Administration entered into
a grant agreement for the Cleveland Avenue
CMAX BRT project. The agreement includes
$37.4 million in federal Section 5309 Small
Starts Capital Investment Grant funds to
support the project. This funding represents
77% of the $48.6 million total project cost. The
remaining 23% local match requirement ($11.2
million) will be funded by COTA’s local operating
funds.
Non-revenue vehicles are utilized to assist in the operations of COTA’s services. COTA has
established a consistent replacement schedule for service vehicles. Examples include vehicles
for street supervisors, street facility and road crews, security operations, etc. The non-
revenue fleet mix includes cars, vans, large trucks, dump trucks, and pick-up trucks. The
estimated program cost for non-revenue support vehicles over the next five years is
programmed at $3.4 million.
Continued renovation of the McKinley Avenue bus storage facility is included in the Capital
Plan. Described in detail in Section 10.1.2, due to its aging condition, this facility encountered
numerous mechanical, electrical, and equipment failures. Consequently, staff will continue
renovation to the building and grounds.
This major renovation project was designed in several phases. With completion of Phases 1
and 2 and partial completion of Phase 3, major components of the facility (vehicle lifts, air
handlers, vehicle exhaust systems, bus wash, etc.) were replaced or upgraded as well as
addition of a new customer service call center and training rooms, and a redesigned operator
day room.
During 2017 - 2019, $25.3 million has been budgeted in order to fund the last phase (3 C) of
this long-term renovation project. COTA plans to use local money for this project; however,
staff will make every effort to pursue available federal funding opportunities if they arise.
2017-2021 SRTP
187
COTA will pursue sustainable development practices in the renovation of this facility in order
to achieve LEED “Silver” certification when this renovation project is completed. Additionally,
renovation of the Fields Avenue Bus Storage and Maintenance Facility and Mobility Services
buildings are planned to convert the facilities to service CNG vehicles beginning in 2017.
Within the SRTP timeframe, $36.6 million has been budgeted for these two projects.
A test track for fixed-route buses is planned to be constructed in 2018. This track will allow for
the testing of new buses and training of operators. A total of $6,000,000 is budgeted in the
SRTP capital plan.
An analysis of park and ride utilization and express service ridership were analyzed as part of
the TSR project. Low performing express lines will be discontinued or consolidated to create
fewer overall lines in the TSR network, however, the remaining express lines will have more
trips per line beginning May 1, 2017 than the existing bus network (see Section 5 for additional
details). Under-used park and ride lots are de-emphasized but most areas with express service
still have a nearby park-and-ride lot with linking express service.
During this SRTP timeframe, COTA will also:
Relocate park and ride service from a leased lot on Gender Road to a COTA-owned
park and ride site which will be constructed in Canal Winchester near Gender Road
and Winchester Pike (opening in 2018);
As part of the Cleveland Avenue CMAX BRT project, COTA will relocate the
currently leased Northern Lights Park and Ride site located within the Northern
Lights Shopping Center to a COTA-owned facility adjacent to this shopping center.
The existing leased site limits COTA to 60 park and ride spaces, sits a distance back
from Cleveland Avenue, and is inadequate to meet the demands of the proposed
CMAX Cleveland Avenue BRT service; and
In conjunction with the CMAX BRT project, a new transit center/park and ride
located just south of the Cleveland Avenue/SR-161 intersection will finish
construction in the fall of 2017.
Improving transportation capacity in the region will require investing in resources that make
transit more convenient, reliable, and responsive. These investments could include:
High capacity fixed-guideway options proposed in COTA NextGen, such as high-
level BRT or a rail based option;
2017-2021 SRTP
188
Non-fixed-guideway options such as BRT in mixed-traffic, a type of BRT service
with fewer amenities than a full BRT line;
Other capital investments that directly support transit use.
High capacity fixed-guideway alternatives are modes of transit that are reserved solely for a
specific type of mass transit vehicle. Because only transit vehicles use fixed guideways, they
allow for the quick and timely transport of people to and from key urban centers. Primary
examples of fixed-guideway transit can be divided into commuter rail, light rail transit,
streetcar, and BRT alternatives.
In total, COTA has programmed $81.8 million in the 2018-2021 TIP for strategic investment
planning and acquisitions that provide transportation options in the most congested traveled
corridors of the region.
ITS is the application of various technologies that improve information, control, and
communication systems for a region’s transportation system, including public transit.
Examples include travel information systems, traffic signal priority for emergency or public
transit vehicles, fleet maintenance systems, and numerous other applications. COTA’s ITS
applications are designed to make bus travel easier and more convenient, reduce traffic
congestion, provide timely and comprehensive transit information, improve on-time
performance, and facilitate integration of COTA’s operations into a regional transportation
network. Example components of COTA’s ITS plans include:
Passenger information systems that provide real-time bus arrival/ departure
information;
Signal priority systems that adjust traffic signal timing to expedite bus service; and
Electronic fare collection systems, which speed up passenger boarding, and
provide opportunities for riders to renew bus passes remotely, using the Internet.
ITS components already in place at COTA include:
CAD/AVL;
Onboard automated stop announcements;
APCs; and
Safety and security systems.
2017-2021 SRTP
189
During the 2017-2021 SRTP, COTA has budgeted nearly $17.6 million for various ITS project
components described in detail in Section 10. Included in the plans is the installation of COTA’s
real time passenger information, a new farebox system that includes smart card and mobile
payment technologies, and deployment of Wi-Fi on all buses for customer use. Over the next
three years, COTA will continue to work closely with the City of Columbus Smart Columbus
project team to design and implement additional new technologies that improve customer
safety and integrate COTA’s services with smart mobility options under development by the
City (multimodal payment systems, autonomous vehicles, creation of mobility hubs, etc.).
COTA’s Capital Improvement Plan includes improvements to various passenger amenities such
as installation and replacement of bus stop signs, shelters, information displays, trashcans,
etc. Investments in these amenities are designed to provide convenient, comfortable, and safe
passenger waiting areas for customers. To meet this goal, COTA has programmed $2.8 million
for associated transit improvements during the 2017-2021 timeframe. COTA will also
investigate deployment of passenger benches for bus stop locations that have insufficient
space for passenger shelters, or at stop locations that do not warrant, based on ridership,
installation of shelters.
To reach the goal of 25 million rides by 2025, COTA has developed a list of initiatives that do
not currently effect the ridership projections found in the model’s financial summary table,
Table 12-1. The current financial plan projects COTA will be able to expand fixed-route bus
service hours, the primary variable effecting ridership, through 2019. After 2019, ridership
growth will be dependent upon non-service related factors, such as population and job growth
and passenger amenities and services.
Financial models cannot accurately account for the influence of non-service related amenities
and services have on ridership, such as the affect free Wi-Fi or real-time information.
However, research suggests that these factors do promote ridership retention and growth.
Reports such as Transit Center’s “Who’s On Board 2016 ” demonstrate that the availability of
amenities such as clean, safe bus shelters, sidewalks connecting to bus stops, quality customer
service and the structure of fares drive changes in ridership.
For 2016, total ridership (fixed route network and Mainstream service) was 18.8 million rides.
Based on 2016 ridership, 6.2 million more annual rides are need to achieve the 25x25 goal. As
described in Section 8, a suite of projects and initiatives that are focused on attracting new
riders and retaining current riders to ensure COTA meets its ridership goals are currently
underway or planned. Listed below are these projects and initiatives separated into those that
are currently within the financial constraints of the 2017-2021 SRTP and those that are
proposed to be added during future updates, completed every two years.

2017-2021 SRTP
190
Included in the 2017-2021 SRTP Financial Plan:
1. CMAX BRT;
2. Improving amenities at bus stops;
3. Wi-Fi on buses;
4. Real-time signage at major stops;
5. First mile/last mile connections to difficult to serve attraction centers;
6. Flex route or feeder services;
7. Real-time passenger alerts;
8. Online customer service;
9. New fare payment system;
10. Review fare policies and potentially change fares;
11. Follow data driven service standards
12. Revisit the TSR 70 percent ridership and 30 percent coverage service allocation;
13. Update bus stop spacing standards;
14. Customer and Community Insights Program;
15. Work with developers and employers to site developments close to transit;
16. Target improvements to pedestrian infrastructure along transit corridors and
between bus stops and destinations;
17. Encourage municipalities to develop transit supportive policies, guidelines and
practices;
18. Proposed to be implemented in future planning:
19. Expanding the high-frequency network;
20. Additional limited stop service in high-frequency corridors;
21. Dedicated bus lanes on surface streets;

2017-2021 SRTP
191
22. Dedicated bus lanes or high-occupancy vehicle (HOV) lanes on highways;
23. Implementation of high-capacity corridor(s);
24. Expanding the fixed-route bus network;
25. Customer loyalty program;
26. Lifestyle/health/environmental campaigns;
27. Unique “place making” bus stops;
28. New vehicles types focused on comfort and capacity;
29. Skip stop service in Downtown; and
30. New transit centers in areas of high ridership.
Table 12-1 is a financial summary of the system, which displays COTA's projected annual fixed-
route service levels, sources of revenue, operating expenses, net capital outlays and resulting
cash balances through 2021.
Since the passage of an additional 10-year renewable 0.25% sales tax in November 2006,
COTA has initiated implementation of many transit enhancements described in the 2006
LRTP, which supported the additional sales tax request. In 2008, however, a major nationwide
economic slowdown began that negatively influenced several sectors of the economy, and led
to significantly higher unemployment rates in the region. In 2010, COTA adjusted its rate of
annual service hour expansion as described in the 2012 LRTP from 60,000 annual hours to
30,000 annual hours. Economic improvement in the last few years allowed COTA to increase
annual hours of expansion to approximately 70,000 hours per since 2015.COTA will continue
to maintain prudent management of its financial resources and a conservative projection of
future local sales tax receipts and federal and state financial assistance.
This five-year plan (2017-2021) represents implementation of recommendations that were
included in the TSR bus service plan, and takes into account numerous public and stakeholder
comments received during development of the TSR service plan. During 2017-2021, COTA
plans to continue to expand service at an annual rate of approximately 26,000 hours, leveling
off at a sustainable level of 1,250,950 hours in 2019. In addition, COTA will continue to monitor
the performance of existing routes to help ensure that the transit system is operating
efficiently and so operational resources can be allocated in the most efficient manner.
COTA's Board of Trustees and management staff will continue to work vigorously to provide
affordable, cost-effective public transit services to the citizens of Central Ohio.
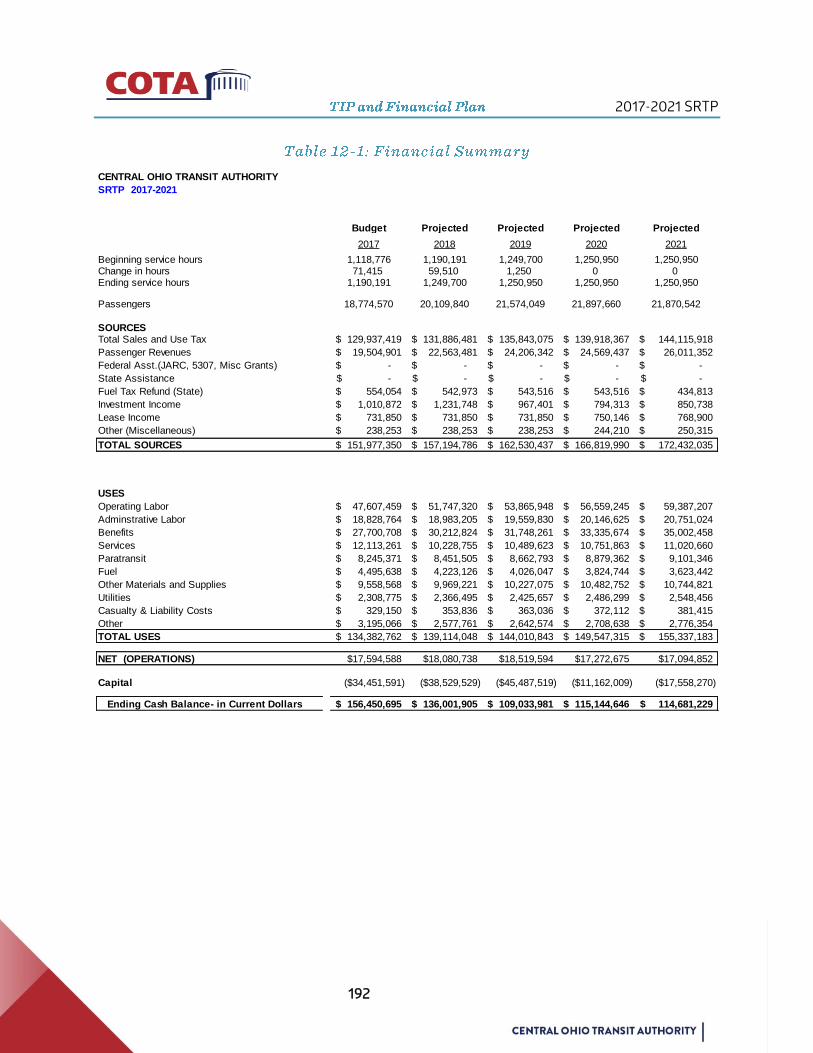
2017-2021 SRTP
192
CENTRAL OHIO TRANSIT AUTHORITY
SRTP 2017-2021
Budget Projected Projected Projected Projected
2017 2018 2019 2020 2021
Beginning service hours 1,118,776 1,190,191 1,249,700 1,250,950 1,250,950Change in hours 71,415 59,510 1,250 0 0Ending service hours 1,190,191 1,249,700 1,250,950 1,250,950 1,250,950
Passengers 18,774,570 20,109,840 21,574,049 21,897,660 21,870,542
SOURCES Total Sales and Use Tax 129,937,419$ 131,886,481$ 135,843,075$ 139,918,367$ 144,115,918$
Passenger Revenues 19,504,901$ 22,563,481$ 24,206,342$ 24,569,437$ 26,011,352$
Federal Asst.(JARC, 5307, Misc Grants) -$ -$ -$ -$ -$
State Assistance -$ -$ -$ -$ -$
Fuel Tax Refund (State) 554,054$ 542,973$ 543,516$ 543,516$ 434,813$
Investment Income 1,010,872$ 1,231,748$ 967,401$ 794,313$ 850,738$
Lease Income 731,850$ 731,850$ 731,850$ 750,146$ 768,900$
Other (Miscellaneous) 238,253$ 238,253$ 238,253$ 244,210$ 250,315$
TOTAL SOURCES 151,977,350$ 157,194,786$ 162,530,437$ 166,819,990$ 172,432,035$
USES
Operating Labor 47,607,459$ 51,747,320$ 53,865,948$ 56,559,245$ 59,387,207$
Adminstrative Labor 18,828,764$ 18,983,205$ 19,559,830$ 20,146,625$ 20,751,024$
Benefits 27,700,708$ 30,212,824$ 31,748,261$ 33,335,674$ 35,002,458$
Services 12,113,261$ 10,228,755$ 10,489,623$ 10,751,863$ 11,020,660$
Paratransit 8,245,371$ 8,451,505$ 8,662,793$ 8,879,362$ 9,101,346$
Fuel 4,495,638$ 4,223,126$ 4,026,047$ 3,824,744$ 3,623,442$
Other Materials and Supplies 9,558,568$ 9,969,221$ 10,227,075$ 10,482,752$ 10,744,821$
Utilities 2,308,775$ 2,366,495$ 2,425,657$ 2,486,299$ 2,548,456$
Casualty & Liability Costs 329,150$ 353,836$ 363,036$ 372,112$ 381,415$
Other 3,195,066$ 2,577,761$ 2,642,574$ 2,708,638$ 2,776,354$
TOTAL USES 134,382,762$ 139,114,048$ 144,010,843$ 149,547,315$ 155,337,183$
NET (OPERATIONS) $17,594,588 $18,080,738 $18,519,594 $17,272,675 $17,094,852
Capital ($34,451,591) ($38,529,529) ($45,487,519) ($11,162,009) ($17,558,270)
Ending Cash Balance- in Current Dollars 156,450,695$ 136,001,905$ 109,033,981$ 115,144,646$ 114,681,229$

2017-2021 SRTP
193
CENTRAL OHIO TRANSIT AUTHORITY
System Capital Program
SRTP 2017-2021
Fiscal Year 2017 2018 2019 2020 2021
SOURCES
State Funding 1,691,735$ 1,747,258$ 1,764,731$ 1,022,264$ 1,094,858$
Federal Funding 54,602,939$ 20,659,468$ 20,299,584$ 26,628,874$ 46,648,952$
TOTAL SOURCES 56,294,674$ 22,406,726$ 22,064,315$ 27,651,137$ 47,743,809$
USES
Fixed Route Buses- CNG 13,601,980$ 15,087,735$ 15,540,367$ 16,006,578$ 16,317,424$
Non-revenue Support Vehicles 698,100$ 691,731$ 566,183$ 811,068$ 641,400$ MMTT -$ -$ -$ -$ -$ Bus Rapid Transit 27,806,376$ -$ 2,000,000$ 10,000,000$ 35,000,000$ Tranist Centers; P&R improvements 2,028,222$ 480,000$ 350,000$ 909,727$ 2,000,000$
ITS 11,234,966$ 2,000,000$ 250,000$ 2,071,431$ 2,073,713$
Computer Hardware \ Software 5,754,398$ 2,000,000$ 3,794,349$ 3,907,610$ 4,032,459$
Facility Improvements 10,182,878$ 36,500,000$ 40,500,000$ 1,418,030$ 1,463,336$
Shop \ Other Equipment 1,021,437$ 784,926$ 808,670$ 832,809$ 859,417$
Strategic Investments- Property 3,060,000$ 1,000,000$ 1,000,000$ 1,000,000$ 1,000,000$
Paratransit Vehicles 3,238,068$ 1,976,863$ 2,314,814$ 1,415,620$ 1,460,849$
Non-Operating Expenses 11,050,000$ -$ -$ -$ -$
Transit Enhancements 1,069,839$ 415,000$ 427,450$ 440,274$ 453,482$
TOTAL USES 90,746,264$ 60,936,255$ 67,551,833$ 38,813,146$ 65,302,079$
Local Capital Requirement (34,451,591)$ (38,529,529)$ (45,487,519)$ (11,162,009)$ (17,558,270)$
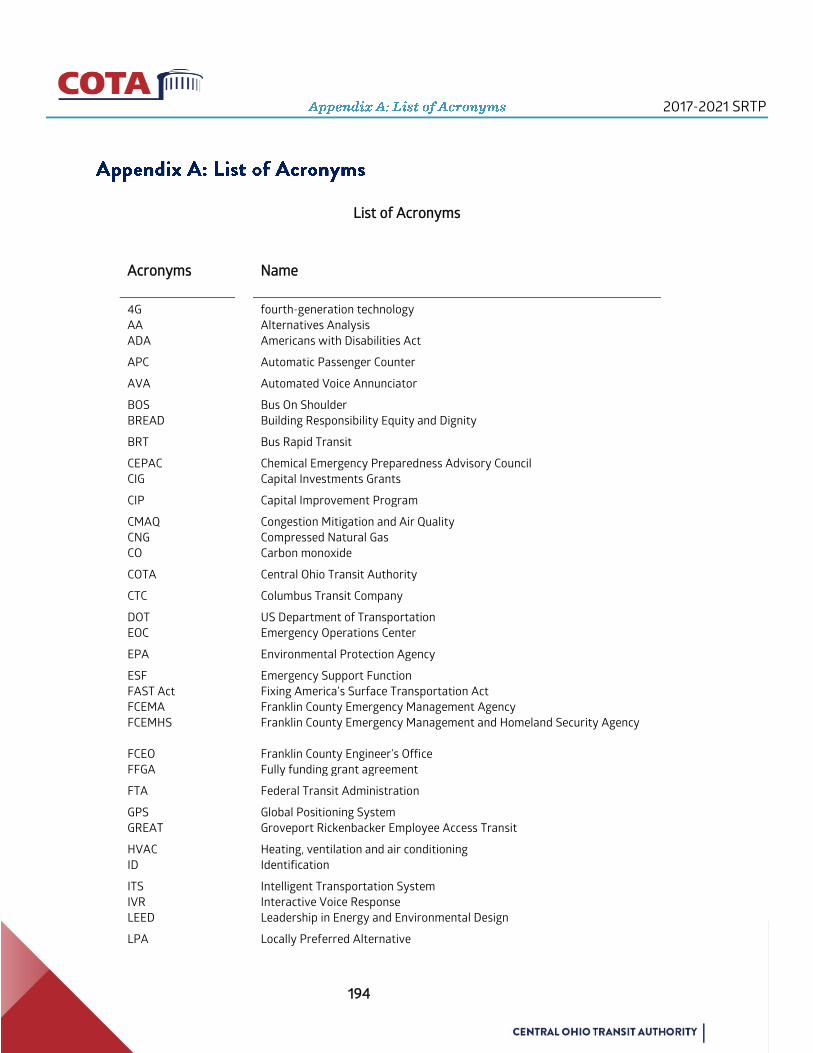
2017-2021 SRTP
194
List of Acronyms
Acronyms Name
4G
AA
ADA
fourth-generation technology
Alternatives Analysis
Americans with Disabilities Act
APC Automatic Passenger Counter
AVA Automated Voice Annunciator
BOS
BREAD
Bus On Shoulder
Building Responsibility Equity and Dignity
BRT Bus Rapid Transit
CEPAC
CIG
Chemical Emergency Preparedness Advisory Council
Capital Investments Grants
CIP Capital Improvement Program
CMAQ
CNG
CO
Congestion Mitigation and Air Quality
Compressed Natural Gas
Carbon monoxide
COTA Central Ohio Transit Authority
CTC Columbus Transit Company
DOT
EOC
US Department of Transportation
Emergency Operations Center
EPA Environmental Protection Agency
ESF
FAST Act
FCEMA
FCEMHS
FCEO
FFGA
Emergency Support Function
Fixing America’s Surface Transportation Act
Franklin County Emergency Management Agency
Franklin County Emergency Management and Homeland Security Agency
Franklin County Engineer’s Office
Fully funding grant agreement
FTA Federal Transit Administration
GPS
GREAT
Global Positioning System
Groveport Rickenbacker Employee Access Transit
HVAC
ID
Heating, ventilation and air conditioning
Identification
ITS
IVR
LEED
Intelligent Transportation System
Interactive Voice Response
Leadership in Energy and Environmental Design
LPA Locally Preferred Alternative
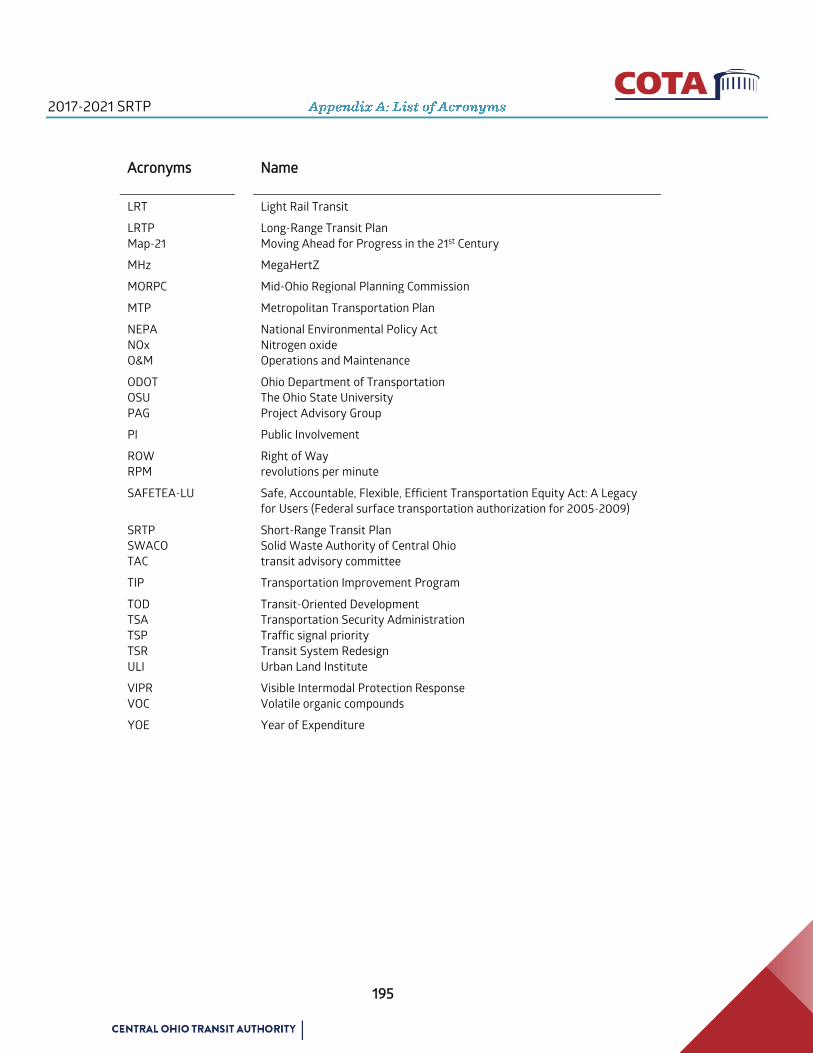
2017-2021 SRTP
195
Acronyms Name
LRT Light Rail Transit
LRTP
Map-21
Long-Range Transit Plan
Moving Ahead for Progress in the 21st Century
MHz MegaHertZ
MORPC Mid-Ohio Regional Planning Commission
MTP Metropolitan Transportation Plan
NEPA
NOx
O&M
National Environmental Policy Act
Nitrogen oxide
Operations and Maintenance
ODOT
OSU
PAG
Ohio Department of Transportation
The Ohio State University
Project Advisory Group
PI Public Involvement
ROW
RPM
Right of Way
revolutions per minute
SAFETEA-LU Safe, Accountable, Flexible, Efficient Transportation Equity Act: A Legacy
for Users (Federal surface transportation authorization for 2005-2009)
SRTP
SWACO
TAC
Short-Range Transit Plan
Solid Waste Authority of Central Ohio
transit advisory committee
TIP Transportation Improvement Program
TOD
TSA
TSP
TSR
ULI
Transit-Oriented Development
Transportation Security Administration
Traffic signal priority
Transit System Redesign
Urban Land Institute
VIPR
VOC
Visible Intermodal Protection Response
Volatile organic compounds
YOE Year of Expenditure

Appendix B: Transit System Redesign 2017-2021 SRTP
196
Appendix B: Transit System Redesign

2017-2021 SRTP Appendix B: Transit System Redesign
197

Appendix B: Transit System Redesign 2017-2021 SRTP
198
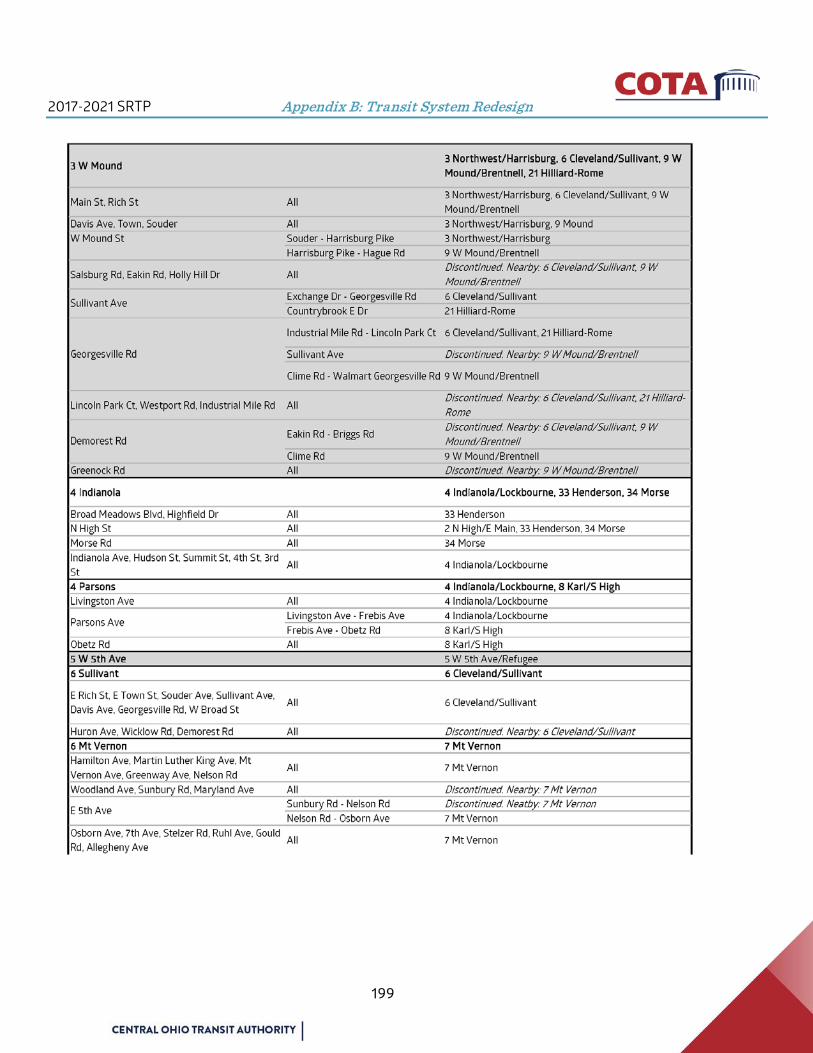
2017-2021 SRTP Appendix B: Transit System Redesign
199
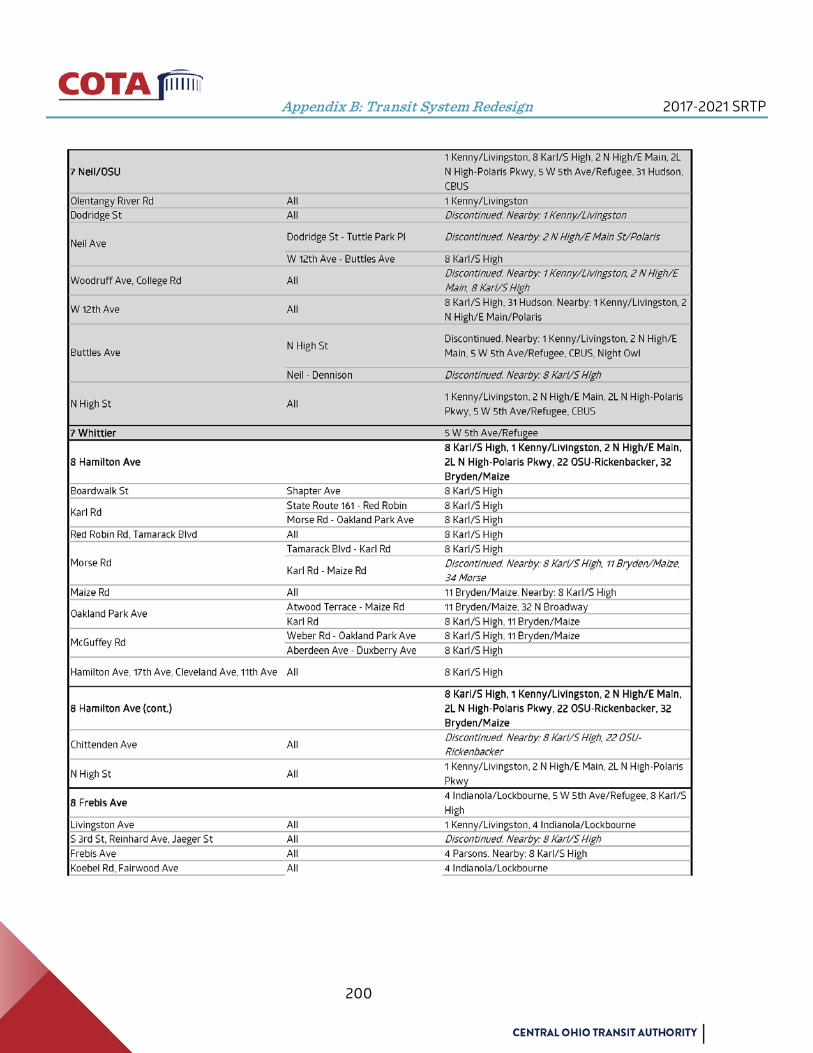
Appendix B: Transit System Redesign 2017-2021 SRTP
200
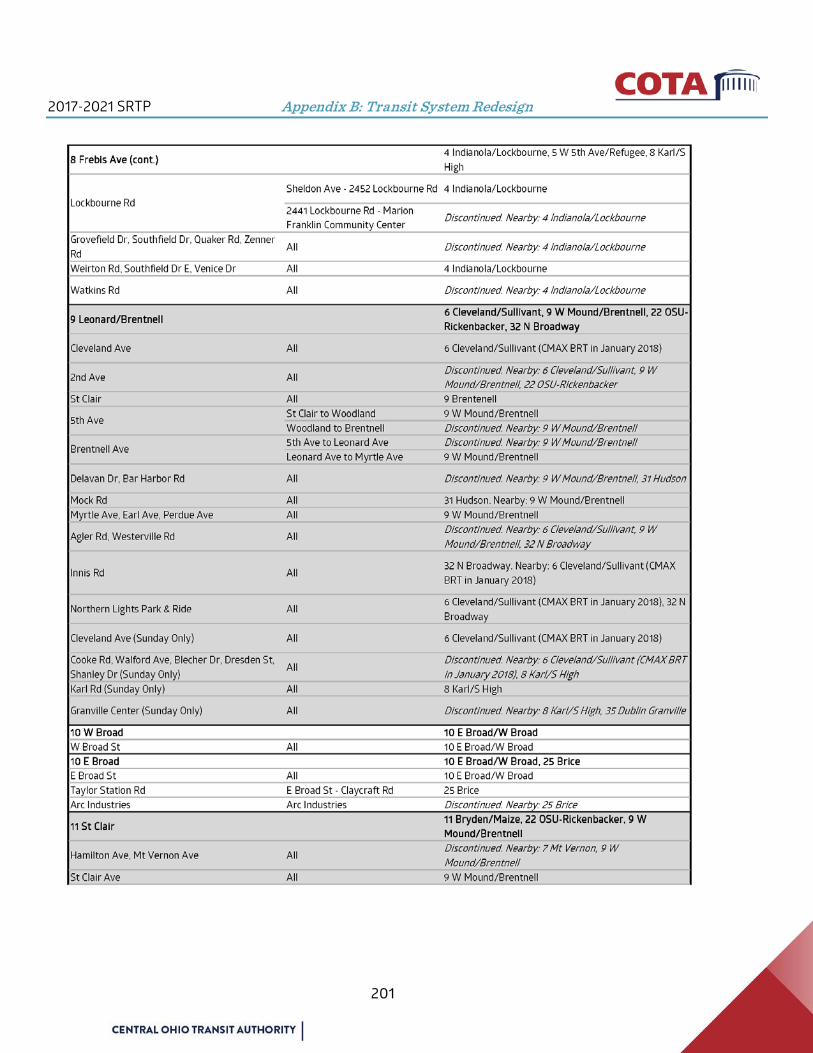
2017-2021 SRTP Appendix B: Transit System Redesign
201
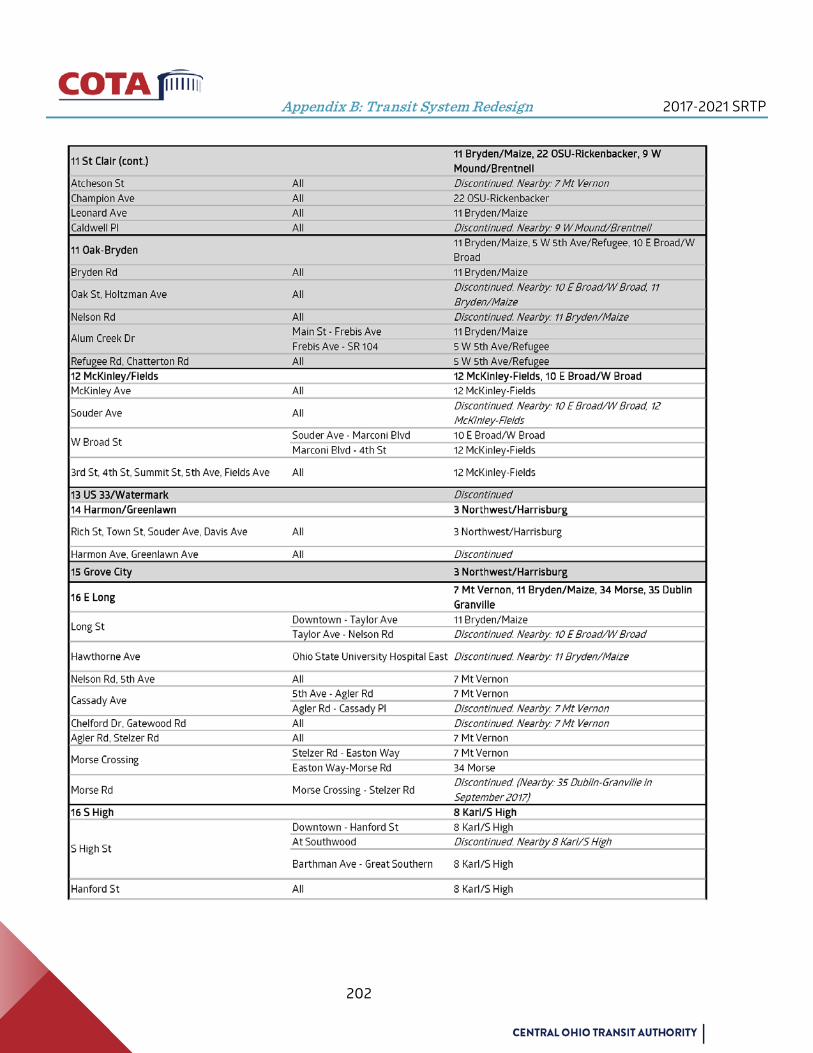
Appendix B: Transit System Redesign 2017-2021 SRTP
202
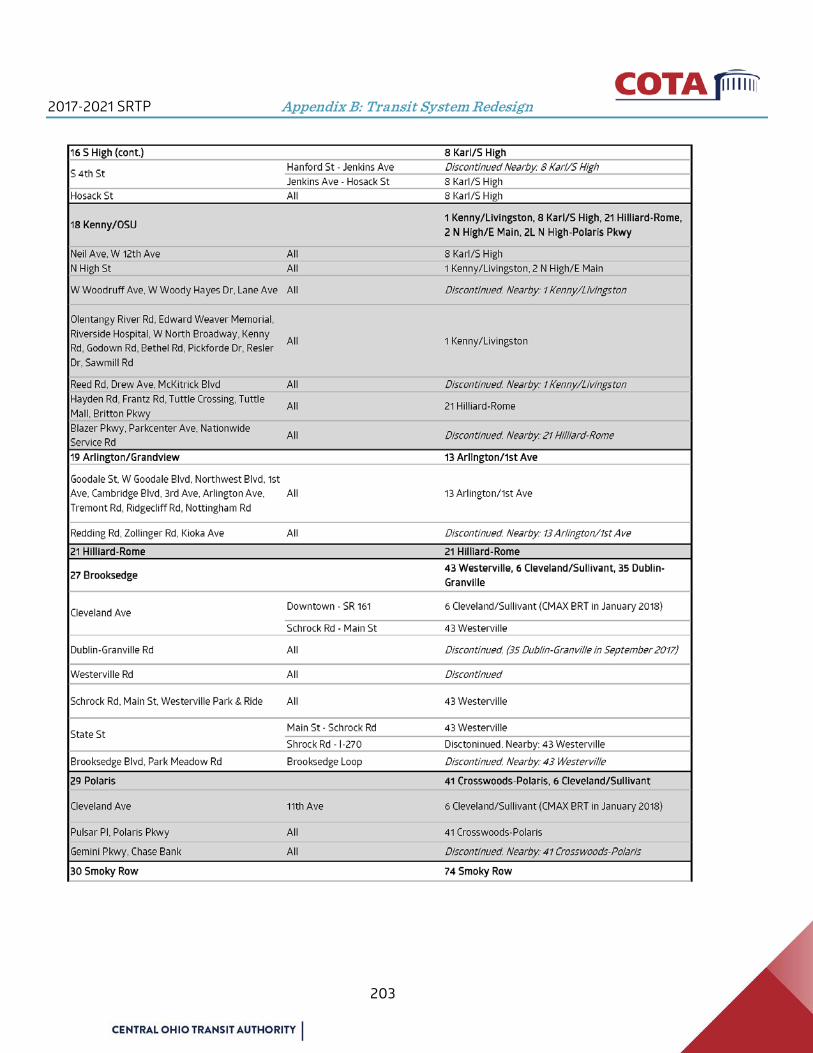
2017-2021 SRTP Appendix B: Transit System Redesign
203
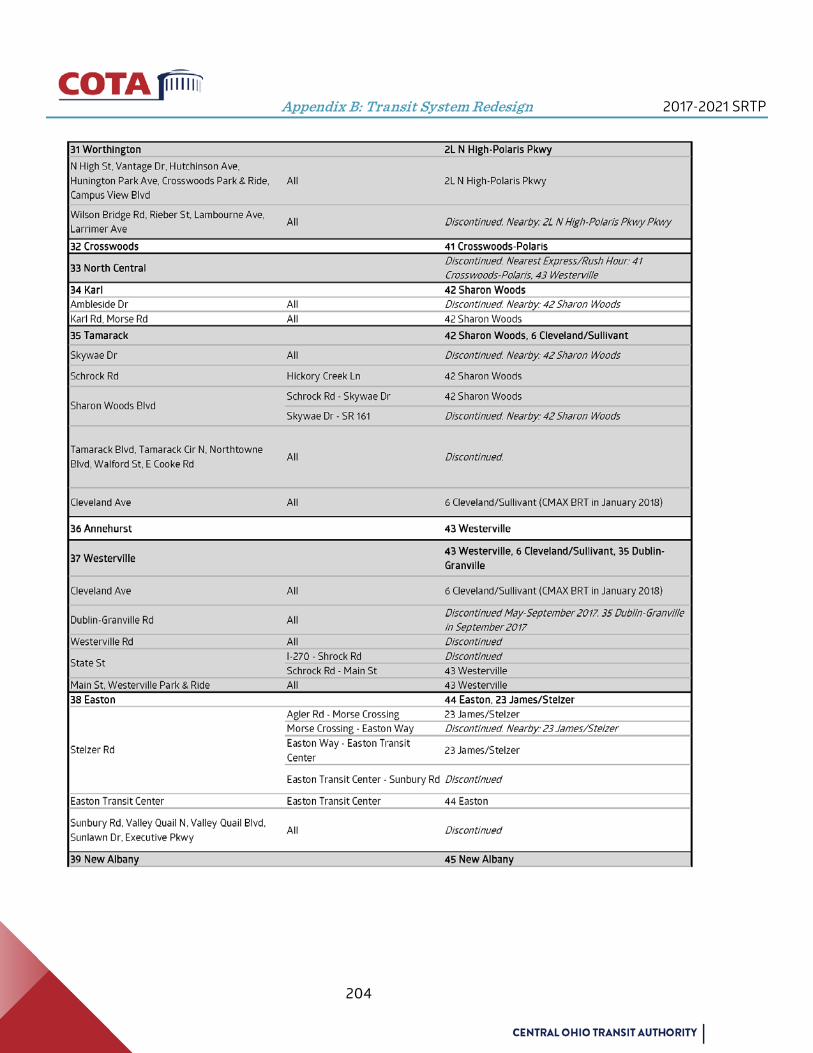
Appendix B: Transit System Redesign 2017-2021 SRTP
204

2017-2021 SRTP Appendix B: Transit System Redesign
205

Appendix B: Transit System Redesign 2017-2021 SRTP
206
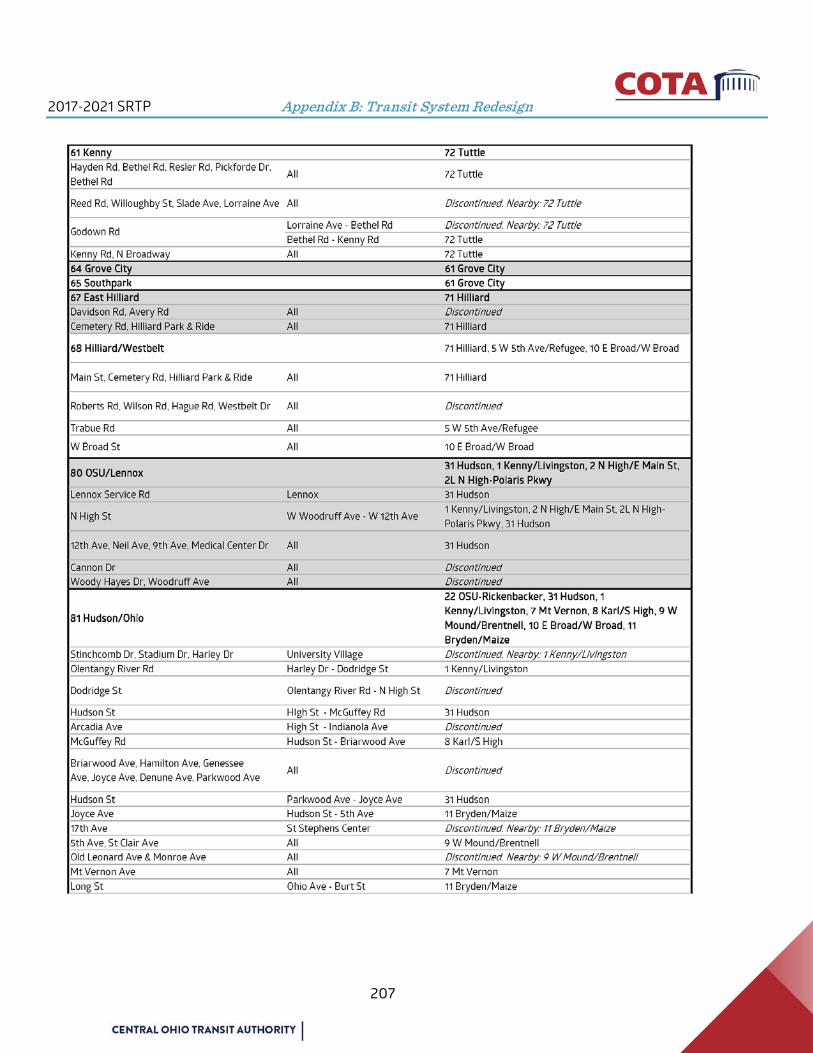
2017-2021 SRTP Appendix B: Transit System Redesign
207
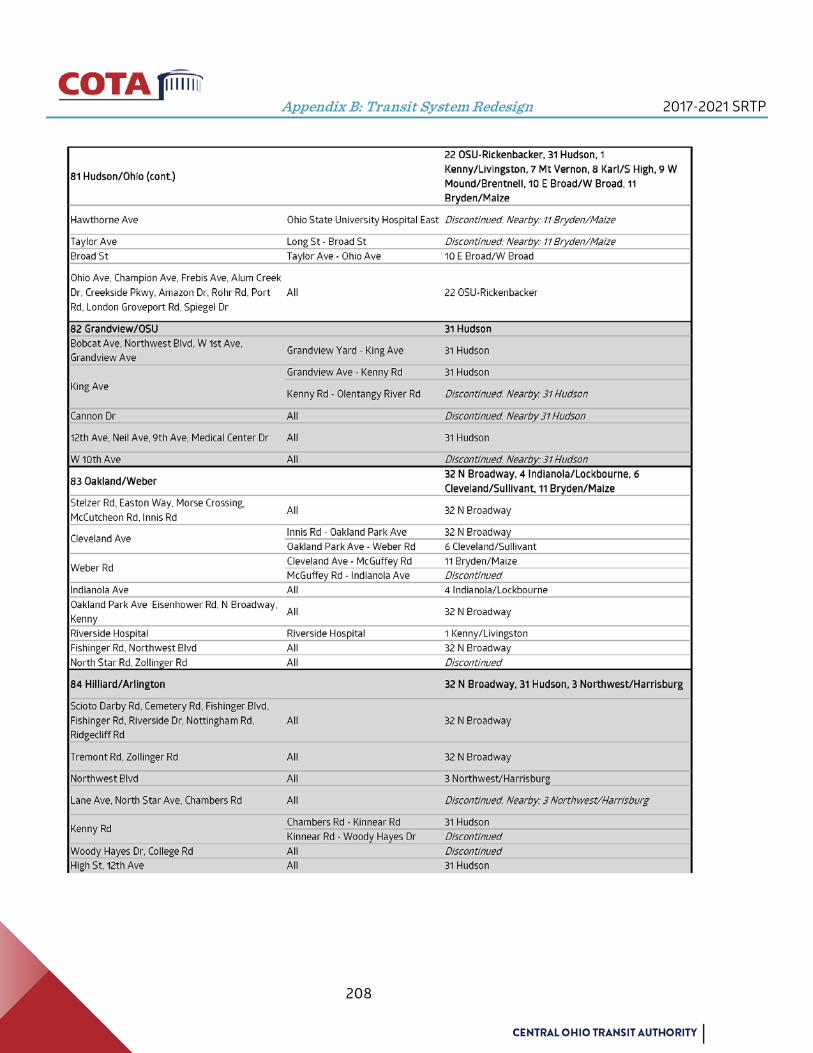
Appendix B: Transit System Redesign 2017-2021 SRTP
208
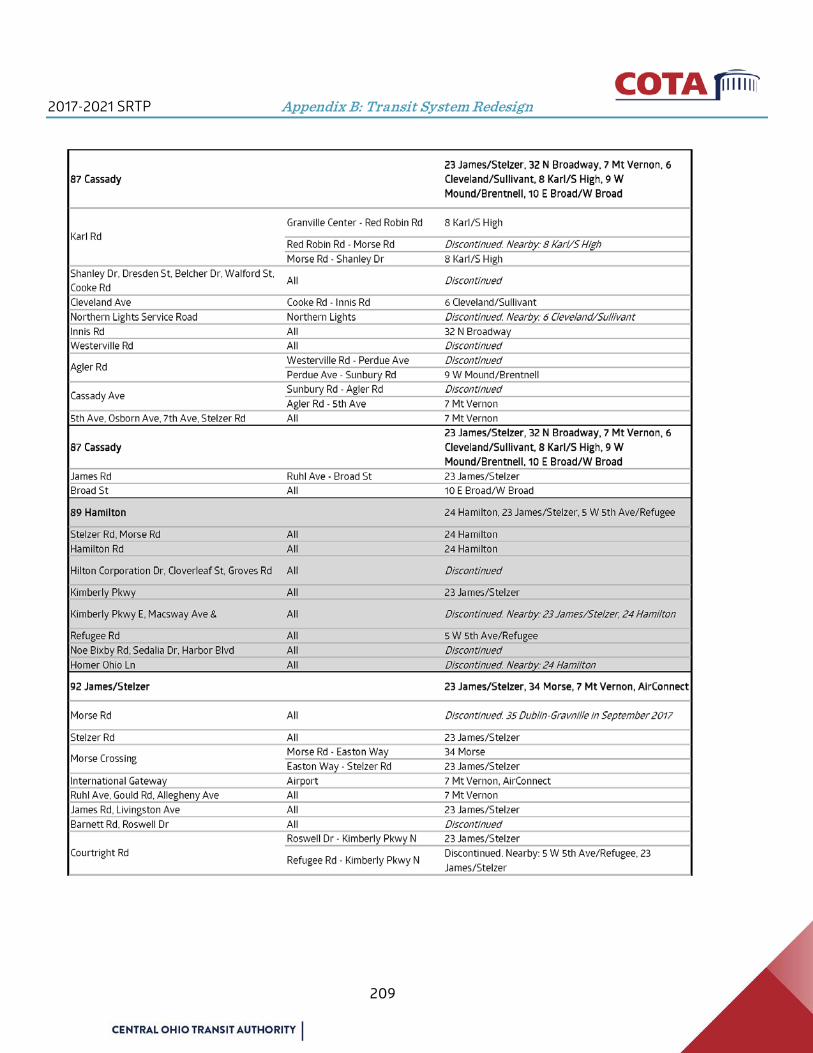
2017-2021 SRTP Appendix B: Transit System Redesign
209
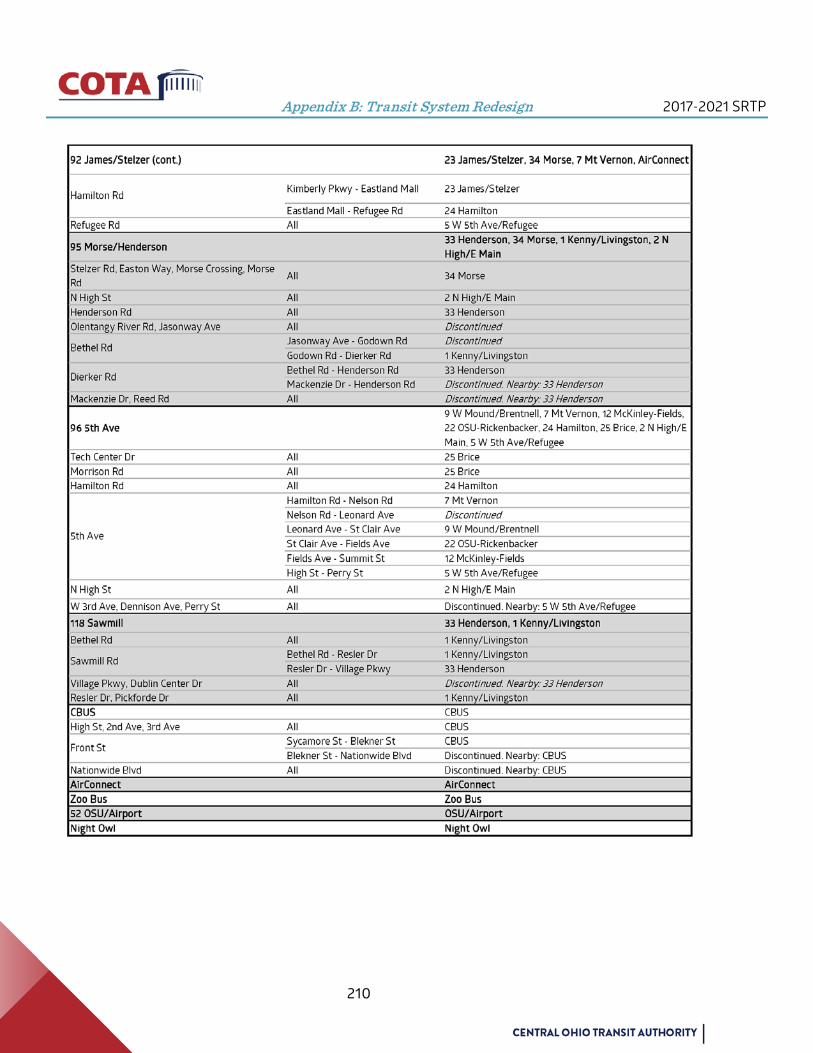
Appendix B: Transit System Redesign 2017-2021 SRTP
210
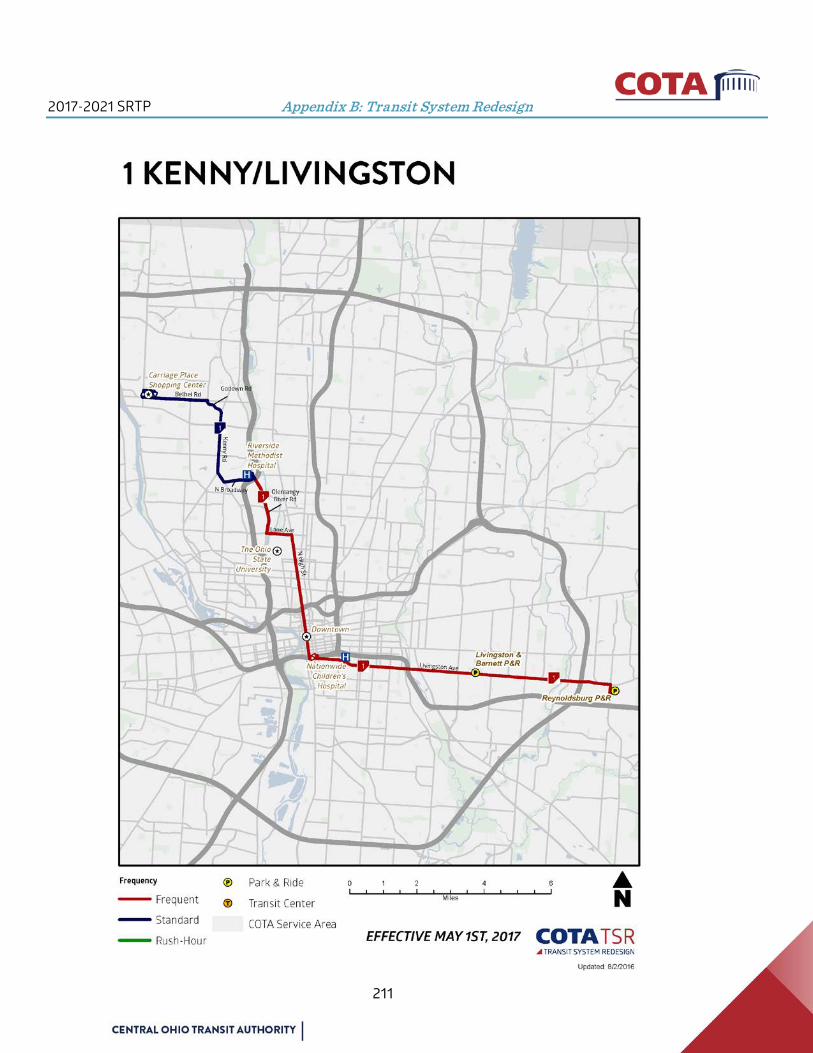
2017-2021 SRTP Appendix B: Transit System Redesign
211
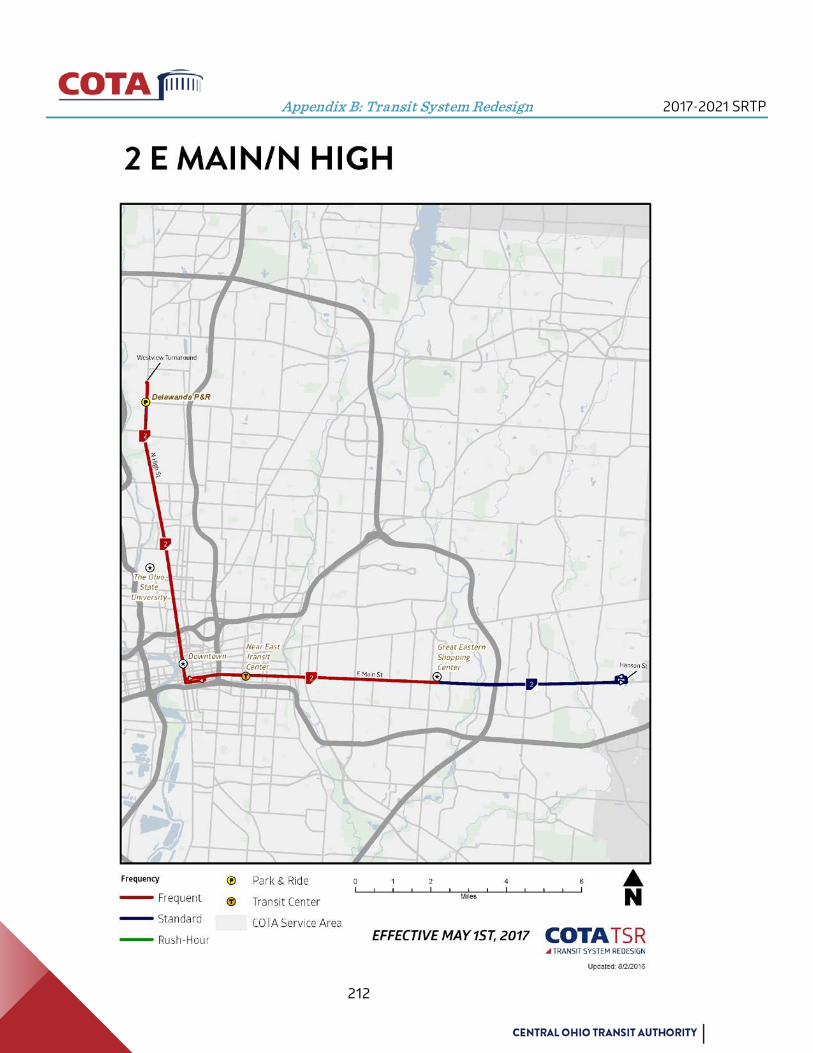
Appendix B: Transit System Redesign 2017-2021 SRTP
212

2017-2021 SRTP Appendix B: Transit System Redesign
213

Appendix B: Transit System Redesign 2017-2021 SRTP
214
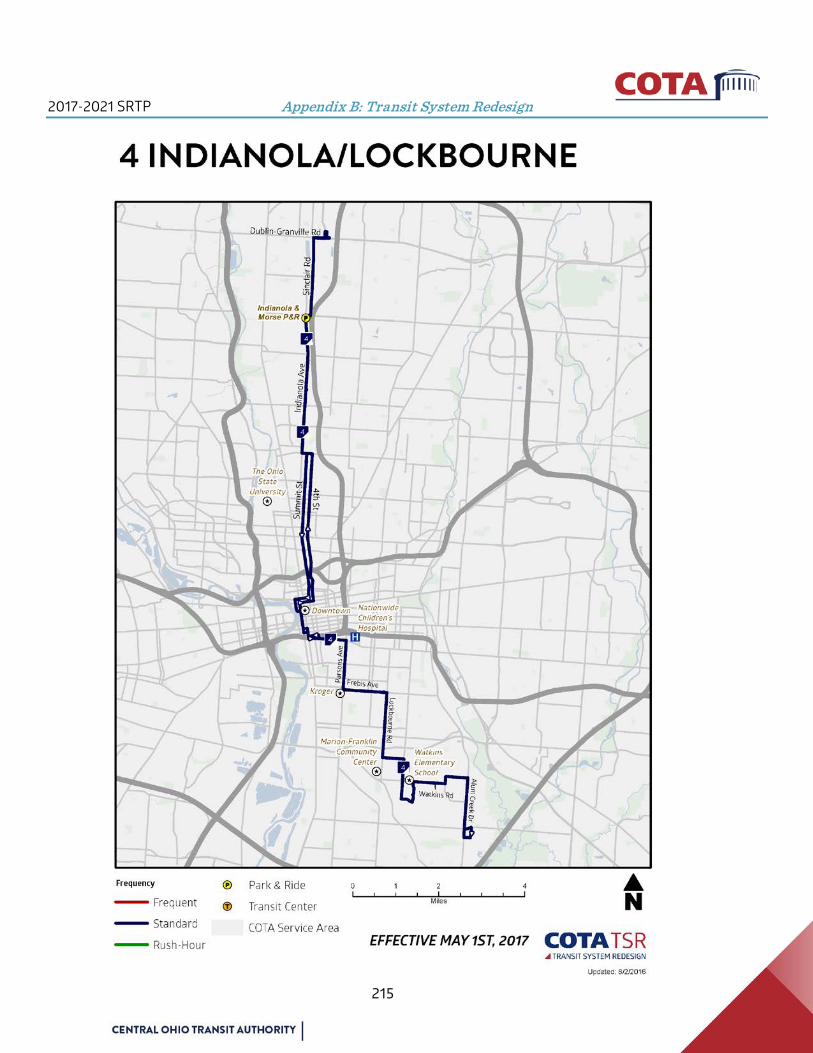
2017-2021 SRTP Appendix B: Transit System Redesign
215

Appendix B: Transit System Redesign 2017-2021 SRTP
216
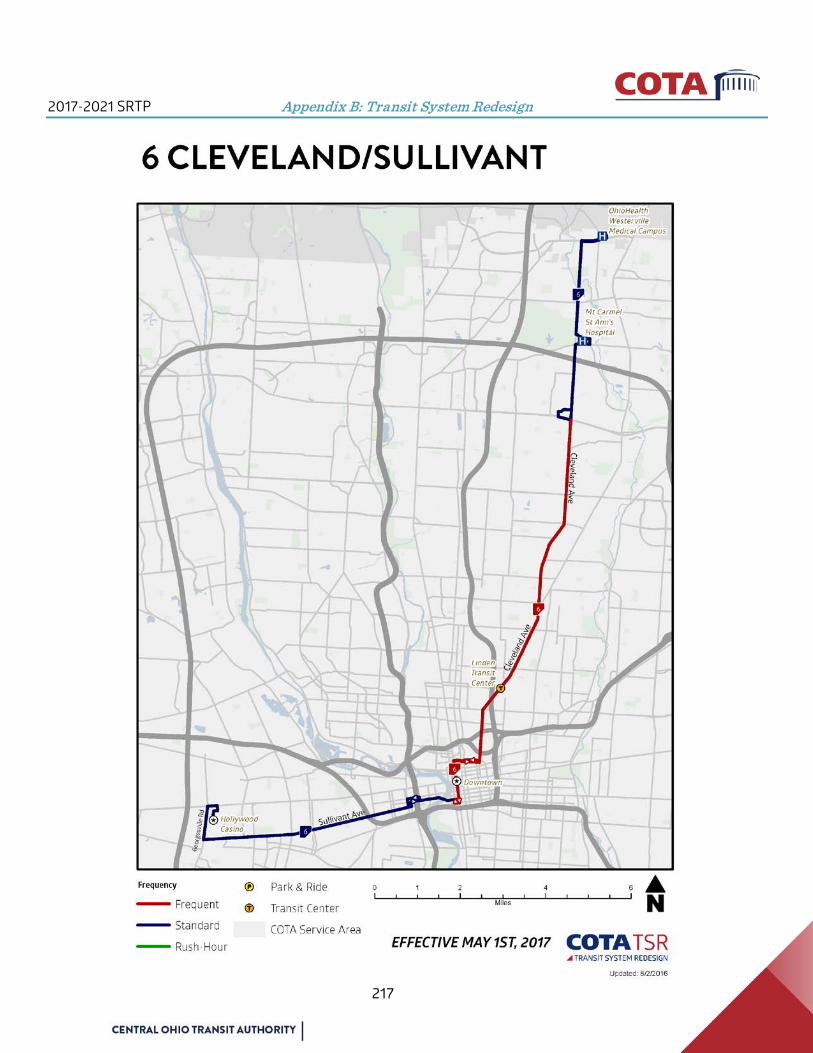
2017-2021 SRTP Appendix B: Transit System Redesign
217
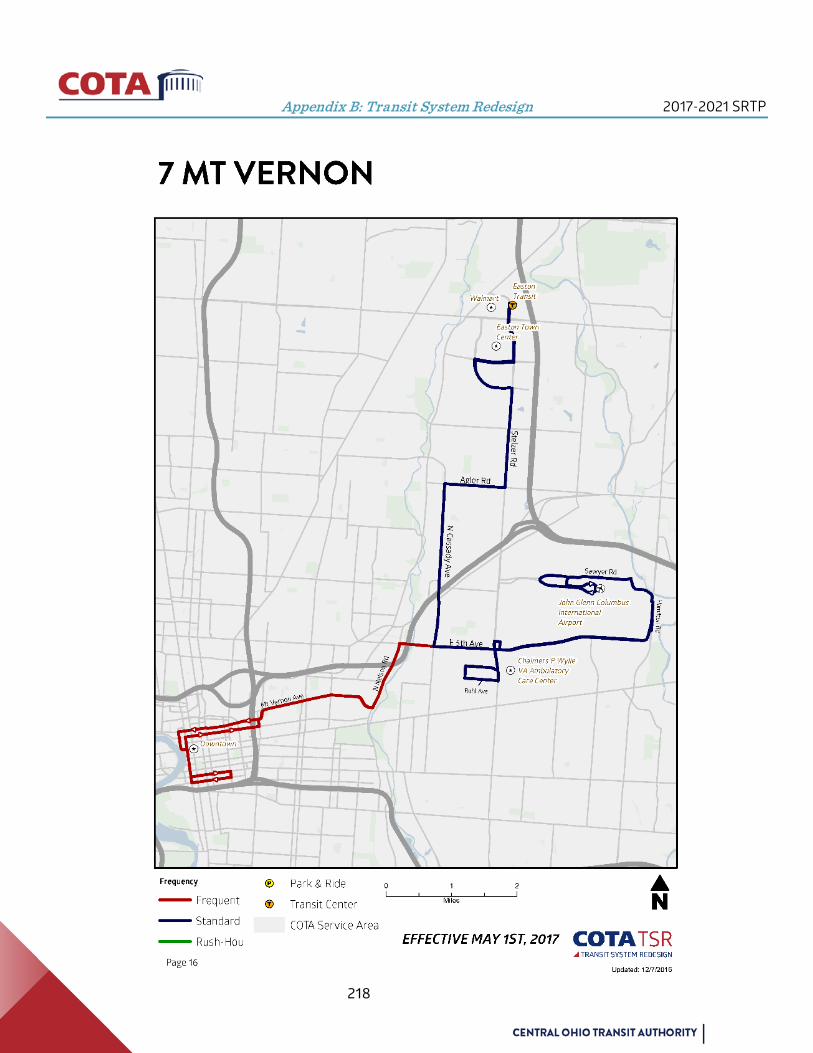
Appendix B: Transit System Redesign 2017-2021 SRTP
218

2017-2021 SRTP Appendix B: Transit System Redesign
219

Appendix B: Transit System Redesign 2017-2021 SRTP
220

2017-2021 SRTP Appendix B: Transit System Redesign
221
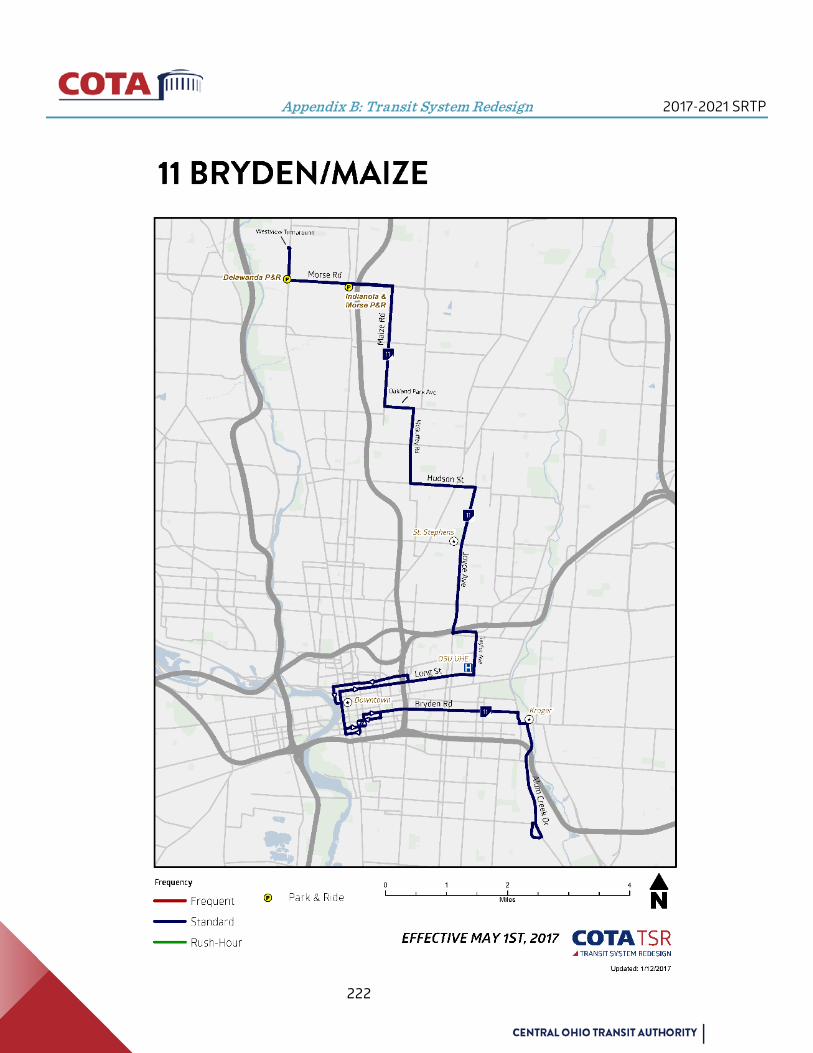
Appendix B: Transit System Redesign 2017-2021 SRTP
222
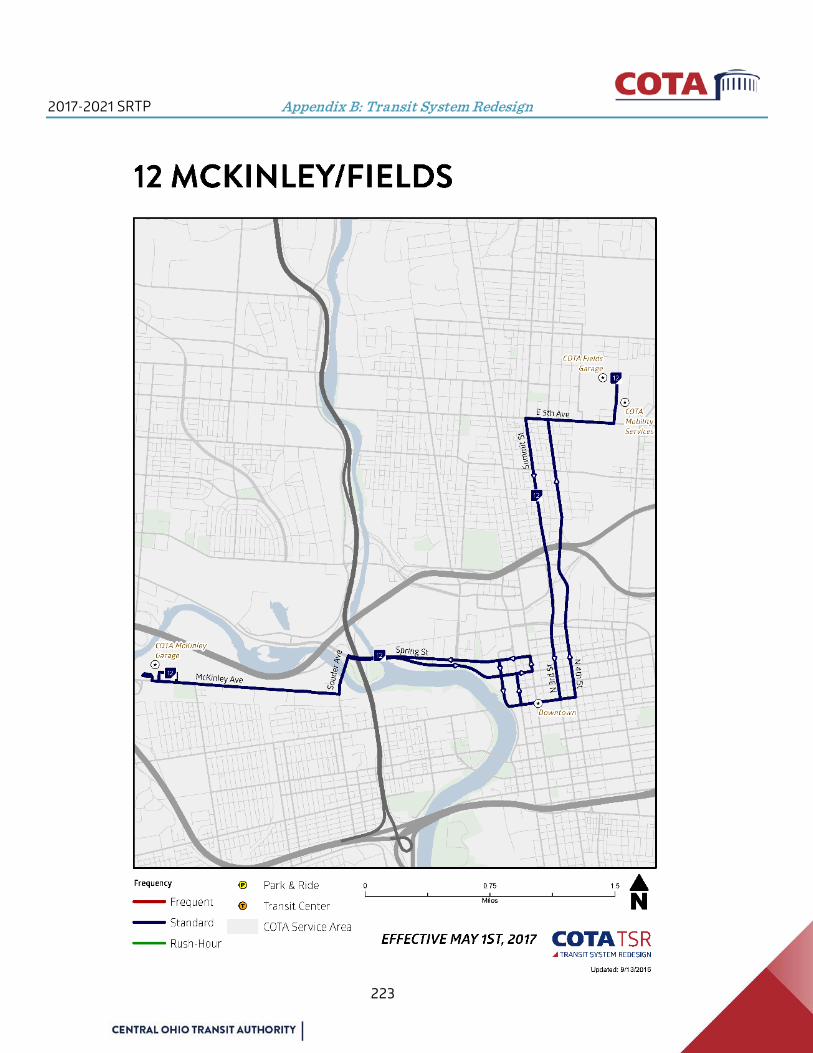
2017-2021 SRTP Appendix B: Transit System Redesign
223
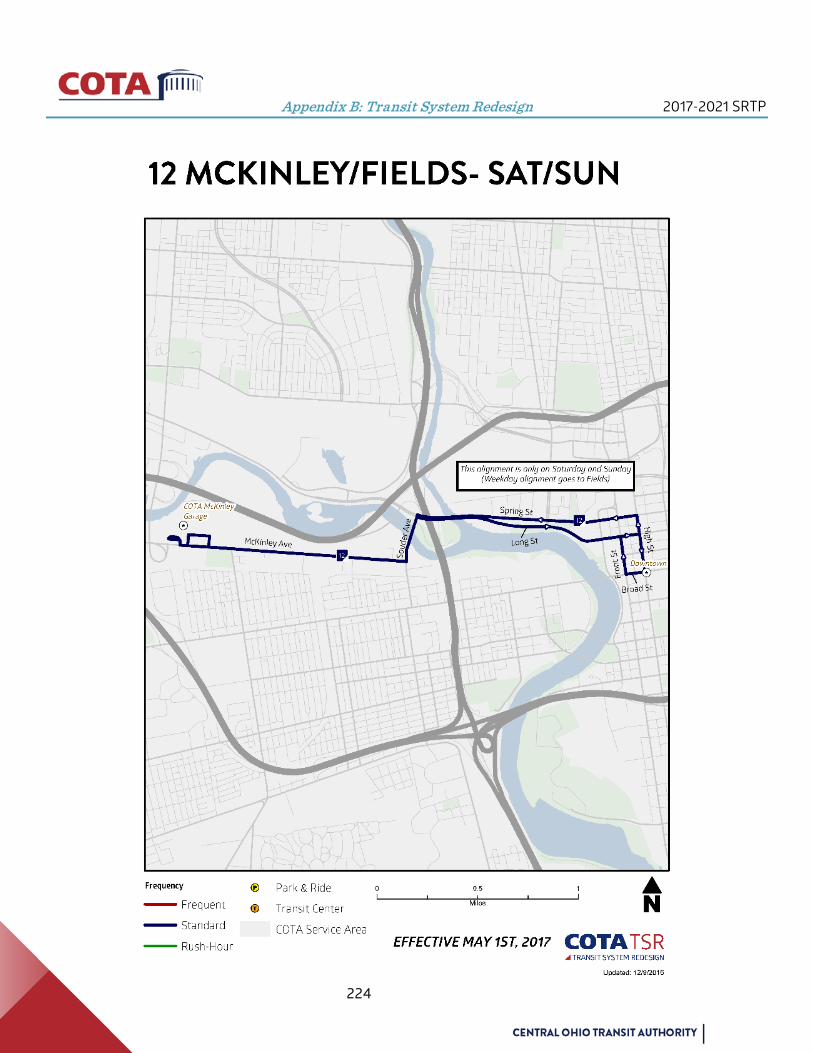
Appendix B: Transit System Redesign 2017-2021 SRTP
224

2017-2021 SRTP Appendix B: Transit System Redesign
225
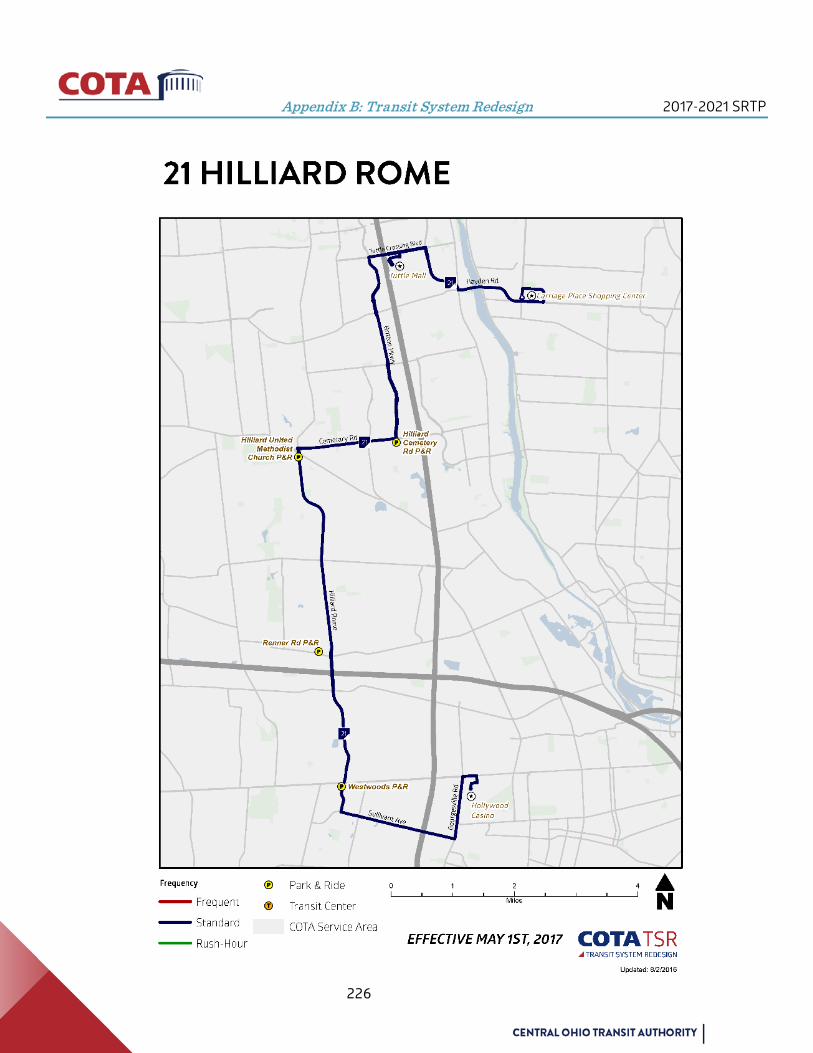
Appendix B: Transit System Redesign 2017-2021 SRTP
226

2017-2021 SRTP Appendix B: Transit System Redesign
227

Appendix B: Transit System Redesign 2017-2021 SRTP
228

2017-2021 SRTP Appendix B: Transit System Redesign
229
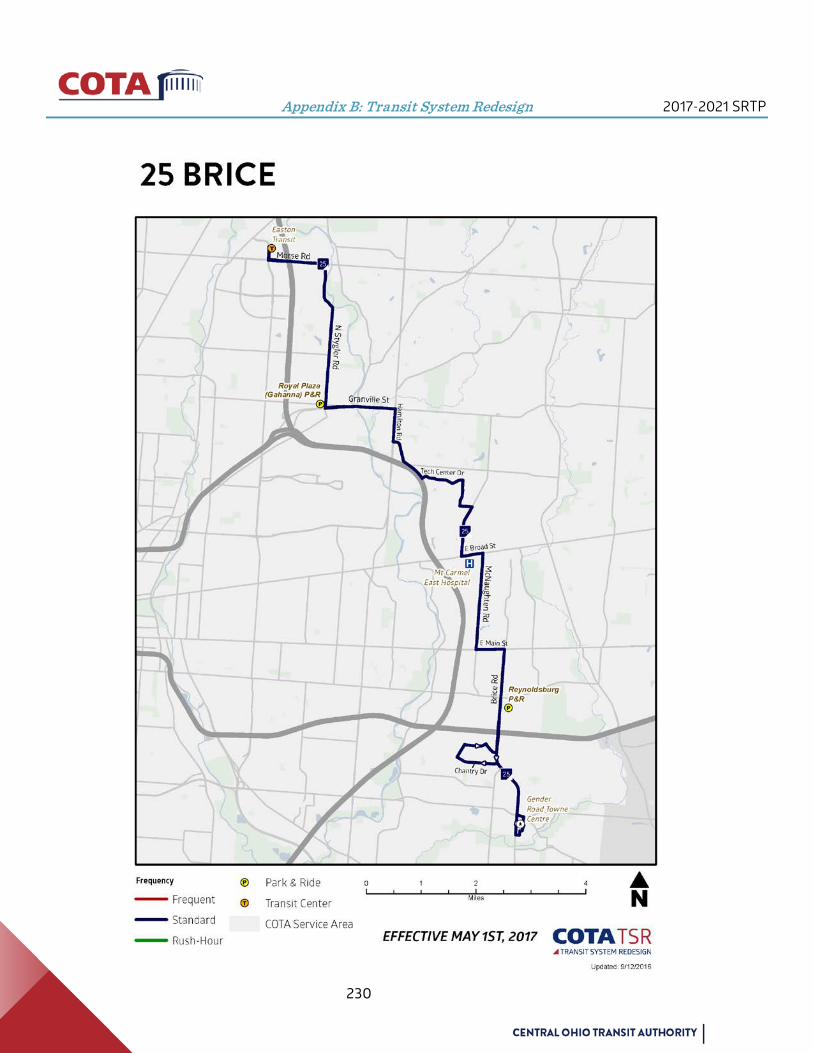
Appendix B: Transit System Redesign 2017-2021 SRTP
230
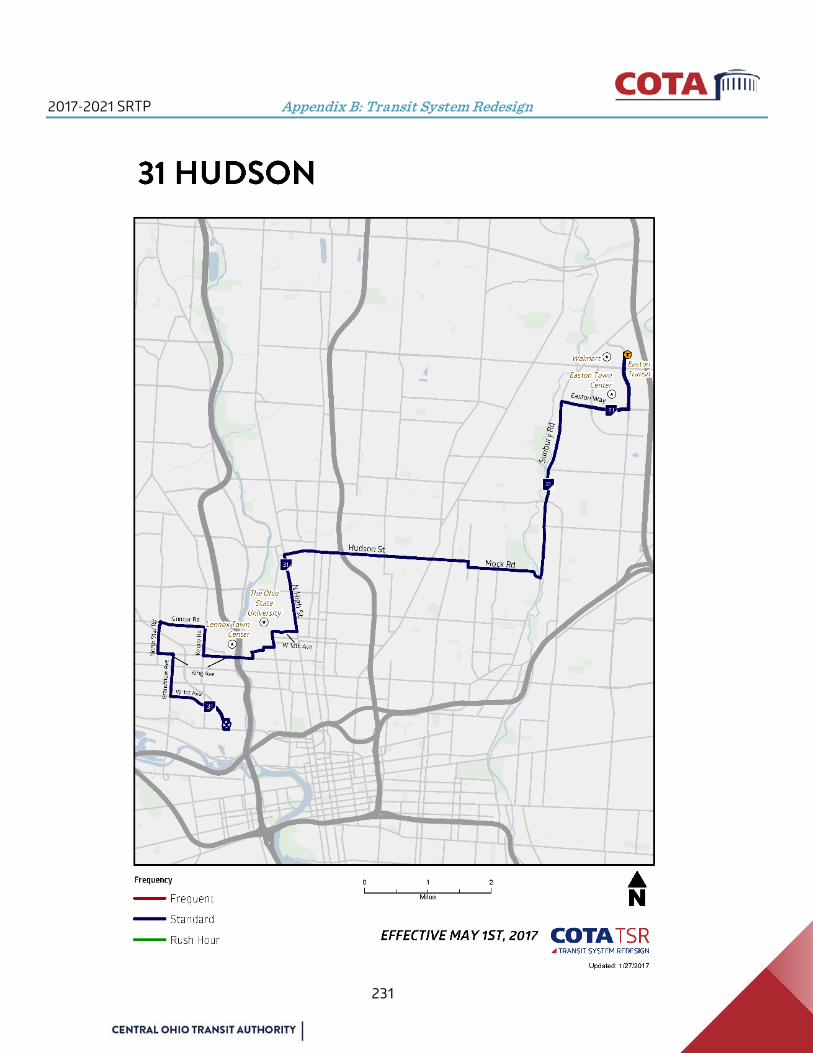
2017-2021 SRTP Appendix B: Transit System Redesign
231

Appendix B: Transit System Redesign 2017-2021 SRTP
232

2017-2021 SRTP Appendix B: Transit System Redesign
233
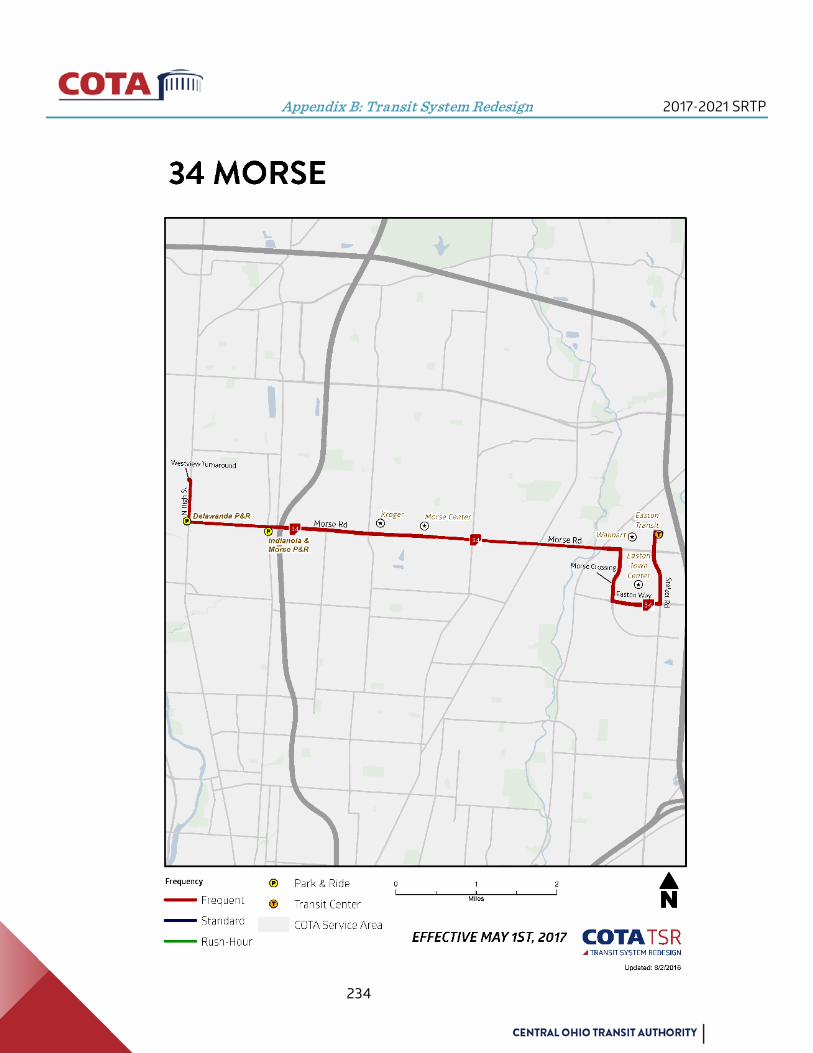
Appendix B: Transit System Redesign 2017-2021 SRTP
234
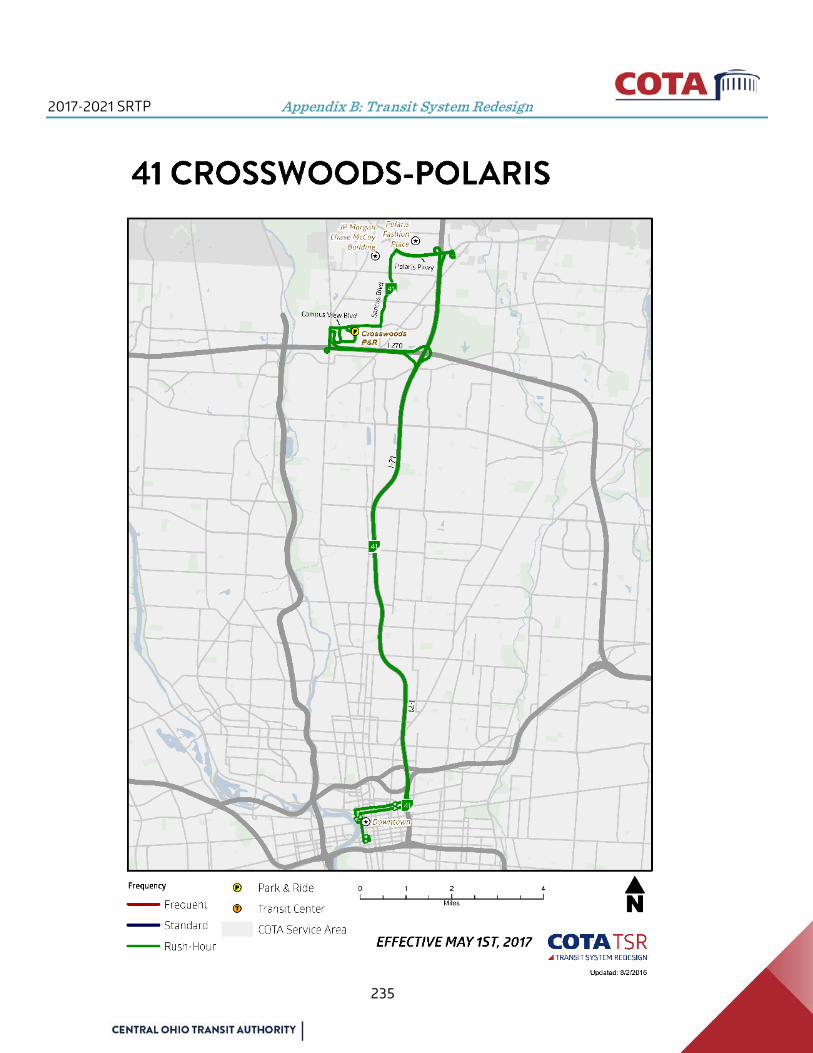
2017-2021 SRTP Appendix B: Transit System Redesign
235

Appendix B: Transit System Redesign 2017-2021 SRTP
236
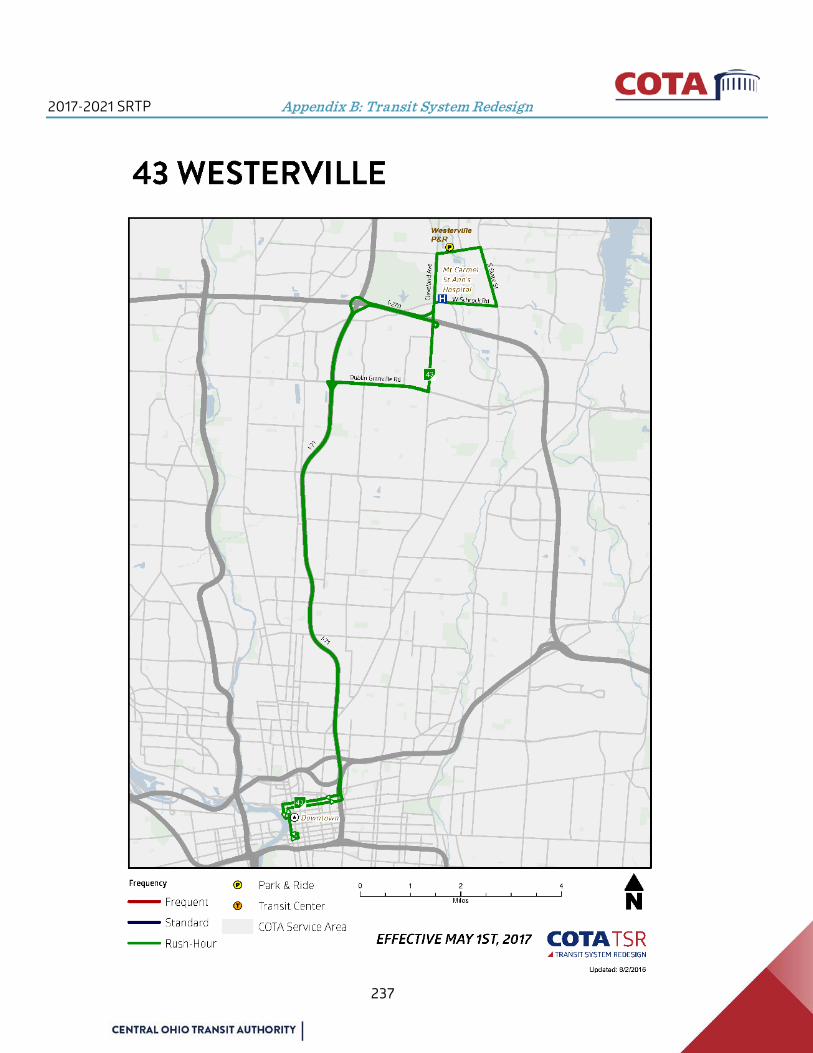
2017-2021 SRTP Appendix B: Transit System Redesign
237
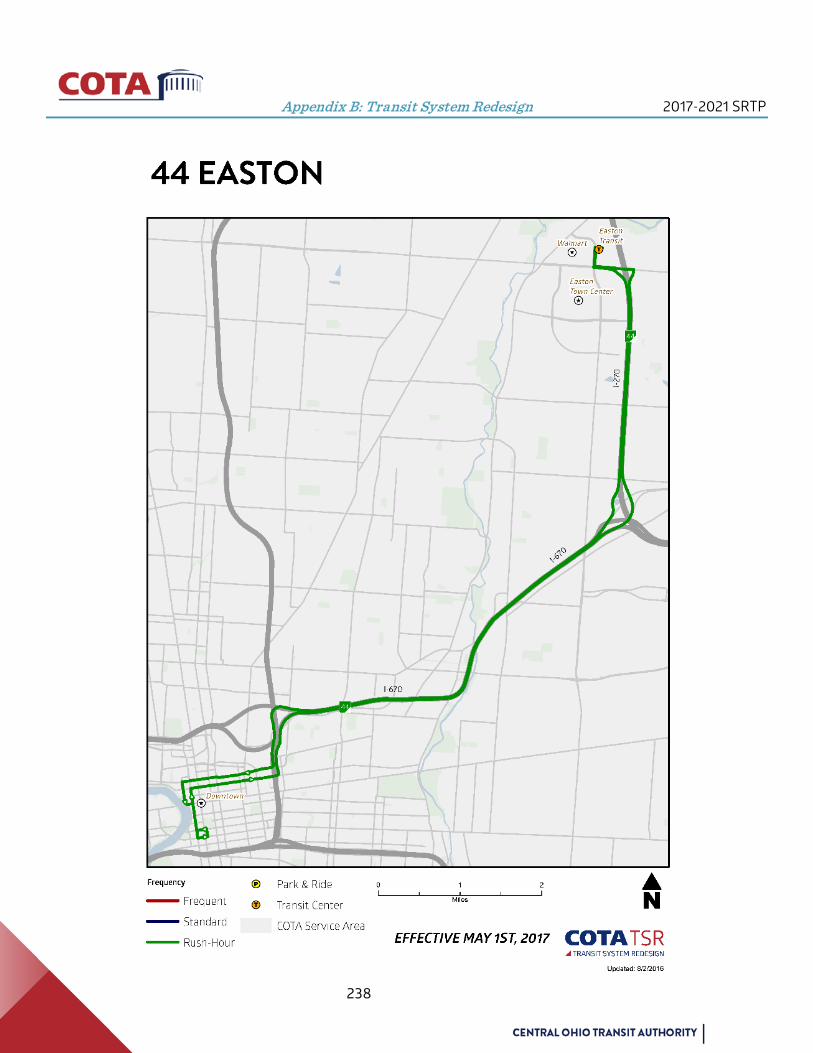
Appendix B: Transit System Redesign 2017-2021 SRTP
238
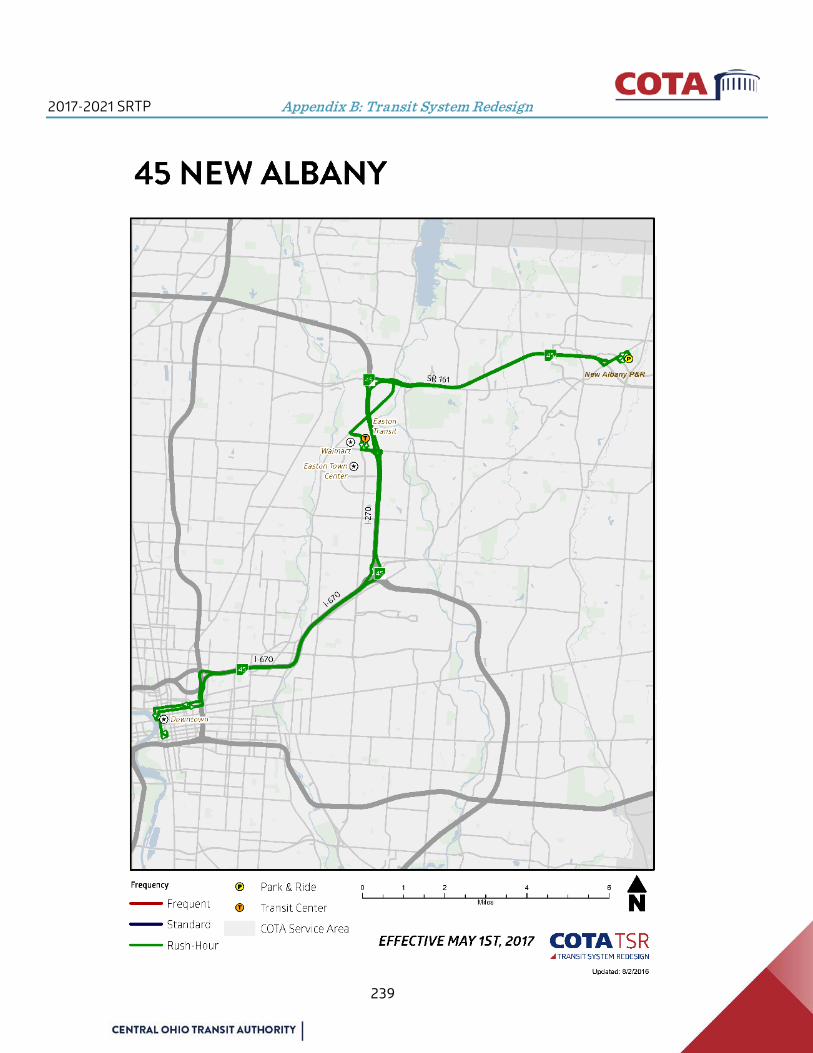
2017-2021 SRTP Appendix B: Transit System Redesign
239
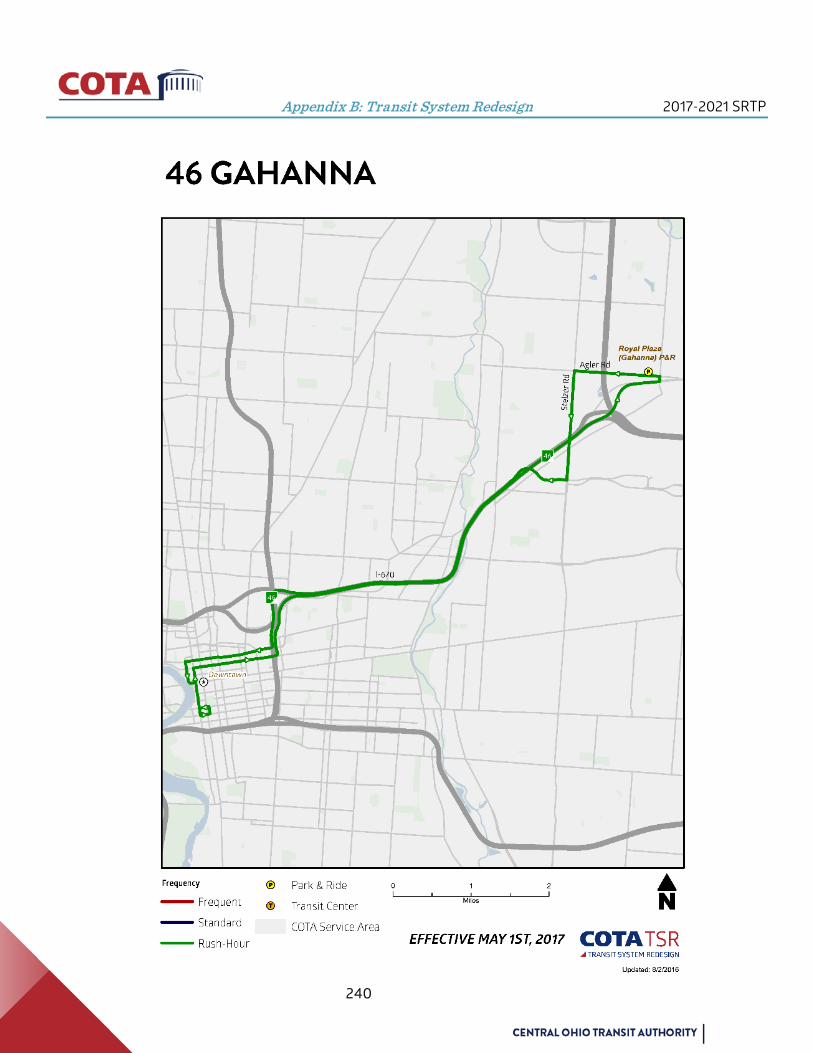
Appendix B: Transit System Redesign 2017-2021 SRTP
240

2017-2021 SRTP Appendix B: Transit System Redesign
241

Appendix B: Transit System Redesign 2017-2021 SRTP
242

2017-2021 SRTP Appendix B: Transit System Redesign
243
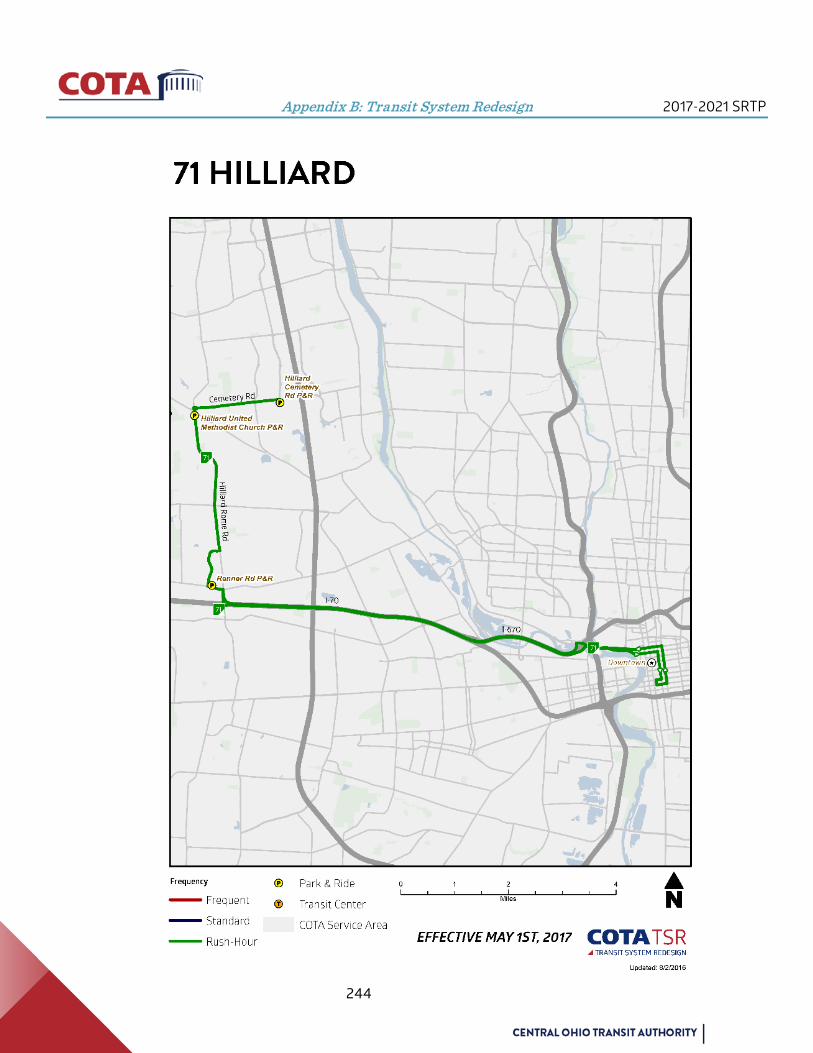
Appendix B: Transit System Redesign 2017-2021 SRTP
244

2017-2021 SRTP Appendix B: Transit System Redesign
245

Appendix B: Transit System Redesign 2017-2021 SRTP
246

2017-2021 SRTP Appendix B: Transit System Redesign
247

Appendix B: Transit System Redesign 2017-2021 SRTP
248
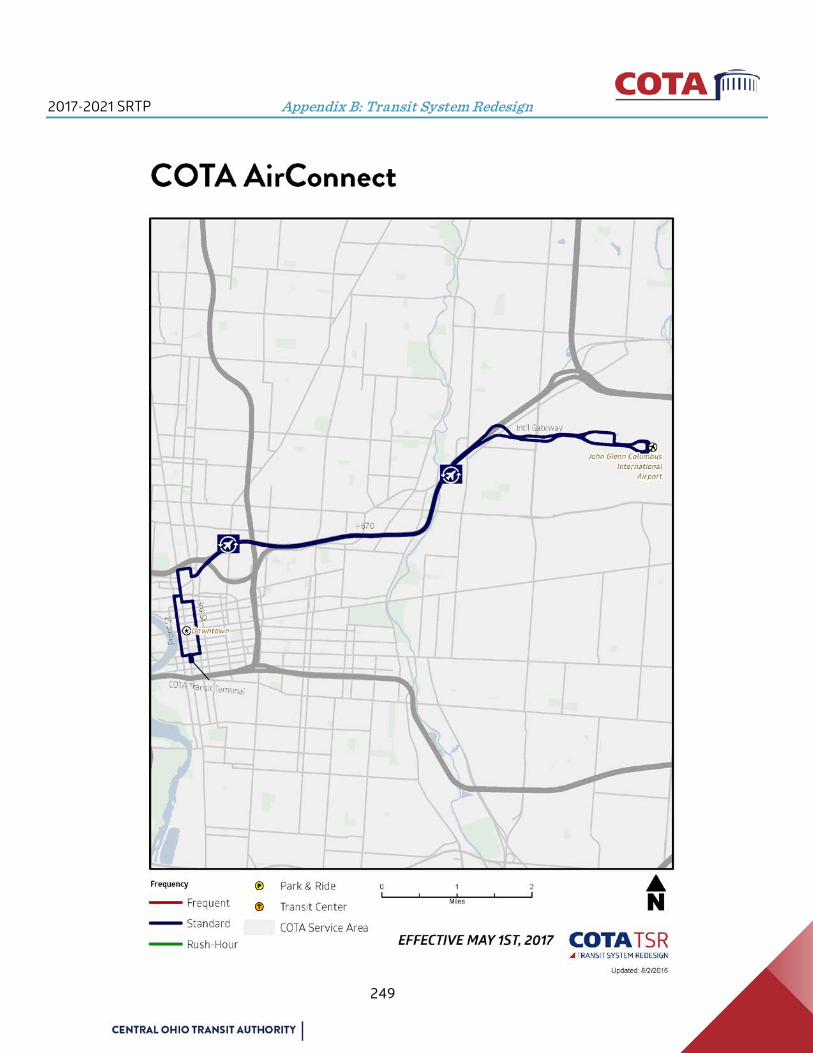
2017-2021 SRTP Appendix B: Transit System Redesign
249
Appendix C: Transit System Redesign Public Meetings 2017-2021 SRTP
250
Appendix C: Transit System Redesign Public Meetings

2017-2021 SRTP Appendix C: Transit System Redesign Public Meetings
251
Description (Event/Outreach)
Date Time Location
TSR Public Meeting 3/18/2014 12:00 p.m.
COTA; 33 N. High St., Columbus, OH 43215
TSR Public Meeting 3/18/2014 5:00 p.m. Hilliard City Hall, 3800 Municipal Way, Hilliard, 43026
TSR Public Meeting 3/19/2014 5:00 p.m. Reynoldsburg City Hall, 7232 E. Main Street, Reynoldsburg 43068
TSR Public Meeting 3/20/2014 12:00 p.m.
Northwood-High Building, 2231 N. High Street
TSR Public Meeting 3/20/2014 5:00 p.m. Worthington Holiday Inn, 7007 N. High Street
TSR Public Meeting 5/28/2014 12:00 p.m.
COTA; 33 N. High St., Columbus, OH 43215
TSR Public Meeting 5/28/2014 5:00 p.m. COTA; 33 N. High St., Columbus, OH 43215
TSR Public Meeting 5/29/2014 5:00 p.m. Columbus Metropolitan Library, Hilltop Branch, 511 S. Hague Ave, Columbus 43204
TSR Public Meeting 6/2/2014 5:00 p.m. Central Community House, 1150 E. Main Street, Columbus 43205
TSR Public Meeting 6/3/2014 5:00 p.m. Grove City, City Hall, 4035 Broadway, Grove City 43123

Appendix C: Transit System Redesign Public Meetings 2017-2021 SRTP
252
TSR Downtown Plan Public Meeting
6/4/2014 12:00 p.m.
COTA; 33 N. High St., Columbus, OH 43215
TSR Public Meeting 6/4/2014 5:00 p.m. Northwest Public Library, 2280 Hard Road, Columbus 43235
September 2014 Service Change Public Comment Meeting
6/11/2014 6:00 p.m. COTA; 33 N. High St., Columbus, OH 43215
September 2014 Service Change Public Comment Meeting
6/17/2014 Noon COTA; 33 N. High St., Columbus, OH 43215
September 2014 Service Change Public Informational Meeting
8/12/2014 Noon COTA; 33 N. High St., Columbus, OH 43215
September 2014 Service Change Public Informational Meeting
8/19/2014 6:00 p.m. COTA; 33 N. High St., Columbus, OH 43215
January 2015 Service Change Public Comment Meeting
9/16/2014 6:00 p.m. COTA; 33 N. High St., Columbus, OH 43215
January 2015 Service Change Public Comment Meeting
9/23/2014 12:00 p.m.
COTA; 33 N. High St., Columbus, OH 43215
January 2015 Service Change Public Informational Meeting
12/9/2014 12:00 p.m.
COTA; 33 N. High St., Columbus, OH 43215
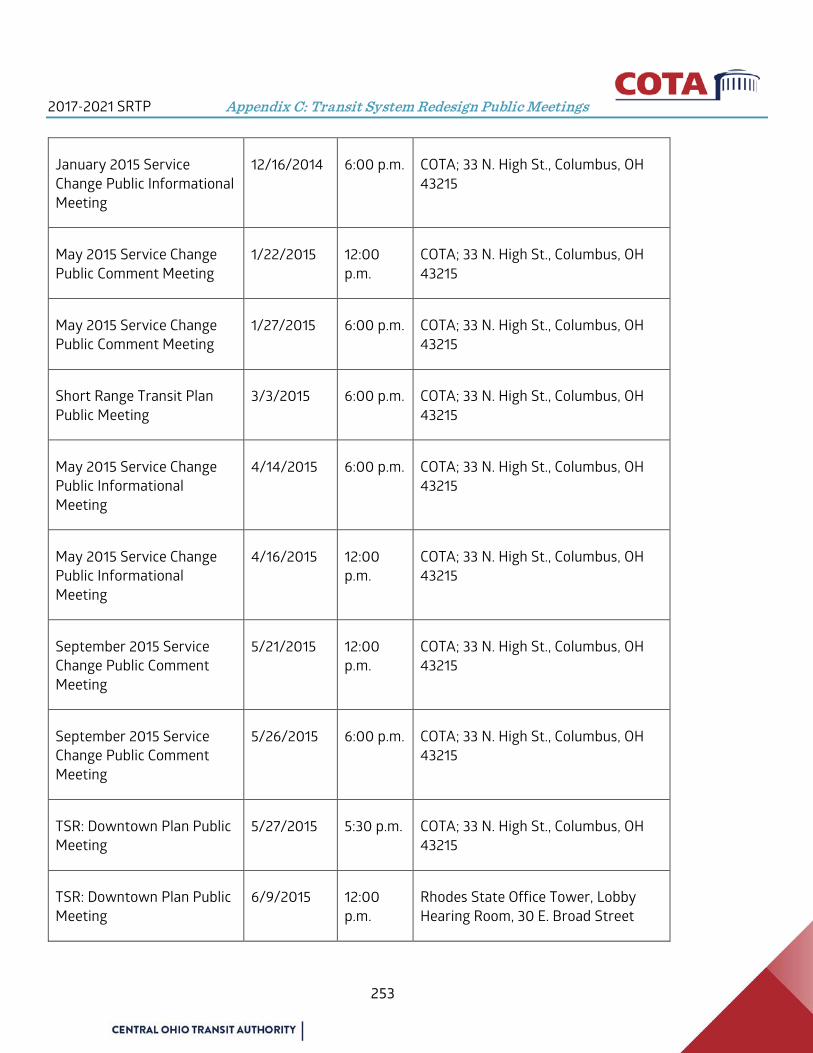
2017-2021 SRTP Appendix C: Transit System Redesign Public Meetings
253
January 2015 Service Change Public Informational Meeting
12/16/2014 6:00 p.m. COTA; 33 N. High St., Columbus, OH 43215
May 2015 Service Change Public Comment Meeting
1/22/2015 12:00 p.m.
COTA; 33 N. High St., Columbus, OH 43215
May 2015 Service Change Public Comment Meeting
1/27/2015 6:00 p.m. COTA; 33 N. High St., Columbus, OH 43215
Short Range Transit Plan Public Meeting
3/3/2015 6:00 p.m. COTA; 33 N. High St., Columbus, OH 43215
May 2015 Service Change Public Informational Meeting
4/14/2015 6:00 p.m. COTA; 33 N. High St., Columbus, OH 43215
May 2015 Service Change Public Informational Meeting
4/16/2015 12:00 p.m.
COTA; 33 N. High St., Columbus, OH 43215
September 2015 Service Change Public Comment Meeting
5/21/2015 12:00 p.m.
COTA; 33 N. High St., Columbus, OH 43215
September 2015 Service Change Public Comment Meeting
5/26/2015 6:00 p.m. COTA; 33 N. High St., Columbus, OH 43215
TSR: Downtown Plan Public Meeting
5/27/2015 5:30 p.m. COTA; 33 N. High St., Columbus, OH 43215
TSR: Downtown Plan Public Meeting
6/9/2015 12:00 p.m.
Rhodes State Office Tower, Lobby Hearing Room, 30 E. Broad Street

Appendix C: Transit System Redesign Public Meetings 2017-2021 SRTP
254
TSR: Downtown Plan Public Meeting
6/10/2015 12:00 p.m.
FC Complex, Judicial Services Building, 369 S. High Street
TSR: Downtown Plan Public Meeting
6/12/2015 12:00 p.m.
Ohio Bureau of Workers’ Comp William Green Bldg, Conference Rm 2, 30 W. Spring Street
September 2015 Service Change Public Informational Meeting
8/13/2015 12:00 p.m.
COTA; 33 N. High St., Columbus, OH 43215
September 2015 Service Change Public Informational Meeting
8/18/2015 6:00 p.m. COTA; 33 N. High St., Columbus, OH 43215
January 2016 Service Change Public Comment Meeting
9/17/2015 12:00 p.m.
COTA; 33 N. High St., Columbus, OH 43215
January 2016 Service Change Public Comment Meeting
9/22/2015 6:00 p.m. COTA; 33 N. High St., Columbus, OH 43215
Transit System Redesign – Downtown Public Meeting
10/19/2015 6:00 p.m. COTA; 33 N. High St., Columbus, OH 43215
Transit System Redesign – Northland Public Meeting
10/20/2015 6:00 p.m. North YMCA, 1640 Sandalwood Place, Columbus 43229
Transit System Redesign – Southside Public Meeting
10/21/2015 6:00 p.m. Marion Franklin Comm. Rec Cntr, 2801 Lockbourne Road, Columbus 43207
Transit System Redesign – Eastside Public Meeting
10/22/2015 7:00 p.m. Far East Neighborhood Pride Center, 2500 Park Crescent Drive, Columbus 43232

2017-2021 SRTP Appendix C: Transit System Redesign Public Meetings
255
Transit System Redesign – Westside Public Meeting
11/4/2015 6:00 p.m. Westgate Comm Rec. Center, 455 S. Westgate Avenue, Columbus 43204
Transit System Redesign – Near East Public Meeting
11/5/2015 6:00 p.m. The Neighborhood House
January 2016 Service Change Public Informational Meeting
12/10/2015 12:00 p.m.
COTA; 33 N. High St., Columbus, OH 43215
January 2016 Service Change Public Informational Meeting
12/15/2015 6:00 p.m. COTA; 33 N. High St., Columbus, OH 43215
May 2016 Public Service Change Public Comment Meeting
1/21/2016 12:00 p.m.
COTA; 33 N. High St., Columbus, OH 43215
May 2016 Public Service Change Public Comment Meeting
1/26/2016 6:00 p.m. COTA; 33 N. High St., Columbus, OH 43215
May 2016 Public Service Change Public Informational Meeting
4/12/2016 6:00 p.m. COTA; 33 N. High St., Columbus, OH 43215
May 2016 Public Service Change Public Informational Meeting
4/14/2016 12:00 p.m.
COTA; 33 N. High St., Columbus, OH 43215
September 2016 Public Service Change Public Comment Meeting
5/19/2016 12:00 p.m.
COTA; 33 N. High St., Columbus, OH 43215

Appendix C: Transit System Redesign Public Meetings 2017-2021 SRTP
256
September 2016 Public Service Change Public Comment Meeting
5/24/2016 6:00 p.m. COTA; 33 N. High St., Columbus, OH 43215
2017-2021 SRTP Appendix D: Transportation Improvement Program Draft
257
Appendix D: Transportation Improvement Program Draft
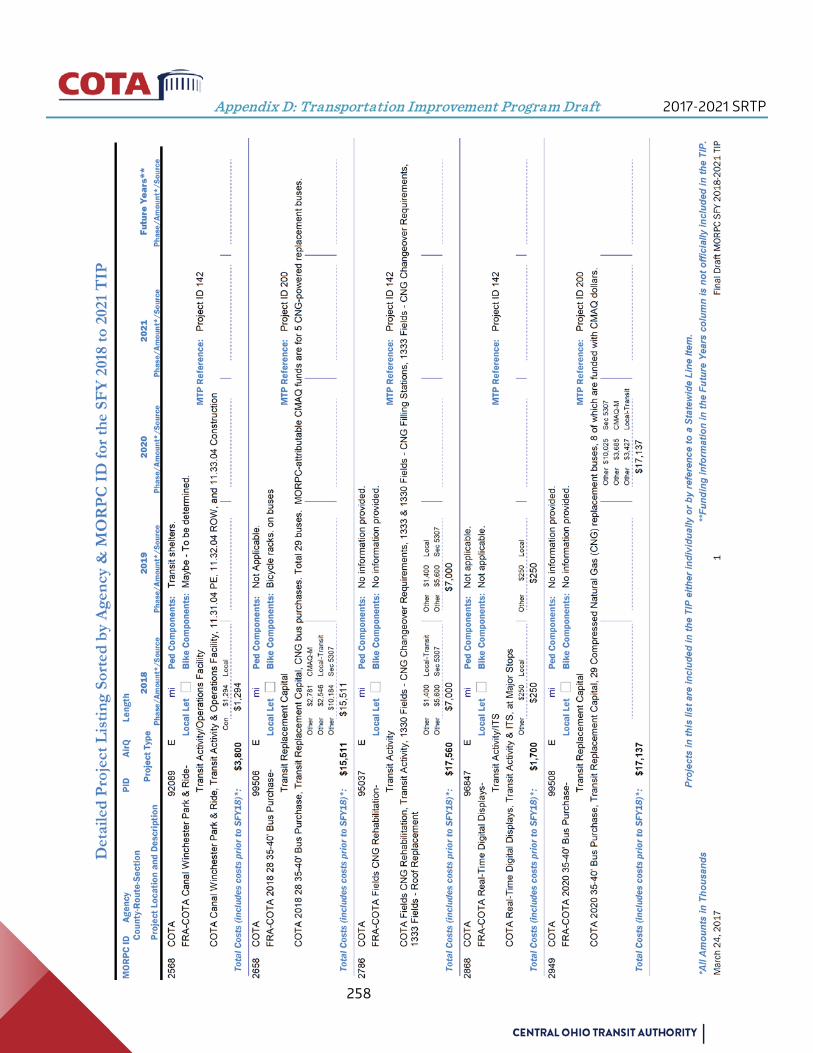
Appendix D: Transportation Improvement Program Draft 2017-2021 SRTP
258
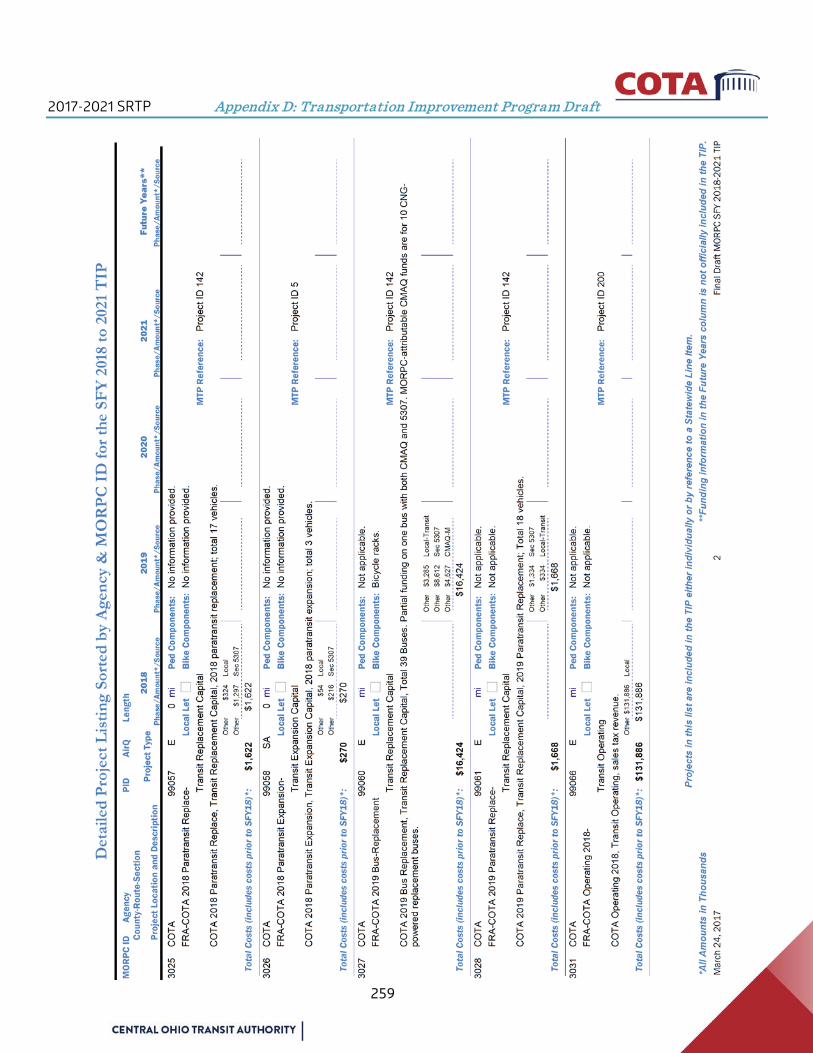
2017-2021 SRTP Appendix D: Transportation Improvement Program Draft
259

Appendix D: Transportation Improvement Program Draft 2017-2021 SRTP
260
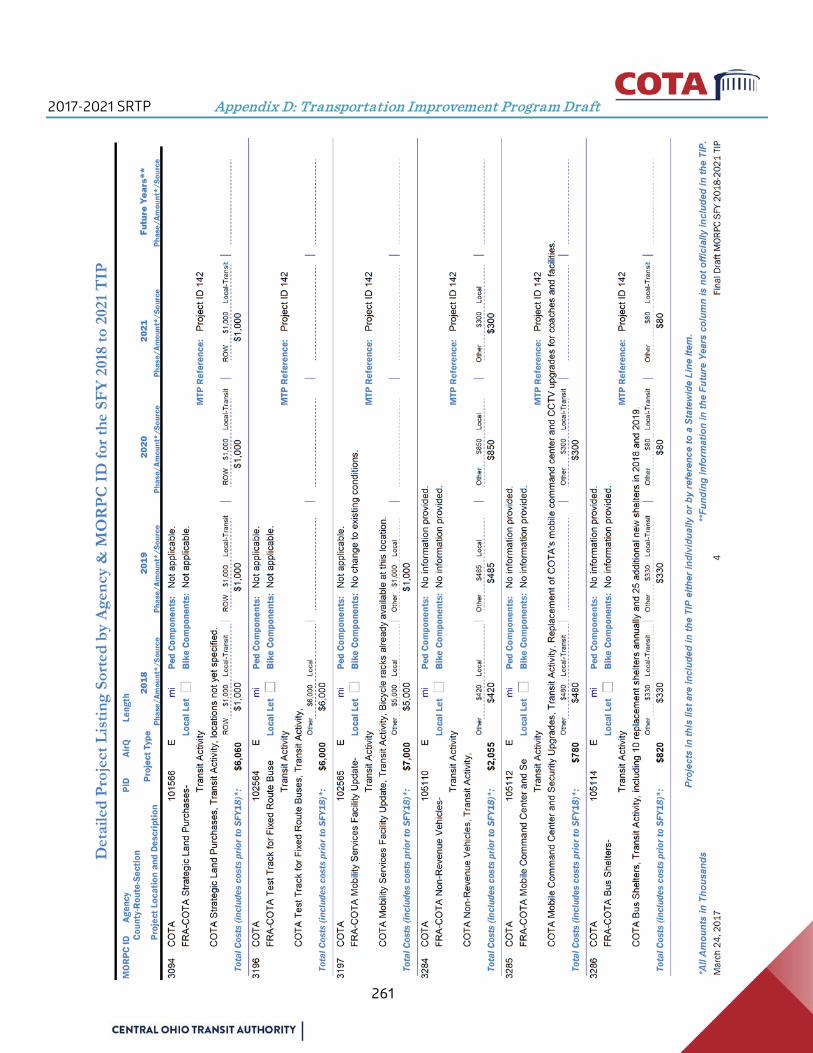
2017-2021 SRTP Appendix D: Transportation Improvement Program Draft
261

Appendix D: Transportation Improvement Program Draft 2017-2021 SRTP
262

2017-2021 SRTP Appendix D: Transportation Improvement Program Draft
263
Copyright © 2022 FDOKUMEN