Colloids versus crystalloids for fluid resuscitation in critically ill patients

Soft Matter
PAPER
Publ
ishe
d on
09
June
201
4. D
ownl
oade
d by
Uni
vers
ita' d
i Rom
a L
a Sa
pien
za o
n 17
/07/
2014
09:
09:3
9.
View Article OnlineView Journal | View Issue
aDebye Institute for Nanomaterials Scienc
3584CC, Utrecht, The Netherlands. E-mail:bDipartimento di sica, Sapienza, Universita
Roma, ItalycDipartimento di Fisica e di Scienze della Ter
F. Stagno d'Alcontres 31, 98166, Messina, It
† These authors contributed equally.
Cite this: Soft Matter, 2014, 10, 5121
Received 5th March 2014Accepted 29th April 2014
DOI: 10.1039/c4sm00505h
www.rsc.org/softmatter
This journal is © The Royal Society of C
Equilibrium phases of one-patch colloids withshort-range attractions
Zdenek Preisler,†*ab Teun Vissers,†b Gianmarco Munao,c Frank Smallenburgb
and Francesco Sciortinob
Inspired by experimental studies of short-ranged attractive patchy particles, we study with computer
simulations the phase behavior and the crystalline structures of one-patch colloids with an interaction
range equal to 5% of the particle diameter. In particular, we study the effects of the patch surface
coverage fraction, defined as the ratio between the attractive and the total surface of a particle. Using
free-energy calculations and thermodynamic integration schemes, we evaluate the equilibrium phase
diagrams for particles with patch coverage fractions of 30%, 50% and 60%. For a 60% surface coverage
fraction, we observe stable lamellar crystals consisting of stacked bilayers that directly coexist with a low
density fluid. Inside the coexistence region, we observe the formation of lamellar structures also in direct
NVT simulations, indicating that the barrier of formation is low and experimental realization is feasible.
For sufficiently strong interactions, these structures spontaneously assemble from the fluid in
simulations, suggesting that they might also easily form in experimental systems. In the Janus case, i.e. at
50% surface coverage fraction, no lamellar structures are formed, and the stable crystals are similar to
those that have been found previously for a longer interaction range (i.e. 20% of the particle diameter).
At 30% coverage fraction, we identify novel ‘open’ crystal structures with large unit cells of up to 14
particles that are stable in the strong interaction limit.
I. Introduction
Colloidal particles with strongly directional interactions play animportant role in so matter physics. One way to achieve theseinteractions is by creating attractive patches on the colloids'surface1–3 Current experimental techniques allow for theproduction of patchy colloids with different sizes, shapes andchemical compositions.4–12 Because such particles exhibitstrongly directional interactions, they constitute a useful tool toinvestigate the effects of the anisotropy on the self-assemblyprocesses. In parallel with these experimental developments,signicant theoretical and numerical efforts have been made topredict the physical properties of these systems13,14 for exampleguiding the identication of empty liquids15 in clay suspen-sions.16 Patchy particles can be used to study uid–uid anduid–solid phase transitions,15,17 and even to create uids thatremain stable down to zero temperature.18 Additionally, theinuence of patch number and size, as well patchy properties ina binary mixture,19–21 have been studied extensively. Of special
e, Utrecht University, Princetonplein 5,
` di Roma, Piazzale Aldo Moro 2, 00185,
ra, Universit degli Studi di Messina, Viale
aly
hemistry 2014
interest is the diamond colloidal crystal found in particles withfour patches in a tetrahedral geometry, because of its inter-esting photonic properties.22–26
One of the simplest examples of patchy colloids is providedby particles with a single patch, such as Janus particles with oneattractive hemisphere.10,27–34 The phase behavior of one-patchparticles, as well as their self-assembly properties in externalelds35,36 and on interfaces37,38 have been previously studied,demonstrating a rich phase behavior and the spontaneous self-assembly of micelles, vesicles, lamellae and tubes, analogous toaggregates found in molecular systems.39–42
In this work we address the issue of the sensitivity of thephase behavior of one-patch particles to the patch coveragefraction by numerical evaluation of equilibrium phase diagramsfor the one-patch Kern–Frenkel (KF) model.43 This model isfrequently adopted in the context of colloidal systems withstrongly directional attractions to investigate the structure,thermodynamics and self-assembly properties.26,39,44–46 In the KFmodel, two particles bind if their mutual distance is within therange of the attraction, modeled by a square-well interaction,and their patches are properly aligned with each other. To beclose to the experimental conditions,32,47,48 we focus on a short(5% of the particle diameter) square-well range. In order todocument the effect of the patch size on the relative thermo-dynamic stability of each phase we perform a thorough study forthree different values of the patch coverage fraction c, see Fig. 1.
Soft Matter, 2014, 10, 5121–5128 | 5121
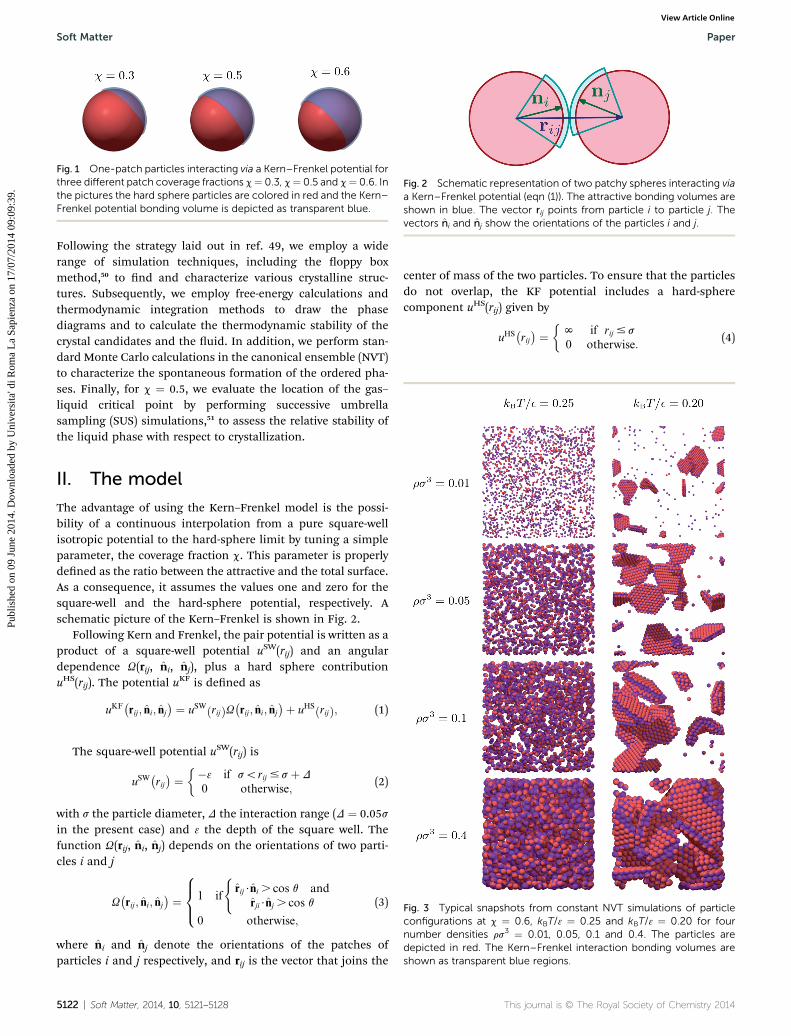
Fig. 1 One-patch particles interacting via a Kern–Frenkel potential forthree different patch coverage fractions c¼ 0.3, c¼ 0.5 and c¼ 0.6. Inthe pictures the hard sphere particles are colored in red and the Kern–Frenkel potential bonding volume is depicted as transparent blue.
Fig. 2 Schematic representation of two patchy spheres interacting viaa Kern–Frenkel potential (eqn (1)). The attractive bonding volumes areshown in blue. The vector rij points from particle i to particle j. Thevectors ni and nj show the orientations of the particles i and j.
Soft Matter Paper
Publ
ishe
d on
09
June
201
4. D
ownl
oade
d by
Uni
vers
ita' d
i Rom
a L
a Sa
pien
za o
n 17
/07/
2014
09:
09:3
9.
View Article Online
Following the strategy laid out in ref. 49, we employ a widerange of simulation techniques, including the oppy boxmethod,50 to nd and characterize various crystalline struc-tures. Subsequently, we employ free-energy calculations andthermodynamic integration methods to draw the phasediagrams and to calculate the thermodynamic stability of thecrystal candidates and the uid. In addition, we perform stan-dard Monte Carlo calculations in the canonical ensemble (NVT)to characterize the spontaneous formation of the ordered pha-ses. Finally, for c ¼ 0.5, we evaluate the location of the gas–liquid critical point by performing successive umbrellasampling (SUS) simulations,51 to assess the relative stability ofthe liquid phase with respect to crystallization.
Fig. 3 Typical snapshots from constant NVT simulations of particleconfigurations at c ¼ 0.6, kBT/3 ¼ 0.25 and kBT/3 ¼ 0.20 for fournumber densities rs3 ¼ 0.01, 0.05, 0.1 and 0.4. The particles aredepicted in red. The Kern–Frenkel interaction bonding volumes areshown as transparent blue regions.
II. The model
The advantage of using the Kern–Frenkel model is the possi-bility of a continuous interpolation from a pure square-wellisotropic potential to the hard-sphere limit by tuning a simpleparameter, the coverage fraction c. This parameter is properlydened as the ratio between the attractive and the total surface.As a consequence, it assumes the values one and zero for thesquare-well and the hard-sphere potential, respectively. Aschematic picture of the Kern–Frenkel is shown in Fig. 2.
Following Kern and Frenkel, the pair potential is written as aproduct of a square-well potential uSW(rij) and an angulardependence U(rij, ni, nj), plus a hard sphere contributionuHS(rij). The potential uKF is dened as
uKF�rij; ni; nj
� ¼ uSW rijð ÞU�rij ; ni; nj
�þ uHS rijð Þ; (1)
The square-well potential uSW(rij) is
uSW�rij� ¼ ��3 if s\rij # sþ D
0 otherwise;(2)
with s the particle diameter, D the interaction range (D ¼ 0.05sin the present case) and 3 the depth of the square well. Thefunction U(rij, ni, nj) depends on the orientations of two parti-cles i and j
U�rij; ni; nj
� ¼8><>: 1 if
(rij$ni . cos q and
rji$nj . cos q
0 otherwise;
(3)
where ni and nj denote the orientations of the patches ofparticles i and j respectively, and rij is the vector that joins the
5122 | Soft Matter, 2014, 10, 5121–5128
center of mass of the two particles. To ensure that the particlesdo not overlap, the KF potential includes a hard-spherecomponent uHS(rij) given by
uHS�rij� ¼ �
N if rij # s
0 otherwise:(4)
This journal is © The Royal Society of Chemistry 2014
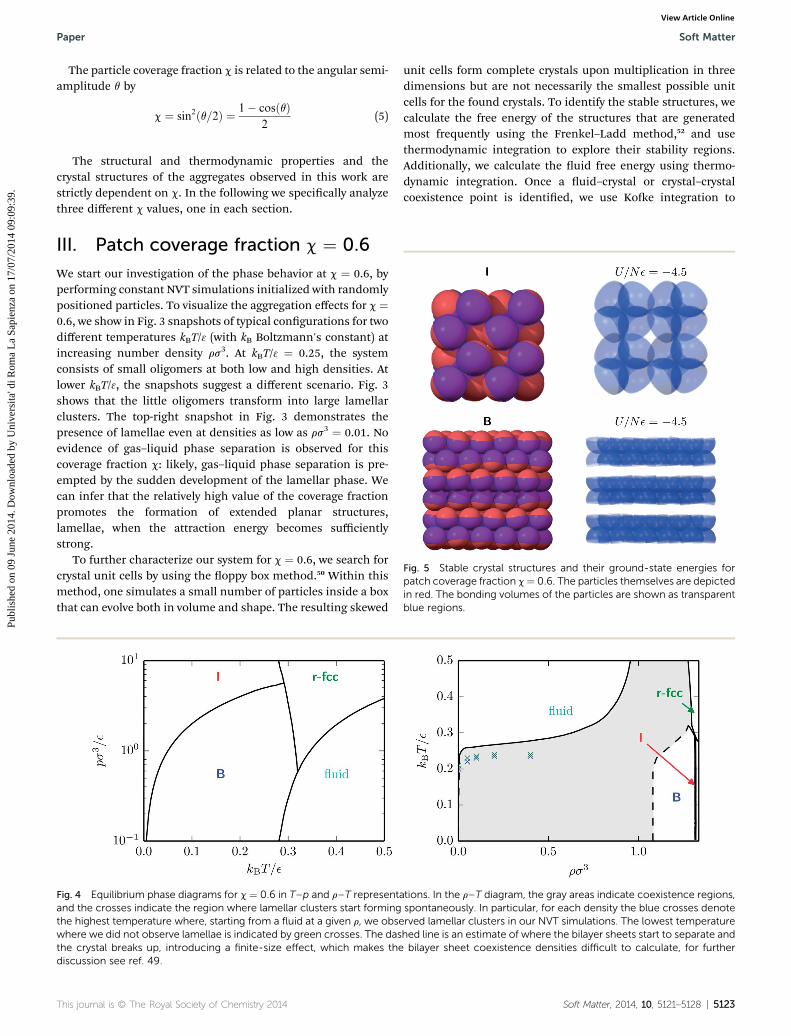
Fig. 5 Stable crystal structures and their ground-state energies forpatch coverage fraction c¼ 0.6. The particles themselves are depictedin red. The bonding volumes of the particles are shown as transparentblue regions.
Paper Soft Matter
Publ
ishe
d on
09
June
201
4. D
ownl
oade
d by
Uni
vers
ita' d
i Rom
a L
a Sa
pien
za o
n 17
/07/
2014
09:
09:3
9.
View Article Online
The particle coverage fraction c is related to the angular semi-amplitude q by
c ¼ sin2ðq=2Þ ¼ 1� cosðqÞ2
(5)
The structural and thermodynamic properties and thecrystal structures of the aggregates observed in this work arestrictly dependent on c. In the following we specically analyzethree different c values, one in each section.
III. Patch coverage fraction c ¼ 0.6
We start our investigation of the phase behavior at c ¼ 0.6, byperforming constant NVT simulations initialized with randomlypositioned particles. To visualize the aggregation effects for c ¼0.6, we show in Fig. 3 snapshots of typical congurations for twodifferent temperatures kBT/3 (with kB Boltzmann's constant) atincreasing number density rs3. At kBT/3 ¼ 0.25, the systemconsists of small oligomers at both low and high densities. Atlower kBT/3, the snapshots suggest a different scenario. Fig. 3shows that the little oligomers transform into large lamellarclusters. The top-right snapshot in Fig. 3 demonstrates thepresence of lamellae even at densities as low as rs3 ¼ 0.01. Noevidence of gas–liquid phase separation is observed for thiscoverage fraction c: likely, gas–liquid phase separation is pre-empted by the sudden development of the lamellar phase. Wecan infer that the relatively high value of the coverage fractionpromotes the formation of extended planar structures,lamellae, when the attraction energy becomes sufficientlystrong.
To further characterize our system for c ¼ 0.6, we search forcrystal unit cells by using the oppy box method.50 Within thismethod, one simulates a small number of particles inside a boxthat can evolve both in volume and shape. The resulting skewed
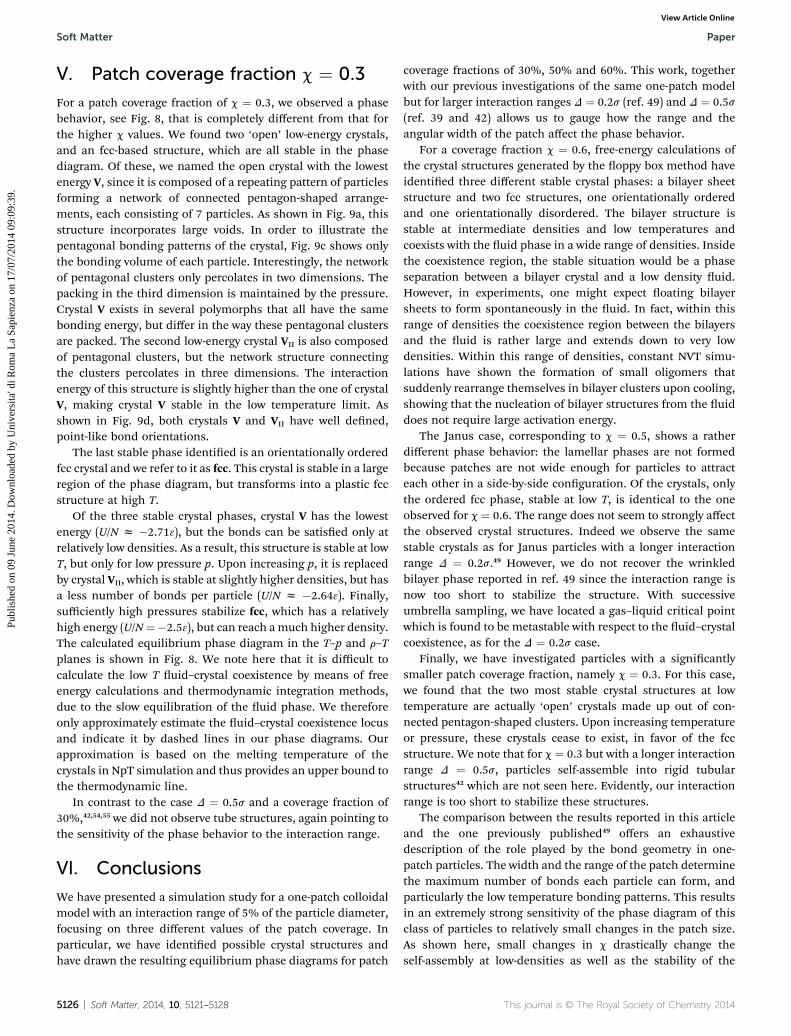
Fig. 4 Equilibrium phase diagrams for c ¼ 0.6 in T–p and r–T representand the crosses indicate the region where lamellar clusters start formingthe highest temperature where, starting from a fluid at a given r, we obsewhere we did not observe lamellae is indicated by green crosses. The dasthe crystal breaks up, introducing a finite-size effect, which makes thediscussion see ref. 49.
This journal is © The Royal Society of Chemistry 2014
unit cells form complete crystals upon multiplication in threedimensions but are not necessarily the smallest possible unitcells for the found crystals. To identify the stable structures, wecalculate the free energy of the structures that are generatedmost frequently using the Frenkel–Ladd method,52 and usethermodynamic integration to explore their stability regions.Additionally, we calculate the uid free energy using thermo-dynamic integration. Once a uid–crystal or crystal–crystalcoexistence point is identied, we use Koe integration to
ations. In the r–T diagram, the gray areas indicate coexistence regions,spontaneously. In particular, for each density the blue crosses denoterved lamellar clusters in our NVT simulations. The lowest temperaturehed line is an estimate of where the bilayer sheets start to separate andbilayer sheet coexistence densities difficult to calculate, for further
Soft Matter, 2014, 10, 5121–5128 | 5123

Soft Matter Paper
Publ
ishe
d on
09
June
201
4. D
ownl
oade
d by
Uni
vers
ita' d
i Rom
a L
a Sa
pien
za o
n 17
/07/
2014
09:
09:3
9.
View Article Online
follow the coexistence line.53 A detailed explanation is also givenin ref. 49.
The complete equilibrium phase diagrams in the tempera-ture–pressure (T–p) and in the density–temperature (r–T) planeare shown in Fig. 4. We identify a stable bilayer crystal structure,which we name B, with energy U/N3 ¼ �4.5, corresponding tonine bonded neighbours per particle. The structure is shown inFig. 5 and it closely resembles the lamellar structures that werefound in the constant NVT simulations. The spheres are on aface centered cubic (fcc) lattice and form bilayer sheets that arestacked on top of each other. At high density, yet low temper-ature, another crystal, labeled as crystal I is stable. This struc-ture had already been identied in ref. 49 and it is composed ofparticles residing on an fcc lattice, with a tetrahedral arrange-ment of the orientations. At high temperatures we nd that themost stable phase is an fcc-crystal with random orientationsthat we name r-fcc, consistent with the hard-sphere behaviorexpected as T / N.
Fig. 7 Typical snapshots of parts of crystals II and W inside a rectan-gular box for c ¼ 0.5. The bonding volume is depicted as transparentblue. At the very bottom we show only the bonding volumes of crystalW to indicate its bonding patterns.
IV. Patch coverage fraction c ¼ 0.5
We now turn our attention to colloids with a patch coveragefraction of 50%, also known as Janus particles. The phasediagram is shown in Fig. 6 in both the T–p and r–T planes.
We observe the same crystal structures as for Janus particleswith an interaction range of D ¼ 0.2s,49 although the stabilityregions are shied toward higher densities because bondedparticles are closer together. Note also that one of the struc-tures coincides with the fcc crystal structure I discussedpreviously for c ¼ 0.6. The other two structures, (II and W),consist of different orientational orderings of particles on ahexagonal close-packed (hcp) lattice and are shown in Fig. 7.We do not nd evidence of lamellar structures of the typeobserved for c ¼ 0.6. Stable lamellae do not form as particlescannot align side-by-side with all patches interacting sideways.The same holds for slightly smaller coverages, for which weexpect a phase behavior close to the Janus case. We also do notobserve the wrinkled bilayer sheet phase reported for D ¼
Fig. 6 Equilibrium phase diagram for the Kern–Frenkel model with covemarked with a red dot. Note that the critical point is metastable with res
5124 | Soft Matter, 2014, 10, 5121–5128
0.2s.49 Indeed the reduction of the range causes the breaking ofthe outer bonds which are required to stabilize the wrinkledbilayer sheet phase.
Using SUS simulations, we nd a gas–liquid critical point atkBT
c/3 x 0.155 and rcs3 x 0.15. However, the critical point is
rage fraction c ¼ 0.5 in the T–p and the r–T plane. The critical point ispect to the fluid–crystal coexistence.
This journal is © The Royal Society of Chemistry 2014

Fig. 8 Phase diagram in the T–p plane and the r–T plane for c¼ 0.3. The dashed line indicates estimated fluid–crystal coexistence in the regionwhere the fluid could not be equilibrated. The symbols of crystals V and VII are indicated on the left from their stability regions for clarity. The grayareas indicate the coexistence regions.
Paper Soft Matter
Publ
ishe
d on
09
June
201
4. D
ownl
oade
d by
Uni
vers
ita' d
i Rom
a L
a Sa
pien
za o
n 17
/07/
2014
09:
09:3
9.
View Article Online
metastable as it is embedded inside the coexistence regionbetween the low-density uid and the crystals. We know fromprevious studies that for D ¼ 0.5s and D ¼ 0.2s,39,49 a critical
Fig. 9 Stable crystals for coverage fraction c ¼ 0.3 and their energy per p(red); (b) the hard cores of the particles as well as their bonding volumorientations depicted on the surface of a unit sphere.
This journal is © The Royal Society of Chemistry 2014
point has been observed, although in the latter case it was alsofound to be metastable with respect to the formation of wrin-kled bilayer sheets49.
article in the low-temperature limit. (a) The hard cores of the particleses (transparent blue); (c) only the bonding volumes; (d) the particle
Soft Matter, 2014, 10, 5121–5128 | 5125
Soft Matter Paper
Publ
ishe
d on
09
June
201
4. D
ownl
oade
d by
Uni
vers
ita' d
i Rom
a L
a Sa
pien
za o
n 17
/07/
2014
09:
09:3
9.
View Article Online
V. Patch coverage fraction c ¼ 0.3
For a patch coverage fraction of c ¼ 0.3, we observed a phasebehavior, see Fig. 8, that is completely different from that forthe higher c values. We found two ‘open’ low-energy crystals,and an fcc-based structure, which are all stable in the phasediagram. Of these, we named the open crystal with the lowestenergy V, since it is composed of a repeating pattern of particlesforming a network of connected pentagon-shaped arrange-ments, each consisting of 7 particles. As shown in Fig. 9a, thisstructure incorporates large voids. In order to illustrate thepentagonal bonding patterns of the crystal, Fig. 9c shows onlythe bonding volume of each particle. Interestingly, the networkof pentagonal clusters only percolates in two dimensions. Thepacking in the third dimension is maintained by the pressure.Crystal V exists in several polymorphs that all have the samebonding energy, but differ in the way these pentagonal clustersare packed. The second low-energy crystal VII is also composedof pentagonal clusters, but the network structure connectingthe clusters percolates in three dimensions. The interactionenergy of this structure is slightly higher than the one of crystalV, making crystal V stable in the low temperature limit. Asshown in Fig. 9d, both crystals V and VII have well dened,point-like bond orientations.
The last stable phase identied is an orientationally orderedfcc crystal and we refer to it as fcc. This crystal is stable in a largeregion of the phase diagram, but transforms into a plastic fccstructure at high T.
Of the three stable crystal phases, crystal V has the lowestenergy (U/N z �2.713), but the bonds can be satised only atrelatively low densities. As a result, this structure is stable at lowT, but only for low pressure p. Upon increasing p, it is replacedby crystal VII, which is stable at slightly higher densities, but hasa less number of bonds per particle (U/N z �2.643). Finally,sufficiently high pressures stabilize fcc, which has a relativelyhigh energy (U/N¼�2.53), but can reach amuch higher density.The calculated equilibrium phase diagram in the T–p and r–Tplanes is shown in Fig. 8. We note here that it is difficult tocalculate the low T uid–crystal coexistence by means of freeenergy calculations and thermodynamic integration methods,due to the slow equilibration of the uid phase. We thereforeonly approximately estimate the uid–crystal coexistence locusand indicate it by dashed lines in our phase diagrams. Ourapproximation is based on the melting temperature of thecrystals in NpT simulation and thus provides an upper bound tothe thermodynamic line.
In contrast to the case D ¼ 0.5s and a coverage fraction of30%,42,54,55 we did not observe tube structures, again pointing tothe sensitivity of the phase behavior to the interaction range.
VI. Conclusions
We have presented a simulation study for a one-patch colloidalmodel with an interaction range of 5% of the particle diameter,focusing on three different values of the patch coverage. Inparticular, we have identied possible crystal structures andhave drawn the resulting equilibrium phase diagrams for patch
5126 | Soft Matter, 2014, 10, 5121–5128
coverage fractions of 30%, 50% and 60%. This work, togetherwith our previous investigations of the same one-patch modelbut for larger interaction ranges D ¼ 0.2s (ref. 49) and D ¼ 0.5s(ref. 39 and 42) allows us to gauge how the range and theangular width of the patch affect the phase behavior.
For a coverage fraction c ¼ 0.6, free-energy calculations ofthe crystal structures generated by the oppy box method haveidentied three different stable crystal phases: a bilayer sheetstructure and two fcc structures, one orientationally orderedand one orientationally disordered. The bilayer structure isstable at intermediate densities and low temperatures andcoexists with the uid phase in a wide range of densities. Insidethe coexistence region, the stable situation would be a phaseseparation between a bilayer crystal and a low density uid.However, in experiments, one might expect oating bilayersheets to form spontaneously in the uid. In fact, within thisrange of densities the coexistence region between the bilayersand the uid is rather large and extends down to very lowdensities. Within this range of densities, constant NVT simu-lations have shown the formation of small oligomers thatsuddenly rearrange themselves in bilayer clusters upon cooling,showing that the nucleation of bilayer structures from the uiddoes not require large activation energy.
The Janus case, corresponding to c ¼ 0.5, shows a ratherdifferent phase behavior: the lamellar phases are not formedbecause patches are not wide enough for particles to attracteach other in a side-by-side conguration. Of the crystals, onlythe ordered fcc phase, stable at low T, is identical to the oneobserved for c ¼ 0.6. The range does not seem to strongly affectthe observed crystal structures. Indeed we observe the samestable crystals as for Janus particles with a longer interactionrange D ¼ 0.2s.49 However, we do not recover the wrinkledbilayer phase reported in ref. 49 since the interaction range isnow too short to stabilize the structure. With successiveumbrella sampling, we have located a gas–liquid critical pointwhich is found to be metastable with respect to the uid–crystalcoexistence, as for the D ¼ 0.2s case.
Finally, we have investigated particles with a signicantlysmaller patch coverage fraction, namely c ¼ 0.3. For this case,we found that the two most stable crystal structures at lowtemperature are actually ‘open’ crystals made up out of con-nected pentagon-shaped clusters. Upon increasing temperatureor pressure, these crystals cease to exist, in favor of the fccstructure. We note that for c ¼ 0.3 but with a longer interactionrange D ¼ 0.5s, particles self-assemble into rigid tubularstructures42 which are not seen here. Evidently, our interactionrange is too short to stabilize these structures.
The comparison between the results reported in this articleand the one previously published49 offers an exhaustivedescription of the role played by the bond geometry in one-patch particles. The width and the range of the patch determinethe maximum number of bonds each particle can form, andparticularly the low temperature bonding patterns. This resultsin an extremely strong sensitivity of the phase diagram of thisclass of particles to relatively small changes in the patch size.As shown here, small changes in c drastically change theself-assembly at low-densities as well as the stability of the
This journal is © The Royal Society of Chemistry 2014

Paper Soft Matter
Publ
ishe
d on
09
June
201
4. D
ownl
oade
d by
Uni
vers
ita' d
i Rom
a L
a Sa
pien
za o
n 17
/07/
2014
09:
09:3
9.
View Article Online
high-density crystal structures. We also note that some of thethermodynamically stable structures require a large number ofparticles in the unit cell, making it impossible to use assump-tions to predict the relevant crystal phases. As shown in thepresent work, numerical simulations can aid in the discovery ofsuch structures. The sensitivity of the bond geometry is notlimited to the patch coverage but is equally relevant to theselection of the patch range. A clear example is provided by thedisappearance of the wrinkled sheet phase from the phasediagram on going from D ¼ 0.2s to D ¼ 0.05s. Given the factthat ne-tuning these parameters experimentally is still achallenge, the knowledge of the effects of the patch range andcoverage on the phase behavior will be crucial in interpretingfuture experimental observations of these particles. Finally, wenote that the effects on the phase behaviour of polydispersity inpatch-size, hard-core size and interaction length could be aninteresting subject of further investigations.
Acknowledgements
Parts of the work are also presented in the PhD thesis of Z.Preisler. The authors gratefully acknowledge ERC-226207-PATCHYCOLLOIDS (T. Vissers, G. Munao, F. Smallenburg andF. Sciortino), ITN-234810-COMPLOIDS (Z. Preisler) and MIUR-PRIN (F. Sciortino).
References
1 V. N. Manoharan, M. T. Elsesser and D. J. Pine, Science, 2003,301, 483–487.
2 S. C. Glotzer and M. J. Solomon, Nat. Mater., 2007, 6, 557–562.
3 Z. Zhang and S. C. Glotzer, Nano Lett., 2004, 4, 1407–1413.4 A. P. R. Eberle, R. Castaneda-Priego, J. M. Kim andN. J. Wagner, Langmuir, 2012, 28, 1866.
5 Q. Meng, Y. Kou, X. Ma, Y. Liang, L. Guo, C. Ni and K. Liu,Langmuir, 2012, 28, 5017.
6 T. H. Zhang, J. Klok, R. H. Tromp, J. Groenewold andW. K. Kegel, So Matter, 2012, 8, 667.
7 S. Sacanna and D. J. Pine, Curr. Opin. Colloid Interface Sci.,2011, 16, 96.
8 Q. Chen, J. Yan, J. Zhang, S. C. Bae and S. Granick, Langmuir,2012, 28, 1355.
9 Y. Jing, B. Moses, B. Sung Chul, L. Erik and G. Steve, Nature,2012, 491, 578–581.
10 A. Walther and A. H. E. Muller, Chem. Rev., 2013, 113, 5194–5261.
11 I. C. Pons-Siepermann and S. C. Glotzer, SoMatter, 2012, 8,6226.
12 A. B. Pawar and I. Kretzschmar, Macromol. Rapid Commun.,2010, 31, 150–168.
13 E. Bianchi, R. Blaak and C. Likos, Phys. Chem. Chem. Phys.,2011, 13, 6297.
14 A. Giacometti, Cent. Eur. J. Phys., 2012, 10, 540–551.15 E. Bianchi, J. Largo, P. Tartaglia, E. Zaccarelli and
F. Sciortino, Phys. Rev. Lett., 2006, 97, 168301–168304.
This journal is © The Royal Society of Chemistry 2014
16 F. Sciortino and E. Zaccarelli, Curr. Opin. Colloid InterfaceSci., 2011, 15, 246.
17 C. Gogelein, F. Romano, F. Sciortino and A. Giacometti,J. Chem. Phys., 2012, 136, 094512.
18 F. Smallenburg and F. Sciortino, Nat. Phys., 2013, 9, 554–558.19 J. M. Tavares, P. I. C. Teixeira and M. M. Telo da Gama, Phys.
Rev. E: Stat., Nonlinear, So Matter Phys., 2009, 80, 021506.20 J. M. Tavares, P. I. C. Teixeira, M. M. T. da Gama and
F. Sciortino, J. Chem. Phys., 2010, 132, 234502.21 J. M. Tavares, P. I. C. Teixeira and M. M. Telo da Gama, Mol.
Phys., 2009, 107, 453–466.22 F. Romano, E. Sanz and F. Sciortino, J. Chem. Phys., 2010,
132, 184501.23 F. Romano, E. Sanz and F. Sciortino, J. Chem. Phys., 2011,
134, 174502.24 Z. Zhang, A. S. Keys, T. Chen and S. C. Glotzer, Langmuir,
2005, 21, 11547.25 A.-P. Hynninen, J. H. Thijssen, E. C. Vermolen, M. Dijkstra
and A. Van Blaaderen, Nat. Mater., 2007, 6, 202–205.26 F. Romano and F. Sciortino, Nat. Commun., 2012, 3, 975.27 K.-H. Roh, D. C. Martin and J. Lahann, Nat. Mater., 2005, 4,
759–763.28 B. Wang, B. Li, B. Zhao and C. Y. Li, J. Am. Chem. Soc., 2008,
130, 11594–11595.29 C.-H. Chen, R. K. Shah, A. R. Abate and D. A. Weitz,
Langmuir, 2009, 25, 4320–4323.30 A. M. Jackson, J. W. Myerson and F. Stellacci, Nat. Mater.,
2004, 3, 330–336.31 W. L. Miller and A. Cacciuto, Phys. Rev. E: Stat., Nonlinear,
So Matter Phys., 2009, 80, 021404.32 Q. Chen, J. K. Whitmer, S. Jiang, S. C. Bae, E. Luijten and
S. Granick, Science, 2011, 331, 199.33 S. Jiang, Q. Chen, M. Tripathy, E. Luijten, K. S. Schweizer and
S. Granick, Adv. Mater., 2010, 22, 1060–1071.34 A. Walther and A. H. E. Muller, SoMatter, 2008, 4, 663–668.35 B. Ren, A. Ruditskiy, J. H. Song and I. Kretzschmar,
Langmuir, 2011, 28, 1149–1156.36 S. Gangwal, A. Pawar, I. Kretzschmar and O. D. Velev, So
Matter, 2010, 6, 1413–1418.37 B. J. Park, T. Brugarolas and D. Lee, So Matter, 2011, 7,
6413–6417.38 N. Glaser, D. J. Adams, A. Boker and G. Krausch, Langmuir,
2006, 22, 5227–5229.39 F. Sciortino, A. Giacometti and G. Pastore, Phys. Rev. Lett.,
2009, 103, 237801.40 G. Rosenthal, K. E. Gubbins and S. H. Klapp, J. Chem. Phys.,
2012, 136, 174901.41 G. Munao, D. Costa, F. Sciortino and C. Caccamo, J. Chem.
Phys., 2011, 134, 194502.42 Z. Preisler, T. Vissers, F. Smallenburg, G. Munao and
F. Sciortino, J. Phys. Chem. B, 2013, 117, 9540–9547.43 N. Kern and D. Frenkel, J. Chem. Phys., 2003, 118, 9882–9889.44 A. Giacometti, F. Lado, J. Largo, G. Pastore and F. Sciortino,
J. Chem. Phys., 2009, 131, 174114.45 A. Giacometti, F. Lado, J. Largo, G. Pastore and F. Sciortino,
J. Chem. Phys., 2010, 132, 174110.
Soft Matter, 2014, 10, 5121–5128 | 5127
Soft Matter Paper
Publ
ishe
d on
09
June
201
4. D
ownl
oade
d by
Uni
vers
ita' d
i Rom
a L
a Sa
pien
za o
n 17
/07/
2014
09:
09:3
9.
View Article Online
46 F. Sciortino, A. Giacometti and G. Pastore, Phys. Chem. Chem.Phys., 2010, 12, 11869–11877.
47 Q. Chen, S. C. Bae and S. Granick, Nature, 2011, 469, 381–384.
48 Y. Iwashita and Y. Kimura, SoMatter, 2013, 9, 10694–10698.49 T. Vissers, Z. Preisler, F. Smallenburg, M. Dijkstra and
F. Sciortino, J. Chem. Phys., 2013, 138, 164505.50 L. Filion, M. Marechal, B. van Oorschot, D. Pelt,
F. Smallenburg and M. Dijkstra, Phys. Rev. Lett., 2009, 103,188302.
5128 | Soft Matter, 2014, 10, 5121–5128
51 P. Virnau and M. Muller, J. Chem. Phys., 2004, 120, 10925–10930.
52 D. Frenkel and A. J. C. Ladd, J. Chem. Phys., 1984, 81, 3188–3193.
53 D. A. Koe, J. Chem. Phys., 1993, 98, 4149–4162.54 G. Munao, Z. Preisler, T. Vissers, F. Smallenburg and
F. Sciortino, So Matter, 2013, 9, 2652–2661.55 T. Vissers, F. Smallenburg, G. Munao, Z. Preisler and
F. Sciortino, J. Chem. Phys., 2014, 140, 144902.
This journal is © The Royal Society of Chemistry 2014
Copyright © 2022 FDOKUMEN


![Patch Antenna[1]](https://static.fdokumen.com/doc/165x107/63158e4cc32ab5e46f0d5c89/patch-antenna1.jpg)