Short and long term effects of antihypertensive therapy in the diabetic rat
11
Kidney International, Vol. 36 (1989), pp. 526—536 LABORATORY INVESTIGATION Short and long term effects of antihypertensive therapy in the diabetic rat SHARON ANDERSON, HELMUT G. RENNKE, DIEGO L. GARCIA, and BARRY M. BRENNER with the technical assistance of SUSAN L. RILEY and DEBORAH J. SANDSTROM Renal Division and Departments of Medicine and Pathology, Brigham and Women's Hospital, and The Harvard Center for The Study of Kidney Diseases, Harvard Medical School, Boston, Massachusetts, USA Short and long term effects of antihypertensive therapy in the diabetic rat. To compare the impact of differing antihypertensive regimens on the development of renal injury, studies were performed in three groups of moderately hyperglycemic diabetic rats, and one group of non- diabetic control (C) rats. One diabetic group (DM) received no therapy except insulin. The remaining diabetic groups received insulin and either the angiotensin I converting enzyme inhibitor captopril (CAP), or triple therapy (TRX) with reserpine, hydralazine and hydrochlorothia- zide. CAP and TRX modestly and comparably lowered blood pressure. At 6 to 10 weeks, DM rats exhibited elevation of the single nephron glomerular filtration rate (SNGFR), due to elevations of the glomerular capillary plasma flow rate (QA) and the glomerular capillary hydraulic pressure (P0). in both DM/CAP and DM/TRX rats, blood pressure reduction was associated with selective normalization of P0w, without change in SNGFR or QA. In long-term (70 weeks) studies, DM rats exhibited progressive albuminuria and marked glomerular sclerosis. CAP limited albuminuria and injury to values even lower than those in C rats, whereas TRX served only to delay, but not to prevent, the increase in albuminuria. TRX reduced glomerular sclerosis, but was less effective than CAP. At 70 weeks, CAP and TRX still reduced systemic blood pressure; remained at normal levels with CAP but was no longer controlled with TRX. These results confirm the clinical observation that antihypertensive therapy slows diabetic gb- merulopathy, but also suggest that CAP affords superior long-term protection as compared to the other antihypertensive drug regimen studied. Microangiopathy is a major cause of morbidity and mortality in diabetes mellitus, and progressive destruction of the renal microcirculatory bed leads to end-stage renal disease in a substantial percentage of Type I and Type 11 diabetic patients [1]. The importance of hemodynamic factors in the progression of diabetic glomerulopathy has been documented by observa- tions that early diabetes is characterized by elevation of the Received for publication August II, 1988 and in revised form April 12, 1989 Accepted for publication April 21, 1989 © 1989 by the International Society of Nephrology glomerular filtration rate (GFR)' clinically [2, 3] as well as experimentally [4—6], and that patients with the highest GFR values early in the course of the disease are more likely to progress to persistent proteinuria or overt diabetic glomerulop- athy than are patients with more normal initial values for GFR [3]. Further support for a hemodynamic basis of diabetic glomer- ulopathy derives from studies of uninephrectomy [7, 8] or a high protein diet [5], in which increases in the glomerular capillary hydraulic pressure (PGC) and perfusion and filtration rates accelerate the development of albuminuria and glomerular structural injury [5]. Conversely, interventions which attenuate these hemodynamic changes slow the development of glomer- ular injury. Dietary protein restriction, which lowers the single nephron (SN) GFR by reducing both the glomerular capillary plasma flow rate (QA) and GC' affords structural protection in this model [5]. Alternatively, selective reduction of PGC with the angiotensin I converting enzyme inhibitor (CE!) enalapril slows the development of injury even in the presence of continued hyperfiltration and hyperperfusion [6], suggesting that glomerular capillary hypertension is the crucial hemody- namic determinant of progressive glomerular injury. Similar findings have been documented in studies involving other models of progressive glomerular injury 19—13]. Control of glomerular hypertension may be dissociated from control of Abbreviations used in this paper are: Al, angiotensin I; All, angiotensin 11; A0, mean glomerular cross-sectional area; AP, mean arterial pressure; BG, blood glucose; C, control; CAP, captopril; CEI, converting enzyme inhibitor; DM, diabetes mellitus; GFR, glomerular filtration rate; HbAIC, glycosylated hemoglobin; Hct, hematocrit; K1, gbomerular capillary ultrafiltration coefficient; LKW, left kidney weight; PAS, periodic acid Schiff; PRA, plasma renin activity; PRC, plasma renin concentration; P.o, glomerular capillary hydraulic pressure; P, mean glomerular transcapillary hydraulic pressure gradient; QA. gb- merular capillary plasma flow rate; RA, RE, RT, afferent, efferent and total arteriolar resistances; RAS, renin-angiotensin system; SHR, spon- taneously hypertensive rat; SN, single nephron; SBP, systolic blood pressure; STZ, streptozotocin; TRX, triple therapy (reserpine, hydrala- zine, and hydrochiorothiazide); UaIbV, 24-hr urinary albumin excretion rate; V0, mean glomerular volume; WKY, Wistar-Kyoto rat. 526
-
Upload
independent -
Category
Documents
-
view
0 -
download
0
Transcript of Short and long term effects of antihypertensive therapy in the diabetic rat
Kidney International, Vol. 36 (1989), pp. 526—536
LABORATORY INVESTIGATION
Short and long term effects of antihypertensive therapy in thediabetic rat
SHARON ANDERSON, HELMUT G. RENNKE, DIEGO L. GARCIA, and BARRY M. BRENNERwith the technical assistance of SUSAN L. RILEY and DEBORAH J. SANDSTROM
Renal Division and Departments of Medicine and Pathology, Brigham and Women's Hospital, and The Harvard Center for The Study ofKidney Diseases, Harvard Medical School, Boston, Massachusetts, USA
Short and long term effects of antihypertensive therapy in the diabeticrat. To compare the impact of differing antihypertensive regimens onthe development of renal injury, studies were performed in three groupsof moderately hyperglycemic diabetic rats, and one group of non-diabetic control (C) rats. One diabetic group (DM) received no therapyexcept insulin. The remaining diabetic groups received insulin andeither the angiotensin I converting enzyme inhibitor captopril (CAP), ortriple therapy (TRX) with reserpine, hydralazine and hydrochlorothia-zide. CAP and TRX modestly and comparably lowered blood pressure.At 6 to 10 weeks, DM rats exhibited elevation of the single nephronglomerular filtration rate (SNGFR), due to elevations of the glomerularcapillary plasma flow rate (QA) and the glomerular capillary hydraulicpressure (P0). in both DM/CAP and DM/TRX rats, blood pressurereduction was associated with selective normalization of P0w, withoutchange in SNGFR or QA. In long-term (70 weeks) studies, DM ratsexhibited progressive albuminuria and marked glomerular sclerosis.CAP limited albuminuria and injury to values even lower than those inC rats, whereas TRX served only to delay, but not to prevent, theincrease in albuminuria. TRX reduced glomerular sclerosis, but wasless effective than CAP. At 70 weeks, CAP and TRX still reducedsystemic blood pressure; remained at normal levels with CAPbut was no longer controlled with TRX. These results confirm theclinical observation that antihypertensive therapy slows diabetic gb-merulopathy, but also suggest that CAP affords superior long-termprotection as compared to the other antihypertensive drug regimenstudied.
Microangiopathy is a major cause of morbidity and mortalityin diabetes mellitus, and progressive destruction of the renalmicrocirculatory bed leads to end-stage renal disease in asubstantial percentage of Type I and Type 11 diabetic patients[1]. The importance of hemodynamic factors in the progressionof diabetic glomerulopathy has been documented by observa-tions that early diabetes is characterized by elevation of the
Received for publication August II, 1988and in revised form April 12, 1989Accepted for publication April 21, 1989
© 1989 by the International Society of Nephrology
glomerular filtration rate (GFR)' clinically [2, 3] as well asexperimentally [4—6], and that patients with the highest GFRvalues early in the course of the disease are more likely toprogress to persistent proteinuria or overt diabetic glomerulop-athy than are patients with more normal initial values for GFR[3].
Further support for a hemodynamic basis of diabetic glomer-ulopathy derives from studies of uninephrectomy [7, 8] or a highprotein diet [5], in which increases in the glomerular capillaryhydraulic pressure (PGC) and perfusion and filtration ratesaccelerate the development of albuminuria and glomerularstructural injury [5]. Conversely, interventions which attenuatethese hemodynamic changes slow the development of glomer-ular injury. Dietary protein restriction, which lowers the singlenephron (SN) GFR by reducing both the glomerular capillaryplasma flow rate (QA) and GC' affords structural protection inthis model [5]. Alternatively, selective reduction of PGC withthe angiotensin I converting enzyme inhibitor (CE!) enalaprilslows the development of injury even in the presence ofcontinued hyperfiltration and hyperperfusion [6], suggestingthat glomerular capillary hypertension is the crucial hemody-namic determinant of progressive glomerular injury. Similarfindings have been documented in studies involving othermodels of progressive glomerular injury 19—13]. Control ofglomerular hypertension may be dissociated from control of
Abbreviations used in this paper are: Al, angiotensin I; All,angiotensin 11; A0, mean glomerular cross-sectional area; AP, meanarterial pressure; BG, blood glucose; C, control; CAP, captopril; CEI,converting enzyme inhibitor; DM, diabetes mellitus; GFR, glomerularfiltration rate; HbAIC, glycosylated hemoglobin; Hct, hematocrit; K1,gbomerular capillary ultrafiltration coefficient; LKW, left kidney weight;PAS, periodic acid Schiff; PRA, plasma renin activity; PRC, plasmarenin concentration; P.o, glomerular capillary hydraulic pressure; P,mean glomerular transcapillary hydraulic pressure gradient; QA. gb-merular capillary plasma flow rate; RA, RE, RT, afferent, efferent andtotal arteriolar resistances; RAS, renin-angiotensin system; SHR, spon-taneously hypertensive rat; SN, single nephron; SBP, systolic bloodpressure; STZ, streptozotocin; TRX, triple therapy (reserpine, hydrala-zine, and hydrochiorothiazide); UaIbV, 24-hrurinary albumin excretionrate; V0, mean glomerular volume; WKY, Wistar-Kyoto rat.
526
Anderson el a!: Prevention of glomerulopathy in diabetes 527
systemic hypertension, in that therapy which lowers GCaf-fords protection when systemic blood pressure is not lowered inhypertensive models [11], or only modestly reduced in nor-motensive animals [6, 14].
An important adverse consequence of diabetes is systemichypertension, which contributes to acceleration of diabeticmicroangiopathic complications [I]. Clinical studies clearlyindicate that antihypertensive therapy slows the progression ofdiabetic renal disease [15, 161. However, the existing studies donot offer long-term comparisons among various antihyperten-sive regimens. In experimental models of non-diabetic progres-sive renal disease, effective antihypertensive control using thetriple therapy (TRX) regimen of reserpine, hydralazine andhydrochlorothiazide reduces GC and slows the development ofrenal injury in some models [13, 17], whereas this regimen failsto control glomerular hypertension or to limit local injury inothers [10, 18, 19]. Preliminary short-term clinical studies innon-diabetic renal disease suggest that CEI may offer a thera-peutic advantage over conventional combination regimens [20—22], presumably by a selective beneficial action to reduceefferent arteriolar resistance and GC' but comparison studieshave not yet been performed in diabetic patients.
Accordingly, we sought to compare the early and long-termglomerular hemodynamic and structural effects of equivalentreduction in blood pressure with CE! and TRX in the moder-ately hyperglycemic diabetic rat. The study was specificallydesigned to determine the consequences of controlled reductionin blood pressure to a predetermined level, using differentantihypertensive regimens, rather than to examine the effects ofspecific doses of pharmacologic agents. This approach, adjust-ing medication doses to achieve a desired level of bloodpressure control, is commonly used in the clinical treatment ofhypertension [15, 16, 20—22], and has revealed important differ-ences in hemodynamic and morphologic consequences in pre-vious studies of experimental renal disease [6, 10—14, 17—19].
Methods
Four groups of adult male Munich-Wistar rats, with initialweights of 200 to 260 g, were studied. One group (C) served asnon-diabetic controls, and three groups were made diabetic byintravenous tail injection of streptozotocin (STZ, Sigma Chem-ical Co., St. Louis, Missouri, USA), 60 mg/kg body weight,under Brevital anesthesia (50 mg/kg i.p.). Two days later,induction of diabetes was confirmed by measurement of tailblood glucose (BG) level using a reflectance meter (Miles AmesDiv., Miles Laboratories, Inc., Elkhart, Indiana, USA). Dia-betic rats received daily evening injections of ultralente insulin(Iletin I, Eli Lilly & Co., Indianapolis, Indiana, USA), in dosesindividually adjusted to maintain BG levels between 200 and400 mg/dl. BG levels were monitored at least once a week in alldiabetic rats, and occasional values were checked in non-diabetic rats for comparison purposes. All rats were fed stan-dard rat chow (Rodent Laboratory Chow 5001, Ralston PurinaCo., Richmond, Indiana, USA) ad libitum. The diet containedthe following composition by weight: protein, 23.4%; fat, 4.5%;Na, 0.40%; Ca, 1.0%; Phos, 0.61%; K, 1.10%; kcal/g, 4.25.
One diabetic group (DM) received no therapy other thaninsulin. A second diabetic group (DM/CAP) was treated withinsulin and with the CE! captopril (E.R. Squibb & Sons, Inc.,
Princeton, New Jersey, USA), administered in the drinkingwater at a concentration of 0.75 to 1.0 g/liter. The third diabeticgroup (DM/TRX) received insulin and an antihypertensivetriple therapy (TRX) regimen consisting of reserpine (5 mg/liter), hydralazine (160 mg/liter) and hydrochlorothiazide (25mg/liter; Sigma Chemical Co.) in the drinking water. Previousstudies have demonstrated the therapeutic efficacy of a modestreduction in systemic blood pressure with CE! therapy in thisnormotensive model [6]. !n the present study, doses of bothantihypertensive regimens were adjusted as needed to maintainthe systolic blood pressure in the range of 100 to 130 mm Hg,representing a modest reduction below values seen in the DMrats receiving only insulin. Extensive pilot testing establishedthat doses exceeding these levels resulted in excessive hypo-tension (systolic blood pressure < 100mm Hg), while doses lessthan those reported resulted in inadequate blood pressurelowering (systolic blood pressure> 130 mm Hg). !n no circum-stance did a dose differing from those reported by even 25percent result in acceptable blood pressure control.
Some of the rats in each group (N = 8 to 11) underwent wholekidney and glomerular hemodynamic studies at 6 to 10 weeksafter STZ injection. The long-term groups were followed withmonthly determinations of systolic blood pressure (SBP) by thetail cuff method [23], and were placed in metabolic cagesbimonthly for determination of 24-hour urinary albumin excre-tion rates (UaIbV). At 70 weeks, some of the rats underwentmeasurement of glomerular hemodynamics, and 8 to 14 rats ineach group were sacrificed for morphologic examination.
Separate groups of comparably treated rats were decapitatedand trunk blood collected in EDTA after 6 to 10 weeks ofdiabetes for determination of plasma renin concentration(PRC).
Micropuncture studies
Following BG measurement, rats were anesthetized withInactin (100 mg/kg i.p.) and placed on a temperature-regulatedtable. The left femoral artery was catheterized, and a baselinecollection of blood was obtained for measurement of hematocrit(Hct), inulin "blank", and plasma sodium and potassium levels.This arterial catheter was used for subsequent periodic bloodsampling and estimation of mean arterial pressure (AP) via anelectronic transducer connected to a direct-writing recorder.After tracheostomy, venous catheters were inserted for infu-sions of inulin and plasma. Intravenous infusions of rat plasma,and 10% inulin solution in 0.9% NaCI, were started at rates of6.0 and 1.2 mI/hr. respectively. The left ureter was catheterizedfor urine collection, and the left kidney exposed and suspendedon a lucite holder, with its surface illuminated and bathed withisotonic saline.
Since the plasma volume of rats prepared for micropunctureis reduced by —20% [24], euvolemia was maintained using thefollowing protocol. !soncotic rat plasma was infused at 6 mI/hrin a total amount equal to 1% of the body weight, followed bya reduction in infusion rate to 1.6 mI/kg/hr. to maintain the Hctconstant. Diabetic rats received extra saline to match theexcessive urinary losses during the procedure.
For calculation of SNGFR, exactly timed samples of tubulefluid were collected for determination of flow rate and inulinconcentration. Samples of efferent arteriolar blood were ob-
528 Anderson et a!: Prevention of glorneru!opathy in diabetes
tamed for determination of protein concentration. Coincidentwith these collections, arterial blood was obtained for determi-nation of Hct and plasma concentrations of inulin and protein,and 10 to 20 minute urine collections were obtained for deter-mination of flow rate and inulin concentration. These measure-ments permitted calculation of GFR (inulin clearance) by stan-dard formulas. Time-averaged hydraulic pressures weremeasured in surface glomerular capillaries, proximal tubules,and efferent arterioles with a servo-null micropipette transducersystem (Instrumentation for Physiology and Medicine, SanDiego, California, USA). Colloid osmotic pressure of plasmaentering and leaving glomerular capillaries was estimated fromvalues for protein concentration in femoral arterial (represent-ing afferent arteriolar) and efferent arteriolar plasma using theequation derived by Deen, et al [25]. These estimates of pre-and post-glomerular plasma protein concentration permit cal-culation of SN filtration fraction, glomerular capillary ultrafil-tration coefficient (Kr), and afferent and efferent arteriolar bloodflow rates and resistances, using equations previously described[25]. Continued hyperglycemia was confirmed by repeat BGmeasurement at the end of the procedure, at which time the leftkidney was weighed, and blood obtained for determination ofglycosylated hemoglobin (HbA1).
MorphologyKidneys were perfused at the measured systolic arterial
pressure for two to three minute with 1.25% glutaraldehyde in0.1 M sodium cacodylate buffer (pH 7.4). After perfusionfixation, the weights of both kidneys were recorded, and twomidcoronal slices of 2 to 3 mm thickness were processed forlight microscopic examination. Three micrometer-thick paraffinsections were stained with hematoxylin and eosin and by theperiodic acid Schiff (PAS) reaction. The extent of glomerulardamage was determined on PAS-stained slides by counting ontwo coronal sections all glomerular profiles with segmental orglobal collapse of capillaries with or without associated hyalindeposition and adhesion of the tuft to Bowman's capsule. Onaverage, 472 glomeruli per animal were evaluated, and theextent of glomerular sclerosis was expressed as the percentageof glomeruli with sclerotic lesions. -
The average glomerular tuft volume (V0)foreach animal wasdetermined by the procedure described by Weibel [26]. For thispurpose, the mean glomerular random cross-sectional area (AG)was determined on 50 systematically sampled glomerular tuftprofiles by point counting at a final magnification of 200 x usinga 361-point ocular grid covering a 369,664 m2 microscopicfield. VG was then calculated as V0 = (/31K)(A0)312, where /3 =1.38 and K = 1.1 are shape and size distribution coefficients [26,27].
AnalyticalThe volume of fluid collected from individual proximal tu-
bules was estimated from the length of the fluid column in aconstant bore capillary tube of known internal diameter. Thetubule fluid inulin concentration was measured by a micro-fluorescence method [28]. Inulin concentrations in plasma andurine were measured using a macro-anthrone method [29].Protein concentrations were determined using a fluorometricmethod [30]. Urinary albumin concentration was measured byradial immunodiffusion [31], Glycosylated hemoglobin was de-
• 300w
' 2000
100
0 8 16 24 32 40 48 56 64 72
Time, weeks of diabetes
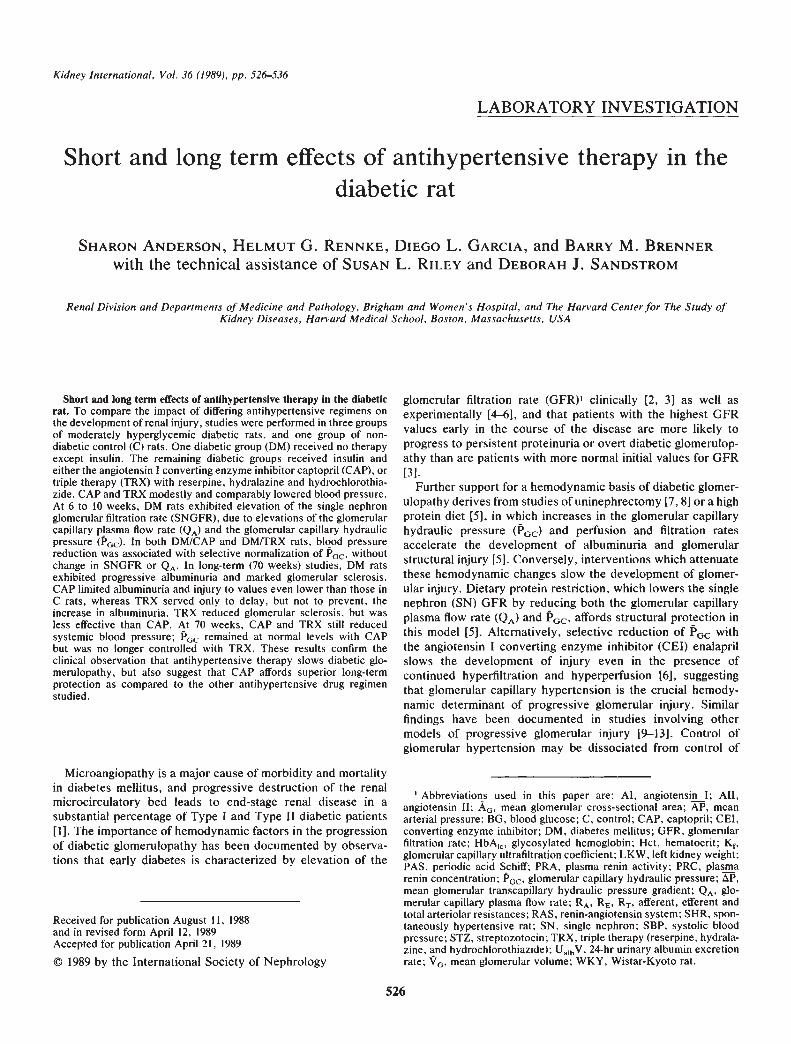
Fig. 1. Body weight. Serial values for body weight in non-diabeticcontrol rats (C, N = 15), diabetic rats (DM, N 14), and diabetic ratstreated with captopril (DM/CAP, N = 10) or triple therapy (DM/TRX,N = 12). At all points after the first, all diabetic groups weighedsignificantly less than did C rats, but body wt values did not differamong diabetic groups. Values are means SEM.
termined by affinity column chromatography (Glyco-Gel B,Pierce Chemical Co., Rockford, Illinois, USA) [321. Plasmasodium and potassium levels were measured by flame photom-etry. PRC was determined by incubating 0.1 ml of rat plasmawith 0.1 ml rat anephric plasma and 0.4 ml of 0.2 M maleatebuffer, pH 6.0 at 37°C for one hour. Appropriate dilutions of ratplasma samples were made using Tris buffer. The generation ofangiotensin I was then determined by radioimmunoassay usingcommercially available reagents (New England Nuclear, Bos-ton, Massachusetts, USA).
Statistical
Statistical analysis was performed by one-way analysis ofvariance followed by computation of modified t values for sixpreplanned pairwise comparisons according to the method ofBonferroni [33]. Statistical significance was defined asP < 0.05.Values for PRC, UaIbV, and glomerular sclerosis, which werenot normally distributed, were subjected to log transformationfor statistical analysis. All values represent means SEM.
Results
GeneralAll diabetic rats failed to gain weight during the first month of
diabetes, thus resulting in slightly slower growth than in non-diabetic C rats (Fig. 1). Thereafter, rates of weight gain werefairly comparable in all groups, though body weights in thediabetic groups never reached those of C rats. Comparablehyperglycemia was maintained in all diabetic groups (Fig. 2).Values for awake systolic blood pressure (Fig. 2) were slightlyelevated in DM rats, averaging 151 2 mm Hg over the 70 weekcourse, as compared to an average value of 125 1 mm Hg inC rats (P < 0.05). In both DM/CAP (120 2 mm Hg) andDM/TRX (118 2 mm Hg) groups, values for SBP weremodestly but significantly lower than in DM rats; at no time didvalues differ between CAP and TRX. Values for PRC deter-mined after 6 to 10 weeks of diabetes are depicted in Table 1. InDM rats, values for PRC were somewhat depressed as com-pared to non-diabetic rats (P < 0.05). Inhibition of convertingenzyme in DM/CAP rats was confirmed by marked elevation ofPRC (P < 0.05 vs. all other groups). In DM/TRX rats, stimu-
500
400C
DM/CAPDMDM/TRX

Anderson et a!: Prevention of glomerulopathy in diabetes 529
Time, weeks of diabetes
Fig. 2. Blood glucose and systolic blood pressure. Serial values forblood glucose (BG) and systolic blood pressure (SBP) in non-diabeticcontrol rats (C), diabetic rats (DM), and diabetic rats treated withcaptopril (DM/CAP) or triple therapy (DM/TRX). All diabetic groupsexhibited comparable hyperglycemia over time, with BG values con-sistently exceeding those in C rats, but not differing among diabeticgroups. Values for SBP were modestly but significantly elevated in DMrats as compared to non-diabetic C rats at all time points, while SBPwas significantly and comparably lowered in both DM/CAP and DM1TRX rats as compared to group DM. Values are means SEM; N as perFig. I.
lation of the plasma renin-angiotensin system was also appar-ent, with values for PRC above the normal range, though lowerthan in the DM/CAP rats (P < 0.05 vs. all other groups).
Insulin requirements did not differ among diabetic groups.Random measurements indicated that food and water intakewere supranormal in all diabetic groups, but did not differamong them. Intakes varied from day to day in all groups; theapproximate average range of daily intakes was 15 to 20 g foodand 15 to 30 ml water/day for control rats, and 35 to 50 g foodand 70 to 125 ml water/day for the diabetic groups.
Early micropuncture experimentsMean values for body weight, left kidney weight (LKW), BG,
HbAC, Hct, A, whole kidney GFR, and plasma sodium andpotassium levels at 6 to 10 weeks of diabetes, and in weight-matched non-diabetic control rats, are summarized in Table 2.Values for body wt did not differ among the groups. Increasedkidney weight was evident in all diabetic groups, with signifi-cant and equivalent elevations of LKW as compared to C rats.Hyperglycemia, as evidenced by elevation of both BG andHbAIC levels, was present in all diabetic groups. Hematocritwas slightly lower in both DM/CAP and DM/TRX groups thanin DM rats, but no diabetic group was significantly differentfrom controls. Values for AIwere equivalent in C and DM rats,whereas AP was comparably reduced in rats receiving CAP orTRX (both P < 0.05 vs. DM). Diabetic rats exhibited wholekidney hyperfiltration, with values in both treated groups beingslightly though not significantly lower than those in DM rats,and not different from one another. Values for plasma sodiumconcentration were comparable in the three diabetic groups.Plasma potassium levels tended to be slightly elevated in
GroupBody wt
gBG
mg/dlPRC
ng Al/mi/hr
C 285 II 89 7 10.0 1.5(N= II)
DM 260 8 286 8 4.9 o.8(N = 11)
DM/CAP 261 6 322 l0 3537 634a.b(N =7)
DM/TRX 276 12 305 l9 46.3(N = 7)
Abbreviations are: C, non-diabetic control; DM, diabetic; DM/CAP,DM + captopril; DMITRX, DM + triple therapy; Body wt, body weight;BG, blood glucose; PRC, plasma renin concentration; Al, angiotensin I.Values are means SEM.
P < 0.05 vs. Cb P < 0.05 vs. DMc P < 0.05 vs. DM/CAP
DM/CAP rats, and were statistically lower in DM/TRX groupsthan in the other diabetic groups.
Mean values for SNGFR, and the pressures, flows, andresistances governing glomerular ultrafiltration are summarizedin Table 3. As in previous studies [4—6], the moderately hyper-glycemic diabetic rats exhibited single nephron hyperfiltration;neither CAP nor TRX affected the supranormal SNGFR values.Values for SN filtration fraction were slightly higher in DM rats,and lower in both DM/CAP and DM/TRX rats, though thesedifferences did not reach statistical significance. All diabeticrats exhibited comparable levels of glomerular capillary hyper-perfusion, with comparable elevations of QA as compared tocontrols. In DM rats, glomerular hyperperfusion was accompa-nied by glomerular capillary hypertension; both the glomerularcapillary hydraulic pressure (PGC) and the glomerular transcap-illary hydraulic pressure gradient (P) were elevated signifi-cantly. Diabetes induced primarily afferent arteriolar vasodila-tation, so that both afferent arteriolar resistance (RA) and theratio of afferent arteriolar to total arteriolar resistance (RA/RT)were reduced. In DM/CAP and DM/TRX groups, afferentarteriolar vasodilatation was offset by concomitant efferentarteriolar vasodilatation, so that values for RA/RT were normal-ized, and values for GC and were maintained at levelscomparable to those seen in non-diabetic controls. Values forafferent and efferent protein concentrations and colloid osmoticpressures did not differ significantly. Values for K, the glomer-ular capillary ultrafiltration coefficient, were numericallythough not statistically lower in the DM rats, whereas they weremaintained at normal levels in both DM/CAP and DM/TRXrats; only the difference between DM and DM/TRX achievedstatistical significance. Thus, all diabetic groups exhibited sin-gle nephron hyperfiltration and hyperperfusion. In the DM rats,elevated SNGFR resulted from elevations in both QA and GC,while hyperfiltration in both treated groups resulted from ele-vation of QA and normalization of K. There were no significantdifferences between DM/CAP and DM/TRX rats in any param-eter measured.
Long-term studiesAs shown in Figure 2, stable moderate hyperglycemia was
maintained in the three diabetic groups, and blood pressures
OM/TAXDM/CAP
DM
—i C
400
E
200
0200
EEa-
100
Table 1. Plasma renin concentration at 6 to 10 weeks of diabetes
DM
0 8 16 24 32 40 48 56 64 72

530 Anderson et a!: Prevention of glomerulopathy in diabetes
Table 2. Systemic and whole kidney parameters at 6 to 10 weeks of diabetes
Body wt LKW BGmg/d!
HbAIC%
Hctvol/dI
APmm Hg
GFRmi/mm
Plasma
Na K
mF2q/literGroup g
C 262 8 0.95 0.04 88 3 5.2 0.4 46 I 114 3 1.08 0.05 — —(N = 8)
DM 275 7 1.21 0.osa 286 ioa 10.7 0.4a 48 I 117 3 1.69 0.08a 139 3 4.6 03(N = 8)
DM/CAP 269 6 1.24 O.O4 351 16a.b 12.8 05a.b 4 b 98 3a.b 1.39 0.08 135 3 5.3 0.2(N=8)
DM/TRX 270 5 1.23 0.05a 336 9a.b 10.7 0.4C 104 3b 1.54 0.07a 140 2 3.4 02b,c(N= 11)Abbreviations are: LKW, left kidney weight; HbA,, glycosylated hemoglobin; Hct, hematocrit; AP, mean arterial pressure; GFR, glomerular
filtration rate. Other abbreviations as in Table I. Values are means SEM. Normal values in this laboratory: Na, 143 2; K, 4.0 0.2.a P < 0.05 vs. Cb P < 0.05 vs. DMc P < 0.05 vs. DM/CAP
Table 3. Glomerular hemodynamics at 6 to 10 weeks of diabetes
GroupEMCPPni/mm SNFF
tTh'eAni/mm
GC T 1Emm Hg
C (N = 8) 42 3 0.29 0,02 146 12 48 1 14 0.3 18 1 34 1
DM (N = 8) 66 a 0.31 0.01 219 I9 64 2 13 0.4 18 1 51 2DM/CAP (N =DM/TRX (N =
8)11)
61 563 4
0.27 0.010.28 0,02
233 l9229 l4
47 1"49 1b
13 0.413 1
2219
1
1
3436 2"
Abbreviations used in this table: SN, single nephron; GFR, glomerular filtration rate; FF, filtration fraction; QA. glomerular capillary plasma flowrate; P0, mean glomerular capillary hydraulic pressure; T' mean proximal tubule hydraulic pressure; P, mean efferent arteriolar hydraulicpressure; F, mean glomerular transcapillary hydraulic pressure gradient; RA, RE and RT, aft'erent, efferent, and total (RA + RE) arteriolarresistances; CA and CE, aff'erent and efferent arteriolar plasma protein concentrations; IDA and 1T, afferent and efferent arteriolar colloid osmoticpressures; K1, glomerular capillary ultrafiltration coefficient; other abbreviations are in Table 1. Values are means SEM.
a P < 0.05 vs. Cb P < 0.05 vs. DM
Table 3. Continued
RA RE RT
x1O'°dyne sec cm5RA/RT CA
gld!
CE IDA 1TE
mm HgK1
ni/(sec. mm Hg)
1.98 0.23 1.03 0.06 3.01 0.29 0.65 0.02 5.4 0.1 7.7 0.2 17 I 30 1 0.080 0.0081.03 0.08a 1.09 0.11 2.12 0.17a 0.49 0.0 5.3 0.1 7.7 0.2 17 1 30 2 0.043 0.0051.02 0.07a 0.63 1.65 0.l2a 0.62 0.01" 5.3 0.2 7.3 0.3 17 1 28 2 0.092 0.0171.08 0.06a 0.71 004a.b 1.79 0.06 0.60 0.02" 5,4 0.1 7.5 0.2 18 1 29 1 0.113 0.022"
were maintained slightly lower in the groups receiving antihy-pertensive treatment. Final determinations of SBP, body wt,LKW, BG, and HbAIC are summarized in Table 4. Systolicblood pressures remained slightly elevated in DM rats, andcomparably reduced in DM/CAP and DM/TRX rats. Bodyweights in all diabetic groups were comparable, though lowerthan those in C rats. Increased kidney weight was present inDM rats, but limited to intermediate values in both treatedgroups. Values for BG and HbAIC were comparably elevated inall diabetic groups. Despite equivalent hyperglycemia andblood pressure, and comparable hemodynamics early in thecourse of diabetes, the long-term outcomes in the two treatedgroups differed substantially. Serial values for UaIbV are de-picted in Figure 3, and final values in Table 4. Non-diabetic Crats exhibited minimal UaIbV early in life, but, as in previousstudies [6, 141, developed a modest degree of age-relatedurinary albumin loss during the latter months of the study.
Diabetic rats receiving only insulin exhibited significant eleva-tions in UalbV as early as one month after induction of diabetes,and UA,bV increased markedly over time. During the first halfyear of diabetes, values for UalbV remained in the normal rangein rats receiving CAP and TRX; thereafter, values in DM/TRXrats rose substantially, eventually to values approaching thosein DM rats. By the final determination, values in DMJTRX ratswere still significantly lower than those in DM rats, but numer-ically higher than those in C rats. In contrast, after 16 months ofdiabetes, values in DMJCAP rats remained significantly lowerthan those in all other groups, including even the aging non-diabetic C rats.
Structural changes
Qualitatively, all diabetic groups exhibited identical changesin the thick ascending portion of Henle's loop and distalconvoluted tubules. Areas of tubular atrophy and interstitial
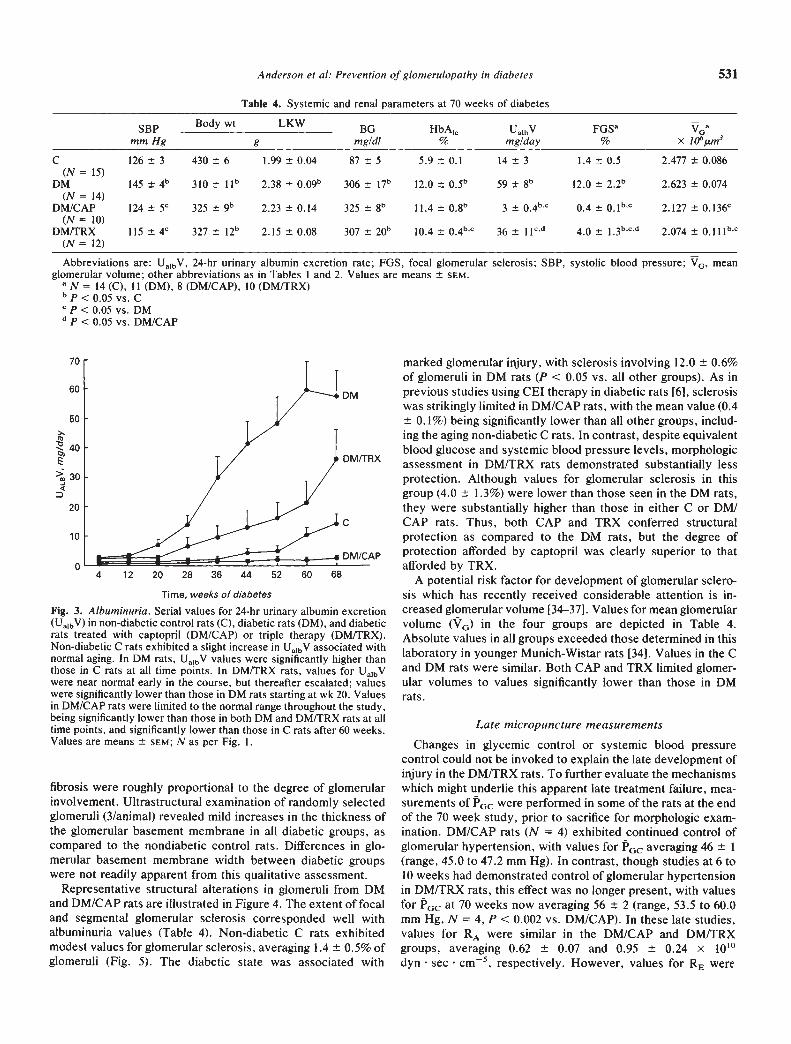
Anderson et a!: Prevention of glomerulopathy in diabetes 531
Table 4. Systemic and renal parameters at 70 weeks of diabetes
SBPmm Hg
Body wt LKW BGmg/d!
HbAIC%
UaIbVmg/day
FGS%
VX JOm3g
C 126 3 430 6 1.99 0.04 87 5 5.9 0.1 14 3 1.4 0.5 2.477 0.086(N = 15)
DM 145 4' 310 ii" 2.38 009b 306 17b 12.0 05b 59 8b l2.0 2,2b 2.623 0.074(N = 14)
DM/CAP 124 5C 325 9b 2.23 0.14 325 8b 11.4 0,8b 3 0.4 O.11C 2.127 0.l36c(N = 10)
DM/TRX 115 4C 327 12b 2.15 0.08 307 20b 10.4 04b.c 36 11c,d 4.0 1,3b 2,074 0111b,c(N = 12)
Abbreviations are: UajbV, 24-hr urinary albumin excretion rate; FGS, focal glomerular sclerosis; SBP, systolic blood pressure; V0. meanglomerular volume; other abbreviations as in Tables I and 2. Values are means SEM.
a N = 14 (C), 11 (DM), 8 (DM/CAP), 10 (DM/TRX)b P < 0.05 vs. C
p < 0.05 vs. DMd P < 0.05 vs. DM/CAP
fibrosis were roughly proportional to the degree of glomerularinvolvement. Ultrastructural examination of randomly selectedglomeruli (3/animal) revealed mild increases in the thickness ofthe glomerular basement membrane in all diabetic groups, ascompared to the nondiabetic control rats. Differences in gb-merular basement membrane width between diabetic groupswere not readily apparent from this qualitative assessment.
Representative structural alterations in glomeruli from DMand DM/CAP rats are illustrated in Figure 4. The extent of focaland segmental gbomerular sclerosis corresponded well withalbuminuria values (Table 4). Non-diabetic C rats exhibitedmodest values for glomerular sclerosis, averaging 1.4 0.5% ofgbomeruli (Fig. 5). The diabetic state was associated with
marked glomerular injury, with sclerosis involving 12.0 0.6%of glomeruli in DM rats (P < 0.05 vs. all other groups). As inprevious studies using CEI therapy in diabetic rats [6], sclerosiswas strikingly limited in DMICAP rats, with the mean value (0.4
0.1%) being significantly lower than all other groups, includ-ing the aging non-diabetic C rats. In contrast, despite equivalentblood glucose and systemic blood pressure levels, morphologicassessment in DMITRX rats demonstrated substantially lessprotection. Although values for glomerular sclerosis in thisgroup (4.0 1.3%) were lower than those seen in the DM rats,they were substantially higher than those in either C or DM1CAP rats. Thus, both CAP and TRX conferred structuralprotection as compared to the DM rats, but the degree of
DM/CAP protection afforded by captopril was clearly superior to thatafforded by TRX.
A potential risk factor for development of glomerular sclero-sis which has recently received considerable attention is in-creased glomerular volume [34—37]. Values for mean glomerularvolume (V0) in the four groups are depicted in Table 4.Absolute values in all groups exceeded those determined in thislaboratory in younger Munich-Wistar rats [34]. Values in the Cand DM rats were similar. Both CAP and TRX limited glomer-ular volumes to values significantly lower than those in DMrats.
Late micropuncture measurements
Changes in glycemic control or systemic blood pressurecontrol could not be invoked to explain the late development ofinjury in the DM/TRX rats. To further evaluate the mechanismswhich might underlie this apparent late treatment failure, mea-surements of P0c were performed in some of the rats at the endof the 70 week study, prior to sacrifice for morphologic exam-ination. DM/CAP rats (N = 4) exhibited continued control ofglomerular hypertension, with values for P0c averaging 46 1(range, 45.0 to 47.2 mm Hg). In contrast, though studies at 6 to10 weeks had demonstrated control of glomerular hypertensionin DM/TRX rats, this effect was no longer present, with valuesfor P0C at 70 weeks now averaging 56 2 (range, 53.5 to 60.0mm Hg, N = 4, P < 0.002 vs. DM/CAP). In these late studies,values for RA were similar in the DMICAP and DM/TRXgroups, averaging 0.62 0.07 and 0.95 0.24 x 10'°dyn sec cm5, respectively. However, values for RE were
p0>30
DM
20
DM/TRX
10
4 12
C
20 28 36 44 52 60 68
Time, weeks of diabetes
Fig. 3. Albuminuria. Serial values for 24-hr urinary albumin excretion(UaIbV) in non-diabetic control rats (C), diabetic rats (DM), and diabeticrats treated with captopril (DM/CAP) or triple therapy (DM/TRX).Non-diabetic C rats exhibited a slight increase in UaibV associated withnormal aging. In DM rats, UalbV values were significantly higher thanthose in C rats at all time points. In DM/TRX rats, values for UaIbVwere near normal early in the course, but thereafter escalated; valueswere significantly lower than those in DM rats starting at wk 20. Valuesin DM/CAP rats were limited to the normal range throughout the study,being significantly lower than those in both DM and DM/TRX rats at alltime points, and significantly lower than those in C rats after 60 weeks.Values are means 5EM; N as per Fig. I.
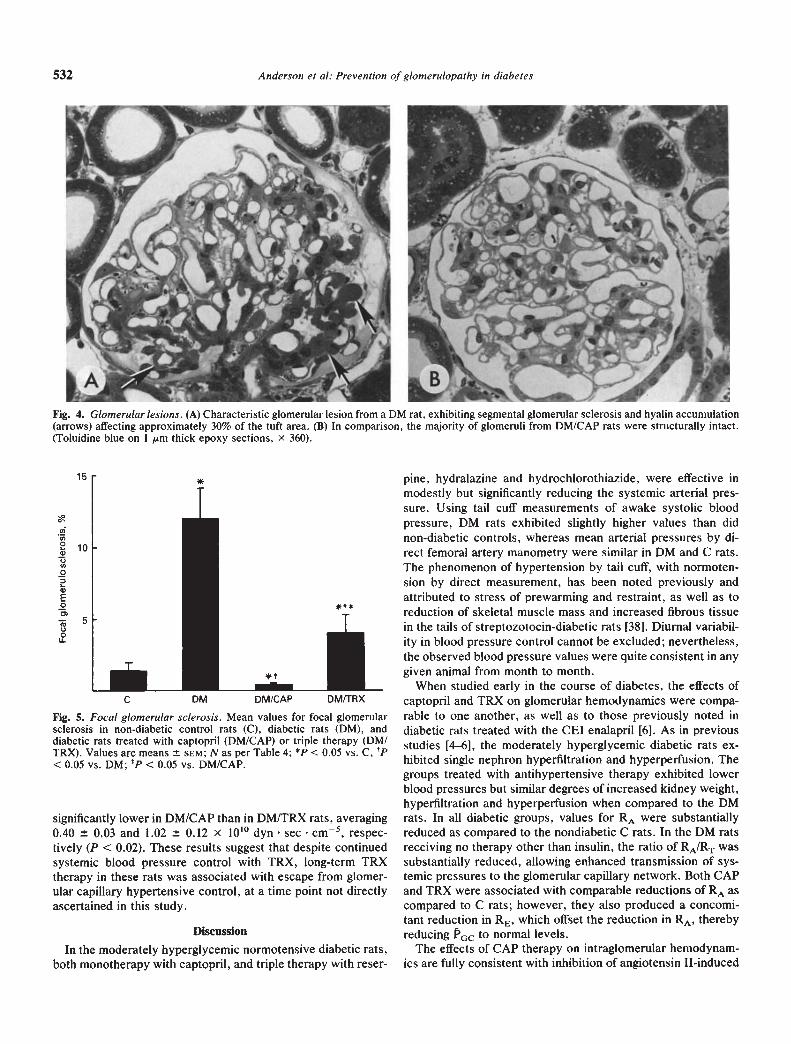
532 Anderson et a!: Prevention ofglomerulopathy in diabetes
Fig. 4. Glomerular lesions. (A) Characteristic glomerular lesion from a DM rat, exhibiting segmental glomerular sclerosis and hyalin accumulation(arrows) affecting approximately 30% of the tuft area. (B) In comparison, the majority ofglomeruli from DM/CAP rats were structurally intact.(Toluidine blue on I m thick epoxy sections, x 360).
significantly lower in DM/CAP than in DM/TRX rats, averaging0.40 0.03 and 1.02 0.12 x 10'° dyn sec cm5, respec-tively (P < 0.02). These results suggest that despite continuedsystemic blood pressure control with TRX, long-term TRXtherapy in these rats was associated with escape from glomer-ular capillary hypertensive control, at a time point not directlyascertained in this study.
Discussion
In the moderately hyperglycemic normotensive diabetic rats,both monotherapy with captopril, and triple therapy with reser-
pine, hydralazine and hydrochlorothiazide, were effective inmodestly but significantly reducing the systemic arterial pres-sure. Using tail cuff measurements of awake systolic bloodpressure, DM rats exhibited slightly higher values than didnon-diabetic controls, whereas mean arterial pressures by di-rect femoral artery manometry were similar in DM and C rats.The phenomenon of hypertension by tail cuff, with normoten-sion by direct measurement, has been noted previously andattributed to stress of prewarming and restraint, as well as toreduction of skeletal muscle mass and increased fibrous tissuein the tails of streptozotocin-diabetic rats [38]. Diurnal variabil-ity in blood pressure control cannot be excluded; nevertheless,the observed blood pressure values were quite consistent in anygiven animal from month to month.
When studied early in the course of diabetes, the effects ofcaptopril and TRX on glomerular hemodynamics were compa-rable to one another, as well as to those previously noted indiabetic rats treated with the CEI enalapril [6]. As in previousstudies [4—6], the moderately hyperglycemic diabetic rats ex-hibited single nephron hyperfiltration and hyperperfusion. Thegroups treated with antihypertensive therapy exhibited lowerblood pressures but similar degrees of increased kidney weight,hyperliltration and hyperperfusion when compared to the DMrats. In all diabetic groups, values for RA were substantiallyreduced as compared to the nondiabetic C rats. In the DM ratsreceiving no therapy other than insulin, the ratio of RA/RT wassubstantially reduced, allowing enhanced transmission of sys-temic pressures to the glomerular capillary network. Both CAPand TRX were associated with comparable reductions of RA ascompared to C rats; however, they also produced a concomi-tant reduction in RE, which offset the reduction in RA, therebyreducing P0 to normal levels.
The effects of CAP therapy on intraglomerular hemodynam-ics are fully consistent with inhibition of angiotensin Il-induced
15
CA
Fig. 5. Focal glomerular sclerosis. Mean values for focal glomerularsclerosis in non-diabetic control rats (C), diabetic rats (DM), anddiabetic rats treated with captopril (DM/CAP) or triple therapy (DM1TRX). Values are means 5EM; N as per Table 4; p < 0.05 vs. C, tp<0.05 vs. DM; P < 0.05 vs. DM/CAP.
C DM OM/CAP DM/TRX
21

Anderson et al: Prevention of glornerulopathy in diabetes 533
enhancement of efferent arteriolar tone, as well as with numer-ous previous studies demonstrating efferent arteriolar relax-ation with these agents in various experimental models [6,9—14]. The intraglomerular hemodynamic consequences of TRXin this model were more difficult to predict, since TRX lowersRE in some models [13, 171 but not in others [10, 18, 19].Activity of the systemic blood renin-angiotensin system (RAS)does not appear to be a critical factor, since this regimen lowersRE in some models of low renin hypertension, such as theuninephrectomized SHR [13], but not in others, including thepartially nephrectomized rat [10] and mine ralocorticoid-salthypertension [18]. Of interest, this regimen raises PRC and failsto lower RE and P0 in the partially nephrectomized rat [10],which is characterized by plasma volume expansion [39]. In themoderately hyperglycemic diabetic rat, which is also character-ized by plasma volume expansion [40] and low !RC values, thisregimen also raises PRC, but lowers RE and GC early in thecourse of diabetes. Thus, plasma volume and PRC do notappear to be consistent predictors of the glomerular hemody-namic consequences of this vasodilator/diuretic regimen. Theseobservations are consistent with the growing body of evidencewhich suggests that the tissue (including intrarenal) RAS maybe a more important contributor to systemic and local vascularhemodynamic regulation than is the plasma RAS [41].
During the early months of diabetes, control of systemicblood pressure with either TRX or captopril markedly limitedthe development of albuminuria. Thereafter, while UalbV val-ues in DM/CAP rats remained at levels which were eventuallyeven lower than those in aging non-diabetic C rats, mean valuesin DM/TRX rats escalated in dramatic fashion. These resultsare reminiscent of those previously noted in another two-kidneylow-renin model, the spontaneously hypertensive rat (SHR), inwhich TRX was felt to prevent [42], but later found only todelay [43], the development of glomerular injury. Of particularimportance is the observation that after 70 weeks of diabetes,captopril afforded continued control of glomerular capillaryhypertension, as previously noted with enalapril therapy in apost-nephrotic model of glomerular injury in rats followed for acomparable period of time [14]. In contrast, despite continuingcontrol of systemic hypertension, the aging DM/TRX rats hadescaped from GC control, and exhibited a concurrent rise inalbuminuria. The possibility that glomerular injury may haveinfluenced hemodynamic findings in the DM/TRX rats studiedlate in the course cannot be totally excluded. However, valuesfor UaIbV in the animals examined were still low (< 10 mg/d) inthree animals, and elevated (26 mg/day) in only one. Accord-ingly, it seems unlikely that glomerular injury was sufficient toexplain the glomerular hypertension found in all of theseanimals.
As in previous studies with dietary protein restriction [5] andCE! therapy [6] in this model, development of albuminuriaclearly had no relation to metabolic control; values for BG werecontinuously comparable in all diabetic groups, and values forHbAIC were highest in the DM/CAP rats, which consistentlyexhibited the lowest Ua(bV levels.
Changes in glomerular volume were also not helpful indifferentiating between the outcomes of the treated groups,though the reduction in glomerular volume may help to explainthe protection afforded by both regimens as compared to theDM rats. Increased glomerular volume has been noted previ-
ously in diabetes [35, 44] as well as in other experimentalmodels characterized by hyperfiltration and particularly byglomerular hypertension [9]. When the adaptive increase inglomerular volume is prevented by dietary protein restriction indiabetic rats [35], by CE! therapy in rats with renal ablation [9],in adriamycin-induced proteinuria [34], or in a model of renalablation with contralateral ureteral diversion [36], glomerularsclerosis is also limited. In the present study, both antihyper-tensive regimens limited glomerular volumes to the same ex-tent. For the DM/CAP group, in which GCwas also limited tonormal values, glomerular injury was virtually non-existent. Inthe DM/TRX rats, lack of control of P (at least in the latestages) appeared to be the more significant predictor of glomer-ular injury. Thus, changes in glomerular volume alone cannotfully explain the development of glomerular injury in thismodel.
The design of this study did not allow documentation of thepoint at which control of glomerular hypertension in DM/TRXrats was lost, though examination of the albuminuria curvesmay suggest that albuminuria, perhaps reflecting glomerularpressure, began to rise sharply after about six or seven monthsof diabetes (Fig. 3). However, evidence suggests that the levelsof putative vasoactive mediators may change during the courseof long-term diabetes. Early diabetes is characterized by rela-tively low values for plasma renin activity (PRA) and plasmaAll levels, with normal levels of inactive renin and serumconverting enzyme, and appropriate suppression of PRA withincreased blood pressure or sodium intake [45—50]. However,later in the course, after albuminuna supervenes, values forPRA and inactive renin rise [46, 47], and converting enzymelevels tend to increase with duration of streptozotocin diabetes[51]. Lower doses of exogenous A!! are required to raise bloodpressure, and suppression of PRA with increased blood pres-sure or sodium intake is impaired [45]. These observationssuggest enhanced vascular responsiveness to vasoactive stim-uli, including All, in the presence of albuminuria and diabeticglomerulopathy. In addition, it has been recently reported thatthe number of glomerular A!! binding sites in the rat increaseswith advancing age [52]. In the present study, such alterationsin the renin-angiotensin system over time may well havecontributed to the altered glomerular hemodynamic response inthe DM/TRX rats. Similarly, local prostaglandin levels andcirculating levels of atrial peptides also undergo changes fromnormal in diabetes [40, 53] as well as during the course of thedisease [53], and may also contribute to sequential changes inglomerular hemodynamics over the extended course of thisstudy. Clearly, further studies of sequential alterations in vaso-regulatory factors in diabetes are required to understand thenatural history of this disease, as well as the long-term conse-quences of therapy.
Results in the DM/CAP rats herein confirm those noted in thislaboratory with the CE! enalapril in this model [6]. In otherstudies in which glomerular hemodynamics were not measured,CE! therapy limited albuminuria, mesangial expansion, andglomerular basement membrane thickening in the diabetic SHR[54], and reduced blood pressure, filtration fraction (presum-ably reflecting P0), and proteinuria in uninephrectomizeddiabetic rats [55]. In relatively short-term studies, administra-tion of TRX lowered blood pressure and limited injury in thediabetic SHR [56, 57]. Bank and coworkers [571 reported that
534 Anderson et a!: Prevention of glomerulopathy in diabetes
moderately hyperglycemic diabetic SHR and Wistar Kyoto(WKY) rats both exhibited increases in SNGFR, QA and P0c ascompared to nondiabetic controls, with values for GC beingslightly though significantly higher in the diabetic SHR than thediabetic WKY. Unfortunately, that study was terminated priorto the development of proteinuria or substantial glomerularinjury. At the time of sacrifice, mesangial expansion wascomparable in the diabetic SHR and WKY, and ameliorated ina third group of diabetic SHR in which antihypertensive therapylowered GC toward, but not to the normal range. Thus, withinthe scope of that study [57], both diabetic groups exhibitedglomerular hypertension and mesangial expansion, while thegroup receiving TRX exhibited lower values for both P andmesangial expansion. These results are comparable to thoseseen in the current study, where TRX lowered GC and UajbVduring the early months of diabetes; however, the effects of thisregimen on long-term development of albuminuria and glomer-ular obsolescence in the diabetic SHR remain to be examined.
Clinical studies spanning as many as six years have estab-lished that antihypertensive therapy started relatively early inthe course of diabetic nephropathy slows the progression ofrenal disease [15, 16]. Typically, the antihypertensive regimenshave consisted of a diuretic, a vasodilator, and a beta-blocker,and it might be speculated that the latter would tend to suppressthe RAS. However, while these studies are encouraging, theyhave yet to reach sufficient duration to establish whetherdiabetic nephropathy is truly prevented, rather than delayed. Ofnote, diuretic therapy (which would be expected to stimulatethe RAS) has recently been correlated with accelerated devel-opment of clinical diabetic glomerulopathy [58]. In patients withadvanced diabetic nephropathy, administration of captopril hasbeen reported to markedly slow the progression of renal insuf-ficiency [59], though only comparison to other reported studiescould be made. To date there are no adequate studies compar-ing CEI to alternative antihypertensive regimens in diabeticpatients. However, in patients with non-diabetic renal disease,several recent preliminary short-term studies suggest that CE!may be superior to conventional combination regimens inreducing proteinuria [20—22], and perhaps in slowing diseaseprogression. That the beneficial effects of CE! are not entirelydue to reduction in systemic pressure is indicated by observa-tions that CE! therapy reduces UaIbV in the absence of sub-stantial changes in either blood pressure or GFR, suggestingthat the reduction in Ua}bV excretion may be a direct conse-quence of control of P0c [60—62].
In summary, the long-term consequences of captopril andTRX were compared in moderately hyperglycemic diabeticrats. Blood pressure was modestly and comparably reduced inboth treated groups as compared to the normotensive diabeticrats receiving only insulin. Early in diabetes, CAP and TRXwere equally effective in selectively controlling glomerularhypertension, without affecting SNGFR or QA. At this time,both regimens were effective in preventing albuminuria, thoughcaptopnl appeared slightly more efficacious than TRX. There-after, TRX rats rapidly developed albuminuria, and despitecontinued control of systemic blood pressure, this group devel-oped glomerular hypertension and moderate glomerular injury.Captopril therapy afforded continued control of systemic andglomerular hypertension, and prevented the development of
glomerular injury. These studies lend further support to theprevious observations [5, 6] that hemodynamic rather thanmetabolic factors predominate in the pathogenesis of glomeru-lar injury in the diabetic rat. Furthermore, these studies confirmthe clinical observations that antihypertensive therapy slowsthe progression of diabetic renal disease, but also indicate thatcaptopril is more effective than TRX in preventing the devel-opment of glomerulopathy in experimental diabetes. Theseobservations underscore the need for clinical studies to ascer-tain whether agents such as CE!, which offer continuing controlof glomerular hypertension in the rat, will provide superiorprotection against the devastating glomerular and extrarenalmicrovascular complications of the diabetic state.
Acknowledgments
Portions of these studies were presented at the 21st Annual Meetingof the American Society of Nephrology, Dec. 3988, and published inabstract form (Kidney mt 35:422, 1989). These studies were supportedby grants from the National Institutes of Health (AM 35930 and DK30410) and from the Squibb Institute for Medical Research. D.L.G. wasthe recipient of a Research Fellowship Award from the National KidneyFoundation/Burroughs Wellcome Foundation. We are grateful to L.E.Clarey, S.J. Downes, K.J. Sandquist, and J.L. Troy for technicalassistance.
Reprint requests to Sharon Anderson, M.D., Renal Division,
Brigham and Women's Hospital, 75 Francis St., Boston, Massachu-setts 02115, USA.
References
I. RITZ E, HASSLACHER C, TSCHOPE W, KOCH M, MANN JFE:Hypertension in diabetes mellitus. Cont rib Nephrol 54:77—85, 1987
2. STALDER G, SCHMID R: Severe functional disorders of glomerularcapillaries and renal hemodynamics in treated diabetes mellitusduring childhood. Ann Paediatr 193:129—138, 1959
3. MOGENSEN CE, CHRISTENSEN CK: Predicting diabetic nephrop-athy in insulin-dependent patients. N EngI J Med 311:89—93, 1984
4. HOSTETTER TH, TROY JL, BRENNER BM: Glomerular hemodynam-ics in experimental diabetes mellitus. Kidney mt 19:410—415, 1981
5. ZATZ R, MEYER TW, RENNKE HG, BRENNER BM: Predominanceof hemodynamic rather than metabolic factors in the pathogenesisof diabetic glomerulopathy. Proc Nat Acad Sci (USA) 82:5963—5967, 1985
6. ZATZ R, DUNN BR, MEYER TW, ANDERSON S, RENNKE HG,BRENNER BM: Prevention of diabetic glomerulopathy by pharma-cological amelioration of glomerular capillary hypertension. J ClinInvest 77:1925—3930, 1986
7. STEFFES MW. BROWN DM, MAUER SM: Diabetic glomerulopathyfollowing unilateral nephrectomy in the rat. Diabetes 27:35—41,
19788. O'DONNELL MP, KASISKE BL, DANIELS FX, KEANE WF: Effect of
nephron loss on glomerular hemodynamics and morphology indiabetic rats. Diabetes 35:1011—1015, 1986
9. ANDERSON S. MEYER TW, RENNKE HG, BRENNER BM: Control ofglonierular hypertension limits glomerular injury in rats with re-duced renal mass. J Clin Invest 76:612—619, 1985
10. ANDERSON S. RENNKE HG, BRENNER BM: Therapeutic advantageof converting enzyme inhibitors in arresting progressive renaldisease associated with systemic hypertension in the rat. J ClinInvest 77:1993—2000, 1986
II. MEYER TW, ANDERSON 5, RENNKE HG, BRENNER BM: Reversingglomerular hypertension stabilizes established glomerular injury.Kidney mt 3 3:752—759, 1987
12. GARCIA DL, RENNKE HG, BRENNER BM, ANDERSON 5: Chronicglucocorticoid therapy amplifies glomerular injury in rats with renalablation. J Clin Invest 80:867—874, 1987
13. DW0RKIN LD, GROSSER M, FEINER H, ULLIAN M, RANDAZZO J,
Anderson et a!: Prevention of glomerulopathy in diabetes 535
PARKER M: Renal vascular effects of antihypertensive therapy inthe uninephrectomized SHR. Kidney mx 35:790—798, 1989
14. ANDERSON S, DIAMOND JR, KARNOVSKY MJ, BRENNER BM:Mechanisms underlying transition from acute glomerular injury toglomeruloscierosis in a rat model of nephrotic syndrome. J Clininvest 82:1757—1768, 1988
15. MOGENSEN CE: Long-term antihypertensive treatment inhibitingprogression of diabetic nephropathy. Br Med J 285:685—688, 1982
16. PARVING H-H, ANDERSEN AR, SMIDT UM, HOMMEL E, MATHIE-SEN ER, SVENDSEN PA: Effect of antihypertensive treatment onkidney function in diabetic nephropathy. Brit MedJ 294:1443—1447,1987
17. NEUGARTEN J, KAMINETSKY B, FEINER H, SCHACHT RG, Lw DT,BALDWIN DS: Nephrotoxic serum nephritis with hypertension:Amelioration by antihypertensive therapy. Kidney ml 28:135—139,1985
18. DWORKIN LD, FEINER HD, RANDAZZO J: Glomerular hyperten-sion and injury in desoxyorticosterone-salt rats on antihypertensivetherapy. Kidney mt 31:718—724, 1987
19. AZAR S. KEANE W, RAIJ L: Antihypertensive therapy in nephriticspontaneously hypertensive rats. Effects on nephron dynamics andmorphology. (abstract) Kidney mt 27:187, 1985
20. HEEG JE, DE J0NG E, VAN DER HEM OK, DE ZEEUW D:Reduction of proteinuria by angiotensin converting enzyme inhibi-tion. Kidney ml 32:78—83, 1987
21. MANN J, RITZ E: Preservation of kidney function by use ofconverting enzyme inhibitors for control of hypertension. Lancet2:622, 1987
22. RUILOPE LM, MIRANDA B, MORALES JM, RoDiclo JL, R0MER0JC, RAIJ L: Converting enzyme inhibition in chronic renal failure.AmfKidDis 13:120—126,1989
23, PFEFFER JM, PFEFFER MA, FROHLICH ED: Validity of an indirecttail-cuff method for determining systolic arterial pressure in unan-esthetized normotensive and spontaneously hypertensive rats. JLab Clin Med 78:957—962, 1971
24. MADDOX DA, PRICE DC, RECTOR FC JR: Effects of surgery onplasma volume and salt and water excretion in rats. Am J Physiol233:F600—F606, 1977
25. DEEN WM, TROY JL, ROBERTSON CR, BRENNER BM: Dynamics ofglomerular ultrafiltration in the rat. IV. Determination of theultrafiltration coefficient. J C/in invest 52:1500-1508, 1973
26. WEIBEL ER: Stereological Methods: Practical Methods for Biolog-ical Morphometry. London, Academic Press, Inc., 1979, pp. 5 1—57
27. HIROSE K, OSTERBY R, NOZAWA M, GUNDERSEN HJG: Develop-ment of glomerular lesions in experimental long-term diabetes inthe rat. Kidney mt 21:689—695, 1982
28. VUREK GC, PEGRAM SE: Fluorometric method for the determina-tion of nanogram quantities of inulin. Anal Biochem 16:409—419,1966
29. FUHR J, KACMARCZYK i, KRUTTGEN CD: Eine einfache colorime-tnsche Methode zur Inulinbestimmung fur Nieren-clearance-Unter-suchungen bei Stoffwechselgesunden und Diabetikern. K/inWochenschr 33:729—730, 1955
30. VIETS JW, DEEN WM, TROY JL, BRENNER BM: Determination ofserum protein concentration in nanoliter blood samples usingflorescamine or o-ophthalaldehyde. Anal Biochem 88:513—521, 1978
31. MANcINI G, CARBONARO AO, HEREMANS iF: Immunochemicalquantitation of antigens by single radial immunodiffusion. Immu-nochemistry 2:235—254, 1965
32. GARLICK RL, MAZER iS, HIGGINS Pi, BUNN HF: Characterizationof glycated hemoglobins. Relevance to monitoring of diabeticcontrol and analysis of other proteins. J C/in Invest 71:1062—1072,
198333. WALLENSTEIN S, ZUCKER CL, FLEISS iL: Some statistical methods
useful in circulation research. Circ Res 47:1—9, 198034. FRIES JWU, SANDSTROM DJ, MEYER TW, RENNKE HG: Glomer-
ular hypertrophy and epithelial cell injury modulate progressiveglomerulosclerosis in the rat. Lab Invest 60:205—218, 1989
35. RENNKE HG, SANDSTROM D, ZATZ R, MEYER TW, COWAN RS,BRENNER BM: The role of dietary protein in the development ofglomerular structural alterations in long term experimental diabetesmellitus. (abstract) Kidney mt 29:289, 1986
36. YOSI-IIDA Y, FoGo A, ICHIKAWA I: Glomerular hemodynamicchanges vs. hypertrophy in experimental glomerular sclerosis.Kidney mt 35:654—660, 1989
37. KLAHR S, SCHREINER GE, ICHIKAWA I: The progression of renaldisease. N Eng! J Med 318:1657—1666, 1988
38. KUSAKA M, KISHI K, SOKABE H: Does so-called streptozotocinhypertension exist in rats? Hypertension 10:517—521, 1987
39. KAYSEN GA, WATSON JB: Mechanism of hypoalbuminemia in the7/8-nephrectomized rat with chronic renal failure. Am J Physiol243:F372—F378, 1982
40. ORTOLA FV, BALLERMANN BJ, ANDERSON S, BRENNER BM:Atrial natriuretic peptide is a potent mediator of hyperfiltration indiabetic rats, in Advances in A trial Peptide Research, edited byLARAGH JH, BRENNER BM, New York, Raven Press, 1988, pp.350—354
41. DZAU Vi: Circulating versus local renin-angiotensin system incardiovascular homeostasis. Circulation 77 (Suppl l):1-4—I-13, 1988
42. FREIS ED, RAGAN D, PILLSBURY H, MATHEWS M: Alteration ofthe course of hypertension in the spontaneously hypertensive rat.Circ Res 31:1—7, 1972
43. FELD LG, VAN LIEw JB, BRENTJENS JR. BOYLAN iW: Renallesions and proteinuria in the spontaneously hypertensive rat madenormotensive by treatment. Kidney mnt 20:606—614, 1981
44. SEYER-HANSEN K, HANSEN i, GUNDERSEN HJG: Renal hypertro-phy in experimental diabetes: A morphometric study. Diabetologia18:501—505, 1980
45. WEIDMANN B, BERETTA-PICCOLI C, TROST BN: Pressor factorsand responsiveness in hypertension accompanying diabetes melli-tus. Hypertension 7 (Suppl II):II-33—1I-42, 1985
46. LUETSCHER iA, KRAEMER FB, WILSoN DM, SCHWARTZ HC,BRYER-ASH M: Increased plasma inactive renin in diabetes melli-tus. A marker for microvascular complications. N EngI J Med312:1412—1417, 1985
47. LUETSCHER JA, KRAEMER FB: Microalbuminuria and increasedplasma prorenin. Prevalence in diabetics followed up to four years.Arch intern Med 148:937—941, 1988
48. O'HARE iA, FERRIS iB, BRADY D, TWOMEY B, O'SULLIVAN Di:Exchangeable sodium and renin in hypertensive diabetic patientswith and without nephropathy. Hypertension 7 (Suppl 1I):II-43—11-48, 1985
49. DRURY PL, BODANSKY Hi: The relationship of the renin-angio-tensin system in Type I diabetes to microvascular disease. Hyper-tension 7 (Suppl H):1I-84—II-89, 1985
50. RAMOS OL: Diabetes mellitus and hypertension. State of the artlecture. Hypertension 11 (Suppl I):1-l4—I-18, 1988
51. VALENTONOVIC MA, ELLIOTT C: Angiotensin converting enzymeactivity as a function of the duration of streptozotocin-induceddiabetes. (abstract) Fed Proc 45:463, 1986
52. WILKEs BM: Increased angiotensin 11 receptor binding with age inisolated rat glomeruli. Kidney mnt 34:241—247, 1988
53. CRAVEN PA, CAINES MA, DERUBERTIS FR: Sequential alterationsin glomerular prostaglandin and thromboxane synthesis in diabeticrats: Relationship to the hyperfiltration of early diabetes. Metabo-lism 36:95—103, 1987
54. Coo ME, ALLEN Ti, MACMILLAN P. BACH L, JERUMS G,DOYLE AE: Genetic hypertension accelerates nephropathy in thestreptozotocin diabetic rat. Am J Hypertens 1:5—10, 1988
55. JACKSON B, DEBREVI L, WHITTY M, JOHNSTON CI: Progression ofrenal disease: effects of different classes of antihypertensive ther-apy. J Hypertension 4 (Suppl. 5):S269—5271, 1986
56. RABKIN R, PETERSEN J, KITAJI i, MARCK B, MURPHY E, MUIR-HEAD EE: Effect of antihypertensive therapy on the kidney inspontaneously hypertensive rats with diabetes. (abstract) Kidneymt 25:205, 1984
57. BANK N, KI0SE R, AYNEDJIAN HS, NGUYEN D, SABLAY LB:Evidence against increased glomerular pressure initiating diabeticnephropathy. Kidney mnt 31:898—905, 1987
58. WALKER WG, HERMANN J, WHELTON PK: Diuretics acceleratemicroalbumin excretion rates in diabetics and hypertensives. (ab-stract) Kidney Int 33:192, 1988
59. BJORCK 5, NYBERG 0, MULEC H, GRANERUS G, HERLITZ H,AURELL M: Beneficial effects of angiotensin converting enzyme
536 Anderson et at: Prevention of glomerulopathy in diabetes
inhibition on renal function in patients with diabetic nephropathy.Brit Med J 293:471—474, 1986
60. TAGUMA Y, KITAMOTO Y, FUTAKI G, UEDA H, MONMA H,ISHIZAKI M, TAKAHASHI H, SEKINO H, SASAKI Y: Effect ofcaptopnl on heavy proteinuria in azotemic diabetics. NEngiJMed313:1617—1620, 1985
61. PARVING H-H, HOMMEL E, SMIDT UM: Protection of kidney
function and decrease in albuminuria by captopril in insulin de-pendent diabetics with nephropathy. Brit Med J 297:1086—1091,1988
62. MARRE M, CHATELIER G, LEBLANC H, GUYENNE T-T, MENARD J,PASSA P: Prevention of diabetic nephropathy with enalapril innormotensive diabetics with microalbuminuria. Brit Med J 297:1092—1095, 1988