
SHORT QUESTIONS
97
RISK AND RETURN ANALYSIS OF COMMERCIAL BANK IN NEPAL By: Narayan Prasad Paudel Prithivi Narayan Campus T.U. Registration Number: 7-1-326-161-98 A Thesis Submitted to: Office of the Dean Faculty of Management Tribhuvan University In partial fulfilment of the requirements for the degree of Master of Business Studies (M.B.S.) Pokhara July, 2009
-
Upload
khangminh22 -
Category
Documents
-
view
1 -
download
0
Transcript of SHORT QUESTIONS

RISK AND RETURN ANALYSIS
OF
COMMERCIAL BANK IN NEPAL
By:Narayan Prasad PaudelPrithivi Narayan Campus
T.U. Registration Number: 7-1-326-161-98
A Thesis Submitted to:
Office of the DeanFaculty of ManagementTribhuvan University
In partial fulfilment of the requirements for the degree ofMaster of Business Studies (M.B.S.)
PokharaJuly, 2009

RECOMMENDATION
This is to certify that the thesis:
Submitted by:
Narayan Prasad Paudel
Entitled
RISK AND RETURN ANALYSISOF
COMMERCIAL BANK IN NEPAL
has been prepared as approved by this Department in theprescribed format of Faculty of Management. This thesis isforwarded for examination.
Supervisor Head of Department
Name: Janak Bdr. Basnet Signature:
Signature: Campus Chief
Signature:
Date:

VIVA-VOCE SHEET
We have conducted the viva-voce examination of the thesis
Submitted by:
Narayan Prasad Paudel
Entitled
RISK AND RETURN ANALYSISOF
COMMERCIAL BANK IN NEPAL
and found the thesis to be the original work of thestudent and written according to the prescribedformat. We recommend the thesis to be accepted aspartial fulfillment of the requirements for degree of
Master of Business Studies (M.B.S.)
Viva-Voce Committee
Chairperson, Research Committee: ………………………………………………
Member (Thesis supervisor): ………………………………………………………
Member (External expert): …………………………………………………………
Member: …………………………………………………………………………………
Date:
ACKNOWLEDGEMENTS
This Theses is for Master's Degree in Business studies (MBS) undertaken at
Tribhuvan University of Nepal. For this I gained lots of guidelines and
suggestions from my teachers, friends, other company's officials and my
relatives. Firstly, I wish to express my profound gratitude to my respectable
supervisor Janak Bahadur Basnet, Teaching Assistance, P.N. Campus and Dr.
Puspa Raj Sharma, PhD, Lecturer, Faculty of Management, Head of Research
Department, P.N. Campus for their valuable guidance throught the work and
my teachers who inspire me to do this study.
I acknowledge staff of Nepal Stock Exchange, Nepal Rastra Bank, Securities
Board of Nepal and selected bank in this study, who provided sources of data
and other information for this study. I also acknowledge my friend Mr Dhurba
Bahadur Chhatri, Laxman Rakhal, and Tilak Ram Lamichhena for their help.
I would also like to thanks my respected teacher. Similarly I would like to
thank my office member for their advise and inspiring matters.
Finally. I would like to express my sincere gratitude to the staff of Western
Regional Library, Pokhara for their cooperation.
Narayan Prasad Paudel

TABLE OF CONTENTS
Acknowledgements
Chapter Page
I. INTRODUCTION 1-6
Background of the study 1Focus of the Study 2Statement of the Problem 4Objectives of the Study 5Significance of the Study 5Limitation of the Study 6Organization of the Study 6
II. REVIEW OF LITERATURE 7-28
Conceptual Review 7Research Review 20
III. RESEARCH METHODOLOGY 29-35Research Design 29Population and Sample 30Sources of Data 30Data Collection and Techniques 30Data Analysis Tools 31Limitation of Methodology 35
IV. PRESENTATION AND ANALYSIS OF DATA 36-58
Data Presentation and Analysis 36
Major Findings of the Study 57
V. SUMMARY, CONCLUSIONS AND RECOMMENDATIONS 59-62
Summary 59
Conclusions 60Recommendations 61
BIBLIOGRAPHYAPPENDICES

LIST OF TABLES
Table Page
4.1 Historical Return and Average Rate of Return of NABIL
3
7
4.2 Historical Return and Average Annual Return of HBL
3
9
4.3 Historical Returns and Average annual rate of NIB
4
0
4.4 Historical Return and Average Rate of Return of EBL.
4
2
4.5 Comparative Analysis of Historical Return of Sampled Banks
4
4
4.6 Expected Market Return and Commercial Banks Return
4
6
4.7 Risk Premium of Individual Banks, Capital Market and
Commercial Bank Sectors Index
48
4.8 Average Rate of Return and Required Rate of Return
4
9
4.9 Risk Analysis of NABIL Bank
5
0
4.10 Risk Analysis of HBL
5
1
4.11 Risk Analysis of Investment Bank
5
2
4.12 Risk Analysis of Everest Bank
5
3
4.13 Comparative Analysis of four Sampled Banks
5
4
4.14 Risk Analysis of Overall Capital Market Relative to Commercial
Banks Index
5
5
4.15 Correlation between Risk and Expected Return
5
6

LIST OF FIGURES
Figure
Page
4.1 Trend Line of Historical Return of NABIL Bank
3
8
4.2 Trend line of Historical Return of HBL
4
0
4.3 Trend line of Historical Return of NIB
4
1
4.4 Trend Line of Historical Return of EBL
4
3
4.5 Comparative Analysis of Historical Return of Sampled Banks
4
5
4.6 Expected Market Return and Commercial Banks Return
4
7

LIST OF ABBREVIATIONS USED
BS : Bikram Sambat
CAPM : Capital Assets Pricing Model
CS : Common Stock
Div : Dividend
DPS : Dividend Per Share
EBL : Everest Bank Limited
FY : Fiscal Year
HBL : Himalayan Bank Limited
MPS : Market Price Per Share
NABIL : Nabil Bank
NEPSE : Nepal Stock Exchange
NIB : Nepal Investment Bank
Rp : Risk Premium
Rs : Nepalese Rupees
SEBO/N : Security Board Nepal
SML : Security Market Line

CHAPTER I
INTRODUCTION
1.1 Background of the Study
Commercial Bank is a legally formed financial institution, which
collects scattered idle funds from the people as deposit and provides it to
the investor as loan for productive purposes. In Nepal's condition, the
history of banking is not very long. In 1994 B.S. the Nepal Bank limited
was established. It was the first bank of our country. The first central bank,
Nepal Rastra Bank, was established with objectives of surprising,
protecting and directing the functions of commercial bank's activities.
Later, it was considered that the Nepal Bank Ltd. was not sufficient to meet
the increasing banking service requirement of the government and people.
Then, the number of banks increased gradually as per the requirement
under different acts like, Agriculture Development Bank / Nepal (ADB/N)
under Agriculture Development Bank Act, 2024, other commercial Bank
under commercial Bank Act, 2031, Finance company under finance
company Act, 2042,etc. In B.S. 2041, Nepal Arab Bank Limited was firstly
established as Joint venture bank in Nepal, Then different commercial
banks have been establishing very fast. There are 25 commercial banks in
Nepal. Banking sector is the most dynamic part of economic which collects
unused fund and mobilizes it in needed sectors. It is the heart of trade
commerce and industries. In Nepalese context, commercial banks have
comparatively good performance among the public limited companies.
There are a lot of commercial banks such as Everest Bank Ltd.,
Nepal SBI Bank Ltd, Himalayan Bank Limited, etc. Twelve banks are

domestic private banks which are Bank of Kathmandu, Nepal Credit and
Commercial Bank, Nepal Industrial and Commercial Bank, etc. and the rest
are government commercial banks such as Nepal Rastriya Bank Ltd.
For the study of the present purpose four Banks such as NABIL are
taken in sampling. Out of them, NABIL. It is the first joint venture
commercial bank established in 1984 A.D. (2041 B.S.) in Nepal and listed
in NEPSE in the year 1986 A.D., Initially Dubai Bank Ltd. invested 50% of
equity share of NABIL. The share owned by DBL is transferred to Emirates
Bank International Limited.
HBL is another joint venture bank established under the Company
Act of Nepal. The Bank was incorporated in 1992 A.D. and was listed in
the NEPSE in 1993 (2050/2/5 B.S.). The control office of its organization is
in Sanchayakosh building Thamal. Its authorized capital is 24 million,
issued capital 24 million and paid of capital 24 million.
NIBL was established on 21 January 1986 as a joint venture bank
under the Company Act 1964. Now this bank is opening under full
ownership of Nepalese promoters and share holders. Authorized capital of
this bank was 270000000. Issued capital is Rs 169,984,500 and paid of
capital 169,984,500.
Everest Bank Limited was established in 1994 A.D. with the joint
venture of Punjab National Bank Limited, India. It was listed in NEPSE in
1996 A.D. Authorized, issue, and paid up capital of EBL is 600 million,
466.80million 455 million respectively.
1.2 Focus of the Study
Risk and return are the important factor and the foundation of the
modern finance theory. The relationship between risk and return is
described investor's perception about risk and their demand for
compensation. No investor like to invest in risky assets unless they are
assured of adequate compensation for the assumption of risk. Similarly,
Return is the motivating force in investment process that is, the reward for
undertaking the investment. Therefore, it has crucial importance for
investors as it is the only rational way for corporation to compare
alternative investment that differs in what they offer (pradhan 1992) Risk is
defined as the chance that the actual outcome frame and investment will
differ from expected outcome. Risk is uncertainty and its magnitude
depends upon the degree of variability in uncertain cash flow. Risk and
return are most important factors in finance and investment area. As a result
risk and return go together in investment and finance. It is in sensible to talk
about return with out taking risk because investment decision involves risk
and return in trade so, return increases in proportion to risk.
There are different kinds of uncertainty about future return. The
actual return may be less than expected return. The main source of
uncertainty is the price at which the stock will be sold. The stock price can
be affected by economic factor such as interest rate, economic growth
inflaction and the strength of dollars. The risk of stock can be measured by
price volatility. One of the main sectors of financial market is capital
market where stock and bond are trade.
Finance is composed depending upon three functions: investment,
financing and dividend. All those having little knowledge about finance are
interest on investment, the stock market definitely drags the attention of
everybody in Nepalese context stock market definitely drags the attention
of every body in Nepalese context.
This study has focused on the analysis of risk and return associated
with the share price of commercial bank. In commercial bank the risk and
return are fully based on portfolio analysis. Therefore this study is also
focus on the analysis of risk and return how an investor or should return
how an invest or should take investment decision in share of domestic
private commercial bank in Nepal. Many political, economic, social and
technological factors affect the commercial bank.

1.3 Statement of Problem
Generally, risk and return are worked out to identity the suitable
position of any organization and financial institution. After the
establishment of Nepal stock exchange, the capital market was grown
rapidly with in the very short period.
The commercial bank invests different kinds of their subject because
they will be generate some benefits in future. The investors don't measure
return and various risk involbs in their investments. It investor are able to
know the price situation of listed companies they can make good return by
making sales or buy decision of the common stock they hold or intend or
investment.
Investors don't have any idea of risk and return because most of the
investors to be a least familiar with the financial activities with out getting
theoretical knowledge of risk associated with investment most of the
investors are making investment on stock that may be terms as ill praltice.
Bank issue a share, debenture, and bond. But their become huge demand
rather then supply but if other sectors such as hotel, insurance and
manufacturing company issue their money. In Nepalese context, most of
people deposit their money in bank instead of investment in financial
assets. Such as share, bond and debenture. A lot of investors do not know
how to make investment and how to calculate risk and return on their
investment. In Nepal most of the financial institutions issue only common
stock. In ours country the commercial bank are playing viatle role in the
capital market, risk and return and other different kinds of area. On the
basis statement, the study is to seek the following question.
a. What is the level of systematic risk and unsystematic risk of
commercial bank?
b. What is the average rate of return of commercial bank?
c. What is the level of risk and return of listed commercial bank?

1.4 Objective of the Study
The basic objective of this study is to find out risk and return
relationship of commercial bank of Nepal. The following are the specific
objective of the study.
a. To analyze the systematic risk and unsystematic risk of
commercial banks.
b. To compare the unsystematic risk of commercial banks.
c. To analyze the risk and return position of commercial banks.
d. To analyze the annual average rate of commercial banks.
e. To analyze the risk premium of commercial banks in Nepal.
1.5 Significance of the Study
“The study is to point out the risk and return position of investing
shares in commercial bank of Nepal. The study will be helpful for investors
as well as commercial banks and also provide proper guideline for making
choice of stock and bond on the basis of risk and return. It is also important
those people who are interested to know about risk and return. The study
will be beneficial for the entire person who is interested to know about the
capital market in Nepal.” In light of these contributions, the study is
valuable for the investors, commercial banks, organization studies and
researchers. The study has following significant:-
a. The analysis of risk and return to develop the effective portfolio.
b. An individual firm is made known of its value position that it can
search for its strength and weakness.
c. The study suggests for a careful judgement of risk and return
relationship.
d. An individual firm is made known of its value position. So that it
can search for its straights and weakness.

1.6 Limitation of the Study
Every research naturally have some delimitation. So this study is not
to exceptional wage, the major decimalization to the study are as under.
a. The study covers the relevant and information only 10 years i.e.,
Fiscal year 1997/1998 to 2006/07.
b. Analysis is based on the tools developed in the context of
efficient market condition.
c. Time and finance constraints are also the major limitation of the
study. The report is to be submitted in a limited time period.
d. The study is to fulfill the requirements as M.B.S. to the study
can't cover all the dimension of the subject matter.
1.7 Organization of the Study
This study has been classified into six chapters. The first chapter,
introduction, includes general introduction, focus of the study, statement of
the problem, objective of the study, significance of the study, limitation of
study and organization of the study. The second chapter- Review of
literature includes theoretical review and relevant material. The third
chapter- Research methodology includes research design population and
sample size, source of data, data collection procedure and data analysis
tools. The fourth chapter is Data presentation and Analysis, It interprets the
collected data using various financial and statistics tools and technique. It
also analyzes and interpreted the data by using the figure and table. It
includes major finding of the studies. The fifth chapter- summarizes the
whole study conclusion and forward the recommendation and six chapters
Bibliography of the study.
CHAPTER II
REVIEW OF LITERAURE
Research is a continues process and it never ends. The procedures
and the finding may change but research continues. So for analysis the data
and to find something new a researcher must review and know if there are
any studies ahead or not. The purpose of reviewing the literature is to
develop some expetise is ones area to see what new contributions be can
made and to receive some ideas for developing a research design. Thus the
previous studies can't be ignored because they provide the foundation to
the present study with the past research study.
In this chapter the review of relevant theoretical literatures and
previous related studies. It is divided into two parts i.e. theoretical review
and research review. Conceptual review includes definitions and summary
of different book and authors and research review includes the review of
the article published different journal and past studies.
2.1 Conceptual Review
2.1.1 Capital Market
Capital market means anybody of individuals whether incorporated
or not, constituted for purpose of selling or dealing in security (Bhalla 19:)
Capital market consists of security market and non security market.
Securities market implies mobilization of the fund through issuance of the
securities sector and bonds, bills and debentures by corporate sector and
bonds, bills and debentures by governments. These securities traded in the
market are generally negotiable and hence can be traded in the secondary

market. Non-securities market refers to the mobilization of the financial
resources by the financial institutions in form deposits and loans. Capital
market is divided into two parts, One is primary capital market and other is
secondary capital market.
Primary Capital market: Financial securities which are offered for
the first time in market is called primary market. The primary market
securities are the new issue market, which bring together the “Supply and
Demand” or sources and uses for new capital fund. In this market the
principal source of fund is the domestic saving of individuals and business,
Other supply includes foreign investors and governments. In a highly
developed capital market by the largest proportion of individuals saving
reaches the new issues market indirectly via a financial internal for
example the saving of most individual are to an ultimate user corporation
designing to expansion of its productive facilities and investment company
or similar institutions, moreover most investor or individual investors are
unfamiliar with new issue market and its institutions, such as underwrites
and selling syndicates which serve as middle men between the corporate
demanders of fund and the individual investors and financial institutions
which supply the fund to most investors the team securities is synonymous
with the “Stock Exchange”
Secondary Market
The market where the existing and pre-developed securities are
bought and sold is called secondary market. Secondary market provides
liquidity to the purchase of the securities. High liquidity of the secondary
market encourages the investors to invest in the primary market as well.
Secondary market can be regarded as the center to convert stock, bonds
and other securities into cash immediately. The secondary market deals
with the previously issue share mainly traded through the stock exchange,
over the counter (OTC) market direct dealing. The majority of all capital

market transactions occur in the secondary market. The proceeds from the
sale of securities in this market do not go to the original issuer (i.e. it does
not create new additional capital) but to the owners of the securities. In
other words securities are traded among the individual as well as
institutional investors. Transactions in existing securities market is to
provide marketability and liquidity for long term investments, there by
supply equity and long term debit capital for the financing of business
enterprises: once investors purchase in the primary market they need the
place to sell those securities in secondary market. Secondary market can be
categorized in two part. (a) Organized Stock Exchange (b) Over the
Counter (OTC) Market.
Nepal Stock Exchange (NEPSE) is the only a secondary market in
Nepal. It is noteworthy that the firm whose securities are being traded in
the secondary market is not involve in the secondary market transaction
and thus does not receive any funds from such transaction.
2.1.2 Development of Capital Market in Nepal
Capital market in Nepal is in infancy. Stock investment practice in
Nepal developed after the establishment of Biratnagar Jute Mill LTD in
1993 and Nepal Bank Ltd. in 1994, tills 1980, the majority of the share
issuing company would belong to the ownership of government. Initial
public offerings hardly found in practices in fund were collected through
the direct placement of bond. The prime objectives of raising the funds
would be the development of the infrastructure and public welfare
programs. It has helped housing the primary government bond market on
the other hand the share of Nepal Bank Ltd. were in existence but Ltd. to
the ownership of Ranas (Khadka 2004) In 1992, government issue the
treasury bills for the first time to finance the infrastructures development it
is followed by the issuance of development bonds in 1964. Trading of
governmental bond have always felt a security of capital market and in

1964, industrial policy was promulgated. This policy has opened the doors
for the establishment of an institution named security market centre (SMC)
in 1977 with its primary aim of developing the Capital market for
government securities in the country under the joint effort of Nepal Rastra
Bank (NRB) and Nepal Industrial Development corporation (NIDC). It
was converted in to security. Exchange centre in 1976 Security Exchange
Act (SEA) was approved by legislature and value into existence with effect
from 13th April 1984. The former securities exchange centre was converted
into Nepal stock exchange with the major objective to arrange
marketability and liquidity to the government and corporate securities.
Floor trading through market intermediaries such as brokers and market
makers has also evolved. Restoration of democracy following the political
movement of 1990 has brought lots of reforms in the financial sector
liberalization in the real sense was initiated. Nepal launched extended
structural adjustment program in 1992 by taking 'Extended Structural
Adjustment Facility' (ESAF) through first amendment in the SEA. This has
led to the establishment of securities board and it was given the
responsibility of regulating and developing the transaction of securities
whereas NEPSE to facilitate the transaction of stock and bonds in the floor
through its member intermediaries. NEPSE presently has 27 brokers and
11 issue manager and 2 portfolio manager i.e. dealer secondary market.
Currently there are 114 listed companies Non-Residence Nepalese (NRN)
have declared to establish a multipurpose mutual fund investment company
with the amount of Rs 10 billion in the near future which would help to
grow the capital market in Nepal. Similarly, state owned corporations like
Nepal Telecom, Nepal Electricity Authority are planning to issue bond and
share to public investors which are encouraging for the capital market
encouraging and alternative investment sectors for investors
(www.nepalstock.com)
2.1.3 Meaning of Risk
"Risk is defined to Webster's as a hazard a price exposure to loss or
injury. Thus risk refers to chance that some unfavorable event will occur if
you engaged in skydiving you are taking a chance with your life sky diving
in risky. If you bet on the horse, you are risking your money. If you invest
in speculative stock or any stock, you are taking a risk in hope of making
an appreciable return. The greater the chance of loss or negative return the
riskier the investment. Most people view risk is the manner. We just
described the chance of loss. In reality, risk occurs when we can't be
creation about the outcomes of a particular activity or event. So we are not
sure that will occur in the future consequently risk result from the face that
an action such as investing can produce, more then one outcomes in future.
(Weston and Brigham 1996)
In the basic sense risk is the chance of financial loss. Assets having
greater chance of loss are viewed as more risky then those with lesser
chance of loss. More formally, the tream risk is used interchangeably with
uncertainty to refer the variability of return associated with a given assets.
Beta coefficient: This is the mathematical value that measure the risk of
one assets in term of its effect on the risk of a group of assets, called a
portfolio. It is concerned solely with market related risk as would be the
concern for an investor holding stock and bonds. It is derived
mathematically so that a high beta indicated high level of risk; low beta
represents a low level of risk.
Standard Deviation: This is a measurement of the dispersion of forecast
return when such return approximate a normal probability distribution. It is
a statistical concept and is widely used to measure risk from holding a
single assets. The standard deviation is derived so that a high standard
deviation represent a large dispersion of return is a high risk. On the other
hand, low standard deviation is a small dispersion and represents low risk.
Subjective Estimates: A subjective risk measure occurs when qualitative
rather then quantitative estimates are used to measure dispersion. We will
used the definition of risk that deals with dispersion of return. We will also
note that fact that mathematical approach can be used to estimate such
dispersion.
2.1.4 Source or Risk
An investment is commitment of money that is expected to
generated additional money. Every investment entails some degree of risk.
It requires a person certain sacrifices for future uncertain benefit.
The primary risk factor that create investment uncertainties are as
follows:
1. Interest rate risk: Interest rate risk is defined as the potential
variability of return caused by changes in market interest rate.
Interest rate risk can be demonstrated, if we reconsider the single
period rate of return formula for a bond or a stock. In interest rate
risk, if market interest rate rise, then investment values and market
prices will fall and vice-versa. The variability of return that result
interest rate risk. This interest rate risk affect the price of bond
stock, real estate gold, puts, calls, futures contracts and other
investments as well.
2. Purchasing power Risk: Purchasing power risk is the variability of
return an investor suffers because of inflation. Economic measure
the rate of inflation by using a price index. The consumer price
index(CPI) is a popular index in a U.S. The percentage change in the
CPI is a widely followed measure of the rate of inflaction.

3. Management risk: Management risk is defined as the variability of
return caused by a decision made by a firm's management and board
of directors. Through many top executives earn princely salaries,
occupy luxurious offices and wield enormous power within their
organization, they are mortal and capable of making a mistake or a
poor decision. Furthermore, errors made by business manager can
harm those who invested in their firms. Forecasting management
error is difficult work that may not be worth the effort and, as a
result, imparts a needlessly skeptical outlook. Agency theory
provides investors with an opportunity to replace skepticism with
informed insight as they endeavor to analyze subjective
management risk.
4. Default risk: Default risk is that portion of an investments total risk
that results from changes in financial integrity of the investment. It
is related to the probability that some of all of the initial investment
will not be returned.
5. Liquidity risk: Liquidity risk is that portion of an assets total
variability of return which results from price discount given or sales
commission paid in order to sell the with out delay. Perfectly liquid
assets are highly marketable and suffer no liquidation costs. Liquid
assets are not readily marketable either price discount must be given
or these costs must be incurred by the seller, in order to find a new
investor for an illiquid assets. The more illiquid an assets is the
larger the price discount.
6. Collability Risk: Some bond and preferred stock are issued with a
provision that allows the issuer to all then in for repurchase. Issuers
like the call provision because it allows them to buy back
outstanding preferred stock and/or bonds with funds from a newer
issue it market interest rate drop below the level being paid on the
outstanding securities.

The portion of a securities total variability of returns and derives
from the possibility that the issue may be called is the collability risk.
Collability risk commands a risk premium that comes in the form of a
slightly higher average rate of return. This additional return should increase
as the risk that the issue will be called increase.
7. Convertibility Risk: Collability risk and convertibility risk are
similar to respects. First, both are contractual stipulations that
includes in the term of the original securities issue. Second both of
these provision after the variability of return from a convertible
bond or a convertible preferred stock that reflects the possibility that
the investment may be converted into the issuer's common stock at a
time or under terms harmful to the investor's best interest.
8. Political risk: Political risk arises from the exploitation of a
politically weak group for the benefit of a politically strong group
with the efforts of various groups to improve their relative positions
increasing the variability return form the affects assets. Regardless
of whether the changes that cause political or by economic interests
the resulting variability of return is called political risk are sought by
political or by economic interest, the resulting variability of return is
called political risk if it is accomplished through legislative, judicial
or administrative branches of government. Political risk can be
classified as internal political risk and domestic political risk.
9. Industry risk: An industry may be viewed as a group of companies
that complete with each other to market a homogeneous product.
Industry risk is that portion of can an investments total variability of
return caused by events that affects the product and firms that make
up an industry. the stage of the industry's life cycle, international
tariffs and/or quotas on the product by and industry, products or
industry product or industry related tax industry wide labour union
problems, environmental restrictions, raw materials availability and

similarly factors interact and affects all the firms in a industry
simultaneously. As the result of these commonalties, the price of the
securities issued by completing firms trend to rise and full together
(Clark 1991)
10. Credit Risk: It is usually associated with loan and investments, but it
can also arise in connection with derivatives foreign exchange, and
other extension of bank credit. Although banks fail for many
reasons, the single most importance reason is bad loans. Banks of
course don't make bad loans. However, unforeseen change in
economic condition and other factor such as interest rate stock,
change in tax laws and soon, have resulted in credit problems.
11. Price Risk: Price risk is the risk to earning or capital resulted to
market making dealing or taking in securities, derivatives, foreign
exchange or other technical crises in Russia institution.
12. Strategic Risk: Strategic risk is the risk to earning or capital arising
from making bed business decisions that adversely affect the value
of the bank.
2.1.5 Types of Risk
There are two types of risk in securities market:
1. Systematic risk
2. Unsystematic risk
Systematic risk: It is market related in other word it arises from the
change in the economy and market condition for example high inflation
recession, impacts of political factors, which are beyond the control of
company management. It affects all firm in the market. The portion of the
risk is not-divesible and can't be reduct. The systematic risk rewarded in
the firm of risk premium. Some times systematic risk is also called market
risk. Systematic risk affects almost all assets in the economic, at lease to
some degree, whereas systematic risk affects at most a small number of
assets. The principle of diversification has an importance implementation
to a diversified investor, only systematic risk matters. It follows that in
deciding whether or not to buy a particular individual assets, a diversified
investor is only be concerned with that assets systematic risk. This is a key
observation and it allows us to say great about the risk and return on
individual assets in particular. It is the basis for a famous relationship
between risk and return called the securities market line. To develop the
SML, we introduce the equally famous Beta coefficient, one of the
centerpiece of modern finance. Beta and SML are key concepts because to
get supply as with at least part of the answer to the question of how to
about determined the required return on an investment.
Unsystematic Risk: The unsystematic risk is not market factor
related. In other word, it arises from the project specific factors. For
example inefficiency of management failure in new product in production,
employee, strikes, lawsuits and any other event that is unique to the
company. It is inherent individual companies or project. This portion of the
risk is divestible and it is possible to redact or eliminate through
diversification of investment.
2.1.6 Meaning of Return
The meaning of return is defined as different wages to different
investors. The rate of return from capital investment is a concept that has
different meaning to different investors. Some competitive seek near term
cast inflow and give less value to more distant returns. Return can be
expressed by cash dividend or capital gain or loss. Still some investors
measure return using financial ratios.
The return shows financial position of any organization. The
company's position may be better if it has high return. Return is the
rewards for an investors from his/her organization. Investors want to
minimize expected return subject to their tolerance for risk. Return is the

motivating force and it is the key method available to investors in
comparing alternative investment. Realized return and excepted return are
two terms which is often used in the language of investment. Realized
return is after the face return, that was earned or it is history.
The return on investment is measured as the total gain or loss
experienced on behalf of the owner a given period of time. It is commonly
stated as the change in value plus any cash distribution, expressed as
percentage of the beginning of the period investment value. The expression
for calculating the rate of return earned on any assets over period t, kt is
commonly defined as:
1t
t1ttt P
CPPK
Where,
Kt = Rate of return during the period t
Pt = Price (value) of assets at time t
Pt-1 = Price (value) of assets at time t-1
Ct = Cash (flow) received from the assets investment in the time
period t – 1 to + (Gitmain 2001)
2.1.7 Expected Rate of Return
The expected rate of return of holding period return is based up on
the expected cash receipt over the holding period and expected ending or
selling price. Depending up on the assumption make about cash receipt and
ending price, a number of expected rate of return are possible. These
possible expected rate of return estimated by the investors summarized in
the expected rate of return. The expected rate of return in order for the
investor to find the investment acceptable (Cheney and Moses, 1925).
2.1.8 Capital Asset Pricing Model (CAPM)
CAPM provides a frame work for measuring the systematic risk of
an individual security and related it to the systematic risk of a well –

diversities portfolio an the context of CAPM the risk of individual security
is defined as the volatility of security return vis-à-vis the return of a market
portfolio. Capital Assets Pricing Model was developed by William F.
Sharpe and Dohn linther 1960 (Van Horn: 1997). CAPM is simple in
concept and has real world applicability. The model describes the
relationship between risk and return or expected return, In the made a
securities expected (required) return is the risk free rate plus a premium
based on the of CAPM. It is the letter measure of risk the most importance
aspect of risk is the overall risk of the firm as viewed by investors in the
market price overall risk significantly affects investment opportunities and
even more importance, the owner wealth. The basic theory that asks
together risk and return for all assts is commonly called capital asset
pricing model. The CAPM equation or securities market line (SML) is
usually written as:
(Rj) = Rf + [ E(Rm) – Rf)× j
Where,
(Rj) = Required return on jth risky assets
Rf = The rate of return on a risk less assets
j = COV (Rj Rm)/VAR (Rm) A measure of the un
diversifiable risk of the jth security (Western and
Copelan: 1996)
E(Rm) = Expected rate of return of market
Assumption of the CAPM
CAPM is the based on a number of assumption the most importance
assumption are (Sharpe, Alerander and Bailey: 1998):
1. Investors evaluate portfolio by looking at the expected return and
standard deviation of the portfolio over one period horizon.
2. Individual assets are infinitely divisible, meaning then an investors
can bay a fraction of a share if he/ she so desires.

3. There is a risk-free-rate at which an investor may either lend i.e.
invest money or borrow money.
4. Tax and transaction cost are irrelevant.
5. All investors have the same one person horizon.
6. The risk free rate is the same for all investors.
7. Information is freely and instantly available to all investors.
8. Investors have homogeneous expectations, meanly then that have
the same perceptions in regard to the expected return standard
deviation and covariance of securities.
CAPM provides a measure of risk and a method of estimating the
market's risk return line. The systematic (market) risk of securities is
measure in term of its securities sensitivity to the market movement. This
sensitivity is referred to security's beta (). Beta reflects the systematic risk
that can't be redacted. Investors can eliminate unsystematic risk, when they
invest their wealth in a well diversifiable market portfolio. A zero beta of
1.0 indicates average level of risk while more then 1 means that the
security's return fluctuates the actuates more that of the market portfolio. A
zero beta means no risk. The graphical presentation of CAPM is called the
security market line (Rj)(Pandey:1990).
In graph, risk as measured by beta B, is plotted on the X-axis and
required rate of return (Rm) are plotted on the Y-axis security market line
has drawn from middle of Y-axis (Weston and Copland: 1996).
SML
M
x
(RM)
(RA)
RF
Y
A
M=1X
Beta
Req
uire
d R
etur
n

2.2 Research Review
These days information highway or the interest has become to the
most easily medium to gain information is subject matter. In the study
period different book and article have been consulted. The study has also
used different database, which is available in Western Regional Library of
Prithivi Narayan Campus, Pokhara and other different kinds of Libraries.
The review of relevant articles published in different journal are available
on line on International Network for the Availability of Scientific
Publication (INASP). In this section data base been reviewed and
presented.
2.2.1 Review of Journal
Financial economics has defined as the application of economics
theory to financial market (Smith 1996). It is the large body of theory
including such well-known models as modern portfolio theory (Markowitz
1952), the capital asset pricing models (CAPM) (Shap 1964), the efficient
market hypothesis (Samulson and fama 1965) and option pricing model
(Black and schowrs 1973). Although these models are all included in
institute of faculty education Ltd. (1995) there are acceptance or use is
controversial.
Akhibe and Whyte (2004) in their research paper "The Gram leach-
Billey ACT" of 1999: Risk implication for the financial service industry
have focused on the risk implementation of banking and private sectors.
The research paper has included many other studies some of the studies
find that bank expansion into banking activities can effect of events that
permitted only Ltd. Entry by bank into not banking activities. The study is
conducted on the systematic, unsystematic and total risk. Such risk are
calculated by using statistical tools i.e. variance, standard deviation, t-
statistical and signed rank which recently used by Aminud, Delong and
Saunders (2002). The study has included 300 bank for the sample size then
they partition two sub-samples; 40 large bank and 200 small banks. The
major finding of the study is that evidence of a significant decline in
systematic risk for banks securities firm and insurance companies but a
significant increase in total and unsystematic risk for the banks and
insurance company. This study has included five years period data. The
study also found that bank and insurance company are less risky then the
securities business so if securities firm want to decline in risk. Securities
firm can be explained by their ability to diversity into less risky banking
and insurance activities. The research paper result suggests that regulators
should carefully monitor and supervise banking activities in the new era of
financial modernization to mitizate adverse effects from the increase in
risk.
Pagaho's (2001) has study on how theories of financial
intermediation of cooperate risk management influence bank Risk. Taking
behaviour from both cooperate finance and banking perspective. That data
set cover period from (2004-2008). In this study the researcher has used
mathematical tools that are model beta, standard deviation total risk
(systematic and non-systematic risk) interest rate risk. The main objectives
of the study is to examine the rationales for risk taking and risk
management behaviour for both a cooperative financial and banking
perspective. After combing the theoretical insights from the cooperate
finance and banking literatures related to hedging and risk taking the paper
reviewed empirical tests based on these theories to determine which of this
theories are based support by the data.
Managerial incentives apart to be the must consistently supported
rational for describing how banks manage risk. In particular, moderate/high
levels of equity ownership reduce bank risk while positive about of stock
option grants increase bank risk taking behaviour. The empirical result
suggested he gable risk such as interest rate risk problems. This implies
empirical test on theory of cooperate risk management need to considered

individual sub-components of total risk and the banks ability to trade these
risk in component financial market.
Berkowitz and Brein's (2002) in their research paper "How accurate
are value-at-risk models at commercial banks?” to has focused on the first
direct evidence on the performance in the value-at-risk models for trading
firms.
The result shows that variance for casts for six large commercial
banks have exceeded nominal average levels over the part two years and
for some bank –variance we substantially removed from the lower range of
trading P&L while such conservative estimates imply higher levels of the
capital coverage for trading risk, the reported variance are less useful as a
measure of actual portfolio risk. They have used standard deviation, mean
correlation coefficient, VAR correlation coefficient, Beach mark model
and portfolio model. To a certain extent the study is Ltd. by the fact that
bank only forecast a single percentile of a portfolio distribution significant
more could be learned about the empirical performance of internal
valuation of models of destiny forecast were recorded. Destiny forecast
evaluation techniques described in Diebold, Gunthur and Tay (1998) and
Berkowitz (2001) provide researcher with substantially more information
to asset the dimensions in which models and need improvement and those
in which models do well.
2.2.2 Review of Related Studies
Bhatta's (1996) study on assessment of the performance of listed
companies in Nepal has based on the data of 10 listed companies from
1995 to 2000. One of the major objectives of this study is to analyze the
performance of listed companies in term of risk and return and internal rate
of return, systematic risk and devastation a risk through portfolio context.
The major finding of the study is that a highly significant positive
correlationship has been addressed of the between risk and return character

of the company. Investors expect higher return from those stock that
associates higher risk. Nepalese capital market is not efficient one, so the
information relating to market and company itself. Neither investor analyze
the overall relevant information of the stock nor does the member of stock
exchange try to determinate the information. Therefore the market return
and risk both may not show high priced stock. Pandey- Sijapati (2000) has
conducted a study on risk and return analysis of common stock investment
by taking six insurance companies as sample. she has used analytical tools
like Rate of Return standard deviation, coefficient of variance, beta
coefficient and t-test has used. According to his study the main objectives
are calculate the risk and return of the common stock and portfolio and also
understand and identify the problem faced by individual investors and
insurance companies. The major finding of the study are generally public
list understood the risk of investment which may due to poor education,
lack of adequate information, etc. that may abstract the development of the
stock market. There is no significant different between the performance of
common stock of the insurance companies and overall market portfolio.
The study has covered five years period.
Sapkota (2000) has studes on risk and return analysis in common
stock investment. The main objectives of the study is to analysis the risk
and return of common stock in Nepalese stock market. But the study is
very closely related to common stock of commercial bank.
On his findings, expected return on the common stock of Nepal
Bank Ltd has maximum and SBI Bank Ltd has found minimum common
stock of NBL is most risky and NSB is least risky. In the context of
industries, expected return of finance and insurance industries has focused
highest so that common stock of Nepal Bank Ltd is the best for investment.
Mr. Sapkota has conducted that, commercial stock is the most risky
securities and lifeblood of stock market because of the higher expected

return, CS attracts more investors. Private CS holders are the passive
owners of the company.
Pandey (2000) has a study on risk and return analysis of common
stock investment. The main objectives of the study is to analysis the risk
and return of common stock investment in banking and financial sectors.
The study also related to insurance companies. In the study, she has taken
six insurance companies in account. To measure the return, she has used
standard deviation, expected return, variance coefficient and beta on her
study, concludes that among all the securities common stock has known to
be the most risky security. Higher the risk, higher will be return. Most of
the investors have attracted to common stock security because of its higher
expected return.
As for the investor, it is important to analysis each investment,
company to potential return with the risk on average the potential return
from the potential return from an investment should compensate for the
level of risk under taken. If proper allocation of assets is performed it can
reduce risk and can even eliminated if well diversified.
Mishra (2001) analyzed risk and return on common stock
investment of commercial bank in Nepal with special reference to five
listed commercial banks. The main objectives of this study was to promote
and protect the interest of the investor by regulating the issuance, sales and
distribution of securities and purchases, sales or exchange of securities. He
also tried to render contribution to the development of capital market by
making securities transaction fair, healthy, efficient and responsible in this
study the researcher has used mathematical tools that are expected return,
standard deviation, coefficient of variance, dividend per share, portfolio
return beta coefficient, required rate of return. The period of the study was
taken five years data from (2059-2064) on this study, it was noticed that
there is a positive correlation between risk and return character of the
company, Nepalese capital market being inefficient, the price index itself is

not sufficient to five the whole information about the prevailing market
situation and the company. It was also notice that investors don’t have any
idea about the procedures of the securities insurance. Neither company nor
the stock brokers transmit any information to the about the current market
situation and hence it becomes difficult for the common investors to invest
in the securities.
Mishra also has focused that Nepalese banks and government should
try to promote healthy practices so that the stock brokers don’t give false
information to the investor for their personal benefit which is common
practice in Nepal. Investor should get regular information about the
systematic risk (beta) return on equity of various listed companies in the
same way as it has given in economic times companies listed in Indian
stock exchange. Upadhaya (2001) conducted the result entitled risk and
return on common stock investment of commercial bank in Nepal. His
study is based on descriptive and analytical research design which covers
the five years period from (2059-2064). The main objectives of the study
was to analyze the risk and return of the common stock of commercial
banks in Nepalese stock market, the study focused in the common stock of
the commercial banks one of the objectives that are related to this study
was to evaluate common stock of listed commercial bank in the terms of
risk and return. The major finding of the study is that expected return on
the common stock of the NGBL has maximum, which is very high rate of
return. Other CS of having higher return is CS of NBBL and EBL with
more than 59% expected return. Expected return of NABIL is also
favorable with 25% CS of SBI is listed risky. Mr. Sudeep has focused on
changing environment of Nepalese business and economic but did not
focus on relationship between closing MPS and EPS.
Saytal (2002) has a study on risk and return analysis of listed
commercial bank for analysis, among listed companies eight are taken into
account the main objective of the study were analyze the risk, return other

variable that help in making decision about investment in securities of the
listed companies and to examine the moment of the market price of share,
also to provided suggestion on the basic of the findings. He used holding
period return and expected rate or return to calculate of the return of the
coefficient of variation (CV) and beta were used to measure risk and
CAPM for portfolio analysis. The expected return of Nepal investment is
36% CV is .06 and risk is 38.3 percent. The beta of list share is 0.66.
Expected return of Himalayan Bank Ltd. is 52.66 percent, risk is 29.3 and
CV 0.556. The beta is 1.567 so HBL is less risky then NIB for the study
the researcher has taken 5 years period. Shrestha (2003) has a study on risk
and return analysis on common stock investment of banking sector in
Nepal. The main objective of the study was to analyzes the systematic risk
and unsystematic risk associated with securities. The study was covered six
years data from (1996-2001).
In this study the researcher has used analytical tools i.e. return of
common stock, expected return, standard deviation beta coefficient CAPM
coefficient of determinates and hypothesis (t-test). The major finding of his
study are NBBL's common stock is yielding the highest realized rate of
return with 71.80% where as it is the lowest 26.60 percent in case of NIB
Ltd. The banking industry average 47.85 percent. The commercial bank
NBBL, BOKL and EBL reprehensively rate of return are 71.80 percent,
67.60 percent and 65.60 percent. All the commercial bank required rate of
return is less then expected rate of return which means that they are all
under price there for it will be beneficial to investors who are going to
purchase the companies. Common stock from the study it has found that
investment in banking sectors are beneficial instead of other financial
sectors.
Tamang (2003) has a study on risk and return analysis of
commercial bank in Nepal. The main objectives of the study is to
determine whether the shares of the commercial bank are correctly priced

or not by analyzing the required rate of return using the capital assets
pricing models also to measure the systematic and unsystematic risk of the
commercial banks. In this study the researcher has used mathematical tools
i.e. market model, single period return, Expected Rate of Return, standard
derivation, coefficient variations Beta coefficient (B). The period of the
study has taken five years data from (1996-2001). The major finding of the
study, the systematic risk of Nepal Arab Bank Ltd. is the (greater) highest
among the shares that is 95.59 percent and Bank of Kathmandu has the
lowest on being 35.81 percent, Nepal Arab Bank has highest unsystematic
risk but total risk or variance of Bangladesh is the highest(10%). From the
study it was also found that the shares of Nepalese commercial banks are
heavily trade in NEPSE, non of the share is correctly priced.
Joshi (2004) has conducted a research on risk and return analysis of
common stock of five listed commercial banks. The main objectives of the
study was to assess the associated with return on common stock investment
of the basic of selected tools. For the study, the researcher has used five
year data 1998 to 2002.
He has used arithmetic mean to calculate the return, standard
deviation and coefficient of variance, which are used to measure the
unsystematic risk and beta coefficient. The measurement explains
sensitively or volatility of stock with market and individual relationship
between risk and return. The researcher also used t-test to calculate
hypothesis. The major finding of his study are that banking sectors has the
expected return is 21.77 percent, risk is 36.10 percent and CV is 1.66,
similarly finance and insurance sectors has 21.77 percent, 36.10 percent
and 1.66 hotel sector has 10.16 percent, 72.40 percent. Trading sector has
6.86 percent and other sector has 6.86 percent and other sector has 16.61
percent 50.45 percent.
Khadak (2004) has the study on risk and return analysis on selected
Nepalese commercial bank listed in NEPSE. The main objectives of the

study to measure system and unsystematic risk of the commercial bank.
The study have covered 6 years period and used expected return,
coefficient variation which measure risk /unit of stock individually
standard charter bank Nepal Ltd has the lowest coefficient of variance
(1.89) and NABIL Bank has the highest on (3.35). The total systematic risk
has related to individual share and correlation coefficient with market
portfolio.

CHAPTER III
RESEARCH METHODOLOGY
The research methodology is the systematic way of solving research
process which a researcher conduct during his her study. It include all the
procedures from theoretical underpinning to the collection and analysis of
the data. As must of the data are quantitative the research is based on the
scientific models. It is composed of both part of technical aspect and
logical aspect on the basis historical data.
This chapter gives the theoretical foundation of data collection and
analysis for the study. This chapter has represents the highlight of research
design, population and sample size, data collection techniques sources and
data analysis tool. It shows that road map of data presentation and analysis.
Research methodology has been used to fulfill the objectives of the study.
3.1 Research Design
The present study is based on descriptive and analytical research
design. Descriptive research is used to describe the relationship risk and
return from table, trend and figures with the help of present data. As the
result analytical research design is used to analyze the standard deviation
coefficient of variation, Beta coefficient, Risk premium, expected return
and average rate of return of sampled bank. Analytical research design
evaluated the present data clearly. This study has been carried out the 10
years period from 15 July 1998 to 15 July 2007.

3.2 Population and Sample
The total population of the study used for 8 listed commercial banks
in Nepal. Total population of the study taken on the basikot listed year of
commercial banks, which are listed before 15th July 1998A.D in NEPSE.
Currently there are 25 commercial banks in Nepal. According to SEBON,
only 14 are listed in NEPSE, till the study period. The sampled banks have
been selected from random sampling technique. SPSS computer Aided
random sampling technique is used to select the samples. The cover overall
33.5% of the population
3.3 Source of Data
The data for the study only secondary sources. The main source of
data is report of Nepal Stock Exchange Ltd, report of security board Nepal,
web side, annual report of commercial bank. The data has been taken from
NEPSE closing and opening price and sectors closing and opening price.
Similarly, SEBON has been visited to taken annual report of SEBON and
annual report of sampled commercial bank. (www.Nepal Stock.com 2007)
3.4 Data Collection and Techniques
All the data for present study have been collected from secondary
source. The annual report commercial bank have been taken from SEBON.
Similarly, NEPSE price have been taken from NEPSE. NRB visited to
collect the treasury-bill rate and banking and financial statistics then
collected data where record in master sheet. Manually then data were
entered to spread sheet to work out statistical financial analysis ratios.
These data are also used to prepare figures and tables. To process the data
of the present study manual and computer based programs were used
(Microsoft Excel and word).

3.5 Data Analysis Tools
All the data has been presented and analyzed to fulfill the objectives,
to illustrate the research work table and figure has been used for data
presentation to evaluate risk and return, the present study has been used
financial and statistical tools.
3.5.1 Financial Tools
3.5.1.1 CAPM Equation/security market line (SML) using CAPM model,
the investor can estimate the required rate of return stock. The
intrinsic value of the stock in inversely related to required rate of
return of stock other thing remaining the same higher required rate
of return will lower the intrinsic value of stock. CAPM models,
helps for pricing implications of common stock.
The relationship between an assets returns and its systematic risk
can be expected by CAMP which is also called the security market line
(SML) SML is the line showing the relationship between systematic risk
index (beta) and required rate of return. The equation of the CAPM or
SML is :
Required Rate of Return (Rj) = Rf + [E(RM) – Rf]×j
Where,
Rf =Risk free rate of return
E(RM) = Expected rate of return of market
= Beta of asset
3.5.1.2 Risk and Premium
Risk premium is record for bearing the risk. In other word risk
premium as the different between the return on risky investment and that
on a risk-free investment. TO Calculate risk premium, we use treasury
bills, (TBS). They are short term government securities. It can be bought
and sold any time, thus they have liquidity. Also they don’t have the

difficult. Treasury bills are also called risk free securities, which can be
replaced on risk free for the study treasury bills period has been taken 364
days.
Risk premium = Rj - RF
3.5.2 Statistical Tools
3.5.2.1 The expected rate of return is the expected after tax increase in the
value of initial investment over the holding period. The overall tax
of return can be decomposed into capital appreciation and dividend
components. The expected rate of return can be count under this
formula .
Expected rate of return iR = P1 R1+P2R2……..+PnRn
=
n
1i
PiRi
Where
Ri = possible ith outcomes
Pi = probability of the ith outcomes
n = number of possible outcomes
iR = weight average of the possible outcomes.
3.5.2.2 Average rate of return
Average rate of return can be calculated by using arithmetic mean
instead of geometric mean.
Average rate of return ( R j) =N
Rj
where,
R j = Average rate of return
(Rj) = summation of the Annual return
N = number of observation (year)

3.5.2.3 The standard deviation
It is quantitative measure of the total risk of Assets. It provides more
information about the risk of assets; It is a measures the dispersion of
return around the mean. The formula for calculate the standard deviation is
(Rothari 1989) j = 2
11
2
1N
)(
n
i
jRRj
Where,
j = Standard deviation of return stock I during the time period
Rj = The possible rate of return
R j = The average mean return
N = Number of observation
3.5.2.4 The coefficient of variation
It is defined as the standard deviation by the mean of expected
return . It is used to standardize the risk per unit of return so that measure
the risk per rupees. It is a measure of relative risk.
coefficient of variation,
CV =j
j
R
Where,
j = Standard deviation of stock j
R j = Average mean return of stock j.
3.5.2.5 Beta coefficient ()
The beta coefficient is an idea of systematic risk. It may be used for
ranking the systematic risk of different assets. If beta is large then 1, then

the assets are more volatile then the market, which is called an aggressive
assets. If the beta is less then 1, then assets are considered as defensive
assets as it's price fluctuation are less volatiles then market on the other
hand, if the beta is equal to I then assets is said to be average as it's price
move proportional to the market changes beta of market is also one (dark
1997)
bj = mσjmCov
2
Where,
bj = The beta value of security i
cov (jm) = covariance between security and market.
2 m = variance of market
covariance of (Rj Rm) =
1N
mRRmjRRj
3.5.2.6 Systematic Risk
Systematic risk is the market related risk It is also called the market
risk or and virsitible risk. for e.g. institution, interest rate war etc.
Systematic Risk = j2 × m2
3.5.2.7 Unsystematic Risk
It is non-market related risk. It is also called non-market related risk
or company unique risk or diversifiable risk. for e.g. discovery of new
technology, labour strike etc.
Unsystematic Risk = Var() – Systematic risk
3.5.2.8 Correlation coefficient
It is the relationship between two variables, dependent and
independent variables. It is also measured the two assets relationship. It's

value are limited between the rank of +1 and -1. karl person's method is
used to calculate correlation coefficient. A positive correlation coefficient
indicate that the return from two securities generally move in the same
direction and vice-versa. Correlation coefficient is used to test the
significant between and expected return. Microsoft excel has used to
calculate correlation between risk and return.
r =
yx
yxCov
,
Significant test is necessary since sometimes interpretation of the
result of the correlation coefficient may be misleading. Significant test is
done with the help of calculation of the problems error.
Probable Error (P.E.) = 0.6745N
r1 2
Where,
N = Number of pairs of observation
r = Coefficient of correlation.
3.6 Limitation of Methodology
Every research has its own limitation this study also has the
following limitations:
1 The major portion of analysis and interpretations has been done
on the basic of available secondary data and information so the
consistency of finding and analysis are depend upon the
reliability of the secondary data and information. The data
analysis depends upon the models, which had used for data
analysis.
2 The study had used average rate return as expected rate of return.
3 For the study, 15 July 1998 has been taken as based year.

CHAPTER IV
DATA PRESENTATION AND ANALYSIS
This chapter focuses on the data analysis and data presentation of
the sample bank. The study covers ten years period from 15th July 1997 to
15 July 2007. This chapter considered of historical return, average return of
coefficient of variance standard deviation, risk premium, correlation
coefficient and Beta coefficient sampled banks. Beta coefficient is used to
measure market sensitivity. The standard deviation is used to measure
diversity risk. Similarly, years end return and average return are used to
evaluate the return position of sampled banks. It has also demonstrated the
figures and tables to analyze the present data. The last of this chapter has
deals with the major finding of the study.
4.1 Data Presentation and Analysis
4.1.1 Analysis of Historical Return of sampled banks
There are four commercial bank listed with NEPSE. They are
NABIL, HBL, NIB and EBL. The study period covered the 15 July 1997 to
15 July 2007. To analysis risk and return of commercial bank are used
figures and table. Historical return of sampled bank is calculated by using
dividend per share and closing and opening price of sampled bank. Trend
line has been demonstrated to analyze historical return of individual bank.
This chapter also so the overall return of four commercial bank.

4.1.1.1 Analysis of Historical Return of NABIL Bank
The every year end return of NABIL over the study period has been
presented in table 4.1.
Table 4.1 Historical Return and Average Rate of Return of NABIL
Year Closing
Price(Rs.)
Dividend (Rs)Rj =
1tP
Div.t1tPtP
1997/98430 30 -
1998/99700 50 74
1999/001400 405 1.58
2000/011500 40 0.10
2001/02735 20 -0.49
2002/03735 50 0.07
2003/041000 65 0.45
2004/051505 70 0.58
2005/061675 85 0.16
2006/071725 80 0.08
Source: Calculated on the basis Data exteracted from NEPSE and Annual Report of NABIL Bank.
Average rate of return ( R j) =N
Rj
=10
27.3
= 33%
NABIL bank has maximum year end return in year 1999/2000 that
is 1.58 percent in year 1999/2000. Closing market price per share is double
then previous years market price per share. NABIL has declared stock
dividend in 1997/1998. Average return of NABIL id 33 percent. The fig.
4.1 exhibits the trand line of historical return of NABIL.

Fig. 4.1 Trend Line of Historical Return of NABIL Bank
The trend line of NABIL is shown in upward slop. NABIL historical
return is negative in 2000/2002. In the year 2002, NABIL year end return
is negative that is -49 percent, which is minimum point of 9 years. The
trend line show overall condition of NABL which indicates that year end
return in least year better then previous years. The trend line y=a+bx has
demonstrated the performance of NABIL where ‘a’ and ‘b’ are the constant
factors and x is variable. The slop of NABIL is in upward slope but the
trend has not given satisfactory. result because the slope of b is only
106.09. The line of closing price is upward and downward because the
closing price has been fluctuation every years. But the year 2000/01, and
2002/2003 the closing price is same.
y = 106.09x + 557
0
200
400
600
800
1000
1200
1400
1600
1800
2000
1997/98 1998/99 1999/00 2000/01 2001/02 2002/03 2003/04 2004/05 2005/06 2006/07
Fiscal Year
Clo
sin
g P
rice
(Rs.
)
Closing Price(Rs.) Linear (Closing Price(Rs.))

4.1.2 Analysis of Historical Return of Himalayan Bank
The historical return of HBL over the study period has been
presented in table 4.2.
Table 4.2: Historical Return and Average Annual Return of HBL
Year Closing Price(Rs.)
Dividend perShare Rj =
1tP
Div.t1tPtP
1997/98 755 503 -
1998/99 1000 300 0.72
1999/00 1700 475 1.175
2000/01 1500 475.50 0.16
2001/02 1000 125 -0.25
2002/03 836 210.32 0.046
2003/04 840 30 0.041
2004/05 920 199.58 0.356
2005/06 965 187.50 0.253
2006/07 1010 235 0.230Source: Calculated on the basis of data extracted from NEPSE and Annual Report of Bank.
Average rate of return ( R j) = 27.3010
2.731
N
Rj
Historical return of HBL has maximum in year 2000 i.e. 117 percent
which is maximum then previous years return. In 2002, Himalayan banks
year return is negative or no return. MBL has declared stock dividend in
many time that is year 2000, 2001, 2002, 2003 and 2005. Before 2002
closing market price per share of Himalayan bank has maximum but after
2002. It has been decreasing rapidly performance of Himalayan bank can
be seen from table 4.2 Average annual return of HBL is 27.30%.
The fig 4.2 has been show a trade line y = a + bx, where ‘a’ and ‘b’
are constant ‘a’ gives the intercept and ‘b’ give the slope of the year end
return. The slope of HBL is negative that is -24.206. It represents overall
performance of HBL is not so good. The closing price of HBL is not same
every years so that the line of the figure has been upward and downward.

Fig 4.2: Trend line of Historical Return of HBL
4.1.3 Analysis of Historical Return of Nepal investment Bank
The Historical return of NIB over the study has been presented in
table 4.3.
Table 4.3: Historical Returns and Average annual rate of NIB
Year Closing Price (Rs.) Dividend per share Rj =
1tP
Div.t1tPtP
1997/98 600 50 -
1998/99 822 30 0.42
1999/00 1401 377.75 1.16
2000/01 1150 0 -0.18
2001/02 760 228 -0.14
2002/03 795 20 0.07
2003/04 940 15 0.20
2004/05 800 12.50 -0.14
2005/06 885 14.50 0.122
2006/07 935 17 0.073
Total ERj = 1.585
Source: Calculated on the basis of data extracted from NEPSE and Annual Report of investment bank.
y = -24.206x + 1185.7
0
200
400
600
800
1000
1200
1400
1600
1800
1997/98 1998/99 1999/00 2000/01 2001/02 2002/03 2003/04 2004/05 2005/06 2006/07
Fiscal Year
Clo
sing
Pri
ce (
Rs.
)
Closing Price (Rs.) Linear (Closing Price (Rs.))

Average rate of Return ( R j) =N
Rj =910
585 = 17.61%
Closing market price per share of NIB has maximum in the year
1999/2000. In the year 2000, year end investment bank is less than
NABIL, Himalayan and Everest. In the year 2002, investment bank is no
return. The trade line of historical return over the study period has been
depicted in fig. 4.3. Average annual rate of return of NIB is 17.61% over
the study period.
Fig. 4.3: Trend line of Historical Return of NIB
It can be explained with the help of fig. 4.3, trend line of NIB is
downward slopping because the value of ‘b’ is negative. The curve line
shows that maximum point of return in year 2000 and minimum in year
2001. The closing line of NIB is downward and upward because the
closing price is not same in every year. As a result of fluctuation the price
of the closing is different in every year.
y = -0.8727x + 913.6
0
200
400
600
800
1000
1200
1400
1600
1997/98 1998/99 1999/00 2000/01 2001/02 2002/03 2003/04 2004/05 2005/06 2006/07
Fiscal Year
Clo
sing P
rice
(R
s.)
Closing Price (Rs.) Linear (Closing Price (Rs.))

4.1.2 Analysis of Historical Return of Everest bank
The Historical return of Everest Bank Limited has been presented in
table 4.4.
Table 4.4: Historical Return and Average Rate of Return of EBL.
YearClosing Price
(Rs.)Dividend per share
(stock + cash)Rj =
1tP
tDiv1tPtP
1997/98 184 15 -
1998/99 407 195 1.29
1999/00 980 - 1.889
2000/01 750 86 -.23
2001/02 430 20 -.312
2002/03 445 20 -.08
2003/04 680 20 .57
2004/05 870 20 .31
2005/06 950 38 0.11
2006/07 190 46 0.19
Total Rj = 4.34
Source: Calculated the Basic of data extracted from NEPSE and Annual Report, Bank.
Average Rate of Return ( R j) =N
Rj = 48.22 percent.
The closing market price per share of Everest bank is less then
among four banks. In 1997/98 the closing market price per share is 184 at
the end of review its market price per share is Rs.1090 only. In year
1990/2000 the Everest bank has also maximum return of Everest bank has
maximum among the four banks i.e. 48.22%. The trend line of EBL over
the study period has been depicted in figure. 4.4

Fig. 4.4: Trend Line of Historical Return of EBL
The trend line of Everest bank is also downward slopping year end
return is decreasing slope in 2005 and historical return of EBL has touch
minimum point in year 2002. The line of closing price of Everest Bank, is
upward and downward because the closing price of Everest Bank is not
same every year. Fig. 4.4 Everest Bank, we can easily deserve over
performance of EBL.
4.1.3 Comparative Analysis of Historical Return of Sampled Banks
In table 4.5 the comparative analysis of historical return of sampled
bank has been presented in 15th July 2005 NABIL, HBL and EBL are
positive return but NIB has negative return. Average return of EBL has
highest return 48.22% and NIB has the lowest then other sampled bank i.e.
17.61% overall condition of HBL is better among the sampled bank
because it has positive return on whole year Expected 1st July 2002 in 15th
July 2002, all the sampled banks have negative return. NABIL and HBL
Return are increasing in positive direction but NIB and EBL return are
increase in negative direction. The historical return of NIB has positive in
y = 18.848x + 484.93
0
200
400
600
800
1000
1200
1997/98 1998/99 1999/00 2000/01 2001/02 2002/03 2003/04 2004/05 2005/06 2006/07
Fiscal Year
Clo
sing P
rice
(R
s.)
Closing Price (Rs.) Linear (Closing Price (Rs.))
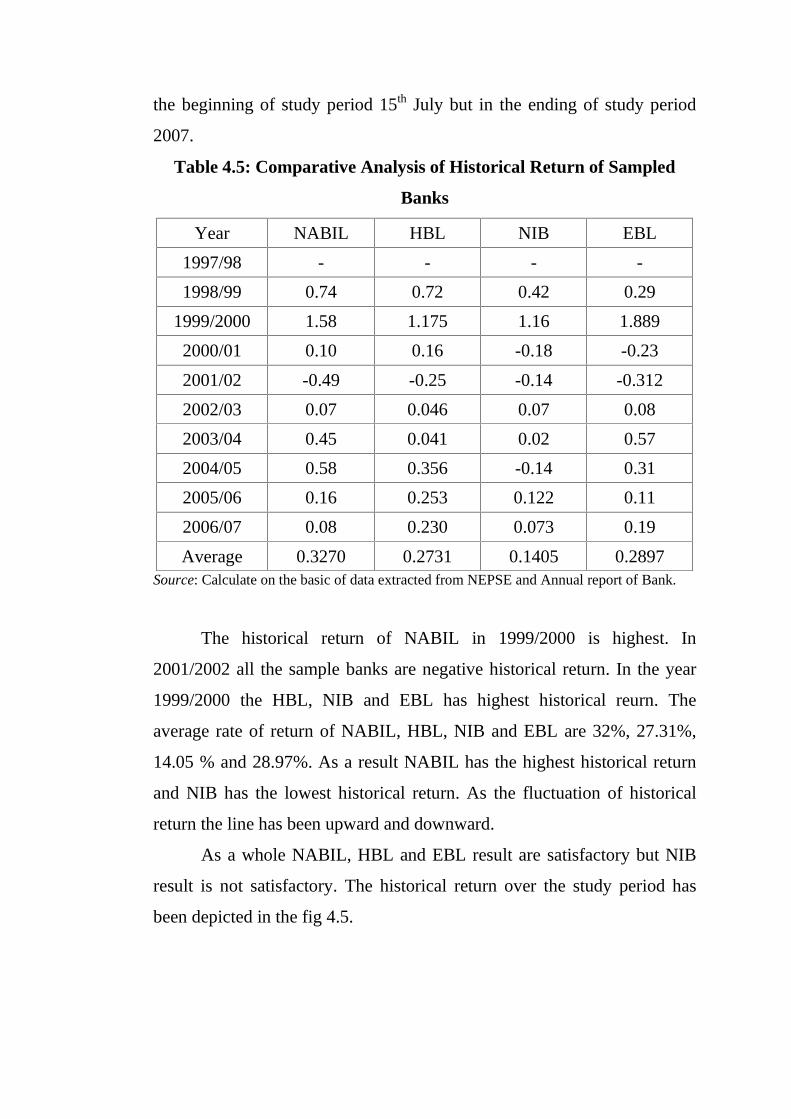
the beginning of study period 15th July but in the ending of study period
2007.
Table 4.5: Comparative Analysis of Historical Return of Sampled
Banks
Year NABIL HBL NIB EBL
1997/98 - - - -
1998/99 0.74 0.72 0.42 0.29
1999/2000 1.58 1.175 1.16 1.889
2000/01 0.10 0.16 -0.18 -0.23
2001/02 -0.49 -0.25 -0.14 -0.312
2002/03 0.07 0.046 0.07 0.08
2003/04 0.45 0.041 0.02 0.57
2004/05 0.58 0.356 -0.14 0.31
2005/06 0.16 0.253 0.122 0.11
2006/07 0.08 0.230 0.073 0.19
Average 0.3270 0.2731 0.1405 0.2897Source: Calculate on the basic of data extracted from NEPSE and Annual report of Bank.
The historical return of NABIL in 1999/2000 is highest. In
2001/2002 all the sample banks are negative historical return. In the year
1999/2000 the HBL, NIB and EBL has highest historical reurn. The
average rate of return of NABIL, HBL, NIB and EBL are 32%, 27.31%,
14.05 % and 28.97%. As a result NABIL has the highest historical return
and NIB has the lowest historical return. As the fluctuation of historical
return the line has been upward and downward.
As a whole NABIL, HBL and EBL result are satisfactory but NIB
result is not satisfactory. The historical return over the study period has
been depicted in the fig 4.5.
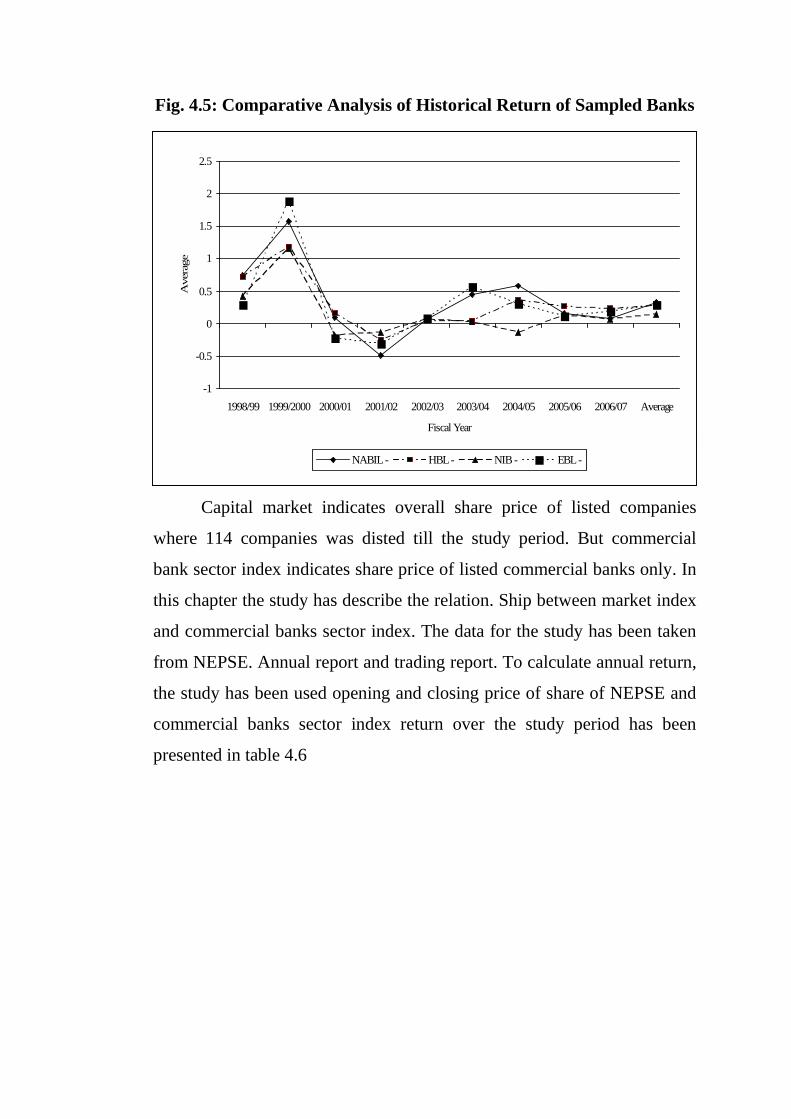
Fig. 4.5: Comparative Analysis of Historical Return of Sampled Banks
4.1.4 Analysis of Commercial Bank Return with Market Rate of
Return
Capital market indicates overall share price of listed companies
where 114 companies was disted till the study period. But commercial
bank sector index indicates share price of listed commercial banks only. In
this chapter the study has describe the relation. Ship between market index
and commercial banks sector index. The data for the study has been taken
from NEPSE. Annual report and trading report. To calculate annual return,
the study has been used opening and closing price of share of NEPSE and
commercial banks sector index return over the study period has been
presented in table 4.6
-1
-0.5
0
0.5
1
1.5
2
2.5
1998/99 1999/2000 2000/01 2001/02 2002/03 2003/04 2004/05 2005/06 2006/07 Average
Fiscal Year
Aver
age
NABIL - HBL - NIB - EBL -

Table 4.6: Expected Market Return and Commercial Banks Return
Year NEPSEAggregate AnnualReturn of Capital
Market (RM)
Commercialbank index
closing
AggreageAnnual return of
commercialbanks index (Rc)
1997/98 163.35 - 218.82 -
1998/99 216.35 0.34 219.04 0.84
1999/2000 360.70 0.66 392.71 0.81
2000/01 348.43 -0.03 384.04 -0.03
2001/02 227.54 -0.35 212.68 -0.45
2002/03 204.86 -0.10 200.67 -0.05
2003/04 222.04 0.084 231.97 0.16
2004/05 286.07 0.29 304.64 0.31
2005/06 297.04 0.023 354.84 0.16
2006/07 287.5 0.24 392.54 0.10
RM = 1.1570 Rc = 1.38
MR = 12.86% cR =15.33%Source: Calculated on the Basic of Data Extracted from NEPSE.
In the year 1998 the NEPSE index has the maximum them
commercial bank. In the year 2000, 2001, 2003, the capital markets
negative as a result in 2001, 2002 and 2003 the commercial bank market
index return is negative in 2000 the commercial bank index and NEPSE
index is highest. Average return of commercial banks is 15.33% and
capital market return is 12.86%. As a result market return is more
fluctuation then commercial banks sectors index. In the year 2005 both
return are positive and satisfactory. The result between capital market and
commercial bank sector index. Aggregate Annual return lines has been
upward and downward because the return is not same every years. The
commercial banks sector index return and capital market return over the
study period has been depicted in fig. 4.6

Fig. 4.6: Expected Market Return and Commercial Banks Return
4.1.4 Analysis of Risk Premium of Commercial Banks
Sector index, capita market and individual banks.
In the study has been describe about the risk premium of sampled
commercial bank and its sector. In this factor has also describe capital
market risk premium. Risk free rate of return has been taken from NRB to
calculate risk premium and individual historical return taken from Table
4.1-4.4. Similarly, historical return of capital market and commercial bank
sector has been taken from 4.5 Risk premium of above sector has been
calculated by using formula, which is given on research methodology
3.5.1.2 risk premium of individual banks, capital market and commercial
bank sector over the study period has been presented in table 4.7.
-0.6
-0.4
-0.2
0
0.2
0.4
0.6
0.8
1
1997/98 1998/99 1999/2000 2000/01 2001/02 2002/03 2003/04 2004/05 2005/06 2006/07
Fiscal Year
Agg
rega
te A
nnua
l Ret
urn
Aggregate Annual Return of Capital Market (RM) Aggreage Annual return of commercial banks index (Rc)

Table 4.7: Risk Premium of Individual Banks, Capital Market and
Commercial Bank Sectors Index
Year
NABILRisk
Premium(RJ-RF)
HBLRisk
Premium(RJ-RF)
NIBRisk
Premium(RJ-RF)
EBLRisk
Premium(RJ-RF)
RF
AggregateRisk
Premiumof market(RJ-RF)
AggregateRisk
Premium ofCommercial
Bank(RJ-RF)
1997/98 - - - - - - -
1998/99 0.719 0.699 0.399 1.269 0.021 0.319 0.819
1999/2000 1.534 1.129 1.114 1.843 0.046 0.614 0.764
2000/01 0.051 0.111 -0.229 -0.279 0.049 -0.079 -0.079
2001/02 -0.537 -0.29 -0.187 -0.357 -0.047 0.397 0.497
2002/03 0.035 0.611 0.035 0.045 0.035 -0.135 -0.085
2003/04 0.377 -0.032 0.497 0.497 0.073 0.011 0.087
2004/05 00.623 .399 -0.97 0.353 -0.043 0.333 0.353
2005/06 0.123 0.216 0.0850 0.073 0.037 -0.014 0.123
2006/07 0.0320 0.182 0.25 0.142 0.048 0.192 0.052
Total 2.9570 3.0250 1.642 3.686 0.2731 1.638 2.5312
Source: Calculate on the Basic of Data Extracted from NEPSE and NRB.
From the above table the risk premium of NIB Bank has the lowest
risk premium and EBL has the highest risk premium. Among for Banks,
EBL has the highest return and NIB has the lowest return. All four banks
are negative risk premium in year 2002 or no return. The Table 4.7 also
represents risk premium of market index and sector index were market risk
premium is les than commercial banks risk premium that is 1.638 and
2.5312 respectively. When return goes up risk premium also goes up and
vice-versa.
4.1.5 Comparison between Average Rage of Return and Required
Rate of Return of Commercial Banks in Nepal
Capital assets pricing model has been used to calculate required rate
of return of sampled banks, which is given in research methodology
3.52%. To calculate required rate of return has been taken from Table (4.1
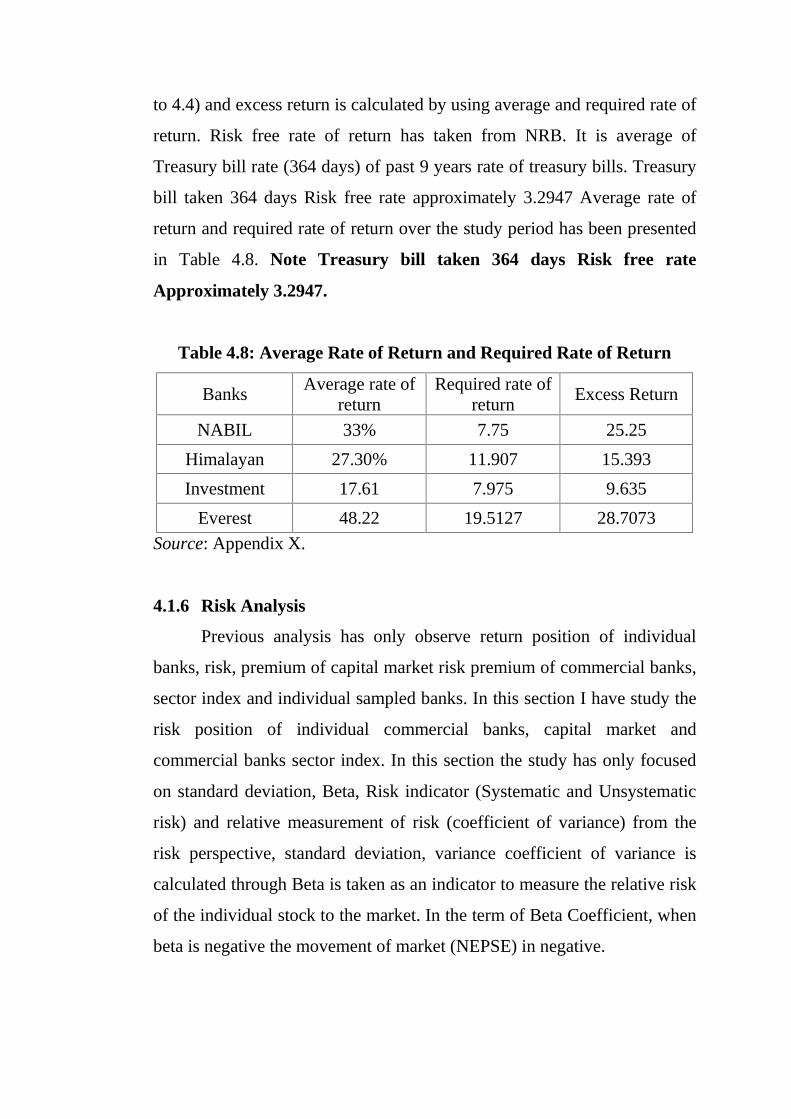
to 4.4) and excess return is calculated by using average and required rate of
return. Risk free rate of return has taken from NRB. It is average of
Treasury bill rate (364 days) of past 9 years rate of treasury bills. Treasury
bill taken 364 days Risk free rate approximately 3.2947 Average rate of
return and required rate of return over the study period has been presented
in Table 4.8. Note Treasury bill taken 364 days Risk free rate
Approximately 3.2947.
Table 4.8: Average Rate of Return and Required Rate of Return
BanksAverage rate of
returnRequired rate of
returnExcess Return
NABIL 33% 7.75 25.25
Himalayan 27.30% 11.907 15.393
Investment 17.61 7.975 9.635
Everest 48.22 19.5127 28.7073
Source: Appendix X.
4.1.6 Risk Analysis
Previous analysis has only observe return position of individual
banks, risk, premium of capital market risk premium of commercial banks,
sector index and individual sampled banks. In this section I have study the
risk position of individual commercial banks, capital market and
commercial banks sector index. In this section the study has only focused
on standard deviation, Beta, Risk indicator (Systematic and Unsystematic
risk) and relative measurement of risk (coefficient of variance) from the
risk perspective, standard deviation, variance coefficient of variance is
calculated through Beta is taken as an indicator to measure the relative risk
of the individual stock to the market. In the term of Beta Coefficient, when
beta is negative the movement of market (NEPSE) in negative.

4.1.6.1 Risk Analysis of NABIL Bank
Risk Analysis of NABIL Bank over the study period has been
presented in Table 4.9
Table 4.9: Risk Analysis of NABIL Bank
Particulars NABIL Bank
Variance 0.3062
Standard Deviation 0.5534
Coefficient of variance 0.1342
Beta Coefficient 0.15
Coefficient of Variation 0.039
Total Risk 0.3062
Systematic Risk 0.0067
Unsystematic Risk 0.2995
Average rate of Return 33%
Source: Appendix XI.
Beta of NABIL is 0.244 it reveals that the stock has positive relation
with the market (NEPSE). As beta of this stock is measure. 0.15 the
positive change in NEPSE if it will be 1 percent the stock will have
positive response by 0.15 percent. From this view point of volatility, the
stock is less volatile then the market. Systematic risk and an unsystematic
risk of the bank are 0.0067 and 0.2995 respectively. Nabil banks has only
one defensive stock among the sampled bank.

4.1.6.2 Risk Analysis of Himalayan Bank Limited
Risk analysis of HBL bank over the study period has been presented
in Table 4.10.
Table 4.10: Risk Analysis of HBL
Particulars HBL
Variance 0.158
Standard Deviation 0.397
Coefficient of Covariance 0.099
Beta Coefficient 0.3588
Coefficient of Variation 0.4758
Total Risk 0.158
Systematic Risk 0.0355
Unsystematic Risk 0.1225
Average rate of Return 27.30%
Source: Appendix XII.
The Beta of Himalayan Bank is 0.3588. As the result it reveals that
the stock has positive correlation with the market (NEPSE). The return of
Himalayan Bank is more volatile then the market. As Beta of this stock is
measured 0.3588, the positive change NEPSE, the stock will have positive
response. From the view point of volatility, the stock is more volatility then
the market. This stock therefore can be categorized as aggressive stock. It
is therefore risky then the market. The variance has indicates the total risk
of the bank is 0.158 and the variance is 0.158.Systematic and unsystematic
risk are 0.0355 and 0.1225.
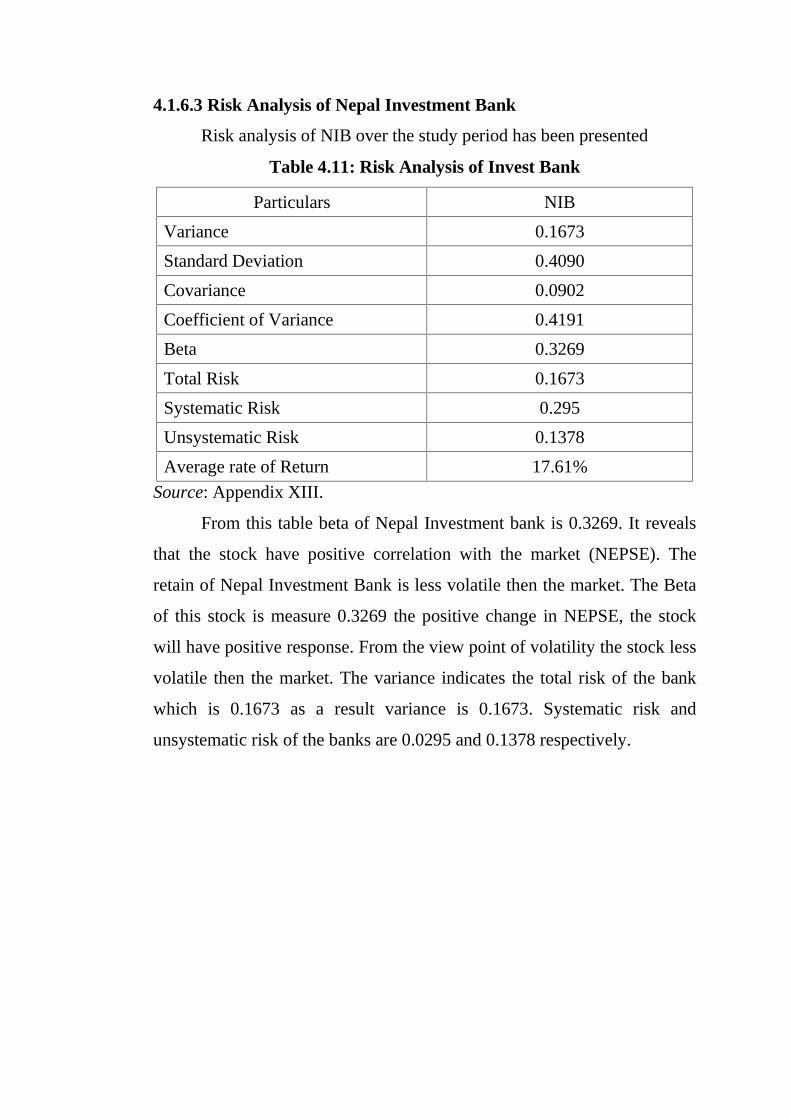
4.1.6.3 Risk Analysis of Nepal Investment Bank
Risk analysis of NIB over the study period has been presented
Table 4.11: Risk Analysis of Invest Bank
Particulars NIB
Variance 0.1673
Standard Deviation 0.4090
Covariance 0.0902
Coefficient of Variance 0.4191
Beta 0.3269
Total Risk 0.1673
Systematic Risk 0.295
Unsystematic Risk 0.1378
Average rate of Return 17.61%
Source: Appendix XIII.
From this table beta of Nepal Investment bank is 0.3269. It reveals
that the stock have positive correlation with the market (NEPSE). The
retain of Nepal Investment Bank is less volatile then the market. The Beta
of this stock is measure 0.3269 the positive change in NEPSE, the stock
will have positive response. From the view point of volatility the stock less
volatile then the market. The variance indicates the total risk of the bank
which is 0.1673 as a result variance is 0.1673. Systematic risk and
unsystematic risk of the banks are 0.0295 and 0.1378 respectively.

4.1.6.4 Risk Analysis of Everest Bank Limited
Risk analysis of EBL for ten year period has been presented in Table
4.12.
Table 4.12: Risk Analysis of Everest Bank
Particulars EBL
Variance 0.466
Standard Deviation 0.683
Covariance 0.171
Coefficient of Variance 0.4772
Beta 0.361
Total Risk 0.466
Systematic Risk 0.106
Unsystematic Risk 0.3598
Average rate of Return 48.22%
Source: Appendix XIV.
Beta of Everest Bank is 0.6205, the Beta reveals that the stock has
positive correlation with the market (NEPSE), from the view point of
volatility the stock is more volatility then the market. This stock therefore
can be categorized as aggressive stock. It is therefore more risky then the
market. The total risk of the banks is 0.466 and systematic risk is 0.106. As
a result an systematic is 0.1062. The average rate of return of this bank is
48.22%.
4.1.6.5 Comparative Analysis and Compare the Unsystematic Risk for
four sampled banks
This section only explain comparative analysis of four commercial
banks. To analysis the study has been taken data from the table 4.9-4.12
comparative analysis has been presented in Table 4.13.

Table 4.13: Comparative Analysis of four Sampled Banks
ParticularsNABILBank
HBL NIB EBL
Variance 0.3062 0.158 0.1673 0.466
Standard Deviation 0.5534 0.397 0.4090 0.683
Coefficient ofVariance
0.039 0.4758 0.4191 0.4773
Beta 0.15 0.3588 0.3269 0.361
Covariance 0.0170 0.099 0.090 0.171
Total Risk 0.3062 0.158 0.1673 0.466
Systematic Risk 0.0067 0.0355 0.0295 0.106
Unsystematic Risk 0.2995 0.1225 0.1378 0.3598
Average rate of Return 33% 27.30% 17.61% 48.22%
Source: Appendix XI-XIV.
The table 4.13 has been presented overall risk indicates of NABIL,
HBL, NIB and EBL. Everest bank limited has the highest Average rate of
return. NIB has the lowest average rate of return of 17.61%. The average
rate of NABIL, HBL has 33% and 27.30%. The total risk of EBL is highest
it is 0.466 and lowest total risk of HBL is 0.158. The result show the
NABIL has the lowest beta (0.15) then other sampled banks and EBL has
the highest Beta coefficient (0.361). The variance of NIB has the highest
and EBL has lowest so that it s less risky then other sampled banks. The
result shows that NABIL has lowest coefficient of variation (0.039) and
HBL has the highest coefficient of variation, covariance of NABIL is
lowest and EBL has highest. The table 4.13 indicates that systematic risk is
less then unsystematic risk. Unsystematic risk can diversity but systematic
risk can't diversity. Among four banks, NABIL has minimum systematic
risk and EBL has highest systematic risk.
Unsystematic risk is one that affects of single assets or a small group
of Assets. Such risk is caused by factor specific to a particular firm. These
factor are availability of raw materials efficiencies of management strikes

by labor union financial average. The unsystematic risk of
NABIL,HBL,NIB and EBL is 0.2995, 0.1225, 0.1378 and 0.3598.compare
the four banks EBL has the highest unsystematic risk and HBL has lowest
systematic risk.
4.1.6.6 Analysis of Overall Capital Market Relative to Commercial
Banks Sector Index
Risk Analysis of overall capital market relative to commercial banks
sectors index study period has been presented in Table 4.14.
Table 4.14: Risk Analysis of Overall Capital Market Relative to
Commercial Banks Index.
Particulars Market Index Commercial bank index
Average return 12.86% 15.33%
Standard Deviation 27.60% 41.02%
Variance 7.62% 16.83%
Coefficient of Variance 2.1462% 2.6758%
Beta of NABIL 0.15 0.1302
Beta of HBL 0.3588 0.1674
Beta of NIB 0.3269 0.3613
Beta of EBL 0.361 -0.1503
Source: Appendix XX.
Table 4.14 exhibits market index and commercial bank index for the
study period. The table has bee show the Average rate of return of market
index is 12.8% and commercial banks average rate of return is 15.33%.
Similarly commercial banks index standard deviation is greater then
market index standard deviation. They are 41.02% and 27.60% percent.
The variance of market index is 7.62% and commercial banks index
variance is 16.83%. Which is greater then market index. The coefficient of
variance of market index and commercial banks index are 2.6758 percent
and 2.1462 percent. Betas of Himalayan bank and Everest bank are 0.1674

and -0.1503 respectively by using market index and this short of stock can
be categorized as aggressive stock but from the view point of commercial
banks index. Stock of Himalayan Bank can be categorized as defensive
stock. NIB Bank and HBL are more risky than EBL and NABIL from the
view point of commercial banks index. But NIB is more risky then NABIL
and Himalayan Bank from the view point of market index.
4.1.7 Correlation between Risk and Expected Return
Correlation coefficient indicates the relationship between two or
more variable. It shows the significant and insignificant result between two
or more variables. The correlation between risk and return has been
analyzed table 4.15. Theoretically, when risk increases return also increase
and vice-versa. For the analysis, standard deviation and expected rate of
return has been taken from previous calculation and it has been calculated
by using Microsoft Excel program. Correlation between risk and Expected
return has been presented in table 4.15.
Table 4.15
Correlation between Risk and Expected Return
RiskStandarddeviation
Returnexpectedreturn
Correlation PE 6PE Result Remarks
0.9308 0.0451 0.2703 r>6PE significant
Source: Appendix XXI
The tables results show that the correlation 0.9308 between risk and
return probably error is 0.0451 and 6PE is 0.2703. The correlation between
risk and return is greater then PE and 6PE. Which indicate that the result of
the study is significant. From the basis of following statement, positive
correlation indicates that when risk increase return also increase with out
proportionally.

4.2 Major Findings of the Study
4.2.1 The Average rate of return of NABIL, HBL, NIB and EBL are
33%, 27.30%, 17.61% and 48.33%. As the result the Everest Bank
has the highest return and NIB has the lowest return.
4.2.2 Over the ten years study period the slope of NABIL, HBL, NIB
and EBL has 106.09, -24.206, -0.8727 and 18.848 respectively.
4.2.3 In the year 2001/02 all the sampled bank have negative annual
return or no return. Annual return of NABIL, HBL, NIB and EBL
return is -0.49, -0.25, -0.14 and -0.312 respectively and in the
same year NEPSE movement is also negative that is 0.079.
4.2.4 Expected return and risk of banking sector are 15.33% and 41.02%
respectively, where as CV remains 2.6758%. Similarly, expected
return and risk of capital market is 12.86% and 31.49%
respectively where as CV remains 2.1486.
4.2.5 Aggregate risk premium of NABIL, HBL, NIB and EBL is 2.9570,
3.0250, 1.6420 and 3.686 respectively. Aggregate risk premium of
capital market and banking sector is 1.638 and 2.5312. Aggregate
risk premium of banking sector has maximum then capital market.
4.2.6 Standard deviation of NABIL, HBL, NIB and EBL are 55.34%,
39.70, 40.90%, 68.3% and Beta coefficient of NABIL, HBL, NIB
and EBL are 0.15, 0.3588, 0.3269 and 0.361 respectively. The
standard deviation of EBL has the highest and HBL has the
lowest.
4.2.7 Coefficient of variation of NABIL, HBL, NIB and EBL is 0.039,
0.4758, 0.4191 and 0.4773 respectively. The coefficient of
variation of EBL is highest and NABIL is lowest.
4.2.8 Systematic Risk of NABIL, HBL, NIB and EBL is 0.0067, .0355,
0.0295 and 0.106 respectively. As a result unsystematic risk of
NABIL, HBL, NIB and EBL are 0.2995, 0.1225, 0.1378 and
0.3598 respectively.

4.2.9 Correlation coefficient between risk and return of sample bank is
+0.9308. Which probable error (PE) and 6 (PE) are 0.0451 and
0.2703 respectively.
4.2.10 According to CAPM theory, HBL has the highest required rate of
return which is 19.51 percent and NABIL has the lowest required
rate of return which is 7.75 percent respectively.
4.2.11 The closing line of four sampled banks is upward and downward
because the closing price of all bank has not same every year.
CHAPTER V
SUMMARY, CONCLUSIONS AND RECOMMENDATION
5.1 Summary
Risk and return are the two parts of coins. "If there is no risk there is
no return." Risk and return measure the performance of any organization it
is a key factor of financial sectors. For any investment decision, investors
should calculate rate of return and risk. The economic is growing rapidly,
which force the life style change fast.
Banking sector is most dynamic part of economic which collects
unused fund and mobilizes it in needed sectors. Bank is the heart of trade
commerce and industry. In our country joint venture bank and private
sectors bank has performed better than Nepalese government sectors banks
because of trading and development, high skill management, efficient and
capacity of proper risk management. Capital market play vital role to
develop the economic world. NEPSE is the heart of capital market. Capital
market has the two parts one is primary market and other is secondary
market. In the primary market and secondary different companies and
investors exchanges the shares transactions. The present study has been
analyzed risk and return of common stocks investment. common stock is
the most risky security and life blood of stock market. The main objective
of the study is to analyze the risk and return of commercial bank and it also
focused of common stock of listed commercial bank.
Four listed commercial bank like NABIL, HBL, NIB and EBL in NEPSE
have been taken as sample and their individual risk and return were
calculated and analyzed as a whole to find out the performance of each

bank. While analyzing the risk and return brief reviews of related studies
has been done. Review of Literature for the study have been described
theoretical review has been presented definition of risk and return of
different books and authors. Similarly, journal and thesis have reviewed
from web side and master dissertation T.U the study has also included
research methodology to fulfill the objective of present study. To analyze
the data standard deviation, beta, required rate of return, expected rate of
return and coefficient of variation have been calculated. The study fully
dependent upon secondary sources. For, the study secondary data were
collected from NEPSE, NRB and related commercial bank's annual report
and web side. The study has mainly focused on risk and return of listed
commercial banks. Presentation and analysis have been measured beta, CV
standard deviation, required rate of return and expected return. On the
basic of major following conclusion are drown.
5.2 Conclusion
5.2.1 CV of commercial banking sector is greater then CV of capital
market therefore market sector is less risky than other sector it is
beneficial for the investor who invests the share of market sector.
5.2.2 The risk of common stock of EBL is most risky while HBL is
lowest risky. If investors want to invest the share of Banking sector
they can purchase the share of HBL.
5.2.3 Beta of EBL is highest and beta of NABIL is lowest. It shows that
NABIL has lowest risk and EBL has highest risk.
5.2.4 Average return of EBL has the highest (48.33%) and NIB has the
lowest (17.61%). From the view point of average rate of return
investor can invest the share of EBL.
5.2.5 The present study has mainly focused on risk and return analysis
from this point, investment bank has the lowest risk. If investor is
risk averter he/she can invest in NIB securities but investor is risk
seeker, he can invest in EBL.]
5.2.6 According to CAPM theory, EBL has the highest required rate of
return which is 19.51 percent and NABIL has the lowest required
rate of return which is 7.75% percent respectively. All four sampled
banks are under priced so it is concluded that investor will purchase
share of commercial bank.
5.2.7 From the study result, it is concluded that none of the share price are
in equilibrium because all the sampled banks average rate of return
is more then required rate of return.
5.3 Recommendation
Above conclusion have presented the following recommendations:
5.3.1 The beta of EBL is 0.361 which is the highest among sampled
banks. It in data that it has the highest systematic risk so it is
recommended that sampled bank should diversity their investment
policy to reduce the risk.
5.3.2 The common stock return of commercial bank are highly sensitive
to market. They are highly positively correlation to the market. So,
market should be analyzed.
5.3.3 Overall, it is belived that higher the return higher the risk and lower
the return lower the risk. Investment risk are better covered through
a large and diversified portfolio. Divesting an investment is a way of
reducing the risk so all the risky sampled banks are recommended to
the diversity their investment policy in less risky securities.
5.3.4 Most of the researchers have included only five years data but only
five years data can't be sufficient to analyze risk and return of
commercial banks so it is suggested that further researcher should be
included at 10 years data.

5.3.5 The result of correlation between risk and return is significant. The
result is unsatisfactory because the sampled size of the study is to
small and the data for the study is used from annual report and web
side which may not be sufficient so it is suggested that for further
researchers will recommended to include sufficient sampled size.
BIBLIOGRAPHY
Books and Report:-
Alibe, Akigbe and Ann Marie Whytem Fall 2004. The Gramn-Leach BlleyAct of 1999: Risk Implication for Financial Service Industry,Journal of Financial Research, XXVII no.3: 453-466.
Balla, V.K. 1999. Investment Management: Security Analysis andPortfolio Management. 6th ed. New Delhi: S. Chand and CompanyLtd. Ram Nagar.
Bhatta, Gopal Prasad, 1995. “Assessment of the Performance of ListedCompanies in Nepal.” Master dis. Tribhuvan University.
Brealey, Richard. A and Stewart (Myer), 1991. Principle of CorporateFinance 4thed. New Delhi: MC Graw Hill.
Copper, Donal R and Pamela S.Schindler, 2003. Business ResearchMethod 8th ed. New Delhi: Tata MC Graw Hill.
EBL, 15th July 1996-15th July 2005, Annual Report, Kathmandu: EverestBank Limited.
Francis, Jack Clark, 1995. Investment of Managerial 5th ed. New Delhi:Publishing Pvt. Ltd.
Gitaman, Lowrance J. 1998. Principle of Managerial Finance 5th ed. NewYork: Harper Collins Publication.
Hampton, John J. 1998. Financial Decision Making (Concept, Problemsand Cases), 4th ed. New Delhi: Prentice Hall of India PrivateLimited.

HBL, 15th July 1998-15th July 2007, Annual Report. Kathmandu:Himalayan Bank Limited.
Joshi, Deepak Raj, 2004. “Risk and Return Analysis of Common Stock ofFive Lister Commercial Banks Listed in NEPSE.” Master diss.,Tribhuvan University.
Khadka, Ram Hari, 2004. “Analysis of Risk and Return on SelectedNepalese Commercial Banks Listed in NEPSE.” Master diss.,Tribhuvan University.
Kothari, CR. 1991. Qualitative Techniques 2nd ed. New Delhi: VikashPublishing House Pvt. Ltd.
Kothari, CR. 1989. Research Methodology: Method and Techniques.2nd
ed. New Delhi: Wishwa Prakashan.
NABIL, 15th July 1996 – 15th July 2005. Annual Report. Kathmandu:NABIL Bank.
Nepal Stock Exchange Ltd. 2005. Financial Statement of ListedCompany, Kathmandu: NEPSE.
NIB 15th July 1996-15th July 2005. Annual Report, Katmandu: NepalInvestment Bank Limited.
Operational Date Nepal Rastra Bank <http://www.nrb.org.np>.
Pandey, Primina, 20000. “Risk and Return Analysis of Common StockInvestment.” Master diss., Tribhuvan University.
Pandey, I.M. 1995. Financial Management 7th ed. New Delhi: PublisingHouse Pvt. Ltd.
Pandey Sijapati, 2000. “Risk and Return Analysis of Common StockInvestment. Master diss., Tribhuvan University.
Pradhan, Surendra 1991. Basic of Financial Management. 1st ed.Kathmandu: Educational Enterprises (P) Ltd.
Prashan, Radhes S. 2004. Financial Management. 1st ed. Kathmandu:Educational Enterprises (p) Ltd.
Ross, Stephen A. Randolph. W. Westertield and Jeffery F. deffe 1998.Fundamental of Corporate Finance 3rd ed. New Delhi: TataMCGraw- Hill.

Sapkota, Jeet Bahadur, 2000. “Risk and Return. Analysis in CommonStock Investment.” Master diss., Tribhuvan University.
Securities Board of Nepal 15th July 2004/05. Annual Report. Kathmandu:SEBON.
Sharpe, William F. Gordon J. Alexander and Jeffery V, Baily 1998.Investment. 5th ed. New Delhi: Prentice Hall of India PrivateLimited.
Shrestha, Amit 2003. “Risk and Return Analysis on Common StockInvestment of Banking Sector in Nepal”. Master diss., TribhuvanUniversity.
Tamang, Buddhi RAj 2003. “Risk and Return Analysis of CommercialBanks in Nepal.” Master diss., Tribhuvan University.
Upaddhaya, Sudeep 2000. “Risk and Return Analysis in Common StockInvestment.” Master diss., Tribhuvan University.
Van, Horn, James C. 1997. Finance Management and Policy 11th ed. NewDelhi: Prentice Hall of India Private Limited.
Westerfield, Ross and Jordan. 1998. Fundamentals of Corporate Finance,6hd ed. New Delhi: Tata MC Graw-Hill Publishing Company, Ltd.
Western,m J Fred and Thomas, 9th ed. Orland of Lorda: The Dryden Press.
Wolff Roward K and Prem R. Pant, 2003. A Hand Book for SocialScience Research and Thesis Writing, 3rd ed. Kathmandu: BuddhaAcademy.
Journal:
Michall, S Pagano. Dec 2001. How Theories of Financial IntermediationCorporate Risk Taking Management Influence Bank Risk TakingBehaviour, Journal of Financial Market 10, no 5: 277-323, April3, 2006, >http://wwww.backwell-Synergy. com/ doi/ pdf/ 10.1111/ j1540 6188. 2001. 00122x>.
Jeremy Berkowitz andJames O' Brien's, June 2002. How Acurate are value– at – Risk Models at Commercial Bank Z. Journal of Finance andVol. 3: 410-432, April 13, 2006<http://www.backwell-Synergy/.comdoi/pdf 10.1046./j.1410.2002.00712>.
Nepal Rastra BAnk Mid. July 2007. Banking and Financial Statistics no.45. Bank and Financial Institutions Regulation Department.Kathmandu: NRB.
Nepal Rastra Bank. Mid July 2007 Quarterly Economic Bulletin volXXXIX, NH Kathmandu: NRB.
Listed Company. January 2, 2006. Nepal Stock Exchange Ltd.<http://www.Nepal STock Com/69/txt>.
April3, 2006<http://www.blackwell-synergy. com/doi/ pdft/ 10.=1046/j1540.00619?
Nepal Stock Exchange Ltd. 1998-2007. Trading Report vo. 4-9.Kathmandu: NEPSE.
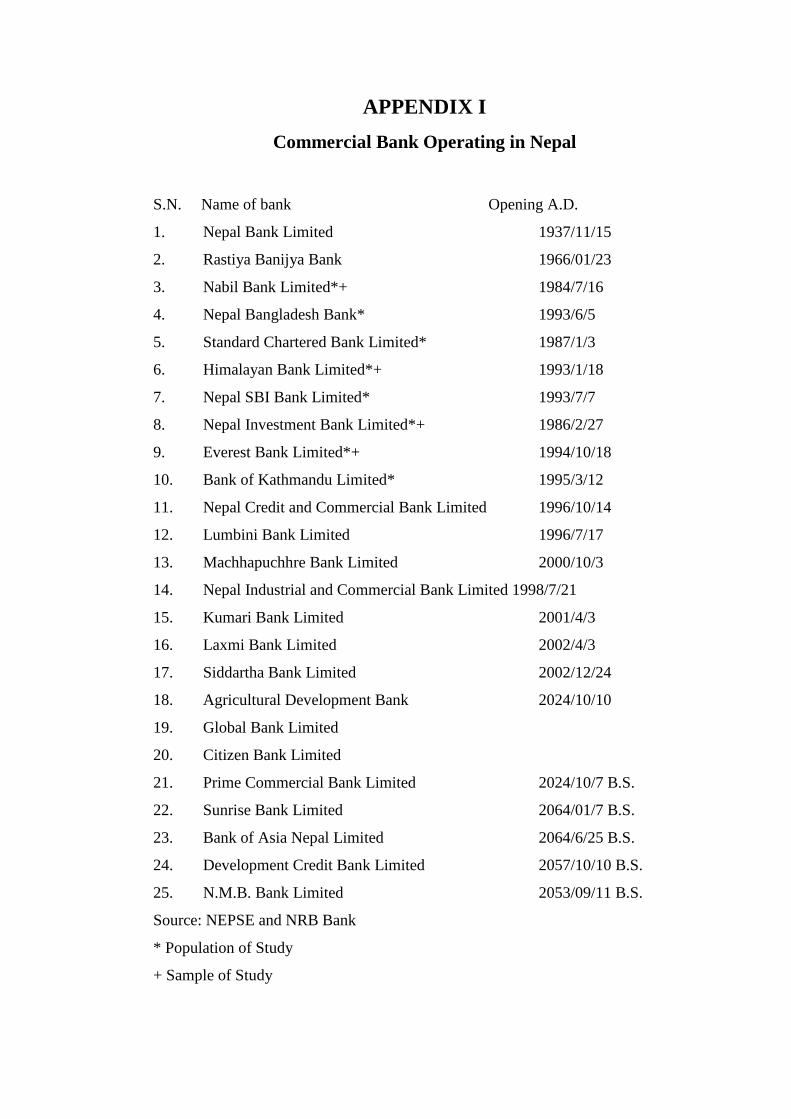
APPENDIX I
Commercial Bank Operating in Nepal
S.N. Name of bank Opening A.D.
1. Nepal Bank Limited 1937/11/15
2. Rastiya Banijya Bank 1966/01/23
3. Nabil Bank Limited*+ 1984/7/16
4. Nepal Bangladesh Bank* 1993/6/5
5. Standard Chartered Bank Limited* 1987/1/3
6. Himalayan Bank Limited*+ 1993/1/18
7. Nepal SBI Bank Limited* 1993/7/7
8. Nepal Investment Bank Limited*+ 1986/2/27
9. Everest Bank Limited*+ 1994/10/18
10. Bank of Kathmandu Limited* 1995/3/12
11. Nepal Credit and Commercial Bank Limited 1996/10/14
12. Lumbini Bank Limited 1996/7/17
13. Machhapuchhre Bank Limited 2000/10/3
14. Nepal Industrial and Commercial Bank Limited 1998/7/21
15. Kumari Bank Limited 2001/4/3
16. Laxmi Bank Limited 2002/4/3
17. Siddartha Bank Limited 2002/12/24
18. Agricultural Development Bank 2024/10/10
19. Global Bank Limited
20. Citizen Bank Limited
21. Prime Commercial Bank Limited 2024/10/7 B.S.
22. Sunrise Bank Limited 2064/01/7 B.S.
23. Bank of Asia Nepal Limited 2064/6/25 B.S.
24. Development Credit Bank Limited 2057/10/10 B.S.
25. N.M.B. Bank Limited 2053/09/11 B.S.
Source: NEPSE and NRB Bank
* Population of Study
+ Sample of Study

APPENDIX II
Year NEPSE Index Closing Commercial Bank Index(Closing
Treasury BillRate RF
1997/98 163.35 118.82 3.5037
1998/99 216.35 219.04 2.1222 0.021
1999/00 366.7 392.71 4.5812 0.046
2000/01 348.43 384.04 4.9535 0.049
2001/02 227.54 212.68 4.717 -0.047
2002/03 204.86 200.67 3.4975 0.035
2003/04 222.04 231.97 3.7273 0.073
2004/05 286.67 304.64 4.2882 -0.043
2005/06 297.04 354.84 3.7127 0.037
2006/07 287.5 392.54 3.2947 0.048
APPENDIX III
HIMALAYAN BANK LIMITED
Year Closing Price Opening Price(Rs.)
Cash Dividend%
Stock Dividend%
1997/98 755 - 50 60
1998/99 1000 755 50 25
1999/00 1700 1000 50 25
2000/01 1500 1700 27.5 30
2001/02 1000 1500 12.5 10
2002/03 836 1000 1.32 25
2003/04 840 836 20 -
2004/05 920 840 11.58 20
2005/06 965 900 14 22
2006/07 1010 965 17 14
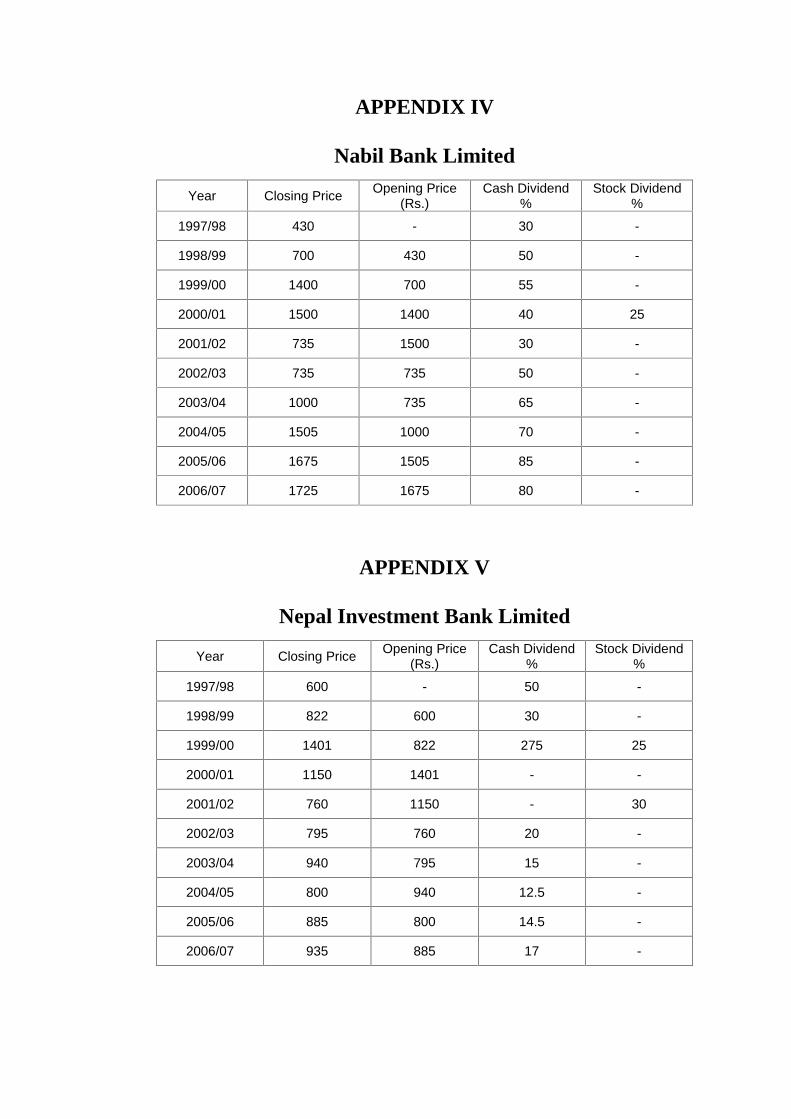
APPENDIX IV
Nabil Bank Limited
Year Closing Price Opening Price(Rs.)
Cash Dividend%
Stock Dividend%
1997/98 430 - 30 -
1998/99 700 430 50 -
1999/00 1400 700 55 -
2000/01 1500 1400 40 25
2001/02 735 1500 30 -
2002/03 735 735 50 -
2003/04 1000 735 65 -
2004/05 1505 1000 70 -
2005/06 1675 1505 85 -
2006/07 1725 1675 80 -
APPENDIX V
Nepal Investment Bank Limited
Year Closing Price Opening Price(Rs.)
Cash Dividend%
Stock Dividend%
1997/98 600 - 50 -
1998/99 822 600 30 -
1999/00 1401 822 275 25
2000/01 1150 1401 - -
2001/02 760 1150 - 30
2002/03 795 760 20 -
2003/04 940 795 15 -
2004/05 800 940 12.5 -
2005/06 885 800 14.5 -
2006/07 935 885 17 -
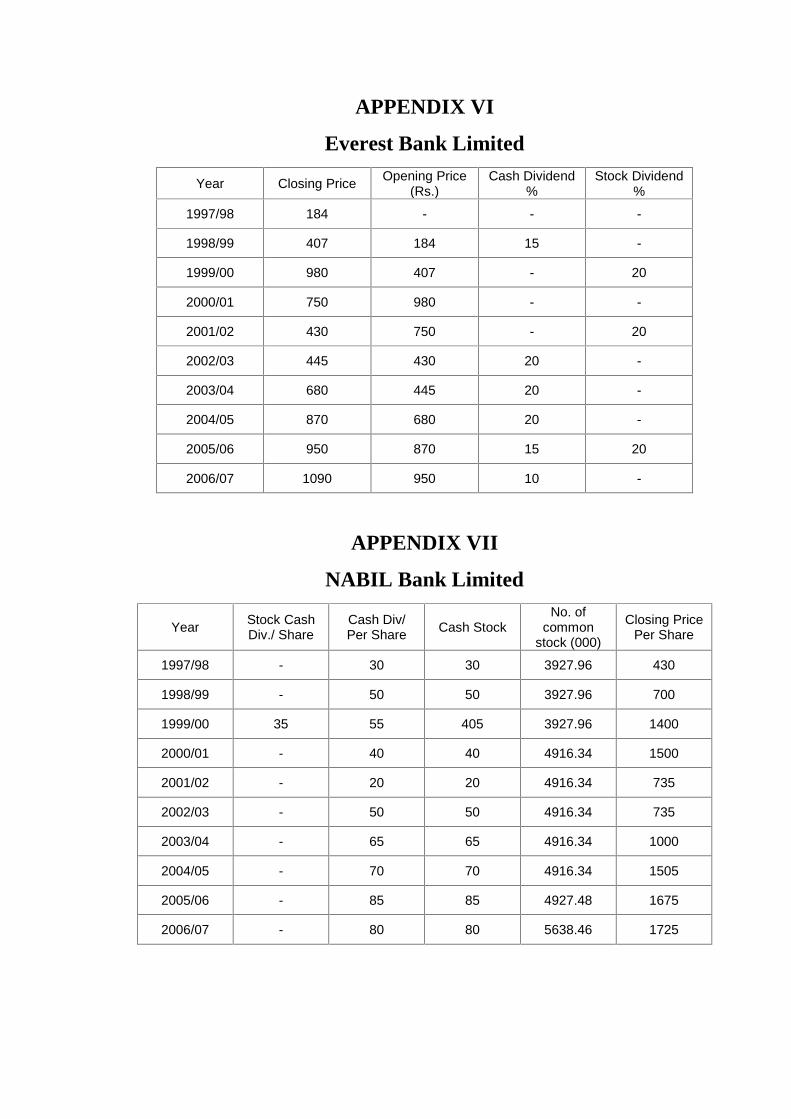
APPENDIX VI
Everest Bank Limited
Year Closing Price Opening Price(Rs.)
Cash Dividend%
Stock Dividend%
1997/98 184 - - -
1998/99 407 184 15 -
1999/00 980 407 - 20
2000/01 750 980 - -
2001/02 430 750 - 20
2002/03 445 430 20 -
2003/04 680 445 20 -
2004/05 870 680 20 -
2005/06 950 870 15 20
2006/07 1090 950 10 -
APPENDIX VII
NABIL Bank Limited
Year Stock CashDiv./ Share
Cash Div/Per Share Cash Stock
No. ofcommon
stock (000)
Closing PricePer Share
1997/98 - 30 30 3927.96 430
1998/99 - 50 50 3927.96 700
1999/00 35 55 405 3927.96 1400
2000/01 - 40 40 4916.34 1500
2001/02 - 20 20 4916.34 735
2002/03 - 50 50 4916.34 735
2003/04 - 65 65 4916.34 1000
2004/05 - 70 70 4916.34 1505
2005/06 - 85 85 4927.48 1675
2006/07 - 80 80 5638.46 1725

APPENDIX VIII
Himalayan Bank Limited
Year Stock CashDiv./ Share
Cash Div/Per Share Cash Stock
No. ofcommon
stock (000)
ClosingMarket Price
Per Share
1997/98 453 50 503 1200 755
1998/99 250 50 300 1920 1000
1999/00 425 50 475 2400 1700
2000/01 448 27.50 475.50 3000 1500
2001/02 112.50 12.50 125 3900 1000
2002/03 209 1.32 210.32 4290 836
2003/04 10 20 30 5362.54 840
2004/05 188 11.58 199.58 5362.50 920
2005/06 173.50 14 187.50 5056 965
2006/07 218 17 235 5475 1010
APPENDIX IX
Investment Bank
Year Stock CashDiv./ Share
Cash Div/Per Share Cash Stock
No. ofcommon
stock (000)
Closing PricePer Share
1997/98 - 50 50 1353.51 600
1998/99 - 30 30 1353.51 822
1999/00 350 27.50 377.75 1553.51 1401
2000/01 - - - 1699.85 1150
2001/02 228 - 228 1699.86 760
2002/03 - 20 20 2953 795
2003/04 - 15 15 2953 940
2004/05 - 12.5 123.50 5905.86 800
2005/06 - 14.5 14.5 5905.86 885
2006/07 - 17 17 5948.86 935

APPENDIX X
Everest Bank
Year Stock CashDiv./ Share
Cash Div/Per Share Cash Stock
No. ofcommon
stock (000)
Closing PricePer Share
1997/98 - - - 1200 184
1998/99 - 15 15 1200 407
1999/00 196 196 195 1200 980
2000/01 - - - 2208.59 750
2001/02 86 86 172 253.19 430
2002/03 - 20 20 3150 445
2003/04 - 20 20 3150 680
2004/05 - 20 20 4550 870
2005/06 - 38 38 4550 950
2006/07 - 46 46 4750 1090
Required rate of return = RF + ( R m – RF)
3.2947 + (33 – 3.2947) .15 = 7.75
3.2947 + (17.30 – 3.2947)× 0.3588 = 11.9070
3.2947 + (17.61 – 3.2947) × 0.3269 = 7.9744
3.2947 + (48.22 – 3.2947) × 0.361 = 19.51
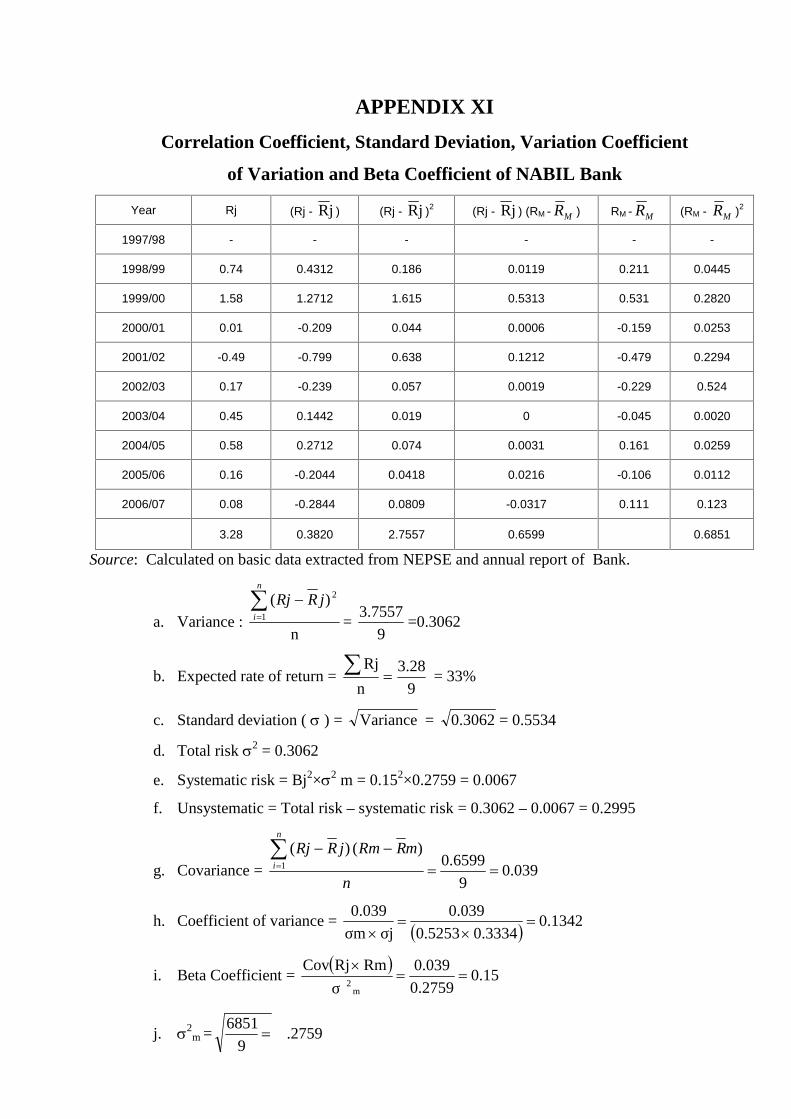
APPENDIX XI
Correlation Coefficient, Standard Deviation, Variation Coefficient
of Variation and Beta Coefficient of NABIL Bank
Year Rj (Rj - jR ) (Rj - jR )2 (Rj - jR ) (RM - MR ) RM - MR (RM - MR )2
1997/98 - - - - - -
1998/99 0.74 0.4312 0.186 0.0119 0.211 0.0445
1999/00 1.58 1.2712 1.615 0.5313 0.531 0.2820
2000/01 0.01 -0.209 0.044 0.0006 -0.159 0.0253
2001/02 -0.49 -0.799 0.638 0.1212 -0.479 0.2294
2002/03 0.17 -0.239 0.057 0.0019 -0.229 0.524
2003/04 0.45 0.1442 0.019 0 -0.045 0.0020
2004/05 0.58 0.2712 0.074 0.0031 0.161 0.0259
2005/06 0.16 -0.2044 0.0418 0.0216 -0.106 0.0112
2006/07 0.08 -0.2844 0.0809 -0.0317 0.111 0.123
3.28 0.3820 2.7557 0.6599 0.6851
Source: Calculated on basic data extracted from NEPSE and annual report of Bank.
a. Variance :n
)(1
2
n
i
jRRj
=9
7557.3=0.3062
b. Expected rate of return =9
3.28
n
Rj = 33%
c. Standard deviation ( ) = Variance = 3062.0 = 0.5534
d. Total risk 2 = 0.3062
e. Systematic risk = Bj2×2 m = 0.152×0.2759 = 0.0067
f. Unsystematic = Total risk – systematic risk = 0.3062 – 0.0067 = 0.2995
g. Covariance = 039.09
6599.0)()(
1
n
mRRmjRRjn
i
h. Coefficient of variance = 0.13420.33340.5253
0.039
σjσm0.039
i. Beta Coefficient =
0.150.2759
0.039
σRmRjCov
m2
j. 2m =
9
6851.2759

APPENDIX XII
Calculation of Standard Deviation, CV, Variance and Beta
Coefficient of Himalayan Bank
Fiscal Year Rj (Rj - jR ) (Rj - jR )2 (RM - MR ) (Rj - jR ) (RM - MR )
1997/98 - - - - -
1998/99 0.72 0.447 0.2 0.211 0.094
1999/00 1.175 0.902 0.814 0.531 0.479
2000/01 0.16 0.113 0.013 -0.154 -0.018
2001/02 -0.25 -0.532 0.283 -0.479 0.255
2002/03 0.046 -0.227 0.052 -0.229 0.053
2003/04 0.041 -0.232 0.054 -0.045 0.01
2004/05 0.356 0.083 0.007 0.161 0.013
2005/06 0.253 -0.02 0 0 0.002
2006/07 0.23 -0.043 0.002 0.111 0.005
2.7310 0.4910 1.4250 0.8930
a. Variance :n
)(1
2
n
i
jRRj
=9
4250.1= 0.158
b. Expected rate of return =9
2.7310
n
Rj
= 27.31%
c. Standard deviation ( ) = Variance = 158.0 = 0.397
d. Total risk 2 = 0.158
e. Systematic risk = Bj2×m2 = 0.35882×0.2759 = 0.0355
f. Unsystematic = Total risk – systematic risk = 0.158 – 0.0355 = 0.1225
g. Covariance = 099.09
8930.0)()(
1
n
mRRmjRRjn
i
h. Coefficient of variance = 0.47420.52530.397
0.099
σjσm0.039
i. Beta Coefficient =
0.35880.2759
0.099
σRmRjCov
m2

APPENDIX XIII
Calculation Standard Deviation, Variable, Coefficient of Variation
Covariance and Beta Coefficient of Investment Bank Limited
Fiscal Year Rj (Rj - jR ) (Rj - jR )2 (RM - MR ) (Rj - jR ) (RM - MR )
1997/98 - - - - -
1998/99 0.42 0.362 0.131 0.211 0.076
1999/00 1.16 1.102 1.214 0.531 0.585
2000/01 -0.18 -0.239 0.057 -0.159 0.038
2001/02 -0.14 -0.199 0.04 -0.479 0.095
2002/03 0.07 0.012 0 -0.229 -0.003
2003/04 0.2 0.142 0.02 -0.045 -0.006
2004/05 -0.14 -0.199 0.04 -0.161 0.032
2005/06 0.122 0.064 0.004 -0.106 -0.007
2006/07 0.073 0.015 0 0.111 0.002
1.5850 1.06 1.5060 0.8120
a. Variance :n
)(1
2
n
i
jRRj
=9
5060.1=0.1673
b. Expected rate of return =9
3.28
n
Rj
= 33%
c. Standard deviation ( ) = Variance = 4090.01673.0
d. Total risk 2 = 0.1673
e. Systematic risk = Bj2×2 m = 0.32692×0.2759 = 0.0295
f. Unsystematic = Total risk – systematic risk = 0.1673-0.295 = 0.1378
g. Covariance = 902.09
8120.0)()(
1
n
mRRmjRRjn
i
h. Coefficient of variance = 0.41910.52530.4090
0.0902
σjσm0.039
i. Beta Coefficient =
0.32690.2759
0.902
mσRmRjCov
2

APPENDIX XIV
Calculation Standard Deviation, Variable, Coefficient of Variation
Covariance and Beta Coefficient of Investment Bank Limited
Fiscal Year Rj (Rj - jR ) (Rj - jR )2 (RM - MR ) (Rj - jR ) (RM - MR )
1997/98 - - - - -
1998/99 1.29 0.808 0.653 0.211 0.17
1999/00 1.889 1.407 1.98 0.531 0.747
2000/01 -0.23 -0.712 0.507 -0.159 0.113
2001/02 -0.312 -0.794 0.63 -0.479 0.38
2002/03 0.08 -0.402 0.162 -0.229 0.092
2003/04 0.57 0.088 0.008 -0.045 -0.004
2004/05 0.31 -0.172 0.03 0.161 -0.028
2005/06 0.11 -0.372 0.138 -0.106 0.039
2006/07 0.19 -0.292 0.085 0.111 0.032
3.8970 -0.4410 4.0930 1.5410
a. Variance :n
)(1
2
n
i
jRRj
=9
0930.4=0.4548 = 0.466
b. Standard deviation ( ) = Variance = 466.0 = 0.683
c. Total risk 2 = 0.466
d. Systematic risk = Bj2×2m = 0.62052×0.2759 = 0.1062
e. Unsystematic = Total risk – systematic risk = 0.3598
f. Covariance = 1712.09
5410.1)()(
1
n
mRRmjRRjn
i
g. Coefficient of variance = 4772.05253.0683.0
0.1712
σjσmRm)(RjCov
h. Beta Coefficient =
0.62050.2759
0.1712
mσRmRjCov
2

APPENDIX XV
Calculation of Correlation between Risk and Return of Sampled
Banks
Banks Average return Standard Deviation
NABIL 0.33 0.5534
HBL 0.2730 0.397
NIB 0.1761 0.4090
EBL 0.4822 0.683
Correlation 0.9308
PE 0.0451
6PE 0.2703

APPENDIX XVI
Nabil Bank Limited Company Performance
Particular 1997/98 1998/99 1999/00 2000/01 2001/02 2002/03 2003/04 2004/05 2005/06 2006/07
Authorized capital (Rsmn) 550 500 500 500 500 500 500 500 500 500
Issue capital (Rsmn) 392.8 392.8 392.8 491.65 491.65 491.65 491.65 491.65 501.65 501.65
Paid of capital 392.8 392.8 392.8 491.65 491.65 491.65 491.65 491.65 501.65 501.65
Reserve (Rsmn) 476.21 541.21 645.67 649.3 654.77 822.53 990.05 998.64 1035 1048
Net worth (Rsmn) 869.01 934.1 938.47 1140.95 1146.42 1314.18 1481.68 1551.68 1033 1658
Total debts (Rsmn) 377.76 190.22 285.2 - 417.3 961.46 229.66 242.56 264 287
No of share (000) 3927.96 3927.96 4916.54 4916.54 4916.54 4916.54 4916.54 5051.64 5125 5256
Net worth per share(Rs) 221.24 237.81 237.8 238.92 232.06 233.18 267.3 267.30 269 285
Net worth per share (Rsmn) 174.8 266.49 329.1 291.37 271.64 416.24 455.32 536 591 603
Earning per share (Rs) 44.5 67.8 83.78 59.37 55.25 84.66 92.61 98.63 101 109
price earning multiple 9.66 10.32 16.71 59.26 13.3 8.66 10.8 11.25 1242 1425
paid up value per share 100 100 100 100 100 100 100 100 100 100
Cash Dividend 30 50 55 40 20 50 65 70 85 85
Stock Dividend - - 25 - - - - - - -
Provision for tax (Rsmn) 126.6 131.07 165.62 181.99 181.99 199.15 201.76 212.68 234 248
Depreciation (Rsmn) 15.4 25.33 25.01 26.27 26.27 35.04 46.27 48.25 68.92 71.25
Assets block (Rsmn) 189.44 219.59 235.17 235.12 235.12 251.92 338.13 362.25 394 401
Total Assets (Rsmn) 11230.9 12424.69 15314.74 18808.9 17629.25 16562.6 16745.45 17865 17968 18502

Equity Data
Particular 1997/98 1998/99 1999/00 2000/01 2001/02 2002/03 2003/04 2004/05 2005/06 2006/07
Trade share 59.75 20.56 94.61 124.8 113.6 92.61 88.79 97.40 86.87 86.87Market capitalization(Rsmn) 1659.04 2744.59 5499.14 5891.94 3608.81 3608.81 4909.95 7489.4 78.36 81.24
Trade rate amount 22.67 29.44 32.68 1052.68 98.08 212.65 84.7 66.78 77.44 81.24
Turnover ratio 1.93 38.29 1.78 3.68 2.49 1.85 1.62 2.86 2.98 3.36
No of transaltion 1176 1353 1248 1600 1632 878 402 144 2.77 284
Market price per share
High Rs 675 762 1495 2301 1500 875 1005 1515 1414 1226
Low Rs 415 404 700 1310 465 700 705 1000 1124 1222
closing price 430 700 1400 1500 735 735 1000 1505 1675 1725
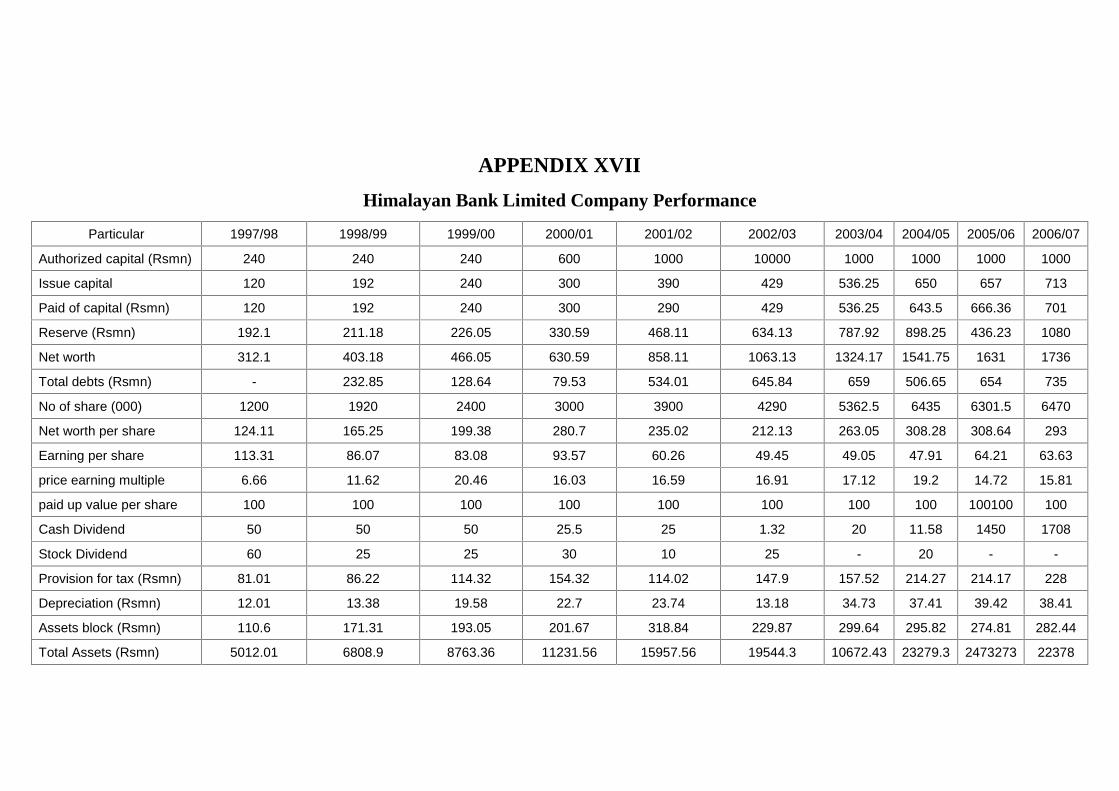
APPENDIX XVII
Himalayan Bank Limited Company Performance
Particular 1997/98 1998/99 1999/00 2000/01 2001/02 2002/03 2003/04 2004/05 2005/06 2006/07
Authorized capital (Rsmn) 240 240 240 600 1000 10000 1000 1000 1000 1000
Issue capital 120 192 240 300 390 429 536.25 650 657 713
Paid of capital (Rsmn) 120 192 240 300 290 429 536.25 643.5 666.36 701
Reserve (Rsmn) 192.1 211.18 226.05 330.59 468.11 634.13 787.92 898.25 436.23 1080
Net worth 312.1 403.18 466.05 630.59 858.11 1063.13 1324.17 1541.75 1631 1736
Total debts (Rsmn) - 232.85 128.64 79.53 534.01 645.84 659 506.65 654 735
No of share (000) 1200 1920 2400 3000 3900 4290 5362.5 6435 6301.5 6470
Net worth per share 124.11 165.25 199.38 280.7 235.02 212.13 263.05 308.28 308.64 293
Earning per share 113.31 86.07 83.08 93.57 60.26 49.45 49.05 47.91 64.21 63.63
price earning multiple 6.66 11.62 20.46 16.03 16.59 16.91 17.12 19.2 14.72 15.81
paid up value per share 100 100 100 100 100 100 100 100 100100 100
Cash Dividend 50 50 50 25.5 25 1.32 20 11.58 1450 1708
Stock Dividend 60 25 25 30 10 25 - 20 - -
Provision for tax (Rsmn) 81.01 86.22 114.32 154.32 114.02 147.9 157.52 214.27 214.17 228
Depreciation (Rsmn) 12.01 13.38 19.58 22.7 23.74 13.18 34.73 37.41 39.42 38.41
Assets block (Rsmn) 110.6 171.31 193.05 201.67 318.84 229.87 299.64 295.82 274.81 282.44
Total Assets (Rsmn) 5012.01 6808.9 8763.36 11231.56 15957.56 19544.3 10672.43 23279.3 2473273 22378

Equity Data
Particular 1997/98 1998/99 1999/00 2000/01 2001/02 2002/03 2003/04 2004/05 2005/06 2006/07
Trade share (000) 17.03 25.36 29.26 37.97 30.87 22.25 178.7 160.4 166.5 168.3
Market capitalization (Rsmn) 906 1200 4080 4500 3000 3586.44 4410 4830 5030 5430
Trade rate amount 14.47 24.47 42.85 75.4 34.5 19.3 152.15 101.62 101.62 104.56
Turnover ratio % 1.32 2.04 1.05 1.68 1.15 0.54 3.45 2.1 2.45 3.01
N0 of transation 384 715 865 941 1020 623 865 1249 1442 1536
Market price per share high 775 1200 1780 1716 1530 950 1010 1181 1184 1156
Low 625 700 1000 1325 610 750 800 855 857 885
Closing price 755 1000 1700 1500 1000 836 840 920 965 1010

APPENDIX XVIII
Investment Bank Limited
Particular 97/98 98/99 99/2000 2000/01 2001/02 2002/03 2003/04 2004/05 2005/06 2006/07
Authorized capital (Rsmn) 270 270 270 270 270 590 590 1000 1000
Issue capital (Rsmn) 135.35 135.35 135.35 169.98 169.98 295.29 295.29 690 705 751
Aid of capital 135.35 135.35 135.35 169.98 169.98 295.29 295.29 258.74 296.78 305
Reserve capital (Rsmn) 232.85 231.85 241.05 299.91 353.43 343.25 435.75 592.13 598 624
Net worth (Rsmn) 368.2 370.36 376.4 469.89 513.42 638.54 729.04 1180.7 1204.60 1326
Total debt 100 50 140 120 98.5 6.83 361.5 350 374 405
No of share 1353.57 1353.51 1353.51 1699.85 1699.85 2953 2953 5905.85 6981 8145
Net worth per share 93.84 45.69 72.66 56.4 57.11 116.82 152.67 232.15 264.14 314.26
Sharing per share 69.33 33.76 53.68 33.16 33.6 39.56 51.7 39.31 59.26 69.23
Price earning mintiple (p.e.) 5.65 24.35 20.1 34.66 22.62 20.1 18.18 20.35 26.40 27.48
Price value per share 100 100 100 100 100 100 100 100 100 100
Cash divident 50 30 25 0 20 15 12.5 38 46
Stock divident 25 30
Provision for tax (Rsmn) 4012 42.57 33.25 37.44 21.01 53.33 78.8 101.53 108.23 114
Depresiation (Rsmn) 6.72 7015 9.32 8.82 8.59 11.87 23.1 32.79 41.26 39.21
Assets block (Rsmn) 28.75 36.22 39.92 33.97 35.88 192.12 219.79 230.59 245 252
Total assets in (Rsmn) 3397.2 3190.26 3967.47 3155.53 4973.89 9014.23 16274 18420 22450
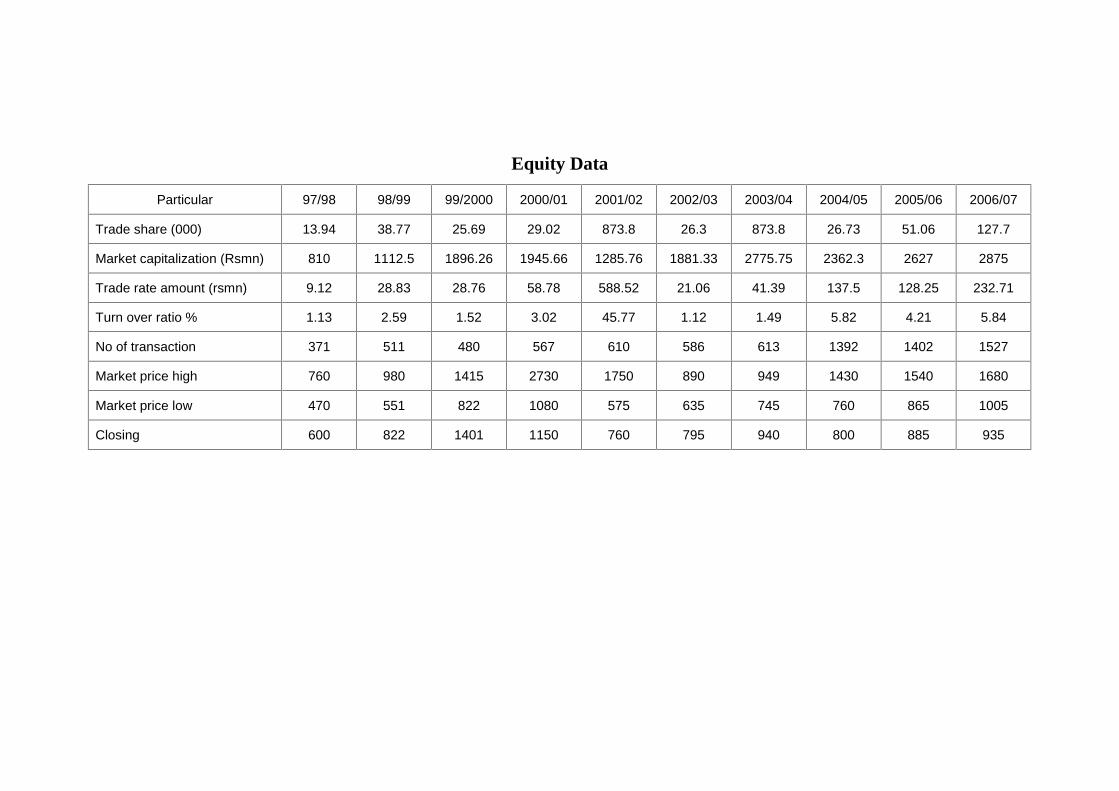
Equity Data
Particular 97/98 98/99 99/2000 2000/01 2001/02 2002/03 2003/04 2004/05 2005/06 2006/07
Trade share (000) 13.94 38.77 25.69 29.02 873.8 26.3 873.8 26.73 51.06 127.7
Market capitalization (Rsmn) 810 1112.5 1896.26 1945.66 1285.76 1881.33 2775.75 2362.3 2627 2875
Trade rate amount (rsmn) 9.12 28.83 28.76 58.78 588.52 21.06 41.39 137.5 128.25 232.71
Turn over ratio % 1.13 2.59 1.52 3.02 45.77 1.12 1.49 5.82 4.21 5.84
No of transaction 371 511 480 567 610 586 613 1392 1402 1527
Market price high 760 980 1415 2730 1750 890 949 1430 1540 1680
Market price low 470 551 822 1080 575 635 745 760 865 1005
Closing 600 822 1401 1150 760 795 940 800 885 935

APPENDIX XIX
Everest Bank Limited Bank Performance
Particular 97/98 98/99 99/2000 2000/01 2001/02 2002/03 2003/04 2004/05 2005/06 2006/07
Authorized capital (Rsmn) 240 240 240 400 400 600 600 600 670 700
Issue capital (Rsmn) 120 120 120 264 264 315 316.8 466.8 513.15 524
Paid up capital 117.56 118.43 118.43 220 259.32 315 315 455 485 510
Reserve (Rsmn) 9.87 26.73 84.42 98.53 131.59 157.82 225.32 314.62 405 485.25
Net worth (Rsmn) 127.43 145.16 20.285 348.53 390.91 472.82 540.32 769.62 745 795
Total debt (Rsmn) 1292.54 2147.98 3215.61 4899.29 6076.26 7439.38 300 - 225
No of share (000) 1200 1200 1200 2208.59 2593.29 3150 3150 4550 5560 6633
Net worth per share 25.63 25.23 41.27 69.79 85.35 94.9 143.57 170.81 171.25 205
Sharing per share 20.86 21.03 34.39 31.56 32.91 29.9 45.58 37.54 36.74 54.65
Price earning muntiple 88.2 19.36 28.5 23.76 13.06 14.88 14.58 23.18 26.27 27.28
Paid up value per share 100 100 100 100 100 100 100 100 100 100
Cash divident 15 20 20 20 15 10
stock divident 20 20
Provision of tax 0.18 13.46 19.51 32.35 42.04 41.71 67.55 81.91 88.91 98.74
Depresiation 2 3.9 7.3 8.91 10.06 19.5 19.74 21.12 24.13 26.17
Assets block 18.6 34.28 49.05 50.36 93.38 109.59 118.37 134.07 143.36 153
Total asset in (Rsmn) 1419.98 2293.14 3417.85 5218.68 6607.17 8052.2 9608.57 11792.1 12273 13391

Equity Data
Particular 97/98 98/99 99/2000 2000/01 2001/02 2002/03 2003/04 2004/05 2005/06 2006/07
Trade share (000) 39.39 53.98 50.98 50.96 69.12 66.51 101.8 163.2 184.20 205
Market capitalization (Rsmn) 88.32 488.4 1176 1080 619.12 1171.29 2142 2740.5 2941 3032
Trade rate amount (Rsmn) 5.9 12.36 36.31 61.75 35.31 29.3 56.11 1232.76 78.35 89.97
Turnover ratio % 4.42 2.53 3.09 5.72 5.7 2.5 262 4.48 5.36 6.73
no of transaction 1255 1082 2157 1679 1906 1496 1742 2126 2425 2628
Market price high 201 440 980 1850 740 490 723 905 143 1721
Market price low 66 184 400 670 325 349 400 625 745 825
Closing price 184 407 980 750 430 445 680 870 950 1090

APPENDIX XX
Market and Commercial Bank Ltd
FiscalYear NEPSE
AggregateAnnual Return or
Capital Market(Rm)
CommercialBank Index
Closing
AggregateAnnual
Return orCommercialBank Index
(Rc)
(Rc - cR )(Rm -
mR )2 (Rc - cR )2
1997/98 163.35 - 218.82 - - -
1998/99 216.35 0.34 219.04 0.84 0.6867 0.0447 0.4716
1999/00 360.70 0.66 392.71 0.81 0.6567 0.2824 0.4313
2000/01 348.43 -0.03 384.04 -0.03 -0.1833 0.0252 0.0336
2001/02 227.54 -0.35 212.68 -0.45 -0.6030 0.2291 0.3640
2002/03 204.86 -0.10 200.67 -0.05 0.2033 0.0523 0.0413
2003/04 222.04 0.084 231.97 0.16 0.0067 0.002 0.0067
2004/05 286.07 0.29 304.64 0.31 0.1567 0.026 0.1567
2005/06 297.04 0.23 354.84 0.16 0.0067 0.0112 0.0067
2006/07 287.50 0.24 392.54 0.10 -0.0533 0.131 0.0028
1.1570 1.38 0.6860 1.5410
mR =9
1.1570
n
Rm =0.1286 =12.86%
cR =9
1.38
n
Rc =0.1533 = 15.33%
Variance of Capital Market =
9
0.6860
n
mRRm1
2
n
i = 0.0762 = 7.62%
Variance of Commercial Bank Index =
9
1.38
n
cRRc1
2
n
i 16.83%
Standard Deviation of Capital Market = %60.270762.0Variance
Standard Deviation of Commercial Bank = %02.411683.0Variance
Coefficient of Variance of Capital Market = 1462.286.12
60.27
Rm
m
Coefficient of Variance of Commercial Bank = 6758.233.15
02.41
cR
c

2
Covariance of NABIL and Commercial Bank Index =n
cRRcjRRjn
i
1
)()(
=9
4703.03820.0 =0.02
Beta of NABIL = 1302.01533.0
02.002.02
c
Covariance of HBL =n
cRRcjRRjn
i
1
)()(= 0257.0
9
4703.04910.0
Beta of HBL = 1674.01533.0
257.00257.02
c
Covariance of NIB =n
cRRcjRRjn
i
1
)()(= 0554.0
9
4703.006.1
Beta of NIB = 3613.01533.0
0554.00554.02
c
Covariance of EBL =n
cRRcjRRjn
i
1
)()(= 023.0
9
4703.04410.0
Beta of EBL = 1503.01533.0
023.0023.02
c

3
APPENDIX – XXI
X1 X2
d2 = x1 – A1
X2 – 0.397
d2 = x2 – A2
X2 – 0.2730d1d2 d1
2 d22
0.5534 0.33 0.1564 0.0570 0.0089 0.0245 0.0032
0.397 0.2730 0 0 0 0 0
0.4090 0.1761 0.0120 0.0969 0.0012 0.0001 0.0094
0.683 0.4822 0.286 0.2090 0.0598 0.0818 0.0437
d1 = 0.4544 d2 = 0.1691 d1d2
=0.675
d12=
0.1064d2
2 =
r12 = 22
22
2
12
1
2121
d.dNd.dN
d.dddN
= 22 1691.0563.044544.01064.04
1691.04544.00675.04
=1966.02191.0
1932.0
=4434.04681.0
1932.0
= 0.9308
PE = 0.6745×n
r 21= 0451.0
4
9308.016745.0
2
6PE = 0.0451× 6 = 0.2706