Questions of Growth, Questions of Development
33
Questions of Growth, Questions of Development Seeraj Mohamed and Simon Roberts The Birchwood Hotel and Conference Centre Johannesburg, South Africa Accelerated and Shared Growth in South Africa: Determinants, Constraints and Opportunities 18 - 20 October 2006 Conference organised with support from the EU
Transcript of Questions of Growth, Questions of Development
Questions of Growth, Questions of Development
Seeraj Mohamed and Simon Roberts
The Birchwood Hotel and Conference CentreJohannesburg, South Africa
Accelerated and Shared Growth in South Africa:Determinants, Constraints and Opportunities
18 - 20 October 2006
Conference organised withsupport from the EU

1
Questions of Growth, Questions of Developm ent
October 2006
Seeraj M ohamed and Simon Roberts Corporate Strategy and Industrial Development research programme
School of Economic and Business Sciences University of the W itwatersrand
1. Introduction
In recent years issues of growth and development have moved up the policy agenda once again, linked in part to the now widespread acknowledgement that GEAR was not in fact a growth strategy (but a strategy to attain particularly a defined macroeconomic stability), and the recognition that the current trajectory of the South African economy would not mean substantial reductions in unemployment and poverty. In this context, the government has development the Accelerated and Shared Growth Initiative for South Africa (ASGISA). ASGISA embodies a set of priorities and interventions to achieve sustained higher rates of growth that is broader based (shared) and will enable government to achieve its targets of halving poverty and unemployment by 2014.
W e contribute to the debates around growth and development by highlighting certain features of the South African economy and its performance which we argue have largely been ignored or downplayed. To do this we assess the economic record in the last fifteen years, in international context and with reference to the macroeconomic policies pursued. W e then assess the structural patterns of economic growth and employment to ascertain the basis on which recent performance has been based. W e argue that only through such an evaluation can one proceed to identifying the key items for the growth and development agenda.
It is now clear that countries which have recorded rapid growth in the past two decades have been notable more for their breach of W ashington Consensus policy prescriptions than for their observance (Rodrik, 2004). Countries in Latin America which, until recently, broadly followed the prescriptions of neo-liberal macroeconomic policy, trade liberalisation and privatisation have been outshone by Asian economies which have followed a diversity of paths. Indeed, ‘[i]t is difficult to identify cases of high growth where unorthodox elements have not played a role’ (Rodrik, 2004).
Our analysis suggests that recent economic performance in South Africa is not as good as it seems at first sight when one considers both the structural patterns of this growth and macroeconomic performance. For example, job creation, such as there has been, has been largely due to essentially dependent parts of services, such as security and cleaning services. M oreover, the performance is fragile as there has been further concentration in South Africa’s traditional industries, entrenching structural weaknesses of the economy, rather than the diversification of capabilities that is required for meaningful shared growth. To understand why this is so we highlight the importance of trends to financialisation, together with the further internationalisation of large corporations. W e then question the record on trade performance and trade liberalisation, before examining the implications of South Africa’s entrenched industrial structure.
2
2. Critical review of South African econom ic perform ance and m acroeconom ic policies
2.1Assessm ent of m acroeconom ic policies and their outcom es
Introduction
A discussion of growth and development requires an assessment of macroeconomic policies and how they have affected development performance. W hat would be the macroeconomic concerns of a developmental state with an agenda to promote industrial and economic development aimed at addressing huge social problems of unemployment, poverty and equality? Ocampo1 (2003) argues that in addition to institutional requirements (efficient state bureaucracy, nondiscretionary legal system and social covenants to secure political stability) specific strategies are required to drive growth and to deal with “old and new forms of vulnerability” (p.92). He says three important elements of this strategy would be, “macroeconomic policies designed to reduce external vulnerability and facilitate productive investment, productive development strategies aimed at guaranteeing a dynamic restructuring of productive structures, and active social policies (ibid.).”
An important lesson from Alice Amsden’s 1989 classic Asia’s Next Giant is that a late-industrializing developmental state has to manage many contradictory requirements of different economic actors involved in a national economy. Her famous comment that the state should “… get prices wrong” provides a solution for a developmental state trying to manage these contradictory developmental requirements (Amsden, 1989, p.11). Therefore, the state has to rely less on the market and develop microeconomic and macroeconomic strategies that support the developmental project and allocates capital towards deepening and diversifying industrial development. For example, even when implementing what may be considered Keynesian-type expansionary macroeconomic policies that promote growth in aggregate demand, the state has to ensure that it does not only reduce interest rates and leave matters to the market. The state has to ensure that its overall economic goals are served by its policy interventions. Reducing interest rates alone is not enough because it could lead to a boom in consumption, imports of consumer goods and speculation in financial and housing markets. W hat is required is a more managed approach to expansionary macroeconomic policies that ensure allocation of capital towards sustainable productive purposes in line with developmental goals. Chang (1997) in a paper for TIPS on South African industrial policy also outlines the importance of developing macroeconomic strategies to support industrial strategy.
Unfortunately, the relations between South African government departments have created a situation where finance and macroeconomic policies takes precedence over and dominate other policies. In addition, it was made clear with the adoption of GEAR that certain economic policies, especially macroeconomic policies, are nonnegotiable. This nonnegotiable aspect of policy is institutionally entrenched in the independence of the South African Reserve Bank and the adoption of inflation targets. The approach to macroeconomic policy adopted by government is clearly in line with the rational expectations hypothesis associated with new classical macroeconomic policy.2 The
1 Jose Antonio Ocampo is currently Under Secretary General at the United Nations heading their Department of Social and Economic Analysis. He was executive secretary of the Economic Commission of Latin America and the Caribbean (ECLAC) and was finance minister for Colombia. 2 Some seminal works in the new classical tradition are Frydman and Phelps (1983), and Lucas (1973).

3
widespread hegemony of neoliberal economics discourse, which draws on new classical macroeconomics, has created general acceptance of the view that agents in markets, especially financial markets, have rational expectations and their response to policies they do not like will be to penalize countries that adopt those policies. As a result, many countries, including South Africa tailor their policies to conform to the W ashington Consensus, which is the gauge used by people working in financial markets and credit ratings agencies to assess macroeconomic policies. These countries also have to prove their credibility by showing that they will not change their policies. As a result, the adoption of inflation targets, the independence of central banks and closing of economic policy discussion space – characteristics of the South African economic policy environment – are widespread in developing and even some developed countries. This approach to macroeconomics policy makes it almost impossible to develop strategies to drive growth and deal with vulnerability, for example external shocks such as increases in the oil price or contagion from financial crises elsewhere.
W ith this inherent weakness in the South Africa’s approach to macroeconomic policy, we assess the effectiveness of macroeconomic policy in South Africa since 1994 in 2 ways:
• First we consider comparisons of growth in GDP per capita and investment (GFCF as a percentage of GDP) between South Africa and aggregates of different income groups of countries.
• Second, we go on to examine the official interpretation of the performance of macroeconomic policy, which in a nutshell, says that South Africa has achieved macroeconomic stability through sacrifice that has now enabled the country to grow.
W e conclude that the adopted macroeconomic policies have not worked and have not supported the development project but increased financial vulnerability and entrenched structural economic weakness.
Comparison of GDP per capita and investment performance
Figure 1 compares 5 year averages of GDP per capita growth from 1974 to 2003 for South Africa, high income countries, middle income countries and lower income countries. W e find that GDP per capita for South Africa and all the income groups examined decline a lot from the 1984-88 period to the 1989-93 period. For middle and lower income countries this sharp decline is largely contributable to the lost decade following the international debt crisis of the 1980s. One of the constraining aspects of the lost decade was the negative levels of net capital flows to most developing countries after the debt crises. Investment and consumption had to be constrained so that countries were able to maintain capital account surpluses. South Africa suffered a similar fate after the 1985 debt crisis.

4
Figure 1
5 year averages of annual percentage GDP per cap grow th
-3
-2
-1
0
1
2
3
4
South Africa HIC M IC LIC
Percentage
1974-78 1979-83 1984-88 1989-93 1994-98 1999-2003
Source: period averages calculated using W DI data
GDP per capita growth improved in all country groups from the period 1994-1998, partly as a result of the return of global capital flows from developed to developing countries. The huge increases in global liquidity in the 1990s and the end of apartheid isolation after the 1994 democratic elections also led to increases in net capital flows to South Africa. However, it is clear from Figure 1 that GDP per capita growth does not improve as much in South Africa as in each of the income groups examined. An examination of investment performance in South Africa and the averages for different country income groups below provides us with insight into the relatively low GDP per capita income growth in South Africa after 1994.
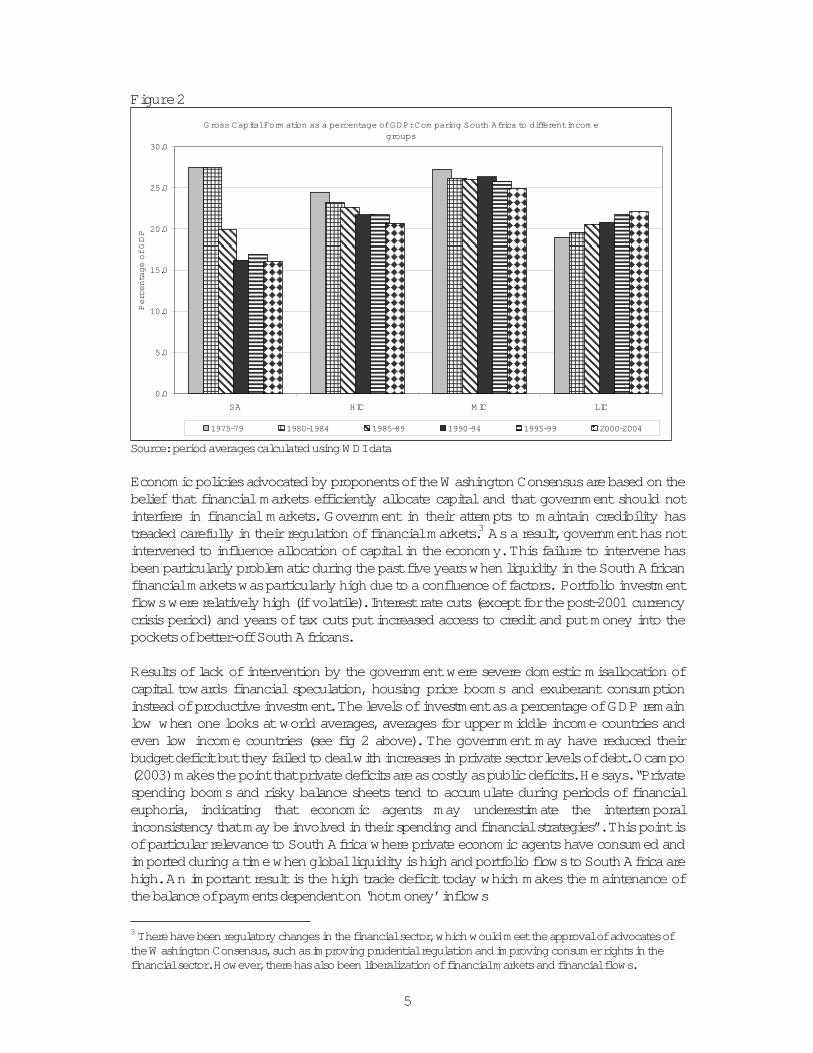
Figure 2 clearly shows that South Africa’s investment performance (GFCF as a percentage of GDP) is much poorer than all of the income groups examined. From 1985 South Africa’s average period GFCF as a percentage of GDP remains below that of all the income groups examined. W hen one also considers the growth in unemployment in South Africa over the past decade it is hard to argue that South Africa has had positive macroeconomic performance. However, government argues that their macroeconomic policies have been successful and have created a foundation on which to increase domestic development.
5
Figure 2
Gross Capital Form ation as a percentage of GDP: Com paring South Africa to different incom e groups
0.0
5.0
10.0
15.0
20.0
25.0
30.0
SA HIC M IC LIC
Percentage of GDP
1975-79 1980-1984 1985-89 1990-94 1995-99 2000-2004
Source: period averages calculated using W DI data
Economic policies advocated by proponents of the W ashington Consensus are based on the belief that financial markets efficiently allocate capital and that government should not interfere in financial markets. Government in their attempts to maintain credibility has treaded carefully in their regulation of financial markets.3 As a result, government has not intervened to influence allocation of capital in the economy. This failure to intervene has been particularly problematic during the past five years when liquidity in the South African financial markets was particularly high due to a confluence of factors. Portfolio investment flows were relatively high (if volatile). Interest rate cuts (except for the post-2001 currency crisis period) and years of tax cuts put increased access to credit and put money into the pockets of better-off South Africans.
Results of lack of intervention by the government were severe domestic misallocation of capital towards financial speculation, housing price booms and exuberant consumption instead of productive investment. The levels of investment as a percentage of GDP remain low when one looks at world averages, averages for upper middle income countries and even low income countries (see fig 2 above). The government may have reduced their budget deficit but they failed to deal with increases in private sector levels of debt. Ocampo (2003) makes the point that private deficits are as costly as public deficits. He says. “Private spending booms and risky balance sheets tend to accumulate during periods of financial euphoria, indicating that economic agents may underestimate the intertemporal inconsistency that may be involved in their spending and financial strategies”. This point is of particular relevance to South Africa where private economic agents have consumed and imported during a time when global liquidity is high and portfolio flows to South Africa are high. An important result is the high trade deficit today which makes the maintenance of the balance of payments dependent on ‘hot money’ inflows
3 There have been regulatory changes in the financial sector, which would meet the approval of advocates of the W ashington Consensus, such as improving prudential regulation and improving consumer rights in the financial sector. However, there has also been liberalization of financial markets and financial flows.
6
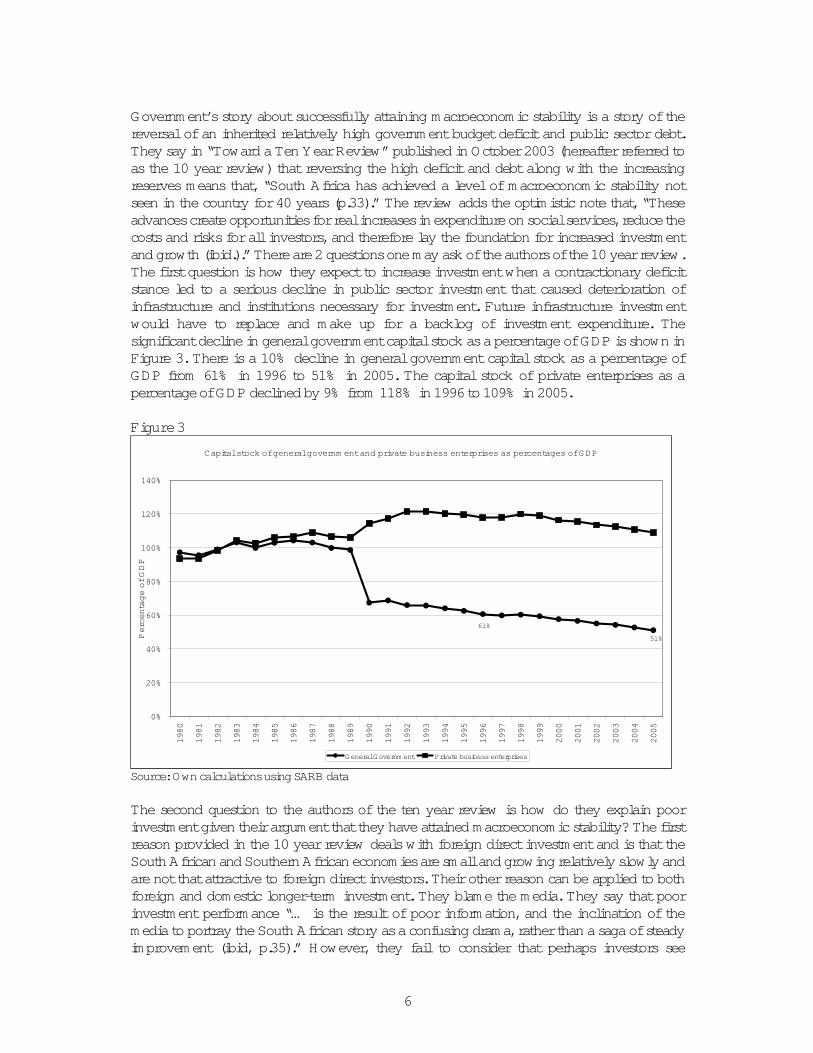
Government’s story about successfully attaining macroeconomic stability is a story of the reversal of an inherited relatively high government budget deficit and public sector debt. They say in “Toward a Ten Year Review” published in October 2003 (hereafter referred to as the 10 year review) that reversing the high deficit and debt along with the increasing reserves means that, “South Africa has achieved a level of macroeconomic stability not seen in the country for 40 years (p.33).” The review adds the optimistic note that, “These advances create opportunities for real increases in expenditure on social services, reduce the costs and risks for all investors, and therefore lay the foundation for increased investment and growth (ibid.).” There are 2 questions one may ask of the authors of the 10 year review. The first question is how they expect to increase investment when a contractionary deficit stance led to a serious decline in public sector investment that caused deterioration of infrastructure and institutions necessary for investment. Future infrastructure investment would have to replace and make up for a backlog of investment expenditure. The significant decline in general government capital stock as a percentage of GDP is shown in Figure 3. There is a 10% decline in general government capital stock as a percentage of GDP from 61% in 1996 to 51% in 2005. The capital stock of private enterprises as a percentage of GDP declined by 9% from 118% in 1996 to 109% in 2005.
Figure 3
Capital stock of general governm ent and private business enterprises as percentages of GDP
61%
51%
0%
20%
40%
60%
80%
100%
120%
140%
1980
1981
1982
1983
1984
1985
1986
1987
1988
1989
1990
1991
1992
1993
1994
1995
1996
1997
1998
1999
2000
2001
2002
2003
2004
2005
Percentage of GDP
G eneral G overnm ent Private business enterprises
Source: Own calculations using SARB data
The second question to the authors of the ten year review is how do they explain poor investment given their argument that they have attained macroeconomic stability? The first reason provided in the 10 year review deals with foreign direct investment and is that the South African and Southern African economies are small and growing relatively slowly and are not that attractive to foreign direct investors. Their other reason can be applied to both foreign and domestic longer-term investment. They blame the media. They say that poor investment performance “… is the result of poor information, and the inclination of the media to portray the South African story as a confusing drama, rather than a saga of steady improvement (ibid, p.35).” However, they fail to consider that perhaps investors see

7
through their political spin and realize that the reduction of government budget deficits and public sector debt and the build up of reserves were not such m ajor achievem ents. Rather than blame the media, government should take responsibility for the impact of the adoption of growth and investment inhibiting macroeconomic policy, which is an important underlying reason for slow economic growth.
Low budget deficits and low inflation do not equal macroeconomic stability
Fiscal discipline
The government’s 10 year review was meant to assess whether government had achieved its objectives during South Africa’s first decade of democracy. The macroeconomic story spun by government is that the macroeconomic situation received from the apartheid government, which drastically increased debt during its last few years in power, was dire. There was a “fiscal crisis”, “currency volatility and low investor confidence”. The 10 year review’s assessment states that government has been extremely successful. It says:
The budget deficit has come down from 9.5% of gross domestic product (GDP) (including the deficits of the Bantustans) in 1993 to fractionally over 1% in 2002/03.Total public-sector debt has fallen from over 60% of GDP in 1994 to barely 50% of GDP in 2002/03. The net open forward position of the Reserve Bank has fallen from $25 billion in 1994 and $22.5 billion in 1998 (the highest level since 1994) to zero in 2003, and foreign reserves have risen from one month’s import cover to two and half month’s import cover (ibid, p. 33).
These purportedly impressive results set out in government’s story are worth examining.
Figure 4
Governm ent revenue, expenditure and the cash flow adjusted deficit as percentages of G DP
-7.2
-5.4
-1
-3.4
-3.9
0
5
10
15
20
25
30
35
1980
1981
1982
1983
1984
1985
1986
1987
1988
1989
1990
1991
1992
1993
1994
1995
1996
1997
1998
1999
2000
2001
2002
2003
2004
2005
Rev. & Exp. as % of GDP
-8
-7
-6
-5
-4
-3
-2
-1
0
Cash flow adjusted deficit as % GDP
National governm ent finance - Cash-flow adjusted - Deficit(-) / surplus(+) (End period)
National governm ent finance: Revenue
National governm ent finance: Expenditure
Source: SARB

8
W e argue that what is presented as a fiscal crisis in the official story was actually a sharpbut m ost likely tem porary increase in the fiscal deficit. The new government seems to have panicked and overreacted. W hile there was a relatively large increase in the government’s budget deficit from 1990 to 1993, much of this increase was related to the extraordinary situation during the period of negotiations between the unbanning of the ANC and other organizations of the liberation movement and the 1994 democratic elections. In Figure 4, one can see that the apartheid government increased expenditure drastically from 1992 to 1993.4 However, a larger reason for the growth in the deficit from 1990 to 1993 was the reduction in government revenue. Business and the media must have realized that these extraordinary expenditures would not continue and that government revenue would not continue to decline but increase through the rest of the 1990s.5 In addition, the average size of the cash flow adjusted fiscal deficit 1980 to 1989, according to SARB data, was 3.2% . The huge increase in the deficit by the apartheid government during the negotiation period could not have been recognized as anything but extraordinary and most likely temporary.
Once the ANC had won the elections and was head of the government of national unity they were warned about macroeconomic instability by domestic and foreign businesses, developed country governments and the IM F and W orld Bank. The ANC was warned against being populist and spending too much too fast on addressing the huge socio-economic problems of the black majority. They were warned that they would risk high levels of inflation because they would have to print money to finance government debt. The memories and misinterpretations of especially the Latin American countries’ ‘lost decade’ following the 1980s international debt crises seem to have scared many policymakers.6 In addition, the experiences of many ANC exiles in Southern African countries, that had high inflation during the 1980s, were still fresh and painful. Therefore, the potential economic problems associated with the budget deficit were exaggerated and the bogey of uncontrolled inflation7 scared the new government into macroeconomic conservatism and closer to policies advocated in the W ashington Consensus. Of course, the policy advice and discussions from business interests, developed country governments and donors and the IM F and W orld Bank also played a role. As a result, the potential problems of the new democratic government to pay their debt were used to promote neo-liberal ideological ends and to ensure slower redistribution of wealth.
4 It is believed that a large share of the increase went to finance “third force” violence, to try to buy support and votes through direct transfers and to increasing expenditure in geographic areas where they believed they could swing votes. They also injected a large amount of cash into the public pension fund. 5 Informal discussions with friends who were business reporters during this period lead me to the conclusion that there was not undue concern about the growth in the deficit at the time. 6 For example, the general belief was that debt was bad instead of assessing the contribution to the debt crises of factors such as large US interest rate increases and limited ability to earn foreign exchange (clearly not a South African problem as a result of mining and mineral exports). 7 The overwhelming concern with inflation is a throwback to new classical macroeconomics where expansionary monetary policy is seen as only inflationary – a perspective clearly at odds with Kaleckian and Keynesian perspectives where expansionary monetary policy is able to lead to permanent increases in output.

9
Figure 5
Source: SARB
At the same time, the government in order to create a business environment that promoted investment steadily reduced company taxes and also reduced taxes on individuals. Of course, the ANC government made important progress in improving collection of taxes and government revenues were not too drastically affected by the tax cuts. As can be seen in Figure 5, government tax revenue shares from individuals and businesses had an upward trend from 1995 to 2000. From 2000 to 2005 there is a negative trend in the share of individual taxes. The share of business taxes jumped from 2000 to 2001 as the individual tax declined and then stayed fairly stable from 2001 to 2005. As a result, the regressive value added tax (VAT) as a share of total revenue trends upwards from 2001 to 2005. Therefore, Figure 4 illustrates that the most regressive tax seems to have been used by government to cover potential revenue gaps due to declining tax collections from individuals and flat company tax revenues for the past five years.
The effects of these fiscal policy choices would have been to constrain spending by the poorest sections of the population but not the middle and upper income earners who enjoyed tax breaks. The differential effects of these policy choices on the type of demand from different income groups on the economy have not been adequately analyzed. One possible outcome is that these policy choices have constrained aggregate demand by the poorest people for nontradables and basic services. At the same time, demand for imported consumption goods, cars and houses and increased speculation in financial markets by middle and higher income earners have increased. One speculates that the tax choices made in the economy has had an effect that reinforces structural weaknesses of the economy and entrenches the reliance on commodity exports. One also speculates that the fiscal choices may help explain the relatively unsustainable consumption-led growth of the past few years.
Government could have chosen to address its concerns about the deficit by maintaining taxes on middle class and wealthy individuals and big businesses at pre-democracy levels.
Com parison of taxes on businesses, individuals and VAT as percentages of Total tax revenue
0
5
10
15
20
25
30
35
40
45
50
1990 1991 1992 1993 1994 1995 1996 1997 1998 1999 2000 2001 2002 2003 2004 2005
Percentage of total revenue: Tax on individuals -Ratios (End period) [4429J;AQ ]
Percentage of total revenue: Tax on com panies - Ratios (End period) [4430J;AQ ]
Percentage of total revenue: Value-added tax - Ratios (End period) [4431J;AQ]

10
The improved collection rates would have amounted to an even larger increase in government revenue from 1994 to 2005. This increase could have meant that government would have been able to increase expenditure while reducing the budget deficit from the high level of 1993. General government capital stock levels would not have declined so drastically. Government argues that they could not have increased spending efficiently because of problems in local governments. However, the reduction in public sector investment as a result of the tight fiscal policies of the GEAR led to a situation where public infrastructure was allowed to deteriorate. Government would not have had to increase public spending as much as it had if there was steady spending to slowly increase and maintain infrastructure.8
Exchange rate volatility
In their discussion of macroeconomic stabilization success in the 10 year review, the authors chose to ignore exchange rate volatility. Instead, they chose to mention the reduction of the net open forward position and the increase of foreign reserves. These developments are meant to convince their audience that they have improved financial stability and reduced vulnerability to contagion in financial markets. At the same time, they neglect to mention that policies of slow deregulation of exchange controls and financial markets means that South Africa has to live with exchange rate volatility and increased financial vulnerability.
The approach to international finance policies adopted by government causes uncertainty that may be stifling long-term productive investments and be promoting more speculation in financial markets. This approach means that government is trapped into a situation where exchange rates are highly volatile and where they are unable to intervene when the currency is overvalued. Exchange rates have been allowed to appreciate to the point where industry suffers, jobs are lost and export relationships are destroyed. Further, the strong currency is directly a cause of rising imports, including rapid growth in imports of consumption goods, which has led to large unsustainable growth in the current account deficit. High exchange rate volatility is a deterrent to long-term investment.
Unfortunately, the policy framework that government has adopted seems to have accepted the neo-liberal interpretation of financial and currency crises. W ithin this perspective, financial crises are caused by poor economic fundamentals and cronyism.9 The heterodox perspective that financial crises are the result of financial instability and vulnerability caused by financial liberalization is ignored.10 Increased integration of domestic capital markets with global markets through easier convertibility of the currency and capital inflows increases instability and volatility.11 The effects of financial liberalization on the economy and sudden huge surges and subsequent equally quick outflows of short-term
8 Also, it is hard to imagine that there were not investments in new infrastructure which the center could have been implemented despite local or provincial government inability to deliver. 9 The irony of government’s approach, which is the approach fostered by the IM F, is that there is agreement on all sides of the economic debate that fundamentals based models cannot explain international economic developments and are unable to explain or predict exchange rate movements. The new emphasis in research is to study institutions and behaviour (psychology) in financial markets (for a good discussion of international economic models and exchange rates see Blecker, 1999). 10 See M ohamed (2003) for a review of literature on different interpretations of financial crisis. 11 Considering the effects of liberalization on the South African economy – Farrel (2001) shows that there was more currency stability during the period when South Africa had a dual currency and M ohamed (2003) shows a link between surges and subsequent outflows of capital during the post-apartheid period and the 2001 currency crisis.
11
foreign capital are ignored by the South African government. The uncomfortable fact that countries with strong macroeconomic fundamentals, e.g. South Korea during the 1990s Asian crises, are also susceptible to contagion is not considered. The 10 year review also does not mention that the huge inflows of foreign capital while potentially disruptive to the economy are not associated with increased productive investment. In fact, the surges in short-term capital flows since the end of apartheid have led to appreciation of the rand relative to the US dollar and a number of the currencies of our main trading partners. As a result, the relative domestic input costs into production have increased and the price competitiveness of South African exports has declined. The short period after the rand’s huge depreciation in 2001 led to a surge in exports as a result of the increased price competitiveness of South African exports. M ohamed (2003) argues that the surge in hot money during the post-apartheid period is not associated with increased investment but is associated with higher levels of consumption, including imports of consumer goods, more speculation on the JSE, and more capital flight from South Africa. Therefore, capital controls to slow down the inflows and outflows of short-term foreign capital would not hurt investment but would reduce South Africa’s vulnerability to financial crises and contagion. The high costs of holding huge levels of foreign reserves would also be avoided. Further, the SARB states that it will not intervene in currency markets to stabilize the rand or to defend its value when there is a speculative attack in currency markets. Therefore, the large reserve does not necessarily prevent volatility and currency crises, especially in cases of contagion. Of course, even by mainstream economists’ standards the SARB has not adequately increased foreign exchange reserves enough to avoid vulnerability to currency crises.
Conclusion
Government’s economic policies in general and macroeconomic and industrial policies specifically are inadequately coordinated. Therefore, macroeconomic and industrial policies are incapable of adequately contributing towards a structural solution for tackling poverty, supporting the creation of adequate formal sector employment and significantly reducing inequality. W e argue that this important shortcoming in economic policy is due to the South African government’s approach to macroeconomic policy, which is steeped in neo-liberal economic discourse.
The acceptance of hegemonic neo-liberal macroeconomic perspectives led government’s economic policy makers to incorrect policy choices:
• Neo-liberal macroeconomic policies constrained employment and investment
Government chose to fight inflation and reduce the government’s budget deficit at a time when the economy required government stimulation to sustain already low levels of employment of people and capital formation.
• Financial liberalization caused financial volatility and vulnerability
Government chose to liberalize global capital flows and rejected the use of capital management techniques to deal with contagion and volatile global capital flows. Their current approach is to maintain credibility with people working in global financial markets by appearing to have strong economic fundamentals and building up foreign exchange reserves is immensely costly for the economy;

12
• Lack of state intervention allowed market-driven misallocation of capital
They chose to believe that financial markets would efficiently allocate capital and did not intervene during the past decade when liquidity in the South African financial markets were high due to portfolio investment flows, interest rate cuts and years of tax cuts. The result was severe domestic misallocation of capital towards financial speculation, housing price booms and exuberant consumption instead of productive investment.
• Inflation targets were chosen above uncompetitive exchange rate
They chose price stability above exchange rate stability and above employment creation. They allowed volatility of the rand. W hen ‘hot money’ inflows increased they allowed the rand to strengthen to the point where industry and employment was negatively affected.
The unstrategic and uncoordinated approach to macroeconomic policy with regard to the development project facing South Africa has huge implications for the economy. One important implication is that macroeconomic policy inhibits rather than supports necessary economic restructuring away from the center of gravity of the mining and minerals processing core of the economy. Instead, growth restraining macroeconomic policies, which increase our vulnerability to contagion and other vulnerabilities, seems to drive capital towards financial speculation and other unproductive uses that bloats the financial sectors and makes us more dependent on the mining and minerals processing base of the economy.
2.2 Brief descriptive review of sectoral perform ance and industrial diversification
Introduction
M uch has been made by the South African government of the sustained higher growth rates of GDP since 1999, although when compared against the growth performance internationally, portrayed above, South African performance is poor. In addition, employment performance has also been very weak, especially when measured against the increases in the labour force. W e disaggregate the changes in GDP and employment to better understand the sectoral patterns.
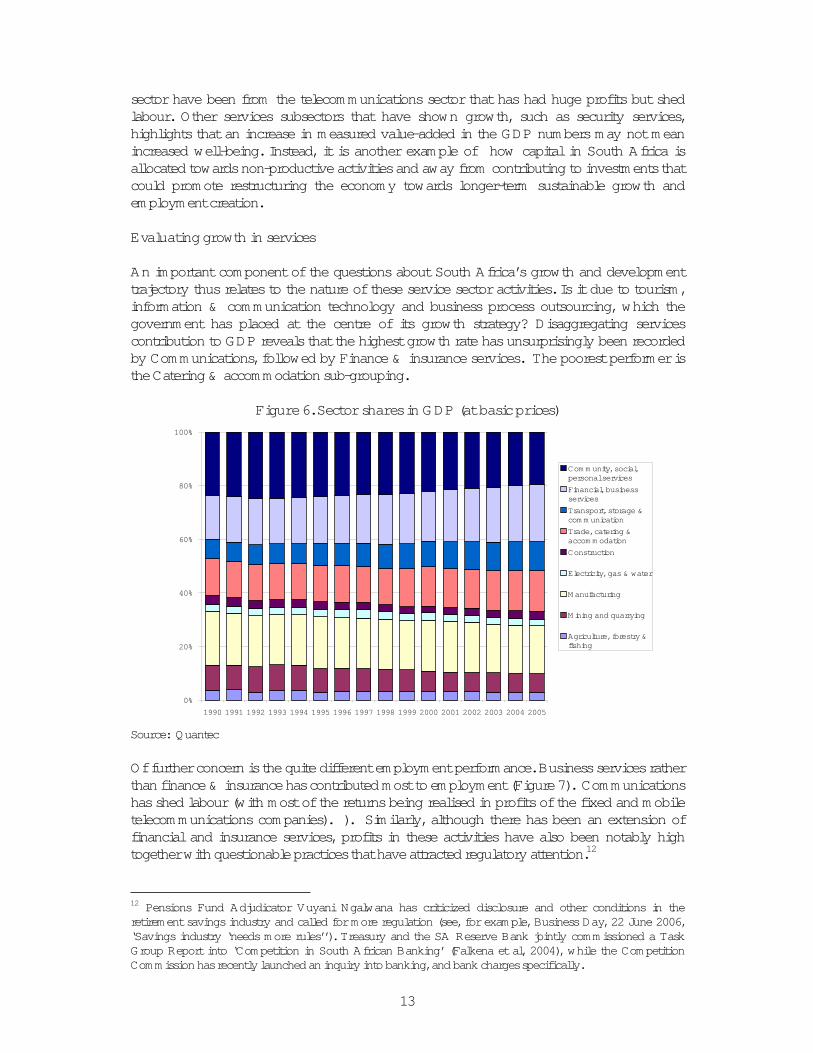
The major contributor to growth has been services. The shares of finance & business services, trade, catering & accommodation, and transport, storage & communication services have all increased over the past fifteen years (Figure 6). This has been interpreted by some commentators in a positive light – as a sign of the maturing of the South African economy and its move to a post industrial development phase. It is also noted that services tend to be more labour absorbing and thus provide a better answer to the high levels of unemployment than an industry oriented development path. Our research shows that that increased jobs have been in extremely low wage activities such as security and cleaning services, meaning average remuneration has fallen as employment has increased. In addition, some of these jobs are a result of the change in classification as such activities are outsourced by, for example, manufacturing firms to independent businesses and are now classified under services. Further, much of the increases in value-added of the services
13
sector have been from the telecommunications sector that has had huge profits but shed labour. Other services subsectors that have shown growth, such as security services, highlights that an increase in measured value-added in the GDP numbers may not mean increased well-being. Instead, it is another example of how capital in South Africa is allocated towards non-productive activities and away from contributing to investments that could promote restructuring the economy towards longer-term sustainable growth and employment creation.
Evaluating growth in services
An important component of the questions about South Africa’s growth and development trajectory thus relates to the nature of these service sector activities. Is it due to tourism, information & communication technology and business process outsourcing, which the government has placed at the centre of its growth strategy? Disaggregating services contribution to GDP reveals that the highest growth rate has unsurprisingly been recorded by Communications, followed by Finance & insurance services. The poorest performer is the Catering & accommodation sub-grouping.
Figure 6. Sector shares in GDP (at basic prices)
0%
20%
40%
60%
80%
100%
1990 1991 1992 1993 1994 1995 1996 1997 1998 1999 2000 2001 2002 2003 2004 2005
Com m unity, social,personal services
Financial, businessservices
Transport, storage &com m unication
Trade, catering &accom m odation
Construction
Electricity, gas & water
M anufacturing
M ining and quarrying
Agriculture, forestry &fishing
Source: Quantec
Of further concern is the quite different employment performance. Business services rather than finance & insurance has contributed most to employment (Figure 7). Communications has shed labour (with most of the returns being realised in profits of the fixed and mobile telecommunications companies). ). Similarly, although there has been an extension of financial and insurance services, profits in these activities have also been notably high together with questionable practices that have attracted regulatory attention.12
12 Pensions Fund Adjudicator Vuyani Ngalwana has criticized disclosure and other conditions in the retirement savings industry and called for more regulation (see, for example, Business Day, 22 June 2006, ‘Savings industry ‘needs more rules’’). Treasury and the SA Reserve Bank jointly commissioned a Task Group Report into ‘Competition in South African Banking’ (Falkena et al, 2004), while the Competition Commission has recently launched an inquiry into banking, and bank charges specifically.

14
Figure 7. Em ploym ent in services
0
200000
400000
600000
800000
1000000
1200000
1400000
1600000
1990 1991 1992 1993 1994 1995 1996 1997 1998 1999 2000 2001 2002 2003 2004 2005
W holesale & retail trade
Catering & accom m odation
Transport & storage
Com m unication
Finance & insurance
Business services
Source: Quantec Note: As this is formal employment, the transport jobs are likely dominated by Transnet, travel agencies and airlines.
The Business Services grouping covers a very wide and diverse range of activities, from security and cleaning to legal and accounting services. Therefore, it is important to consider average remuneration across the sectors (Figure 8). Over the past decade, the average remuneration per employee in Business Services was just R21 194 per annum (in constant 2000 Rands). In Catering & Accommodation it was even lower at R16 682. W hile there may be issues with the data such as the inclusion of part-time workers, the difference with other sectors is striking. Taken together with the employment growth, it suggests that the increased jobs have been in extremely low wage activities such as security and cleaning services, meaning average remuneration has fallen as employment has increased. In addition, some of these jobs are a result of the change in classification as such activities are outsourced by, for example, manufacturing firms to independent businesses and are now classified under services. The main conclusion is that the employment created in services are either not in fact additional jobs, or are very low wage (and largely insecure) jobs in areas such as security services. The growth in employment in security services appears particularly rapid with the number of active security guards registered with industry regulatory body having increased from 115 331 in 1997 to 288 686 in 2005 (Dawood, 2006).

15
Figure 8. Average annual rem uneration in services
0
50000
100000
150000
200000
250000
1990 1991 1992 1993 1994 1995 1996 1997 1998 1999 2000 2001 2002 2003 2004 2005
Rand, constant 2000 prices
W holesale & retail trade
Catering & accom m odation
Transport & storage
Com m unication
Finance & insurance
Business services
Source: Quantec Note: the increase in average wages in Communications in 1997-1998 is consistent with large retrenchments
by Telkom in this year, following privatisation
The issue of security services also highlights that an increase in measured value-added in the GDP numbers may not mean increased well-being. Indeed, it can reflect the reverse. This is the case with higher levels of pollution which mean spending on clean-up and greater use of health facilities, both of which count as positive contributions to GDP. As the remuneration of already high income earners increases still further (especially in the non-traded sectors such as communications) more is spent on security services to protect their wealth. South Africa’s services growth path certainly appears to exhibit such signs.
Continued lack of diversity within the secondary and primary sectors
A second aspect we highlight is the continued lack of diversification within the primary and secondary sectors. Notwithstanding the high levels of construction activity, driven by increased middle class incomes, South Africa’s income continues to be generated at its base from a narrow range of heavy industries with strong links to minerals processing. The starkest sign of this is from export earnings (Figure 9). Following the increased reliance on basic metals export earnings in the mid 1990s, due to major projects such as Saldanha Steel, Columbus Stainless Steel and Alusaf, the South African economy has failed to diversity away from these energy and resource-intensive products with the exception of the growth of the auto industry.

16
Figure 9. Breakdown of South Africa’s m erchandise exports
0%
20%
40%
60%
80%
100%
1990 1991 1992 1993 1994 1995 1996 1997 1998 1999 2000 2001 2002 2003 2004 2005
per cent share
M inerals Basic m etals Basic chem icals & refinery products Pulp & paper M otor vehicles & parts O ther goods exports
Source: Quantec
Against findings as to the importance of diversification for sustained and broad-based growth (Imbs and W acziarg, 2003) these patterns are worrying. W hen we examine manufacturing value-added we find that concentration levels have been maintained from 1999 to 2005, and indeed have even increased slightly.13 The implication of this lack of diversification in the South African economy are explored further in section 3.3.
13 M easured by the Hirschman-Herfindahl index, the sum of the squares of the sub-sector shares, at the level of the 28 main manufacturing sub-sectors using value added measured in constant Rands. The HHI increased from 530 in 1999 to 553 in 2005.

17
3. Key considerations for growth and developm ent
3.1 South African corporate structure and global financialization during the post-apartheid period
The change in government as a result of the first democratic elections in 1994 was accompanied by massive restructuring of the South African corporate sector. Undoubtedly, the transition to democracy and the changed power relations between the powerful white controlled corporate sector and the new government elected by the black majority is an important reason for the corporate restructuring. This restructuring was shaped by changes in the global economy, especially the global financial system during the era after the collapse of the Bretton-W oods arrangements.
W hile being part of a heinous system of racial oppression and ruthless exploitation of black workers, South African capital has always been highly integrated with international capital and seems to have been influenced by or followed the major changes and trends in international capital. Changes in the international environment during the 1980s and 1990s led to changes in corporate structure in South Africa because these global changes had an enormous effect on how capital was accumulated and allocated at a global and national level.
M any heterodox economists argue that the “Golden Age” of capitalism, where the real sector was supported by the financial sector, was replaced by a neoliberal system where finance dominates the real sector. M any economists argue that an important element of this change is financialization. Financialization refers to huge growth of the role and contribution of the financial sector in the economy and significant growth in the share of income of non-financial firms from financial assets. In a nutshell, the effect of financialization has been to increase financial speculative activities, impede economic growth and has led to a more unequal distribution of resources (see Dumenil and Levy, 2001, and Krippner, 2002, for a more comprehensive definition and analysis of financialization).
Two important changes occurred in the global economy during the 1990s. The first was the rise to prominence of institutional investors and the shareholder value movement.14 The growth to prominence of institutional investors was part of the process of financialization that started in the 1970s. Crotty (2002, 2003) says that the rise of institutional investors in the US led to a situation where on average US stocks are held for just one year. In addition, an increasing share of industrial company revenues is from financial not productive assets. The second change was the surge in merger and acquisition activity from the 1990s. There are a number of reasons for this global restructuring that concentrated global businesses and caused them to focus on core businesses. The prominence of institutional investors and the shareholder value movement was central to this restructuring because they demanded simpler structures.15 M uch of the funds for the new global giants were sourced from institutional investors, who invest most of their funds into big companies that have familiar
14 The growth in importance of the business media and their influence over business is also significant. 15 One important reason for the growth in influence of institutional investors and the shareholder value movement is that large non-financial corporations (NFC) have become much more dependent on financial markets to finance expansion (since the 1990s largely through M & As) and also recently share buybacks and investment in financial assets to maintain high levels of profit and the impression of increased earnings per share. During the period after W W II up to 1980 a much larger share of NFC finance was reinvestment of profits.

18
brands, large market share, high R&D spending and focus on their core activities. Both these changes to the global economy had profound impacts on the structure of the South African corporate sector. Since 1994 the South African corporate sector has engaged in the following activities:
• conglomerate unbundling and restructuring; • consolidation within sectors by conglomerates as part of ensuring stronger focus and
better strategic direction, which has also increased concentration; • internationalization, mostly outward, by firms which moved their primary listing
overseas, and foreign acquisitions by South African listed firms; and • black economic empowerment deals, first, through special purpose vehicles for
financing and second, more recently, in areas where government policy has provided a specific impetus.
Nolan (2003) points out that total global mergers activity grew from over US$150 billion in 1992 to over US$2000 billion in 1998, when 8 of the world’s 10 largest mergers took place. By 1999 it was over $3300 billion. Large South African companies were caught up in this process of restructuring. The offshore listing of major South African corporations from 1997 can be seen within the context of this merger frenzy. The result was a spectacular growth in M &A activity in South Africa. According to Ernst and Young data there was an increase from 136 M &A deals in 1994 to a peak of 605 in 1998. There was an average of 530 M &As from 1999 to 2002.
M ost of the corporate pyramid structures in South Africa, which were at the center of the ‘minerals and energy complex’ (M EC) as a system of accumulation and were used by the powerful families to control most of the South African economy, were restructured and disentagled. This restructuring should be seen within the context of global markets being restructured where global market share was reapportioned to the newly merged global giants. The wealthy and powerful in South Africa did not want to be left out of this process. They wanted to ensure not only that they got their share of the international market in minerals by internationalizing their operations but also to consolidate and secure the viability of their South African assets.
At the same time, South Africa was undergoing a transition from apartheid to democracy and there was contestation about the future economic policy of the country. The changes in South Africa meant that many of the wealthy and the large corporations wanted to move their assets out of reach of the new government. The restructuring of global assets and the transition to democracy provides important reasons for the move by a number of large corporations to move their primary listings. Also capital flight had continued to be high throughout the 1990s, indicating that wealthy South Africans wanted to increase their wealth offshore.16 A company that moved its primary listing offshore would be able to move a large amount of capital out of South Africa legally because they would not be bound by exchange control restrictions on residents. Large amounts of capital could leave the country in the form of dividends or other payments
An important consequence of the restructuring of the economy due to the political changes in the 1990s and global business restructuring is that the South African economy has become more concentrated. The fact that large South African corporations have become
16 M ohamed and Finnoff (2005) show that misinvoicing of trade made up a significant share of capital flight indicating that it was probably big businesses with large export and import volumes involved in misinvoicing of trade.
19
internationlized through mergers and acquisition, largely to ensure more focus on core business, means that this concentration has been especially in the existing commodities base of the economy. In other words, the restructuring from the 1990s has made the economy more concentrated and more dependent on the M EC.
3.2 Trade liberalisation and export-led growth? – the role of trade in econom ic developm ent
Trade has played a very important role in South Africa’s policies for growth. The GEAR strategy sought to pursue an export-oriented strategy, while successive trade and industrial policies have highlighted the need to support exports and international competitiveness.17
M oreover, trade liberalisation has formed an important part of industrial policy, partly by design and partly by default (see, Roberts, 2005).
It is worth remembering that the gains from trade – of specialisation and exchange – depend on the products in which that specialisation takes place and the terms of the exchange. Only under extreme assumptions of perfect competition and freely available technology can we ignore these considerations and translate it into a simplistic prescription for trade liberalisation.18 Despite a vast number of studies, the relationship between trade liberalisation and economic performance remains highly contested (Rodrik, 2004; Roberts, 2000; Akyuz 2006; Shafaeddin, 2006), while the significant role that state intervention has played in rapid industrialisation has been widely noted (see, for example, Amsden, 1989 and 2001; Rodrik, 2004).
The relationship between trade and growth depends on the changing basket of exported and imported products, and what underlies this. In other words, it is necessary to understand the basis of a country’s competitive capabilities and how they evolve over time. In this context, it is quite easy to understand how protection may be an important component in an incentive structure encouraging the development of capabilities, to create ‘dynamic comparative advantage’ (Amsden, 1989).
The South African experience is entirely consistent with such an approach. Since the late 1980s South African has undergone a far reaching programme of trade liberalisation. The South African trade policy reform involved a move towards neutrality through a mix of rationalisation and liberalisation. In addition to lowering the average tariff level by approximately one third over five years from 1994, the National Party programme of removing quantitative restrictions and surcharges in the early 1990s was continued after 1994.19 The highly differentiated tariff structure was also largely standardised. Edwards (2005a) estimates that average nominal protection in manufacturing fell from 22.9 per cent in 1994 to 8.2 per cent in 2004, while effective protection in manufacturing fell significantly, from 48 per cent to 12.7 per cent.20
17 See, for example, the DTI’s Integrated M anufacturing Strategy (DTI, 2002). 18 All the evidence on the importance of technology and the prevalence of imperfect competition has not prevented some from making such a simplistic translation (such as Edwards, 2005). 19 For example, the reduction of import surcharges from 1990 implied significant liberalisation, especially in view of the differential rates being charged. 20 This corrects a very misleading picture portrayed by Fedderke and Vaze (2001) who argued that protection had not been reduced. This was based on collection rates which clearly excludes the liberalisation of quantitative restrictions and the effect of lowering such high tariffs that there were no imports (and hence no revenue collected).

20
There has also been a debate around the effects of trade liberalization on employment and wages. Research by both Fedderke and Edwards has blamed unemployment on technology and rigidities in unskilled and semi-skilled wages.21 Fedderke et al. (2001) use a model based on assumptions of efficient markets and perfect competition and find that trade has led to higher returns to both labour and capital, while technology has induced lower wages. Given this, the main reason for high unemployment is suggested to be excessive wages (above what they would see as the ‘market clearing’ wage rate). This implies that they believe labour market outcomes are not unequal enough and that low paid workers should be earning even less despite the wages of a large proportion being too little to meet basic housing, transport and nutrition requirements for an average family.22
There are several key assumptions in their study related to technology. Firstly, they assume that technology is an international ‘public good’, in other words that South Africa is able to freely adopt any technology it wishes. This they believe is a plausible assumption due to the large stock of know-how in South Africa and the inflow of skilled people after apartheid (without any real justification for these judgments). Secondly, they assume a pass through of technology to value-added prices (in order to meet the assumption of zero profit which flows from their assumption of perfect competition). The assumption is necessary to be able to separate the technology from the liberalisation effects. This is crucial for their findings that trade has ‘mandated’ increased earnings to both capital and labour while it is technology which has ‘mandated’ negative earnings for both factors. As the assumption means that any application of new technology will increase output from a given set of inputs and factor use and, by their assumption, lower product prices, it is impossible for technology to have any effect other than to lower prices of factors. Indeed, this is the only possible outcome of productivity improvements. On the other hand, this leaves the remaining effects as trade-induced, such that trade has the effect of increasing factor earnings.23
Edwards (2001) decomposes occupational employment effects into final demand, exports, import substitution and technology effects, using an input-output methodology. W hile he finds the effect of imports and exports on overall employment largely cancels itself out, the importance of technological change is highlighted as one of the main reasons for employment loss. As in other studies, technology is used as a ‘catch-all’ term for increased productivity. There are a number of issues with such an interpretation:
• W hile improved productivity means less labour to produce a given output, this is a partial analysis. A more productive and growing economy is a positive feature. The better production capabilities should lead to increased employment unless there are other major rigidities, such as weak local demand and overly constrictive macroeconomic policy.
21 See also M achaka et al. (2003) for a critical review of this research. 22 In 2004, 39 per cent of South African workers earned less than R1000 per month and 65 per cent earned less than R2500 per month (Valodia et al., 2006). However, these are almost entirely African and Coloured workers, whom account for 97.9 per cent of those earning under R1000 and 95.2 per cent of those earnings under R2500. The proportion of African and Coloured workers in these low wage categories has also increased since 2000, when 92.5 per cent of those earning under R2500 per month were of these race groups. Viewed another way, 74.4 per cent of African workers earn less than R2500 per month, compared with just 11.9 per cent of white workers. 23 The Stolper-Samuelson theorem proposes that the factor earnings of the scarce factor would fall with international trade as goods intensive in this factor are imported, while factor earnings of the abundant factor increase as goods intensive in this factor are exported.

21
• Productivity would be expected to improve over time. Blaming it for employment loss is really to acknowledge the failure to understand the real issues such as related to weak domestic demand, macroeconomic policy, the structure of production etc.
• Trade liberalisation means factors of production would be expected to shift between different sectors, from ones where there is a comparative disadvantage to ones where there is an advantage. Unemployment can result if factors of production are not perfectly mobile – in other words if it is not easy for a footwear worker to retrain to become a plastics machine operator then a decline in the footwear industry will leave people without a job. Technology effects are part of these changes, in so far as there are different levels of productivity in the different sectors.
• Technology application in manufacturing may reflect the previous pattern of investment. In the South African case, to the extent that trade liberalisation enhances the returns to resource-based and heavy industries in which there is a comparative advantage due to previous government support, this will imply higher labour productivity as these sectors are generally capital-intensive. This ‘technology’ effect is really a path dependency. The path the South African economy is on influences the outcomes of increased international integration.
• There is evidence that, aside from the very capital-intensive resource-based sectors, investment in new capital equipment and in training by firms are associated with higher growth in output and employment (M achaka and Roberts, 2006). At issue is whether the economic environment favours the development of competitive capabilities in broad-based manufacturing with the potential to absorb labour as part of an overall expansion path.
• To properly understand technology suggests relaxing the assumption that technologies are freely available to all and instead to understand technology as an area with severe market imperfections. This means that technologies tend to be bound up with the strategies of companies and previous decisions. For example, in the auto industry the ability to produce requires access to technologies and capabilities. This means attracting one of the big multinationals to locate production sites, or a commitment to developing a local auto firm requiring long-term protection and support if it is to succeed, as demonstrated by the Korean experience.
• Technological capabilities reflect past demand patterns. For example, South Africa’s capabilities in basic chemicals are integrally related to the apartheid regime’s support for the oil from coal processes of Sasol which led to a whole range of spin-off technological capabilities. Similarly, the capabilities in machinery and equipment are related to the need to supply the mining industry and particular areas in which South Africa has been a world leader, such as deep-mining.
Instead of using technology as an explanation for everything which is not understood, taking it seriously therefore requires sector and firm level analyses. The role of government is crucial to the development of local technological capabilities. M arket failures mean that private firms will always under-invest in research and development. It is thus a key area for government support. The question is whether the choice of focus areas is in line with the desired growth path.
Even Edwards (2005b) has finally come to accept that trade liberalisation has ‘mandated’ a sharp decline in the relative returns of labour, of between 26 and 29 per cent from 1994 to 2003. W hen examining semi and unskilled workers it is found that tariff liberalization negatively affected the demand for these workers the most (mandating a decline wages of 47 per cent in semi and unskilled manufacturing jobs) (Edwards, 2005b: 24). By

22
comparison liberalization was found to benefit capital and skilled workers. High levels of unemployment is still blamed on real wage rigidity in the face of declining ‘labour demand due to skill-biased technological change and trade liberalisation’ (Edwards, 2005b: 25). A decomposition analysis finds that overall trade has had a positive contribution to employment from 1994 to 2002, as employment creation in high skilled jobs has outweighed trade related job loss in low skilled jobs. However, again this is because the real culprit for employment loss is ‘technology’ (Edwards, 2005b: 15). Apparently the also very strong increase in capital is also partly responsible for labour-shedding. Given South Africa’s continued extremely low investment rates, this appears difficult to sustain, as it is an adjustment from a very low base.
The point is surely to understand the real basis for South Africa’s export performance (and to recognize that natural resource exports will inevitably mean labour-intensive imports given a current account deficit). As described above, the sectors in which South Africa has large exports (and a significant trade surplus) are those linked to minerals and natural resources. Bell et al. (2002) find that South Africa’s natural resource endowment largely accounts for the sectoral mix of its trade specialisation and that this, and the variation in real exchange rates resulting from dependence on natural resources, have inhibited more broad-based export-oriented manufacturing. Exports of downstream products such as metal products did follow the exchange rate depreciation brought about by collapse of the natural resource boom in the mid-1980s, however, the resource orientation remains. Nordås (1996) also finds that the natural resource base of much of manufacturing has heavily influenced trade flows.
The implications of a third factor of production (resources) for employment depend also on the complementarities with other factors. If resources (including energy, which is very cheap in South Africa) are complementary to capital (and also possibly skilled labour) then this explains the apparent paradox of liberalisation favouring capital and skill intensive manufacturing. Instead of reflecting the abundance in South Africa of these factors, the trade flows reflect South Africa’s comparative advantage in resources and energy.
The implication is that it is in a sense correct that the employment losses are not due to trade, but underlying factors such as the resource-base. But, this is to ignore the fact that having an exchange rate which reflects the minerals endowment in South Africa inhibits the competitiveness of other sectors.
The ongoing importance of South Africa’s industrial structure is examined in more detail in the following section.
23
3.3 South Africa’s entrenched industrial structure and the m inerals-energy com plex
In the specific case of South Africa, the typical analysis in the early 1990s highlighted the declining share of mining, and the increased share of manufacturing.24 But, many processes classified under manufacturing are very closely related to mineral extraction and cheap energy. Based on input-output linkages of manufacturing sub-sectors with minerals extraction and energy (itself based almost entirely on locally mined coal), Fine and Rustomjee identified the M inerals Energy Complex (M EC) in South Africa as composed of certain manufacturing sub-sectors, mining and electricity generation.25 In addition to the reliance on coal for electricity generation, it is important to note that more than 40 per cent of electricity in the early 1990s was consumed in mining, smelting and refining.
Using this approach Fine and Rustomjee found that, while the share of mining in total production has been declining, its significance when the industries which are closely linked to it are taken into account, has not. For example, while the share of manufacturing in GDP had been increasing, to a peak of 26 per cent of GDP in 1989, if the sectors of manufacturing closely related to mining and energy are omitted, then the non-M EC manufacturing share of GDP remained below its 1980 level of 18 per cent.
Fine and Rustomjee’s M EC has been critiqued in terms of the statistical evidence on the M EC sectors and the development of these sectors relative to more diversified manufacturing, meaning that they overstated the M EC’s importance and performance (Bell and Farrell, 1997; Bell, 1998). The M EC also did not address international dimensions nor did it explore the importance of linkages in the development of production capabilities in different industries (see Roberts, 2000). These critiques are not fundamental if the M EC is taken to be an evolving system of relationships and interests. For example, Bell and Farrell do not dispute the importance of the mining based conglomerates in the development of much of manufacturing. And, Fine and Rustomjee explicitly acknowledge the need to extend the analysis to address international relationships.
As illustrated above, despite trade liberalisation and sharply higher real interest rates, the main feature of developments in the 1990s is the continued better performance of capital and resource-intensive industries. Liberalisation of both trade and capital flows cannot change this, and indeed has tended to reinforce the pattern as the currency tends to overvaluation and volatility. For manufacturers producing traded goods the volatility means it is very difficult to predict earnings from any given investment decision, increasing uncertainty and risk and working against new investments in expanded capacity.
The performance patterns within manufacturing, with a strong bias towards capital-intensive sectors, suggest the importance of previous government policies, and ‘path dependent’ factors meaning that firms which have developed productive strengths are able to re-invest and continue to grow their businesses. Perhaps the best example of this is Sasol, which leads local industry in ongoing R&D spending to continuously improve its capabilities. The result, however, has been that capital-intensive sectors have continued to
24 See, for example, Joffe et al. (1995) and Fallon and Pereira (1994). 25 The manufacturing sub-sectors which are considered part of the M EC are: fertilisers and pesticides; synthetic resins, plastics; other chemical products; other basic chemicals; other plastic products; bricks, tiles, refractories; cement; other non-metallic minerals; iron and steel; non-ferrous metals. The categorisations vary slightly depending on different systems of classification.
24
grow output, while many labour-intensive sectors have contracted or have recorded low growth. Such patterns have been reinforced by IDC lending in the mid 1990s which went predominantly to large-scale capital-intensive operations such as the Saldanha steel plant and Alusaf aluminium smelter. Indeed, there is a correlation of capital-intensity and output performance (measured by growth in value-added) over the ten years from 1993 to 2003 (see M achaka and Roberts, 2006).
The importance of a small number of very large-scale industries in the aggregate manufacturing trends is emphasised by the disaggregated investment record. If one excludes coke & refineries, basic chemicals, basic iron & steel, basic non-ferrous metals and motor vehicles (which together accounted for more than half of manufacturing GDFI in 2005) then manufacturing investment has hardly changed since 1995 (Roberts, 2005). Aside from motor vehicles, these very capital-intensive sectors are dominated by one or two firms, and have strong links with minerals processing. In the case of basic chemicals and coke & refineries the major firm is Sasol, while Iscor (now M ittal SA) dominates basic iron & steel, and a small number of firms dominate non-ferrous metals production. Furthermore, there are good reasons to believe that this pattern will continue. Sasol maintains a very high rate of expansion, with huge investment projects underway.
In 1996 to 1998 investment in basic iron & steel averaged around 50 per cent of the sector’s value-added. In addition, there are indications that iron & steel production will increase significantly in the next two to three years, and non-ferrous capacity is also set to increase given the smelters currently under consideration (although the largest expansion in the past decade has occurred in M ozambique). The new investment being planned in aluminium is despite the rationale having largely fallen away. South Africa now faces the need to invest in new electricity capacity, and the cost of such capacity needs to be taken into account in planning future smelters along with the long-term benefits to the local economy.
Closer examination reveals that in each of steel and basic chemicals the performance is down to the decisions of a single company. W hile it could still be argued that these outcomes reflect decisions to invest in expanded capacity as opposed to in alternative sectors, each of these firms was historically state-owned, developed capabilities under state support, and continued to receive finance (both loan and equity finance) from the IDC. State support also resulted in beneficial input pricing for local production in the form of coal, iron ore and electricity, and support for marketing of product in the case of Sasol’s sales of fuel.
There are two quite distinct issues related to the importance of South Africa’s minerals endowment for industrial development. The first is the impact of resource earnings on the economy. The increasing discoveries of platinum, in particular, in the past decade together with higher world prices of precious metals and other minerals such as iron ore mean that South Africa is again increasingly an exporter of natural resources and an importer of manufactured products. The implication of holding relatively low levels of foreign exchange reserves and having a freely floating exchange rate means that the cost of South African labour measured in international currency reflects the platinum windfall and not the local skills and education base of the country. Together with large portfolio capital flows, this also implies that the currency will continue to be volatile, reacting sharply to movements in international prices of metals and minerals.
The second issue is the linkages from mining and minerals to particular industries. The sectors with most rapid expansion of productive capacity in the last decade are closely

25
related to minerals beneficiation. But, closer examination reveals that it is the combination of government decisions together with the endowment which is important. W hile, for example, aluminium is based on cheap power ultimately derived from South Africa’s endowments of coal, the low energy prices are also due to Eskom’s massive over-investment in the 1970s. Cheap energy is also important for production of steel. The largest iron & steel company Iscor was state owned until the beginning of the 1990s, and the state through the IDC provided massive support for the establishment of Saldanha Steel in the mid 1990s. In addition, government support through infrastructure provision has also aided these industries.
Similarly, while the largest basic chemicals plant and one of the biggest refiners, Sasol, has historically derived its inputs from coal, its competitive capabilities derive from the huge state financing of its synthetic fuels operations for strategic reasons. After more than a decade as a privatised company, continuing to engage in high levels of R&D, it is somewhat ironically a case of an infant industry which has successfully grown-up. The point is that it was the government action rather than simply the minerals-link which underpinned the development of the industry. This legacy lives on in that it is one of the firms making the most of the opportunities from trade and increased international integration (including through outward acquisitions and foreign stock market listings).
At the same time, the lack of linkages from basic metals and basic chemicals due to the behaviour of the major firms is one the key reasons for the poor performance of more labour-intensive and diversified manufacturing. Indeed, monopoly pricing actively inhibits manufacturing growth.
In concentrated upstream sectors such as basic iron & steel, non-ferrous metals and basic chemicals, it is common for firms in South Africa to charge import-parity prices to local buyers for products in which there is a large trade surplus. In such cases competition would be expected to yield a price close to the export price received, as an exporting firm would be willing to sell the product at any price above the price currently being received for the exported product. Instead, pricing at import parity (often some 30 to 50 per cent higher than the export prices received) reflects the exertion of firms’ market power to act as price setters rather than price takers.
Such pricing means effectively a transfer from those local buyers (generally downstream industries) to the upstream industries. This can be very costly especially for relatively basic downstream products for which the material inputs are a very large part of costs and are very large in relation to the selling price of the finished good. By comparison, for more technologically sophisticated products, utilising higher skill levels, one would expect the cost of material inputs to be less significant.
Data from input-output tables demonstrate the importance of products such as basic iron & steel for downstream metal fabrication, and also for the more sophisticated machinery & equipment manufacture. Basic iron & steel comprises 37 per cent of direct inputs to fabricated metal products and 42 per cent taking into account indirect effects. The proportion of basic iron & steel including indirect effects (i.e. through intermediate products) in inputs to general machinery is 25 per cent. Non-ferrous metals account for 14 per cent of the direct inputs to fabricated metal products and 18 per cent of the direct inputs to electrical machinery. The labour-intensive plastics sector is even more dependent on inputs of polymer chemicals, which account for 51 per cent of direct inputs to plastic products, and are also import-parity priced.

26
Pricing is evidently going to be important for the competitiveness of downstream industries, and import parity pricing means there is no advantage to downstream industries from the internationally competitive, low production-cost upstream industries. This is evident in the trade performance. South Africa has large trade surplus in many upstream product areas such as basic metals (iron & steel and non ferrous metals) as well as in important polymer chemicals. Downstream industries record trade deficits in most cases. And, the growth of sectors such as basic iron & steel and non-ferrous metals has far exceeded that of metal products and machinery and equipment. There are further direct implications for employment as the basic metals activities are highly capital-intensive, and tend to reduce labour as they improve the efficiency of their operations. Higher growth of more labour-intensive downstream sectors would generate employment. The constriction of downstream industrial growth through the pricing behaviour of upstream firms also means higher levels of exports of products such as basic iron & steel, given the large fixed and sunk costs implying production at minimum efficient scale as long as returns in the export market cover marginal costs.
These dynamics are consistent with Fine and Rustomjee’s characterisation of the ‘minerals-energy complex’ (M EC) as being at the heart of South Africa’s industrial development – both in descriptive terms and, more importantly, as a system of accumulation while at the same time meaning that South Africa’s industrial development remains limited outside the areas of its direct interest (notwithstanding the motor industry’s development).
It is important, however, to recognise that the M EC characterisation is not necessarily determinist. Different competing interests influence government policy, and changing industrial realities mean big business groupings have to adapt. Some of the changes in the major conglomerate groupings are discussed in a separate section below, here we briefly reflect on three recent developments, being (a) continuity in terms of government incentives and support; (b) black economic empowerment; and (c) internationalisation and the attraction of FDI.
The process of government’s industrial policy formulation and implementation is obviously a messy one of competing ideas and interests. However, two aspects of continuity stand out. First, large incentives have continued to be given to M EC type activities, and especially basic metals and chemicals. One of the largest incentive programmes has provided tax relief equivalent to R7.7bn since 2002.26 The Strategic Investment Projects (SIP) incentive is targeted at large investments which the government considers to be important for future competitiveness of South Africa. Of the 33 projects approved up to the end of 2004, 13 are in chemicals and eight are in metal production (mainly upstream basic metals). Sasol alone accounts for four projects, and 24 per cent of the total tax allowances granted, by value. Other firms to be awarded an incentive include Iscor, BHP Billiton, Anglo-American’s subsidiary Hulett Aluminium, Nampak (two), Trident Steel, Kimberley-Clark and Nestle. This scheme clearly appears to be reinforcing the heavy industry orientation of the South African economy and demonstrating the ability of very large companies to take advantage of industrial policies. Based on DTI estimates of direct job creation, the SIP incentive projects approved have an average capital:labour ratio of
26 Details of the projects are given in Engineering News, 21-27 January 2005. The proposed Pechiney projects (four in total related to the proposed aluminium smelter) have been omitted following the review of this project.

27
R3.7mn per employee, making them amongst the most capital intensive activities in manufacturing.
Second, IDC financing for much of the past decade has continued in its orientation to the M EC. Indeed, from 1994 to 1999 over half its investments by value were in basic metals, and the IDC has continued to maintain shareholdings in M EC firms. The IDC’s role and recent developments are discussed below in more detail.
Emphasis on black economic empowerment (BEE) in business (as opposed to a broader transformation programme) has been growing, although not necessarily clearly defined. W hile government’s reference is now to ‘broad based’ black economic empowerment which encompasses skills development, management participation and the growth of small and medium enterprises, the single biggest BEE development has been the M ining Charter and related legislation. This makes the state’s granting of mineral rights conditional on a certain minimum black ownership.27 W hile this may appear to weaken the influence of the M EC by subjecting it to intervention by the state, the disproportionate interests held by black ANC-aligned business interests in mining compared to other areas of the economy suggests that the interests of mining and resource-related activities will be strengthened not weakened in government policy formulation. The political influence of M EC type groupings therefore continues, albeit in an ongoing evolving and contested manner.
Another important evolution is linked to the internationalisation of activities. This encompasses both internationalisation of South African minerals-oriented conglomerates such as Anglo-American and Gencor, and foreign interests. The attraction of FDI into minerals-processing in terms of South Africa’s ‘competitive advantage’ has been one strand of government’s policy. This has been particularly linked with the importance of cheap energy in patterns of industrial development. M ajor current projects under consideration include a ferrochrome plant and an aluminium smelter (proposed for Richards Bay and Coega, respectively). Neither of these will use significant South African minerals inputs apart from energy. The two firms involved are Tata and Alcan (having acquired Pechiney). The acquisition of Iscor by M ittal Steel (now the world’s largest steel company) also represents the entry of a conglomerate into South African industry with no previous South African connections.
4. Conclusion
The economic policies of the post-apartheid government have not adequately addressed the inherited structural and institutional weaknesses of the South African economy. As a result, capital accumulated in South Africa during the post-apartheid era largely continues to be allocated to the resources sector, contributes to speculation in financial and other asset markets or leaves the economy. The policy environment shapes the type of economic trajectory possible for South Africa. Unless there is a concerted effort by the state to restructure the economy, this trajectory will continue to be with the dominant M EC activities and growth in sectors like finance and communications (which are also sectors where oligopolistic firms can extract high rents). However, this type of growth will be constrained because it will occur within an inherited institutional framework that seems to
27 It has, in fact, become progressively more complex, as provision has been made through a points system for procurement from black suppliers and for local beneficiation of minerals, which can be traded off against the equity target.
28
perpetuate high levels of unemployment and inequality. Therefore, the government requires a vision for the future structure of the economy, informed by a vision for a democratic and economically just South Africa. Our contribution to this vision is to argue that South Africa requires a diversified industrial base, where we move up the value-added chain, as our economy develops the necessary wealth, skills and capacity. W e want manufacturing and services sectors that create employment and provide opportunities for upgrading of skills so that labour and management can assist movement up the value-added chain. Of course, we need to ensure that the wealth generated in the country is not wasted, totally consumed or directed to speculation but is invested in diversifying and deepening our industrial and skills base. W ithin this context, an initiative such as ASGISA, which government has stressed is not a new policy but an initiative, aimed at accelerating infrastructure development, programmes to improve performance in certain targeted economics sectors, unblocking of bureaucracy for small business success, addressing poor delivery from government and improving access to skills, is not enough. W e need a vision and a reorientation of policy (and government effort) towards achieving that vision.
M acroeconomic policy has clearly mattered for the growth path of the South African economy. Our analysis indicates that policies have discouraged productive investment, especially in tradables. This is true of interest rate policies which were procyclical, encouraged short-term capital inflows and a volatile and all too often overvalued currency. An obsession with reducing the budget deficit, rather than the sustainability of government finances, led to a collapse in government investment, while the changing structure of taxation supported the recent consumption boom, much of it fuelling increased imports. Overall, as with other countries following the standard macroeconomic prescriptions, South Africa’s performance has been poor.
The macroeconomic policies are directly tied to a growth trajectory which has favoured services. However, much of the job creation in these activities has been in wholesale & retail trade and in business services, with the latter including growth of jobs in security and cleaning services. W hile these jobs are generally low wage and insecure, it is clear that this is not a source of continued employment growth. Apparent employment growth in cleaning services is partly to do with outsourcing of these activities and hence a reclassification from other sectors such as manufacturing, while employment growth in security services at the recent rates would suggest citizens have completely abandoned the South African Police Service, not something one would want to see as part of an employment creation strategy. As a result, a significant proportion of services contribution to GDP growth is not welfare enhancing, promotes labour insecurity, increase inequality and poverty and could potentially stifle aggregate demand of the poorest in society.
Also of concern, and with far reaching implications for long-term economic development, is the increasing financialisation and international concentration of global business and its implication on large South African corporations. The growing importance of institutional investors, with relatively short-term horizons, together with the continuing massive wave of mergers and acquisitions puts immense pressures on corporations to become more oriented to short-term profits and less to longer-term investment strategies. In addition, corporations have conceded to institutional investors’ demands that shareholder value will increase if they restructure to focus on core business. As a result, large South African corporations have internationalised, restructured, and many have moved their listings offshore to become de facto foreign investors in South Africa. An important consequence of this development is that large South African corporations that grew because of their exploitation of South African mineral wealth and harsh exploitation of black labour are able to sidestep the
29
project to develop the South African economy and their threat to disinvest has grown. At the same time, the economy has become more concentrated and dependent on the M EC. Large corporations have selectively withdrawn from many downstream value-added sectors and focused on what they define as core business. To make matters worse, long-term investment in the economy is further constrained by the very high level of foreign trade in South African equities and bonds, which increases currency volatility, financial fragility and susceptibility to financial contagion. The Rand’s position as one of the most highly traded ‘emerging market’ currencies is in no way justified by levels of real economic activity in the South African economy. Nor is this activity in financial markets related to improved investment in real economic activity. The increases in short-term portfolio flows during the 1990s led to more credit to the private sector but this growth in private debt was associated with more consumption of imported goods and more speculation in financial and housing markets rather than productive investment.
Notwithstanding the changes in conglomerate ownership with overseas listings, and the unbundling and re-bundling that has taken place, the South African economy remains anchored by resource-based activities. Indeed, macroeconomic policies and trade liberalisation have further impeded the diversification from these activities. In addition, in almost any given sub-sector or industry the outcomes in terms of production, employment and investment depend on the decisions of a very few firms. Key to developing a policy agenda is to understand the ways in which policies influence the orientation of these firms and, more broadly, the evolving pattern of capitalist development in South Africa.

30
References
Akyuz, Y. (2006) ‘From liberalisation to investment and jobs: lost in translation’, paper prepared for International Labour Organisation, downloaded from http://www.networkideas.org/featart/feb2006/Lost_in_Translation.pdf
Amsden, A. (1989), Asia’s Next Giant: South Korea and Late Industrialization, New York, Oxford University Press.
Amsden, A. (2001) The rise of “the rest”. Challenges to the W est from Late-Industrializing Economies. Oxford: OUP.
Bell, T., G. Farrell, R. Cassim (2002) ‘Competitiveness, international trade and finance in a minerals-rich economy: The case of South Africa’, in Fanelli, J.M . and R. M edhora (eds.) Finance and Competitiveness in Developing Countries. London: Routledge.
Belli, P., Finger, M . and Ballivian, A. (1993) ‘South Africa: Review of Trade Policy Issues’ Informal Discussion Papers on Aspects of the South African Economy No.4, Southern Africa Department, W orld Bank, W ashington
Chabane, N, A. Goldstein and S. Roberts (2006) ‘The changing face and strategies of big business in South Africa: Ten years of political democracy’, Industrial and Corporate Change, forthcoming
Chang, H-J. (1997), “Evaluating the Current Industrial Policy of South Africa”, prepared for the Trade and Industrial Policy Strategies (TIPS) – download at www.tips.org.za.
Chang, H.J. (Ed.), (2002), Rethinking Development Economics, Anthem Press, London.
Crotty, J. (2002), “The Effects of Increased Product M arket Competition and Changes in Financial M arkets on the Performance of Nonfinancial Corporations in the Neoliberal Era”, Political Economy Research Institute, W orking Paper no. 44.
Crotty, J. (2003), “The Neoliberal Paradox: The Impact of Destructive Product M arket Competition and Impatient Finance on Nonfinancial Corporations in the Neoliberal Era,” PERI Research Brief.
Dawood, N. (2006) ‘Employment in Services in South Africa’, School of Economics and Business Sciences Honours Long Essay, University of the W itwatersrand.
Department of Trade and Industry (DTI) (2002) Accelerating Growth and Development: The Contribution of the Integrated M anufacturing Strategy, Pretoria.
Dumenil, G. and D. Levy (2001), “Costs and benefits of Neoliberalism: A Class Analysis,” Review of International Political Economy, Vol. 8, no.4, 578-607.
Edwards, L. (2001) ‘Globalisation and the skills bias of occupational employment in South Africa’, South African Journal of Economics, 69(1), 40-71.
Edwards, L. (2005a) ‘Has South Africa liberalised its trade?’, South African Journal of Economics, 73(4), 754-775.

31
Edwards, L. (2005b) ‘Trade Liberalisation and Labour Demand in South Africa during the 1990s’, Strategies and Analysis for Growth and Access (SAGA) W orking Paper, October 2005.
Falkena, H., G. Davel, P. Hawkins, D. Llewellyn, C. Luus, E. M asilela, G. Parr, J. Pienaar, H. Shaw (2004) ‘ Competition in South African Banking’, Task Group Report for the National Treasury and the South African Reserve Bank, April 2004.
Farrell, G.N. (2001), “Capital Controls and the Volatility of South African Exchange Rates”, South African Reserve Bank Occasional Paper No 15.
Fedderke, J. and P. Vaze (2001) ‘The nature of South Africa’s trade patterns by economic sector, and the extent of trade liberalisation during the course of the 1990s’, South African Journal of Economics, 69(3), 436-473.
Fedderke, J., Y. Shin and P. Vaze (2001) ‘Trade, technology and wage inequality: a dynamic panel data approach to South African M anufacturing Sectors’, ERSA.
Frydman, R. and E.S. Phelps (eds.) (1983), Individual Forecasting and Aggregate Outcomes: ''Rational Expectations'' Examined, New York, Cambridge University Press.
Government of South Africa (2003), “Toward a Ten Year Review”, prepared by Policy Coordination and Advisory Services of the Presidency. Download at http://www.10years.gov.za/review/docs/cover.pdf.
Krippner, G. (2002), “W hat is Financialization?,” Sociology Department, University of W isconsin-M addison. (Available through gkripner@ ssc.wisc.edu).
Lucas, R. Jr (1973) "Some International Evidence on Output-Inflation Tradeoffs", American Economics Review, Vol. 63, pp.326-34
M achaka, J. and S. Roberts (2006) ‘Addressing the Apartheid Industrial Legacy: Local Economic Development and Industrial Policy in South Africa’, in Roberts, S. (ed.) Sustainable M anufacturing? The Case of South Africa & Ekurhuleni, Cape Town: Juta.
M achaka, J. W . M ainga, S. Roberts (2003) ‘Globalisation and employment in South Africa: A review of issues’, report commissioned by Department of Labour, M ay 2003
M ohamed, S (2003), “Capital Inflows Since the End of Apartheid and the 2001Currency Crisis”, presented at the TIPS/DPRU 2003 forum – download at www.tips.org.za.
M ohamed, S. and Finnoff (2005) XXX
Nolan, P. (2003), “Industrial Policy in the early 21st century: The challenge of the global business revolution” in Chang, H.J. (Ed.), (2002), Rethinking Development Economics,Anthem Press, London.
Ocampo, J. A. (2003), “Development and the Global Order” in Chang, H.J. (Ed.), (2002), Rethinking Development Economics, Anthem Press, London.

32
Roberts, S. (2000) ‘Understanding the effects of trade policy reform: the case of South Africa’, South African Journal of Economics, 68 (4), 607-638.
Roberts, S. (2001) ‘Globalisation, industrial development and the plastics industry in South Africa’, Journal of International Development, 13, 797-810.
Roberts, S. (2005) ‘Industrial development and industrial policy in South Africa – a ten year review’, presented at Conference on South African Economic Policy Under Democracy – A Ten Year Review, Stellenbosch, 28 & 29 October 2005
Rodrik, D. (2004) ‘Growth Strategies’, mimeo, paper for Handbook of Economic Growth
Shafaeddin, M . (2006) ‘Does Trade Openness Favour or Hinder Industrialization and Development’, paper prepared for the Intergovernmental group of Twenty-Four on International M onetary Affairs, to be presented at the Technical Group meeting, Geneva, 16-17 M arch 2006
Valodia, I., L. Lebani, C. Skinner, R. Devey (2006) ‘Low-waged and informal employment in South Africa’, Transformation, 60, 90-126.