Creatinine and insulin predict cardiac mass in drug-naïve hypertensive patients
Upload
independentCategory
view
1download
0
REVIEW
Serum creatinine as a marker of muscle mass in chronickidney disease: results of a cross-sectional study and reviewof literature
Sapna S. Patel & Miklos Z. Molnar & John A. Tayek & Joachim H. Ix &
Nazanin Noori & Deborah Benner & Steven Heymsfield &
Joel D. Kopple & Csaba P. Kovesdy & Kamyar Kalantar-Zadeh
Received: 4 May 2012 /Accepted: 12 June 2012 /Published online: 10 July 2012# Springer-Verlag 2012
AbstractBackground Higher muscle mass is associated with better out-comes and longevity in patients with chronic disease states.Imaging studies such as dual-energy X-ray absorptiometry(DEXA) are among the gold standard methods for assessingbody fat and lean body mass (LBM), approximately half ofwhich is comprised of skeletal muscle mass. Elaborate imagingdevices, however, are not commonly available in routine clinicalpractice and therefore easily accessible and cost-effective, butreliable muscle mass biomarkers are needed. One such markeris serum creatinine, derived frommuscle-based creatine, which
is inexpensive and ubiquitously available, and it can serve as abiomarker of skeletal muscle mass in human subjects.Methods and results In 118 hemodialysis patients, we foundthat the 3-month averaged serum creatinine concentrationcorrelated well with DEXA-measured LBM. The recentliterature regarding serum creatinine as a surrogate of mus-cle mass is summarized, as is the literature concerning theuse of other measures of muscle mass, such as plasmagelsolin and actin, and urinary creatinine excretion. Wehave also reviewed the role of dietary meat intake inserum creatinine variability along with several biomarkers
Patel and Molnar contributed equally to this article.
S. S. Patel : J. D. Kopple :K. Kalantar-ZadehDivision of Nephrology and Hypertension, Los AngelesBiomedical Research Institute at Harbor-UCLA Medical Center,Torrance, CA, USA
S. S. Patel :M. Z. Molnar :N. Noori :K. Kalantar-Zadeh (*)Harold Simmons Center for Chronic Disease Researchand Epidemiology, Los Angeles Biomedical Research Instituteat Harbor-UCLA Medical Center,Torrance, CA, USAe-mail: [email protected]
M. Z. MolnarInstitute of Pathophysiology, Semmelweis University,Budapest, Hungary
J. A. Tayek : J. D. Kopple :K. Kalantar-ZadehDavid Geffen School of Medicine at UCLA,Los Angeles, CA, USA
J. A. TayekGeneral Internal Medicine, Los Angeles Biomedical ResearchInstitute at Harbor-UCLA Medical Center,Torrance, CA, USA
J. H. IxUniversity of California San Diego,San Diego, CA, USA
D. BennerDaVita Nutrition,Irvine, CA, USA
S. HeymsfieldPennington Biomedical Research Center,Baton Rouge, LA, USA
J. D. Kopple :K. Kalantar-ZadehJonathan Fielding UCLA School of Public Health,1124 West Carson Street, C1-Annex,Los Angeles, CA 90502, USA
C. P. KovesdyDivision of Nephrology, University of Virginia,Charlottesville, VA, USA
C. P. KovesdyDivision of Nephrology, Salem VA Medical Center,Salem, VA, USA
J Cachexia Sarcopenia Muscle (2013) 4:19–29DOI 10.1007/s13539-012-0079-1
of dietary meat intake (creatine, carnitine, carnosine, ophi-dine, anserine, 3-methyl-L-histidine and 1-methylhistidine).Conclusion In summary, none of these biomarkers wasstudied in CKD patients. We advance the hypothesis thatin both health and disease, under steady state, serum creat-inine can serve as a reliable muscle mass biomarker ifappropriate adjustment for full or residual kidney functionand dietary meat intake is undertaken.
Keywords Serum creatinine . Hemodialysis .
Protein–energy wasting (PEW) . Lean body mass (LBM) .
Nutritional status . Skeletal muscle mass
1 Introduction
The accurate assessment of nutritional status and body compo-sition is of paramount importance in providing nutritional care topatients with chronic kidney disease (CKD) and end-stage renaldisease (ESRD), as malnutrition and the protein–energy wastingsyndrome are among the strongest risk factors for morbidity andmortality. Body composition is typically divided into fat massand fat-free mass also known as lean body mass (LMB). Com-pared to body fat mass, which stores energy in the form ofadipose tissue, LBM includes muscle and visceral proteins andconsists predominantly of water, protein, glycogen andminerals.In people with water retaining states, such as CKD, it is alsoimportant to assess body water volume separately from the othercomponents of LMB. The LBM compartment therefore is het-erogeneous and its measure is affected by fluctuations in waterand electrolyte distribution, which are of a more dynamic naturein patients receiving renal replacement therapy [1]. Approxi-mately half of LBM is comprised of skeletal muscle mass [2].Recent studies suggest that higher muscle mass is associatedwith greater longevity in people with CKD and other chronicdisease states [3, 4]. We present and summarize the recentliterature regarding serum creatinine as a surrogate marker ofmuscle mass, show new information supporting this conten-tion (including the results of a pilot study that examines thecorrelation between serum creatinine and muscle in dialysispatients) and review the literature of other markers of musclemass and the role of dietary meat intake in creatinine variabil-ity as well as other biomarkers of meat intake.
2 Creatinine as a muscle mass surrogate
The accurate assessment of nutritional status and body com-position is instrumental in providing optimal care to patientswith chronic disease states including those with CKD. Im-aging studies such as dual-energy X-ray absorptiometry(DEXA) are among the gold standard methods for assessingbody composition [1, 5, 6]. However, this method requires
an instrument that is not commonly available in clinicalpractice, and therefore other easily accessible, cost-effective and reliable markers of body composition areneeded. Ideally, the measurements in a simple blood testcombined with height, weight, and gender would be a conve-nient approach to estimate LBM including skeletal musclemass and fat mass.
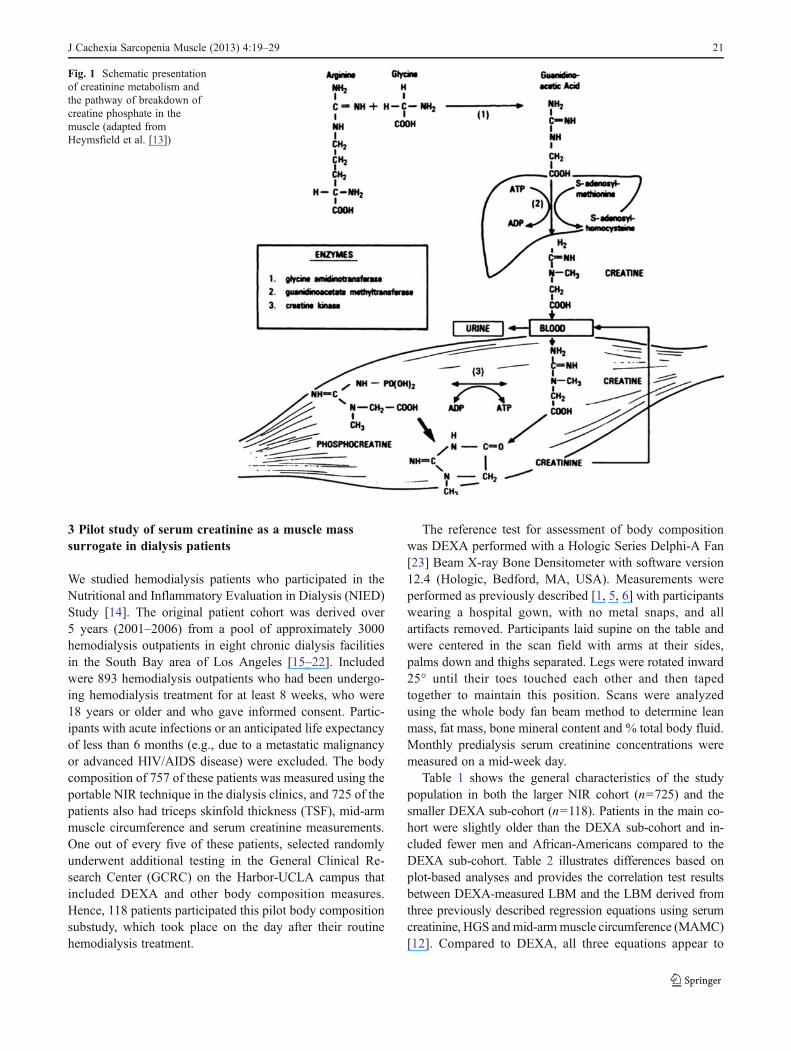
In the past few years, emerging data have revived the oldnotion that serum creatinine level is a reliable and cost-effectivesurrogate marker of muscle mass in stable chronic dialysispatients in whom kidney function is minimal to nonexistentand who maintain stable dose of dialysis therapy [4, 7–12].Creatinine (from the Greek κρέας, flesh) is a breakdownproduct of creatine phosphate in muscle (see Fig. 1). Underthe steady-state and stable kidney function, creatinine is usuallyproduced at a relatively constant rate by the body depending onthe absolute amount of muscle mass [13]. Creatinine is filteredout of the blood by the glomeruli (and is excreted to smallerextent in the proximal tubules of the kidney). Since there islittle to no tubular reabsorption of creatinine, its renal clearanceis often used to estimate glomerular filtration rate. Under stablekidney function, the serum or plasma concentration of serumcreatinine can also reflect skeletal muscle mass, if its non-muscle-mass-dependent variations (such as due to renal filtra-tion or meat intake) can be accurately accounted for. In peoplewith stable kidney function and urine output, a 24-h urinarycreatinine is usually a constant number based on skeletal mus-cle mass save variations due to meat intake [13].
In the early 1980s, Schutte et al. [7] examined 24 healthymen and found that total plasma creatinine correlated stronglywith urinary creatinine excretion and with weight, total bodywater and anthropometrically estimated LBM. Donadio et al.[5] examined 27 adult hemodialysis patients and found LBMestimated by bioelectrical impedance analysis (BIA) andDEXA correlated well with serum creatinine. In addition,Keshaviah et al. [8] supported these results showing a strongrelationship between serum creatinine level and skeletal musclemass in peritoneal dialysis patients. Recently, Noori et al. [12]examined the correlation of DEXA-measured LBM and pre-dicted LBM based on serum concentrations of creatinine andanthropometric measurements, such as mid-arm muscle cir-cumference (MAMC) and handgrip strength (HGS), in 118randomly selected hemodialysis patients who underwent ex-tensive clinical and nutritional evaluation including DEXA and725 hemodialysis patients in whom LBM was estimated usingthe portable near-infrared (NIR) technique. In this latter study,serum creatinine, MAMC and HGS displayed the highestcorrelations with LBM. The authors developed three regressionequations based on serum creatinine, MAMC and HGS toestimate LBM [12]. In women, there was less bias with serumcreatinine and MAMC compared to other methods [12]. Nev-ertheless, serum creatinine-based equation to estimate LBMwas reliable and practical in this study.
20 J Cachexia Sarcopenia Muscle (2013) 4:19–29
3 Pilot study of serum creatinine as a muscle masssurrogate in dialysis patients
We studied hemodialysis patients who participated in theNutritional and Inflammatory Evaluation in Dialysis (NIED)Study [14]. The original patient cohort was derived over5 years (2001–2006) from a pool of approximately 3000hemodialysis outpatients in eight chronic dialysis facilitiesin the South Bay area of Los Angeles [15–22]. Includedwere 893 hemodialysis outpatients who had been undergo-ing hemodialysis treatment for at least 8 weeks, who were18 years or older and who gave informed consent. Partic-ipants with acute infections or an anticipated life expectancyof less than 6 months (e.g., due to a metastatic malignancyor advanced HIV/AIDS disease) were excluded. The bodycomposition of 757 of these patients was measured using theportable NIR technique in the dialysis clinics, and 725 of thepatients also had triceps skinfold thickness (TSF), mid-armmuscle circumference and serum creatinine measurements.One out of every five of these patients, selected randomlyunderwent additional testing in the General Clinical Re-search Center (GCRC) on the Harbor-UCLA campus thatincluded DEXA and other body composition measures.Hence, 118 patients participated this pilot body compositionsubstudy, which took place on the day after their routinehemodialysis treatment.
The reference test for assessment of body compositionwas DEXA performed with a Hologic Series Delphi-A Fan[23] Beam X-ray Bone Densitometer with software version12.4 (Hologic, Bedford, MA, USA). Measurements wereperformed as previously described [1, 5, 6] with participantswearing a hospital gown, with no metal snaps, and allartifacts removed. Participants laid supine on the table andwere centered in the scan field with arms at their sides,palms down and thighs separated. Legs were rotated inward25° until their toes touched each other and then tapedtogether to maintain this position. Scans were analyzedusing the whole body fan beam method to determine leanmass, fat mass, bone mineral content and % total body fluid.Monthly predialysis serum creatinine concentrations weremeasured on a mid-week day.
Table 1 shows the general characteristics of the studypopulation in both the larger NIR cohort (n0725) and thesmaller DEXA sub-cohort (n0118). Patients in the main co-hort were slightly older than the DEXA sub-cohort and in-cluded fewer men and African-Americans compared to theDEXA sub-cohort. Table 2 illustrates differences based onplot-based analyses and provides the correlation test resultsbetween DEXA-measured LBM and the LBM derived fromthree previously described regression equations using serumcreatinine, HGS andmid-armmuscle circumference (MAMC)[12]. Compared to DEXA, all three equations appear to
Fig. 1 Schematic presentationof creatinine metabolism andthe pathway of breakdown ofcreatine phosphate in themuscle (adapted fromHeymsfield et al. [13])
J Cachexia Sarcopenia Muscle (2013) 4:19–29 21
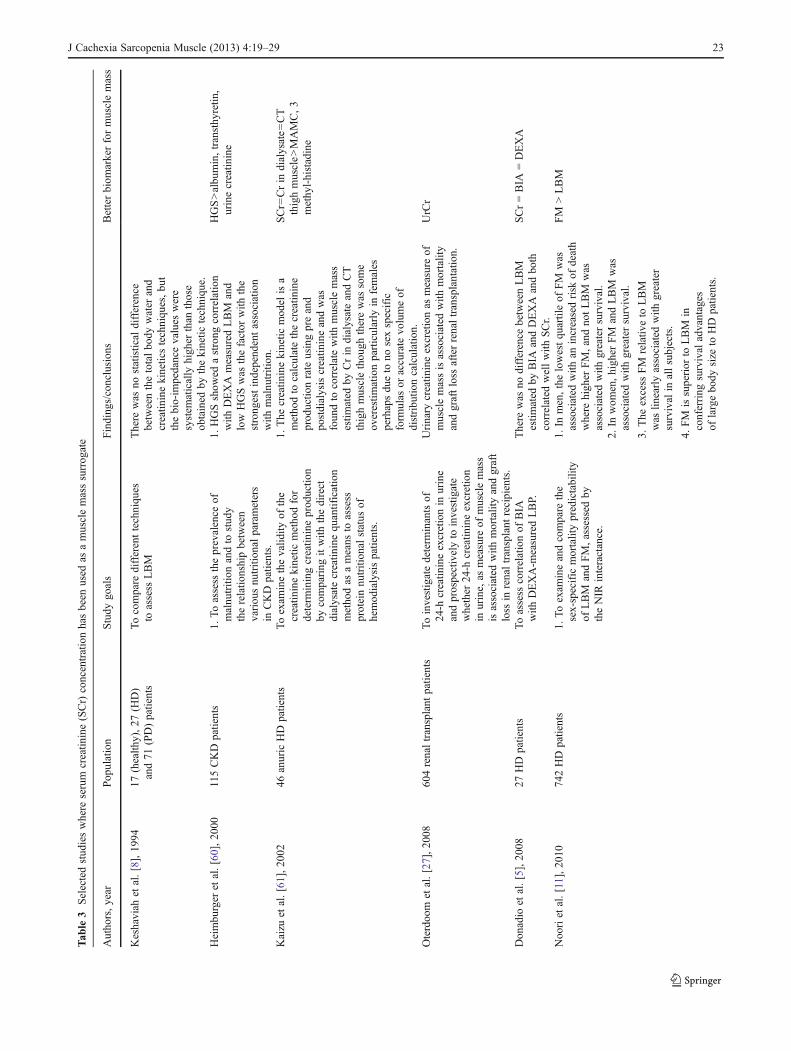
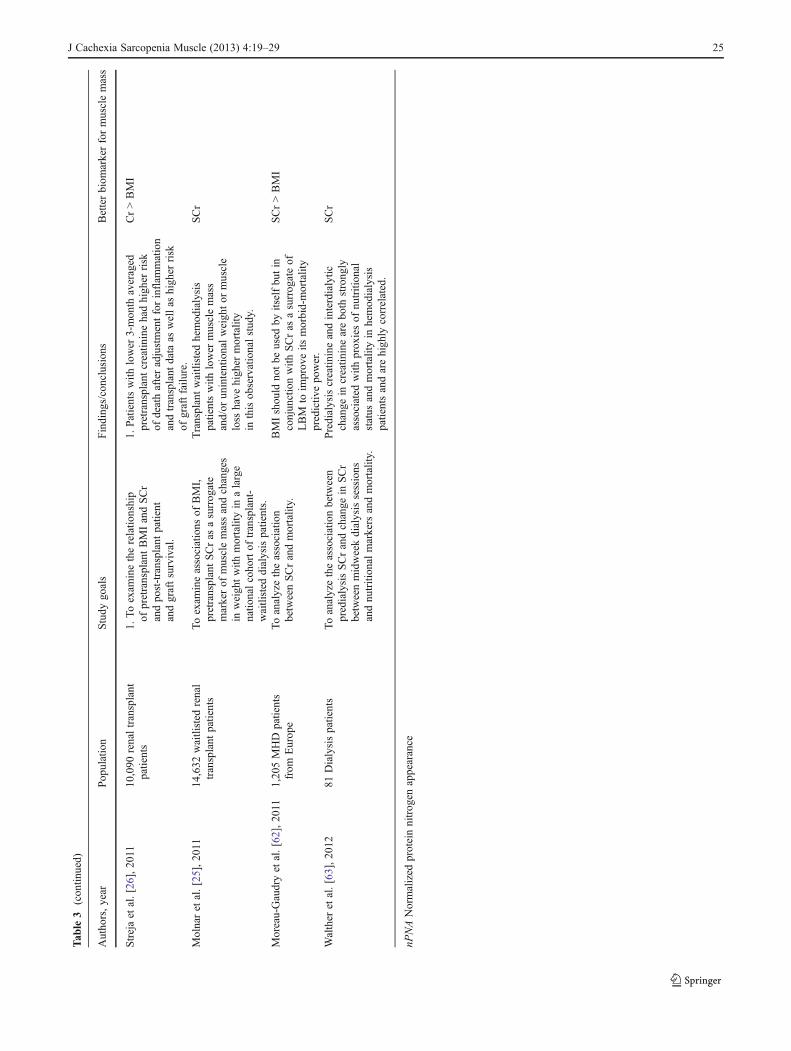
accurately estimate the LBM. All three methods tended tounderestimate LBM among participants with higher LBM.Figure 2 shows the association between LBM and serumcreatinine based on the prediction models [12]. Figure 3depicts cubic splines that illustrate the association betweenthe DEXA-measured LBM and the LBM estimated by each ofthe three regression equations based on serum creatinine,MAMC and HGS. The association with serum creatininewas strong, linear and with narrow confidence intervals.
4 Serum creatinine as a muscle surrogatein the literature
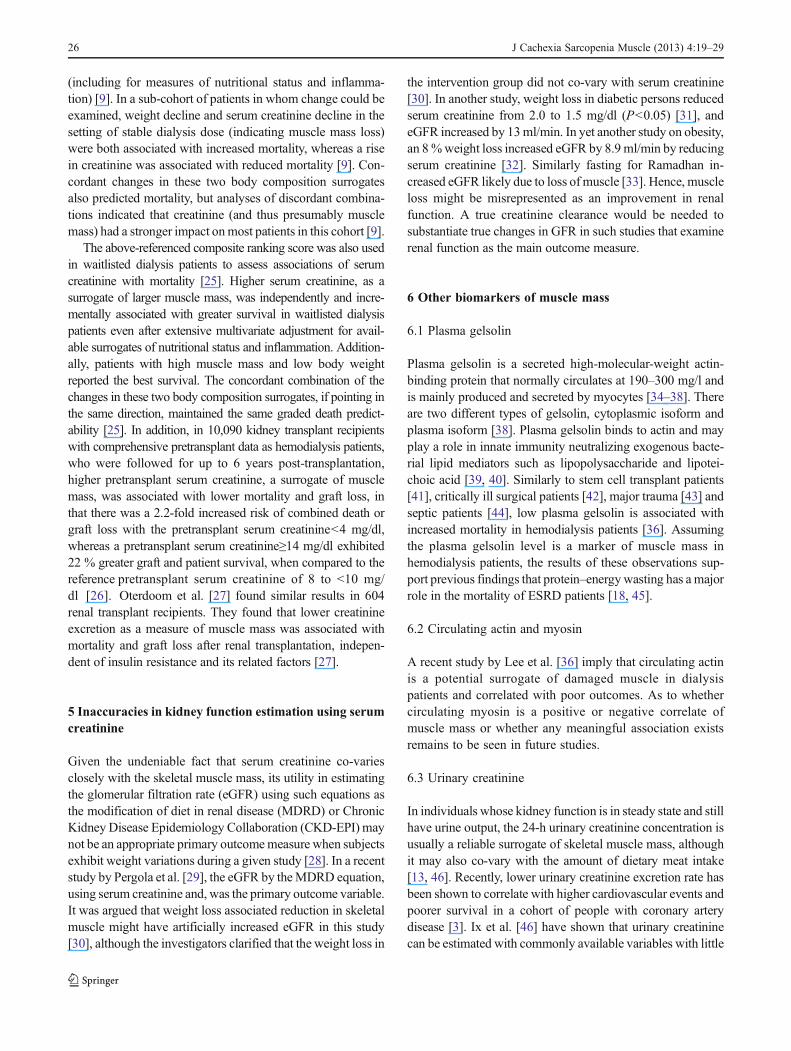
Table 3 shows some recent studies where serum creatininewas used as a surrogate marker of LBM and/or skeletalmuscle mass. Despite their variable results, most studiesshow that serum creatinine correlate well measures of mus-cle mass. Additionally, there has been a sizeable literaturedemonstrating that low LBM in the dialysis population isassociated with increased mortality.
In the general population, Oterdoom et al. [24] showed thatlow creatinine excretion, as an indirect measure of lowmusclemass, is associated with increased incidence of cardiovascularevents and all-cause mortality, independent of insulin resis-tance. Recently, Kalantar-Zadeh et al. [9] examined the rela-tionship of mortality with changes in dry weight and in serumcreatinine in a cohort of 121,762 hemodialysis patients fol-lowed for up to 5 years. They used a new method for calcu-lating a composite ranking score, and confirmed that BMI(measured by 3-month averaged BMI) and serum creatininelevels (3-month averaged dialysis dose-adjusted serum creat-inine concentrations) simultaneously predicted decreasedmortality even after extensive multivariate adjustment
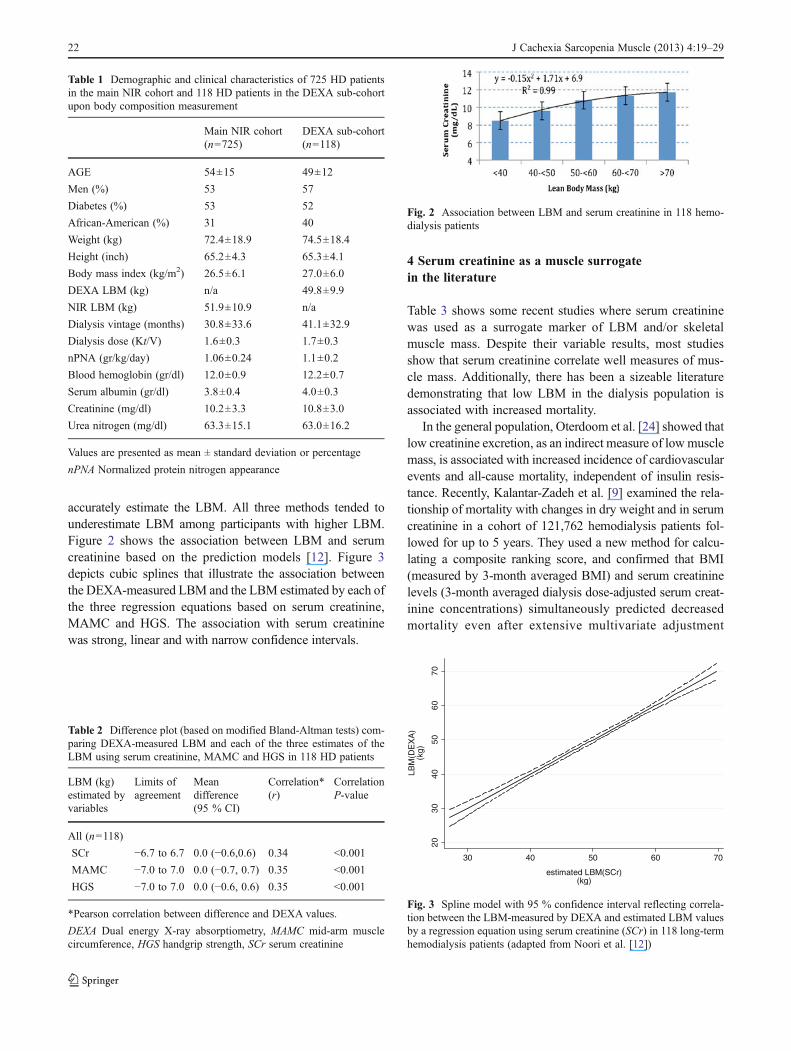
Table 1 Demographic and clinical characteristics of 725 HD patientsin the main NIR cohort and 118 HD patients in the DEXA sub-cohortupon body composition measurement
Main NIR cohort(n0725)
DEXA sub-cohort(n0118)
AGE 54±15 49±12
Men (%) 53 57
Diabetes (%) 53 52
African-American (%) 31 40
Weight (kg) 72.4±18.9 74.5±18.4
Height (inch) 65.2±4.3 65.3±4.1
Body mass index (kg/m2) 26.5±6.1 27.0±6.0
DEXA LBM (kg) n/a 49.8±9.9
NIR LBM (kg) 51.9±10.9 n/a
Dialysis vintage (months) 30.8±33.6 41.1±32.9
Dialysis dose (Kt/V) 1.6±0.3 1.7±0.3
nPNA (gr/kg/day) 1.06±0.24 1.1±0.2
Blood hemoglobin (gr/dl) 12.0±0.9 12.2±0.7
Serum albumin (gr/dl) 3.8±0.4 4.0±0.3
Creatinine (mg/dl) 10.2±3.3 10.8±3.0
Urea nitrogen (mg/dl) 63.3±15.1 63.0±16.2
Values are presented as mean ± standard deviation or percentage
nPNA Normalized protein nitrogen appearance
Table 2 Difference plot (based on modified Bland-Altman tests) com-paring DEXA-measured LBM and each of the three estimates of theLBM using serum creatinine, MAMC and HGS in 118 HD patients
LBM (kg)estimated byvariables
Limits ofagreement
Meandifference(95 % CI)
Correlation*(r)
CorrelationP-value
All (n0118)
SCr −6.7 to 6.7 0.0 (−0.6,0.6) 0.34 <0.001
MAMC −7.0 to 7.0 0.0 (−0.7, 0.7) 0.35 <0.001
HGS −7.0 to 7.0 0.0 (−0.6, 0.6) 0.35 <0.001
*Pearson correlation between difference and DEXA values.
DEXA Dual energy X-ray absorptiometry, MAMC mid-arm musclecircumference, HGS handgrip strength, SCr serum creatinine
Fig. 2 Association between LBM and serum creatinine in 118 hemo-dialysis patients
2030
4050
6070
LBM
(DE
XA
)(k
g)
30 40 50 60 70
estimated LBM(SCr)(kg)
Fig. 3 Spline model with 95 % confidence interval reflecting correla-tion between the LBM-measured by DEXA and estimated LBM valuesby a regression equation using serum creatinine (SCr) in 118 long-termhemodialysis patients (adapted from Noori et al. [12])
22 J Cachexia Sarcopenia Muscle (2013) 4:19–29
Tab
le3
Selectedstud
ieswhere
serum
creatin
ine(SCr)concentrationhasbeen
used
asamusclemasssurrog
ate
Autho
rs,year
Pop
ulation
Study
goals
Finding
s/conclusion
sBetterbiom
arkerformusclemass
Keshaviah
etal.[8],19
9417
(health
y),27
(HD)
and71
(PD)patients
Tocompare
differenttechniqu
esto
assess
LBM
There
was
nostatistical
difference
betweenthetotalbo
dywater
and
creatin
inekineticstechniqu
es,bu
tthebio-im
pedancevalues
were
system
atically
high
erthan
those
obtained
bythekinetic
techniqu
e.Heimbu
rger
etal.[60],20
00115CKD
patients
1.To
assess
theprevalence
ofmalnu
trition
andto
stud
ytherelatio
nshipbetween
variou
snu
trition
alparameters
inCKD
patients.
1.HGSshow
edastrong
correlation
with
DEXA
measuredLBM
and
low
HGSwas
thefactor
with
the
strong
estindepend
entassociation
with
malnu
trition
.
HGS>albu
min,transthy
retin
,urinecreatin
ine
Kaizu
etal.[61],20
0246
anuric
HD
patients
Toexam
inethevalid
ityof
the
creatin
inekinetic
metho
dfor
determ
iningcreatin
ineprod
uctio
nby
comparing
itwith
thedirect
dialysatecreatin
inequ
antification
metho
das
ameans
toassess
proteinnu
trition
alstatus
ofhemod
ialysispatients.
1.The
creatin
inekinetic
mod
elisa
metho
dto
calculatethecreatin
ine
prod
uctio
nrate
usingpreand
postdialysiscreatin
ineandwas
foun
dto
correlatewith
musclemass
estim
ated
byCrin
dialysateandCT
thighmusclethou
ghtherewas
some
overestim
ationparticularly
infemales
perhapsdu
eto
nosexspecific
form
ulas
oraccurate
volumeof
distribu
tioncalculation.
SCr0
Crin
dialysate0
CT
thighmuscle>
MAMC,3
methy
l-histadine
Oterdoo
met
al.[27],20
0860
4renaltransplant
patients
Toinvestigatedeterm
inantsof
24-h
creatin
ineexcretionin
urine
andprospectivelyto
investigate
whether
24-h
creatin
ineexcretion
inurine,as
measure
ofmusclemass
isassociated
with
mortalityandgraft
loss
inrenaltransplant
recipients.
Urinary
creatin
ineexcretionas
measure
ofmusclemassisassociated
with
mortality
andgraftloss
afterrenaltransplantation.
UrCr
Don
adio
etal.[5],20
0827
HD
patients
Toassess
correlationof
BIA
with
DEXA-m
easuredLBP.
There
was
nodifference
betweenLBM
estim
ated
byBIA
andDEXA
andbo
thcorrelated
wellwith
SCr.
SCr0BIA
0DEXA
Noo
riet
al.[11],20
1074
2HD
patients
1.To
exam
ineandcompare
the
sex-specific
mortalitypredictability
ofLBM
andFM,assessed
bytheNIR
interactance.
1.In
men,thelowestqu
artileof
FM
was
associated
with
anincreasedrisk
ofdeath
where
high
erFM,andno
tLBM
was
associated
with
greatersurvival.
FM
>LBM
2.In
wom
en,high
erFM
andLBM
was
associated
with
greatersurvival.
3.The
excess
FM
relativ
eto
LBM
was
linearlyassociated
with
greater
survival
inallsubjects.
4.FM
issuperior
toLBM
inconferring
survival
advantages
oflargebody
size
toHD
patients.
J Cachexia Sarcopenia Muscle (2013) 4:19–29 23

Tab
le3
(con
tinued)
Autho
rs,year
Pop
ulation
Study
goals
Finding
s/conclusion
sBetterbiom
arkerformusclemass
Noo
riet
al.[4],20
1079
2HD
patients
1.Toexam
inethecorrelations
ofanthropo
metricandbiochemical
measureswith
DEXA-m
easured
LBM
inHD
patientsto
determ
ine
which
serves
asabettersurrog
ate
forLBM.
1.MAMC(r00.54
,P<0.00
1)andSCr
(r00.36
,P<0.01
)hadthestrong
est
correlations
with
DEXA-m
easuredLBM.
MAMC>SCr
2.Tostud
ytheou
tcom
epredictability
ofLBM
estim
ated
byMAMCand
SCrandcompare
them
with
TSF.
2.Patientswith
high
estMAMCrepo
rted
bettermentalhealth
score.
3.Toexam
inetheassociation
ofMAMCwith
QoL
.3.
Decreased
risk
ofdeathwas
observed
inhemod
ialysispatientswith
high
erMAMC,high
erSCrandhigh
erTSF.
4.HighMAMCareassociated
with
greater
survival
inpatientswith
low
TSFandin
patientswith
high
TSFthickn
ess,thus
sugg
estin
gthat
musclemassmay
possibly
bemoreim
portantthan
periph
eral
body
fat
massin
predictin
gsurvival
inHD
patients.
Kalantar-Zadeh
etal.[10],20
1012
1,76
2HD
patients
1.Tovalid
ate3-mon
thaveraged
pre-HD
SCras
amarkerformuscle
massin
subg
roup
of117patients.
1.HigherBMI(upto
45)anda
high
erSCrareeach
independ
ently
andincrem
entally
associated
with
greatersurvival
even
afteradjustment
fornu
trition
alstatus
andinflam
mation.
SCr>BMI
2.Tostud
yadjusted
dryweigh
tandSCrconcentrationandtheir
changesov
ertim
eas
predictors
ofmortalityin
HD
patients.
2.A
gain
indryweigh
taccompanied
byaconcurrent
increase
inmuscle
mass(SCr)isassociated
with
the
greatestsurvival,whereas
weigh
tloss
accompanied
byloss
inmuscle
massbearsthehigh
estmortality.A
weigh
tloss
with
gain
ofmusclemass
confershigh
ersurvival
than
weigh
tgain
with
loss
ofmusclemass.
Noo
riet
al.[12],20
11118/61
2(D
evelop
ment/
valid
ationcoho
rt)HD
patients
1.Toexam
inecorrelationbetween
DEXA-m
easuredLBM
with
SCr
(3-m
onth
averaged),albu
min,
prealbum
in,anthropo
metric
measurements,nP
NA
and
subjectiv
eassessment.
1.LBM
calculated
bySCr,MAMC,
andhand
grip
streng
thhadthehigh
est
correlations
with
LBM
calculated
byDEXA
andwhenvalid
ated
byNIR
interactance.
SCr>MAMC
2.Todevelopequatio
nsto
estim
ateLBM
andcompare
toDEXA-m
easuredLBM.
2.Serum
albu
min
andprealbum
inlevelsdidno
tcorrelatewellwith
DEXA-m
easuredLBM.
3.Totestvalid
ityof
equatio
nsin
valid
ationcoho
rtcompared
toNIR
techniqu
e.
3.LBM
calculated
byHGS,MAMC,
SCrun
derestim
ated
LBM
particularly
atLBM>50
kg.
24 J Cachexia Sarcopenia Muscle (2013) 4:19–29
Tab
le3
(con
tinued)
Autho
rs,year
Pop
ulation
Study
goals
Finding
s/conclusion
sBetterbiom
arkerformusclemass
Strejaet
al.[26],20
1110
,090
renaltransplant
patients
1.Toexam
inetherelatio
nship
ofpretransplantBMIandSCr
andpo
st-transplantpatient
andgraftsurvival.
1.Patientswith
lower
3-mon
thaveraged
pretransplantcreatin
inehadhigh
errisk
ofdeathafteradjustmentforinflam
mation
andtransplant
data
aswellas
high
errisk
ofgraftfailu
re.
Cr>BMI
Molnaret
al.[25],20
1114
,632
waitlisted
renal
transplant
patients
Toexam
ineassociations
ofBMI,
pretransplantSCras
asurrog
ate
markerof
musclemassandchanges
inweightwith
mortalityin
alarge
natio
nalcoho
rtof
transplant-
waitlisted
dialysispatients.
Transplantwaitlisted
hemod
ialysis
patientswith
lower
musclemass
and/or
unintentionalweigh
tor
muscle
loss
have
high
ermortality
inthisob
servationalstud
y.
SCr
Moreau-Gaudryet
al.[62],20
111,20
5MHD
patients
from
Europ
eToanalyzetheassociation
betweenSCrandmortality.
BMIshou
ldno
tbe
used
byitselfbu
tin
conjun
ctionwith
SCras
asurrog
ateof
LBM
toim
prov
eits
morbid-mortality
predictiv
epo
wer.
SCr>BMI
Walther
etal.[63],20
1281
Dialysispatients
Toanalyzetheassociationbetween
predialysisSCrandchange
inSCr
betweenmidweekdialysissessions
andnu
trition
almarkers
andmortality.
Predialysiscreatin
ineandinterdialytic
change
increatin
inearebo
thstrong
lyassociated
with
prox
iesof
nutrition
alstatus
andmortalityin
hemod
ialysis
patientsandarehigh
lycorrelated.
SCr
nPNANormalized
proteinnitrog
enappearance
J Cachexia Sarcopenia Muscle (2013) 4:19–29 25
(including for measures of nutritional status and inflamma-tion) [9]. In a sub-cohort of patients in whom change could beexamined, weight decline and serum creatinine decline in thesetting of stable dialysis dose (indicating muscle mass loss)were both associated with increased mortality, whereas a risein creatinine was associated with reduced mortality [9]. Con-cordant changes in these two body composition surrogatesalso predicted mortality, but analyses of discordant combina-tions indicated that creatinine (and thus presumably musclemass) had a stronger impact onmost patients in this cohort [9].
The above-referenced composite ranking score was also usedin waitlisted dialysis patients to assess associations of serumcreatinine with mortality [25]. Higher serum creatinine, as asurrogate of larger muscle mass, was independently and incre-mentally associated with greater survival in waitlisted dialysispatients even after extensive multivariate adjustment for avail-able surrogates of nutritional status and inflammation. Addition-ally, patients with high muscle mass and low body weightreported the best survival. The concordant combination of thechanges in these two body composition surrogates, if pointing inthe same direction, maintained the same graded death predict-ability [25]. In addition, in 10,090 kidney transplant recipientswith comprehensive pretransplant data as hemodialysis patients,who were followed for up to 6 years post-transplantation,higher pretransplant serum creatinine, a surrogate of musclemass, was associated with lower mortality and graft loss, inthat there was a 2.2-fold increased risk of combined death orgraft loss with the pretransplant serum creatinine<4 mg/dl,whereas a pretransplant serum creatinine≥14 mg/dl exhibited22 % greater graft and patient survival, when compared to thereference pretransplant serum creatinine of 8 to <10 mg/dl [26]. Oterdoom et al. [27] found similar results in 604renal transplant recipients. They found that lower creatinineexcretion as a measure of muscle mass was associated withmortality and graft loss after renal transplantation, indepen-dent of insulin resistance and its related factors [27].
5 Inaccuracies in kidney function estimation using serumcreatinine
Given the undeniable fact that serum creatinine co-variesclosely with the skeletal muscle mass, its utility in estimatingthe glomerular filtration rate (eGFR) using such equations asthe modification of diet in renal disease (MDRD) or ChronicKidney Disease Epidemiology Collaboration (CKD-EPI) maynot be an appropriate primary outcomemeasure when subjectsexhibit weight variations during a given study [28]. In a recentstudy by Pergola et al. [29], the eGFR by theMDRD equation,using serum creatinine and, was the primary outcome variable.It was argued that weight loss associated reduction in skeletalmuscle might have artificially increased eGFR in this study[30], although the investigators clarified that the weight loss in
the intervention group did not co-vary with serum creatinine[30]. In another study, weight loss in diabetic persons reducedserum creatinine from 2.0 to 1.5 mg/dl (P<0.05) [31], andeGFR increased by 13ml/min. In yet another study on obesity,an 8%weight loss increased eGFR by 8.9 ml/min by reducingserum creatinine [32]. Similarly fasting for Ramadhan in-creased eGFR likely due to loss of muscle [33]. Hence, muscleloss might be misrepresented as an improvement in renalfunction. A true creatinine clearance would be needed tosubstantiate true changes in GFR in such studies that examinerenal function as the main outcome measure.
6 Other biomarkers of muscle mass
6.1 Plasma gelsolin
Plasma gelsolin is a secreted high-molecular-weight actin-binding protein that normally circulates at 190–300 mg/l andis mainly produced and secreted by myocytes [34–38]. Thereare two different types of gelsolin, cytoplasmic isoform andplasma isoform [38]. Plasma gelsolin binds to actin and mayplay a role in innate immunity neutralizing exogenous bacte-rial lipid mediators such as lipopolysaccharide and lipotei-choic acid [39, 40]. Similarly to stem cell transplant patients[41], critically ill surgical patients [42], major trauma [43] andseptic patients [44], low plasma gelsolin is associated withincreased mortality in hemodialysis patients [36]. Assumingthe plasma gelsolin level is a marker of muscle mass inhemodialysis patients, the results of these observations sup-port previous findings that protein–energywasting has a majorrole in the mortality of ESRD patients [18, 45].
6.2 Circulating actin and myosin
A recent study by Lee et al. [36] imply that circulating actinis a potential surrogate of damaged muscle in dialysispatients and correlated with poor outcomes. As to whethercirculating myosin is a positive or negative correlate ofmuscle mass or whether any meaningful association existsremains to be seen in future studies.
6.3 Urinary creatinine
In individuals whose kidney function is in steady state and stillhave urine output, the 24-h urinary creatinine concentration isusually a reliable surrogate of skeletal muscle mass, althoughit may also co-vary with the amount of dietary meat intake[13, 46]. Recently, lower urinary creatinine excretion rate hasbeen shown to correlate with higher cardiovascular events andpoorer survival in a cohort of people with coronary arterydisease [3]. Ix et al. [46] have shown that urinary creatininecan be estimated with commonly available variables with little
26 J Cachexia Sarcopenia Muscle (2013) 4:19–29
bias and moderate precision. It is important to note that manydialysis patients have minimal to no urine output, so that theurine creatinine cannot be measured in this group of patient.
7 Biomarkers of dietary meat intake
Given a main origin of serum creatinine being skeletal muscle-based creatine, it has long been argued that ingestion of striatedmuscle in form of meat, chicken and fish can increase serumcreatinine level [47]. Hence, one cannot ignore the role ofstriated muscle ingestion, which is also rich in protein, in theforgoing discussion. This is especially the case in view of ourown previous publications that show that higher protein intakeand better nutritional status is associated with higher serumcreatinine levels and greater survival [48]. As one instance ofthis, we have already reported that greater appetite is positivelyassociated with survival in these hemodialysis patients [49].Greater appetite is most likely associated with greater ingestionof striated muscle, which can increase serum creatinine. Hence,when serum creatinine is used as a surrogate of muscle mass, itis important that dietary meat intake can be accounted for. Arecently published paper by Dragsted [50] has summarized themost important biomarkers of meat intake in healthy popula-tions [50]. We summarize the some of these markers in healthypatients and in ESRD patients.
7.1 Creatine
Creatine, the precursor of creatinine, is a nitrogenous organ-ic acid that occurs naturally in vertebrates and contributes toenergy supply to muscle cells (see Fig. 1). Creatine isproduced in the vertebrate body from amino acids L-argi-nine, glycine and L-methionine primarily in the kidney andliver. It is transported in the blood for use by muscle cells.Approximately 95 % of the human body’s total creatine islocated in skeletal muscle (Fig. 1). In humans, approximate-ly half of stored creatine originates from ingested meat. Inhealthy people, daily consumption of meat increases serumcreatine level [51]. Serum creatine would therefore seem tobe a promising marker for meat and fish intake, althoughcorrection for muscle mass measured by other techniqueswould be required for quantitative estimates [50]. However,we are unaware of any study examining creatine as a markerof meat intake in CKD or ESRD patients.
7.2 Carnitine
Serum carnitine level is lower in vegetarians [52] and inpatients on parenteral diet [53] than in omnivores, suggestingthat serum carnitine is a potential marker of meat intake.However, it is not clear that carnitine is a marker of meatintake in hemodialysis patients, in whom the supplementation
of carnitine may or may not have an impact on the cardiovas-cular system [54].
7.3 Carnosine
The dipeptide beta-alanyl-histidine (carnosine) is present inmuscle and nerve tissues in most vertebrates, although levelsare low in most kinds of fish. Since dietary intake of nervetissues is limited, carnosine might be a potential marker ofmuscle intake from animals, fish and shellfish [50, 55]. Sim-ilarly to other abovementioned markers, it is not knownwhether carnosine is a good marker of meat intake in ESRDpatients.
7.4 Ophidine and anserine
Anserine (beta-alanyl-1-methyl-L-histidine), a dipeptidesimilar to carnitine and ophidine, is present in skeletalmuscle from many types of vertebrate animals [55]. Humanmuscle does not contain anserine, which could therefore bea good candidate to measure meat intake in ESRD patients[56]. We are not aware of any study about the use of thesemarkers of meat intake in in the setting of renal dysfunction.
7.5 3-Methyl-L-histidine and 1-methylhistidine
Another potential marker of dietary meat intake is 1-methylhistidine which has a long elimination half-life inhealthy persons (17 h) and could therefore serve as a goodmarker of meat intake from the past several days prior to itslevel measurement [57, 58].Moreover, 3-methyl-L-histidineis a degradation product of actin and myosin, the majorcomponents of meat. As 3-methyl-L-histidine can originatefrom endogenous muscle sources, it would be an unreliablemarker of meat intake [59].There are currently no dataregarding the role of these molecules as markers of meatintake in CKD or ESRD patients.
8 Conclusions
Serum creatinine is a reliable, cheap, and easily accessiblemarker of muscle mass in stable chronic dialysis patients.Using serum creatinine as a surrogate marker of skeletalmuscle mass, it has been proven that muscle mass is animportant predictor of survival in dialysis patients. Whileseveral new biomarkers have been proposed as surrogatemarkers of muscle mass, currently, there is not enoughevidence to support the clinical use of these molecules forthis purpose. By simultaneously measuring serum creati-nine, another kidney filtration marker (such as Cystatin C)and a dietary meat intake marker, we should be able todevelop equations that can reliably estimate total muscle
J Cachexia Sarcopenia Muscle (2013) 4:19–29 27

mass in both healthy people and patients with chronic dis-ease states. Our research groups is currently engaged indeveloping such approaches, given the importance of bothquality and quantity of skeletal muscle mass and emergingpharmaceutical interventions to module and improve musclestatus in health and disease.
Acknowledgement We thank DaVita Clinical Research for provid-ing the clinical data, analysis and review for this research project. Theauthors of this manuscript certify that they comply with the ethicalguidelines for authorship and publishing in the Journal of Cachexia,Sarcopenia and Muscle [64].
Funding Sources This study was supported by KKZ’s research grantsfrom the National Institutes of Health, National Institute of Diabetes,Digestive and Kidney Disease grant R01-DK078106, R21-DK078012and K24-DK091419; a research grant from DaVita; a General ClinicalResearch Center grant # M01-RR00425 from the National Centers forResearch Resources, National Institutes of Health; and a philanthropicgrant from Mr. Harold C. Simmons. MZM received grants from theNational Developmental Agency (KTIA-OTKA-EU 7KP-HUMAN-MB08-A-81231) from the Research and Technological Innovation Fund,and is recipient of the Hungarian Eötvös Scholarship (MÖB/77-2/2012).
Conflict of Interests None
References
1. Kamimura MA, Avesani CM, Cendoroglo M, Canziani ME,Draibe SA, Cuppari L. Comparison of skinfold thicknesses andbioelectrical impedance analysis with dual-energy X-ray absorpti-ometry for the assessment of body fat in patients on long-termhaemodialysis therapy. Nephrol Dial Transplant. 2003;18:101–5.
2. Lee RC, Wang Z, Heo M, Ross R, Janssen I, Heymsfield SB.Total-body skeletal muscle mass: development and cross-validation of anthropometric prediction models. Am J Clin Nutr.2000;72:796–803.
3. Ix JH, de Boer IH, Wassel CL, Criqui MH, Shlipak MG, WhooleyMA. Urinary creatinine excretion rate and mortality in personswith coronary artery disease: the heart and soul study. Circulation.2010;121:1295–303.
4. Noori N, Kopple JD, Kovesdy CP, Feroze U, Sim JJ, Murali SB, etal. Mid-arm muscle circumference and quality of life and survivalin maintenance hemodialysis patients. Clin J Am Soc Nephrol.2010;5:2258–68.
5. Donadio C, Halim AB, Caprio F, Grassi G, Khedr B, MazzantiniM. Single- and multi-frequency bioelectrical impedance analysesto analyse body composition in maintenance haemodialysispatients: comparison with dual-energy X-ray absorptiometry.Physiol Meas. 2008;29:S517–24.
6. Negri AL, Barone R, Veron D, Fraga A, Arrizurieta E, Zucchini A,et al. Lean mass estimation by creatinine kinetics and dual-energyX-ray absorptiometry in peritoneal dialysis. Nephron Clin Pract.2003;95:c9–14.
7. Schutte JE, Longhurst JC, Gaffney FA, Bastian BC, BlomqvistCG. Total plasma creatinine: an accurate measure of total striatedmuscle mass. J Appl Physiol. 1981;51:762–6.
8. Keshaviah PR, Nolph KD, Moore HL, Prowant B, Emerson PF,Meyer M, et al. Lean body mass estimation by creatinine kinetics.J Am Soc Nephrol. 1994;4:1475–85.
9. Kalantar-Zadeh K, Streja E, Molnar MZ, Lukowsky LR, KrishnanM, Kovesdy CP, et al. Mortality prediction by surrogates of bodycomposition: an examination of the obesity paradox in hemodial-ysis patients using composite ranking score analysis. Am J Epi-demiol. 2012;175:793–803.
10. Kalantar-Zadeh K, Streja E, Kovesdy CP, Oreopoulos A, Noori N,Jing J, et al. The obesity paradox and mortality associated withsurrogates of body size and muscle mass in patients receivinghemodialysis. Mayo Clinic Proc. 2010;85:991–1001.
11. Noori N, Kovesdy CP, Dukkipati R, Kim Y, Duong U, Bross R, etal. Survival predictability of lean and fat mass in men and womenundergoing maintenance hemodialysis. Am J Clin Nutr. 2010;92:1060–70.
12. Noori N, Kovesdy CP, Bross R, Lee M, Oreopoulos A, Benner D,et al. Novel equations to estimate lean body mass in maintenancehemodialysis patients. Am J Kidney Dis. 2011;57:130–9.
13. Heymsfield SB, Arteaga C, McManus C, Smith J, Moffitt S.Measurement of muscle mass in humans: validity of the 24-hoururinary creatinine method. Am J Clin Nutr. 1983;37:478–94.
14. Colman S, Bross R, Benner D, Chow J, Braglia A, Arzaghi J, et al.The nutritional and inflammatory evaluation in dialysis patients(NIED) study: overview of the NIED study and the role of dieti-tians. J Ren Nutr. 2005;15:231–43.
15. Rambod M, Kovesdy CP, Bross R, Kopple JD, Kalantar-Zadeh K.Association of serum prealbumin and its changes over time withclinical outcomes and survival in patients receiving hemodialysis.Am J Clin Nutr. 2008;88:1485–94.
16. Kalantar-Zadeh K, Kopple JD, Kamranpour N, Fogelman AM,Navab M. HDL-inflammatory index correlates with poor outcomein hemodialysis patients. Kidney Int. 2007;72:1149–56.
17. Bross R, Zitterkoph J, Pithia J, Benner D, Rambod M, KovesdyCP, et al. Association of serum total iron-binding capacity and itschanges over time with nutritional and clinical outcomes in hemo-dialysis patients. Am J Nephrol. 2009;29:571–81.
18. Rambod M, Bross R, Zitterkoph J, Benner D, Pithia J, Colman S,et al. Association of Malnutrition-Inflammation Score with qualityof life and mortality in hemodialysis patients: a 5-year prospectivecohort study. Am J Kidney Dis. 2009;53:298–309.
19. Shantouf R, Kovesdy CP, Kim Y, Ahmadi N, Luna A, Luna C, etal. Association of serum alkaline phosphatase with coronary arterycalcification in maintenance hemodialysis patients. Clin J Am SocNephrol. 2009;4:1106–14.
20. Rambod M, Kovesdy CP, Kalantar-Zadeh K. Malnutrition-Inflammation Score for risk stratification of patients with CKD:is it the promised gold standard? Nat Clin Pract Nephrol.2008;4:354–5.
21. Rambod M, Kovesdy CP, Kalantar-Zadeh K. Combined high se-rum ferritin and low iron saturation in hemodialysis patients: therole of inflammation. Clin J Am Soc Nephrol. 2008;3:1691–701.
22. Raj, DS, Shah, VO, Rambod, M, Kovesdy, CP, Kalantar-Zadeh, K.Association of soluble endotoxin receptor CD14 and mortalityamong patients undergoing hemodialysis. Am J Kidney Dis.2009 [e-published Sep 2009].
23. About DCI—Introduction. In: DCI Dialysis Clinic Inc homepage(http://www.diciinc.org); 2001–2002. Nashville, TN: DialysisClinic.
24. Oterdoom LH, Gansevoort RT, Schouten JP, de Jong PE, Gans RO,Bakker SJ. Urinary creatinine excretion, an indirect measure ofmuscle mass, is an independent predictor of cardiovascular diseaseand mortality in the general population. Atherosclerosis.2009;207:534–40.
25. Molnar MZ, Streja E, Kovesdy CP, Bunnapradist S, Sampaio MS,Jing J, Krishnan M, Nissenson AR, Danovitch GM, Kalantar-Zadeh K. Associations of body mass index and weight loss withmortality in transplant-waitlisted maintenance hemodialysispatients. Am J Transplant: official journal of the American Society
28 J Cachexia Sarcopenia Muscle (2013) 4:19–29

of Transplantation and the American Society of Transplant Sur-geons. 2011;11:725–36.
26. Streja E,MolnarMZ,Kovesdy CP, Bunnapradist S, Jing J, NissensonAR, et al. Associations of pretransplant weight and muscle mass withmortality in renal transplant recipients. Clin J Am Soc Nephrol.2011;6:1463–73.
27. Oterdoom LH, van Ree RM, de Vries AP, Gansevoort RT, SchoutenJP, van Son WJ. Homan van der Heide, JJ, Navis, G, de Jong, PE,Gans, RO, Bakker, SJ. Urinary creatinine excretion reflecting musclemass is a predictor of mortality and graft loss in renal transplantrecipients. Transplantation. 2008;86:391–8.
28. Kalantar-Zadeh, K, Amin, AN. Toward more accurate detection andrisk stratification of chronic kidney disease. JAMA. 2012;307(18):1976–7.
29. Pergola PE, Raskin P, Toto RD, Meyer CJ, Huff JW, GrossmanEB, et al. Bardoxolone methyl and kidney function in CKD withtype 2 diabetes. N Engl J Med. 2011;365:327–36.
30. Rogacev KS, Bittenbring JT, Fliser D. Bardoxolone methyl, chronickidney disease, and type 2 diabetes. N Engl J Med. 2011;365:1745–6. author reply 1746–7.
31. Saiki A, Nagayama D, Ohhira M, Endoh K, Ohtsuka M, Koide N,et al. Effect of weight loss using formula diet on renal function inobese patients with diabetic nephropathy. Int J Obes (London).2005;29:1115–20.
32. Straznicky NE, Grima MT, Lambert EA, Eikelis N, Dawood T,Lambert GW, et al. Exercise augments weight loss induced im-provement in renal function in obese metabolic syndrome individ-uals. J Hypertens. 2011;29:553–64.
33. Bernieh B, Al Hakim MR, Boobes Y, Abu Zidan FM. FastingRamadan in chronic kidney disease patients: clinical and biochem-ical effects. Saudi J Kidney Dis Transplant: an official publicationof the Saudi Center for Organ Transplantation. Saudi Arabia.2010;21:898–902.
34. Kwiatkowski DJ, Mehl R, Izumo S, Nadal-Ginard B, Yin HL.Muscle is the major source of plasma gelsolin. J Biol Chem.1988;263:8239–43.
35. Kwiatkowski DJ, Stossel TP, Orkin SH, Mole JE, Colten HR, Yin HL.Plasma and cytoplasmic gelsolins are encoded by a single gene andcontain a duplicated actin-binding domain. Nature. 1986;323:455–8.
36. Lee PS, Sampath K, Karumanchi SA, Tamez H, Bhan I, Isakova T,et al. Plasma gelsolin and circulating actin correlate with hemodi-alysis mortality. J Am Soc Nephrol. 2009;20:1140–8.
37. Kwiatkowski DJ, Mehl R, Yin HL. Genomic organization andbiosynthesis of secreted and cytoplasmic forms of gelsolin. J CellBiol. 1988;106:375–84.
38. Lee PS, Bhan I, Thadhani R. The potential role of plasma gelsolin indialysis-related protein–energy wasting. Blood Purif. 2010;29:99–101.
39. Bucki R, Byfield FJ, Kulakowska A, McCormick ME, DrozdowskiW, Namiot Z, et al. Extracellular gelsolin binds lipoteichoic acid andmodulates cellular response to proinflammatory bacterial wall com-ponents. J Immunol. 2008;181:4936–44.
40. Bucki R, Georges PC, Espinassous Q, Funaki M, Pastore JJ, ChabyR, et al. Inactivation of endotoxin by human plasma gelsolin. Bio-chemistry. 2005;44:9590–7.
41. DiNubile MJ, Stossel TP, Ljunghusen OC, Ferrara JL, Antin JH.Prognostic implications of declining plasma gelsolin levels afterallogeneic stem cell transplantation. Blood. 2002;100:4367–71.
42. Lee PS, Drager LR, Stossel TP, Moore FD, Rogers SO. Relationshipof plasma gelsolin levels to outcomes in critically ill surgical patients.Ann Surg. 2006;243:399–403.
43. Mounzer KC, Moncure M, Smith YR, Dinubile MJ. Relationship ofadmission plasma gelsolin levels to clinical outcomes in patients aftermajor trauma. Am J Respir Crit Care Med. 1999;160:1673–81.
44. Lee PS, Patel SR, Christiani DC, Bajwa E, Stossel TP, WaxmanAB. Plasma gelsolin depletion and circulating actin in sepsis: apilot study. PloS One. 2008;3:e3712.
45. Molnar MZ, Czira ME, Rudas A, Ujszaszi A, Lindner A, FornadiK, et al. Association of the malnutrition–inflammation score withclinical outcomes in kidney transplant recipients. Am J KidneyDis. 2011;58:101–8.
46. Ix JH, Wassel CL, Stevens LA, Beck GJ, Froissart M, Navis G, etal. Equations to estimate creatinine excretion rate: the CKD epi-demiology collaboration. Clin J Am Soc Nephrol. 2011;6:184–91.
47. Preiss DJ, Godber IM, Lamb EJ, Dalton RN, Gunn IR. Theinfluence of a cooked-meat meal on estimated glomerular filtrationrate. Ann Clin Biochem. 2007;44:35–42.
48. Shinaberger CS, Kilpatrick RD, Regidor DL, McAllister CJ,Greenland S, Kopple JD, et al. Longitudinal associations betweendietary protein intake and survival in hemodialysis patients. Am JKidney Dis. 2006;48:37–49.
49. Kalantar-Zadeh K, Block G, McAllister CJ, Humphreys MH,Kopple JD. Appetite and inflammation, nutrition, anemia, andclinical outcome in hemodialysis patients. Am J Clin Nutr.2004;80:299–307.
50. Dragsted LO. Biomarkers of meat intake and the application ofnutrigenomics. Meat Sci. 2010;84:301–7.
51. Delanghe J, De Slypere JP, De Buyzere M, Robbrecht J, Wieme R,Vermeulen A. Normal reference values for creatine, creatinine, andcarnitine are lower in vegetarians. Clin Chem. 1989;35:1802–3.
52. Krajcovicova-Kudlackova M, Simoncic R, Bederova A, BabinskaK, Beder I. Correlation of carnitine levels to methionine and lysineintake. Physiol Res. 2000;49:399–402.
53. Dahlstrom KA, Ament ME, Moukarzel A, Vinton NE, CederbladG. Low blood and plasma carnitine levels in children receivinglong-term parenteral nutrition. J Pediat Gastroenterol Nutr.1990;11:375–9.
54. MolyneuxR, Seymour AM, Bhandari S. Value of carnitine therapy inkidney dialysis patients and effects on cardiac function from humanand animal studies. Curr Drug Targets. 2012;13:285–93.
55. Undrum T, Lunde H, Gjessing LR. Determination of ophidine inhuman urine. J Chromatogr. 1982;227:53–9.
56. Christman AA. Determination of anserine, carnosine, and other histi-dine compounds in muscle extractives. Anal Biochem. 1971;39:181–7.
57. Abe H, Okuma E, Sekine H, Maeda A, Yoshiue S. Human urinaryexcretion of L-histidine-related compounds after ingestion of sev-eral meats and fish muscle. Int J Biochem. 1993;25:1245–9.
58. Sjolin J, Hjort G, Friman G, Hambraeus L. Urinary excretion of 1-methylhistidine: a qualitative indicator of exogenous 3-methylhistidineand intake of meats from various sources. Metab Clin Exp.1987;36:1175–84.
59. Rennie MJ, Phillips S, Smith K. Reliability of results and inter-pretation of measures of 3-methylhistidine in muscle interstitiumas marker of muscle proteolysis. J Appl Physiol. 2008;105:1380–1. author reply 1382–3.
60. Heimburger O, Qureshi AR, Blaner WS, Berglund L, Stenvinkel P.Hand-grip muscle strength, lean body mass, and plasma proteins asmarkers of nutritional status in patients with chronic renal failureclose to start of dialysis therapy. Am JKidney Dis. 2000;36:1213–25.
61. Kaizu Y, Ohkawa S, Kumagai H. Muscle mass index in haemo-dialysis patients: a comparison of indices obtained by routineclinical examinations. Nephrol Dial Transplant. 2002;17:442–8.
62. Moreau-Gaudry X, Guebre-Egziabher F, Jean G, Genet L, LatailladeD, Legrand E, et al. Serum creatinine improves body mass indexsurvival prediction in hemodialysis patients: a 1-year prospectivecohort analysis from the ARNOS study. J Ren Nutr. 2011;21:369–75.
63. Walther CP, Carter CW, Low CL, Williams P, Rifkin DE, SteinerRW, et al. Interdialytic creatinine change versus predialysis creat-inine as indicators of nutritional status in maintenance hemodialy-sis. Nephrol Dial Transplant. 2012;27:771–6.
64. von Haehling S, Morley JE, Coats AJ, Anker SD. Ethical guidelinesfor authorship and publishing in the Journal of Cachexia, Sarcopeniaand Muscle. J Cachexia Sarcopenia Muscle. 2010;1:7–8.
J Cachexia Sarcopenia Muscle (2013) 4:19–29 29
Copyright © 2022 FDOKUMEN