Serial analysis of 38 proteins during the progression of human breast tumor in mice using an...
41
Protein Time Course in a Cancer Mouse Model 1 Serial analysis of 38 proteins during the progression of human breast tumor in mice using an antibody colocalization microarray Huiyan Li a,b , Sébastien Bergeron a,b , Matthew G. Annis c , Peter M. Siegel c , David Juncker a,b,d a Biomedical Engineering Department, b McGill University and Genome Quebec Innovation Centre, c Rosalind and Morris Goodman Cancer Research Centre, d Department of Neurology and Neurosurgery, McGill University, Montréal, QC, H3A 0G1, Canada *To whom correspondence should be addressed. E-mail [email protected] MCP Papers in Press. Published on February 13, 2015 as Manuscript M114.046516 Copyright 2015 by The American Society for Biochemistry and Molecular Biology, Inc.
Transcript of Serial analysis of 38 proteins during the progression of human breast tumor in mice using an...

Protein Time Course in a Cancer Mouse Model
1
Serial analysis of 38 proteins during the progression of human breast
tumor in mice using an antibody colocalization microarray
Huiyan Lia,b, Sébastien Bergeron
a,b, Matthew G. Annis
c, Peter M. Siegel
c, David Juncker
a,b,d
aBiomedical Engineering Department,
bMcGill University and Genome Quebec Innovation
Centre, cRosalind and Morris Goodman Cancer Research Centre,
dDepartment of Neurology
and Neurosurgery, McGill University, Montréal, QC, H3A 0G1, Canada
*To whom correspondence should be addressed. E-mail:[email protected]
MCP Papers in Press. Published on February 13, 2015 as Manuscript M114.046516
Copyright 2015 by The American Society for Biochemistry and Molecular Biology, Inc.

Protein Time Course in a Cancer Mouse Model
2
List of abbreviations
ACM Antibody Colocalization Microarray
ELISA Enzyme-Linked Immunosorbent Assay
PBS Phosphate Buffered Saline
BSA Bovine Serum Albumin
PBST Phosphate Buffered Saline containing 0.1% Tween-20
SD Standard Deviation
dAb detection Antibody
cAb capture Antibody
LOD Limit Of Detection

Protein Time Course in a Cancer Mouse Model
3
Summary
Proteins in serum or plasma hold great potential for use in disease diagnosis and
monitoring. However the correlation between tumor burden and protein biomarker
concentration has not been established. Here, using an antibody colocalization microarray,
the protein concentration in serum was measured and compared with the size of
mammary xenograft tumors in 11 individual mice from the time of injection; 7 blood
samples were collected from each tumor-bearing mouse as well as control mice on a
weekly basis. The profiles of 38 proteins detected in sera from these animals were
analyzed by clustering and we identified 10 proteins with the greatest relative increase in
serum concentration that correlated with growth of the primary mammary tumor. To
evaluate the diagnosis of cancer based on these proteins using either an absolute
threshold (i.e. a concentration cutoff) or self-referenced differential threshold based on
the increase in concentration before cell injection, ROC curves were produced for 10
proteins with increased concentration, and the AUC calculated for each time-point, based
on a single protein or on a panel of proteins, in each case showing a rapid increase of the
AUC. Next, the sensitivity and specificity of individual and optimal protein panels were
calculated, showing high accuracy as early as week 2. These results provide a foundation
for studies of tumor growth through measuring serial changes of protein concentration in
animal models.

Protein Time Course in a Cancer Mouse Model
4
Introduction
Proteins in blood have long been used as biomarkers for cancer disease management (1,
2). Proteins up-regulated in cancer cells may be found at higher concentration in blood
and their use for disease prognosis and response to therapy is well established (3). For
example, CA-125 has been used as a biomarker to monitor the tumor progression and
treatment response of ovarian cancer (4). The prospect of screening and diagnosing
cancer based on the detection of blood-based biomarkers has generally not been fulfilled.
Compared to single point detection, time course analysis of biomarkers in serially
collected samples can improve the accuracy of biomarker detection and is notably used to
help diagnose prostate cancer in man using PSA, and is widely used to evaluate
progression of tumors.
Recently, Gambhir and colleagues proposed a mathematical model relating secreted
blood biomarker levels to tumor sizes for ovarian cancer (5, 6). Lutz et al. proposed a
first model with protein excretion into circulation assumed to be proportional to tumor
volume, and a fixed half-life, finding that protein concentration is linearly correlated with
tumor size (5). Later Hori et al. improved the model by incorporating dynamic protein
levels over time and also considering protein secretion from non-tumor tissues as
confounding factors (6). Their model was used to predict the earliest time point at which
a tumor could be detected based on estimates about growth and excretion rates of tumors.
The authors studied CA-125, an FDA-approved biomarker for ovarian cancer, and used

Protein Time Course in a Cancer Mouse Model
5
the excretion rates and half-life available from the literature. They found that when
considering the contribution of healthy cells to the CA-125 concentration in serum,
tumors could only be detected when they reach tens of millimeters in diameter, which
based on known tumor growth rates, would be more than 10 years after initiation (6).
While this study provided a framework for the analysis of blood-based protein
biomarkers and disease progression, experimental validation is missing, and notably
individual variation and the fluctuations of protein excretion over time were not
considered in the model.
Mouse models have long been used in cancer research and notably to study breast cancer
protein biomarkers (7). Transgenic mice as well as human cancer xenografted into mice
have been exploited to uncover circulating cancer-related proteins and tumor cells (8-13).
Time course analysis can improve the accuracy of biomarkers and help evaluate the
course of cancer progression. One challenge to time course studies in mice is that at most
50-100 µL of blood can be collected weekly without causing harm to the animals, which
upon processing, translates to only 20-40 µL of plasma. This small volume is insufficient
for many analytical methods, and makes multiplex analysis even more challenging.
Previous longitudinal studies either sacrificed individual mice at each time point to
extract all the blood at once, or pooled the blood extracted from many mice resulting in
the loss of information of individual subjects over time. Recently, a transgenic mouse
model was used to characterize the change in plasma proteome at different stages of

Protein Time Course in a Cancer Mouse Model
6
breast tumor development (14). Plasma samples were collected from tumor-bearing and
control mice at 3 tumor stages and during tumor regression, and the plasma pools from
5-11 mice were measured using mass spectrometry. The plasma proteins that changed in
abundance were grouped by their involvement in a number of physiologic processes such
as wound repair and immune response, and many of them were found to be tumor
microenvironment-derived proteins. However, individual variations could not be studied.
Measuring proteins in blood at concentrations that are relevant for biomarker discovery
remains a technological challenge. Arguably the most popular proteomics technology is
mass spectrometry; however, it suffers from a bias towards high abundance molecules
that mask low abundance ones. The enzyme-linked immunosorbent assay (ELISA) and
more specifically sandwich immunoassays constitute the gold standard when it comes to
detecting proteins at very low concentrations in samples such as serum or plasma (15).
These assay formats have been multiplexed in the form of antibody microarrays and
bead-based assays and used to detect proteins in small volumes of blood (16-19).
However, multiplexing has a negative impact and can severely compromise assay
performance because it increases vulnerability to cross-reactivity among the proteins
measured and the mixture of reagents required for these assays, limiting the multiplexed
sandwich assays to between 1 - 50 targets depending on the antibodies (20, 21). New
assay formats that address this reagent-driven cross-reactivity have been developed (21),
and we recently presented an antibody colocalization microarray (ACM) that replicates

Protein Time Course in a Cancer Mouse Model
7
the performance of single-plex ELISA while being multiplexed and scalable (20). With
the ACM, Capture antibodies (cAbs) are arrayed on a slide and each detection antibody
(dAb) is spotted on the antigen-cAb spot, such that only a single pair of antibodies is used
in each micro-spot, thus avoiding reagent –driven cross-reactivity (21) caused by mixing
of the different dAbs . Moreover, we presented a hand-held version of the ACM using a
so-called snap chip transferring pre-spotted and stored antibodies from
microarray-to-microarray, which avoids the spotting procedure during an assay thus
greatly simplifying the operation, and was used to measure 10 proteins simultaneously
(22).
In this work, we present a temporal analysis of protein concentration in the serum of
individual tumor-bearing mice by measuring 50 proteins using a snap chip ACM. Human
MDA-MB-231-1833TR breast cancer cells, which are representative of the triple
negative breast cancer subtype, were injected orthotopically into mice, and blood was
collected each week while recording tumor volume. Among the 50 human proteins
analyzed, 38 were detected in the serum of tumor-bearing mice and 10 of these displayed
a temporal increase. Protein concentration and tumor size were compared, and the
proteins that increased the most during tumor growth were identified. Candidate
biomarkers to discriminate between tumor-bearing and healthy mice were validated at
each time point after cancer cell injection using ROC curves based on either (i) an
absolute threshold or on (ii) a self-referred differential methods. The earliest time point at

Protein Time Course in a Cancer Mouse Model
8
which cancer could be diagnosed was evaluated for both individual proteins and selected
protein panels, and the sensitivity and specificity of both methods were compared for
different time points of tumor growth.
Experimental Procedures
Materials
Matched antibody pairs for sandwich immunoassays and human antigens used in this
study are listed in SI Table 1. G-CSF and GM-CSF mouse antigens were purchased from
Pepro Tech, TNF-RI mouse antigens were from R&D Systems. Streptavidin-conjugated
Cy 5 was purchased from Rockland. Phosphate buffered saline (PBS) tablets were
obtained from Fisher Scientific. Tween-20 and glycerol were purchased from
Sigma-Aldrich. Bovine serum albumin (BSA) was obtained from Jackson
ImmunoResearch Laboratories, Inc. BSA-free StabilGuard Choice Microarray Stabilizer
was purchased from SurModics, Inc. Aminosilane coated slides were obtained from
Schott North America, and nitrocellulose coated slides were purchased from Grace
Bio-Laboratories, Inc. ELISA kits for Human G-CSF and human sTNF RI/TNFRSF1A
were purchased from R&D Systems.
Injection of cancer cells into mice and collection of mouse sera
All animal experiments were conducted according to the protocol approved by McGill
University Animal Care Committee. One million MDA-MB-231-1833TR cells (an

Protein Time Course in a Cancer Mouse Model
9
MDA-MB-231 variant that metastasizes to bone (23)) were injected into the fourth
mammary fat pad of SCID/beige mice in 50:50 PBS:Matrigel (Becton Dickinson). Blood
samples were collected through saphenous vein one week prior to and weekly following
the injection of tumors cells. All mice were over 20 g, which allowed us to collect 100 µL
blood per mouse maximum per week, corresponding to 15-40 µL of serum depending on
the collection volumes. At the end of the study, the mice were sacrificed and their blood
was collected. Serum was isolated by centrifugation of blood samples in microcuvette
tubes (Sarstedt), and the isolated sera were stored at -80 °C for further analysis.
Measurement and calculation of tumor volumes
In this study we measured the length and width of the tumors at each time point using a
caliper and calculated the tumor volume with an ellipsoid model (24).
Preparation of capture and detection antibody microarrays on slides
cAb solutions with 20% glycerol and 1% BSA in PBS were spotted on an aminosilane
slide, 0.4 nL per spot, and snapped with a nitrocellulose slide (assay slide) using the snap
apparatus for 1 min, then separated and the antibody spots were transferred to the
nitrocellulose slide. dAb solutions containing 20% glycerol and 1% BSA in PBS were
printed on another aminosilane slide (dAb slide) with 0.8 nL per spot. The concentrations
of the cAbs and the dAbs in printing buffers are listed in SI Table 1. An inkjet spotter
(Nanoplotter 2.0, GeSiM) was used for printing at a relative humidity of 80%. The

Protein Time Course in a Cancer Mouse Model
10
center-to-center distance between spots was 400 µm.
The transfer slides and the assay slides were fixed in two chucks of a snap apparatus and
snapped together for antibody transfer. A rubber cushion was used behind each slide and
a spacer was sandwiched between the two slides to ensure reliable reagent transfer (22).
After snapping, the assay slide with transferred cAbs was incubated at 4 °C for overnight
in a sealed chamber and then washed 3 times with PBS containing 0.1% Tween-20
(PBST) for 5 min each time on the shaker at 450 rpm. Next, the slide was blocked with
StabilGuard for 1 hour on the shaker at 450 rpm, and dried with nitrogen gas.
Storage of the snap chip slides
Both the assay and dAb slides were stored in a -20°C freezer sealed in an airtight bag
with desiccant.
Sandwich immunoassays with 50 proteins
Sealed bags of assay slides were removed from the freezer and kept at room temperature
for 30 min before opening to avoid condensation. To make standard curves 50 proteins
were spiked in PBS containing 0.05% Tween-20, at the concentrations listed in SI Table 1,
and five-fold, seven-point dilution series were prepared. A buffer solution without any
proteins was also prepared as a blank control. All mouse serum samples were diluted 5
times using PBS containing 0.05% Tween-20. GFP was used in each array for data

Protein Time Course in a Cancer Mouse Model
11
normalization. The assay slides were clamped with 16-compartment slide module gaskets
(Grace Bio-Laboratories, Inc) and then 75-80 µL of each serial diluted standard protein
solutions and diluted mouse serum samples were incubated on the assay slides on the
shaker at 450 rpm at 4°C for overnight. The slides were then rinsed 3 times with PBST on
the shaker at 450 rpm for 5 min each time, followed by a brief rinse with distilled water
and dried with nitrogen gas. The sealed bags of dAb slides were removed from the freezer,
kept at room temperature for 30 min, and then the bags were opened and the dAb slides
were incubated in a humidity saturated petri-dish for 20 min to rehydrate glycerol
droplets containing antibodies. Next, the assay and the dAb slides were fixed in the snap
apparatus and snapped together for 1 min. Following separation the assay slides were
incubated in a humidified petri-dish for 1 hour and then clamped with the gasket and
rinsed 4 times with PBST on the shaker at 450 rpm for 5 min. The assay slides were then
incubated with 2.5 µg/mL of streptavidin conjugated Cy 5 for 20 min on the shaker at
450 rpm, and then rinsed 3 times with PBST on the shaker and once with distilled water,
and dried using nitrogen gas.
Scanning of the slides and data analysis
The slides were scanned using a microarray laser scanner (Axon GenePix 4000B) with
the 635 nm laser. The net fluorescent intensity of a spot was extracted using Array-Pro
Analyzer version 4.5 (Media Cybernetics) by subtracting the background signal in the
vicinity of each spot.

Protein Time Course in a Cancer Mouse Model
12
Heat maps were produced using the Spearman’s rank correlation coefficient between the
protein levels. For each of the 7 time points, the rank was computed for each protein, and
the absolute difference between each Spearman coefficient was used to determine the
similarity matrix for hierarchical clustering analysis. Z-score represents the distance
between a data point and the mean in units of the standard deviation.
For all top ranked 10 proteins the concentration for all the 14 mice at 7 time points were
normalized between 0 and 1, using the formula�����(�)
��(�)����(�). In the absolute threshold
method, the disease cohort consisted of the 11 tumor-bearing mice and the blood
concentration of the proteins at that specific time point. The control values for each time
point consisted of the concentration of proteins from 3 control mice at 7 time points,
adding up to 21 “controls”. This control cohort was used both for ROC calculation and
for calculating the sensitivity and specificity described further below. In the differential
method, for each disease and each control mice, the (normalized) average concentration
from weeks -1 & 0 were subtracted from the concentration at each time point. For ROC
curve calculation, the control cohort was comprised of the concentration value for each of
the 3 control mice; there were thus 3 controls for each of the 5 specific time points. ROC
curves were calculated and plotted using GraphPad Prism 6 (GraphPad Software).
For the time course analysis, the sensitivity and specificity of individual proteins and a

Protein Time Course in a Cancer Mouse Model
13
protein panel were calculated for both the absolute threshold and differential method for
each week. The 6 proteins whose AUC values are highest in week 3 using either absolute
or differential methods were selected for time course analysis. For the absolute threshold
method, the threshold for a positive diagnostic was defined as a measurement higher than
the average plus two standard deviation of the 21 controls. For the differential
self-referenced method, the threshold for positive diagnostic was defined as a
concentration above the average of weeks – 1 & 0 (for the same mice) plus two times the
average of the standard deviations that were calculated from the 7 time points for the
three control mice. For a protein panel, the same aforementioned calculation method was
applied to each protein first and then either the averaged threshold or averaged baseline
was used. Sensitivity was defined as the true positive rate, and specificity as the true
negative rate.
Results
Fabrication of antibody microarrays
The procedure for making antibody microarrays and performing the multiplex
immunoassay in an ACM format with a snap chip (22) is illustrated in Fig. 1. In ACMs,
each detection antibody (dAb) is delivered only to the corresponding capture antibody
(cAb) spot, thus avoiding cross-reactivity and false positive signals. Whereas previously
only one snap and transfer was performed (22), we implemented a novel “double transfer”
protocol that we recently developed to improve the alignment between cAb and dAb

Protein Time Course in a Cancer Mouse Model
14
microarrays.1 Briefly, whereas previously only the dAbs were transferred to the assay
slide by snapping, here both cAb and dAb microarrays are transferred to minimize
misalignment and thus increase the density of spots that may be transferred, Fig. 1. We
established a snap chip targeting 50 human proteins, SI Table 1, comprising cancer
biomarkers, cancer related proteins and cytokines. For all assays, standard curves were
established for each target protein.
Validation of the snap chip immunoassay
To assess whether the assays effectively discriminate between the human proteins
secreted by the xenograft tumor from mouse proteins, the interspecies cross-reactivity
was assessed. Cross-reactivity to mouse proteins was not expected as the antibody pairs
we used were produced in mice (25), but we nonetheless tested it experimentally for three
recombinant mouse proteins, G-CSF, GM-CSF, TNF-RI. Binding of mouse proteins was
undetectable up to the maximal assay concentration of 400 ng/mL, indicating that the
antibodies are indeed specific for human proteins.
Next, we compared the snap chip immunoassay to a commercial ELISA for G-CSF and
TNF-RI. These two proteins were measured in 16 mice serum samples comprising 14
sera collected at the end of the study and 2 samples of mixed mice serum samples from
1 Li, H., Munzar, J.D., Ng, A., Juncker, D. (2015) A versatile snap chip for high-density sub-nanoliter chip-to-chip
reagent transfer. Submitted manuscript.

Protein Time Course in a Cancer Mouse Model
15
earlier time points (for more details see below). Duplicate measurements of each sample
were made for both snap chip and ELISA, SI Fig. 1. The correlation, r, for G-CSF and
TNF-RI proteins was 0.94 and 0.82, respectively. The slope of the curve for G-CSF was
0.97, while it was 1.5 for TNF-RI. Such differences are commonly observed for
immunoassays (26, 27). This discrepancy might be due to different antibody clones used
in the two methods although they were purchased from the same vendor, or the use of
different buffers imposed by the use of the snap chip and of a mixture of the proteins for
the dilution series. We don’t expect this difference to affect the results of the time course
measurements as relative changes are assessed.
Serum protein levels measured during the growth of primary mammary tumor
xenografts in mice
Human triple-negative breast cancer cells (MDA-MB-231-1833TR) were injected into
the mammary pad of 11 mice while matrigel devoid of breast cancer cells was injected
into 3 control mice. Tumors grew in all 11 mice and were measured weekly starting at
week 2, the first time point at which they were palpable. Initial blood samples were
collected 1 week and ∼1 hour before cell injection, and then on a weekly basis starting on
the second week. In total, 7 samples were collected from each mouse, adding up to 98
samples in total. The concentrations of the 50 proteins in each sample were measured
with the snap chip, which could accommodate up to 16 samples per chip (slide), while on
some chips one column of 8 wells was used for establishing the binding curve. Among 50

Protein Time Course in a Cancer Mouse Model
16
proteins measured with ACM, the levels of 38 proteins were above the limits of detection
(LODs) of the assay for at least one time point and thus considered measurable in mice
sera. The remaining 12 proteins were not detected in the serum.
A hierarchical clustering was performed for 38 human proteins based on the average
concentration across the 11 mice at each time point, Fig. 2. Ten proteins, clustered from
EGFR down to MMP-3, show increasing concentrations over time. The next cluster of
seven proteins from NT-3 to TNF-RII also shows a clear increase of average values over
time but with significant fluctuation. Further down in the list, no clear trends are visible.
The proteins clustered at the bottom, starting from IL-4 show moderate signals at week -1,
and low signal levels for time point 6, and some of them are relatively high for time point
5. HER 2 was not detected in the mice serum as expected, since triple-negative breast
cancer cells were used to grow tumors. CA 15-3, which is used clinically to evaluate
response to therapy in breast cancer (28) did not cluster with the discriminating proteins
at the top. CA15-3 did however increase in concentration during the first 3 weeks after
cancer cell injection, but then decreased, and fluctuations were observed in individual
mice. For further analysis, we decided to focus on the 10 proteins clustered at the top of
the heat map.
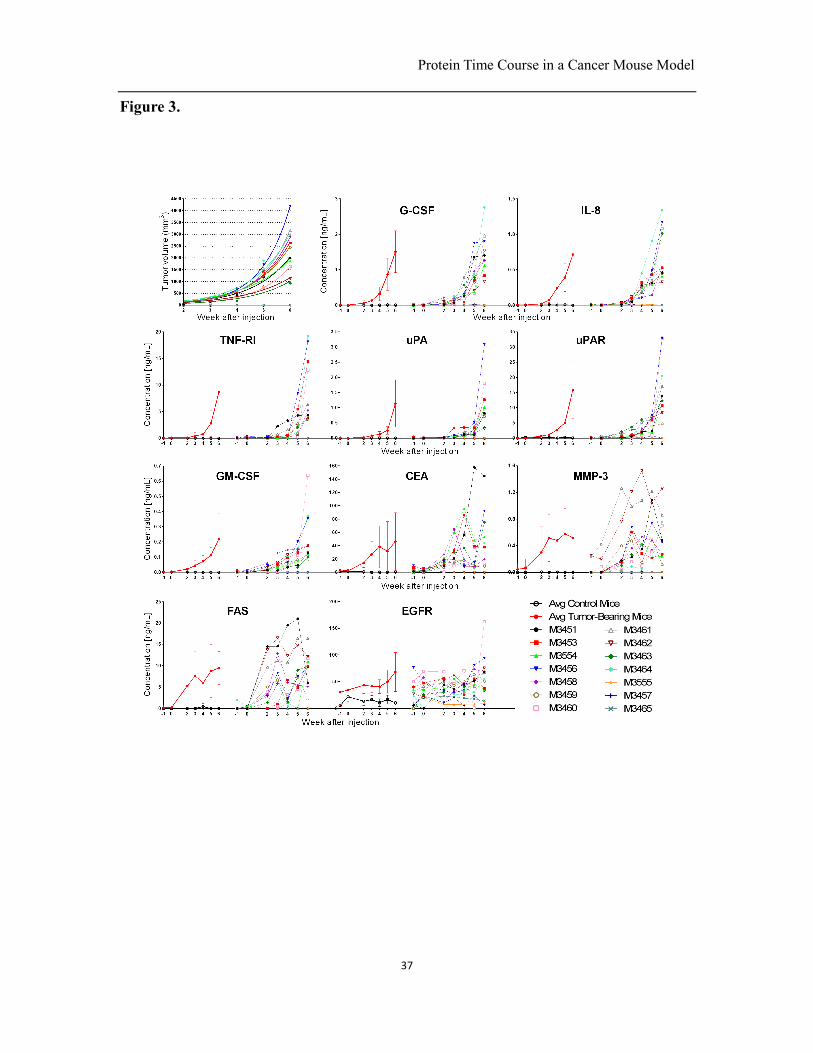
The time course of tumor growth is shown in Fig 3a. The results show important
variations from animal to animal. Whereas variability in tumor growth is generally

Protein Time Course in a Cancer Mouse Model
17
known, it should be noted that all cancers originated from a cell line with reduced genetic
variability compared to natural tumors, and were implanted in mice with similar genetic
background, and yet widely varying growth rates and final tumor volumes are observed
despite the homogeneous genetic background. To further investigate the ten increased
proteins found in Fig.2, we plotted their concentrations during tumor growth for both
individual mice and the average of all tumor-bearing and control mice. Six proteins
(G-CSF, IL-8, TNF-RI, uPA, uPAR, GM-CSF) increased continuously during the growth
of human xenografts with only small fluctuations, and the remaining 4 proteins (EGFR,
CEA, MMP-3, FAS) also increased, but with significant fluctuation, Fig. 3b-e. EGFR
shows relatively high signals in control mice, which might be due to the cross-reactivity
of antibodies with other antigens (20). Regardless, on average, a clear trend is visible for
EGFR as the signal rises significantly. The fluctuation in protein concentrations in
samples taken prior to cancer cell injection (week -1 and week 0) and of control animals
might be ascribed to the variability in sample collection and serum, and the specificity of
the antibodies. The correlation between tumor size and protein concentration was not
consistent among mice. Mice M3456 and M3464 grew large tumors, and the
concentration of proteins in blood was also high in relation to the other mice. However,
M3460 shows a moderately sized tumor, but high concentrations of proteins in the blood,
indicating that the correlation between protein concentration and tumor size is not
consistent among different mice, as will be further discussed below.

Protein Time Course in a Cancer Mouse Model
18
Correlation of protein levels with tumor volumes
With mice, it becomes possible to track the time course of tumor size and protein
concentration in blood for an extended period of time, allowing one to directly probe a
model linking the two. We plotted the six proteins whose levels increased continuously
along with the growth of the tumor burdens for each of the 11 tumor-bearing mice (Fig.
4.). We found that the protein levels and the tumor volumes were linearly correlated for
all mice (SI Table. 2.).
Time-course analysis of sensitivity and specificity of protein biomarkers
For the diagnosis and monitoring of recurrence, the differential change in concentration
(sometimes also called the velocity (1)) is often more accurate. Indeed, this measure
intrinsically takes into account personal variation and defines individual baselines. Here,
we wanted to test whether differential, self-referred diagnosis would outperform
diagnosis relying on a population average-based threshold in mice cancer models. The
ROC curves of the 10 individual proteins as well as of the linear combination of the
normalized variation of the 10 proteins for each time point are plotted. The ROC curves
calculated using absolute and differential methods for the six proteins that linearly
correlated with tumor burden are shown in Fig. 5 and Fig. 6. The ROC curves for the four
proteins that increased but fluctuated are shown in SI Fig 2-3. The area under curve
(AUC) shows that diagnostic accuracy for all the proteins increased progressively during
the time course of tumor growth as might be expected for these mice models. The low

Protein Time Course in a Cancer Mouse Model
19
AUC values for mouse from weeks 0 and -1 using the absolute threshold method indicate
that the results reflects a change in the mouse, except for TNF-RI where already a high
AUC values arises before; this may be due to a measurement artifact or a coincidental
higher expression in the specific subset of mice. For most proteins the differential method
and the absolute threshold analysis yielded a similar diagnostic accuracy. Using the
differential method, IL-8 achieved the best performance of AUC = 1 for all the time
points after injection of cancer cells, which is also reflected in its time course curves for
each individual mice shown in Fig 3. Interestingly, the AUC already reaches a high value
after only 2 weeks. For example, in the week 2, MMP-3 and IL-8 show an AUC = 1 with
absolute and differential methods, respectively (SI Fig. 2-3).
The ROC curve of the 10-protein panel was outperformed by individual proteins that
yielded higher AUCs. A backward elimination protocol (29, 30) was used to identify
panels with higher sensitivity and specificity for both differential method and threshold
analysis. Following the removal of each individual protein from the panel, the sum of
sensitivity and specificity were calculated, and only the panels with better or equivalent
accuracy were selected for further elimination. Using this procedure, we found 37
combinations with between 8 and 4 proteins with sensitivity = 1 and specificity = 1 for
every time point, as listed in SI Table 4. CEA, FAS, and uPAR appeared in all 37
combinations. To further select the best combinations and taking advantage of the control
time points at week -1 and 0, we calculated the diagnostic specificity using the absolute

Protein Time Course in a Cancer Mouse Model
20
threshold based method and found 8 combinations with a specificity of 0.96.
The sensitivity and specificity were computed for 6 individual proteins whose AUC = 1 at
week 3 using either absolute or differential method. The optimal protein panel comprising
CEA, FAS, uPAR, and IL-8 was computed using an absolute threshold of two standard
deviations above the average of the control mice, or using the differential method with a
limit set as the average standard deviation above the value at weeks -1 & 0 (see methods
for details). The sensitivity and specificity for each time point are shown in Fig. 7. At
week 2, the sensitivity of G-CSF, and IL-8 were higher for the differential threshold, and
of uPA, MMP-3 and EGFR for the absolute threshold. The sensitivity improved
monotonically for most individual proteins. Relatively large fluctuations are observed for
the specificity, which can be accounted for by the small number of control mice. CEA
gives the most accurate classification with both measurements between weeks 2-6
because the assay signals in tumor-bearing mice are higher than those in the control mice.
The specificity is similar for both methods except for IL-8 and uPA. EGFR showed a
relatively low sensitivity using the differential method, which can be ascribed to the
fluctuations in concentration observed in our measurements. Despite the fluctuations
observed, our measurements achieved relatively high sensitivity and specificity starting
from as early as the second week depending on the proteins in question.
Discussion

Protein Time Course in a Cancer Mouse Model
21
In this study, we detected 38 human proteins in mice serum, and the 10 selected proteins
found to increase over time in the sera of tumor-bearing mice had previously been linked
to triple negative breast cancer, consistent with the cancer subtype of MDA-MB-231 cells.
G-CSF has been reported to be a drug support in chemotherapy of triple negative breast
cancer (31). Higher concentrations of IL 8 were found to be correlated with the invasion
and metastasis process for MDA-MB-231 cells (32-34). TNF-RI is associated with poor
prognosis in breast cancer patients on its own (35). uPA/uPAR system is involved in
multiple steps of tumor formation and progression (36, 37), and the uPA/uPAR genes
were found to be over-expressed in MDA-MB-231 cell lines (38). GM-CSF is a cytokine
functioning in tumor progression and has been found to be over-expressed in
MDA-MB-231 and other breast cancer cells (39). CEA was found in the blood of triple
negative breast cancer patients and was documented in the majority of patients with
metastatic breast cancer (40). EGFR is a cell surface receptor that has been found to
express in many human tumor cells including MDA-MB-231 cells and contributes to
cancer cell proliferation and migration (41-43), and can function as a potential
therapeutic target in triple-negative breast cancer (44). MMP-3 is involved in tumor
invasion and metastasis, and has been reported to be highly over-expressed in
MDA-MB-231 cells (45). FAS was found to mediate non-apoptotic functions in triple
negative breast cancer cells (46, 47). These previous studies indicate that these proteins
function in different aspects of triple negative breast cancer and therefore are concordant
with a higher concentration in blood as the tumor grows.

Protein Time Course in a Cancer Mouse Model
22
In a previous study using a HER2/neu driven inducible endogenous cancer mouse model,
36 candidate protein biomarkers were found to be increased in the mice plasma using
mass spectrometry (8). The proteins identified were distinct from this study; however in
consideration that the cell line used here represents a triple negative cancer, it is expected
that different markers would be found. Some of the proteins were detected at pg/mL
range in this work, lower than ng/mL concentrations for most of the 36 proteins detected
using mass spectrometry in the previous work.
Considering that we are only measuring human proteins, which are not expected in the
blood prior to starting the experiment, one would not expect to obtain a detectable signal
prior to tumor cell inoculation, yet a number of proteins show weak to moderate signals
in week -1 and week 0 (Fig.2.). Cross-reactivity to mouse proteins is possible for the
antibodies which are not of murine origin, but unlikely for most proteins, given that most
capture antibodies are mouse antibodies (see SI Table 1). The variability observed may, in
part, arise due to the difference in matrix between the binding curves made in buffer, and
the actual yet measurements that were conducted in serum which is known to generate a
background signal. Hence some signals that appear above the LOD may in fact be below.
This issue is a general challenge faced by all sandwich assays such as ELISA due to the
absence of a reference sample.

Protein Time Course in a Cancer Mouse Model
23
Gambhir and colleagues proposed mathematical models relating protein levels with
tumor volumes, and predicted that with the LODs of current ELISA tumors could not be
detected until they reach tens of millimeters in diameter (5, 6). Despite the relative large
size of tumors, the concentration of proteins was only in the pg/mL (Fig.3b-e.), close to
the LOD of ELISA and the snap chip ACM, and similar in concentration to the one found
in humans. Considering that the volume of blood in a mouse is ~ 2500 times less than in
a human (48), the relatively low concentration of cancer proteins in the blood of mice can
be ascribed to a number of factors. This xenograft model elicits much less vascularization
than many natural tumors and rapidly develops a necrotic core within the tumor. In
addition, differences in protein shedding, vascular permeability, as well as different
half-life of the proteins in blood could all contribute to reduce the concentration of tumor
proteins in blood (6). Moreover, proteins from stromal cells surrounding the tumor, which
are also altered, are expected to be released into the blood and to contribute to the
increase in concentration (14, 49). However, since the antibodies used here are specific
for human proteins, stromally released proteins could not be measured here. Indeed, the
protein concentrations measured in this work are lower than those in a previous study
using an inducible endogenous HER 2/neu mouse model that measured proteins at high
ng/mL range (14), suggesting that xenograft cancer model might yield lower protein
concentrations in blood.
We found that protein concentration was proportional to tumor size, in agreement with

Protein Time Course in a Cancer Mouse Model
24
the model proposed by Lutz et al. (5) (Fig. 4.). However, the necrotic core of these
xenograft tumors that arises for volumes as small as 300-500 mm3 (~ 8 mm in diameter)
might break the direct relation between tumor volume and cell numbers. Cells are mainly
proliferating within a viable rim at the edges of the tumor, and hence one would expect
that the contribution to proteins in the blood would originate from those cells. This would
imply that biomarker concentration would be correlated to tumor surface area. When
comparing the protein concentration to the surface area of the ellipsoid tumor, a linear
regression provides the best fit, with comparable accuracy relative to volumetric fits. (SI
Table. 2-3). The tumor outer layer is in fact heterogeneous, and hence secretion may
occur both from the outer surface and from within the tumor, providing a plausible
explanation for the results observed. Extending the growth time towards larger tumors
might help resolve this question, however the tumor sizes reached the maximal allowable
tumor volumes under the approved animal use protocol.
Some of the most important findings of this study are that (i) the significant fluctuations
in the relations linking the protein concentration and tumor volume, and (ii) the
variability in the excretion rates among different mice. As illustrated in Fig. 4, for many
proteins and many mice, the data points are not aligned with the linear fit, and fluctuate
above and below the fit. These results indicate that the relationship between excretion
rate and blood concentration are not constant, and may vary owing to environmental
factors and metabolic activity. Secondly, the range of slopes for protein concentration vs.

Protein Time Course in a Cancer Mouse Model
25
tumor volumes varies significantly. M3459 is typically characterized with the lowest
slopes, while M3460 has the highest slopes. The highest and lowest ratios between
protein excretion rate normalized for tumor volume for the six proteins measured were
found for IL-8 and TNFR-I. For IL-8, the slope of M3460 is 6.5×10⁻⁴ and M3459 is
1.7×10⁻⁴ corresponding to a ratio of 3.8, and for TNFR-I, the slope for M3460 is 7.8×10
-3
and for M3459 is 1.6×10⁻³ corresponding to ratio of 4.9. These results indicate that in
addition to different excretion rates as a function of tumor volume, even larger
fluctuations in protein secretion rates arise between mice with highly similar genetic
background, and that they can arise independently of tumor growth rates. The variability
in protein concentration will add uncertainty in the size of the tumor that may be detected,
and might prevent the establishment of precise concentration cut-offs for cancer diagnosis
considering large personal variations among human patients, at least when using single
protein biomarkers. Indeed, studies of breast cancer growth in human patients monitored
by mammography screening have shown large variations between patients (50).
Interestingly, the excretion rates of different proteins are conserved relative to other mice,
i.e. a mouse that had a high concentration of one protein in blood also had a high
concentration of the other 5 proteins that were studied here. This may reflect the
metabolic activity of a single tumor that leads to a consistent excretion rate for different
proteins. If the same relationships hold true in human tumors, one protein could be used
for normalization of the values.

Protein Time Course in a Cancer Mouse Model
26
As shown from the ROC curves, the blood-based classification identified tumor-bearing
mice after only 2 weeks, when many tumors were not yet palpable (Fig. 5-6.). The AUC
values for most of the 10 individual proteins outperform the multi-protein panel
diagnostic. The panel is simply the collection of all proteins and hence it would be
expected that some individual proteins outperform it. Finally, we evaluated the sensitivity
and specificity of individual proteins for specific thresholds determined based on the
standard deviation of the measurement, Fig. 7. Among the six proteins with the highest
sensitivity and specificity, three overlapped with the ones continuously increased during
tumor growth (GCSF, IL-8, and uPA) whose ROC curves were shown in Fig. 5-6, while
three were distinct (CEA MMP3 and EGFR). Following backward elimination, optimal
protein panels with higher specificity and sensitivity were identified for both absolute
threshold and differential methods (SI Table 4). Interestingly, 3 out of these 8
combinations consisted of only 4 proteins comprising CEA, FAS, uPAR and either IL-8,
TNF-RI, or G-CSF. FAS was neither among the 6 top proteins for AUC or the
sensitivity/specificity analysis, but was essential to the high performance of the protein
panel. The other 5 combination comprised 5 proteins, and the panels were either
combination of the above proteins, while one panel included uPA and another GM-CSF.
The use of each time point as a negative control afforded a sufficient number of negative
controls, but for future biomarker studies it is recommended to increase the number of
negative control to achieve more robust statistics. This study found little differences

Protein Time Course in a Cancer Mouse Model
27
between absolute threshold and differential measurements. There are several factors that
may contribute to the high accuracy of both approaches, namely the genetic similarity of
mice and of the injected cancer cells, the selectivity of our analysis for xenograft proteins,
and the limited number of control mice. Future studies may overcome some of the
limitations of our study, and use both larger cohorts of control mice along with validation
cohorts (8), as well as more advanced statistical analysis (51, 52). Finally, measuring
protein levels using high sensitivity antibody microarrays from induced or spontaneous
mice cancer might uncover other facets of protein concentration in blood that are not
replicated by xenograft tumors.
In summary, we measured 50 proteins in serial serum samples from a human xenograft
breast tumor model and found 10 proteins that increased in concentration as the tumors
grew. For six of these, concentration and tumor volume was linearly correlated. To the
best of our knowledge, this is the first study to monitor protein levels at multiple time
points in multiple individual xenograft-bearing mice. It will be interesting to evaluate
whether these proteins will also be found in the blood of human triple negative cancer
patients. To evaluate proteins secreted from tumor microenvironment, samples could be
measured in parallel with antibody arrays targeting mouse proteins (14). Such time course
studies might be repeated with genetically induced cancers in mice, and thus study
protein excretion time course in vascularized tumors while also including contributions of
the stromal tissue. ROC curves showed that the diagnostic accuracy with identified

Protein Time Course in a Cancer Mouse Model
28
proteins increased progressively during the time course of tumor growth for both absolute
threshold and differential methods. For most individual proteins and the protein panel the
differential measurement showed similar sensitivity and specificity than absolute
threshold based measurement. Optimal protein panels were selected and outperformed
individual proteins. It will be interesting to see if the same trends will persist with larger
cohorts, and in other cancer models. Time course studies within an early diagnosis
paradigm are logistically difficult for human cancer, but it may be possible to use
antibody colocalization microarrays to study the response to therapy in both neoadjuvant
and adjuvant settings by serially collecting blood and monitoring the concentration of
multiple proteins (53).
Acknowledgements
We thank Professor Rob Sladek for the use of the inkjet spotter, and the Center for
Structural and Functional Genomics at Concordia University for the use of the
fluorescent microarray scanner. We acknowledge the Canadian Institutes for Health
Research (CIHR), the Natural Science and Engineering Research Council of Canada
(NSERC), and the Canada Foundation for Innovation (CFI) for their financial support.
H.L. was supported by a fellowship from the NSERC-CREATE Integrated Sensor
Systems program. D.J. acknowledges support from a Canada Research Chair.

Protein Time Course in a Cancer Mouse Model
29
References
1. Nielsen, V. G., and Garza, J. I. (2014) Comparison of the effects of CORM-2, CORM-3 and CORM-A1 on
coagulation in human plasma. Blood Coagul. Fibrinolysis 6, 6
2. Wang, Q., Chaerkady, R., Wu, J., Hwang, H. J., Papadopoulos, N., Kopelovich, L., Maitra, A., Matthaei,
H., Eshleman, J. R., Hruban, R. H., Kinzler, K. W., Pandey, A., and Vogelstein, B. (2011) Mutant proteins as
cancer-specific biomarkers. Proc. Natl. Acad. Sci. U.S.A. 108, 2444-2449
3. Joshi, S., Tiwari, A. K., Mondal, B., and Sharma, A. (2011) Oncoproteomics. Clin. Chim. Acta 412,
217-226
4. Fuzery, A., Levin, J., Chan, M., and Chan, D. (2013) Translation of proteomic biomarkers into FDA
approved cancer diagnostics: issues and challenges. Clin. Proteomics 10, 13
5. Lutz, A. M., Willmann, J. K., Cochran, F. V., Ray, P., and Gambhir, S. S. (2008) Cancer Screening: A
Mathematical Model Relating Secreted Blood Biomarker Levels to Tumor Sizes. PLoS Medicine 5, e170
6. Hori, S. S., and Gambhir, S. S. (2011) Mathematical Model Identifies Blood Biomarker–Based Early
Cancer Detection Strategies and Limitations. Sc. Transl. Med. 3, 109ra116-109ra116
7. Kelly-Spratt, K. S., Kasarda, A. E., Igra, M., and Kemp, C. J. (2008) A Mouse Model Repository for
Cancer Biomarker Discovery. J. Proteome Res. 7, 3613-3618
8. Whiteaker, J. R., Lin, C., Kennedy, J., Hou, L., Trute, M., Sokal, I., Yan, P., Schoenherr, R. M., Zhao, L.,
Voytovich, U. J., Kelly-Spratt, K. S., Krasnoselsky, A., Gafken, P. R., Hogan, J. M., Jones, L. A., Wang, P., Amon,
L., Chodosh, L. A., Nelson, P. S., McIntosh, M. W., Kemp, C. J., Paulovich, A. G. (2011) A targeted
proteomics-based pipeline for verification of biomarkers in plasma. Nat. Biotechnol. 29, 625-634
9. Hung, K. E., Faca, V., Song, K., Sarracino, D. A., Richard, L. G., Krastins, B., Forrester, S., Porter, A.,
Kunin, A., Mahmood, U., Haab, B. B., Hanash, S. M., and Kucherlapati, R. (2009) Comprehensive Proteome
Analysis of an Apc Mouse Model Uncovers Proteins Associated with Intestinal Tumorigenesis. Cancer Prev.
Res. 2, 224-233
10. Whiteaker, J. R., Zhang, H., Zhao, L., Wang, P., Kelly-Spratt, K. S., Ivey, R. G., Piening, B. D., Feng, L.-C.,
Kasarda, E., Gurley, K. E., Eng, J. K., Chodosh, L. A., Kemp, C. J., McIntosh, M. W., and Paulovich, A. G. (2007)
Integrated Pipeline for Mass Spectrometry-Based Discovery and Confirmation of Biomarkers
Demonstrated in a Mouse Model of Breast Cancer. J. Proteome Res. 6, 3962-3975
11. Pitteri, S. J., Faca, V. M., Kelly-Spratt, K. S., Kasarda, A. E., Wang, H., Zhang, Q., Newcomb, L.,
Krasnoselsky, A., Paczesny, S., Choi, G., Fitzgibbon, M., McIntosh, M. W., Kemp, C. J., and Hanash, S. M.
(2008) Plasma Proteome Profiling of a Mouse Model of Breast Cancer Identifies a Set of Up-Regulated
Proteins in Common with Human Breast Cancer Cells. J. Proteome Res. 7, 1481-1489
12. Eliane, J.-P., Repollet, M., Luker, K. E., Brown, M., Rae, J. M., Dontu, G., Schott, A. F., Wicha, M., Doyle,
G. V., Hayes, D. F., and Luker, G. D. (2008) Monitoring Serial Changes in Circulating Human Breast Cancer
Cells in Murine Xenograft Models. Cancer Res. 68, 5529-5532
13. Rodenburg, W., Pennings, J. L. A., van Oostrom, C. T. M., Roodbergen, M., Kuiper, R. V., Luijten, M.,
and de Vries, A. (2010) Identification of breast cancer biomarkers in transgenic mouse models: A
proteomics approach. PROTEOMICS – Clinical Applications 4, 603-612
14. Pitteri, S. J., Kelly-Spratt, K. S., Gurley, K. E., Kennedy, J., Buson, T. B., Chin, A., Wang, H., Zhang, Q.,
Wong, C.-H., Chodosh, L. A., Nelson, P. S., Hanash, S. M., and Kemp, C. J. (2011) Tumor

Protein Time Course in a Cancer Mouse Model
30
Microenvironment–Derived Proteins Dominate the Plasma Proteome Response during Breast Cancer
Induction and Progression. Cancer Res. 71, 5090-5100
15. Uotila, M., Ruoslahti, E., and Engvall, E. (1981) Two-site sandwich enzyme immunoassay with
monoclonal antibodies to human alpha-fetoprotein. J. Immunol. Methods 42, 11-15
16. Nielsen, U. B., and Geierstanger, B. H. (2004) Multiplexed sandwich assays in microarray format. J.
Immunol. Methods 290, 107-120
17. Li, H., Leulmi, R. F., and Juncker, D. (2011) Hydrogel droplet microarrays with trapped
antibody-functionalized beads for multiplexed protein analysis. Lab Chip 11, 528-534
18. Stoevesandt, O., and Taussig, M. J. (2012) Affinity proteomics: the role of specific binding reagents in
human proteome analysis. Expert Rev. Proteomics 9, 401-414
19. Yu, X., Schneiderhan-Marra, N., and Joos, T. O. (2010) Protein microarrays for personalized medicine.
Clin. Chem. 56, 376-387
20. Pla-Roca, M., Leulmi, R. F., Tourekhanova, S., Bergeron, S., Laforte, V., Moreau, E., Gosline, S. J. C.,
Bertos, N., Hallett, M., Park, M., and Juncker, D. (2012) Antibody Colocalization Microarray: A Scalable
Technology for Multiplex Protein Analysis in Complex Samples. Mol. Cell. Proteomics 11
21. Juncker, D., Bergeron, S., Laforte, V., and Li, H. (2014) Cross-reactivity in antibody microarrays and
multiplexed sandwich assays: shedding light on the dark side of multiplexing. Curr. Opin. Chem. Biol. 18,
29-37
22. Li, H., Bergeron, S., and Juncker, D. (2012) Microarray-to-Microarray Transfer of Reagents by Snapping
of Two Chips for Cross-Reactivity-Free Multiplex Immunoassays. Anal. Chem. 84, 4776-4783
23. Mourskaia, A. A., Dong, Z., Ng, S., Banville, M., Zwaagstra, J. C., O'Connor-Mccourt, M. D., and Siegel,
P. M. (2008) Transforming growth factor-[beta]1 is the predominant isoform required for breast cancer cell
outgrowth in bone. Oncogene 28, 1005-1015
24. Wapnir, I. L., Barnard, N., Wartenberg, D., and Greco, R. S. (2001) The Inverse Relationship Between
Microvessel Counts and Tumor Volume in Breast Cancer. The Breast Journal 7, 184-188
25. Antibody Product Catalog, R&D Systems.
26. Miller, J. C., Zhou, H., Kwekel, J., Cavallo, R., Burke, J., Butler, E. B., Teh, B. S., and Haab, B. B. (2003)
Antibody microarray profiling of human prostate cancer sera: Antibody screening and identification of
potential biomarkers. Proteomics 3, 56-63
27. Grote, T., Siwak, D. R., Fritsche, H. A., Joy, C., Mills, G. B., Simeone, D., Whitcomb, D. C., and Logsdon,
C. D. (2008) Validation of reverse phase protein array for practical screening of potential biomarkers in
serum and plasma: Accurate detection of CA19-9 levels in pancreatic cancer. Proteomics 8, 3051-3060
28. Tampellini, M., Berruti, A., Bitossi, R., Gorzegno, G., Alabiso, I., Bottini, A., Farris, A., Donadio, M.,
Sarobba, M., Manzin, E., Durando, A., Defabiani, E., De Matteis, A., Ardine, M., Castiglione, F., Danese, S.,
Bertone, E., Alabiso, O., Massobrio, M., and Dogliotti, L. (2006) Prognostic significance of changes in CA
15-3 serum levels during chemotherapy in metastatic breast cancer patients. Breast Cancer Res. Treat. 98,
241-248
29. Shin, H., Sheu, B., Joseph, M., and Markey, M. K. (2008) Guilt-by-association feature selection:
Identifying biomarkers from proteomic profiles. J. Biomed. Inf. 41, 124-136
30. Olsson, N., Carlsson, P., James, P., Hansson, K., Waldemarson, S., Malmström, P., Fernö, M., Ryden, L.,
Wingren, C., and Borrebaeck, C. A. K. (2013) Grading Breast Cancer Tissues Using Molecular Portraits. Mol.

Protein Time Course in a Cancer Mouse Model
31
Cell. Proteomics 12, 3612-3623
31. Frasci, G., Comella, P., Rinaldo, M., Iodice, G., Di Bonito, M., D'Aiuto, M., Petrillo, A., Lastoria, S., Siani,
C., Comella, G., and D'Aiuto, G. (2009) Preoperative weekly cisplatin–epirubicin–paclitaxel with G-CSF
support in triple-negative large operable breast cancer. Ann. Oncol. 20, 1185-1192
32. Kim, H., Choi, J.-A., Park, G.-S., and Kim, J.-H. (2012) BLT2 Up-Regulates Interleukin-8 Production and
Promotes the Invasiveness of Breast Cancer Cells. PLoS ONE 7, e49186
33. Rody, A., Karn, T., Liedtke, C., Pusztai, L., Ruckhaeberle, E., Hanker, L., Gaetje, R., Solbach, C., Ahr, A.,
Metzler, D., Schmidt, M., Muller, V., Holtrich, U., and Kaufmann, M. (2011) A clinically relevant gene
signature in triple negative and basal-like breast cancer. Breast Cancer Res 13, R97
34. De Larco, J. E., Wuertz, B. R., Rosner, K. A., Erickson, S. A., Gamache, D. E., Manivel, J. C., and Furcht, L.
T. (2001) A potential role for interleukin-8 in the metastatic phenotype of breast carcinoma cells. Am. J.
Pathol. 158, 639-646
35. Fuksiewicz, M., Kowalska, M., Kotowicz, B., Rubach, M., Chechlinska, M., Pienkowski, T., and
Kaminska, J. (2010) Serum soluble tumour necrosis factor receptor type I concentrations independently
predict prognosis in patients with breast cancer. Clin. Chem. Lab. Med. 48, 1481-1486
36. Duffy, M. J. (2004) The urokinase plasminogen activator system: role in malignancy. Curr. Pharm. Des.
10, 39-49
37. Bevan, P., and Mala, C. (2008) The Role of uPA and uPA Inhibitors in Breast Cancer. Breast Care (Basel)
3, 1-2
38. Neve, R. M., Chin, K., Fridlyand, J., Yeh, J., Baehner, F. L., Fevr, T., Clark, L., Bayani, N., Coppe, J.-P.,
Tong, F., Speed, T., Spellman, P. T., DeVries, S., Lapuk, A., Wang, N. J., Kuo, W.-L., Stilwell, J. L., Pinkel, D.,
Albertson, D. G., Waldman, F. M., McCormick, F., Dickson, R. B., Johnson, M. D., Lippman, M., Ethier, S.,
Gazdar, A., and Gray, J. W. (2006) A collection of breast cancer cell lines for the study of functionally
distinct cancer subtypes. Cancer Cell 10, 515-527
39. Senst, C., Nazari-Shafti, T., Kruger, S., Bentrup, K., Dupin, C., Chaffin, A., Srivastav, S., Wörner, P.,
Abdel-Mageed, A., Alt, E., and Izadpanah, R. (2013) Prospective dual role of mesenchymal stem cells in
breast tumor microenvironment. Breast Cancer Res. Treat. 137, 69-79
40. Yerushalmi, R., Tyldesley, S., Kennecke, H., Speers, C., Woods, R., Knight, B., and Gelmon, K. A. (2012)
Tumor markers in metastatic breast cancer subtypes: frequency of elevation and correlation with outcome.
Ann. Oncol. 23, 338-345
41. Harris, A. L., Nicholson, S., Sainsbury, R., Wright, C., and Farndon, J. (1992) Epidermal growth factor
receptor and other oncogenes as prognostic markers. J. Natl. Cancer Inst. Monogr. 11, 181-187
42. Subik, K., Lee, J. F., Baxter, L., Strzepek, T., Costello, D., Crowley, P., Xing, L., Hung, M. C., Bonfiglio, T.,
Hicks, D. G., and Tang, P. (2010) The Expression Patterns of ER, PR, HER2, CK5/6, EGFR, Ki-67 and AR by
Immunohistochemical Analysis in Breast Cancer Cell Lines. Breast Cancer (Auckl) 4, 35-41
43. Hirsch, D. S., Shen, Y., and Wu, W. J. (2006) Growth and Motility Inhibition of Breast Cancer Cells by
Epidermal Growth Factor Receptor Degradation Is Correlated with Inactivation of Cdc42. Cancer Res. 66,
3523-3530
44. Corkery, B., Crown, J., Clynes, M., and O'Donovan, N. (2009) Epidermal growth factor receptor as a
potential therapeutic target in triple-negative breast cancer. Ann. Oncol. 20, 862-867
45. Phromnoi, K., Yodkeeree, S., Anuchapreeda, S., and Limtrakul, P. (2009) Inhibition of MMP-3 activity

Protein Time Course in a Cancer Mouse Model
32
and invasion of the MDA-MB-231 human invasive breast carcinoma cell line by bioflavonoids. Acta
Pharmacol Sin 30, 1169-1176
46. Peter, M. E., Budd, R. C., Desbarats, J., Hedrick, S. M., Hueber, A. O., Newell, M. K., Owen, L. B., Pope,
R. M., Tschopp, J., Wajant, H., Wallach, D., Wiltrout, R. H., Zornig, M., and Lynch, D. H. (2007) The CD95
receptor: apoptosis revisited. Cell 129, 447-450
47. Chakrabandhu, K., Huault, S., and Hueber, A.-O. (2008) Distinctive molecular signaling in
triple-negative breast cancer cell death triggered by hexadecylphosphocholine (miltefosine). FEBS Lett.
582, 4176-4184
48. Riches, A. C., Sharp, J. G., Thomas, D. B., and Smith, S. V. (1973) Blood volume determination in the
mouse. J. Physiol. 228, 279-284
49. Finak, G., Bertos, N., Pepin, F., Sadekova, S., Souleimanova, M., Zhao, H., Chen, H., Omeroglu, G.,
Meterissian, S., Omeroglu, A., Hallett, M., and Park, M. (2008) Stromal gene expression predicts clinical
outcome in breast cancer. Nat. Med. 14, 518-527
50. Weedon-Fekjær, H., Lindqvist, B., Vatten, L., Aalen, O., and Tretli, S. (2008) Breast cancer tumor
growth estimated through mammography screening data. Breast Cancer Res. 10, 1-13
51. Tibshirani, R., Hastie, T., Narasimhan, B., and Chu, G. (2002) Diagnosis of multiple cancer types by
shrunken centroids of gene expression. Proc. Natl. Acad. Sci. U.S.A. 99, 6567-6572
52. Yan, Z., Li, J., Xiong, Y., Xu, W., and Zheng, G. (2012) Identification of candidate colon cancer
biomarkers by applying a random forest approach on microarray data. Oncol. Rep. 28, 1036-1042
53. Carlsson, A., Wingren, C., Kristensson, M., Rose, C., Fernö, M., Olsson, H., Jernström, H., Ek, S.,
Gustavsson, E., Ingvar, C., Ohlsson, M., Peterson, C., and Borrebaeck, C. A. K. (2011) Molecular serum
portraits in patients with primary breast cancer predict the development of distant metastases. Proc. Natl.
Acad. Sci. U.S.A.108, 14252-14257

Protein Time Course in a Cancer Mouse Model
33
Figure legend
Fig. 1. Schematic outlining the process flow for preparing the slides and performing an
antibody colocalization microarray in a snap chip format. (a) dAbs are spotted onto an
aminosilane coated slide that is stored in a freezer. cAbs are spotted onto another
aminosilane slide with the same spotting layout and transferred to a nitrocellulose coated
assay slide followed by blocking and storage in a freezer. (b) Both slides are removed
from the freezer prior to use. The assay slide is incubated with sample solutions, and then
the dAbs transferred to the assay slide by snapping, followed by incubation with
streptavidin-Cy 5. Next, the assay results are imaged with a fluorescent microarray
scanner and the data analyzed.
Fig. 2. Hierarchical cluster analysis of the 38 human proteins detected in mice sera. The
average concentration of each protein of the 11 tumor-bearing mice subtracted by the
average concentration of 3 control mice is shown. Row Z-score were used for color
rendering.
Fig. 3. Tumor volumes and protein concentrations during the time course of tumor
growth. (a) Tumor volume of the 14 mice (comprising 3 controls) calculated for weeks
after the injection of cancer cells and fitted with an exponential growth curve. (b-e) Time
course of the 10 proteins (G-CSF, IL-8, TNF-RI, uPA, uPAR, GM-CSF, CEA, MMP-3,
FAS, EGFR) that increased during the growth of the human breast cancer xenografts in
mice. For each protein, curves on the left show average protein levels for the
tumor-bearing mice and controls during the growth of tumor; curves on the right show

Protein Time Course in a Cancer Mouse Model
34
protein levels during the time course for each of the 11 individual tumor-bearing mice
and 3 controls. Error bars on the average curves are the standard deviations of protein
concentrations among mice. M3451-M3465 represent the identity of each mouse.
Fig. 4. Comparison between tumor volume and protein concentration of the 6 proteins
G-CSF, IL-8, TNF-RI, uPA, uPAR, and GM-CSF in serum for each of the 11 mice along
with linear regression curves. Despite the genetic homogeneity of the mice, important
variations are seen among mice. A high or low excretion rate for one protein is often
mirrored by the excretion rate for other proteins, suggesting that metabolic differences
between tumors underlie this variation.
Fig. 5. ROC curves of the 10-protein panel and 6 individual human proteins at each time
point before and after injection of cancer cells using absolute threshold method. For
overlapping curves for AUC = 1, the color from the earliest week at this value are shown.
Fig. 6. ROC curves of the 10-protein panel and 6 individual proteins at each time point
after cancer cell injection using the self-referenced differential method. Some curves with
AUC=1 are invisible due to overlap with other curves. Unlike for the absolute threshold,
no ROC curves were plotted for week – 1 & 0 because they are not meaningful.
Fig. 7. Time course of sensitivity and specificity calculated with absolute threshold based
method and differential measurement for the six proteins whose AUC=1 at week 3 as
well as the panels with sensitivity=1 and specificity=1.
Figures
Figure 1.
Protein Time Course in a Cancer Mouse Model
35
Protein Time Course in a Cancer Mouse Model

Protein Time Course in a Cancer Mouse Model
36
Figure 2.
Protein Time Course in a Cancer Mouse Model
37
Figure 3.
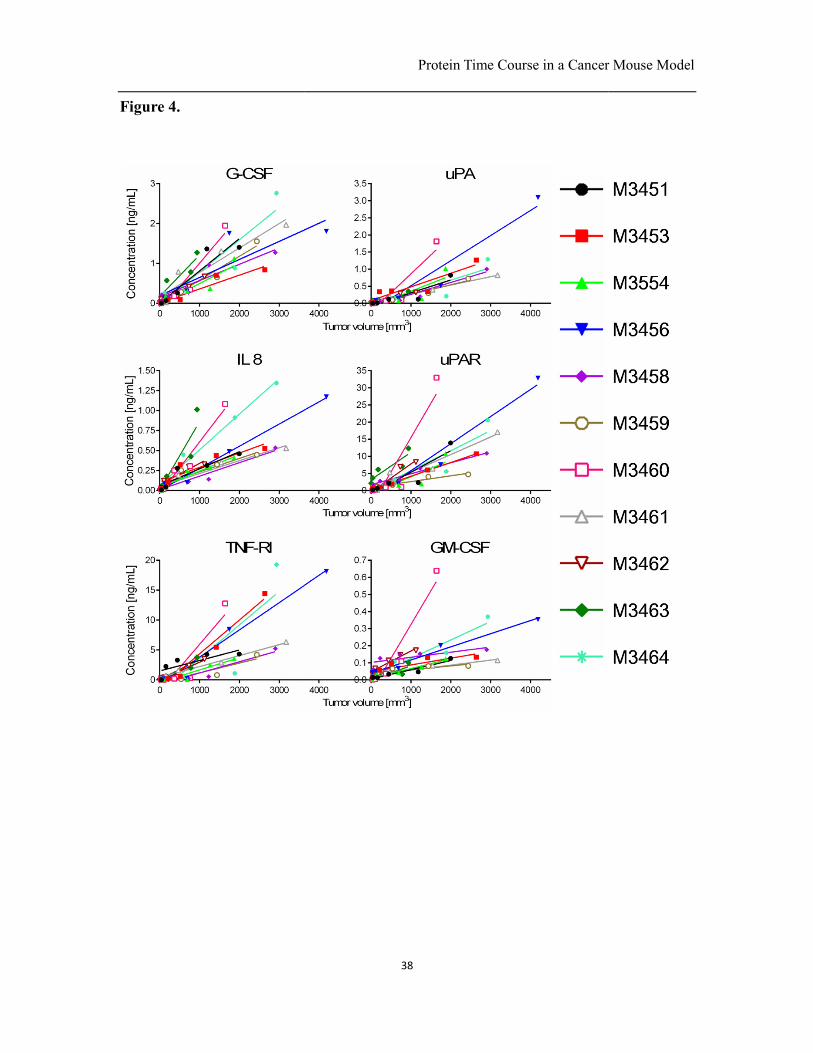
Figure 4.
Protein Time Course in a Cancer Mouse Model
38
Protein Time Course in a Cancer Mouse Model

Protein Time Course in a Cancer Mouse Model
39
Figure 5.

Protein Time Course in a Cancer Mouse Model
40
Figure 6.

Protein Time Course in a Cancer Mouse Model
41
Figure 7.


![North Carolina register [serial] - NC.gov](https://static.fdokumen.com/doc/165x107/6327f539e491bcb36c0b8a23/north-carolina-register-serial-ncgov.jpg)


![The Chanticleer [serial]](https://static.fdokumen.com/doc/165x107/632863a3051fac18490eb46f/the-chanticleer-serial.jpg)