Sequential-injection on-line preconcentration using chitosan resin functionalized with...
30
Chemistry Analytical Chemistry fields Okayama University Year 2007 Sequential-injection on-line preconcentration using chitosan resin functionalized with 2-amino-5-hydroxy benzoic acid for the determination of trace elements in environmental water samples by inductively coupled plasma-atomic emission spectrometry Akhmad Sabarudin * Narong Lenghor † Mitsuko Oshima ‡ Lukman Hakim ** Toshio Takayanagi †† Yun-Hua Gao ‡‡ Shoji Motomizu § * Department of Chemistry, Faculty of Science, Okayama University † Department of Chemistry, Faculty of Science, Okayama University ‡ Department of Chemistry, Faculty of Science, Okayama University, [email protected] u.ac.jp ** Department of Chemistry, Faculty of Science, Okayama University †† Department of Chemistry, Faculty of Science, Okayama University, [email protected] u.ac.jp ‡‡ Technical Institute of Physics and Chemistry, Chinese Academy of Sciences (CAS) § Department of Chemistry, Faculty of Science, Okayama University, [email protected] This paper is posted at eScholarship@OUDIR : Okayama University Digital Information Repository. http://escholarship.lib.okayama-u.ac.jp/analytical chemistry/36
Transcript of Sequential-injection on-line preconcentration using chitosan resin functionalized with...
Chemistry
Analytical Chemistry fields
Okayama University Year 2007
Sequential-injection on-line
preconcentration using chitosan resin
functionalized with 2-amino-5-hydroxy
benzoic acid for the determination of
trace elements in environmental water
samples by inductively coupled
plasma-atomic emission spectrometry
Akhmad Sabarudin∗ Narong Lenghor† Mitsuko Oshima‡
Lukman Hakim∗∗ Toshio Takayanagi††
Yun-Hua Gao‡‡ Shoji Motomizu§
∗Department of Chemistry, Faculty of Science, Okayama University†Department of Chemistry, Faculty of Science, Okayama University‡Department of Chemistry, Faculty of Science, Okayama University, [email protected]
u.ac.jp∗∗Department of Chemistry, Faculty of Science, Okayama University††Department of Chemistry, Faculty of Science, Okayama University, [email protected]
u.ac.jp‡‡Technical Institute of Physics and Chemistry, Chinese Academy of Sciences (CAS)§Department of Chemistry, Faculty of Science, Okayama University,
This paper is posted at eScholarship@OUDIR : Okayama University Digital InformationRepository.
http://escholarship.lib.okayama-u.ac.jp/analytical chemistry/36
Sequential-Injection On-line Preconcentration Using Chitosan Resin Functionalized With 2-Amino-5-Hydroxy Benzoic Acid for the Determination of Trace Elements in Environmental Water Samples by Inductively Coupled Plasma-Atomic Emission Spectrometry Akhmad Sabarudin1, Narong Lenghor1, Mitsuko Oshima1, Lukman Hakim1, Toshio Takayanagi1, Yun-Hua Gao2, Shoji Motomizu1*
1 Department of Chemistry, Faculty of Science, Okayama University, Tsushimanaka 3-1-1,
Okayama City 700-8530, Japan 2 Technical Institute of Physics and Chemistry, Chinese Academy of Sciences (CAS), Add.
No 2 Beiyitiao Zhongguancun, Beijing 100080, China
Abstract
A new chelating resin using chitosan as a base material was synthesized. Functional moiety of 2-amino-5-hydroxy benzoic acid (AHBA) was chemically bonded to the amino group of cross-linked chitosan (CCTS) through the arm of chloromethyloxirane (CCTS-AHBA resin). Several elements, such as Ag, Be, Cd, Co, Cu, Ni, Pb, U, V, and rare earth elements (REEs), could be adsorbed on the resin. To use the resin for on-line pretreatment, the resin was packed in a mini-column and installed into a sequential injection/automated pretreatment system coupled with inductively coupled plasma-atomic emission spectrometry (ICP-AES). The sequential injection/ automated pretreatment system (Auto-Pret System) was a laboratory-assembled, and the program was written using Visual Basic software. This system can provide easy operation procedures, less reagent consumption, as well as less waste production.
Experimental variables considered as effective factors in the improvement sensitivity, such as an eluent concentration, a sample and an eluent flow rate, pH of samples, and air-sandwiched eluent were carefully optimized. The proposed system provides excellent on-line collection efficiency, as well as high concentration factors of analytes in water samples, which results in highly sensitive detection of ultra-trace and trace analysis. Under the optimal conditions, the detection limits of 24 elements examined are in the range from ppt to sub-ppb levels. The proposed method was validated by using the standard reference material of a river water, SLRS-4, and the applicability was further demonstrated to the on-line collection/concentration of trace elements, such as Ag, Be, Cd, Co, Cu, Ni, Pb, U, V, and REEs in water samples.
Keywords: Sequential-Injection, on-line preconcentration, trace elements, ICP-AES, chitosan
resin
1
_______________________________ * To whom correspondence should be addressed: E-mail : [email protected] (Shoji Motomizu)
Phone/Fax : (81) 86-251-7846
1. Introduction
Chelating resins are often used for the preconcentration, separation, and recovery of
metal in analytical chemistry. The development of novel chelating resins for solid phase
extraction (SPE) is very opportune because of its reliability, excellent metal loading capacity
and adsorption ability [1]. Pretreatment of aqueous samples with chelating resin as SPE can
provide several advantages: high enrichment/collection factors, better removal of interferent
ions, high performance and rate of reaction process, and the possibility of the combination
with several detections methods [2]. Chelating resins can be synthesized by chemically
immobilizing appropriate chelating agents on polymeric supports. Polystyrene functionalized
with 2,5-dimercapto-1,3,4-thiodiazole [3], dithiocarbamate [4], maleic acid [5],
2-(α-hydroxymethyl) benzimidazole [6], bis(2-benzimidazolylmethyl)amine [7],
2-napthol-3,6-disulfonic acid [8], glucosamine [9] have been reported so far for the adsorption
of several metal ions. Commercially available resins of Amberlite series have been widely
used as a polymeric support for designing chelating resins. Amberlite XAD-2 functionalized
with pyrochatechol [10], chromotropic acid [11], and o-aminophenol [12] were applied as a a
collector for Cu, Co, Cd, Ni, and Zn. Ambelite XAD-4 functionalized with bicine [13], and
o-vanillinsemicarbazone [14] has been used for preconcentration and separation of rare earth
2
elements (REEs), U, and Th, whereas Amberlite XAD-4 possessing salen moiety [15] was
applied to the separation and determination of Cu, Pb, and Bi. Amberlite XAD-16 resins
modified with phosphonic acid derivatives [16-18] have reported as a selective collector for U,
Th, and La. Epoxy-polyamide chelating resins have been applied to the preconcentration and
separation of trace Ga, In, Bi, V, Cr, and Ti [19], as well as the collection/concentration of
trace noble metals [20].
Chitosan, one of the most abundant biomass, has been found to be an excellent base
material compared to other natural polymers, activated sludge, synthetic polymer, etc. The use
of chitosan as solid support for an ion exchange and a chelating resin is increasing due to its
advantages, such as easy derivatization of its amino groups and more hydrophilic than such
synthetic base materials as polystyrene-divinylbenzene, polyethylene and polyurethane
[21-22]. These advantages provide fast reaction rate, as well as fast in sorption kinetics of
analyte species. However, chitosan can easily dissolve in acidic solutions due to the
protonation of its amino groups. Therefore, cross-linking agents such as
ethyleneglycoldiglycidylether (EGDE) and glutaraldehyde [23-24] were used for improving
its chemical stability and mechanical strength. By using the cross-linked chitosan as a
polymeric support, chitosan-based chelating resins possessing such moieties as iminodiacetate
[22], leucine [25], serine [26], imino di(methyl phosphonic acid) [27], N-methyl-D-glucamine
[28], and 3,4-diaminobenzoic acid [29] were synthesized for the collection/concentration of
3
trace elements.
Several chelating resins mentioned above can provide several advantages for the
improving sensitivity and selectivity in trace metal analysis. However, the operations are
usually very tedious because it is performed manually in batch method. Stringent control of
the laboratory environment is also required to avoid sample contamination when trace and
ultra-trace detection levels are attempted. Such situations can be overcome by utilizing
on-line preconcentration procedures using functionalized solid materials coupled with
flow-based (FB)-spectroscopic detection system [1, 30-37]. By employing an on-line system,
such general drawbacks of batchwise preconcentration procedures were mostly eliminated. In
addition, the reagent consumption is reduced to a few percent of the usual manner, and the
requirements on the laboratory environment for trace analysis are much less stringent.
A sequential injection analysis (SIA) comes next to the continous-flow analysis concept.
SIA is very useful for improving tedious and time-consuming pretreatment of samples prior to
the measurement, because it is more robust and versatile, and is characterized by the use of
discrete volumes and variable-flow conditions throughout the analytical cycle [38]. A
sequential injection/ICP-MS method in combination with on-line solvent extraction for the
determination of lead was reported by Wang and Hansen [39]. Although the method is very
sensitive, the use of organic solvent, methyl isobutyl keton (MIBK), could not be avoided.
Sequential injection/anodic stripping voltammetry [40-41] allows simultaneous determination
4
of Pb, Cu,Cd, and Zn. However, because of the detection limits are several ten ppb levels, it
could not be applied to the determination of trace elements in natural water samples.
In this work, the chitosan resin cross-linked with EGDE (CCTS) was chemically modified
by combining hydroxyl group of 2-amino-5-hydroxy benzoic acid (AHBA) moiety to the
amino group of chitosan through the arm of chloromethyloxirane (CCTS-AHBA resin). Then,
the resin was packed in a mini-column, which was utilized as an on-line preconcentration
device. The mini-column was installed into the laboratory-assembled
sequential-injection/automated pretreatment system (Auto-Pret System) coupled with
inductively coupled plasma-atomic emission spectrometry (ICP-AES) for the
collection/concentration and determination of Ag, Be, Cd, Co, Cu, Ni, Pb, U, V, and REEs in
water samples. Experimental variables considered as effective factors for improving detection
sensitivity, such as an eluent concentration, a flow rate of eluent, a sample flow rate, pH of
samples, and air-sandwiched eluent, were carefully optimized. The proposed system can
provide excellent on-line collection efficiency, less reagent consumption compared to
conventional flow-based method, and high sensitivity (several ppt level LOD of some
analytes), as well as excellent separation efficiency of the analytes from commonly existing
matrices in water samples.
2. Experimental
5
2.1 Apparatus
An ICP-AES system (Vista Pro, Seiko Instruments, Chiba, Japan) was used for the
measurement of Ag, Be, Cd, Co, Cu, Ni, Pb, U, V and REEs. The operating conditions of
ICP-AES were summarized in Table 1. The ICP-AES was coupled with a
laboratory-assembled sequential injection/automated pretreatment system (Auto-Pret System),
which consists of a syringe pump (SP: Cavro, San Jose, CA, USA) with volumes of 2.5 ml, a
6-port selection valve (SL: Hamilton, Reno, NV, USA), and a 6-way switching valve (SV:
Hamilton, Reno, NV, USA). The pump, valves, as well as ICP-AES, were fully controlled by
a computer. The program for Auto-Pret System was written using Visual Basic software. The
manifold of the Auto-Pret System used in this work was shown in Fig.1. The PTFE tubing
(0.8 mm i.d.) was used for assembling all flow lines except for a holding coil (2 mm i.d). In
the proposed system, only water flows continuously by using peristaltic pump fixed in
ICP-AES, whereas the consumption of other reagents depends on the optimized volumes,
which result in much less reagent consumption compared to conventional batchwise method.
The laboratory-made mini-column was prepared from PTFE tubing with the volume of
about 0.13 ml (2 mm i.d x 4 cm length), which corresponds to about 26 mg of CCTS-AHBA
resin. This column was equipped with the plugs of quartz wool at both ends of the tubing to
keep CCTS-AHBA resin in the column.
An automated titration system, Model AT-510 (Kyoto Electronics Manufacturing Co.,
6
Kyoto, Japan), was used for the acid-base titration for the estimation of the pKa values of
CCTS-AHBA resin synthesized. Infrared spectra (4000-400 cm-1) were taken by KBr pellet
method using a FT/IR-4100 spectrometer (JASCO Co., Tokyo, Japan)
2.2 Reagents and solutions
Flake-type chitosan and 2-amino-5-hydroxy benzoic acid (AHBA) were purchased from
Tokyo Kasei Co. Ltd. (Tokyo, Japan). Chitosan flakes were ground to fine pieces and sieved
to obtain chitosan particles of 100-300 μm. All other reagents used for the synthesis of
CCTS-AHBA resin were of analytical reagent grade.
The standard reference material of river water (SLRS-4) was provided by National
Research Council Canada (NRCC).
Working solutions of multielement standard solutions were prepared by diluting several
kinds of a single element standard solution for atomic absorption spectrometry (1000 μg ml-1,
Wako Pure Chemicals, Osaka, Japan) and a multi-element standard solution for ICP-MS;
XSTC-13 and XSTC-1 (10 μg ml-1, Spex CertiPrep Inc., NJ, USA), and by mixing them
together. The XSTC-13 contains 31 elements of Th, Ag, Al, As, Ba, Be, Bi, Ca, Cd, Co, Cr,
Cs, Cu, Fe, Ga, In, K, Li, Mg, Mn, Na, Ni, Pb, Rb, Se, Sr, TL, V, Zn, U, and Hg, whereas
XSTC-1 contains 16 elements of Ce, Dy, Er, Eu, Gd, Ho, La, Lu, Nd, Pr, Sm, Sc, Tb, Tm, Yb,
and Y. The mixed standard solutions were then adjusted to desired concentration and pH
7
before introducing to Auto-Pret System.
Acetic acid (minimum 96 %) and ammonia water (29 %) used for the preparation of
ammonium acetate solution were of an electronic industrial reagent grade (Kanto Chemicals,
Tokyo, Japan). The solutions were used for adjusting pH from 3 to 9. Diluted nitric acid
(ultrapure grade, 60 %, density 1.38 g ml-1, Kanto Chemicals, Tokyo, Japan) was used for
adjusting pH 1-2 of samples. Ultrapure water (18.3 MΩ cm-1 resistivity) prepared by an Elix
3/Milli-Q Element system (Nihon Millipore, Tokyo, Japan) was used throughout.
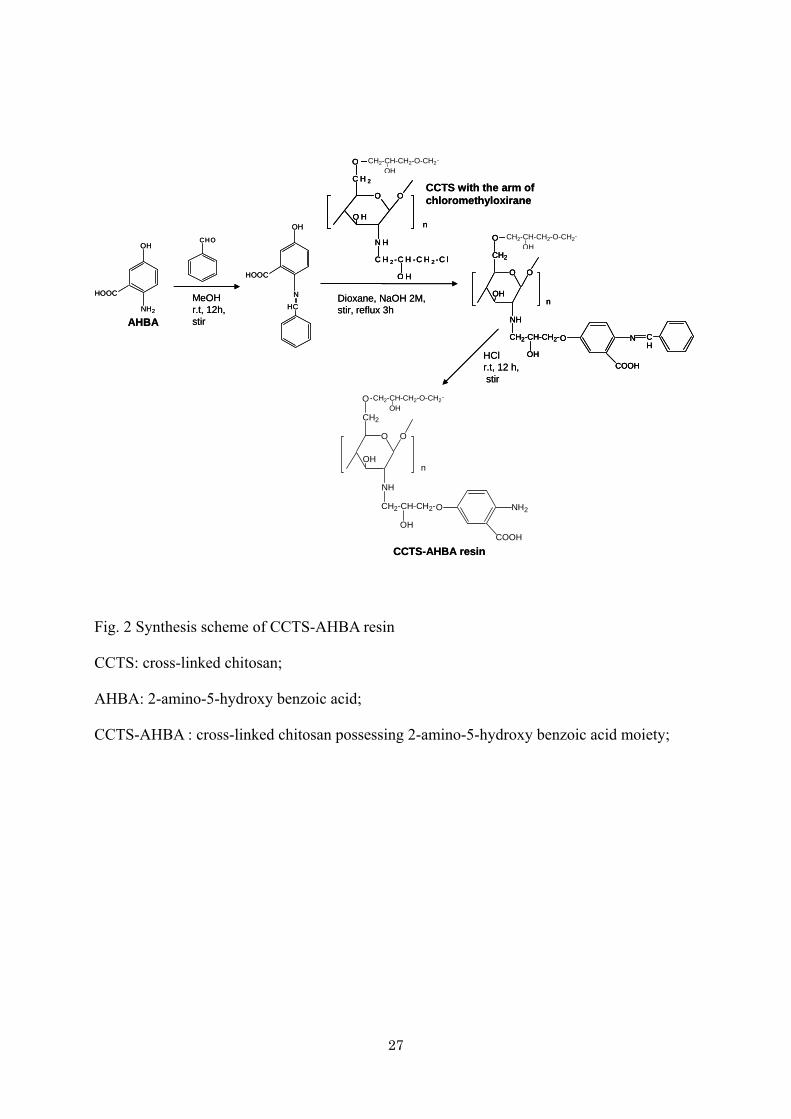
2.3 Preparation of CCTS-AHBA resin
The CCTS-AHBA resin was synthesized through three steps. In the first step, the
cross-linked chitosan (CCTS) with the arm of chloromethyloxirane was synthesized in a
similar manner as in the previous works [25-28]. In the second step, the amino group of
2-amino-5-hydroxy benzoic acid (AHBA) moiety was protected by treating 10 gram of
AHBA with 20 g of benzaldehyde in 20 ml of methanol: the mixture was stirred for 12 hours
at room temperature. Then, the CCTS with the arm of chloromethyloxirane (5 g) and the
AHBA protected-amino group were suspended in dioxane (100 ml), and to this suspension, 2
M NaOH (40 ml) was added. The mixture was refluxed for 3 h in order to couple hydroxy
phenolic group of AHBA with chloro terminal of the arm of CCTS. In the last step, the
protection group (benzaldehyde), which was condensed with amino groups of AHBA, was
8
removed by stirring the product in 100 ml of 0.5 M HCl for 12 h at room temperature: this
procedure was repeated two times. Then, the product (CCTS-AHBA) was filtered on the glass
filter and washed with methanol and water. The synthesis scheme of this resin was shown in
Fig. 2. Before being packed in mini-column as on-line preoncentration device, the
CCTS-AHBA resin was cleaned up by stirring at low speed for 3 h in 2M nitric acid followed
by washing with ultrapure water.
2.4 Operating procedures for on-line collection/concentration of trace elements
The whole procedure run through 4 steps, during which the carrier (ultrapure water) is
pumped continuously into the ICP-AES by a peristaltic pump fixed in the ICP-AES system.
Step 1: Column conditioning. In this step, SV is in load position, and SP is set up to aspirate
1000 μl (at flow rate of 100 μl s-1) of 0.5 M ammonium acetate buffer (NH4OAc, pH 7) into
HC via the port 3 of SL, which is then dispensed through the port 1 at the flow rate of 40 μl
s-1 for conditioning the column.
Step 2: Collection and preconcentration. SV is in load position, and SP is set to aspirate 2500
μl of the samples into HC via the port 2 of SL (at the flow rate of 100 μl s-1), followed by
flowing it into the column via the port 1 (at the flow rate of 30 μl s-1 ) for the collection and
preconcentration of trace elements, as well as the removal of the matrices. This step was
repeated 2 times to introduce total sample volume of 5 ml.
9
Step 3: Washing. After sample is loaded to the column, 500 μl of the ultrapure water (W1) is
aspirated into the syringe (at the flow rate of 200 μl s-1), and then dispensed to wash the
column via the port 1 of SL (at the flow rate of 40 μl s-1), while SV is still in load position.
Step 4: Elution and measurement. In this step, the air-sandwiched eluent was used. The SP is
set to aspirate air (40 μl, flow rate: 40 μl s-1 ), eluent (2M HNO3; 250 μl, flow rate: 100 μl s-1),
air (40 μl, flow rate: 40 μl s-1 ) into HC via the port 5, port 6, and port 5 of SL, respectively,
followed by aspirating ultrapure water (W1) into the syringe (at the flow rate of 200 μl s-1) to
fill the syringe up to 2500 μl . Then, SL is switched to the port 1, while SV is switched to the
inject position, as shown in Fig. 1. Afterwards, the zones in the holding coil, which consists
the zones of 40 μl air-250 μl eluent-40 μl air (in the front side) and the zones of 2170 μl
ultrapure water (in the back side), are dispensed to elute the collected trace elements on the
CCTS-AHBA column (at the flow rate of 30 μl s-1), followed by measuring them by ICP-AES.
Peak height was used as an analytical signal for the preparation of a calibration graph, as well
as analytes measurement.
3. Results and discussion
3.1 Characteristics of CCTS-AHBA resin
The IR spectrum of CCTS-AHBA resin, in comparison with the one of cross-linked
chitosan (CCTS), depicted several bands at 1646.93 cm-1, 1575.80 cm-1, and 1384.66 cm-1,
10
which are attributed to C=C stretching of benzene, C=O of carboxylate group, and C-N
stretching of aromatic amino group, respectively. These bands showed the existence of AHBA
moiety attached to CCTS in the synthesized resin.
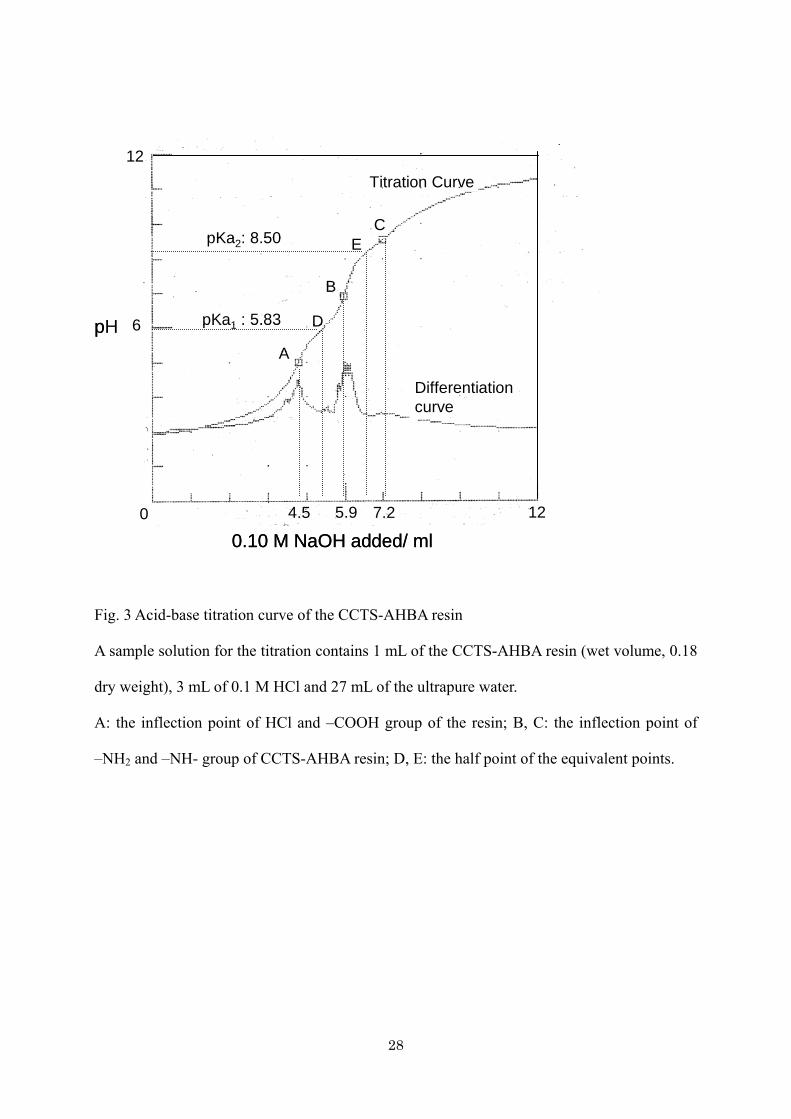
Figure 3 shows the results of an acid-base titration for the synthesized CCTS-AHBA resin
in an acidic solution with a 0.10 M NaOH solution as a titrant. There are three pKa values
which can be expected from the chemical structure of the CCTS-AHBA resin. The pKa
value comes from –COOH and –NH2 group of AHBA moiety, and –NH- group of CCTS. For
the estimation of pKa of this resin, the pKa values of 2-amino benzoic acid, which are
attributed to –COOH (pKa: 2.11) and –NH2 (pKa: 4.95) group can be referred [42]. As shown
in Fig.3, there are two pKa values of 5.83 and 8.50, were clearly observed from the titration
curve. The pKa of 5.83 in the resin is attributed to the –NH2 group of the moiety, whereas the
pKa of 8.50 is due to the –NH- group of cross-linked chitosan (CCTS). The pKa value of
-COOH group of AHBA moiety cannot be observed from the titration curve because the
neutralization reaction of –COOH group overlapped with the neutralization of HCl. In this
experiment, 3 ml of 0.10 M HCl in 30 ml water was added to the resin-suspended solution
before titration. Therefore, the pH of HCl solution is about 2, whereas –COOH group of
AHBA is seemed to be about 2.11 of pKa. When the sample is titrated, the amount of H+ from
HCl and H+ from –COOH group cannot be separated.
At the first end point (A), the volume of 0.10 M NaOH required to neutralize total acid of
11
HCl and –COOH was 4.5 ml. The volume, 4.5 ml of NaOH, can be attributed to the
neutralization of HCl (3.0 ml of NaOH), and the neutralization of –COOH group (1.5 ml of
NaOH). The most important value is the volume of NaOH required to neutralize –NH2 group
of AHBA, should be the same amount as that used to neutralize –COOH group. From the
second end point (B), 1.4 ml of NaOH is needed to neutralize –NH2 group: it means that the
moles of –COOH and –NH2 present in the synthesized resin are almost equal with each other.
Similarly, the volume of NaOH required to neutralizing –NH- group of CCTS was about 1.3
ml (third end point, C). This result indicates that the amounts of AHBA moiety attached to
cross-linked chitosan can be estimated to be 0.8 mmol g-1 of the resin.
3.2 Adsorption behavior of metal ions on the CCTS-AHBA resin
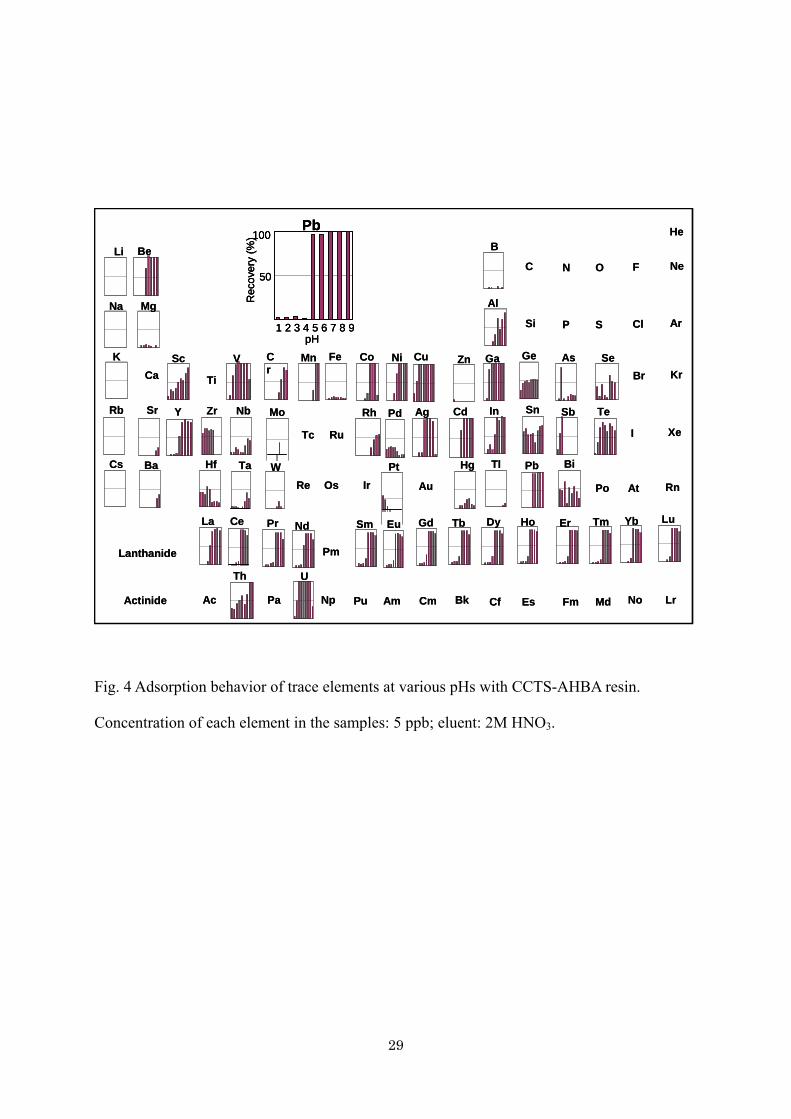
The adsorption behavior of 60 elements on the CCTS-AHBA resin was examined in a
similar manner as in the previous works [25-29]. Figure 4 shows the results obtained for the
adsorption/recovery of 5 ppb of the 60 elements in the pH ranges from 1 to 9. The
CCTS-AHBA resin can adsorb almost completely V, Cu, and U from acidic to alkaline pH
regions. Other elements, such as Be, Co, Ni, Ag, Cd, Pb, and REEs (Y, La, Ce, Pr, Nd, Sm,
Eu, Gd, Tb, Dy, Ho, Er, Tm, Yb, Lu) are adsorbed on the resin at around neutral to alkaline
regions. Vanadium as an oxoanion can be adsorbed on the resin through an ion exchange
mechanism, whereas other elements may adsorb on the resin through a chelating mechanism.
12
In our previous reports [22-23, 43], it was found that the cross-linked chitosan (CCTS) itself
could adsorb Cu, V, Ni, and Ag. Accordingly, the AHBA moiety attached to CCTS is seemed
to possess excellent adsorption ability for Be, Co, Cd, Pb, U, and REEs. In our previous
work [29], the chitosan resin functionalized with 3,4-diamino benzoic acid (CCTS-DBA
resin) had poor adsorption capacities for REEs, however, the present resin (CCTS-AHBA)
had excellent enrichment efficiency for REEs. Possibly, in the CCTS-AHBA resin, REEs can
form six-membered ring chelate, which is more stable than five-membered ring chelate as in
the CCTS-DBA resin. This is why the enrichment of REEs can be strongly improved when a
-COOH group was added as in the CCTS-AHBA resin.
3.3 Optimization of Auto-Pret System
3.3.1 Factors affecting the collection/preconcentration of analytes
Several factors affecting the collection/preconcentration of analytes, involving sample
pH and sample loading flow rate, were examined. Among these factors, the pH of sample
solutions is seemed to be the most important parameter for the effective collection and
preconcentration of analytes.
The effect of sample pH on the recovery of 60 elements was examined in the pH ranges
from 1 to 9 as shown in section 3.2. For further experiment, pH 7 was selected because it
allows simultaneous determination of 24 elements, such as Be, Cd, Co, Cu, Ni, Pb, V, Ag, U,
13
Y, La, Ce, Pr, Nd, Sm, Eu, Gd, Tb, Dy, Ho, Er, Tm, Yb, and Lu. The resin was packed in a
mini-column (4 cm x 2 mm i.d.) and installed into Auto-Pret System coupled with ICP-AES,
which can provides automated on-line preconcentration and determination of trace elements.
Faster flow rate of sample loading and higher adsorption efficiency of analytes are desired
in the preconcentration experiments because these conditions can give a higher
preconcentration factor in a shorter time. However, the kinetics of the adsorption may limit
the flow rate, at which the sample can be dispensed through the column. Therefore, in the
present study the effect of the flow rate of sample loading was examined in the ranges of 10 -
50 μl s-1. The peak height tends to decrease with an increase in the flow rate of sample
loading for REEs, whereas no significant decrease of the peak heights for Be, Cd, Co, Cu, Ni,
Pb, V, Ag, U up to the flow rate of 30 μl s-1. Even the flow rate of 10 μl s-1 resulted in highest
intensity for almost all analytes, however, it can not be recommended because of the
time-consuming analysis. As a compromise of the sensitivity and the analysis time, a sample
flow rate of 30 μl s-1 was selected as an optimum condition.
3.3.2 Factor affecting the elution of the analytes
Nitric acid (HNO3) was used as an eluent for the present study. Several factors affecting
the elution efficiency of analytes, such as an eluent concentration, an eluent volume, an eluent
flow rate, and air-sandwiched eluent method were studied.
14
The concentration of HNO3 on the elution of analytes collected on the column was
examined in the ranges of 0.5-3.0 M. It was found that 0.5 M HNO3 was not effective to elute
analytes from the column, which gave the lowest peak height for all analytes examined. Some
elements, such as Cu, Co, and Pb, could be eluted completely with 1M HNO3. However, most
of the elements gave the highest peak height when these were eluted with 2M HNO3. Similar
results were found when 3M HNO3 was used. From these results, a 2 M HNO3 was chosen as
an optimal eluent concentration.
The volume of eluent (2 M HNO3) was examined by varying its volume from 0.05 to 2 ml
to ascertain the complete elution of the analytes and the highest peak height. The peak height
of the collected elements increases with increasing eluent volume up to 0.2 ml, though some
elements, such as La, Co, and Be can be eluted completely using 0.1 ml of 2M HNO3. When
the volume of the eluent was varied from 0.2 to 2 ml, the peak height of analytes did not show
any significant differences. In the procedure required for the preconcentration of analytes, the
volume of the eluent is seemed to be as low as possible to obtain the highest enrichment
factor. Therefore, the eluent volume of 0.25 ml of 2M HNO3 was selected for further
experiments.
The effect of the flow rate of eluent (2 HNO3) was examined by varying its flow rate
from 10 to 50 μl s-1. It was found that the flow rate slower than 20 μl s-1 resulted in the lowest
sensitivity due to the largest dispersion of the eluate during their transportation to ICP-AES.
15
However, when the flow rate is faster than 30 μl s-1, the peak height tends to decrease. The
highest intensity was found in the ranges of 20-30 μl s-1. Considering the analysis time, the
eluent flow rate of 30 μl s-1 was selected as an optimal condition.
The optimized parameters of the Auto-Pret System were summarized in Table 2. Under
the optimal conditions, the analysis time of 1 sample was about 6 min using 5 ml of sample.
3.4 Analytical properties of merits
In order to evaluate the performance of the proposed method, the enrichment factor,
collection efficiency, and detection limits obtained by using on-line preconcentration
sequential injection system were studied. The effect of matrices commonly exist in water
sample (Na, Ca, Mg, and K) was also examined. This was followed by an assessment of the
accuracy and reproducibility.
The enrichment factor and collection efficiency were investigated under optimal conditions.
The enrichment factor was calculated by comparing the peak height obtained with the
Auto-Pret System with those obtained by directly introducing the samples (5 ml), and
collection efficiency was calculated by comparing peak area of flow signals of each analyte
obtained with and without column preconcentration device as shown in Table 3.
The effect of river water matrices (Na: 20 ppm, K: 10 ppm, Mg: 15 ppm, Ca: 20 ppm)
were examined by comparing the peak height of 1 ppb of each analyte in the presence and
16
absence of the matrices. The results showed that no significant difference in the peak intensity
between sample with and without the addition of the matrices. Such results demonstrated that
the column packed with CCTS-AHBA resin was efficient for retaining the analytes and
effectively removing them from potential interfering matrices. In addition, the column
containing CCTS-AHBA resin can be used at least for 4 months.
The calibration graphs for Be, Tm, Y, and Yb could be constructed at several ppt levels,
whereas other elements, such as Ag, Cd, Co, Cu, Dy, Er, Eu, Gd, Ho, La, Lu, Nd, Ni, Pb, Pr,
Sm, Tb, and V, were constructed at several ten ppt levels. The detection limits (LOD) of
analytes examined were determined by the signal to noise ratio (S/N = 3). As shown in Table
4, ppt to sub-ppb levels of LOD could be achieved. The relative standard deviations (n = 6) of
analytes examined at a 1 ppb level were in the ranges of 0.2 – 1.2 %, which means that the
proposed method is superior in reproducibility.
The accuracy of the proposed method was evaluated by analyzing the standard reference
material of river water (SLRS-4). The results were summarized in Table 5. Uranium could not
be detected, because its concentration was lower than LOD. Larger volume of sample can be
used to improve the LOD of uranium although such procedure can increase the analysis time
substantially. The results obtained by the proposed method are in good agreement with the
certified values.
17
3.5 Application to real river water samples
The applicability and robustness of the proposed method were demonstrated
by determining trace elements in environmental river water samples. The analytical results
were shown in Table 5. Most of the elements examined by the proposed method could be
determined using 5 ml of the sample solutions. Cadmium could be detected clearly when 10
ml of the sample solution was used. However, it is very difficult to detect uranium because of
LOD limitation and the poor sensitivity of ICP-AES for uranium.
4. Conclusion
The cross-linked chitosan functionalized with 2-amino-5-hydroxy benzoic acid moiety
(CCTS-AHBA resin) facilitates the determination of 24 trace-elements with excellent
collection efficiency, high enrichment factor, and effective matrix separation.
The proposed method, in which CCTS-AHBA resin was packed in a mini-column and
utilized as an on-line preconcentration device coupled with a laboratory-assembled sequential
injection/automated pretreatment (Auto-Pret) system and ICP-AES, provides excellent
detection limit, and it can be used as a versatile technique for the determination of trace
elements in river waters with satisfied results. Easy operation could be attributed to the
Auto-Pret System equipped with a laboratory-written software.
18
5. Acknowledgements
The present work was partially supported by the Grant-in-Aid for Scientific Research (B)
No 16350044 from Japan Society for Promotion of Science (JSPS).
6. References
[1] V. A. Lemos, E. M., Gama, A. S. Lima, Microchim. Acta, 153 (2006) 179
[2] D. Bilba, D. Bejan, L.Tofan, Croat. Chem. Acta, 71 (1998) 155
[3] R. Qu, C. Sun, C. Ji, C. Wang, Z. Zhao, D. Yu, Polym. Eng. Sci., 45 (2005) 1515
[4] P. K. Roy, A. S. Rawat, P. K. Rai, Talanta, 59 (2003) 239
[5] P. K. Roy, A. S. Rawat, V. Choudhary, P. K. Rai, J. Appl. Polym. Sci., 59 (2003) 239
[6] M. R. Maurya, S. Sikarwar, T. Joseph, P. Manikandan, S. B. Halligudi, React. Func.
Polym., 63 (2005) 71
[7] S. Pramanik, P. K. Dhara, P. Chattopadhyay, Talanta, 63 (2004) 485
[8] B. C. Mondal, D. Das, A. K. Das, Talanta, 56 (2002) 145
[9] C. Sun, R. Qu, C. Wang, C. Ji, G. Cheng, J. Appl. Polym. Sci, 95 (2005) 890
[10] P. K. Tewari, A. K. Singh, Talanta, 53 (2001) 823
[11] P. K. Tewari, A. K. Singh, Analyst, 124 (1999) 1847
[12] M. Kumar, D. P. S. Rathore, A. K. Singh, Talanta, 51 (2000) 1187
[13] K. Dev, R. Pathak, G. N. Rao, Talanta, 48 (1999) 579
19
[14] V. K. Jain, A. Handa, S. S. Sait, P. Shrivastav, Y. K. Agrawal, 429 (2001) 237
[15] Y. S. Kim, G. In, C. W. Han, J. M. Choi, Microchem. J., 80 (2005) 151
[16] D. Prabhakaran, M. S. Subramanian, Anal. Bioanal. Chem., 379 (2004) 519
[17] M. A. Maheswari, M. S. Subramanian, Talanta, 64 (2004) 202
[18] M. A. Maheswari, M. S. Subramanian, React. Func. Polym., 62 (2005) 105
[19] D. Yang, X. Chang, Y. Liu, S. Wang, J. Appl. Polym. Sci., 97 (2005) 2330
[20] D. Yang, X. Chang, Y. Liu, S. Wang, Microchim. Acta., 147 (2004) 219
[21] K. Oshita, M. Oshima, Y. H. Gao, K. H. Lee, S. Motomizu, Anal. Sci., 18 (2002) 1121.
[22] Y. H. Gao, K. Oshita, K. H. Lee, M. Oshima, S. Motomizu, Analyst, 127 (2002) 1713.
[23] K. Oshita, Y. H. Gao, Oshima M, S. Motomizu, Anal. Sci. (Supplement), 17 (2001) a317.
[24] T. Y. Hsien, G. L. Rorrer, Ind. Eng. Chem. Res., 36 (1997), 3631–3638.
[25] K. Oshita, J. Xu, Y. H. Gao, K. H. Lee, M. Oshima, S. Motomizu, Bull. Chem. Soc. Jpn.,
76 (2003) 1555
[26] K. Oshita, M. Oshima, Y. Gao, K.H. Lee , S. Motomizu, Analytica Chimica Acta, 480
(2003) 239
[27] S. Yamakawa, K. Oshita, A. Sabarudin, M. Oshima, S. Motomizu, Bunseki Kagaku, 53
(2004) 1039.
[28] A. Sabarudin, K. Oshita, M. Oshima, S. Motomizu, Talanta, 66 (2005)136
[29] A. Sabarudin, K. Oshita, M. Oshima, S. Motomizu, Anal. Chim. Acta, 542 ( 2005) 207
20
[30] S. Hirata, T. Kajiya, N. Takano, M. Aihara, K. Honda, O. Shikino, E. Nakayama, Anal.
Chim. Acta, 499 (2003) 157
[31] T. Kajiya, M. Aihara, S. Hirata, Spectrochim. Acta part B, 59 (2004) 543
[32] A. O. Martins, E. D. Silva, E. Carasek, N. S. Gonçalves, M. C. M, Laranjeira, V. T.
Fávere, Anal. Chim. Acta, 521 (2004) 157
[33] C.R.T. Tarley, S.L.C. Ferreira, M.A.Z. Arruda, Microchem. J, 77 (2004) 163
[34] E.L. Silva, D. Budziak, E. Carasek, Anal. Lett., 37 (2004) 1909
[35] V.A. Lemos, J.S. Santos, P.X. Baliza, Sep. Sci. Technol., 39 (2004) 3317
[36] Z.H. Wang, Z.P. Zhang, Z.P. Wang, L.W. Liu, X.P. Yan, Anal. Chim. Acta, 514 (2004)
151
[37] V.A. Lemos, D.G. da Silva, A.L. de Carvalho, D.A Santana, G.S. Novaes, A.S. dos Passos,
Microchem. J., 84 (2006) 14
[38] J. Ruzicka, M.D. Marshall, Anal. Chim. Acta 237 (1990) 329
[39] J. Wang, E.H. Hansen, J. Anal. At. Spectrom 17 (2002) 1284
[40] S. Suteerapatarapon, J. Jakmunee, Y. Vaneesorn, K. Grudpan, Talanta, 58 (2002) 1235.
[41] A. Economou, A.Voulgaropoulos, J. Autom. Methods Manage. Chem, 25 (2003) 133.
[42] David R. Lide, Handbook of Chemistry and Physics, CRC press, New York, 81st edition,
2000, p 8-51.
[43] Y. Gao, K.H. Lee, M. Oshima, S. Motomizu, Anal. Sci., 16 (2000) 1303
21
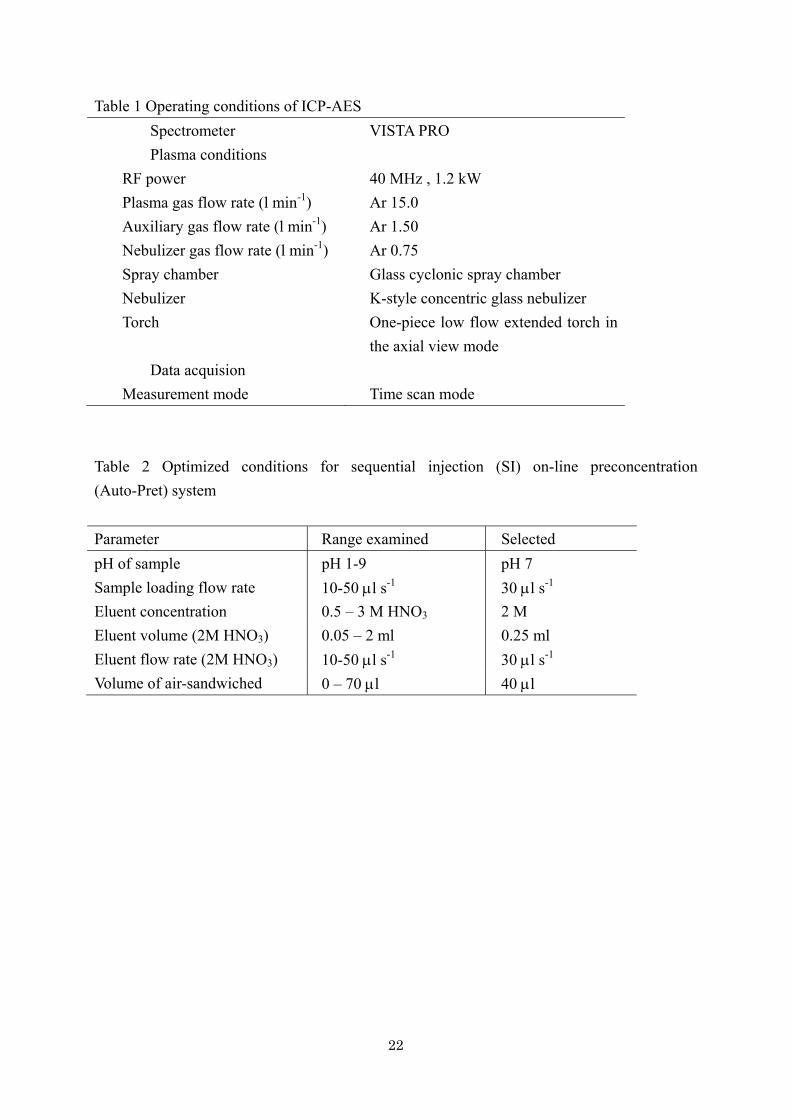
Table 1 Operating conditions of ICP-AES Spectrometer VISTA PRO Plasma conditions
RF power 40 MHz , 1.2 kW Plasma gas flow rate (l min-1) Ar 15.0 Auxiliary gas flow rate (l min-1) Ar 1.50 Nebulizer gas flow rate (l min-1) Ar 0.75 Spray chamber Glass cyclonic spray chamber Nebulizer K-style concentric glass nebulizer Torch One-piece low flow extended torch in
the axial view mode Data acquision
Measurement mode Time scan mode Table 2 Optimized conditions for sequential injection (SI) on-line preconcentration (Auto-Pret) system
Parameter Range examined Selected pH of sample pH 1-9 pH 7 Sample loading flow rate 10-50 μl s-1 30 μl s-1 Eluent concentration 0.5 – 3 M HNO3 2 M Eluent volume (2M HNO3) 0.05 – 2 ml 0.25 ml Eluent flow rate (2M HNO3) 10-50 μl s-1 30 μl s-1 Volume of air-sandwiched 0 – 70 μl 40 μl
22
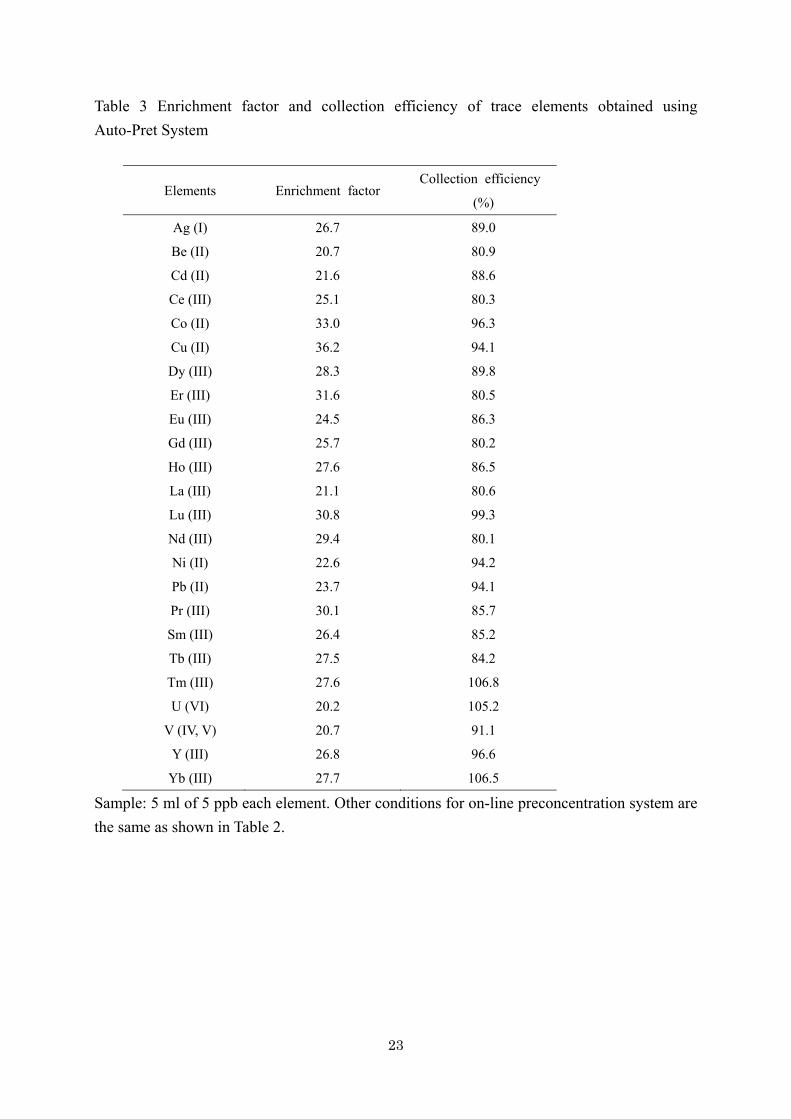
Table 3 Enrichment factor and collection efficiency of trace elements obtained using Auto-Pret System
Elements Enrichment factor Collection efficiency
(%)
Ag (I) 26.7 89.0
Be (II) 20.7 80.9
Cd (II) 21.6 88.6
Ce (III) 25.1 80.3
Co (II) 33.0 96.3
Cu (II) 36.2 94.1
Dy (III) 28.3 89.8
Er (III) 31.6 80.5
Eu (III) 24.5 86.3
Gd (III) 25.7 80.2
Ho (III) 27.6 86.5
La (III) 21.1 80.6
Lu (III) 30.8 99.3
Nd (III) 29.4 80.1
Ni (II) 22.6 94.2
Pb (II) 23.7 94.1
Pr (III) 30.1 85.7
Sm (III) 26.4 85.2
Tb (III) 27.5 84.2
Tm (III) 27.6 106.8
U (VI) 20.2 105.2
V (IV, V) 20.7 91.1
Y (III) 26.8 96.6
Yb (III) 27.7 106.5
Sample: 5 ml of 5 ppb each element. Other conditions for on-line preconcentration system are the same as shown in Table 2.
23
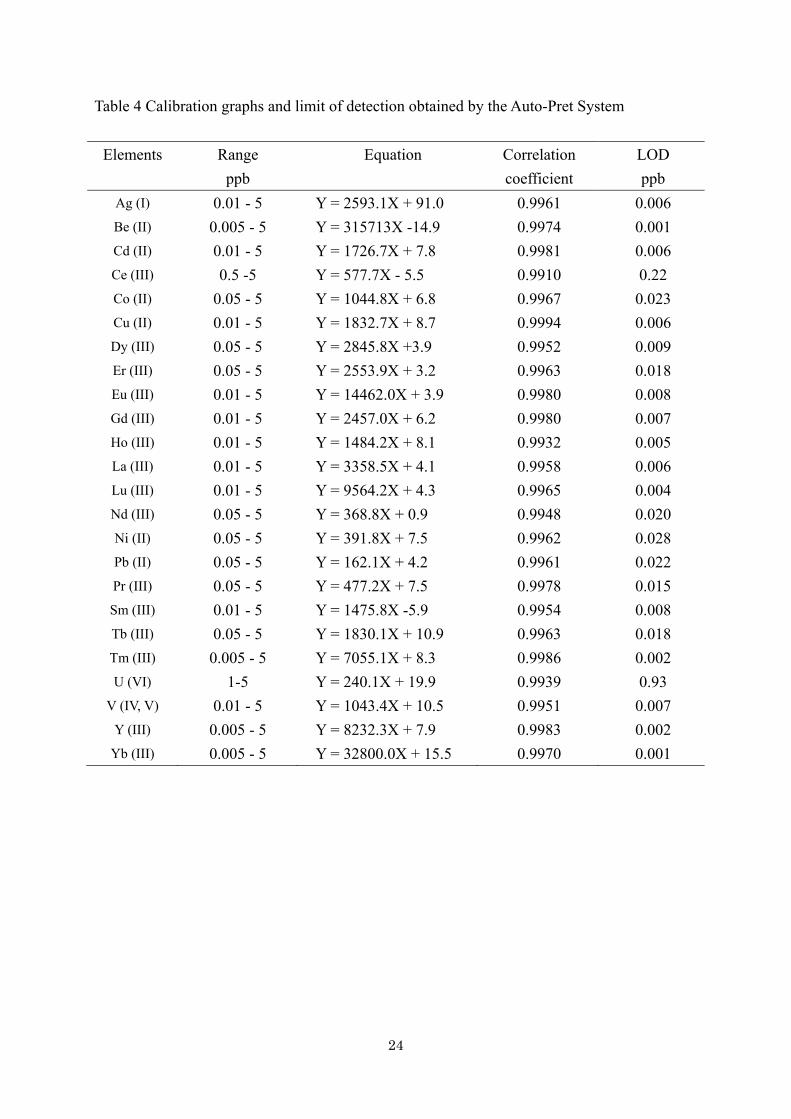
Table 4 Calibration graphs and limit of detection obtained by the Auto-Pret System
Elements Range ppb
Equation Correlation coefficient
LOD ppb
Ag (I) 0.01 - 5 Y = 2593.1X + 91.0 0.9961 0.006 Be (II) 0.005 - 5 Y = 315713X -14.9 0.9974 0.001 Cd (II) 0.01 - 5 Y = 1726.7X + 7.8 0.9981 0.006 Ce (III) 0.5 -5 Y = 577.7X - 5.5 0.9910 0.22 Co (II) 0.05 - 5 Y = 1044.8X + 6.8 0.9967 0.023 Cu (II) 0.01 - 5 Y = 1832.7X + 8.7 0.9994 0.006 Dy (III) 0.05 - 5 Y = 2845.8X +3.9 0.9952 0.009 Er (III) 0.05 - 5 Y = 2553.9X + 3.2 0.9963 0.018 Eu (III) 0.01 - 5 Y = 14462.0X + 3.9 0.9980 0.008 Gd (III) 0.01 - 5 Y = 2457.0X + 6.2 0.9980 0.007 Ho (III) 0.01 - 5 Y = 1484.2X + 8.1 0.9932 0.005 La (III) 0.01 - 5 Y = 3358.5X + 4.1 0.9958 0.006 Lu (III) 0.01 - 5 Y = 9564.2X + 4.3 0.9965 0.004 Nd (III) 0.05 - 5 Y = 368.8X + 0.9 0.9948 0.020 Ni (II) 0.05 - 5 Y = 391.8X + 7.5 0.9962 0.028 Pb (II) 0.05 - 5 Y = 162.1X + 4.2 0.9961 0.022 Pr (III) 0.05 - 5 Y = 477.2X + 7.5 0.9978 0.015 Sm (III) 0.01 - 5 Y = 1475.8X -5.9 0.9954 0.008 Tb (III) 0.05 - 5 Y = 1830.1X + 10.9 0.9963 0.018 Tm (III) 0.005 - 5 Y = 7055.1X + 8.3 0.9986 0.002 U (VI) 1-5 Y = 240.1X + 19.9 0.9939 0.93
V (IV, V) 0.01 - 5 Y = 1043.4X + 10.5 0.9951 0.007 Y (III) 0.005 - 5 Y = 8232.3X + 7.9 0.9983 0.002
Yb (III) 0.005 - 5 Y = 32800.0X + 15.5 0.9970 0.001
24
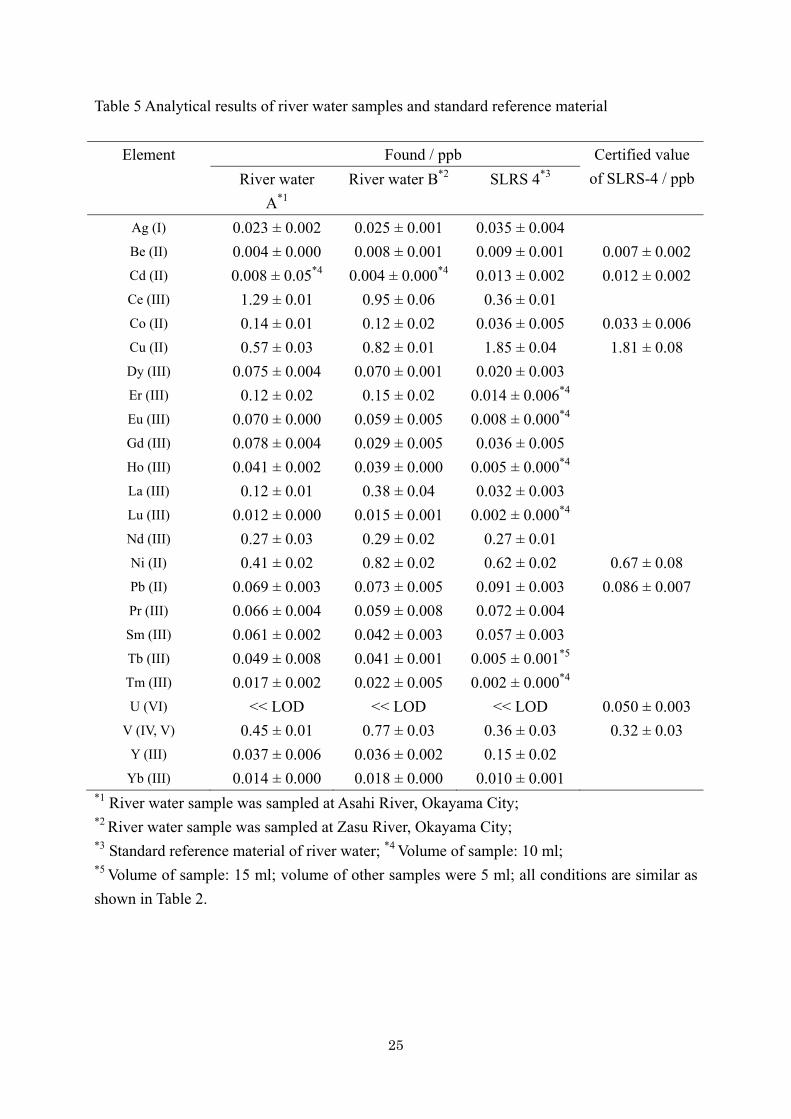
Table 5 Analytical results of river water samples and standard reference material
Element Found / ppb Certified value of SLRS-4 / ppbRiver water
A*1 River water B*2 SLRS 4*3
Ag (I) 0.023 ± 0.002 0.025 ± 0.001 0.035 ± 0.004 Be (II) 0.004 ± 0.000 0.008 ± 0.001 0.009 ± 0.001 0.007 ± 0.002 Cd (II) 0.008 ± 0.05*4 0.004 ± 0.000*4 0.013 ± 0.002 0.012 ± 0.002 Ce (III) 1.29 ± 0.01 0.95 ± 0.06 0.36 ± 0.01 Co (II) 0.14 ± 0.01 0.12 ± 0.02 0.036 ± 0.005 0.033 ± 0.006 Cu (II) 0.57 ± 0.03 0.82 ± 0.01 1.85 ± 0.04 1.81 ± 0.08 Dy (III) 0.075 ± 0.004 0.070 ± 0.001 0.020 ± 0.003 Er (III) 0.12 ± 0.02 0.15 ± 0.02 0.014 ± 0.006*4 Eu (III) 0.070 ± 0.000 0.059 ± 0.005 0.008 ± 0.000*4 Gd (III) 0.078 ± 0.004 0.029 ± 0.005 0.036 ± 0.005 Ho (III) 0.041 ± 0.002 0.039 ± 0.000 0.005 ± 0.000*4 La (III) 0.12 ± 0.01 0.38 ± 0.04 0.032 ± 0.003 Lu (III) 0.012 ± 0.000 0.015 ± 0.001 0.002 ± 0.000*4 Nd (III) 0.27 ± 0.03 0.29 ± 0.02 0.27 ± 0.01 Ni (II) 0.41 ± 0.02 0.82 ± 0.02 0.62 ± 0.02 0.67 ± 0.08 Pb (II) 0.069 ± 0.003 0.073 ± 0.005 0.091 ± 0.003 0.086 ± 0.007 Pr (III) 0.066 ± 0.004 0.059 ± 0.008 0.072 ± 0.004 Sm (III) 0.061 ± 0.002 0.042 ± 0.003 0.057 ± 0.003 Tb (III) 0.049 ± 0.008 0.041 ± 0.001 0.005 ± 0.001*5 Tm (III) 0.017 ± 0.002 0.022 ± 0.005 0.002 ± 0.000*4 U (VI) << LOD << LOD << LOD 0.050 ± 0.003
V (IV, V) 0.45 ± 0.01 0.77 ± 0.03 0.36 ± 0.03 0.32 ± 0.03 Y (III) 0.037 ± 0.006 0.036 ± 0.002 0.15 ± 0.02
Yb (III) 0.014 ± 0.000 0.018 ± 0.000 0.010 ± 0.001 *1 River water sample was sampled at Asahi River, Okayama City; *2 River water sample was sampled at Zasu River, Okayama City; *3 Standard reference material of river water; *4 Volume of sample: 10 ml; *5 Volume of sample: 15 ml; volume of other samples were 5 ml; all conditions are similar as shown in Table 2.
25
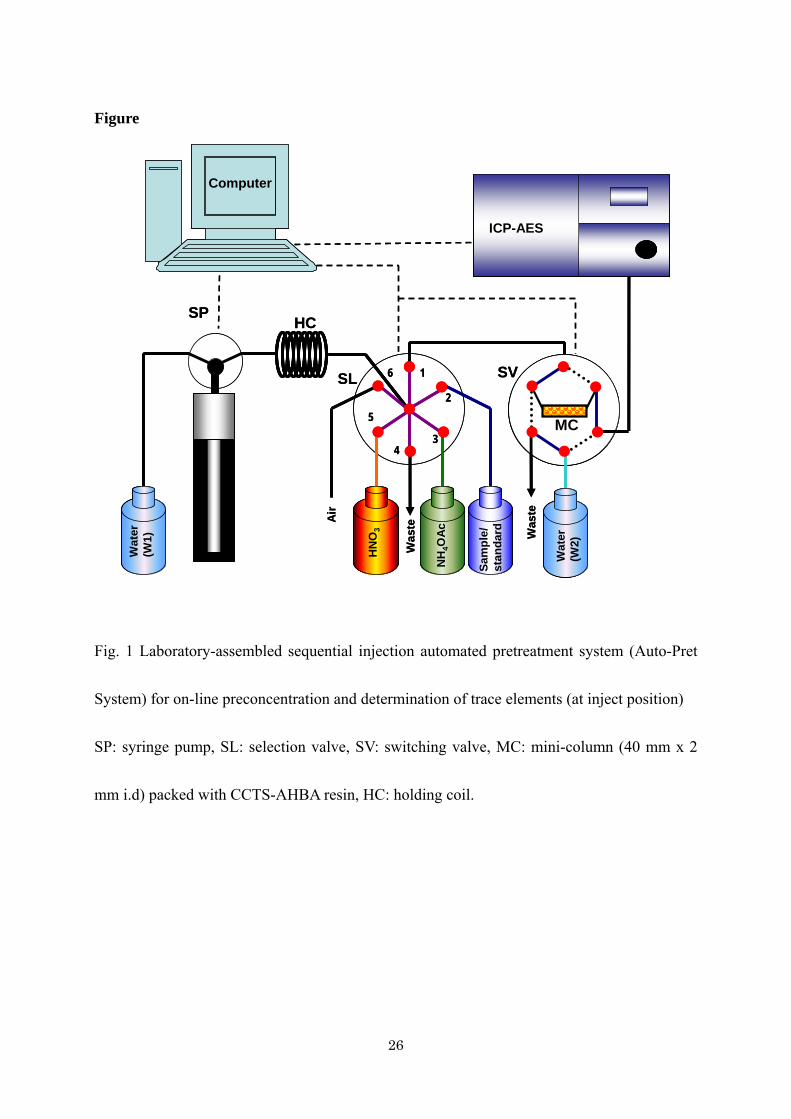
Figure W
ater
(W
1)
Sam
ple/
stan
dard
HN
O3
Air
HC
SL SV1
2
34
5
6
SP
MCW
aste
Computer
ICP-AES
Wat
er
(W2)
Was
te
NH
4OAc
Wat
er
(W1)
Sam
ple/
stan
dard
HN
O3
Air
HC
SL SV1
2
34
5
6
SP
MCW
aste
Computer
ICP-AES
Wat
er
(W2)
Was
te
NH
4OAc
Fig. 1 Laboratory-assembled sequential injection automated pretreatment system (Auto-Pret
System) for on-line preconcentration and determination of trace elements (at inject position)
SP: syringe pump, SL: selection valve, SV: switching valve, MC: mini-column (40 mm x 2
mm i.d) packed with CCTS-AHBA resin, HC: holding coil.
26
NH2
HOOC
OHCHO
MeOHr.t, 12h, stir
HOOC
OH
NHC
AHBA
O O
C H 2
O
N H
n
C ro s s - lin k in g
C H 2 -C H -C H 2 -C l
O H
O H
CH2-CH-CH2-O-CH2OH
Dioxane, NaOH 2M,stir, reflux 3h
N
COOH
O CH
O O
CH2
O
NH
n
Cross-linking
CH2-CH-CH2-
OH
OH
CH2-CH-CH2-O-CH2OH
HClr.t, 12 h,stir
NH2
COOH
O
O O
CH2
O
NH
n
Cross-linking
CH2-CH-CH2-
OH
OH
CH2-CH-CH2-O-CH2OH
CCTS-AHBA resin
CCTS with the arm of chloromethyloxirane
NH2
HOOC
OHCHO
MeOHr.t, 12h, stir
HOOC
OH
NHC
AHBA
O O
C H 2
O
N H
n
C ro s s - lin k in g
C H 2 -C H -C H 2 -C l
O H
O H
CH2-CH-CH2-O-CH2OH
O O
C H 2
O
N H
n
C ro s s - lin k in g
C H 2 -C H -C H 2 -C l
O H
O H
CH2-CH-CH2-O-CH2OH
Dioxane, NaOH 2M,stir, reflux 3h
N
COOH
O CH
O O
CH2
O
NH
n
Cross-linking
CH2-CH-CH2-
OH
OH
CH2-CH-CH2-O-CH2OH
N
COOH
O CH
O O
CH2
O
NH
n
Cross-linking
CH2-CH-CH2-
OH
OH
CH2-CH-CH2-O-CH2OH
HClr.t, 12 h,stir
NH2
COOH
O
O O
CH2
O
NH
n
Cross-linking
CH2-CH-CH2-
OH
OH
CH2-CH-CH2-O-CH2OH
NH2
COOH
O
O O
CH2
O
NH
n
Cross-linking
CH2-CH-CH2-
OH
OH
CH2-CH-CH2-O-CH2OH
CCTS-AHBA resin
CCTS with the arm of chloromethyloxirane
Fig. 2 Synthesis scheme of CCTS-AHBA resin
CCTS: cross-linked chitosan;
AHBA: 2-amino-5-hydroxy benzoic acid;
CCTS-AHBA : cross-linked chitosan possessing 2-amino-5-hydroxy benzoic acid moiety;
27
4.5 5.9 7.2
pKa1 : 5.83
pKa2: 8.50
A
B
C
D
E
0.10 M NaOH added/ ml
pH
0 12
12
6
Titration Curve
Differentiationcurve
4.5 5.9 7.2
pKa1 : 5.83
pKa2: 8.50
A
B
C
D
E
0.10 M NaOH added/ ml
pH
0 12
12
6
Titration Curve
Differentiationcurve
Fig. 3 Acid-base titration curve of the CCTS-AHBA resin
A sample solution for the titration contains 1 mL of the CCTS-AHBA resin (wet volume, 0.18
dry weight), 3 mL of 0.1 M HCl and 27 mL of the ultrapure water.
A: the inflection point of HCl and –COOH group of the resin; B, C: the inflection point of
–NH2 and –NH- group of CCTS-AHBA resin; D, E: the half point of the equivalent points.
28
Li
Na
K
Rb
Cs
Mg
Ca
Sr
Ba
Sc
Zr
Hf
Nb
Ta
Nd
W
Mn
Sm Eu
Fe
Rh
Ru
Co
Pd
Pt
Y
Ac
Ce
Pa
Pr
Pm
Tc
Re
Np
Os
Pu
Ir
Am Cm
Gd
C
Si
N
P
O
S
Au
Dy
Zn
Cd
Hg
Cf
Er Tm
As Se
Po
Bk
Tb Ho
Tl
Es Fm Md
LuYb
Be
Th
V Cr
Mo
U
Ni
Ti
Al
Cu
Ag
Ga Ge
SbSn TeIn
Pb Bi
B
La
No Lr
F
Cl
Br
I
At
Ne
Ar
Kr
Xe
Rn
He
Lanthanide
Actinide
Rec
over
y (%
)
50
100Pb
pH1 2 3 4 5 6 7 8 9
Rec
over
y (%
)
50
100Pb
pH1 2 3 4 5 6 7 8 9
Fig. 4 Adsorption behavior of trace elements at various pHs with CCTS-AHBA resin.
Concentration of each element in the samples: 5 ppb; eluent: 2M HNO3.
29