Study on Adsorption Performance of Benzoic Acid in ... - MDPI
13
Article Study on Adsorption Performance of Benzoic Acid in Cyclocarya paliurus Extract by Ethyl Cellulose Microspheres Yamin Zhao 1,2,3, *, Lujun Zhang 1,2,3 , Xiaoxue Zhai 1,2,3 , Qian Liu 1,2,3 , Lebing Sun 1,2,3 , Mengshi Liu 1,2,3 , Lili An 1,2,3 , Liang Xian 1,2,3 , Ping Zhang 1,2,3 and Lihua Chen 1,2,3 Citation: Zhao, Y.; Zhang, L.; Zhai, X.; Liu, Q.; Sun, L.; Liu, M.; An, L.; Xian, L.; Zhang, P.; Chen, L. Study on Adsorption Performance of Benzoic Acid in Cyclocarya paliurus Extract by Ethyl Cellulose Microspheres. Chemistry 2021, 3, 1113–1125. https://doi.org/10.3390/ chemistry3040081 Academic Editors: Aldo Todaro, Krystian Marszalek and Simona Fabroni Received: 29 August 2021 Accepted: 28 September 2021 Published: 1 October 2021 Publisher’s Note: MDPI stays neutral with regard to jurisdictional claims in published maps and institutional affil- iations. Copyright: © 2021 by the authors. Licensee MDPI, Basel, Switzerland. This article is an open access article distributed under the terms and conditions of the Creative Commons Attribution (CC BY) license (https:// creativecommons.org/licenses/by/ 4.0/). 1 School of Chemical Engineering, Northwest Minzu University, Lanzhou 730030, China; [email protected] (L.Z.); [email protected] (X.Z.); [email protected] (Q.L.); [email protected] (L.S.); [email protected] (M.L.); [email protected] (L.A.); [email protected] (L.X.); [email protected] (P.Z.); [email protected] (L.C.) 2 Key Laboratory for Utility of Environment-Friendly Composite Materials and Biomass in Universities of Gansu Province, Lanzhou 730030, China 3 Key Laboratory of Environment-Friendly Composite Materials of the State Ethnic Affairs Commission, Lanzhou 730030, China * Correspondence: [email protected] Abstract: Polymer microspheres with inter-connecting pores are widely used as microsphere ma- terials. In the study, the ethyl cellulose microspheres (ECM) were prepared by using the solvent- evaporation method. Based on that, a method for the separation and purification of benzoic acid from crude extract of Cyclocarya paliurus was established by the ECM and high performance liquid chro- matography (HPLC). The ECM after the sorption equilibrium was desorbed by using 40% methanol as the analytical solvent. The content of benzoic acid in eluent is up to 0.0216 mg/mL, and the benzoic acid can be obtained with a high purity of 82.22%. Furthermore, the adsorption-desorption behavior of benzoic acid onto ECM was investigated. The results of adsorption kinetics of benzoic acid showed that the adsorption followed the pseudo-first-order kinetic model. The ECM was characterized by using Fourier transform infrared spectroscopy (FTIR), thermogravimetric analysis (TGA), scanning electron microscope (SEM), and X-ray diffraction (XRD). The results showed that the ECM has a high adsorption property due to its more porous structure, phenolic hydroxyl group, and other oxygen-containing functional groups. This method and the ECM can be used stably, continuously, and efficiently to purify the benzoic acid from the methanol extract of C. paliurus on a large scale. Keywords: ethyl cellulose microspheres (ECM); HPLC; adsorption-desorption; benzoic acid; Cyclocarya paliurus 1. Introduction The increasingly prominent environmental problems have promoted the utilization ef- ficiency of natural resources [1]. As the abundant and inexpensive renewable resource in na- ture, cellulose is the second largest source of energy in the world after water. Cellulose have strong adsorption because of a large amount of hydroxyl groups and oxygen-containing groups on its surface [2]. Ethyl cellulose (EC), as a kind of important derivative from cellulose, is nontoxic, stable, solvent-soluble, and has good plasticity and high mechanical intensity [3–5]. At present, EC has been widely used in many fields as a macromolecular material with excellent biocompatibility [6]. In addition, EC shows good film-forming per- formance and the prepared films have been widely used in many fields, such as biological separation, microcapsule materials, and crystal orientation [7–10]. Due to its biodegradable, antimicrobial effect, higher bioactivity, and so on, EC as an ideal carrier material can be used to control the release drug delivery system [11,12]. The surface area of microspheres consists of two parts: the external surface area and the surface area of internal pore wall [13]. At present, porous polymer microspheres are Chemistry 2021, 3, 1113–1125. https://doi.org/10.3390/chemistry3040081 https://www.mdpi.com/journal/chemistry
-
Upload
khangminh22 -
Category
Documents
-
view
0 -
download
0
Transcript of Study on Adsorption Performance of Benzoic Acid in ... - MDPI
Article
Study on Adsorption Performance of Benzoic Acid inCyclocarya paliurus Extract by Ethyl Cellulose Microspheres
Yamin Zhao 1,2,3,*, Lujun Zhang 1,2,3, Xiaoxue Zhai 1,2,3, Qian Liu 1,2,3, Lebing Sun 1,2,3, Mengshi Liu 1,2,3,Lili An 1,2,3, Liang Xian 1,2,3, Ping Zhang 1,2,3 and Lihua Chen 1,2,3
�����������������
Citation: Zhao, Y.; Zhang, L.; Zhai,
X.; Liu, Q.; Sun, L.; Liu, M.; An, L.;
Xian, L.; Zhang, P.; Chen, L. Study on
Adsorption Performance of Benzoic
Acid in Cyclocarya paliurus Extract by
Ethyl Cellulose Microspheres.
Chemistry 2021, 3, 1113–1125.
https://doi.org/10.3390/
chemistry3040081
Academic Editors: Aldo Todaro,
Krystian Marszałek and
Simona Fabroni
Received: 29 August 2021
Accepted: 28 September 2021
Published: 1 October 2021
Publisher’s Note: MDPI stays neutral
with regard to jurisdictional claims in
published maps and institutional affil-
iations.
Copyright: © 2021 by the authors.
Licensee MDPI, Basel, Switzerland.
This article is an open access article
distributed under the terms and
conditions of the Creative Commons
Attribution (CC BY) license (https://
creativecommons.org/licenses/by/
4.0/).
1 School of Chemical Engineering, Northwest Minzu University, Lanzhou 730030, China;[email protected] (L.Z.); [email protected] (X.Z.); [email protected] (Q.L.);[email protected] (L.S.); [email protected] (M.L.); [email protected] (L.A.);[email protected] (L.X.); [email protected] (P.Z.); [email protected] (L.C.)
2 Key Laboratory for Utility of Environment-Friendly Composite Materials and Biomass in Universities ofGansu Province, Lanzhou 730030, China
3 Key Laboratory of Environment-Friendly Composite Materials of the State Ethnic Affairs Commission,Lanzhou 730030, China
* Correspondence: [email protected]
Abstract: Polymer microspheres with inter-connecting pores are widely used as microsphere ma-terials. In the study, the ethyl cellulose microspheres (ECM) were prepared by using the solvent-evaporation method. Based on that, a method for the separation and purification of benzoic acid fromcrude extract of Cyclocarya paliurus was established by the ECM and high performance liquid chro-matography (HPLC). The ECM after the sorption equilibrium was desorbed by using 40% methanolas the analytical solvent. The content of benzoic acid in eluent is up to 0.0216 mg/mL, and the benzoicacid can be obtained with a high purity of 82.22%. Furthermore, the adsorption-desorption behaviorof benzoic acid onto ECM was investigated. The results of adsorption kinetics of benzoic acid showedthat the adsorption followed the pseudo-first-order kinetic model. The ECM was characterized byusing Fourier transform infrared spectroscopy (FTIR), thermogravimetric analysis (TGA), scanningelectron microscope (SEM), and X-ray diffraction (XRD). The results showed that the ECM has ahigh adsorption property due to its more porous structure, phenolic hydroxyl group, and otheroxygen-containing functional groups. This method and the ECM can be used stably, continuously,and efficiently to purify the benzoic acid from the methanol extract of C. paliurus on a large scale.
Keywords: ethyl cellulose microspheres (ECM); HPLC; adsorption-desorption; benzoic acid;Cyclocarya paliurus
1. Introduction
The increasingly prominent environmental problems have promoted the utilization ef-ficiency of natural resources [1]. As the abundant and inexpensive renewable resource in na-ture, cellulose is the second largest source of energy in the world after water. Cellulose havestrong adsorption because of a large amount of hydroxyl groups and oxygen-containinggroups on its surface [2]. Ethyl cellulose (EC), as a kind of important derivative fromcellulose, is nontoxic, stable, solvent-soluble, and has good plasticity and high mechanicalintensity [3–5]. At present, EC has been widely used in many fields as a macromolecularmaterial with excellent biocompatibility [6]. In addition, EC shows good film-forming per-formance and the prepared films have been widely used in many fields, such as biologicalseparation, microcapsule materials, and crystal orientation [7–10]. Due to its biodegradable,antimicrobial effect, higher bioactivity, and so on, EC as an ideal carrier material can beused to control the release drug delivery system [11,12].
The surface area of microspheres consists of two parts: the external surface area andthe surface area of internal pore wall [13]. At present, porous polymer microspheres are
Chemistry 2021, 3, 1113–1125. https://doi.org/10.3390/chemistry3040081 https://www.mdpi.com/journal/chemistry
Chemistry 2021, 3 1114
widely used in fields of pharmaceutical carriers, ionic adsorption, catalyst, drug controlledrelease, and so on [14–16]. Based on the above analysis, the natural polymer microspheresshould be used in chromatographic separation science due to its excellent biocompatibilityand strong adsorption.
Cyclocarya Paliurus (Batal.) Iljinskaja, as a kind of perennial herb plant from Juglan-daceae family, is an endemic tree growing on cloudy and foggy highlands in the Xiushuiarea of Southern China [17]. The leaves of C. Paliurus, commonly known as “sweet tea”,have been used as Chinese herbal medicine for thousands of years, and have beneficialeffects on health, remedying ailments, enhancing mental efficiency, and in recoveringfrom mental fatigue [18,19]. Modern pharmacology research confirmed that C. Paliurushas multiple biological activities, such as antihypertensive activity, hypolipidaemic, hy-poglycemic activity, enhancement of mental efficiency, and antioxidant activity [20–25].The constituents isolated from its leaves consist of protein, polysaccharides, triterpenoids,flavonoids, steroids, saponins, phenolic acids, etc. [26–29]. Among these compounds, theunique characteristics of its phenolic acids have drawn much attention.
Many studies have shown that phenolic acids can protect insulin-producing cells,improve insulin secretion, and promote the utilization of blood glucose as energy underpressure [30]. In the meanwhile, phenolic acids have been demonstrated to be effective forweight loss through suppression of fat absorption [31].
Up to now, many techniques have been applied to separate and ensure the purityof active ingredients in natural plant extracts, such as high-speed counter-current chro-matography, preparative column chromatography, electromigration, and supercritical fluidextraction [32–34]. However, these methods are not suitable for large-scale industrialproduction due to the low capacity and high production cost. Many researchers havefocused on the purification of the active ingredient by resin adsorption, natural materials,modified porous absorbents, and combination technologies. Nevertheless, to the best ofour knowledge, there have been few reports yet regarding the absorbent-filling processfor the separation and purification of the active ingredient, which as a method of suchintegrated process is still required. Therefore, it is of very important significance thatthere is separation and purification of active components in natural products by using theadsorption property of porous adsorbent materials.
The purpose of this work was to use the ethyl cellulose microspheres (ECM) forseparating and purifying benzoic acid from C. paliurus extract. By utilizing the adsorptionproperty of the ethyl cellulose microspheres (ECM), the purpose of crude extraction ofbenzoic acid from the extract of C. paliurus was finally achieved.
2. Materials and Methods2.1. Main Experimental Materials and Instruments
Ethyl cellulose (EC) (6 mPa s to 9 mPa s) was obtained from Aladdin Chemistry Co.Ltd. (Shanghai, China), polyvinyl alcohol (PVA) and trichloromethane were purchasedfrom Chengdu Kelong Chemical Reagent Factory, Chengdu, China. Dichloromethane andhexane were purchased from Tianjin Fengchuan Chemical Reagent Technology Co. Ltd.(Tianjin, China) HCOOH is analytically pure. CH3OH and acetonitrile are chromatograph-ically pure. Benzoic acid standard with a purity of 98% was purchased from ShanghaiShifeng Biotechnology Co., Ltd. (Shanghai, China) Distilled water was made by our school.
C. paliurus was identified by Xiao-jun Yang (College of Chemical Engineering, North-west Minzu University, Lanzhou, China) and deposited in the college of chemical engineer-ing of Northwest Minzu University.
Agilent-1200 High Performance Liquid Chromatograph (Agilent Technologies, Cali-fornia, CA, USA); Nicolet 380 Fourier Transform Infrared Spectrometer (American Ther-moelectric Corporation, Waltham, MA, USA); TGA1 Thermogravimetric Analyzer (MET-TLER, Switzerland); EVO18 scanning electron microscope (Zeiss, Jena, Germany); SHA-BAtype water bath constant temperature oscillator (Fip Experimental Instrument Factory,Changzhou, China); TDL-4 desktop centrifuge (Precision Instrument Co., Ltd., Shang-
Chemistry 2021, 3 1115
hai, China); AS3120 ultrasonic cleaning instrument (Outsells Instrument Co., Ltd., Tian-jin, China); PW135 high-speed pulverizer (Taisite Instrument Co., Ltd., Tianjin, China;Advanced-I-24L ultra-pure water machine (Aike Water Treatment Equipment Co., Ltd.,Chengdu, China); 0.45 µm microporous membrane (Xingya Purification Materials Factory,Shanghai, China); and 5 mL syringe (Huada Medical Devices Co., Ltd., Jiangsu, China).
2.2. Pretreatment of ECM
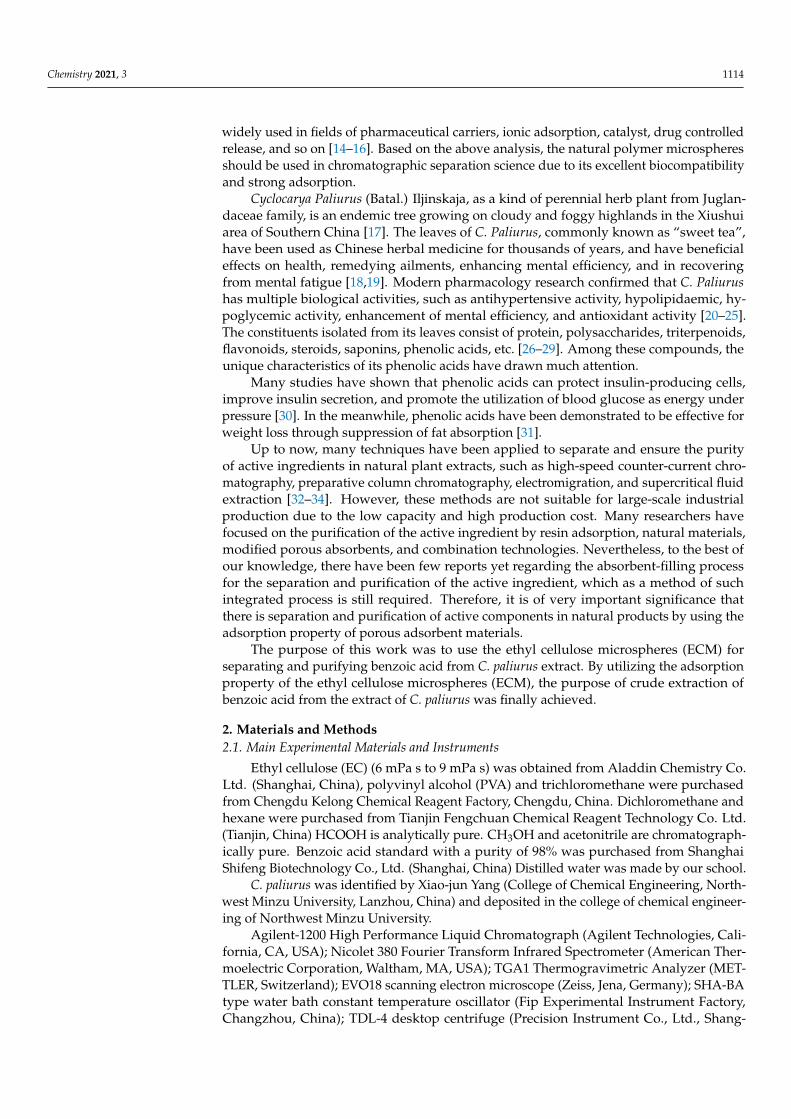
In this experiment, ECM was prepared by the method of solvent evaporation [35]. Inaddition, the production process of ECM is shown in Figure 1.
Chemistry 2021, 3, FOR PEER REVIEW 3
moelectric Corporation, Waltham, MA, USA); TGA1 Thermogravimetric Analyzer (MET-TLER, Switzerland); EVO18 scanning electron microscope (Zeiss, Jena, Germany); SHA-BA type water bath constant temperature oscillator (Fip Experimental Instrument Factory, Changzhou, China); TDL-4 desktop centrifuge (Precision Instrument Co., Ltd., Shanghai, China); AS3120 ultrasonic cleaning instrument (Outsells Instrument Co., Ltd., Tianjin, China); PW135 high-speed pulverizer (Taisite Instrument Co., Ltd, Tianjin, China.; Ad-vanced-I-24L ultra-pure water machine (Aike Water Treatment Equipment Co., Ltd, Chengdu, China.); 0.45 μm microporous membrane (Xingya Purification Materials Fac-tory, Shanghai, China); and 5 mL syringe (Huada Medical Devices Co., Ltd, Jiangsu, China).
2.2. Pretreatment of ECM In this experiment, ECM was prepared by the method of solvent evaporation [35]. In
addition, the production process of ECM is shown in Figure 1. Two-hundred-and-eighty grams of polyvinyl alcohol (PVA) solution with the mass
fraction of 0.5% was weighed precisely and placed in a three-necked flask. The system of oil phase solution, which is transparent and homogeneous, was prepared with EC, di-chloromethane, trichloromethane, and hexane, according to the mass ratio of a certain amount. Then, the oil phase solution was pulled in PVA solution, and the system of mix-ture was agitated at the speed of 400 r/min and the temperature of 40 °C to insist 60 min. Subsequently, the temperature of the system was heated up to 70 °C to insist 120 min. Finally, the ECM was obtained though washing with distilled water and being dried.
Figure 1. Flow chart of preparation of ECM.
2.3. Structural Characterization of the ECM 2.3.1. Fourier Transform Infrared Spectroscopy (FTIR) Analysis
The Fourier transform infrared spectroscopy (FTIR) spectra of ECM in comparison with EC were performed in the range 400–4000 cm−1 at 64 scans with 4 cm−1 resolution using Nicolet 380 FTIR Spectrometer-American Thermoelectric Corporation. This analysis was employed to demonstrate the function groups of the EC and ECM.
2.3.2. Thermo Gravimetric Analyzer (TGA) Analysis TGA was used to study the thermodynamic properties of the material. The tempera-
ture ranged from 25 °C to 800 °C with the heating rate of 10 °C/min, using 20 mL/min high purity nitrogen as the carrier gas.
2.3.3. Scanning Electron Microscope (SEM) Analysis
Figure 1. Flow chart of preparation of ECM.
Two-hundred-and-eighty grams of polyvinyl alcohol (PVA) solution with the massfraction of 0.5% was weighed precisely and placed in a three-necked flask. The systemof oil phase solution, which is transparent and homogeneous, was prepared with EC,dichloromethane, trichloromethane, and hexane, according to the mass ratio of a certainamount. Then, the oil phase solution was pulled in PVA solution, and the system of mixturewas agitated at the speed of 400 r/min and the temperature of 40 ◦C to insist 60 min.Subsequently, the temperature of the system was heated up to 70 ◦C to insist 120 min.Finally, the ECM was obtained though washing with distilled water and being dried.
2.3. Structural Characterization of the ECM2.3.1. Fourier Transform Infrared Spectroscopy (FTIR) Analysis
The Fourier transform infrared spectroscopy (FTIR) spectra of ECM in comparisonwith EC were performed in the range 400–4000 cm−1 at 64 scans with 4 cm−1 resolutionusing Nicolet 380 FTIR Spectrometer-American Thermoelectric Corporation. This analysiswas employed to demonstrate the function groups of the EC and ECM.
2.3.2. Thermo Gravimetric Analyzer (TGA) Analysis
TGA was used to study the thermodynamic properties of the material. The tempera-ture ranged from 25 ◦C to 800 ◦C with the heating rate of 10 ◦C/min, using 20 mL/minhigh purity nitrogen as the carrier gas.
2.3.3. Scanning Electron Microscope (SEM) Analysis
SEM was used to observe the shape; size distribution; and surface topography of thematerial, high vacuum mode, and beam spot 5.0.
Chemistry 2021, 3 1116
2.3.4. X-ray Diffraction (XRD) Analysis
Analysis of EC and ECM crystal structures was cured out by execution of X-raydiffraction (XRD) using Thermo scientific diffractometer with a Cu Kα radiation source(λ = 0.154 nm).
2.4. Determination of the Benzoic Acid
In order to ensure that the measurement method was fast, stable, reproducible, andaccurate, the quantitative detection of C. paliurus extract before and after adsorption withECM was mainly carried out by HPLC. The chromatographic conditions were establishedas the following shows:
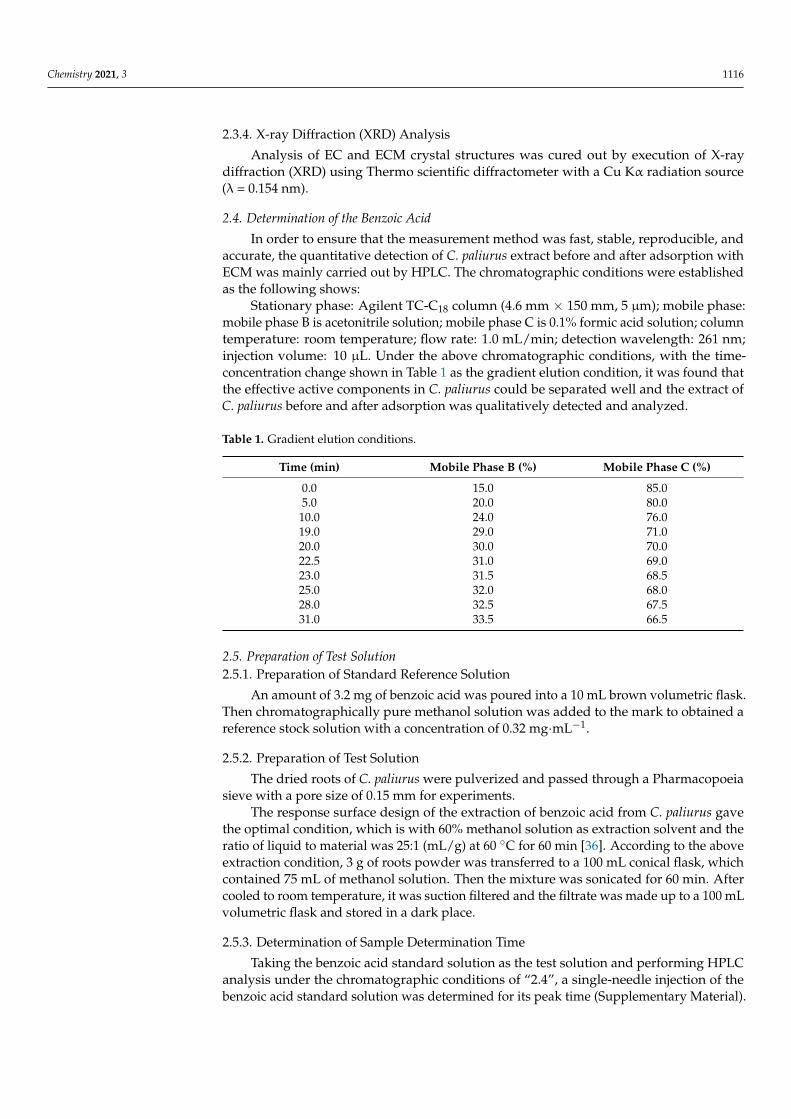
Stationary phase: Agilent TC-C18 column (4.6 mm × 150 mm, 5 µm); mobile phase:mobile phase B is acetonitrile solution; mobile phase C is 0.1% formic acid solution; columntemperature: room temperature; flow rate: 1.0 mL/min; detection wavelength: 261 nm;injection volume: 10 µL. Under the above chromatographic conditions, with the time-concentration change shown in Table 1 as the gradient elution condition, it was found thatthe effective active components in C. paliurus could be separated well and the extract ofC. paliurus before and after adsorption was qualitatively detected and analyzed.
Table 1. Gradient elution conditions.
Time (min) Mobile Phase B (%) Mobile Phase C (%)
0.0 15.0 85.05.0 20.0 80.0
10.0 24.0 76.019.0 29.0 71.020.0 30.0 70.022.5 31.0 69.023.0 31.5 68.525.0 32.0 68.028.0 32.5 67.531.0 33.5 66.5
2.5. Preparation of Test Solution2.5.1. Preparation of Standard Reference Solution
An amount of 3.2 mg of benzoic acid was poured into a 10 mL brown volumetric flask.Then chromatographically pure methanol solution was added to the mark to obtained areference stock solution with a concentration of 0.32 mg·mL−1.
2.5.2. Preparation of Test Solution
The dried roots of C. paliurus were pulverized and passed through a Pharmacopoeiasieve with a pore size of 0.15 mm for experiments.
The response surface design of the extraction of benzoic acid from C. paliurus gavethe optimal condition, which is with 60% methanol solution as extraction solvent and theratio of liquid to material was 25:1 (mL/g) at 60 ◦C for 60 min [36]. According to the aboveextraction condition, 3 g of roots powder was transferred to a 100 mL conical flask, whichcontained 75 mL of methanol solution. Then the mixture was sonicated for 60 min. Aftercooled to room temperature, it was suction filtered and the filtrate was made up to a 100 mLvolumetric flask and stored in a dark place.
2.5.3. Determination of Sample Determination Time
Taking the benzoic acid standard solution as the test solution and performing HPLCanalysis under the chromatographic conditions of “2.4”, a single-needle injection of thebenzoic acid standard solution was determined for its peak time (Supplementary Material).
Chemistry 2021, 3 1117
2.5.4. Investigation of Linear Relationship
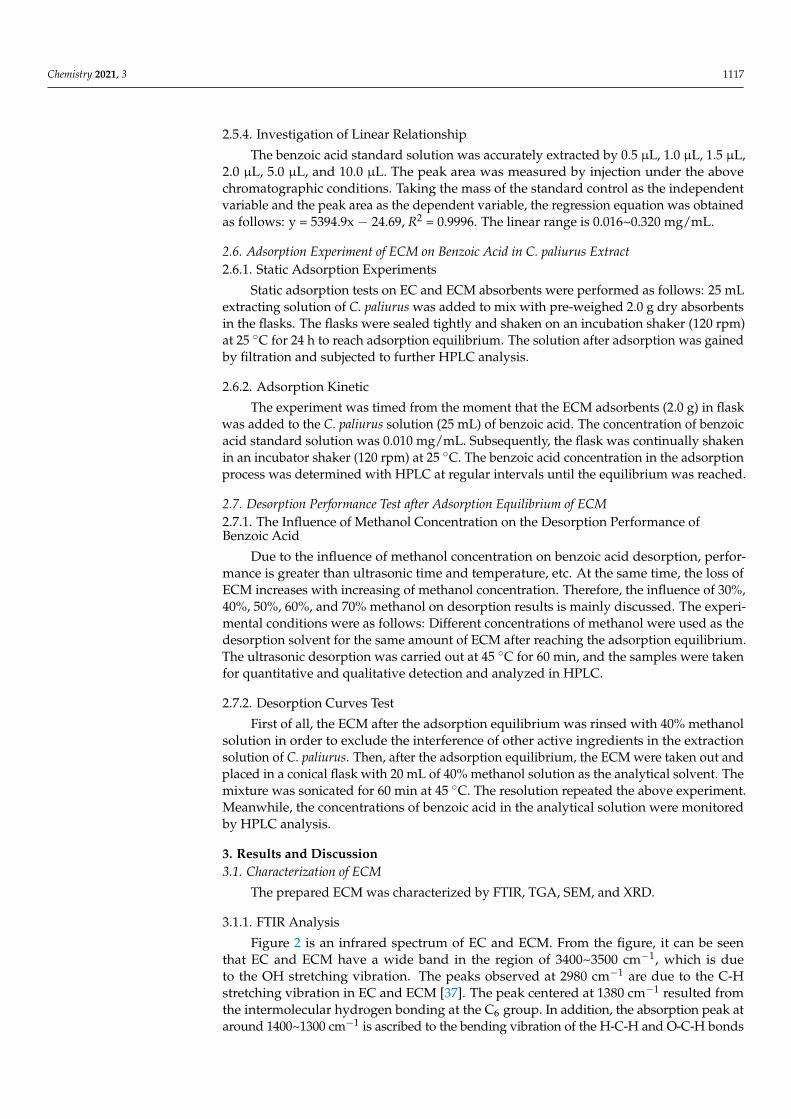
The benzoic acid standard solution was accurately extracted by 0.5 µL, 1.0 µL, 1.5 µL,2.0 µL, 5.0 µL, and 10.0 µL. The peak area was measured by injection under the abovechromatographic conditions. Taking the mass of the standard control as the independentvariable and the peak area as the dependent variable, the regression equation was obtainedas follows: y = 5394.9x − 24.69, R2 = 0.9996. The linear range is 0.016~0.320 mg/mL.
2.6. Adsorption Experiment of ECM on Benzoic Acid in C. paliurus Extract2.6.1. Static Adsorption Experiments
Static adsorption tests on EC and ECM absorbents were performed as follows: 25 mLextracting solution of C. paliurus was added to mix with pre-weighed 2.0 g dry absorbentsin the flasks. The flasks were sealed tightly and shaken on an incubation shaker (120 rpm)at 25 ◦C for 24 h to reach adsorption equilibrium. The solution after adsorption was gainedby filtration and subjected to further HPLC analysis.
2.6.2. Adsorption Kinetic
The experiment was timed from the moment that the ECM adsorbents (2.0 g) in flaskwas added to the C. paliurus solution (25 mL) of benzoic acid. The concentration of benzoicacid standard solution was 0.010 mg/mL. Subsequently, the flask was continually shakenin an incubator shaker (120 rpm) at 25 ◦C. The benzoic acid concentration in the adsorptionprocess was determined with HPLC at regular intervals until the equilibrium was reached.
2.7. Desorption Performance Test after Adsorption Equilibrium of ECM2.7.1. The Influence of Methanol Concentration on the Desorption Performance ofBenzoic Acid
Due to the influence of methanol concentration on benzoic acid desorption, perfor-mance is greater than ultrasonic time and temperature, etc. At the same time, the loss ofECM increases with increasing of methanol concentration. Therefore, the influence of 30%,40%, 50%, 60%, and 70% methanol on desorption results is mainly discussed. The experi-mental conditions were as follows: Different concentrations of methanol were used as thedesorption solvent for the same amount of ECM after reaching the adsorption equilibrium.The ultrasonic desorption was carried out at 45 ◦C for 60 min, and the samples were takenfor quantitative and qualitative detection and analyzed in HPLC.
2.7.2. Desorption Curves Test
First of all, the ECM after the adsorption equilibrium was rinsed with 40% methanolsolution in order to exclude the interference of other active ingredients in the extractionsolution of C. paliurus. Then, after the adsorption equilibrium, the ECM were taken out andplaced in a conical flask with 20 mL of 40% methanol solution as the analytical solvent. Themixture was sonicated for 60 min at 45 ◦C. The resolution repeated the above experiment.Meanwhile, the concentrations of benzoic acid in the analytical solution were monitoredby HPLC analysis.
3. Results and Discussion3.1. Characterization of ECM
The prepared ECM was characterized by FTIR, TGA, SEM, and XRD.
3.1.1. FTIR Analysis
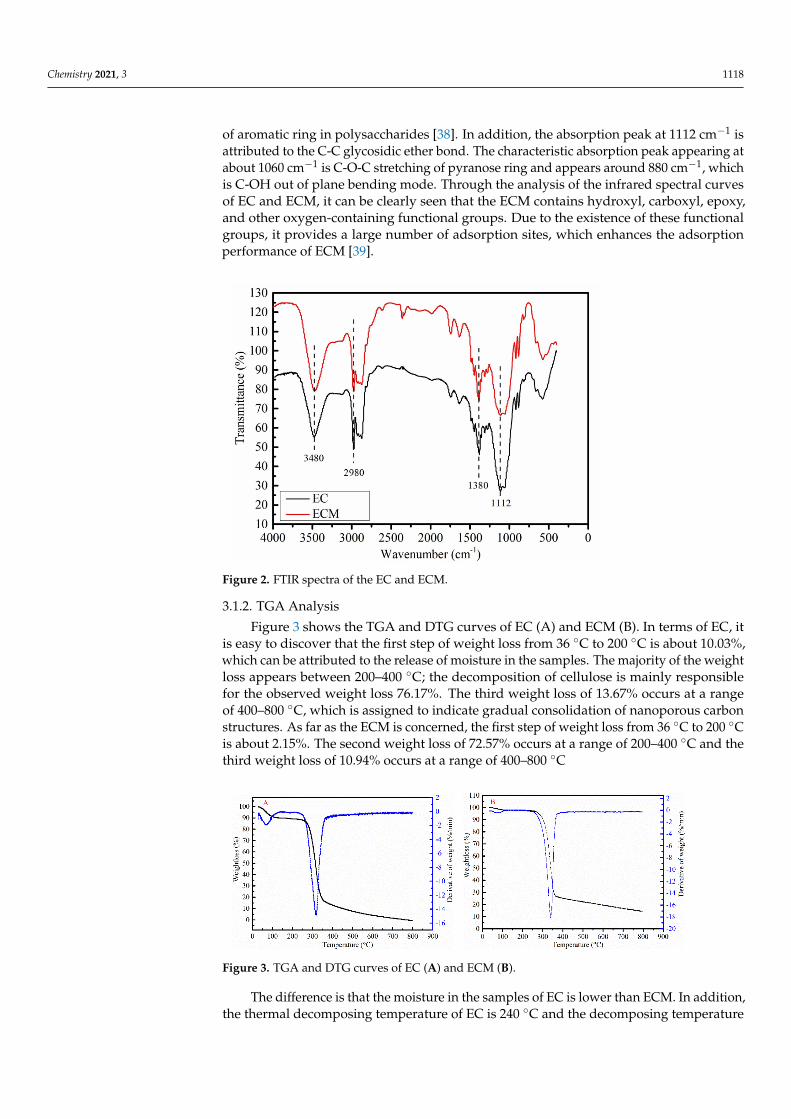
Figure 2 is an infrared spectrum of EC and ECM. From the figure, it can be seenthat EC and ECM have a wide band in the region of 3400~3500 cm−1, which is dueto the OH stretching vibration. The peaks observed at 2980 cm−1 are due to the C-Hstretching vibration in EC and ECM [37]. The peak centered at 1380 cm−1 resulted fromthe intermolecular hydrogen bonding at the C6 group. In addition, the absorption peak ataround 1400~1300 cm−1 is ascribed to the bending vibration of the H-C-H and O-C-H bonds
Chemistry 2021, 3 1118
of aromatic ring in polysaccharides [38]. In addition, the absorption peak at 1112 cm−1 isattributed to the C-C glycosidic ether bond. The characteristic absorption peak appearing atabout 1060 cm−1 is C-O-C stretching of pyranose ring and appears around 880 cm−1, whichis C-OH out of plane bending mode. Through the analysis of the infrared spectral curvesof EC and ECM, it can be clearly seen that the ECM contains hydroxyl, carboxyl, epoxy,and other oxygen-containing functional groups. Due to the existence of these functionalgroups, it provides a large number of adsorption sites, which enhances the adsorptionperformance of ECM [39].
Chemistry 2021, 3, FOR PEER REVIEW 6
3.1.1. FTIR Analysis Figure 2 is an infrared spectrum of EC and ECM. From the figure, it can be seen that
EC and ECM have a wide band in the region of 3400~3500 cm−1, which is due to the OH stretching vibration. The peaks observed at 2980 cm−1 are due to the C-H stretching vibra-tion in EC and ECM [37]. The peak centered at 1380 cm−1 resulted from the intermolecular hydrogen bonding at the C6 group. In addition, the absorption peak at around 1400~1300 cm−1 is ascribed to the bending vibration of the H-C-H and O-C-H bonds of aromatic ring in polysaccharides [38]. In addition, the absorption peak at 1112 cm−1 is attributed to the C-C glycosidic ether bond. The characteristic absorption peak appearing at about 1060 cm−1 is C-O-C stretching of pyranose ring and appears around 880 cm−1, which is C-OH out of plane bending mode. Through the analysis of the infrared spectral curves of EC and ECM, it can be clearly seen that the ECM contains hydroxyl, carboxyl, epoxy, and other oxygen-containing functional groups. Due to the existence of these functional groups, it provides a large number of adsorption sites, which enhances the adsorption performance of ECM [39].
Figure 2. FTIR spectra of the EC and ECM.
3.1.2. TGA Analysis Figure 3 shows the TGA and DTG curves of EC (A) and ECM (B). In terms of EC, it
is easy to discover that the first step of weight loss from 36 °C to 200 °C is about 10.03%, which can be attributed to the release of moisture in the samples. The majority of the weight loss appears between 200-400 °C; the decomposition of cellulose is mainly respon-sible for the observed weight loss 76.17%. The third weight loss of 13.67% occurs at a range of 400-800 °C, which is assigned to indicate gradual consolidation of nanoporous carbon structures. As far as the ECM is concerned, the first step of weight loss from 36 °C to 200 °C is about 2.15%. The second weight loss of 72.57% occurs at a range of 200-400 °C and the third weight loss of 10.94% occurs at a range of 400-800 °C
The difference is that the moisture in the samples of EC is lower than ECM. In addi-tion, the thermal decomposing temperature of EC is 240 °C and the decomposing temper-ature of ECM is 280 °C. In addition, the residue of EC is 0.66% and the residue of ECM is 14.23%. It can be clearly seen that the ECM have better thermal stability.
Based on thermogravimetric analysis, it was proved that the ECM has good thermal stability in a certain range and could be used as absorbent material [40,41].
Figure 2. FTIR spectra of the EC and ECM.
3.1.2. TGA Analysis
Figure 3 shows the TGA and DTG curves of EC (A) and ECM (B). In terms of EC, itis easy to discover that the first step of weight loss from 36 ◦C to 200 ◦C is about 10.03%,which can be attributed to the release of moisture in the samples. The majority of the weightloss appears between 200–400 ◦C; the decomposition of cellulose is mainly responsiblefor the observed weight loss 76.17%. The third weight loss of 13.67% occurs at a rangeof 400–800 ◦C, which is assigned to indicate gradual consolidation of nanoporous carbonstructures. As far as the ECM is concerned, the first step of weight loss from 36 ◦C to 200 ◦Cis about 2.15%. The second weight loss of 72.57% occurs at a range of 200–400 ◦C and thethird weight loss of 10.94% occurs at a range of 400–800 ◦C
Chemistry 2021, 3, FOR PEER REVIEW 7
Figure 3. TGA and DTG curves of EC (A) and ECM (B).
3.1.3. SEM Analysis The morphology of ECM was studied by scanning electron microscope (SEM). As
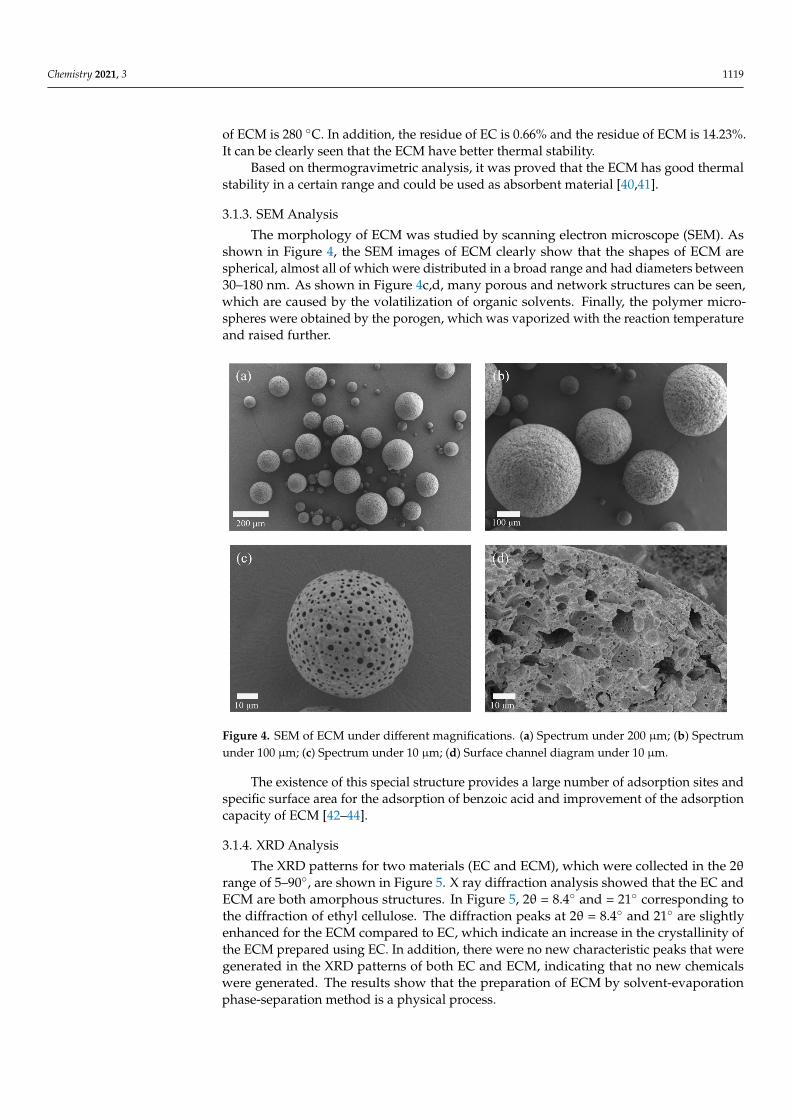
shown in Figure 4, the SEM images of ECM clearly show that the shapes of ECM are spherical, almost all of which were distributed in a broad range and had diameters be-tween 30–180 nm. As shown in Figure 4c,d, many porous and network structures can be seen, which are caused by the volatilization of organic solvents. Finally, the polymer mi-crospheres were obtained by the porogen, which was vaporized with the reaction temper-ature and raised further.
The existence of this special structure provides a large number of adsorption sites and specific surface area for the adsorption of benzoic acid and improvement of the ad-sorption capacity of ECM [42–44].
Figure 4. SEM of ECM under different magnifications. (a) Spectrum under 200 μm; (b) Spectrum under 100 μm; (c) Spectrum under 10 μm; (d) Surface channel diagram under 10 μm.
3.1.4. XRD Analysis The XRD patterns for two materials (EC and ECM), which were collected in the 2θ
range of 5–90°, are shown in Figure 5. X ray diffraction analysis showed that the EC and ECM are both amorphous structures. In Figure 5, 2θ = 8.4° and = 21° corresponding to the diffraction of ethyl cellulose. The diffraction peaks at 2θ = 8.4° and 21° are slightly en-hanced for the ECM compared to EC, which indicate an increase in the crystallinity of the
Figure 3. TGA and DTG curves of EC (A) and ECM (B).
The difference is that the moisture in the samples of EC is lower than ECM. In addition,the thermal decomposing temperature of EC is 240 ◦C and the decomposing temperature
Chemistry 2021, 3 1119
of ECM is 280 ◦C. In addition, the residue of EC is 0.66% and the residue of ECM is 14.23%.It can be clearly seen that the ECM have better thermal stability.
Based on thermogravimetric analysis, it was proved that the ECM has good thermalstability in a certain range and could be used as absorbent material [40,41].
3.1.3. SEM Analysis
The morphology of ECM was studied by scanning electron microscope (SEM). Asshown in Figure 4, the SEM images of ECM clearly show that the shapes of ECM arespherical, almost all of which were distributed in a broad range and had diameters between30–180 nm. As shown in Figure 4c,d, many porous and network structures can be seen,which are caused by the volatilization of organic solvents. Finally, the polymer micro-spheres were obtained by the porogen, which was vaporized with the reaction temperatureand raised further.
Chemistry 2021, 3, FOR PEER REVIEW 7
Figure 3. TGA and DTG curves of EC (A) and ECM (B).
3.1.3. SEM Analysis The morphology of ECM was studied by scanning electron microscope (SEM). As
shown in Figure 4, the SEM images of ECM clearly show that the shapes of ECM are spherical, almost all of which were distributed in a broad range and had diameters be-tween 30–180 nm. As shown in Figure 4c,d, many porous and network structures can be seen, which are caused by the volatilization of organic solvents. Finally, the polymer mi-crospheres were obtained by the porogen, which was vaporized with the reaction temper-ature and raised further.
The existence of this special structure provides a large number of adsorption sites and specific surface area for the adsorption of benzoic acid and improvement of the ad-sorption capacity of ECM [42–44].
Figure 4. SEM of ECM under different magnifications. (a) Spectrum under 200 μm; (b) Spectrum under 100 μm; (c) Spectrum under 10 μm; (d) Surface channel diagram under 10 μm.
3.1.4. XRD Analysis The XRD patterns for two materials (EC and ECM), which were collected in the 2θ
range of 5–90°, are shown in Figure 5. X ray diffraction analysis showed that the EC and ECM are both amorphous structures. In Figure 5, 2θ = 8.4° and = 21° corresponding to the diffraction of ethyl cellulose. The diffraction peaks at 2θ = 8.4° and 21° are slightly en-hanced for the ECM compared to EC, which indicate an increase in the crystallinity of the
Figure 4. SEM of ECM under different magnifications. (a) Spectrum under 200 µm; (b) Spectrumunder 100 µm; (c) Spectrum under 10 µm; (d) Surface channel diagram under 10 µm.
The existence of this special structure provides a large number of adsorption sites andspecific surface area for the adsorption of benzoic acid and improvement of the adsorptioncapacity of ECM [42–44].
3.1.4. XRD Analysis
The XRD patterns for two materials (EC and ECM), which were collected in the 2θrange of 5–90◦, are shown in Figure 5. X ray diffraction analysis showed that the EC andECM are both amorphous structures. In Figure 5, 2θ = 8.4◦ and = 21◦ corresponding tothe diffraction of ethyl cellulose. The diffraction peaks at 2θ = 8.4◦ and 21◦ are slightlyenhanced for the ECM compared to EC, which indicate an increase in the crystallinity ofthe ECM prepared using EC. In addition, there were no new characteristic peaks that weregenerated in the XRD patterns of both EC and ECM, indicating that no new chemicalswere generated. The results show that the preparation of ECM by solvent-evaporationphase-separation method is a physical process.

Chemistry 2021, 3 1120
Chemistry 2021, 3, FOR PEER REVIEW 8
ECM prepared using EC. In addition, there were no new characteristic peaks that were generated in the XRD patterns of both EC and ECM, indicating that no new chemicals were generated. The results show that the preparation of ECM by solvent-evaporation phase-separation method is a physical process.
Figure 5. XRD patterns for EC and ECM.
3.2. Adsorption Behaviour 3.2.1. Static Adsorption Experiments
The sample solutions after adsorption by EC and ECM for 24 h were quantitatively analyzed by HPLC. The contents of benzoic acid in the test solution before and after ad-sorption were compared. The results are shown in Figure 6. Changes in the contents of benzoic acid before and after adsorption in C. paliurus extract are clearly visible. It can be clearly seen from Figure 6 that ECM have strong adsorption for benzoic acid in the extract of C. paliurus. The results are attribute to the large number of micropores in ECM.
Figure 6. Effect diagram of ECM (c) and EC (b) on 24 h adsorption of benzoic acid content (annota-tion: (a) is the sample before adsorption; (b) is the sample adsorption by EC; (c) is the sample ad-sorption by ECM).
3.2.2. Adsorption Kinetics Kinetic models were developed to elucidate the mechanism and rate of adsorption.
The mechanism of adsorption depends on the physical and/or chemical characteristics of the adsorbent. To determine the adsorption mechanism of benzoic acid onto ECM absor-bents, pseudo-first-order [45], pseudo-second-order [46], and intraparticle diffusion ki-netic models were evaluated. These models are provided in the following equations:
Figure 5. XRD patterns for EC and ECM.
3.2. Adsorption Behaviour3.2.1. Static Adsorption Experiments
The sample solutions after adsorption by EC and ECM for 24 h were quantitativelyanalyzed by HPLC. The contents of benzoic acid in the test solution before and afteradsorption were compared. The results are shown in Figure 6. Changes in the contents ofbenzoic acid before and after adsorption in C. paliurus extract are clearly visible. It can beclearly seen from Figure 6 that ECM have strong adsorption for benzoic acid in the extractof C. paliurus. The results are attribute to the large number of micropores in ECM.
Chemistry 2021, 3, FOR PEER REVIEW 8
ECM prepared using EC. In addition, there were no new characteristic peaks that were generated in the XRD patterns of both EC and ECM, indicating that no new chemicals were generated. The results show that the preparation of ECM by solvent-evaporation phase-separation method is a physical process.
Figure 5. XRD patterns for EC and ECM.
3.2. Adsorption Behaviour 3.2.1. Static Adsorption Experiments
The sample solutions after adsorption by EC and ECM for 24 h were quantitatively analyzed by HPLC. The contents of benzoic acid in the test solution before and after ad-sorption were compared. The results are shown in Figure 6. Changes in the contents of benzoic acid before and after adsorption in C. paliurus extract are clearly visible. It can be clearly seen from Figure 6 that ECM have strong adsorption for benzoic acid in the extract of C. paliurus. The results are attribute to the large number of micropores in ECM.
Figure 6. Effect diagram of ECM (c) and EC (b) on 24 h adsorption of benzoic acid content (annota-tion: (a) is the sample before adsorption; (b) is the sample adsorption by EC; (c) is the sample ad-sorption by ECM).
3.2.2. Adsorption Kinetics Kinetic models were developed to elucidate the mechanism and rate of adsorption.
The mechanism of adsorption depends on the physical and/or chemical characteristics of the adsorbent. To determine the adsorption mechanism of benzoic acid onto ECM absor-bents, pseudo-first-order [45], pseudo-second-order [46], and intraparticle diffusion ki-netic models were evaluated. These models are provided in the following equations:
Figure 6. Effect diagram of ECM (c) and EC (b) on 24 h adsorption of benzoic acid content (annotation:(a) is the sample before adsorption; (b) is the sample adsorption by EC; (c) is the sample adsorptionby ECM).
3.2.2. Adsorption Kinetics
Kinetic models were developed to elucidate the mechanism and rate of adsorption.The mechanism of adsorption depends on the physical and/or chemical characteristicsof the adsorbent. To determine the adsorption mechanism of benzoic acid onto ECMabsorbents, pseudo-first-order [45], pseudo-second-order [46], and intraparticle diffusionkinetic models were evaluated. These models are provided in the following equations:

Chemistry 2021, 3 1121
Pseudo-first-order:qt = qe(1 − e−K1t) (1)
Pseudo-second-order:
qt = K2q2
e t1 + K2qet
(2)
In these equations, qe and qt are the adsorption capacity at equilibrium and at any timet (mg/g of dry resin), respectively. The parameters K1 (min−1) and K2 (g/(mg min)) arethe rate constants of the pseudo-first-order and pseudo-second-order for the adsorptionprocess, respectively.
The adsorptive capacity was changed with adsorption time as shown in Table 2. First-order and second-order models of benzoic acid are shown in Figure 7. Model parametersobtained from nonlinear regression analysis are also shown in Table 2.
Table 2. Changes in adsorption time and adsorption amount.
Adsorption Time (min) Peak Area Adsorptive Capacity (mg/g)
0 75.8 015 70.2 0.8130 66 1.5145 58 2.7460 55.7 3.1
120 38.8 5.71180 27.6 7.44240 22.3 7.90300 19.6 7.90420 19.2 7.89540 19.2 7.89660 19.2 7.89720 19.2 7.89
Chemistry 2021, 3, FOR PEER REVIEW 9
Pseudo-first-order:
)1( 1tKet eqq −−= (1)
Pseudo-second-order:
tqKtqKqe
et
2
2
2 1+= (2)
In these equations, qe and qt are the adsorption capacity at equilibrium and at any time t (mg/g of dry resin), respectively. The parameters K1 (min−1) and K2 (g/(mg min)) are the rate constants of the pseudo-first-order and pseudo-second-order for the adsorption process, respectively.
The adsorptive capacity was changed with adsorption time as shown in Table 2. First-order and second-order models of benzoic acid are shown in Figure 7. Model parameters obtained from nonlinear regression analysis are also shown in Table 2.
Kinetic curves in Figure 7 are the adsorption of benzoic acid on ECM absorbents at 25 °C. It is easy to discover from Table 3 and Figure 7 that the K values of the first-order are bigger than the second-order models. Moreover, the equilibrium adsorption capacity calculated by the pseudo-first-order kinetic model is closer to the actual equilibrium ad-sorption capacity of ECM. Thus, the adsorption behavior of ECM on benzoic acid con-formed more with the first-order kinetic model. It shows that ECM adsorbs benzoic acid mainly through physical adsorption.
Figure 7. Adsorption kinetic curves of benzoic acids onto adsorbents at 25 °C. (A) first-order ki-netic curve; (B) second-order kinetic curve.
Table 2. Changes in adsorption time and adsorption amount.
Adsorption Time (min) Peak Area Adsorptive Capacity (mg/g) 0 75.8 0
15 70.2 0.81 30 66 1.51 45 58 2.74 60 55.7 3.1 120 38.8 5.71 180 27.6 7.44 240 22.3 7.90 300 19.6 7.90 420 19.2 7.89 540 19.2 7.89 660 19.2 7.89
Figure 7. Adsorption kinetic curves of benzoic acids onto adsorbents at 25 ◦C. (A) first-order kineticcurve; (B) second-order kinetic curve.
Kinetic curves in Figure 7 are the adsorption of benzoic acid on ECM absorbents at25 ◦C. It is easy to discover from Table 3 and Figure 7 that the K values of the first-orderare bigger than the second-order models. Moreover, the equilibrium adsorption capacitycalculated by the pseudo-first-order kinetic model is closer to the actual equilibriumadsorption capacity of ECM. Thus, the adsorption behavior of ECM on benzoic acidconformed more with the first-order kinetic model. It shows that ECM adsorbs benzoicacid mainly through physical adsorption.

Chemistry 2021, 3 1122
Table 3. Kinetic parameters of benzoic acids adsorption onto adsorbents at 25 ◦C.
Pseudofirst-Order-Model Pseudosecond-Order-Model
Adsorbents
qe (exp)(mg/g)
K1(min−1)
qe(mg/g) R2 K2
(g/mg min)Qe (cal)(mg/g) R2
7.890 0.009 8.143 0.9848 0.0011 9.6594 0.9556
3.3. Desorption Performance Test3.3.1. The Influence of Methanol Concentration on the Desorption Performance ofBenzoic Acid
It can be clearly seen from Figure 8 that the concentration of methanol has a signifi-cant influence on the desorption experiment, and the optimal concentration of methanoldesorption solvent is 40%, which is also caused by the hydrophilicity of benzoic acid.
Chemistry 2021, 3, FOR PEER REVIEW 10
720 19.2 7.89
Table 3. Kinetic parameters of benzoic acids adsorption onto adsorbents at 25 °C.
Pseudofirst-Order-Model Pseudosecond-Order-Model
Adsorbents qe (exp) (mg/g)
K1
(min−1) qe
(mg/g) R2 K2
(g/mg min) Qe (cal) (mg/g)
R2
7.890 0.009 8.143 0.9848 0.0011 9.6594 0.9556
3.3. Desorption Performance Test 3.3.1. The Influence of Methanol Concentration on the Desorption Performance of Ben-zoic Acid
It can be clearly seen from Figure 8 that the concentration of methanol has a signifi-cant influence on the desorption experiment, and the optimal concentration of methanol desorption solvent is 40%, which is also caused by the hydrophilicity of benzoic acid.
Figure 8. Effect of methanol concentration on desorption of benzoic acid.
3.3.2. Desorption Curves of ECM The test results of the desorption performance are shown in Table 4 and Figure 9. It
can be clearly seen from Table 4 and Figure 10 that the ECM after the adsorption equilib-rium was desorbed with 40% methanol solution [47]. The benzoic acid was obtained by desorption with a purity of up to 77.22%. At the same time, the desorption curves were obtained. The chromatograms of the initial sample and products of benzoic acid are shown in Figure 10. The product of benzoic acid comes from eluting components on ECM adsorbents with 40% methanol solution. Comparing with the initial sample, the benzoic acid was successfully and completely separated by using this methodology. ECM adsor-bents exhibit a large adsorption capacity of about 5.066 mg/g towards benzoic acid.
Table 4. The influence of the number of desorption on the content of benzoic acid in desorption solution.
Stage Number of Times Peak Area Ratio of Peak Area C (mg/mL)
a
0 0 0 0 1 78.2 15.358 0.0099 2 90.8 14.932 0.0123 3 47.7 37.144 0.0043 4 46.4 41.071 0.0040 5 0 0 0 6 0 0 0
b
1 140.8 74.787 0.0215 2 141 72.987 0.0216 3 137.4 82.227 0.0209 4 78.8 68.380 0.0100
Figure 8. Effect of methanol concentration on desorption of benzoic acid.
3.3.2. Desorption Curves of ECM
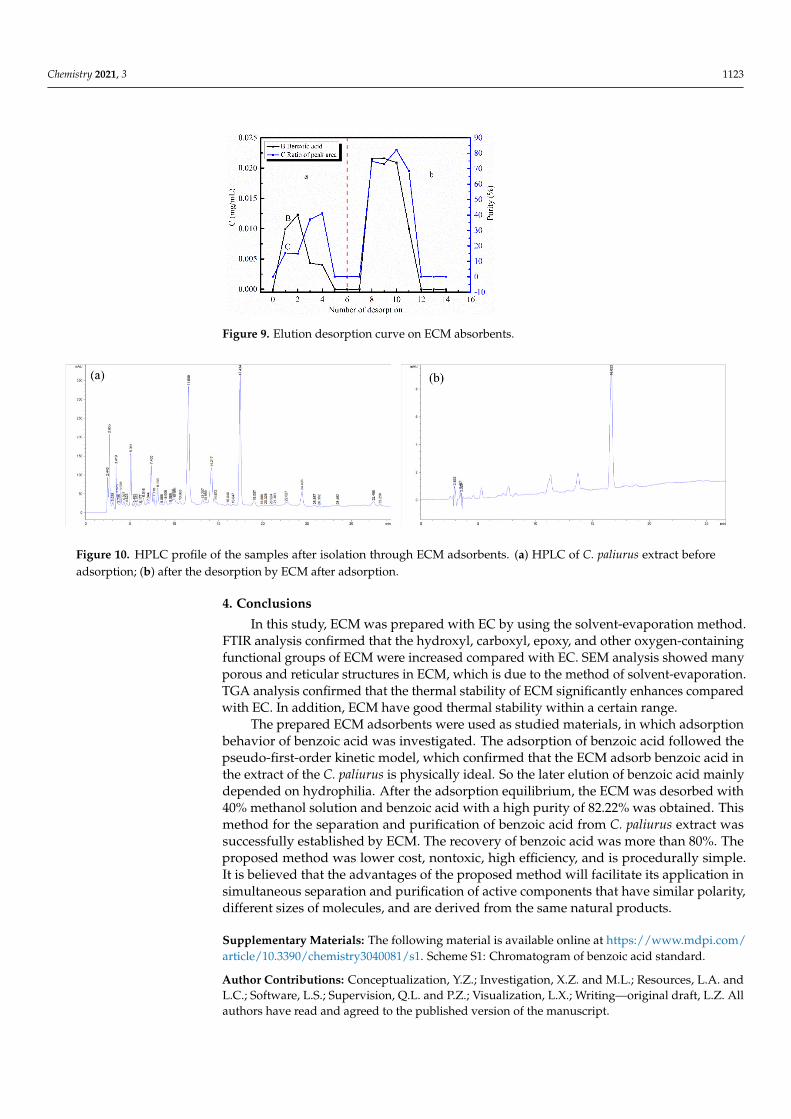
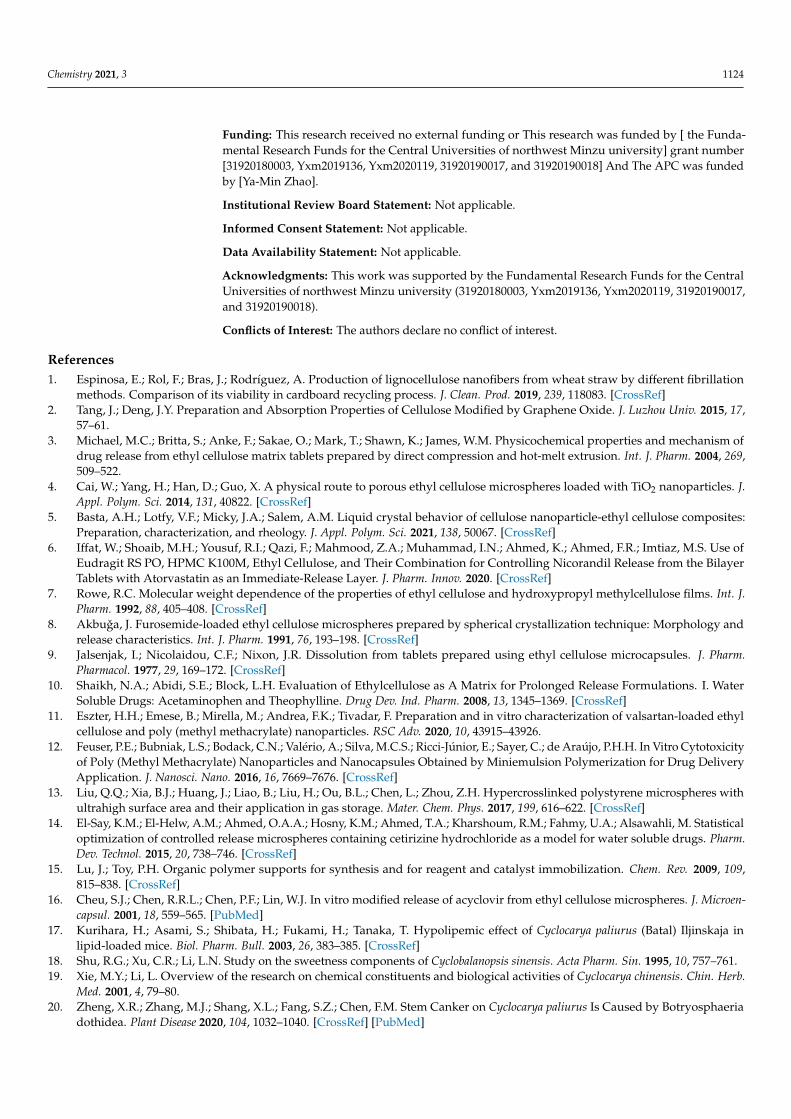
The test results of the desorption performance are shown in Table 4 and Figure 9.It can be clearly seen from Table 4 and Figure 10 that the ECM after the adsorptionequilibrium was desorbed with 40% methanol solution [47]. The benzoic acid was obtainedby desorption with a purity of up to 77.22%. At the same time, the desorption curveswere obtained. The chromatograms of the initial sample and products of benzoic acidare shown in Figure 10. The product of benzoic acid comes from eluting components onECM adsorbents with 40% methanol solution. Comparing with the initial sample, thebenzoic acid was successfully and completely separated by using this methodology. ECMadsorbents exhibit a large adsorption capacity of about 5.066 mg/g towards benzoic acid.
Table 4. The influence of the number of desorption on the content of benzoic acid in desorption solution.
Stage Number of Times Peak Area Ratio of Peak Area C (mg/mL)
a
0 0 0 01 78.2 15.358 0.00992 90.8 14.932 0.01233 47.7 37.144 0.00434 46.4 41.071 0.00405 0 0 06 0 0 0
b
1 140.8 74.787 0.02152 141 72.987 0.02163 137.4 82.227 0.02094 78.8 68.380 0.01005 0 0 0
(annotation: a is stage of rinse; b is stage of desorption).
Chemistry 2021, 3 1123
Chemistry 2021, 3, FOR PEER REVIEW 11
5 0 0 0 (annotation: a is stage of rinse; b is stage of desorption.).
Figure 9. Elution desorption curve on ECM absorbents.
Figure 10. HPLC profile of the samples after isolation through ECM adsorbents. (a) HPLC of C. paliurus extract before adsorption; (b) after the desorption by ECM after adsorption.
4. Conclusions In this study, ECM was prepared with EC by using the solvent-evaporation method.
FTIR analysis confirmed that the hydroxyl, carboxyl, epoxy, and other oxygen-containing functional groups of ECM were increased compared with EC. SEM analysis showed many porous and reticular structures in ECM, which is due to the method of solvent-evapora-tion. TGA analysis confirmed that the thermal stability of ECM significantly enhances compared with EC. In addition, ECM have good thermal stability within a certain range.
The prepared ECM adsorbents were used as studied materials, in which adsorption behavior of benzoic acid was investigated. The adsorption of benzoic acid followed the pseudo-first-order kinetic model, which confirmed that the ECM adsorb benzoic acid in the extract of the C. paliurus is physically ideal. So the later elution of benzoic acid mainly depended on hydrophilia. After the adsorption equilibrium, the ECM was desorbed with 40% methanol solution and benzoic acid with a high purity of 82.22% was obtained. This method for the separation and purification of benzoic acid from C. paliurus extract was successfully established by ECM. The recovery of benzoic acid was more than 80%. The proposed method was lower cost, nontoxic, high efficiency, and is procedurally simple. It is believed that the advantages of the proposed method will facilitate its application in simultaneous separation and purification of active components that have similar polarity, different sizes of molecules, and are derived from the same natural products.
Supplementary Material: The following material is available online. Scheme S1: Chromatogram of benzoic acid standard.
Figure 9. Elution desorption curve on ECM absorbents.
Chemistry 2021, 3, FOR PEER REVIEW 11
5 0 0 0 (annotation: a is stage of rinse; b is stage of desorption.).
Figure 9. Elution desorption curve on ECM absorbents.
Figure 10. HPLC profile of the samples after isolation through ECM adsorbents. (a) HPLC of C. paliurus extract before adsorption; (b) after the desorption by ECM after adsorption.
4. Conclusions In this study, ECM was prepared with EC by using the solvent-evaporation method.
FTIR analysis confirmed that the hydroxyl, carboxyl, epoxy, and other oxygen-containing functional groups of ECM were increased compared with EC. SEM analysis showed many porous and reticular structures in ECM, which is due to the method of solvent-evapora-tion. TGA analysis confirmed that the thermal stability of ECM significantly enhances compared with EC. In addition, ECM have good thermal stability within a certain range.
The prepared ECM adsorbents were used as studied materials, in which adsorption behavior of benzoic acid was investigated. The adsorption of benzoic acid followed the pseudo-first-order kinetic model, which confirmed that the ECM adsorb benzoic acid in the extract of the C. paliurus is physically ideal. So the later elution of benzoic acid mainly depended on hydrophilia. After the adsorption equilibrium, the ECM was desorbed with 40% methanol solution and benzoic acid with a high purity of 82.22% was obtained. This method for the separation and purification of benzoic acid from C. paliurus extract was successfully established by ECM. The recovery of benzoic acid was more than 80%. The proposed method was lower cost, nontoxic, high efficiency, and is procedurally simple. It is believed that the advantages of the proposed method will facilitate its application in simultaneous separation and purification of active components that have similar polarity, different sizes of molecules, and are derived from the same natural products.
Supplementary Material: The following material is available online. Scheme S1: Chromatogram of benzoic acid standard.
Figure 10. HPLC profile of the samples after isolation through ECM adsorbents. (a) HPLC of C. paliurus extract beforeadsorption; (b) after the desorption by ECM after adsorption.
4. Conclusions
In this study, ECM was prepared with EC by using the solvent-evaporation method.FTIR analysis confirmed that the hydroxyl, carboxyl, epoxy, and other oxygen-containingfunctional groups of ECM were increased compared with EC. SEM analysis showed manyporous and reticular structures in ECM, which is due to the method of solvent-evaporation.TGA analysis confirmed that the thermal stability of ECM significantly enhances comparedwith EC. In addition, ECM have good thermal stability within a certain range.
The prepared ECM adsorbents were used as studied materials, in which adsorptionbehavior of benzoic acid was investigated. The adsorption of benzoic acid followed thepseudo-first-order kinetic model, which confirmed that the ECM adsorb benzoic acid inthe extract of the C. paliurus is physically ideal. So the later elution of benzoic acid mainlydepended on hydrophilia. After the adsorption equilibrium, the ECM was desorbed with40% methanol solution and benzoic acid with a high purity of 82.22% was obtained. Thismethod for the separation and purification of benzoic acid from C. paliurus extract wassuccessfully established by ECM. The recovery of benzoic acid was more than 80%. Theproposed method was lower cost, nontoxic, high efficiency, and is procedurally simple.It is believed that the advantages of the proposed method will facilitate its application insimultaneous separation and purification of active components that have similar polarity,different sizes of molecules, and are derived from the same natural products.
Supplementary Materials: The following material is available online at https://www.mdpi.com/article/10.3390/chemistry3040081/s1. Scheme S1: Chromatogram of benzoic acid standard.
Author Contributions: Conceptualization, Y.Z.; Investigation, X.Z. and M.L.; Resources, L.A. andL.C.; Software, L.S.; Supervision, Q.L. and P.Z.; Visualization, L.X.; Writing—original draft, L.Z. Allauthors have read and agreed to the published version of the manuscript.
Chemistry 2021, 3 1124
Funding: This research received no external funding or This research was funded by [ the Funda-mental Research Funds for the Central Universities of northwest Minzu university] grant number[31920180003, Yxm2019136, Yxm2020119, 31920190017, and 31920190018] And The APC was fundedby [Ya-Min Zhao].
Institutional Review Board Statement: Not applicable.
Informed Consent Statement: Not applicable.
Data Availability Statement: Not applicable.
Acknowledgments: This work was supported by the Fundamental Research Funds for the CentralUniversities of northwest Minzu university (31920180003, Yxm2019136, Yxm2020119, 31920190017,and 31920190018).
Conflicts of Interest: The authors declare no conflict of interest.
References1. Espinosa, E.; Rol, F.; Bras, J.; Rodríguez, A. Production of lignocellulose nanofibers from wheat straw by different fibrillation
methods. Comparison of its viability in cardboard recycling process. J. Clean. Prod. 2019, 239, 118083. [CrossRef]2. Tang, J.; Deng, J.Y. Preparation and Absorption Properties of Cellulose Modified by Graphene Oxide. J. Luzhou Univ. 2015, 17,
57–61.3. Michael, M.C.; Britta, S.; Anke, F.; Sakae, O.; Mark, T.; Shawn, K.; James, W.M. Physicochemical properties and mechanism of
drug release from ethyl cellulose matrix tablets prepared by direct compression and hot-melt extrusion. Int. J. Pharm. 2004, 269,509–522.
4. Cai, W.; Yang, H.; Han, D.; Guo, X. A physical route to porous ethyl cellulose microspheres loaded with TiO2 nanoparticles. J.Appl. Polym. Sci. 2014, 131, 40822. [CrossRef]
5. Basta, A.H.; Lotfy, V.F.; Micky, J.A.; Salem, A.M. Liquid crystal behavior of cellulose nanoparticle-ethyl cellulose composites:Preparation, characterization, and rheology. J. Appl. Polym. Sci. 2021, 138, 50067. [CrossRef]
6. Iffat, W.; Shoaib, M.H.; Yousuf, R.I.; Qazi, F.; Mahmood, Z.A.; Muhammad, I.N.; Ahmed, K.; Ahmed, F.R.; Imtiaz, M.S. Use ofEudragit RS PO, HPMC K100M, Ethyl Cellulose, and Their Combination for Controlling Nicorandil Release from the BilayerTablets with Atorvastatin as an Immediate-Release Layer. J. Pharm. Innov. 2020. [CrossRef]
7. Rowe, R.C. Molecular weight dependence of the properties of ethyl cellulose and hydroxypropyl methylcellulose films. Int. J.Pharm. 1992, 88, 405–408. [CrossRef]
8. Akbuga, J. Furosemide-loaded ethyl cellulose microspheres prepared by spherical crystallization technique: Morphology andrelease characteristics. Int. J. Pharm. 1991, 76, 193–198. [CrossRef]
9. Jalsenjak, I.; Nicolaidou, C.F.; Nixon, J.R. Dissolution from tablets prepared using ethyl cellulose microcapsules. J. Pharm.Pharmacol. 1977, 29, 169–172. [CrossRef]
10. Shaikh, N.A.; Abidi, S.E.; Block, L.H. Evaluation of Ethylcellulose as A Matrix for Prolonged Release Formulations. I. WaterSoluble Drugs: Acetaminophen and Theophylline. Drug Dev. Ind. Pharm. 2008, 13, 1345–1369. [CrossRef]
11. Eszter, H.H.; Emese, B.; Mirella, M.; Andrea, F.K.; Tivadar, F. Preparation and in vitro characterization of valsartan-loaded ethylcellulose and poly (methyl methacrylate) nanoparticles. RSC Adv. 2020, 10, 43915–43926.
12. Feuser, P.E.; Bubniak, L.S.; Bodack, C.N.; Valério, A.; Silva, M.C.S.; Ricci-Júnior, E.; Sayer, C.; de Araújo, P.H.H. In Vitro Cytotoxicityof Poly (Methyl Methacrylate) Nanoparticles and Nanocapsules Obtained by Miniemulsion Polymerization for Drug DeliveryApplication. J. Nanosci. Nano. 2016, 16, 7669–7676. [CrossRef]
13. Liu, Q.Q.; Xia, B.J.; Huang, J.; Liao, B.; Liu, H.; Ou, B.L.; Chen, L.; Zhou, Z.H. Hypercrosslinked polystyrene microspheres withultrahigh surface area and their application in gas storage. Mater. Chem. Phys. 2017, 199, 616–622. [CrossRef]
14. El-Say, K.M.; El-Helw, A.M.; Ahmed, O.A.A.; Hosny, K.M.; Ahmed, T.A.; Kharshoum, R.M.; Fahmy, U.A.; Alsawahli, M. Statisticaloptimization of controlled release microspheres containing cetirizine hydrochloride as a model for water soluble drugs. Pharm.Dev. Technol. 2015, 20, 738–746. [CrossRef]
15. Lu, J.; Toy, P.H. Organic polymer supports for synthesis and for reagent and catalyst immobilization. Chem. Rev. 2009, 109,815–838. [CrossRef]
16. Cheu, S.J.; Chen, R.R.L.; Chen, P.F.; Lin, W.J. In vitro modified release of acyclovir from ethyl cellulose microspheres. J. Microen-capsul. 2001, 18, 559–565. [PubMed]
17. Kurihara, H.; Asami, S.; Shibata, H.; Fukami, H.; Tanaka, T. Hypolipemic effect of Cyclocarya paliurus (Batal) Iljinskaja inlipid-loaded mice. Biol. Pharm. Bull. 2003, 26, 383–385. [CrossRef]
18. Shu, R.G.; Xu, C.R.; Li, L.N. Study on the sweetness components of Cyclobalanopsis sinensis. Acta Pharm. Sin. 1995, 10, 757–761.19. Xie, M.Y.; Li, L. Overview of the research on chemical constituents and biological activities of Cyclocarya chinensis. Chin. Herb.
Med. 2001, 4, 79–80.20. Zheng, X.R.; Zhang, M.J.; Shang, X.L.; Fang, S.Z.; Chen, F.M. Stem Canker on Cyclocarya paliurus Is Caused by Botryosphaeria
dothidea. Plant Disease 2020, 104, 1032–1040. [CrossRef] [PubMed]
Chemistry 2021, 3 1125
21. Sundberg-Kövamees, M.; Grunewald, J.; Wahlström, J. Immune cell activation and cytokine release after stimulation of wholeblood with pneumococcal C-polysaccharide and capsular polysaccharides. Int. J. Infect. Dis. 2016, 52, 1–8. [CrossRef]
22. Chen, J.J.; Ding, J.X.; Xu, W.G.; Sun, T.M.; Xiao, H.H.; Zhuang, X.L.; Chen, X.S. Receptor and microenvironment dual-recognizablenanogel for targeted chemotherapy of highly metastatic malignancy. Nano Lett. 2017, 17, 4526–4533. [CrossRef] [PubMed]
23. Zhang, Y.; Lv, T.; Min, L.; Xue, T.; Hui, L.; Zhang, W.; Ding, X.; Zhuang, Z. Anti-aging effect of polysaccharide from Bletilla striataon nematode Caenorhabditis elegans. Pharmacogn. Mag. 2015, 11, 449–454. [PubMed]
24. Li, Y.G.; Ji, D.F.; Zhong, S.; Lv, Z.Q.; Lin, T.B. Cooperative anti-diabetic effects of deoxynojirimycin-polysaccharide by inhibitingglucose absorption and modulating glucose metabolism in streptozotocin-induced diabetic mice. PLoS ONE 2013, 8, e65892.[CrossRef] [PubMed]
25. Qin, D.; Yang, X.; Gao, S.; Yao, J.; Mcclements, D.J. Influence of hydrocolloids (dietary fibers) on lipid digestion of protein-stabilized emulsions: Comparison of neutral, anionic, and cationic polysaccharides. J. Food Sci. 2016, 81, C1636–C1645. [CrossRef][PubMed]
26. Xie, J.H.; Xin, L.; Shen, M.Y.; Nie, S.P.; Hui, Z.; Li, C.; Gong, D.M.; Xie, M.Y. Purification, physicochemical characterisation andanticancer activity of a polysaccharide from Cyclocarya paliurus leaves. Food Chem. 2013, 136, 1453–1460. [CrossRef] [PubMed]
27. Wang, Y.R.; Cui, B.S.; Han, S.W.; Li, S. New dammarane triterpenoid saponins from the leaves of Cyclocarya paliurus. J. Asian Nat.Prod. Res. 2018, 20, 1019–1027. [CrossRef] [PubMed]
28. Xie, J.H.; Xie, M.Y.; Nie, S.P.; Shen, M.Y.; Wang, Y.X.; Li, C. Isolation, chemical composition and antioxidant activities of awater-soluble polysaccharide from Cyclocarya paliurus (Batal.) Iljinskaja. Food Chem. 2010, 119, 1626–1632. [CrossRef]
29. Xie, M.Y.; Xie, J.H. Review about the research on Cyclocarya paliurus (Batal.) Iljinskaja. Food Sci. Biotechnol. 2008, 27, 113–121.30. Li, Q.; Hu, J.; Xie, J.; Nie, S.; Xie, M.Y. Isolation, structure, and bioactivities of polysaccharides from Cyclocarya paliurus (Batal.)
Iljinskaja. Ann. N. Y. Acad. Sci. 2017, 1398, 20–29. [CrossRef]31. Shang, X.; Tan, J.-N.; Du, Y.; Liu, X.; Zhang, Z. Environmentally-Friendly Extraction of Flavonoids from Cyclocarya paliurus (Batal.)
Iljinskaja Leaves with Deep Eutectic Solvents and Evaluation of Their Antioxidant Activities. Molecules 2018, 23, 2110. [CrossRef]32. Liu, F.; Wang, Y.; Burkhart, T.A. Anti-inflammatory mechanism research of tanshinone II A by module-based network analysis.
J. Bio-Med Mater. Eng. 2014, 24, 3815–3824.33. Thibault, L.; Emilie, D.; Caroline, W.; Eric, L. Supercritical Fluid Chromatography development of a predictive analytical tool to
selectively extract bioactive compounds by supercritical fluid extraction and pressurised liquid extraction. J. Chromatogr. A 2020,1632, 461582.
34. Huang, K.J.; Wu, J.J.; Chiu, Y.H.; Lai, C.Y.; Chang, C.M.J. Designed polar cosolvent-modifified supercritical CO2 removing caffeinefrom and retaining catechins in green tea powder using response surface methodology. J. Agric. Food Chem. 2007, 55, 9014–9020.[CrossRef] [PubMed]
35. Hao, J.Z.; Zhu, L.H.; Wang, H.; Si, T.; He, Y.P.; Sun, Y.L. Preparation of polymer microspheres with controllable structures andinvestigation of their inter-connecting properties. Chem. Ind. Eng. Prog. 2020, 39, 658–666.
36. Peng, W.W.; Zhang, Z.Y.; Ji, C.J.; Li, B.; Wan, C.P.; Shangguan, X.C. Chemical constituents from the aerial part of Cyclocaryapaliurus (Batal.) Iljinsk (Juglandaceae). Biochem. Syst. Ecol. 2018, 78, 110–112. [CrossRef]
37. Li, Q.; Xie, B.; Wang, Y.; Peng, L.; Li, Y.; Li, B.; Liu, S. Cellulose nanofibrils from Miscanthus floridulus straw as green particleemulsifier for O/W Pickering emulsion. Food Hydrocolloids 2019, 97, 105214. [CrossRef]
38. Jmel, M.A.; Anders, N.; Messaoud, G.B.; Messaoud, G.B.; Marzouki, M.N.; Smaali, I. The stranded macroalga Ulva lactuca asa new alternative source of cellulose: Extraction, physicochemical and rheological characterization. J. Clean. Prod. 2019, 234,1421–1427. [CrossRef]
39. Falkeborg, M.; Guo, Z. Dodecenyl succinylated alginate (DSA) as a novel dual-function emulsifier for improved fish oil-in-wateremulsions. Food Hydrocoll. 2015, 46, 10–18. [CrossRef]
40. Rodríguez, F.; Castillo-Ortega, M.M.; Encinas, J.C.; Grijalva, H.; Brown, F.; Sánchez-Corrales, V.M.; Castaño, V.M. Preparation,characterization, and adsorption properties of cellulose acetate-polyaniline membranes. J. Appl. Polym. Sci. 2009, 111, 1216–1224.[CrossRef]
41. Castillo-Ortega, M.M.; Romero-García, J.; Rodriguez, F.; Nájera-Luna, A.; Herrera-Franco, P.J. Fibrous membranes of celluloseacetate and poly (vinyl pyrrolidone) by electrospinning method: Preparation and characterization. J. Appl. Polym. Sci. 2010, 116,1873–1878. [CrossRef]
42. Wu, J.H.; Wang, X.J.; Li, S.J.; Ying, X.Y.; Hu, J.B.; Xu, X.L.; Kang, X.Q.; You, J.; Du, Y.Z. Preparation of Ethyl Cellulose Microspheresfor Sustained Release of Sodium Bicarbonate. Iran. J. Pharm. Res. 2019, 18, 556–568.
43. Pérez-Martínez, J.I.; Morillo, E.; Maqueda, C.; Ginés, J.M. Ethyl cellulose polymer microspheres for controlled release ofnorfluazon. Pest Manag. Sci. 2001, 57, 688–694. [CrossRef] [PubMed]
44. Lin, W.J.; Wu, T.L. Modification of the initial release of a highly water-soluble drug from ethyl cellulose microspheres. J. Microen-capsul. 1999, 16, 639–646. [PubMed]
45. Ho, Y.S. Citation review of lagergren kinetic rate equation on adsorption reactions. Scientometrics 2004, 59, 171–177.46. Ho, Y.S.; Mckay, G. Pseudo-second order model for sorption processes. Process Biochem. 1999, 34, 451–465. [CrossRef]47. Zhang, X.F.; Xu, Y.; Zhang, Q.; Cao, K.; Mu, X.N. Simultaneous separation and purification of (-)-epigallocatechin gallate and
caffeine from tea extract by size exclusion effect on modified porous adsorption material. J. Chromatogr. B 2016, 1031, 29–36.[CrossRef]