Freezing temperature of benzoic acid as a fixed point in ...
42
u. S. DEPARTMENT OF COMM1!RCE NATIONAL BUREAU OF STANDARDS RESEARCH PAPER RP1647 I Part of Journal of Research of the N..ational Bureau of Standards, Volume 34, April 1945 FREEZING TEMPERATURE OF BENZOIC ACID AS A FIXED POINT IN THERMOMETRY By Frank W. Schwab and Edward Wichers ABSTRACT The freezing temperature of benzoic acid is found to be reproducible with a pre- cision comparable to that of the ice point and somewhat superior to that of the steam point as usually ob serv ed in standardi zing laboratories . For use in the calibration of thermometric i nst ruments the acid is contained in a parti ally evacuated gl ass cell provid ed with a th ermometer well. When thu s confinea , and if not h eated excessively, the substan ce maintains a cons tant composit ion for long periods of time. When properly manipulat ed, the acid in a gi ven cell exhibits a freezing temperatur e reproduci ble from day to d ay within 1 millidegree. The triple point of pure benzoic acid is 122.362° ± 0.002° C. Und er a press ur e of 1 atmosphere of dry air the freezing temperature is 0.013 degree high er. Corre- sponding el evations for oxygen amI nitrogen are 0.001 and 0.015 degree, respec- tively. The press ure coefficient of the freezing temperature is 0.039 degree /at.m. The change in volume of the acid 0 11 fr eezing is -0.138 cm3/g. The co rr espondin g calculated value for the d ensity of the solid at the freezing t emperature is 1.27 g/c m3• Th e solu bi lity of oxygen in the liquid at i ts freezing temperature, under a pressure of 1 atm., is 0.132 g/ l,OOO g of acid; that of nitrogen is 0.073 g. An app endix deals with a method of calculating temperat ures, in the ranges -190° to 0° C and 0° to 660° C, f rom observat ions with a platinum the rmometer. For this purpose power-series equations are usee instead of the Callendar and Callendar- Van Du sen equations. T ables are included to facilitate the comp u- tation of temperature, CONTENTS . Page I. Introduction_________ __ ___________________________ ___ ________ ___ 334 II. Mat erials, apparatus, and procedures_______________________________ 335 1. Material and procedure fo r filling th e cells______________ ______ 335 2. Apparatu s for measuring temperatures ___ __ __ ______ __ __ ___ ___ 339 3. Pro cedures for measuring t emper atu r es ____ ---- -------------- 340 (a) At th e benzoic acid point __ __________________________ 340 (b) At th e ice point _ ______ ____________ ______ ___ ________ 341 III. Stability of benzoic acid ____________ _____ ________________________ 342 IV. Reproducibility of the freezing temp erature ___________________ ___ __ 345 1. Relative reprodu cibility of the ice point and the benzoic acid ______ __ _________ __________ ___ ___ ______________ __ 347 2. Comparison of thermometers ____ ______ ' ____ _____ ___ ________ 347 3. Comparison of cells ____ _____ __ ____________ ____ ____________ 348 V. Freezing temperatur es of th e pure acid under defined conditions_ _ __ _ __ _ 350 1. Determination of the triple point ________________ ________ ___ 351 2, Freezing temp eratures under different pressures of oxygen and of nitrogen ______________ ___ _________ ___________________ 352 3. Variation in th e freezing t empe rature as a function of pressure ___ 354 4. Solubilities of oxygen and of nitro gen in benzoic acid _____ ______ 355 5. Freezing t emperature under one atmosphere of dry air ___ _______ 356 VI. Change in th e specific volume of ben zoic acid that accompanies freezing_ 359 333 -
-
Upload
khangminh22 -
Category
Documents
-
view
0 -
download
0
Transcript of Freezing temperature of benzoic acid as a fixed point in ...
u. S. DEPARTMENT OF COMM1!RCE NATIONAL BUREAU OF STANDARDS
RESEARCH PAPER RP1647 I
Part of Journal of Research of the N..ational Bureau of Standards, Volume 34, April 1945
FREEZING TEMPERATURE OF BENZOIC ACID AS A FIXED POINT IN THERMOMETRY
By Frank W. Schwab and Edward Wichers
ABSTRACT
The freezing temperature of benzoic acid is found to be reproducible with a precision comparable to that of the ice point and somewhat superior to that of the steam point as usually observed in standardizing laboratories. For use in the calibration of thermometric instruments the acid is contained in a partially evacuated glass cell provided with a thermometer well. When thus confinea, and if not heated excessively, the substance maintains a constant composition for long periods of time. When properly manipulated, the acid in a given cell exhibits a freezing temperature reproducible from day to day within 1 millidegree.
The triple point of pure benzoic acid is 122.362° ± 0.002° C. Under a pressure of 1 atmosphere of dry air the freezing temperature is 0.013 degree higher. Corresponding elevations for oxygen amI nit rogen are 0.001 and 0.015 degree, respectively. The pressure coefficient of the freezing temperature is 0.039 degree/at.m. The change in volume of the acid 0 11 freezing is -0.138 cm3/g. The corresponding calculated value for the density of the solid at the freezing t emperature is 1.27 g/cm3• The solubility of oxygen in the liquid at its freezing t emperature, under a pressure of 1 atm., is 0.132 g/ l,OOO g of acid; that of nitrogen is 0.073 g.
An appendix deals with a method of calculating temperatures, in the ranges -190° to 0° C and 0° to 660° C, from observations with a platinum thermometer. For this purpose power-series equations are usee instead of the Callendar and Callendar-Van Dusen equations. Tables are included to facilitate the computation of temperature,
CONTENTS . Page
I. Introduction _________ __ ___________________________ ___ ________ ___ 334 II. Materials, apparatus, and procedures _______________________________ 335
1. Material and procedure fo r filling the cells ______________ ______ 335 2. Apparatus for measuring temperatures ___ __ __ ______ __ __ ___ ___ 339 3. Procedures for measuring t emperatures ____ ---- -------------- 340
(a) At the benzoic acid point __ __________________________ 340 (b) At the ice point _______ ____________ ______ ___ ________ 341
III. Stability of benzoic acid ____________ _____ ________________________ 342 IV. Reproducibility of the freezing temperature ___________________ ___ __ 345
1. Relative reproducibility of the ice point and the benzoic acid poin~ ______ __ _________ __________ ___ ___ ______________ __ 347
2. Comparison of thermomet ers ____ ______ ' ____ _____ ___ ________ 347 3. Comparison of cells ____ _____ __ ____________ ____ ____________ 348
V. Freezing temperatures of the pure acid under defined conditions_ _ _ _ _ _ _ _ 350 1. Determination of the triple point ________________ ________ ___ 351 2, Freezing temperatures under different pressures of oxygen and
of nitrogen ______________ ___ _________ ___________________ 352 3. Variation in the freezing t emperature as a function of pressure ___ 354 4. Solubilities of oxygen and of nitrogen in benzoic acid _____ ______ 355 5. Freezing t emperature under one atmosphere of dry air ___ _______ 356
VI. Change in the specific volume of benzoic acid that accompanies freezing_ 359
333
-
334 J owrnal of Research of the National Bureau of Standards
Page VII. Appendix. CalCulation of temperatures in platinum resistance ther-
mometry (by Frank W. Schwab and E. R. Smith) ________________ 360 1. Relation between the power series, Callendar and Callendar-
Van Dusen equations ____________________________________ 360 2. Interpolation of temperatures by use of the power series equa-tions __________________________________________________ 361
(a.) In the range from 0° to 660° C _____________________ 362 (b) In the range from -190° to 0° C ___________________ 362
3. Procedure for the calculation of temperatures by use of the power series equatioDs __________________________________ 363
1. INTRODUCTION
Temperatures in the range 0° to 660° 0, on the International Temperature Scale, are defined in terms of platinum resistance thermometers, of specified characteristics, by means of the equation
R,=Ro (1+At+Bt2).
Ro is the resistance at the temperature of equilibrium between ice and air-saturated water at normal atmospheric pressure, and A and B are constants determined by calibration at the temperatures of condensing water vapor and sulfur vapor, respectively, each under a pressure of 1 atm. The temperature of melting ice is relatively insensitive to variations of atmospheric pressure (0.0076 degree a/atm.), but the accuracy of calibration at the steam and sulfur points is limited by the accuracy which can be attained in making barometric measurements. The boiling temperature of water changes by 0.001 degree 0 with a change in pressure of 0.027 mm of mercury. Since barometric pressure measurements commonly are not made to an accuracy greater than about 0.1 mm of mercury in standardizing laboratories, the accuracy of calibration of platinum thermometers is limited to 0.003 to 0.004 degree a, except in a very few laboratories that are equipped for fundamental work in thermometry. The sulfur point, used with the steam and ice points to determine the constant in the second-power term in the equation, need not be fixed as accurately as the steam point unless temperatures are measured near the sulfur point or in the range beyond it.
A readily reproducible fixed temperature in the iVicinity of 1000 0, insensitive to variations in barometric pressure, would be useful for the calibration of thermometers, even if it could not be reproduced more exactly than the steam point, because the calibration procedure would be greatly simplified if barometric measurements did not need to be made. The present paper deals with the use for this purpose of the freezing temperature of benzoic acid. The term "freezing temperature" is here used in preference to "freezing point" because, as will be explained later, it is proposed to establish arbitrary conditions of observation, which may cause the freezing temperature to be fixed anywhere between the triple point (122.362° a) and the freezing point (freezing temperature under 1 atm. of dry air, 122.3750 0).
Experience with benzoic acid in another project 1 indicated that this substance possesses the properties required of a thermometric standard, of which the more important are as follows: (1) Avalla-
1 Frank W. Schwab and Edward Wichers, Preparation of benzoic aciaof high puritu, J. Research NBS 25, 747 (1940) RP1351.
Fr;,eezing Temperature of Benzoic .Acid 335 bility in an adequate degree of purity; (2) sufficiently large latent heat at the change of phase; (3) adequate velocity of crystallization; (4) existence in only one crystalline form at temperatures near the freezing point; and (5) stability under the conditions of use. Benzoic acid can be obtained commercially in a degree of purity better than 99.95 mole percent, and the purity can be increased to 99.998 mole percent or better by relatively simple laboratory procedures, most readily by a method of fractional freezing described in a previous paper.2 The cryoscopic behavior of the substance is such that 0.001 mole percent of impurity dissolved in the liquid acid (but insoluble in the solid) depresses the freezing temperature 0.00075 degree C. Hence the attainable purity will permit reproducing the freezing temperature to within 0.001 to 0.002 degree C. The same amount of impurity causes the freezing temperature of the acid to change 0.00075 degree C between 0- and 50-percent frozen. As will be shown later, variations in the proportion frozen can be held within a small part of this range.
The heat of fusion of benzoic acid is reported to be about 140 jig, or 150 jlml, which is a little less than half that of water. Many observations made during earlier work show that the heat of fusion, combined with a high velocity of crystallization, is sufficient to maintain satisfactory thermal equilibrium between the solid and liquid when the system loses heat at any reasonably slow rate. During these observations no evidence was ever obtained of the transformation of the liquid to more than one crystalline form.
II. MATERIALS, APPARATUS, AND PROCEDURES
1. MATERIAL AND PROCEDURE FOR FILLING THE CELLS
The benzoic acid used for the experimental work reported in this paper was prepared by fractionally freezing a quantity of commercial benzoic acid as described by the authors in an earlier pUblication.3
Measurements of the freezing range,~ when the acid was freed of water in a manner which did not cause the formation of a significant amount of benzoic anhydride, indicated that the acid used to determine the reproducibility of the freezing temperature was 99.998 mole percent pure. That used to study some of the properties of the acid was of somewhat lower purity.
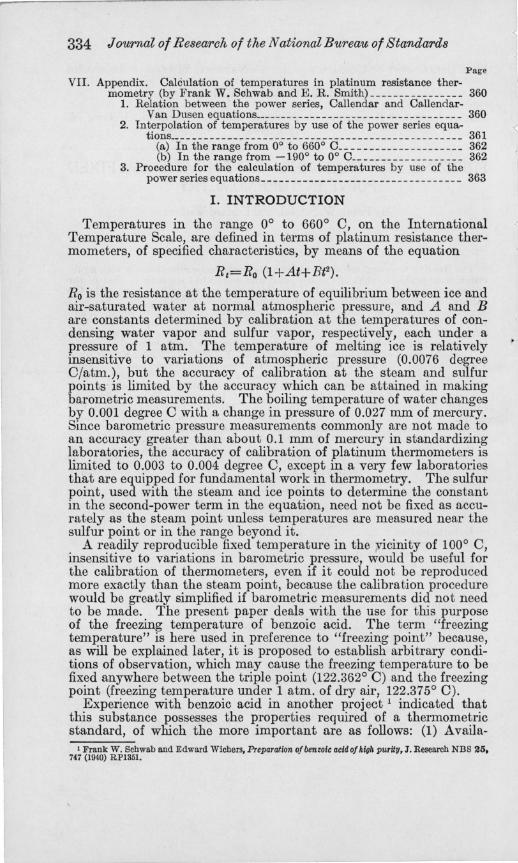
To avoid variations in freezing temperature which would have resulted from changes in the moisture content of air had the acid been frozen in open vessels, the acid was kept in sealed cells for all observations of the constancy and reproducibility of the freezing temperature. These cells, shown in figure 1, were cylindrical in shape, 5 cm in diameter, and about 25 cm long. A thermometer well 8 mm in diameter extended nearly the length of the cylinder, and an extension of the well about 12 cm long served as a handle. The capacity of each cell was about 425 ml.
, Frank W. Schwab and Edward Wichers, Purification of 8ubstances by slow fractional freezing, J. Research NBS 3~, 253 (1944) RPI588 .
• See footnote 2. I Frank W. Schwab and Edward Wichers, Precise Measurement of the Freezing Range as a Means
of Determining the Purity of a Substance, Temperature-Its Measurement and Control in Science and Industry, p. 256-264 (Reinhold Publishing Corporation, New York, N . Y., 1941).
336 J ourrnal of Research of the National Bureau of Standards
Before the cell was sealed to the apparatus shown in figure 2, about 380 g of the acid (365 ml), carefully fused in a beaker or other suitable vessel and containing a small amount of water, was t ransferred to the cell through a side tube. The volume of liquid acid was adjusted so as to leave a free space of 50 to 60 ml in the cell. The acid was allowed to freez e completely and the cell was sealed in place as shown
A
B
C
D
E
F ----l-H
G
FIGURE I.-Benzoic acid fixed-point cell.
A, SIde-tube; B, thermometer well; C, cell proper; D , solid benzoic acid; E, mixture of crystals and liquid F, solid benzoic acid; G, Dewar flask. I
in figure 2, with the aeration-tube, B, completely withdrawn. The acid was melted again and tube B was inserted, through the sidearm extended, into the liquid and adjusted with its end near the bottom of the cell. The opening at K between B and the side arm extended was closed by forcing a short piece of rubber tubing over the outside tube and was finally sealed with pycene. With stopcock 9 open,

Freezing Temperature of Benzoic, Acid 337
and stopcock 2 open to outlet 1, the liquid was saturated with air, which was dried over phosphorus pentoxide and free of carbon dioxide, forced under the necessary pressure into the system at H.
The next steps in the procedure were designed to remove the water which is always present when benzoic acid is fused in contact with ordinary air. Liquid benzoic acid saturated, at temperatures near its freezing point, with air having a partial pressure of 5 mm of water vapor, contains about 0.06 mole percent of dissolved water. This amount of water depresses the freezing temperature between 0.04 and 0.05 degree C. In addition to moisture gained from the air there was
9 ~
K
. -L H
6
2." 3 ~
8 :=
J ~~r5 =
7 G
C D E F A B
'---' FIGURE 2.-Apparatus for filling the benzoic acid fixed-point cell and for determining
water in benzoic acid.
A, Benzoic acid fixed-point cell; B, aeration-tube; C, manometer; D, trap of known volume; E, capillary trap; F, trap; G, vacuum connection; H, dry air source; K, rubber-tubing-connection sealed with pycene; L, air condenser for benzoic acid; 1, outlet for dry air; 2, 3, 4, etc. 2-mm stopcocks.
usually some that had been added intentionally to convert to benzoic acid small amounts of benzoic anhydride which might have been formed during the operations of purification . It was therefore necessary to dry the acid in the cells quite thoroughly to avoid excessive differences among the freezing temperatures in the several cells. This was done by pumping off the gases evolved while the acid slowly froze in the cell. The evolution of dissolved oxygen and nitrogen helped materially to sweep out the water vapor. The acid was allowed to freeze completely. To keep it from freezing so rapidly as to entrap much of the evolved gases, it was warmed at intervals with the soft flame of a hand torch. The acid was again fused and saturated with dry air. During this operation much of the acid that had sublimed while it was previously freezing and had condensed in the cell side of the inverted U-tubc, L, melted and flowed back into the cell. The
634436-45--4
\
338 J owrnal of Research of the National Bureaw of Standard8
acid was allowed to freeze a second time. This time the discharged gases were pumped off through stopcock 2, which was open to the manometer, 0, and trap D with stopcock 6 closed. During the pumping the trap was cooled with liquid air. When the pumping was completed, the trap was isolated from the rest of the apparatus, by closing stopcocks 3 and 7, and allowed to warm to room temperature. The known volume of the trap and the pressure indicated by the manometer gave a measure of the amount of water removed from the acid. E is a capillary receiver not used in this work and F is a guard trap. This apparatus and its use are described in greater detail in another publication.5
The amount of water removed during the second freezing was in each case enough to indicate the need of fusing the acid a third time. After the acid was saturated this time with dry air, stopcock 9 was closed and the aerating tube withdrawn far enough to leave its tip opposite the T outlet to L. The opening at K was again sealed vacuum tight in the manner previously described, and water, to~ether with the atmospheric gases, was pumped from the acid while It was allowed to freeze. Not more than 0.0036 g of water, equivalent to about 0.006 mole percent or 0.0009 percent by weight, was pumped from any of the cells during the third evacuation. Because of the relatively long time required for the acid to freeze, a small part of this water may have formed as the result of the conversion of acid to anhydride. This behavior will be discussed in a later section of the paper.
The acid was allowed to freeze completely under vacuum, and then to cool to room temperature. Dry air at a pressure of about 21 cm of mercury was then admitted, after which the side tube was sealed. Under this condition the pressure increased somewhat when the acid was fused because the increase in volume accompanying fusion more than offset the amount of air dissolved. When the acid began to freeze, the pressure was about 25 cm, or one-third of an atmosphere. Because the volume of free space in the cells was not the same in each case, this pressure varied somewhat, by amounts not exactly known, in the group of cells prepared for observations of the freezing temperature.
Several other cells, filled in the manner described, were used for observations on the stability of the acid. Still another cell (fig. 4), to be described later, was provided with a side arm assembly consisting of a stopcock and a ball-joint connection so that various gases could be admitted at known pressures for observations on the effect of pressure and of dissolved atmospheric gases. The triple point of the acid was also measured in this same apparatus.
, Frank W. Scbwab and Edward Wicbers, A physical method for determining residual water and other ~olatile materials in pUTe substances, J. Researcb NBS 33, 121 (1944) RPl600.

I
> Freezing Temperature of Benzoic A.cid 339
2. APPARATUSI FOR MEASURING TEMPERATURES
The temperature measurements were made with platinum resistance thermometers of the coiled-filament type described by Meyers,6 with a resistance at 0° 0 of about 25 ohms. The outside diameter of the thermometers was about 7 mm and the length of the coiled filament was 3 to 3.5 cm. The resistances were measured with a precision Mueller 7 bridge of the type G-2, No. 8069, made by the Leeds & Northrup 00. The apparatus was equipped with a switch that reversed the galvanometer current and thereby doubled the scale deflection caused by a given unbalance in the bridge. For convenience the bridge was connected to a four-place selector switch. The galvanometer had a sensitivity of 10 mm/microvolt, a period of not over 6 seconds, a critical external damping resistance of not less than 50 ohms and a coil resistance of 23.5 ohms. The optical arm of the galvanometer was 5.5 m long. With a reversing switch on the bridge, it provided a scale deflection of 32 mm for an unbalance of the bridge of 0.0001 ohm. It was thus readily possible to estimate changes in resistance to a few millionths of an ohm. All corrections were made to a millionth of an ohm in order to obtain an adequate measure of the reproducibili ty.
Before the series of measurements r eported in this paper were made, the resistance bridge was calibrated by the Resistance Measurements Section of this Bureau. Two of the thermometers, 535 and 618, together with the bridge, were calibrated at the steam point to 0.0001 degree 0 by O. S. Oragoe and H. F. Stimson of the Heat Measurements Section, with a precision manometer by means of which the height of the mercury column was fixed with an accuracy within 1 micron. The sulfur point was determined in the regular way by the Thermometry Section, also of this Bureau. A much less accurate calibration was required at the sulfur point than at the steam point, since all of the temperatures measured were close to 122.4° O. At this temperature, errors arising from an error of calibration at the sulfur point are only about one-fiftieth of the error at the sulfur point itself. The bridge and each of the thermometers, 535 and 618, were calibrated in the same way after the measurements were completed, to disclose, if possible, any changes in the resistancemeasuring equipment. The other thermometers, 515 and 587, were calibrated in the regular way by the Thermometry Section, before the measurements were begun. At the completion of the observations, theremometer 587 was also calibrated with the same accuracy as 535 and 618. The characteristics of the four thermometers, as determined by these calibrations, are given in table 1 .
• C. H. Meyers, Coiled·filamem re8istance thermometers, BS J. Research 9, 807 (1932) RP508. 7 E. F. Mueller, Precision Resistance Thermometry, Temperature-Its Measurement and Control In
Science and Industry, p. 162 to 179 (Reinhold Publishing Corporatiou, New York, N. Y.,1941).
340 JowrnaZ of Research 01 the National Bureau of Standards
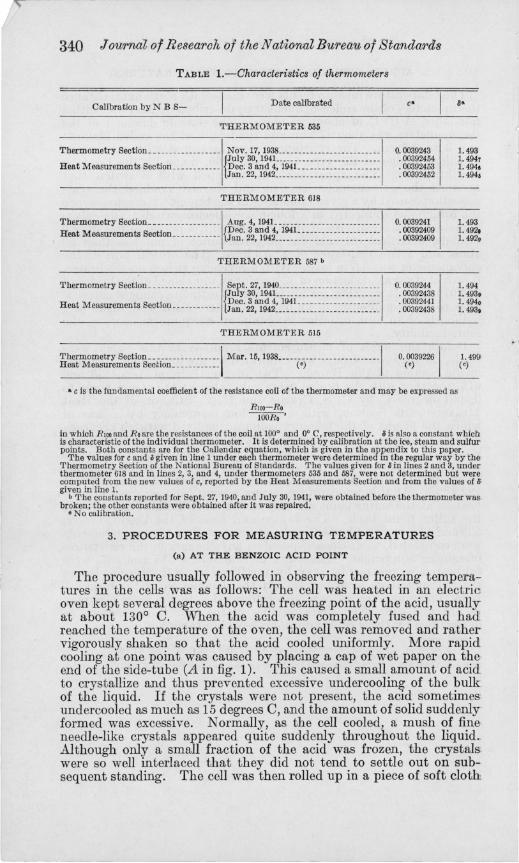
TABLE I.-Characteristics of thermometers
Calibration by N B S- Date calibrated c· ~.
'THERMOMETER 535
Thermometry Section . . . ..... ... . ..... . Nov. 17.1938 ................. . . . ... . . .
{July 30.1941.. . . .. . •.. . .......•. . . . . ...
Heat Measurements Section.. ......... . Dec. 3 and 4. 1941. . ................. . . Jan. 22. 1942 ..•.................... ... .
THERMOMETER 618
0.0039243 .00392454 .00392453 .00392452
Thermometry Section····· ·············1 Aug. 4. 1941. .'."'.'.".""" '. " '."1 0.0039241 I Heat Measurements Section ..... . . . . . . . {.Pa~~. i2~~~4L~~~~~ ~~ ~ ~~~~~~ ~~~ ~~~~~~~ ~ : gg~~~g~ --------------------~--------------------~-
THERMOMETER 587 b
Thermometry Section .. .. . ...... . ... ... Sept. 27.1940 .. ... ... . . . . . ... . ........ .
{July 30.1941. .. . . . .. . .. .. . ... ........ . .
Heat Measurements Section ... . . . . ..... Dec. 30 and 4.1941. ........ ... . . . . . . .. . Jan. 2 •• 1942 ...... . ............... . ... .
THERMOMETER 515
0.0039244 .00392438 .00392441 .00392438
Thermometry Section··,.·· · · · · ··· ··· · · · 1 Mar. 15.1938 .... ... .. ... ... . •...•..... 1 0.00392261 Heat Measurements Sec.lOn. ....... .... (,) (0)
------------------------~---
• c is the fundamental coefficient of the resistance coli of the thermometer and may be expressed as
R,oo-R. 100R. •
1. 493 1. 494, 1. 494, 1. 494,
1. 493 1. 492, 1. 492.
1. 494 1. 493. 1. 494. 1. 493.
1.(91) (,)
in which RlOo and Ro are the resistances of the coil at 1000 and 00 C. respectively. ~ is also a constant which is characteristic of the individual thermometer. It is determined by calibration at tho ice. steam and sulfur points. Both constants are for the Callendar equation. which is given in the appendix to this paper.
The values for c and 0 given in line 1 under each thermometer were determined in the regular way by the Thermometry Section of the National Bureau of Standards. The values given for 0 in lines 2 and 3. under thermometer 618 and in lines 2. 3. and 4. under thermometers 535 and 587. were not determined but were computed from the new values of c. reported hy the Heat Measurements Section and from the values of I> given in line 1.
b The constants reported for Sept. 27. 1940. and July 30. 1941. were obtained before the thermometer was. broken; the other constants were obtained after it was repaired.
o No calibration.
3. PROCEDURES FOR MEASURING TEMPERATURES
(a) AT THE BENZOIC ACID POINT
The procedure usually followed in observing the freezing temperatures in the cells was as follows: The cell was heated in an electric. oven kept several degrees above the freezing point of the acid, usually at about 1300 C. When the acid was completely fused and had. reached the temperature of the oven, the cell was removed and rather vigorously shaken so that the acid cooled uniformly. More rapid cooling at one point was caused by placing a cap of wet paper on the end of the side-tube (A in fig. 1). This caused a small amount of acid to crystallize and thus prevented excessive undercooling of the bulk of the liquid. If the crystals were not present, the acid sometimes undercooled as much as 15 degrees C, and the amount of solid suddenly formed was excessive. Normally, as the cell cooled, a mush of fineneedle-like crystals appeared quite suddenly throughout the liquid. Although only a small fraction of the acid was frozen, the crystals: were so well interlaced that they did not tend to settle out on subsequent standing. The cell was then rolled up in a piece of soft clotft
<;
F1'eezing Temperature of Benzoic Acid 341
and placed in a close-fitting Dewar flask. The open end of the Dewar flask was packed with co'tton to provide further insulation. Before the cell was put into it, the Dewar flask was warmed approximately to the freezing_point of the acid by placing in it for 15 to 20 minutes a companion cell also containing freezing benzoic acid. This was done to prevent the rapid freezing of acid in the cell to be measured, which otherwise would have been caused by the loss of a considerable amount of heat to the cold flask. When the cell which was to be observed was in place in the Dewar flask, the resistance thermometer was inserted in the thermometer well. After about 10 minutes, measurements of resistance were begun. They were continued at least until the resistance reached its maximum (usually within 30 minutes) and nearly always for a considerably longer period. In a number of instances two sets of resistance measurements were made, one in which the thermometer current was 1.00 ma; the other, 1.41 mao With the latter current the power input was twice that of the former. The difference in resistance between the two sets of measurements, when subtracted from the resistance observed with a current of 1 ma, provided the correction necessary to give resistances corresponding to zero thermometer current.
Usually, observations were made on several cells in close sequence by connecting the several thermometers to the bridge in rotation by means of the selector switch.
Temperatures corresponding to observed resistances were computed by the method described in the appendix to this paper. For observations of small differences in temperature, with a given thermometer, it was not always necessary to compute actual temperatures. For these relative measurements it was often sufficient to observe changes in the interval between the ice point and the benzoic. acid point, since the change of r esistance as a function of temperature in the vicinity of the benzoic acid point was accurately known. The approximate coefficient was 0.0001 ohm/millidegree.
(b) AT THE ICE POINT
The fundamental calibrations of the measuring instruments were made before and after the series of observations that gave the precision of the benzoic acid fixed-point cell. In addition, observations at the benzoic acid point were bracketed between observations at the ice point, made the same day, in order to disclose and, if possible, to correct for any variation in the resistance-measuring equipment. Two benzoic acid points and three ice points were usually measured with a thermometer during a day.
Measurements at the ice point were made as follows: 8 Shaved ice obtained from clear cakes was washed with distilled water. The mush was thoroughly mixed in an open porcelain enamel pan to approach saturation with air, and then transferred to a precooled Dewar flask. The coil of the thermometer was immersed 20 to 25 cm, the mush was pressed lightly around the thermometer and measurements
• The "ice point," or temperature of equilibrium between Ice and air·saturated water at normal atmos· pheric pressure, has been a basic fixed point in nearly all measurements of temperature. It was reported in the Technical News Bulletin of the National Bureau of Standards, No. 305, p. 71 (1942), that for work of the highest precision it is desirable to avoid the small variations In the ice point resulting from contact of the melting ice with the atmosphere. For this purpose the triple point of water has ad vantages. A direct comparison hetween the ice point and the triple point for the same sample of water shows a difference of 0.00997 degree C.
342 J owrnal of Research of the National Bureau of Standards
of the resistances were recorded when they became constant. As with the measurements at the benzoic acid point, observations were made with thermometer currents of 1.00 and 1.41 rna, to permit extrapola-tion to zero current. A correction for impurities in the ice was obtained from conductivity measurements of the ice water at the time of calibration and on other occasions when it was desirable to report temperatures to the highest accuracy. Clear ice was of high purity and the correction was usually not more than 0.00001 to 0.00002 ohm.
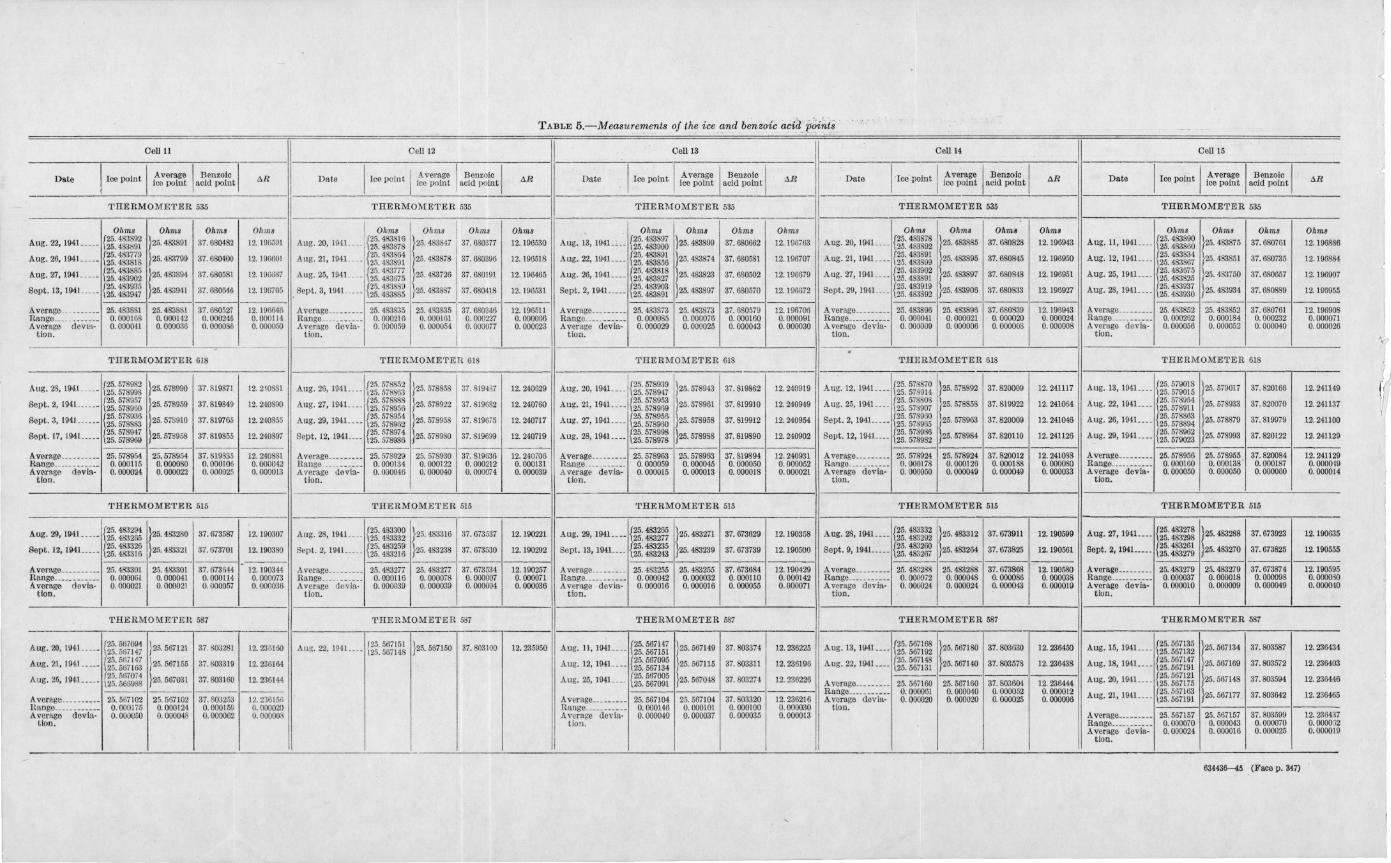
In table 5 are given the resistances of thermometers 587, 535, 618, and 515 as measured at the ice points during the time most of the measurements reported in this paper were made. These measurements show the maximum variation observed during a period of about 1 month.
III. STABILITY OF BENZOIC ACID
In the course of this work, benzoic acid was not found to undergo any measurable irreversible decomposition when heated at temperatures below 150 0 C. Evidence of this will be presented later. However, the acid does undergo a reversible decomposition to benzoic anhydride and water. Since this reaction must be controlled if the acid is not to suffer a variable or progressive change in purity, and · 1 hence in freezing temperature, extensive observations concerning it were made. Some of these observations have been reported in an earlier publication.9 When the acid is enclosed in a sealed container the water produced simultaneously with the anhydride cannot es-cape, and the reaction therefore can proceed only until an equilibrium is reached. At the outset it was thought that the acid would have to be brought to some state of equilibrium with the products of its own dissociation if reproducible freezing temperatures were to be obtained. Accordingly, four cells were kept above freezing temperature, except during the short periods when observations of the freezing temperature were being made, until they reached equilibrium, as evidenced by constancy of the freezing temperature. This was done by keeping the cells in an electrically heated oven, in which mechan-ical circulation of air kept the temperature constant within 1 degree. The temperature of theloven was intended to be about 10 degrees C above the freezing temperature of the acid. An actual measurement made after the observations were begun showed the temperature of the oven to be 131.60 C. The observed freezing temperatures of the cells are given in table 2. It will be noted that 10 days or longer were required for the acid to reach equilibrium with benzoic anhy-dride and water. The slight variability in the observed temperatures over longer periods, up to 8 weeks, is attributable to a lack of reproducibility caused by the presence of about 0.015 mole percent each of dissolved anhydride and water. The small differences in the total depressions observed in the several cells were probably caused by differences in the initial content of water or of anhydride resulting from uncontrolled variations in the drying of the acid when the cells were filled.
• Frank W. Schwab and Edward Wichers, Preparation o/benzdc acid of hiQh purity, J . Research NBS Z5, 747 (1940) EP 1351.
r
~ ~
Freezing Temperature oj Benzow, Acid 343
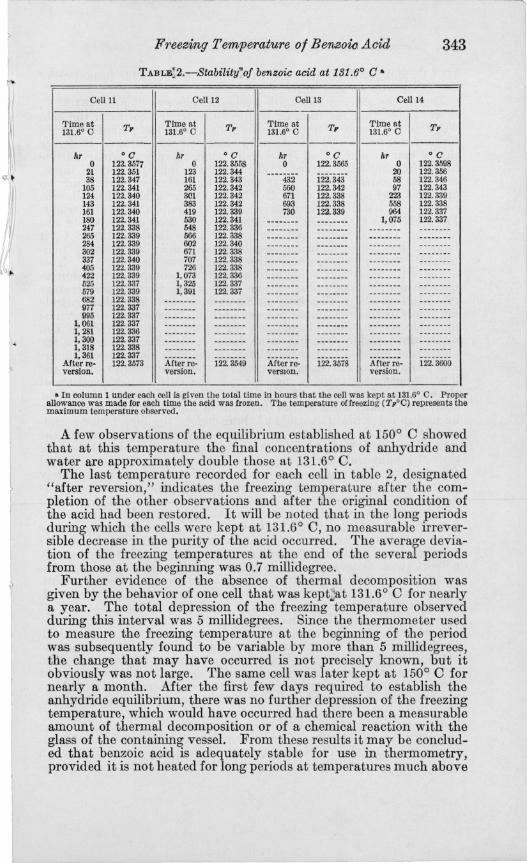
TABLE:2.-Stability~of benzoic acid at lSl.6° C'
Cellll Cell 12 Cell 13 Cell 14
Time at T, Time at T"
Time at T, Time at T" 131.6° C 131.6° C 131.6° C 131.6° C
AT °0 AT °0 AT ·0 AT ·0 0 122.3577 0 122.3558 0 122.3565 0 122.3.598
21 122. 351 123 122.344 20 122.356 38 122.347 161 122.343 432 122.343 58 122.346
105 122.341 265 122.342 560 122.312 97 122.343 124 122. 340 301 122.342 671 122.338 223 122.339 143 122.341 383 122.342 693 122.338 558 122.338 161 122. 340 419 122.339 730 122.339 964 122.337 ISO 122.341 530 122.341 1,075 122.337 247 122.338 548 122.336 265 122. 339 566 122.338 234 122.339 602 122.340 302 122.339 671 122.338 337 122. 340 707 122.338 405 122.339 726 122.338 422 122.339 1,073 122.336 525 122.337 1,325 122.337 579 122.339 1,391 122.337 682 122.338 977 122. 337 995 122. 337
1,001 122. 337 1,231 122.336 1,300 122. 337 1,318 122.338 1,361 122.337
After re- 122.3573 Alter re- 122.3549 Alterre- 122. 3578 After re- 122. 3600 version. version. verSIon . version.
• In column 1 under each cell is given the total time in hours that the cell was kept at 131.6° C. Proper allowance was made for each time tbe acid was frozen . Tbe temperature 01 freezing (T"OC) represents the maximum temperature observed.
A few observations of the equilibrium established at 150° C showed that at this temperature the final concentrations of anhydride and water are approximately double those at 131.6° C.
The last t emperature recorded for each cell in table 2, designated "after reversion," indicates the freezing temperature after the completion of the other observations and after the original condition of the acid had been restored. It will be noted that in the long periods during which the cells were kept at 131.6° C, no measurable irreversible decrease in the purity of the acid occurred. The average deviation of the freezing temperatures at the end of the several periods from those at the beginning was 0.7 millidegree.
Further evidence of the absence of thermal decomposition was given by the behavior of one cell that was keptjat 131.6° C for nearly a year. The total depression of the freezing temperature observed during this interval was 5 millidegrees_ Since the thermometer used to measure the freezing temperature at the beginning of the period was subsequently found to be variable by more than 5 millidegrees, the change that may have occurred is not precisely known, but it obviously was not large. The same cell was later kept at 150° C for nearly a month. After the first few days required to establish the anhydride equilibrium, there was no further depression of the freezing temperature, which would have occurred had there been a measurable amount of thermal decomposition or of a chemical reaction with the glass of the containing vessel. From these results it may be concluded that benzoic acid is adequately stable for use in thermometry, provided it is not heated for long periods at temperatures much above
344 Jowrnal of Research of tM National Bureau of Standards
150° C, and provided account is taken of the reversible formation of benzoic anhydride and water.
During the observations made while the cells were kept at 131.6° C, it was noted that the freezing temperature tended to rise if the acid was kept near freezing for longer than the usual short periods required for measurements. If all the acid in a cell was allowed to freeze slowly and then remelted for a short time, there was a marked rise in the freezing temperature. When this was repeated several times, the . freezing temperature returned to that of acid containing no anhydride, as shown in table 2. Obviously the acid in the cells was reverting to its original condition. This came about for two reasons. From the fact that the equilibrium concentrations of anhydride and water at 150° C were markedly greater than those at 131.6° C, it follows that the equilibrium concentrations near the freezing temperature (122.4° C) must be lower than those at 131.6° C. This alone is probably not enough to account for complete reversion to benzoic acid, although observations made at the freezing temperature indicate that the equilibrium concentrations of water and anhydride are lower than 0.003 mole percent each at this temperature. The probable explanation of complete reversion of the anhydride and water during slow freezing is as follows: As the acid freezes the anhydride and water remain almost completely in solution in the liquid phase. As freezing progresses, their concentrations in the liquid phase progressively increase. If the eutectic temperature of the system is as much as 10 degrees C below the freezing point of the acid, the initially minute concentration of the two "impurities" may be multiplied some thousands of times before the liquid phase completely disappears. This huge change in concentration causes the rate of recombination to increase enormously. It is doubtless true that the anhydride and water do not remain ideally in the liquid phase as freezing progresses, but this condition must be rather closely approached at the slow rate of freezing which occurs if the cell is kept in the Dewar flask.
From the data in table 2 it can be estimated that the initial rate of formation of anhydride and water at 131.6° C is not great enough to cause in 1 hour a lowering of the freezing temperature by as much as 1 millidegree. When a cell is prepared for an observation it takes only a short time, at most half an hour, to heat the acid, once it is completely fused, to a temperature a few degrees above its freezing point. As the rate of formation of the anhydride during the melting period, which is considerably longer, must be much lower than at 131.6° C, it may be concluded that the total amount of anhydride and water formed while the cell is being prepared for an observation is not enough to depress the freezing temperature by as much as 1 millidegree. Since even the minute amounts that are formed tend to revert to acid during the subsequent freezing, it is apparent that cells kept at room temperature during the periods between observations would not be unreliable because of the dissociation reaction. Because of the absence of appreciable amounts of anhydride and water as" impurities" in such cells, the observed freezing temperatures would also be more sharply reproducible than in cells maintained above the freezing temperature during the intervals between observations. Accordingly, all subsequent observations of the reproducibility of the freezing tempera-
1
Freezing Temperature of Benzoic Acid 345
ture were made on cells kept at room temperature when not in use. In occasional exceptions, for example, when the formation of crystals was faulty, the per~od required to reheat the cell was very short. lO
IV. REPRODUCIBILITY OF THE FREEZING TEMPERATURE
After the acid in each of the five cells had been restored to the condition existing before the series of observations in which the cells were kept at 131.6° C, a large number of observations were made to determine the reproducibility of the freezing temperature.'1 Most of these observations were made during a period of 1 month. Four thermometers were used. Two of the thermometers, 535 and 618, were calibrated at the steam point with the high degree of accuracy previously mentioned. This made it possible to assign absolute values to the observed temperatures, although the emphasis in this series of observations was on the constancy and reproducibility of the temperature of a particular cell as measured with a particular thermometer. It should be noted that the observed temperatures have no significance either as the triple point of benzoic acid or as its freezing temperature under 1 atm of dry air, because the conditions in the cells were intermediate between these two defined conditions. The pressure in the cells was about one-third of an atmosphere, but there was some variation in the. pressure from cell to cell, and also in the purity of the acid in the several cells, resulting from the way in which the cells were filled.
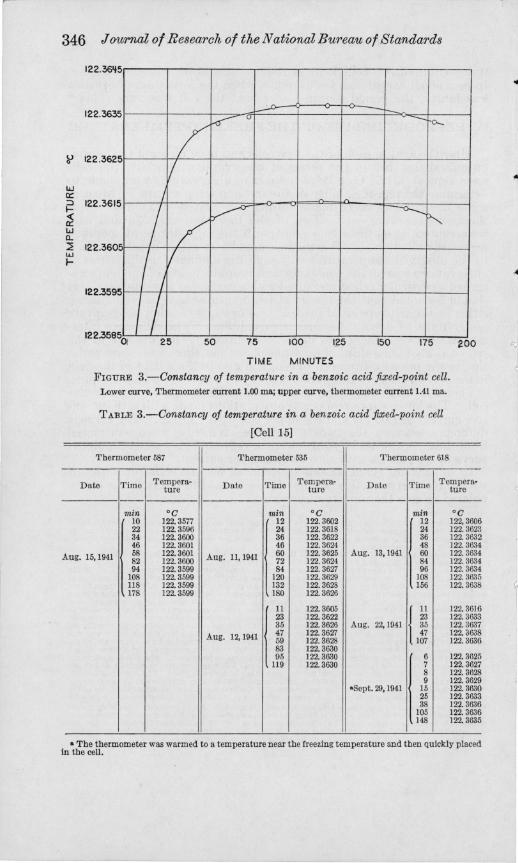
Figure 3 12 illustrates the course of measurements of a particular cell. The lower curve represents observations made with a thermometer current of 1.00 rna and the upper one with 1.41 rna. The average difference between the two sets of measurements, when subtracted from those represented by the lower curve, would give an extrapolated curve of resistances with zero thermometer current. 13
In table 3 are given six sets of data, all for one cell, but obtained with three thermometers, similar to those used in figure 3 but extrapolated to zero thermometer current.
10 In connection with this discussion, it may be pointed out that the direction and magnitude of the shift in the equilibrium between the acid anhydride and water in the interval between 150° C and the freezing point suggest that no measurable amounts of anhydride and water are likely to exist under equilibrium conditions at room temperature.
11 Thanks are expressed to J . L. Clark, of tbis Bureau. for h is help during these observations . 12 The observations in figure 3 werc made by the Heat Measurements Section. 13 In accordance with a paper by Mueller (see footnote 7), it has been customary to assume that, in the
range from 0° to 500° C, the temperature rise produced by a constant thermometer current is independent of the temperature and the medium in wbich the thermometer is placed. This is true only when the environments of the thermometer do not differ materially with respect to loss of heat at the temperatbres being measured. In cases where there is doubt as to whether the heating is the same at all temperatures or in different media at one temperature, the observed resistances may be corrected to those corresponding to zero thermometer current by making observations with two different thermometer currents. For example, the environment of the tbermometer in the measurements at thc ice point reported in this paper, was shavea ice in water. At the bcnzoic acid point the thermometer, inserted in the well R of the cell (fig. 1) was separated from the freezing mixture of benzoic acid by the Pyrex thermometer well and a thin air space. Subtracting tbe difference between the resistances observed when 1.41 and 1.00 rna were used, from the resistance observed when 1.00 rna was used, gave the resistance for zero thermometer current. The difference between the resistances observed for each thermometer, 53'), 61S. 515 and 5S7. with tbermometer currents of 1.41 and 1.00 rna, was 0.000209, 0.0001S4, 0.000167, and 0.000190 obm at the benzoic acid point. The corresponding differences at the ice point were 0.000133, O.OOO1OS, 0.000119, and 0.000120 ohms, respectively. Thc validity of these extrapolations is dependent on the assumption that the heat input and the temperature rise of the tbermometers varies 8S the square of the current, which was verified by making measurements with thermometer currents of "';0.50. 1.00, ";2.00, and 2.00 rna. It is intcrestin~ to note that if the temperature at the benzoic acid point had been calculated from the resistanccs observed with 1.00 ms as the thermometer current, the benzoic acid point would have been in error by at least 0.5 millidegree (thermometer 515) and not more than O.S millidegree (thermometer 618). With a thermometer current of 2 rna, the error would have been 2.0 and 3.2 millidegrees, and larger for higber thermometer currents.
346 J owrnril of R esearoh of the National Bureaw of Standards
~
w a::: :::> ..... « cr: w 0... :2 w f-
122.36,+5
122.3635
122 .3625
~
~ v --- 0-
f / ,
122.3615
122.3605
122..3595
I
/ ~ ~ ~
;/
I I V
I I 25 50 75 100 150 175
TIME MINUTES
FIGURE 3.-Constancy oj temperature in a benzoic acid fixed-point cell. Lower curve, Thermometer current 1.00 ma; upper curve, thermometer current 1,41 mao
TABLE 3.-Constancy oj temperature in a benzoic acid fixed-point cell
[Cell 15]
Thermometer 587 Thermometer 535 Thermometer 618
200
Date Time T empera· Date Time Tempera· Date Time Tempera-ture ture ture
-----min °C min °C min °C
10 122.3577 12 122. 3602 12 122, 3606 22 122.3.596 24 122.3618 24 122.3623 34 122.3600 36 122.3622 36 122.3632 46 122.3601 46 122.3624 48 122. 3634
Aug. 15, 1941 58 122.3601 Aug. 11, 1941 60 122. 3625 Aug. 13,1941 60 122. 3634 82 122.3600 72 122.3624 84 122.3634 94 122.3599 84 122. 3627 96 122.3634
108 122.3599 120 122. 3629 108 122.3635 118 122.3599 132 122.3628 156 122.3638 178 122.3599 180 122.3626
l" 122.3605
1 11
122.3616 23 122.3622 23 122.3633 35 122.3626 Aug. 22,1941 35 122.3637
Aug. 12, 1941 47 122. 3627 47 122.3638 59 122.3628 107 122.3636 83 122.3630 95 122.3630 6 122.3625
119 122.3630 7 122. 3627 8 122.3628 9 122.3629
-Sept. 29, 1941 15 122.3630 25 122.3633 38 122.3636
105 122.3636 148 122. 3635
• The thermometer was warmed to a temperature near the freezing temperature and then quickly placed in the cell.
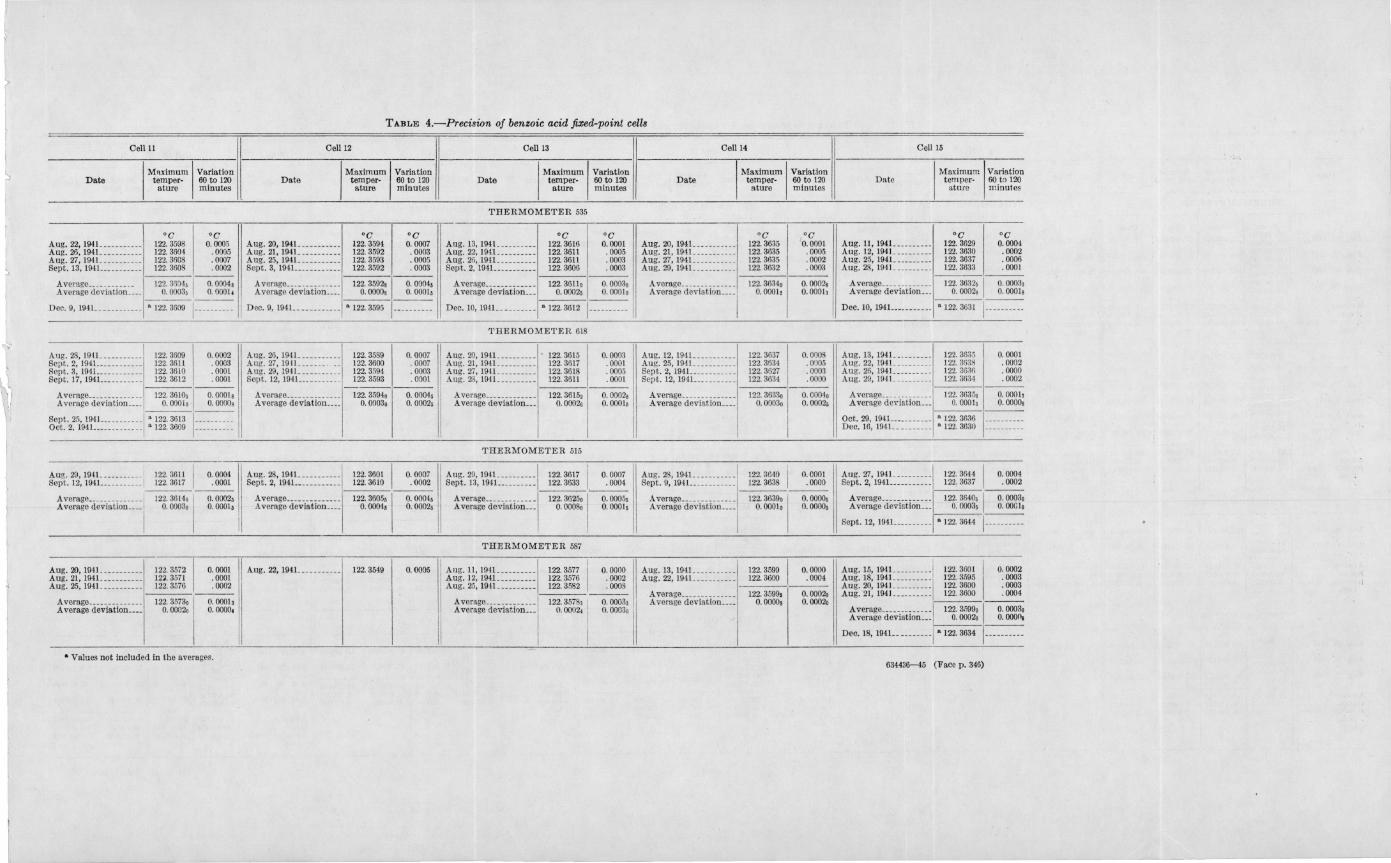
TABLE 4.-Precision of benzoic acid ji:£ed-point cells
Cell \1 Cell 12
I MRximum I Variation I Maximu m I Variation Date temper- 60 to 120 Date temper- 60 to 120
a ture minutes ature m inutes
Aug. 22,194'- _________ _ Aug. 26, 194L _________ _ Aug. 27, 194'- ______ ___ _ Sept. 13, 194L ___ ___ __ _
°C 122.3598 122.3604 122. 36G8 122.3608
°C 0.0005
. 0005
.0007
.0002
Avemgc__ ____ ____ __ 1-1-2-2.-3-60-4-, I 0.0004, Averago dcviatiou____ 0.0003, 0.0001,
Dec. 9, 194L ______ ____ ~2. 3609 I~
Aug. 28, 194L ________ _ _ Sept. 2, 194L __ ____ __ _ _ Sept. 3, 194L __ ____ __ _ _ Sept.17,194L ____ ____ _
122.3609 122.3611 122.3610 122.3612
0.0002 .0003 .0001 . 0001
Aug. 20, 194L _____ _____ Aug. 21, 194L _____ _____ Aug. 25, 194L __________ Sept. 3, 194L ___________
A verage ______________ Average devia tion ____
Dee.9,194L ___________
Aug. 26, 194L _________ _ Aug. 27, 19IL ______ . __ Aug. 29, 194L ____ _____ _ Sept. 12,1941--_______ _ .
°C 122.3594 122.3592 122.3593 122.3592
-----122.3592,
0.0000,
' 122.3595
122.3589 122.3600 122.3594 122.3593
Average__ ____ ___ _____ 122. 3610, 0.0001, Average ____ ._________ 122.35940 Average deviatioll ____ 1 0.0001, 0.0000, Average d eviation____ 0.00030
Sept. 25, 194L _________ I" 122.3613 ____ ____ ._1' Oct. 2, 194L ___ ______ _ . "122.3609 ________ ._
Aug. 29, 194L ________ _ 122.3611 II 0.0004 I Aug.28,194L __________ 1
Sept. 12, 194L _____ ____ '_ 1_2_2._3_61_7_. __ ._0_00._1 I Sept. 2, 194L _________ _ _
AA vVeerraaggee-d--e-v-'·-a-t-'·o-u--_-_-_-_ I' 122.36140 I 0.0002, Average __ ____ _______ _ 0.00030 0.0001, Average deviation ___ _
I II
Aug. 20,194'- __________ 122.3572 1 0. 0001 II Aug. 22,194L _________ _ Aug. 21, 194L ________ __ 1 2~. 3571 . 0001 Aug. 25, 194'- __ __ ______ 122.3576 .0002 I'
Average ________ __ ____ - 1-2-2.-3-5-73-0- :--0-. OOO--la Average deviatioll____ 0.00020 0.0000,
II a Values llOt included in the averages.
122.3601 I 122.3610
122.3605, I 0.0004,
122. 3549
°C 0.0007 .0003 .0005 .0003
----0.0004, 0.0001,
-- -- - - ----
0.0007 .0007 .0003 .0001
0.0004, 0.0002,
0.0007 .0002
----0.0004, 0.0002,
0.0005
,
Cell 13 Cell 14 Cell 15
I Maximum I Variation I Maximum I Variation I Maximum I Variation Date temper- 60 to 120 Date torn per- 60 to 120 Date t emper- 60 to 120
ature minutes ature minutes atu re In inut es
THERM OMETER 535
°C °C °C °C °C °C Aug. 13, 194'- _______ __ 122. 3616 0.0001 Aug. 20, 194'- __________ 122. 3635 0. 0001 Aug. 11, 194L ___ __ ____ 122.3629 0.0004 Aug. 22,19-11 ________ __ 122.3611 .0005 Aug. 21 , 194L ________ __ 122.3635 .0005 Aug. 12, 194L ____ _____ 122.3630 .0002 Aug. 26, 19'11 __________ 122.3611 . 0003 Aug. 27,194L ________ ._ 122.3635 .0002 Aug. 25,194'- _____ ___ _ 122. 3637 . 0006 Sept. 2, 1941--_________ 122.3606 .0003 Au g. 29, 194L _____ ___ _ . 122.3632 .0003 Au g. 28,1941 _________ . 122. 3633 .0001
1
Average _____________ 122.36110 0.00030 Averago __ ________ ___ . 122.36340 0.0002, Average _____________ 122.3632, 0.0003, Average deviat ion ___ 0. 0002, 0.0001, Average deviat ioll ____ O.OOO!' 0.0001, Average devi.tion __ . 0.0002, 0.0001,
D ec. 10, 194L ___ ___ ___ ' 122.3612 1------- --- D ec. 10, 194'-________ __ • 122. 3631 1-- --- -----
'l'HERMOMETER 618
Aug. 20, 194L ________ _ Aug. 21, 194L ________ _ Aug. 27, 194'- ________ _ Aug. 28,194L ________ _
122.3615 122.3617 122.3618 122.3611
0.0003 .0001 .0005 .0001
I Aug. 12, 194L __ __ __ ___ _ Aug. 25, 194L _________ _ Sept. 2, 194L ______ __ _ _ Sept.12,194L ____ _____ _
122.3637 122.3634 122.3627 122.3634
0.0008 . 0005 .0003 . 0000
Aug. 13, 194L _.______ _ 122.3635 0.0001 Aug. 22, 194L _.___ ____ 122.3638 .0002 Aug. 26,194'-______ ___ 122. 363f, .0000 Aug. 29, 194L _._______ 122.3634 .0002
Average_____________ 122.3615, Average deviation___ 0.0002,
THERMOMETER 515
Aug. 29, 194'- ________ _ Sept. 13, 194'--______ _ _
Average ____________ _ Average deviation __ _
122.3617 1 122.3633
122.36250 I 0.00080
THERMOMETER 587
Aug. ll, 194'- ___ ___ __ _ Aug. 12,194'- ___ _____ _ Aug. 25,194'- ___ ____ _ _
A verage __ _______ ___ _ Average deviation __ _
122.3577 II
122.3576 122.3582
122.3578, 1-
0. 0002,
I
I
0.0002, O.OOOh
O. C007 .0004
0.0005, 0.0001, 1
0.0000 .0002 . 0008
0.0003,
0.0003, I,
1---- ;,- --- 1----1--Average______________ 122.36330 0.0004, Average__ ________ ___ 122.3635, O.OOO!,
0.0000, Average d eviation____ 0.00030 0.0002, Average devintion___ 0. 00010
Aug. 28, 194L __________ 1 122.3640 I 0.0001 Sept.9, 194L _______ ____ 122.3638 .0000
:-------122. 36390 I 0.0000,
O. 0001, 0.0000, A verage __ __ _________ _ Average deviatioll ___ _
Aug. 13,194L ____ ______ 122.35991 0. 0000 Aug. 22, 194L___ ____ ___ 122. 3600 .0004
1--- -:---A verage __ ___________ _ 122. 3599, O. 00020 Average deviat ioll ___ _ O. 0000, O. 00020
Oct. 29,194'-- __ _______ '122.3636 D ec. 16, 194L _________ '122.3630
Aug. 27, 194L _________ 1 Sept . 2, 194L ___ ______ _
122. 3644 I O. 0004 122.3637 ~
A verage ____________ _ Average deviatioll __ _
122. 3640, 1 O. 0003, 0.0003, O.OOClo
Sept. 12, 194L ________ _ ·122. 3644 I~
Aug. 18, 194'- _________ ' 122.3595 .0003 Aug. 15, 194L ______ _ --I 122.3601 I 0.0002
Aug. 20,194L _________ 122.3600 . 0003 Aug. 21 , 194'-_________ 122.3600 . 0004
1----:---Average_______ ___ __ _ 122. 3599, 0.00030 A verage d eviation ___ 0.00020 0.0000,
1----,1---Dec. 18, 194L _________ "122.3634
634436-45 (Face p. 346)
CeIlll Cell 12
Date I . I Avernge I Ice POlllt ice point I Benzoic I
acid point t>R Date I . I Average Ice pomt I ice p<Jint I Benzoic I I acid point I
THERMOMETER 535
I THERMOMETER 535
I Ohms Ohms Ohms Ohms Ohms Ohms Ohms Aug. 22, 194L ___ _ {25.483892 }25.483891 37.680482 12. 190591 1{25 483816 }25.483847 37.680377 25.4!!:l891 Aug. 20, 1941. - -- 25: 483878
Aug.26,I94L ____ {25.48377g 25.483818 }25.483799 37.680400 12.196601 Aug. 21, 1911. __ _ {25.483864
25.483891 }25. 483878 37.680396
Aug. 27,1941. ___ _ {25.483885 25.483902 }25. 483894 37.680581 12. 190687 Aug. 25, 1941. __ _ {25.483777
25.483675 }25. 483726 37.680191
Sept . 13, 19H ____ _ {25.483935 25.483947 }25.483941 37.680646 12. 196705 Sept. 3, 1941.. ___ {25.483889
25.483885 }25.483887 37.680418
Averago ___ __ __ __ 25. 483881 25.483881 37.680527 12.196646 Average ___ ______ 25.483835 25.483835 37.680346 Range _____ _______ 0.000168 0.000142 0.000246 0.000114 Range _____ ____ __ 0.000216 0.000161 0.000227 Average devia' 0.000041 0.000036 0.000086 0.000050 Average devia- 0.000059 0.000054 0.000077
tion. tion.
-THERMOMETER 618 THERMOMETER 618
Aug. 28, 104L ___ _ e5.578982 25. 578998 }25.578990 37.819871 12.210881 1{25. 578852 Aug. 26, 1941. - -- 25.578863 }25.578858 37.819437
Sept. 2, 1041.. __ __ {25.578957 25.578960 }25.578959 37.810849- 12.240890 Aug. 27,1941. ___ {25.578888
25.578956 }25.578922 37.819682
Sept. 3, 1041.. ____ r5.578936 }25.57891O 37.819765 12.240855 Aug. 29,1941. ___ {25.578954 }25. 578953 37.819675 25.578883 25.578962 Sept. 17, 1941. ____ 25.578947 }25.578953 37.819855 12.240897 Sept. 12, 194L __ {25.578974 }25.578980 37.819699 25.578969 25.578986
Average ____ ____ __ 25.578954 25. 578954 37.819835 12.240881 Average __ _______ 25.578929 25. 578930 37.819636 Range _____ _______ 0. 000115 0.000080 0.0001 06 0. 000042 Range ____ ____ __ 0.000134 0.000122 0.000212 Average devia· 0.000024 0.000022 0.000025 0.000013 Average devia- 0.000046 0.000040 0.000074
tlon. tion.
THERMOME'l'ER 515 'l'HERMOME'l'ER 515
Aug. 29, 1941.. __ _ (25.483294 25.483265 }25.483280 37.673587 12. 190307 Aug. 28, 1941. ___ {25.483300
25.483332 }25.483316 37.673537
Sept. 12, 1941.. ___ e5.483326 25.483316 }25.483321 37. 673701 12. 190380 Sept. 2, 194L ___ {25.483259
25.483216 }25.483238 37. 673530 ---_.
Average __________ 25.483301 25.483301 37.673614 12. 190344 Average ____ _____ 25. 483277 25.483277 37.673534 Raugo _______ _____ 0.000061 0.000041 0.000114 0.000073 Range ______ _____ 0.000116 0.000078 0.000007 Averago davia- 0. 000021 0.000021 0.000057 0.000036 Average devia- 0.000039 0.000039 0.000004
tion. tion.
'l'HERMOMETER 537 THERMOMETER 587
--Aug. 2O, 194L. __ _ {25.5tl7094 }25.567121 37.803281 12.230160 Aug. 22. 1941. ___ /25.567151 }25.567150 37.803100 25.507147 \25.567 148 Aug. 21, 194.1 ___ . _ {20.567147
25.567163 }25. 567155 37. 803319 12.236164
Aug.25,1941.. ___ {25.567074 25.566988 }25.567031 37.803160 12.216144
- ---Average ____ __ ____ 25.567102 25. 567102 37. 80,253 12.2361511 Itango _____ _______ 0.000175 0.000124 0.000159 0.000020 Average
t lon. devla- 0.000050 0.000048 0.000062 0.000008
TABLE 5.-M easurements of the ice and benzoic aci;:r p;n~t8 - .-
Cell 13
t>R Date I . I Average I ce POInt ice point I Benzoic I acid point 6R Date
THERMOMETER 535
I
Ohms Ohms Ohms Ohms Ohms I 12.196530 Aug. 13, 194L ~ __ {25.483397 }25.483899 37.680662 12.196763 25.483900 Aug. 20, 1941. ___
12. 196518 Aug. 22, 194L ___ {25.483891 25.483856 }25.483874 37. 680581 12.196707 Aug. 21, 1941. __ _
12.196465 Aug. 26, 194L __ _ {25.483818 25.483827 }25.483823 37.680502 12.196679 Aug. 27, 1941. ___
12. 196531 Sept. 2, 1941. ____ {25.483903 25.483891 }25.483897 37.680570 12.196672 Sept. 29, 1941. ___
12. 196511 A verage ____ _____ 25.483873 25.483873 37.680579 12.196701\ Average ___ __ ____ 0.000066 Range ___ ________ 0.000085 0. 000076 0.000160 0.000091 Range __ _________
0.000023 Average devia- 0.000029 0.000025 0.000043 0.000030 Average devia· tion . tion.
. THERMOMETER 618
12.240629 ? 1{25.578939 }25.578943 37.819862 12.240919 Ang. 12, 1941. ___ Aug .• 0, 194L __ _ 25.578947
12. 240760 " 1{25.578953 }25.578961 37.819910 12.240949 Aug. 25, 1941. ___ Auo • 21, 194L __ _ 25.578969
12.240717 Aug. 27, 1941. ___ {25.578956 25.578960 }25.578958 37.819912 12.240954 Sept. 2, 194L ___
12.240719 Aug. 28, 1941. ___ {25.578998 25.578978 }25.578988 37.819890 12.240902 Sept. 12, 1941. ___
12.240706 A verage ____ _____ 25.578963 25.578963 37.819894 12.240931 A verage _________ 0.000131 Range ___ ________ 0.000059 0.000045 0.000050 0. 000052 Range __ ____ _____
0.000039 Average devia· 0.000015 0.000013 0.000018 0.000021 Average devia· tion. tion.
THERMOMETER 515
12.190221 Aug. 29, 1941. __ _ {25.483265 25.483277 }25.483271 37.673629 12.190358 Aug. 28, 1941. ___
12.190292 Sept. 13, 1941. __ _ {25.483235 25.483243 }25.483239 37.673739 12.190500 Sept. 9, 194L ___
12. 190257 Average ___ ____ __ 25.483255 25.483255 37.673684 12.190429 A verage ___ ______ 0.000071 Range __ __ _______ 0.000042 0.000032 0.000110 0.000142 Range __ __ ____ ___
0.000036 Average devia- 0.000016 0. 000016 0.000055 0.000071 Average devia-tiOD. tion.
THERMOMETER 537
12.235950 Aug. 11, 194L ___ (25.567147 25.567151 }25.567149 37.803374 12.236225 Aug. 13, 194L ___
Aug. 12, 1941 __ __ e5.567095 25.567134 }25.567115 37.803311 12.236196 Aug. 22, 1941. __ _
Aug. 25, 194L ___ (25.567005 25. 567091 }25.567048 37.803274 12.236226 Average __ _______
Range __ __ _______ Average ___ _____ _ 25.567104 25.567104 37.803320 12.236216 Average devia· Range __ __ _______ 0.000146 0.000101 0.000100 0.000030 tion. Average devia · 0.000040 0.000037 0.000035 0.000013
tiOll.
Cell 14
I . . I Average I Benzoic I Ice POlllt ice paint acid point t>R Date
THERMOMETER 535
Ohms Ohms Ohms Ohms {25.483878 25.483892 }25.483885 37.680828 12. 196943 Aug. 11, 1941. ___
{25.483891 25.483899 }25.483895 37.680845 12.196950 Aug. 12, 194L ___
{25.483902 25.483891 }25.483897 37.680848 12.196951 Aug. 25, 194L ___
{25.483919 25.483892 }25.483906 37.680833 12.196927 Aug. 28,1941. ___
25.483896 25.483896 37.680839 12.196943 A verage __ ____ ___ 0.000041 0.000021 0.000020 0.000024 Range _____ ______
0.ooDOO9 0.000006 0.000008 0.000008 Average devia-tion.
THERMOMETER 618
{25.578870 25. 5711914 }25.578892 37.820009 12.241117 Aug. 13, 194L ___
{25. 578808 25. 57S907 }25.578858 37.819922 12. 241064 Aug. 22, 1941. ___
e5.578960 25.578965 }25.578963 37.820009 12.241046 Aug. 26, 194L __
{25.573986 25.578982 }25.578984 37.820110 12.241126 Aug. 29,1941. ___
25.578924 25.578924 37.820012 12.241088 Average _____ ____ 0. 000178 0. 000126 0.000188 0.000080 Range ___________
0.000050 0.000049 0.000049 0. 000033 Average devia-tion.
THERMOMETER 515
f5.483332 25.483292 }25.483312 37.673911 12.190599 Aug. 27, 1941 ____
{25.483260 25.483267 }25.483264 37.673825 12. 190561 Sept. 2, 194L ___
25.483288 25.483288 37.673868 12.190580 Average __ ______ _ 0.000072 0.000048 0.000086 0.000038 Range ___ ________ 0.000024 0.000024 0.000043 0. 000019 Average dev ia·
tion.
THERMOMETER 537
{25.567168 25.567192 }25.567180 37.803630 12.236450 Aug. 15, 1941. ___
{25.567148 25.567131 }25.567140 37.803578 12.236438 Aug. 18, 1941. ___
25.567160 25.567160 37.803604 12.236444 Aug. 20, 1941. ___
0.000061 0.000040 0.000052 0.000012 Aug. 21, 194L ___ 0.000020 0.000020 0.000025 0.000006
Average __ __ _____ Range ____ _______ Average devia-
tion.
Cell 15
I Ice point I Ave1'l~ge ICe pomt I B enzoic I acid point
THERMOMETER 535
Ohms Ohms Ohms {25.483890 25.483860 }25.483875 37.680761
{25.483834 25. 483867 }25.483851 37.680735
{25.483675 25.483825 }25.483750 37.680657
(25.483937 25.483930 }25.483934 37.680889
25.483852 25.483852 37. 680761 0.000262 0.000184 0.000232 0.000056 0.000052 0.000040
THERMOMETER 618
{25. 579018 25.579015 }25.579017 37.820166
{25.578954 25.578911 }25. 578933 37.820070
{25.578863 25. 578894 }25.578879 37. 819979
{25.578962 25.579023 }25.578993 37.820122
25.578956 25.578955 37.820084 0.000160 0.000138 0.000187 0.000050 0.000050 0.000060
THERMOMETER 515
{25.483278 25.483298 }25.483288 37.673923
{25.483261 25.483279 }25.483270 37.673825
25.483279 25.483279 37.673874 0. 000037 0.000018 0.000098 0.000010 0.000009 0.000049
THERMOMETER 587
{25.567135 25.567132 }25.567134 37.803537
{25.567147 25.567191 }25.567169 37.803572
{25.567121 25. 567175 }25.567148 37.803594
(25.567163 25.567191 }25.567177 37.803642
25.567157 25.567157 37.803599 0.000070 0. 000043 0. 000070 0.000024 0.000016 0.000025
63443&-45 (Face p. 347)
AR
Ohm. 12.196886
12.196884
12.196907
12.196955
12. 196908 0.000071 0.000026
12.241149
12.241137
12.241100
12.241129
12.241129 0.000019 0. 000014
12.190635
12. 190555
12.190595 0.000080 0.000040
12.236434
12.236403
12.236446
12. 236465
12.236437 0.000032 0.000019
] L

Freezing Temperature of Benzoic, Acid 347
In table 4 are recorded the systematic observations of five cells with the four thermometers. In addition to the date of each measurement, there are given the maximum observed temperature and the variation during the time interval 60 to 120 minutes. Also given are the averages of each set of measurements with a particular cell and Lhermometer and the average deviation of these measurements. Following these averages are single measurements of each of four cells with thermometer 535, and measurements of one cell (15) with each of the four thermometers, all made about 3 months after the others. At that time (Dec. 18, 1941, table 4) thermometer 587 had also been calibrated at the steam point with the same accuracy as 535 and 618, hence the measurements made with the three thermometers are directly comparable.
For a few days toward the end of the period during which the systematic observations were made, ithe humidity became so high that it had a significant effect on the ,behavior of the bridge and galvanometer. This was apparent from erratic observations of the ice point. Only those measurements that were unmistakably unreliable from this cause have been excluded from table 4.
1. RELATIVE REPRODUCIBILITY OF THE ICE POINT AND THE BENZOIC ACID POINT
In table 5 the resistances observed at the ice point and at the benzoic acid point have been listed to show the relative reproducibilities of these two fixed points. The average of the average deviations of the difference of resistances between the ice and benzoic acid points is 0.0000257 ohm. The greatest difference between any two observations of the resistance, in a set of observations with one thermometer, was 0.000262 ohm at the ice point (cell 15, thermometer 535) and 0.000246 ohm at the benzoic acid point (cell 11, thermometer 535).
The average of the average deviations obtained from the respective averages of each set of observations is 0.0000328 ohm at the ice point and 0.0000439 ohm at the benzoic acid point. These two averages are in about the same ratio to each other as that of the respective total resistances, 25 to 37 ohms. This suggests that the main source of variability in the observations, both of the ice point and of the benzoic acid point, may have been in the bridge. If this was true, both fixed points were reproduced with about equal precision, and possibly with a greater actual precision than is shown by the recorded resistances.
2. COMPARISON OF THERMOMETERS
In table 6 the average maximum temperatures observed in each cell with each thermometer have been combined to show the differences between observations of a particular cell with all possible pairs of the four thermometers. It will be seen that the differences between thermometers 535 and 618 are the smallest. As previously noted, these thermometers had received the specially accurate calibration at the steam point. The other two were calibrated in accordance with the routine practice of the Thermometry Section. In view of the reproducibility of the freezing temperature of each cell, as shown by table 4, it may reasonably be concluded that the comparisons of all other
F
348 Journal of Research of the National Bureau of Standards
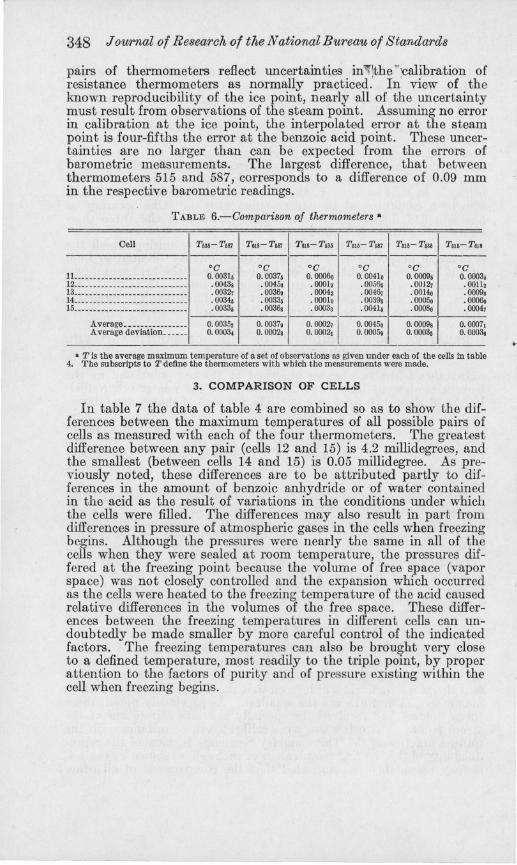
pairs of thermometers reflect uncertainties in'lll'jthe ~:calibration of resistance thermometers as normally practiced. In view of the known reproducibility of the ice point, nearly all of the uncertainty must result from observations of the steam point. Assuming no error in calibration at the ice point, the interpolated error at the steam point is four-fifths the error at the benzoic acid point. These uncertainties are no larger than can be expected from the errors of barometric measurements. The largest difference, that between thermometers 515 and 587, corresponds to a difference of 0.09 mm .::; in the respective barometric readings.
TABLE 6.-Comparison of thermometers a
Cell ----------------11-------1------1------1-------------------
• T is the average maximum temperature of a set of observations as given under each of the cells in table 4. The subscripts to T define the thermometers with which the measurements were made.
3. COMPARISON OF CELLS
In table 7 the data of table 4 are combined so as to show the differences between the maximum temperatures of all possible pairs of cells as measured with each of the four thermometers. The greatest difference between any pair (cells 12 and 15) is 4.2 millidegrees, and the smallest (between cells 14 and 15) is 0.05 millidegree. As previously noted, these differences are to be attributed partly to differences in the amount of benzoic anhydride or of water contained in the acid as the result of variations in the conditions under which the cells were filled. The differences may also result in part from differences in pressure of atmospheric gases in the cells when freezing begins. Although the pressures were nearly the same in all of the cells when they were sealed at room temperature, the pressures differed at the freezing point because the volume of free space (vapor space) was not closely controlled and the expansion which occurred as the cells were heated to the freezing temperature of the acid caused relative differences in the volumes of the free space. These differences between the freezing temperatures in different cells can undoubtedly be made smaller by more careful control of the indicated factors. The freezing temperatures can also be brought very close to a defined temperature, most readily to the triple point, by proper attention to the factors of purity and of pressure e}.."isting within the cell when freezing begins.
l
Freezing Temperature of BenzowAcid 349
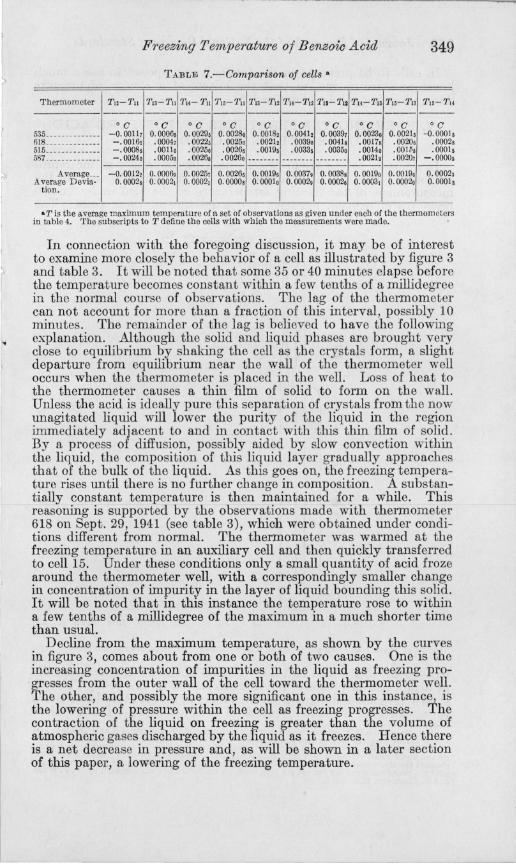
TABLE 7.-Comparison of cells'
Thermometer Tn-Tu Tu-TII 'TH- Til Tl~-TlI T1 3-T12 Tu-T" Tn-T" T14-T" T"-T,, T a -TI ----------------
°C °C °C °C °C °C °C °C °C °C 535 ......... . ... . -0.00117 0.0006, 0.0029, 0.00280 0. 0018, 0.00410 0. 0039, 0.00230 0.0021, -{).OOOI 618 ...... ...... .. -. 0016, . 0004, . 0022, .0025, . 00210 . 00390 .0041, .0017, . 0020, .0002 515 . ...... ....... - . 0008, .00110 .00250 .0026, . 0019, . 0033, .00350 .00140 .0011', .0001 587 . ............. -.00240 .0005, . 0025, . 00260 ---- ---- -------- -------- .0021, . 0020, -.0000
--------------------Average ... -0.0012, 0.0006, 0. 0025, 0.0026, 0.0019, 0.0037, 0.0038, 0.00190 0.0019, 0.0002
Average Devia· 0.0002, 0.0002, O. 0002, 0.0000, O. 00010 0.0002, 0. 0002, 0. 0003, 0.00020 0.0001 tion.
aT is the " verage maximum temperature of a set of ohservations as given under each of tbe thermometers in table 4. The subscripts to T define tbe cells with wbicb the measurements were made.
In connection with the foregoing discussion, it may be of interest to examine more closely the behavior of a cell as illustrated by figure 3 and table 3. It will be noted that some 35 or 40 minutes elapse before the temperature becomes constant within a few t enths of a millidegree in the normal course of observations. The lag of the thermometer can not account for more than a fraction of this interval , possibly 10 minutes. The remainder of the lag is believed to have the following explanation. Although the solid and liquid phases are brought very close to equilibrium by shaking the cell as the crystals form, a slight departure from equilibrium near the wall of the thermomet er well occurs when the thermometer is placed in the well. Loss of heat to the thermometer causes a thin film of solid to form on the wall. Unless the acid is ideally pure this separation of crystals from the now unagitated liquid will lower the purity of the liquid in the region immediately adjacent to and in contact with this thin film of solid. By a process of diffusion, possibly aided by slow convection within the liquid, the composition of tIllS liquid layer gradually approaches that of the bulk of the liquid. As this goes on, the freezing temperature rises until there is no further change in composition. A substantially constant temperature is then maintained for a while. This reasoning is supported by the observations made with thermometer 618 on Sept. 29, 1941 (see table 3), which were obtained under conditions different from normal. The thermometer was warmed at the freezing temperature in an auxiliary cell and then quickly transferred to cell 15. Under these conditions only a small quantity of acid froze around the thermometer well, with a correspondingly smaller change in concentration of impurity in the layer of liquid bounding this solid. It will be noted that in this instance the temperature rose to within a few tenths of a millidegree of the maximum in a much shorter time than usual.
Decline from the maximum temperature, as shown by the curves in figure 3, comes about from one or both of two causes. One is the increasing concentration of impurities in the liquid as freezing progresses from the outer wall of the cell toward the thermometer well. The other, and possibly the more significant one in this instance, is the lowering of pressure within the cell as freezing progresses. The contraction of the liquid on freezing is greater than the volume of atmospheric gases discharged by the liquid as it freezes. Hence there is a net decrease in pressure and, as will be shown in a later section of this paper, a lowering of the freezing temperature.
f 350 Journal of Research of the N ationaZ Bureau of Standards
In cells to be prepared in the future it is proposed to use a much lower pressure of gas, so that the effects of a change of pressure during freezing will be minimized. a
V. FREEZING TEMPERATURES OF THE PURE ACID UNDER DEFINED CONDITIONS
In addition to the group of cells used for the study of the repro-ducibility of the freezing temperature, one cell was prepared for the {-measurement of the freezing temperature of the acid under known pressures of oxygen, nitrogen, and a mixture of these gases. The
o
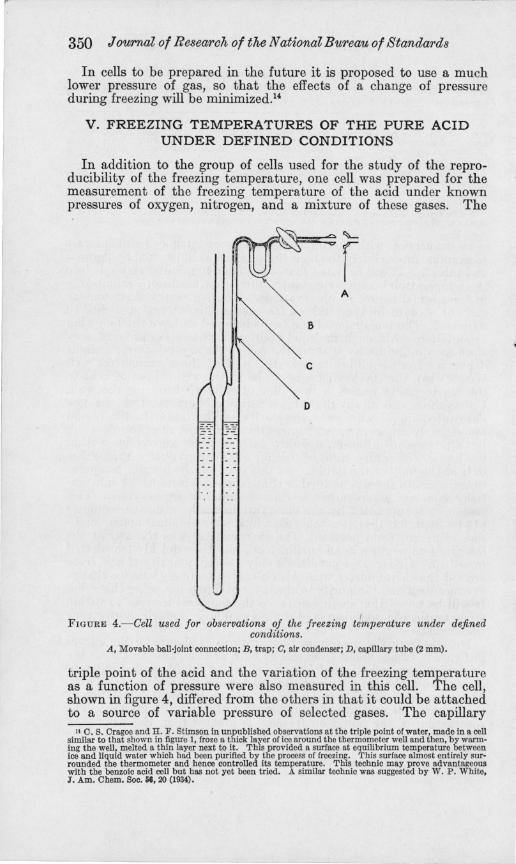
I FIGURE 4.- Cell used for observations of the freezing temperature under defined
conditions. A, Movable ball'joint connection; B, trap; C, air condenser; D, capillary tube (2 mm).
triple point of the acid and the variation of the freezing temperature as a function of pressure were also measured in this cell. The cell, shown in figure 4, differed from the others in that it could be attached to a source of variable pressure of selected gases. The capillary
11 C. S. Cragoe and H. F. Stimson in unpublished observations at the triple point of water, made in a cell similar to that shown in figure 1, froze a thick layer of ice around the thermometer well and then, by warm· ing the well, melted a thin layer next to it. This provided a surface at equilibrium temperature between ice and liquid water which had been purifled by the process of freezing. This surface almost entirely surrounded the thermometer and hence controlled its temperature. This technic may prove advantageous with the benzoic acid cell but has not yet been tried. A. similar technic was suggested by W. P. White, J. A.m. Chem. Soc. 68, 20 (1934).
)
Freezing Temperature of Benzoic, Acid 351
portions of the connecting tube retarded the tendency for benzoic acid to sublime out of the cell when molten, and the larger portions served as condensers for the small amount of vapor that did pass the capillaries. The spherical joint, A, made it possible to rock the tube, if desired, while it was connected to the system for supplying gases and measuring the pressure.
When the acid in this cell was to be prepared for an observation, it was melted~withIa.flame)ather than in the oven. Care was taken to heat the acid slowly and uniformly so as to avoid overheating it. To get the desired mush of crystals in the liquid, the cell was manipulated in the manner previously described, with the additional detail that capillary D was kept cool, so that crystals of the acid would collect at this point and keep liquid from flowing into the trap or to the stopcock while the cell was being shaken. The cell was kept in a previously warmed Dewar flask during the temperature measurements. Further details of the manipulation required by special conditions of observation will be given in the appropriate paragraphs.
1. DETERMINATION OF THE TRIPLE POINT
To prepare for the determination of the triple point the acid was freed of water and atmospheric gases by evacuation of the cell while the acid was allowed to freeze slowly. The melting and freezing were repeated until no further change of pressure occurred when the cell was connected at A (fig. 4) to an evacuated system connected with a mercury manometer. Once the cell was freed of gases in the manner indicated, it did not require attachment to the gas-supply train during the observations of the triple point.
The triple point was measured on three consecutive days and twice more about a month later. The two later measurements were made between series of observations of the freezing temperatures under oxygen and nitrogen. They served as a check on the absence of any significant change in the composition of the acid which might have resulted from the repeated meltings.
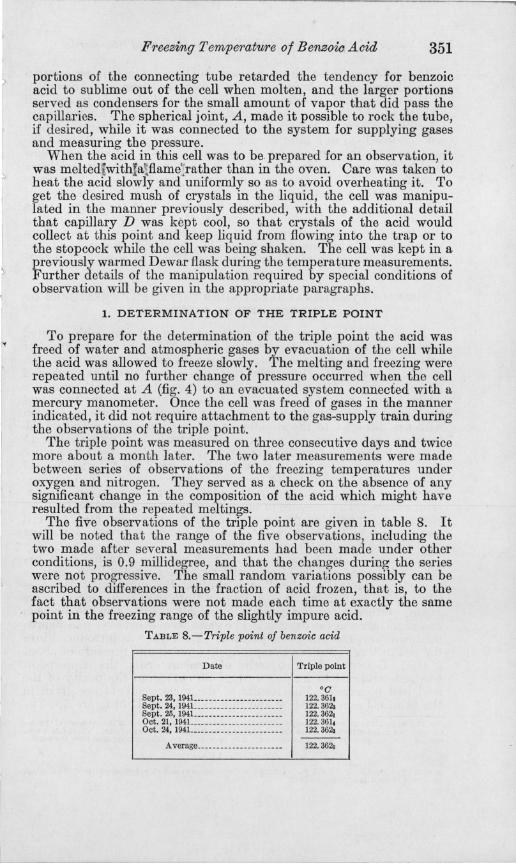
The five observations of the triple point are given in table 8. It will be noted that the range of the five observations, including the two made after several measurements had been made under other conditions, is 0.9 millidegree, and that the changes during the series were not progressive. The small random variations possibly can be ascribed to diffeITences in the fraction of acid frozen, that is, to the fact that observations were not made each time at exactly the same point in the freezing range of the slightly impure acid.
TABLE 8.-Triple point of benzoic acid
Date
Sept. 23, 194L _____________________ _ Sept. 24, 1941.. ____________________ _ Sept. 25, 194L .. __________________ __ Oct. 21, 1941.. ____________________ __ Oct. 24, 1941.. .. __________________ __
A verage .. ____ ______ .. __ __ ___ _
Triple point
°C 122.3618 122.362, 122.362, 122.361, 122.362,
122.3620
352 JOWl"1UJ,l of Researoh of the National Bureau of Standards
The acid used for these measurements was known to contain a small amount of impurity. To make the necessary correction of the triple point, the freezing temperature of the acid in this cell under 1 atm of dry air was compared with that of acid of known purity also under 1 at.m of dry air and observed in another apparatus which will be described in a later section. The freezing temperature of the acid used for the triple-point measurements was 6 millidegrees below that of the pure acid. The amount of impurity, confirmed by a measurement of the freezing range, was found to be 0.0084 mole percent, which corresponds to a lowering of the freezing temperature of 6 millidegrees. This 'correction has been applied to the temperatures in table 8. By adding an uncertainty of '1 millidegree involved in the triple-point measurements to the uncertainty of 1 millidegree attached to the freezing temperature in dry air of the pure acid, the value of the triple point of pure benzoic acid can be given as 122.362° ±0.002° C. ~
2. FREEZING TEMPERATURES UNDER DIFFERENT PRESSURES OF OXYGEN AND OF NITROGEN
To measure the freezing temperatures in equilibrium with selected pressures of oxygen or nitrogen, the acid in the cell was first freed of gases in the manner described in the preceding section. With the acid in the cell at room temperature, gas was admitted at a selected pressure', which, after a few trials, bore a known relation to the pressure which would exist in the cell after it was isolated from the train and the acid had been melted, shaken long enough to insure saturation with gas, brought to the standard conditions for observations of the freezing temperature, placed in a Dewar flask, and then shaken 15 minutes longer to insure equilibrium. When the freezing temperature reached its maximum value, the actual pressure in the cell was checked by setting the manometer to the predicted pressure and then opening the stopcock. The change in the manometer never exceeded a few centimeters. The pressure in the cell was computed from the manometer setting (predicted pressure), the observed pressure after the cell was opened to the manometer, and the known volumes of the gas space in the manometer and in the cell.15
The oxygen and nitrogen used for these measurements were, re,spectively, 99.87 and 99.74 percent pure, as determined from analyses made by Martin Shepherd and Shuford Schuhmann of the Gas Chemistry Section of this Bureau. Both gases contained some argon. Other impurities consisted primarily of oxygen in the nitrogen and of nitrogen in the oxygen. The gases were dried over phosphorus pentoxide but not otherwise purified. Each gas was introduced into the cell in three successive steps, up to a maximum pressure of about 2 atm. Between the two series of measurements, the triple point was redetermined to make sure that no change in the purity of the acid had occurred. The results of the measurements are given in the third column of table 9 and in curves Band D of figure 5. The
" The ratios of the gas space of the system to the gas space of the cell v./v, and of the gas space of the rna· nometer to the gas space of the cell v .. /v, were found to be 2,17 and 1.17, respectively. These ratlos were constant over the range of pressures measured. The pressore in the cell was compnted from the relation
P. =2.17P.-1.17p .. ,
in which p ,= pressure in the cell, P .. "= pressure n the manometer and P. = pressure in the system, which consists of the cell and the manometer.
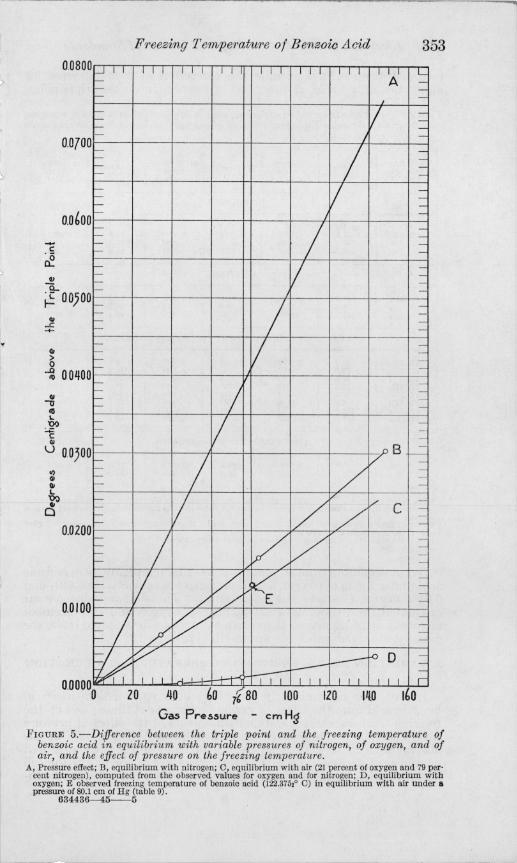
~
,'<
Freezing Te1nperature of B enz-ow Aoid 353 0.0800 I~ I I I I I I I I I I I I I I I I I I I I A I L
I- -I- -I- -
l- I -I- -I- -l- I -r- I -r- -r- -r- -
ONOO
l- I -'- -- -- -- I -- -- -- -- ! -- -- -- -- I -- -- -- -
0.0'00
-c 'cf.
Cl> Ii.. ~ OOJOO
Cl> ...t: .....
- V -- -- -- -
CII > 0
..l) 00400 10 - -- / -- -- -
Cl> -0
f1I -
IV -- -- -- DB -
I V r--- -
-
/ -
- -- -r- V / V -r-
/ C -I- -I- -
l- I / V -I- -I- -r- -
L .'2'> C
III u 00300
oJ) III CII L
~ Q
0.0200
r- / ~ < -r- -r-
/ -
r- _.
§/ /' -
~ ---
0.0100
~ ~ --f.o D -
f--.-- -
~ -
I I I -rl I I I I I I I I I I (' 20 40 ~o if, 80 100 120 IIl0 I~O
0.00000
Gas Pressure - em Hg
FIGURE 5.-Difference between the triple point and the freezing temperature of benzoic acid in equi librium with variable pressures of nitrogen, of oxygen, and of air, and the effect of pressure on the freezing temperature.
A, Pressure effect; B, equilibrium with nitrogen; 0 , equilibrium with air (21 percent of oxygen and 79 percent nitrogen), computed from the observed values for oxygen and for nitrogen; D, equilibrium with oxygen; E obser ved freezing temperature of benzoic acid (122.375,0 0) in equilibrium with air under 8 pressure of 80.1 em of Hg (table 9).
634436-45--5
l
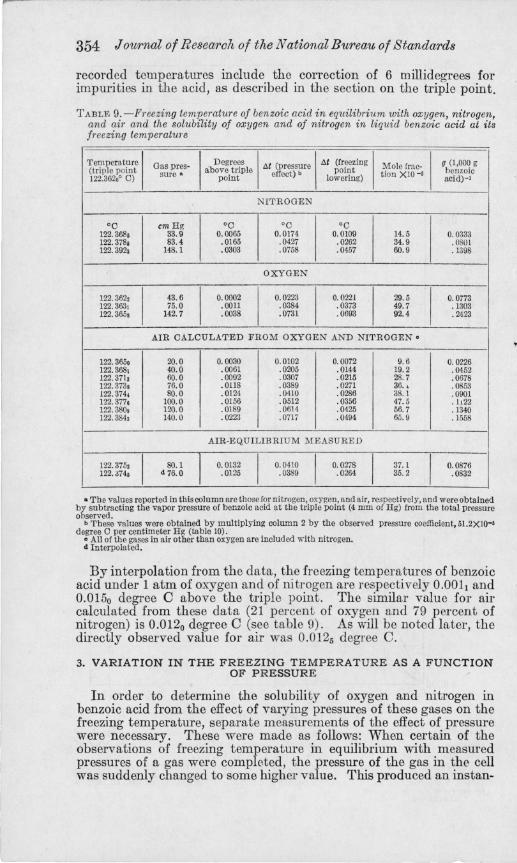
354 J owrnal of Researoh of the National Bureau of Standards
recorded temperatures include the correction of 6 millidegrees for impurities in the acid, as described in the section on the triple point.
TABLE 9. -Freezing temperature of benzoic acid in equilibrium with oxygen, nitrogen, and air and the solubility of oxygen and of nitrogen in liquid benzoic acid at its freezing temperature
Tem perature I Gas pres· I Degrees II>/ (pressure I M (fr~ezing I Mole frac-
I U (1,000 g
(trip le point sure a above. triple effect) b pOll~t tion XlO-' benzoic 122.3620° 0) pomt lowenng) aCid)-'
NITROGEN
°0 cmHg °0 °0 °0 122.368, 33.9 0.0065 0.0174 0. 0109 14.5 0.0333 122.378, 83.4 .0165 .0427 .0262 34. 9 . 0801 122.3923 148. 1 .0303 .0758 .0457 60.9 .1398
OXYGEN
122.362,
I 43.6
I 0.0002
I 0.0223
I 0.0221
I 29.5
I 0.0773
122.363, 75.0 .0011 .0384 .0373 49.7 .1303 122.365, 142.7 .0038 .0731 . 0693 92.4 .2423
AIR OALOULATED FROM OXYGEN A JD NITROGEN'
122.3650 20.0 0.0030 0.0102 0.0072 9.6 0.0226 122. 368, 40.0 .0061 .0205 .0144 19.2 .0452 122.3710 60.0 .0092 .0307 .0215 28.7 .0678 122.373, 76.0 .0118 . 0389 .0271 36. , .0853 122. 374, 80.0 .0124 . 0410 .0286 38. 1 .0901 122.377, 100.0 . 0156 .0512 .0356 47.5 . 1122 122.380, 120. 0 .0189 .0614 .0425 56.7 .1340 122.3843 140. 0 .0223 .0717 .0494 65.9 .1558
AIR·EQUILIBRIUM MEASURED
122.375,
I SO. 1 0.0132
I 0.0410
I 0.0278
I 37.1
I 0.0876
122. a74, d 76.0 .0125 . 0389 .0264 35.2 .0832
• Tbe values reported in this column are those for nitrogen, oxygen, and air, respecti vely, and were obtained b y subtracting the vapor pressure of benzoic acid at the triple point (4 rom of Hg) from the total pressure ohserved.
b Tbese values were obtained by multiplying column 2 by the observed pressure coefficient, 51.2XlO-' degree 0 per centimeter Hg (table 10).
° All of the gases in air other than oxygen are included with nitrogen. d Interpolated.
By interpolation from the data, the freezing temperatures of benzoic acid under 1 atm of oxygen and of nitrogen are respectively 0.0011 and 0.0150 degree C above the triple point . The similar value for air calculated from these data (21 percent of oxygen and 79 percent of nitrogen) is 0.0120 degree C (see table 9). As will be noted later, the directly observed value for air was 0.0125 degree C.
3. VARIATION IN THE FREEZING TEMPERATURE AS A FUNCTION OF PRESSURE
In order to determine the solubility of oxygen and nitrogen in benzoic acid from the effect of varying pressures of these gases on the freezing temperature, separate measurements of the effect of pressure were necessary. These were made as follows: When certain of the observations of freezing temperature in equilibrium with measured pressures of a gas were completed, the pressure of the gas in the cell was suddenly changed to some higher value. This produced an instan-
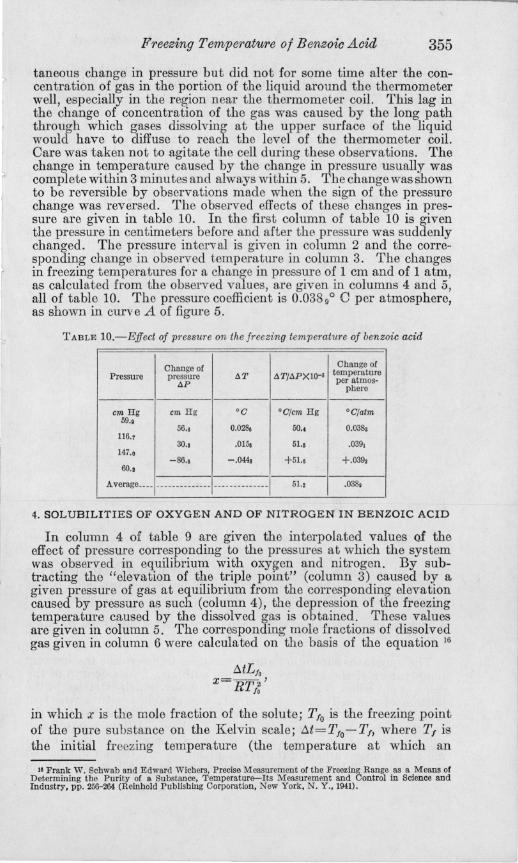
Freezing Temperature of Benzoic Acid 355
taneous change in pressure but did not for some time alter the concentration of gas in the portion of the liquid around the thermometer well, especially in the region near the thermometer coil. This lag in the change of concentration of the gas was caused by the long path through which gases dissolving at the upper surface of the liquid would have to diffuse to reach the level of the thermometer coil. Care was taken not to agitate the cell during these observations. The change in temperature caused by the change in pressure usually was complete within 3 minutes and always within 5. Thechangewasshown to be reversible by observations made when the sign of the pressure change was reversed. The observed effects of these changes in pressure are given in table 10. In the first column of table 10 is given the pressure in centimeters before and after the pressure was suddenly changed. The pressure interval is given in column 2 and the corresponding change in observed temperature in column 3. The changes in freezing temperatures for a change in pressure of 1 em and of 1 atm, as calculated from the observed values, are given in columns 4 and 5, all of table 10. The pressure coefficient is 0.038 90 C per atmosphere, as shown in curve A of figure 5.
TABLE lO.-Effect of pressure on the freezing temperature of benzoic acid
Change of Change oC
Pressure pressure tJ.T tJ.T/tJ.PXI0-' temperature tJ.P per atmos-
phere
em Hg em Hg DC DC/em Hg DC/atm 59 .•
56., 0.028, 50 .• 0.038, 116.7
30 .• .015, 51., .0391
147.0 -86., -.044, +51., +.039,
60 .•
Average .... - - - - --- - ------ - ----- - ------- 51., .038.
4. SOLUBILITIES OF OXYGEN AND OF NITROGEN IN BENZOIC ACID
In column 4 of table 9 are given the interpolated values of the effect of preSSUl'e corresponding to the pressures at which the system was observed in equilibrium with oxygen and nitrogen. By subtracting the " elevation of the triple point" (column 3) caused by a given pressure of gas at equilibrium from the corresponding elevation caused by pressure as such (column 4), the depression of the freezing temperature caused by the dissolved gas is obtained. These values are given in column 5. The corresponding mole fractions of dissolved gas given in column 6 were calculated on the basis of the equation 16
D.tLfo x= RTf!'
in which x is the mole fraction of the solute; Tlo is the freezing point of the pure substance on the Kelvin scale; D.t=T/o-T" where TI is the initial freezing temperature (the temperature at which an
"Frank W. Schwab and Edward Wichers, Precise Measurement of the Freezing Range as a Means of Determining the Purity of a Substance, T emperature-Its Measurement and Control in Science and Industry, pp. 256-264 (Reinhold Publishing Corporation, New York, N. Y., 1941).
..
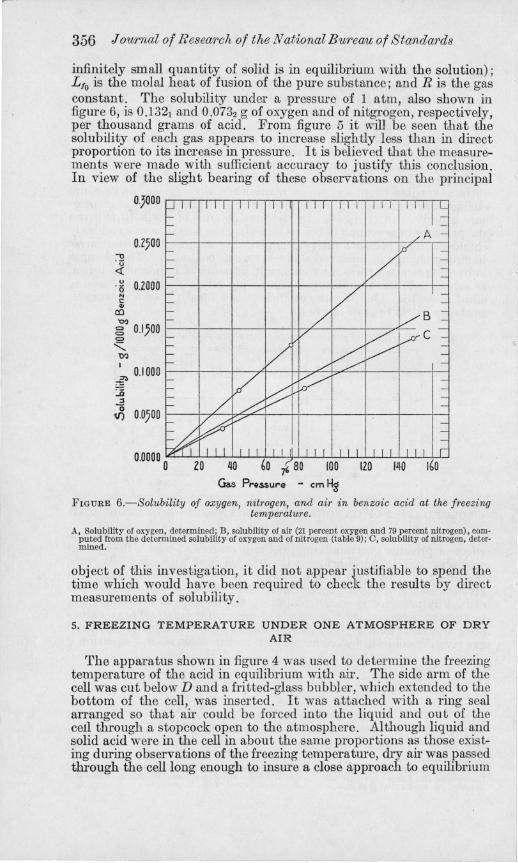
356 J ownal of Resea?'ch of the National B ureau of Standards
infinitely small quantity of solid is in equilibrium with the solution); Llo is the molal heat of fusion of the pure substance; and R is the gas -<
constant. The solubility under a pressure of 1 atm, also shown in figure 6, is 0.1321 and 0.0732 g of oxygen and of nitgrogen, respectively, per thousand grams of acid. From figure 5 it will be seen that the solubility of each gas appears to increase slightly less than in direct proportion to its increase in pressure . It is believed that the measurements were made with sufficient accuracy to justify this conclusion. In view of the slight bearing of these observations on the principal ~
O}OOO rr-T-rT-rT.,.-,--,--.,....,..,...",....,...,,-,-rrr-,,-,-,-.,,-,--,--.,-,,,
0.2500 f----t--+--t--H---j---t--t--7"'------,------i
. 5 O.ZOOO I---t---t---j---+f---t--fr"---j-- -t---i
'" c .. CO 'O? g O.I}OO I--+--+--+--------i-+--.L---+---+--~-o
"'O'J
~ 0.1000
:..a :s
o 1f) 0.0500 t---t-r--p7-"''-t--t+--I--t-:---t---t--i
cmHg
FIGURE 6.-Solubility of oxygen, nitrogen, and air in benzoic acid at the freezing temperature.
A, Solubility of oxygeu, determined; B, solubility of air (21 percent oxygen and 79 percent nitrogen), computed from the determined solubility of oxygen and of nitrogen (table 9); C, solubility of nitrogen, determined.
object of this investigation, it did not appear justifiable to spend the time which would have been required to check the results by direct measurements of solubility.
5. FREEZING TEMPERATURE UNDER ONE ATMOSPHERE OF DRY AIR
The apparatus shown in figure 4 was used to determine the freezing temperature of the acid in equilibrium with air. The side arm of the cell was cut below D and a fritted-glass bubbler, which extended to the bottom of the cell, was inserted. It was attached with a ring seal arranged so that air could be forced into the liquid and out of the cell through a stopcock open to the atmosphere. Although liquid and solid acid were in the cell in about the same proportions as those existing during observations of the freezing temperature, dry air was passed through the cell long enough to insure a close approach to equilibrium
l
Freezing Temperature of Benzoic Acid 357
with dissolved oxygen and nitrogen under a combined pressure of 1 atm. The stopcock was then closed and the freezing temperature observed in the usual way. The freezing temperature was 122.3752° 0, and the simultaneously measured pressure in the cell was 80.5 cm of mercury (table 9 and fig. 5). During these observations thp. temperature of the upper end of the cell was probably slightly higher than it was while the air was being swept through the cell, hence the pressure rose slightly above 1 atm. The freezing temperature corrected to 1 atm was 122.3745° O.
To determine the freezing temperature of benzoic acid in equilibrium with air in another manner, a different form of apparatus was used. This apparatus, which has been described in an earlier publication 17
is shown in figure 7. It was designed for measuring freezing ranges. The thermometer was centered in a cylindrical glass freezing tube 2 cm in diameter and about 25 cm long, provided with a glass jacket that could be evacuated if desired. The thermometer was supported by a ground-in glass head provided with an outlet tube for the passage of air from the freezing-range cell. The tip of the thermometer was about 2 cm from the bottom of the cell, and the depth of the liquid in the cell was 20 cm. Just above the bottom of the cell was a glass bubbler of the type described by Branham and Sperling 18 with orifices about 0.003 in. in diameter. The bubbler was provided with an inlet tube passing through the double-walled vessel and connected to a source of purified air dried over phosphorus pentoxide or conditioned to contain a desired partial pressure of water.
The freezing temperature of a portion of acid of high purity was measured as follows: While the acid was being melted in the apparatus it was stirred with air saturated with water at 0° O. It was then brought to a temperature about 10 degrees above the freezing temperature and thoroughly treated with air saturated with water at -25° O. Air saturated at this temperature contains a partial pressure of water vapor of about 0.5 mm of mercury, which is 10 times as much as is needed to cause virtually complete reversion of benzoic anhydride to benzoic acid.19 The cell was then transferred to an oil bath that was kept 8 degrees below the freezing point of the acid. The acid undercooled about 0.5 degree O. When crystals suddenly formed, the temperature rose to within a few millidegrees of the equilibrium temperature in less than 2 minutes. About 5 percent of the acid was allowed to freeze, and then the temperature of the oil bath was quickly raised to the freezing temperature of the acid and kept constant within 0.01 degree O. This prevented further formation of solid and allowed the thermometer to indicate the temperature of equilibrium. The freezing temperature under these conditions was 122.3699° O. Next, the acid was stirred with air dried over phosphorus pentoxide until the temperature rose to a constant value at 122.3740° 0, representing equilibrium in contact with dry air. This required 40 minutes, and observations were continued for 30 minutes longer. Thereafter the air used for stirring contained a partial pressure of water vapor of 4.6 mm of Hg, corre-
11 Frank W . Schwab an d Edward Wichers, Precise Measurement of the Freezing Range as a Means of Determining the Purity of a Substance, Temperature-Its Measurement and Control in Science and Industry, p. 256-264 (Reinhold Publishing Corporation, New York, N. Y., 1941) .
18 J. R. Branham and E. O. Sperling, Bubbler tip oj Pyrex ulass jor difficult absorptions, J. Research NBS 22,701 (1939) RPI214.
" Frank W. Schwab and Edward Wichers, Preparation oj benzoic acid oj high puritv, J. Research NBS 25. 747 (1940) RP1351.
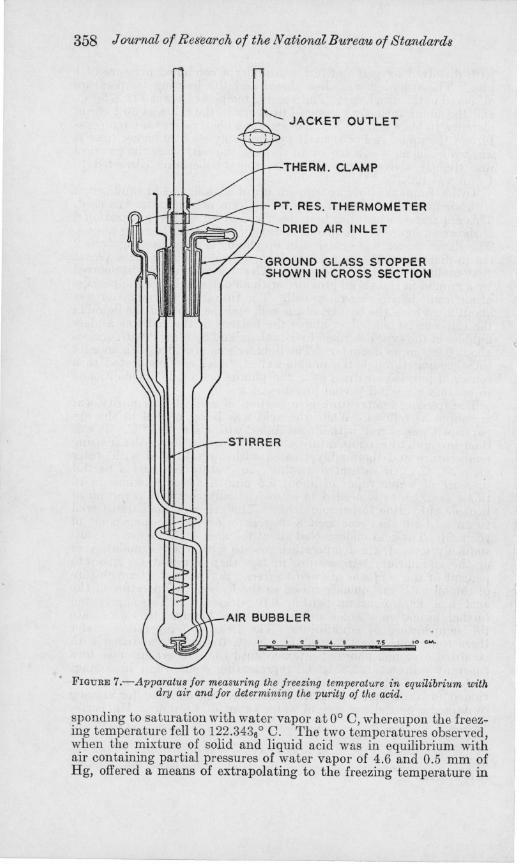
358 Journal of Research of the National Bureaw of Standards
JACKET OUTLET
THERM . CLAMP
p~ RES. THERMOMETER
DRIED AIR INLET
GROUND GLASS STOPPER SHOWN IN CROSS SECTION
TIRRER
AIR BUBBLER
FIGURE 7.-Apparatus for measuring the f1·eezing temperature in equilibrium with dry air and for determining the purity of the acid.
sponding to saturation with water vapor at 0° 0, whereupon the freezing t emperature fell to 122.3436° O. The two temperatures observed, when the mixture of solid and liquid acid was in equilibrium with air containing partial pressures of water vapor of 4.6 and 0.5 mm of H g, offered a means of extrapolating to the freezing temperature in
Freezing Temperature of Benzoic, Acid 359
equilibrium with dry air. The extrapolated temperature was 122.373° 0, which agrees sufficiently well with the observed temperature under dry air to indicate that the acid, when thus observed, did not contain a significant amount of benzoic anhydride.
After these observations were completed the purity of the acid was determined by measuring its freezing range in the same apparatus by a procedure previously described .20 Its purity was found to be 99.9984 mole percent. The presence of 0 .0016 mole percent of impurity caused an initial depression of the freezing temperature of 0.0012 degree 0, or of 0.0013 degree ° at the point in the freezing range
? when 5 percent of the substance is frozen. This correction was therefore applied to the observed freezing temperature of the acid (122.3740° 0), giving a value for pure benzoic acid of 122.3753° 0, with an estimated uncertainty of ±0.001 degree O.
VI. CHANGE IN THE SPECIFIe VOLUME OF BENZOIC ACID THAT ACCOMPANIES FREEZING
The change in volume when benzoic acid freezes is of interest in connection with its behavior in the sealed cells. No data were found on the density of solid benzoic acid at or near its freezing point, and no apparently reliable values for the density of the liquid at that temperature. Observations by Timmermans and Burriel 21 on the liquid at 130°, 155°, and 180° 0 permit extrapolation to the freezing temperature. The respective values for the density are 1.07494, 1.05218, and 1.02942 g/ml. Extrapolation to the freezing temperature gives 1.0819 g/ml. In this calculation the freezing temperature givpn by Timmermans (122.45° 0) was used so as to minimize the effect of possible systematic errors in the other temperatures.
There are no data for the density of the solid acid at temperatures higher than 23.3° O. The only available coefficient of expansion 22 is for the interval between 15° and 30° O. This value is probably in error because its calculation involved Lumsden's 23 determination of the density at 15° 0 (1.266 g/cm3), a value which appears to be less accurate than the one published by Hendricks and Jefferson 24
(1.3211 ±O.OOOI g/cm3 at 23.3° 0). It was accordingly impossible to make any r easonably good extrapolation to the density of the solid acid at its melting point. The change of volume on freezing was, therefore, calculated from the recorded value for the heat of fusion per gram !:.H" 1,400 cc-atm, the observed pressure coefficient of the freezing temperature !:.T/!:.P, 0.0389° Ojatm, and the freezing temperature of the acid T, 395.6° K, by means of the OlausiusClapeyron equation
!:.P !:.H, !:.T=T(v2-v1)'
20 Frank W. Schwab and Edward Wichers, Precise Measurement of the Freezing Range as a Means of Determining the Pnrity of a Substance, Temperature-Its Measurement and Control in Science and Industry, p. 256-264 (Reinhold Publishing Corporation , New York. N. Y.,1941).
" Jean Timmermans and F . Burrie!, Recherches sur les propri~t~ de quelqnes combimtisons organiques, solides a In temperature ordinaire, Chlmie & Industrie, Special No., p. 196-7, March (1931).
" E. R . Smith, Th. det.rmination of the coefficient of cubical expansion of solid benzoic acid by means of a uas·filled dilatometer, BS J. Research 7, 903 (1931) RP382.
"John Scott Lumsden, The physical properties of heptoic, hexahydrobenzoic, and benzoic acids and their derivativu, J . Chern. Soc. 87 90 (1905).
" S. B. Hendricks and M. E. Jefferson, Anisotropy oj molecular crystals. 1. Experimental, J. Optical Soc. of America 23, 299 (1933) .
------------------------ - ---- -- --- ---
360 Journal ot R esearch of the National Bureau of Standards
in which VI is the specific volume of the liquid form, and V2 that of the solid. The shrinkage which occurs on freezing, thus calculated, is 0.138 cm3/g. The corresponding calculated value for the density of the solid at the freezing t emperature is 1.27 gjcm3•
The foregoing calculated value for the density at 122.37° C and the value of Hendricks and Jefferson for the density at 23.3° C give as the coefficient of cubical expansion, for the 99-degree interval, 0.00040 per degree.
Acknowledgment is made for the advice and many helpful suggestions received from members of the Heat Division, in particular E. F. Mueller, C. S. Cragoe, H. F. Stimson, and C. H. Meyers. Thanks are also expressed to C. L . Gordon for preparing the drawings.
VII. APPENDIX
Calculation of Temperatures in Platinum Resistance Thermometry
By Frank W. Schwab and E. R. Smith
The Callendar equation has been used for more than a half century for the computation of temperatures. During all these years there was little need for a departure from its use, but recently when it was appreciated that precision platinum resistance thermometers might be calibrated at temperatures other than the ice, steam, sulfur, and oxygen points, it became clear that a direct application of the fundamental equations offers advantages.
The fundamental equations can be modified in a regular manner to improve their application to the computation of temperatures. For the range from 0° to 660° C, one modification of the fundamental equation is described in this section. In the range from -190° to 0° C, two forms are given, of which the second is the more suitable for solution by the use of a slide rule.
1. RELATION BETWEEN THE POWER SERIES, CALLENDAR, AND CALLENDAR-VAN DUSEN EQUATIONS
The international scale of temperature between 0° and 660° C is defined by the resistance Re of a platinum resistance thermometer by means of the formula
(1)
for which the constants, Ro, A, and B are determined from measurements of resistances at the melting point of ice, the boiling point of water, and the boiling point of sulfur. From - 190° to 0° C, the temperature scale is obtained from the resistance by the formula
R t =Ro[l + At+ Bt2+C(t- 100)t3], (2)
in which the constants Ro, A, and B are the same as in formula 1 and the constant C is found from a measurement of resistance at the boiling point of oxygen.25
" Compt. rend ., Eighth General Conference of Weights and Measures, (Paris, 1933).
Freezing Temperature of Benzoic, Acid 361
National Bureau of Standards certificates for platinum resistance thermometers report only values for the constants Ro, e, and {) for the Callendar formula
Rt-Ro (t ) t t=100RlOO_Ro +8 100-1 100'
in which the value to be used for (RlOO - Ro) is given by
(RIOO-RO) = 100eRo.
The value of the constant {3 may also be given for use in the CallendarVan Dusen equation
t=100~~-=-IJlo +8C~0-1 )l~O +{3C~O-l )C~oy (3)
at temperatures below 00 C.
Equations 1 and 2 are the fundamental international equations. The constants for them can be computed from those of the equivalent forms of the Callendar and Callendar-Van Dusen equations. Ro, of course, remains the same for all. The relationships between the constants are readily obtained by writing the complete fundamental equation, 2, in the form
(4)
and the Callendar-Van Dusen equation in the equivalent form
~;=l +e( 1 + 1~0)t-(t~4)t2-Gg8)(t-100)t3. (5)
Since these equations are equivalent, comparison of coefficients gives
(6)
The constants of the Callendar and Callendar-Van Dusen equations in terms of those of the fundamental equations are
104B 1080 e=A+lOOB, {)=- - e- ' f3=- - e- ' (7)
2. INTERPOLATION OF TEMPERATURES BY USE OF THE POWER SERIES EQUATIONS
The power series equations can be expanded to make them more useful for the computation of temperatures by successive approximations. A simple graph together with a short table obviate more than one computation for a precision of the temperature within 0.0010 C.26
26 All of the precisions of the computation of temperature referred to in this appendix are dependent only on the method of computation. Otber errors, sucb as errors of calibration, bave been discussed by Brickwedde and Hoge, and otbers. Harold J . Hoge and Ferdinand G. Brickwedde, Intercompariso?l of platinum resistance thermometers between -1900 and 445 0 C, J . Researcb NBS 28, 217 (1942) RP1454.
..
362 Journal of Research of the National Bureau of Standards
(a) IN THE RANGE FROM o· TO 660· C
With a calculating machine, the fundamental equations can be used as conveniently as the Callendar and Callendar-Van Dusen to
equations to compute temperatures from resistances. For example, equation 1 can be written in the form
(~;-1 )=t(A+Bt) and t (RdRo)-1 A+Bt
If tl is a first estimation of the temperature,
etc.
t (R,/Ro)-l 2= A+Btl '
(8)
(9)
When the measured temperature is between 0° and 100° C, and the first estimated temperature, t l , is correct to within 1°C, one solution of equation 9 yields the correct temperature to the nearest 0.01 ° C. In the range between 100° and 660° C, two successive solutions are sufficient for this accuracy.
Better convergence can be obtained by the formula
(10)
which can be derived from equation 1 by the N ewton-Raphson method of series approximation 27 or, less elegantly, by adding RoBt2 to each side of equation 1. With equation 10, if the first , estimate of the temperature, t l , is correct to within 2° C, the first solution of the equation for ~ yields the temperature correctly to within 0.001 ° C over the complete range of validity of equation 1. The first estimation for tl can be made to within 2° C from a rough plot of R, with respect to t. To make this plot, values of R, for t=Oo, 100°, 200° .. , 600° C, can be quickly tabulated by little more than inspection of the fundamental formula R,=RoCI+At+Bt2). The results are plotted on a scale such that 1 mm= 1 degree and 0.1 ohm for a 25-ohm thermometer. With sufficient accuracy the plot is taken as linear over each 100-degree interval. Then only one computation with equation 10 is needed to find the correct temperature to within the precision of calibration of a platinum resistance thermometer.
(b) IN THE RANGE FROM -190· TO o· c.
Equation 2 can be solved approximately to obtain
(11)
for temperatures below 0° C. For measurements with a 25-ohm thermometer and with an initial estimate of the temperature made correctly to within 1°C, the first temperature computed by equation 11 differs from the correct temperature by 0.003° Cat -25° C and by
17 See also, Scarborough, Numerical Mathematical Analysis, p.178, Johns Hopkins Press (1930).
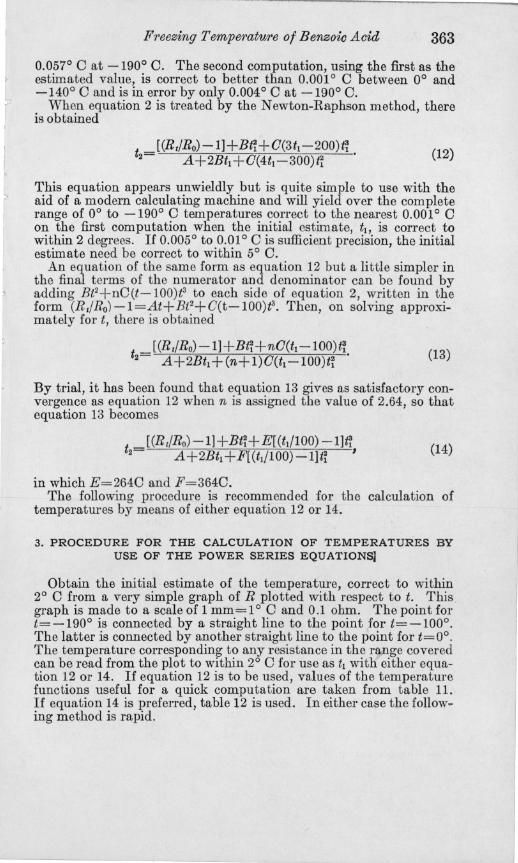
Freezing Temperature of Benzoic Acid 363
0.057° 0 at -190° O. The second computation, using the first as the estimated value, is correct to better than 0.001° 0 between 0° and -140° 0 and is in error by only 0.004° 0 at -190° O.
When equation 2 is treated by the N ewton-Raphson method, there is obtained
t _[(Rt/Ro) -1]+Bt~+O(3tl-200)t~ . 2- A+2Btl+0(4tl-300)t~ (12)
This equation appears unwieldly but is quite simple to use with the aid of a modern calculating machine and will yield over the complete range of 0° to -190° 0 temperatures correct to the nearest 0.001° 0 on the first computation when the initial estimate, tt, is correct to within 2 degrees. If 0.005° to 0.01 ° 0 is sufficient precision, the initial estimate need be correct to within 5° O.
An equation of the same form as equation 12 but a little simpler in the final terms of the numerator and denominator can be found by adding Bt2+nO(t-100W to each side of equation 2, written in the form (R,jRo)-1=At+Bt2+O(t-100)t3• Then, on solving approximately for t, there is obtained
t _[(Rt/Ro) -1]+Bt~+nO(tl-100)~. 2- A+2Btl+(n+1)O(tl-100)t~
(13)
By trial, it has been found that equation 13 gives as satisfactory convergence as equation 12 when n is assigned the value of 2.64, so that equation 13 becomes
t _[(Rt/Ro)-1]+Bt~+E[(td100)-1]~ 2- A+2Btl+F[(td100)-1]t~ I
in which E=2640 and F=3640.
(14)
The following procedure is recommended for the calculation of temperatures by means of either equation 12 or 14.
3. PROCEDURE FOR THE CALCULATION OF TEMPERATURES BY USE OF THE POWER SERIES EQUATIONSl
Obtain the initial estimate of the temperature, correct to within 2° 0 from a very simple graph of R plotted with respect to t. This . graph is made to a scale of 1 mm=l ° 0 and 0.1 ohm. The point for t=-1900 is connected by a straight line to the point for t=-1000. The latter is connected by another straight line to the point for t=OO. The temperature corresponding to any resistance in the range covered can be read from the plot to within 2° 0 for use as tl with either equation 12 or 14. If equation 12 is to be used, values of the temperature functions useful for a quick computation are taken from table 11. If equation 14 is preferred, table 12 is used. In either case the follow~ ing method is rapid.
...
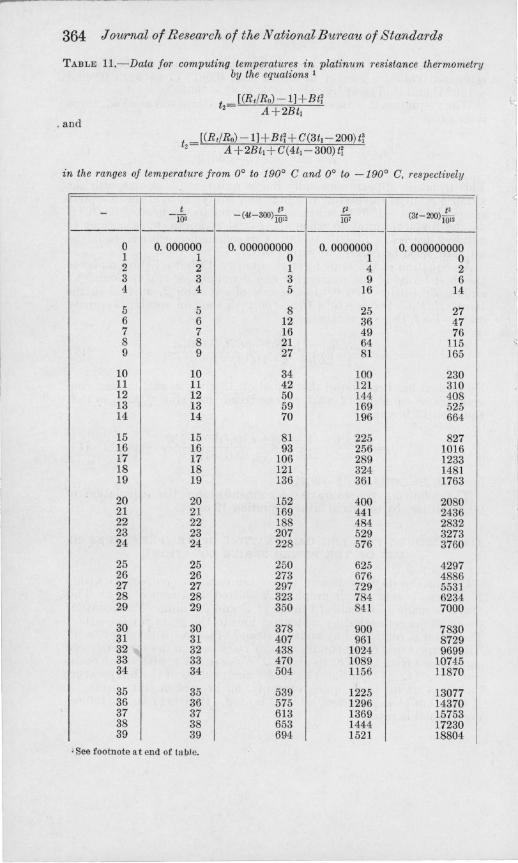
F
364 Journal of Research of the National BU1'eau of Standards
TABLE 11.-Data for computing temperatures in platinum resistance thermometry by the equations 1
t [(R tlRo)-lJ+Bt~ 2 A+2Bt1
• and [(RtlRo) -lJ+BtH C(3t l -200) tl
t2 A+2Bt l +C(4tl -300)ti
in the ranges of temperature from 0° to 190° C and 0° to -190° C, respectively
- t t' t' t' -166 -(41-300)1012 10i (3t-200)10I'
0 O. 000000 O. 000000000 O. 0000000 O. 000000000 1 1 0 1 0 2 2 1 4 2 3 3 3 9 6 4 4 5 16 14
5 5 8 25 27 6 6 12 36 47 7 7 16 49 76 8 8 21 64 115 9 9 27 81 165
10 10 34 100 230 11 11 42 121 310 12 12 50 144 408 13 13 59 169 525 14 14 70 196 664
15 15 81 225 827 16 16 93 256 1016 17 17 106 289 1233 18 18 121 324 1481 19 19 136 361 1763
20 20 152 400 2080 21 21 169 441 2436 22 22 188 484 2832 23 23 207 529 3273 24 24 228 576 3760
25 25 250 625 4297 26 26 273 676 4886 27 27 297 729 5531 28 28 323 784 6234 29 29 350 841 7000
30 30 378 900 7830 31 31 407 961 8729 32 32 438 1024 9699 33 33 470 1089 10745 34 34 504 1156 11870
35 35 539 1225 13077 36 36 575 1296 14370 37 37 613 1369 15753 38 38 653 1444 17230 39 39 694 1521 18804
J See footnote at end of til bJe.
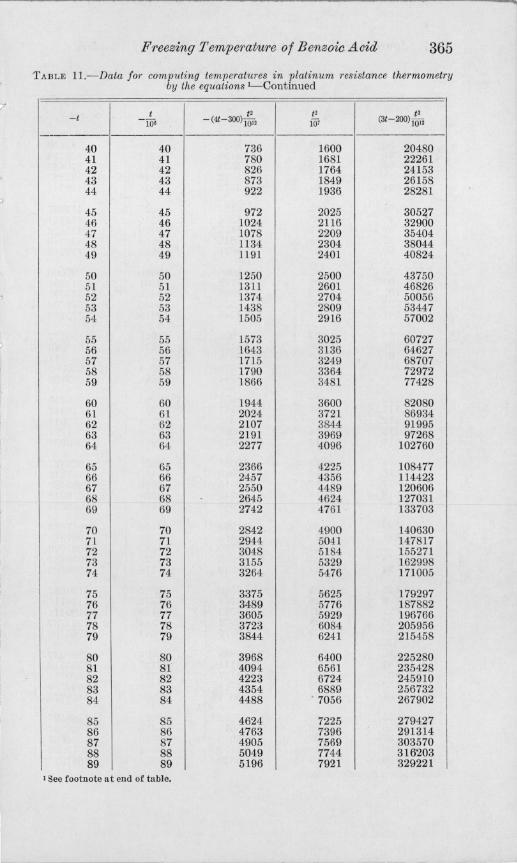
Freezing Temperature of B enzoic Acid 365
TABLE 11.- Data jor computing temperatures in platinum resistance thermometry by the equations I- Cont inued
-t t t' t' t' -106 - (4t-3OO)iOii iQi (31 - 200) 1012
-----------40 40 736 1600 20480 41 41 780 1681 22261 42 42 826 1764 24153 43 43 873 1849 26158 44 44 922 1936 28281
45 45 972 2025 30527 46 46 1024 2116 32900 47 47 1078 2209 35404 48 48 1134 2304 38044 49 49 1191 2401 40824
50 50 1250 2500 43750 51 51 1311 2601 46826 52 52 1374 2704 50056 53 53 1438 2809 53447 54 54 1505 2916 57002
55 55 1573 3025 60727 56 56 1643 3136 64627 57 57 1715 3249 68707 58 58 1790 3364 72972 59 59 1866 3481 77428
60 60 1944 3600 82080 61 61 2024 3721 86934 62 62 2107 3844 91995 63 63 2191 3969 97268 64 64 2277 4096 102760
65 65 2366 4225 108477 66 66 2457 4356 114423 67 67 2550 4489 120606 68 68 2645 4624 127031 69 69 2742 4761 133703
70 70 2842 4900 140630 71 71 2944 5041 147817 72 72 3048 5184 155271 73 73 3155 5329 162998 74 74 3264 5476 171005
75 75 3375 5625 1'79297 76 76 3489 5776 187882 77 77 3605 5929 196766 78 78 3723 6084 205956 79 79 3844 6241 215458
80 80 3968 6400 225280 81 81 4094 6561 235428 82 82 4223 6724 245910 83 83 4354 6889 256732 84 84 4488 . 7056 267902
85 85 4624 7225 279427 86 86 4763 7396 291314 87 87 4905 7569 303570 88 88 5049 7744 316'203 89 89 5196 7921 329221
! See footnote at end of table.
..
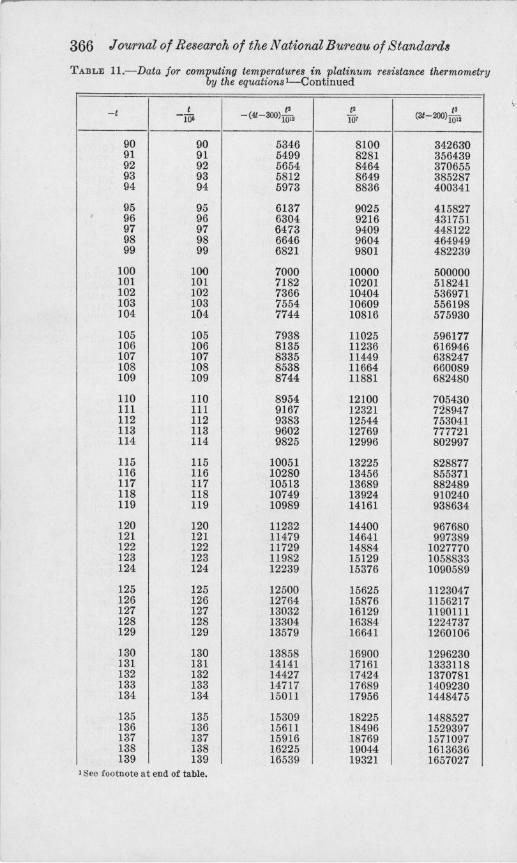
366 Journal of Re8earoh of the National Bureau of Standard8
TABLE H.-Data for computing temperatures in platinum resistance thermometry by the equations I-Continued
-/ t t' I' I' -Wi -(41-300)1012 107 (31-200)1012
90 90 5346 8100 34263'0 91 91 5499 8281 356439 92 92 5654 8464 370655 93 93 5812 8649 385287 94 94 5973 8836 400341
95 95 6137 9025 415827 . 96 96 6304 9216 431751 97 97 6473 9409 448122 98 98 6646 9604 464949 99 99 6821 9801 482239
100 100 7000 10000 500000 101 101 7182 10201 518241 102 102 7366 10404 536971 Hi3 103 7554 ]0609 556198 104 104 7744 10816 575930
105 105 7938 11025 596177 106 106 8135 11236 616946 107 107 8335 11449 638247 108 108 8538 11664 660089 109 109 8744 11881 682480
110 no 8954 12100 705430 111 111 9167 12321 728947 112 112 9383 12544 753041 113 113 9602 12769 777721 114 114 9825 12996 802997
115 115 10051 13225 828877 116 116 10280 13456 855371 117 117 10513 13689 882489 118 118 10749 13924 910240 119 119 10989 14161 938634
120 120 11232 14400 967680 121 121 11479 14641 997389 122 122 11729 14884 1027770 123 123 11982 15129 1058833 124 124 12239 15376 1090589
125 125 12500 15625 1123047 126 126 12764 15876 1156217 127 127 13032 16129 1190111 128 128 13304 16384 1224737 129 129 13579 16641 1260106
130 130 13858 16900 1296230 131 131 14141 17161 1333118 132 132 14427 17424 1370781 133 133 14717 17689 1409230 134 134 15011 17956 1448475
135 135 15309 18225 1488527 136 136 15611 18496 1529397 137 137 15916 18769 1571097 138 138 16225 19044 1613636 139 139 16539 19321 1657027
1 See footnote a t end of table.
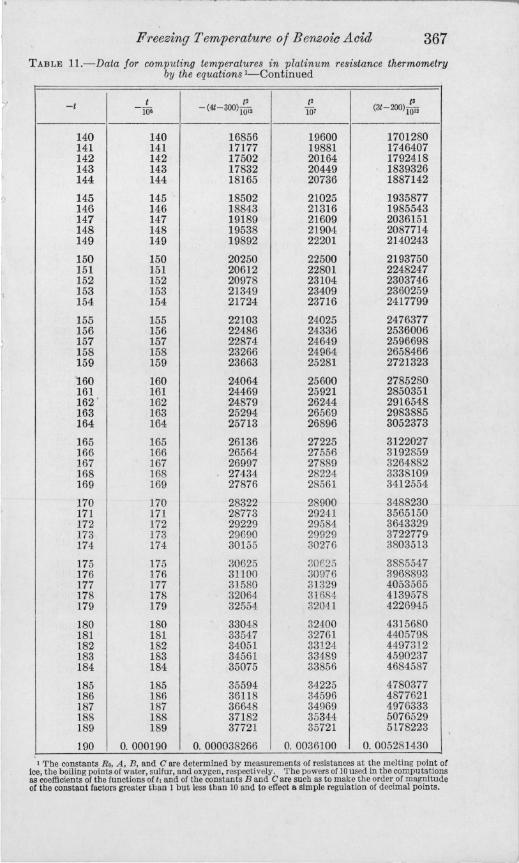
Freezing T emperature of B enzoic Aoid 367
TABLE 11.- Data for computing temperatures in platinum resistance thermometry by the equations I-Continued
-t t t' t' t· -iQo - (4t-300) 10\' 107 (31-200)10\'
140 140 16856 19600 1701280 141 141 17177 19881 1746407 142 142 17502 20164 1792418 143 143 17832 20449 1839326 144 144 18165 20736 1887142
145 145 18502 21025 1935877 146 146 18843 21316 1985543 147 147 19189 21609 2036151 148 148 19538 21904 2087714 149 149 19892 22201 2140243
150 150 20250 22500 2193750 151 151 20612 22801 2248247 152 152 20978 23104 2303746 153 153 21349 23409 2360259 154 154 21724 23716 2417799
155 155 22103 24025 2476377 156 156 22486 24336 2536006 157 157 22874 24649 2596698 158 158 23266 24964 2658466 159 159 23663 25281 2721323
'160 160 24064 25600 2785280 161 161 24469 25921 2850351 162 . 162 24879 26244 2916548 163 163 25294 26569 2983885 164 164 25713 26896 3052373
165 165 26136 27225 3122027 166 166 26564 27556 3192859 167 167 26997 27889 3264882 168 168 27434 28224 3338109 169 169 27876 28561 3412554
170 170 28322 28900 3488230 171 171 28773 29241 3565150 172 172 29229 29584 3643329 173 173 29690 29929 3722779 174 174 30155 30276 3803513
175 175 30625 30(25 3885547 176 176 31100 30976 3968893 177 177 31580 31329 4053565 178 178 32064 31684 4139578 179 179 32554 32041 4226945
180 180 33048 324.00 4315680 181 181 33547 32761 4405798 182 182 34051 33124 4497312 183 183 34561 33489 4590237 184 184 35075 33856 4684587
185 185 35594 34225 4780377 186 186 36118 34596 4877621 187 187 36648 34969 4976333 188 188 37182 35344 5076529 189 189 37721 35721 5178223
190 O. 000190 O. 000038266 0.0036100 O. 005281430
1 The constants Ro, A, B, and C are determined by measurements of resistances at the melting point oC ice, the boiling points of water, sulfur, and oxygen, respectively. The powers of 10 used in tbe computations as coefficients of the functions of t \ and of tbe constants Band Care sncb as to make tbe order of magnitude of the constant factors greater than 1 but less tban 10 and to effect a silDple regulation of decimal points.
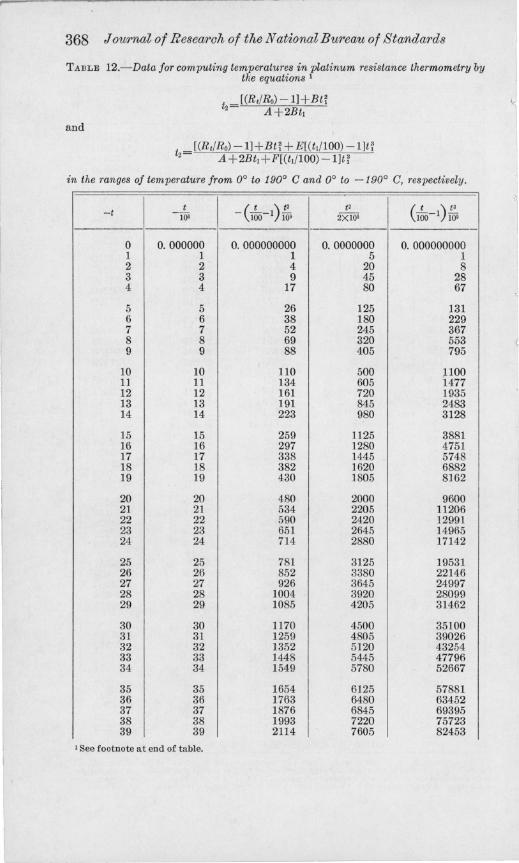
r
368 J owrnal of Researoh of the National Bureau of Standards
TABLE 12.-Data for computing temperatures in platinum resistance thermometry by the equations 1
t _[(R,jRo)- ll+Bti 2- A+2Btl
and
[(R ,jR o) - ll+Bti + E[(tt/100) - ljtt t2 A+2Bt1+F[(tl/100)-ljti
in the ranges of temperature from 0° to 190° C and 0° to - 190° C, respectively.
-t t C )t' t' (t ) t' -lo6 - 100-1 IQi 2Xlo' 100-1 1Qi -------
0 O. 000000 O. 000000000 0.0000000 O. 000000000 1 1 1 5 1 2 2 4 20 8 3 3 9 45 28 4 4 17 80 67
5 5 26 125 131 6 6 38 180 229 7 7 52 245 367 8 8 69 320 553 9 9 88 405 795
10 10 110 500 1100 11 11 134 605 1477 12 12 161 720 1935 13 13 191 845 2483 14 14 223 980 3128
15 15 259 1125 3881 16 16 297 1280 4751 17 17 338 1445 5748 18 18 382 1620 6882 19 19 430 1805 8162
20 20 480 2000 9600 21 21 534 2205 11206 22 22 590 2420 12991 23 23 651 2645 14965 24 24 714 2880 17142
25 25 781 3125 19531 26 26 852 3380 22146 27 27 926 3645 24997 28 28 1004 3920 28099 29 29 1085 4205 31462
30 30 1170 4500 35100 31 31 1259 4805 39026 32 32 1352 5120 43254 33 33 1448 5445 47796 34 34 1549 5780 52667
35 35 1654 6125 57881 36 36 1763 6480 63452 37 37 1876 6845 69395 38 38 1993 7220 75723 39 39 2114 7605 82453
1 See footnote at end of table.
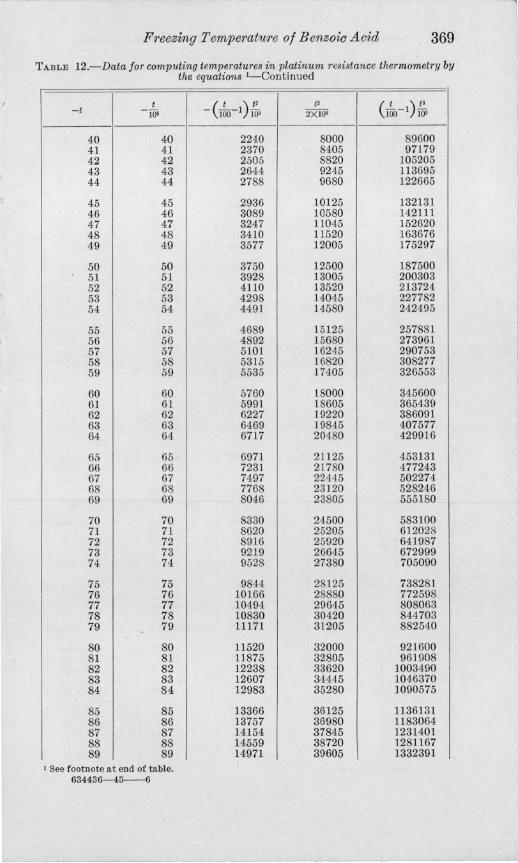
I ~ I
I
~ ~
Freezing Temperature of BenzoioAcid 369
TABLE 12o-Data for computing temperatwoes in platinum resistance thermometry by the equations I-Continued
-t t -loi
40 40 41 41 42 42 43 43 44 44
45 45 46 46 47 47 48 48 49 49
50 50 51 51 52 52 53 53 54 54
55 55 56 56 57 57 58 58 59 59
60 60 61 61 62 62 63 63 64 64
65 65 66 66 67 67 68 68 69 69
70 70 71 71 72 72 73 73 74 74
75 75 76 76 77 77 78 78 79 79
80 80 81 81 82 82 83 83 84 84
85 85 86 86 87 87 88 88 89 89
1 See footnote at end of tableo 634436- 45- 6
C )t. - 100-1 w; -------
2240 2370 2505 2644 2788
2936 3089 3247 3410 3577
3750 3928 4110 4298 4491
4689 4892 5101 5315 5535
5760 5991 6227 6469 6717
6971 7231 7497 7768 8046
8330 8620 8916 9219 9528
9844 10166 10494 10830 11171
11520 11875 12238 12607 12983
13366 13757 14154 14559 14971
t' e t ) t3
2X10' 100-1 loi
8000 89600 8405 97179 8820 105205 9245 113695 9680 122665
10125 132131 10580 142111 11045 152620 11520 163676 12005 175297
12500 187500 13005 200303 13520 213724 14045 227782 14580 242495
15125 257881 15680 273961 16245 290753 16820 308277 17405 326553
18000 345600 18605 365439 19220 386091 19845 407577 20480 429916
21125 453131 21780 477243 22445 502274 23120 528246 23805 555180
24500 583100 25205 612028 25920 641987 26645 672999 27380 705090
28125 738281 28880 772598 29645 808063 30420 844703 31205 882540
32000 921600 32805 961 908 33620 1003490 34445 1046370 35280 1090575
36125 1136131 36980 1183064 37845 1231401 38720 1281167 39605 1332391
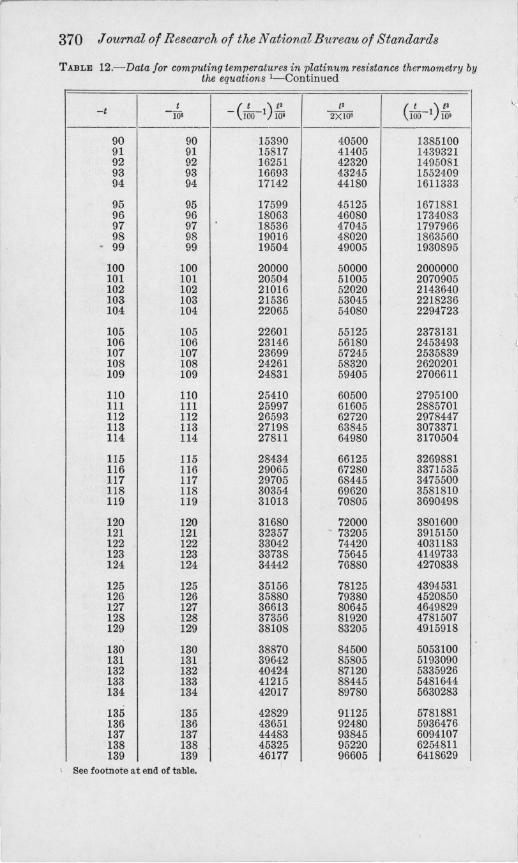
370 Journal of Research of the National Bureau of Standards
TABLE 12.-Data for computing temperatures in platinum resistance thermometry by the equations I-Continued
-I 1 C )/' t' (t ) t' -106 - 100- 1 1Qi 2X lO' 100- 1 10'
------ -90 90 15390 40500 1385100 91 91 15817 41405 1439321 92 92 16251 42320 1495081 93 93 16693 43245 1552409 94 94 17142 44180 1611333
95 95 17599 45125 1671881 96 96 18063 46080 1734083 97 97 18536 47045 1797966 98 98 19016 48020 1863560
• 99 99 19504 49005 1930895
100 100 20000 50000 2000000 101 101 20504 51005 2070905 102 102 21016 52020 2143640 103 103 21536 53045 2218236 104 104 22065 54080 2294723
105 105 22601 55125 2373131 106 106 23146 56180 2453493 107 107 23699 57245 2535839 108 108 24261 58320 2620201 109 109 24831 59405 2706611
110 110 25410 60500 2795100 111 111 25997 61 605 2885701 112 112 26593 62720 2978447 113 113 27198 63845 3073371 114 114 27811 64980 3170504
115 115 28434 66125 3269881 116 116 29065 67280 3371 535 117 117 29705 68445 3475500 118 118 30354 69620 3581810 119 119 31013 70805 3690498
120 120 31680 72000 3801600 121 121 32357 - 73205 3915150 122 122 33042 74420 4031183 123 123 33738 75645 4149733 124 124 34442 76880 4270838
125 125 35156 78125 4394531 126 126 35880 79380 4520850 127 127 36613 80645 4649829 128 128 37356 81920 4781507 129 129 38108 83205 4915918
130 130 38870 84500 5053100 131 131 39642 85805 5193090 132 132 40424 87120 5335926 133 133 41215 88445 5481644 134 134 42017 89780 5630283
135 135 42829 91125 5781881 136 136 43651 92480 5936476 137 137 44483 93845 6094107 138 138 45325 95220 6254811 139 139 46177 96605 6418629
t See footnote at end of table.
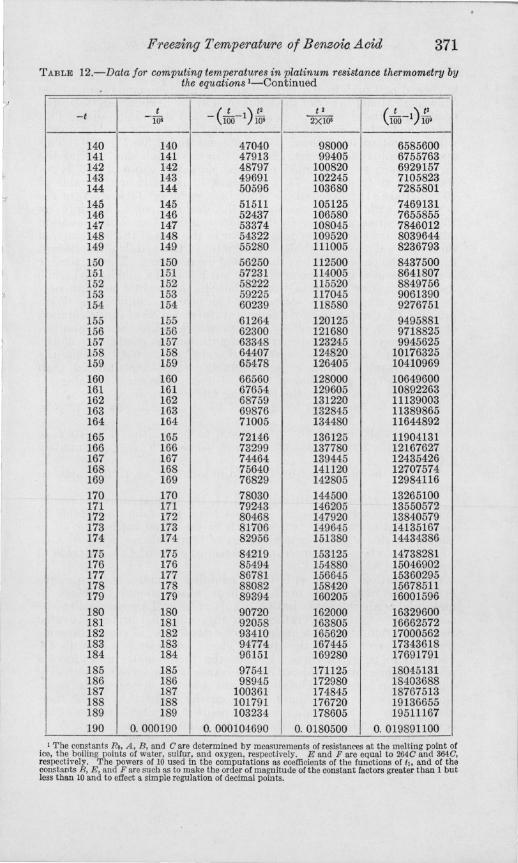
l Freezing Temperature of Benzow, Acid 371
TABLE 12.-Data for computing temperatures in platinum resistance thermometry by the equations I-Continued
t C )t' t ' C r' -t -j]6 - . 100-1 Wi 2XlO' 100-1 W
140 140 47040 98000 6585600 141 141 47913 99405 6755763 142 142 48797 100820 6929157 143 143 49691 102245 7105823 144 144 50596 103680 7285801 145 145 51511 105125 7469131 146 146 52437 106580 7655855 147 147 53374 108045 7846012 148 148 54322 109520 8039644 149 149 55280 111005 8236793 150 150 56250 112500 8437500 151 151 57231 114005 8641807 152 152 58222 115520 8849756 153 153 59225 117045 9061390 154 154 60239 118580 9276751 155 155 61264 120125 9495881 156 156 62300 121680 9718825 157 157 63348 123245 9945625 158 158 64407 124820 10176325 159 159 65478 126405 10410969 160 160 66560 128000 10649600 161 161 67654 129605 10892263 162 162 68759 131220 11139003 163 163 69876 132845 11389865 164 164 71005 134480 11644892 165 165 72146 136125 11904131 166 166 73299 137780 12167627 167 167 74464 139445 12435426 168 168 75640 141120 12707574 169 169 76829 142805 12984116 170 170 78030 144500 13265100 171 171 79243 146205 13550572 172 172 80468 147920 13840579 173 173 81706 149645 14135167 174 174 82956 151380 14434386 175 175 84219 153125 14738281 176 176 85494 154880 15046902 177 177 86781 156645 15360295 178 178 88082 158420 15678511 179 179 89394 160205 16001596 180 180 90720 162000 16329600 181 181 92058 163805 16662572 182 182 93410 165620 17000562 183 183 94774 167445 17343618 184 184 96151 169280 17691791 185 185 97541 171125 18045131 186 186 98945 172980 18403688 187 187 100361 174845 18767513 188 188 101791 176720 19136655 189 189 103234 178605 19511167 190 O. 000190 O. 000104690 O. 0180500 O. 019891100
1 The constants Ro, A , B, and Care determinp,d by measurements of resistances at the melting point of ice, tbe boiling points of water, sullur, and oxygen, respectively. E and F are equal to 264C and 364C, respectively. The powers of 10 used in tbe computations as coefficients of the functions of I" and of the constants B, E, and F are such as to make tbe order of magnitude of tbe constant factors greater than 1 but less tban 10 and to eJIect a simple regulation of decimal points.
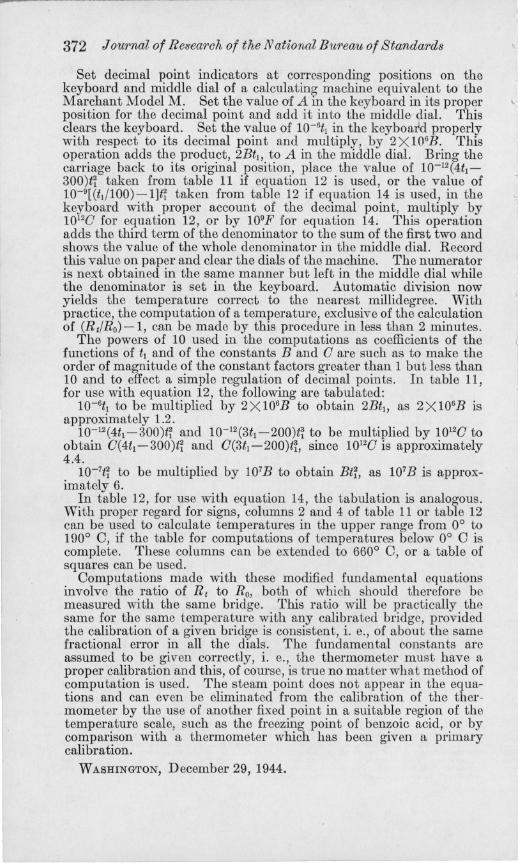
372 Journal of Re:5earch of tlw National Bureau of Standards
Set decimal point indicators at corresponding positions on the keyboard and middle dial of a calculating machine equivalent to the Marchant Model M. Set the value of A in the keyboard in its proper position for the decimal point and add it into the middle dial. This clears the keyboard. Set the value of 1O-6tl in the keyboa d properly with respect to its decimal point and multiply, by 2 X 10⁶B. This operation adds the product, 2Btl , to A in the middle dial. Bring the carriage back to its original position, place the value of 10-l 2 (4t1 -
300)t~ taken from table 11 if equation 12 is used, or the value of 1O-9[(tl/ 100)-1]t~ taken from table 12 if equation 14 is used, in the keyboard with proper account of the decimal point, multiply by 10120 for equation 12, or by 109F for equation 14. This operation adds the third term of the denominator to the sum of the first two and shows the value of the whole denominator in the middle dial. Record this value on paper and clear the dials of the machine. The numerator is next obtained in the same manner but left in the middle dial while the denominator is set in the keyboard. Automatic division now yields the temperature correct to the nearest millidegree. With practice, the computation of a temperature, exclusive of the calculation of (Rt/Ro)-l, can be made by this procedure in less than 2 minutes.
The powers of 10 used in the computations as coefficients of the functions of tl and of the constants Band 0 are such as to make the order of magnitude of the constant factors greater than 1 but less than 10 and to effect a simple regulation of decimal points. In table 11, for use with equation 12, the following are tabulated:
10-Btl to be multiplied by 2X10⁶B to obtain 2Btr, as 2X10⁶B is approximately 1.2.
1O-12(4tl-300)t~ and 1O-12(3tl -200)tr to be multiplied by 10120 to obtain 0(4tl-300)t~ and 0(3tl -200)tr, since 10120 is approximately 4.4.
1O-7t~ to be multiplied by 107B to obtain Bt~, as 107B is approximately 6.
In table 12, for use with equation 14, the tabulation is analogous. With propel' regard for signs, columns 2 and 4 of table 11 or table 12 can be used to calculate temperatures in the upper range from 0° to 190° 0, if the table for computations of temperatures below 0° ° is complete. These columns can be extended to 660° 0, or a table of squares can be used.
Oomputations made with these modified fundamental equations involve the ratio of R t to Ro, both of which should therefore be measured with the same bridge. This ratio will be practically the same for the same temperature with any calibrated bridge, provided the calibration of a given bridge is consistent, i. e., of about the same fractional error in all the dials. The fundamental constants are assumed to be given correctly, i. e., the thermometer must have a proper calibration and this, of course, is true no matter what method of computation is used. The steam point does not appeal' in the equations and can even be eliminated from the calibration of the thermometer by the use of another fixed point in a suitable region of the temperature scale, such as the freezing point of benzoic acid, or by comparison with a thermometer which has been given a primary calibration.
WASHINGTON, December 29,1944.
\i
l