Title: Influence of freezing temperatures prior freeze-drying on ...
39
1 Title: Influence of freezing temperatures prior freeze-drying on the viability of yeasts and lactic acid bacteria isolated from wine. Authors: Lucía Polo*, Rosario Mañes-Lázaro*, Isidoro Olmeda, Liz Erika Cruz, Ángel Medina, Sergi Ferrer, Isabel Pardo Running title: Freezing effect on survival of wine microorganism Corresponding author address: ENOLAB. ERI BioTecMed/IViSoCa. University of Valencia, Dr. Moliner 50, Burjassot, Valencia, 46100, Spain Phone: +34 963544390 * Authors first position is shared
-
Upload
khangminh22 -
Category
Documents
-
view
1 -
download
0
Transcript of Title: Influence of freezing temperatures prior freeze-drying on ...

1
Title: Influence of freezing temperatures prior freeze-drying on the viability of yeasts and
lactic acid bacteria isolated from wine.
Authors: Lucía Polo*, Rosario Mañes-Lázaro*, Isidoro Olmeda, Liz Erika Cruz, Ángel
Medina, Sergi Ferrer, Isabel Pardo
Running title: Freezing effect on survival of wine microorganism
Corresponding author address: ENOLAB. ERI BioTecMed/IViSoCa. University of
Valencia, Dr. Moliner 50, Burjassot, Valencia, 46100, Spain
Phone: +34 963544390
* Authors first position is shared
li2106
Text Box
Journal of Applied Microbiology, Vol. 122, Issue 6, June 2017, pp. 1603-1614 DOI:10.1111/jam.13465
li2106
Text Box
Published by Wiley. This is the Author Accepted Manuscript issued with: Creative Commons Attribution Non-Commercial License (CC:BY:NC 4.0). The final published version (version of record) is available online at DOI:10.1111/jam.13465. Please refer to any applicable publisher terms of use.
2
Abstract
Aims: To determine the effect of three different freezing temperatures on survival rates
of wine yeasts and lactic acid bacteria (LAB) after freeze-drying.
Methods and Results: Yeasts were grown in GPYD broth, Lactobacillus, Pediococcus
and Leuconostoc strains in MRS broth and Oenococcus oeni in MLO broth to mid
stationary phase. Cells were recovered and concentrated in appropriate lyoprotectants.
Aliquots of each strain were frozen at -20, -80 and -196ºC before vacuum drying. Viable
cells counts were performed before freezing and after freeze-drying and survival rates
calculated. Yeast and bacteria survivals were affected differently by temperatures of
freezing. The highest survivals rates were obtained at -20 ºC and -80 ºC for yeasts,
whereas for LAB they were at -196ºC, although no significant differences among the
three temperatures were obtained in this case. Wide differences in survival rates were
recorded among freeze-dried yeasts, while these differences were much less drastic in the
case of LAB species. Pichia membranifaciens, Starmerella bacillaris and Metschnikowia
pulcherrima among yeasts and Lactobacillus paracasei, Pediococcus parvulus and
Lactobacillus mali, among LAB, were the most tolerant species to freeze-drying.
Conclusions: -20ºC is the temperature that ensures the highest viability after the
lyophilization process for yeast, whereas -196ºC guarantees the best results for LAB.
Significance and Impact of the Study: This study shows that freezing temperature used
to lyophilize cells is a crucial factor for ensuring a good survival of wine yeast and LAB.
These results have important practical applications, not only for appropriately preserve
microorganisms but also for improving starter production processes.
Keywords : freeze-drying, yeast, lactic acid bacteria, freezing, lyophilization, survival,
wine.
3
Introduction
Yeast and lactic acid bacteria are involved in a great number of traditional European,
African and Asiatic food fermentations that result in products as basic as bread, sausages,
dairy products, sauerkraut, beverages, or as exotic as gari, idli, ogi, etc. (Caplice and
Fitzgerald 1999; Holzapfel 2002). Preservation of microorganisms responsible for these
fermentations is of great interest at both domestic and industrial levels. Careful
preservation of microorganism is imperative for future research, teaching and industrial
applications (Prakash et al. 2013). Lyophilization (or freeze-drying) is the preferred long-
term preservation method used by microbial resource centres and by industries producing
bacterial starters (Høier et al. 1999; Krieger 2009; Prakash et al. 2013), due to ease of
transportation and use, to the low cost of maintenance, and to the high rate of cell survival
over long periods of time (Miyamoto-Shinohara et al. 2006; Morgan et al. 2006; Prakash
et al. 2013). Freeze-drying is a form of preservation based on a cold-drying process which
consists in the dehydration of a substance by sublimation and involves three phases:
freezing, primary drying (sublimation) and secondary drying (desorption) (Kumar et al.
2011). Freeze-drying Lyophilization is considered the most appropriate method for
preservation of microorganisms. Freeze-drying is a very complex physical process in
which cell survival is affected by many physico-chemical and biological parameters.
Physico-chemical factors such as cell growth conditions, type of lyoprotectant, freezing,
sublimation and thawing temperatures, degree of dehydration achieved, reconstitution
medium, and time and storage and rehydration conditions have been described to have
great influence on the survival of microorganisms (Donev et al. 1995; Dumont et al. 2004;
Zhao and Zhang 2005; Nakamura et al. 2009; Peiren et al. 2015). Also, biological factors,
as type of microorganism, initial cell concentration, age of the cells, and presence of
compatible solutes in cell cytoplasm that can affect freeze-dried cell survival (Donev et
4
al. 1995; Miyamoto-Shinohara et al. 2000). Freeze-drying implies always a fall of viable
cells (Tymczyszyn et al. 2007), since it affects greatly cell compounds, structures and
properties, especially those related to cell membranes. The main causes of losing viability
after freeze-drying are, probably, ice crystal formation, high osmolarity due to the
increase of internal solute concentration, and macromolecule denaturation induced by
water removal (Pehkonen et al. 2008). Although freezing itself has not a lethal effect for
cells, it can induce physical stress that can injure a part of these cells, thus decreasing the
proportion of viable cells (Pehkonen et al. 2008). If freezing is extremely slow,
intracellular water can flow to the outer environment by osmosis and create extracellular
crystals, thus causing extracellular water removing and solute concentration increase that
lead to an osmotic imbalance. Conversely, if freezing is too fast, cells can not lose water
fast enough to maintain the balance, so intracellular ice crystals can appear thus producing
damaging or even lethal effects (Seki et al. 2009).
For these reasons, not all microorganism can be successfully preserved by this method,
thus satisfactory results are obtained for many bacteria, yeast and sporulating fungi, but
are not for non-sporulating fungi, some yeast species (Lipomyces, Leucosporidium,
Brettanomyces, Dekkera, Bullera, and Sporobolomyces) and certain bacteria
(Aquaspirillum serpens, Clostridium botulinum, Helicobacter pylori, etc.) (Prakash et al.
2013).
The aim of this work was to evaluate the influence of different initial freezing
temperatures prior sublimation on the viability of wine-isolated microorganisms
subjected to freeze-drying. Improving preservation of these important industrial
microorganisms is of paramount interest for industries devoted to starter culture
production.
5
Materials and methods
Microorganisms
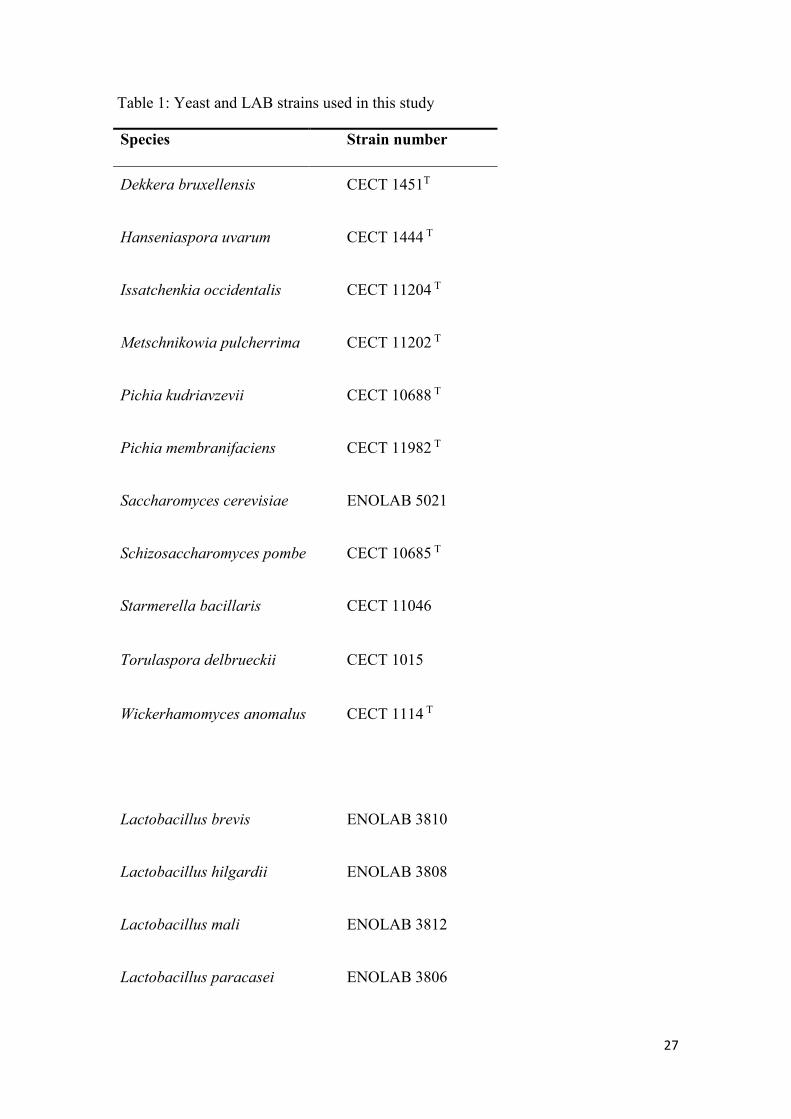
Microorganisms used for experiments are described in Table 1. Strains are representative
of the species currently found during vinification and were obtained from the Spanish
Type Culture Collection (CECT) and the private wine microorganism culture collection
ENOLAB (University of Valencia).
Biomass production
Yeast strains were grown in Glucose Peptone Yeast extract medium (GPY). The
composition per litre was as follows: 20 g glucose (Panreac); 10 g acid casein peptone H
(Pronadisa); yeast extract 5 g (Pronadisa) and agar 20 g (Pronadisa). The pH was adjusted
to 5.5.
Lactobacillus, Pediococcus and Leuconostoc species were grown in de Man, Rogosa and
Sharp medium (MRS) (Scharlab) supplemented with L-Cysteine (0.5 g l-1) (Sigma) and
Oenococcus oeni Enolab 4168 was grown in Medium for Leuconostoc oenos medium
(MLO), pH 4.8 (Zúñiga et al. 1993). One hundred millilitres cultures were incubated at
28ºC until mid-stationary phase; yeasts cultures were grown under shaking conditions
160 rpm in a HT Infors AG rotatory shaker, whereas bacteria biomass was produced
without agitation. Yeast and bacteria were harvested by aseptic centrifugation at 6000
rpm (6842 g) for 15 minutes at 4ºC in a Multifuge 1 S-R centrifuge (Heraeus). The yeast
pellet was washed with 100 ml of 0.9% NaCl (Panreac) solution, centrifuged again at the
same conditions and resuspended in a lyoprotectant solution consisting in 2 ml of
skimmed milk powder (Oxoid) and 1 ml of 15% glucose (Panreac) solution. Bacterial
cells, after centrifugation from the culture media, were washed with the same volume of
glutamic acid (0.067 mol l-1) and centrifuged under the same conditions. A concentrated
6
cell suspension was prepared by resuspending the cell pellet with 3 ml of glutamic acid
(0.067 mol l-1).
Freeze-drying and rehydration protocols
Volumes of 300 µl of cell suspensions were distributed into 0.5 mm diameter sterile glass
tubes and, after 10 minutes at room temperature, they were subjected to different freezing
treatments: -20 ºC for one hour, -80 ºC for one hour and -196 ºC (by immersion in liquid
N2) for one minute. Immediately after the treatments, cells were freeze-dried in a Virtis
lyophiliser operating at a 15.9 millitorr vacuum pressure for 18 hours. After freeze-drying
vials were sealed under a vacuum pressure of 1.7 millitors and then, stored at 4 ºC for a
week. After this storage period, cells were rehydrated and homogenized with 300 μl of
the appropriate culture media: GPY for yeasts, MRS for Lactobacillus, Pediococcus and
Leuconostoc species and MLO for O. oeni. Three independent replicates of each strain
were done.
Survival rate calculation
Viable cell counts were carried out on GPY, MRS or MLO plates, depending of the type
of microorganism. Concentrated cell suspensions, taken just before freezing and after
rehydration, were serially diluted and spread on plates. Plates were incubated at 28°C for
3-4 days and then the number of colony forming units per millilitre (CFU ml-1) was
determined. Survival percentage was calculated as the percentage of viable cells after
freeze-drying relative to viable cells before freeze-drying. Survival assays were carried
out in triplicate.
Statistical analysis
7
Statistical analyses were performed by using the JMP Pro 12 Statistical Software package
(SAS Institute Cary NC, USA). Generally, the independent variable (survival rates)
distribution was assessed for normality using the Shapiro-Wilk W Test. The
homoscedasticity was tested using the Levene’s test. When any of them failed, a variable
transformation was performed in order to improve normality or homogenize the
variances. As neither normality nor homoscedasticity improved, non-parametric Kruskal-
Wallis rank sum test was used. Type of microorganism (yeast or bacteria), strain and
freezing treatment were considered as dependent variables. Nonparametric comparisons
for each pair using Wilcoxon Method were used to investigate the relationship between
the different species. Statistical significance was judged at level P = 95%.
Existence of significant differences in survival relative to freezing temperatures was
determined by Kruskal-Wallis ANOVA one way non parametric test, and considering
different variables as factors: type of microorganism (yeast or bacteria, freezing
temperature, yeast or LAB species, etc.). The SPSS Statistics (IBM) software version 22
was used. Statistical significance was judged at level P < 0.05.
Results
The values of survival of yeasts and LABs obtained from the three different freeze-drying
processes are shown in Tables 2 and 3.
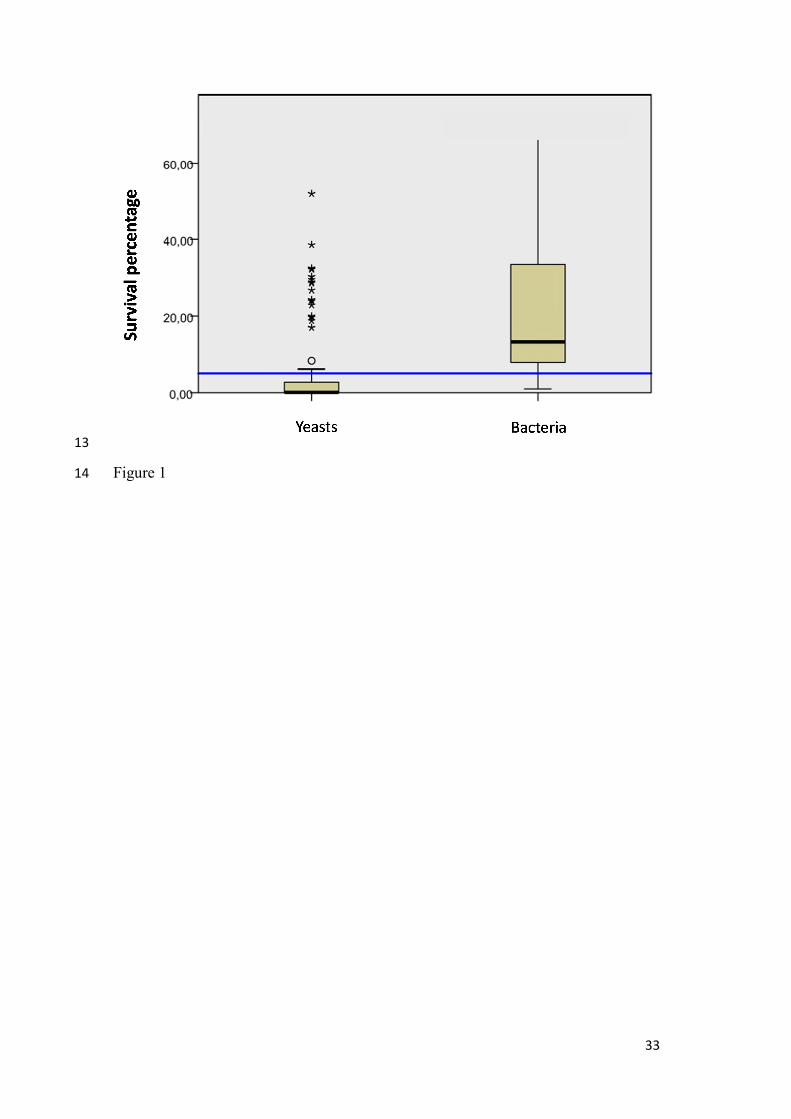
We found important differences in the response to freeze-drying between the yeast and
LAB groups. Yeasts were more sensitive to freezing than LABs. Considering the three
temperatures tested, average survival values were 5.6% for yeast and 21% for bacteria.
The p value obtained after Kruskal Wallis ANOVA one way test of data showed that the
null hypothesis that there were not differences in survival between the two groups of
microorganisms was not supported (p = 0.000) (Figure 1). Yeast and bacteria survivals

8
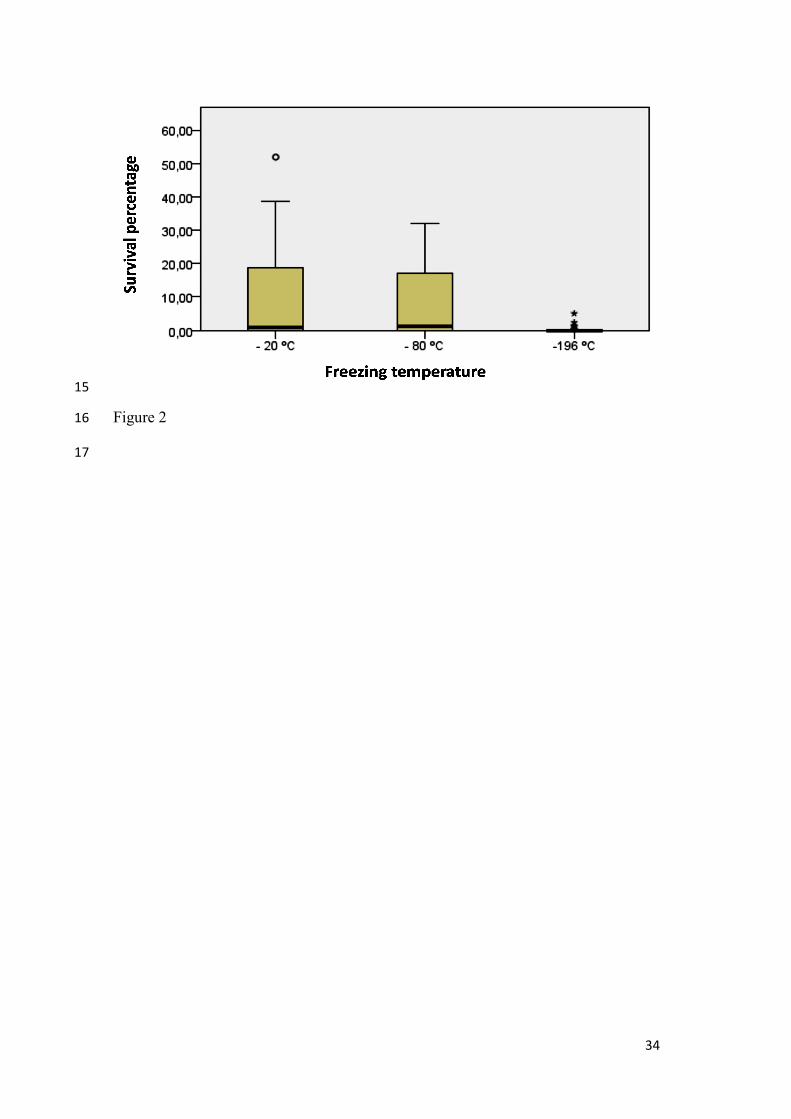
were affected differently by the different temperatures of freezing. In the case of yeasts,
higher survivals were obtained at -20ºC (average 9.5%) and at -80ºC (average 7.25%)
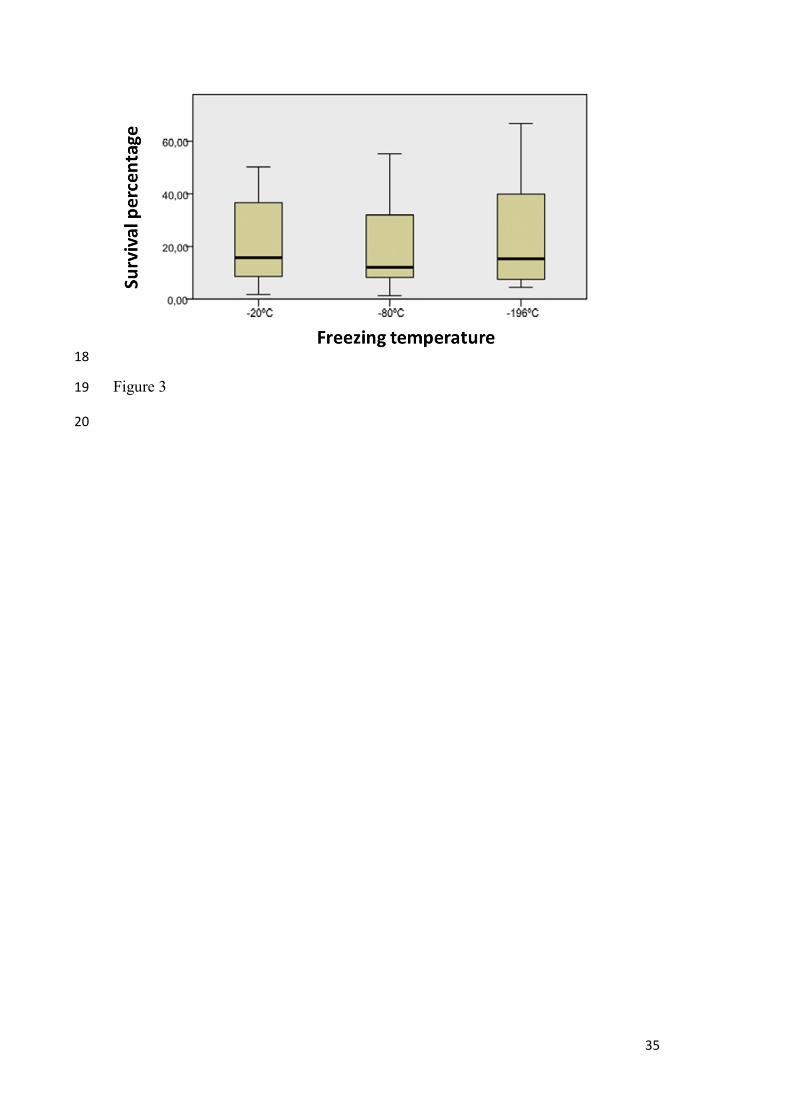
than at -196 ºC (average 0.4%) (Table 2, Figure 2). On the contrary, survival at -20, -80
and -196ºC did not differ too much for LAB, (averages 21, 18 and 23%, respectively)
(Table 3, Figure 3). Statistical analysis of yeast survival data showed no significant
differences between at -20ºC and -80ºC (p = 1.000). However, there are statistical
differences between -20°C and -196°C (p = 0.001) and between -80°C and -196°C (p =
0.014). In the case of bacteria, no significant differences in survival were found among
the three temperatures tested (p = 0.695) (Figure 2).
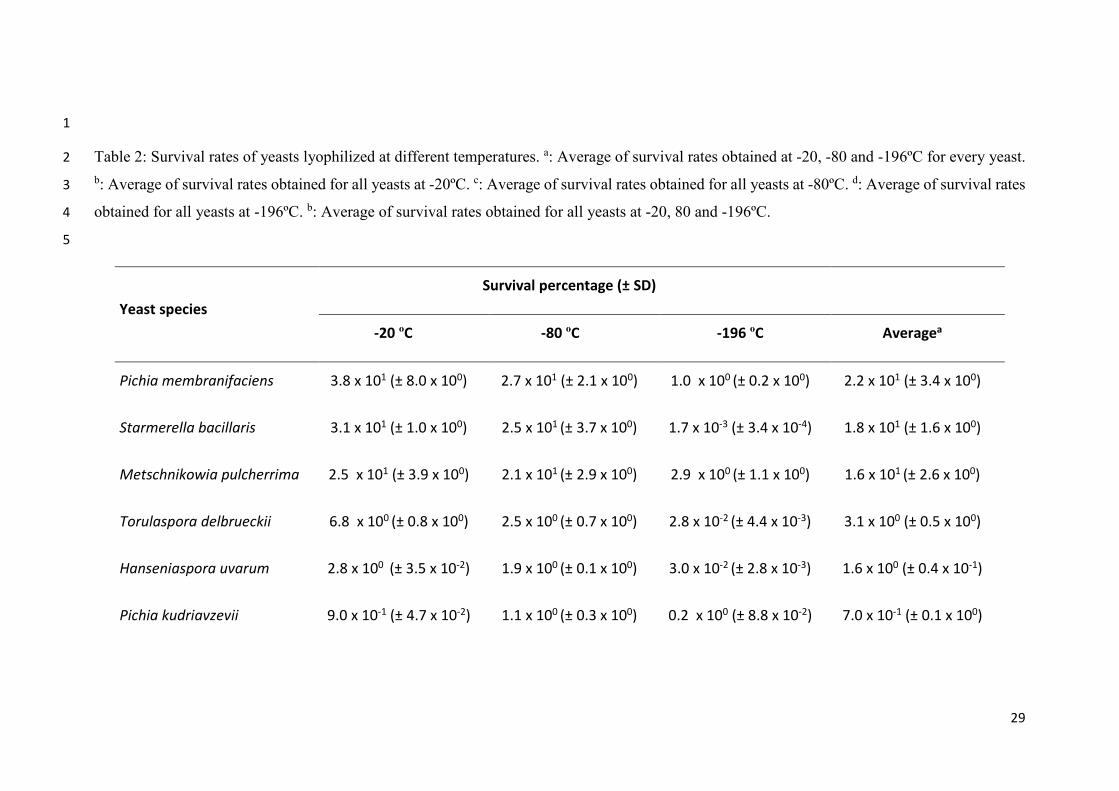
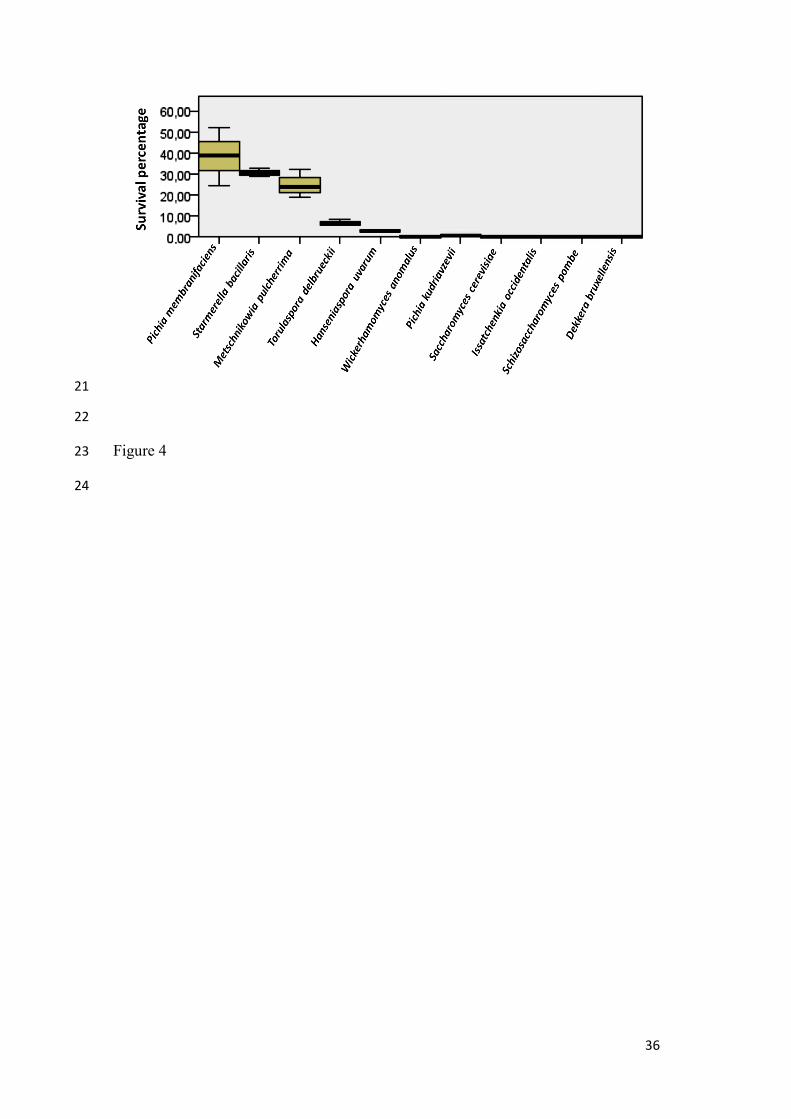
As can be observed in Table 2, survival rates varied widely among individual yeast
strains; values ranged between 38 and 0.00031%, and extreme values corresponded to
Pichia membranifaciens frozen at -20 ºC and to Saccharomyces cerevisiae frozen at -196
ºC. Among yeasts, the highest survival rates were obtained at -20 ºC and the lowest at -
196 ºC. Average survival rates of each yeast showed that the most resistant yeasts to
freeze-drying (regardless of the temperature used) were P. membranifaciens, Starmerella
bacillaris and Metschnikowia pulcherrima, whose survival exceeded 16%, whereas the
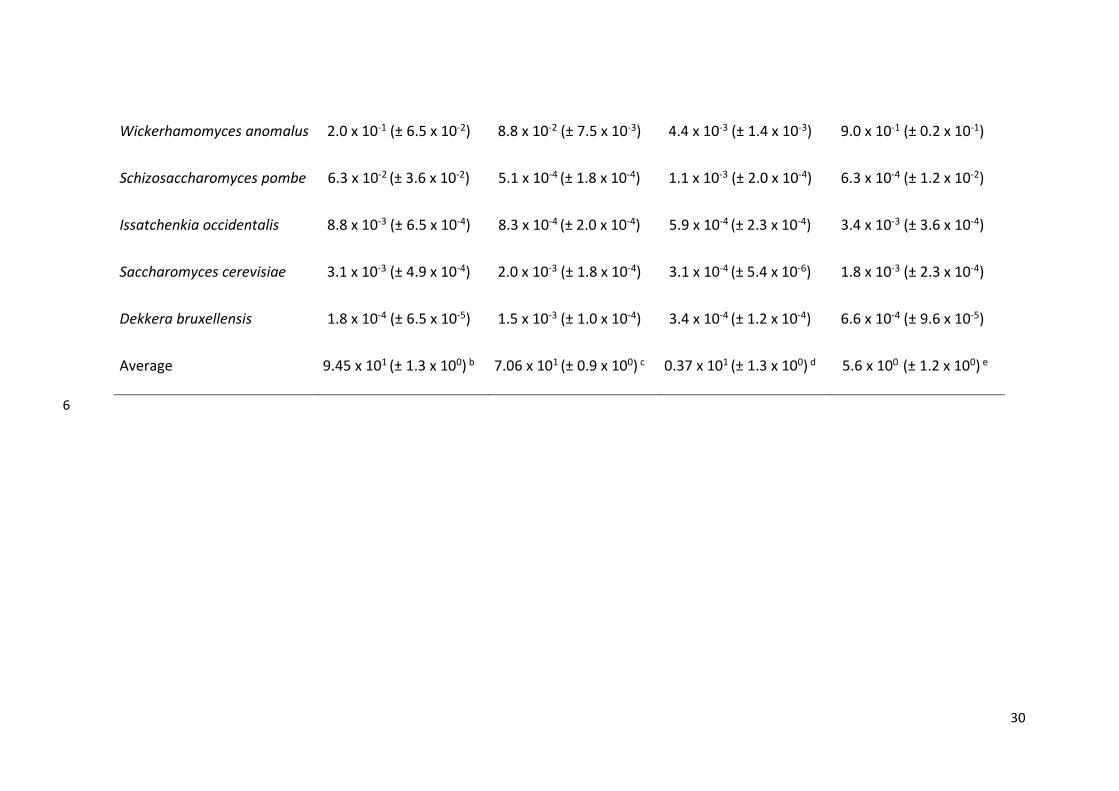
rest did not overcome 5%. Wickerhamomyces anomalus, S. cerevisiae, Dekkera
bruxellensis, Schizosaccharomyces pombe and Issatchenkia occidentalis strains showed
much lower survival rates compared with the rest of yeasts, regardless of the freezing
temperature used. Considering averages of survival percentages at the three temperatures
as variable, and yeast strain as factor a boxplot was plotted (Figure 4). The null hypothesis
- i.e. there do not exist differences in survival averages at the three temperatures among
species - was not supported. Thus, significant differences in survival percentages have
been recorded for the couples D. bruxellensis and Hanseniaspora uvarum (p= 0.023), D.
9
bruxellensis and Torulaspora delbrueckii (P= 0.008), D. bruxellensis and M. pulcherrima
(p= 0.002), D. bruxellensis and S. bacillaris (P= 0.001), and D. bruxellensis and P.
membranifaciens (p= 0.000); also for the couples S. cerevisiae and T. delbrueckii (p=
0.023), S. cerevisiae and M. pulcherrima (p= 0.005), S. cerevisiae and S. bacillaris (p=
0.002), and S. cerevisiae and P. membranifaciens (p= 0.001), Issatchenkia occidentalis
and M. pulcherrima (P= 0.020), I. occidentalis and S. bacillaris (p= 0.009), I. occidentalis
and P. membranifaciens (p= 0.005), Schizosaccharomyces pombe and M. pulcherrima
(p= 0.043), S. pombe and S. bacillaris (P= 0.020), S. pombe and P. membranifaciens (p=
0.013), Wickerhamomyces anomalus and S. bacillaris (p= 0.043), and, finally, W.
anomalus and P. membranifaciens (p= 0.028).
The null hypothesis that considers that yeast survival was affected in the same way for
the different freezing temperatures could not be supported. Thus, the P. membranifaciens,
S. bacillaris, M. pulcherrima, W. anomalus, I. orientalis and S. cerevisiae survivals were
significantly different at -20°C and -196°C and at -80°C and -196°C, but no at -20°C and
-80°C. For this group of strains is indistinct that freezing took place at -80 or -20ºC, as
there are not significant differences between the survival observed at these temperatures.
As for the rest of yeasts, the temperature of -196ºC was that provided lower survival
values. Significant differences in T. delbrueckii, and H. uvarum survival rates were found
among the three freezing temperatures tested, higher survivals rates were recorded at -
20°C, while the lowest values were obtained at -196ºC. Significant differences in
survivals rates of I. occidentalis were found between -20°C and -80°C and between -20°C
and -196°C, but not between -80°C and -196°C, whereas S. pombe survivals were
10
significantly different only between -20ºC and -80ºC. In these two yeasts, freezing at -
20°C ensured the highest survival rates, as for the rest. Finally, statistical significant
differences were found for D. bruxellensis survival rates between -20°C and -80°C and
between -80°C and -196°C, but not between -20°C and -196°C. The highest survival rate
for this yeast was achieved at -80°C.
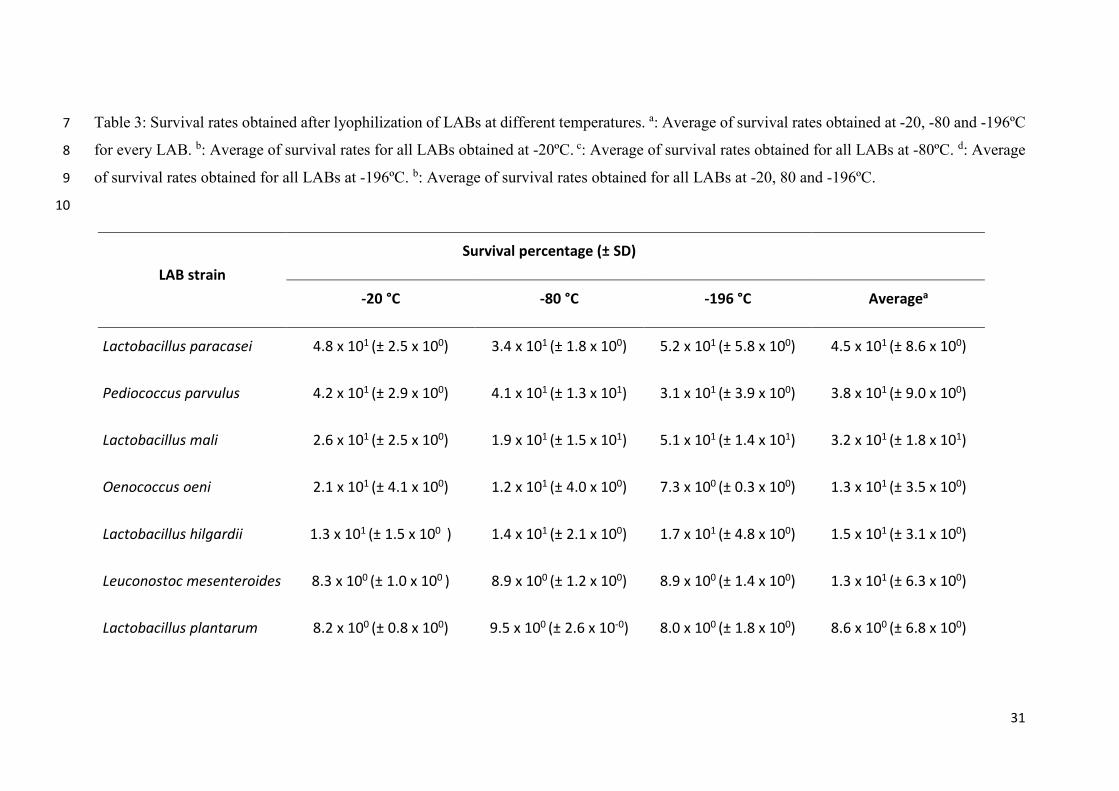
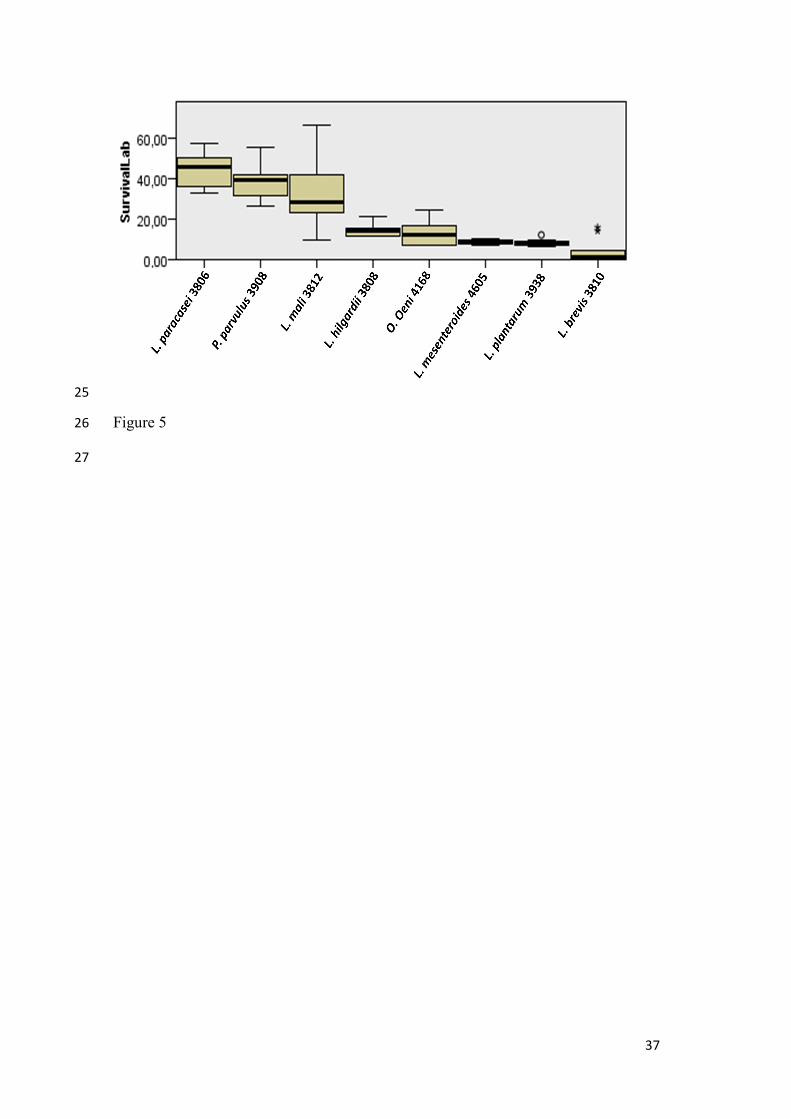
LAB survival rates after freeze-drying ranged between 52 and 1.4% (Table 3, Figure 5).
The highest value corresponded to Lactobacillus paracasei frozen at -196ºC, whereas the
lowest one to Lactobacillus brevis frozen at -80ºC. In general, the highest survival rates
were obtained at -196ºC, however, values corresponding to -20ºC and -80ºC were only
slightly lower; in fact, percentages of survival at these two temperatures were 90 and 78%
of that observed at -196ºC, respectively. The most sensitive bacteria to freezing at -20 and
-80ºC was Lact. brevis, but at -196ºC was O. oeni.
Considering the average of the survival rates of each freeze-dried bacteria at the three
freezing temperatures used, a plot from Kruskal Wallis ANOVA one way analysis was
built considering strain as the factor (Figure 5). Kruskal Wallis statistical test showed that
significant differences in survival rates existed among bacteria (p= 0.000). Significant
differences were found between Lact. brevis and Lactparacasei (p= 0.000), Lact. brevis
and Lact. mali (p= 0.002), and Lact. brevis and Ped. parvulus (p= 0.000), Also, the
survival rates of the next couples were significantly different: Lact. plantarum and Lact.
mali, (p=0.033), Lact. plantarum and Ped. parvulus (p= 0.002), Lact. plantarum and Lact.
paracasei (p= 0.000), Leuc. mesenteroides and Ped. parvulus (p= 0.006), Leuc.
mesenteroides and Lact. paracasei (p= 0.001), and Lact. paracasei and O. oeni
(p=0.016). Differences between the rest of the couples were not significant. The bacteria
showing the highest survival rates, considering the averages of survival at all freezing
11
temperatures, were Lact. paracasei, Ped. parvulus and Lact. mali (Table 3, Figure 5). It
can be deduced from Figure 5 that bacteria more tolerant to freeze-drying, whatever
temperature used for freezing, were Lact. paracasei, Ped. parvulus, and Lact. mali,
whereas Lact. brevis, Lact. plantarum and Leuc. mesenteroides were the less tolerant. No
significant differences between survivals of the bacteria clustered into the most and less
tolerant groups were found.
When analysing the behaviour of each bacteria to different freezing temperatures we
found that Lact. paracasei and Lact. mali showed significant differences in survival
between -20 and -80ºC (p= 0.01 and p=0.031, respectively) and between -80 and -196ºC
(p= 0.008 and p=0.047 ), but not between 20 and -196ºC (P values>0.05). Survival rates
of Lactobacillus hilgardii, Lact. plantarum and Leuc. mesenteroides are not significantly
different at the temperatures tested. Survival rates of Lact. brevis and O. oeni were not
significantly different neither between -20 and -80ºC nor between -20 and -196ºC (P
values>0.05), but they were between -80 and -196ºC (p=0.022 and p=0.005,
respectively). Finally, Ped. parvulus survival percentages show significant differences
among -20 and -196ºC (p=0.015) but not between -20 and -80 ºC nor -80 and -196ºC.
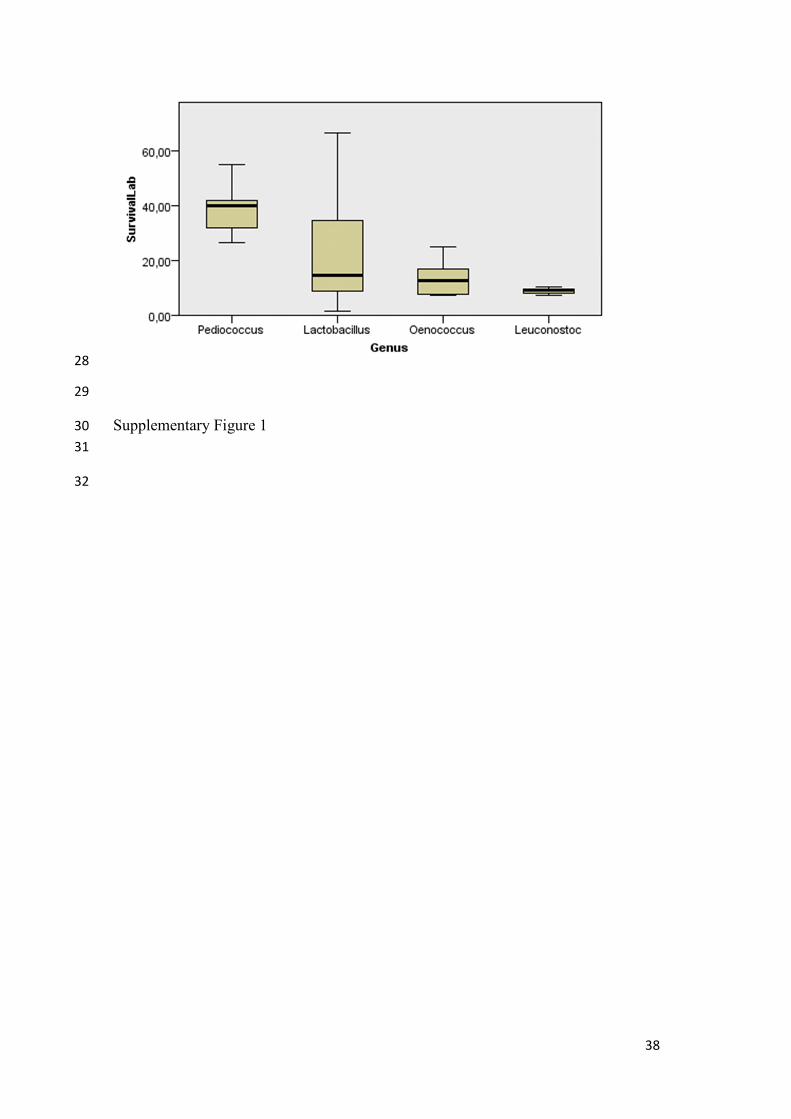
When analysing the behaviour of bacteria grouping them by genus, Kruskal Wallis one
way ANOVA test showed that there were significant differences in survival between
genera. Namely, significant differences were recorded by the next genera couples:
Pediococcus and Lactobacillus (p=0.026), Pediococcus and Leuconostoc (p=0.001) and
Pediococcus and Oenococcus (p=0.023), but not in the rest of the possible couples
(Supplementary Figure 1). From the analysis of the averages from survival rates at
different freezing temperatures, it can be deduced that Pediococcus bacteria were the
bacteria more tolerant to freeze-drying whatever freezing temperature used. The null
12
hypothesis that cell morphology did not influence survival rate must be retained as no
significant differences from were found between survival rates of cocci and rod cells after
statistical analysis (Supplementary Figure 2).
Discussion
Among factors determining the survival rate after freeze-drying, the type of
microorganisms is one of the most important intrinsic factors, whereas freezing protocol is
one of the most relevant extrinsic elements (Tsvetkov and Shishkova 1982; Santivarangkna
et al. 2008). In this work, focused on the effect of freeze-drying on microorganism related
to the winemaking process, we have observed important differences on survival of yeast
and lactic acid bacteria: yeasts were more sensitive to this preservation method than
bacteria, as already demonstrated Miyamoto-Shinohara et al. (2006). We have
demonstrated that the initial freezing temperature is a crucial factor determining the
performance of freeze-drying in the case of yeasts. However LABs were less affected by
this variable. Dumont et al. (2004) reported similar findings when they tested the effect of
different freezing rates on survival of the yeasts S. cerevisiae and Candida utilis, and the
bacterium Lact. plantarum. They found that the highest viabilities of S. cerevisiae (>80%)
were achieved at both, low (5 ºC min-1) and at very high (30000 ºC min-1) cooling rates,
whereas at intermediate cooling rates, viabilities ranged between 40 and 65%. Viabilities
recorded by us for this species were much lower, in the same range of that reported by
Miyamoto-Shinohara et al. (2010), and these viabilities decreased as freezing temperatures
lowered. Zhao and Zhang found that the malolactic species O. oeni and Lact. brevis
showed higher viability after freeze-drying when they were frozen at -65 ºC instead of -20
ºC before sublimation (Zhao and Zhang 2005; Zhao and Zhang 2009). However, in our
13
case it was the contrary, although differences between the two temperatures were too small
to be significant. Results from our Lact. plantarum strain showed slightly higher survival
at -80 ºC than at the other two temperatures, but differences were not significant. What it
became clear from the literature is that freeze-drying affected more negatively than freezing
both yeast and bacteria. This is not surprising because they suffered not only the deleterious
effects of freezing but also those derived from vacuum drying. This last process exposes
cell envelopes to a hydrophobic environment which alters the membrane permeability in a
more drastic way than freezing. Bravo-Ferrada et al. (2015) compared by flow cytometry
the percentage of damaged membranes in freeze-dried and frozen cells of Lact. plantarum,
and deduced that the highest percentage corresponded to lyophilized cells. Similar results
were reported by Russell and Stewart (1981) from studies on survival of three brewing
yeasts: S. cerevisiae, Saccharomyces uvarum and Saccharomyces diastaticus. They
demonstrated that survival of these yeasts was higher when they were frozen than when
were freeze-dried. Very low survival rates after lyophilization of S. cerevisiae cells (lower
than 0.02%) have been reported by various researchers (Atkin et al. 1949; Miyamoto-
Shinohara et al. 2010). By the contrary, Lact. plantarum is able to overcome lyophilization
stress rendering higher percentages of viable cells (Tsvetkov and Brankova 1983; de
Valdez et al. 1985; Dumont et al. 2004; García-Alegría et al. 2004). We have found values
of 8-9% survival of Lact. plantarum at the three temperatures tested, lower of those
reported by the previous cited authors; however, the survival rates are strain dependent
characteristics as Bravo-Ferrada et al. (2015) have demonstrated.
We have found important differences in abilities to survive not only among yeasts and
bacteria, but also between different strains belonging to each of these two groups. Several
authors have found that even different strains of the same species may respond differently
to the same preservation method (Prakash et al. 2013; Bravo-Ferrada et al. 2015). Taken
14
into account that factors as cooling rates, growth stage of the culture, type of lyoprotectant
used, and composition of the suspension and re-hydration media were common for each
yeast and bacterium, reasons explaining differences in survival must be related to
distinguishing features existing between species, such as cell size and morphology, water
content, membrane and cell wall composition, cell permeability, production of
exopolysaccharides, or ability to metabolize different carbohydrates, as have been
demonstrated by several authors (Dumont et al. 2004; C. Santivarangkna 2008; Miyamoto-
Shinohara et al. 2008; Miyamoto-Shinohara et al. 2010; Prakash et al. 2013). Miyamoto-
Shinohara et al. (2010) found a relationship between osmotolerance of yeasts and tolerance
to freeze-drying. We have observed that the strains of species P. membranifaciens, M.
pulcherrima, T. delbrueckii, H. uvarum, P. kudriavzevii and W. anomalus, all of them
reported as osmotolerant (Wang et al. 2015), were more resistant to freeze-drying than the
rest of yeasts. Although Wang et al. (2015) described S. cerevisiae as a species able to
resist high sugar concentrations, Tofalo et al. (2009) described that osmotolerance is a
strain dependent character in this species. We ignore if the low viability of the strain
ENOLAB 2056 after freeze-drying is or not a consequence of its low osmotolerance
because we have not tested this feature, but other authors have also found very low survival
rates to freeze-drying of S. cerevisiae strains, especially when freezing is performed by
dipping it in liquid nitrogen (-196ºC) (Wellman and Stewart 1973; Miyamoto-Shinohara et
al. 2006). Hernández-López et al. (2003) tested the abilities of T. delbrueckii to survive
and to leaven sweet and frozen sweet dough and found that that it was more tolerant to
freezing and to overcome osmotic stress than S. cerevisiae strains. They concluded that
survival differences between these two yeasts were related to the low invertase activity, the
slow rate of trehalose mobilization, and with the ability to adapt rapidly to high osmotic
pressures environments that exhibits T. delbrueckii.
15
As also pointed Miyamoto-Shinohara et al. (2010), we have observed that size of yeast
could be one of the reasons that explain the differences in survival in the yeast group: the
larger was the yeast, the lower survival showed; sizes of the yeasts tested in our work were
obtained from Kurtzman and Fell (1998). So, P. membranifaciens, S. bacillaris, M.
pulcherrima, and T. delbrueckii strains were more resistant to freeze-drying than the larger
yeasts H. uvarum, S. pombe or D. bruxellensis. We did not notice a size effect on the LAB
survival, possibly because differences in size among bacteria were very small. Data of
bacterial sizes were obtained from Bergey’s Manual of Systematic Bacteriology (Dicks
and Holzapfel 2009; Hammes and Hertel 2009; Holzapfel et al. 2009a; Holzapfel et al.
2009b). Cell morphology did not explain differences although a higher number of species
having coccus and bacillar shape should be tested to support our results.
As has been pointed by other authors, cell wall and membrane composition greatly affects
survival after freeze-drying in both yeast and bacteria (Fernández Murga et al. 2001;
Santivarangkna et al. 2008; Miyamoto-Shinohara et al. 2010). In general, yeast walls are
composed of 85-90% polysaccharide and 10-15% protein. The polysaccharide component
consists of a mixture of water-soluble mannan, alkali-soluble glucan, alkali-insoluble
glucan and small amounts of chitin (Nguyen et al. 1998). Most of the protein is covalently
linked to the mannan, which is more correctly described as mannoprotein. The proportions
of these different components vary with the species and they have important influence on
rheological properties of cell wall and membrane organization (Nguyen et al. 1998), which
can influence its response to freezing and freeze-drying (Santivarangkna et al. 2008).
Miyamoto-Shinohara et al. (2010) stated that the higher amount of glucan was present in
the yeast walls, the higher survival rate after lyophilization was observed. However, this
glucan can trap moisture, which decreased survival during storage. Moisture retention also
occurs when yeasts are able to produce extracellular polysaccharides and has the same

16
effect that glucan (Miyamoto-Shinohara et al. 2010). Differences in peptidoglycan
composition could explain differences in the response to freezing that we have found in
freeze-dried LABs; thus, bacteria having meso-diamino-pimelic in their cell walls (Lact.
paracasei and Lact. mali) tolerated significantly better freezing at -196ºC than at -80ºC.
However, cells containing Lys-D-Asp (Lact. brevis, Lact. hilgardii, Lact. plantarum and
Ped. parvulus) in their cell walls did not show significant differences in survival among
the three freezing temperatures. Data from cell wall composition were obtained from
Bergey’s Manual of Systematic Bacteriology (Dicks and Holzapfel 2009; Hammes and
Hertel 2009; Holzapfel et al. 2009a; Holzapfel et al. 2009b).
We have observed that survival rate of P. kudriavzevii (syn. Issatchenkia orientalis) is 100
and 300 times higher than I. occidentalis and S. cerevisiae. Similar differences between S.
cerevisiae and I. orientalis were found by Miyamoto-Shinohara et al. (2010). It is generally
accepted that freezing in liquid nitrogen (-196 ºC) was the method that resulted in the
lowest viability of yeast strains compared to higher freezing temperatures (Wellman and
Stewart 1973; Uzunova-Doneva and Donev 2000-2002; Abadias et al. 2001; Dumont et al.
2004). The reason why this occurs is because the freezing rate at this temperature (300 ºC
min-1 from Uzunova-Doneva and Donev (2000-2002)) is too fast to let the internal water
migrate outside the cell, and the water frozen inside the cell resulted in lethal damage
(Abadias et al., 2001). In the case of bacteria, in general, survival rates at -196ºC are a little
higher than at lower temperatures. This differential fact related to the yeasts could be
associated to the surface/volume (S/V) ratio, which determines thermal and water flow
during freezing. Bacterial cells are smaller than yeast cells and they have an S/V ratio five
times larger and, hence, water and heat will flow out faster from bacteria preventing in this
way intracellular crystallization, which results in a higher viability. Cell wall and plasmatic
17
membrane differences between bacteria and yeast can also account for differences in
survival (Dumont et al. 2004; Miyamoto-Shinohara et al. 2010).
From the results obtained in this work, we recommend that the freezing step during freeze-
drying should be performed at -20ºC for yeast and O. oeni and Ped. parvulus, and at -196ºC
for the rest of LABs, in order to obtain the best survival rates.
It has been recognized that survival of freeze-dried yeast is lower than survivals obtained
from other preservation methods as L-drying, drying or freezing (Atkin et al. 1949;
Miyamoto-Shinohara et al. 2010; Prakash et al. 2013). Although liquid fresh or frozen
yeast starters provide higher viable cell population, the short time frame of the fresh
cultures or the difficulties for distribution and storage of the frozen yeast justifies that, the
majority of yeast starter cultures used for food fermentations are sold as active dried yeasts
(Aguilera and Karel 1997; Krieger-Weber 2009). However, LAB dried starters are
practically inexistent in the market, possibly due to the low tolerance of these bacteria to
drying. Although there are not many works that compare the effects of drying and freeze-
drying, Kim and Bhowmik (1990) found that spray-dried yogurt powder showed lower
survival for Staphylococcus thermophilus than freeze-dried powder. This fact, besides a
higher storage stability, and an easy handling during storage, distribution and application,
makes freeze-drying be preferable to freezing to produce commercial starters, instead of
frozen cultures have higher percentage of viable cells and that cells need shorter time for
activation (Buckenhüskes 1993).
Data obtained in these experiments are important from the practical point of view, as
optimal temperatures to perform freezing previous to freeze-drying can be deduced. Data
obtained in these experiments are important from the practical point of view. Setting
18
freezing at -20ºC ensures higher values of yeast viability, reaching a maximum of 5 log
units related to -196ºC, whereas this last temperature ensures up to 5 times more survival
in LABs compared to -20ºC. Optimization of freeze-drying conditions ensures a greater
security in preserving microorganisms of industrial importance and helps to define
guidelines for improving the performance of commercially produced starter cultures’
preparations.
Acknowledgements
This work was supported by the Ministry of Education and Science, National Institute for
Agricultural Research (INIA) and FEDER through the project RM2007-00007-00-00.
Conflict of interest
No conflict of interest declared
19
REFERENCES
Abadias, M., Benabarre, A., Teixidó, N., Usall, J. and Viñas, I. (2001) Effect of freeze
drying and protectants on viability of the biocontrol yeast Candida sake. Int J Food
Microbiol 65, 173-182.
Aguilera, J.M. and Karel, M. (1997) Preservation of biological materials under
desiccation. Critical Reviews in Food Science and Nutrition 37, 287-309.
Atkin, L., Moses, W. and Gray, P.P. (1949) The preservation of yeast cultures by
lyophilization. Wallerstein Labs Commun 57.
Bravo-Ferrada, B.M., Brizuela, N., Gerbino, E., Gómez-Zavaglia, A., Semorile, L. and
Tymczyszyn, E.E. (2015) Effect of protective agents and previous acclimation on ethanol
resistance of frozen and freeze-dried Lactobacillus plantarum strains. Cryobiology 71,
522-528.
Buckenhüskes, H.J. (1993) Selection criteria for lactic acid bacteria to be used as starter
cultures for various food commodities. FEMS Microbiol Rev 12, 253-272.
C. Santivarangkna, U.K., P. Foerst, (2008) Inactivation mechanisms of lactic acid starter
cultures preserved by drying processes. J Appl Microbiol 105, 1-13.
Caplice, E. and Fitzgerald, G.F. (1999) Food fermentations: role of microorganisms in
food production and preservation. Int J Food Microbiol 50, 131-149.
de Valdez, G.F., de Giori, G.S., de Ruiz Holgado, A.P. and Oliver, G. (1985) Effect of
the rehydration medium on the recovery of freeze-dried lactic acid bacteria. Appl Environ
Microbiol 50, 1339-1341.
Dicks, L.M.T. and Holzapfel, W.H. (2009) Genus Oenococcus. In Bergey's Manual of
Systematic Bacteriology eds. De Vos, P., Garrity, G.M., Jones, D., Krieg, N.R., Ludwig,
W., Rainey, F.A., Schleifer, K.-H. and Whitman, W. pp.635-642: Springer.
20
Donev, T., Savova, I. and Kujumdzieva, A. (1995) Influence of the cultivation conditions
on yeast strains survival after lyophilization. Journal of Culture Collections 1, 38-41.
Dumont, F., Marechal, P.-A. and Gervais, P. (2004) Cell size and water permeability as
determining factors for cell viability after freezing at different cooling rates. Appl Environ
Microbiol 70, 268-272.
Fernández Murga, M.a.L., Font de Valdez, G. and Anibal Disalvo, E. (2001) Effect of
lipid composition on the stability of cellular membranes during freeze-thawing of
Lactobacillus acidophilus grown at different temperatures. Arch Biochem Biophys 388,
179-184.
García-Alegría, E., López, I., Ruiz, J.I., Sáenz, J., Fernández, E., Zarazaga, M., Dizy, M.,
Torres, C. and Ruíz-Larrea, F. (2004) High tolerance of wild Lactobacillus plantarum
and Oenococcus oeni strains to lyophilisation and stress environmental conditions of acid
pH and ethanol. FEMS Microbiology Letters 230, 53-61.
Hammes, W.P. and Hertel, C. (2009) Genus Lactobacillus. In Bergey's Manual of
Systematic Bacteriology eds. De Vos, P., Garrity, G.M., Jones, D., Krieg, N.R., Ludwig,
W., Rainey, F.A., Schleifer, K.-H. and Whitman, W. pp.465-511: Springer.
Hernández-López, M.J., Prieto, J.A. and Rández-Gil, F. (2003) Osmotolerance and
leavening ability in sweet and frozen sweet dough. Comparative analysis between
Torulaspora delbrueckii and Saccharomyces cerevisiae baker's yeast strains. Antonie van
Leeuwenhoek 84, 125-134.
Høier, E., Janzen, T., Henriksen, C.M., Rattray, F., Brockmann, E. and Johansen, E.
(1999) The production, application and action of lactic cheese starter cultures. In
Technology of cheesemaking ed. Law, B.A. pp.99-131. Sheffild, UK: Sheffild Academic
Press

21
Holzapfel, W., Franz, C.M.A.P., Wolfgang, L. and Dick, L. (2009a) Genus Pediococcus.
In Bergey's Manual of Systematic Bacteriology eds. De Vos, P., Garrity, G.M., Jones, D.,
Krieg, N.R., Ludwig, W., Rainey, F.A., Schleifer, K.-H. and Whitman, W. pp.513-520:
Springer.
Holzapfel, W.H. (2002) Appropriate starter culture technologies for small-scale
fermentation in developing countries. Int J Food Microbiol 75, 197-212.
Holzapfel, W.H., Bjorkroth, J.A. and Dicks, L.M.T. (2009b) Genus Leuconostoc. In
Bergey's Manual of Systematic Bacteriology eds. De Vos, P., Garrity, G.M., Jones, D.,
Krieg, N.R., Ludwig, W., Rainey, F.A., Schleifer, K.-H. and Whitman, W. pp.624-635:
Springer.
Kim, S.S. and Bhowmik, S.R. (1990) Survival of Lactic Acid Bacteria during Spray
Drying of Plain Yogurt. Journal of Food Science 55, 1008-1010.
Krieger-Weber, S. (2009) Application of yeast and bacteria as starter cultures. In Biology
of microorganisms on grapes, in must and in wine ed. Jürgen, K.H.U.G.F. pp.489-511.
Berlin Heidelberg: Springer-Verlag.
Krieger, S. (2009) Application of yeast and bacteria as starter culture. In Biology of
microorganisms on grapes, in must and in wine ed. Köning, H., Unden, G., Fröhlich, J.
pp.489-511. Berlin Heidelberg: Springer-Verlag.
Kumar, G.P., Prashanth, N. and Kumari, B.C. (2011) Fundamentals and applications of
lyophilization. Journal of Advanced Pharmaceutical Research 2, 157-169.
Kurtzman, C. and Fell, J.W. (1998) The yeast. A taxonomic study: Elsevier.
Miyamoto-Shinohara, Y., Imaizumi, T., Sukenobe, J., Murakami, Y., Kawamura, S. and
Komatsu, Y. (2000) Survival rate of microbes after freeze-drying and long-term storage.
Cryobiology 41, 251-255.
22
Miyamoto-Shinohara, Y., Nozawa, F., Sukenobe, J. and Imaizumi, T. (2010) Survival of
yeasts stored after freeze-drying or liquid-drying. The Journal of General and Applied
Microbiology 56, 107-119.
Miyamoto-Shinohara, Y., Sukenobe, J., Imaizumi, T. and Nakahara, T. (2006) Survival
curves for microbial species stored by freeze-drying. Cryobiology 52, 27-32.
Miyamoto-Shinohara, Y., Sukenobe, J., Imaizumi, T. and Nakahara, T. (2008) Survival
of freeze-dried bacteria. The Journal of General and Applied Microbiology 54, 9-24.
Morgan, C.A., Herman, N., White, P.A. and Vesey, G. (2006) Preservation of micro-
organisms by drying; A review. J Microbiol Methods 66, 183-193.
Nakamura, T., Takagi, H. and Shima, J. (2009) Effects of ice-seeding temperature and
intracellular trehalose contents on survival of frozen Saccharomyces cerevisiae cells.
Cryobiology 58, 170-174.
Nguyen, H.T., Fleet, H.G. and Rogers, L.P. (1998) Composition of the cell walls of
several yeast species. Appl Microbiol Biotechnol 50, 206-212.
Pehkonen, K.S., Roos, Y.H., Miao, S., Ross, R.P. and Stanton, C. (2008) State transitions
and physicochemical aspects of cryoprotection and stabilization in freeze-drying of
Lactobacillus rhamnosus GG (LGG). J Appl Microbiol 104, 1732-1743.
Peiren, J., Buyse, J., De Vos, P., Lang, E., Clermont, D., Hamon, S., Bégaud, E., Bizet,
C., Pascual, J., Ruvira, M., Macián, M.C. and Arahal, D. (2015) Improving survival and
storage stability of bacteria recalcitrant to freeze-drying: a coordinated study by European
culture collections. Appl Microbiol Biotechnol 99, 3559-3571.
Prakash, O., Nimonkar, Y. and Shouche, Y.S. (2013) Practice and prospects of microbial
preservation. FEMS Microbiology Letters 339, 1-9.
23
Russell, I. and Stewart, G.G. (1981) Liquid nitrogen storage of yeast cultures compared
to more traditional storage methods. American Society of Brewing Chemists Journal 39,
19-24.
Santivarangkna, C., Kulozik, U. and Foerst, P. (2008) Inactivation mechanisms of lactic
acid starter cultures preserved by drying processes. J Appl Microbiol 105, 1-13.
Seki, S., Kleinhans, F.W. and Mazur, P. (2009) Intracellular ice formation in yeast cells
vs. cooling rate: Predictions from modeling vs. experimental observations by differential
scanning calorimetry. Cryobiology 58, 157-165.
Tofalo, R., Chaves-López, C., Di Fabio, F., Schirone, M., Felis, G.E., Torriani, S.,
Paparella, A. and Suzzi, G. (2009) Molecular identification and osmotolerant profile of
wine yeasts that ferment a high sugar grape must. Int J Food Microbiol 130, 179-187.
Tsvetkov, T. and Brankova, R. (1983) Viability of micrococci and lactobacilli upon
freezing and freeze-drying in the presence of different cryoprotectants. Cryobiology 20,
318-323.
Tsvetkov, T. and Shishkova, I. (1982) Studies on the effects of low temperatures on lactic
acid bacteria. Cryobiology 19, 211-214.
Tymczyszyn, E.E., del Rosario Diaz, M., Gomez-Zavaglia, A. and Disalvo, E.A. (2007)
Volume recovery, surface properties and membrane integrity of Lactobacillus delbrueckii
subsp. bulgaricus dehydrated in the presence of trehalose or sucrose. J Appl Microbiol
103, 2410-2419.
Uzunova-Doneva, T. and Donev, T. (2000-2002) Influence of the freezing rate on the
survival of strains Saccharomyces cerevisiae after cryogenic preservation. Journal of
Culture Collections 3, 78.83.
Wang, H., Hu, Z., Long, F., Niu, C., Yuan, Y. and Yue, T. (2015) Characterization of
osmotolerant yeasts and yeast-like molds from apple orchards and apple juice processing
24
plants in China and investigation of their spoilage potential. Journal of Food Science 80,
M1850-M1860.
Wellman, A.M. and Stewart, G.G. (1973) Storage of brewing yeasts by liquid nitrogen
refrigeration. Appl Microbiol 26, 577-583.
Zhao, G. and Zhang, G. (2005) Effect of protective agents, freezing temperature,
rehydration media on viability of malolactic bacteria subjected to freeze-drying. J Appl
Microbiol 99, 333-338.
Zhao, G. and Zhang, G. (2009) Influence of freeze-drying conditions on survival of
Oenococcus oeni for malolactic fermentation. Int J Food Microbiol 135, 64-67.
Zúñiga, M., Pardo, I. and Ferrer, S. (1993) An improved medium for distinguishing
between homofermentative and heterofermentative lactic acid bacteria. Int J Food
Microbiol 18, 37-42.
25
Figure legends:
Figure 1.- Boxplot resulting from Kruskal-Wallis ANOVA one way test considering
survival rates as independent variable and type of microorganism as factor. Asterisk show
extreme data.
Figure 2.- Boxplot resulting from Kruskal-Wallis ANOVA one way test considering yeast
survival as independent variable and freezing temperature as factor. Asterisk and circle
marks extreme data.
Figure 3.- Boxplot resulting from Kruskal-Wallis ANOVA one way test considering LAB
survival as independent variable and freezing temperature as factor.
Figure 4.- Boxplot resulting from Kruskal-Wallis ANOVA one way test considering yeast
survival as independent variable and yeast strain as factor.
Figure 5.- Boxplot resulting from Kruskal-Wallis ANOVA one way test considering
survival rate as independent variable and bacterial strain as factor. Asterisk and circle
label extreme data.
Supplementary Figure 1: Boxplot resulting from Kruskal-Wallis ANOVA one-way test
considering survival rate as independent variable and genus as factor.

26
Supplementary Figure 2: Boxplot resulting from Kruskal-Wallis ANOVA one-way test
considering survival rate as independent variable and cell morphology as factor.
27
Table 1: Yeast and LAB strains used in this study
Species Strain number
Dekkera bruxellensis CECT 1451T
Hanseniaspora uvarum CECT 1444 T
Issatchenkia occidentalis CECT 11204 T
Metschnikowia pulcherrima CECT 11202 T
Pichia kudriavzevii CECT 10688 T
Pichia membranifaciens CECT 11982 T
Saccharomyces cerevisiae ENOLAB 5021
Schizosaccharomyces pombe CECT 10685 T
Starmerella bacillaris CECT 11046
Torulaspora delbrueckii CECT 1015
Wickerhamomyces anomalus CECT 1114 T
Lactobacillus brevis ENOLAB 3810
Lactobacillus hilgardii ENOLAB 3808
Lactobacillus mali ENOLAB 3812
Lactobacillus paracasei ENOLAB 3806

28
Lactobacillus plantarum CECT 748T
Leuconostoc mesenteroides ENOLAB 4605
Oenococcus oeni ENOLAB 4168
Pediococcus parvulus ENOLAB 3908
29
1
Table 2: Survival rates of yeasts lyophilized at different temperatures. a: Average of survival rates obtained at -20, -80 and -196ºC for every yeast.2
b: Average of survival rates obtained for all yeasts at -20ºC. c: Average of survival rates obtained for all yeasts at -80ºC. d: Average of survival rates3
obtained for all yeasts at -196ºC. b: Average of survival rates obtained for all yeasts at -20, 80 and -196ºC.4
5
Yeast species
Survival percentage (± SD)
-20 ºC -80 ºC -196 ºC Averagea
Pichia membranifaciens 3.8 x 101 (± 8.0 x 100) 2.7 x 101 (± 2.1 x 100) 1.0 x 100 (± 0.2 x 100) 2.2 x 101 (± 3.4 x 100)
Starmerella bacillaris 3.1 x 101 (± 1.0 x 100) 2.5 x 101 (± 3.7 x 100) 1.7 x 10⁻³ (± 3.4 x 10⁻⁴) 1.8 x 101 (± 1.6 x 100)
Metschnikowia pulcherrima 2.5 x 101 (± 3.9 x 100) 2.1 x 101 (± 2.9 x 100) 2.9 x 100 (± 1.1 x 100) 1.6 x 101 (± 2.6 x 100)
Torulaspora delbrueckii 6.8 x 100 (± 0.8 x 100) 2.5 x 100 (± 0.7 x 100) 2.8 x 10⁻² (± 4.4 x 10⁻³) 3.1 x 100 (± 0.5 x 100)
Hanseniaspora uvarum 2.8 x 100 (± 3.5 x 10⁻²) 1.9 x 100 (± 0.1 x 100) 3.0 x 10⁻² (± 2.8 x 10⁻³) 1.6 x 100 (± 0.4 x 10⁻¹)
Pichia kudriavzevii 9.0 x 10⁻¹ (± 4.7 x 10⁻²) 1.1 x 100 (± 0.3 x 100) 0.2 x 100 (± 8.8 x 10⁻²) 7.0 x 10⁻¹ (± 0.1 x 100)
30
Wickerhamomyces anomalus 2.0 x 10⁻¹ (± 6.5 x 10⁻²) 8.8 x 10⁻² (± 7.5 x 10⁻³) 4.4 x 10⁻³ (± 1.4 x 10⁻³) 9.0 x 10⁻¹ (± 0.2 x 10⁻¹)
Schizosaccharomyces pombe 6.3 x 10⁻² (± 3.6 x 10⁻²) 5.1 x 10⁻⁴ (± 1.8 x 10⁻⁴) 1.1 x 10⁻³ (± 2.0 x 10⁻⁴) 6.3 x 10⁻⁴ (± 1.2 x 10⁻²)
Issatchenkia occidentalis 8.8 x 10⁻³ (± 6.5 x 10⁻⁴) 8.3 x 10⁻⁴ (± 2.0 x 10⁻⁴) 5.9 x 10⁻⁴ (± 2.3 x 10⁻⁴) 3.4 x 10⁻³ (± 3.6 x 10⁻⁴)
Saccharomyces cerevisiae 3.1 x 10⁻³ (± 4.9 x 10⁻⁴) 2.0 x 10⁻³ (± 1.8 x 10⁻⁴) 3.1 x 10⁻⁴ (± 5.4 x 10⁻⁶) 1.8 x 10⁻³ (± 2.3 x 10⁻⁴)
Dekkera bruxellensis 1.8 x 10⁻⁴ (± 6.5 x 10⁻⁵) 1.5 x 10⁻³ (± 1.0 x 10⁻⁴) 3.4 x 10⁻⁴ (± 1.2 x 10⁻⁴) 6.6 x 10⁻⁴ (± 9.6 x 10⁻⁵)
Average 9.45 x 101 (± 1.3 x 100) b 7.06 x 101 (± 0.9 x 100) c 0.37 x 101 (± 1.3 x 100) d 5.6 x 100 (± 1.2 x 100) e
6
31
Table 3: Survival rates obtained after lyophilization of LABs at different temperatures. a: Average of survival rates obtained at -20, -80 and -196ºC7
for every LAB. b: Average of survival rates for all LABs obtained at -20ºC. c: Average of survival rates obtained for all LABs at -80ºC. d: Average8
of survival rates obtained for all LABs at -196ºC. b: Average of survival rates obtained for all LABs at -20, 80 and -196ºC.9
10
LAB strain
Survival percentage (± SD)
-20 °C -80 °C -196 °C Averagea
Lactobacillus paracasei 4.8 x 101 (± 2.5 x 100) 3.4 x 101 (± 1.8 x 100) 5.2 x 101 (± 5.8 x 100) 4.5 x 101 (± 8.6 x 100)
Pediococcus parvulus 4.2 x 101 (± 2.9 x 100) 4.1 x 101 (± 1.3 x 101) 3.1 x 101 (± 3.9 x 100) 3.8 x 101 (± 9.0 x 100)
Lactobacillus mali 2.6 x 101 (± 2.5 x 100) 1.9 x 101 (± 1.5 x 101) 5.1 x 101 (± 1.4 x 101) 3.2 x 101 (± 1.8 x 101)
Oenococcus oeni 2.1 x 101 (± 4.1 x 100) 1.2 x 101 (± 4.0 x 100) 7.3 x 100 (± 0.3 x 100) 1.3 x 101 (± 3.5 x 100)
Lactobacillus hilgardii 1.3 x 101 (± 1.5 x 100 ) 1.4 x 101 (± 2.1 x 100) 1.7 x 101 (± 4.8 x 100) 1.5 x 101 (± 3.1 x 100)
Leuconostoc mesenteroides 8.3 x 100 (± 1.0 x 100 ) 8.9 x 100 (± 1.2 x 100) 8.9 x 100 (± 1.4 x 100) 1.3 x 101 (± 6.3 x 100)
Lactobacillus plantarum 8.2 x 100 (± 0.8 x 100) 9.5 x 100 (± 2.6 x 10-0) 8.0 x 100 (± 1.8 x 100) 8.6 x 100 (± 6.8 x 100)
32
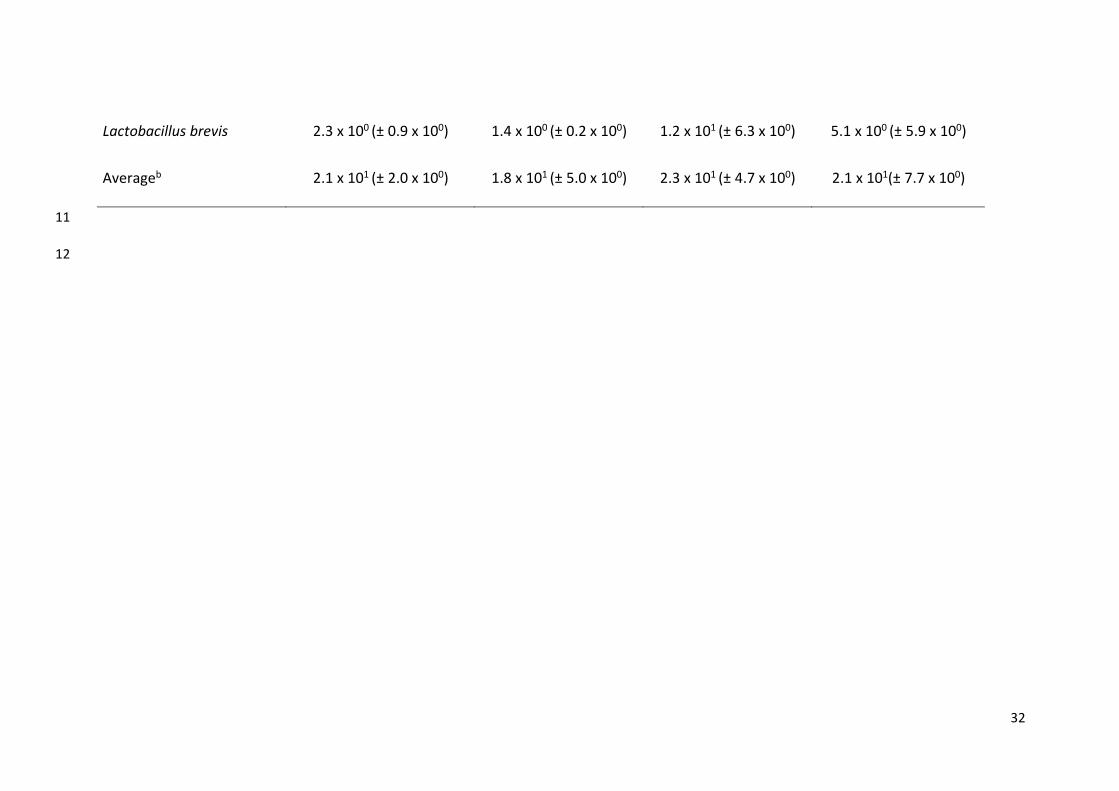
Lactobacillus brevis 2.3 x 100 (± 0.9 x 100) 1.4 x 100 (± 0.2 x 100) 1.2 x 101 (± 6.3 x 100) 5.1 x 100 (± 5.9 x 100)
Averageb 2.1 x 101 (± 2.0 x 100) 1.8 x 101 (± 5.0 x 100) 2.3 x 101 (± 4.7 x 100) 2.1 x 101(± 7.7 x 100)
11
12
33
13
Figure 114
34
15
Figure 216
17
35
18
Figure 319
20
36
21
22
Figure 423
24
37
25
Figure 526
27
38
28
29
Supplementary Figure 130
31
32

39
33
34
Supplementary Figure 235
36