Adsorption, Aggregation and Structure Formation in Systems ...
189
Adsorption, Aggregation and Structure Formation in Systems of Charged Particles: From Colloidal to Supracolloidal Assembly vorgelegt von Master of Science (Honours School) - Chemistry Bhuvnesh Bharti aus Rajpura, Punjab - INDIA Von der Fakultät II – Mathematik und Naturwissenschaften der Technischen Universität Berlin zur Erlangung des akademischen Grades Doktor der Naturwissenschaften Dr. rer. nat. genehmigte Dissertation Promotionsausschuss: Vorsitzender: Prof. Dr. R. Süssmuth (TU, Berlin) Berichter: Prof. Dr. G. H. Findenegg (TU, Berlin) Berichter: Prof. Dr. R. von Klitzing (TU, Berlin) Berichter: Prof. Dr. O. D. Velev (NCSU, Raleigh) Tag der wissenschaftlichen Aussprache: 16 Juli 2012 Berlin 2012 D83
-
Upload
khangminh22 -
Category
Documents
-
view
0 -
download
0
Transcript of Adsorption, Aggregation and Structure Formation in Systems ...
Adsorption, Aggregation and Structure
Formation in Systems of Charged Particles:
From Colloidal to Supracolloidal Assembly
vorgelegt von Master of Science (Honours School) - Chemistry
Bhuvnesh Bharti aus Rajpura, Punjab - INDIA
Von der Fakultät II – Mathematik und Naturwissenschaften der Technischen Universität Berlin
zur Erlangung des akademischen Grades
Doktor der Naturwissenschaften Dr. rer. nat.
genehmigte Dissertation
Promotionsausschuss:
Vorsitzender: Prof. Dr. R. Süssmuth (TU, Berlin) Berichter: Prof. Dr. G. H. Findenegg (TU, Berlin) Berichter: Prof. Dr. R. von Klitzing (TU, Berlin) Berichter: Prof. Dr. O. D. Velev (NCSU, Raleigh) Tag der wissenschaftlichen Aussprache: 16 Juli 2012
Berlin 2012
D83


No Problem can stand the assault of sustained thinking.
(C. F. Kettering)

Acknowledgements
First and foremost I offer my sincere gratitude to my supervisor, Prof. Gerhard H.
Findenegg, who encouraged me throughout the tenure of my thesis. This PhD work
would not have been possible without his constant support and luminous guidance. In
equal measures, I am thankful to my second supervisor, Prof. Orlin D. Velev for hosting
me at NCSU, and guiding me with his patience, knowledge and innovative ideas during
my stay in his group. I would also like to acknowledge the useful discussions and inputs
given by Prof.’s R. v Klitzing, S. Klapp, D. Lerche, S. K. Mehta and M. Gradzielski.
I am grateful to Jens Meissner for his help with the experiments; he has been a
great asset to me not only in my PhD work, but also as a close friend. I am also thankful
to Dr. D. Lugo (TU, Berlin) and Dr. S. Gangwal (NCSU, Raleigh) for their help in
starting up the new projects. In addition, I would like to express my gratitude to
Dr. S. Prévost (TU Berlin) and Dr. S. Smukov (NCSU, Raleigh) for their useful ideas
and advices. I highly appreciate the help of Dr. T. Söbisch (LUM, Berlin), Dr. U. Gasser
(PSI, Zurich), Dr. V. Cristiglio (ILL, Grenoble), Dr. J. Justin (LLB, Saclay), S. Selve
(ZELMI, Berlin), Dr. T. Mielke and J. Bürger (MPI für Molekulare Genetik, Berlin) for
their helps with the various experimental techniques.
I am indebted to Deutsche Forschungsgemeinschaft (DFG) in the frame work of
IGRTG-1524 for the financial support. I am grateful to all IGRTG members;
specifically, I would like to thank the Chairman, Prof. M. Schön, Managing Director,
Dr. D. Fliegner and Administrative Assistant, Mrs. P. Erdmann for their friendly
support. I am also thankful to secretaries, Christiane, Maria and CTA’s Ingke, René,
Michaela, Gabi and Jana for their help with the bureaucratic and experimental work.
I consider myself to be lucky to have such awesome colleagues both in TU Berlin
as well as in NCSU Raleigh. Specially, I would like to thank Raphael, Heiko and
Ravneet for their friendly support and motivation.

Abstract
Interaction of charged colloids with soft matter covers a wide range of phenomena that
play an important role in the natural environment as well as in various industrial and
biomedical applications. In the present work, we address the fundamental questions
about the interaction of surfactants and proteins with colloidal silica materials. Concepts
developed from the soft-hard matter interactions are then used for assembling
permanent linear chain structure of oppositely charged polystyrene microbeads.
The influence of surface curvature and surface modification on the self-assembly
of the nonionic surfactant C12E5 at silica nanoparticles and in the nanopores of SBA-15
silica material was studied by adsorption measurements and Small-Angle Neutron
Scattering (SANS). A strong decrease of the limiting adsorption of C12E5 with
decreasing particle diameter (from 13 to 43 nm) was found. To investigate the role of
lysine as a surface modifier, the morphology of the surfactant aggregates assembled on
pure siliceous nanoparticles (Ludox-TMA, 27 nm) and in the 8 nm pores of SBA-15
material was followed by SANS as the function of lysine concentration at a fixed
surfactant-to-adsorbent ratio. SANS measurements showed that lysine displaces the
C12E5 from the silica surface and the desorbed surfactant forms wormlike structure in
the bulk solution.
The interaction of the globular protein lysozyme with silica nanoparticles
(20 nm) was studied over a wide pH (3-11) and salinity range (0-100 mM). The
adsorption affinity and binding capacity of lysozyme on the silica particles increases
with increasing pH and decreasing salinity of dispersion, indicating the directing role of
electrostatic interactions in the adsorption processes. The adsorbed protein induces
bridging aggregation of the silica particles. Analytic centrifugation and Small Angle
X-ray Scattering (SAXS) studies indicate the presence of compact aggregates at pH 4-6
and a loose flocculated network at pH 7-9, followed by a sharp decrease of aggregate
size near the isoelectric point (IEP) of lysozyme. However, the compactness or the
stickiness obtained by SAXS structure factor fittings, increases with the increase in
dispersion salinity at a given pH. The results of silica aggregation in the presence of
lysozyme were compared with another similar globular protein, cytochrome C. In this
case, a shift in the aggregating pH regime was observed, which was attributed to the
slight difference in the IEP of the two proteins and to the non-uniform surface charge
distribution of the cytochrome C.
The heteroaggregation studied between oppositely charged silica and protein
molecules was implemented to achieve permanent assembly of latex microparticles. AC
electric fields are widely used for the directional assembly of chains or crystals from
any types of colloidal particles by dielectrophoresis (DEP), but these structures
disintegrate once the field is switched off. Here we presented a novel approach, where
we used DEP as a directing force to assemble ordered structures of heteroaggregating
particle pair. We demonstrate that the assembly process depends on the size ratio as well
as the number ratio of the two particles, and we derived a set of assembly rules for the
structures resulting from the process.

Zusammenfassung
Die Wechselwirkung zwischen geladenen Kolloidteilchen spielt eine wichtige Rolle in
Natur und Technik, wie auch für biomedizinische Anwendungen. In der vorliegenden
Dissertation werden grundlegende Fragen des Zusammenspiels von Silica Nanoteilchen
mit Tensiden und Proteinen behandelt. Die dabei entwickelten Konzepte werden auch
benutzt, um die Ausrichtung entgegengesetzt geladener Polystyrol-Teilchen
(Durchmesser um 1 µm) zu permanente linearen Ketten zu studieren.
Der Einfluss der Oberflächenkrümmung und Oberflächenmodifizierung auf die
Aggregation eines nichtionischen Tensids (C12E5) an der Oberfläche von
Silica-Nanoteilchen und in den Nanoporen von SBA-15 Silica wurde mit
Adsorptionsmessungen und Neutronen-kleinwinkelstreuung (SANS) untersucht. Für
Silica-Teilchen mit Durchmessern von 13 bis 43 nm wurde eine starke Abnahme der
maximalen Adsorption von C12E5 mit abnehmendem Teilchendurchmessern festgestellt.
Die Wechselwirkung des Tensids mit der Silikaoberfläche wurde durch Adsorption der
basischen Aminosäure Lysin modifiziert. Der Einfluss dieser Modifizierung auf die
Morphologie der Tensidaggregate an der Oberfläche von Silica-Nanoteilchen
(Ludox-TMA, 27 nm) und in den zylindrischen Nanoporen von SBA-15 wurde mittels
SANS studiert. Es wurde gefunden, dass mit steigender Oberflächenkonzentration von
Lysin das Tensid schrittweise von der Silica-Oberfläche verdrängt wird und wurmartige
Mizellen in der umgebenden Lösung bildet.
Die Wechselwirkung des globulären Proteins Lysozym mit Silcia-Nanoteichen
wurde im pH-Bereich 3 bis 11 und bei Ionenstärken bis 100 mM NaCl untersucht. Die
Adsorptionsaffinität und Bindungskapazität steigt mit steigendem pH und sinkender
Ionenstärke. Das adsorbierte Lysozym bewirkt eine Verbrückung der Silicapartikel und
damit eine Flockung des Systems. Untersuchungen mittels analytischer Zentrifuge und
Röntgenkleinwinkelstreuung (SAXS) deuten auf kompakte Aggregate im pH Bereich
4-6 und ein lockeres Netzwerk im pH Bereich 7-9 hin. Bei Annäherung an den
isoelektrischen Punkts von Lysozym (IEP = 10.7) nimmt die Aggregatgröße drastisch
ab. Aus den SAXS Daten wurde der Strukturfaktor der Silica-Aggregate ermittelt. Es
zeigte sich, dass dieser im gesamten pH Bereich und auch bei hohen Ionenstärken durch
das sticky-hard sphere Modell wiedergegeben wird. Die Protein-induzierte Aggregation
der Silicapartikel wurde auch mit Cytochrom C, einem weiteren globulären Protein,
untersucht. Dabei wurde eine Verschiebung des pH Bereichs festgestellt, in dem die
Aggregation stattfindet. Dies wurde primär auf die inhomogenere Verteilung der
Oberflächenladung von Cytochrom C zurückgeführt.
In Anlehnung an die Ergebnisse zur Heteroaggregation von Silica-Nanoteilchen
mit entgegengesetzt geladenen Proteinmolekülen wurde die Möglichkeit untersucht,
Latex- Mikroteilchen mit positiver und negativer Oberflächenladung zu stabilen Ketten
aufzureihen. Häufig werden elektrische Wechselfelder benutzt, um Ketten oder Kristalle
von kolloidalen Partikeln durch Dielektrophorese (DEP) zu erzeugen. Solche Strukturen
zerfallen jedoch, sobald das elektrische Feld ausgeschaltet wird. In dieser Arbeit wird
ein neuer Ansatz präsentiert, bei dem DEP auf binäre Systeme von entgegengesetzt
geladenen Teilchen angewandt wird. Auf diese Weise lassen sich stabile Ketten von
heteroaggregierten Teilchen herstellen. Weiterhin wird gezeigt, dass das Verhältnis der
Größe und Anzahl der Partikel die Struktur der Aggregate bestimmt. Daraus wurden
assembly rules für die Strukturen, die aus diesem Prozess erhalten werden, abgeleitet.

List of Publications
1. “Aggregation of Silica Nanoparticles Directed by Adsorption of Lysozyme”
Bhuvnesh Bharti, Jens Meissner and Gerhard H. Findenegg, Langmuir, 2011, 27,
9823.
2. “Surfactant Adsorption and Aggregate Structure at Silica Nanoparticles: Effects of
Particle Size and Surface Modification” Bhuvnesh Bharti, Jens Meissner, Urs
Gasser and Gerhard H. Findenegg, Soft Matter, 2012, 8, 2573.
3. “Protein–specific Effects of Binding to Silica Nanoparticles” Bhuvnesh Bharti and
Gerhard H. Findenegg, Chem. Lett., accepted.
4. “Permanent Supracolloidal Biparticle Assembly Triggered by an Electric Field”
Bhuvnesh Bharti, Gerhard H. Findenegg and Orlin D. Velev, submitted.
5. “Assembling wormlike micelles in tubular nanopores by tuning surfactant-wall
interactions” Bhuvnesh Bharti, Mengjun Xue, Jens Meissner, Viviana Cristiglio and
Gerhard H. Findenegg, submitted.
6. “Effect of pH and Salinity on Silica-Lysozyme Heteroaggregation” Bhuvnesh
Bharti, Sabine Klapp and Gerhard H. Findenegg, in preparation.

Contents
1. Introduction ............................................................................................................... 1
1.1 Why study colloidal interactions? ................................................................................. 1
1.2 Interaction of nanoparticles with nonionic surfactants ................................................. 1
1.3 Protein-nanoparticle interactions .................................................................................. 4
1.4 Supra-colloidal permanent assembly of microparticles ................................................ 6
1.5 Overview ....................................................................................................................... 7
1.6 Thesis outline ................................................................................................................ 8
2. Methods .................................................................................................................. 15
2.1 Synthesis and characterization of silica nanoparticles ................................................ 15
2.1.1 Synthesis ............................................................................................................. 15
2.1.2 Zeta potential ....................................................................................................... 16
2.1.3 Nitrogen adsorption ............................................................................................. 17
2.2 Adsorption at solid/liquid interface ............................................................................. 19
2.2.1 Surfactant adsorption .......................................................................................... 20
2.2.2 Protein adsorption ............................................................................................... 22
2.3 Turbidity and analytic centrifugation .......................................................................... 24
2.4 Small Angle Scattering (SAS) .................................................................................... 25
2.5 Small Angle Diffraction (SAD) .................................................................................. 29
3. Theory and modeling .............................................................................................. 33
3.1 Scattering data analysis ............................................................................................... 33
3.1.1 Micelle-decorated bead model ............................................................................ 34
3.1.2 Raspberry–like bead model ................................................................................. 38
3.2 Particle assembly ......................................................................................................... 40
3.2.1 Dielectrophoresis................................................................................................. 40
3.2.2 Chain-length distribution from numerical simulations ....................................... 42
3.2.3 Statistical model for chain length distribution .................................................... 44
4. Surfactant adsorption and aggregate structure at silica nanoparticles .................... 53
4.1 Introduction ................................................................................................................. 53
4.2 Results ......................................................................................................................... 54
4.2.1 Characterization of silica nanoparticles .............................................................. 54
4.2.2 Surfactant adsorption on Lys-Sil nanoparticles .................................................. 56
4.2.3 Lysine adsorption on silica nanoparticles ........................................................... 57
4.2.4 SANS study of surfactant aggregate structure .................................................... 58
4.3 Discussion ................................................................................................................... 62
4.3.1 Size dependence of the adsorption of C12E5 on Lys-Sil ...................................... 62
4.3.2 Effect of lysine on binding strength of surfactant ............................................... 65
4.3.3 Potential application relevance ............................................................................ 67
4.4 Conclusions ................................................................................................................. 68
5. Formation of cylindrical micelles in tubular nanopores.......................................... 73
5.1 Introduction ................................................................................................................. 73
5.2 Theoretical Background .............................................................................................. 74
5.3 Experimental ............................................................................................................... 78
5.3.1 Characterization of SBA-15 ................................................................................ 78
5.3.2 Lysine adsorption ................................................................................................ 79
5.3.3 Sample preparation and SANS measurements .................................................... 79
5.4 Results ......................................................................................................................... 81
5.4.1 Lysine adsorption ........................................................................................................ 81
5.4.2 SANS results ....................................................................................................... 82
5.5 Discussion ............................................................................................................... 87
5.5.1 Lysine adsorption ................................................................................................ 87
5.5.2 Lysine induced effects ......................................................................................... 88
5.6 Conclusion ............................................................................................................... 89
6. Aggregation of silica nanoparticles directed by adsorption of lysozyme ............... 93
6.1 Introduction ................................................................................................................. 93
6.2 Results ......................................................................................................................... 95
6.2.1 Characterization of silica nanoparticles ............................................................... 95
6.2.2 Lysozyme adsorption .......................................................................................... 96
6.2.3 pH effects at a constant protein-to-silica ratio ..................................................... 98
6.2.4 Characterization by analytical centrifuge .......................................................... 102
6.2.5 cryo-TEM study of flocculation ........................................................................ 104
6.2.6 SAXS study of flocculate .................................................................................. 105
6.2.7 Influence of polydispersity on the evaluation of S(q) ........................................ 110
6.3 Discussion ................................................................................................................. 111
6.3.1 Nature of adsorptive interaction ........................................................................ 111
6.3.2 Protein-induced aggregation .............................................................................. 112
6.3.3 Interparticle bonds and flocculate structure....................................................... 113
6.4 Conclusions ............................................................................................................... 116
7. Effect of pH and salinity on silica-lysozyme hetero-aggregation ......................... 121
7.1 Introduction ............................................................................................................... 121
7.2 Results ....................................................................................................................... 122
7.2.1 Adsorption isotherms ........................................................................................ 122
Introduction 3
7.2.2 pH driven lysozyme binding ............................................................................. 124
7.2.3 Aggregation of protein/silica core-shell composite........................................... 126
7.3 Discussion ................................................................................................................. 134
7.3.1 Role of electrostatic interactions ....................................................................... 135
7.3.2 Protein induced silica aggregation .................................................................... 135
7.3.3 Lysozyme/silica patchy particles ...................................................................... 137
7.4 Conclusions ............................................................................................................... 138
8. Protein–specific effects of binding to silica nanoparticles ................................... 143
8.1 Introduction ............................................................................................................... 143
8.2 Results ....................................................................................................................... 143
8.2.1 Characterization of proteins .............................................................................. 143
8.2.2 Protein-binding to silica surface ........................................................................ 145
8.2.3 Protein-induced silica aggregation .................................................................... 147
8.3 Discussion ................................................................................................................. 149
8.4 Conclusions ............................................................................................................... 151
9. Permanent supracolloidal biparticle assembly initiated by an electric field ......... 153
9.1 Introduction ............................................................................................................... 153
9.2 Methods ..................................................................................................................... 154
9.3 Results and discussion............................................................................................... 155
10. Summary and Outlook ....................................................................................... 165
10.1 Interaction between hydrophilic silica and a nonionic surfactant ............................. 165
10.2 Protein-nanoparticle interactions .............................................................................. 166
10.3 Supra-colloidal permanent assembly of microparticles ............................................ 168
A. Appendix ............................................................................................................... 171
A.1 Materials .................................................................................................................... 171
A.2 Mesoporous SBA-15 silica characterization ............................................................. 172
A.3 Permanent chaining: Characterizing the chains structures ........................................ 172
A.3.1 Numerical simulations ...................................................................................... 172
A.3.2 Radial distribution of particles .......................................................................... 173

Introduction 1
1. Introduction
1.1 Why study colloidal interactions?
Colloid science is known to the scientific community for 150 years since the pioneering
work of Thomas Graham in the 1860‟s. In terms of length scales, the colloidal regime is
roughly considered between 1 nm and 1000 nm.1 It covers the size range between
simple molecules and objects visible in a light microscope. In many cases a colloidal
system consists of two distinct phases: a dispersed phase (or internal phase) and
a continuous phase (or dispersion medium). Depending upon the form of dispersed
phase and dispersion medium, colloidal system can be solid in liquid, liquid in liquid,
liquid in gas, etc…
The interactions between colloidal particles play a vital role in colloidal stability
and lead to a wealth of important and interesting kind of dispersion behavior.2,3
Colloids
consisting of nano and micron sized particles play an important role in industrial
products like paints, varnishes, inks, cosmetics, etc.,4,5
and are also extensively involved
in food products6 , 7
and bio-medical applications8 - 10
like imaging,11
bacterial
detections,12
protein fibrillation,13
also as drug carriers.14
Large-scale structures (one-,
two-, or three- dimensional), assembled by colloidal particles as their building units
have found applications in many fields of modern technology, including infrared-
emitting nano crystals,15
surface coatings,16
single-nanowire light emitting diodes,17
single electron transistors18
and in microfluidic devices.19
Interactions of nano- and
micro-sized inorganic colloid particles of fixed shape (hard matter), as well as
interactions between hard and soft matter (surfactants, proteins and polymers) is of great
relevance in the field of nanotechnology and holds the key to the stability, fabrication
and properties of the nanomaterials. Hence, studying the interactions in the colloidal
domain is of importance not only for their bio-medical applications but also for the
improvement and betterment of many daily-use industrial products.
1.2 Interaction of nanoparticles with nonionic surfactants
Surfactant adsorption involves the transfer of amphiphilic molecules from bulk
solution to an interface. This transfer can cause drastic modifications in the
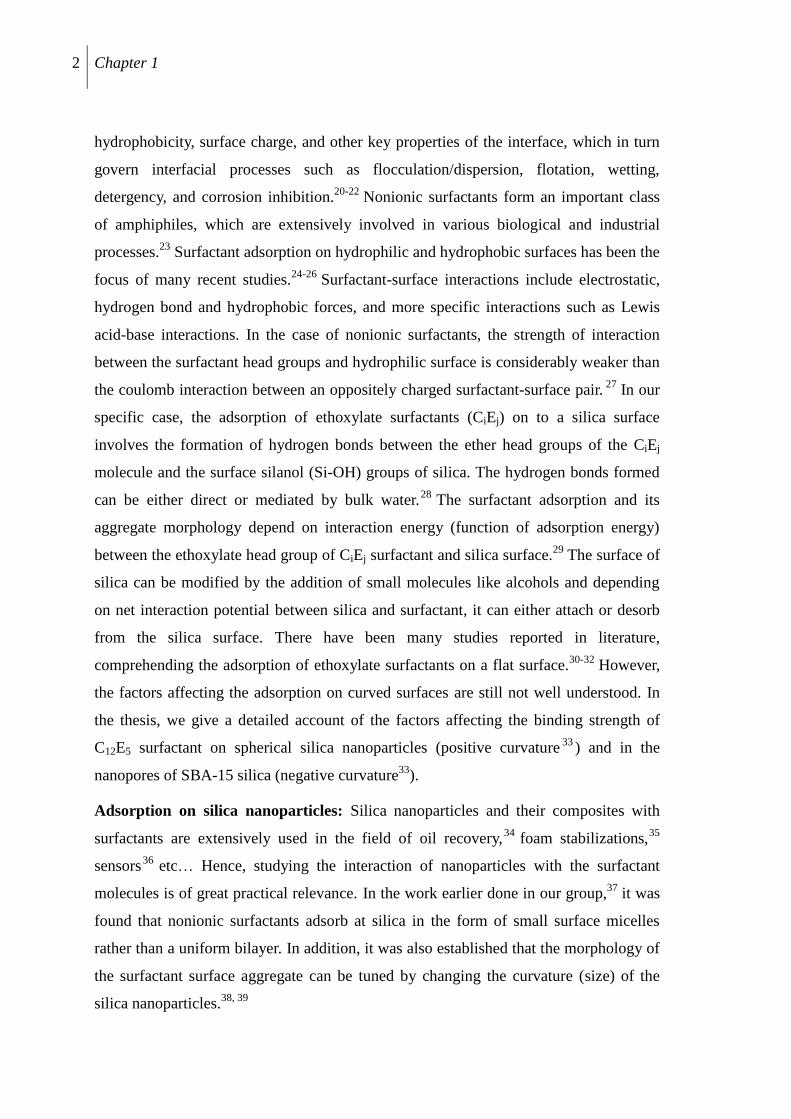
2 Chapter 1
hydrophobicity, surface charge, and other key properties of the interface, which in turn
govern interfacial processes such as flocculation/dispersion, flotation, wetting,
detergency, and corrosion inhibition.20-22
Nonionic surfactants form an important class
of amphiphiles, which are extensively involved in various biological and industrial
processes.23
Surfactant adsorption on hydrophilic and hydrophobic surfaces has been the
focus of many recent studies.24-26
Surfactant-surface interactions include electrostatic,
hydrogen bond and hydrophobic forces, and more specific interactions such as Lewis
acid-base interactions. In the case of nonionic surfactants, the strength of interaction
between the surfactant head groups and hydrophilic surface is considerably weaker than
the coulomb interaction between an oppositely charged surfactant-surface pair. 27
In our
specific case, the adsorption of ethoxylate surfactants (CiEj) on to a silica surface
involves the formation of hydrogen bonds between the ether head groups of the CiEj
molecule and the surface silanol (Si-OH) groups of silica. The hydrogen bonds formed
can be either direct or mediated by bulk water.28
The surfactant adsorption and its
aggregate morphology depend on interaction energy (function of adsorption energy)
between the ethoxylate head group of CiEj surfactant and silica surface.29
The surface of
silica can be modified by the addition of small molecules like alcohols and depending
on net interaction potential between silica and surfactant, it can either attach or desorb
from the silica surface. There have been many studies reported in literature,
comprehending the adsorption of ethoxylate surfactants on a flat surface.30-32
However,
the factors affecting the adsorption on curved surfaces are still not well understood. In
the thesis, we give a detailed account of the factors affecting the binding strength of
C12E5 surfactant on spherical silica nanoparticles (positive curvature33
) and in the
nanopores of SBA-15 silica (negative curvature33
).
Adsorption on silica nanoparticles: Silica nanoparticles and their composites with
surfactants are extensively used in the field of oil recovery,34
foam stabilizations,35
sensors36
etc… Hence, studying the interaction of nanoparticles with the surfactant
molecules is of great practical relevance. In the work earlier done in our group,37
it was
found that nonionic surfactants adsorb at silica in the form of small surface micelles
rather than a uniform bilayer. In addition, it was also established that the morphology of
the surfactant surface aggregate can be tuned by changing the curvature (size) of the
silica nanoparticles.38, 39
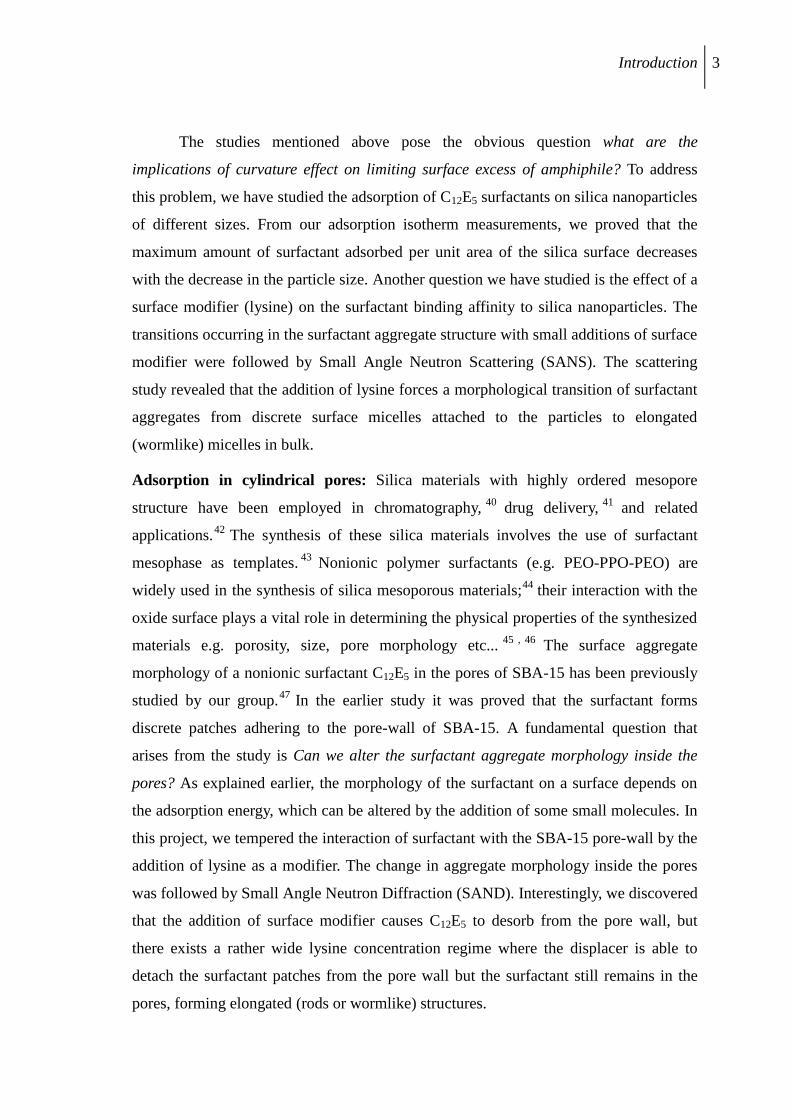
Introduction 3
The studies mentioned above pose the obvious question what are the
implications of curvature effect on limiting surface excess of amphiphile? To address
this problem, we have studied the adsorption of C12E5 surfactants on silica nanoparticles
of different sizes. From our adsorption isotherm measurements, we proved that the
maximum amount of surfactant adsorbed per unit area of the silica surface decreases
with the decrease in the particle size. Another question we have studied is the effect of a
surface modifier (lysine) on the surfactant binding affinity to silica nanoparticles. The
transitions occurring in the surfactant aggregate structure with small additions of surface
modifier were followed by Small Angle Neutron Scattering (SANS). The scattering
study revealed that the addition of lysine forces a morphological transition of surfactant
aggregates from discrete surface micelles attached to the particles to elongated
(wormlike) micelles in bulk.
Adsorption in cylindrical pores: Silica materials with highly ordered mesopore
structure have been employed in chromatography,40
drug delivery,41
and related
applications.42
The synthesis of these silica materials involves the use of surfactant
mesophase as templates.43
Nonionic polymer surfactants (e.g. PEO-PPO-PEO) are
widely used in the synthesis of silica mesoporous materials;44
their interaction with the
oxide surface plays a vital role in determining the physical properties of the synthesized
materials e.g. porosity, size, pore morphology etc...45 , 46
The surface aggregate
morphology of a nonionic surfactant C12E5 in the pores of SBA-15 has been previously
studied by our group.47
In the earlier study it was proved that the surfactant forms
discrete patches adhering to the pore-wall of SBA-15. A fundamental question that
arises from the study is Can we alter the surfactant aggregate morphology inside the
pores? As explained earlier, the morphology of the surfactant on a surface depends on
the adsorption energy, which can be altered by the addition of some small molecules. In
this project, we tempered the interaction of surfactant with the SBA-15 pore-wall by the
addition of lysine as a modifier. The change in aggregate morphology inside the pores
was followed by Small Angle Neutron Diffraction (SAND). Interestingly, we discovered
that the addition of surface modifier causes C12E5 to desorb from the pore wall, but
there exists a rather wide lysine concentration regime where the displacer is able to
detach the surfactant patches from the pore wall but the surfactant still remains in the
pores, forming elongated (rods or wormlike) structures.
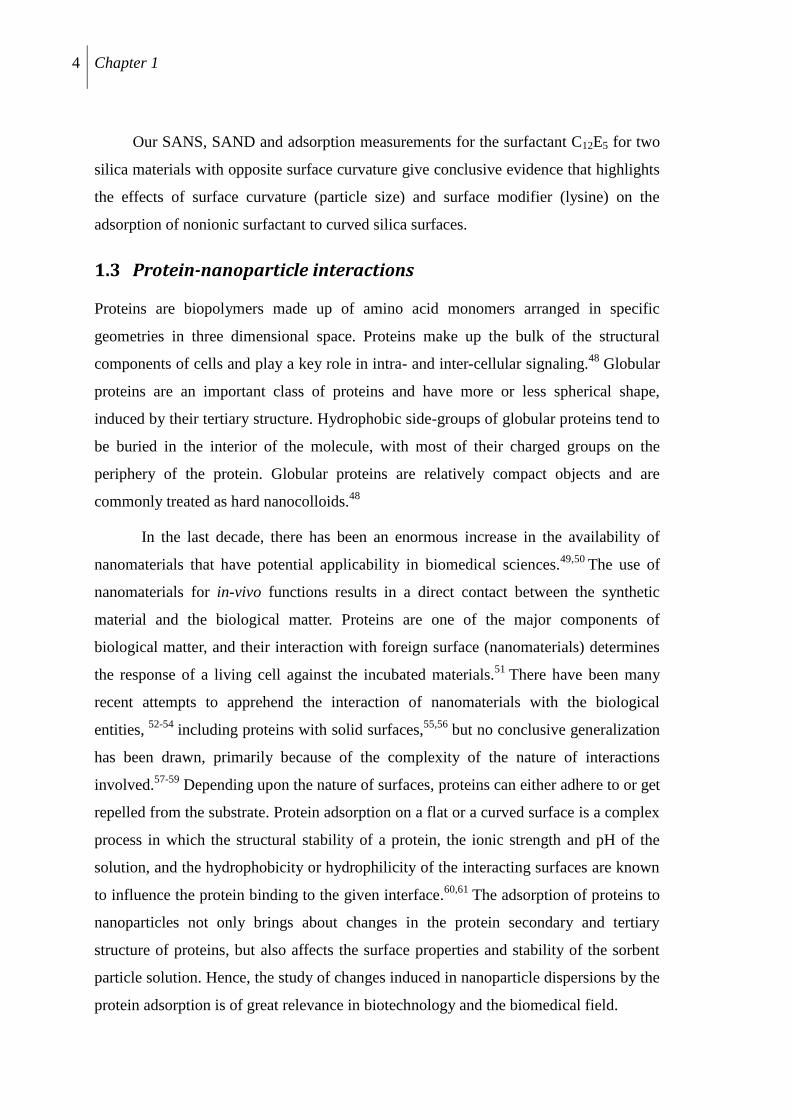
4 Chapter 1
Our SANS, SAND and adsorption measurements for the surfactant C12E5 for two
silica materials with opposite surface curvature give conclusive evidence that highlights
the effects of surface curvature (particle size) and surface modifier (lysine) on the
adsorption of nonionic surfactant to curved silica surfaces.
1.3 Protein-nanoparticle interactions
Proteins are biopolymers made up of amino acid monomers arranged in specific
geometries in three dimensional space. Proteins make up the bulk of the structural
components of cells and play a key role in intra- and inter-cellular signaling.48
Globular
proteins are an important class of proteins and have more or less spherical shape,
induced by their tertiary structure. Hydrophobic side-groups of globular proteins tend to
be buried in the interior of the molecule, with most of their charged groups on the
periphery of the protein. Globular proteins are relatively compact objects and are
commonly treated as hard nanocolloids.48
In the last decade, there has been an enormous increase in the availability of
nanomaterials that have potential applicability in biomedical sciences.49,50
The use of
nanomaterials for in-vivo functions results in a direct contact between the synthetic
material and the biological matter. Proteins are one of the major components of
biological matter, and their interaction with foreign surface (nanomaterials) determines
the response of a living cell against the incubated materials.51
There have been many
recent attempts to apprehend the interaction of nanomaterials with the biological
entities, 52-54
including proteins with solid surfaces,55,56
but no conclusive generalization
has been drawn, primarily because of the complexity of the nature of interactions
involved.57-59
Depending upon the nature of surfaces, proteins can either adhere to or get
repelled from the substrate. Protein adsorption on a flat or a curved surface is a complex
process in which the structural stability of a protein, the ionic strength and pH of the
solution, and the hydrophobicity or hydrophilicity of the interacting surfaces are known
to influence the protein binding to the given interface.60,61
The adsorption of proteins to
nanoparticles not only brings about changes in the protein secondary and tertiary
structure of proteins, but also affects the surface properties and stability of the sorbent
particle solution. Hence, the study of changes induced in nanoparticle dispersions by the
protein adsorption is of great relevance in biotechnology and the biomedical field.
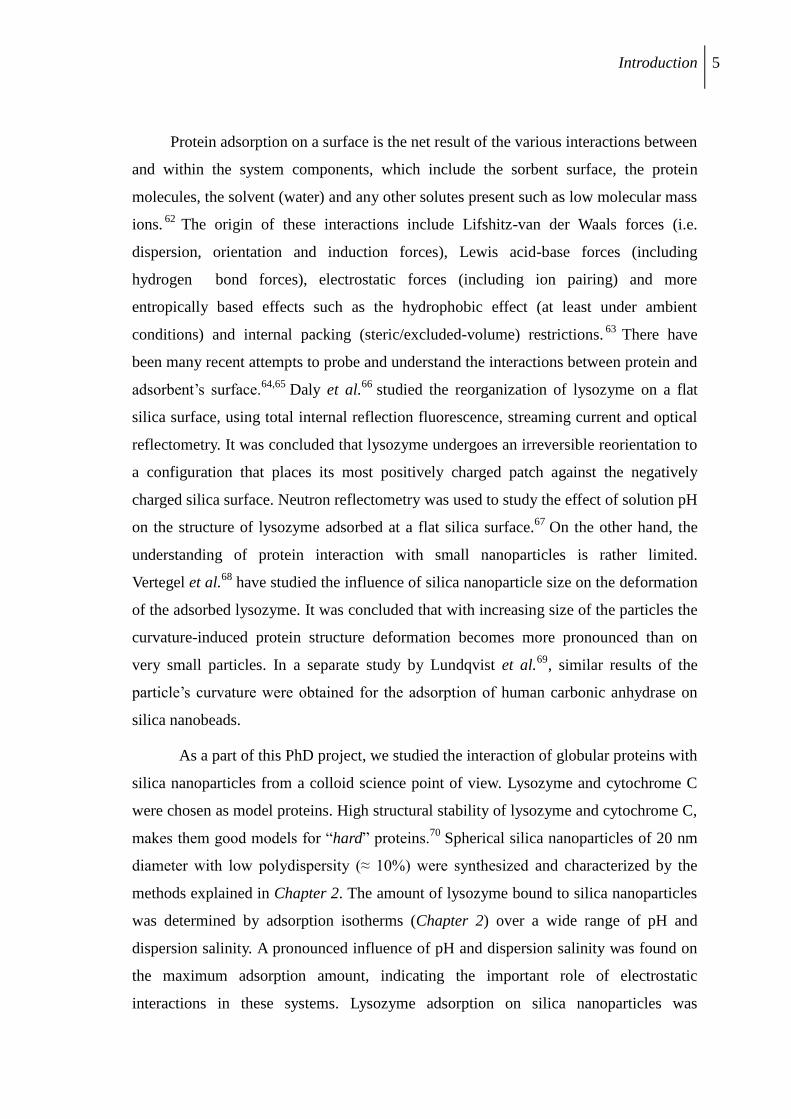
Introduction 5
Protein adsorption on a surface is the net result of the various interactions between
and within the system components, which include the sorbent surface, the protein
molecules, the solvent (water) and any other solutes present such as low molecular mass
ions.62
The origin of these interactions include Lifshitz-van der Waals forces (i.e.
dispersion, orientation and induction forces), Lewis acid-base forces (including
hydrogen bond forces), electrostatic forces (including ion pairing) and more
entropically based effects such as the hydrophobic effect (at least under ambient
conditions) and internal packing (steric/excluded-volume) restrictions.63
There have
been many recent attempts to probe and understand the interactions between protein and
adsorbent‟s surface.64,65
Daly et al.66
studied the reorganization of lysozyme on a flat
silica surface, using total internal reflection fluorescence, streaming current and optical
reflectometry. It was concluded that lysozyme undergoes an irreversible reorientation to
a configuration that places its most positively charged patch against the negatively
charged silica surface. Neutron reflectometry was used to study the effect of solution pH
on the structure of lysozyme adsorbed at a flat silica surface.67
On the other hand, the
understanding of protein interaction with small nanoparticles is rather limited.
Vertegel et al.68
have studied the influence of silica nanoparticle size on the deformation
of the adsorbed lysozyme. It was concluded that with increasing size of the particles the
curvature-induced protein structure deformation becomes more pronounced than on
very small particles. In a separate study by Lundqvist et al.69
, similar results of the
particle‟s curvature were obtained for the adsorption of human carbonic anhydrase on
silica nanobeads.
As a part of this PhD project, we studied the interaction of globular proteins with
silica nanoparticles from a colloid science point of view. Lysozyme and cytochrome C
were chosen as model proteins. High structural stability of lysozyme and cytochrome C,
makes them good models for “hard” proteins.70
Spherical silica nanoparticles of 20 nm
diameter with low polydispersity (≈ 10%) were synthesized and characterized by the
methods explained in Chapter 2. The amount of lysozyme bound to silica nanoparticles
was determined by adsorption isotherms (Chapter 2) over a wide range of pH and
dispersion salinity. A pronounced influence of pH and dispersion salinity was found on
the maximum adsorption amount, indicating the important role of electrostatic
interactions in these systems. Lysozyme adsorption on silica nanoparticles was
6 Chapter 1
accompanied by a protein-induced aggregation of silica nanoparticles. This aggregation
was observed to be completely reversible with pH. A combination of analytical
centrifugation, cryo-TEM and Small Angle X-ray Scattering (SAXS) was used to
characterize the properties and structure of the hetero-aggregate over the pH range from
the Iso-Electric Point (IEP) of the silica to the IEP of lysozyme. The aggregation
behavior was also studied for a similar globular protein cytochrome C. SAXS and
turbidity measurements of silica-cytochrome C composites at different pH show the
different aggregation pH regimes. We propose that the observed differences are due to a
more unsymmetrical distribution of surface charge on cytochrome C in comparison to
lysozyme.
1.4 Supra-colloidal permanent assembly of microparticles
As discussed in the section 1.3, silica nanoparticles were observed to form
hetero-aggregates with oppositely charged proteins. This hetero-aggregation was
non-directional and essentially random. Although the pH of the dispersion does allow
some control over the aggregate morphology, a direct tuning of the aggregate structure
was not possible in the protein/silica systems. Based on our protein-particle aggregation
studies, the question arises How it may be possible to control the morphology of a
biparticle system exhibiting strongly attractive interaction, i.e. to assemble an
aggregating pair of positive and negative particles into long-range ordered arrays. To
address this question, the effect of an external electric field on the hetero-aggregation of
latex microspheres was studied in collaboration with Prof. O. D. Velev. Micrometer
sized particles were used in order to simplify the experimental characterization of the
system.
Assembling colloidal particles is an active and challenging field of materials
science. In the past decade, there have been a number of studies focusing on patterning
of colloidal particles,71
primarily because of their potential applications in surface-
coatings,72
nano-electronic devices,73
nanofluidic sieves74
etc… Assembled linear
structures of microparticles have been studied extensively in view of their potential
application in microcircuits. 75
One of the most widely used methods for drawing micro
particles to linear chains is through the application of external fields (electric or
magnetic).76
In the presence of external alternating electric field, dielectric particles
Introduction 7
(e.g. latex) tend to align into chain structures along the direction of applied field. This
phenomenon is called Dielectrophoresis (DEP). 77
In the presence of electric field, each
dielectric particle has a net induced dipole moment and because of the dipole-dipole
interaction between the particles, long range, highly ordered structures can be formed
(for details see Chapter 3 and 9). DEP-induced structures formed by equally charged
particles are temporary and last only as long as external field is applied. The structure
completely disintegrates upon removing the external field, primarily because of the
surface charge-charge repulsion between the particles.
In order to exploit the field-induced chain formation for harvesting permanent
chain structures, particles should remain assembled even after the external electric field
is switched off. For achieving such „everlasting‟ chain structures, we used a bi-particle
system, i.e. a dispersion of two types of colloidal particles having opposite surface
charges. By replacing equally charged with oppositely charged micro-particles, we
introduce a short-range strongly attractive potential between the particles. DEP is then
used to drag the particles near the surface contact point, where the strong attractive
electrostatic potential glues the particles together (i.e. forms hetero-aggregate) and the
structures formed survive when the electric field is switched off.
In addition to developing a novel experimental technique for synthesizing such
permanent structures, we developed a theoretical approach based on a statistical model
that predicts the chain length distribution for a given size ratio and number ratio of the
positive and negative particles. On further development of this model and experimental
technique, it should be possible to tune the chain length depending on the requirement
of any industrial or biochemical process.
1.5 Overview
As outlined above, the focus of this PhD project was to accomplish a better
understanding of the interaction phenomena of colloidal particles with soft matter. From
a colloidal science point of view, many aspects of these interactions depend on surface
curvature (particle size) and surface chemistry (surface energy and charge). Dispersions
of silica nanoparticles were used as model systems for studying the effect of surface
curvature (particle size) and surface energy on the adsorption of nonionic ethoxylate
surfactant C12E5. On the other hand, surface charge on silica nanoparticle surface as
8 Chapter 1
well as the net charge of protein molecules are premium factors in controlling protein
adsorption at nanoparticles and protein-induced nanoparticle aggregation.
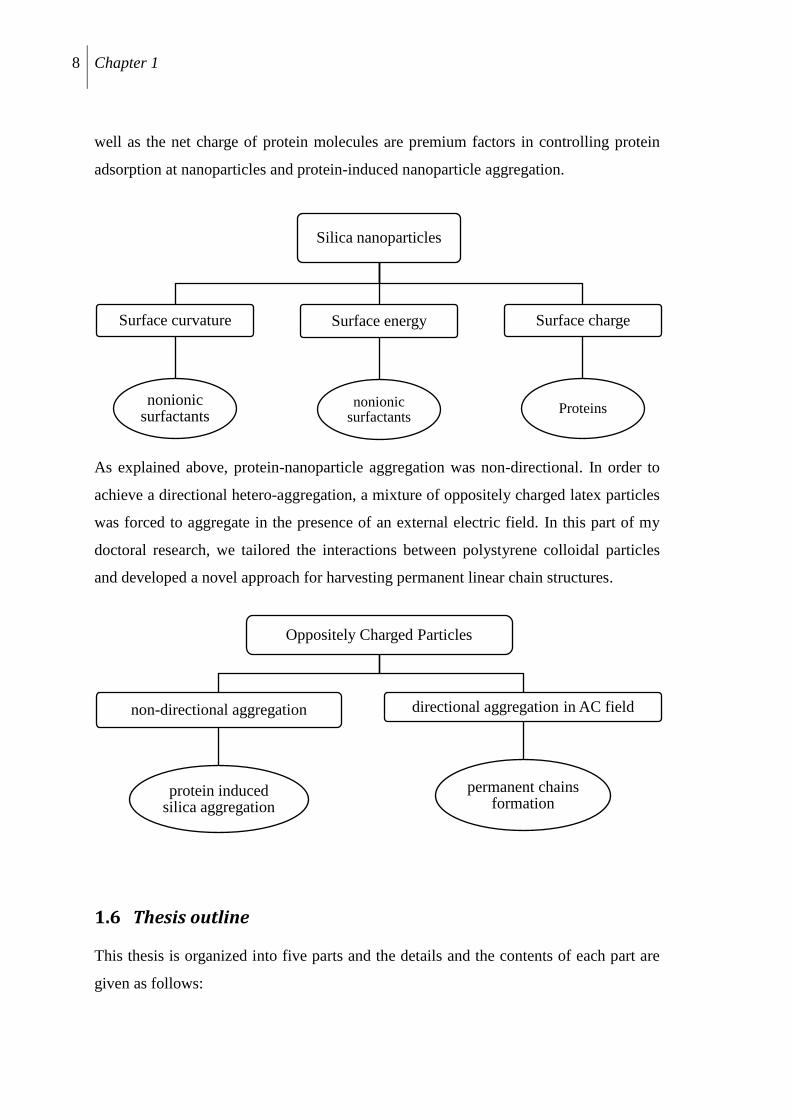
As explained above, protein-nanoparticle aggregation was non-directional. In order to
achieve a directional hetero-aggregation, a mixture of oppositely charged latex particles
was forced to aggregate in the presence of an external electric field. In this part of my
doctoral research, we tailored the interactions between polystyrene colloidal particles
and developed a novel approach for harvesting permanent linear chain structures.
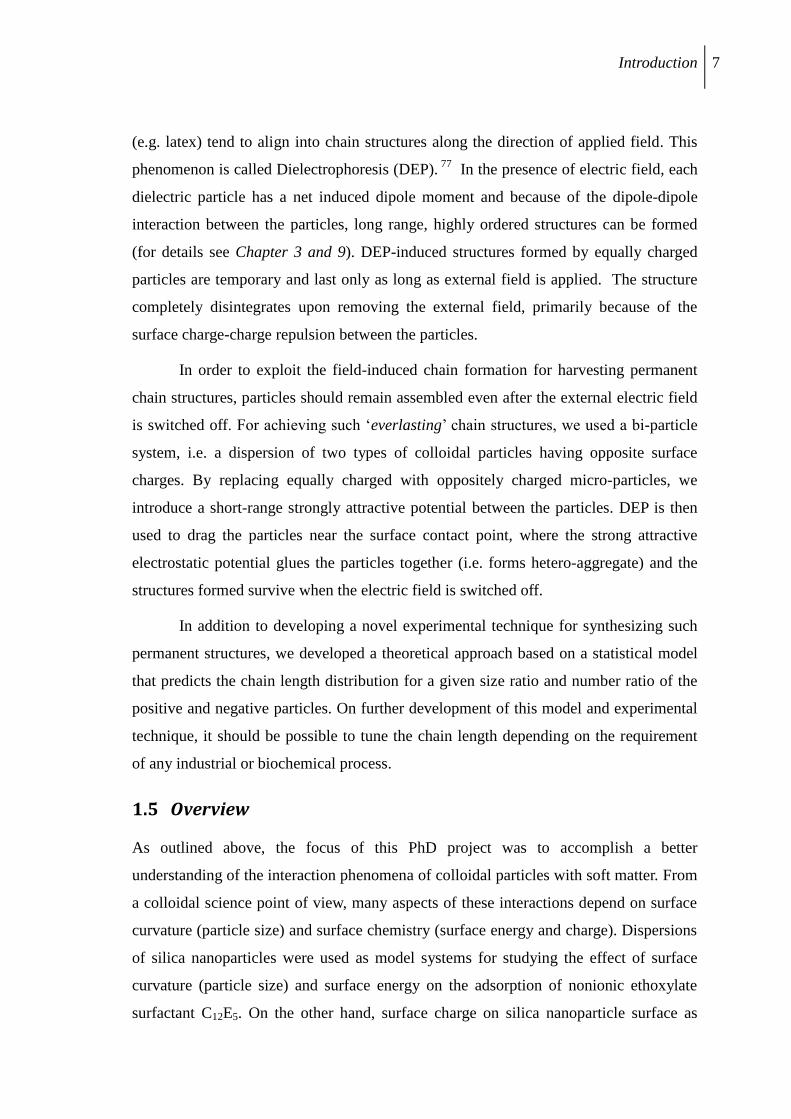
1.6 Thesis outline
This thesis is organized into five parts and the details and the contents of each part are
given as follows:
Silica nanoparticles
Surface curvature
nonionic surfactants
Surface energy
nonionic surfactants
Surface charge
Proteins
Oppositely Charged Particles
non-directional aggregation
protein induced silica aggregation
directional aggregation in AC field
permanent chains formation
Introduction 9
Part-I: Introduction and basics
After this general introduction to the subject area and the systems studied (Chapter 1),
the main experimental methods used for studying the system, including the
measurement of adsorption isotherms, small angle scattering and diffraction, are
summarized in Chapter 2. A detailed account of the analysis of the scattering data and
the theory behind it is given in Chapter 3. This chapter also explains the basics of
particle chaining in an AC-electric field due to dielectrophoresis (DEP), and provides a
detailed account of the statistical approach for predicting the length of permanent chain
structure developed in this work.
Part-II: Curvature and surface energy effects on the interaction of hydrophilic
silica with a nonionic surfactant
In Chapter 4, we present the results of adsorption and SANS measurements aimed to
study the effect of particle size and surface modification of silica nanoparticles on the
self-assembly of surfactant C12E5. Chapter 5 deals with the complementary situation of
the self-assembly of the surfactant in cylindrical nanopores of SBA-15 silica and the
effects of a surface modifier on the binding tendency of the C12E5 surfactant to the
pore-walls are also presented.
Part–III: Adsorptive and aggregative effects of proteins on silica nanoparticles
Part III of the thesis presents the studies of the interactions between silica nanoparticles
(20 nm) with two globular proteins, cytochrome C and lysozyme. Chapter 6 deals with
the effects of pH on the adsorption of lysozyme to silica nanoparticles and the
protein-induced aggregation of the silica particles. In direct continuation to these
studies, Chapter 7, focuses on the effect of ionic strength on the adsorption and the
concomitant aggregation of the protein/silica system. Chapter 8 highlights the
differences in the aggregation induced behavior observed for lysozyme and
cytochrome C with silica.
Part-IV: Field directed assembly of hetero-aggregating structures
Part IV of the thesis reports the results of the studies performed in the lab of Prof. Velev
at North Carolina State University concerning the formation of permanent long chains
made up of positive and negatively charged latex particles. In Chapter 9 we demonstrate
10 Chapter 1
how the heteroaggregation phenomenon and DEP can be combined to assemble
permanent linear structures. We provide a complete characterization of the chains
formed for two different particle size ratios and different number ratios of the positive
and negative particles. We also present an analysis of the data according to a new
statistical model.
Part –V: Summary and Outlook
To conclude, a short summary of the work is given which indicates how the different
projects studied address and contribute to the better understanding of the colloidal
interactions. We also propose an outlook of the projects to highlight the possible
extension and applications of the already studied projects.
References
1 Levine, I. N., “Physical Chemistry”, 2001, 5, Tata McGraw-Hill, USA.
2 Martínez, A. G., Barbosa, S., Santos, I. P., Marzán, L. M. L., Curr. Opin. Colloid
Interface Sci., 2011, 16, 118.
3 Henglein, A., Chem. Rev., 1989, 89, 1861.
4 Coelho, M. C., Torrao, E. N., Grácio, J., J. Nanosci. Nanotechnol., 2012, 12, 1.
5 Lu, A. H., Salabas, E. L., Schüth, F., Angew. Chemie Int. Ed., 2007, 46, 1222.
6 Weiss, J., Takhistov, P., McClements, J., J. Food Sci., 2006, 71, R107.
7 Mao, Y., McClements, D. J., Food Chem., 2012, 134, 872.
8 Liu, G. Y., Wang, J. M., Xia, Q., Eur. Food Res. Technol., 2012, 234, 391.
9 Patel, A., Velikov, K. P., LWT-Food Sci. Technol., 2011, 44, 1958.
10 Osaka, T., Matsunga, T., Nakanishi, T., Arakaki, A., Niwa, D., Iida, H., Anal.
Bionanal. Chem., 2006, 384, 593.
11 Xiong, H. M., Xu, Y., Ren, Q. G., Xia, Y. Y., J. Am. Chem. Soc., 2008, 130, 7522.
12 Gao, J., Gu, H., Xu, B., Acc. Chem. Res., 2009, 42, 1097.
Introduction 11
13 Colvin, V. L., Kulinowski, K. M., Proc. Natl. Acad. Sci., 2007, 104, 8679.
14 Farokhzad , O. C., Langer, R., ACS Nano, 2009, 3, 16.
15 Rogach, A. L., Eychmüller, A., Hickey, S. G., Kershaw, S. V., Small, 2007, 4, 536.
16 Prevo, B. G., Hon, E. W., Velev, O. D., J. Mater. Chem., 2007, 17,791.
17 Gudiksen, M. S., Lauhon, L. J., Wang, J., Smith, D. C. Lieber, C. M., Nature, 2002,
415, 617.
18 Thelander, C. Mårtensson, T., Björk, M. T., Ohlsson, B. J., Larsson, M. W.,
Wallenberg, L. R., Samuelson, L., Appl. Phys. Lett., 2003, 83, 2052.
19 Terray, A., Oakey, J., Marr, D. W. M., Appl. Phys. Lett., 2002, 81, 1555.
20 Zhang, R., Somasundaran, P., Adv. Colloid Interface Sci., 2006, 123-126, 213.
21 Xiao, L., Xu, G. Y., Zhang, Z. Q., Wang, Y. B, Li, G. Z., Colloids Surf. A, 2003, 224,
199.
22 Holmberg, K., Shah, D. O., Schwuger, M. J., “Handbook of Applied Surface and
Colloid Chemistry” 2002, John Wiley, New York.
23 Jiao, J., Adv. Drug Deliver. Rev., 2008, 15, 1663.
24 Soria-Sánchez, M., Maroto-Valiente, A., Guerreo-Ruiz, A., Nevskaia, D. M., J.
Colloid Interface Sci., 2010, 343, 194.
25 Hunter, N., Wanless, E. J., Jameson, G. J., Pugh, R., J., Colloids Surf. A, 2009, 347,
81.
26 Griffith, J. C., Alexander, A.E., J. Colloid Interface Sci., 1967, 25, 311.
27 Somasundaran, P., Krishnakumar, S., Colloids Surf. A, 1997, 123-124, 491.
28 Trens, P., Denoyel, R., Langmuir, 1993, 9, 519.
29 Levitz, P., Damme, H. V., J. Phys. Chem., 1986, 90, 1302.
30 Tiberg, F., J. Chem. Soc., Faraday Trans., 1996, 92, 531.
12 Chapter 1
31 Penfold, J., Staples, E., Tucker, I., Langmuir, 2002, 18, 2967.
32 Grant, L. M., Tiberg, F., Ducker, W. A., J. Phys. Chem. B, 1998, 102, 4288.
33 Ouyang, G., Wang, X., Yang, G. W., Chem. Rev., 2009, 109, 4221.
34 Le, N. Y. T., Pham, D. K., Le, K. H., Nguyen, P. T., Adv. Nat. Sci. : Nanosci.
Nanotechnol., 2011, 2, 035013.
35 Dickinson, E., Ettelaie, R., Kostakis, T., Murray, B. S., Langmuir, 2004, 20, 8517.
36 Latterini, L., Amelia, M., Langmuir, 2009, 25, 4767.
37 Lugo, D. M., “Adsorption of surfactants on colloidal silica: Effects of surface
curvature on the structure of surface aggregates”, 2010, Ph.D. Thesis, Technische
Universität, Berlin, Germany.
38 Lugo, D. M. , Oberdisse, J., Karg, M., Schweins, R., Findenegg, G. H., Soft Matter,
2009, 5, 2928.
39 Lugo, D. M., Oberdisse, J., Lapp, A., Findenegg, G. H., J. Phys. Chem. B, 2010, 114,
4183.
40 Gallis, K. W., Araujo, J. T., Duff, K. J., Moore, J. G., Landry, C. C., Adv. Mater.,
1999, 17, 1452.
41 Chen, J. F., Ding, H. M., Wang, J. X., Shao, L., Biomaterials, 2004, 25, 723.
42 Slowing, I. I., Escoto, J. L. V., Wu, C. W., Lin, V. S. Y., Adv. Drug Delivery Rev.,
2008, 60, 1278.
43 Huo, Q., Margolese, D. I., Stucy, G. D., Chem. Mater., 1996, 8, 1147.
44 Bagshaw, S. A., Prouzet, E., Pinnavaia, T. J., Science, 1995, 269, 1242.
45 Kuang, D., Brezesinski, T., Smarsly, B., J. Am. Chem. Soc., 2004, 126, 10534.
46 Wan, Y., Shi, Y., Zhao, D., Chem. Commun., 2007, 9, 897
Introduction 13
47 Shin, T. G., “The self-assembly of surfactants in ordered mesoporous silica studied by
neutron scattering”, 2010, Ph.D. Thesis, Technische Universität, Berlin, Germany.
48 Poon, W. C. K., “Soft Condensed Matter Physics in Molecular and Cell Biology”,
2006, Taylor & Francis Group, USA.
49 De, M., Ghosh, P. S., Rotello, V. M., Adv. Mater., 2008, 20, 4225.
50 Sarikaya, M., Tamerler, C., Jen, A. K. Y., Schulten, K., Baneyx, F., Nature Mater.,
2003, 2, 577.
51 Lynch, I., Salvati, A., Kenneth, D. A., Nature Nanotechnol., 2009, 4, 546.
52 Niemeyer, C. M., Angew. Chem. Int. Ed., 2001, 40, 4129.
53 Cedervall, T., Lynch, I., Lindman, S., Berggard, T., Thulin, E., Nilsson, H., Dawson,
K. A., Linse, S., Proc. Natl. Acad. Sci., 2007, 104, 2050.
54 Verma, A., Stellacci, F., Small, 2010, 6, 12.
55 Cohavi, O., Corni, S., Rienzo, R. D., Felice, R. D., Gottschalk, K. E., Hoefling, M.,
Kokh, D., Molinari, E., Schreiber, G, Vaskevich, A., Wade, R. C., J. Mol. Recognit.,
2010, 23, 259.
56 Rabe, M., Verdes, D., Seeger, S., Adv. Colloid Interface Sci., 2011, 162, 87.
57 Lynch. I., Dawson, K. A., Nano Today, 2008, 3, 40.
58 Klein, J., Proc. Natl. Acad. Sci., 2007, 104, 2029
59 Li, N., Zeng, S., He, L., Zhong, W., Anal. Chem., 2010, 82, 7460.
60 Pasche, S., Vörös, J., Griesser, H. J., Spencer, N. D., Textor, M., J. Phys. Chem. B,
2005, 109, 17545.
61 Haynes, C. A., Norde, W., Colloids Surf. B, 1994, 2, 517.
62 Norde, W., Lyklema, J., J. Colloid Interface Sci., 1975, 66, 295.
63 Haynes, C. A., Norde, W., Colloid Surf. B, 1994, 2, 517.
14 Chapter 1
64 Roach, P., Farrar, D., Perry, C. C., J. Am. Chem. Soc., 2004, 127, 8168.
65 Monopoli, M. P., Walczyk, D., Campbell, A., Elia, G., Lynch, I., Bombelli, F. B.,
Dawson, K. A., J. Am. Chem. Soc., 2011, 133, 2525.
66 Daly, S. M., Przybycien, T. M., Tilton, R. D., Langmuir, 2003, 19, 3848.
67 Su, T. J., Lu, J. R., Thomas, R. K., Cui, Z. F., Penfold, J., Langmuir, 1998, 14, 438.
68 Vertegel, A. A., Siegel, R. W., Dordick, J. S., Langmuir, 2004, 20, 6800.
69 Lundqvist, M., Sethson, I., Jonsson, B. H., Langmuir, 2004, 20, 10639.
70 Norde, W., Favier, J. P., Colloid Surface, 1992, 64, 87.
71 Vutukuri, H. R., Stiefelhagen, J., Vissers, T., Imhof, A., van Blaaderen, A., Adv.
Mater., 2012, 24, 412.
72 Prevo, B. G., Hon, E. W., Velev, O. D., J. Mater. Chem., 2007, 17, 791.
73 Vanmaekelbergh, D., Nano Today, 2011, 6, 419.
74 Zeng, Y., Harrison, D. J., Anal. Chem., 2007, 79, 2289.
75 Hermanson, K. D., Lumsdon, S. O., Williams, J. P., Kaler, E. K., Velev, O. D.,
Science, 2001, 294, 1082.
76 Velev, O. D., Gupta, S., Adv. Mater., 2009, 21, 1897.
77 Velev, O. D., Bhatt, K. H., Soft Matter, 2006, 2, 738.
Methods 15
2. Methods
2.1 Synthesis and characterization of silica nanoparticles
2.1.1 Synthesis
Silica nanoparticles of diameter 12, 21 and 42 nm were prepared by the hydrolysis of
tetraethyl orthosilicate Si(OC2H5)4 (TEOS) with water. The reaction taking place is a
sol-gel process and is shown below:
Si(OC2H5)4 + 2 H2O → SiO2 + 4 C2H5OH
The reaction proceeds by hydrolysis of TEOS to Si(OH)4 and a series of
condensation reactions that convert the orthosilicic acid into a mineral-like solid via
the formation of Si-O-Si linkages.1
Reaction was carried out in the presence of the
basic amino acid lysine as reported by Davis et al.2 and Thomassen et al.
3 In a typical
synthesis 0.51 g of lysine monohydrate was dissolved in 102 mL milli-Q water in a
250 mL round bottom flask (RB). After equilibration at 60°C for 1 hour, 16 mL of
TEOS was added dropwise and the reaction mixture was kept in the reaction vessel
at an optimized temperature and stirring rate. The resulting silica dispersion was
dialyzed to remove unreacted TEOS and reaction by-products, using dialysis
membranes with a molecular-weight cut-off at 14 kDa. Dialysis was carried for
1 week with changing of milli-Q water twice per day. Bigger aggregates of silica
formed during the reaction were removed from the dialyzed dispersion by a series of
filtration steps. Filtration was done with 5 µm followed by 0.8 µm and eventually
using 0.22 µm filters. In order to avoid aggregation of silica, pH was adjusted to ≃ 9
and the dispersion was stored at 8°C. The particle size was tuned solely by
optimizing the stirring speed and the adjustment of the temperature of the reaction
mixture. Since the different sizes of silica nanoparticles were prepared by altering
only the physical conditions, the surface chemistry (surface charge density)
presumably remains unaltered. The resulting silica nanoparticles were characterized
for their size and polydispersity by Small Angle X-ray Scattering (SAXS), for their
surface charge by zeta potential and for their specific surface area by nitrogen
adsorption.
16 Chapter 2
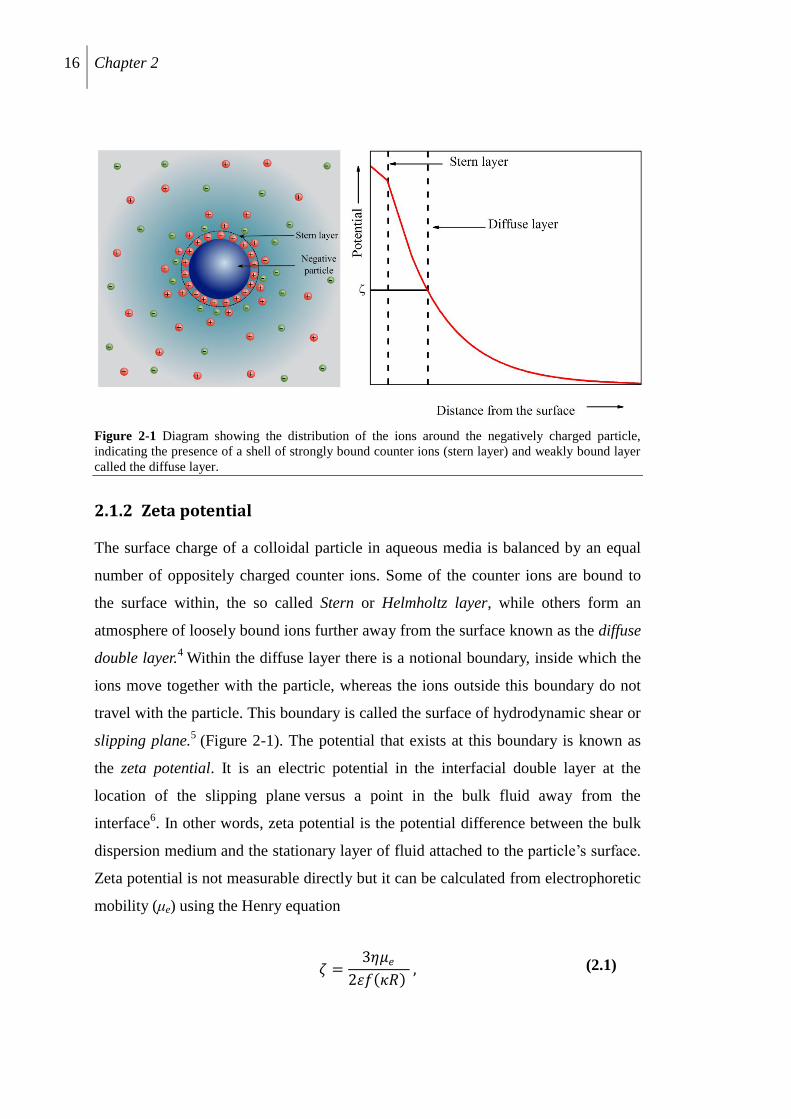
Figure 2-1 Diagram showing the distribution of the ions around the negatively charged particle,
indicating the presence of a shell of strongly bound counter ions (stern layer) and weakly bound layer
called the diffuse layer.
2.1.2 Zeta potential
The surface charge of a colloidal particle in aqueous media is balanced by an equal
number of oppositely charged counter ions. Some of the counter ions are bound to
the surface within, the so called Stern or Helmholtz layer, while others form an
atmosphere of loosely bound ions further away from the surface known as the diffuse
double layer.4 Within the diffuse layer there is a notional boundary, inside which the
ions move together with the particle, whereas the ions outside this boundary do not
travel with the particle. This boundary is called the surface of hydrodynamic shear or
slipping plane.5 (Figure 2-1). The potential that exists at this boundary is known as
the zeta potential. It is an electric potential in the interfacial double layer at the
location of the slipping plane versus a point in the bulk fluid away from the
interface6. In other words, zeta potential is the potential difference between the bulk
dispersion medium and the stationary layer of fluid attached to the particle‟s surface.
Zeta potential is not measurable directly but it can be calculated from electrophoretic
mobility (μe) using the Henry equation
휁 =3휂𝜇𝑒
2휀𝑓 𝜅𝑅 , (2.1)
Methods 17
where ζ is the zeta potential of the particle with radius R, η and ε are the viscosity
and dielectric constant of the medium respectively and f(κR) is called the Henry‟s
function. The Henry‟s function depends on particle size and the ionic strength of the
dispersion via the Debye length (1/κ)
1𝜅 =
휀0 휀 𝑘𝐵𝑇
2𝑁𝐴𝑒2𝐼 (2.2)
where ε0 is the permittivity of free space, ε is the Dielectric constant, kB is Boltzmann
constant; T is the temperature in K, NA being the Avogadro number, e is the
elementary electronic charge and I is the ionic strength of the dispersion.
The electrophoretic mobility of a particle can be determined by the application
of an electric field across the dispersion. The charged particles suspended in the
electrolyte are attracted towards the electrode of opposite charge. Viscous forces
acting on the particles tend to oppose this movement. When a steady velocity v, is
reached, the electrophoretic mobility is given by μe=v/E, where E is the electric field
strength. The Henry‟s function f(κR) acquires the value of 1.5 in the limit κR >> 1,
i.e. large particles and high ionic strength (Smoluchowski approximation), whereas
f(κR) =1 in the limit κR << 1, i.e. small particles in low ionic strength media (Hückel
approximation). Measurements of the electrophoretic mobility were carried out with
a Zetasizer Nano ZS (Malvern Instruments, UK) operating with a 4mW HeNe laser
(633nm) and a light scattering detector positioned at 90° and a temperature control
jacket for the cuvette. The sample was equilibrated for 2 minutes at 25°C before
starting the measurements. Three measurements, each consisting of 30 runs were
performed for each sample, and an average of the measurements was used for further
reference.
2.1.3 Nitrogen adsorption
The surface area of the nanoparticles was determined by nitrogen adsorption at 77 K.
The adsorption isotherm was then interpreted on the basis of BET model of
multilayer gas adsorption.7
The surface of a solid is regarded as an array of
equivalent adsorption sites. As in Langmuir model of monolayer adsorption, each of
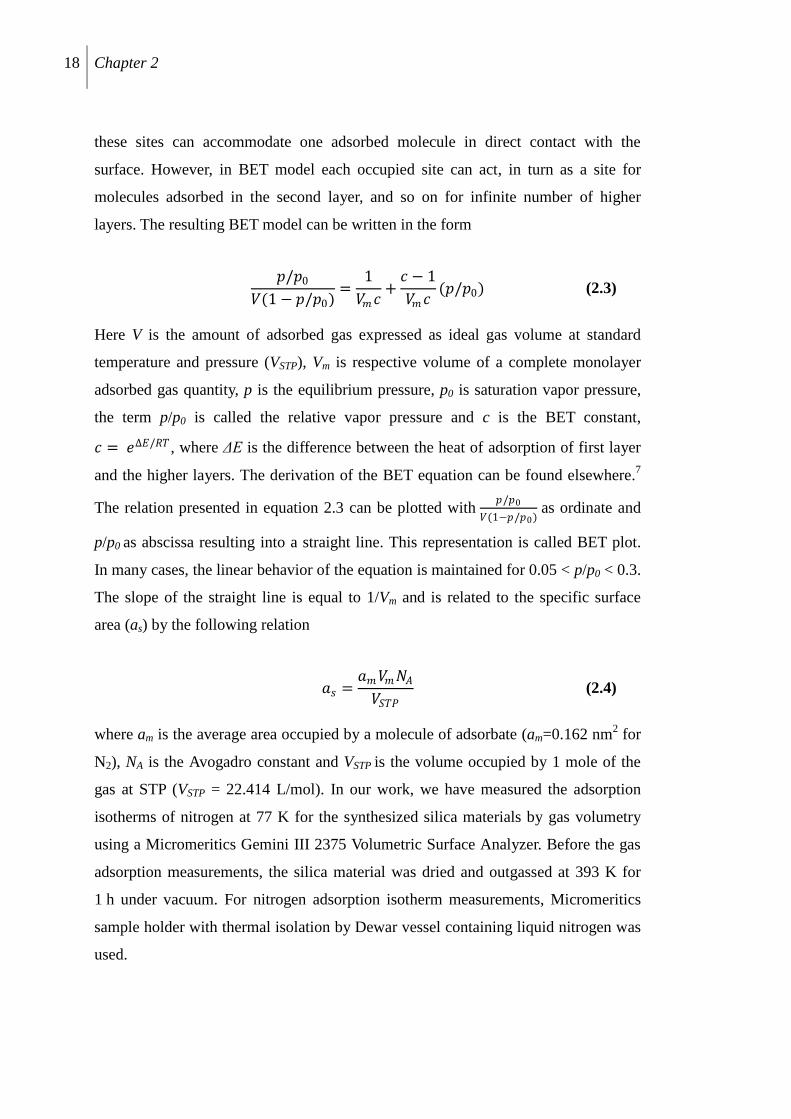
18 Chapter 2
these sites can accommodate one adsorbed molecule in direct contact with the
surface. However, in BET model each occupied site can act, in turn as a site for
molecules adsorbed in the second layer, and so on for infinite number of higher
layers. The resulting BET model can be written in the form
𝑝/𝑝0
𝑉(1 − 𝑝/𝑝0)=
1
𝑉𝑚𝑐+
𝑐 − 1
𝑉𝑚𝑐(𝑝/𝑝0) (2.3)
Here V is the amount of adsorbed gas expressed as ideal gas volume at standard
temperature and pressure (VSTP), Vm is respective volume of a complete monolayer
adsorbed gas quantity, p is the equilibrium pressure, p0 is saturation vapor pressure,
the term p/p0 is called the relative vapor pressure and c is the BET constant,
𝑐 = 𝑒∆𝐸/𝑅𝑇 , where ΔE is the difference between the heat of adsorption of first layer
and the higher layers. The derivation of the BET equation can be found elsewhere.7
The relation presented in equation 2.3 can be plotted with 𝑝/𝑝0
𝑉(1−𝑝/𝑝0) as ordinate and
p/p0 as abscissa resulting into a straight line. This representation is called BET plot.
In many cases, the linear behavior of the equation is maintained for 0.05 < p/p0 < 0.3.
The slope of the straight line is equal to 1/Vm and is related to the specific surface
area (as) by the following relation
𝑎𝑠 =𝑎𝑚𝑉𝑚𝑁𝐴
𝑉𝑆𝑇𝑃 (2.4)
where am is the average area occupied by a molecule of adsorbate (am=0.162 nm2 for
N2), NA is the Avogadro constant and VSTP is the volume occupied by 1 mole of the
gas at STP (VSTP = 22.414 L/mol). In our work, we have measured the adsorption
isotherms of nitrogen at 77 K for the synthesized silica materials by gas volumetry
using a Micromeritics Gemini III 2375 Volumetric Surface Analyzer. Before the gas
adsorption measurements, the silica material was dried and outgassed at 393 K for
1 h under vacuum. For nitrogen adsorption isotherm measurements, Micromeritics
sample holder with thermal isolation by Dewar vessel containing liquid nitrogen was
used.
Methods 19
2.2 Adsorption at solid/liquid interface
Adsorption phenomena take place whenever two immiscible phases are brought into
direct contact with each other, resulting in the excess accumulation of either
component in the interfacial region. The process of transfer of the component from
bulk to the surface continues until a state of adsorption equilibrium is reached.8
Adsorption from solution onto a solid surface depends on the composition of the
solution and is expressed in terms of an adsorption isotherm, where amount adsorbed
(nads) is expressed as the function of equilibrium concentration (i.e. free adsorbate
concentration) in the bulk (ceq). In our studies, we determined adsorption isotherms
by solvent depletion method. In a typical experimental scheme, a certain
concentration of adsorbate (c0) (protein or surfactant) was added to the dispersion
containing a fixed amount of silica nanoparticles and the mixture obtained was
equilibrated for 24 hours on a multiple axel rotor. After complete equilibrium was
reached, nanoparticles with the adsorbed protein (or surfactant) were removed from
the dispersion by centrifugating the samples for 2 hours at ≃21,000g (15,000 RPM)
in a Hettich Universal 320R centrifugation equipment fitted with 1420-A sample
holder. The supernatant was carefully isolated from the centrifugated mixture and the
amount of unadsorbed protein (or surfactant) in the supernatant was determined by
the methods described in the following sections. After the precise determination of
the residual equilibrium concentration ceq the amount adsorbed was calculated as
nads= V(c0-ceq), where V is the volume of dispersion and c0 is the total amount of
adsorbent added to silica dispersion. The surface concentration (excess) of the
adsorbed material is then given by equation 2.59,10
𝛤 = 𝑐0 − 𝑐𝑒𝑞 𝑉
𝑎𝑠𝑚 (2.5)
here Γ is the surface excess concentration (expressed in mol/m2), c0, ceq are the
concentration before and after equilibration with the solid (in moles/L), V is the total
volume of solution (in L), m is the total mass (in g) and as is the specific surface area
of the particles (in m2/g) (section 2.1.3). Different initial amounts of adsorbate (c0)
were added to the nanoparticle dispersion in order to access different surface
20 Chapter 2
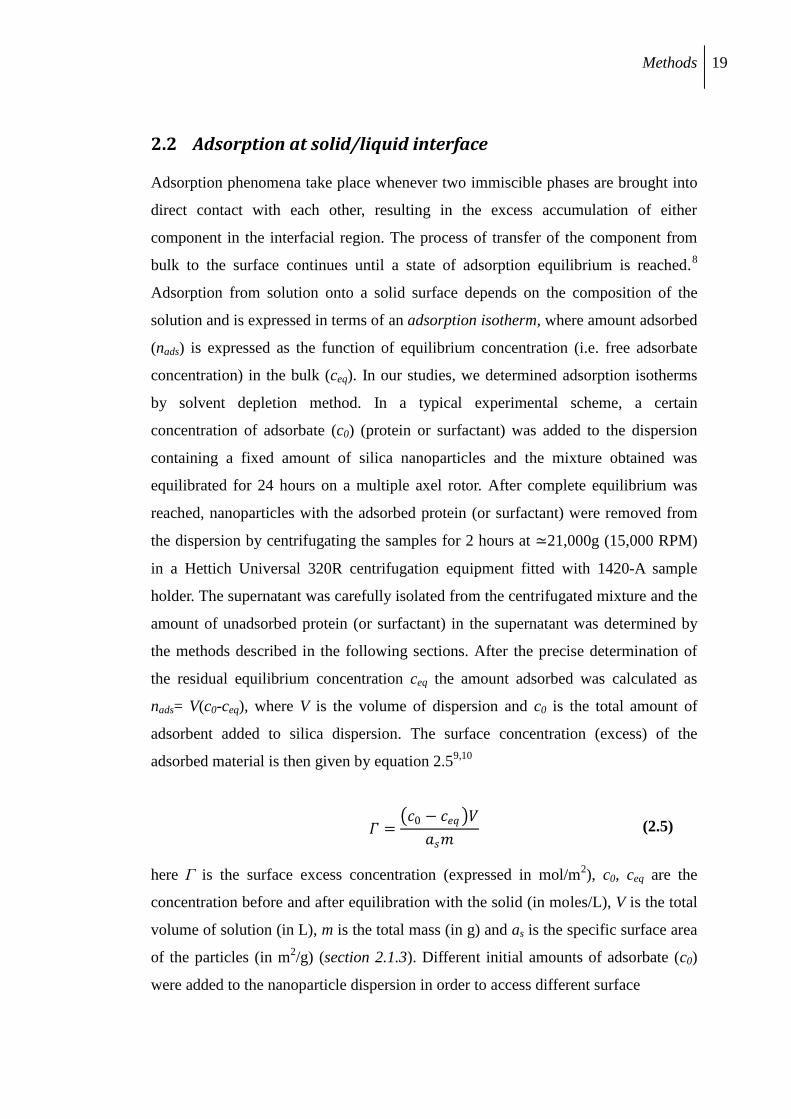
Figure 2-2 Surface tension variation of aqueous solution of C12E5 surfactant at different bulk
concentrations, the intersection point of the linear fit for the two regions of surface tension curve gives
the value of cmc.
concentration regimes, and thus to obtain complete adsorption isotherm.
2.2.1 Surfactant adsorption
The adsorption isotherm of C12E5 on silica nanoparticles was determined by the
procedure explained in the previous section. Surface tension was used to determine
the equilibrium surfactant concentration (ceq). Surface tension measurements were
made by the Du Noüy ring method using a Krüss K11 Tensiometer. The
Platinum-Iridium ring of 20 mm diameter was used to examine the pulling force (and
hence surface tension) from the liquid-air interface for the determination of surface
tension of solution. The ring was completely dried before each measurement and all
the samples were equilibrated at 25°C for 5 minutes before the measurement. Three
consecutive readings were taken and their mean value was used as the final surface
tension of the solution. A surface tension curve for known concentration of C12E5
surfactant is shown in Figure 2-2, the dashed line indicates the value of critical
micelle concentration (cmc). The region of linear decay in the surface tension with
surfactant concentration < cmc, was used as the reference, and the linear fit to the
points was used as the calibration values for determining unknown concentrations of
surfactant. A typical adsorption isotherms curve for nonionic surfactant (C12E5) on
Methods 21
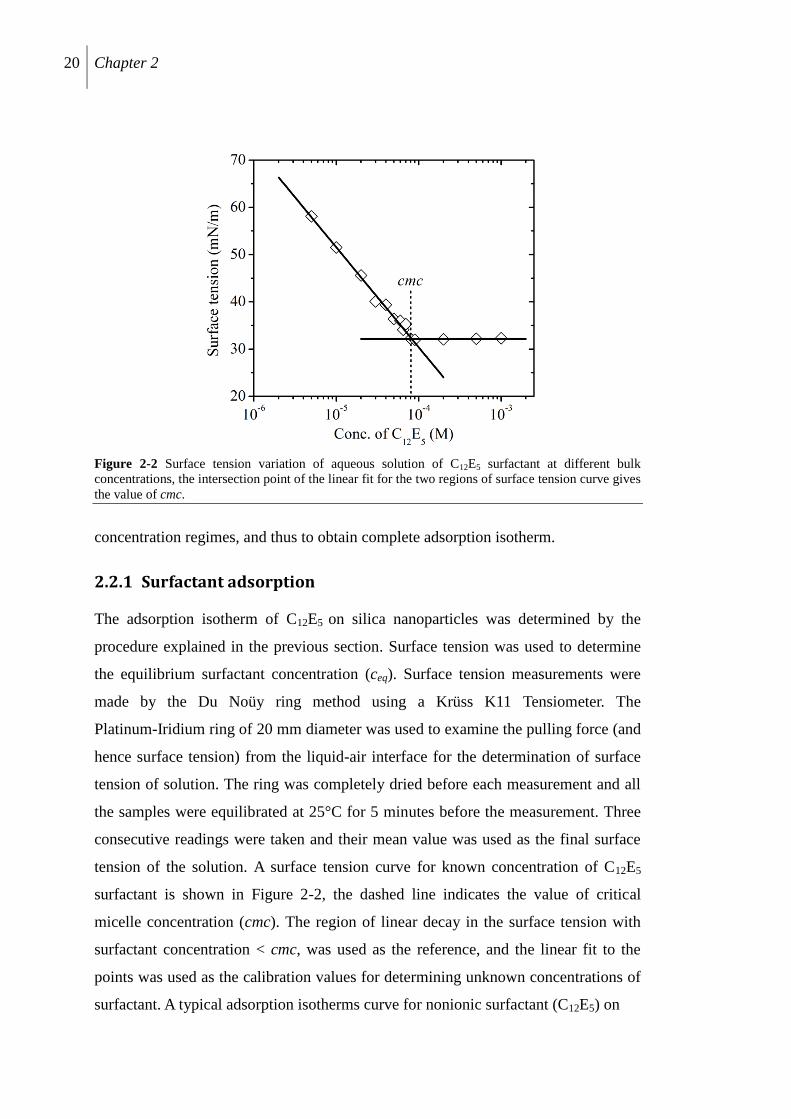
Figure 2-3 Generalized example of two different types of adsorption isotherms on silica
nanoparticles. (a) Adsorption isotherm of C12E5 on silica, it presents an S-type curve and can be
represented by Gu-Zhu model.14
(b) Lysozyme adsorption isotherm at silica surface, it shows a very
strong affinity of adsorption on silica surface and can be represented by Langmuir adsorption model.
silica surface is shown in Figure 2-3(a). The adsorption isotherm of nonionic
surfactants on silica surface shows an S-shaped curve11,12
which is contradistinct
from the Langmuir model of adsorption (Figure 2-3(b)).
For nonionic ethoxylate surfactants, because of the presence of weak
non-electrostatic interactions between the ethoxylate surfactant head groups and
silica surface silanol groups, the adsorption isotherms do not show the second plateau
region as is the case with ionic surfactants13
(not shown here). The adsorption
behavior of nonionic surfactant has been well explained by Zhu et al.14
. According to
the proposed model, the aggregation of n monomers of nonionic surfactant on a
surface site (s) forms a surface-micelle, where n is the nominal aggregation number
of the surface-micelle.
At equilibrium,
s + n-monomers ↔ surface-micelle
By applying the mass action model to the above assumption, the surface excess
concentration (Γ) of nonionic surfactant is given by the following equation 2.6.
22 Chapter 2
𝛤 =𝛤𝑚𝐾𝑐𝑒𝑞
𝑛
1 + 𝐾𝑐𝑒𝑞𝑛 (2.6)
where Γm is the maximum surface concentration, ceq is the equilibrium concentration
of surfactant, K is the adsorption constant and n is the mean aggregation number.
This equation was used for fitting the experimental data points in (Chapter 4) and
hence determining the Γm and n values.
2.2.2 Protein adsorption
Adsorption isotherms of proteins (lysozyme or cytochrome C) on silica nanoparticles
were measured at different pH and ionic strength in 50 mM
2-(N-morpholino)ethanesulfonic acid (MES) or 2-(Bis(2-hydroxyethyl)amino)acetic
acid (BICINE) buffer. Organic buffers were used with the purpose of keeping the
ionic concentration caused by buffers to a minimum. The free protein concentration
in the supernatant obtained after centrifugating out silica with adsorbed protein was
determined by measuring its absorbance at λ = 280 nm using a Varian Cary UV-vis
spectrophotometer. For precise determination of protein concentration at pH > 7, the
BCA protein assay kit was used. 0.15 ml of the protein sample was incubated with
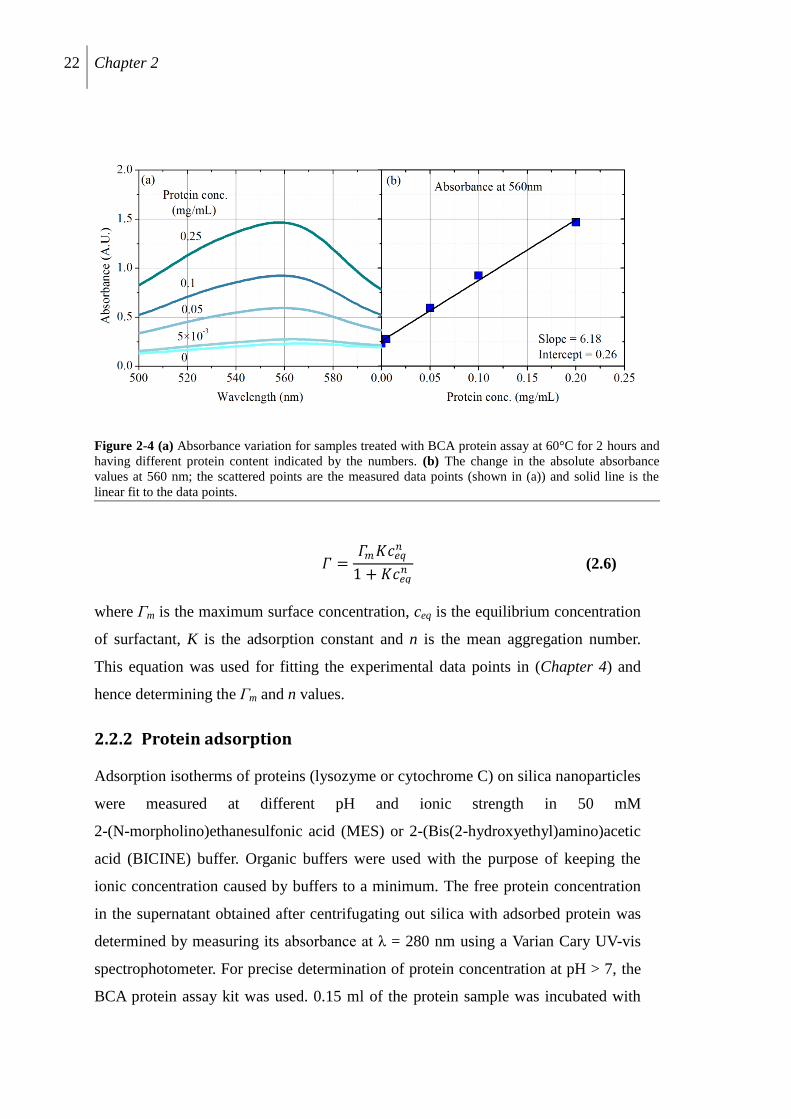
Figure 2-4 (a) Absorbance variation for samples treated with BCA protein assay at 60°C for 2 hours and
having different protein content indicated by the numbers. (b) The change in the absolute absorbance
values at 560 nm; the scattered points are the measured data points (shown in (a)) and solid line is the
linear fit to the data points.
Methods 23
3 mL of working reagent for 2 hours at 60 ± 1°C, and the absorbance at λ = 560 nm
was measured. BCA uses reduction of Cu+2
to Cu+ by protein in an alkaline medium
(biuret reaction) with the highly sensitive and selective colorimetric detection of Cu+
using a unique reagent containing bicinchoninic acid.15
At first, a calibration curve
with known protein amounts was obtained. Based on this calibration curve, the
unknown protein concentration was determined. Figure 2-4(a) shows the typical
UV-vis curves measured for different known concentrations of the protein, The
calibration curve resulting from the measurements is shown in Figure 2-4(b). The
linear fit to the experimental points gives a slope m with an intercept of b. Hence
equilibrium concentration of protein is given by equation 2.7.
𝑐𝑒𝑞 = (𝐴560 − 𝑏)
𝑚 (2.7)
where A560 is the absorbance of the assay-protein complex, b = 0.26 and m = 6.18.
The adsorption isotherms obtained were of the type shown in Figure 2-4(b).
This type of isotherm is typical for strong monolayer adsorption and can be
represented by the Langmuir adsorption model. According to this model there exists
equilibrium between empty surface sites (s), free particles (p) and sites occupied by a
single particle (sp), i.e. s + p ↔ sp. Surface of protein at any point can be estimated
by the above model using the Langmuir equation16
𝛤 =𝛤𝑚𝐾𝑐𝑒𝑞
1 + 𝐾𝑐𝑒𝑞
(2.8)
where Γ is the surface (excess) concentration at any point on adsorption isotherm, Γm
is the maximum surface concentration, ceq is the equilibrium concentration in the
solution and K is the Langmuir equilibrium constant. Its value depends on the
strength of adsorption, i.e., the binding affinity (or energy) of the sorbent to the
substrate. Comparing equations 2.6 and 2.8 the only difference between the two
model isotherms is the presence of the aggregation number „n‟ in equation 2.6, which
accounts for rapid increase in adsorption beyond a specific onset concentration.
24 Chapter 2
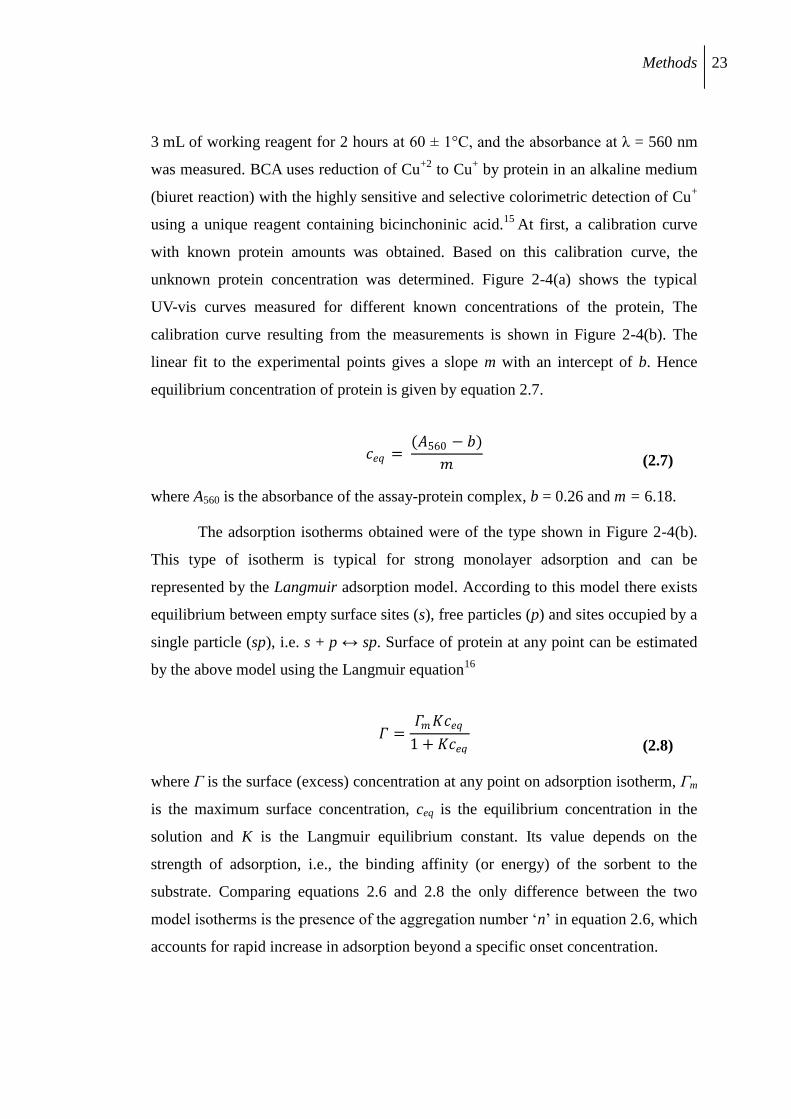
Figure 2-5 Experimental setup of the multisample analytical photocentrifuge. Parallel NIR-light is
passed through the sample cells and the distribution of local transmission is recorded at preset time
intervals over the entire sample length. (Figure reproduced with the permission of LUM, Berlin,
GmbH)
2.3 Turbidity and analytic centrifugation
As will be discussed in Chapter 6 and 7, the samples of silica dispersion containing
lysozyme in a pH range 4-9 causes a lysozyme-mediated silica aggregation. In order
to study the evolution and nature of these aggregates as a function of pH, turbidity
measurements were made. The turbidity ηc of the dispersions was determined from
their optical transmittance (T) at wavelength 800 nm with the relation
ηc = (log10(1/T))/lc, where c is the mass concentration of the silica in the dispersion,
and l is the optical path length. The transmittance of the samples was determined in
1 mm quartz cuvettes using a UV-vis spectrophotometer.
Another newly developed technique used for the characterization of aggregate
morphology is the analytical photo-centrifuge. It allows speeding up the
sedimentation of dispersions by the application of centrifugal force. The rate of
sedimentation of nanoparticles or aggregates in the centrifugal field is dependent on
their size and morphology. Hence monitoring sedimentation by measuring the
intensity of the light transmitted through the sample can provide detailed information
about the aggregate structure. As described elsewhere,17 , 18
in STEP-technology
(Space and Time Extinction Profiles), the sample is measured simultaneously over its
full sample length as a function of time as shown in Figure 2-5. For a given type of
sample cells the position corresponds to a defined sample volume, the relationship
Methods 25
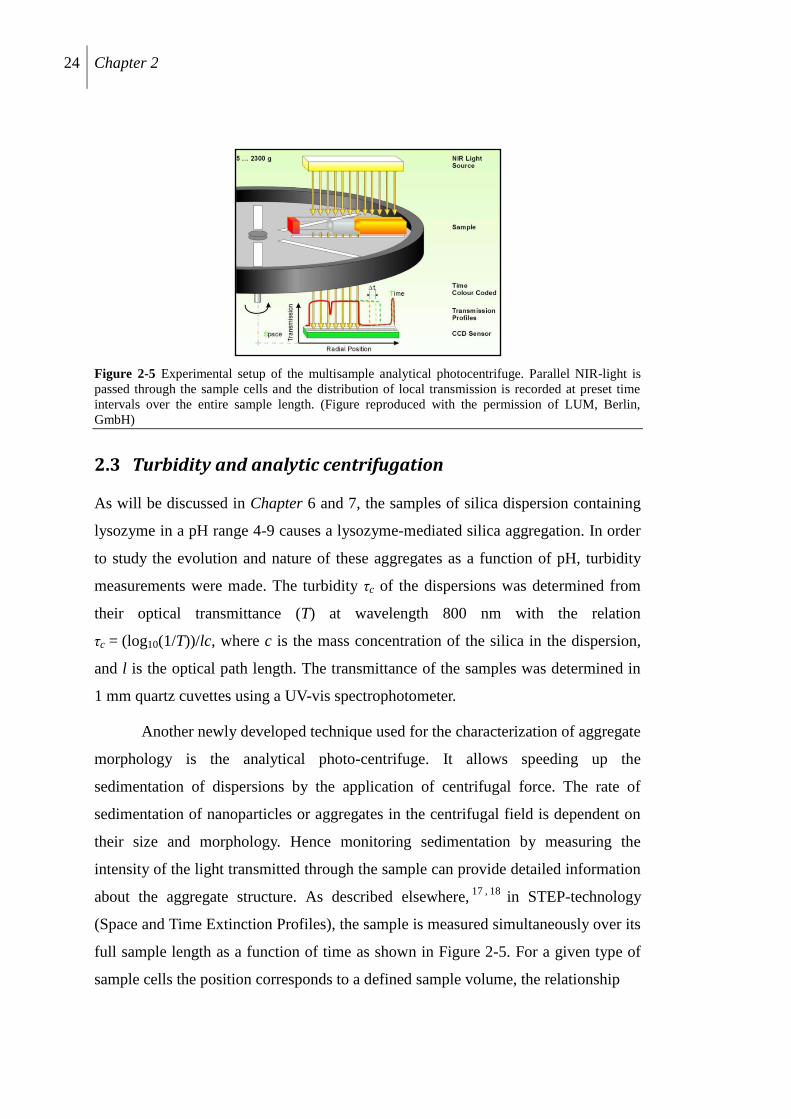
Figure 2-6 (a) Experimental setup for the small angle scattering experiment, where the incident beam
from the source (neutron or x-ray) is projected on the sample and the scattered beam is monitored by
the detector in line with the incident beam. (b) Schematic illustration of a neutron scattering geometry
and vector relations.
between position and sample volume can be established by calibration. This allows
to directly determine separate phase volumes and to calculate packing densities.
In the present work, the analytical centrifugation measurements were carried
out in cooperation with Prof. D. Lerche and Dr. T. Sobisch at LUM Berlin. The
sedimentation kinetics and phase volume of the silica-protein hetero-flocculate, and
the size distribution of the flocculated particles was derived from the progression of
transmission profiles. The sedimentation kinetics was measured at a centrifugal
acceleration of 36 g (bottom position). Subsequently, the compression kinetics of the
sediments formed was obtained at 2300 g. The size distributions were determined in
a separate measurement in which the centrifugal acceleration was gradually
increased from 13 to 2300 g.19
2.4 Small Angle Scattering (SAS)
Scattering is the phenomenon where an incident radiation (light, x-rays or neutrons)
is forced to deviate from a straight linear path when passing through a medium
(solid, liquid or gas). In general, when an electromagnetic wave is incident on a
system then the constituents of the system emit secondary wavelets in all the
directions. The overall scattering pattern is then resulting from the superposition and
interference of all the secondary wavelets. A typical set up for small angle instrument
is shown in the Figure 2-6(a). Here, a collimated X-ray or neutron beam is incident
on the sample and the pattern arising from the scattering was observed by the
detector placed in line with the incident beam. Beam-stop is placed in order to avoid
the high intensity direct beam, which could lead to damage of detector. In my PhD
26 Chapter 2
work, Small Angle Neutron Scattering (SANS) and Small Angle X-ray Scattering
(SAXS) were used to study the structural features of hard and soft matter in the
nanoparticle dispersions. The principle of the two techniques is exactly the same but
important differences between SANS and SAXS result from the different nature of
the scattered radiation. Neutrons are neutral elementary subatomic particles which
interact with the atomic nuclei of the sample. On the other hand, X-rays interact with
the electron shell of the atoms and thus gives information about the electron density
in different parts of the sample. In both cases, it is the elastic, coherent scattering of
X-rays/neutrons that gives rise to small-angle scattering. Coherent scattering is “in
phase” and thus can contribute to small-angle scattering. Incoherent scattering is
isotropic in a small-angle scattering experiment and thus contributes to the
background signal and degrades signal to noise.20
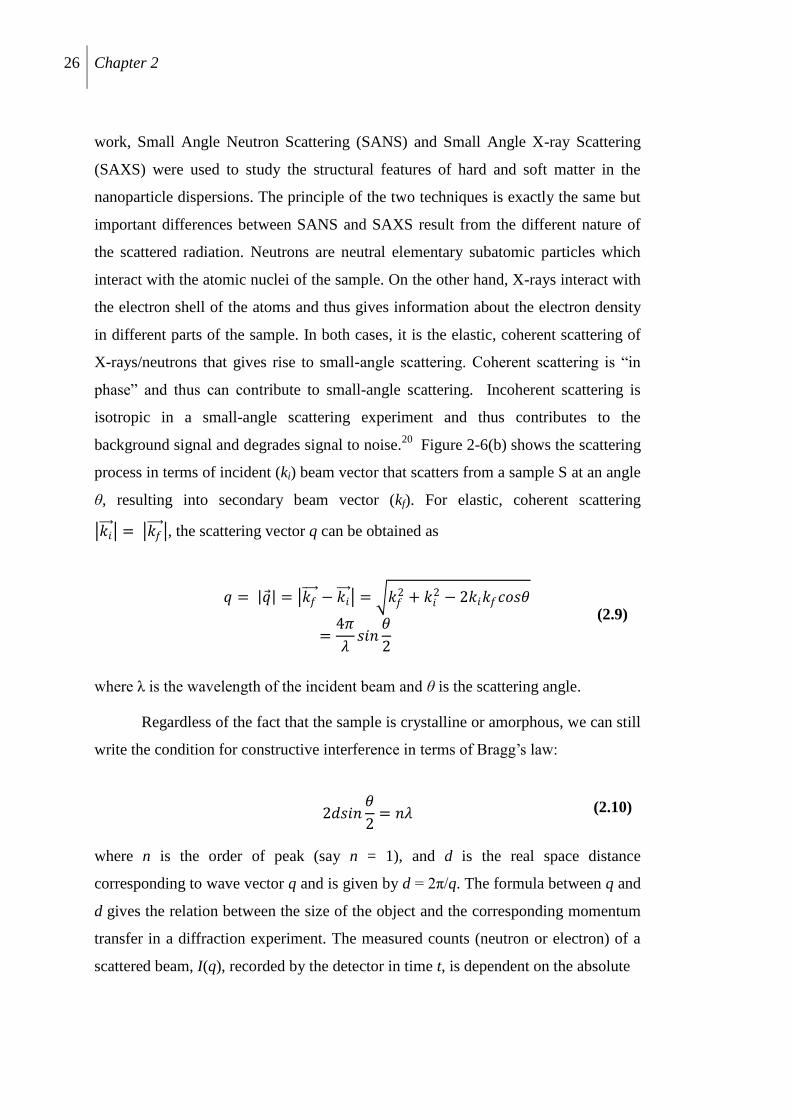
Figure 2-6(b) shows the scattering
process in terms of incident (ki) beam vector that scatters from a sample S at an angle
θ, resulting into secondary beam vector (kf). For elastic, coherent scattering
𝑘𝑖 = 𝑘𝑓
, the scattering vector q can be obtained as
𝑞 = 𝑞 = 𝑘𝑓 − 𝑘𝑖
= 𝑘𝑓2 + 𝑘𝑖
2 − 2𝑘𝑖𝑘𝑓𝑐𝑜𝑠휃
=4𝜋
𝜆𝑠𝑖𝑛
휃
2
(2.9)
where λ is the wavelength of the incident beam and θ is the scattering angle.
Regardless of the fact that the sample is crystalline or amorphous, we can still
write the condition for constructive interference in terms of Bragg‟s law:
2𝑑𝑠𝑖𝑛휃
2= 𝑛𝜆 (2.10)
where n is the order of peak (say n = 1), and d is the real space distance
corresponding to wave vector q and is given by d = 2π/q. The formula between q and
d gives the relation between the size of the object and the corresponding momentum
transfer in a diffraction experiment. The measured counts (neutron or electron) of a
scattered beam, I(q), recorded by the detector in time t, is dependent on the absolute
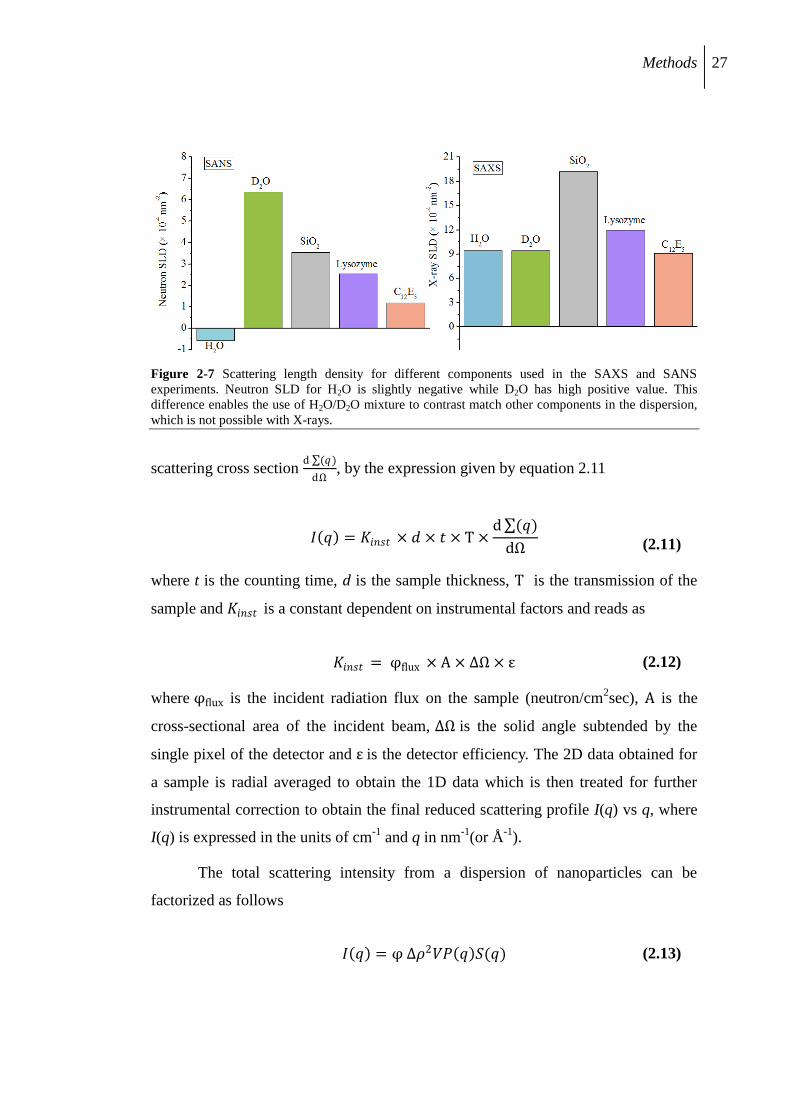
Methods 27
Figure 2-7 Scattering length density for different components used in the SAXS and SANS
experiments. Neutron SLD for H2O is slightly negative while D2O has high positive value. This
difference enables the use of H2O/D2O mixture to contrast match other components in the dispersion,
which is not possible with X-rays.
scattering cross section d (𝑞)
dΩ, by the expression given by equation 2.11
𝐼 𝑞 = 𝐾𝑖𝑛𝑠𝑡 × 𝑑 × 𝑡 × T ×d (𝑞)
dΩ (2.11)
where t is the counting time, d is the sample thickness, T is the transmission of the
sample and 𝐾𝑖𝑛𝑠𝑡 is a constant dependent on instrumental factors and reads as
𝐾𝑖𝑛𝑠𝑡 = φflux × A × ΔΩ × ε (2.12)
where φflux is the incident radiation flux on the sample (neutron/cm2sec), A is the
cross-sectional area of the incident beam, ΔΩ is the solid angle subtended by the
single pixel of the detector and ε is the detector efficiency. The 2D data obtained for
a sample is radial averaged to obtain the 1D data which is then treated for further
instrumental correction to obtain the final reduced scattering profile I(q) vs q, where
I(q) is expressed in the units of cm-1
and q in nm-1
(or Å-1
).
The total scattering intensity from a dispersion of nanoparticles can be
factorized as follows
𝐼 𝑞 = φ ∆𝜌2𝑉𝑃 𝑞 𝑆(𝑞) (2.13)
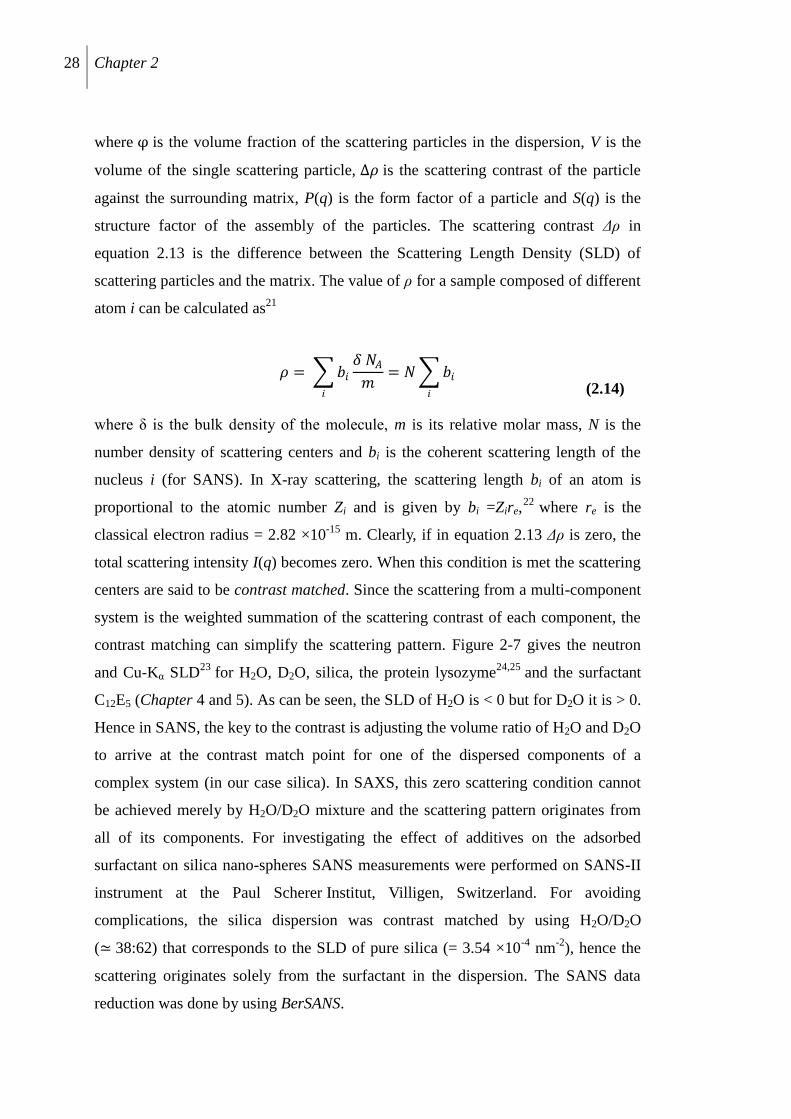
28 Chapter 2
where φ is the volume fraction of the scattering particles in the dispersion, V is the
volume of the single scattering particle, ∆𝜌 is the scattering contrast of the particle
against the surrounding matrix, P(q) is the form factor of a particle and S(q) is the
structure factor of the assembly of the particles. The scattering contrast Δρ in
equation 2.13 is the difference between the Scattering Length Density (SLD) of
scattering particles and the matrix. The value of ρ for a sample composed of different
atom i can be calculated as21
𝜌 = 𝑏𝑖
𝛿 𝑁𝐴
𝑚= 𝑁 𝑏𝑖
𝑖𝑖
(2.14)
where δ is the bulk density of the molecule, m is its relative molar mass, N is the
number density of scattering centers and bi is the coherent scattering length of the
nucleus i (for SANS). In X-ray scattering, the scattering length bi of an atom is
proportional to the atomic number Zi and is given by bi =Zire,22
where re is the
classical electron radius = 2.82 ×10⁻¹⁵
m. Clearly, if in equation 2.13 Δρ is zero, the
total scattering intensity I(q) becomes zero. When this condition is met the scattering
centers are said to be contrast matched. Since the scattering from a multi-component
system is the weighted summation of the scattering contrast of each component, the
contrast matching can simplify the scattering pattern. Figure 2-7 gives the neutron
and Cu-Kα SLD23
for H2O, D2O, silica, the protein lysozyme24,25
and the surfactant
C12E5 (Chapter 4 and 5). As can be seen, the SLD of H2O is < 0 but for D2O it is > 0.
Hence in SANS, the key to the contrast is adjusting the volume ratio of H2O and D2O
to arrive at the contrast match point for one of the dispersed components of a
complex system (in our case silica). In SAXS, this zero scattering condition cannot
be achieved merely by H2O/D2O mixture and the scattering pattern originates from
all of its components. For investigating the effect of additives on the adsorbed
surfactant on silica nano-spheres SANS measurements were performed on SANS-II
instrument at the Paul Scherer Institut, Villigen, Switzerland. For avoiding
complications, the silica dispersion was contrast matched by using H2O/D2O
(≃ 38:62) that corresponds to the SLD of pure silica (= 3.54 ×10⁻⁴
nm-2
), hence the
scattering originates solely from the surfactant in the dispersion. The SANS data
reduction was done by using BerSANS.
Methods 29
Figure 2-8(a) Cartoon showing the ordered pores in the SBA-15 material; (b) 2D hexagonal lattice of
the pores indicating the ordered lattice parameters. (c) Bragg‟s diffraction: Two beams with identical
wavelength and phase (X-rays or neutrons) incident on an ordered solid, which are scattered off from
two different atoms within it.
software package26
. Further modeling of the form factors and structure factor is
explained in Chapter 3.
2.5 Small Angle Diffraction (SAD)
In Chapter 5, we have presented a study of the assembly of the nonionic surfactant
C12E5 in the cylindrical mesopores of a SBA-15 silica material. A given mesoporous
material is identified by its pore diameter (or width) and by its pore lattice. A
cylindrical pore is regarded as the unit cell i.e. the basic building block of the pseudo
crystalline structure of SBA-15. Since the ordered structure of SBA-15 has
hexagonal symmetry (Figure 2-8(a) and (b)), the unit cell can be reduced to
parallelepiped (Figure 2-8(b)) that has two characteristic sides whose length can be is
equal to „dhk‟ lattice parameter. In our study of the self-assembly of surfactant in such
ordered mesoporous silica materials, Small Angle Neutron Diffraction (SAND) was
applied. The experimental setup of a SAD is similar to SAS. In both the cases, a
beam of X-rays or neutrons is incident on the sample and the scattered or diffracted
beam is measured by the detector. Diffracted waves from different centers in a
material can interfere with each other and the resultant intensity distribution is
strongly modulated by this interaction (Figure 2-8(c)). If the scattering centers are
arranged in a periodic fashion, as in crystals, the diffracted waves will consist of
sharp interference maxima (peaks) with the same symmetry as the distribution of the
scattering centers. The peaks in a diffraction pattern are directly related to the
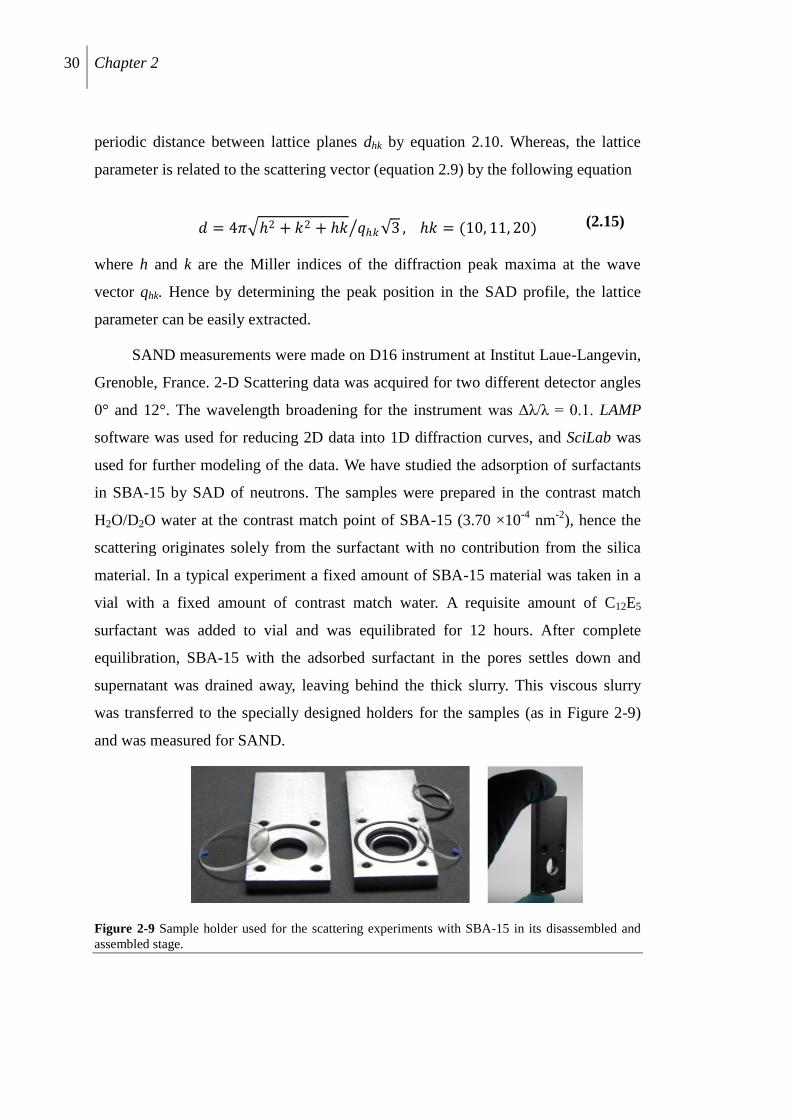
30 Chapter 2
periodic distance between lattice planes dhk by equation 2.10. Whereas, the lattice
parameter is related to the scattering vector (equation 2.9) by the following equation
𝑑 = 4𝜋 2 + 𝑘2 + 𝑘 𝑞𝑘 3 , 𝑘 = (10, 11, 20) (2.15)
where h and k are the Miller indices of the diffraction peak maxima at the wave
vector qhk. Hence by determining the peak position in the SAD profile, the lattice
parameter can be easily extracted.
SAND measurements were made on D16 instrument at Institut Laue-Langevin,
Grenoble, France. 2-D Scattering data was acquired for two different detector angles
0° and 12°. The wavelength broadening for the instrument was Δλ/λ = 0.1. LAMP
software was used for reducing 2D data into 1D diffraction curves, and SciLab was
used for further modeling of the data. We have studied the adsorption of surfactants
in SBA-15 by SAD of neutrons. The samples were prepared in the contrast match
H2O/D2O water at the contrast match point of SBA-15 (3.70 ×10⁻⁴
nm-2
), hence the
scattering originates solely from the surfactant with no contribution from the silica
material. In a typical experiment a fixed amount of SBA-15 material was taken in a
vial with a fixed amount of contrast match water. A requisite amount of C12E5
surfactant was added to vial and was equilibrated for 12 hours. After complete
equilibration, SBA-15 with the adsorbed surfactant in the pores settles down and
supernatant was drained away, leaving behind the thick slurry. This viscous slurry
was transferred to the specially designed holders for the samples (as in Figure 2-9)
and was measured for SAND.
Figure 2-9 Sample holder used for the scattering experiments with SBA-15 in its disassembled and
assembled stage.
Methods 31
References
1 Livage, J., Sanchez, C., Henry, M., Doeuff, S., Solid State Ionics, 1989, 32-33, 633.
2 Davis, T. M., Snyder, M. A., Krohn, J. E., Tsapatsis M. Chem. Mater., 2006, 18,
5814.
3 Thomassen, L. C. J., Aerts, A., Rabolli, V., Lison, D., Gonzalez, L., Kirsch-Volders,
M., Napierska, D., Hoet, P. H., Kirschhock, C. E. A., Martens, J. A. Langmuir, 2010,
26, 328.
4 Isrealachvilli, J. N., “Intermolecular and Surface Forces”, 2011, Academic Press,
USA.
5 Atkins, P. W., “Physical Chemistry”, 1994, Oxford University Press, Oxford.
6 Hunter, R.J., “Zeta Potential in Colloid Science: Principles and Applications”,
1988, Academic Press, UK.
7 Gregg, S. J., Sing, K. S. W., “Adsorption, Surface Area and Porosity”, 1982,
Academic press UK.
8 Chatoraj, D. K., Birdi, K. S., “Adsorption and the Gibbs Surface Excess”, 1984,
Plenum Press, USA.
9 Findenegg, G. H., “Theoretical Advancement in Chromatography and related
Separation Techniques”, 1992, Kluwer Academic Publishers, Netherlands.
10 Dietsch, O., Eltekov, A., Bock, H., Gubbins, K. E., Findenegg, G. H., J. Phys.
Chem. C, 2007, 111, 16045.
11 Singh, S. K., Notely, S. M., J. Phys. Chem. B, 2010, 114, 14977.
12 Lugo, D. M., Oberdisse, J., Karg, M., Schweins, R., Findenegg, G. H., Soft Matter,
2009, 5, 2928.
13 Tyrode, E., Ruthland, M. W., Bain, C. D., J. Am. Chem. Soc., 2008, 130, 17434.
14 Gu, T., Zhu, B.Y., Colloid Surf., 1990, 44, 81.
32 Chapter 2
15Smith, P. K., Krong, R. I., Hermanson, G. T., Mallia, A. K., Gartner, F. H.,
Frovenzano, M. D., Fujimoto, E. K., Goeke, N. M., Olson, B. J., Klenk, D. C., Anal.
Biochem., 1985, 150, 76.
16 Bharti, B, Meissner, J., Findenegg, G. H., Langmuir, 2011, 27, 9823.
17 Lerche, D., Sobisch, T. Powder Technol., 2007, 174, 46.
18 Sobisch, T., Lerche, D., Colloid Surf. A, 2008, 331, 114.
19 Detloff, T., Lerche, D., Sobisch, T., Part. Part. Syst. Charact., 2006, 23, 184.
20 Linder, P., Zemb, Th., “Neutrons, X-rays and Light Scattering Methods Applied to
Soft Condensed Matter”, 2002, Delta Series-Elsevier, Netherlands.
21 Gabrys, B. J., “Applications of neutron scattering to soft Condensed Matter”,
2000, Gordon and Beach Science publishers, USA.
22 Narayanan, J., Liu, X. Y., Biophys. J., 2003, 84, 523.
23 http://www.ncnr.nist.gov/resources/sldcalc.html
24 Efimova, Y. M., van Well, A. A., Hanefeld, U., Wierczinski, B., Bouwman, W. G.,
Physica B, 2004, 350, e877.
25 Stuhrmann, H. B., Fuess, H., Acta Cryst., 1976, A32, 67.
26 Keiderling, U., Appl. Phys. A, 2002, 74, S1455.
Theory and modeling 33
3. Theory and modeling
3.1 Scattering data analysis
As a first step to the modeling of the scattering data, incoherent scattering
background was subtracted by applying Porod‟s law. In the scattering profiles, at
sufficiently high-q values, the scattering originates solely from the interface between
matrix and scattering object. According to this law, for smooth particle having a
sharp interface the scattering intensity should decay as 𝐼 𝑞 ∝ 𝑞−4. Hence, to satisfy
this condition the data of the high-q scattering regime is fitted to the following
equation
𝐼 𝑞 ≈ 𝐴𝑝𝑞−4 + 𝐼𝑖𝑏 (3.1)
where Iib is the incoherent background scattering which is then subtracted from the
whole scattering curve. The Porod constant Ap obtained by fitting the experimental
curve is related to the specific surface area S and scattering contrast ∆𝜌 as
𝐴𝑝 = 2𝜋𝑆∆𝜌2 (3.2)
After the background subtraction the scattering profiles were fitted on the
basis of form factors models as discussed below. The Scilab software package1 was
used for building up the codes for the models, whereas SASfit program2 was used for
the fitting of simple and predefined scattering structure and form factor functions.
Scattering data of dilute dispersions of silica particles were fitted according to
the form factor of spheres dispersed in a medium of given contrast. The form factor
Pm(q) of monodisperse spheres with radius R is given by
𝑃𝑚 𝑞 = 4
3𝜋𝑅3 × ∆𝜌 × 3
sin 𝑞𝑅 − 𝑞𝑅𝑐𝑜𝑠 𝑞𝑅
𝑞𝑅 3
2
(3.3)
where ∆𝜌 is the scattering contrast of the sphere against the dispersion medium i.e.
∆𝜌 = ρparticle - ρmedium. The size polydispersity in the silica beads was taken into
account by the log-normal size distribution. The distribution for mean particle size R0
and standard deviation σ (polydispersity) is given by
34 Chapter 3
𝐷 𝑅, 𝑅0,𝜍 = 1
2𝜋𝑅𝜍exp −
1
2𝜍2 𝑙𝑛
𝑅
𝑅0
2
(3.4)
The form factor of the system of polydisperse spheres is then given by
𝑃 𝑞 = 𝐷 𝑅, 𝑅0,𝜍 𝑃𝑚 ( 𝑞, 𝑅)𝑑𝑅 (3.5)
The form factor of the polydisperse sphere was normalized so that the forward
scattering (I(q→0)) = 1. The overall scattering intensity in absolute units was
obtained by using the P(q) in the following equation
𝐼 𝑞 = 𝑁𝑉2∆𝜌2𝑃 𝑞 𝑆(𝑞) (3.6)
where N is the number density of the particles with scattering length contrast ∆𝜌
against the background, V is the volume of single particle and S(q) is the structure
factor of the system. S(q) accounts for the inter-particle correlations arising in the
system. For a dilute non-interacting system S(q) = 1.
3.1.1 Micelle-decorated bead model
In Chapter 4, we report a SANS study of surfactant adsorption on silica
nanoparticles, where the SANS profiles are modeled on the basis of previously
developed micelle decorated bead model.3 The model accounts for the structure of
the adsorbed surface micelles on spherical silica beads in the silica contrast match
scenario. The model assumes that there is a random distribution of the spherical (or
ellipsoidal) surface micelles of radius Ra.
First step of this model involves the generation of a completely random set of
coordinates of the center of each surface micelle lying on the outer surface of a silica
nanoparticle of radius Rb. This random but uniform distribution of spherical micelles
was achieved by hypercube rejection method,4 where three numbers (A1, A2 and A3)
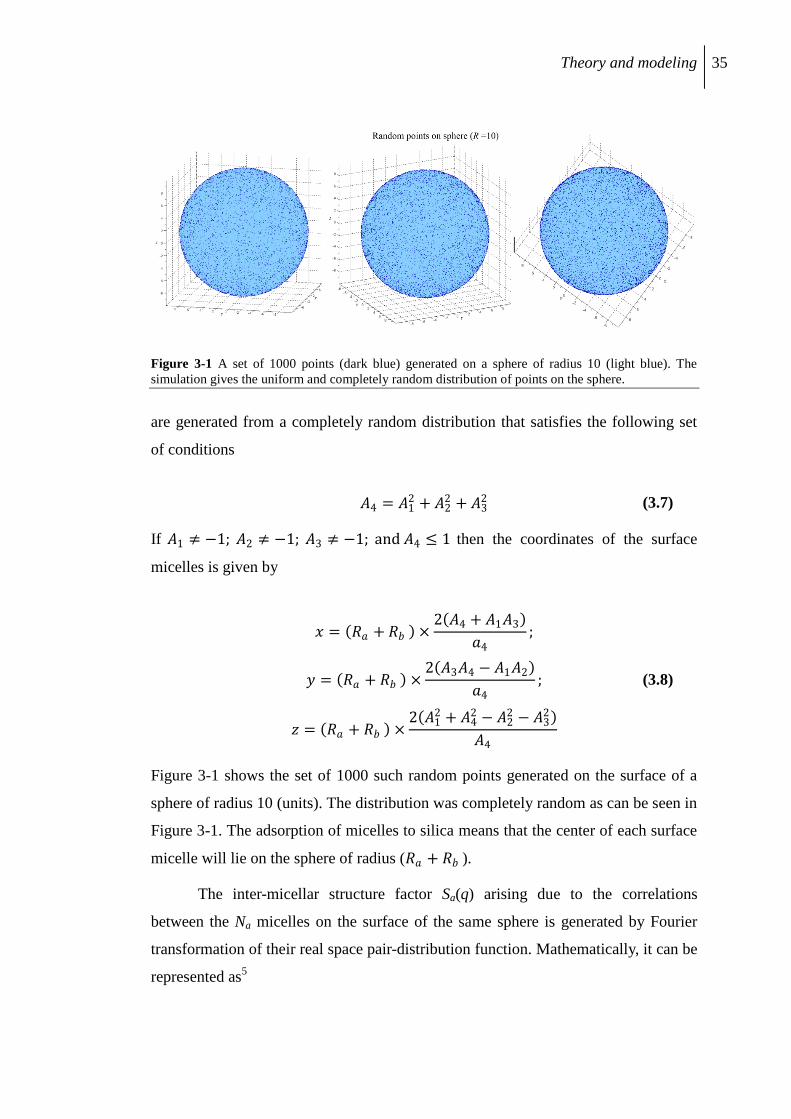
Theory and modeling 35
Figure 3-1 A set of 1000 points (dark blue) generated on a sphere of radius 10 (light blue). The
simulation gives the uniform and completely random distribution of points on the sphere.
are generated from a completely random distribution that satisfies the following set
of conditions
𝐴4 = 𝐴12 + 𝐴2
2 + 𝐴32 (3.7)
If 𝐴1 ≠ −1; 𝐴2 ≠ −1; 𝐴3 ≠ −1; and 𝐴4 ≤ 1 then the coordinates of the surface
micelles is given by
𝑥 = 𝑅𝑎 + 𝑅𝑏 ×2 𝐴4 + 𝐴1𝐴3
𝑎4;
𝑦 = 𝑅𝑎 + 𝑅𝑏 ×2 𝐴3𝐴4 − 𝐴1𝐴2
𝑎4;
𝑧 = 𝑅𝑎 + 𝑅𝑏 ×2 𝐴1
2 + 𝐴42 − 𝐴2
2 − 𝐴32
𝐴4
(3.8)
Figure 3-1 shows the set of 1000 such random points generated on the surface of a
sphere of radius 10 (units). The distribution was completely random as can be seen in
Figure 3-1. The adsorption of micelles to silica means that the center of each surface
micelle will lie on the sphere of radius (𝑅𝑎 + 𝑅𝑏 ).
The inter-micellar structure factor Sa(q) arising due to the correlations
between the Na micelles on the surface of the same sphere is generated by Fourier
transformation of their real space pair-distribution function. Mathematically, it can be
represented as5
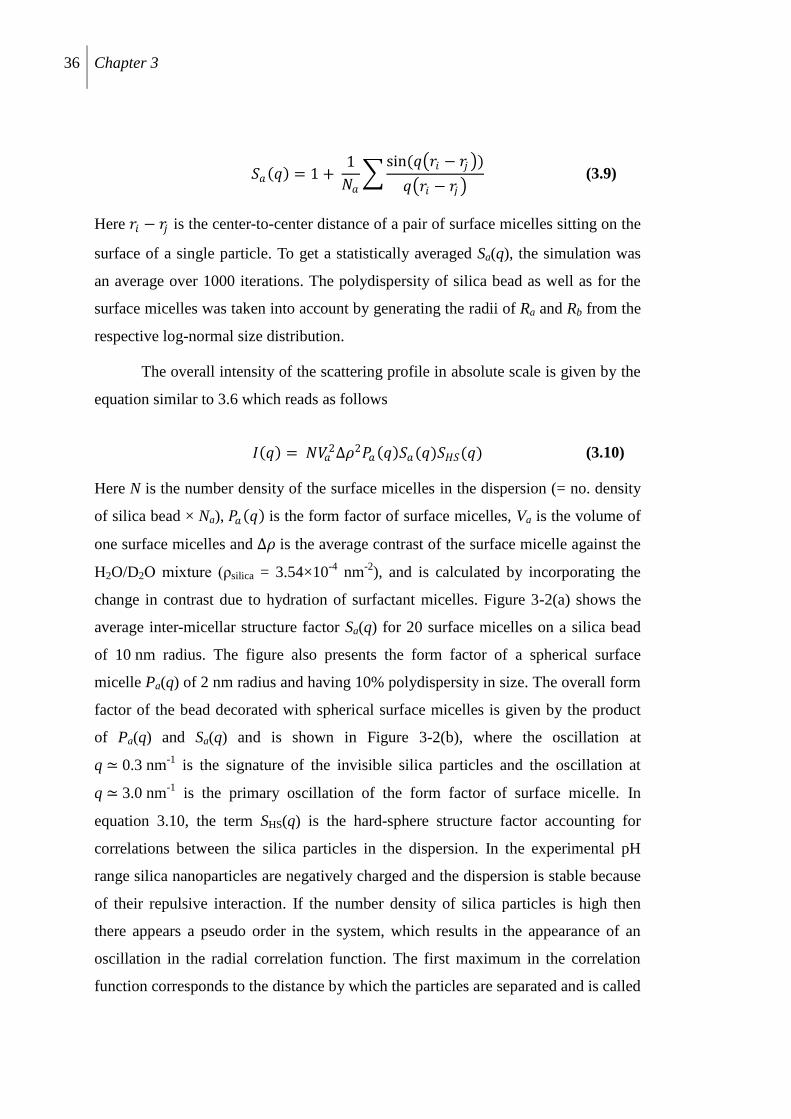
36 Chapter 3
𝑆𝑎 𝑞 = 1 + 1
𝑁𝑎
sin(𝑞 𝑟𝑖 − 𝑟𝑗 )
𝑞 𝑟𝑖 − 𝑟𝑗 (3.9)
Here 𝑟𝑖 − 𝑟𝑗 is the center-to-center distance of a pair of surface micelles sitting on the
surface of a single particle. To get a statistically averaged Sa(q), the simulation was
an average over 1000 iterations. The polydispersity of silica bead as well as for the
surface micelles was taken into account by generating the radii of Ra and Rb from the
respective log-normal size distribution.
The overall intensity of the scattering profile in absolute scale is given by the
equation similar to 3.6 which reads as follows
𝐼 𝑞 = 𝑁𝑉𝑎2∆𝜌2𝑃𝑎 𝑞 𝑆𝑎(𝑞)𝑆𝐻𝑆(𝑞) (3.10)
Here N is the number density of the surface micelles in the dispersion (= no. density
of silica bead × Na), 𝑃𝑎 𝑞 is the form factor of surface micelles, Va is the volume of
one surface micelles and ∆𝜌 is the average contrast of the surface micelle against the
H2O/D2O mixture (ρsilica = 3.54×10⁻⁴
nm-2
), and is calculated by incorporating the
change in contrast due to hydration of surfactant micelles. Figure 3-2(a) shows the
average inter-micellar structure factor Sa(q) for 20 surface micelles on a silica bead
of 10 nm radius. The figure also presents the form factor of a spherical surface
micelle Pa(q) of 2 nm radius and having 10% polydispersity in size. The overall form
factor of the bead decorated with spherical surface micelles is given by the product
of Pa(q) and Sa(q) and is shown in Figure 3-2(b), where the oscillation at
q ≃ 0.3 nm-1
is the signature of the invisible silica particles and the oscillation at
q ≃ 3.0 nm-1
is the primary oscillation of the form factor of surface micelle. In
equation 3.10, the term SHS(q) is the hard-sphere structure factor accounting for
correlations between the silica particles in the dispersion. In the experimental pH
range silica nanoparticles are negatively charged and the dispersion is stable because
of their repulsive interaction. If the number density of silica particles is high then
there appears a pseudo order in the system, which results in the appearance of an
oscillation in the radial correlation function. The first maximum in the correlation
function corresponds to the distance by which the particles are separated and is called
Theory and modeling 37
Figure 3-2 Simulated inter-micellar structure factor Sa(q) for 20 micelles on the silica particle with
radius Rb = 10 nm (10% polydispersity) (blue line). Red line indicates the form factor Pa(q) of
spherical micelles of radius Ra = 2 nm (10 % polydispersity). (b) Overall form factor of the
micelle-decorated bead model (P(q) = Sa(q)× Pa(q)). (c) Cartoon representing the silica nanoparticle in
contrast matched medium with spherical surfactant micelles at its periphery.
the hard sphere repulsion radius. The analytic expression for SHS(q) is as follows6,7
𝑆 𝑞 =
1
1 + 24𝜑𝐺(𝑞)𝑞𝑅HS
(3.11)
where 𝜑 is the volume fraction of the particles in the dispersion and G(q) is given by
𝐺 𝑞 = 𝛼
𝑠𝑖𝑛𝐴−𝐴𝑐𝑜𝑠𝐴
𝐴2 + 𝛽 2𝐴𝑠𝑖𝑛𝐴 + 2−𝐴2 𝑐𝑜𝑠𝐴−2
𝐴3 +
𝛾 −𝐴4𝑐𝑜𝑠𝐴+4[ 3𝐴2−6 𝑐𝑜𝑠𝐴+(𝐴3−6𝐴 𝑠𝑖𝑛𝐴 +6])
𝐴5 (3.12)
with 𝛼 = (1+2𝜑)2
(1−𝜑)4 ; 𝛽 = −6𝜑(1+𝜑/2)2
(1−𝜑)4 ; 𝛾 = 𝜑𝛼
2 and 𝐴 = 2𝑅HS 𝑞
where RHS is the hard sphere repulsion.
The micelle-decorated bead model can successfully predict the morphology
of C12E5 micelles on silica nanoparticles at silica/solvent contrast match conditions.
In other situations where this contrast scenario is not feasible it is desirable to study
such decorated particles in a full contrast scenario. The corresponding relations have
been derived and given below.
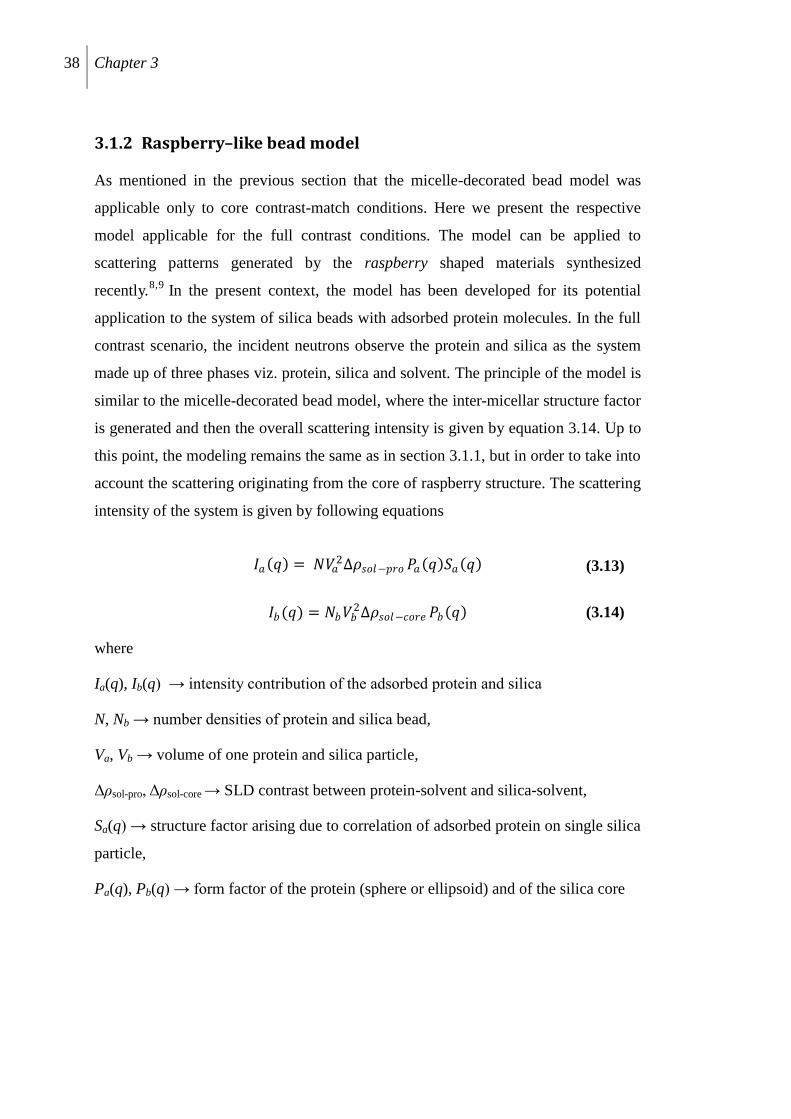
38 Chapter 3
3.1.2 Raspberry–like bead model
As mentioned in the previous section that the micelle-decorated bead model was
applicable only to core contrast-match conditions. Here we present the respective
model applicable for the full contrast conditions. The model can be applied to
scattering patterns generated by the raspberry shaped materials synthesized
recently.8,9
In the present context, the model has been developed for its potential
application to the system of silica beads with adsorbed protein molecules. In the full
contrast scenario, the incident neutrons observe the protein and silica as the system
made up of three phases viz. protein, silica and solvent. The principle of the model is
similar to the micelle-decorated bead model, where the inter-micellar structure factor
is generated and then the overall scattering intensity is given by equation 3.14. Up to
this point, the modeling remains the same as in section 3.1.1, but in order to take into
account the scattering originating from the core of raspberry structure. The scattering
intensity of the system is given by following equations
𝐼𝑎 𝑞 = 𝑁𝑉𝑎2∆𝜌𝑠𝑜𝑙−𝑝𝑟𝑜 𝑃𝑎 𝑞 𝑆𝑎 𝑞 (3.13)
𝐼𝑏(𝑞) = 𝑁𝑏𝑉𝑏2∆𝜌𝑠𝑜𝑙−𝑐𝑜𝑟𝑒 𝑃𝑏 𝑞 (3.14)
where
Ia(q), Ib(q) → intensity contribution of the adsorbed protein and silica
N, Nb → number densities of protein and silica bead,
Va, Vb → volume of one protein and silica particle,
Δρsol-pro, Δρsol-core → SLD contrast between protein-solvent and silica-solvent,
Sa(q) → structure factor arising due to correlation of adsorbed protein on single silica
particle,
Pa(q), Pb(q) → form factor of the protein (sphere or ellipsoid) and of the silica core
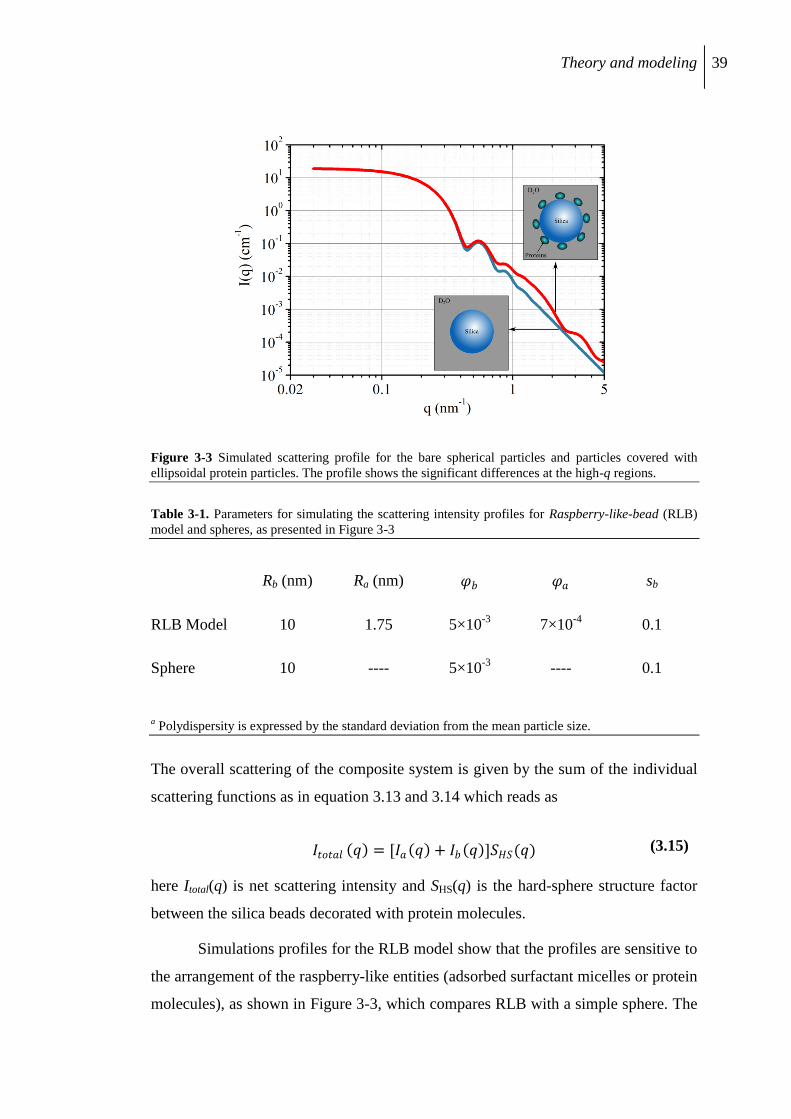
Theory and modeling 39
Figure 3-3 Simulated scattering profile for the bare spherical particles and particles covered with
ellipsoidal protein particles. The profile shows the significant differences at the high-q regions.
Table 3-1. Parameters for simulating the scattering intensity profiles for Raspberry-like-bead (RLB)
model and spheres, as presented in Figure 3-3
Rb (nm) Ra (nm) 𝜑𝑏 𝜑𝑎 sb
RLB Model 10 1.75 5×10⁻³
7×10⁻⁴
0.1
Sphere 10 ---- 5×10⁻³
---- 0.1
a Polydispersity is expressed by the standard deviation from the mean particle size.
The overall scattering of the composite system is given by the sum of the individual
scattering functions as in equation 3.13 and 3.14 which reads as
𝐼𝑡𝑜𝑡𝑎𝑙 𝑞 = [𝐼𝑎 𝑞 + 𝐼𝑏 𝑞 ]𝑆𝐻𝑆(𝑞) (3.15)
here Itotal(q) is net scattering intensity and SHS(q) is the hard-sphere structure factor
between the silica beads decorated with protein molecules.
Simulations profiles for the RLB model show that the profiles are sensitive to
the arrangement of the raspberry-like entities (adsorbed surfactant micelles or protein
molecules), as shown in Figure 3-3, which compares RLB with a simple sphere. The
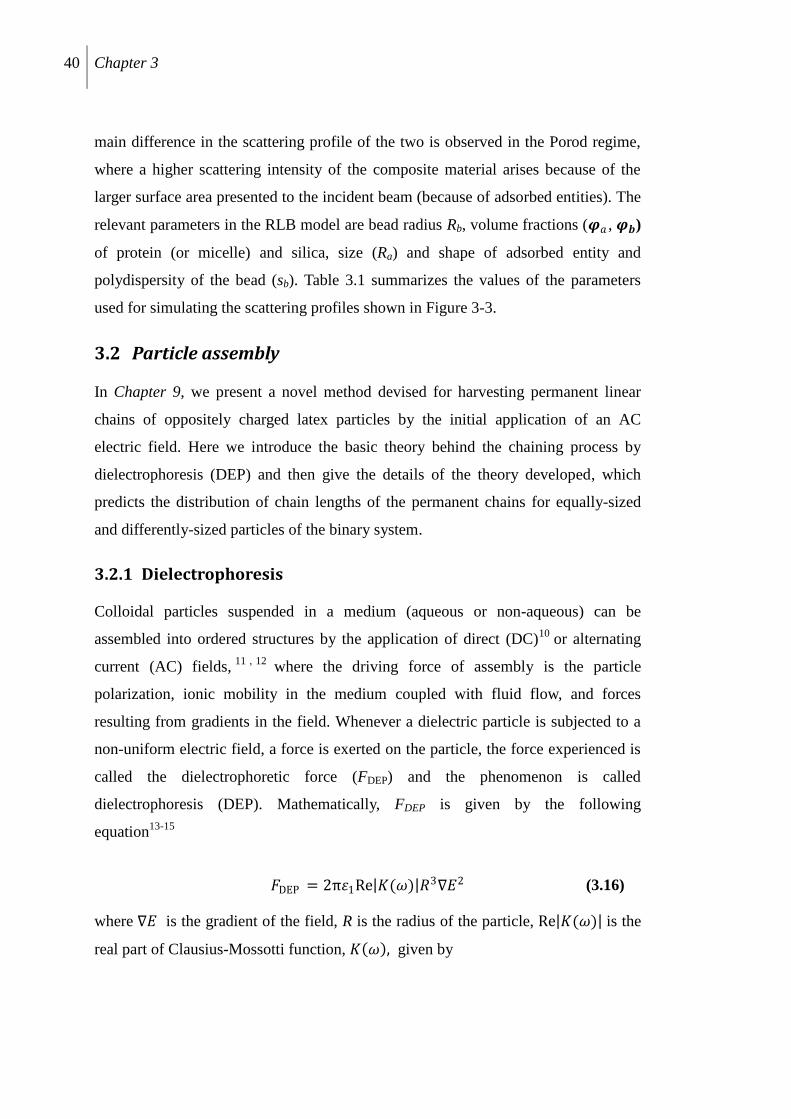
40 Chapter 3
main difference in the scattering profile of the two is observed in the Porod regime,
where a higher scattering intensity of the composite material arises because of the
larger surface area presented to the incident beam (because of adsorbed entities). The
relevant parameters in the RLB model are bead radius Rb, volume fractions (𝝋𝑎 , 𝝋𝒃)
of protein (or micelle) and silica, size (Ra) and shape of adsorbed entity and
polydispersity of the bead (sb). Table 3.1 summarizes the values of the parameters
used for simulating the scattering profiles shown in Figure 3-3.
3.2 Particle assembly
In Chapter 9, we present a novel method devised for harvesting permanent linear
chains of oppositely charged latex particles by the initial application of an AC
electric field. Here we introduce the basic theory behind the chaining process by
dielectrophoresis (DEP) and then give the details of the theory developed, which
predicts the distribution of chain lengths of the permanent chains for equally-sized
and differently-sized particles of the binary system.
3.2.1 Dielectrophoresis
Colloidal particles suspended in a medium (aqueous or non-aqueous) can be
assembled into ordered structures by the application of direct (DC)10
or alternating
current (AC) fields,11 , 12
where the driving force of assembly is the particle
polarization, ionic mobility in the medium coupled with fluid flow, and forces
resulting from gradients in the field. Whenever a dielectric particle is subjected to a
non-uniform electric field, a force is exerted on the particle, the force experienced is
called the dielectrophoretic force (FDEP) and the phenomenon is called
dielectrophoresis (DEP). Mathematically, FDEP is given by the following
equation13-15
𝐹DEP = 2π휀1Re 𝐾(𝜔) 𝑅3∇𝐸2 (3.16)
where ∇𝐸 is the gradient of the field, R is the radius of the particle, Re 𝐾(𝜔) is the
real part of Clausius-Mossotti function, 𝐾 𝜔 , given by
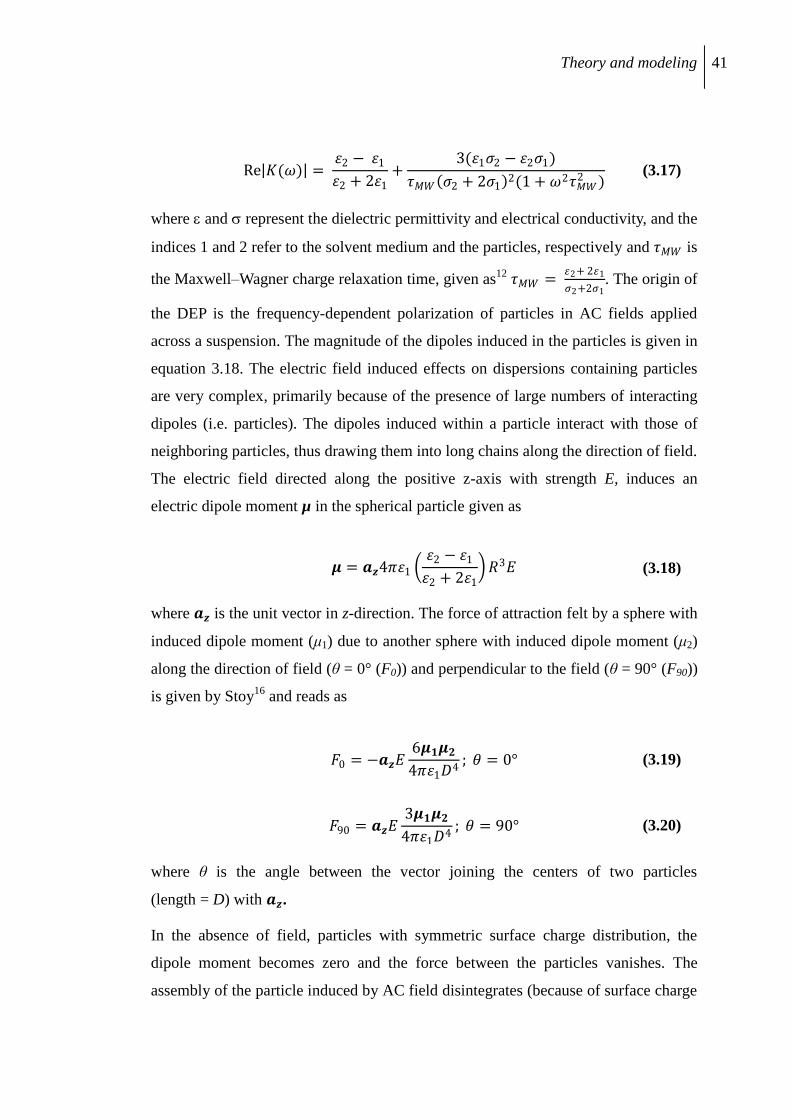
Theory and modeling 41
Re 𝐾(𝜔) = 휀2 − 휀1
휀2 + 2휀1+
3(휀1𝜍2 − 휀2𝜍1)
𝜏𝑀𝑊 𝜍2 + 2𝜍1 2(1 + 𝜔2𝜏𝑀𝑊2 )
(3.17)
where and represent the dielectric permittivity and electrical conductivity, and the
indices 1 and 2 refer to the solvent medium and the particles, respectively and 𝜏𝑀𝑊 is
the Maxwell–Wagner charge relaxation time, given as12
𝜏𝑀𝑊 = 휀2+ 2휀1
𝜍2+2𝜍1. The origin of
the DEP is the frequency-dependent polarization of particles in AC fields applied
across a suspension. The magnitude of the dipoles induced in the particles is given in
equation 3.18. The electric field induced effects on dispersions containing particles
are very complex, primarily because of the presence of large numbers of interacting
dipoles (i.e. particles). The dipoles induced within a particle interact with those of
neighboring particles, thus drawing them into long chains along the direction of field.
The electric field directed along the positive z-axis with strength E, induces an
electric dipole moment µ in the spherical particle given as
𝝁 = 𝒂𝒛4𝜋휀1 휀2 − 휀1
휀2 + 2휀1 𝑅3𝐸 (3.18)
where 𝒂𝒛 is the unit vector in z-direction. The force of attraction felt by a sphere with
induced dipole moment (μ1) due to another sphere with induced dipole moment (μ2)
along the direction of field (θ = 0° (F0)) and perpendicular to the field (θ = 90° (F90))
is given by Stoy16
and reads as
𝐹0 = −𝒂𝒛𝐸6𝝁𝟏𝝁𝟐
4𝜋휀1𝐷4; 휃 = 0° (3.19)
𝐹90 = 𝒂𝒛𝐸3𝝁𝟏𝝁𝟐
4𝜋휀1𝐷4; 휃 = 90° (3.20)
where θ is the angle between the vector joining the centers of two particles
(length = D) with 𝒂𝒛.
In the absence of field, particles with symmetric surface charge distribution, the
dipole moment becomes zero and the force between the particles vanishes. The
assembly of the particle induced by AC field disintegrates (because of surface charge
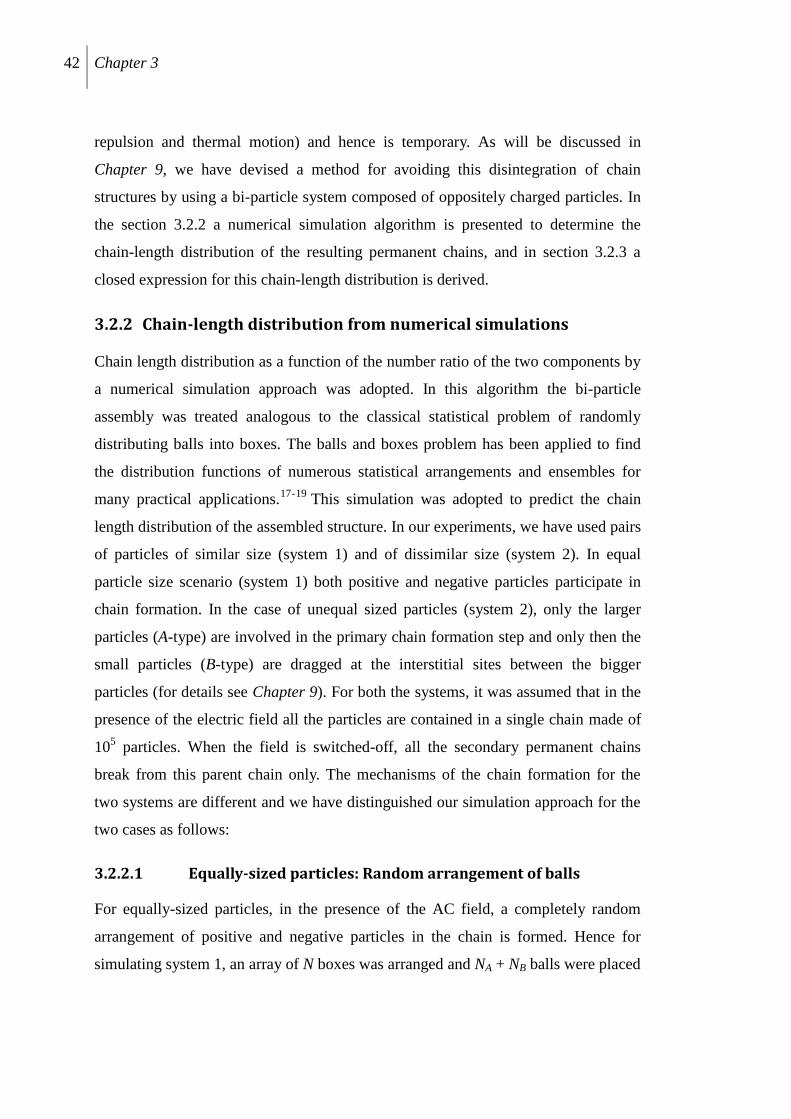
42 Chapter 3
repulsion and thermal motion) and hence is temporary. As will be discussed in
Chapter 9, we have devised a method for avoiding this disintegration of chain
structures by using a bi-particle system composed of oppositely charged particles. In
the section 3.2.2 a numerical simulation algorithm is presented to determine the
chain-length distribution of the resulting permanent chains, and in section 3.2.3 a
closed expression for this chain-length distribution is derived.
3.2.2 Chain-length distribution from numerical simulations
Chain length distribution as a function of the number ratio of the two components by
a numerical simulation approach was adopted. In this algorithm the bi-particle
assembly was treated analogous to the classical statistical problem of randomly
distributing balls into boxes. The balls and boxes problem has been applied to find
the distribution functions of numerous statistical arrangements and ensembles for
many practical applications.17-19
This simulation was adopted to predict the chain
length distribution of the assembled structure. In our experiments, we have used pairs
of particles of similar size (system 1) and of dissimilar size (system 2). In equal
particle size scenario (system 1) both positive and negative particles participate in
chain formation. In the case of unequal sized particles (system 2), only the larger
particles (A-type) are involved in the primary chain formation step and only then the
small particles (B-type) are dragged at the interstitial sites between the bigger
particles (for details see Chapter 9). For both the systems, it was assumed that in the
presence of the electric field all the particles are contained in a single chain made of
105 particles. When the field is switched-off, all the secondary permanent chains
break from this parent chain only. The mechanisms of the chain formation for the
two systems are different and we have distinguished our simulation approach for the
two cases as follows:
3.2.2.1 Equally-sized particles: Random arrangement of balls
For equally-sized particles, in the presence of the AC field, a completely random
arrangement of positive and negative particles in the chain is formed. Hence for
simulating system 1, an array of N boxes was arranged and NA + NB balls were placed
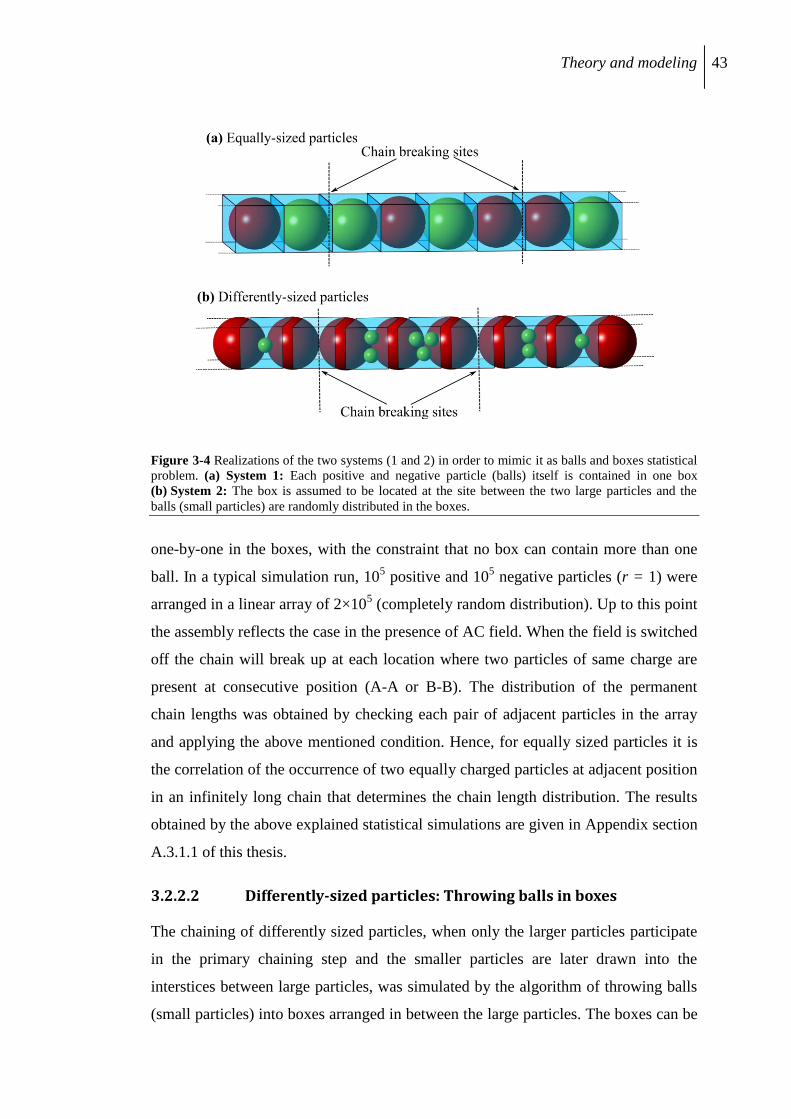
Theory and modeling 43
Figure 3-4 Realizations of the two systems (1 and 2) in order to mimic it as balls and boxes statistical
problem. (a) System 1: Each positive and negative particle (balls) itself is contained in one box
(b) System 2: The box is assumed to be located at the site between the two large particles and the
balls (small particles) are randomly distributed in the boxes.
one-by-one in the boxes, with the constraint that no box can contain more than one
ball. In a typical simulation run, 105 positive and 10
5 negative particles (r = 1) were
arranged in a linear array of 2×10⁵ (completely random distribution). Up to this point
the assembly reflects the case in the presence of AC field. When the field is switched
off the chain will break up at each location where two particles of same charge are
present at consecutive position (A-A or B-B). The distribution of the permanent
chain lengths was obtained by checking each pair of adjacent particles in the array
and applying the above mentioned condition. Hence, for equally sized particles it is
the correlation of the occurrence of two equally charged particles at adjacent position
in an infinitely long chain that determines the chain length distribution. The results
obtained by the above explained statistical simulations are given in Appendix section
A.3.1.1 of this thesis.
3.2.2.2 Differently-sized particles: Throwing balls in boxes
The chaining of differently sized particles, when only the larger particles participate
in the primary chaining step and the smaller particles are later drawn into the
interstices between large particles, was simulated by the algorithm of throwing balls
(small particles) into boxes arranged in between the large particles. The boxes can be
44 Chapter 3
taken as an analogy to the binding sites of small particles located in-between two
larger ones in the chain. In these simulations, the chain length was defined by the
number of large particles in the chains, rather than the total number (NA+NB) of
particles bound, as was the case in system 1. In a typical simulation run, a numbered
array of 105 boxes (binding sites = NA-1) was arranged and NB balls (= r×NA) were
distributed randomly with no restriction on the maximum occupancy of the box.
Here, the condition for chain rupturing was met when a box after distributing all the
balls remained unoccupied and the chain breaks away at that specific junction.
Again, the chain length distribution was expressed in terms of fraction of chains (Xn)
and fraction of particles (Φn) in the chains of given length (L). Hence, in this case it‟s
the correlation between the positions of the empty boxes in the single parent chain
that determines the chain length distribution of the permanent structures formed. It
has been shown in Appendix section A.3.1.2, if the number of balls thrown to a fixed
number of boxes increases, the mean chain length obtained increases, this can be
understood by the fact that as the average number of balls thrown per box increases.
The probability of a box to be occupied (containing at least 1 ball) increases. For
system 2, we carried out the simulations at different r values and compared the chain
length distribution given by simulations and the kinetic model.
3.2.3 Statistical model for chain length distribution
DEP can be used to assemble chains of charged spherical particles carrying opposite
charges in a permanent way. We consider an assembly of NA particles A (negatively
charged) and NB particles B (positively charged), all of equal size (radius R).
Experiments show that “chaining” depends not only on the concentration of A and B
type particles, but also on the size ratio of the two particles. Here we analyze the
distribution of chain lengths for two cases, namely pairs of oppositely charged
particles of equal and different sizes.
3.2.3.1 Equally-sized particles
For micrometer-sized particles the field-induced dipole interaction between the
particles outweighs the interactions caused by the positive and negative surface
charges of the two types of particles. Accordingly, in the electric field all the NA + NB
Theory and modeling 45
particles will assemble to long chains in which A and B particles are arranged in a
purely statistical order. When the field is switched off, the electrostatic interactions
between the charged surfaces of the particles determine the type of final structures
formed. For particles of sufficiently high charge, bonds between oppositely charged
neighboring particles (A–B) will survive, while bonds of equally charged
neighboring particles (A–A or B–B) will break. Since the particles in the long chains
had been arranged in a purely statistical manner, the probability of finding a chain of
n particles A and B in alternating order depends on the mole fraction x of (B-type)
particles in the biparticle dispersion. It is proportional to 𝑥𝑛/2 1 − 𝑥 𝑛/2 for equal
numbers of A and B (n even) and to 𝑥(𝑛+1)/2 1 − 𝑥 (𝑛−1)/2 for chains with B
particles on either end (n odd). For biparticle mixtures of stoichiometric composition
(𝑥 = 𝑥0 =1
2) thenormalized concentration of n-mer chains is given by 𝑋𝑛 =
1
2𝑥0
𝑛 .
When the composition deviates from the stoichiometric by some increment 𝛥𝑥, i.e.,
𝑥 = 𝑥0 + 𝛥𝑥, the normalized concentrations of n-mer chains can be expressed by a
polynomial in 𝛿 = 𝛥𝑥/𝑥0, which for δ < 0.1 can be approximated by
𝑋𝑛 =1
2𝑥0
𝑛 1 −𝑛 ′
2𝛿2 , (3.21)
where 𝑛′ = 𝑛 for even n and 𝑛′ = 𝑛 − 1 for odd n.
The results may also be expressed in terms of 𝛷𝑛 , the fraction of particles contained
in n-mer aggregates,
𝛷𝑛 = 𝑛X𝑛 = 𝑛𝑥𝑛 (3.22)
In System 1 of this study particles A and B have similar sizes (DB/DA = 1.1) and thus
the dipole moment induced by the electric field will also be similar (µB/µA ≈ 1.3).
Accordingly, this system should conform to the model of particle assembly outlined
above. Figure 9-2 of the thesis shows that the distribution law resulting for this
model (eqs. 3.21 and 3.22) indeed gives a good representation of the experimental
size distribution for this system.
46 Chapter 3
3.2.3.2 Differently-sized particles
When the size of the two types of particles differs at least by the factor 4, as in
system 2 of the studied systems (DB/DA = 0.225) [for details go to Chapter 9], the
induced dipole moments in the two particles will differ by about two orders of
magnitude (µB/µA ≈ 0.01). Accordingly, only the large (A-type) particles will
participate in the field-induced primary chain formation step. The small (B-type)
particles will attach to these chains in a secondary step only while the electric field is
still on. Based on evidence from earlier studies by Gupta20
et al. we suppose that the
attachment sites for the B particles are at the rim between neighboring A particles.
When the electric field is switched off, small B particles can form links between the
two oppositely charged A particles, possibly by slipping in a central location between
the neighboring A particles.
To model the resulting chain length distribution we assume that each contact
point in the chain of large particles (A) formed in the primary DEP process
represents a binding site for the positively charged small particles (B), which then
forms a permanent bond between the two A particles when the field is switched off.
If S - S0 out of the S binding sites in the primary chain of A particles are occupied by
B particles, and S0 sites remain vacant, the primary chain will break up into G = S0+1
fragment groups of particles (“secondary chains”) [The “number of chains” G
includes single A particles] when the field is switched off. As an example, consider
the situation of NA = 10 and NB = 6: The B particles form 6 bonds (indicated by
horizontal lines) and leave 3 vacant binding sites (vertical lines). Accordingly,
G = NA – NB = 4. In the example shown below the group is made up of one monomer
(N1 = 1), one dimer (N2 = 1) one trimer (N3 = 1) and one tetramer (N4 = 1):
O – O – O – O | O |O – O |O – O – O N1 = N2 = N3 = N4 = 1
However, different distributions of n-mers can be realized by interchange of the
locations of bonds and vacant sites, as summarized in the table below for NA = 10,
NB = 6 (G = 4).
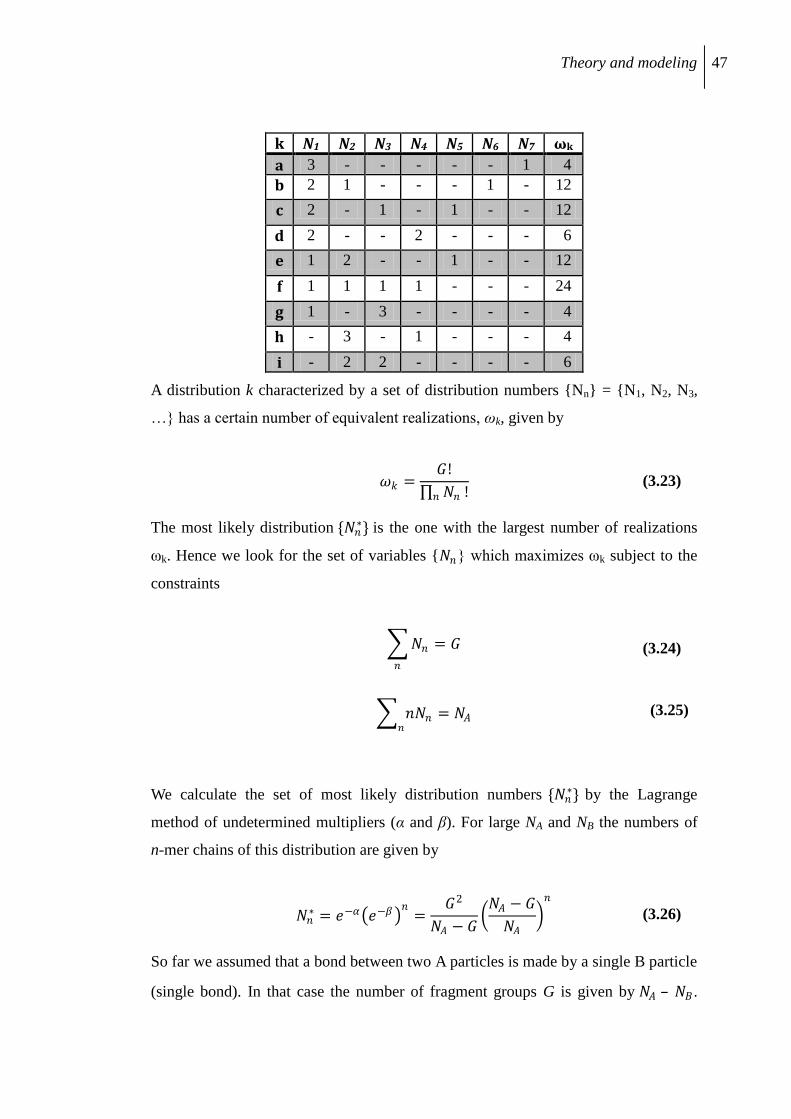
Theory and modeling 47
k N1 N2 N3 N4 N5 N6 N7 ωk
a 3 - - - - - 1 4
b 2 1 - - - 1 - 12
c 2 - 1 - 1 - - 12
d 2 - - 2 - - - 6
e 1 2 - - 1 - - 12
f 1 1 1 1 - - - 24
g 1 - 3 - - - - 4
h - 3 - 1 - - - 4
i - 2 2 - - - - 6
A distribution k characterized by a set of distribution numbers {Nn} = {N1, N2, N3,
…} has a certain number of equivalent realizations, ωk, given by
𝜔𝑘 =𝐺!
𝑁𝑛𝑛 ! (3.23)
The most likely distribution {𝑁𝑛∗} is the one with the largest number of realizations
ωk. Hence we look for the set of variables {𝑁𝑛} which maximizes ωk subject to the
constraints
𝑁𝑛
𝑛
= 𝐺 (3.24)
𝑛𝑁𝑛𝑛
= 𝑁𝐴 (3.25)
We calculate the set of most likely distribution numbers {𝑁𝑛∗} by the Lagrange
method of undetermined multipliers (α and β). For large NA and NB the numbers of
n-mer chains of this distribution are given by
𝑁𝑛∗ = 𝑒−𝛼 𝑒−𝛽
𝑛=
𝐺2
𝑁𝐴 − 𝐺 𝑁𝐴 − 𝐺
𝑁𝐴
𝑛
(3.26)
So far we assumed that a bond between two A particles is made by a single B particle
(single bond). In that case the number of fragment groups G is given by 𝑁𝐴 – 𝑁𝐵.
48 Chapter 3
Accordingly, no fragmentation should occur when 𝑁𝐵 is equal to the number of
binding sites, 𝑆 = 𝑁𝐴 − 1 ≈ 𝑁𝐴. The experiments show, however, that more than one
B particle can be accommodated between two A particles. This implies that some
sites will remain vacant even if 𝑁𝐵 > 𝑁𝐴. For large particle numbers 𝑁𝐴 and 𝑁𝐵 we
can replace the number of fragment groups by the number of vacant sites, i.e.,
𝑆0 = 𝐺 − 1 ≈ 𝐺. The number of n-mer chains normalized to the total number of A
particles, X𝑛 , and the fraction of A particles existing in form of r-mer chains, 𝛷𝑛 , is
then given by
X𝑛 =𝑁𝑛
∗
𝑁𝐴=
𝑆02
𝑁𝐴 𝑁𝐴 − 𝑆0 1 −
𝑆0
𝑁𝐴
𝑛
= 𝜍02 1 − 𝜍0 𝑛−1 (3.27)
Φ𝑛 = 𝑛𝑋𝑛 = 𝑛𝜍02 1 − 𝜍0 𝑛−1 (3.28)
where 𝜍0 = 𝑆0/𝑁𝐴 is the fraction of vacant sites.
Determination of the fraction of vacant sites 𝝈𝟎
To determine the fraction of vacant binding sites we have to consider the distribution
of B-type particles over the binding sites. The total number of binding sites, 𝑆, is
made up of vacant sites (S0), singly occupied sites (S1), doubly occupied sites (S2),
etc.
𝑆 = 𝑆0 + 𝑆1 + 𝑆2 + ⋯ = 𝑆0 + 𝑆𝑚
∞
𝑚=1
(3.29)
The distribution numbers 𝑆𝑚 will depend on whether the B-type particles are
bound to the binding sites in a reversible or irreversible way. Irreversible binding
leads to the Poisson distribution, while reversible binding can be treated by a
multiple-step mass-action law.
Theory and modeling 49
(a) Poisson distribution
According to the Poisson distribution law the probability of finding m out of N
particles on a given site is given by
𝑃𝑁 𝑚 = 𝑁𝑝 𝑚
𝑚!𝑒−𝑁𝑝 (3.30)
where p is the probability for a single particle to be on this site. In the present case
we have S equivalent binding sites and thus p= 1/S. When identifying N with the
number of B-type particles in the system, we have 𝑁𝑝 =𝑁𝐵
𝑆≈
𝑁𝐵
𝑁𝐴= 𝑟 . The
probability 𝑃𝑁 𝑚 can then be identified with the fraction of binding sites occupied
with m particles, 𝜍𝑚 = 𝑆𝑚 /𝑆,
𝜍𝑚 = 𝑟 𝑚
𝑚!𝑒−𝑟 with 𝑚 = 0,1,2 … (3.31)
Accordingly, on the basis of the Poisson distribution the fraction of vacant sites
(m = 0) is 𝜍0 = 𝑒−𝑟 .
(b) Multiple-step mass action law
When binding of B particles to vacant binding sites is reversible, the numbers of
vacant and single occupied sites along the chain will be connected by a Langmuir
type equilibrium
𝑆1 = 𝐾1𝑐𝐵𝑆0 (3.32)
where 𝐾1 represents a binding constant and 𝑐𝐵 is the concentration of free
(nonbound) B particles. A similar relation will apply for the numbers of sites
occupied by one and two particles, and generally for the numbers of sites occupied
by 𝑚 − 1 and 𝑚 particles, viz.
𝑆𝑚 = 𝐾𝑚𝑐𝐵𝑆𝑚−1 for 𝑚 = 2,3 … (3.33)
where 𝐾𝑚 represents the binding constant for sites at which 𝑚 − 1 particles are
already bound. Here we assume that all binding constants are equal, i.e. 𝐾1 = 𝐾2 =
⋯ = 𝐾. With the abbreviation 𝑧 = 𝐾𝑐𝐵 we then obtain
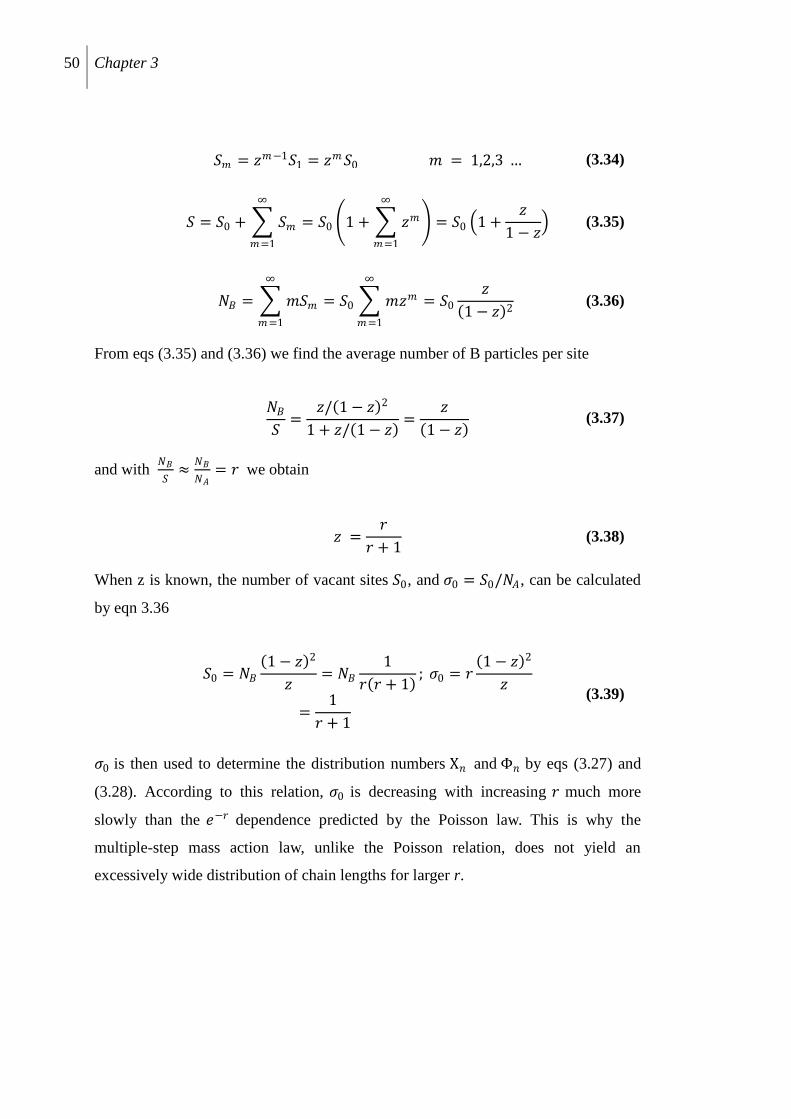
50 Chapter 3
𝑆𝑚 = 𝑧𝑚−1𝑆1 = 𝑧𝑚𝑆0 𝑚 = 1,2,3 … (3.34)
𝑆 = 𝑆0 + 𝑆𝑚
∞
𝑚=1
= 𝑆0 1 + 𝑧𝑚
∞
𝑚=1
= 𝑆0 1 +𝑧
1 − 𝑧 (3.35)
𝑁𝐵 = 𝑚𝑆𝑚
∞
𝑚=1
= 𝑆0 𝑚𝑧𝑚
∞
𝑚=1
= 𝑆0
𝑧
1 − 𝑧 2 (3.36)
From eqs (3.35) and (3.36) we find the average number of B particles per site
𝑁𝐵
𝑆=
𝑧/ 1 − 𝑧 2
1 + 𝑧/ 1 − 𝑧 =
𝑧
1 − 𝑧 (3.37)
and with 𝑁𝐵
𝑆≈
𝑁𝐵
𝑁𝐴= 𝑟 we obtain
𝑧 =𝑟
𝑟 + 1 (3.38)
When z is known, the number of vacant sites 𝑆0, and 𝜍0 = 𝑆0/𝑁𝐴, can be calculated
by eqn 3.36
𝑆0 = 𝑁𝐵
1 − 𝑧 2
𝑧= 𝑁𝐵
1
𝑟 𝑟 + 1 ; 𝜍0 = 𝑟
1 − 𝑧 2
𝑧
=1
𝑟 + 1
(3.39)
𝜍0 is then used to determine the distribution numbers X𝑛 and Φ𝑛 by eqs (3.27) and
(3.28). According to this relation, 𝜍0 is decreasing with increasing 𝑟 much more
slowly than the 𝑒−𝑟 dependence predicted by the Poisson law. This is why the
multiple-step mass action law, unlike the Poisson relation, does not yield an
excessively wide distribution of chain lengths for larger r.
Theory and modeling 51
References
1 Consortium Scilab - Digiteo (2011). Scilab: Free and Open Source software for
numerical computation (OS, Version 5.3.3) [Software]. Available from:
http://www.scilab.org
2 http://kur.web.psi.ch/sans1/SANSSoft/sasfit.html
3 Oberdisse, J., Phys. Chem. Chem. Phys., 2004, 6, 1557.
4 http://www.math.niu.edu/~rusin/known-math/96/sph.rand
5 Despert, G., Oberdisse, J., Langmuir, 2003, 19, 7604.
6 Percus, J. K., Yevick, G. J., Phys. Rev., 1958, 110, 1.
7 Vrij, A., J. Chem. Phys., 1979, 71, 3267.
8 Pi, M., Yang, T., Yuan, J., Fujii, S., Kakigi, Y., Nakamura, Y., Cheng, S., Colloid
Surf. B, 2010, 78, 193.
9 Su, Y., Yan, R., Dan, M., Xu, J., Wang, D., Zhang, W., Lu, S., Langmuir, 2011, 27,
8983.
10 Holgado, M., Santamaria, F. G., Blanco, A., Ibisate, M., Cintas, A., Miguez, H.,
Serna, C. J., Molpeceres, C., Requena, J., Mifsud, A., Meseguer, F., Lopez, C.,
Langmuir, 1999, 15, 4701.
11 Hermanson, K. D., Lumsdon, S. O., Williams, J. P., Kaler, E. W., Velev, O. D.,
Science, 2001, 294, 1082.
12 Velev, O. D., Bhatt, K. H., Soft matter, 2006, 2, 738.
13 Pohl, H. A., J. Appl. Phys., 1951, 22, 869.
14 Jones, T. B., “Electromechanics of particles”, 1995, Cambridge University Press,
UK.
15 Muller, T., Gerardino, A., Schnelle, T., Shirley, S. G., Bordoni, F., DeGasperis, G.,
Leoni, R., Fuhr, G., J. Phys. D: Appl. Phys., 1996, 29, 340.
52 Chapter 3
16 Stoy, R. D., J. Electrostat., 1994, 33, 385.
17 Davis, J. M., Giddings, J. C., Anal. Chem., 1983, 55, 418.
18 Bialas, P., Bogacz, L., Jhonston, D., Nucl. Phys. B, 2000, 5, 599.
19 Ewens, W. J., Wilf, H. S., Proc. Natl. Acad. Sci. USA, 2007, 27, 11189.
20 Gupta, S., Alargova, R. G., Kilpatrick, P. K., Velev, O. D., Soft Matter, 2008, 4,
726.
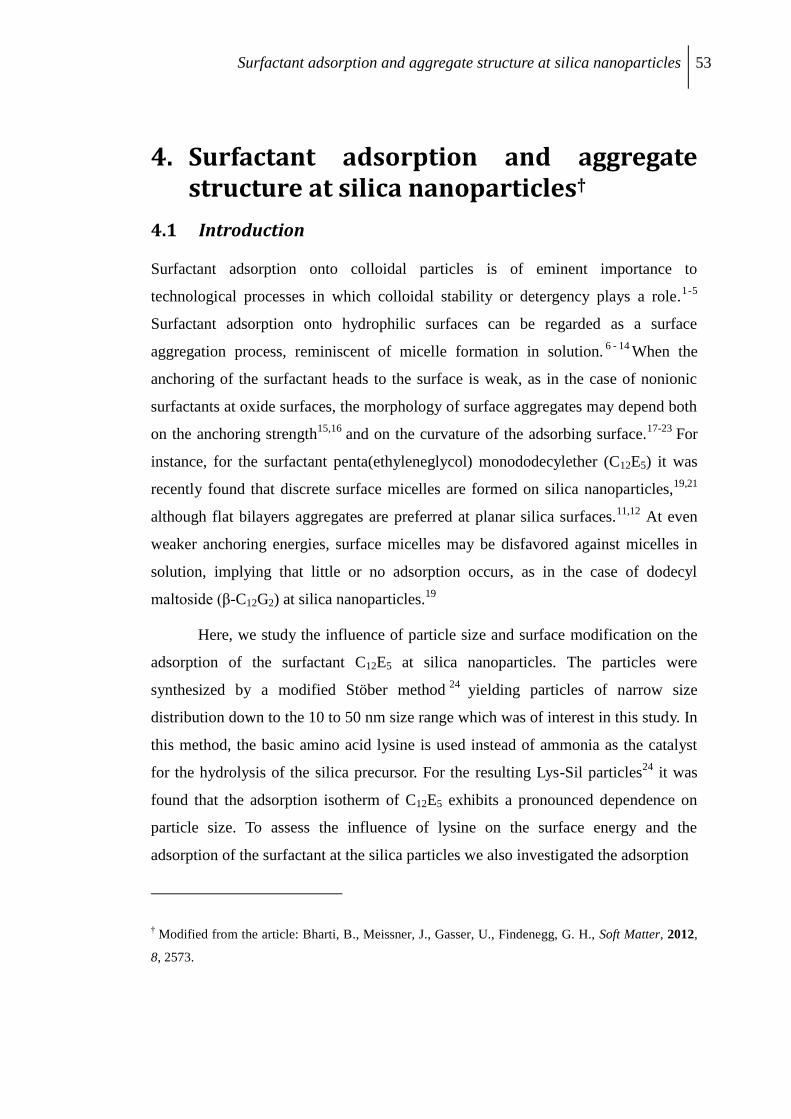
Surfactant adsorption and aggregate structure at silica nanoparticles 53
4. Surfactant adsorption and aggregate structure at silica nanoparticles†
4.1 Introduction
Surfactant adsorption onto colloidal particles is of eminent importance to
technological processes in which colloidal stability or detergency plays a role.1-5
Surfactant adsorption onto hydrophilic surfaces can be regarded as a surface
aggregation process, reminiscent of micelle formation in solution.6 - 14
When the
anchoring of the surfactant heads to the surface is weak, as in the case of nonionic
surfactants at oxide surfaces, the morphology of surface aggregates may depend both
on the anchoring strength15,16
and on the curvature of the adsorbing surface.17-23
For
instance, for the surfactant penta(ethyleneglycol) monododecylether (C12E5) it was
recently found that discrete surface micelles are formed on silica nanoparticles,19,21
although flat bilayers aggregates are preferred at planar silica surfaces.11,12
At even
weaker anchoring energies, surface micelles may be disfavored against micelles in
solution, implying that little or no adsorption occurs, as in the case of dodecyl
maltoside (β-C12G2) at silica nanoparticles.19
Here, we study the influence of particle size and surface modification on the
adsorption of the surfactant C12E5 at silica nanoparticles. The particles were
synthesized by a modified Stöber method24
yielding particles of narrow size
distribution down to the 10 to 50 nm size range which was of interest in this study. In
this method, the basic amino acid lysine is used instead of ammonia as the catalyst
for the hydrolysis of the silica precursor. For the resulting Lys-Sil particles24
it was
found that the adsorption isotherm of C12E5 exhibits a pronounced dependence on
particle size. To assess the influence of lysine on the surface energy and the
adsorption of the surfactant at the silica particles we also investigated the adsorption
† Modified from the article: Bharti, B., Meissner, J., Gasser, U., Findenegg, G. H., Soft Matter, 2012,
8, 2573.
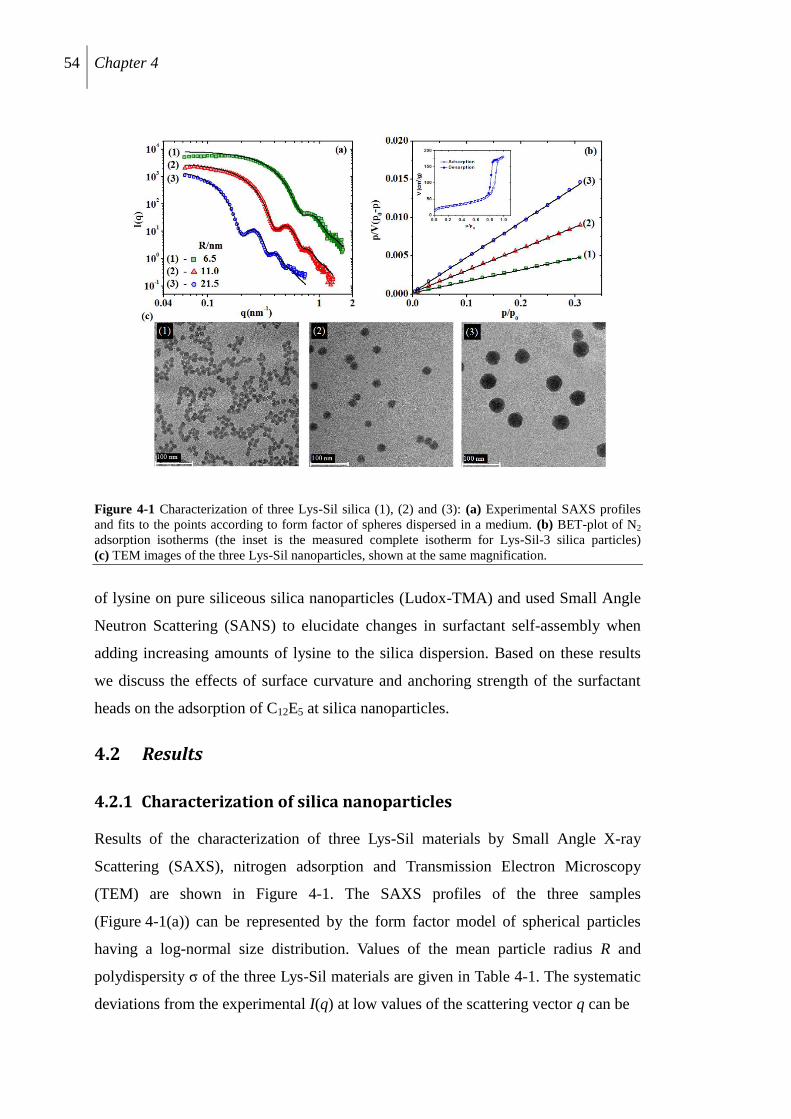
54 Chapter 4
Figure 4-1 Characterization of three Lys-Sil silica (1), (2) and (3): (a) Experimental SAXS profiles
and fits to the points according to form factor of spheres dispersed in a medium. (b) BET-plot of N2
adsorption isotherms (the inset is the measured complete isotherm for Lys-Sil-3 silica particles)
(c) TEM images of the three Lys-Sil nanoparticles, shown at the same magnification.
of lysine on pure siliceous silica nanoparticles (Ludox-TMA) and used Small Angle
Neutron Scattering (SANS) to elucidate changes in surfactant self-assembly when
adding increasing amounts of lysine to the silica dispersion. Based on these results
we discuss the effects of surface curvature and anchoring strength of the surfactant
heads on the adsorption of C12E5 at silica nanoparticles.
4.2 Results
4.2.1 Characterization of silica nanoparticles
Results of the characterization of three Lys-Sil materials by Small Angle X-ray
Scattering (SAXS), nitrogen adsorption and Transmission Electron Microscopy
(TEM) are shown in Figure 4-1. The SAXS profiles of the three samples
(Figure 4-1(a)) can be represented by the form factor model of spherical particles
having a log-normal size distribution. Values of the mean particle radius R and
polydispersity σ of the three Lys-Sil materials are given in Table 4-1. The systematic
deviations from the experimental I(q) at low values of the scattering vector q can be
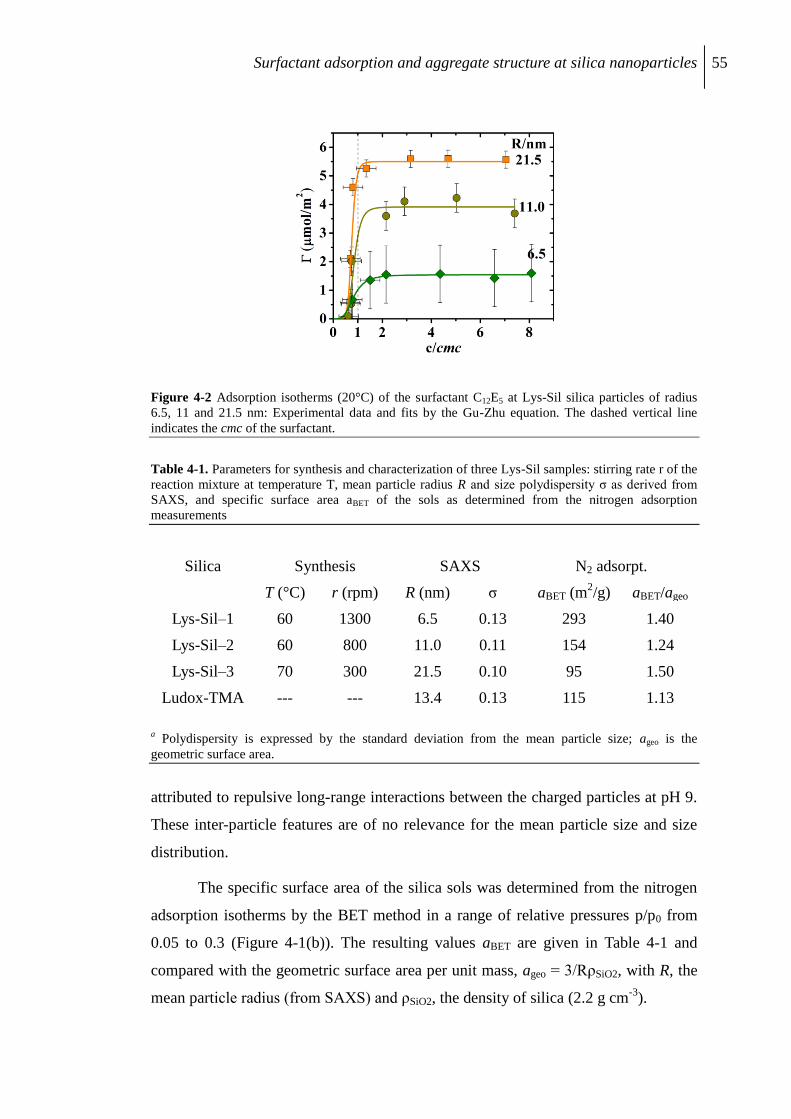
Surfactant adsorption and aggregate structure at silica nanoparticles 55
Figure 4-2 Adsorption isotherms (20°C) of the surfactant C12E5 at Lys-Sil silica particles of radius
6.5, 11 and 21.5 nm: Experimental data and fits by the Gu-Zhu equation. The dashed vertical line
indicates the cmc of the surfactant.
Table 4-1. Parameters for synthesis and characterization of three Lys-Sil samples: stirring rate r of the
reaction mixture at temperature T, mean particle radius R and size polydispersity σ as derived from
SAXS, and specific surface area aBET of the sols as determined from the nitrogen adsorption
measurements
Silica Synthesis SAXS N2 adsorpt.
T (°C) r (rpm) R (nm) σ aBET (m2/g) aBET/ageo
Lys-Sil–1 60 1300 6.5 0.13 293 1.40
Lys-Sil–2 60 800 11.0 0.11 154 1.24
Lys-Sil–3 70 300 21.5 0.10 95 1.50
Ludox-TMA --- --- 13.4 0.13 115 1.13
a Polydispersity is expressed by the standard deviation from the mean particle size; ageo is the
geometric surface area.
attributed to repulsive long-range interactions between the charged particles at pH 9.
These inter-particle features are of no relevance for the mean particle size and size
distribution.
The specific surface area of the silica sols was determined from the nitrogen
adsorption isotherms by the BET method in a range of relative pressures p/p0 from
0.05 to 0.3 (Figure 4-1(b)). The resulting values aBET are given in Table 4-1 and
compared with the geometric surface area per unit mass, ageo = 3/RρSiO2, with R, the
mean particle radius (from SAXS) and ρSiO2, the density of silica (2.2 g cm-3
).
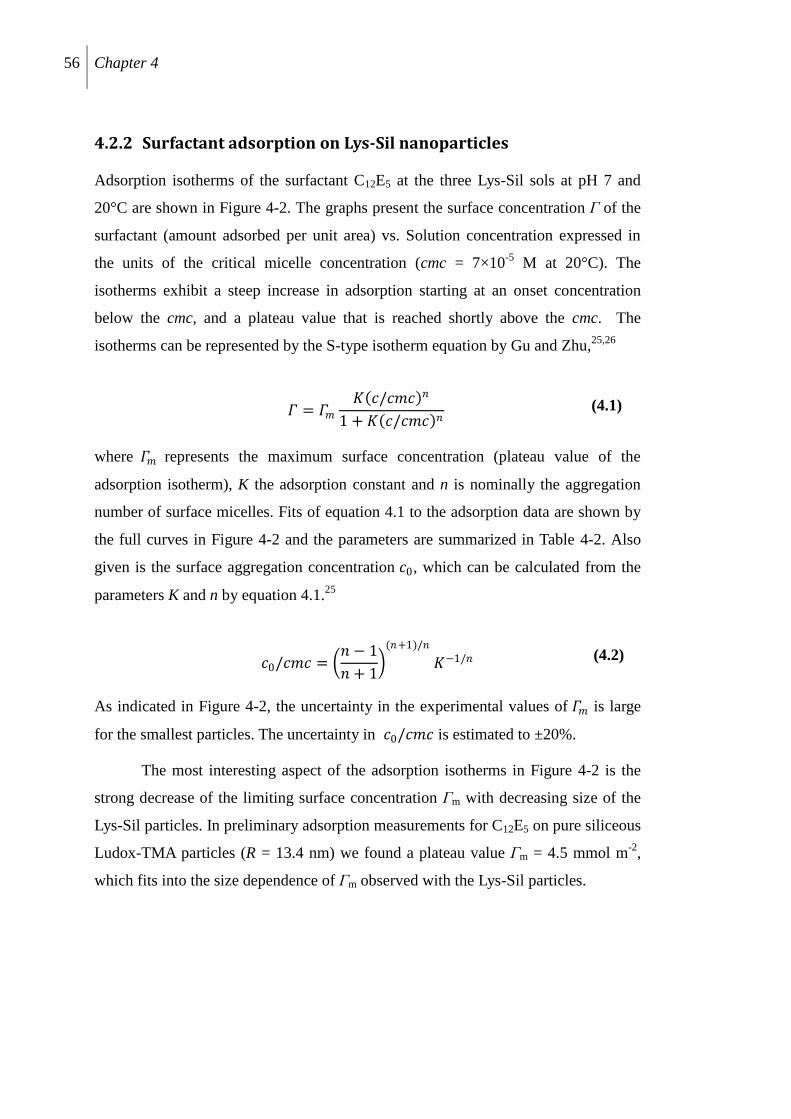
56 Chapter 4
4.2.2 Surfactant adsorption on Lys-Sil nanoparticles
Adsorption isotherms of the surfactant C12E5 at the three Lys-Sil sols at pH 7 and
20°C are shown in Figure 4-2. The graphs present the surface concentration Γ of the
surfactant (amount adsorbed per unit area) vs. Solution concentration expressed in
the units of the critical micelle concentration (cmc = 7×10⁻⁵
M at 20°C). The
isotherms exhibit a steep increase in adsorption starting at an onset concentration
below the cmc, and a plateau value that is reached shortly above the cmc. The
isotherms can be represented by the S-type isotherm equation by Gu and Zhu,25,26
𝛤 = 𝛤𝑚
𝐾 𝑐/𝑐𝑚𝑐 𝑛
1 + 𝐾 𝑐/𝑐𝑚𝑐 𝑛 (4.1)
where 𝛤𝑚 represents the maximum surface concentration (plateau value of the
adsorption isotherm), K the adsorption constant and n is nominally the aggregation
number of surface micelles. Fits of equation 4.1 to the adsorption data are shown by
the full curves in Figure 4-2 and the parameters are summarized in Table 4-2. Also
given is the surface aggregation concentration 𝑐0, which can be calculated from the
parameters K and n by equation 4.1.25
𝑐0/𝑐𝑚𝑐 = 𝑛 − 1
𝑛 + 1
(𝑛+1)/𝑛
𝐾−1/𝑛 (4.2)
As indicated in Figure 4-2, the uncertainty in the experimental values of 𝛤𝑚 is large
for the smallest particles. The uncertainty in 𝑐0/𝑐𝑚𝑐 is estimated to ±20%.
The most interesting aspect of the adsorption isotherms in Figure 4-2 is the
strong decrease of the limiting surface concentration Γm with decreasing size of the
Lys-Sil particles. In preliminary adsorption measurements for C12E5 on pure siliceous
Ludox-TMA particles (R = 13.4 nm) we found a plateau value Γm = 4.5 mmol m-2
,
which fits into the size dependence of Γm observed with the Lys-Sil particles.
Surfactant adsorption and aggregate structure at silica nanoparticles 57
Figure 4-3 Adsorption isotherm of lysine on Ludox-TMA silica: experimental data and fit by the
Langmuir equation.
Table 4-2. Adsorption of C12E5 at Lys-Sil nanoparticles. Fit of adsorption data of Figure 4-2 by
equation 1: maximum surface concentration Γm, adsorption constant K, nominal aggregation number
of surface micelles n, and ratio of surface aggregation concentration to critical micelle concentration.
Silica R (nm) Γm (µmol m-2
) K n c0/cmc
Lys-Sil–1 6.5 1.5 1.9 3.7 0.42
Lys-Sil–2 11 3.9 2.8 6.2 0.58
Lys-Sil–3 21.5 5.5 12 8.8 0.58
Yokoi et al.27
investigated the formation and properties of Lys-Sil
nanoparticles using a combination of liquid-state 13
C NMR, solid-state 13
C CP/MAS
NMR, thermogravimetry, and differential thermal analysis. They concluded that a
substantial fraction of lysine used in the particle synthesis remains adsorbed at the
nanospheres. To find out in what way adsorbed lysine may affect the adsorption of
the surfactant, we studied the adsorption of lysine on pure siliceous nanoparticles.
4.2.3 Lysine adsorption on silica nanoparticles
The adsorption of lysine was studied on Ludox-TMA silica sol, as this material is
free from any other organic base. The results are shown in Figure 4-3. Within error
limits the adsorption data can be represented by the Langmuir equation:
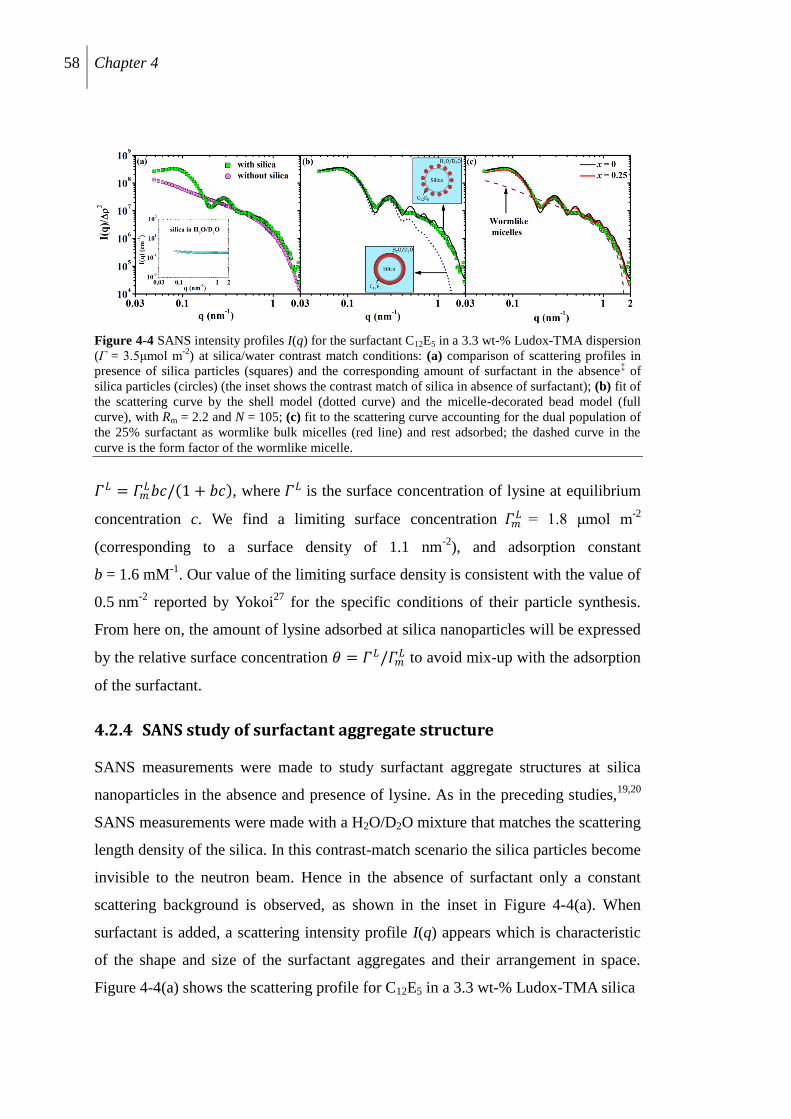
58 Chapter 4
Figure 4-4 SANS intensity profiles I(q) for the surfactant C12E5 in a 3.3 wt-% Ludox-TMA dispersion
(Γ = 3.5μmol m-2
) at silica/water contrast match conditions: (a) comparison of scattering profiles in
presence of silica particles (squares) and the corresponding amount of surfactant in the absence‡ of
silica particles (circles) (the inset shows the contrast match of silica in absence of surfactant); (b) fit of
the scattering curve by the shell model (dotted curve) and the micelle-decorated bead model (full
curve), with Rm = 2.2 and N = 105; (c) fit to the scattering curve accounting for the dual population of
the 25% surfactant as wormlike bulk micelles (red line) and rest adsorbed; the dashed curve in the
curve is the form factor of the wormlike micelle.
𝛤𝐿 = 𝛤𝑚𝐿𝑏𝑐/ 1 + 𝑏𝑐 , where 𝛤𝐿 is the surface concentration of lysine at equilibrium
concentration c. We find a limiting surface concentration 𝛤𝑚𝐿
= 1.8 μmol m-2
(corresponding to a surface density of 1.1 nm-2
), and adsorption constant
b = 1.6 mM-1
. Our value of the limiting surface density is consistent with the value of
0.5 nm-2
reported by Yokoi27
for the specific conditions of their particle synthesis.
From here on, the amount of lysine adsorbed at silica nanoparticles will be expressed
by the relative surface concentration 휃 = 𝛤𝐿/𝛤𝑚𝐿 to avoid mix-up with the adsorption
of the surfactant.
4.2.4 SANS study of surfactant aggregate structure
SANS measurements were made to study surfactant aggregate structures at silica
nanoparticles in the absence and presence of lysine. As in the preceding studies,19,20
SANS measurements were made with a H2O/D2O mixture that matches the scattering
length density of the silica. In this contrast-match scenario the silica particles become
invisible to the neutron beam. Hence in the absence of surfactant only a constant
scattering background is observed, as shown in the inset in Figure 4-4(a). When
surfactant is added, a scattering intensity profile I(q) appears which is characteristic
of the shape and size of the surfactant aggregates and their arrangement in space.
Figure 4-4(a) shows the scattering profile for C12E5 in a 3.3 wt-% Ludox-TMA silica
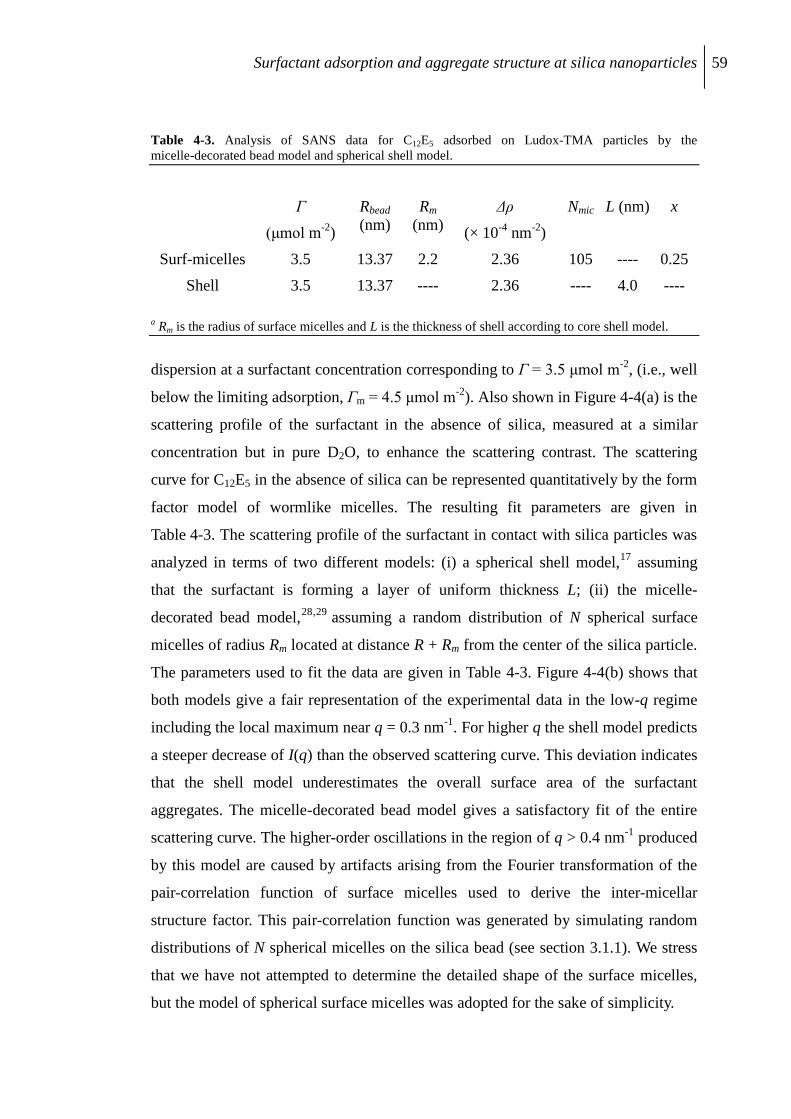
Surfactant adsorption and aggregate structure at silica nanoparticles 59
Table 4-3. Analysis of SANS data for C12E5 adsorbed on Ludox-TMA particles by the
micelle-decorated bead model and spherical shell model.
Γ
(μmol m-2
)
Rbead
(nm)
Rm
(nm)
Δρ
(× 10-4
nm-2
)
Nmic L (nm) x
Surf-micelles 3.5 13.37 2.2 2.36 105 ---- 0.25
Shell 3.5 13.37 ---- 2.36 ---- 4.0 ----
a Rm is the radius of surface micelles and L is the thickness of shell according to core shell model.
dispersion at a surfactant concentration corresponding to Γ = 3.5 μmol m-2
, (i.e., well
below the limiting adsorption, Γm = 4.5 μmol m-2
). Also shown in Figure 4-4(a) is the
scattering profile of the surfactant in the absence of silica, measured at a similar
concentration but in pure D2O, to enhance the scattering contrast. The scattering
curve for C12E5 in the absence of silica can be represented quantitatively by the form
factor model of wormlike micelles. The resulting fit parameters are given in
Table 4-3. The scattering profile of the surfactant in contact with silica particles was
analyzed in terms of two different models: (i) a spherical shell model,17
assuming
that the surfactant is forming a layer of uniform thickness L; (ii) the micelle-
decorated bead model,28,29
assuming a random distribution of N spherical surface
micelles of radius Rm located at distance R + Rm from the center of the silica particle.
The parameters used to fit the data are given in Table 4-3. Figure 4-4(b) shows that
both models give a fair representation of the experimental data in the low-q regime
including the local maximum near q = 0.3 nm-1
. For higher q the shell model predicts
a steeper decrease of I(q) than the observed scattering curve. This deviation indicates
that the shell model underestimates the overall surface area of the surfactant
aggregates. The micelle-decorated bead model gives a satisfactory fit of the entire
scattering curve. The higher-order oscillations in the region of q > 0.4 nm-1
produced
by this model are caused by artifacts arising from the Fourier transformation of the
pair-correlation function of surface micelles used to derive the inter-micellar
structure factor. This pair-correlation function was generated by simulating random
distributions of N spherical micelles on the silica bead (see section 3.1.1). We stress
that we have not attempted to determine the detailed shape of the surface micelles,
but the model of spherical surface micelles was adopted for the sake of simplicity.
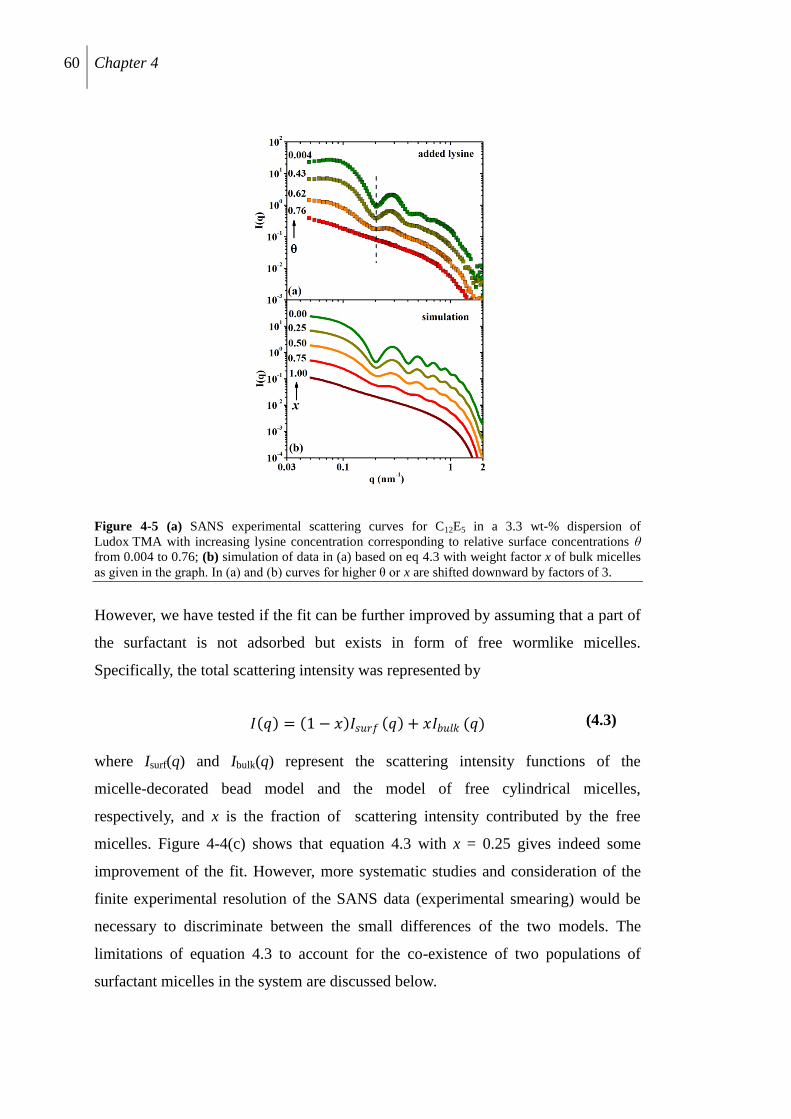
60 Chapter 4
Figure 4-5 (a) SANS experimental scattering curves for C12E5 in a 3.3 wt-% dispersion of
Ludox TMA with increasing lysine concentration corresponding to relative surface concentrations θ
from 0.004 to 0.76; (b) simulation of data in (a) based on eq 4.3 with weight factor x of bulk micelles
as given in the graph. In (a) and (b) curves for higher θ or x are shifted downward by factors of 3.
However, we have tested if the fit can be further improved by assuming that a part of
the surfactant is not adsorbed but exists in form of free wormlike micelles.
Specifically, the total scattering intensity was represented by
𝐼 𝑞 = 1 − 𝑥 𝐼𝑠𝑢𝑟𝑓 𝑞 + 𝑥𝐼𝑏𝑢𝑙𝑘 (𝑞) (4.3)
where Isurf(q) and Ibulk(q) represent the scattering intensity functions of the
micelle-decorated bead model and the model of free cylindrical micelles,
respectively, and x is the fraction of scattering intensity contributed by the free
micelles. Figure 4-4(c) shows that equation 4.3 with x = 0.25 gives indeed some
improvement of the fit. However, more systematic studies and consideration of the
finite experimental resolution of the SANS data (experimental smearing) would be
necessary to discriminate between the small differences of the two models. The
limitations of equation 4.3 to account for the co-existence of two populations of
surfactant micelles in the system are discussed below.
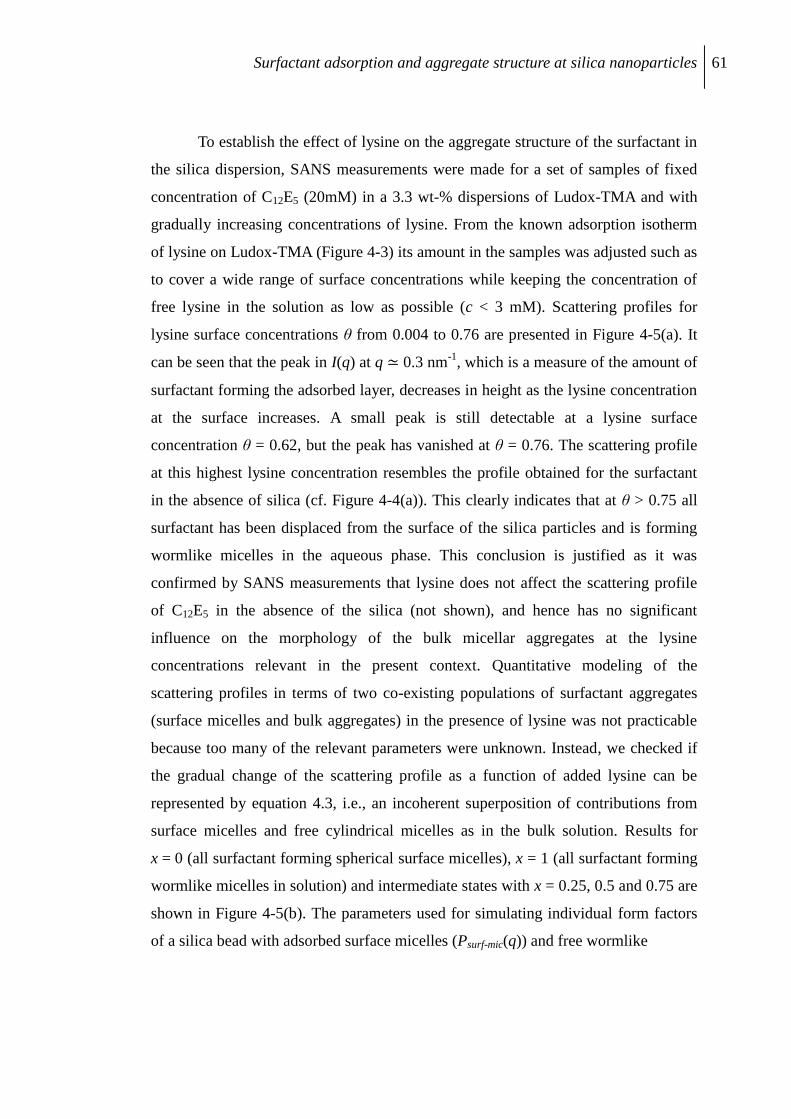
Surfactant adsorption and aggregate structure at silica nanoparticles 61
To establish the effect of lysine on the aggregate structure of the surfactant in
the silica dispersion, SANS measurements were made for a set of samples of fixed
concentration of C12E5 (20mM) in a 3.3 wt-% dispersions of Ludox-TMA and with
gradually increasing concentrations of lysine. From the known adsorption isotherm
of lysine on Ludox-TMA (Figure 4-3) its amount in the samples was adjusted such as
to cover a wide range of surface concentrations while keeping the concentration of
free lysine in the solution as low as possible (c < 3 mM). Scattering profiles for
lysine surface concentrations θ from 0.004 to 0.76 are presented in Figure 4-5(a). It
can be seen that the peak in I(q) at q ≃ 0.3 nm-1
, which is a measure of the amount of
surfactant forming the adsorbed layer, decreases in height as the lysine concentration
at the surface increases. A small peak is still detectable at a lysine surface
concentration θ = 0.62, but the peak has vanished at θ = 0.76. The scattering profile
at this highest lysine concentration resembles the profile obtained for the surfactant
in the absence of silica (cf. Figure 4-4(a)). This clearly indicates that at θ > 0.75 all
surfactant has been displaced from the surface of the silica particles and is forming
wormlike micelles in the aqueous phase. This conclusion is justified as it was
confirmed by SANS measurements that lysine does not affect the scattering profile
of C12E5 in the absence of the silica (not shown), and hence has no significant
influence on the morphology of the bulk micellar aggregates at the lysine
concentrations relevant in the present context. Quantitative modeling of the
scattering profiles in terms of two co-existing populations of surfactant aggregates
(surface micelles and bulk aggregates) in the presence of lysine was not practicable
because too many of the relevant parameters were unknown. Instead, we checked if
the gradual change of the scattering profile as a function of added lysine can be
represented by equation 4.3, i.e., an incoherent superposition of contributions from
surface micelles and free cylindrical micelles as in the bulk solution. Results for
x = 0 (all surfactant forming spherical surface micelles), x = 1 (all surfactant forming
wormlike micelles in solution) and intermediate states with x = 0.25, 0.5 and 0.75 are
shown in Figure 4-5(b). The parameters used for simulating individual form factors
of a silica bead with adsorbed surface micelles (Psurf-mic(q)) and free wormlike
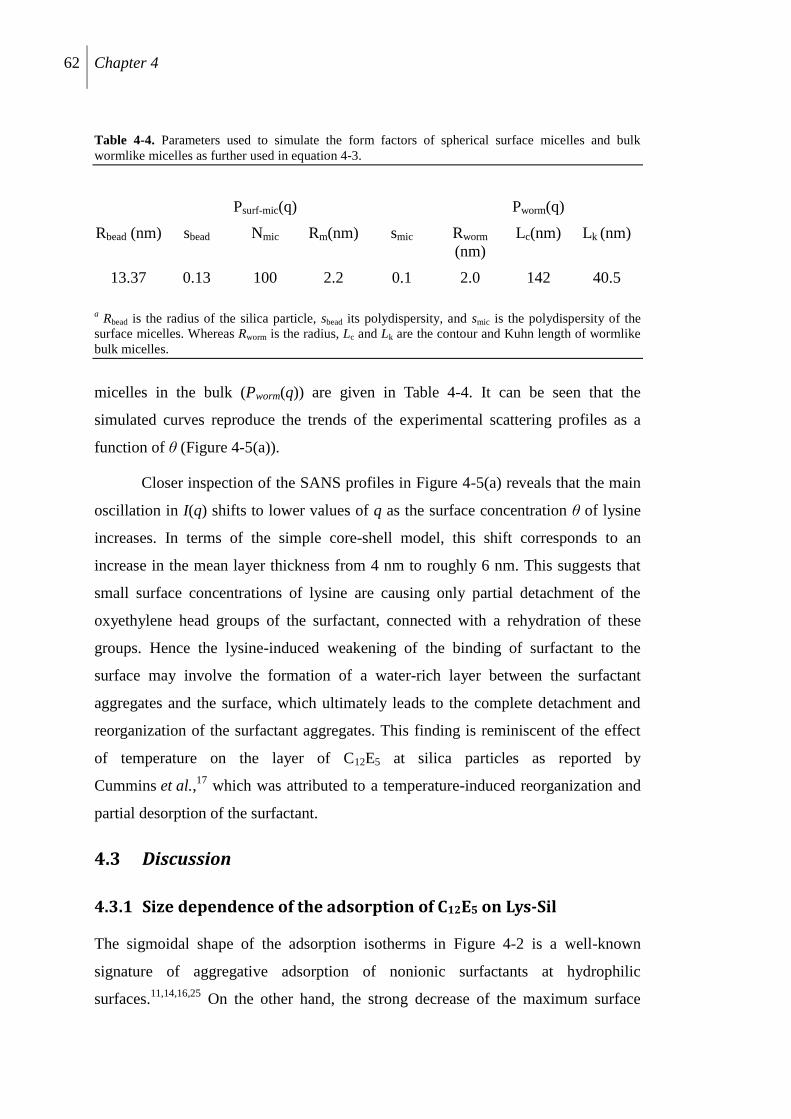
62 Chapter 4
Table 4-4. Parameters used to simulate the form factors of spherical surface micelles and bulk
wormlike micelles as further used in equation 4-3.
Psurf-mic(q) Pworm(q)
Rbead (nm) sbead Nmic Rm(nm) smic Rworm
(nm)
Lc(nm) Lk (nm)
13.37 0.13 100 2.2 0.1 2.0 142 40.5
a Rbead is the radius of the silica particle, sbead its polydispersity, and smic is the polydispersity of the
surface micelles. Whereas Rworm is the radius, Lc and Lk are the contour and Kuhn length of wormlike
bulk micelles.
micelles in the bulk (Pworm(q)) are given in Table 4-4. It can be seen that the
simulated curves reproduce the trends of the experimental scattering profiles as a
function of θ (Figure 4-5(a)).
Closer inspection of the SANS profiles in Figure 4-5(a) reveals that the main
oscillation in I(q) shifts to lower values of q as the surface concentration θ of lysine
increases. In terms of the simple core-shell model, this shift corresponds to an
increase in the mean layer thickness from 4 nm to roughly 6 nm. This suggests that
small surface concentrations of lysine are causing only partial detachment of the
oxyethylene head groups of the surfactant, connected with a rehydration of these
groups. Hence the lysine-induced weakening of the binding of surfactant to the
surface may involve the formation of a water-rich layer between the surfactant
aggregates and the surface, which ultimately leads to the complete detachment and
reorganization of the surfactant aggregates. This finding is reminiscent of the effect
of temperature on the layer of C12E5 at silica particles as reported by
Cummins et al.,17
which was attributed to a temperature-induced reorganization and
partial desorption of the surfactant.
4.3 Discussion
4.3.1 Size dependence of the adsorption of C12E5 on Lys-Sil
The sigmoidal shape of the adsorption isotherms in Figure 4-2 is a well-known
signature of aggregative adsorption of nonionic surfactants at hydrophilic
surfaces.11,14,16,25
On the other hand, the strong decrease of the maximum surface
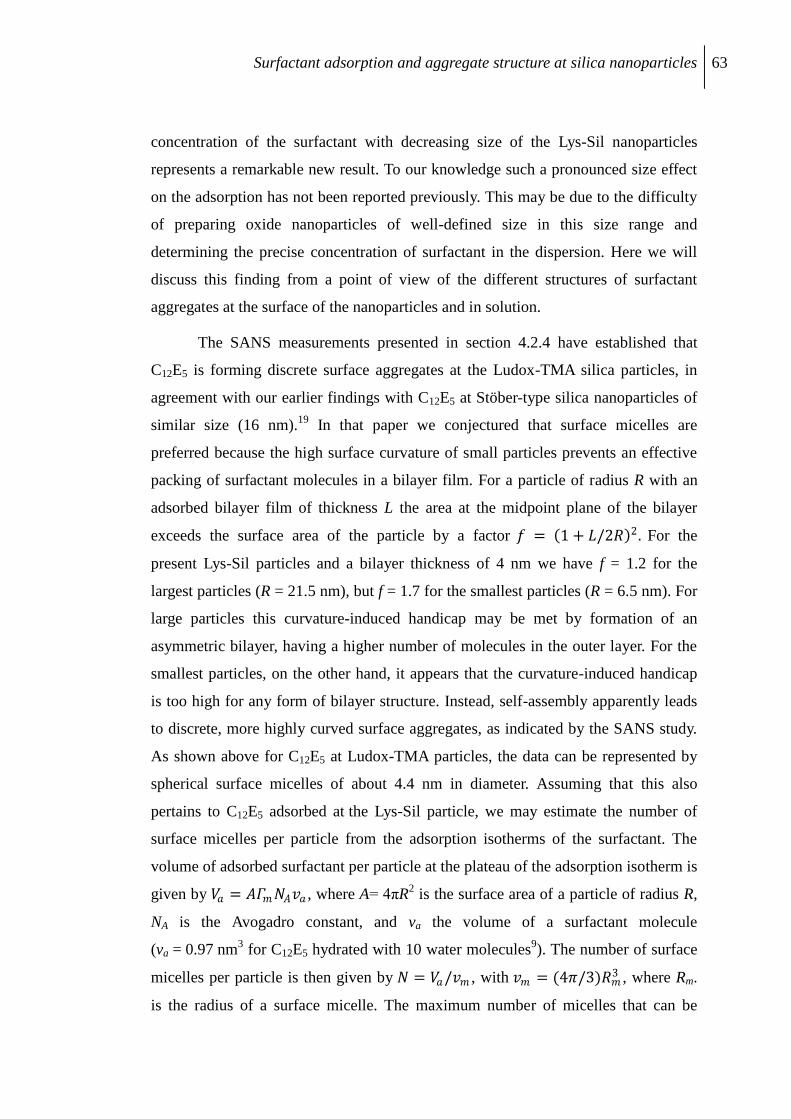
Surfactant adsorption and aggregate structure at silica nanoparticles 63
concentration of the surfactant with decreasing size of the Lys-Sil nanoparticles
represents a remarkable new result. To our knowledge such a pronounced size effect
on the adsorption has not been reported previously. This may be due to the difficulty
of preparing oxide nanoparticles of well-defined size in this size range and
determining the precise concentration of surfactant in the dispersion. Here we will
discuss this finding from a point of view of the different structures of surfactant
aggregates at the surface of the nanoparticles and in solution.
The SANS measurements presented in section 4.2.4 have established that
C12E5 is forming discrete surface aggregates at the Ludox-TMA silica particles, in
agreement with our earlier findings with C12E5 at Stöber-type silica nanoparticles of
similar size (16 nm).19
In that paper we conjectured that surface micelles are
preferred because the high surface curvature of small particles prevents an effective
packing of surfactant molecules in a bilayer film. For a particle of radius R with an
adsorbed bilayer film of thickness L the area at the midpoint plane of the bilayer
exceeds the surface area of the particle by a factor 𝑓 = 1 + 𝐿/2𝑅 2. For the
present Lys-Sil particles and a bilayer thickness of 4 nm we have f = 1.2 for the
largest particles (R = 21.5 nm), but f = 1.7 for the smallest particles (R = 6.5 nm). For
large particles this curvature-induced handicap may be met by formation of an
asymmetric bilayer, having a higher number of molecules in the outer layer. For the
smallest particles, on the other hand, it appears that the curvature-induced handicap
is too high for any form of bilayer structure. Instead, self-assembly apparently leads
to discrete, more highly curved surface aggregates, as indicated by the SANS study.
As shown above for C12E5 at Ludox-TMA particles, the data can be represented by
spherical surface micelles of about 4.4 nm in diameter. Assuming that this also
pertains to C12E5 adsorbed at the Lys-Sil particle, we may estimate the number of
surface micelles per particle from the adsorption isotherms of the surfactant. The
volume of adsorbed surfactant per particle at the plateau of the adsorption isotherm is
given by 𝑉𝑎 = 𝐴𝛤𝑚𝑁𝐴𝑣𝑎 , where A= 4πR2 is the surface area of a particle of radius R,
NA is the Avogadro constant, and va the volume of a surfactant molecule
(va = 0.97 nm3 for C12E5 hydrated with 10 water molecules
9). The number of surface
micelles per particle is then given by 𝑁 = 𝑉𝑎/𝑣𝑚 , with 𝑣𝑚 = (4𝜋/3)𝑅𝑚3 , where Rm.
is the radius of a surface micelle. The maximum number of micelles that can be
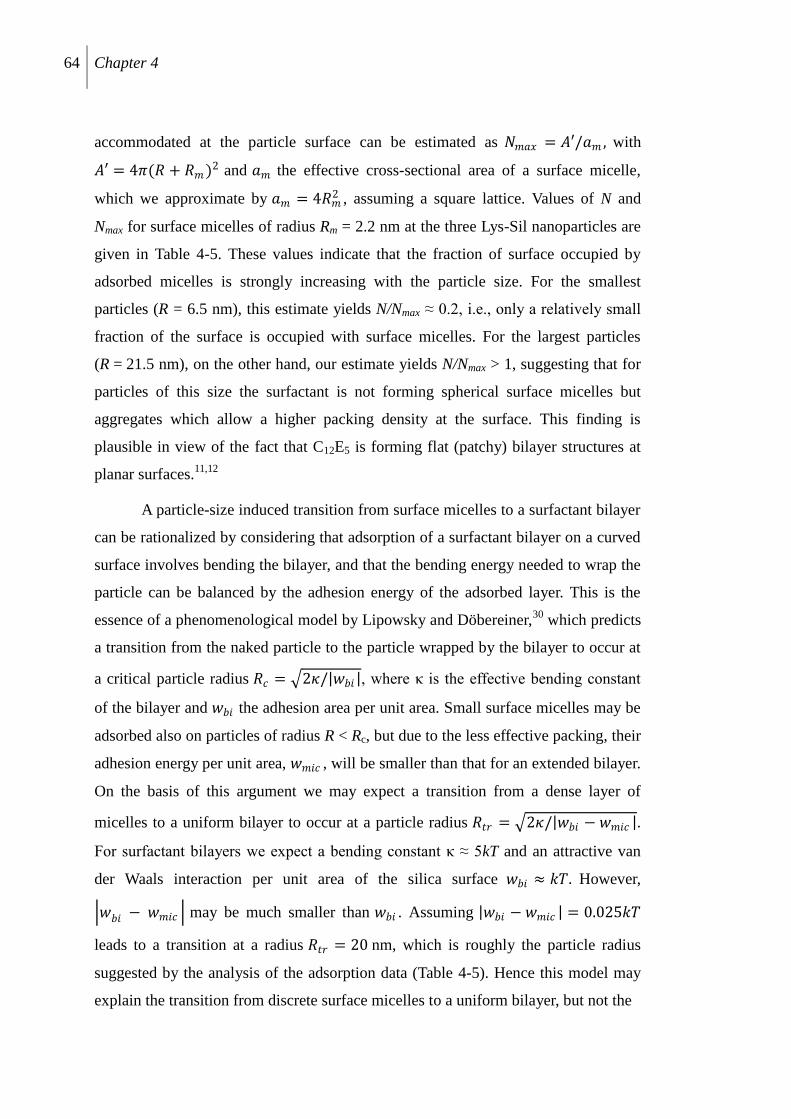
64 Chapter 4
accommodated at the particle surface can be estimated as 𝑁𝑚𝑎𝑥 = 𝐴′/𝑎𝑚 , with
𝐴′ = 4𝜋(𝑅 + 𝑅𝑚 )2 and 𝑎𝑚 the effective cross-sectional area of a surface micelle,
which we approximate by 𝑎𝑚 = 4𝑅𝑚2 , assuming a square lattice. Values of N and
Nmax for surface micelles of radius Rm = 2.2 nm at the three Lys-Sil nanoparticles are
given in Table 4-5. These values indicate that the fraction of surface occupied by
adsorbed micelles is strongly increasing with the particle size. For the smallest
particles (R = 6.5 nm), this estimate yields N/Nmax ≈ 0.2, i.e., only a relatively small
fraction of the surface is occupied with surface micelles. For the largest particles
(R = 21.5 nm), on the other hand, our estimate yields N/Nmax > 1, suggesting that for
particles of this size the surfactant is not forming spherical surface micelles but
aggregates which allow a higher packing density at the surface. This finding is
plausible in view of the fact that C12E5 is forming flat (patchy) bilayer structures at
planar surfaces.11,12
A particle-size induced transition from surface micelles to a surfactant bilayer
can be rationalized by considering that adsorption of a surfactant bilayer on a curved
surface involves bending the bilayer, and that the bending energy needed to wrap the
particle can be balanced by the adhesion energy of the adsorbed layer. This is the
essence of a phenomenological model by Lipowsky and Döbereiner,30
which predicts
a transition from the naked particle to the particle wrapped by the bilayer to occur at
a critical particle radius 𝑅𝑐 = 2𝜅/ 𝑤𝑏𝑖 , where κ is the effective bending constant
of the bilayer and 𝑤𝑏𝑖 the adhesion area per unit area. Small surface micelles may be
adsorbed also on particles of radius R < Rc, but due to the less effective packing, their
adhesion energy per unit area, 𝑤𝑚𝑖𝑐 , will be smaller than that for an extended bilayer.
On the basis of this argument we may expect a transition from a dense layer of
micelles to a uniform bilayer to occur at a particle radius 𝑅𝑡𝑟 = 2𝜅/ 𝑤𝑏𝑖 − 𝑤𝑚𝑖𝑐 .
For surfactant bilayers we expect a bending constant κ ≈ 5kT and an attractive van
der Waals interaction per unit area of the silica surface 𝑤𝑏𝑖 ≈ 𝑘𝑇. However,
𝑤𝑏𝑖 − 𝑤𝑚𝑖𝑐 may be much smaller than 𝑤𝑏𝑖 . Assuming 𝑤𝑏𝑖 − 𝑤𝑚𝑖𝑐 = 0.025𝑘𝑇
leads to a transition at a radius 𝑅𝑡𝑟 = 20 nm, which is roughly the particle radius
suggested by the analysis of the adsorption data (Table 4-5). Hence this model may
explain the transition from discrete surface micelles to a uniform bilayer, but not the
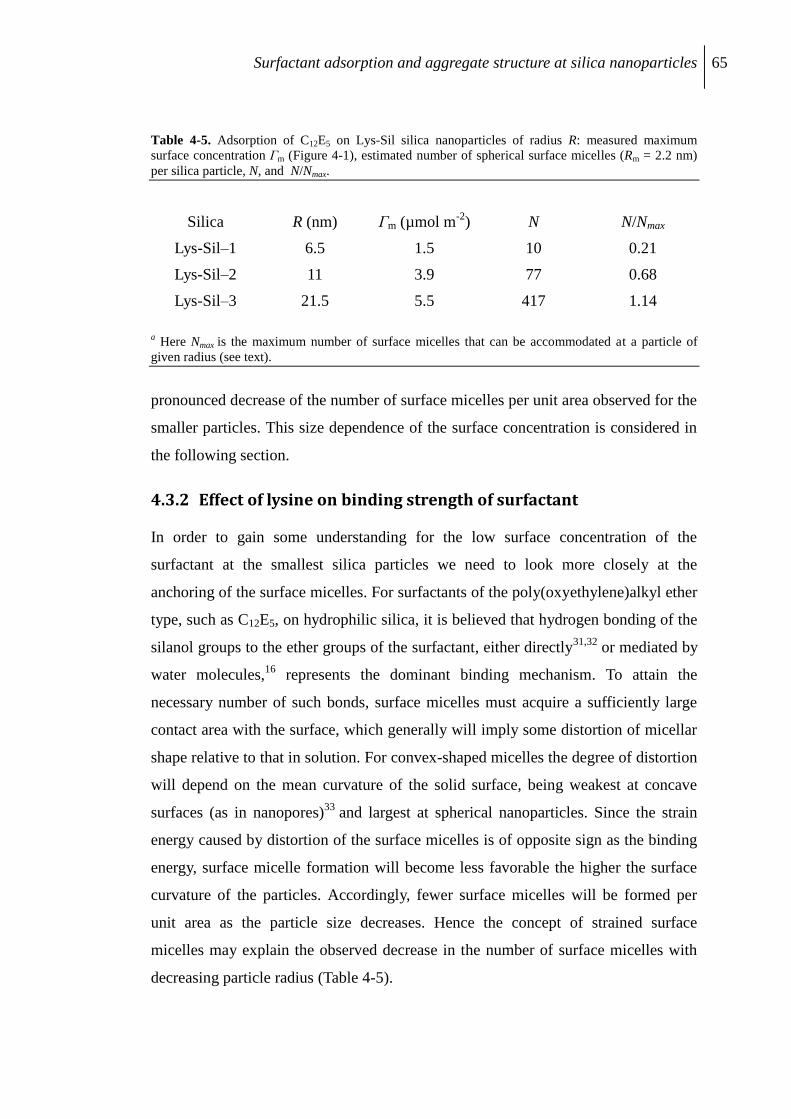
Surfactant adsorption and aggregate structure at silica nanoparticles 65
Table 4-5. Adsorption of C12E5 on Lys-Sil silica nanoparticles of radius R: measured maximum
surface concentration Γm (Figure 4-1), estimated number of spherical surface micelles (Rm = 2.2 nm)
per silica particle, N, and N/Nmax.
Silica R (nm) Γm (µmol m-2
) N N/Nmax
Lys-Sil–1 6.5 1.5 10 0.21
Lys-Sil–2 11 3.9 77 0.68
Lys-Sil–3 21.5 5.5 417 1.14
a Here Nmax is the maximum number of surface micelles that can be accommodated at a particle of
given radius (see text).
pronounced decrease of the number of surface micelles per unit area observed for the
smaller particles. This size dependence of the surface concentration is considered in
the following section.
4.3.2 Effect of lysine on binding strength of surfactant
In order to gain some understanding for the low surface concentration of the
surfactant at the smallest silica particles we need to look more closely at the
anchoring of the surface micelles. For surfactants of the poly(oxyethylene)alkyl ether
type, such as C12E5, on hydrophilic silica, it is believed that hydrogen bonding of the
silanol groups to the ether groups of the surfactant, either directly31,32
or mediated by
water molecules,16
represents the dominant binding mechanism. To attain the
necessary number of such bonds, surface micelles must acquire a sufficiently large
contact area with the surface, which generally will imply some distortion of micellar
shape relative to that in solution. For convex-shaped micelles the degree of distortion
will depend on the mean curvature of the solid surface, being weakest at concave
surfaces (as in nanopores)33
and largest at spherical nanoparticles. Since the strain
energy caused by distortion of the surface micelles is of opposite sign as the binding
energy, surface micelle formation will become less favorable the higher the surface
curvature of the particles. Accordingly, fewer surface micelles will be formed per
unit area as the particle size decreases. Hence the concept of strained surface
micelles may explain the observed decrease in the number of surface micelles with
decreasing particle radius (Table 4-5).
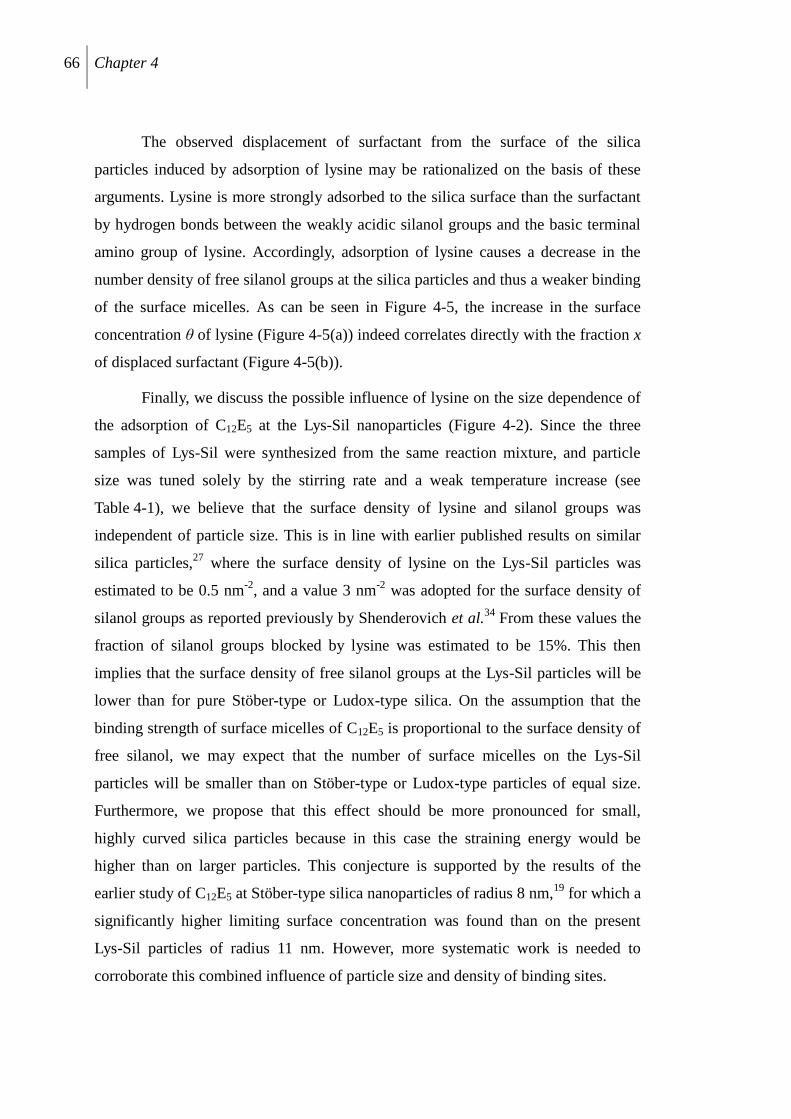
66 Chapter 4
The observed displacement of surfactant from the surface of the silica
particles induced by adsorption of lysine may be rationalized on the basis of these
arguments. Lysine is more strongly adsorbed to the silica surface than the surfactant
by hydrogen bonds between the weakly acidic silanol groups and the basic terminal
amino group of lysine. Accordingly, adsorption of lysine causes a decrease in the
number density of free silanol groups at the silica particles and thus a weaker binding
of the surface micelles. As can be seen in Figure 4-5, the increase in the surface
concentration θ of lysine (Figure 4-5(a)) indeed correlates directly with the fraction x
of displaced surfactant (Figure 4-5(b)).
Finally, we discuss the possible influence of lysine on the size dependence of
the adsorption of C12E5 at the Lys-Sil nanoparticles (Figure 4-2). Since the three
samples of Lys-Sil were synthesized from the same reaction mixture, and particle
size was tuned solely by the stirring rate and a weak temperature increase (see
Table 4-1), we believe that the surface density of lysine and silanol groups was
independent of particle size. This is in line with earlier published results on similar
silica particles,27
where the surface density of lysine on the Lys-Sil particles was
estimated to be 0.5 nm-2
, and a value 3 nm-2
was adopted for the surface density of
silanol groups as reported previously by Shenderovich et al.34
From these values the
fraction of silanol groups blocked by lysine was estimated to be 15%. This then
implies that the surface density of free silanol groups at the Lys-Sil particles will be
lower than for pure Stöber-type or Ludox-type silica. On the assumption that the
binding strength of surface micelles of C12E5 is proportional to the surface density of
free silanol, we may expect that the number of surface micelles on the Lys-Sil
particles will be smaller than on Stöber-type or Ludox-type particles of equal size.
Furthermore, we propose that this effect should be more pronounced for small,
highly curved silica particles because in this case the straining energy would be
higher than on larger particles. This conjecture is supported by the results of the
earlier study of C12E5 at Stöber-type silica nanoparticles of radius 8 nm,19
for which a
significantly higher limiting surface concentration was found than on the present
Lys-Sil particles of radius 11 nm. However, more systematic work is needed to
corroborate this combined influence of particle size and density of binding sites.
Surfactant adsorption and aggregate structure at silica nanoparticles 67
Figure 4-6 (a) Turbidity of 5.2 mM C12E5 in a 1 wt-% dispersion of Ludox-TMA without lysine
(squares) and with 3mM lysine (circles); (b) photograph of the two constantly stirred samples at a
temperature well above the cloud point Tc (dashed line in a).
4.3.3 Potential application relevance
The finding that a nonionic surfactant can be displaced readily from the surface of
nanoparticles by small amounts of a more strongly adsorbed substance is of practical
relevance for the formulation of dispersions stabilized by such surfactants. In
addition, the displaced surfactant can cause significant changes in the macroscopic
behavior of the system. Since non-ionic surfactants like C12E5 are forming wormlike
micelles in a wide temperature and concentration range their displacement from the
surface can affect the rheological behavior of the system.35
For these surfactants it is
even possible that the displacement of the surfactant drives the system from the
one-phase region into the two-phase region of the surfactant + water phase diagram.
For the present system this is demonstrated in Figure 4-6. The phase diagram of the
C12E5 + water exhibits a lower critical point (cloud point) at about 31°C and 1 wt-%
surfactant.36
Above this temperature the system separates into a water-rich and a
surfactant-rich phase. Figure 4-6(a) shows the turbidity vs. temperature of a 1 wt-%
68 Chapter 4
Ludox-TMA dispersion containing 0.2 wt-% C12E5, without and with added lysine.
In the absence of lysine almost all surfactant is adsorbed at the particles (surface
concentration Γ = 4 µmol m-2
, i.e., close to the limiting adsorption). The turbidity of
this sample is moderately low and independent of temperature up to 50°C. In the
presence of lysine (3 mM), however, when the surfactant is detached from the
particles, the turbidity of the stirred sample strongly increases at temperatures T > Tc,
as most of the free surfactant is now forming droplets of the surfactant-rich phase.
The silica particles remain dispersed in the aqueous phase. SAXS measurements on
the samples without and with lysine show no increased intensity in the Guinier
regime at different temperatures, confirming the absence of any aggregation of silica
nanoparticles.37
The scattering curves taken at temperatures from 20 to 50°C
superimpose (not shown). Photograph of the samples without and with lysine at a
temperature above Tc are also shown in Figure 4-6(b). This is a striking example to
show the potential significance of such displacement effects for the formulation of
nanoparticle dispersions with nonionic surfactants. Related phenomena were reported
recently by Mustafina et al.38
4.4 Conclusions
This study has shown that the self-assembly of surfactants in a dispersion of
nanoparticles can be tuned by an additive which modifies the surface energy by
adsorption onto the particles. Lysine acts as an effective surface modifier in the
present system. Small concentrations of lysine cause a complete displacement of the
surfactant C12E5 from silica particles. SANS measurements reveal that the
displacement process represents a morphological transition from discrete surface
micelles attached to the particles to elongated (wormlike) micelles in the aqueous
bulk phase. The detachment seems to proceed via an intermediate state in which a
hydrated layer of adsorbed lysine intercalates between the surfactant aggregates and
the surface. Further SANS studies are needed to elucidate this process.
For Lys-Sil particles we find a pronounced decrease of the maximum surface
concentration of the surfactant with decreasing particle size. Our study suggests that
this size effect is caused by the adsorbed layer of lysine, which reduces the binding
strength of the surfactant head groups, in combination with the increasing curvature
Surfactant adsorption and aggregate structure at silica nanoparticles 69
of the solid surface. For the smallest particles (diameter 13 nm) only a fraction of
their surface is decorated with surface micelles. We speculate that this may be a
consequence of a stronger distortion of surface micelles that is needed for attaining a
sufficiently large contact area with the surface of small particles when some of the
sites are blocked by lysine. The much higher limiting adsorption of the surfactant at
the largest particles (43 nm) indicates that in this case the surfactant is not forming
discrete surface micelles but less highly curved aggregates which allow a higher
packing density at the surface. We present a simple model to account for such a
transition in surface aggregate structure. Hence, this study can contribute to a better
understanding of the factors controlling the self-assembly of surfactants at
nanoparticles. This will be useful in the formulation of nanoparticle dispersions and
their application in particle nanotechnology.
References
1 Holmberg, K., Shah D. O., Schwuger, M. J., Eds., Handbook of Applied Surface
and Colloid Chemistry, 2002, John Wiley: New York, USA.
2 Paria, S., Khilar, K. C., J. Colloid Interface Sci., 2004, 110, 75.
3 Limbach, L. K., Bereiter, R., Müller, E., Krebs, R., Gälli, R., Stark, W. J., Environ.
Sci. Technol., 2008, 42, 5828.
4 Veronovoski, N., Andeozzi, P., Mesa, C. L., Smol, M. S., Ribitsch, V., Colloid
Polym. Sci., 2010, 288, 387.
5 Zhang, R., Somasundaran, P., Adv. Colloid Inteface Sci., 2006, 123-126, 213.
6 Klimenko, N.A., Koganovskii, A.M., Kolloidn. Zh., 1974, 36, 151.
7 Klimenko, N.A., Kofanov, V.L., Sivalov, E.G., Kolloidn. Zh., 1981, 43, 287.
8 Levitz, P., Langmuir, 1991, 7, 1595.
9 Böhmer, M. R., Koopal, L. K., Janssen, R., Lee, E. M., Thomas, R. K., Rennie, A.
R., Langmuir, 1992, 8, 2228.
10 Manne, S., Gaub, H. E., Science, 1995, 270, 1480.
70 Chapter 4
11 Tiberg, F., J. Chem. Soc. Faraday Trans., 1996, 92, 531.
12 Grant, L. M., Tiberg, F., Ducker, W. A., J. Phys. Chem. B, 1998, 102, 4288.
13 Steitz, R., Müller-Buschbaum, P., Schemmel, S., Cubitt, R., Findenegg, G. H.,
Europhys. Lett., 2004, 67, 962.
14 Dietsch, O., Eltekov, A., Bock, H., Gubbins, K. E., Findenegg, G. H., J. Phys.
Chem. C, 2007, 111, 16045.
15 Penfold, J., Staples, E., Tucker, I., Langmuir, 2002, 18, 2967.
16 Matsson, M. K., Kronberg, B., Claesson, P. M., Langmuir, 2004, 20, 4051.
17 Cummins, P. G., Penfold, J., Staples, E., J. Phys. Chem., 1992, 96, 8092.
18 Penfold, J., Staples, E., Tucker, I., Cummins, P., J. Phys. Chem., 1996, 100, 18133.
19 Lugo, D. M., Oberdisse, J., Karg, M., Schweins, R., Findenegg, G. H., Soft Matter,
2009, 5, 2928.
20 Lugo, D. M., Oberdisse, J., Lapp, A., Findenegg, G. H., J. Phys. Chem. B, 2010,
114, 4183.
21 Sharma, K. P., Aswal, V. K., Kumaraswami, G., J. Phys. Chem. B, 2010, 114,
10986.
22 Kumar, S., Aswal, V. K., J. Phys.-Condens. Mat., 2011, 23, 035101.
23 Ahualli, S., Iglesias, G. R., Wachter, W., Dulle, M., Minami, D., Glatter, O.,
Langmuir, 2011, 27, 9182.
24 Davis, T. M., Snyder, M. A., Krohn, J. E., Tsapatsis, M., Chem. Mater., 2006, 18,
5814.
25 Gu, T., Zhu, B.-Y., Colloids Surf., 1990, 44, 81.
26 Zhu, B.-Y., Gu, T., Zhao, X., J. Chem. Soc. Faraday Trans I, 1989, 85, 3819.
Surfactant adsorption and aggregate structure at silica nanoparticles 71
27 Yokoi, T., Wakabayashi, J., Otsuka, Y., Fan, W., Iwama, M., Watanabe, R.,
Aramaki, K., Shimojima, A., Tatsumi, T., Okubo, T., Chem. Mater., 2009, 21, 3719.
28 Despert, G., Oberdisse, J., Langmuir, 2003, 19, 7604.
29 Oberdisse, J., Phys. Chem. Chem. Phys., 2004, 6, 1557.
30 Lipowsky, R., Döbereiner, H.-G., Europhys. Lett., 1998, 43, 219.
31 Partyka, S., Zaini, S., Lindeheimer, M., Brun, B., Colloids Surf., 1984, 12, 255,
32 Trens, P., Denoyel, R., Langmuir, 1993, 9, 519.
33 Müter, D., Shin, T., Demé, B., Fratzl, P., Paris, O., Findenegg, G. H., J. Phys.
Chem. Lett., 2010, 1, 1442.
34 Shenderovich, I. G., Mauder, D., Akcakayiran, D., Buntkowsky, G., Limbach, H.-
H., Findenegg, G. H., J. Phys. Chem. B, 2007, 111, 12088.
35 Strey, R., Ber. Bunsenges. Phys. Chem. 1996, 100, 182.
36 Strey, R., Schomäcker, R., Roux, D., Nallet, F., Olsson, U., J. Chem. Soc., Faraday
Trans., 1990, 86, 2253.
37 Bharti, B., Meissner, J., Findenegg, G. H., Langmuir, 2011, 27, 9823.
38 Mustafina, A. R., Elistratova, J. G., Bochkova, O. D., Burilov, V. A., Fedorenko, S.
V., Konovalov, A. I., Soloveva, S. Y., J. Colloid Interface Sci., 2011, 354, 644.

Assembling wormlike micelles in tubular nanopores by tuning surfactant-wall
interactions
73
5. Assembling wormlike micelles in tubular nanopores by tuning surfactant-wall interactions ‡
5.1 Introduction
Nanoporous materials with pores of uniform size and shape are of interest in many
known application fields, ranging from catalysis, membrane processes, and
chromatography to new areas such as microelectronics and medical diagnosis.1,2
Since surfactants or related amphiphilic substances are involved in many of these
fields, their self-assembly in nano-confined space can play an important and diverse
role in these applications. For instance, surfactant adsorption in narrow pores is of
importance in surfactant-aided membrane processes such as micellar-enhanced
ultrafiltration (MEUF)3 or micellar liquid chromatography.
4 It is well-known that
surfactants can improve the wettability of hydrophobic nanopores by adsorption of
an oriented monolayer.5 Surfactant adsorption onto hydrophilic surfaces can be
regarded as a surface aggregation process, reminiscent of micelle formation in
solution.6-9
Up to now only a few experimental studies have addressed the effect of
confinement on the structure of complex fluids in nanopores. X-ray reflectivity and
holographic X-ray diffraction10
have been used to investigate confinement-induced
ordering in complex liquids between planar parallel surfaces. Structural and dynamic
aspects of the self-assembly of the nonionic surfactant C12E5 in porous glass were
studied by 1H NMR.
11 Recently, we have adopted Small-Angle Neutron Scattering
(SANS) to characterize adsorbed layers of this and other nonionic surfactants in the
cylindrical pores of SBA-15 periodic mesoporous silica.12,13
SBA-15 is made up of
micrometer-sized particles which constitute arrays of cylindrical nanopores arranged
‡ Modified from the article: Bharti, B., Xue, M., Meissner, J., Cristigilo, V., Findenegg, G. H.,
submitted.
74 Chapter 5
side-by-side in a 2D hexagonal lattice (space group P6mm).14
Due to the high
mesoscale order of these materials structural information about the density profile of
fluids in the pores can be derived by analyzing the intensities of the Bragg
reflections.15
By applying this technique to the study of surfactants in the pores of
SBA-15 it was found that initially the adsorption of the surfactant in the pores leads
to the formation of discrete surface aggregates which increase in number and
eventually merge to interconnected bilayer patches as the plateau of the adsorption
isotherm is approached.12,13
Recently we have found that the anchoring strength of the surfactant C12E5 to
the surface of silica nanoparticles can be modified by co-adsorption of a more
strongly adsorbed substance, such as the aminoacid lysine.16
In an earlier SANS
study it had been shown that in the absence of lysine, the surfactant is forming
discrete surface micelles at the silica nanoparticles.17
When increasing doses of
lysine were added to the silica dispersion a gradual transition from the surface
micelles to detached wormlike micelles in the bulk solution was observed. It was
now of interest to see if such a lysine-induced morphological transition from surface
micelles to wormlike micelles in solution occurs in a similar way for surfactant
adsorbed in nanopores, or if the behavior is affected by the confined geometry of the
pore space. Similar to our previous studies, here again, we used SANS as a primary
experimental tool, and we follow the evolution of the scattering profiles at different
lysine adsorption levels. As a surprising result of this study we find that in a limited
lysine adsorption regime cylindrical micelles are formed in the central space of the
tubular pores. Before presenting the experimental details we give a brief summary of
the theoretical background of this method where we present simulated scattering
curves to illustrate the potential to distinguish between different aggregate
morphologies of the surfactant.
5.2 Theoretical Background
As was shown in the preceding studies,12,13
the scattering from surfactant aggregates
in the pores of SBA-15 can be represented by a sum of three contributions: Bragg
scattering from the pore lattice (IBragg), diffuse scattering from surfactant aggregates
Assembling wormlike micelles in tubular nanopores by tuning surfactant-wall
interactions
75
(Idiff) and a background (Ib) due to incoherent scattering, mostly arising from the
protons of H2O and surfactant, i.e.,
𝐼 𝑞 = 𝐼Bragg (𝑞) + 𝐼diff (𝑞) + 𝐼b (5.1)
where q represents the modulus of the scattering vector. When the scattering contrast
between the silica matrix and the solvent is suppressed by using a H2O/D2O solvent
mixture that matches the scattering length density of the matrix, then in the absence
of surfactant only a q-independent background, Ib appears. In the presence of
surfactant, diffuse scattering will arise due to the inhomogeneous distribution of the
surfactant in the porous matrix. In previous studies of our group,13
it was found that
over a wide range of surfactant fillings this diffuse scattering can be represented by a
scattering function for disperse two-phase systems with spatial correlations, similar
to the Teubner-Strey relation18
𝐼𝑑𝑖𝑓𝑓 𝑞 =𝑠𝐼𝑚
𝑠 + 1 − 𝑠 (𝑞 𝑞𝑚 − 1)2 (5.2)
where qm and Im represent the values of the scattering vector and scattering intensity
at the correlation peak, and 𝑠 = 𝐼0/𝐼𝑚 , with I0 the limiting value of 𝐼𝑑𝑖𝑓𝑓 𝑞 for
q → 0. From these experimental parameters two characteristic lengths, d and ξ, can
be derived: d represents the quasiperiodic distance between surfactant domains in the
matrix, and ξ is a decay length of this quasiperiodic order. They are given in terms of
qm and 𝑠 as
𝑑 =2𝜋 2
𝑞𝑚
1
1−𝑠 1/2+ 1
−1/2
; 𝜉 = 2
𝑞𝑚
1
1−𝑠 1/2− 1
−1/2
(5.3)
When surfactant is present in the pores, contrast match between pore fluid and matrix
is eliminated and Bragg reflections from the pore lattice appear. The radial average of
the total scattering intensity for an ensemble of long cylindrical objects is given by
𝐼𝐵𝑟𝑎𝑔𝑔 𝑞 = 𝑍𝑆𝐿(𝑞)𝑃(𝑞) (5.4)
where 𝑆𝐿 𝑞 is the structure factor of the pore lattice, 𝑃 𝑞 is the form factor of the
scattering entity in a pore, which depends on the shape and geometry of the
76 Chapter 5
surfactant aggregates, and Z is a constant. For a perfect 2D-hexagonal lattice the
spherically averaged structure factor is given by 𝑆𝐿 𝑞 = 𝑞−2 𝑚𝑘𝑘 𝑆𝑘 𝑞 , where
𝑚𝑘 is the multiplicity factor of a Bragg peak with Miller indices hk (𝑚𝑘 = 6 for
the 10, 11, and 20 peaks), and 𝑆𝑘 represents delta functions at positions
𝑞𝑘 = 4𝜋
𝑎0 3 2 + 𝑘2 + 𝑘. In reality, the Bragg reflections are broadened due to
lattice imperfections and limited instrumental resolution. In this work, they are
represented by Gaussian functions 𝑆𝑘 𝑞 = 𝑎𝑘𝑒𝑥𝑝 −𝑏 𝑞 − 𝑞𝑘 2 , where 𝑎𝑘 is
the amplitude of peak hk, and parameter b characterizes the width of the individual
Bragg peak. The value of b was determined from the SANS curve of SBA-15 in D2O
and kept constant in the data analysis of all samples. The form factor P(q) in
equation 5.4 was modeled in different ways, to account for the different scattering
patterns observed as a function of the added surface modifier (see below).
To demonstrate the effect of the distribution of surfactant, Figure 5-1 shows
simulated Bragg scattering curves for two different adsorption scenarios, namely,
discrete surface micelles adsorbed to the pore-walls, and rod-like aggregates
non-attached to the pore-wall. Also shown in Figure 5-1 is the expected scattering
behavior for the case that the surfactant is non-adsorbed but forms micelles outside
the pore space. The parameters used in the simulations are summarized in Table 5-1.
(1) Discrete surface micelles or patches: If the surfactant is forming surface
micelles or bilayer patches at the pore walls, the statistical average of all patches (at
contrast-match of the matrix by the aqueous phase) corresponds to the geometry of a
hollow cylinder. Hence the form factor of a hollow cylinder, PHC(q), shown as the
full line in Figure 5-1(a) was adopted in equation 5.4. This causes a modulation of
the Bragg scattering pattern (shaded area) from that of the original structure factor
SBragg(q) (dotted). Since the primary minimum of PHC(q) is situated at a q value near
the (10) Bragg peak, this peak is reduced in intensity compared to that of the (11) and
(20) peaks. The resulting distribution of peak intensities is a signature of a shell
structure of the surfactant in the pores and was observed previously for the surfactant
C12E5 in SBA-15.13
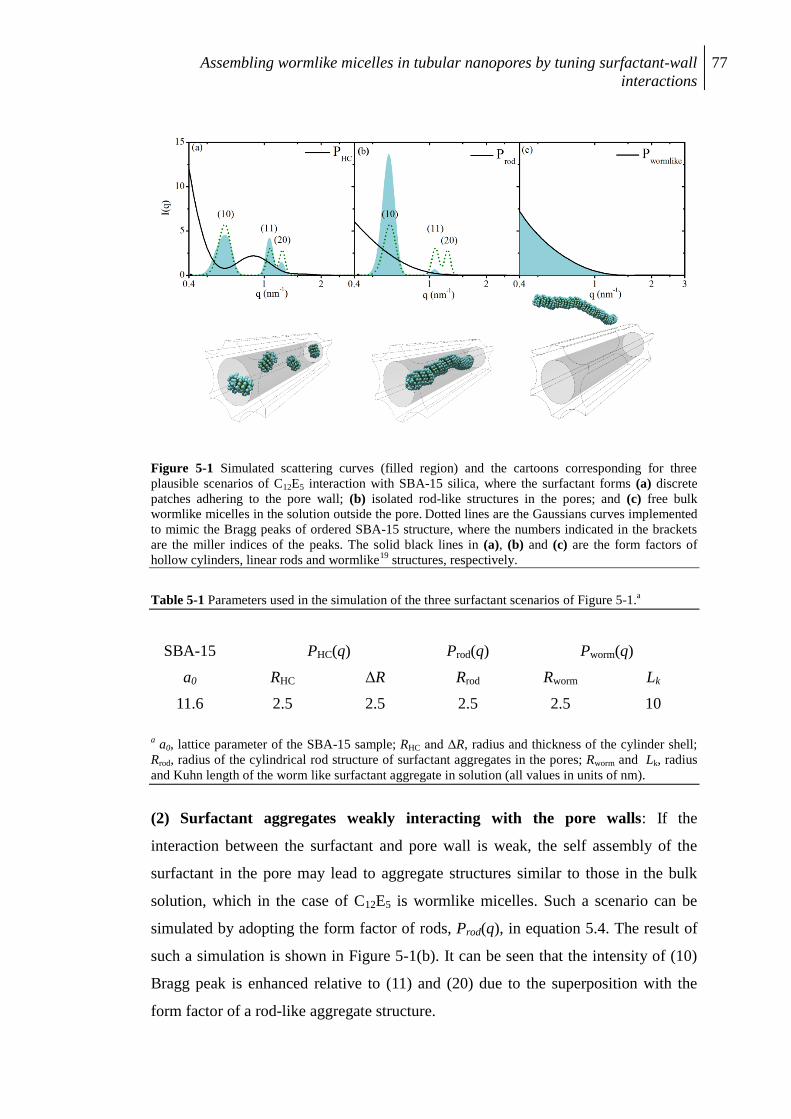
Assembling wormlike micelles in tubular nanopores by tuning surfactant-wall
interactions
77
Figure 5-1 Simulated scattering curves (filled region) and the cartoons corresponding for three
plausible scenarios of C12E5 interaction with SBA-15 silica, where the surfactant forms (a) discrete
patches adhering to the pore wall; (b) isolated rod-like structures in the pores; and (c) free bulk
wormlike micelles in the solution outside the pore. Dotted lines are the Gaussians curves implemented
to mimic the Bragg peaks of ordered SBA-15 structure, where the numbers indicated in the brackets
are the miller indices of the peaks. The solid black lines in (a), (b) and (c) are the form factors of
hollow cylinders, linear rods and wormlike19
structures, respectively.
Table 5-1 Parameters used in the simulation of the three surfactant scenarios of Figure 5-1.a
SBA-15 PHC(q) Prod(q) Pworm(q)
a0 RHC ΔR Rrod Rworm Lk
11.6 2.5 2.5 2.5 2.5 10
a a0, lattice parameter of the SBA-15 sample; RHC and ΔR, radius and thickness of the cylinder shell;
Rrod, radius of the cylindrical rod structure of surfactant aggregates in the pores; Rworm and Lk, radius
and Kuhn length of the worm like surfactant aggregate in solution (all values in units of nm).
(2) Surfactant aggregates weakly interacting with the pore walls: If the
interaction between the surfactant and pore wall is weak, the self assembly of the
surfactant in the pore may lead to aggregate structures similar to those in the bulk
solution, which in the case of C12E5 is wormlike micelles. Such a scenario can be
simulated by adopting the form factor of rods, Prod(q), in equation 5.4. The result of
such a simulation is shown in Figure 5-1(b). It can be seen that the intensity of (10)
Bragg peak is enhanced relative to (11) and (20) due to the superposition with the
form factor of a rod-like aggregate structure.
78 Chapter 5
(3) Micelles outside the pore space: If the interaction of surfactant and pore wall is
even weaker, formation of aggregates in the pores is disfavored against aggregation
in the bulk solution for entropic reasons. Since no surfactant is present in the pores,
no Bragg scattering will occur in the contrast-match scenario ( 𝐼𝐵𝑟𝑎𝑔𝑔 𝑞 = 0 ).
Instead diffuse scattering from free micelles will occur, as shown in Figure 5-1(c) for
the case of wormlike micelles, based on the form factor of semi-flexible worms
(Pworm(q)). Hence the absence of Bragg peaks is a signature for the case that no
surfactant is adsorbed in the pore space.
In the simulations of Figure 5-1(a) and 5-1(b), the diffuse scattering
contribution 𝐼𝑑𝑖𝑓𝑓 𝑞 is neglected for simplicity. This is in accordance to
equation 5.1, where the contributions from diffuse scattering and Bragg scattering are
additive in good approximation, and thus will not affect the relative intensities of the
Bragg peaks, which is characteristic for the different aggregate structures in the
pores.
5.3 Experimental
5.3.1 Characterization of SBA-15
SBA-15 was synthesized as described previously20
and characterized by nitrogen
adsorption and Small-Angle X-ray Scattering (SAXS). Nitrogen adsorption
measurements at 77 K were performed on a Gemini III 2375 volumetric surface
analyzer (Micromeritics). SAXS was performed on a SAXSess mc2 instrument
(Anton Paar, Austria), equipped with a Cu-Kα, slit-collimated x-ray source operating
at 40 kV (50 mA). Details of nitrogen adsorption and SAXS measurements are
described elsewhere.21
The lattice parameter (a0) of the SBA-15 sample was
determined from the SAXS data (see appendix Figure A-1(a)). The specific surface
area (aBET) was based on a BET plot of the nitrogen adsorption isotherm in the
relative pressure range 0.05 < p/p0 < 0.30 (see appendix Figure A-1(b)). The diameter
D of the cylindrical mesopores was determined from the mid-value of the pore
condensation pressure (p/p0)pc using the improved KJS prescription.22
Characteristic
parameters of the SBA-15 sample used in this study are given in Table 5-2.
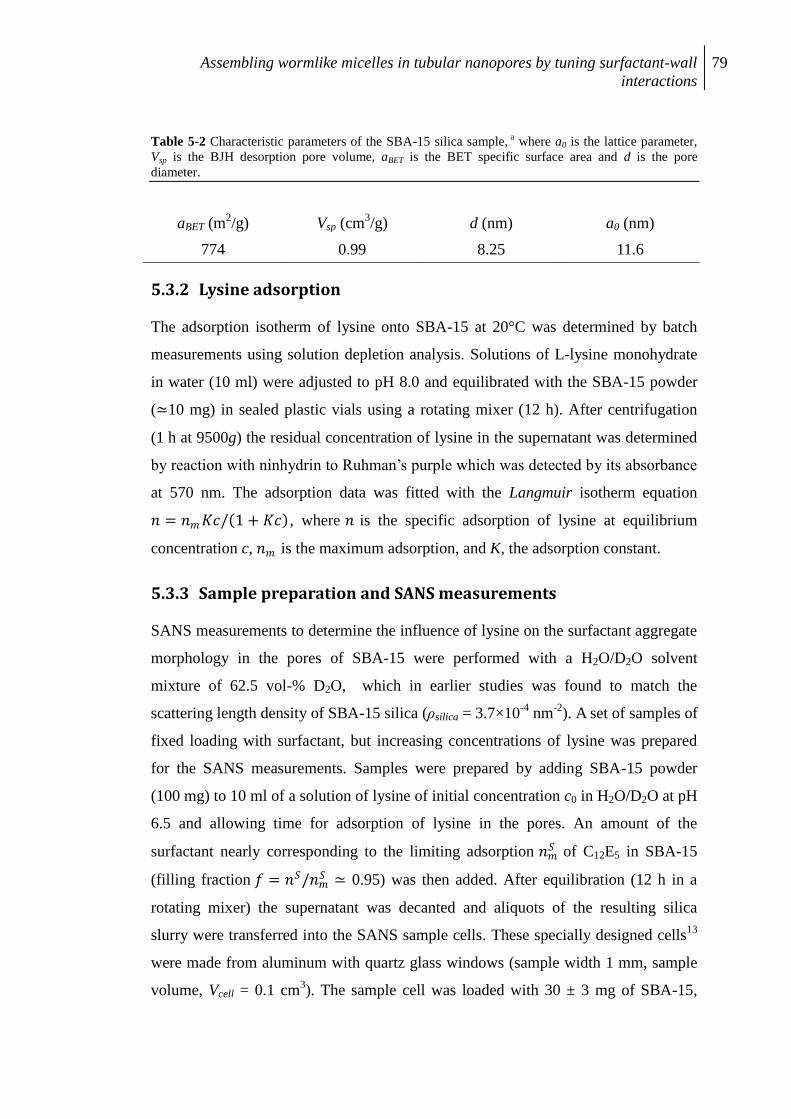
Assembling wormlike micelles in tubular nanopores by tuning surfactant-wall
interactions
79
Table 5-2 Characteristic parameters of the SBA-15 silica sample, a where a0 is the lattice parameter,
Vsp is the BJH desorption pore volume, aBET is the BET specific surface area and d is the pore
diameter.
aBET (m2/g) Vsp (cm
3/g) d (nm) a0 (nm)
774 0.99 8.25 11.6
5.3.2 Lysine adsorption
The adsorption isotherm of lysine onto SBA-15 at 20°C was determined by batch
measurements using solution depletion analysis. Solutions of L-lysine monohydrate
in water (10 ml) were adjusted to pH 8.0 and equilibrated with the SBA-15 powder
(≃10 mg) in sealed plastic vials using a rotating mixer (12 h). After centrifugation
(1 h at 9500g) the residual concentration of lysine in the supernatant was determined
by reaction with ninhydrin to Ruhman‟s purple which was detected by its absorbance
at 570 nm. The adsorption data was fitted with the Langmuir isotherm equation
𝑛 = 𝑛𝑚𝐾𝑐/ 1 + 𝐾𝑐 , where 𝑛 is the specific adsorption of lysine at equilibrium
concentration c, 𝑛𝑚 is the maximum adsorption, and K, the adsorption constant.
5.3.3 Sample preparation and SANS measurements
SANS measurements to determine the influence of lysine on the surfactant aggregate
morphology in the pores of SBA-15 were performed with a H2O/D2O solvent
mixture of 62.5 vol-% D2O, which in earlier studies was found to match the
scattering length density of SBA-15 silica (ρsilica = 3.7×10⁻⁴
nm-2
). A set of samples of
fixed loading with surfactant, but increasing concentrations of lysine was prepared
for the SANS measurements. Samples were prepared by adding SBA-15 powder
(100 mg) to 10 ml of a solution of lysine of initial concentration c0 in H2O/D2O at pH
6.5 and allowing time for adsorption of lysine in the pores. An amount of the
surfactant nearly corresponding to the limiting adsorption 𝑛𝑚𝑆 of C12E5 in SBA-15
(filling fraction 𝑓 = 𝑛𝑆/𝑛𝑚𝑆 ≃ 0.95) was then added. After equilibration (12 h in a
rotating mixer) the supernatant was decanted and aliquots of the resulting silica
slurry were transferred into the SANS sample cells. These specially designed cells13
were made from aluminum with quartz glass windows (sample width 1 mm, sample
volume, Vcell = 0.1 cm3). The sample cell was loaded with 30 ± 3 mg of SBA-15,
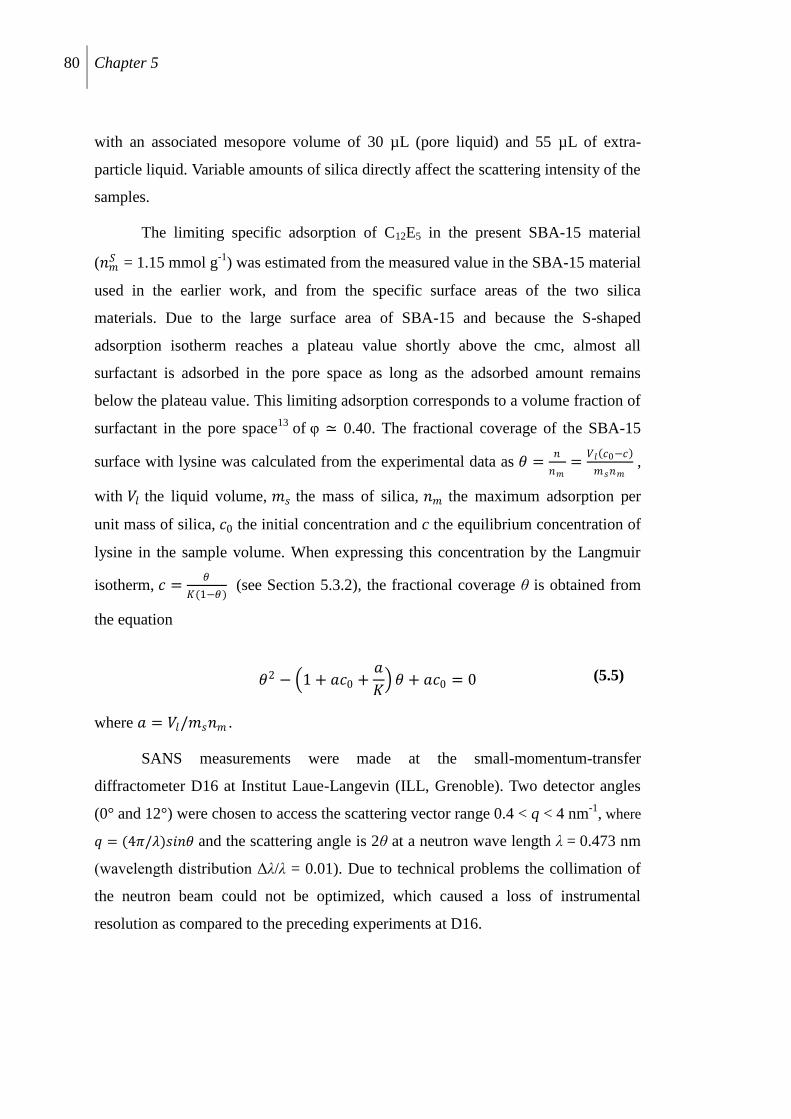
80 Chapter 5
with an associated mesopore volume of 30 µL (pore liquid) and 55 µL of extra-
particle liquid. Variable amounts of silica directly affect the scattering intensity of the
samples.
The limiting specific adsorption of C12E5 in the present SBA-15 material
(𝑛𝑚𝑆 = 1.15 mmol g
-1) was estimated from the measured value in the SBA-15 material
used in the earlier work, and from the specific surface areas of the two silica
materials. Due to the large surface area of SBA-15 and because the S-shaped
adsorption isotherm reaches a plateau value shortly above the cmc, almost all
surfactant is adsorbed in the pore space as long as the adsorbed amount remains
below the plateau value. This limiting adsorption corresponds to a volume fraction of
surfactant in the pore space13
of υ ≃ 0.40. The fractional coverage of the SBA-15
surface with lysine was calculated from the experimental data as 휃 =𝑛
𝑛𝑚=
𝑉𝑙 𝑐0−𝑐
𝑚𝑠𝑛𝑚 ,
with 𝑉𝑙 the liquid volume, 𝑚𝑠 the mass of silica, 𝑛𝑚 the maximum adsorption per
unit mass of silica, 𝑐0 the initial concentration and c the equilibrium concentration of
lysine in the sample volume. When expressing this concentration by the Langmuir
isotherm, 𝑐 =휃
𝐾(1−휃) (see Section 5.3.2), the fractional coverage θ is obtained from
the equation
휃2 − 1 + 𝑎𝑐0 +𝑎
𝐾 휃 + 𝑎𝑐0 = 0 (5.5)
where 𝑎 = 𝑉𝑙/𝑚𝑠𝑛𝑚 .
SANS measurements were made at the small-momentum-transfer
diffractometer D16 at Institut Laue-Langevin (ILL, Grenoble). Two detector angles
(0° and 12°) were chosen to access the scattering vector range 0.4 < q < 4 nm-1
, where
𝑞 = (4𝜋/𝜆)𝑠𝑖𝑛휃 and the scattering angle is 2θ at a neutron wave length λ = 0.473 nm
(wavelength distribution Δλ/λ = 0.01). Due to technical problems the collimation of
the neutron beam could not be optimized, which caused a loss of instrumental
resolution as compared to the preceding experiments at D16.
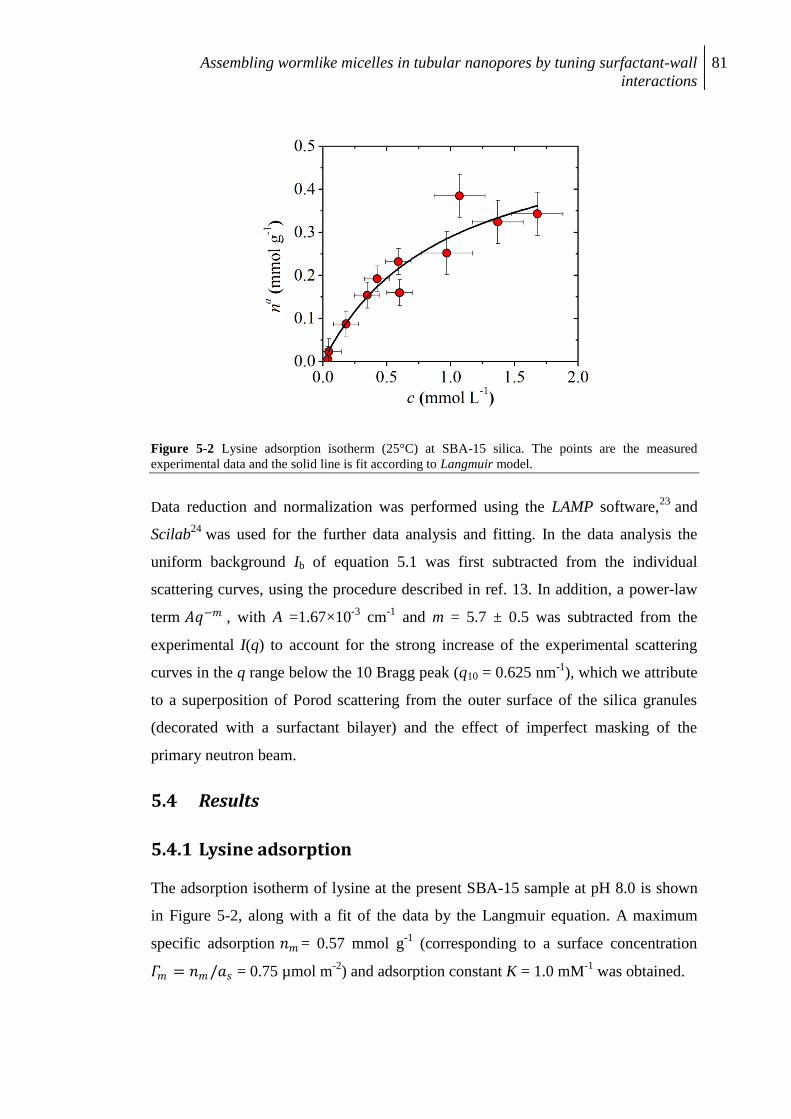
Assembling wormlike micelles in tubular nanopores by tuning surfactant-wall
interactions
81
Figure 5-2 Lysine adsorption isotherm (25°C) at SBA-15 silica. The points are the measured
experimental data and the solid line is fit according to Langmuir model.
Data reduction and normalization was performed using the LAMP software,23
and
Scilab24
was used for the further data analysis and fitting. In the data analysis the
uniform background Ib of equation 5.1 was first subtracted from the individual
scattering curves, using the procedure described in ref. 13. In addition, a power-law
term 𝐴𝑞−𝑚 , with A =1.67×10⁻³
cm-1
and m = 5.7 ± 0.5 was subtracted from the
experimental I(q) to account for the strong increase of the experimental scattering
curves in the q range below the 10 Bragg peak (q10 = 0.625 nm-1
), which we attribute
to a superposition of Porod scattering from the outer surface of the silica granules
(decorated with a surfactant bilayer) and the effect of imperfect masking of the
primary neutron beam.
5.4 Results
5.4.1 Lysine adsorption
The adsorption isotherm of lysine at the present SBA-15 sample at pH 8.0 is shown
in Figure 5-2, along with a fit of the data by the Langmuir equation. A maximum
specific adsorption 𝑛𝑚 = 0.57 mmol g-1
(corresponding to a surface concentration
𝛤𝑚 = 𝑛𝑚 /𝑎𝑠 = 0.75 µmol m-2
) and adsorption constant K = 1.0 mM-1
was obtained.
82 Chapter 5
Figure 5-3 (a) SANS curves from SBA-15 immersed in pure D2O (blue squares) and in the contrast-
matching H2O/D2O mixture (green hexagons); the positions of the three leading Bragg reflections are
indicated by dotted vertical lines. (b) Scattering profile from SBA-15 in H2O/D2O with the surfactant
C12E5 at relative filling f = 0.95 in the absence of lysine (θ = 0): the black line represents a fit to the
data points (circles), with the diffuse scattering contribution Idiff(q) according to equation 5.2 (green
curve) and the Bragg scattering contribution IBragg(q) according to equation 5.4 indicated by the
contour of the shaded areas (see text).
The value of 𝛤𝑚 is significantly lower than the adsorption of lysine at Ludox silica
nanoparticles, for which a value Γm = 1.8 µmol m-2
was reported in a recent study.16
On the other hand, our result for SBA-15 silica is significantly higher than a value
reported for lysine in a MCM-41 silica at pH 6 (Γm = 0.23 µmol m-2
).25
Possible
reasons for these differences are discussed in Section 5.5.1.
5.4.2 SANS results
The SANS profile of a slurry sample of pristine SBA-15 in D2O is shown on a
semi-logarithmic scale in Figure 5-3(a). Its main feature is the distinct (10) peak,
while the (11) and (20) Bragg reflections appear as a combined peak, due to the
limited instrumental resolution. This scattering profile was used to determine
parameter b characterizing the effective width of the Gaussian peaks. A mean value
b = 175 nm2 (for peaks hk = 10, 11, and 20) was obtained as previously,
12,13 and this
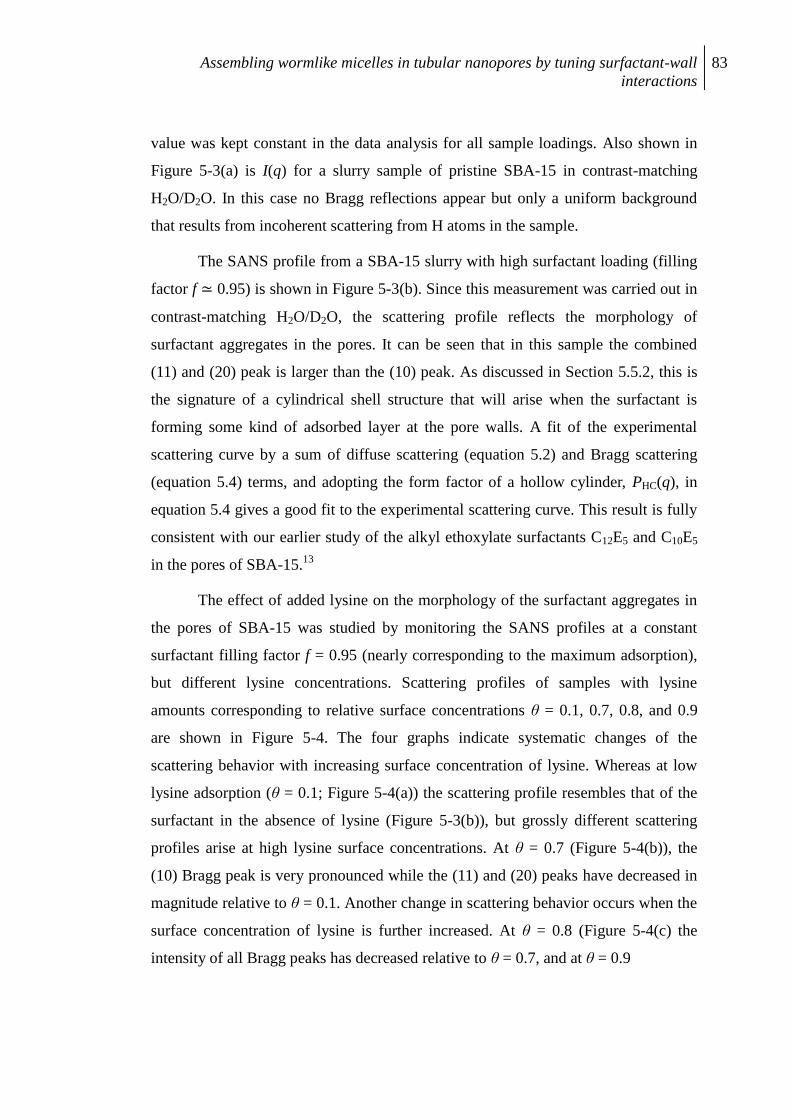
Assembling wormlike micelles in tubular nanopores by tuning surfactant-wall
interactions
83
value was kept constant in the data analysis for all sample loadings. Also shown in
Figure 5-3(a) is I(q) for a slurry sample of pristine SBA-15 in contrast-matching
H2O/D2O. In this case no Bragg reflections appear but only a uniform background
that results from incoherent scattering from H atoms in the sample.
The SANS profile from a SBA-15 slurry with high surfactant loading (filling
factor f ≃ 0.95) is shown in Figure 5-3(b). Since this measurement was carried out in
contrast-matching H2O/D2O, the scattering profile reflects the morphology of
surfactant aggregates in the pores. It can be seen that in this sample the combined
(11) and (20) peak is larger than the (10) peak. As discussed in Section 5.5.2, this is
the signature of a cylindrical shell structure that will arise when the surfactant is
forming some kind of adsorbed layer at the pore walls. A fit of the experimental
scattering curve by a sum of diffuse scattering (equation 5.2) and Bragg scattering
(equation 5.4) terms, and adopting the form factor of a hollow cylinder, PHC(q), in
equation 5.4 gives a good fit to the experimental scattering curve. This result is fully
consistent with our earlier study of the alkyl ethoxylate surfactants C12E5 and C10E5
in the pores of SBA-15.13
The effect of added lysine on the morphology of the surfactant aggregates in
the pores of SBA-15 was studied by monitoring the SANS profiles at a constant
surfactant filling factor f = 0.95 (nearly corresponding to the maximum adsorption),
but different lysine concentrations. Scattering profiles of samples with lysine
amounts corresponding to relative surface concentrations θ = 0.1, 0.7, 0.8, and 0.9
are shown in Figure 5-4. The four graphs indicate systematic changes of the
scattering behavior with increasing surface concentration of lysine. Whereas at low
lysine adsorption (θ = 0.1; Figure 5-4(a)) the scattering profile resembles that of the
surfactant in the absence of lysine (Figure 5-3(b)), but grossly different scattering
profiles arise at high lysine surface concentrations. At θ = 0.7 (Figure 5-4(b)), the
(10) Bragg peak is very pronounced while the (11) and (20) peaks have decreased in
magnitude relative to θ = 0.1. Another change in scattering behavior occurs when the
surface concentration of lysine is further increased. At θ = 0.8 (Figure 5-4(c) the
intensity of all Bragg peaks has decreased relative to θ = 0.7, and at θ = 0.9
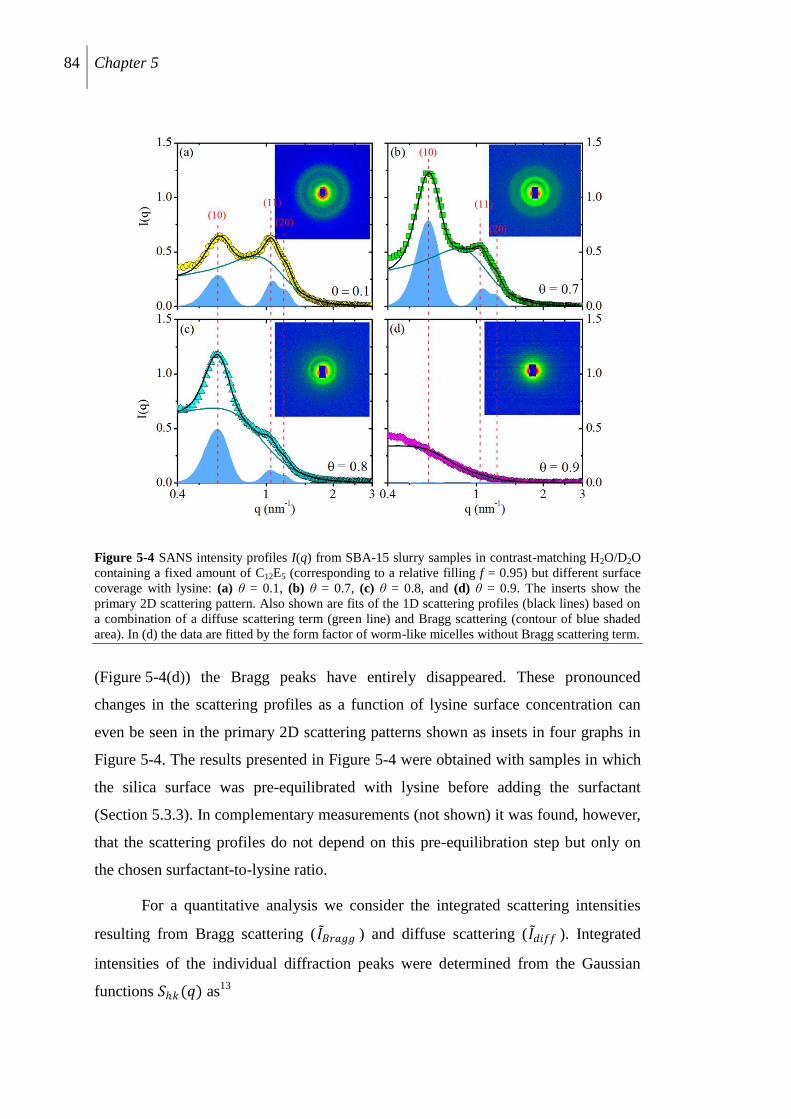
84 Chapter 5
Figure 5-4 SANS intensity profiles I(q) from SBA-15 slurry samples in contrast-matching H2O/D2O
containing a fixed amount of C12E5 (corresponding to a relative filling f = 0.95) but different surface
coverage with lysine: (a) θ = 0.1, (b) θ = 0.7, (c) θ = 0.8, and (d) θ = 0.9. The inserts show the
primary 2D scattering pattern. Also shown are fits of the 1D scattering profiles (black lines) based on
a combination of a diffuse scattering term (green line) and Bragg scattering (contour of blue shaded
area). In (d) the data are fitted by the form factor of worm-like micelles without Bragg scattering term.
(Figure 5-4(d)) the Bragg peaks have entirely disappeared. These pronounced
changes in the scattering profiles as a function of lysine surface concentration can
even be seen in the primary 2D scattering patterns shown as insets in four graphs in
Figure 5-4. The results presented in Figure 5-4 were obtained with samples in which
the silica surface was pre-equilibrated with lysine before adding the surfactant
(Section 5.3.3). In complementary measurements (not shown) it was found, however,
that the scattering profiles do not depend on this pre-equilibration step but only on
the chosen surfactant-to-lysine ratio.
For a quantitative analysis we consider the integrated scattering intensities
resulting from Bragg scattering (𝐼 𝐵𝑟𝑎𝑔𝑔 ) and diffuse scattering (𝐼 𝑑𝑖𝑓𝑓 ). Integrated
intensities of the individual diffraction peaks were determined from the Gaussian
functions 𝑆𝑘(𝑞) as13
Assembling wormlike micelles in tubular nanopores by tuning surfactant-wall
interactions
85
Figure 5-5 (a) Portion of the intensity contribution coming from diffused (circles) and Bragg
(squares) scattering towards the total experimental scattering intensity. (b) Integrated intensity of
individual Bragg‟s peaks (10)-squares, (11)-circles and (20)-triangles for SBA-15 in H2O/D2O with
adsorbed C12E5 at different lysine amounts. (c) peak maximum of the diffused scattering contribution
and s (I0/Im) calculated from equation 5.2. (d) Quasiperiodic distance d and order ξ, respectively of the
surfactant domain, calculated from equation 5.3.
𝐼 𝐵𝑟𝑎𝑔𝑔 = 𝐼 𝑘
𝑘
(5.6)
The integrated diffuse scattering of the samples was determined from the fits with the
Teubner-Strey function (equation 5.2) as
𝐼 𝑑𝑖𝑓𝑓 = 𝐼𝑑𝑖𝑓𝑓 (𝑞)𝑞2 𝑑𝑞 (5.7)
The integrated scattering intensities 𝐼 𝐵𝑟𝑎𝑔𝑔 , 𝐼 𝑑𝑖𝑓𝑓 and total integrated intensity
𝐼 𝑡𝑜𝑡𝑎𝑙 = 𝐼 𝐵𝑟𝑎𝑔𝑔 + 𝐼 𝑑𝑖𝑓𝑓 are shown as a function of θ in Figure 5-5(a). In all samples,
𝐼 𝑑𝑖𝑓𝑓 is the dominating contribution. For the two samples with lysine surface
concentration up to θ = 0.7, the two contributions 𝐼 𝑑𝑖𝑓𝑓 and 𝐼 𝐵𝑟𝑎𝑔𝑔 are nearly
constant. As the lysine adsorption is increased to θ = 0.9, 𝐼 𝑑𝑖𝑓𝑓 falls off sharply to a
low but finite value, while 𝐼 𝐵𝑟𝑎𝑔𝑔 decays to zero.
86 Chapter 5
The behavior of 𝐼 𝑑𝑖𝑓𝑓 can be rationalized on the basis that the present samples
can be regarded approximately as two-phase system consisting of aggregated
surfactant and matrix. In this case the diffuse scattering intensity will follow the
Porod relation26
𝐼 𝑑𝑖𝑓𝑓 ≃ 𝛷 1 − 𝛷 , where 𝛷 is the volume fraction of surfactant in
the sample. Since the surfactant loading was kept constant for all these samples, 𝐼 𝑑𝑖𝑓𝑓
should also remain constant if effectively all surfactant is adsorbed in the pores. The
fact that 𝐼 𝑑𝑖𝑓𝑓 falls off steeply at high θ > 0.7 therefore indicates that above some
threshold of the lysine surface concentration an increasing fraction of the surfactant
was not contained in the silica slurry but remained in the supernatant.
The integral Bragg scattering intensity 𝐼 𝐵𝑟𝑎𝑔𝑔 also remains nearly constant
from θ = 0.1 to θ = 0.7 (Figure 5-5(a)), but this does not apply to the individual
contributions 𝐼 𝑘 , as shown in Figure 5-5(b). Most remarkably, the intensity 𝐼 10
increases by nearly a factor 3 in this range, while the intensities 𝐼 11 and 𝐼 20
decrease. This change in the relative peak intensities, combined with the fact that the
amount of surfactant in the pore space has remained constant, can be taken as
conclusive evidence of a morphological transition of the surfactant aggregates in the
pore space, and the form factor simulations of Figure 5-1 clearly indicate that at
θ > 0.7 the surfactant is no longer forming a shell geometry but some cylindrical
geometry. As θ is further increased, the intensity of all Bragg peaks is decreasing and
vanishing at θ > 0.9, indicating that no surfactant is left in the pore space.
The diffuse scattering contribution of the samples with lysine surface
concentrations up to θ = 0.8 was represented by the Teubner-Strey model. Values of
the primary parameters 𝑞𝑚 and 𝑠 = 𝐼0/𝐼𝑚 of equation 5.2 are given in Figure 5-5(c),
and the characteristic lengths d and ξ derived from these parameters by equation 5.3
are shown in Figure 5-5(d). The values at low lysine concentration (θ = 0.1) are
similar to those found previously for this surfactant in the absence of lysine. A weak
increase of d and ξ is found as the lysine surface concentration increases up to
θ = 0.7. Above this threshold concentration, the quasiperiodic distance 𝑑 exhibits a
marked increase while the decay length ξ remains unchanged.
Assembling wormlike micelles in tubular nanopores by tuning surfactant-wall
interactions
87
5.5 Discussion
5.5.1 Lysine adsorption
Several adsorption studies of lysine onto silica surfaces have aimed to assess the
nature of the adsorptive interactions.25,27
In aqueous solutions, lysine can exist in
different dissociation states. In the pH range 6 to 9, which is of relevance in the
present context, these are the cationic (Lys+) and zwitterionic (Lys
±) form. With
increasing pH, silica surface becomes increasingly negatively charged as a result of
the dissociation of silanol groups. Since the adsorbed amount of lysine at silica
surfaces is strongly increasing with pH it was concluded that electrostatic
interactions with the negatively charged silica surface represent the main driving
force for the adsorption of lysine. In a recent ATR-IR study27
it was found that ca.
80% of the adsorbed lysine was present in the cationic state (Si–O–···Lys
+) and 20%
in the zwitterionic state (Si–O–···Lys
±). In both cases the adsorptive bond to the
surface is formed by the charged terminal amino group, such that the (zwitterionic or
anionic) α-aminoacid moiety is exposed to the aqueous medium.
The diversity in values of the limiting adsorption of lysine silica surfaces
reported in the literature16,25,27
may be due in part to different pH conditions at which
the measurements were performed, as the adsorption is strongly changing with pH.
Another cause will be that different silica materials have different surface
concentrations of silanol groups and thus a different concentration of binding sites
for the aminoacid. In particular we expect that silica nanoparticles prepared and kept
in the aqueous medium will have a higher silanol density than silica materials like
SBA-15 or MCM-41, which have been calcined at 550°C. Even for these two
materials different concentrations of silanol groups at the surface of the pore walls
have been reported, namely 2.9 nm-2
for MCM-41 and 3.7 nm-2
for SBA-15.28
The
limiting surface concentration 𝛤𝑚 = 𝑛𝑚 /𝑎𝑠 = 0.75 µmol m-2
for lysine on the present
SBA-15 material at pH 7 corresponds to a surface density 0.45 nm-2
, implying that at
maximum about 1 in 10 silanol groups is binding a lysine molecule.
88 Chapter 5
5.5.2 Lysine induced effects
For alkyl ethoxylate surfactants such as C12E5 it is generally accepted that hydrogen
bonding of the silanol groups to oxygen atoms of the ethoxylate head groups
represents the dominant binding mechanism of the surfactant to the silica surface.
The hydrogen bond can be formed either directly29
or mediated with water
molecules.30
We find that lysine is more strongly bound to the silica surface than the
surfactant molecules and thus the number of silanol groups available for adsorption
of the surfactant will decrease as the surface concentration of lysine increases.
Accordingly, the adsorptive binding of the surfactant to the surface will become
weaker as the relative surface concentration θ of lysine increases, and this lowering
of the adsorption energy eventually leads to the complete displacement of the
surfactant from the surface. Such a behavior was recently found for the surfactant
C12E5 at silica nanoparticles, where a gradual transition from surface micelles to
detached wormlike micelles in the bulk solution was observed as the lysine
concentration was increased.16
The present work shows, however, that in the
confined geometry of cylindrical pores the transition from bilayer patches attached to
the pore wall (θ ≤ 0.1) to wormlike micelles in the extrapore space (θ ≥ 0.9) proceeds
via an intermediate state (at θ ≃ 0.7). From the intensities of the leading Bragg peaks
(Figure 5-5(b)) we see that in this intermediate state, the surfactant is no longer
forming a cylindrical-shell structure as expected for an adsorbed (patchy) bilayer
film, but a cylindrical structure as expected for cylindrical micelles. Simple
geometric considerations show that the amount of surfactant in the pore space at the
chosen filling factor corresponds to that of a cylindrical aggregate of radius
𝑅𝑐 = 𝑅 𝜑 = 2.6 nm, based on the pore radius R = 4.1 nm and the mean volume
fraction of surfactant in the pore space υ ≃ 0.4. The resulting value of 𝑅𝑐 is similar
to that of cylindrical micelles of C12E5. Hence we propose that when the surfactant is
gradually displaced from the pore wall by lysine, the intermediate state at θ ≃ 0.7
represents a cylindrical micelle in the pore.
The observed surfactant aggregate morphologies are believed to represent
equilibrium structures as they are formed independent of whether the silica sample
was in contact first with lysine or with the surfactant. Accordingly, the displacement
Assembling wormlike micelles in tubular nanopores by tuning surfactant-wall
interactions
89
of surfactant by lysine is to be understood in a thermodynamic sense and not as a
unidirectional reaction. Hence, when the silica is pre-equilibrated with lysine at
surface concentration corresponding to the intermediate state (θ ≃ 0.7), surfactant is
being adsorbed into the pore space to form cylindrical micelles. Since this process is
not favored entropically against micelles in the aqueous bulk phase, we conclude that
the cylindrical aggregates must still keep in contact with the pore wall in some way.
A somewhat similar conclusion emerged from our recent study of the lysine-induced
displacement of C12E5 surface micelles from the surface of silica nanoparticles,16
where it was concluded that at intermediate lysine surface concentrations, the
weakening of the binding of the surfactant to the surface may involve the formation
of a water-rich layer between the surfactant aggregates and the surface. Further work
is needed to elucidate this aspect. Regardless of this open point we believe that this is
the first example to show that cylindrical surfactant micelles can form spontaneously
in cylindrical pores.
As mentioned previously, a wide variety of aggregate morphologies was
observed in DPD molecular simulations of a short-chain surfactant/water system
confined to a nanotube.31
Specifically, for model hydrophilic surfaces (when water
was preferred by the pore wall) and surfactant concentrations comparable to those in
the present work, formation of threadlike micelles was observed in the central region
of the nanopores. This aggregate morphology is consistent with the proposed
aggregate structure at intermediate lysine concentrations of the present work.
5.6 Conclusion
The self-assembly of the surfactant of C12E5 in the cylindrical nanopores of SBA-15
silica has been tuned by co-adsorption of the basic aminoacid lysine. The adsorption
behavior of lysine at SBA-15 was characterized by its single-component adsorption
isotherm while the adsorption isotherm of C12E5 was taken from the earlier study.
The aggregate morphologies of the surfactant in the pores in the absence and
presence of lysine was then studied by SANS in contrast-matching H2O/D2O water.
The SANS data were analysed along the lines described in our preceding studies.12,13
The main findings of this work are:
90 Chapter 5
(1) At low lysine adsorption levels the surfactant is forming patchy bilayer
aggregates at the pore walls, as observed in the absence of lysine.
(2) At high lysine adsorption levels, i.e. values approaching the limiting surface
concentration (0.75 µmol m-2
), the surfactant is completely displaced from the pore
space and forms cylindrical micelles in the extrapore bulk liquid.
(3) At an intermediate lysine adsorption level (ca. 70% of the maximum surface
concentration) the surfactant is forming cylindrical micelles inside the tubular pores.
Our conclusions rely on a quantitative analysis of the intensities of the Bragg
reflections from the pore lattice peaks as a function of the lysine adsorption level. To
our knowledge this is the first time that the formation of cylindrical surfactant
aggregates by adsorption into the cylindrical nanopores has been verified
experimentally. The driving force for this process is, however, not yet clear. We
propose that the cylindrical micelles in the pores are stabilized by weak interactions
with the surface, either by direct contact of surfactant head groups with the surface
silanol groups at a few places along the pore, or mediated by lysine and a hydration
shell of water at the pore wall.
References
1 Davis, M. E., Nature, 2002, 417, 813.
2 Slowing, I. I., Trewyn, B. G., Giri, S., Lin, S.-Y., Adv. Funct. Mater., 2007, 17,
1225.
3 Scamehorn, J. F., Harwell, J. H., “Surfactant-Based Separation Processes” 1989,
33, New York, USA.
4 Ruiz-Angel, M. J. S., Carda-Broch, S., Torres-Lapasio, J. R., Garcia-Alvarez-
Coque, M. C., J. Chromatogr. A, 2009, 1216, 1798.
5 Brumaru, C., Geng, M. L., Langmuir, 2010, 26, 19091.
6 Levitz, P., Langmuir, 1991, 7, 1595.
7 Grant, L. M., Tiberg, F., Ducker, W. A., J. Phys. Chem. B, 1998, 102, 4288.
Assembling wormlike micelles in tubular nanopores by tuning surfactant-wall
interactions
91
8 Tyrode, L., Rutland, M. W., Bain, C. D., J. Am. Chem. Soc., 2008, 130, 17434.
9 Dietsch, O., Eltekov, A., Bock, H., Gubbins, K. E., Findenegg, G. H., J. Phys.
Chem. C, 2007, 111, 16045.
10 Perret, E., Nygård, K., Satapathy, D. K., Balmer, T. E., Bunk, O., Heuberger, M.,
van der Veen, J. Europhys. Lett., 2009, 88, 36004; Nygård, K., Satapathy, D. K.,
Perret, E., Padeste, C., Bunk, O., David, C., van der Veen, J. F., Soft Matter, 2010, 6,
4536.
11 Qiao, Y., Schönhoff, M., Findenegg, G. H., Langmuir, 2003, 19, 6160.
12 Müter, D., Shin, T., Demé, B., Fratzl, P., Paris, O., Findenegg, G. H., J. Phys.
Chem. Lett., 2010, 1, 1442.
13 Shin, T., Müter, D., Meissner, J., Paris, O., Findenegg, G. H., Langmuir, 2011, 27,
5252.
14 Zhao, D. Y., Feng, J. L., Huo, Q. S., Melosh, N., Fredrickson, G. H., Chmelka, B.,
F., Stucky, G. D., Science, 1998, 279, 548.
15 Jähnert, S., Müter, D., Prass, J., Zickler, G. A., Paris, O., Findenegg, G. H. J. Phys.
Chem. C, 2009, 113, 15201; Findenegg, G. H., Jähnert, S., Müter, D., Prass, J., Paris,
O. Phys. Chem. Chem. Phys., 2010, 12, 7211.
16 Bharti, B., Meissner, J., Gasser, U., Findenegg, G. H., Soft Matter, 2012, 8, 2573.
17 Lugo, D., Oberdisse, J., Karg, M., Schweins, R., Findenegg, G. H., Soft Matter,
2009, 5, 2928.
18 Teubner, M., Strey, R., J. Chem. Phys., 1987, 87, 3195.
19 Kholodenko, A. L., Macromolecules, 1993, 26, 4179.
20 Akcakayiran, D., Mauder, D., Hess, C., Sievers, T. K., Kurth, D. G., Shenderovich,
I., Limbach, H.-H., Findenegg, G. H., J. Phys. Chem. B, 2008, 112, 14637.
21 Bharti, B., Meissner, J., Findenegg, G. H., Langmuir, 2011, 27, 9823.
92 Chapter 5
22 Jaroniec, M., Solovyov, L. A., Langmuir, 2006, 22, 6757.
23 http://www.ill.eu/html/instruments-support/computing-for-science/cs-software/all-
software/lamp/
24 Consortium Scilab - Digiteo (2011). Scilab: Free and Open Source software for
numerical computation (Windows, Version 5.3.3). Available from:
http://www.scilab.org
25 O‟Connor, A. J., Hokura, A., Kisler, J. M., Shimazu, S., Stevens, G. W., Komatsu,
Y., Sep. Purif. Technol., 2006, 48, 197.
26 Porod, G. “Small-Angle Scattering of X-rays”, 1967, Gordon & Breach, New York,
London, Paris.
27 Kitadai, N., Yokoyama, T., Nakashima, S., J. Colloid Interface Sci., 2009, 329, 31.
28 Shenderovich, I. G., Mauder, D.,, Akcakayiran, D., Buntkowsky, G., Limbach, H.-
H., Findenegg, G. H., J. Phys. Chem. B, 2007, 111, 12088.
29 Trens , P., Denoyel, R., Langmuir, 1993, 9, 519.
30 Matsson, M. K., Kronberg , B., Claesson, P. M., Langmuir, 2004, 20, 4051.
31 Arai, N., Yasuoka, K., Zeng, X. C., J. Am. Chem. Soc., 2008, 130, 7916.
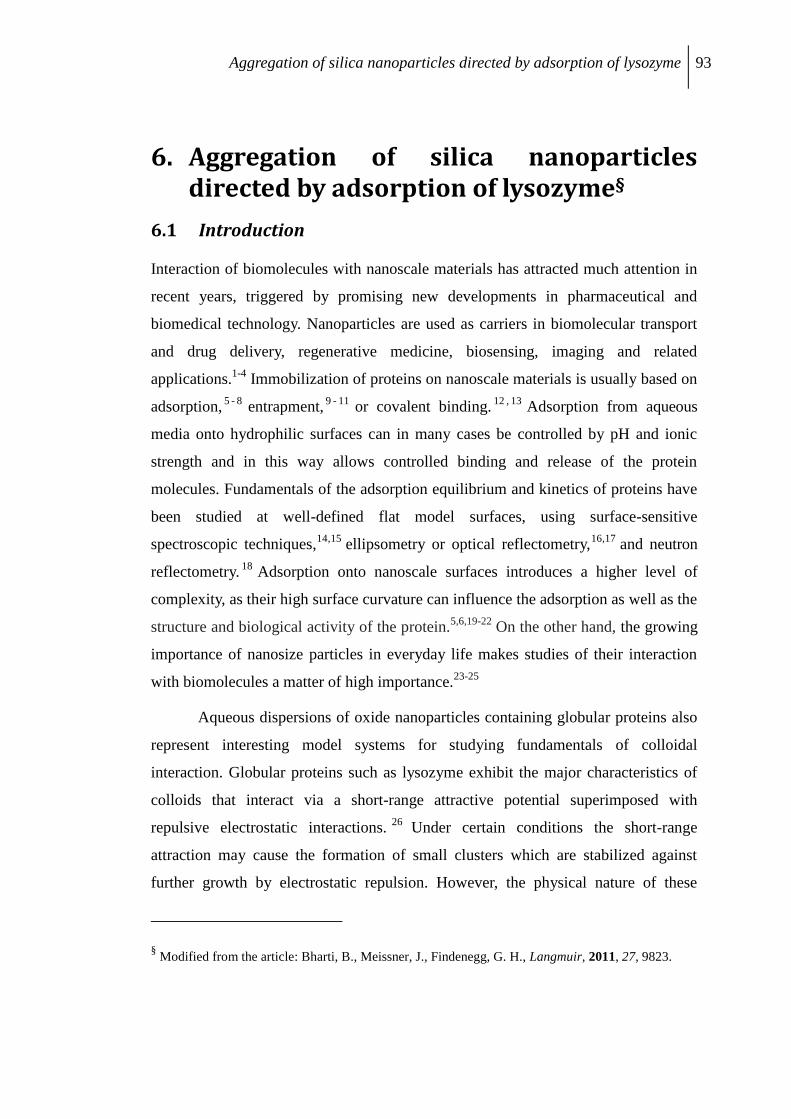
Aggregation of silica nanoparticles directed by adsorption of lysozyme 93
6. Aggregation of silica nanoparticles directed by adsorption of lysozyme§
6.1 Introduction
Interaction of biomolecules with nanoscale materials has attracted much attention in
recent years, triggered by promising new developments in pharmaceutical and
biomedical technology. Nanoparticles are used as carriers in biomolecular transport
and drug delivery, regenerative medicine, biosensing, imaging and related
applications.1-4
Immobilization of proteins on nanoscale materials is usually based on
adsorption,5 - 8
entrapment,9 - 11
or covalent binding.12 , 13
Adsorption from aqueous
media onto hydrophilic surfaces can in many cases be controlled by pH and ionic
strength and in this way allows controlled binding and release of the protein
molecules. Fundamentals of the adsorption equilibrium and kinetics of proteins have
been studied at well-defined flat model surfaces, using surface-sensitive
spectroscopic techniques,14,15
ellipsometry or optical reflectometry,16,17
and neutron
reflectometry.18
Adsorption onto nanoscale surfaces introduces a higher level of
complexity, as their high surface curvature can influence the adsorption as well as the
structure and biological activity of the protein.5,6,19-22
On the other hand, the growing
importance of nanosize particles in everyday life makes studies of their interaction
with biomolecules a matter of high importance.23-25
Aqueous dispersions of oxide nanoparticles containing globular proteins also
represent interesting model systems for studying fundamentals of colloidal
interaction. Globular proteins such as lysozyme exhibit the major characteristics of
colloids that interact via a short-range attractive potential superimposed with
repulsive electrostatic interactions.26
Under certain conditions the short-range
attraction may cause the formation of small clusters which are stabilized against
further growth by electrostatic repulsion. However, the physical nature of these
§ Modified from the article: Bharti, B., Meissner, J., Findenegg, G. H., Langmuir, 2011, 27, 9823.
94 Chapter 6
protein clusters is still not fully understood and remains an active field of current
research.27 - 30
Oxide particles such as silica are prototypical for colloid systems
interacting by van der Waals and electrical double layer forces. Ionic strength and pH
are affecting the aggregation of these particles in a way predicted by the Derjaguin–
Landau–Verwey–Overbeek (DLVO) theory.31,32
The adsorption of globular proteins
onto colloidal oxide particles is attributed to electrostatics, dispersion forces and
solvation forces. Electrostatic interaction will promote protein adsorption in the pH
range between the isoelectric point (IEP) of protein and of the surface, and impede
adsorption outside this pH range, where the net charge of the protein is equal to that
of the particles.17
Accordingly, pH will have a pronounced effect on the strength of
adsorption of the protein at the particle surface. Many studies have been devoted to
the adsorption of proteins on nanoparticles and the effect of adsorption on the protein
structure and activity.5,6,19-22
On the other hand, rather little is known about how
protein adsorption is affecting the interaction of the nanoparticles. Recently, Kendall
et al.23
studied the aggregation behavior of nanoparticles induced by fibrinogen, in
order to assess the toxicity of the particles in relation to the proteins. In a different
context, Ang et al.33
studied the interaction of silica nanoparticles with ß-casein at
air-water interface and its effect on the surface activity of the silica-protein
complexes. Bridging attraction and hetero-aggregation of silica nanoparticles was
also found under the influence of adsorbed polyethylene oxide34
and of thermo-
responsive polymer chains.35
This kind of behavior contrasts with the more familiar
situation in which aggregation is prevented by grafting of an organic layer onto the
surface of the particles.36,37
Here we study the adsorption of a globular protein on silica nanoparticles and
the protein-induced interaction between the nanoparticles from a colloid science
point of view. Lysozyme (molecular mass 14.3 kDa, isoelectric point near pH 11)
was chosen as the protein because of its high structural stability which makes it a
good model for “hard” proteins. The molecules are of roughly prolate shape and have
a radius of gyration of 1.64 nm.38
The silica nanoparticles used in this study were
synthesized by a variant of the classical Stöber method, using lysine instead of
ammonia as the catalyst. This allows to prepare samples of low polydispersity for
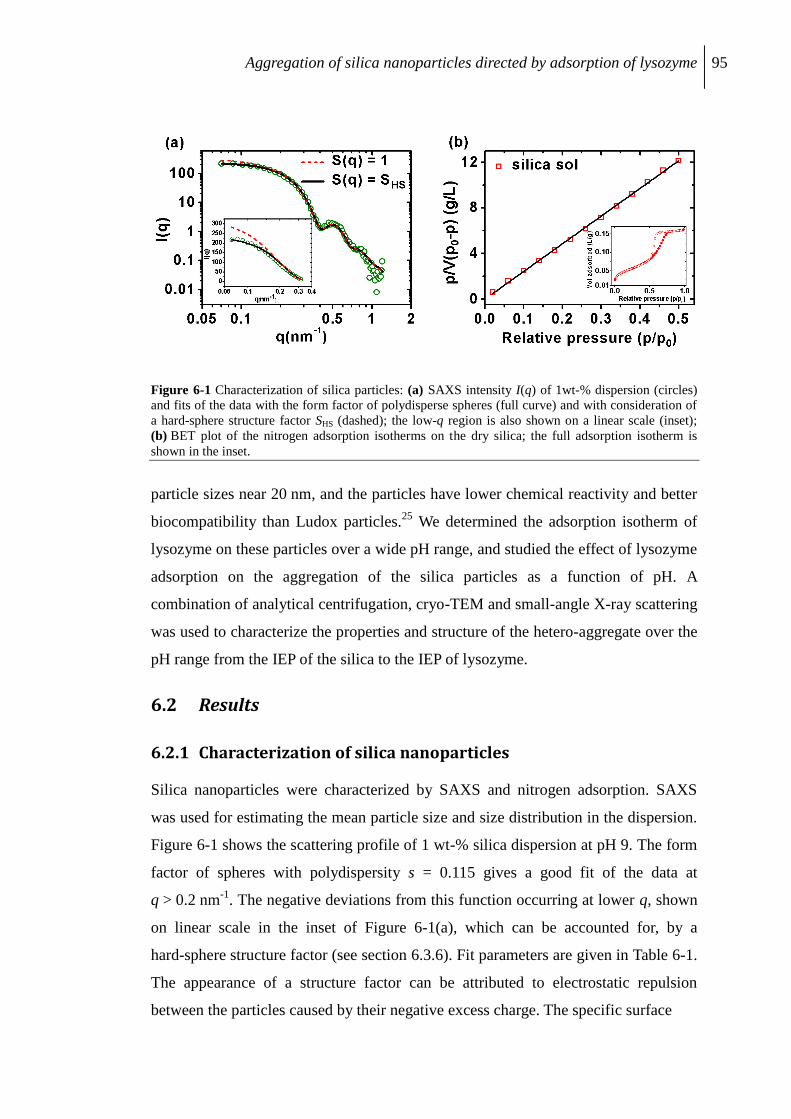
Aggregation of silica nanoparticles directed by adsorption of lysozyme 95
Figure 6-1 Characterization of silica particles: (a) SAXS intensity I(q) of 1wt-% dispersion (circles)
and fits of the data with the form factor of polydisperse spheres (full curve) and with consideration of
a hard-sphere structure factor SHS (dashed); the low-q region is also shown on a linear scale (inset);
(b) BET plot of the nitrogen adsorption isotherms on the dry silica; the full adsorption isotherm is
shown in the inset.
particle sizes near 20 nm, and the particles have lower chemical reactivity and better
biocompatibility than Ludox particles.25
We determined the adsorption isotherm of
lysozyme on these particles over a wide pH range, and studied the effect of lysozyme
adsorption on the aggregation of the silica particles as a function of pH. A
combination of analytical centrifugation, cryo-TEM and small-angle X-ray scattering
was used to characterize the properties and structure of the hetero-aggregate over the
pH range from the IEP of the silica to the IEP of lysozyme.
6.2 Results
6.2.1 Characterization of silica nanoparticles
Silica nanoparticles were characterized by SAXS and nitrogen adsorption. SAXS
was used for estimating the mean particle size and size distribution in the dispersion.
Figure 6-1 shows the scattering profile of 1 wt-% silica dispersion at pH 9. The form
factor of spheres with polydispersity s = 0.115 gives a good fit of the data at
q > 0.2 nm-1
. The negative deviations from this function occurring at lower q, shown
on linear scale in the inset of Figure 6-1(a), which can be accounted for, by a
hard-sphere structure factor (see section 6.3.6). Fit parameters are given in Table 6-1.
The appearance of a structure factor can be attributed to electrostatic repulsion
between the particles caused by their negative excess charge. The specific surface
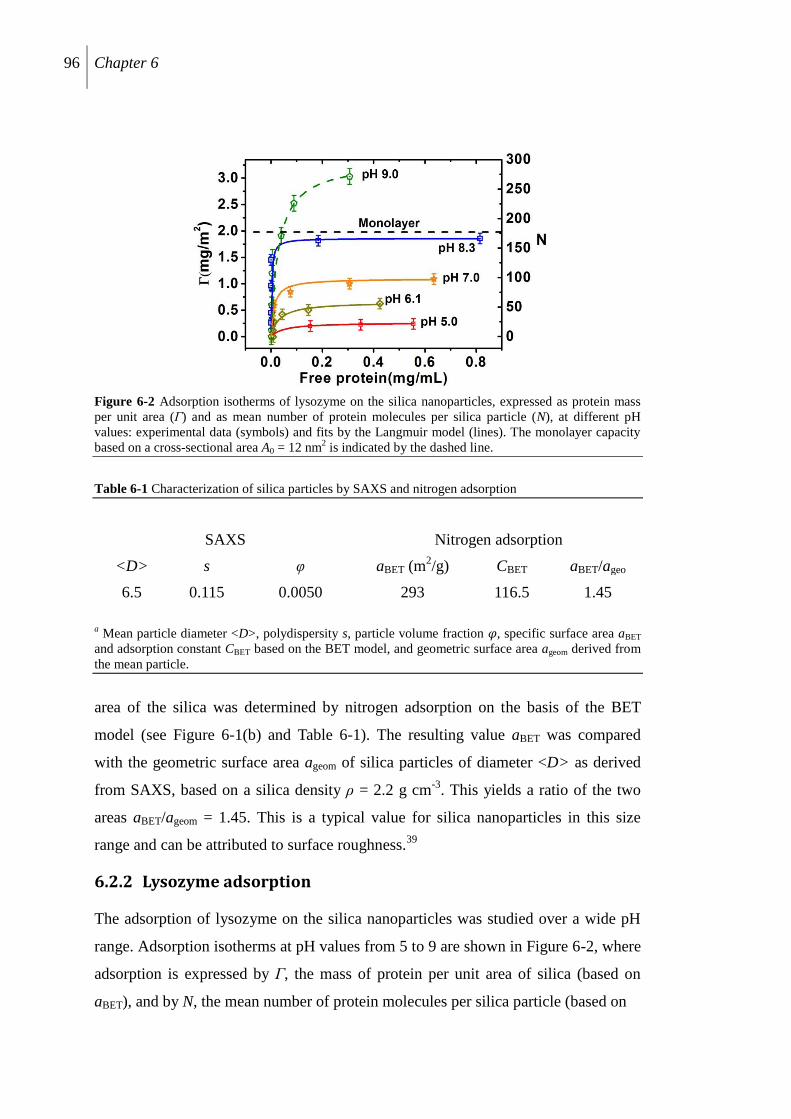
96 Chapter 6
Figure 6-2 Adsorption isotherms of lysozyme on the silica nanoparticles, expressed as protein mass
per unit area (Γ) and as mean number of protein molecules per silica particle (N), at different pH
values: experimental data (symbols) and fits by the Langmuir model (lines). The monolayer capacity
based on a cross-sectional area A0 = 12 nm2 is indicated by the dashed line.
Table 6-1 Characterization of silica particles by SAXS and nitrogen adsorption
SAXS Nitrogen adsorption
<D> s θ aBET (m2/g) CBET aBET/ageo
6.5 0.115 0.0050 293 116.5 1.45
a Mean particle diameter <D>, polydispersity s, particle volume fraction 𝜑, specific surface area aBET
and adsorption constant CBET based on the BET model, and geometric surface area ageom derived from
the mean particle.
area of the silica was determined by nitrogen adsorption on the basis of the BET
model (see Figure 6-1(b) and Table 6-1). The resulting value aBET was compared
with the geometric surface area ageom of silica particles of diameter <D> as derived
from SAXS, based on a silica density ρ = 2.2 g cm-3
. This yields a ratio of the two
areas aBET/ageom = 1.45. This is a typical value for silica nanoparticles in this size
range and can be attributed to surface roughness.39
6.2.2 Lysozyme adsorption
The adsorption of lysozyme on the silica nanoparticles was studied over a wide pH
range. Adsorption isotherms at pH values from 5 to 9 are shown in Figure 6-2, where
adsorption is expressed by Γ, the mass of protein per unit area of silica (based on
aBET), and by N, the mean number of protein molecules per silica particle (based on
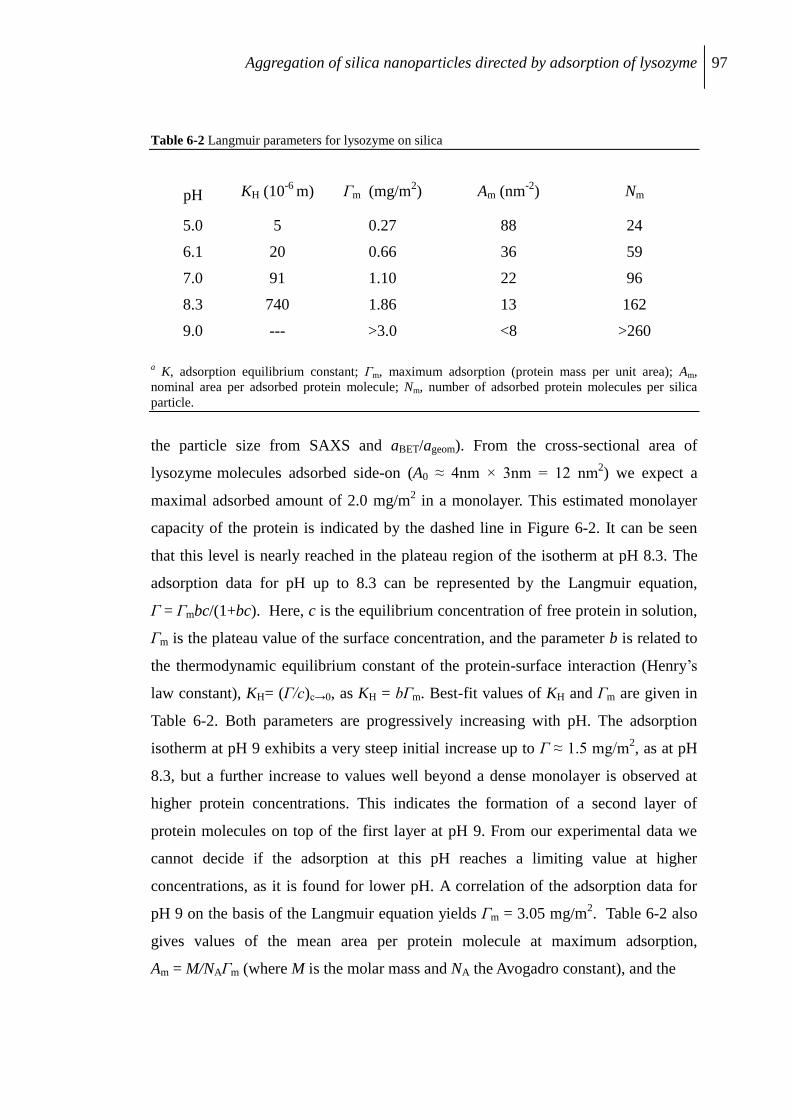
Aggregation of silica nanoparticles directed by adsorption of lysozyme 97
Table 6-2 Langmuir parameters for lysozyme on silica
pH KH (10-6
m) Γm (mg/m2) Am (nm
-2) Nm
5.0 5 0.27 88 24
6.1 20 0.66 36 59
7.0 91 1.10 22 96
8.3 740 1.86 13 162
9.0 --- >3.0 <8 >260
a K, adsorption equilibrium constant; Γm, maximum adsorption (protein mass per unit area); Am,
nominal area per adsorbed protein molecule; Nm, number of adsorbed protein molecules per silica
particle.
the particle size from SAXS and aBET/ageom). From the cross-sectional area of
lysozyme molecules adsorbed side-on (A0 ≈ 4nm × 3nm = 12 nm2) we expect a
maximal adsorbed amount of 2.0 mg/m2 in a monolayer. This estimated monolayer
capacity of the protein is indicated by the dashed line in Figure 6-2. It can be seen
that this level is nearly reached in the plateau region of the isotherm at pH 8.3. The
adsorption data for pH up to 8.3 can be represented by the Langmuir equation,
Γ = Γmbc/(1+bc). Here, c is the equilibrium concentration of free protein in solution,
Γm is the plateau value of the surface concentration, and the parameter b is related to
the thermodynamic equilibrium constant of the protein-surface interaction (Henry‟s
law constant), KH= (Γ/c)c→0, as KH = bΓm. Best-fit values of KH and Γm are given in
Table 6-2. Both parameters are progressively increasing with pH. The adsorption
isotherm at pH 9 exhibits a very steep initial increase up to Γ ≈ 1.5 mg/m2, as at pH
8.3, but a further increase to values well beyond a dense monolayer is observed at
higher protein concentrations. This indicates the formation of a second layer of
protein molecules on top of the first layer at pH 9. From our experimental data we
cannot decide if the adsorption at this pH reaches a limiting value at higher
concentrations, as it is found for lower pH. A correlation of the adsorption data for
pH 9 on the basis of the Langmuir equation yields Γm = 3.05 mg/m2. Table 6-2 also
gives values of the mean area per protein molecule at maximum adsorption,
Am = M/NAΓm (where M is the molar mass and NA the Avogadro constant), and the
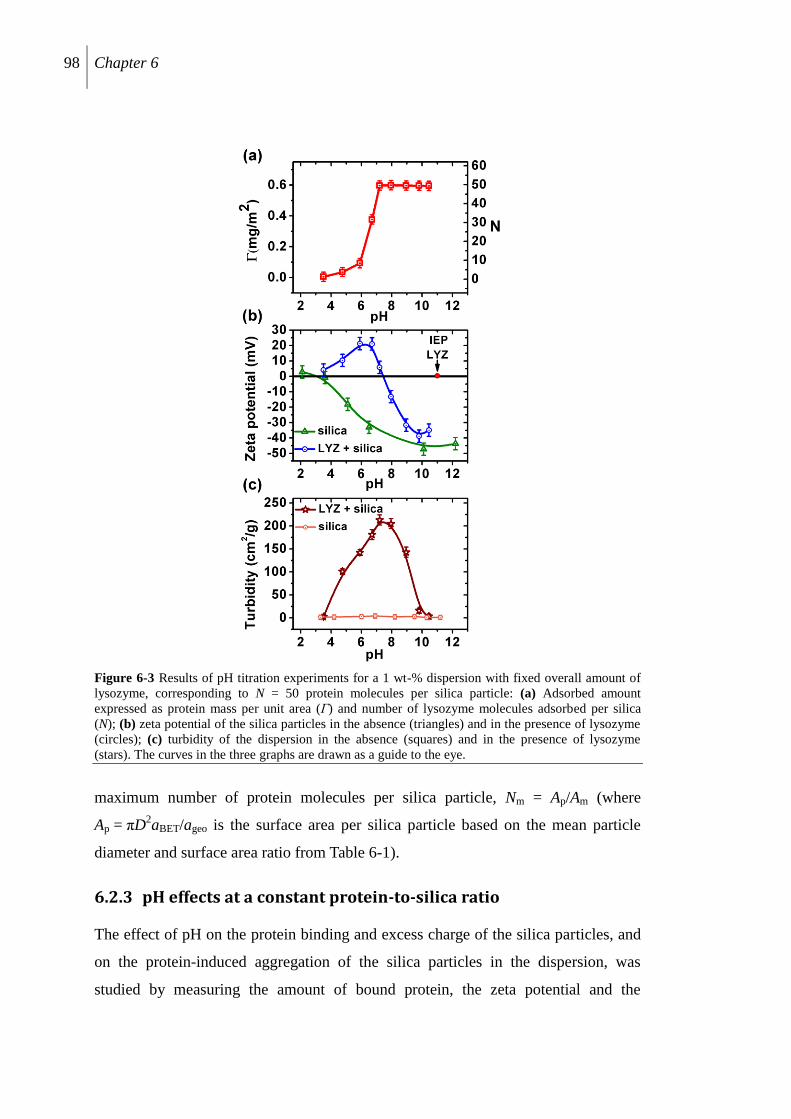
98 Chapter 6
Figure 6-3 Results of pH titration experiments for a 1 wt-% dispersion with fixed overall amount of
lysozyme, corresponding to N = 50 protein molecules per silica particle: (a) Adsorbed amount
expressed as protein mass per unit area (Γ) and number of lysozyme molecules adsorbed per silica
(N); (b) zeta potential of the silica particles in the absence (triangles) and in the presence of lysozyme
(circles); (c) turbidity of the dispersion in the absence (squares) and in the presence of lysozyme
(stars). The curves in the three graphs are drawn as a guide to the eye.
maximum number of protein molecules per silica particle, Nm = Ap/Am (where
Ap = πD2aBET/ageo is the surface area per silica particle based on the mean particle
diameter and surface area ratio from Table 6-1).
6.2.3 pH effects at a constant protein-to-silica ratio
The effect of pH on the protein binding and excess charge of the silica particles, and
on the protein-induced aggregation of the silica particles in the dispersion, was
studied by measuring the amount of bound protein, the zeta potential and the
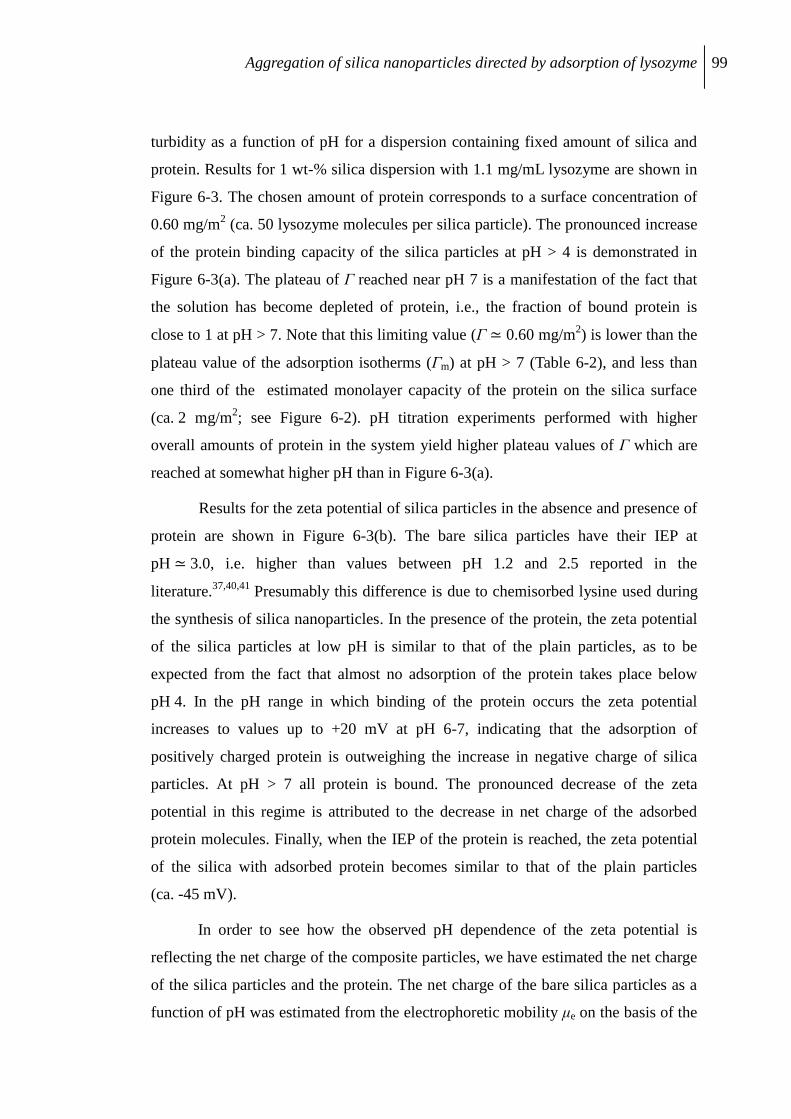
Aggregation of silica nanoparticles directed by adsorption of lysozyme 99
turbidity as a function of pH for a dispersion containing fixed amount of silica and
protein. Results for 1 wt-% silica dispersion with 1.1 mg/mL lysozyme are shown in
Figure 6-3. The chosen amount of protein corresponds to a surface concentration of
0.60 mg/m2 (ca. 50 lysozyme molecules per silica particle). The pronounced increase
of the protein binding capacity of the silica particles at pH > 4 is demonstrated in
Figure 6-3(a). The plateau of Γ reached near pH 7 is a manifestation of the fact that
the solution has become depleted of protein, i.e., the fraction of bound protein is
close to 1 at pH > 7. Note that this limiting value (Γ ≃ 0.60 mg/m2) is lower than the
plateau value of the adsorption isotherms (Γm) at pH > 7 (Table 6-2), and less than
one third of the estimated monolayer capacity of the protein on the silica surface
(ca. 2 mg/m2; see Figure 6-2). pH titration experiments performed with higher
overall amounts of protein in the system yield higher plateau values of Γ which are
reached at somewhat higher pH than in Figure 6-3(a).
Results for the zeta potential of silica particles in the absence and presence of
protein are shown in Figure 6-3(b). The bare silica particles have their IEP at
pH ≃ 3.0, i.e. higher than values between pH 1.2 and 2.5 reported in the
literature.37,40,41
Presumably this difference is due to chemisorbed lysine used during
the synthesis of silica nanoparticles. In the presence of the protein, the zeta potential
of the silica particles at low pH is similar to that of the plain particles, as to be
expected from the fact that almost no adsorption of the protein takes place below
pH 4. In the pH range in which binding of the protein occurs the zeta potential
increases to values up to +20 mV at pH 6-7, indicating that the adsorption of
positively charged protein is outweighing the increase in negative charge of silica
particles. At pH > 7 all protein is bound. The pronounced decrease of the zeta
potential in this regime is attributed to the decrease in net charge of the adsorbed
protein molecules. Finally, when the IEP of the protein is reached, the zeta potential
of the silica with adsorbed protein becomes similar to that of the plain particles
(ca. -45 mV).
In order to see how the observed pH dependence of the zeta potential is
reflecting the net charge of the composite particles, we have estimated the net charge
of the silica particles and the protein. The net charge of the bare silica particles as a
function of pH was estimated from the electrophoretic mobility μe on the basis of the
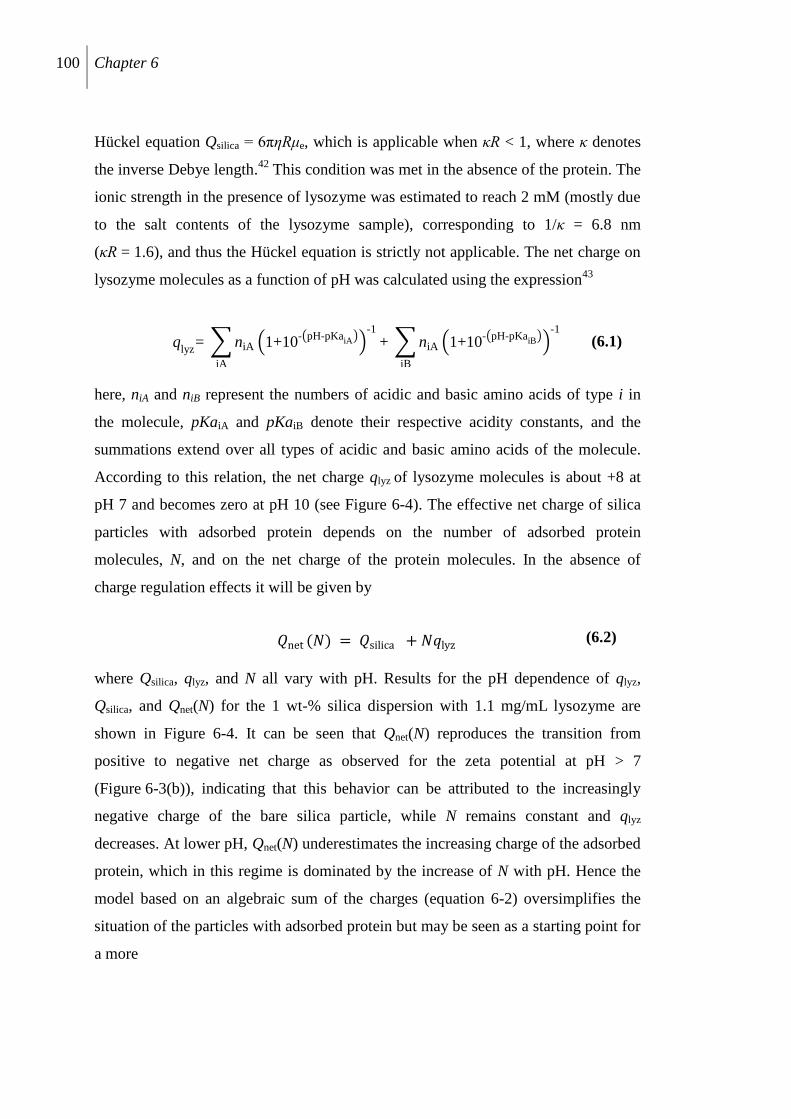
100 Chapter 6
Hückel equation Qsilica = 6πηRμe, which is applicable when κR < 1, where κ denotes
the inverse Debye length.42
This condition was met in the absence of the protein. The
ionic strength in the presence of lysozyme was estimated to reach 2 mM (mostly due
to the salt contents of the lysozyme sample), corresponding to 1/κ = 6.8 nm
(κR = 1.6), and thus the Hückel equation is strictly not applicable. The net charge on
lysozyme molecules as a function of pH was calculated using the expression43
qlyz
= niA 1+10- pH-pKaiA
-1
iA
+ niA 1+10- pH-pKaiB
-1
iB
(6.1)
here, niA and niB represent the numbers of acidic and basic amino acids of type i in
the molecule, pKaiA and pKaiB denote their respective acidity constants, and the
summations extend over all types of acidic and basic amino acids of the molecule.
According to this relation, the net charge qlyz of lysozyme molecules is about +8 at
pH 7 and becomes zero at pH 10 (see Figure 6-4). The effective net charge of silica
particles with adsorbed protein depends on the number of adsorbed protein
molecules, N, and on the net charge of the protein molecules. In the absence of
charge regulation effects it will be given by
𝑄net (𝑁) = 𝑄silica + 𝑁𝑞lyz (6.2)
where Qsilica, qlyz, and N all vary with pH. Results for the pH dependence of qlyz,
Qsilica, and Qnet(N) for the 1 wt-% silica dispersion with 1.1 mg/mL lysozyme are
shown in Figure 6-4. It can be seen that Qnet(N) reproduces the transition from
positive to negative net charge as observed for the zeta potential at pH > 7
(Figure 6-3(b)), indicating that this behavior can be attributed to the increasingly
negative charge of the bare silica particle, while N remains constant and qlyz
decreases. At lower pH, Qnet(N) underestimates the increasing charge of the adsorbed
protein, which in this regime is dominated by the increase of N with pH. Hence the
model based on an algebraic sum of the charges (equation 6-2) oversimplifies the
situation of the particles with adsorbed protein but may be seen as a starting point for
a more
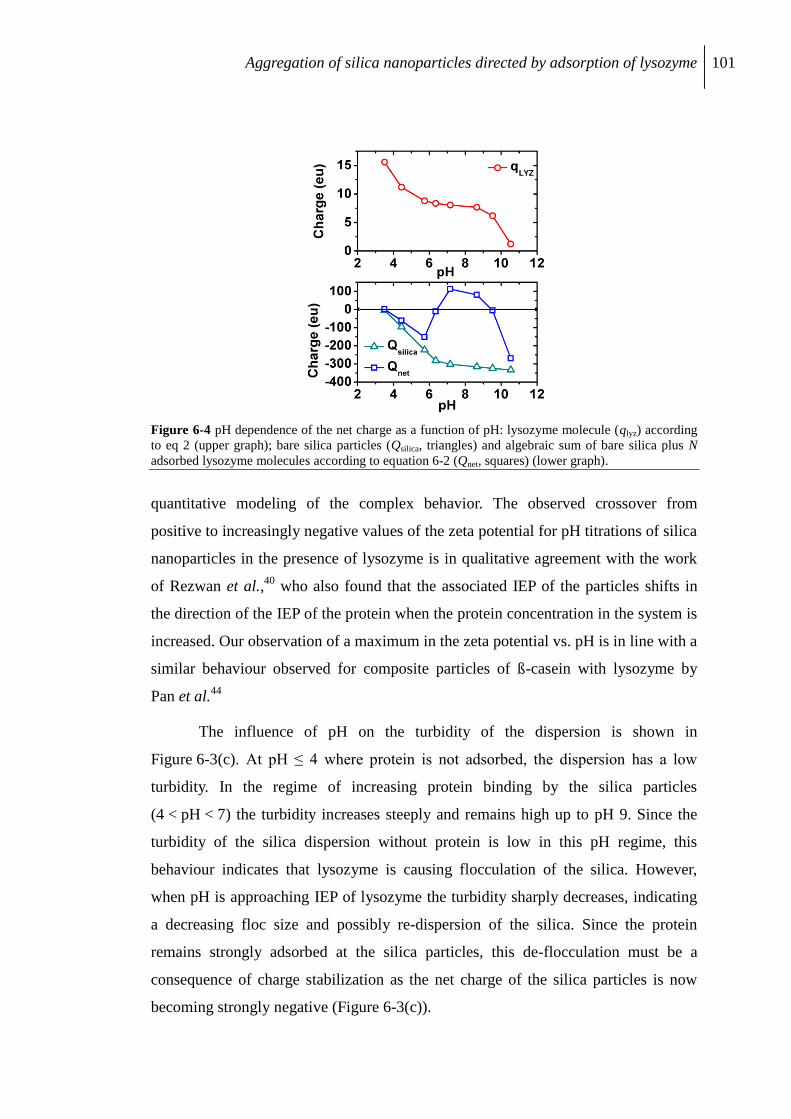
Aggregation of silica nanoparticles directed by adsorption of lysozyme 101
Figure 6-4 pH dependence of the net charge as a function of pH: lysozyme molecule (qlyz) according
to eq 2 (upper graph); bare silica particles (Qsilica, triangles) and algebraic sum of bare silica plus N
adsorbed lysozyme molecules according to equation 6-2 (Qnet, squares) (lower graph).
quantitative modeling of the complex behavior. The observed crossover from
positive to increasingly negative values of the zeta potential for pH titrations of silica
nanoparticles in the presence of lysozyme is in qualitative agreement with the work
of Rezwan et al.,40
who also found that the associated IEP of the particles shifts in
the direction of the IEP of the protein when the protein concentration in the system is
increased. Our observation of a maximum in the zeta potential vs. pH is in line with a
similar behaviour observed for composite particles of ß-casein with lysozyme by
Pan et al.44
The influence of pH on the turbidity of the dispersion is shown in
Figure 6-3(c). At pH ≤ 4 where protein is not adsorbed, the dispersion has a low
turbidity. In the regime of increasing protein binding by the silica particles
(4 < pH < 7) the turbidity increases steeply and remains high up to pH 9. Since the
turbidity of the silica dispersion without protein is low in this pH regime, this
behaviour indicates that lysozyme is causing flocculation of the silica. However,
when pH is approaching IEP of lysozyme the turbidity sharply decreases, indicating
a decreasing floc size and possibly re-dispersion of the silica. Since the protein
remains strongly adsorbed at the silica particles, this de-flocculation must be a
consequence of charge stabilization as the net charge of the silica particles is now
becoming strongly negative (Figure 6-3(c)).
102 Chapter 6
Figure 6-5 Sedimentation kinetics of the silica/lysozyme hetero-flocculate at different pH values
(20°C) expressed by the normalized position (Δl/l) of the flocculate/supernatant boundary (traced at a
limiting transmission value of 75%) at constant centrifugal acceleration 36g (left) and 2300g (right);
the inset shows the results for times >200s at 2300g on an expanded scale.
6.2.4 Characterization by analytical centrifuge
Analytical centrifugation was used to characterize the properties of the
hetero-flocculate as a function of pH for the same protein-to-silica ratio as in section
6.2.3. At the onset of protein binding to the silica particles (pH 4.2) a low turbidity
and no significant change of the transmission profile with time was detected,
indicating that only small aggregates exist. At a somewhat higher pH (5.5) but still in
the low protein binding regime (Figure 6-3(a)), an initial polydisperse sedimentation
is observed in which the particles settle with different velocities according to
differences in floc size. Whereas initially small flocs have enough room to settle
individually, later they combine to a flocculated network as at higher pH. In the
complete protein-binding regime (pH 7 to 9) the samples exhibit the typical zone
sedimentation behavior of flocculated networks. However, as pH is further increased
to pH 10, the behavior changes sharply to a polydisperse sedimentation. The
sedimentation and compression kinetics of the samples as a function of pH is shown
in Figure 6-5. The initial sedimentation velocity measured at 36 g (Figure 6-5-left)
increases from pH 5.5 to 8.7 but the sediment volume at pH 5.5 is significantly
smaller than at pH 7-9. The sedimentation velocity at pH 10.2 is much smaller than
for the other samples at 36g. However, at a higher acceleration (2300 g) the sample
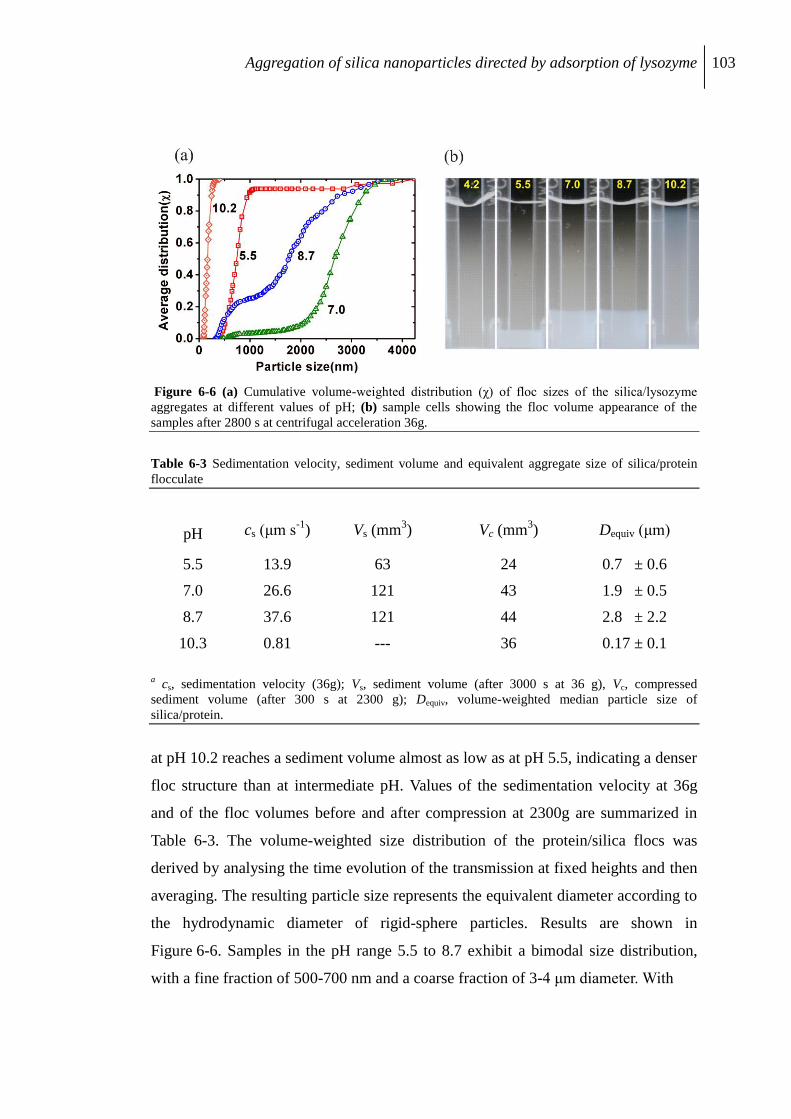
Aggregation of silica nanoparticles directed by adsorption of lysozyme 103
Figure 6-6 (a) Cumulative volume-weighted distribution (χ) of floc sizes of the silica/lysozyme
aggregates at different values of pH; (b) sample cells showing the floc volume appearance of the
samples after 2800 s at centrifugal acceleration 36g.
Table 6-3 Sedimentation velocity, sediment volume and equivalent aggregate size of silica/protein
flocculate
pH cs (μm s-1
) Vs (mm3) Vc (mm
3) Dequiv (μm)
5.5 13.9 63 24 0.7 ± 0.6
7.0 26.6 121 43 1.9 ± 0.5
8.7 37.6 121 44 2.8 ± 2.2
10.3 0.81 --- 36 0.17 ± 0.1
a cs, sedimentation velocity (36g); Vs, sediment volume (after 3000 s at 36 g), Vc, compressed
sediment volume (after 300 s at 2300 g); Dequiv, volume-weighted median particle size of
silica/protein.
at pH 10.2 reaches a sediment volume almost as low as at pH 5.5, indicating a denser
floc structure than at intermediate pH. Values of the sedimentation velocity at 36g
and of the floc volumes before and after compression at 2300g are summarized in
Table 6-3. The volume-weighted size distribution of the protein/silica flocs was
derived by analysing the time evolution of the transmission at fixed heights and then
averaging. The resulting particle size represents the equivalent diameter according to
the hydrodynamic diameter of rigid-sphere particles. Results are shown in
Figure 6-6. Samples in the pH range 5.5 to 8.7 exhibit a bimodal size distribution,
with a fine fraction of 500-700 nm and a coarse fraction of 3-4 μm diameter. With
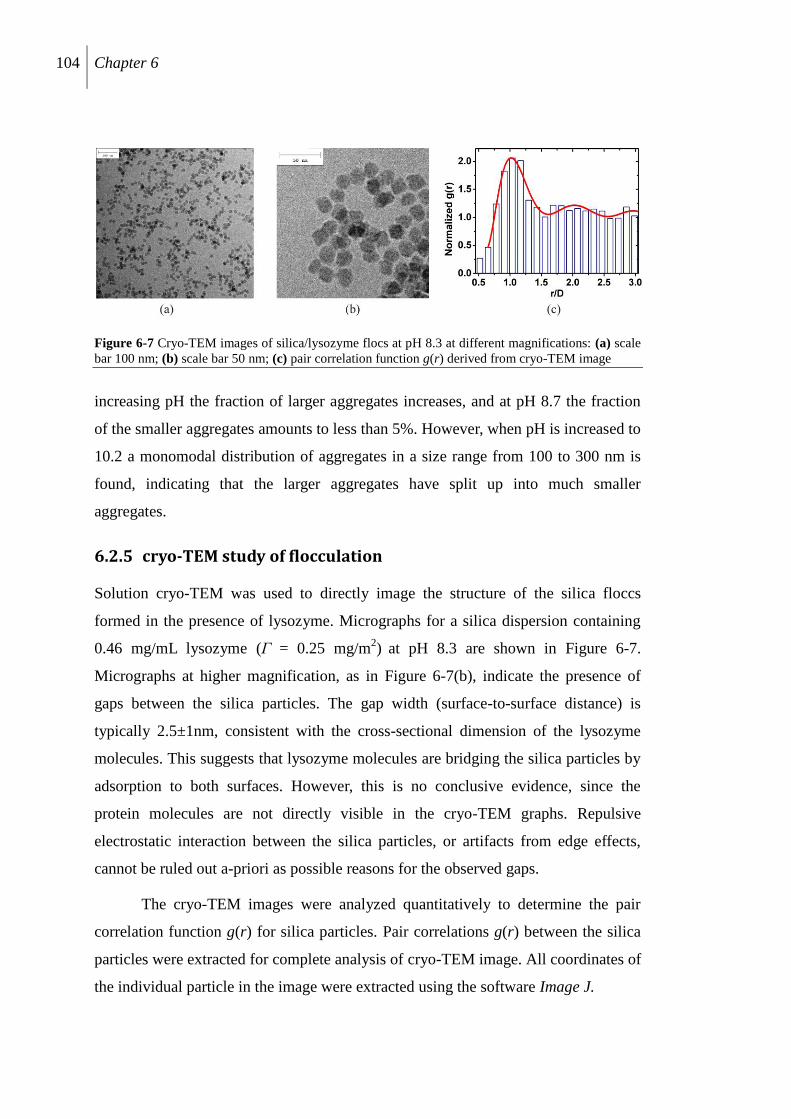
104 Chapter 6
Figure 6-7 Cryo-TEM images of silica/lysozyme flocs at pH 8.3 at different magnifications: (a) scale
bar 100 nm; (b) scale bar 50 nm; (c) pair correlation function g(r) derived from cryo-TEM image
increasing pH the fraction of larger aggregates increases, and at pH 8.7 the fraction
of the smaller aggregates amounts to less than 5%. However, when pH is increased to
10.2 a monomodal distribution of aggregates in a size range from 100 to 300 nm is
found, indicating that the larger aggregates have split up into much smaller
aggregates.
6.2.5 cryo-TEM study of flocculation
Solution cryo-TEM was used to directly image the structure of the silica floccs
formed in the presence of lysozyme. Micrographs for a silica dispersion containing
0.46 mg/mL lysozyme (Γ = 0.25 mg/m2) at pH 8.3 are shown in Figure 6-7.
Micrographs at higher magnification, as in Figure 6-7(b), indicate the presence of
gaps between the silica particles. The gap width (surface-to-surface distance) is
typically 2.5±1nm, consistent with the cross-sectional dimension of the lysozyme
molecules. This suggests that lysozyme molecules are bridging the silica particles by
adsorption to both surfaces. However, this is no conclusive evidence, since the
protein molecules are not directly visible in the cryo-TEM graphs. Repulsive
electrostatic interaction between the silica particles, or artifacts from edge effects,
cannot be ruled out a-priori as possible reasons for the observed gaps.
The cryo-TEM images were analyzed quantitatively to determine the pair
correlation function g(r) for silica particles. Pair correlations g(r) between the silica
particles were extracted for complete analysis of cryo-TEM image. All coordinates of
the individual particle in the image were extracted using the software Image J.
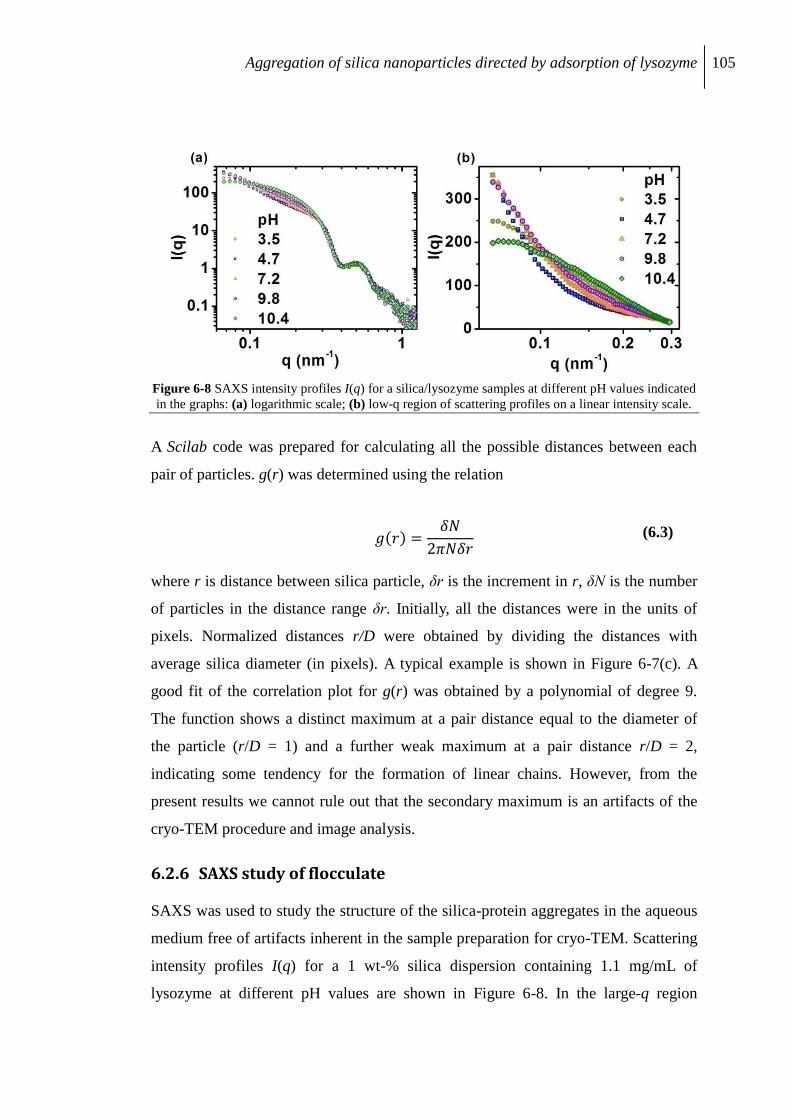
Aggregation of silica nanoparticles directed by adsorption of lysozyme 105
Figure 6-8 SAXS intensity profiles I(q) for a silica/lysozyme samples at different pH values indicated
in the graphs: (a) logarithmic scale; (b) low-q region of scattering profiles on a linear intensity scale.
A Scilab code was prepared for calculating all the possible distances between each
pair of particles. g(r) was determined using the relation
𝑔 𝑟 =𝛿𝑁
2𝜋𝑁𝛿𝑟 (6.3)
where r is distance between silica particle, δr is the increment in r, δN is the number
of particles in the distance range δr. Initially, all the distances were in the units of
pixels. Normalized distances r/D were obtained by dividing the distances with
average silica diameter (in pixels). A typical example is shown in Figure 6-7(c). A
good fit of the correlation plot for g(r) was obtained by a polynomial of degree 9.
The function shows a distinct maximum at a pair distance equal to the diameter of
the particle (r/D = 1) and a further weak maximum at a pair distance r/D = 2,
indicating some tendency for the formation of linear chains. However, from the
present results we cannot rule out that the secondary maximum is an artifacts of the
cryo-TEM procedure and image analysis.
6.2.6 SAXS study of flocculate
SAXS was used to study the structure of the silica-protein aggregates in the aqueous
medium free of artifacts inherent in the sample preparation for cryo-TEM. Scattering
intensity profiles I(q) for a 1 wt-% silica dispersion containing 1.1 mg/mL of
lysozyme at different pH values are shown in Figure 6-8. In the large-q region
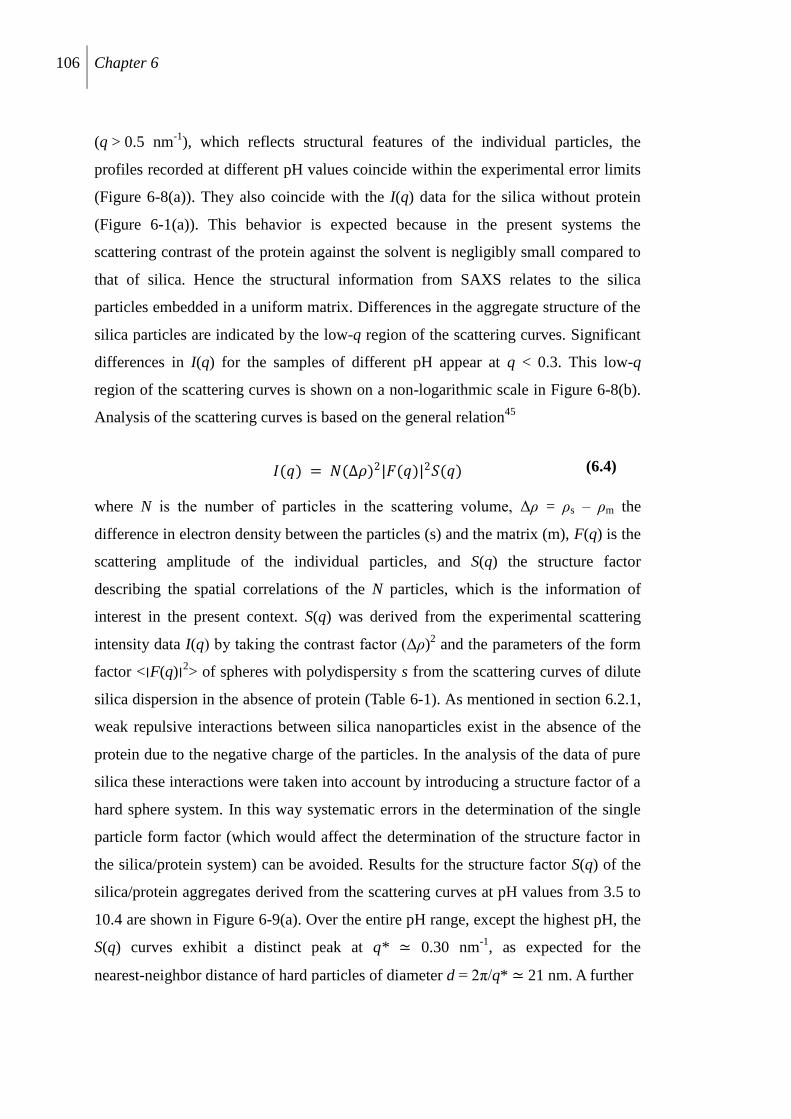
106 Chapter 6
(q > 0.5 nm-1
), which reflects structural features of the individual particles, the
profiles recorded at different pH values coincide within the experimental error limits
(Figure 6-8(a)). They also coincide with the I(q) data for the silica without protein
(Figure 6-1(a)). This behavior is expected because in the present systems the
scattering contrast of the protein against the solvent is negligibly small compared to
that of silica. Hence the structural information from SAXS relates to the silica
particles embedded in a uniform matrix. Differences in the aggregate structure of the
silica particles are indicated by the low-q region of the scattering curves. Significant
differences in I(q) for the samples of different pH appear at q < 0.3. This low-q
region of the scattering curves is shown on a non-logarithmic scale in Figure 6-8(b).
Analysis of the scattering curves is based on the general relation45
𝐼(𝑞) = 𝑁(Δ𝜌)2|𝐹(𝑞)|2𝑆(𝑞) (6.4)
where N is the number of particles in the scattering volume, Δρ = ρs – ρm the
difference in electron density between the particles (s) and the matrix (m), F(q) is the
scattering amplitude of the individual particles, and S(q) the structure factor
describing the spatial correlations of the N particles, which is the information of
interest in the present context. S(q) was derived from the experimental scattering
intensity data I(q) by taking the contrast factor (Δρ)2 and the parameters of the form
factor <׀F(q)׀2> of spheres with polydispersity s from the scattering curves of dilute
silica dispersion in the absence of protein (Table 6-1). As mentioned in section 6.2.1,
weak repulsive interactions between silica nanoparticles exist in the absence of the
protein due to the negative charge of the particles. In the analysis of the data of pure
silica these interactions were taken into account by introducing a structure factor of a
hard sphere system. In this way systematic errors in the determination of the single
particle form factor (which would affect the determination of the structure factor in
the silica/protein system) can be avoided. Results for the structure factor S(q) of the
silica/protein aggregates derived from the scattering curves at pH values from 3.5 to
10.4 are shown in Figure 6-9(a). Over the entire pH range, except the highest pH, the
S(q) curves exhibit a distinct peak at q* ≃ 0.30 nm-1
, as expected for the
nearest-neighbor distance of hard particles of diameter d = 2π/q* ≃ 21 nm. A further
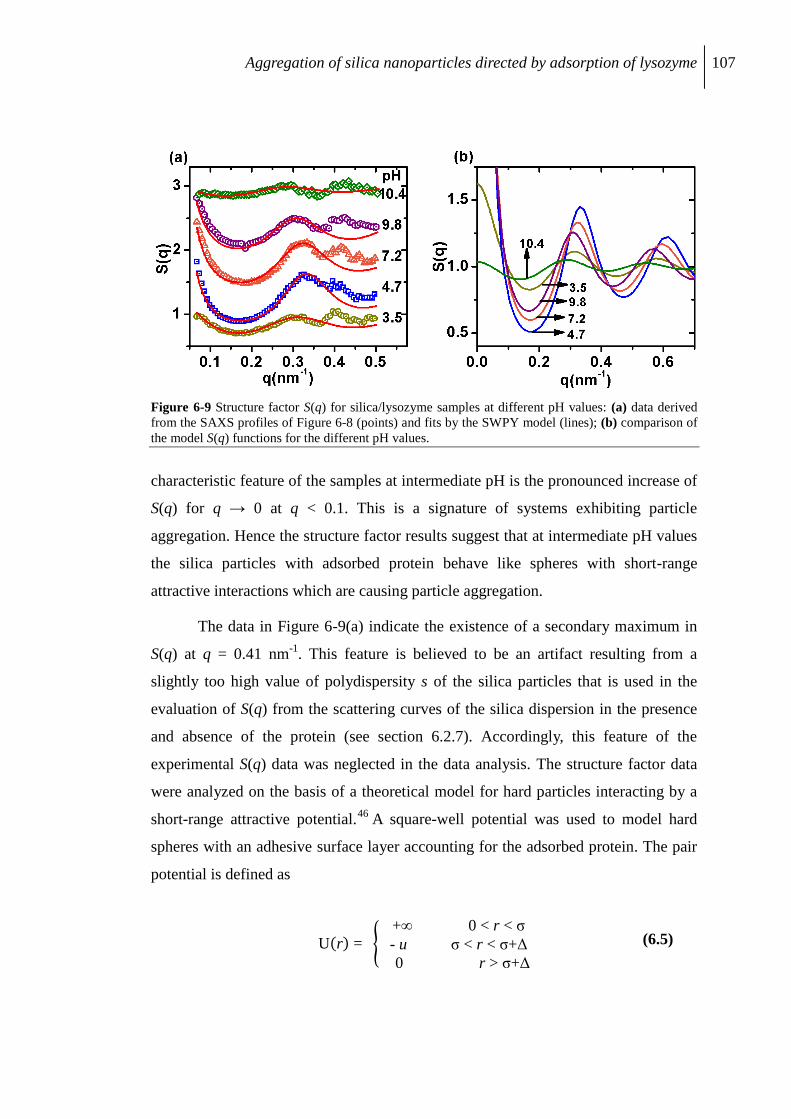
Aggregation of silica nanoparticles directed by adsorption of lysozyme 107
Figure 6-9 Structure factor S(q) for silica/lysozyme samples at different pH values: (a) data derived
from the SAXS profiles of Figure 6-8 (points) and fits by the SWPY model (lines); (b) comparison of
the model S(q) functions for the different pH values.
characteristic feature of the samples at intermediate pH is the pronounced increase of
S(q) for q → 0 at q < 0.1. This is a signature of systems exhibiting particle
aggregation. Hence the structure factor results suggest that at intermediate pH values
the silica particles with adsorbed protein behave like spheres with short-range
attractive interactions which are causing particle aggregation.
The data in Figure 6-9(a) indicate the existence of a secondary maximum in
S(q) at q = 0.41 nm-1
. This feature is believed to be an artifact resulting from a
slightly too high value of polydispersity s of the silica particles that is used in the
evaluation of S(q) from the scattering curves of the silica dispersion in the presence
and absence of the protein (see section 6.2.7). Accordingly, this feature of the
experimental S(q) data was neglected in the data analysis. The structure factor data
were analyzed on the basis of a theoretical model for hard particles interacting by a
short-range attractive potential.46
A square-well potential was used to model hard
spheres with an adhesive surface layer accounting for the adsorbed protein. The pair
potential is defined as
U r = +∞ 0 < r < σ
- u σ < r < σ+Δ
0 r > σ+Δ
(6.5)
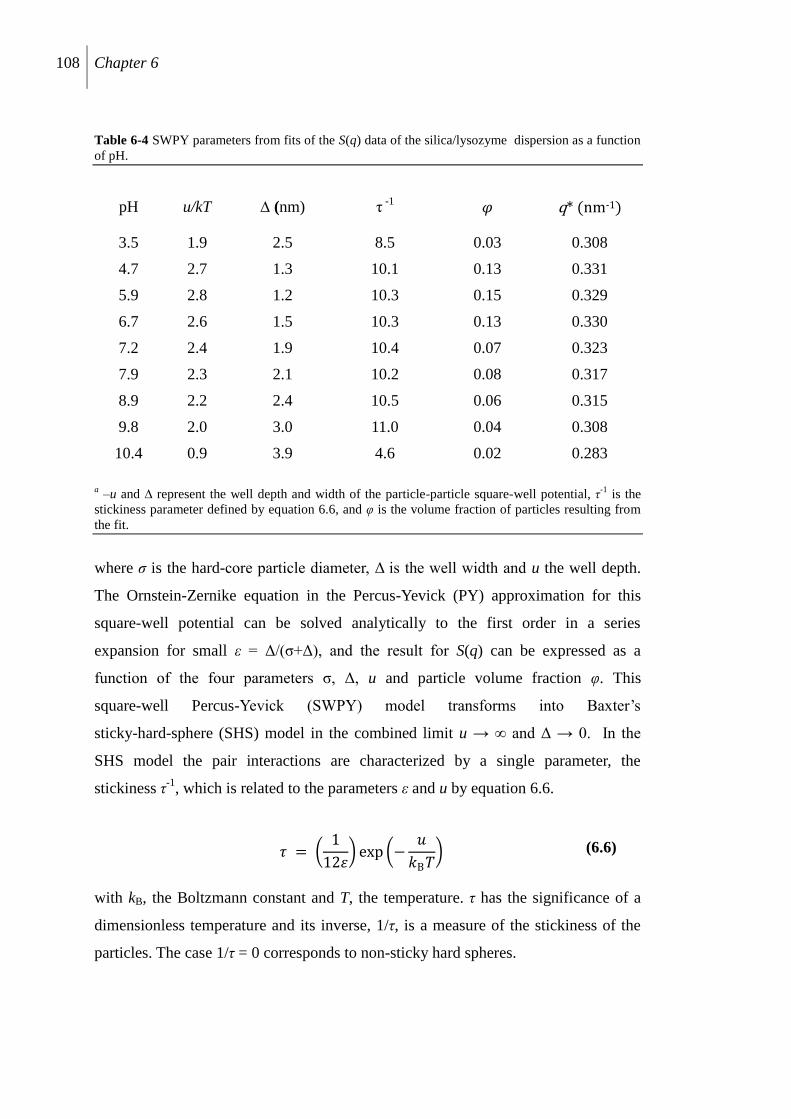
108 Chapter 6
Table 6-4 SWPY parameters from fits of the S(q) data of the silica/lysozyme dispersion as a function
of pH.
pH u/kT ∆ (nm) τ -1 𝜑 q* (nm-1)
3.5 1.9 2.5 8.5 0.03 0.308
4.7 2.7 1.3 10.1 0.13 0.331
5.9 2.8 1.2 10.3 0.15 0.329
6.7 2.6 1.5 10.3 0.13 0.330
7.2 2.4 1.9 10.4 0.07 0.323
7.9 2.3 2.1 10.2 0.08 0.317
8.9 2.2 2.4 10.5 0.06 0.315
9.8 2.0 3.0 11.0 0.04 0.308
10.4 0.9 3.9 4.6 0.02 0.283
a –u and ∆ represent the well depth and width of the particle-particle square-well potential, η
-1 is the
stickiness parameter defined by equation 6.6, and θ is the volume fraction of particles resulting from
the fit.
where ζ is the hard-core particle diameter, Δ is the well width and u the well depth.
The Ornstein-Zernike equation in the Percus-Yevick (PY) approximation for this
square-well potential can be solved analytically to the first order in a series
expansion for small ε = Δ/(σ+Δ), and the result for S(q) can be expressed as a
function of the four parameters σ, Δ, u and particle volume fraction θ. This
square-well Percus-Yevick (SWPY) model transforms into Baxter‟s
sticky-hard-sphere (SHS) model in the combined limit u → ∞ and Δ → 0. In the
SHS model the pair interactions are characterized by a single parameter, the
stickiness η-1
, which is related to the parameters ε and u by equation 6.6.
𝜏 = 1
12휀 exp −
𝑢
𝑘B𝑇 (6.6)
with kB, the Boltzmann constant and T, the temperature. η has the significance of a
dimensionless temperature and its inverse, 1/η, is a measure of the stickiness of the
particles. The case 1/η = 0 corresponds to non-sticky hard spheres.
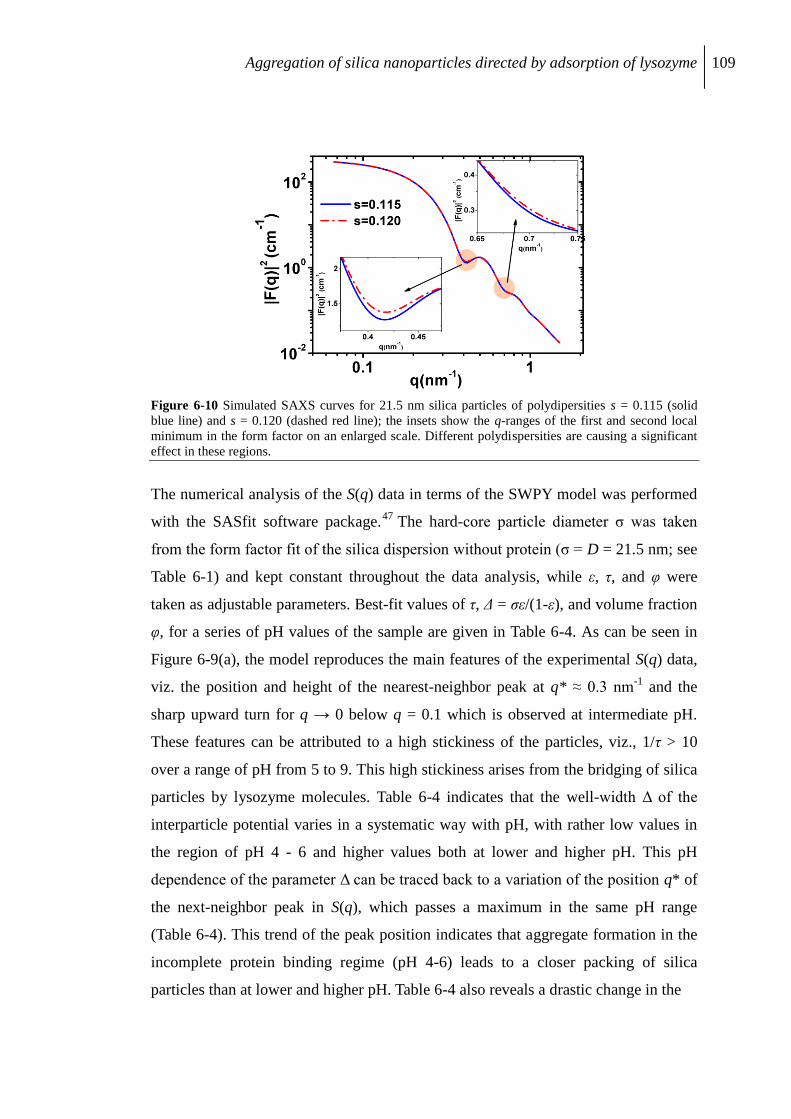
Aggregation of silica nanoparticles directed by adsorption of lysozyme 109
Figure 6-10 Simulated SAXS curves for 21.5 nm silica particles of polydipersities s = 0.115 (solid
blue line) and s = 0.120 (dashed red line); the insets show the q-ranges of the first and second local
minimum in the form factor on an enlarged scale. Different polydispersities are causing a significant
effect in these regions.
The numerical analysis of the S(q) data in terms of the SWPY model was performed
with the SASfit software package.47
The hard-core particle diameter σ was taken
from the form factor fit of the silica dispersion without protein (σ = D = 21.5 nm; see
Table 6-1) and kept constant throughout the data analysis, while ε, η, and θ were
taken as adjustable parameters. Best-fit values of η, Δ = ζε/(1-ε), and volume fraction
θ, for a series of pH values of the sample are given in Table 6-4. As can be seen in
Figure 6-9(a), the model reproduces the main features of the experimental S(q) data,
viz. the position and height of the nearest-neighbor peak at q* ≈ 0.3 nm-1
and the
sharp upward turn for q → 0 below q = 0.1 which is observed at intermediate pH.
These features can be attributed to a high stickiness of the particles, viz., 1/η > 10
over a range of pH from 5 to 9. This high stickiness arises from the bridging of silica
particles by lysozyme molecules. Table 6-4 indicates that the well-width Δ of the
interparticle potential varies in a systematic way with pH, with rather low values in
the region of pH 4 - 6 and higher values both at lower and higher pH. This pH
dependence of the parameter Δ can be traced back to a variation of the position q* of
the next-neighbor peak in S(q), which passes a maximum in the same pH range
(Table 6-4). This trend of the peak position indicates that aggregate formation in the
incomplete protein binding regime (pH 4-6) leads to a closer packing of silica
particles than at lower and higher pH. Table 6-4 also reveals a drastic change in the
110 Chapter 6
Figure 6-11 Evolution of a secondary peak in S(q) at q ≃ 0.41 nm-1
with increasing values of
polydispersity (s = 0.115 to 0.135): (a) pH 7.2; (b) pH 3.5.
aggregation behavior occurring in the narrow pH range from 9.8 to 10.4, as can be
seen from the pronounced decrease of the potential-depth parameter u/kBT and
increase in the well-width Δ. The stickiness parameter η-1
, which is affected by both
u/kBT and Δ, decreases to nearly one half of its value in this narrow pH range.
6.2.7 Influence of polydispersity on the evaluation of S(q)
The structure factor S(q) as determined from the experimental SAXS data is shown
in Figure 6-9(a). In addition to the nearest-neighbor peak at q ≈ 0.3 nm-1
, the data
indicate a further peak at q ≈ 0.41 nm-1
. Here we show that this second peak can be
an artifact resulting from using a slightly too high value of polydispersity of the silica
particles in the evaluation of the structure factor. Polydispersity is strongly affecting
the form factor curve in the q-range of the first (and second) local minimum, but not
elsewhere. This is illustrated in Figure 6-10, where the scattering curves of isolated
particles of polydispersities s = 0.115 and 0.120 are shown. In this case (mean
particle diameter 21.5 nm) the first local minimum in I(q) is located at 0.41 nm-1
.
Figure 6-11 shows S(q) functions calculated from simulated scattering curves of the
aggregated system at pH 7.2 and 3.5 and scattering curves for isolated particles of
polydispersity values from 0.115 to 0.135. In the simulation for pH 7.2 a shoulder in
the nearest-neighbor peak, located around q = 0.41 nm-1
appears and becomes more
pronounced with increasing polydispersity. In the simulation for pH 3.5, where
thenearest-neighbor peak is smaller than at pH 7.2, a secondary peak located around
Aggregation of silica nanoparticles directed by adsorption of lysozyme 111
q = 0.41 nm-1
appears, again increasing in magnitude with increasing polydispersity.
These simulations strongly suggest that the feature at q = 0.41 nm-1
in the structure
factor curves of Figure 6-9(a) are indeed artifacts caused by slightly overestimating
the particle polydispersity in the calculation of S(q).
6.3 Discussion
The results presented in the preceding section show that the protein-mediated
aggregation of the silica particles can be controlled to a large extent by pH. Here we
attempt to account for these phenomena in terms of the complex interactions acting
between the two types of particles in these systems. We first analyze the interactions
responsible for the adsorption of the protein on isolated silica particles (section 6.3.1)
and then turn to the interaction between silica particles in the presence of the protein
(section 6.3.2). Finally we turn to the large-scale structure of the hetero-flocculate
and the effect of pH on it and discuss the significance of the present work in relation
to recent work of other groups (section 6.3.3).
6.3.1 Nature of adsorptive interaction
The observed enhancement of the adsorption of lysozyme on silica nanoparticles
with increasing pH is consistent with similar findings of Vertegel et al.6 but at
variance with a report that pH did not influence the surface concentration of
lysozyme adsorbed at silica nanoparticles.22
Henry‟s law constant KH is a measure of
the interaction of individual protein molecules with the surface. Its increase by two
orders of magnitude in the pH range from 5 to 8.3 (Table 6-2) can be attributed to the
increasing strength of attractive protein-surface electrostatic interactions as the silica
surface attains an increasingly negative charge with increasing pH. Figure 6-3(a)
shows that the protein is not adsorbed at the silica particles under electrostatically
repulsive conditions below pH 4, when the silica particles become positively
charged. Our value of Henry‟s law constant at pH 7, KH ≈ 10-4
m is smaller by a
factor 10 than the value reported by Roth and Lenhoff14
for lysozyme on a
hydrophilic quartz surface at low ionic strength. The deviation can be attributed in
part to errors inherent in our determination of KH and differences in the surface
chemistry of the two silica materials, but a more fundamental cause for the lower KH
112 Chapter 6
may be the weaker dispersion interactions of the protein with the finite-size
nanoparticles as compared with a semi-infinite flat substrate.
The progressive increase of the adsorption plateau value Γm with increasing
pH (Table 6-2) can be attributed to the decreasing strength of repulsive
protein-protein electrostatic interactions as the net charge of the molecules is
gradually decreasing on approaching the isoelectric point. This result is in agreement
with the work of van der Venn et al.,17
who presented convincing experimental
evidence for the dominating influence of electrostatic interactions in the adsorption
of lysozyme on a flat silica surface. We conclude that the same applies to the
adsorption of the protein on the silica nanoparticles.
6.3.2 Protein-induced aggregation
In the pH range between the isoelectric points of the silica particles and lysozyme
(3 < pH < 11) the adsorption of the protein is causing aggregation of the silica
particles. Generally, bridging of two silica particles by protein molecules based on
electrostatic interactions can be expected for proteins of high positive excess charge
density but low dipole moment, i.e., when the excess charge is distributed more or
less uniformly over their entire surface. Lysozyme (average surface charge density
+0.26e nm-2
, dipole moment 72 D at pH 7)14
meets both of these conditions.
Quantitative information about the protein-mediated interaction between the silica
particles comes from the structure factor S(q) (Figure 6-9). In the pH range from 4.7
to 9.8, S(q) exhibits a distinct nearest-neighbor peak and a strong increase for q → 0
below 0.1 nm-1
. The combination of these features is a signature of systems
interacting by a short-range attractive pair potential. From the fits of S(q) with the
SWPY model we find that the depth of the interparticle potential well is between
2kBT and 3kBT, in line with the observation that aggregate formation is reversible
with changes in pH. Closer inspection of the data in Table 6-4 indicates that the
highest values of the pair interaction parameter u/kBT and lowest values of the well-
width Δ are found in the pH range 4-6. In this regime of short-range interactions the
sticky-hard-sphere model is well applicable to the present systems. For higher pH,
somewhat lower values of interaction parameter u/kBT but larger values of the
well-width are obtained. This suggests that the nature of the interactions responsible
Aggregation of silica nanoparticles directed by adsorption of lysozyme 113
for the protein-mediated aggregation is gradually changing with increasing pH, i.e.,
when the negative charge on the silica particles increases; the positive net charge of
the protein molecules decreases. However, the stickiness parameter η-1
does not
reflect these changes but is nearly independent of pH in the range from pH 5 to 9,
presumably due to the mutual compensation of the changes in u/kBT and Δ. Further
work is needed to confirm these observations.
The remarkable fact that the scattering data can be represented by models
with short-range attractive interactions leads to an interesting interpretation of the
protein-induced aggregation of the silica particles. It is well-known that the SHS
model fluid exhibits a critical point, the coordinates of which are ηc ≈ 0.098 and
θc ≈ 0.121.44
The region η > ηc represents the single-phase region, while for η < ηc
there is a domain of densities in which a gas-like phase coexists with a liquid-like
phase. For the present system we find that η-1
is nearly equal to the critical value
ηc-1
= 10.2 in the pH range from 5 to 9 in which flocculation is observed (Table 6-4).
In this pH range, the silica dispersion can be considered to be in a near-critical state,
characterized by a high osmotic compressibility, in agreement with the observed
sharp rise of S(q) for q → 0 below q = 0.1 nm-1
. The drastic change in the
aggregation behavior occuring between pH 9.8 and pH 10.4 is also reflected in S(q)
(Figure 6-9). At pH 10.4, S(q) exhibits only a small hump in the q range of
nearest-neighbor distances and is nearly flat at lower q. A fit by the SWPY model
yields a shallow attractive potential corresponding to a much lower stickiness than at
pH below 10 (Table 6-4). Qualitatively, this behavior can be attributed to the sharp
decrease in positive net charge of lysozyme in the pH range close to its IEP (see
Figure 6-4), which implies that the attractive bridging energy will sharply decrease in
this pH range.
6.3.3 Interparticle bonds and flocculate structure
The average coordination of a silica particle in the aggregates can be assessed from
the height of the nearest-neighbor peak in S(q). The fits of the S(q) data with the
SWPY model indicate that this nearest-neighbor peak is most pronounced in the pH
range 4-6, where it reaches a maximum of about 1.5 (Figure 6-9(b)). At higher pH
values, the nearest-neighbor peak becomes less pronounced, indicating a somewhat
114 Chapter 6
lower coordination number of the silica particles in the aggregates. One expects that
a high coordination number of the particles in the aggregates will lead to a lower
mean volume of the aggregate. The sediment volumes Vc, resulting from the
centrifugation study (Table 6-3) are indeed showing this trend, i.e. lower sediment
volumes at pH 5.5 than at higher pH. These findings imply that the coordination
number of the silica particles in the aggregates is highest at pH values at which only
a fraction of the protein molecules is bound to the silica surface. This may be
rationalized by the argument that a bridging contact between two silica particles
requires just one (or a few) protein molecules, while protein molecules adsorbed
vis-à-vis on neighboring particles but not involved in a bridging contacts will repell
each other due to their net positive charge. This repulsive protein-protein interaction
may indeed favor structures of lower coordination number of the silica particles, as
such open structures will minimize the repulsive interaction between pairs of
non-bridging protein molecules adsorbed near the contact point on the two particles.
The drastic change in the aggregation behavior in the narrow pH range from 9.8 to
10.4 represents one of the most remarkable finding of this work. This change is
evidenced by the sharp decrease of the sedimentation velocity and aggregate size as
derived from the centrifugation experiments (Table 6-3), as well as the sharp change
in the low-q behavior of the SAXS scans (Figure 6-8). As mentioned above, this can
be attributed qualitatively to a relatively sharp decrease of the attractive bridging
energy of lysozyme and a concomitant increase of the repulsive electrostatic
interaction between the protein-decorated silica particles.
The proposed evolution of aggregate structures of silica particles induced by
lysozyme as a function of pH is sketched in Figure 6-12. At a pH close to the IEP of
silica, protein is not adsorbed and the absence of charge stabilization will cause a
weak aggregation of silica particles (Figure 6-12(a)). In the regime of incomplete
protein binding to the silica particles (pH 4–6), protein adsorption will cause bridging
aggregation. Initially, the number of bonds should increase with the number of
adsorbed protein molecules per silica particle. This may lead to aggregates of
relatively high mean coordination number of the silica particles, and thus high
packing density in the flocculate (Figure 6-12(b)). In the complete protein-binding
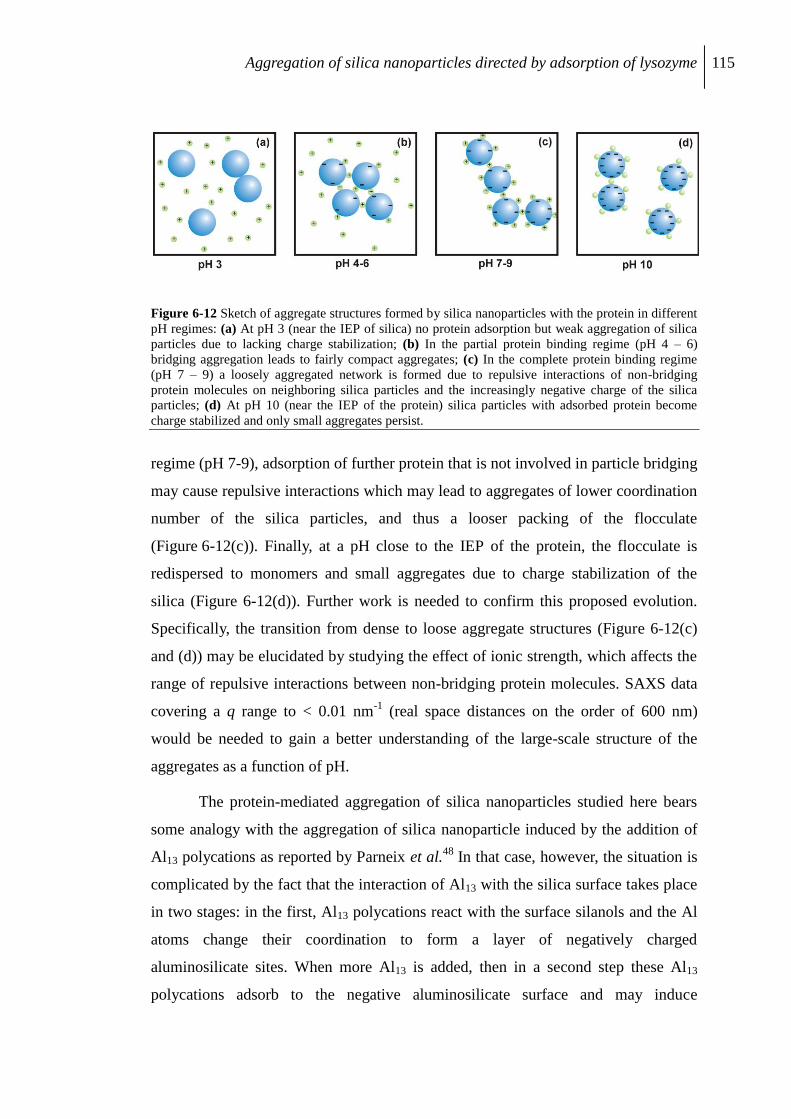
Aggregation of silica nanoparticles directed by adsorption of lysozyme 115
Figure 6-12 Sketch of aggregate structures formed by silica nanoparticles with the protein in different
pH regimes: (a) At pH 3 (near the IEP of silica) no protein adsorption but weak aggregation of silica
particles due to lacking charge stabilization; (b) In the partial protein binding regime (pH 4 – 6)
bridging aggregation leads to fairly compact aggregates; (c) In the complete protein binding regime
(pH 7 – 9) a loosely aggregated network is formed due to repulsive interactions of non-bridging
protein molecules on neighboring silica particles and the increasingly negative charge of the silica
particles; (d) At pH 10 (near the IEP of the protein) silica particles with adsorbed protein become
charge stabilized and only small aggregates persist.
regime (pH 7-9), adsorption of further protein that is not involved in particle bridging
may cause repulsive interactions which may lead to aggregates of lower coordination
number of the silica particles, and thus a looser packing of the flocculate
(Figure 6-12(c)). Finally, at a pH close to the IEP of the protein, the flocculate is
redispersed to monomers and small aggregates due to charge stabilization of the
silica (Figure 6-12(d)). Further work is needed to confirm this proposed evolution.
Specifically, the transition from dense to loose aggregate structures (Figure 6-12(c)
and (d)) may be elucidated by studying the effect of ionic strength, which affects the
range of repulsive interactions between non-bridging protein molecules. SAXS data
covering a q range to < 0.01 nm-1
(real space distances on the order of 600 nm)
would be needed to gain a better understanding of the large-scale structure of the
aggregates as a function of pH.
The protein-mediated aggregation of silica nanoparticles studied here bears
some analogy with the aggregation of silica nanoparticle induced by the addition of
Al13 polycations as reported by Parneix et al.48
In that case, however, the situation is
complicated by the fact that the interaction of Al13 with the silica surface takes place
in two stages: in the first, Al13 polycations react with the surface silanols and the Al
atoms change their coordination to form a layer of negatively charged
aluminosilicate sites. When more Al13 is added, then in a second step these Al13
polycations adsorb to the negative aluminosilicate surface and may induce
116 Chapter 6
aggregation of the silica by bridging of particles by Al13 polycations. Hence the Al13
polycations added in the second step take the role of the protein in the present case.
Parneix et al.48
submitted their samples to osmotic compression and studied the
structural changes induced by the compression by small-angle neutron scattering.
Significant differences in the compression law were found depending on the way in
which the samples were prepared. It would be of interest to perform a similar study
with our samples in which pronounced structural changes can be induced by small
changes in pH.
6.4 Conclusions
This study has demonstrated the important role of electrostatic interactions in the
adsorption of lysozyme on silica nanoparticles and in the protein-mediated
aggregation of the silica particles. It was found that the adsorption capacity for
lysozyme increases progressively from the isoelectric points of silica to the
isoelectric point of the protein. If the amount of protein per silica particle is limited,
the zeta potential first increases to positive values with increasing pH but later turns
to negative values and approaches the zeta potential of the bare silica particles near
the isoelectric point of the proteins. These trends of the zeta potential qualitatively
reflect the changes in the overall charge of the protein-decorated silica particles, even
though the electrophoretic mobility cannot be represented quantitatively by a simple
algebraic summation of charges of the protein decorated particles.
The study provides strong evidence that the aggregation of silica
nanoparticles is due to a bridging by lysozyme molecules, although direct imaging of
the protein was not achieved by cryo-TEM. Concordant information about the
structure of the silica-protein hetero-aggregates could be derived from the
sedimentation study and the SAXS measurements. It was found that the local
structure of the aggregates as well as the large-scale structure of the flocculate
depends on the number of bound lysozyme molecules. The size of the
nearest-neighbor peak in the structure factor indicates that the number of nearest
neighbors in the aggregate decreases when the number of bound protein molecules
increases. This is consistent with a higher sediment volume of the flocculates under
these conditions and may be rationalized from the fact that away from their
Aggregation of silica nanoparticles directed by adsorption of lysozyme 117
isoelectric point protein molecules adsorbed vis-a-vis on neighboring silica particles
are repelling each other and thus may favor a less dense packing of the silica
particles.
References
1 Moyano, D. F., Rotello, V. M., Langmuir, 2011, 27, 10376.
2 Nam, J. M., Thaxton, C. S., Mirkin, C. A. , Science, 2003, 301, 1884.
3 Brigger, I., Dubertnet, C., Couvreur, P. , Adv. Drug Delivery Rev. , 2002, 54, 631.
4 Vivero-Escoto, J. L., Slowing, I. I., Wu, C.-W., Lin, V. S. Y. , J. Am. Chem. Soc.,
2009, 131, 3462.
5 Roach, P., Farrar, D., Perry, C. C. , J. Am. Chem. Soc., 2006, 128, 3939.
6 Vertegel, A. A., Siegel, R. W., Dordick, J. S., Langmuir, 2004, 20, 6800.
7 Peng, Z. G., Hidajat, K., Uddin, M. S., Colloids Surf. B: Biointerfaces, 2004, 35,
169.
8 Henzler, K., Haupt, B., Lauterbach, K., Wittemann, A., Borisov, O., Ballauff, M. , J.
Am. Chem. Soc., 2010, 132, 3159.
9 Janes, K. A., Calvo, P., Alonso, M. J., Adv. Drug Deliv. Rev., 2001, 47, 83.
10 Cardoso, M. B., Luckarift, H. R., Urban, V. S., O‟Neill, H., Johnson, G. R., Adv.
Funct. Mater., 2010, 20, 3031.
11 Slowing, I. I., Trewyn, B. G., Lin, V. S.-Y., J. Am. Chem. Soc., 2007, 129, 8845.
12 Lee, D.W., Park, K. M., Banerjee, M., Ha, S. H., Lee, T., Suh, K., Paul, S., Jung,
H., Kim, J., Selvapalam, N., Ryu, S. H., Kim, K., Nature Chemistry, 2011, 3, 154.
13 Rana, S., Yeh, Y.-C., Rotello, V. M., Curr. Opin. Chem. Biol., 2010, 14, 828.
14 Roth, C. M., Lenhoff, A. M., Langmuir, 1995, 11, 3500.
15 Czeslik, C., Royer, C., Hazlett, T., Mantulin, W., Biophys. J., 2003, 84, 2533.
16 Wahlgren, M., Arnebrant, T., Lundström, I., J. Coll. Interface Sci., 1995, 175, 506.
118 Chapter 6
17 van der Veen, M., Norde, W., Cohen Stuart, M., Colloids Surf. B, 2004, 35, 33.
18 Hollmann, O., Steitz, R., Czeslik, C., Phys. Chem. Chem. Phys., 2008, 10, 1448.
19 Lundqvist, M., Sethson, I., Jonsson, B. H., Langmuir, 2004, 20, 10639.
20 Asuri, P., Karajanagi, S. S., Yang, H. C., Yim, T. J., Kane, R. S., Dordick, J. S.,
Langmuir, 2006, 22, 5833.
21 Shang, W., Nuffer, J. H., Muniz-Papandrea, V. A., Colon, W., Siegel, R. W.,
Dordick, J. S., Small, 2009, 5, 470.
22 Wu, X., Narsimhan, G., Biochim. Biophys. Acta, 2008, 1784, 1694.
23 Kendall, M., Ding, P., Kendall, K., Nanotoxicology, 2011, 5, 55.
24 Dutta, D., Sundaram, S. K., Teeguarden, J. G., B. Riley, J., Fifield, L. S., Jacobs, J.
M., Addleman, S. R., Kaysen, G. A., Moudgil, B. M., Weber, T. J., Toxicology Sci.,
2007 100, 303.
25 Thomassen, L. C. J., Aerts, A., Rabolli, V., Lison, D., Gonzalez, L., Kirsch-
Volders, M., Napierska, D., Hoet, P. H., Kirschhock, C. E. A., Martens, J. A.,
Langmuir, 2010, 26, 328.
26 Stradner, A., Sedgwick, H., Cardinaux, F., Poon, W. C. K., Egelhaaf, S. U.,
Schurtenberger, P., Nature, 2004, 432, 492.
27 Liu, Y., Fratini, E., Baglioni, P., Chen, W.R., Chen, S. H., Phys. Rev. Lett., 2005,
95, 118102.
28 Cardinaux, F., Stradner, A., Schurtenberger, P., Sciortino, F., Zaccarelli, E.,
Europhys. Lett., 2007, 77, 48004.
29 Shukla, A., Mylonas, E., Cola, E. D., Finet, S., Timmins, P., Narayanan, T.,
Svergun, D. I., Proc Natl Acad Sci, 2008, 105, 5075.
30 Porcar, L., Falus, P., Chen, W. R., Faraone, A., Fratini, E., Hong, K., Baglioni, P.,
Liu, Y., J. Phys. Chem. Lett., 2010, 1, 126.
Aggregation of silica nanoparticles directed by adsorption of lysozyme 119
31 Schaefer, D. W., Martin, J. E., Wiltzius, P., Cannell, D. S., Phys. Rev. Lett., 1984,
52, 2371.
32 Bian, S. W., Mudunkotuwa, I. A., Rupasinghe, T., Grassian, V. H., Langmuir, 2011,
27, 6059.
33 Ang, J. C., Lin, J. M., Yaron, P. N., White, J. W., Soft Matter, 2010, 6, 383.
34 Wong, K., Lixon, P., Lafuma, F., Lindner, P., Charriol-Aguerre, O., Cabane, B., J.
Colloid Interface Sci., 1992, 153, 55.
35 Babayan, D., Chassenieux, C., Lafuma, F., Ventelon, L., Hernandez, J., Langmuir,
2010, 26, 2279.
36 Bagwe, R. P., Hilliard, L. R., Tan, W., Langmuir, 2006, 22, 4357.
37 Goller, M. I., Barthet, C., McCarthy, G. P., Corradi, R., Newby, B. P., Wilson, S.
A., Armes, S. P., Luk, S. Y., Colloid Polym . Sci., 1998, 276, 1010.
38 Arai, S., Hirai, M., Biophysical J., 1999, 76, 2192.
39 Lugo, D. M., Oberdisse, J., Lapp, A., Findenegg, G. H., J. Phys. Chem. B, 2010,
114, 4183.
40 Rezwan, K., Studart, A. R., Vörös, J., Gauckler, L. J., J. Phys. Chem. B, 2005,
109, 14469.
41 Wu, Z., Xiang, H., Kima, T., Chun, M. S., Lee, K., J. Colloid Interface Sci., 2006,
304, 119.
42 Hunter, R. “Zeta potential in colloid science”, 1981, Academic Press, New York.
43 Posse, E., Vitals, A. L., de Arcuri, B. F., Farias, R. N., Morero, R. D., Biochim.
Biophys. Acta, 1990, 1024, 390.
44 Pan, X., Yu, S., Yao, P., Shao, Z., J. Colloid Interface Sci., 2007, 316, 405.
45 Glatter, O., Kratky, O. “Small-angle X-ray scattering”, 1983, Academic Press,
New York, USA.
120 Chapter 6
46 Regnaut, C., Ravey, J. C., J. Chem. Phys., 1989, 91, 1211.
47 http://kur.web.psi.ch/sans1/SANSSoft/sasfit.html
48 Parneix, C., Persello, J., Schweins, R., Cabane, B., Langmuir, 2009, 25, 4692.
Effect of pH and salinity on silica-lysozyme hetero-aggregation 121
7. Effect of pH and salinity on silica-lysozyme hetero-aggregation**
7.1 Introduction
The interactions of nanomaterials with biological entities have been the focus of
many recent studies.1-4
The attachment of biochemical quantities like proteins to
synthetic functional materials have found their applicability in protein-purification
strategies, bacterial detections,5 protein fibrillation,
6 biosensors and drug delivery
systems.7 There have been a number of attempts to study the interaction of globular
proteins with hydrophilic surface.8,9
These interactions form the basis for studying
the complex interactions occurring between nanoscale materials with biological
matter like living cell.10 ,11
Protein adsorption on a flat or a curved surface is a
complex process in which the structural stability of a protein, the ionic strength, the
pH of the solution and the hydrophobicity or hydrophilicity of the interacting
surfaces are known to influence the protein binding affinity to the given interface.12
The adsorption of proteins to nanoparticles not only brings about the changes in the
protein secondary and tertiary structures but also affects the surface properties and
stability of the sorbent particle solution. Hence, studying the changes induced in a
nanoparticle dispersion by protein adsorption is of great relevance, both in industrial
and medical processes. The interactions of hydrophilic silica surface with entities
such as proteins and polymers have been the center of attraction in the recent times,
for example, Aggregation of the human platelets by amorphous silica has been
reported by Corbalan et al..13
Larsericsdotter et al.14
have systematically studied the
effects of electrostatic interactions on the adsorption of lysozyme, ribonuclease A,
and R-lactalbumin on silica surface by varying the ionic strength. On the other hand,
Wong et al.15
have studied the bridging flocculation of highly charged silica
nanoparticles by long poly(ethylene oxide) polymer chains. This study revealed that
**Modified from the article: Bharti, B., Klapp, S., Findenegg, G. H., in preparation
122 Chapter 7
the range of the electrostatic repulsive forces, controlled by the ionic strength,
strongly affects the shape of the flocs. When the ionic strength is sufficiently low, for
example, 1 mM, the flocs are linear and their fractal dimension increases with the
ionic strength. Long range repulsive forces are therefore, a key feature in tuning the
colloidal flocs structure. In our previous study16
we have reported the bridging
hetero-aggregation of silica nanoparticles by lysozyme. The pH responsive
aggregation phenomenon was studied in association with the binding affinity of
lysozyme molecules to the silica surface. The aggregation behavior proved to be
completely switchable with pH. In this work, we dig deeper in order to have a better
understanding of the electrostatically driven heteroaggregation process of protein
with nanoparticles.
In the present study, we explore the effects of dispersion salinity on the
lysozyme binding to silica surface on a rather wide pH regime (3-11). We use
adsorption measurements to characterize the amount of protein bound to the silica at
a given pH and salinity condition. The nature of protein induced silica aggregates
was strongly dependent on the dispersion salinity. The protein/silica composite
aggregates formed were characterized by turbidity, Small Angle X-ray Scattering
(SAXS) and analytical centrifugation measurements. We try to explain the results
obtained on the basis of different forces involved in the adsorption and aggregation
process. In section 7.2 we present the results obtained by studying the
silica/lysozyme system at various pH/salinity and protein concentration. In section
7.3, we try to explain the observed behavior and compare our results with some
previously reported theoretical and experimental work.
7.2 Results
7.2.1 Adsorption isotherms
The effect of ionic strength on the binding affinity of lysozyme to silica nanoparticles
was investigated by adsorption isotherms. The details for the adsorption isotherm
measurements are given elsewhere.16
Protein-nanoparticle binding was studied at
pH = 8.3 in bicine buffer, over a wide NaCl concentration (cNaCl) range. Figure 7-1(a)
shows such adsorption isotherms at ionic strengths varying from 0 to 100 mM. In the
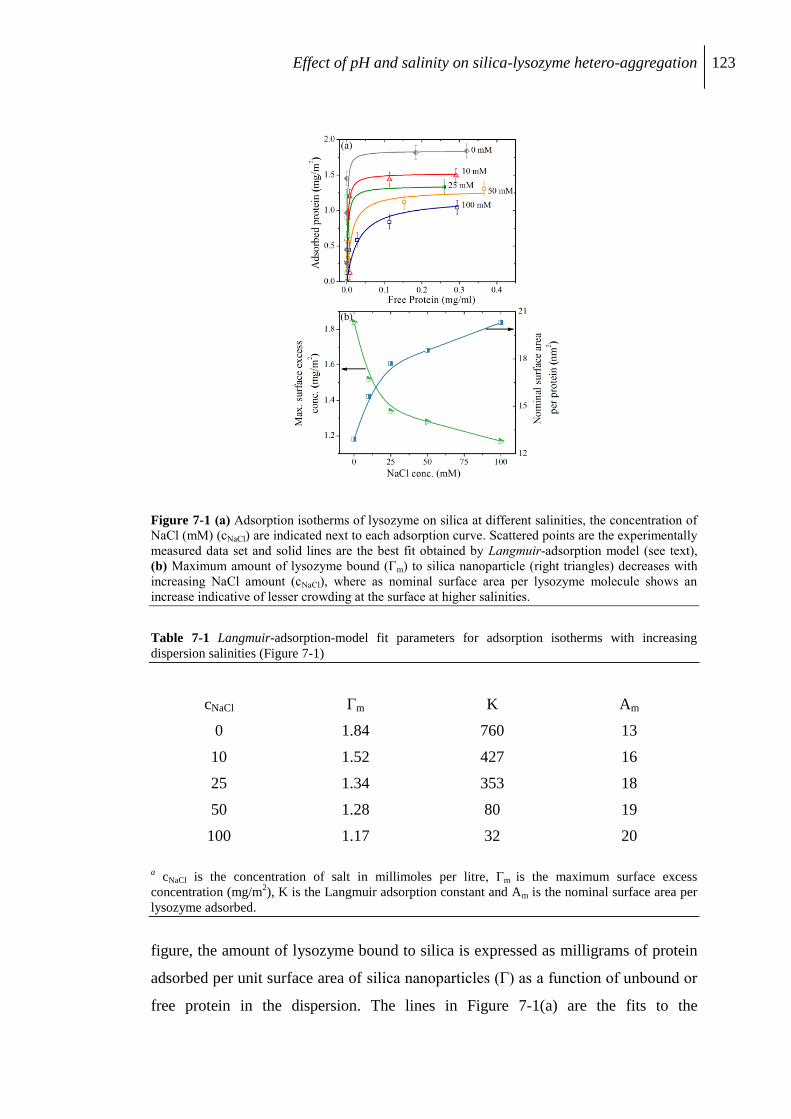
Effect of pH and salinity on silica-lysozyme hetero-aggregation 123
Figure 7-1 (a) Adsorption isotherms of lysozyme on silica at different salinities, the concentration of
NaCl (mM) (cNaCl) are indicated next to each adsorption curve. Scattered points are the experimentally
measured data set and solid lines are the best fit obtained by Langmuir-adsorption model (see text),
(b) Maximum amount of lysozyme bound (Γm) to silica nanoparticle (right triangles) decreases with
increasing NaCl amount (cNaCl), where as nominal surface area per lysozyme molecule shows an
increase indicative of lesser crowding at the surface at higher salinities.
Table 7-1 Langmuir-adsorption-model fit parameters for adsorption isotherms with increasing
dispersion salinities (Figure 7-1)
cNaCl Γm K Am
0 1.84 760 13
10 1.52 427 16
25 1.34 353 18
50 1.28 80 19
100 1.17 32 20
a cNaCl is the concentration of salt in millimoles per litre, Γm is the maximum surface excess
concentration (mg/m2), K is the Langmuir adsorption constant and Am is the nominal surface area per
lysozyme adsorbed.
figure, the amount of lysozyme bound to silica is expressed as milligrams of protein
adsorbed per unit surface area of silica nanoparticles (Γ) as a function of unbound or
free protein in the dispersion. The lines in Figure 7-1(a) are the fits to the
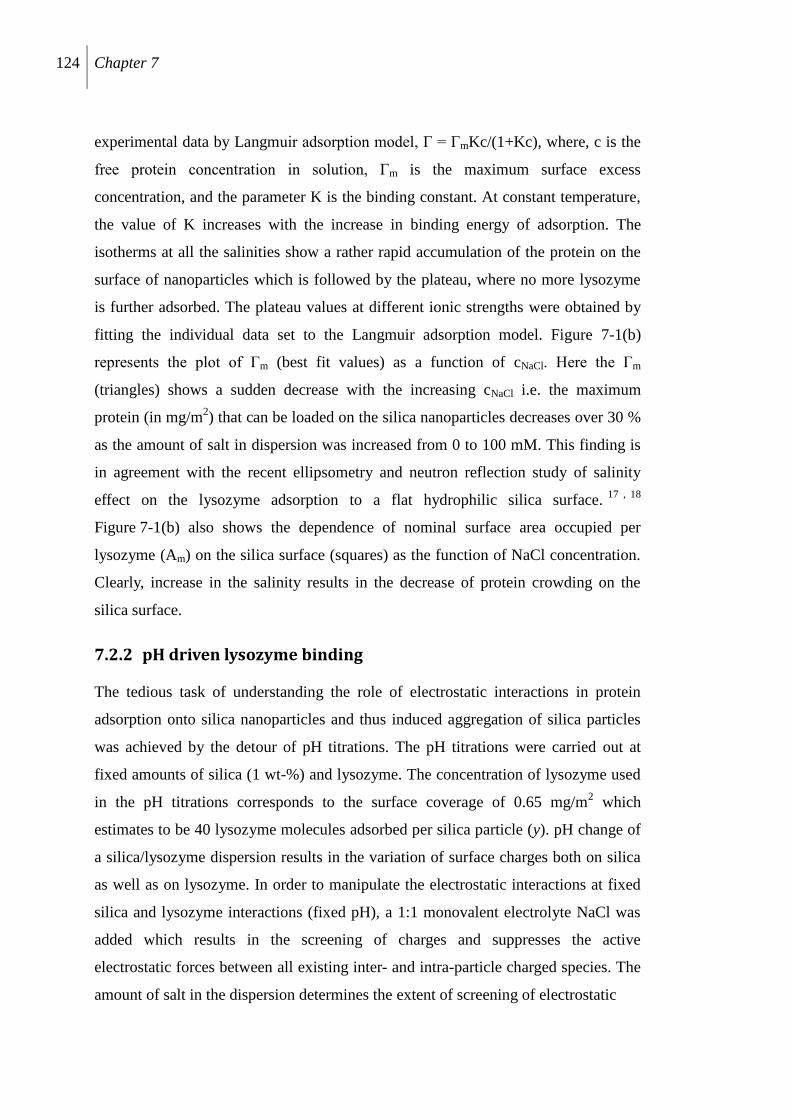
124 Chapter 7
experimental data by Langmuir adsorption model, Γ = ΓmKc/(1+Kc), where, c is the
free protein concentration in solution, Γm is the maximum surface excess
concentration, and the parameter K is the binding constant. At constant temperature,
the value of K increases with the increase in binding energy of adsorption. The
isotherms at all the salinities show a rather rapid accumulation of the protein on the
surface of nanoparticles which is followed by the plateau, where no more lysozyme
is further adsorbed. The plateau values at different ionic strengths were obtained by
fitting the individual data set to the Langmuir adsorption model. Figure 7-1(b)
represents the plot of Γm (best fit values) as a function of cNaCl. Here the Γm
(triangles) shows a sudden decrease with the increasing cNaCl i.e. the maximum
protein (in mg/m2) that can be loaded on the silica nanoparticles decreases over 30 %
as the amount of salt in dispersion was increased from 0 to 100 mM. This finding is
in agreement with the recent ellipsometry and neutron reflection study of salinity
effect on the lysozyme adsorption to a flat hydrophilic silica surface.17 , 18
Figure 7-1(b) also shows the dependence of nominal surface area occupied per
lysozyme (Am) on the silica surface (squares) as the function of NaCl concentration.
Clearly, increase in the salinity results in the decrease of protein crowding on the
silica surface.
7.2.2 pH driven lysozyme binding
The tedious task of understanding the role of electrostatic interactions in protein
adsorption onto silica nanoparticles and thus induced aggregation of silica particles
was achieved by the detour of pH titrations. The pH titrations were carried out at
fixed amounts of silica (1 wt-%) and lysozyme. The concentration of lysozyme used
in the pH titrations corresponds to the surface coverage of 0.65 mg/m2 which
estimates to be 40 lysozyme molecules adsorbed per silica particle (y). pH change of
a silica/lysozyme dispersion results in the variation of surface charges both on silica
as well as on lysozyme. In order to manipulate the electrostatic interactions at fixed
silica and lysozyme interactions (fixed pH), a 1:1 monovalent electrolyte NaCl was
added which results in the screening of charges and suppresses the active
electrostatic forces between all existing inter- and intra-particle charged species. The
amount of salt in the dispersion determines the extent of screening of electrostatic
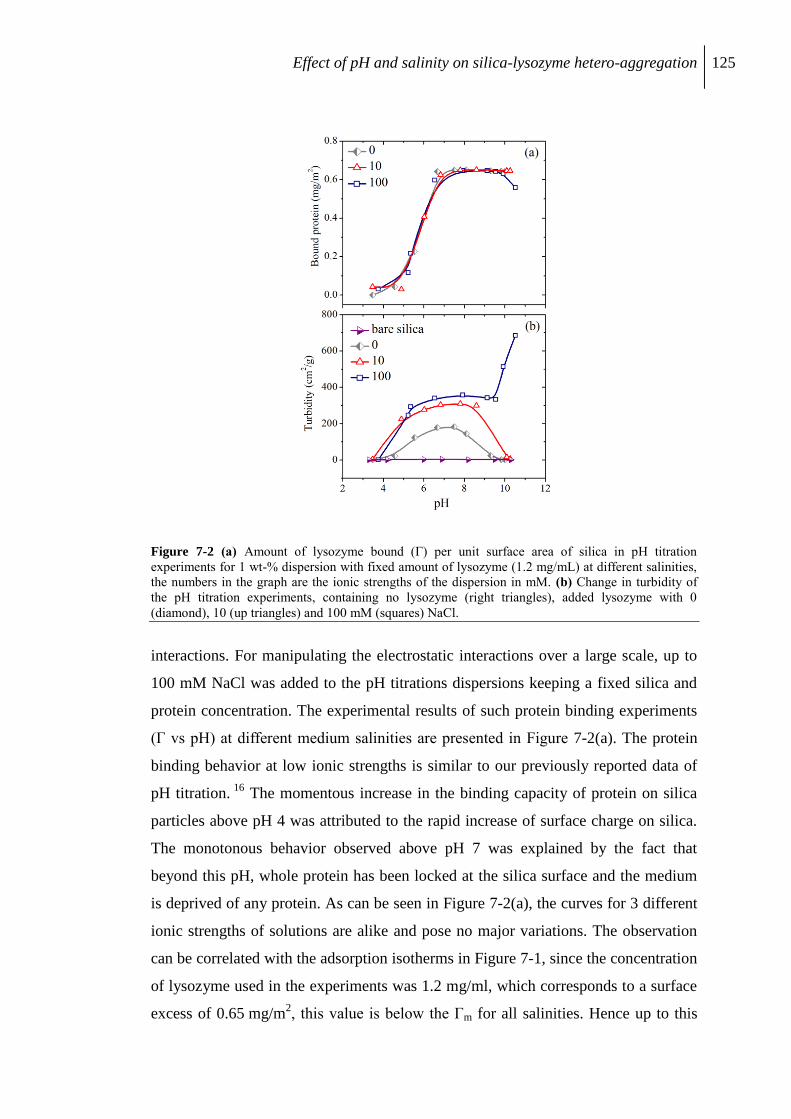
Effect of pH and salinity on silica-lysozyme hetero-aggregation 125
Figure 7-2 (a) Amount of lysozyme bound (Γ) per unit surface area of silica in pH titration
experiments for 1 wt-% dispersion with fixed amount of lysozyme (1.2 mg/mL) at different salinities,
the numbers in the graph are the ionic strengths of the dispersion in mM. (b) Change in turbidity of
the pH titration experiments, containing no lysozyme (right triangles), added lysozyme with 0
(diamond), 10 (up triangles) and 100 mM (squares) NaCl.
interactions. For manipulating the electrostatic interactions over a large scale, up to
100 mM NaCl was added to the pH titrations dispersions keeping a fixed silica and
protein concentration. The experimental results of such protein binding experiments
(Γ vs pH) at different medium salinities are presented in Figure 7-2(a). The protein
binding behavior at low ionic strengths is similar to our previously reported data of
pH titration. 16
The momentous increase in the binding capacity of protein on silica
particles above pH 4 was attributed to the rapid increase of surface charge on silica.
The monotonous behavior observed above pH 7 was explained by the fact that
beyond this pH, whole protein has been locked at the silica surface and the medium
is deprived of any protein. As can be seen in Figure 7-2(a), the curves for 3 different
ionic strengths of solutions are alike and pose no major variations. The observation
can be correlated with the adsorption isotherms in Figure 7-1, since the concentration
of lysozyme used in the experiments was 1.2 mg/ml, which corresponds to a surface
excess of 0.65 mg/m2, this value is below the Γm for all salinities. Hence up to this
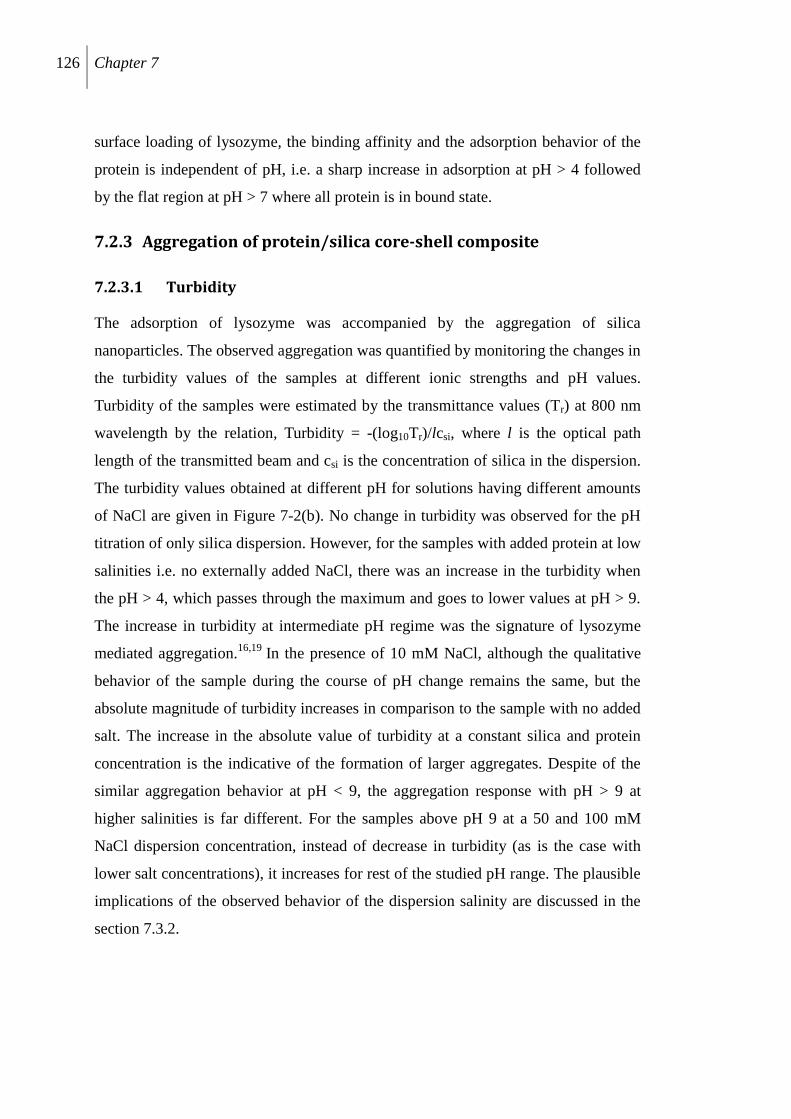
126 Chapter 7
surface loading of lysozyme, the binding affinity and the adsorption behavior of the
protein is independent of pH, i.e. a sharp increase in adsorption at pH > 4 followed
by the flat region at pH > 7 where all protein is in bound state.
7.2.3 Aggregation of protein/silica core-shell composite
7.2.3.1 Turbidity
The adsorption of lysozyme was accompanied by the aggregation of silica
nanoparticles. The observed aggregation was quantified by monitoring the changes in
the turbidity values of the samples at different ionic strengths and pH values.
Turbidity of the samples were estimated by the transmittance values (Tr) at 800 nm
wavelength by the relation, Turbidity = -(log10Tr)/lcsi, where l is the optical path
length of the transmitted beam and csi is the concentration of silica in the dispersion.
The turbidity values obtained at different pH for solutions having different amounts
of NaCl are given in Figure 7-2(b). No change in turbidity was observed for the pH
titration of only silica dispersion. However, for the samples with added protein at low
salinities i.e. no externally added NaCl, there was an increase in the turbidity when
the pH > 4, which passes through the maximum and goes to lower values at pH > 9.
The increase in turbidity at intermediate pH regime was the signature of lysozyme
mediated aggregation.16,19
In the presence of 10 mM NaCl, although the qualitative
behavior of the sample during the course of pH change remains the same, but the
absolute magnitude of turbidity increases in comparison to the sample with no added
salt. The increase in the absolute value of turbidity at a constant silica and protein
concentration is the indicative of the formation of larger aggregates. Despite of the
similar aggregation behavior at pH < 9, the aggregation response with pH > 9 at
higher salinities is far different. For the samples above pH 9 at a 50 and 100 mM
NaCl dispersion concentration, instead of decrease in turbidity (as is the case with
lower salt concentrations), it increases for rest of the studied pH range. The plausible
implications of the observed behavior of the dispersion salinity are discussed in the
section 7.3.2.
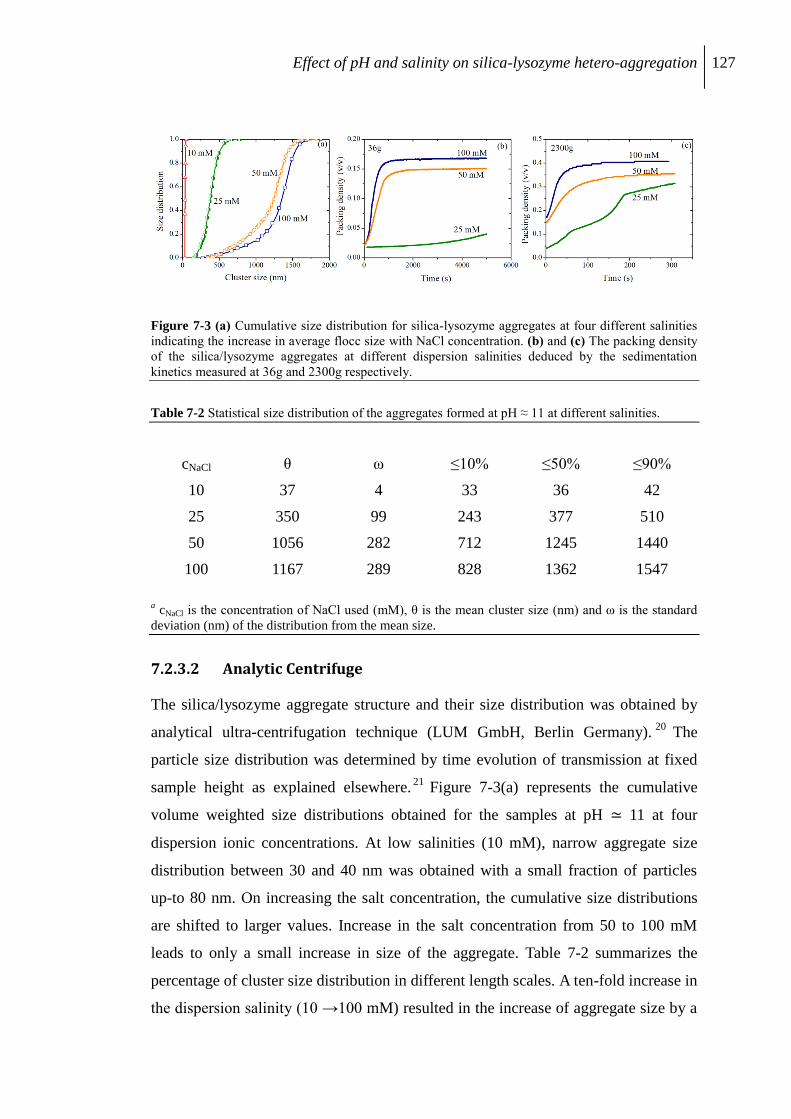
Effect of pH and salinity on silica-lysozyme hetero-aggregation 127
Figure 7-3 (a) Cumulative size distribution for silica-lysozyme aggregates at four different salinities
indicating the increase in average flocc size with NaCl concentration. (b) and (c) The packing density
of the silica/lysozyme aggregates at different dispersion salinities deduced by the sedimentation
kinetics measured at 36g and 2300g respectively.
Table 7-2 Statistical size distribution of the aggregates formed at pH ≈ 11 at different salinities.
cNaCl θ ω ≤10% ≤50% ≤90%
10 37 4 33 36 42
25 350 99 243 377 510
50 1056 282 712 1245 1440
100 1167 289 828 1362 1547
a cNaCl is the concentration of NaCl used (mM), θ is the mean cluster size (nm) and ω is the standard
deviation (nm) of the distribution from the mean size.
7.2.3.2 Analytic Centrifuge
The silica/lysozyme aggregate structure and their size distribution was obtained by
analytical ultra-centrifugation technique (LUM GmbH, Berlin Germany).20
The
particle size distribution was determined by time evolution of transmission at fixed
sample height as explained elsewhere.21
Figure 7-3(a) represents the cumulative
volume weighted size distributions obtained for the samples at pH ≃ 11 at four
dispersion ionic concentrations. At low salinities (10 mM), narrow aggregate size
distribution between 30 and 40 nm was obtained with a small fraction of particles
up-to 80 nm. On increasing the salt concentration, the cumulative size distributions
are shifted to larger values. Increase in the salt concentration from 50 to 100 mM
leads to only a small increase in size of the aggregate. Table 7-2 summarizes the
percentage of cluster size distribution in different length scales. A ten-fold increase in
the dispersion salinity (10 →100 mM) resulted in the increase of aggregate size by a
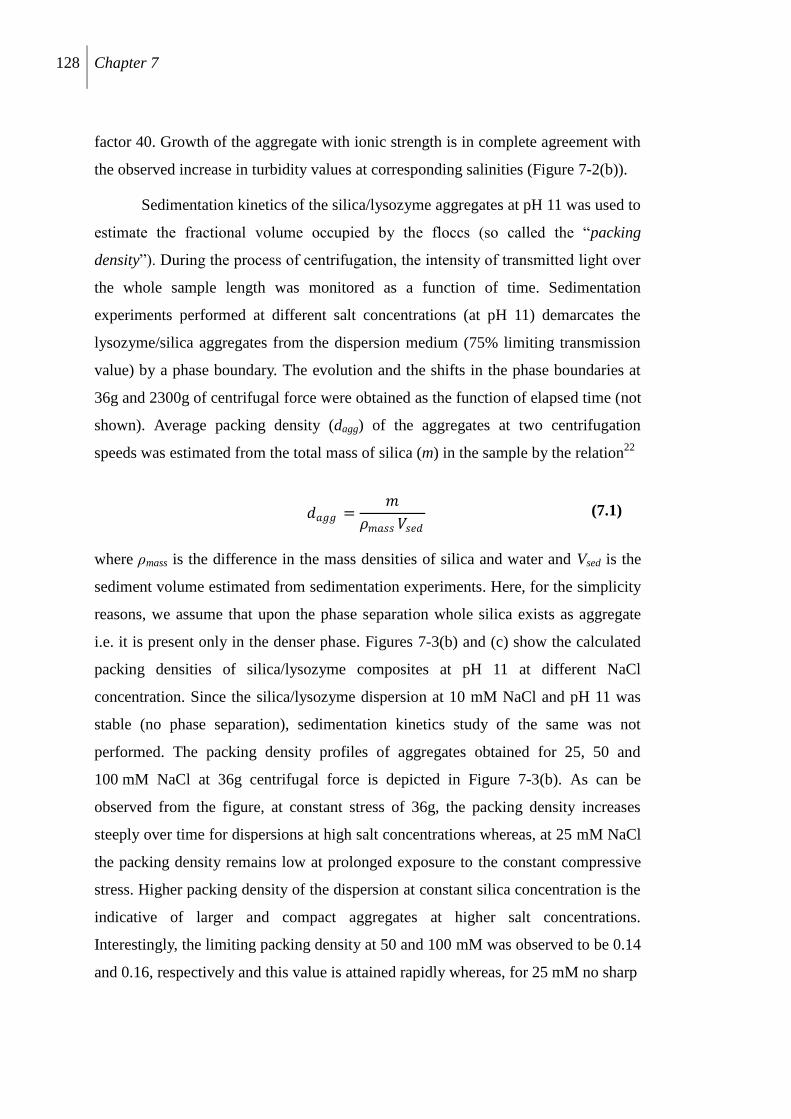
128 Chapter 7
factor 40. Growth of the aggregate with ionic strength is in complete agreement with
the observed increase in turbidity values at corresponding salinities (Figure 7-2(b)).
Sedimentation kinetics of the silica/lysozyme aggregates at pH 11 was used to
estimate the fractional volume occupied by the floccs (so called the “packing
density”). During the process of centrifugation, the intensity of transmitted light over
the whole sample length was monitored as a function of time. Sedimentation
experiments performed at different salt concentrations (at pH 11) demarcates the
lysozyme/silica aggregates from the dispersion medium (75% limiting transmission
value) by a phase boundary. The evolution and the shifts in the phase boundaries at
36g and 2300g of centrifugal force were obtained as the function of elapsed time (not
shown). Average packing density (dagg) of the aggregates at two centrifugation
speeds was estimated from the total mass of silica (m) in the sample by the relation22
𝑑𝑎𝑔𝑔 =𝑚
𝜌𝑚𝑎𝑠𝑠 𝑉𝑠𝑒𝑑 (7.1)
where ρmass is the difference in the mass densities of silica and water and Vsed is the
sediment volume estimated from sedimentation experiments. Here, for the simplicity
reasons, we assume that upon the phase separation whole silica exists as aggregate
i.e. it is present only in the denser phase. Figures 7-3(b) and (c) show the calculated
packing densities of silica/lysozyme composites at pH 11 at different NaCl
concentration. Since the silica/lysozyme dispersion at 10 mM NaCl and pH 11 was
stable (no phase separation), sedimentation kinetics study of the same was not
performed. The packing density profiles of aggregates obtained for 25, 50 and
100 mM NaCl at 36g centrifugal force is depicted in Figure 7-3(b). As can be
observed from the figure, at constant stress of 36g, the packing density increases
steeply over time for dispersions at high salt concentrations whereas, at 25 mM NaCl
the packing density remains low at prolonged exposure to the constant compressive
stress. Higher packing density of the dispersion at constant silica concentration is the
indicative of larger and compact aggregates at higher salt concentrations.
Interestingly, the limiting packing density at 50 and 100 mM was observed to be 0.14
and 0.16, respectively and this value is attained rapidly whereas, for 25 mM no sharp
Effect of pH and salinity on silica-lysozyme hetero-aggregation 129
Figure 7-4 Radial averaged SAXS intensity I(q) profile as the function of scattering vector q on
log-log scale, for a silica dispersion containing 1.1 mg/ml of lysozyme at different pH at (a) 10 mM;
and (b) 100 mM dispersion salinity. For better visualization each scattering curve has been shifted
upwards by the constant factor of 5 and the equilibrium pH has been indicated next to the curve.
boundary in the separation existed even after a prolonged centrifugation time. This
result reconfirms the particle size distribution presented in Figure 7-3(a). The
samples were also subjected to extended compression stress of 2300g leading to the
higher packing density of the flocs. Here again the limiting packing density of 0.4
and 0.34 for 50 and 100 mM NaCl respectively was attained but in the experimental
time scale this limiting value was never achieved for dispersions at 25 mM NaCl.
Here we would like to point out that because of the weaker aggregation the error in
the determination of the phase boundary and thus packing density for aggregate at
25 mM is higher than in the case of strongly aggregated dispersions (50 and
100 mM).
7.2.3.3 Small Angle X-ray Scattering (SAXS)
To relate the protein-induced silica nanoparticle aggregation with the interaction
potential between silica nanoparticles, SAXS measurements were performed for the
pH titration at different ionic strengths. Typical scattering profiles of the samples
130 Chapter 7
containing 10 and 100 mM NaCl are shown in Figure 7-4(a) and 7-4(b) respectively.
The scattering intensity is plotted as the function of scattering vector q, given by
(4π/λ)sinθ; where λ is the wavelength of X-ray beam and 2θ is the scattering angle.
In the case of X-ray scattering, it needs to be kept in mind that the scattering solely
arises from silica nanoparticles and its aggregate structure and the contribution of the
lysozyme towards the overall scattering is negligible. The oscillation appearing in the
scattering curves (Figures 7-4(a) and (b)) is the signature of spherical shaped silica
nanoparticles. The scattering curves in Figures 7-4(a) and (b) are identical at
q > 0.3 nm-1
(on a non-shifted scale; not shown), indicating the absence of any
change in the local spherical structure (shape) of the silica nanoparticles during the
aggregation process. However, an increase in the intensity can be observed in low-q
regions of the scattering profiles, which is typical for the aggregating nanoparticle
systems.16
In the case of 10 mM NaCl pH titration (Figure 7-4(a)), the SAXS profile
at pH 3.5 represents the flattening of the profile in low-q Guinier regime,
characteristic of the stable silica dispersion and is analogous to the profile of bare
silica nanoparticle. Because of the lack of any attractive electrostatic interaction
between protein and silica surface at this pH, no protein molecule binds to the silica
particle and the silica dispersion remains stable against aggregation. As the pH is
increased, the charge on the silica surface increases resulting into an attractive
interaction between silica and protein, and at pH > 4, lysozyme binds to silica surface
and initiates the aggregation process, resulting into an increase of scattering intensity
in Guinier regime which in turn originates from the large aggregate structure evolved
during the aggregation process.
The samples at low pH and 100 mM added NaCl (Figure 7-4(b)) show similar
behavior to 10 mM pH titration set. However, as pH is increased to 9 and beyond,
SAXS profiles show significant difference from the aggregates at 10 mM NaCl. At
100 mM electrolyte concentration, instead of disappearance of the rise in low-q
intensity, a steep increase in the slopes at higher salinity can be noticed. At 100 mM
ionic strength, the slope of low-q intensity for pH ≃ 10 varies as q-3.5
compared to
q-1.5
for 10 mM sample at corresponding pH . Silica/lysozyme aggregates with no
externally added salt redisperses itself at pH > 9.8, whereas, the floccs formed at 50
and 100 mM salt remain densely aggregated at the higher end of the experimental pH
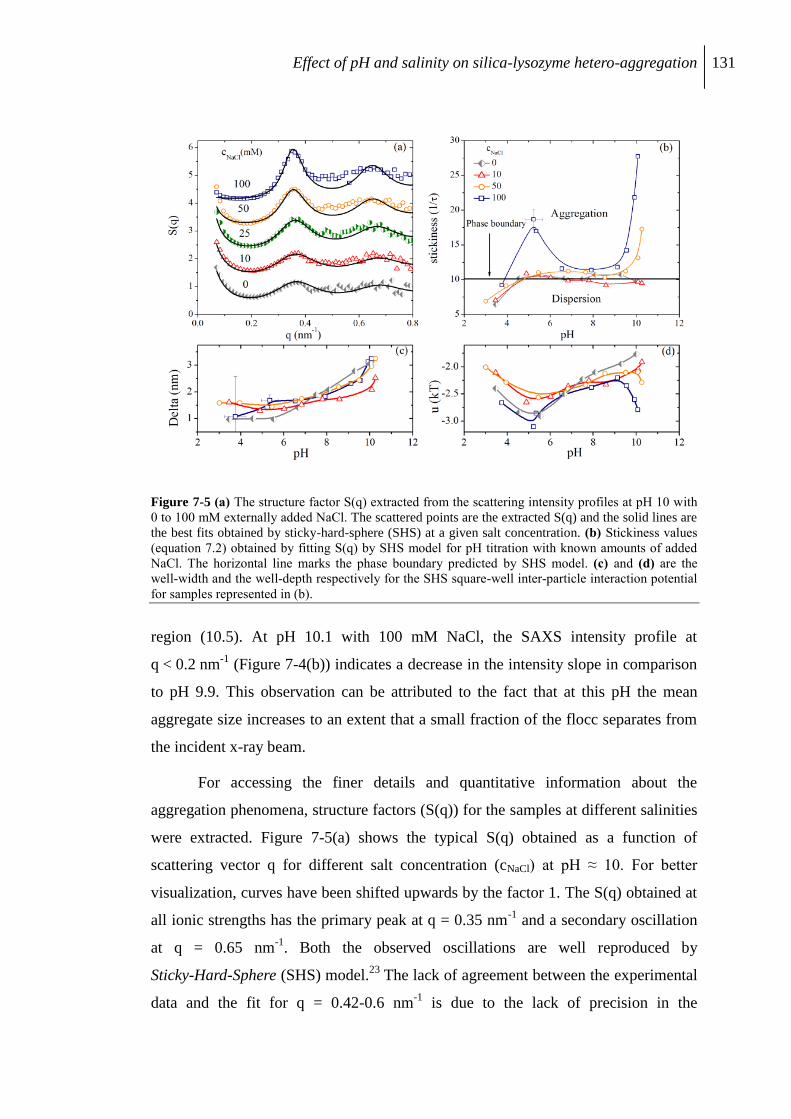
Effect of pH and salinity on silica-lysozyme hetero-aggregation 131
Figure 7-5 (a) The structure factor S(q) extracted from the scattering intensity profiles at pH 10 with
0 to 100 mM externally added NaCl. The scattered points are the extracted S(q) and the solid lines are
the best fits obtained by sticky-hard-sphere (SHS) at a given salt concentration. (b) Stickiness values
(equation 7.2) obtained by fitting S(q) by SHS model for pH titration with known amounts of added
NaCl. The horizontal line marks the phase boundary predicted by SHS model. (c) and (d) are the
well-width and the well-depth respectively for the SHS square-well inter-particle interaction potential
for samples represented in (b).
region (10.5). At pH 10.1 with 100 mM NaCl, the SAXS intensity profile at
q < 0.2 nm-1
(Figure 7-4(b)) indicates a decrease in the intensity slope in comparison
to pH 9.9. This observation can be attributed to the fact that at this pH the mean
aggregate size increases to an extent that a small fraction of the flocc separates from
the incident x-ray beam.
For accessing the finer details and quantitative information about the
aggregation phenomena, structure factors (S(q)) for the samples at different salinities
were extracted. Figure 7-5(a) shows the typical S(q) obtained as a function of
scattering vector q for different salt concentration (cNaCl) at pH ≈ 10. For better
visualization, curves have been shifted upwards by the factor 1. The S(q) obtained at
all ionic strengths has the primary peak at q = 0.35 nm-1
and a secondary oscillation
at q = 0.65 nm-1
. Both the observed oscillations are well reproduced by
Sticky-Hard-Sphere (SHS) model.23
The lack of agreement between the experimental
data and the fit for q = 0.42-0.6 nm-1
is due to the lack of precision in the
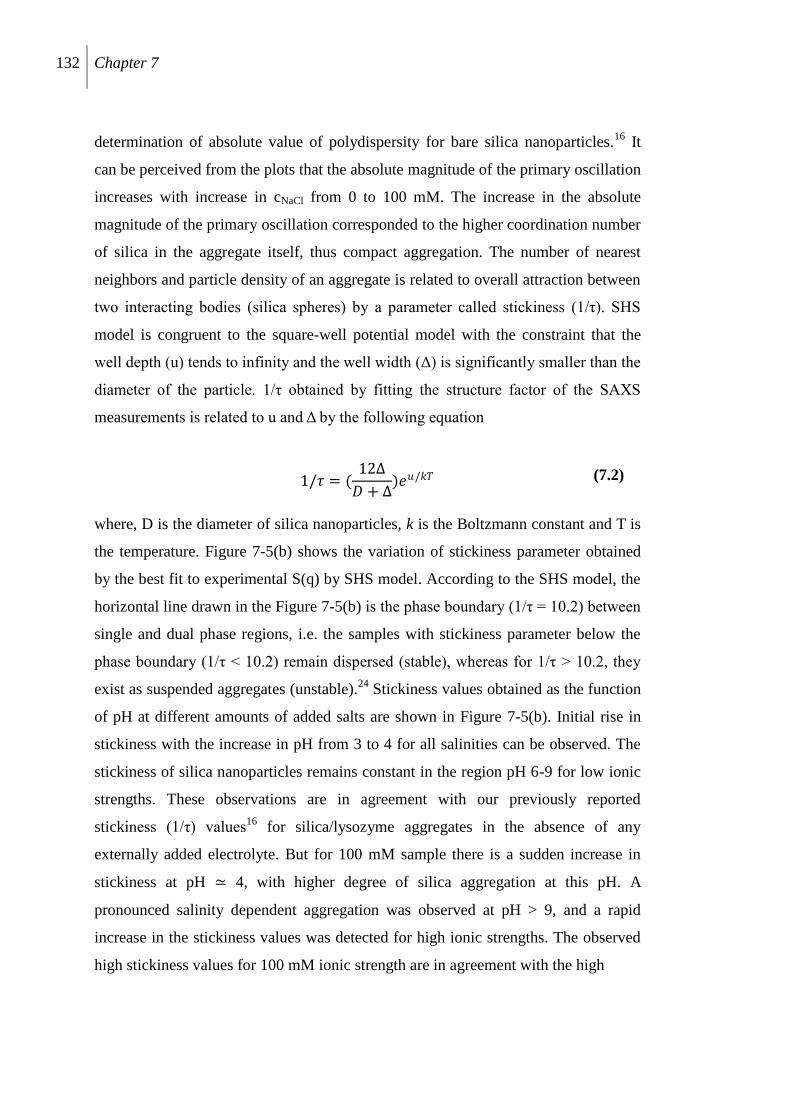
132 Chapter 7
determination of absolute value of polydispersity for bare silica nanoparticles.16
It
can be perceived from the plots that the absolute magnitude of the primary oscillation
increases with increase in cNaCl from 0 to 100 mM. The increase in the absolute
magnitude of the primary oscillation corresponded to the higher coordination number
of silica in the aggregate itself, thus compact aggregation. The number of nearest
neighbors and particle density of an aggregate is related to overall attraction between
two interacting bodies (silica spheres) by a parameter called stickiness (1/τ). SHS
model is congruent to the square-well potential model with the constraint that the
well depth (u) tends to infinity and the well width (Δ) is significantly smaller than the
diameter of the particle. 1/τ obtained by fitting the structure factor of the SAXS
measurements is related to u and Δ by the following equation
1/𝜏 = (12Δ
𝐷 + Δ)𝑒𝑢/𝑘𝑇 (7.2)
where, D is the diameter of silica nanoparticles, k is the Boltzmann constant and T is
the temperature. Figure 7-5(b) shows the variation of stickiness parameter obtained
by the best fit to experimental S(q) by SHS model. According to the SHS model, the
horizontal line drawn in the Figure 7-5(b) is the phase boundary (1/τ = 10.2) between
single and dual phase regions, i.e. the samples with stickiness parameter below the
phase boundary (1/τ < 10.2) remain dispersed (stable), whereas for 1/τ > 10.2, they
exist as suspended aggregates (unstable).24
Stickiness values obtained as the function
of pH at different amounts of added salts are shown in Figure 7-5(b). Initial rise in
stickiness with the increase in pH from 3 to 4 for all salinities can be observed. The
stickiness of silica nanoparticles remains constant in the region pH 6-9 for low ionic
strengths. These observations are in agreement with our previously reported
stickiness (1/τ) values16
for silica/lysozyme aggregates in the absence of any
externally added electrolyte. But for 100 mM sample there is a sudden increase in
stickiness at pH ≃ 4, with higher degree of silica aggregation at this pH. A
pronounced salinity dependent aggregation was observed at pH > 9, and a rapid
increase in the stickiness values was detected for high ionic strengths. The observed
high stickiness values for 100 mM ionic strength are in agreement with the high
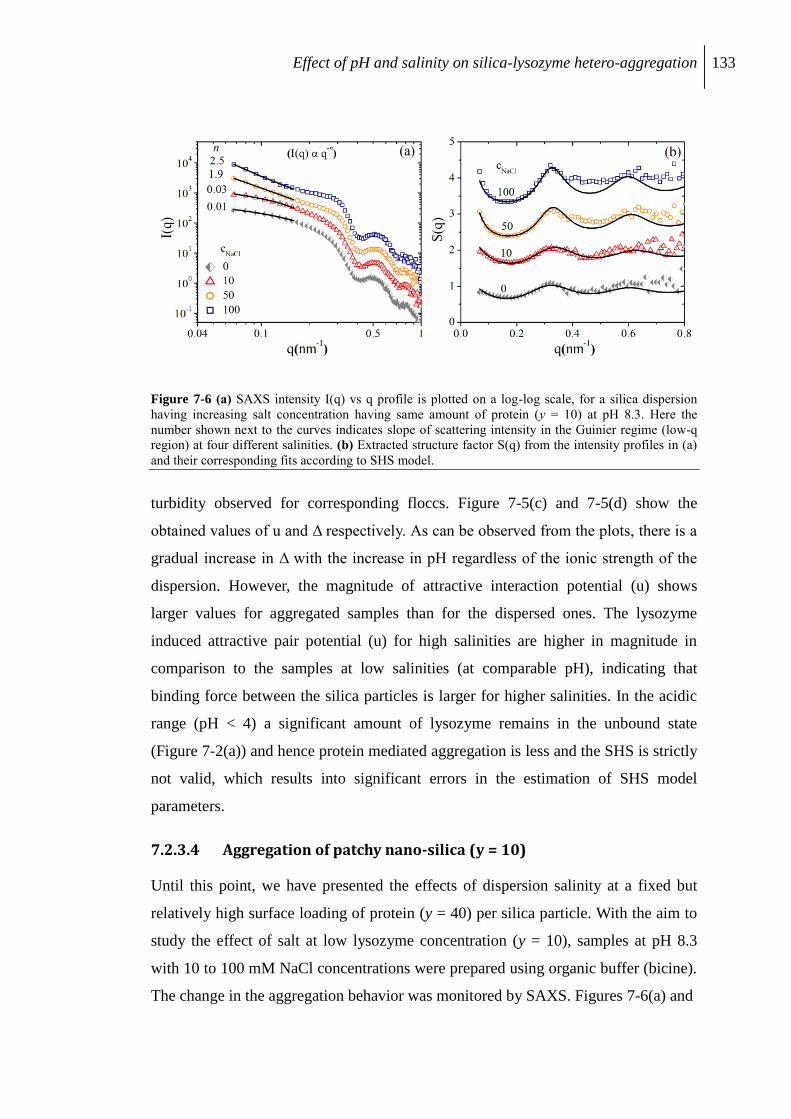
Effect of pH and salinity on silica-lysozyme hetero-aggregation 133
Figure 7-6 (a) SAXS intensity I(q) vs q profile is plotted on a log-log scale, for a silica dispersion
having increasing salt concentration having same amount of protein (y = 10) at pH 8.3. Here the
number shown next to the curves indicates slope of scattering intensity in the Guinier regime (low-q
region) at four different salinities. (b) Extracted structure factor S(q) from the intensity profiles in (a)
and their corresponding fits according to SHS model.
turbidity observed for corresponding floccs. Figure 7-5(c) and 7-5(d) show the
obtained values of u and Δ respectively. As can be observed from the plots, there is a
gradual increase in Δ with the increase in pH regardless of the ionic strength of the
dispersion. However, the magnitude of attractive interaction potential (u) shows
larger values for aggregated samples than for the dispersed ones. The lysozyme
induced attractive pair potential (u) for high salinities are higher in magnitude in
comparison to the samples at low salinities (at comparable pH), indicating that
binding force between the silica particles is larger for higher salinities. In the acidic
range (pH < 4) a significant amount of lysozyme remains in the unbound state
(Figure 7-2(a)) and hence protein mediated aggregation is less and the SHS is strictly
not valid, which results into significant errors in the estimation of SHS model
parameters.
7.2.3.4 Aggregation of patchy nano-silica (y = 10)
Until this point, we have presented the effects of dispersion salinity at a fixed but
relatively high surface loading of protein (y = 40) per silica particle. With the aim to
study the effect of salt at low lysozyme concentration (y = 10), samples at pH 8.3
with 10 to 100 mM NaCl concentrations were prepared using organic buffer (bicine).
The change in the aggregation behavior was monitored by SAXS. Figures 7-6(a) and
134 Chapter 7
Table 7-3 Turbidity and S(q) fit parameters stickiness (1/η), volume fraction (υ), well width (Δ), well
depth (u) at surface concentration of 10 protein molecules per silica (y) with increasing NaCl
concentration cNaCl.
cNaCl Turbidity 1/η υ Δ u
0 1 5.4 0.08 1.2 -2.1
10 4 6.5 0.09 1.5 -2.1
50 163 9.7 0.16 1.3 -2.7
100 183 10.2 0.15 1.7 -2.5
a all measurements were carried out at 25°C.
Figure 7-6(b) present the SAXS profiles and thus extracted structure factors S(q) for
different salinities at pH 8.3. The numbers given next to the SAXS curves in
Figure 7-6(a) are the low-q (0.07-0.15 nm-1
) slopes (n) of scattering intensity, varying
proportional to q-n
. As indicated by the values of n for y = 10, the magnitude of the
slopes increased from n ≃ 0 to 2.5, when the ionic strength was varied from 0 to
100 mM. As mentioned earlier, this increase in low-q intensity is the signature of the
aggregation of scattering entities i.e. silica nanoparticles. Structure factors extracted
from the scattering curves and their corresponding fits from SHS model are given in
Figure 7-5(b). The fitting parameters obtained and the turbidity values for the
aggregates are given in Table 7-3. Low turbidity values for the samples with 0 and
10 mM salt, indicate the absence of any observable aggregation of silica
nanoparticles i.e. lysozyme is not able to glue the silica particles at y = 10 and at low
ionic strengths and nanoparticles remain in dispersed form. As the ionic strength is
raised to 50 and 100 mM the turbidity increases to 163 and 183 cm2/g respectively.
The increase in turbidity values is complemented by the high stickiness values given
by SHS fit to the S(q).
7.3 Discussion
As presented in the previous section, adsorption of lysozyme and the induced
aggregation of silica nanoparticles is highly dependent on pH and the ionic strength
of the dispersion. Here we account for the observed differences in adsorption and
Effect of pH and salinity on silica-lysozyme hetero-aggregation 135
aggregation behaviour on the basis of the complex interactions between hydrophilic
silica particles and lysozyme.
7.3.1 Role of electrostatic interactions
In our previous study of the interaction of silica nanoparticles with lysozyme we
presented evidence for the important role of electrostatic interactions in this system,
based on the pH dependence of the lysozyme adsorption at the silica particles and the
lysozyme-induced flocculation.16
Following up this work we have now focused on
the combined influence of pH and salinity on the adsorption and aggregation
behaviors. The screening of electrostatic interactions between all pairs of charged
species, i.e., protein-silica, particle-particle and protein-protein, causes a decrease of
the maximum protein adsorption at the silica particles (Figure 7-1). The decrease in
the surface crowding of protein molecules at the silica surface is an indication that
the protein-particle attractive pair interactions, although screened, are still
dominating over the protein-protein repulsive interaction. These results are in
agreement with the previously reported reduction in lysozyme binding to silica
nanoparticles.14, 15, 25
Lundin et al.17
have studied the adsorption of lysozyme at pH
8.5 on the flat silica surface by QCM and ellipsometry and have found a pronounced
dependence of adsorption on the concentration of added salt. The generic behavior of
the protein adsorption is the same with the decrease of the bound protein by the
factor of ≈1.3 from 10→100 mM NaCl. However, the differences in the absolute
amounts of bound protein can be attributed to the probable dissimilarity in the
surface charge density between our aqueous silica nanoparticle dispersion and the
flat surface used by Lundin et al..
7.3.2 Protein induced silica aggregation
As shown in Figure 7-2(a) and 7-2(b), in the course of pH change the adsorption of
protein is accompanied by aggregation of the silica particles. Although, the binding
behavior of the protein to silica remains similar at different tested salinities,
significant differences can be observed in the corresponding sample turbidities. The
increase in the concentration of monovalent salt from 1 to 100 mM decreases the
Debye length of colloidal silica from about 10 to about 1 nm. The Debye length
136 Chapter 7
determines the length scale at which electrostatic interactions between the silica
nanoparticles are screened, and therefore is of immediate relevance for the
structuring and stability of the dispersion.26
For low dispersion salinities (large
Debye lengths) the dispersion remains stable against aggregation due to electrostatic
inter-particle repulsions. In the presence of lysozyme higher turbidity is solely due to
the formation of protein-bridged-silica aggregates. In the absence of any externally
added salt at pH < 4, the silica surface is weakly charged and proteins remains
unadsorbed and hence the silica nanoparticles remain in completely dispersed form.
At the intermediate pH regime, silica-lysozyme forms oppositely charged pair and
form hetero-aggregates. Whereas, in the weak protein binding regime pH 4-5, SAXS
structure factor fits show a high stickiness (Figure 7-5(b)), which can be explained
by the following two cooperative effects (i) lack of silica dispersion stability because
of vicinity of its IEP and high ionic strength,27
and (ii) effective gluing of silica
nanoparticles by protein molecules. Too high value of stickiness parameter is
obtained at 100 mM NaCl (Figure 7-5(b)), which is due to the reduction in the
screening length of the particles.
At intermediate pH 5-9, the aggregation is the typical hetero-aggregation
between highly charged silica and lysozyme molecules, resulting into the formation
of less dense flocculated networks.16
The aggregation occurring in this pH range is
independent of the dispersion salinity, the possible reason for this observation is
discussed later in this section. For the pH > 9, the positive charge density on the
lysozyme surface decreases because of its approaching IEP (pH 11) resulting in the
weaker bridging capability of lysozyme and hence weaker aggregation. At this point
we should also keep in mind that with the increase in salinity, there is an increase in
the screening of charged entities i.e. the local charges both on lysozyme and silica. At
pH > 9, at a known NaCl concentration, the surface charge of silica particles remains
constant and highly negative.16
The changes occurring in the silica/lysozyme
composite system are solely because of the change in the surface charge density of
the protein. As the IEP of lysozyme is approached, the charge on the surface of
protein diminishes resulting into the release of bound counter ions (Cl- from NaCl)
on the surface. As a result, the surface of the protein is dehydrated leading to the
increase in attractive Hamaker dispersion forces (salting out). The aggregation of
Effect of pH and salinity on silica-lysozyme hetero-aggregation 137
lysozyme itself has been reported earlier in various theoretical and experimental
studies.28,29
In their work, Velev et al.29
have found that for lysozyme increasing salt
concentration results in the decrease in the second virial coefficient. The net positive
charge on protein decreases with increasing pH and the repulsive-attractive
interactions approach a balance at pH ≃ 9 for lysozyme increasing the importance of
van der Waals forces.29
For our silica-lysozyme composite, on addition of
monovalent 1:1 electrolyte (NaCl) the turbidity (Figure 7-2(b)) as well as stickiness
(Figure 7-5(b)) show a sudden increase. Tentatively, we attribute the increase in
turbidity at higher pH and salinity samples to the decrease in the Debye length of the
silica dispersion and with the approaching IEP of lysozyme, the net charge on
lysozyme approaches zero, but there exist local charges on the surface of proteins,
which are further screened by high salt concentrations. Under these screened charge
interactions, the hydrophobic groups on the surface of protein molecules tend to lose
their water of hydration, in order to gain entropy in the form of released water
molecules. Dehydration results in the exposure of hydrophobic surface patches of the
protein to the solution which then tend to precipitate out by attaching to the protein
molecule sitting on the surface of another silica nanoparticle. Hence, strong
hydrophobic protein-protein interactions now drive aggregation phenomenon. This
behavior is similar to the salting-out effect of only protein dispersions. In the present
case, we can say that the salting-out phenomenon for protein is taking place which
incorporates the silica nanoparticles into the phase separating domain. These effects
get stronger with the increase in the NaCl concentration resulting in the increase in
the mean aggregate size and decrease in the packing density of the flocc (Figure 7-3).
7.3.3 Lysozyme/silica patchy particles
At low protein concentration, only a small fraction of the silica surface is occupied
by the protein, i.e. the silica surface has only a handful patched of lysozyme adhering
to the surface by electrostatic attraction. At this low surface coverage with protein the
silica/protein dispersions showed a pronounced salinity-dependent aggregation. The
volume fraction of silica in the floccs obtained by SHS model fitting shows an
increase of around 80% with the increase in cNaCl from 0 to 100 mM (Figure 7-6).
The jump in the turbidity values for the aggregated solution at y = 10 was also
138 Chapter 7
observed (not shown) and was proportional to the concentrations of NaCl. Analytic
centrifugation also shows an increase in aggregate size with salinity. This increase in
the aggregation is again attributed to the collaborative function of suppression of
silica-silica repulsions and increase in protein-protein hydrophobic attractions. The
reason of the present effect gets pronounced only at low surface which is discussed
here. High protein concentration at pH 8.3 results into a larger number of bridges
between the silica particles resulting into a high aggregation in the system. However,
when the protein concentration is sufficiently lower at the same pH, there are not
enough number of lysozyme molecules available to form the junction between silica
nanoparticles. The decrease in the Debye length by the adding salt results into a less
repulsive interaction between silica/protein patchy particle and now, in the screened
interacting system smaller number of bonds are actually capable of gluing the silica
particles together. Here we just presented the effects, more systematic studies are
needed to quantify the results in terms of the minimum number of protein particles
necessary to aggregate the silica dispersion at a given pH.
7.4 Conclusions
In this work we have demonstrated the importance of dispersion salinity and pH on
the binding affinity of lysozyme to silica nanoparticles. Increase in ionic strength of
dispersion at pH 8.3 results in a gradual decrease in the maximum surface excess of
lysozyme adsorption onto silica nanoparticles. In the set of experiments at a constant
ratio of silica and protein and fixed values of salinity we have studied the turbidity of
the samples as a function of pH. These measurements show that an increase in
salinity does not have a very pronounced effect on the turbidity for pH < 9, i.e., at pH
values well below the isoelectric point of lysozyme. However, a further increase in
the pH results in a very pronounced increase in turbidity, indicating a strong increase
of the aggregate size. SAXS measurements show an increase of the scattering
intensity in the low-q regime, indicating the presence of silica aggregates. From
measured SAXS data, the structure factor of aggregates could be determined. As
before,16
we have analyzed the structure factor data on the basis of the sticky-hard
sphere model. A strong increase in stickiness of the silica beads with increasing
salinity was observed at pH > 9, in accordance with the high turbidity values in this
Effect of pH and salinity on silica-lysozyme hetero-aggregation 139
regime. The high stickiness of the beads was attributed to the presence of dominant
hydrophobic interactions between the protein molecules attached to different silica
particles. Furthermore, we have found that salinity also changes the aggregation
behavior of protein with the silica particles at very low protein loadings (10
lysozyme per silica). All the studies prove that salinity and pH play a major role in
the lysozyme-induced aggregation of the silica particles. The interactions can be
tuned by adjusting the charges on the individual particles by changing pH, and the
charges can be screened by addition of salt to the dispersion. Above some limiting
value of salinity the hydrophobic interactions between lysozyme molecules become a
dominant factor. Hence, we conclude that depending upon the extent of surface
charge screening, the aggregation behavior is governed either by the electrostatic
interactions or by short-range hydrophobic interactions between the protein
molecules.
References
1 Walkey, C. D., Chan, C. W., Chem. Soc. Rev., 2012, 41, 2780.
2 Niemeyer, C. M., Angew. Chem. Int. Ed., 2001, 40, 4129.
3 Cedervall, T., Lynch, I., Lindman, S., Berggard, T., Thulin, E., Nilsson, H.,
Dawson, K. A., Linse, S., Proc. Natl. Acad. Sci., 2007, 104, 2050.
4 Wu, J., Silvent, J., Coradin, T., Aimé, C., Langmuir, 2012, 28, 2156.
5 Gao, J., Gu, H., Xu, B., Acc. Chem. Res., 2009, 42, 1097.
6 Colvin, V. L., Kulinowski, K. M., Proc. Natl. Acad. Sci., 2007, 104, 8679.
7 Farokhzad , O. C., Langer, R., ACS Nano, 2009, 3, 16.
8 Shemetov, A. A., Nabiev, I., Sukhanova, A., ACS Nano, 2012, 6, 4585.
9 Tam, M-E. A., Schifferli, K. H., Biomed.Mater., 2008, 3, 034001.
10 Chen, S. H., Li, F. C., Souris, J. S., Yang, C. S., Tseng, F. G., Lee, H. S., Chen, C.
T., Dong, C. Y., Lo, L. W., ACS Nano, 2012, 6, 4122.
140 Chapter 7
11 Lynch, I., Salvati, A., Kenneth, D. A., Nat. Nanotechnol., 2009, 4, 546.
12 Haynes, C. A., Norde, W., Colloids Surf. B, 1994, 2, 517.
13 Corbalan, J. J., Medina, C., Jacoby, A., Malinski, T., Radomski, M. W., Int. J.
Nanomed., 2012, 7, 631.
14 Larsericsdotter, H., Oscarsson, S., Buijs, J., J. Colloid Inter. Sci., 2001, 237, 98.
15 Wong, K., Cabane, B., Somasudaran, P., Colloids Surf., 1988, 30, 355.
16 Bharti, B., Meissner, J., Findenegg, G. H. Langmuir, 2011, 27, 9823.
17 Lundin, M., Elofsson, U. M., Blomberg, E. Rutland , M. W., Colloid Surf. B, 2010,
77, 1.
18 Su, T. J., Lu, J. R., Thomas, R. K., Cui, Z. F., Penfold, J., J. Colloid Inter. Sci.,
1998, 203, 419.
19 Kumar, S., Aswal, V. K., Kohlbrecher. J., Langmuir, 2011, 27, 10167.
20 Lerche, D., Sobisch, T., Powder Technol., 2007, 174, 46.; Sobisch, T., Lerche, D.,
Colloids Surf. A, 2008, 331, 114.
21 Detloff, T., Sobisch, T., Lerche, D., Part. Part. Syst. Charact., 2006, 23, 184.
22 Sobisch, T., Lerche, D., Detloff, T., Beiser, M., Erk, A., Filtration, 2006, 6, 313.
23 Baxter, R. J., J. Chem. Phys., 1968, 49, 2770.
24 Regnaut, C., Ravey, J. C., J. Chem. Phys., 1989, 91, 1211.
25 Nezu, T., Masuyama, T., Sasaki, K., Saitoh, S., Taira, M., Araki, Y., Dent. Mater.
J., 2008, 27, 573.
26 Zeng, Y., Grander, S., Oliveria, C. L. P., Thünemann, A. F., Paris, O., Pederson, J.
S., Klapp, S. H., Klitzing, R. v., Soft Matter, 2011, 7, 10899.
27 Metin, C. O., Lake, L. W., Miranda, R., Nguyen, P. Q., J. Nanopart. Res., 2011, 13,
839.
Effect of pH and salinity on silica-lysozyme hetero-aggregation 141
28 Lund, M., Jungwirth, P., Woodward, C. E., Phys. Rev. Lett., 2008, 100, 258150
29 Velev, O. D., Kaler, E. W., Lenhoff, A. M., Biophys. J., 1998, 75, 2682.

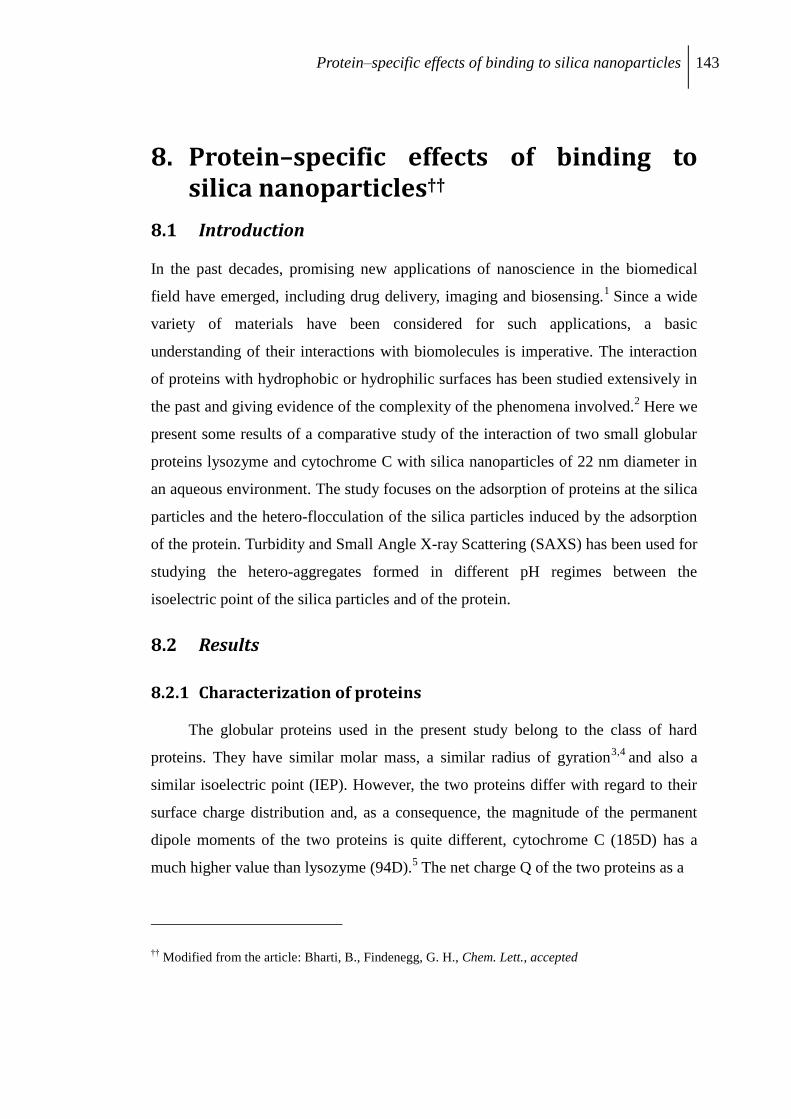
Protein–specific effects of binding to silica nanoparticles 143
8. Protein–specific effects of binding to silica nanoparticles††
8.1 Introduction
In the past decades, promising new applications of nanoscience in the biomedical
field have emerged, including drug delivery, imaging and biosensing.1 Since a wide
variety of materials have been considered for such applications, a basic
understanding of their interactions with biomolecules is imperative. The interaction
of proteins with hydrophobic or hydrophilic surfaces has been studied extensively in
the past and giving evidence of the complexity of the phenomena involved.2 Here we
present some results of a comparative study of the interaction of two small globular
proteins lysozyme and cytochrome C with silica nanoparticles of 22 nm diameter in
an aqueous environment. The study focuses on the adsorption of proteins at the silica
particles and the hetero-flocculation of the silica particles induced by the adsorption
of the protein. Turbidity and Small Angle X-ray Scattering (SAXS) has been used for
studying the hetero-aggregates formed in different pH regimes between the
isoelectric point of the silica particles and of the protein.
8.2 Results
8.2.1 Characterization of proteins
The globular proteins used in the present study belong to the class of hard
proteins. They have similar molar mass, a similar radius of gyration3,4
and also a
similar isoelectric point (IEP). However, the two proteins differ with regard to their
surface charge distribution and, as a consequence, the magnitude of the permanent
dipole moments of the two proteins is quite different, cytochrome C (185D) has a
much higher value than lysozyme (94D).5 The net charge Q of the two proteins as a
†† Modified from the article: Bharti, B., Findenegg, G. H., Chem. Lett., accepted
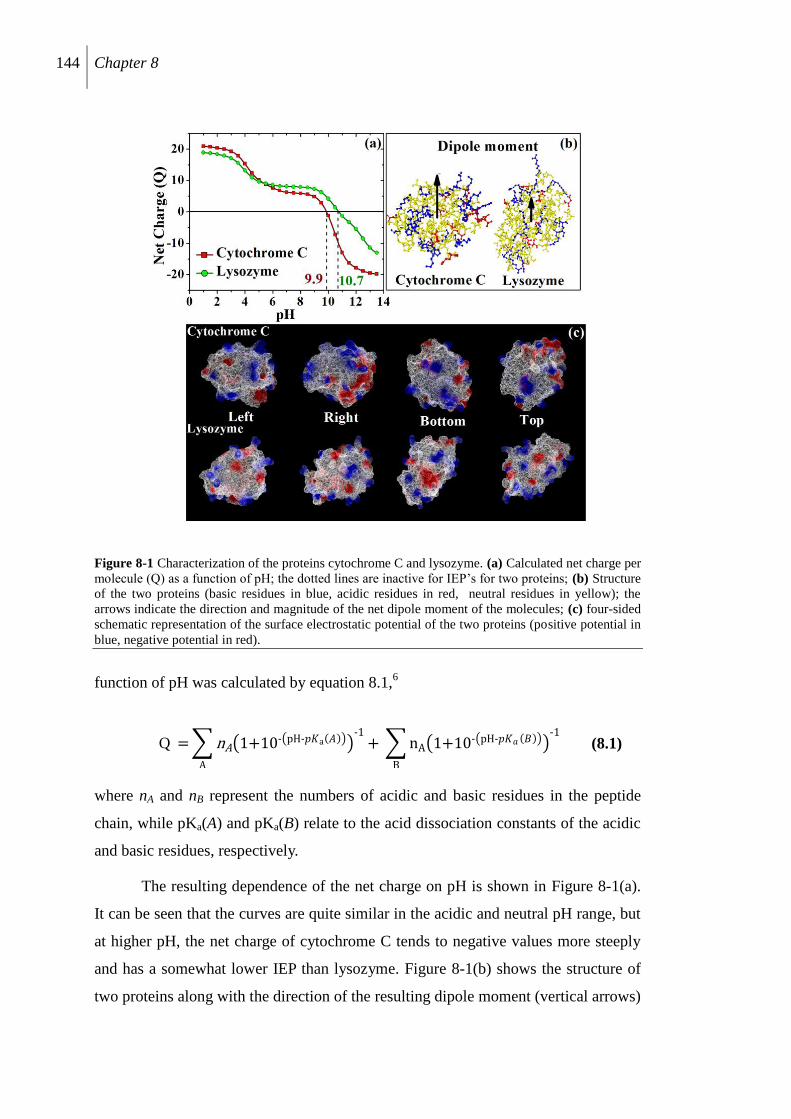
144 Chapter 8
Figure 8-1 Characterization of the proteins cytochrome C and lysozyme. (a) Calculated net charge per
molecule (Q) as a function of pH; the dotted lines are inactive for IEP‟s for two proteins; (b) Structure
of the two proteins (basic residues in blue, acidic residues in red, neutral residues in yellow); the
arrows indicate the direction and magnitude of the net dipole moment of the molecules; (c) four-sided
schematic representation of the surface electrostatic potential of the two proteins (positive potential in
blue, negative potential in red).
function of pH was calculated by equation 8.1,6
Q = nA 1+10- pH-𝑝𝐾a 𝐴 -1
A
+ nA 1+10- pH-𝑝𝐾𝑎 𝐵 -1
B
(8.1)
where nA and nB represent the numbers of acidic and basic residues in the peptide
chain, while pKa(A) and pKa(B) relate to the acid dissociation constants of the acidic
and basic residues, respectively.
The resulting dependence of the net charge on pH is shown in Figure 8-1(a).
It can be seen that the curves are quite similar in the acidic and neutral pH range, but
at higher pH, the net charge of cytochrome C tends to negative values more steeply
and has a somewhat lower IEP than lysozyme. Figure 8-1(b) shows the structure of
two proteins along with the direction of the resulting dipole moment (vertical arrows)
Protein–specific effects of binding to silica nanoparticles 145
at neutral pH. Basic residues (+) are indicated in blue, acidic residues (-) in red, and
neutral residues in yellow color. The structures and resulting dipole moment
presented in Figure 8-1(b) were obtained by using the protein data bank lysozyme
(PDB: 2LYZ) and cytochrome C (PDB: 1HRC) structures. The calculations were
done by online protein dipole moment server.7 Only the non-hydrogen atoms of the
standard amino acids of the protein itself were included in the dipole moment
calculations. The exact electrostatic potentials and its distribution at the surfaces of
the two proteins as calculated by the CCP4MG8 software package are shown in
Figure 8-1(c). The images show the four faces of the protein corresponding to a
rotation of the molecule in steps of 90° as indicated in the figure. For lysozyme
molecule, the partial areas of positive and negative potential are similar on the four
faces, a more dissimilar distribution is observed for cytochrome C, in agreement with
the higher dipole moment of the cytochrome C. We have studied the effect of this
difference in charge distribution on the adsorption of the proteins at silica
nanoparticles and the protein-induced flocculation of the silica.
Silica nanoparticles used in this study were synthesized by the method of
Davis et al.9, using lysine as the basic catalyst for the hydrolysis of the silica
precursor, and characterized by SAXS and nitrogen adsorption. They had a mean
diameter of 22 nm (polydispersity 10%), a specific surface area of 180 m2/g, and an
isoelectric point near 3 (somewhat higher than the pure silica surface, presumably
due to the adsorption of lysine10
). Accordingly, in a wide pH range between the
isoelectric points of silica and the protein, the silica particles are negatively charged
while the protein molecules carry a positive net charge. As was shown earlier for the
case of lysozyme, this opposite charge dominates the adsorption behavior of the
protein and the hetero-flocculation behavior of the silica nanoparticles.11
8.2.2 Protein-binding to silica surface
In order to investigate the effects of dissimilar dipole moment of two proteins, pH
titrations experiments were carried out for protein/silica dispersions of fixed
concentration of silica (1 wt-%) and protein (1 mg/mL, corresponding to a surface
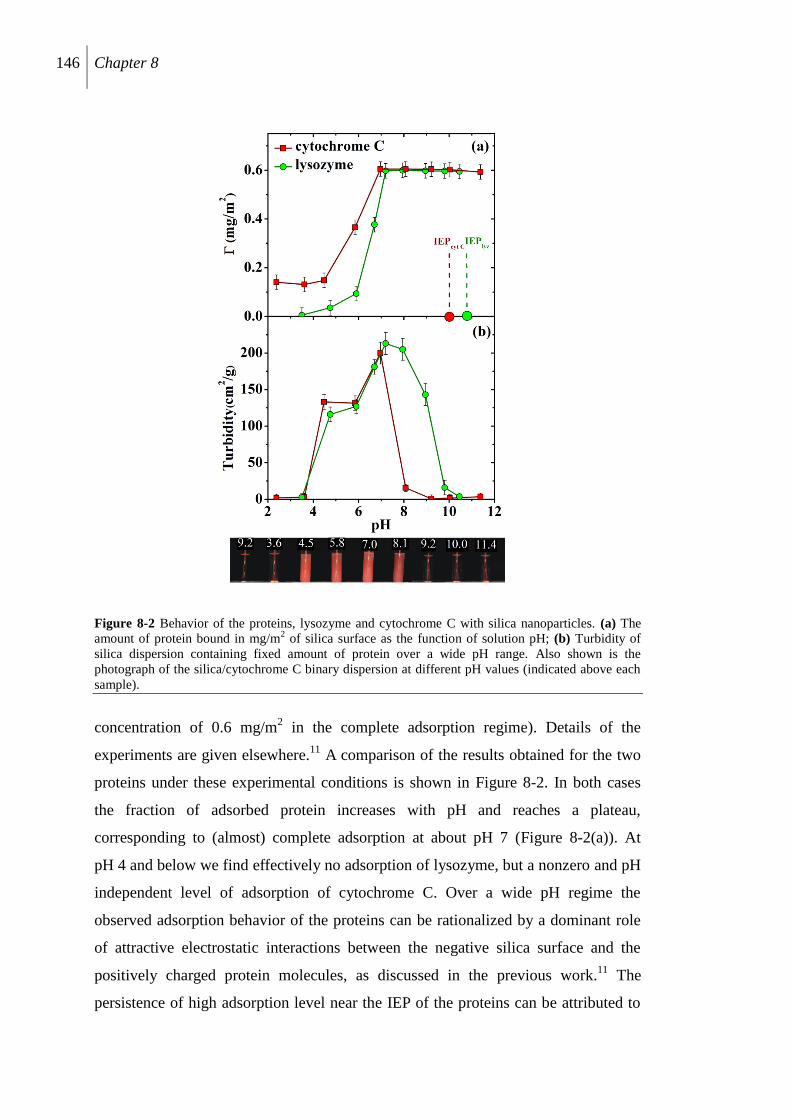
146 Chapter 8
Figure 8-2 Behavior of the proteins, lysozyme and cytochrome C with silica nanoparticles. (a) The
amount of protein bound in mg/m2 of silica surface as the function of solution pH; (b) Turbidity of
silica dispersion containing fixed amount of protein over a wide pH range. Also shown is the
photograph of the silica/cytochrome C binary dispersion at different pH values (indicated above each
sample).
concentration of 0.6 mg/m2 in the complete adsorption regime). Details of the
experiments are given elsewhere.11
A comparison of the results obtained for the two
proteins under these experimental conditions is shown in Figure 8-2. In both cases
the fraction of adsorbed protein increases with pH and reaches a plateau,
corresponding to (almost) complete adsorption at about pH 7 (Figure 8-2(a)). At
pH 4 and below we find effectively no adsorption of lysozyme, but a nonzero and pH
independent level of adsorption of cytochrome C. Over a wide pH regime the
observed adsorption behavior of the proteins can be rationalized by a dominant role
of attractive electrostatic interactions between the negative silica surface and the
positively charged protein molecules, as discussed in the previous work.11
The
persistence of high adsorption level near the IEP of the proteins can be attributed to
Protein–specific effects of binding to silica nanoparticles 147
the interaction of remaining positively charged patches of the protein surface with
the strongly negative silica surface, and the diminished electrostatic repulsion
between adsorbed protein molecules and increasing role of hydrophobic interactions
between adsorbed protein.
8.2.3 Protein-induced silica aggregation
The turbidity of the protein/silica dispersions and its dependence on pH
(Figure 8-2(b)) can attributed to silica aggregation due to adsorbed protein. At pH 3
when little or no protein is adsorbed, only weak aggregation of the silica particle
occurs due to the missing charge stabilization. The sharp increase in turbidity from
pH 3 to 4 and the further increase up to pH 7 is attributed to the protein mediated
bridging of silica nanoparticles.11
The low turbidity of the systems in the pH region
near the IEP of the protein can be attributed to charge stabilization of the strongly
negatively charged silica particles coated with a layer of nearly uncharged protein.
Interestingly, significant differences in the pH-dependence of the turbidity are found
in the pH range 7 to 10. For the dispersion with cytochrome C, the strong decrease in
turbidity occurs at a significantly lower pH than for the dispersion with lysozyme.
This shows that cytochrome C although being strongly adsorbed as lysozyme has a
significantly lower ability to induce aggregation of the silica particles in this pH
regime. It is also of interest to note that at low pH some cytochrome C remains
adsorbed at the silica particles but here too this does not lead to enhanced
aggregation of the silica nanoparticles. We return to this point later.
The aggregate structure of the silica hetero-flocculate with cytochrome C was
characterized by SAXS. Figure 8-3 shows SAXS profile where the radially averaged
scattering intensity, I(q) is plotted as a function of momentum transfer q. It needs to
be kept in mind that the proteins due to their low electron density remain effectively
invisible to the x-ray beam. The profiles were obtained for a 1 wt-% silica dispersion
containing on average 50 cytochrome C molecules per silica particle. The profiles for
pH 5.8 and 7.0 exhibit a pronounced increase in I(q) in the low-q region (Guinier
regime), which is missing or much weaker in the profiles for pH 9.2 and 2.8. The
increase in scattering intensity in the Guinier regime is a signature of strong particle
aggregation.12
The scattering profiles were analyzed in terms of the relation
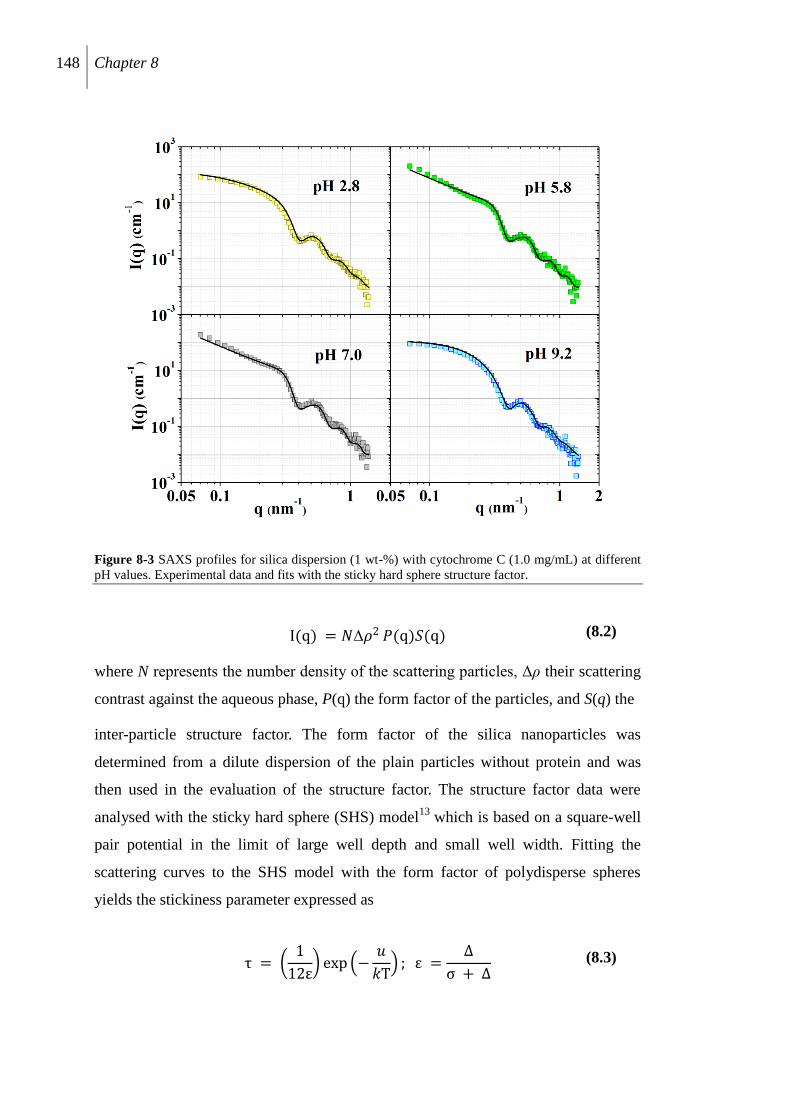
148 Chapter 8
Figure 8-3 SAXS profiles for silica dispersion (1 wt-%) with cytochrome C (1.0 mg/mL) at different
pH values. Experimental data and fits with the sticky hard sphere structure factor.
I(q) = 𝑁Δ𝜌2 𝑃(q)𝑆(q) (8.2)
where N represents the number density of the scattering particles, Δρ their scattering
contrast against the aqueous phase, P(q) the form factor of the particles, and S(q) the
inter-particle structure factor. The form factor of the silica nanoparticles was
determined from a dilute dispersion of the plain particles without protein and was
then used in the evaluation of the structure factor. The structure factor data were
analysed with the sticky hard sphere (SHS) model13
which is based on a square-well
pair potential in the limit of large well depth and small well width. Fitting the
scattering curves to the SHS model with the form factor of polydisperse spheres
yields the stickiness parameter expressed as
τ = 1
12ε exp −
𝑢
𝑘T ; ε =
Δ
σ + Δ (8.3)
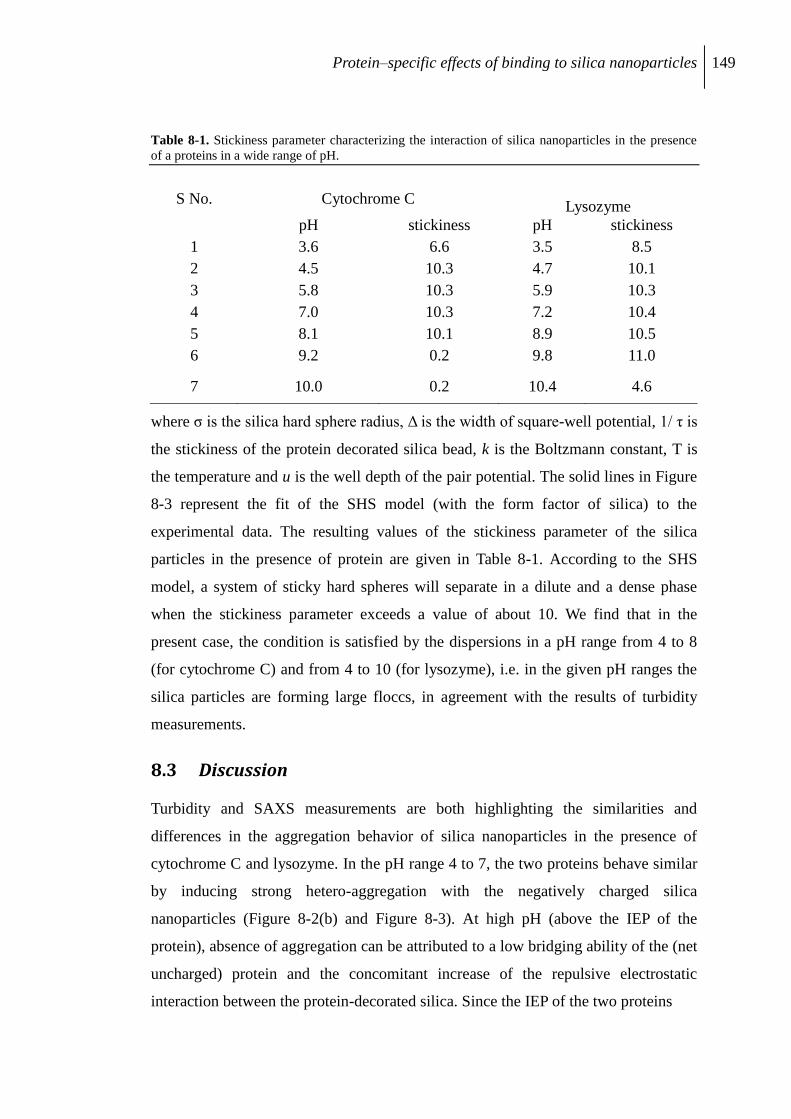
Protein–specific effects of binding to silica nanoparticles 149
Table 8-1. Stickiness parameter characterizing the interaction of silica nanoparticles in the presence
of a proteins in a wide range of pH.
S No. Cytochrome C Lysozyme
pH stickiness pH stickiness
1 3.6 6.6 3.5 8.5
2 4.5 10.3 4.7 10.1
3 5.8 10.3 5.9 10.3
4 7.0 10.3 7.2 10.4
5 8.1 10.1 8.9 10.5
6 9.2 0.2 9.8 11.0
7 10.0 0.2 10.4 4.6
where σ is the silica hard sphere radius, Δ is the width of square-well potential, 1/ τ is
the stickiness of the protein decorated silica bead, k is the Boltzmann constant, T is
the temperature and u is the well depth of the pair potential. The solid lines in Figure
8-3 represent the fit of the SHS model (with the form factor of silica) to the
experimental data. The resulting values of the stickiness parameter of the silica
particles in the presence of protein are given in Table 8-1. According to the SHS
model, a system of sticky hard spheres will separate in a dilute and a dense phase
when the stickiness parameter exceeds a value of about 10. We find that in the
present case, the condition is satisfied by the dispersions in a pH range from 4 to 8
(for cytochrome C) and from 4 to 10 (for lysozyme), i.e. in the given pH ranges the
silica particles are forming large floccs, in agreement with the results of turbidity
measurements.
8.3 Discussion
Turbidity and SAXS measurements are both highlighting the similarities and
differences in the aggregation behavior of silica nanoparticles in the presence of
cytochrome C and lysozyme. In the pH range 4 to 7, the two proteins behave similar
by inducing strong hetero-aggregation with the negatively charged silica
nanoparticles (Figure 8-2(b) and Figure 8-3). At high pH (above the IEP of the
protein), absence of aggregation can be attributed to a low bridging ability of the (net
uncharged) protein and the concomitant increase of the repulsive electrostatic
interaction between the protein-decorated silica. Since the IEP of the two proteins
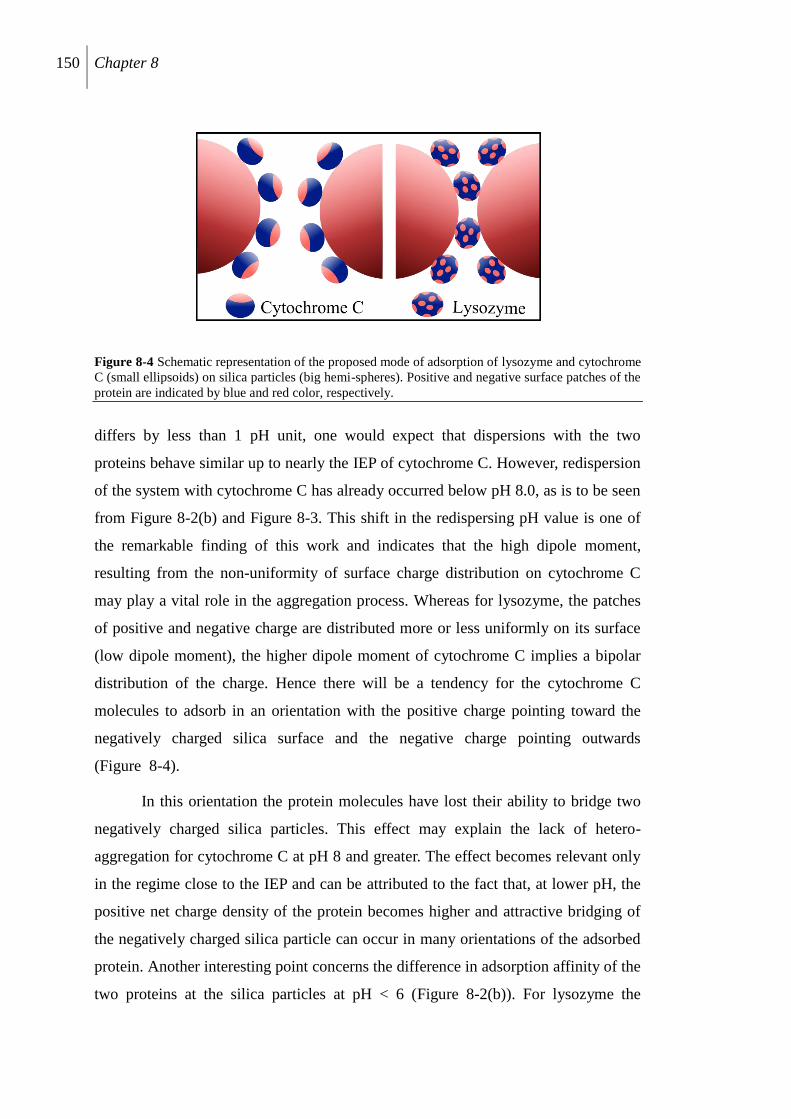
150 Chapter 8
Figure 8-4 Schematic representation of the proposed mode of adsorption of lysozyme and cytochrome
C (small ellipsoids) on silica particles (big hemi-spheres). Positive and negative surface patches of the
protein are indicated by blue and red color, respectively.
differs by less than 1 pH unit, one would expect that dispersions with the two
proteins behave similar up to nearly the IEP of cytochrome C. However, redispersion
of the system with cytochrome C has already occurred below pH 8.0, as is to be seen
from Figure 8-2(b) and Figure 8-3. This shift in the redispersing pH value is one of
the remarkable finding of this work and indicates that the high dipole moment,
resulting from the non-uniformity of surface charge distribution on cytochrome C
may play a vital role in the aggregation process. Whereas for lysozyme, the patches
of positive and negative charge are distributed more or less uniformly on its surface
(low dipole moment), the higher dipole moment of cytochrome C implies a bipolar
distribution of the charge. Hence there will be a tendency for the cytochrome C
molecules to adsorb in an orientation with the positive charge pointing toward the
negatively charged silica surface and the negative charge pointing outwards
(Figure 8-4).
In this orientation the protein molecules have lost their ability to bridge two
negatively charged silica particles. This effect may explain the lack of hetero-
aggregation for cytochrome C at pH 8 and greater. The effect becomes relevant only
in the regime close to the IEP and can be attributed to the fact that, at lower pH, the
positive net charge density of the protein becomes higher and attractive bridging of
the negatively charged silica particle can occur in many orientations of the adsorbed
protein. Another interesting point concerns the difference in adsorption affinity of the
two proteins at the silica particles at pH < 6 (Figure 8-2(b)). For lysozyme the
Protein–specific effects of binding to silica nanoparticles 151
fraction of adsorbed protein falls off steeply below pH 7 and no adsorption is
detectable below pH 3. This is strong evidence that electrostatic interactions between
oppositely charged particles represent the main driving force of adsorption. For
cytochrome C, on the other hand, a certain level of adsorption prevails down to the
lowest experimental pH, where the silica surface is uncharged or even positively
charged. Hence, non-electrostatic interactions must play a role in the adsorption of
cytochrome C to the silica nanoparticles in this acidic pH regime. However, the silica
aggregation is still governed by the electrostatic effects of the hetero-aggregating
system.
8.4 Conclusions
In summary, these findings indicate that the adsorption behavior of lysozyme on the
silica particles is dominated by electrostatic interactions while for cytochrome C non-
coulombic contributions (presumably hydrophobic interactions) also play a role. In
the hetero-aggregation of silica with proteins, it is the distribution of positively and
negatively charged patches over the surface of the protein that tunes the aggregation
behavior. Because of the bipolar distribution of surface charge at cytochrome C, this
molecule is less effective to induce hetero-aggregation with silica particles in the pH
regime approaching the IEP of the protein.
References
1 Farokhzad, O. C., Langer, R., ACS nano, 2009, 3, 16; Asuri, P., Bale, B. S. S.,
Karajanagi, S. S., Kane, R. S., Curr. Opin. Biotechnol., 2006, 17, 562.
2 Lynch, I., Dawson, K. A., Nanotoday, 2008, 3, 40; Klein, J., Proc. Natl. Acad. Sci.
USA, 2007, 104, 2029; Li, N., Zeng, S., He, L., Zhong, W., Anal. Chem., 2010, 82,
7460.
3 Parmar, A. S., Muschol, M., Biophys. J., 2009, 97, 590.
4 Morar, A. S., Olteanu, A., Young, G. B., Pielak, G. J., Protein Sci., 2001, 10, 2195.
5 Takashima, S., J. Non-cryst. Solids, 2002, 305,303.
152 Chapter 8
6 Posse, E., Vitals, A. L., de Arcuri, B. F., Farias, R. N., Morero, R. D., Biochim.
Biophys. Acta, 1990, 1024, 390.
7 http://bioinfo.weizmann.ac.il/dipol/
8 McNicholas, S., Potterton, E., Wilson, K. S., Noble, M. E. M., Acta Cryst., 2011,
D67, 386.
9 Davis, T. M., Snyder, M. A., Krohn, J. E., Tsapatsis, M., Chem.Mater., 2006, 18,
5814.
10 Bharti, B., Meissner, J., Gasser, U., Findenegg, G. H., Soft Matter, 2012, 8, 2573.
11 Bharti, B., Meissner, J., Findenegg, G. H., Langmuir, 2011, 27, 9823.
12 Muratov, A., Moussaid, A., Narayanan, T., Kats, E. I., J. Chem. Phys., 2009, 131,
054902; Parneix, C., Persello, J., Schweins, R., Cabane, B., Langmuir, 2009, 25,
4692.
13 Baxter, R. J., J. Chem. Phys., 1968, 49, 2770.; Regnaut, C., Ravey, J. C., J. Chem.
Phys., 1989, 91, 1211.
Permanent supracolloidal biparticle assembly Triggered by an electric field 153
9. Permanent supracolloidal biparticle assembly Triggered by an electric field‡‡
9.1 Introduction
The colloidal assembly is a major route to making materials with tailored
functionality resulting from the organization of the particles.1-3
While much attention
has been focused on colloidal crystals with potential photonics applications,4
permanently bound linear structures are a somewhat overlooked material with a
broad range of applications. For example, linear arrays of magnetic nanoparticles can
be used as flexible artificial flagellum,5
whereas linear chains of polystyrene
nanoparticles in polymer solution can cause interesting viscosity anomalies.6 In
addition, the linear arrays of colloidal particles could find applications in structures
for single-nanowire light emitting diodes,7
single electron transistors8
and in
microfluidics.9 Colloidal assembly can be achieved by internal fields (induced by
surfactants10
and by dynamic self-assembly11
) or by applying an external field (e.g.,
magnetic,12
or electric,13
or light14
). DEP induces a long-range dipolar interaction
between randomly distributed particles10,15,16
which forces them to align into long
chains along the direction of the applied field.17
This effect has been used for
one-dimensional18
or two-dimensional19
assembly, as well as for particle (or cell)
capturing.20
However, DEP-induced structures formed from a single type of particles
will disassemble by thermal motion as soon as the field is switched off, due to the
repulsive interaction caused by the surface charges.
We report here a facile, in-situ single-step, method of assembling permanent
chains of micron-sized particles by applying AC electric fields to dispersions
containing positive and negative particles. In contrast to biparticle assembly into
crystalline arrays,21,22
where the charge on the particles has to be tuned to low values
to avoid irreversible aggregation, we use highly charged particles of opposite charge,
‡‡ Modified from the article: Bharti, B., Findenegg, G. H., Velev, O. D., submitted
154 Chapter 9
with attractive interaction energies well in excess of the thermal energy, so that the
particles stick irreversibly when they come in contact. The hetero-aggregation
between positive and negative particles in water is governed by short range attractive
electrostatic interactions.23 , 24
The aggregation kinetics are commonly driven by
Brownian dynamics and result in disordered, fractal like clumps of particles. The
added deployment of an external electric field enables us to align the particles to
chains by the long-range induced polarization interaction. By combining the
hetero-aggregation with DEP we achieve the formation of linear structures of
unprecedented length and order. We characterize the permanent chaining tendency of
biparticle systems composed of particles of equal size as well as different sizes, we
propose an explanation for the pronounced effects of different particle size and
number ratio of the particles, and formulate assembly rules for tailoring the length of
permanent chains formed.
9.2 Methods
The polystyrene particles used in this study were washed with milli-Q water several
times in order to minimize the ionic strength of the dispersion and to avoid any trace
of surfactant. pH of the dispersions was adjusted to 3.0 using 0.01 M HCl. The
biparticle dispersion was prepared by mixing pre-sonicated aliquots of the
constituent single-particle dispersions in a vial; it was then rapidly transferred into
the hydrophobically sealed chamber (< 10s) and the electric field was employed
instantaneously. The particle dispersion was subjected to a square wave AC electric
field (40 V/mm, 10 kHz), using parallel electrodes. The assembly process of
colloidal particles was observed using an Olympus BX-61 microscope both in
bright-field and fluorescence mode. Several images of the linear chain structures
were taken for further analysis. The chain length of a linear aggregate was defined by
counting the number of constituent particles of a given chain. The chain length
distribution was determined by analyzing at least 5 microscope images for given
values of Dsmall/Dlarge and r.
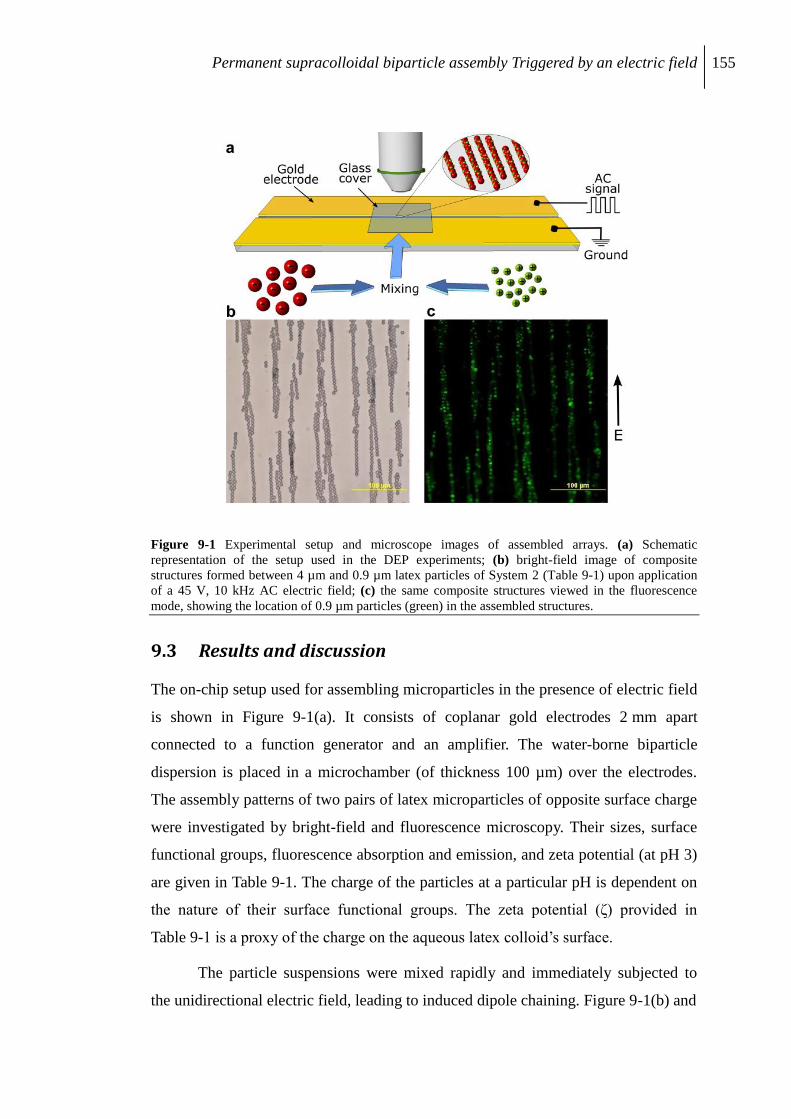
Permanent supracolloidal biparticle assembly Triggered by an electric field 155
Figure 9-1 Experimental setup and microscope images of assembled arrays. (a) Schematic
representation of the setup used in the DEP experiments; (b) bright-field image of composite
structures formed between 4 µm and 0.9 µm latex particles of System 2 (Table 9-1) upon application
of a 45 V, 10 kHz AC electric field; (c) the same composite structures viewed in the fluorescence
mode, showing the location of 0.9 µm particles (green) in the assembled structures.
9.3 Results and discussion
The on-chip setup used for assembling microparticles in the presence of electric field
is shown in Figure 9-1(a). It consists of coplanar gold electrodes 2 mm apart
connected to a function generator and an amplifier. The water-borne biparticle
dispersion is placed in a microchamber (of thickness 100 µm) over the electrodes.
The assembly patterns of two pairs of latex microparticles of opposite surface charge
were investigated by bright-field and fluorescence microscopy. Their sizes, surface
functional groups, fluorescence absorption and emission, and zeta potential (at pH 3)
are given in Table 9-1. The charge of the particles at a particular pH is dependent on
the nature of their surface functional groups. The zeta potential (ζ) provided in
Table 9-1 is a proxy of the charge on the aqueous latex colloid‟s surface.
The particle suspensions were mixed rapidly and immediately subjected to
the unidirectional electric field, leading to induced dipole chaining. Figure 9-1(b) and
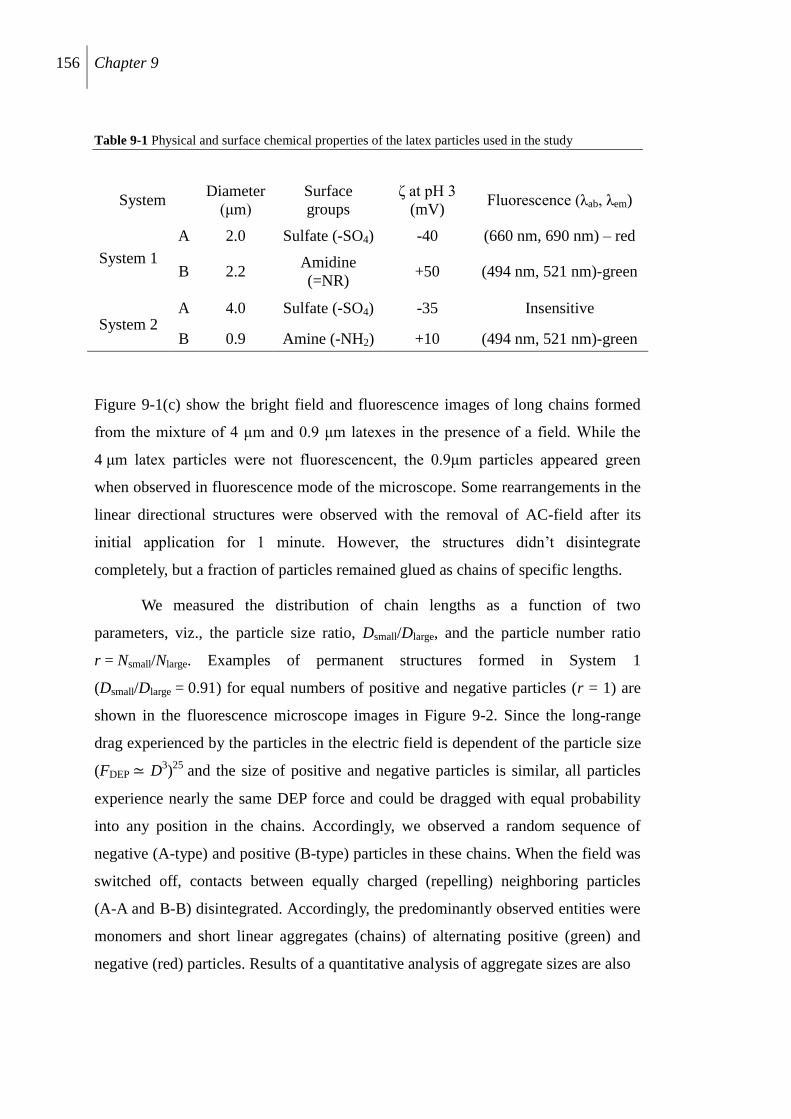
156 Chapter 9
Table 9-1 Physical and surface chemical properties of the latex particles used in the study
System Diameter
(μm)
Surface
groups
ζ at pH 3
(mV) Fluorescence (λab, λem)
System 1
A 2.0 Sulfate (-SO4) -40 (660 nm, 690 nm) – red
B 2.2 Amidine
(=NR) +50 (494 nm, 521 nm)-green
System 2 A 4.0 Sulfate (-SO4) -35 Insensitive
B 0.9 Amine (-NH2) +10 (494 nm, 521 nm)-green
Figure 9-1(c) show the bright field and fluorescence images of long chains formed
from the mixture of 4 μm and 0.9 μm latexes in the presence of a field. While the
4 μm latex particles were not fluorescencent, the 0.9μm particles appeared green
when observed in fluorescence mode of the microscope. Some rearrangements in the
linear directional structures were observed with the removal of AC-field after its
initial application for 1 minute. However, the structures didn‟t disintegrate
completely, but a fraction of particles remained glued as chains of specific lengths.
We measured the distribution of chain lengths as a function of two
parameters, viz., the particle size ratio, Dsmall/Dlarge, and the particle number ratio
r = Nsmall/Nlarge. Examples of permanent structures formed in System 1
(Dsmall/Dlarge = 0.91) for equal numbers of positive and negative particles (r = 1) are
shown in the fluorescence microscope images in Figure 9-2. Since the long-range
drag experienced by the particles in the electric field is dependent of the particle size
(FDEP ≃ D3)25
and the size of positive and negative particles is similar, all particles
experience nearly the same DEP force and could be dragged with equal probability
into any position in the chains. Accordingly, we observed a random sequence of
negative (A-type) and positive (B-type) particles in these chains. When the field was
switched off, contacts between equally charged (repelling) neighboring particles
(A-A and B-B) disintegrated. Accordingly, the predominantly observed entities were
monomers and short linear aggregates (chains) of alternating positive (green) and
negative (red) particles. Results of a quantitative analysis of aggregate sizes are also
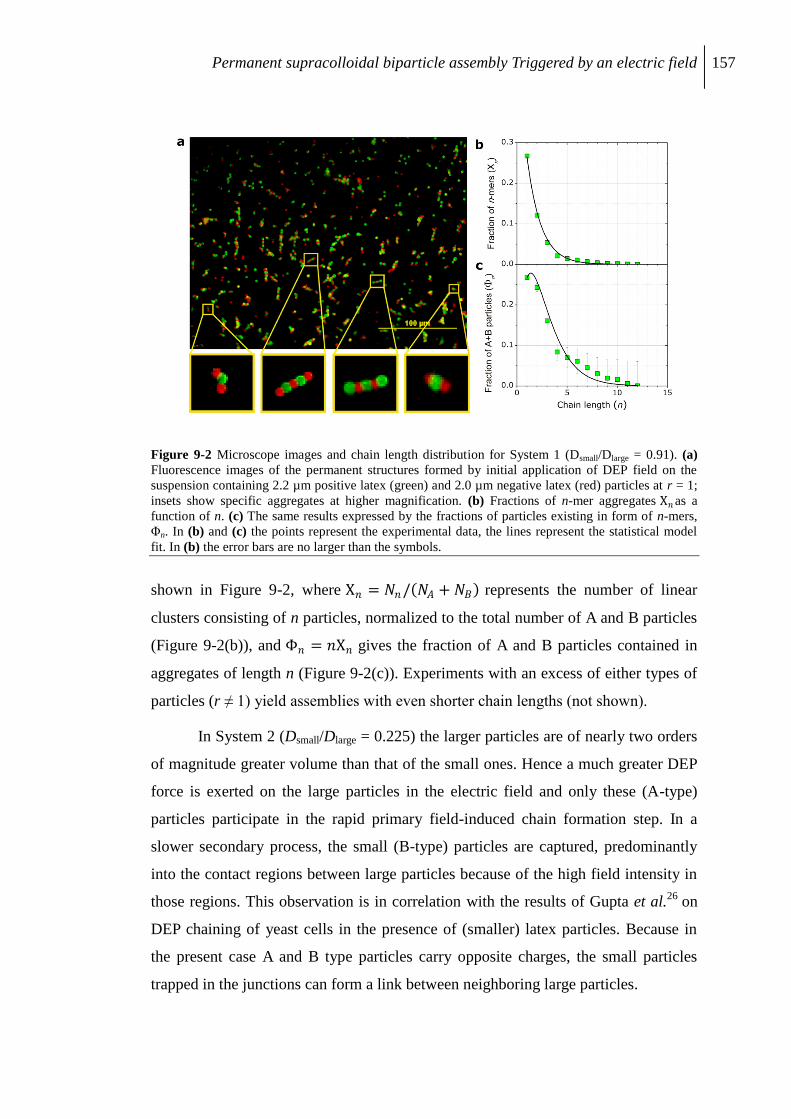
Permanent supracolloidal biparticle assembly Triggered by an electric field 157
Figure 9-2 Microscope images and chain length distribution for System 1 (Dsmall/Dlarge = 0.91). (a)
Fluorescence images of the permanent structures formed by initial application of DEP field on the
suspension containing 2.2 µm positive latex (green) and 2.0 µm negative latex (red) particles at r = 1;
insets show specific aggregates at higher magnification. (b) Fractions of n-mer aggregates X𝑛 as a
function of n. (c) The same results expressed by the fractions of particles existing in form of n-mers,
Φn. In (b) and (c) the points represent the experimental data, the lines represent the statistical model
fit. In (b) the error bars are no larger than the symbols.
shown in Figure 9-2, where X𝑛 = 𝑁𝑛 / 𝑁𝐴 + 𝑁𝐵 represents the number of linear
clusters consisting of n particles, normalized to the total number of A and B particles
(Figure 9-2(b)), and Φ𝑛 = 𝑛X𝑛 gives the fraction of A and B particles contained in
aggregates of length n (Figure 9-2(c)). Experiments with an excess of either types of
particles (r ≠ 1) yield assemblies with even shorter chain lengths (not shown).
In System 2 (Dsmall/Dlarge = 0.225) the larger particles are of nearly two orders
of magnitude greater volume than that of the small ones. Hence a much greater DEP
force is exerted on the large particles in the electric field and only these (A-type)
particles participate in the rapid primary field-induced chain formation step. In a
slower secondary process, the small (B-type) particles are captured, predominantly
into the contact regions between large particles because of the high field intensity in
those regions. This observation is in correlation with the results of Gupta et al.26
on
DEP chaining of yeast cells in the presence of (smaller) latex particles. Because in
the present case A and B type particles carry opposite charges, the small particles
trapped in the junctions can form a link between neighboring large particles.
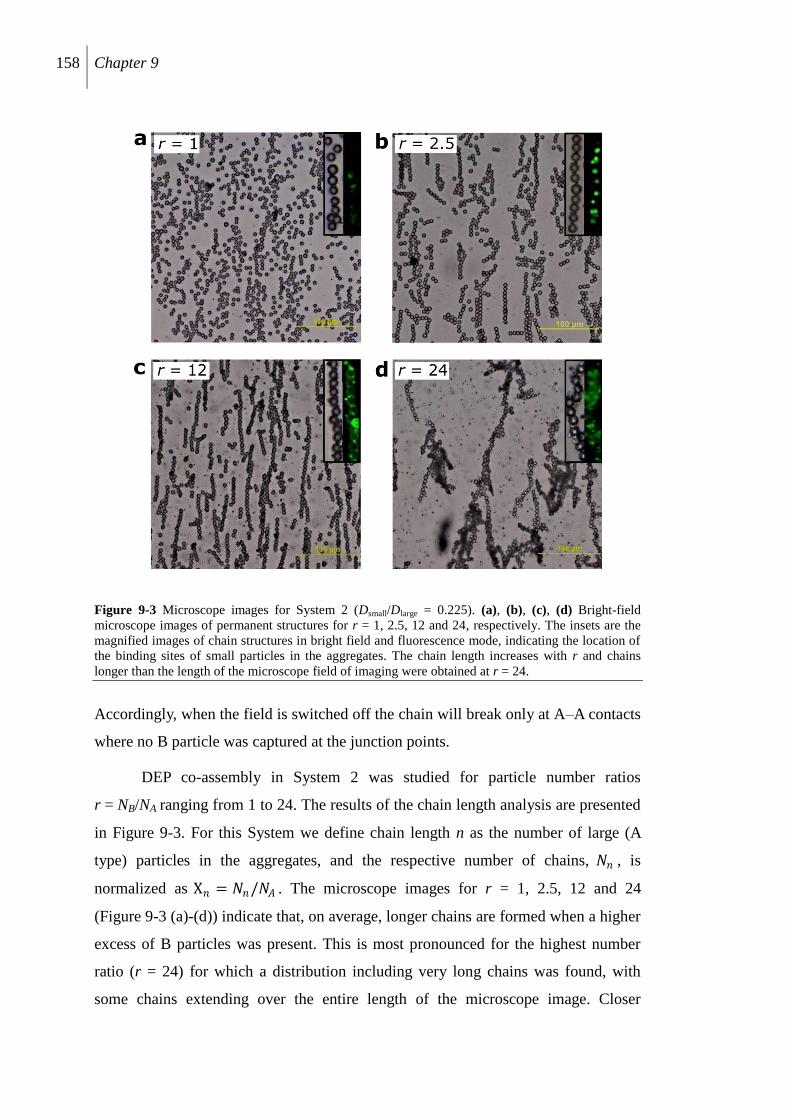
158 Chapter 9
Figure 9-3 Microscope images for System 2 (Dsmall/Dlarge = 0.225). (a), (b), (c), (d) Bright-field
microscope images of permanent structures for r = 1, 2.5, 12 and 24, respectively. The insets are the
magnified images of chain structures in bright field and fluorescence mode, indicating the location of
the binding sites of small particles in the aggregates. The chain length increases with r and chains
longer than the length of the microscope field of imaging were obtained at r = 24.
Accordingly, when the field is switched off the chain will break only at A–A contacts
where no B particle was captured at the junction points.
DEP co-assembly in System 2 was studied for particle number ratios
r = NB/NA ranging from 1 to 24. The results of the chain length analysis are presented
in Figure 9-3. For this System we define chain length n as the number of large (A
type) particles in the aggregates, and the respective number of chains, 𝑁𝑛 , is
normalized as X𝑛 = 𝑁𝑛/𝑁𝐴 . The microscope images for r = 1, 2.5, 12 and 24
(Figure 9-3 (a)-(d)) indicate that, on average, longer chains are formed when a higher
excess of B particles was present. This is most pronounced for the highest number
ratio (r = 24) for which a distribution including very long chains was found, with
some chains extending over the entire length of the microscope image. Closer
Permanent supracolloidal biparticle assembly Triggered by an electric field 159
inspection of the enlarged bright-field images (insets Figure 9-3) of individual
permanent chains and the respective fluorescence images (where only the small B
particles are visible) indicates that several small particles may be captured in the gap
between two large particles. The images also reveal that not all B particles are
captured but some remain free, especially in samples with a high excess of B
particles.
The trends in chain length distribution observed in the two systems can be
explained by a combinatorial probabilistic model. For system 1 (Dsmall/Dlarge = 0.91),
in the processes of random chain formation of A and B particles the probability of
finding a chain of n particles in alternating sequence of A and B depends on the
number fractions 𝑥 and 1 − 𝑥 and is proportional to 𝑥𝑚 1 − 𝑥 𝑛−𝑚 , where
m = (n ± 1)/2 (for n = 1,3,5 …) and m = n/2 (for n = 2, 4 …). For a stoichiometric
composition of A and B particles (𝑥 =1
2) this combinatorial mathematics approach
yields normalized numbers of n-mer chains as
X𝑛 ≡𝑁𝑛
𝑁𝐴 + 𝑁𝐵=
1
2
1
2
𝑛
(9.1)
and fraction of particles in n-mer chainsΦ𝑛 = 𝑛X𝑛 , is in fair agreement with the
experimental findings (Figure 9-2(b), (c)). When the particle number ratio r in
equation 9.1 was treated as an adjustable parameter, the best fit of the experimental
X𝑛 data was obtained for reff = 0.93. This deviation is within the error limits of the
image analysis. From equation 9.1 the mean chain length for this number ratio is
𝑛 = 2.3.
To model the assembly process and the resulting chain length distribution for
System 2 (Dsmall/Dlarge = 0.225), we evaluate the probability that a smaller particle of
opposite charge will be captured in the junction between the large particles and serve
as a “link” for the chain will depend on the ratio r. The model is based on the
assumption that each contact point in the chain of large particles (A) formed in the
primary DEP process serves as a binding site for the positively charged small
particles (B), which form the permanent bond between the two A particles. If S- S0
out of the S binding sites in the primary chain of A particles are occupied by B
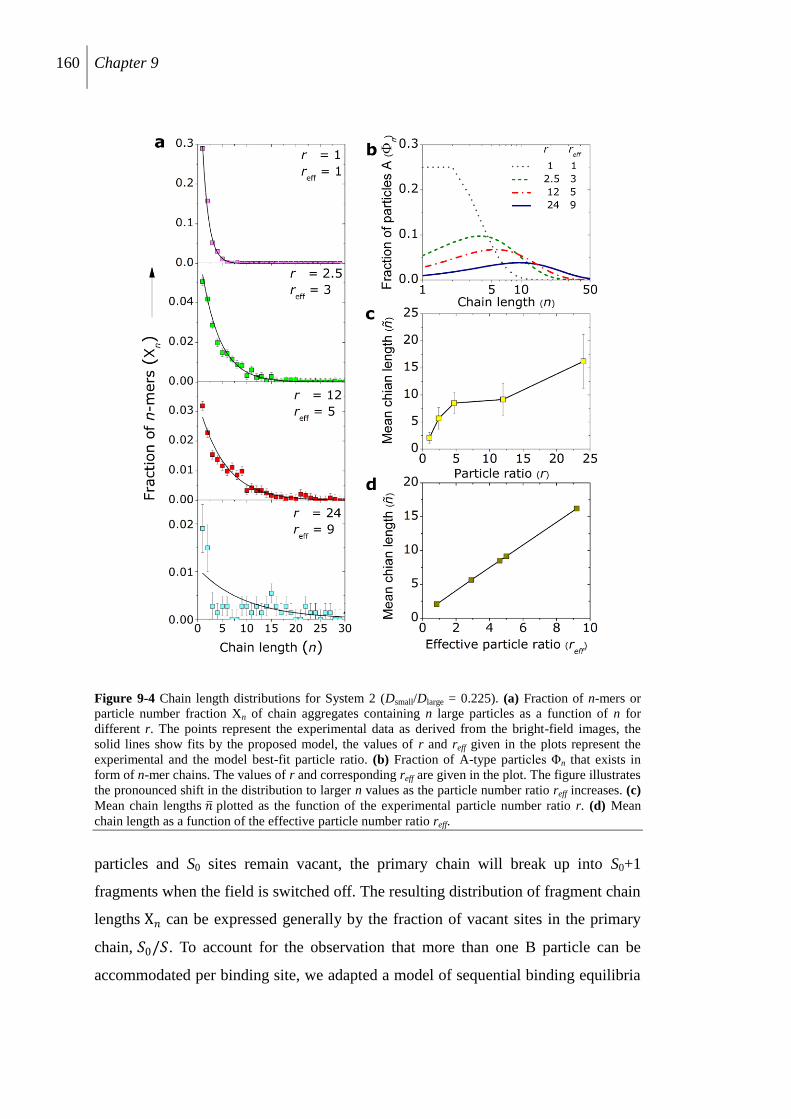
160 Chapter 9
Figure 9-4 Chain length distributions for System 2 (Dsmall/Dlarge = 0.225). (a) Fraction of n-mers or
particle number fraction Xn of chain aggregates containing n large particles as a function of n for
different r. The points represent the experimental data as derived from the bright-field images, the
solid lines show fits by the proposed model, the values of r and reff given in the plots represent the
experimental and the model best-fit particle ratio. (b) Fraction of A-type particles Φn that exists in
form of n-mer chains. The values of r and corresponding reff are given in the plot. The figure illustrates
the pronounced shift in the distribution to larger n values as the particle number ratio reff increases. (c)
Mean chain lengths 𝑛 plotted as the function of the experimental particle number ratio r. (d) Mean
chain length as a function of the effective particle number ratio reff.
particles and S0 sites remain vacant, the primary chain will break up into S0+1
fragments when the field is switched off. The resulting distribution of fragment chain
lengths X𝑛 can be expressed generally by the fraction of vacant sites in the primary
chain, 𝑆0/𝑆. To account for the observation that more than one B particle can be
accommodated per binding site, we adapted a model of sequential binding equilibria
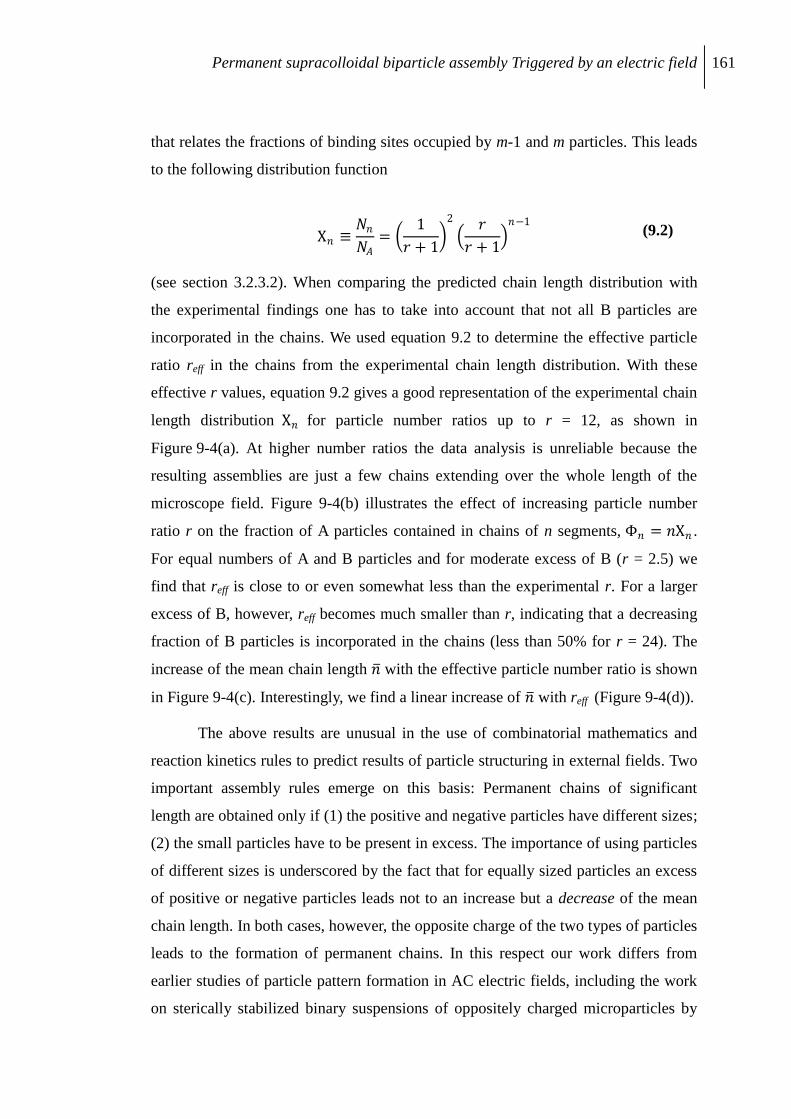
Permanent supracolloidal biparticle assembly Triggered by an electric field 161
that relates the fractions of binding sites occupied by m-1 and m particles. This leads
to the following distribution function
X𝑛 ≡𝑁𝑛
𝑁𝐴=
1
𝑟 + 1
2
𝑟
𝑟 + 1
𝑛−1
(9.2)
(see section 3.2.3.2). When comparing the predicted chain length distribution with
the experimental findings one has to take into account that not all B particles are
incorporated in the chains. We used equation 9.2 to determine the effective particle
ratio reff in the chains from the experimental chain length distribution. With these
effective r values, equation 9.2 gives a good representation of the experimental chain
length distribution X𝑛 for particle number ratios up to r = 12, as shown in
Figure 9-4(a). At higher number ratios the data analysis is unreliable because the
resulting assemblies are just a few chains extending over the whole length of the
microscope field. Figure 9-4(b) illustrates the effect of increasing particle number
ratio r on the fraction of A particles contained in chains of n segments, Φ𝑛 = 𝑛X𝑛 .
For equal numbers of A and B particles and for moderate excess of B (r = 2.5) we
find that reff is close to or even somewhat less than the experimental r. For a larger
excess of B, however, reff becomes much smaller than r, indicating that a decreasing
fraction of B particles is incorporated in the chains (less than 50% for r = 24). The
increase of the mean chain length 𝑛 with the effective particle number ratio is shown
in Figure 9-4(c). Interestingly, we find a linear increase of 𝑛 with reff (Figure 9-4(d)).
The above results are unusual in the use of combinatorial mathematics and
reaction kinetics rules to predict results of particle structuring in external fields. Two
important assembly rules emerge on this basis: Permanent chains of significant
length are obtained only if (1) the positive and negative particles have different sizes;
(2) the small particles have to be present in excess. The importance of using particles
of different sizes is underscored by the fact that for equally sized particles an excess
of positive or negative particles leads not to an increase but a decrease of the mean
chain length. In both cases, however, the opposite charge of the two types of particles
leads to the formation of permanent chains. In this respect our work differs from
earlier studies of particle pattern formation in AC electric fields, including the work
on sterically stabilized binary suspensions of oppositely charged microparticles by
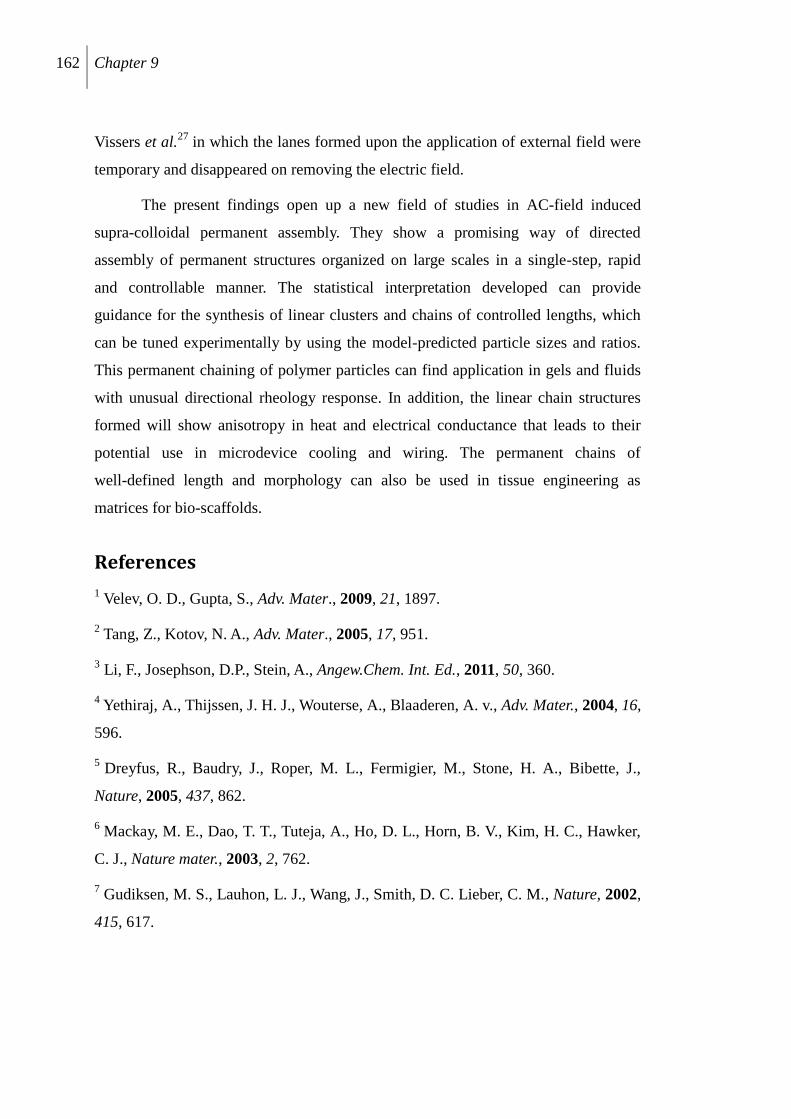
162 Chapter 9
Vissers et al.27
in which the lanes formed upon the application of external field were
temporary and disappeared on removing the electric field.
The present findings open up a new field of studies in AC-field induced
supra-colloidal permanent assembly. They show a promising way of directed
assembly of permanent structures organized on large scales in a single-step, rapid
and controllable manner. The statistical interpretation developed can provide
guidance for the synthesis of linear clusters and chains of controlled lengths, which
can be tuned experimentally by using the model-predicted particle sizes and ratios.
This permanent chaining of polymer particles can find application in gels and fluids
with unusual directional rheology response. In addition, the linear chain structures
formed will show anisotropy in heat and electrical conductance that leads to their
potential use in microdevice cooling and wiring. The permanent chains of
well-defined length and morphology can also be used in tissue engineering as
matrices for bio-scaffolds.
References
1 Velev, O. D., Gupta, S., Adv. Mater., 2009, 21, 1897.
2 Tang, Z., Kotov, N. A., Adv. Mater., 2005, 17, 951.
3 Li, F., Josephson, D.P., Stein, A., Angew.Chem. Int. Ed., 2011, 50, 360.
4 Yethiraj, A., Thijssen, J. H. J., Wouterse, A., Blaaderen, A. v., Adv. Mater., 2004, 16,
596.
5 Dreyfus, R., Baudry, J., Roper, M. L., Fermigier, M., Stone, H. A., Bibette, J.,
Nature, 2005, 437, 862.
6 Mackay, M. E., Dao, T. T., Tuteja, A., Ho, D. L., Horn, B. V., Kim, H. C., Hawker,
C. J., Nature mater., 2003, 2, 762.
7 Gudiksen, M. S., Lauhon, L. J., Wang, J., Smith, D. C. Lieber, C. M., Nature, 2002,
415, 617.
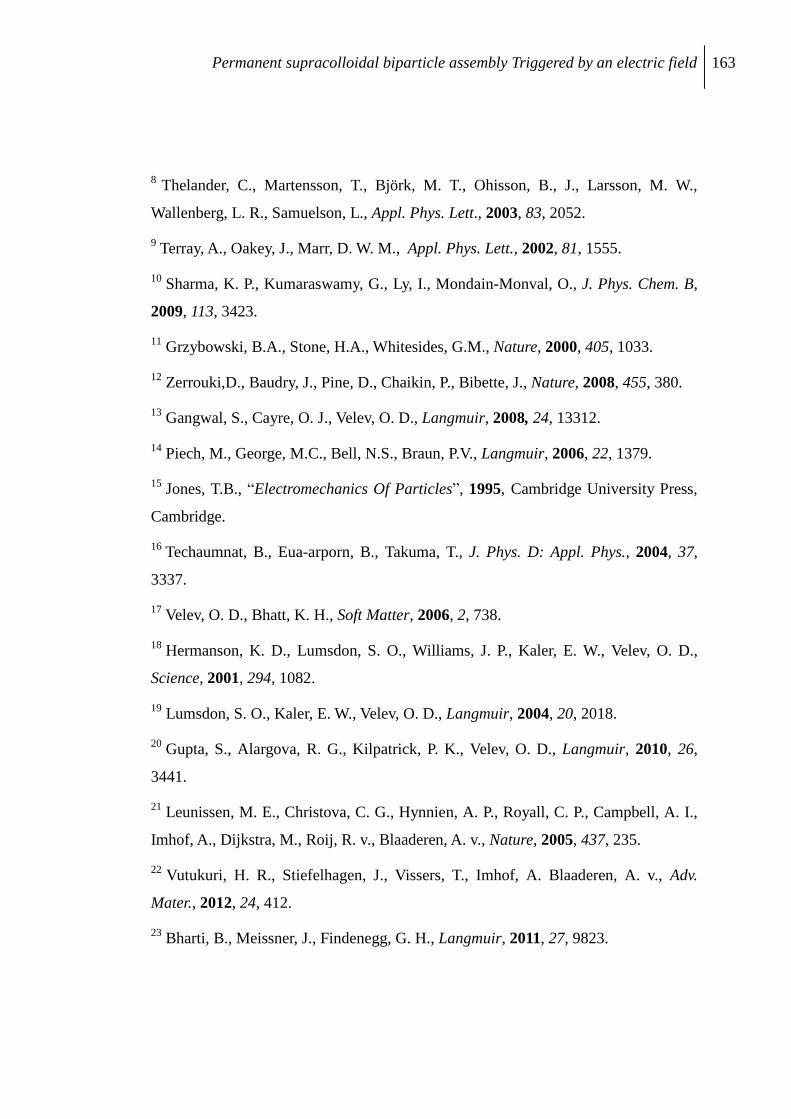
Permanent supracolloidal biparticle assembly Triggered by an electric field 163
8 Thelander, C., Martensson, T., Björk, M. T., Ohisson, B., J., Larsson, M. W.,
Wallenberg, L. R., Samuelson, L., Appl. Phys. Lett., 2003, 83, 2052.
9 Terray, A., Oakey, J., Marr, D. W. M., Appl. Phys. Lett., 2002, 81, 1555.
10 Sharma, K. P., Kumaraswamy, G., Ly, I., Mondain-Monval, O., J. Phys. Chem. B,
2009, 113, 3423.
11 Grzybowski, B.A., Stone, H.A., Whitesides, G.M., Nature, 2000, 405, 1033.
12 Zerrouki,D., Baudry, J., Pine, D., Chaikin, P., Bibette, J., Nature, 2008, 455, 380.
13 Gangwal, S., Cayre, O. J., Velev, O. D., Langmuir, 2008, 24, 13312.
14 Piech, M., George, M.C., Bell, N.S., Braun, P.V., Langmuir, 2006, 22, 1379.
15 Jones, T.B., “Electromechanics Of Particles”, 1995, Cambridge University Press,
Cambridge.
16 Techaumnat, B., Eua-arporn, B., Takuma, T., J. Phys. D: Appl. Phys., 2004, 37,
3337.
17 Velev, O. D., Bhatt, K. H., Soft Matter, 2006, 2, 738.
18 Hermanson, K. D., Lumsdon, S. O., Williams, J. P., Kaler, E. W., Velev, O. D.,
Science, 2001, 294, 1082.
19 Lumsdon, S. O., Kaler, E. W., Velev, O. D., Langmuir, 2004, 20, 2018.
20 Gupta, S., Alargova, R. G., Kilpatrick, P. K., Velev, O. D., Langmuir, 2010, 26,
3441.
21 Leunissen, M. E., Christova, C. G., Hynnien, A. P., Royall, C. P., Campbell, A. I.,
Imhof, A., Dijkstra, M., Roij, R. v., Blaaderen, A. v., Nature, 2005, 437, 235.
22 Vutukuri, H. R., Stiefelhagen, J., Vissers, T., Imhof, A. Blaaderen, A. v., Adv.
Mater., 2012, 24, 412.
23 Bharti, B., Meissner, J., Findenegg, G. H., Langmuir, 2011, 27, 9823.
164 Chapter 9
24 Lin, W., Kobayashi, M., Skarba, M., Changdao, M., Galleto, P., Borkovec, M.,
Langmuir, 2006, 22, 1038.
25 Stoy, R, D., J. Electrostatics, 1994, 33, 385.
26 Gupta, S., Alargova, R. G., Kilpatrick, P. K., Velev, O. D., Soft Matter, 2008, 4,
726.
27 Vissers, T., Blaaderen, A. v., Imhof, A., Phys. Rev. Lett., 2011, 206, 228303.
Summary and Outlook 165
10. Summary and Outlook
The main goal of this PhD project was to get a better understanding of adsorption
and aggregation processes occurring in colloidal dispersions in the presence of soft
matter. Specifically, the adsorption of nonionic surfactants and of globular proteins
onto hydrophilic silica nanoparticles was studied. For the proteins studied in the
present work their adsorption onto silica nanoparticles caused hetero-flocculation in
a wide pH range, which was also studied by a combination of different experimental
techniques. In addition, the aggregation of microparticles was investigated with the
aim to produce permanent aggregate structure on a supracolloidal length scale. In this
work, we not only studied the colloidal systems by various experimental techniques,
but also accounted for the resulting structures on the basis of different theoretical
models. This section of the thesis summarizes the outcome of the studied topics and
their impacts on the field of colloid science.
10.1 Interaction between hydrophilic silica and a nonionic
surfactant
Adsorption of surfactant onto silica surfaces is an important process that plays a vital
role in the dispersion stability and governs its other physical properties. We studied
the factors affecting adsorption of the nonionic surfactant C12E5 onto silica
nanoparticles and in the pores of mesoporous SBA-15 silica. From our adsorption
isotherm studies we proved that the limiting surface excess of surfactant is a function
of surface curvature and the maximum amount which can be loaded per unit area of
particle surface decreases by a factor 3 when the particle size was reduced from
42 nm to 13 nm. Another important factor that influenced the adsorption
phenomenon was the surface chemistry of the silica. We altered the surface
chemistry of the silica by addition of the basic amino acid lysine. Lysine showed
preferential adsorption over C12E5 molecules and was able to displace the pre-
adsorbed C12E5 molecules from silica surface. The displacement of surfactant from
silica nanoparticles was also studied by small-angle neutron scattering (SANS) in
silica contrast match conditions. SANS profiles in the absence of surface modifier
were fitted by micelles-decorated bead model indicating that the surfactant is
166 Chapter 10
adsorbed on the surface of silica in the form of discrete surface aggregates. Gradual
addition of lysine to the dispersion leads to a decrease in the surface concentration of
surfactant aggregates. The SANS study showed that the surfactant desorbed from the
silica surface formed wormlike micelles in the bulk and lead to a phase separation of
the water-C12E5 system at elevated temperatures.
The effect of surface modifier on the adsorption of C12E5 on silica was also
studied in the nanopores of SBA-15 silica. A similar lysine-induced
surfactant-desorption effect was observed as on the silica nanoparticles. Here again
the transitions occurring in the surfactant aggregate morphology at a fixed C12E5
loading with increasing lysine concentration were traced by SANS. By analyzing the
SANS profile on the basis of Treubner-Strey model, we established that in the
absence of lysine, C12E5 forms discrete bilayer patches at the pore walls, which then
transforms to elongated wormlike structures still adhering to the pore walls at
intermediate lysine concentrations. A further addition of surface modifier then results
in a complete desorption of the surfactant from the pores, which then forms
cylindrical micelles in the exterior of SBA-15 pores as in the case of silica
nanoparticles.
By studying the adsorption of surfactant onto nanoparticles and in the
nanopores, we affirm that there are two important factors governing the aggregative
adsorption of these molecules: (1) surface curvature and (2) surface chemistry.
Surface curvature can be altered by changing the size of adsorbent particle and
surface chemistry can be tempered by the addition of some more strongly adsorbing
molecules. These established facts can play an important role in the formulation of
dispersions for various biological and industrial applications. On the other hand, our
study leaves open questions that need further attention, such as What is the influence
of increasing binding strength of surfactant head group (CiEj) to the silica surface on
the desorption effect of lysine? What other modifiers are capable of delivering a
similar effect?
10.2 Protein-nanoparticle interactions
The interaction of 20 nm silica nanoparticles with two globular proteins, viz.
lysozyme and cytochrome C, was studied in an extensive way. In the case of
Summary and Outlook 167
lysozyme, our systematic study of adsorption isotherm proved that the maximum
amount of protein per unit area is highly pH responsive. It increases steeply with
increasing pH indicating that the electrostatic interaction represents the main driving
force. To prove this conjuncture the ionic strength of the dispersion was increased by
adding NaCl. Presence of salt in dispersion screens the electrostatic interactions
between the constituent charged species, i.e. silica nanoparticles and protein
molecules, resulting in a decrease of the adsorbed protein amount with the increasing
salinity. This effect of salinity is taken as evidence for the dominance of charge-
charge interactions between protein and silica particles. The binding of a positive
protein to a negatively charged silica nanoparticle dispersion resulted in the
formation of protein-nanoparticle heteroaggregates. The protein-particle composite
showed striking pH responsiveness. The aggregates exist in a pH range from 4 to 10
and completely dissolved both at pH < 4 and at pH > 10. At pH < 4 the silica is only
weakly charged, leading to the lack of protein adsorption and hence the lack of silica
aggregation. On the other hand, at pH > 10, lysozyme is feebly charged (isoelectric
point (IEP) = 11.0) and is unable to glue the negatively charged silica particles
together. A pH-dependent study of aggregate morphology by SAXS and analytic
centrifugation proved that, at pH 4-6 compact aggregates are formed whereas in the
pH range 6-10 the aggregates were loosely packed and of fractal dimension. In
addition, the structure factors obtained by the SAXS profiles could be represented by
the Sticky-hard-sphere model. This model characterizes the system in terms of a
short-range attractive potential between the silica particles. High values of the
stickiness parameter in the intermediate pH regime give direct evidence of the role of
the protein as „glue‟ between the negatively charged silica particles.
The protein-induced aggregation of silica nanoparticles observed with
lysozyme was compared with corresponding effects with cytochrome C. These two
proteins are similar in terms of their sizes, IEP and net surface charge; but differ in
their net dipole moments. Aggregation of 22 nm silica particles induced by
cytochrome C was observed in the range from pH 4 to 8, whereas the aggregating
regime for lysozyme was pH 4 to 10. For cytochrome C, the shift in the pH values
where silica aggregates re-dissolve was attributed to the two factors (1) lower IEP of
cytochrome C, and (2) non-uniform distribution of surface charge.
168 Chapter 10
The Thesis addressed several of the fundamental questions about the protein
adsorption and induced aggregation with silica nanoparticles. However, some
important open questions that arise from the performed work are: What is the
morphology and the extent of denaturation of the adsorbed protein? In pH titrations,
when a protein desorbs from silica nanoparticle by the change in pH, does it fully
regains its native conformations? Can the surface chemistry of the silica particles be
altered, such that the tendency of protein adsorption remains high with no
aggregation of nanoparticles?
10.3 Supra-colloidal permanent assembly of microparticles
The heteroaggregation of protein and silica nanoparticles was found to be almost
completely random, only a slight alteration in the aggregate morphology was
possible by changing the pH. In order to achieve highly ordered system,
dielectrophoresis (DEP) was used as an external force directing the aggregate
morphology. DEP has been widely used for assembling dielectric particles into linear
chains and 2D arrays. However, the assembly formed is temporary and exists only as
long as the field is present. The ordered structure completely disassembles, when the
field is switched off. In the present work micron sized latex particles of opposite
charges were mixed and an immediate application of AC electric field to the
biparticle dispersion forces the particles to arrange into linear chains. Since the
heteroaggregation of the oppositely charged particles is irreversible, the chains
assembled retain their linear structure even after removal of external AC-field. We
developed a new model for predicting the distribution of chain lengths of the
permanent chains at a given positive-to-negative particle number ratio and size ratio.
The model gives an excellent account for the obtained experimental chain lengths.
Based on the proposed statistical model and its experimental proof, we proposed the
assembly rules for harvesting such chain structures: (1) Long chains can be
assembled only if the ratio of the sizes (Dsmall/Dlarge) is less than 0.25; (2) Chain
length increases with the increase in particle number ratio (Nsmall/Nlarge > 1).
The method adopted here for making permanent structures is a novel
approach and was only used to get permanent chains. Such assembled system can
find their applications in field responsive gels and dispersions with impeccable
Summary and Outlook 169
rheological properties. The study is the first of its kind and generates several
questions, which should be addressed in further studies. Some of them are: Is it
possible to fabricate 2D and 3D structures by using biparticle dispersion? How to
achieve the DEP directed biparticle assembly at nanoscale? What is the effect of
surface charge density of particles on the assembled structures?


Appendix 171
A. Appendix
A.1 Materials
C12E5 (Sigma-Aldrich, ≥ 98%), 2,6-diaminohexanoic acid (lysine) (Fluka,
purity > 98%), tetraethyl orthosilicate (TEOS) (ABCR GmbH, purity > 98%), D2O
(Euriso-top, 99.9% ), ninhydrin reagent (Sigma, 2% solution) Lysozyme from
chicken egg white (Sigma-Aldrich, 69000 units/mg protein, lot no. 019k1320,
purity > 90%), cytochrome C from equine heart (Sigma-Aldrich, lot no. 070M7031v,
purity ≥ 95%), organic buffers N,N-Bis(2-hydroxyethyl) glycine (BICINE) (Sigma-
Aldrich, purity > 99%) and 2-(N-morpholino)-ethanesulfonic acid (MES) (Sigma-
Aldrich, purity > 99%). Pierce® bicinchoninic acid (BCA) purchased from Pierce
Biotechnology, Inc. (Rockford, IL) were used without further purification.
Polystyrene microspheres of sizes 0.90, 4.0 2.0 and 2.2 μm were supplied by
invitrogen. Water was purified by a Milli-Q water from MilliPore QPAK®(2) unit.
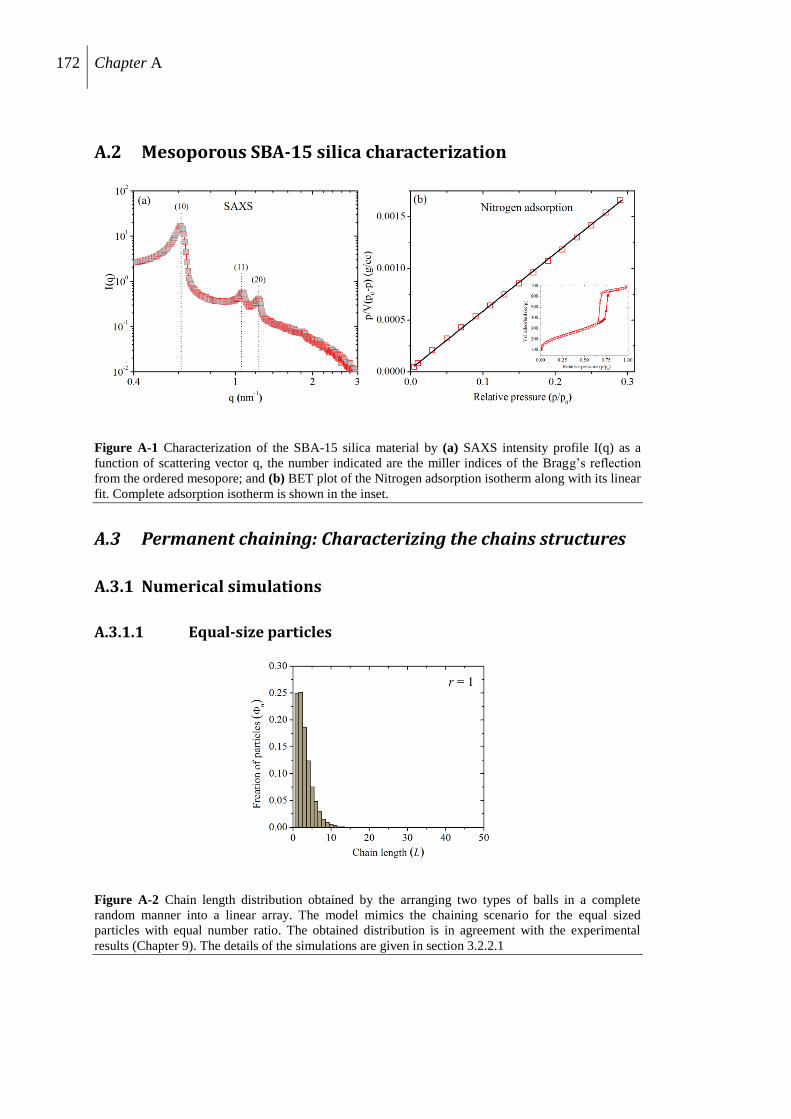
172 Chapter A
A.2 Mesoporous SBA-15 silica characterization
Figure A-1 Characterization of the SBA-15 silica material by (a) SAXS intensity profile I(q) as a
function of scattering vector q, the number indicated are the miller indices of the Bragg‟s reflection
from the ordered mesopore; and (b) BET plot of the Nitrogen adsorption isotherm along with its linear
fit. Complete adsorption isotherm is shown in the inset.
A.3 Permanent chaining: Characterizing the chains structures
A.3.1 Numerical simulations
A.3.1.1 Equal-size particles
Figure A-2 Chain length distribution obtained by the arranging two types of balls in a complete
random manner into a linear array. The model mimics the chaining scenario for the equal sized
particles with equal number ratio. The obtained distribution is in agreement with the experimental
results (Chapter 9). The details of the simulations are given in section 3.2.2.1
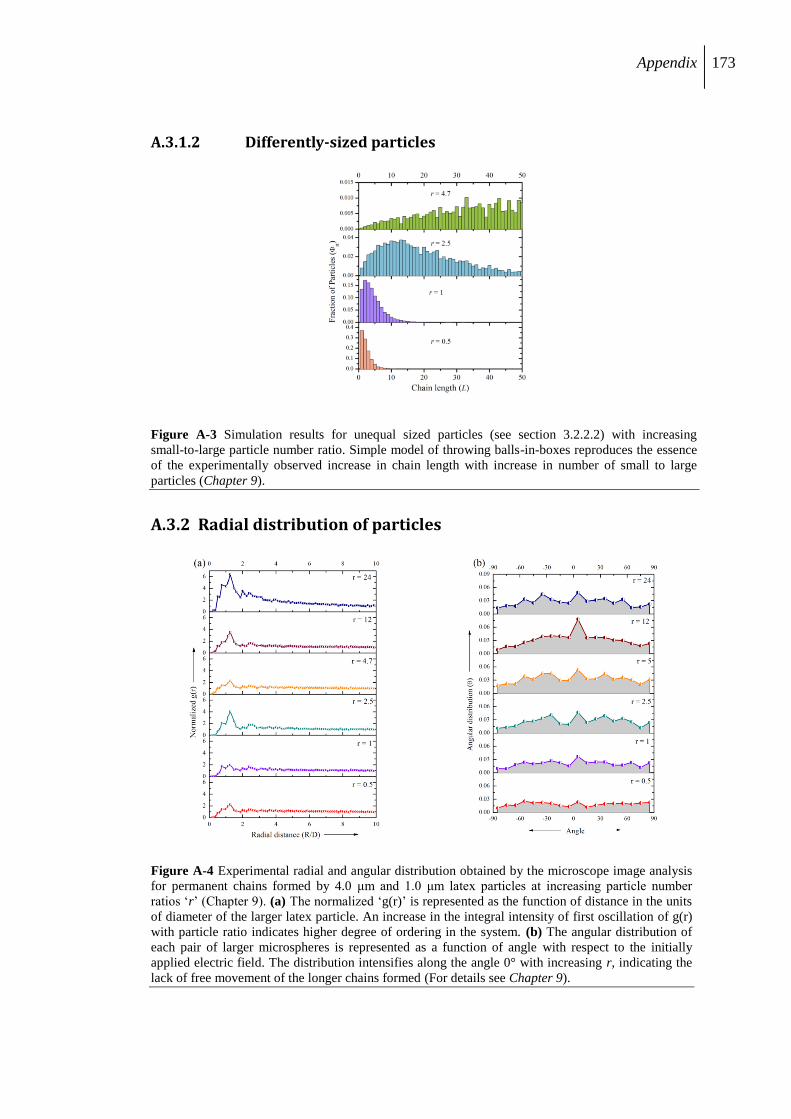
Appendix 173
A.3.1.2 Differently-sized particles
Figure A-3 Simulation results for unequal sized particles (see section 3.2.2.2) with increasing
small-to-large particle number ratio. Simple model of throwing balls-in-boxes reproduces the essence
of the experimentally observed increase in chain length with increase in number of small to large
particles (Chapter 9).
A.3.2 Radial distribution of particles
Figure A-4 Experimental radial and angular distribution obtained by the microscope image analysis
for permanent chains formed by 4.0 μm and 1.0 μm latex particles at increasing particle number
ratios „r‟ (Chapter 9). (a) The normalized „g(r)‟ is represented as the function of distance in the units
of diameter of the larger latex particle. An increase in the integral intensity of first oscillation of g(r)
with particle ratio indicates higher degree of ordering in the system. (b) The angular distribution of
each pair of larger microspheres is represented as a function of angle with respect to the initially
applied electric field. The distribution intensifies along the angle 0° with increasing r, indicating the
lack of free movement of the longer chains formed (For details see Chapter 9).