Permeate Flux in Ultrafiltration Processes—Understandings ...
Upload
independentCategory
view
1download
0
Water Research 36 (2002) 3834–3848
Probing reactivity of dissolved organic matter for disinfectionby-product formation using XAD-8 resin adsorption and
ultrafiltration fractionation
Mehmet Kitisa, Tanju Karanfila,*, Andrew Wigtonb, James E. Kilduffb
aDepartment of Environmental Engineering and Science, Clemson University, 342 Computer Court, Anderson, SC 29625, USAbDepartment of Environmental and Energy Engineering, Rensselaer Polytechnic Institute, 110 8th Street, Troy, NY 12180, USA
Received 1 May 2001; received in revised form 1 January 2002
Abstract
The disinfection by-product (DBP) reactivity (yield and speciation upon reaction with chlorine) of dissolved organic
matter (DOM) isolated from two surface waters was investigated. The source waters, each having significantly different
specific ultraviolet absorbance (SUVA254), molecular weight (MW) distribution and polarity, were fractionated using
XAD-8 resin adsorption and ultrafiltration (UF), with good DOM mass balance closures (based on dissolved organic
carbon). It was found that such fractionation preserved both the SUVA and the reactivity of the source waters, as
demonstrated by statistically similar DBP formation and speciation from chlorinated source water and source waters
reconstituted from XAD-8 or UF fractions. In addition, there was no evidence of synergistic effects among DOM
components when reacting with chlorine.
Consistent trends between DBP yields and MW were not found. Hydrophobic fractions of DOM (isolated by XAD-
8) were the most reactive DOM components; however, hydrophilic components also showed appreciable DBP yields,
contributing up to 50% of total DBP formation. In contrast, strong and unique correlations were observed between the
SUVA of individual fractions and their trihalomethane (THM) and haloacetic acid (HAA9) yields, confirming that the
aromaticity of DOM components is more directly related to reactivity than other physicochemical properties. The
finding of a single correlation independent of the fractionation process employed is notable because XAD-8 adsorption
and UF fractionate DOM by significantly different mechanisms. These results confirm that SUVA is a distributed
parameter that reflects DOM heterogeneity. Therefore, the SUVA distribution within natural water represents an
important property that can be used as a reliable predictor of DBP formation. Finally, bromine appears to be more
effectively incorporated into low UV-absorbing (i.e., low SUVA), low MW and hydrophilic DOM fractions. r 2002
Elsevier Science Ltd. All rights reserved.
Keywords: Natural organic matter (NOM); Chlorine; Disinfection by-products (DBPs); Reactivity; XAD-8 resin; Ultrafiltration;
Specific ultraviolet absorbance (SUVA)
1. Introduction
Natural organic matter (NOM), present nearly in all
surface and groundwaters, can undergo a variety of
reactions in natural and engineered environmental
systems. The reactions that occur between NOM and
disinfectants/oxidants (e.g., chlorine) used in drinking
water treatment produce by-products, generally known
as disinfection by-products (DBPs). Some of these DBPs
are classified as suspected carcinogens. The dissolved
and colloidal fractions of NOM (i.e., DOM, those
components passing through a 0.45-mm filter) serve as
*Corresponding author. Tel.: +1-864-656-1005; fax: +1-
864-656-0672.
E-mail address: [email protected] (T. Karanfil).
0043-1354/02/$ - see front matter r 2002 Elsevier Science Ltd. All rights reserved.
PII: S 0 0 4 3 - 1 3 5 4 ( 0 2 ) 0 0 0 9 4 - 5

major precursors in these reactions. DOM is a hetero-
geneous mixture of various organic molecules originat-
ing from aquagenic (e.g., biota in a water body)
and pedogenic (e.g., soil and terrestrial vegetation)
sources. As a result, its isolation and fractionation into
more homogenous components has been the most
common approach to facilitate the interpretation of
results from DOM characterization and reactivity
studies. A number of methods, ranging from sorption
by synthetic resins to separation (based on size) by
membranes, have been developed for DOM isolation
and/or fractionation [1–8].
Resin adsorption chromatography (RAC), employing
various synthetic resins, has been used to isolate and
fractionate DOM from natural waters with varying
degrees of success [1,5,6,9,10,11]. This chromatographic
separation method concentrates and isolates DOM
components into operationally defined fractions depend-
ing on their affinities to different resins and their back-
elution efficiencies. DOM fractions obtained by RAC
were found to exhibit a wide range of DBP formation
upon reaction with chlorine [10,12,13–17]. In general,
the humic fractions (i.e., ‘‘hydrophobic acids’’ isolated
by adsorption to XAD-8, a neutral methylmethacrylate
resin) have been found to contribute significantly to
DBP formation. However, hydrophilic fractions (i.e.,
those not retained on XAD-8 resin) have also been
shown to produce appreciable amounts of DBPs in some
waters [10,14–16,18].
Ultrafiltration (UF) has been used to fractionate
DOM into different molecular weight (MW) fractions
[2,3,7,8,19,20]. UF is a pressure-driven membrane
process in which dissolved solutes are separated accord-
ing to their molecular sizes. UF membranes are typically
characterized by molecular weight cut-off (MWC)
values established by the manufacturers, who calibrate
membranes by measuring membrane rejection of macro-
molecules having known molecular weights. However,
these macromolecules often have structural character-
istics significantly different than DOM. As a result, it is
not possible to directly relate the molecular weight of
DOM fractions to manufacturer-specified MWC values.
In addition, DOM concentration, ionic strength, and pH
affect molecular configuration [21], and thus the
rejection of DOM components by a single UF mem-
brane. Therefore, as in the RAC method, DOM
fractions obtained from UF depend on operational
conditions. A wide range of DBP formation upon
chlorination has been reported for various MW
fractions obtained by UF [2,3,16,19,22]. While no
significant trend between DOM MW and DBP forma-
tion is evident from these studies, MW fractionso5 kDa
generally exhibited higher reactivity. We hypothesize
that the lack of a clear trend is due to fact that chemical
composition of DOM components is a more important
predictor of DBP formation than size.
DOM fractions obtained from RAC or UF can be
characterized using various techniques including ele-
mental analysis, pyrolysis GC/MS, 13C-NMR, and IR/
FTIR. Although these techniques provide important
information about the structural characteristics of DOM
components, they demand large DOM masses for
analysis and are not feasible for practical treatment
operations. On the other hand, a simple surrogate
parameter, specific ultraviolet absorbance (SUVA),
provides rapid information about DOM aromaticity,
an important property related to DOM reactivity.
SUVA is defined as the UV absorbance, specified at a
wavelength generally between 254 and 280 nm, normal-
ized by DOC. SUVA has often correlated well with DBP
formation [12,17,23–26], and as a result, its use by
practitioners and researchers has increased in recent
years.
2. Motivation and objectives
During isolation and fractionation processes, the
original water composition may change as a result of
concentration changes, exposure to acids, bases and/or
solvents, and adsorption by surfaces. Questions have
been raised about whether these changes chemically alter
the structure and/or reactivity of DOM components
[27–29]. In addition, reports in the literature suggest the
possibility that reactivity is not conserved upon fractio-
nation, and that synergistic effects may be important.
For example, based on greater trihalomethane (THM)
formation by NOM fractions (humic, non-humic, and
low-molecular weight) as compared to whole water,
Owen et al. [14] cite the possibility of synergistic effects
in chlorine substitution or oxidation. In contrast, Chang
et al. [30] found that the THM formation potential
(THMFP) for various organic fractions, prepared by
resin adsorption and reacted with sodium hypochlorite,
recovered only 57% of the THMFP concentration
produced by the raw water. While many studies have
examined the reactivity of NOM fractions, studies
specifically designed to examine whether fractionation
changes DOM reactivity are lacking. Therefore, the first
objective of this research was to evaluate the reactivity
(DBP formation and speciation) of fractions generated
by resin adsorption or UF as compared to both the
unfractionated source water, and source water recon-
stituted from fractions. A systematic approach was
taken to assure good mass balance closure, to verify that
potentially reactive fractions were not lost during
fractionation. Potentially confounding influences (in-
cluding the oxidant to carbon ratio, and bromine
concentration) were also carefully controlled. This study
focuses on one resin, XAD-8, because it is the resin most
commonly employed in fractionation studies.
M. Kitis et al. / Water Research 36 (2002) 3834–3848 3835

The second objective was to compare the DBP
reactivity of different DOM components obtained from
XAD-8 and UF fractionation, and to evaluate whether
reactivity correlates more strongly with the SUVA of
individual fractions, or with other physicochemical
properties (polarity and size). Previous work has
documented strong correlations between the DBP
formation (both THM and haloacetic acids (HAA9))
and the SUVA of DOM remaining in solution after
carbon adsorption and alum coagulation [31]. However,
in those experiments, the DOM removed from solution
was not recovered, and its reactivity could not be
measured. In contrast, the XAD-8 and UF fractionation
techniques used in the present research allow (near)
complete recovery of all DOM fractions. This will allow
a rigorous test of SUVA as a robust parameter for
correlating DOM reactivity.
3. Materials and methods
3.1. Source waters
Two surface waters with significantly different SUVA,
DOC, and physicochemical characteristics were selected
for this study (Table 1). A high-SUVA water was
obtained from the influent of the Myrtle Beach (MB)
drinking water treatment plant in South Carolina, which
uses the Intercoastal Waterway as its source. A low-
SUVA water was collected from the Tomhannock (TM)
reservoir, the water supply for the city of Troy, New
York. DOM was isolated and concentrated from each
source water using a reverse osmosis (RO) system, as
described elsewhere [32]. Isolating and concentrating
DOM provides several advantages over direct use of
source waters, including: (1) reduced storage require-
ments; (2) providing a consistent supply of DOM for the
duration of the study; (3) providing sufficient mass of
DOM to investigate concentration effects; and (4)
providing sufficient starting mass of DOM such that
after fractionation by either resin adsorption or ultra-
filtration, individual fractions would have a high enough
concentration to allow further study. Mass balance
calculations and subsequent reactivity experiments
showed that over 95% of the DOM was recovered from
each source, with no impact on its DBP reactivity as a
result of RO isolation [32].
3.2. XAD-8 resin and ultrafiltration fractionation of
DOM
DOM concentrates were applied to a pre-cleaned
XAD-8 resin (Supelite DAX-8, Supelco, St. Louis, MO)
column at pH 2 to fractionate the organic matter. The
fraction adsorbed by the resin and subsequently back-
eluted from the column using a pH 11 solution is
designated hydrophobic (HPO), while the fractions
collected from the effluent of the column are designated
hydrophilic (HPL). HPL samples were collected as a
function of elution volume, representing a wide range of
column distribution coefficients ðk0Þ: This was done to
investigate the effect of k0 on the SUVA and DBP
reactivity of the HPL fractions and to calculate mass
balances. After elution or recovery, the pH of each
collected fraction was immediately adjusted to the
source water value. Both HPO and HPL fractions were
stored as aqueous solutions in amber bottles at 41C until
use.
A hollow-fiber, cross-flow ultrafiltration system was
used to obtain apparent MW fractions (A/G Technol-
ogy Corporation, Needham, MA). All system tubing
was peroxide-cured silicone (Cole Parmer) chosen for
low organic leachables and acid/base stability. Process
solution was delivered by a peristaltic pump from a 5-L
reservoir into the membrane element; permeate flow was
collected, while the retentate flow was recycled back to
the reservoir. Feed solution was recirculated through the
system at a rate of 4L/min, providing high cross-flow
and shear rates of about 8000 s�1 to minimize accumula-
tion of organic matter at the membrane surface.
Membrane elements were cleaned by recirculating a
0.1N NaOH solution at a cross flow rate of 4L/min for
a minimum of 1 h, followed by a clean water rinse. Six
membranes (1, 3, 5, 10, 30 and 100 kDa) were used to
obtain up to seven fractions; membranes with MWC
larger than 5 kDa were not used with the TM water
because only 11% of the total DOC was in this large
MW fraction. The HPO fraction of the TM water was
further separated into four size fractions to investigate
the size distribution and DBP reactivity within HPO
components. All UF fractions were stored as aqueous
solutions in amber bottles at 41C until use.
Transport of organic molecules across UF membranes
is influenced by many factors related to solution
Table 1
Compositional characteristics of the natural source watersa
Parameter Unit Myrtle Beach
(MB)
Tomhannock
(TM)
DOC mg C/L 20.2 3.3
UV254 Abs. cm�1 0.939 0.069
SUVA254 L/mg Cm 4.65 2.09
Total
alkalinity
mg CaCO3/L 44 39
Total
hardness
mg CaCO3/L 26 54
pH — 7.2 7.0
Bromide mg/L 43 o25b
aValues reported are the average of triplicate measurements.bMinimum reporting level was 25 mg/L.
M. Kitis et al. / Water Research 36 (2002) 3834–38483836

chemistry, membrane properties, and solute/membrane
interactions, which together control membrane rejection
during analysis. To control variability in macromolecule
separation results among different DOM samples,
solution chemistry was adjusted to an ionic strength of
0.01M (as NaCl) and pH 7 for all samples and buffer
solutions prior to ultrafiltration. To achieve a high
degree of separation, and maintain a sufficiently high
permeate concentration to allow further experimenta-
tion, the following cascade-type fractionation protocol
was used (Fig. 1).
The first step was to concentrate the whole DOM
solution on the 1 kDa membrane. Starting with the
lowest MWC membrane maximized the concentration
of the lowest MW fraction by avoiding continual
dilution of the permeate stream as fractionation
proceeds. In addition, as will be described further, this
approach provides opportunities to subsequently im-
prove the separation of various MW fractions, narrow-
ing their MW distribution. Initial concentrations and
concentration factors varied somewhat, but in all
experiments, the system concentration was kept below
100mg/L, to minimize accumulation at the membrane
surface [33]. Concentrated retentate was then diafiltered
with solute-free buffer solution. Diafiltration increased
the separation of the o1 kDa components, but also
diluted the filtrate. The concentration of the o1 kDa
filtrate was allowed to decrease to about 3mg/L, after
which the process was stopped, yielding the o1 kDa
fraction. The o1 kDa components remaining in the
retentate were removed subsequently. Next, the reten-
tate was diluted back to its original volume, and was first
concentrated and then diafiltered on the next larger
MWC (3 kDa). The permeate in this step yielded a dilute
solution of the 1–3 kDa fraction, which was then
concentrated again on the 1 kDa membrane to reduce
its volume, increase its concentration, and remove
remaining o1 kDa components, thereby serving to
‘‘clean’’ the 1–3 kDa fraction. The DOM retained by
the 3 kDa membrane was then diluted and applied to the
next larger MWC, and the process was repeated. The
permeate from membranes having MWC’s >1kDa
were concentrated on lower MWC membranes, serving
to improve recovery and provide narrower MW
P
Buffer
P
Buffer
P
Buffer
P
Buffer
5k Damembrane
P
Buffer
Fractionation step Cleaning step
11
2233
4455
Whole NOM
>1kDa
<1 kDa fraction
1-3 kDa <1 kDa fraction
1-3 kDa fraction
>3 kDa 1-3 kDa fraction3-5 kDa
3-5 kDa fraction >5 kDa(To subsequent membranes)
3k Damembrane
1k Damembrane
3k Damembrane
1k Da membrane
Fig. 1. Schematic depiction of the ultrafiltration protocol employed. Feed solutions are in bold. Feed solutions are retentates when
applied to the next higher molecular weight cut-off (MWC), and permeates when applied to the next lower MWC for concentration
and cleanup. Final fractions are boxed. Supplemental fractions produced from cleanup steps are in italic, and are indicated by dashed
lines.
M. Kitis et al. / Water Research 36 (2002) 3834–3848 3837

fractions. In applying this protocol (to all but the 1 kDa
membrane), the diafiltration volume was selected to
achieve high removal of components (>90%) small
enough to pass a particular membrane. This was done
by determining the average rejection for a retentate
mixture and modeling the mass throughput as described
previously [7,33]. In some cases, the system was operated
in the diafiltration mode using the excess sample volume
as the diafiltration solution, as described by Cai [20].
DOC concentrations were measured using a high-
temperature combustion TOC analyzer (TOC-5000,
Shimadzu, Kyoto, Japan). Mass balance calculations
were performed to determine the DOM recoveries (as
%DOC) after each fractionation experiment. Recovery
was calculated as the total DOM mass recovered in
individual fractions divided by the total DOM mass
applied. These calculations also quantified the contribu-
tion of each fraction (as %DOC) to the total mass of
DOM in the source water. SUVA was used to
characterize the DOM in all fractions. UV absorbance
was measured by a spectrophotometer (DU 640, Beck-
man, Fullerton, CA). Bromide concentration was
determined using an ion chromatography system
(ED40 electrochemical detector; GP50 gradient pump;
AS50 autosampler; AS9-HC column, Dionex, Sunny-
vale, CA) according to USEPA Method 300 [34].
3.3. DBP reactivity experiments
DBP yield and speciation from reaction of DOM in
each source water with chlorine was examined in three
sets of experiments. The first set evaluated the formation
of DBPs upon chlorination of the original source water
sample. The second set of experiments evaluated the
formation of DBPs upon chlorination of individual
DOM fractions. Finally, the third set evaluated the
formation of DBPs upon chlorination of source water
reconstituted from individual fractions to examine
whether the reactivity of source water DOM changed
as a result of isolation and fractionation techniques.
A target DOC of 3mg/L was selected for all DBP
formation experiments, a value close to that of the TM
source water, and representative of typical DOC values
in drinking water sources in the United States [35]. All
the XAD-8 and UF fractions, and original source water
samples were diluted to 3mg/L DOC using distilled and
deionized water (DDW). Source waters were reconsti-
tuted from XAD-8 or UF fractions by combining them
in proportion to their mass contributions to the source
water DOM. After dilution or reconstitution, bromide
was spiked into MB samples, if necessary, to achieve a
bromide level equivalent to that of the original source
water (i.e., 43 mg/L). No bromide spike was necessary for
TM samples because bromide concentrations were
below the detection limit (o25mg/L). DOC and bromide
concentrations of all samples were measured again after
dilution, reconstitution and/or spiking for verification.
Generally, the differences between the target and
measured concentrations were o10%.
After adjusting DOC and bromide levels, all samples
were buffered at pH 870.3 with 0.01M phosphate, and
UV absorbance at 254, 272 and 280 nm was measured.
Then, all the samples were chlorinated employing the
uniform formation condition protocol (UFC) [36]. After
a 24-h incubation period, residual free chlorine was
measured following Standard Method 4500-Cl F [37]
and was quenched with sodium sulfite prior to analysis
for DBPs. DBP formation was quantified in terms of
THM, haloacetonitriles (HANs), haloketones (HKs),
chloral hydrate (CHY), and chloropicrin (CP) according
to USEPA method 551.1 [38], and HAA9 according to
Standard Method 6251 B [37] with some modifications.
More detailed information about the experimental
protocols and the analytical techniques used in this
study can be found elsewhere [26]. For both waters
tested, the extent of THM and HAA9 formations was
significantly higher than those of other DBPs (i.e.,
HANs, HKs, CHY, and CP), thus, only the THM and
HAA9 results are discussed in this paper.
4. Results and discussion
4.1. Fractionation of DOM
DOM recovered in UF and XAD-8 fractions ranged
between 89.9% and 109.1% (as DOC), indicating
minimal organic matter losses (Table 2). The positive
errors in the recovery were attributed to analytical
errors, including the very low-level DOC measurements
required for some fractions. Fig. 2A shows the apparent
MW distribution of source water DOM as measured by
UF. For both waters, the o1 kDa fraction was
Table 2
DOM recoveries during UF and XAD-8 fractionation
Source water Fractionation type Recoverya
MB UF 99.6b
XAD-8 105.6c
TM UF 109.1b
XAD-8 89.9c
UF for HPO Fraction 105.5b
aRecovery as % DOC.bMultiple runs with each water were not conducted.
However, the aggregate standard deviation of 5 separate runs
with 3 waters was 4.7.cMultiple runs with each water were not conducted.
However, the aggregate standard deviation of 11 separate runs
with 3 waters was 3.5.
M. Kitis et al. / Water Research 36 (2002) 3834–38483838
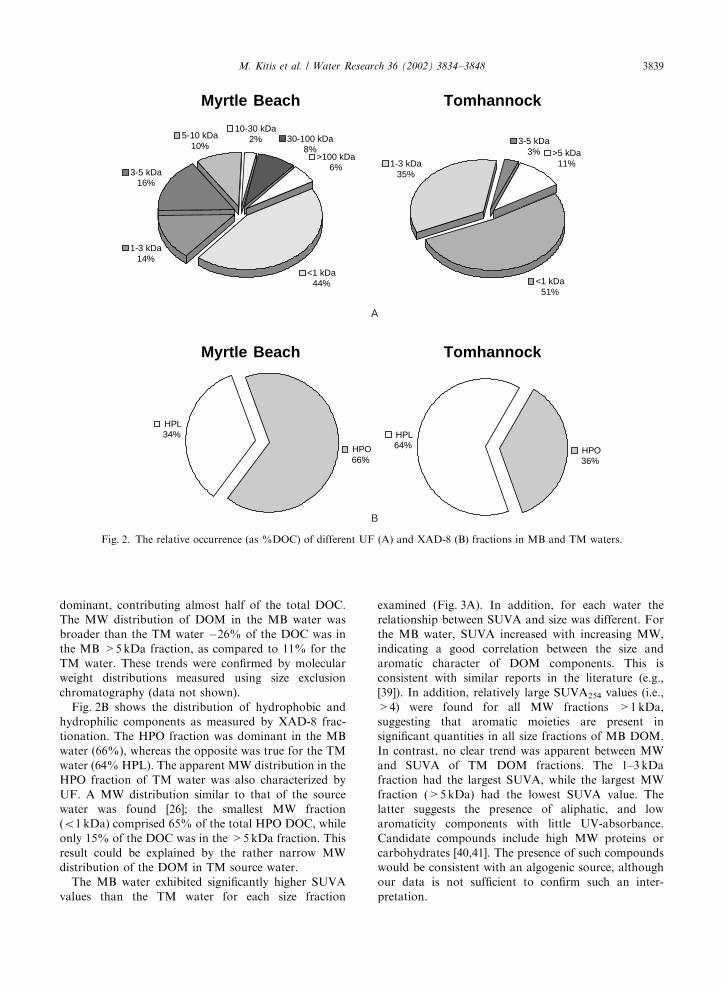
dominant, contributing almost half of the total DOC.
The MW distribution of DOM in the MB water was
broader than the TM water �26% of the DOC was in
the MB >5kDa fraction, as compared to 11% for the
TM water. These trends were confirmed by molecular
weight distributions measured using size exclusion
chromatography (data not shown).
Fig. 2B shows the distribution of hydrophobic and
hydrophilic components as measured by XAD-8 frac-
tionation. The HPO fraction was dominant in the MB
water (66%), whereas the opposite was true for the TM
water (64% HPL). The apparent MW distribution in the
HPO fraction of TM water was also characterized by
UF. A MW distribution similar to that of the source
water was found [26]; the smallest MW fraction
(o1 kDa) comprised 65% of the total HPO DOC, while
only 15% of the DOC was in the >5kDa fraction. This
result could be explained by the rather narrow MW
distribution of the DOM in TM source water.
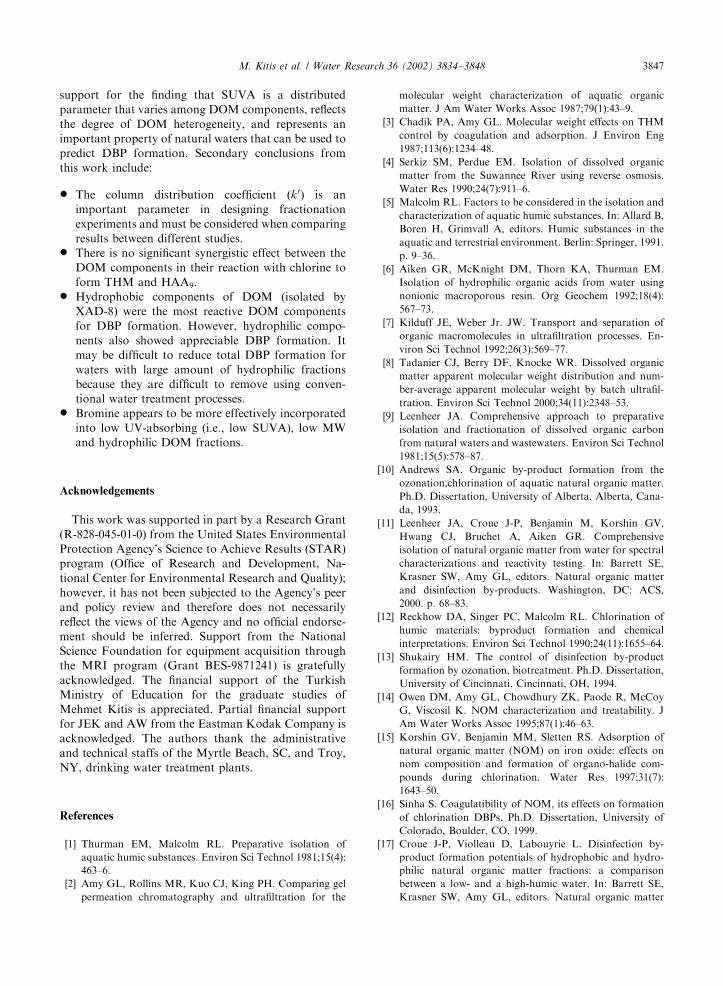
The MB water exhibited significantly higher SUVA
values than the TM water for each size fraction
examined (Fig. 3A). In addition, for each water the
relationship between SUVA and size was different. For
the MB water, SUVA increased with increasing MW,
indicating a good correlation between the size and
aromatic character of DOM components. This is
consistent with similar reports in the literature (e.g.,
[39]). In addition, relatively large SUVA254 values (i.e.,
>4) were found for all MW fractions >1kDa,
suggesting that aromatic moieties are present in
significant quantities in all size fractions of MB DOM.
In contrast, no clear trend was apparent between MW
and SUVA of TM DOM fractions. The 1–3 kDa
fraction had the largest SUVA, while the largest MW
fraction (>5kDa) had the lowest SUVA value. The
latter suggests the presence of aliphatic, and low
aromaticity components with little UV-absorbance.
Candidate compounds include high MW proteins or
carbohydrates [40,41]. The presence of such compounds
would be consistent with an algogenic source, although
our data is not sufficient to confirm such an inter-
pretation.
Myrtle Beach Tomhannock
Myrtle Beach Tomhannock
<1 kDa44%
1-3 kDa14%
3-5 kDa16%
5-10 kDa10%
30-100 kDa8%
>100 kDa 6%
10-30 kDa2%
<1 kDa51%
1-3 kDa35%
3-5 kDa3% >5 kDa
11%
HPO66%
HPL34%
HPO36%
HPL64%
A
B
Fig. 2. The relative occurrence (as %DOC) of different UF (A) and XAD-8 (B) fractions in MB and TM waters.
M. Kitis et al. / Water Research 36 (2002) 3834–3848 3839

XAD-8 fractions also exhibited a wide range of
SUVA values (Fig. 3B). For both waters, the HPO
fraction had a significantly higher SUVA value than the
HPL fraction and the original source water. This was
expected based on previous research showing that HPO
fractions isolated by XAD-8 resins have higher aromatic
content than the HPL fractions [6,12,17]. It was found
that as the column distribution coefficient ðk0Þ increased,
the SUVA of the HPL fractions increased. The column
distribution coefficient is directly proportional to the
volume of water processed through the resin bed.
Therefore, as k0 increases, available adsorption sites on
the resins are occupied, resulting in the breakthrough of
higher UV-absorbing DOM components. This result
emphasizes the fact that XAD-8 column fractions are
operationally defined, and that selection of k0 is
0
2
4
6
8
SourceWater
HPO (0-20) (20-34) (34-80) (80-107) (0-59) (59-108)
SU
VA
254
(L/m
g D
OC
-m)
MB
TM
0
2
4
6
8
SourceWater
<1 kDa 1-3 kDa 3-5 kDa >5 kDa 5-10kDa
10-30kDa
30-100kDa
>100kDa
SU
VA
254
(L/m
g D
OC
-m)
MB
TM
A
B
Fig. 3. SUVA254 values of UF (A) and XAD-8 (B) fractions in MB and TM waters. In part B, numbers in parenthesis represent the k0
range of HPL fractions. Error bars indicate the 95% confidence intervals.
M. Kitis et al. / Water Research 36 (2002) 3834–38483840

important in designing fractionation experiments and
for comparing results between studies. As observed for
the source water, no clear trend was apparent between
MW and the SUVA of UF fractions prepared from the
TM HPO fraction.
The differences in the MW and HPO/HPL distribu-
tions of the two surface waters examined in this research
suggest that the sources of DOM in these waters are
quite different. Pedogenic humic substances and/or
DOM originating from terrestrial vegetation generally
contain more aromatic moieties and lignin, larger MW
components and more intense color per C atom; in
contrast, aquagenic humics generally contain more
aliphatic moieties and more carboxylic functional
groups [41,42]. Taken as a whole, the evidence suggests
that MB water exhibits a significant pedogenic DOM
signature. Factors contributing to this conclusion
include (1) relatively high SUVA254 values (e.g., >4);
(2) high MW components; (3) hydrophobic character-
istics; and, (4) a watershed that contains many forests
and wetland areas. In contrast, the hydrophilic, low
SUVA and low MW properties of the TM DOM are
consistent with a more aquagenic signature.
4.2. The impact of UF and XAD-8 fractionation on the
SUVA and DBP reactivity of source water DOM
To investigate the impact of UF and XAD-8
fractionation, the SUVA and DBP reactivity of source
water DOM was compared to reactivity of source waters
reconstituted from the XAD-8 or UF fractions. Frac-
tions were mixed in proportion to their mass contribu-
tions to the source water DOM. For both TM and MB
waters, it was found that the SUVA values (at 254, 272
and 280 nm wavelengths) of the reconstituted source
waters were statistically similar (within the 95%
confidence intervals) to the unfractionated source water
[26]. This result confirms that XAD-8 and UF fractiona-
tion did not modify the spectroscopic characteristics of
the original DOM. Because UV absorbance is a function
of both the concentration of UV-absorbing components
and their structural configuration, we conclude that no
irreversible modifications to the DOM molecular
structure occurred from exposure to strong acids and
bases, from interactions with resin materials during
RAC and/or with membrane materials during UF, or
from aggregation resulting from increases in concentra-
tion. Similarly, no statistically significant impact of UF
fractionation on the SUVA of the TMHPO fraction was
observed.
Fig. 4 shows a comparison of specific THM and
HAA9 yields (i.e., THM/DOC or HAA9/DOC) of
unfractionated MB source water with those of recon-
stituted source waters (i.e., measured) from XAD-8 or
UF fractions. In addition, since the contribution of
individual fractions to overall DOM mixture is known,
and their DBP yields were measured, the DBP formation
of the source water was calculated as the sum of
contributions from each fraction:
SDBPYcalculated ¼XN
i¼1
xiSDBPYi
" #; ð1Þ
where xi is the fraction of mass contributed by an
individual XAD-8 or UF fraction to the source water
DOC, SDBPYi is the measured specific DBP yield (i.e.,
for THM or HAA9) of the XAD-8 or UF fraction, and
N is the total number of fractions. The calculated DBP
yields of reconstituted source water from XAD-8 or UF
fractions are also shown in Fig. 4.
Examination of the data in Fig. 4 suggests that neither
XAD-8 nor UF fractionation altered reactive sites
within the DOM that were responsible for DBP
formation. The same conclusion was reached for the
TM water (data not shown). Measured DBP yields for
reconstituted source waters were consistent with yields
calculated by summing contributions of individual
fractions, and were statistically comparable (i.e., within
95% confidence intervals) with that of the unfractio-
nated source water. This finding also suggests that the
contribution of each fraction to total DBP formation
appears to be linearly cumulative; no synergistic effect
among the fractions is apparent. The impact of XAD-8
and UF fractionation on the DOM reactivity was also
evaluated in terms of bromine incorporation factors for
THM ðnÞ and HAA9 ðn0Þ: The bromine incorporation
factor was calculated as the total moles of bromine
incorporated divided by total moles of species formed in
a given DBP class. Similar to DBP formation, bromine
incorporation factors for reconstituted source waters
were consistent with those calculated by summing
contributions of individual fractions, and were statisti-
cally comparable with those of unfractionated source
waters [26]. In addition, the relative occurrence of
individual DBP species in the source waters did not
change. These observations together confirm that the
UF and XAD-8 fractionation did not irreversibly
modify the reactivity of DOM components that
contribute to the formation of DBPs.
4.3. The DBP reactivity of UF and XAD-8 fractions
4.3.1. UF fractions
The THM and HAA9 specific yields of individual UF
fractions after chlorination are shown in Fig. 5A. For
MB water, DBP yields generally increased with increas-
ing MW, with the exception of the 3–5 kDa fraction,
which exhibited reactivity higher than the overall trend
would suggest. The general trend with MW suggests that
larger molecular size DOM fractions are more reactive
precursors for DBP formation, which is consistent with
their higher SUVA values. The positive correlation
M. Kitis et al. / Water Research 36 (2002) 3834–3848 3841

between the MW and DBP formation was not observed
for the TM water. The 1–3 kDa fraction produced the
highest THM and HAA9 yields, whereas the largest MW
(>5kDa) fraction, which also had the smallest SUVA
value, produced the smallest yields. For both waters, the
specific yields of HAA9 were higher than those of THM
in all MW fractions and the unfractionated source
waters.
For MB water, bromine incorporation factors for
both THM and HAA9 formation decreased as the MW
of the fractions increased up to 3–5 kDa, above which
they were relatively constant (Fig. 6A). The o1 kDa
fraction, having the smallest SUVA value, had the
largest ðnÞ and ðn0Þ values among all MW fractions and
the source water, an observation consistent with the
literature [13,16]. This suggests that bromine is incorpo-
rated into lower-MW fractions to a greater extent. For
TM water, there was no clear trend between bromine
incorporation factors and MW (Fig. 6A). The largest ðnÞand ðn0Þ values were found in the 3–5 kDa fraction. In
0
10
20
30
40
50
60
70
80
90
Source water MeasuredXAD-8
MeasuredUF
CalculatedXAD-8
CalculatedUF
TH
M/D
OC
(µg
/mg
)
HPO
<1K
1-3K
3-5K
5-10K10-30K
30-100K
>100KHPL
A
0
10
20
30
40
50
60
70
80
90
Source water MeasuredXAD-8
Measured UF
CalculatedXAD-8
CalculatedUF
HA
A9/D
OC
(µg
/mg
)
HPO
<1K
1-3K
3-5K
5-10K
10-30K30-100K
>100K
HPL
B
Fig. 4. Comparison of specific THM (A) and HAA9 (B) yields of source water, and measured and calculated reconstituted source
waters from XAD-8 or UF fractions for MB water. Error bars indicate the 95% confidence intervals.
M. Kitis et al. / Water Research 36 (2002) 3834–38483842

general, since both were low-bromide waters, bromi-
nated DBPs formed in small quantities, resulting in the
very small ðnÞ and ðn0Þ values.The contribution of molecular size fractions to overall
reactivity results from the combined effects of individual
fraction reactivity and apparent molecular weight
distribution. To illustrate this, the percent contribution
of each MW fraction to source water specific DBP yield
was calculated. Because no synergistic effect was found
between the UF or XAD-8 fractions during DBP
formation, the following linear combination was used:
%SDBPYi ¼SDBPYiPN
i¼1 xiSDBPYi
h i� 100: ð2Þ
In the TM water, 93% and 91% of the THM and
HAA9 yields, respectively, of the source water were
produced from the fractions with MW o3 kDa. In
Fig. 5. Specific THM and HAA9 yields of UF (A) and XAD-8 (B) fractions in MB and TM waters. In part B, numbers in parenthesis
represent the k0 range of HPL fractions. Error bars indicate the 95% confidence intervals.
M. Kitis et al. / Water Research 36 (2002) 3834–3848 3843

contrast, percentage yields of the low molecular weight
MB fractions were only about half as large. This large
contribution from the low molecular weight TM
components occurs because the low MW fractions are
more reactive (Fig. 5A), and because they dominate the
source water composition (86% by weight). High MW
components (>5kDa) of the TM water contribute only
4% and 5% to the source water’s THM and HAA9
yields, respectively. This compares to 31% and 37% for
the MB water, as a result of an increase in DBP
reactivity with MW for this water, and a significant mass
fraction of larger components (26% by weight).
4.3.2. XAD-8 fractions
The reactivity of XAD-8 fractions for DBP formation
is shown in Fig. 5B. With the exception of THM
produced from the HPO fraction, XAD-8 fractions of
MB water exhibited larger THM and HAA9 yields than
Fig. 6. THM and HAA9 bromine incorporation factors of UF (A) and XAD-8 (B) fractions in MB and TM waters. In part B, numbers
in parenthesis represent the k0 range of HPL fractions. Error bars indicate the 95% confidence intervals.
M. Kitis et al. / Water Research 36 (2002) 3834–38483844

those of TM water. For both waters tested, the HPO
fraction had higher THM and HAA9 yields than the
HPL fractions and the source water. This is consistent
with previous reports in the literature that humic-type
components of DOM, generally captured by XAD-8
resins, are more reactive to DBP formation [12,15,16].
However, HPL fractions also exhibited appreciable
THM and HAA9 yields. As calculated using Eq. (2),
HPL fractions contributed 27% and 50% of the
THM yield for MB and TM water, respectively [26].
Similar contributions to HAA9 yields were observed
for both waters. Since hydrophilic fractions are less
amenable to removal in conventional water treatment
processes, these contributions to total DBP formation
can have significant implications for the ability of
water utilities to comply with more stringent DBP
regulations.
It was found that both THM and HAA9 yields of the
HPL fractions increased with increasing k0 (Fig. 5B), as
more hydrophobic components, having higher SUVA
values, elute from the column. The effect of k0 was more
pronounced in the more hydrophobic MB water. This
emphasizes the importance of k0 when comparing DBP
reactivities between different studies. In terms of the
reactivity of MW fractions of the HPO fraction in TM
water, no clear trend was found between MW and DBP
yields; results were similar to that found for the source
water [26].
For each water tested, HPL fractions produced
greater yields of brominated species (both THM and
HAA9) than the HPO fraction and source water
(Fig. 6B), an observation consistent with the literature
(e.g., [16]). Very small ðnÞ and ðn0Þ values were found
in the HPO fraction of both waters. In fact, no
brominated HAA9 species were detected in the HPO
fraction of TM water. These results suggest that
hydrophilic moieties of DOM are more susceptible to
bromine incorporation.
4.4. The role of SUVA in DBP reactivity
Because the chemical composition of DOM compo-
nents is expected to play a significant role in DBP
reactivity, and SUVA has been shown to correlate well
with DBP formation [12,17,23,31], correlations between
the SUVA and the DBP yields of UF and XAD-8
fractions were examined (Fig. 7A). All the fractions had
the same DOC, bromide and chlorine concentrations;
thus, differences in DBP yields could be directly related
to differences in SUVA. Two important observations
were made from these correlations. First, although the
correlations between the DBP formation and MW were
not consistent for the two waters (Fig. 5A), the trend of
increasing DBP formation with increasing SUVA is
clear (Fig. 7A). In the context of DBP reactivity, the
chemical properties (i.e., aromaticity) of these DOM
mixtures are more important than their physical size.
Second, although two separation processes with sig-
nificantly different mechanisms were used in the DOM
fractionation, strong and single trends (R2 values of
linear fits ranging between 0.85 and 0.92) were observed
between SUVA and both THM and HAA9 yields,
independent of the fractionation process used. This is
consistent with our previous work, which identified
unique correlations between SUVA and the DBP yield
of DOM fractions obtained from a single water using
carbon and XAD-8 batch adsorption, and alum
coagulation [31]. This, consistent with other research,
confirms that SUVA is a distributed parameter; i.e.,
when we measure SUVA for a water sample, it is a
composite value representing contributions from differ-
ent components:
SUVA ¼XN
i¼1
xiSUVAi; ð3Þ
where xi is a mole or mass fraction, and SUVAi is the
SUVA of a single component or a class of components.
The range of SUVAi for different components is a
measure of DOM heterogeneity, one that correlates with
DBP reactivity. The way in which SUVA is distributed
provides more information than a composite value of
SUVA. Therefore, these results provide additional
support for the finding that the SUVA distribution of
DOM components, which reflects the distribution of
unsaturated bonds within DOM, represents an impor-
tant characteristic of natural waters.
SUVA also correlated with both THM and HAA9
bromine incorporation factors of individual fractions,
independent of their MW or hydrophobicity (Fig. 7B).
As the SUVA decreased, both ðnÞ and ðn0Þ values
increased, suggesting that bromine is more effectively
incorporated into lower UV-absorbing DOM fractions.
This suggests that SUVA may also effectively distin-
guish between sites that have preferential affinity for
chlorine substitution, and those that react with bromine.
In addition, as discussed before, lower-MW and
hydrophilic fractions, which had lower SUVA values,
were also found to have larger ðnÞ and ðn0Þ values.
Bromine is a stronger and faster halogenating agent than
chlorine. However, the mechanistic reasoning associated
with the finding that bromine incorporates more into
lower-SUVA (i.e., less aromatic), more hydrophilic, and
lower-MW DOM fractions is not well understood. In
both waters, ðnÞ values were larger than ðn0Þ for each
XAD-8 or UF fraction or source water. In addition, the
slopes of the SUVA-bromine incorporation factor fits in
the tested waters were always larger for THM, suggest-
ing that the relative occurrence of brominated THM
species is larger than that of brominated HAA species
after chlorination of DOM, especially for the lower-
SUVA fractions (Fig. 7B).
M. Kitis et al. / Water Research 36 (2002) 3834–3848 3845

5. Conclusions
The primary conclusions from this work are that (1)
DOM isolation and/or fractionation procedures using
XAD-8 adsorption and UF do not alter either the
SUVA or the reactivity of DOM (in terms of DBP
formation and speciation) as compared to the source
water, at least for the techniques described in this study;
and, (2) although XAD-8 adsorption and UF fraction-
ate DOM with significantly different mechanisms, for
each water tested, strong and unique correlations were
observed between SUVA and both THM and HAA9
yields, independent of the fractionation process em-
ployed. Because there was no consistent trend between
the MW and DBP formation for the UF fractions of the
two waters tested in this study, aromaticity of DOM
components is more important than the size for
predicting DBP formation. These results provide further
0.0
0.1
0.2
0.3
0 1 2 3 4 5 6 7 8
SUVA254 (L /mg DOC-m)
Br
Inco
rp. F
acto
r (n
or
n')
fo
r T
M
0.0
0.1
0.2
0.3
Br
Inco
rp. F
acto
r (n
or
n')
fo
r M
B
TM-n TM-n'
MB-n MB-n'
B
MB-n
MB-n'
TM-n
TM-n'
0
20
40
60
80
100
0 1 2 3 4 5 6 7 8
SUVA254 (L /mg DOC-m)
DB
P Y
ield
s (µ
g/m
g D
OC
) fo
r T
M
0
20
40
60
80
100
120
140
DB
P Y
ield
s (µ
g/m
g D
OC
) fo
r M
B
MB-THM MB-HAA9
TM-THM TM-HAA9
MB-THM
MB-HAA9
TM-THM
TM-HAA9
A
Fig. 7. The role of SUVA of UF and XAD-8 fractions in DBP yields (A) and bromine incorporation factors (B) for MB and TM
waters.
M. Kitis et al. / Water Research 36 (2002) 3834–38483846
support for the finding that SUVA is a distributed
parameter that varies among DOM components, reflects
the degree of DOM heterogeneity, and represents an
important property of natural waters that can be used to
predict DBP formation. Secondary conclusions from
this work include:
* The column distribution coefficient ðk0Þ is an
important parameter in designing fractionation
experiments and must be considered when comparing
results between different studies.* There is no significant synergistic effect between the
DOM components in their reaction with chlorine to
form THM and HAA9.* Hydrophobic components of DOM (isolated by
XAD-8) were the most reactive DOM components
for DBP formation. However, hydrophilic compo-
nents also showed appreciable DBP formation. It
may be difficult to reduce total DBP formation for
waters with large amount of hydrophilic fractions
because they are difficult to remove using conven-
tional water treatment processes.* Bromine appears to be more effectively incorporated
into low UV-absorbing (i.e., low SUVA), low MW
and hydrophilic DOM fractions.
Acknowledgements
This work was supported in part by a Research Grant
(R-828-045-01-0) from the United States Environmental
Protection Agency’s Science to Achieve Results (STAR)
program (Office of Research and Development, Na-
tional Center for Environmental Research and Quality);
however, it has not been subjected to the Agency’s peer
and policy review and therefore does not necessarily
reflect the views of the Agency and no official endorse-
ment should be inferred. Support from the National
Science Foundation for equipment acquisition through
the MRI program (Grant BES-9871241) is gratefully
acknowledged. The financial support of the Turkish
Ministry of Education for the graduate studies of
Mehmet Kitis is appreciated. Partial financial support
for JEK and AW from the Eastman Kodak Company is
acknowledged. The authors thank the administrative
and technical staffs of the Myrtle Beach, SC, and Troy,
NY, drinking water treatment plants.
References
[1] Thurman EM, Malcolm RL. Preparative isolation of
aquatic humic substances. Environ Sci Technol 1981;15(4):
463–6.
[2] Amy GL, Rollins MR, Kuo CJ, King PH. Comparing gel
permeation chromatography and ultrafiltration for the
molecular weight characterization of aquatic organic
matter. J Am Water Works Assoc 1987;79(1):43–9.
[3] Chadik PA, Amy GL. Molecular weight effects on THM
control by coagulation and adsorption. J Environ Eng
1987;113(6):1234–48.
[4] Serkiz SM, Perdue EM. Isolation of dissolved organic
matter from the Suwannee River using reverse osmosis.
Water Res 1990;24(7):911–6.
[5] Malcolm RL. Factors to be considered in the isolation and
characterization of aquatic humic substances. In: Allard B,
Boren H, Grimvall A, editors. Humic substances in the
aquatic and terrestrial environment. Berlin: Springer, 1991.
p. 9–36.
[6] Aiken GR, McKnight DM, Thorn KA, Thurman EM.
Isolation of hydrophilic organic acids from water using
nonionic macroporous resin. Org Geochem 1992;18(4):
567–73.
[7] Kilduff JE, Weber Jr. JW. Transport and separation of
organic macromolecules in ultrafiltration processes. En-
viron Sci Technol 1992;26(3):569–77.
[8] Tadanier CJ, Berry DF, Knocke WR. Dissolved organic
matter apparent molecular weight distribution and num-
ber-average apparent molecular weight by batch ultrafil-
tration. Environ Sci Technol 2000;34(11):2348–53.
[9] Leenheer JA. Comprehensive approach to preparative
isolation and fractionation of dissolved organic carbon
from natural waters and wastewaters. Environ Sci Technol
1981;15(5):578–87.
[10] Andrews SA. Organic by-product formation from the
ozonation,chlorination of aquatic natural organic matter.
Ph.D. Dissertation, University of Alberta, Alberta, Cana-
da, 1993.
[11] Leenheer JA, Croue J-P, Benjamin M, Korshin GV,
Hwang CJ, Bruchet A, Aiken GR. Comprehensive
isolation of natural organic matter from water for spectral
characterizations and reactivity testing. In: Barrett SE,
Krasner SW, Amy GL, editors. Natural organic matter
and disinfection by-products. Washington, DC: ACS,
2000. p. 68–83.
[12] Reckhow DA, Singer PC, Malcolm RL. Chlorination of
humic materials: byproduct formation and chemical
interpretations. Environ Sci Technol 1990;24(11):1655–64.
[13] Shukairy HM. The control of disinfection by-product
formation by ozonation, biotreatment. Ph.D. Dissertation,
University of Cincinnati, Cincinnati, OH, 1994.
[14] Owen DM, Amy GL, Chowdhury ZK, Paode R, McCoy
G, Viscosil K. NOM characterization and treatability. J
Am Water Works Assoc 1995;87(1):46–63.
[15] Korshin GV, Benjamin MM, Sletten RS. Adsorption of
natural organic matter (NOM) on iron oxide: effects on
nom composition and formation of organo-halide com-
pounds during chlorination. Water Res 1997;31(7):
1643–50.
[16] Sinha S. Coagulatibility of NOM, its effects on formation
of chlorination DBPs. Ph.D. Dissertation, University of
Colorado, Boulder, CO, 1999.
[17] Croue J-P, Violleau D, Labouyrie L. Disinfection by-
product formation potentials of hydrophobic and hydro-
philic natural organic matter fractions: a comparison
between a low- and a high-humic water. In: Barrett SE,
Krasner SW, Amy GL, editors. Natural organic matter
M. Kitis et al. / Water Research 36 (2002) 3834–3848 3847

and disinfection by-products. Washington, DC: ACS,
2000. p. 139–53.
[18] Langvik V-A, Holmbom B. Formation of mutagenic
organic by-products and AOX by chlorination of fractions
of humic water. Water Res 1994;28(3):553–7.
[19] Kim H. Removal mechanisms of various molecular weight
fractions in natural organic carbon using anion exchange
resin. Ph.D. Dissertation, University of Houston, Hous-
ton, TX, 1990.
[20] Cai Y. Size distribution measurements of dissolved organic
carbon in natural waters using ultrafiltration technique.
Water Res 1999;33(13):3056–60.
[21] Ghosh K, Schnitzer M. Macromolecular structures of
humic substances. Soil Sci 1980;129:266–76.
[22] Schnoor JL, Nitzschke JL, Lucas RD, Veenstra JN.
Trihalomethane yields as a function of precursor mole-
cular weight. Environ Sci Technol 1979;13:1134–8.
[23] Edzwald JK, Becker WC, Wattier KL. Surrogate para-
meters for monitoring organic matter and THM precur-
sors. J Am Water Works Assoc 1985;77(4):122–32.
[24] Singer PC, Chang SD. Correlations between trihalo-
methanes and total organic halides formed during water
treatment. J Am Water Works Assoc 1989;81(8):61–5.
[25] Galapate RP, Baes AU, Ito K, Iwase K, Okada M.
Trihalomethane formation potential prediction using some
chemical functional groups and bulk parameters. Water
Res 1999;33(11):2555–60.
[26] Kitis M. Probing chlorine reactivity of DOM for DBP
formation: relations with SUVA and development of the
DBP reactivity profile. Ph.D. Dissertation, Clemson
University, Clemson, SC, 2001.
[27] Aiken GR. In: Frimmel FH, Christman RF, editors.
Humic substances and their role in the environment. New
York, NY: Wiley, 1988. p. 15–30.
[28] Malcolm RL, MacCarthy P. Quantitative evaluation of
XAD-8 and XAD-4 resins used in tandem for removing
organic solutes from water. Environ Int 1992;18:597–607.
[29] Town RM, Powell HKJ. Limitations of XAD resins for
the isolation of the non-colloidal humic fraction in soil
extracts and aquatic samples. Anal Chim Acta
1993;271:195–202.
[30] Chang C-N, Ma Y-S, Fang G-C, Zing F-F. Characteriza-
tion and isolation of natural organic matter from a
eutrophic reservoir. J Water Supply Res Technol AQUA
2000;49(5):269–80.
[31] Kitis M, Karanfil T, Kilduff JE, Wigton A. The reactivity
of natural organic matter to disinfection by-products
formation and its relation to specific ultraviolet absor-
bance. Water Sci Technol 2001;43(2):9–17.
[32] Kitis M, Karanfil T, Kilduff JE. Isolation of dissolved
organic matter (DOM) from surface waters using reverse
osmosis and its impact on the reactivity of DOM to
formation and speciation of disinfection by-products.
Water Res 2001;35(9):2225–34.
[33] Logan BA, Jiang Q. Molecular size determination of
dissolved organic matter. J Environ Eng 1990;116:
1046–62.
[34] US Environmental Protection Agency, 1993. Determina-
tion of inorganic anions by ion chromatography. EPA/
600/R-93, Cincinnati, OH.
[35] Oxenford JL. Disinfection by-products: current practices
and future directions. In: Minear R, Amy GL, editors.
Disinfection by-products in water treatment. Washington,
DC: ACS, 1996. p. 3–17.
[36] Summers RS, Hooper SM, Shukairy HM, Solarik G,
Owen D. Assessing DBP yield: uniform formation condi-
tions. J Am Water Works Assoc 1996;88(6):80–93.
[37] APHA, AWWA, WEF, Standard methods for the
examination of water and wastewater. 18th ed. Washing-
ton, DC, 1992.
[38] US Environmental Protection Agency. Reprints of EPA
methods for chemical analyses under the information
collection rule. EPA 814-B-96-006, Cincinnati, OH, 1996.
[39] Chin YP, Aiken G, O’Loughlin E. Molecular weight,
polydispersity, and spectroscopic properties of aquatic
humic substances. Environ Sci Technol 1994;28(11):
1853–8.
[40] Rashid MA. Geochemistry of marine humic compounds.
New York, NY: Springer, 1985.
[41] Aiken G, Cotsaris E. Soil and hydrology: their effect on
nom. J Am Water Works Assoc 1995;87(1):36–45.
[42] Thurman EM, Malcolm RL. Structural study of humic
substances: new approaches and methods. In: Christman
RF, Gjessing ET, editors. Aquatic and terrestrial humic
materials. Ann Arbor, MI: Ann Arbor Science, 1983.
p. 1–23.
M. Kitis et al. / Water Research 36 (2002) 3834–38483848
Copyright © 2022 FDOKUMEN