Platinum (II) complexes of benzoic- and 3-methoxybenzoic acid hydrazides. Synthesis,...
13
Platinum (II) Complexes of Benzoic- and 3-Methoxybenzoic Acid Hydrazides. Synthesis; Characterization, and Cytotoxic Effect Nicolay Dodoff, Konstantin Grancharov, Rumyana Gugova, and Nadejda Spassovska Institute of Molecular Biology, Bulgarian Academy of Sciences, Sofia, Bulgaria ABSTRACT The complexes [Pt(bah),X,l, [Pt(NH,Xbah)Cl,l.OSH,O, [Pt(mbah),X,], and [Pt(NH,Xmbah)Cl,] (bah = benzoic acid hydrazide, mbah = 3-methoxybenzoic acid hydrazide; X = Cl, Br, I) have been prepared and characterized by elemental analysis, electric conductivity, IR, ‘H NMR, and electronic spectra. A &-square planar structure with hydrazide ligands coordinated via the NH,-groups has been proposed for these complexes. The complexes have shown a growth- inhibitory effect against Friend leukemia cells in culture comparable to that of the antitumor drug cisplatin. INTRODUCTION cis-Diamminedichloroplatinum (cisplatin), a widely used drug in cancer chemo- therapy, is a prototype of a great number of platinum complexes synthesized in search for new agents with improved therapeutic characteristics [l, 21. A noteworthy approach in the design of cisplatin analogues is the use of biolo- gically active compounds as ligands [2]. Aromatic acids hydrazides and their derivatives have shown various biological activity [3-51, including antitumor effect [6-91. Some transition metal complexes of hydrazides have exhibited a growth inhibition effect on bacteria and fungi [lo, 111. A relatively small number of platinum complexes with acid hydrazides as ligands have as yet been Address reprint requests to: Dr. N. Dodoff, Institute of Molecular Biology, Bulgarian Academy of Sciences, Acad. G. Bonchev Str., Block. 21, 1113 Sofia, Bulgaria. Journal of Inorganic Biochemistry, 54,221-233 (1994) 221 0 1994 Elsevier Science Inc., 655 Avenue of the Americas, NY, NY 10010 0162-0134/94/$7.00
Transcript of Platinum (II) complexes of benzoic- and 3-methoxybenzoic acid hydrazides. Synthesis,...

Platinum (II) Complexes of Benzoic- and 3-Methoxybenzoic Acid Hydrazides. Synthesis; Characterization, and Cytotoxic Effect
Nicolay Dodoff, Konstantin Grancharov, Rumyana Gugova, and Nadejda Spassovska
Institute of Molecular Biology, Bulgarian Academy of Sciences, Sofia, Bulgaria
ABSTRACT
The complexes [Pt(bah),X,l, [Pt(NH,Xbah)Cl,l.OSH,O, [Pt(mbah),X,], and [Pt(NH,Xmbah)Cl,] (bah = benzoic acid hydrazide, mbah = 3-methoxybenzoic acid hydrazide; X = Cl, Br, I) have been prepared and characterized by elemental analysis, electric conductivity, IR, ‘H NMR, and electronic spectra. A &-square planar structure with hydrazide ligands coordinated via the NH,-groups has been proposed for these complexes. The complexes have shown a growth- inhibitory effect against Friend leukemia cells in culture comparable to that of the antitumor drug cisplatin.
INTRODUCTION
cis-Diamminedichloroplatinum (cisplatin), a widely used drug in cancer chemo- therapy, is a prototype of a great number of platinum complexes synthesized in search for new agents with improved therapeutic characteristics [l, 21. A noteworthy approach in the design of cisplatin analogues is the use of biolo- gically active compounds as ligands [2]. Aromatic acids hydrazides and their derivatives have shown various biological activity [3-51, including antitumor effect [6-91. Some transition metal complexes of hydrazides have exhibited a growth inhibition effect on bacteria and fungi [lo, 111. A relatively small number of platinum complexes with acid hydrazides as ligands have as yet been
Address reprint requests to: Dr. N. Dodoff, Institute of Molecular Biology, Bulgarian Academy of Sciences, Acad. G. Bonchev Str., Block. 21, 1113 Sofia, Bulgaria.
Journal of Inorganic Biochemistry, 54,221-233 (1994) 221 0 1994 Elsevier Science Inc., 655 Avenue of the Americas, NY, NY 10010 0162-0134/94/$7.00

222 N. Dodoff et al.
synthesized [12-171. Such complexes have not however been tested for antitumor activity.
In the present work we report: i) The preparation and characterization by spectroscopic methods of a series of platinum(B) complexes of benzoic acid hydrazide (bah) and 3-methoxybenzoic acid hydrazide (mbah). It should be noted here that some of these complexes have been described in the literature [14-161, being characterized mainly by IR spectroscopy. Our studies expand the information about them including ‘H NMR and electronic spectral data. ii> A comparative in vitro study of the cytotoxic effect of the synthesized complexes, the free ligands, and cisplatin on Friend leukemia cells.
EXPERIMENTAL
Starting Materials
K,[PtCl,] and cis-[Pt(NH,)zC1,] were prepared according to Ref. ]181; (PhCH,NEt,),[PtCl,] and KCPt(NH,)Cl,l according to Ref. 1191 and 1201, respectively; and bah and mbah as described in Refs. [21] and [22], respectively. The remaining reagents and solvents were commercial AR grade products.
Preparation of the Complexes
[Pt(bah),Cl,] (I) and [Pt(mbah),Cl,] (VI). These complexes were prepared according to Refs. [14] and [16], respectively: solutions of 0.25 g (1.84 mmol) of bah and 0.60 g (3.61 mmol) of mbah in 10 ml of water were added to stirred solutions of 0.25 g (0.60 mmol) of K,[PtCl,] in the same volume of water. Yellow precipitates began to appear about 10 min after mixing of the reagents; 6 hr later the precipitates were filtered and washed with water and methanol. Complex I was air-dried, whereas VI was dried in vacua. Yields: 0.26 g (80%) and 0.32 g (89%), respectively.
[Pt(bah),Cl,] (Ir). A solution of 0.19 g (1.39 mmol) of bah in 10 ml of methanol was added while stirring to a solution of 0.50 g (0.69 mmol) of (PhCH,NEt&[PtCl,] in 25 ml of the same solvent. A yellow solid began to settle about 1 hr later. The reaction mixture was left overnight. The precipitate was filtered, washed with methanol, and dried in vacua. Yield: 0.28 g (75%).
[Pt(NH,)(bah)Cl,].O.SH,O (III) and [Pt(NH,)(mbah)Clz] (VZZ). A solution of 1.10 mmol of the corresponding hydrazide (0.15 g bah; 0.18 g mbah) in 10 ml water was added while stirring to a solution of 0.40 g (1.12 mmol) of I<IPt(NH,)Cl,] in the same volume of water. Yellow precipitates began to appear about 20 min later. The reaction mixtures were left overnight. The precipitates were filtered, washed with water and methanol, and dried in vacua. Yields: 0.33 and 0.34 g, respectively (70%).
rPt(bah),X,] and [Pt(mbah),X,/, X = Br, I (IV if, VZII and IX). Aqueous K,[PtBr,] and K,[PtI,l were prepared according to Refs. [23] and [24], respec- tively: solutions of 0.30 g (0.72 mmol) of K,[PtCl,] in 5 ml water and 3.25 mmol of KX (0.39 g KBr and 0.54 g KI) in 2 ml water were mixed and heated on a water bath (20 min at 60-70°C for KBr solution and 10 min at 35-40°C for KI solution). A solution of 1.82 mmol of the corresponding hydrazide (0.25 g bah and 0.30 g mbah) in 10 ml water was added while stirring to a solution of the
PT(I1) COMPLEXES OF HYDRAZIDES 223
corresponding K,[PtX,]. Yellow (dark yellow for the iodo-complexes) precipi- tates were immediately formed. After 3 hr they were filtered, washed with water and methanol, and dried in vacua. Yields: 0.40-0.52 g (88-92%).
Analyses and Physical Measurements
The elemental analyses were performed according to standard microanalytical procedures (Institute of Organic Chemistry, Bulgarian Academy of Sciences).
Melting points were measured with a Boetius heating-plate microscope. Electric conductivities were determined at 24°C in distilled dimethylform-
amide (DMF) and dimethylsulfoxide (DMSO) (A = 1.2 X 10m6 and 0.5 X lop6 0-l cm-l, respectively) using a Radiometer CDM 3 conductometer.
Infrared spectra were recorded on a Bruker ISF-113V spectrophotometer in nujol mulls (4000-400 cm-‘) and in polyethylene disks (450-150 cm-‘), as well as in CsI disks.
‘H MNR spectra were registered on a Bruker WM 250 spectrometer at 250 MHz in DMSO-d, solutions using TMS as internal standard.
Solid-state diffuse reflectance spectra were recorded on a Perkin-Elmer 330 apparatus using BaSO, as reference.
Solution electronic absorption spectra were registered on a Specord UV-Vis spectrophotometer.
In Vitro Cytotoxicity Assay
Cells. Friend leukemia cells (clone F 4N) were grown in Dulbeco’s modified Eagle medium (Gibco Laboratories, Gibco, Grand Island, New York), supple- mented with 10% calf serum, under 5% CO, atmosphere at 37°C. The cultures were passed every day at a concentration of 5 X lo5 cells/ml.
Cell Growth Assay. The compounds studied were dissolved immediately before use in DMSO to obtain stock solutions of various concentrations. Each of these solutions was then used at 1% concentration in the experiments. Control cells were incubated in the presence of 1% DMSO. The final concentration of DMSO in the medium did not affect the growth and the viability of the cells.
Exponentially growing cells were incubated in culture medium with varying amounts of the test compounds at 37°C in CO, atmosphere. After 24, 48, and 72 hr of drug exposure the cells were counted hemocytometrically. The number of dead cells was determined by staining with trypan blue. The average of two independent determinations was calculated.
The ID,, (50% inhibitory dose) was defined as drug concentration required to reduce the number of living cells by 50%.
RESULTS AND DISCUSSION
Characterization of the Complexes
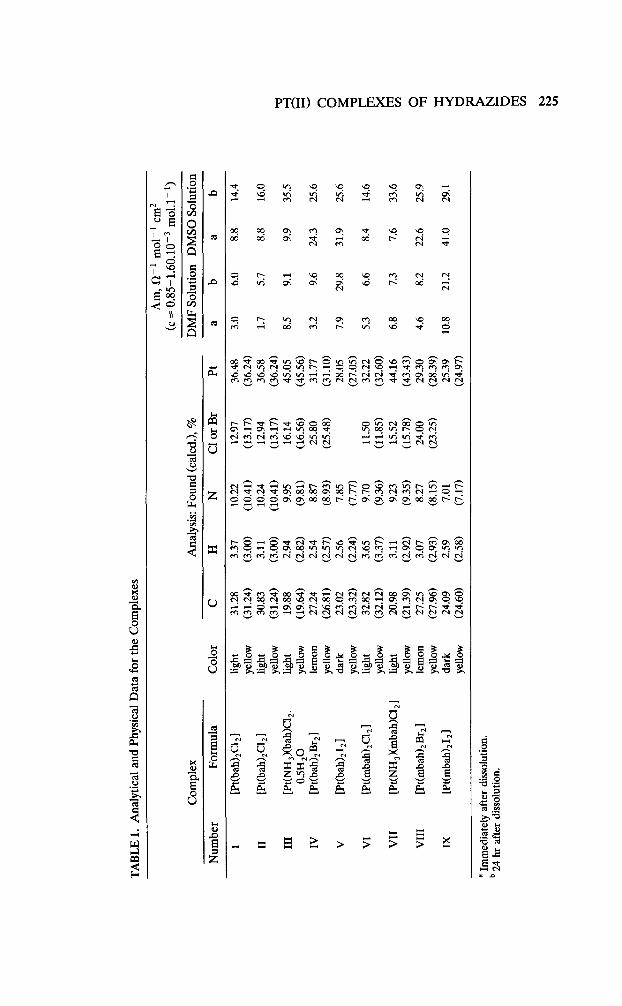
Table 1 contains the formulas and analytical and conductivity data for the complexes prepared.
By reacting aqueous solutions of K,[PtCl,] and bah in molar ratio 1:3, Kharitonov et al. [14] have isolated a complexwith formula [Pt(bah),Cl,l.O.SH,O. They claimed that the freshly prepared compound was soluble in hot ethanol and after recrystallization from this solvent a water-free complex was produced.
224 N. Dodoff et al.
Following their procedure for preparation of [Pt(bah)2C1,].0.5H,0, we obtained the water-free Complex I which (even freshly isolated) was insoluble in hot ethanol. We conducted a reaction of [PtCl,]‘- with bah in methanolic solution using the reagent (PhCH,NEt,),[PtCl,]. Under these conditions Complex II was isolated. This compound has the same composition as Complex I, prepared in water, but differs from it in some spectral characteristics and appears to be the same as the Kharitonov’s water-free complex [Pt(bah),Cl,l (see below).
All the complexes synthesized are stable at normal conditions, with the exception of I which was found to change on standing as indicated by its IR spectrum (see below). Complex III melts with decomposition at 1522160°C. The remaining complexes decompose without melting up to 300°C. The complexes are soluble in DMF and DMSO and are practically insoluble in water, with the exception of III which is slightly water-soluble.
Conductivity Measurements
The molar electric conductivity values (Table 1) for freshly prepared DMF solutions of all the complexes are typical for nonelectrolytes [25], indicating their nonionic nature. The A, values of DMF solutions measured 24 hr after dissolution of the complexes increased (especially for bromo- and iodo- complexes), suggesting that solvolysis was gone in some extent. The molar conductivity values measured in DMSO immediately after dissolution of the complexes were higher than those in DMF, and for the iodo-complexes they reached the values characteristic for 1: 1 electrolytes [25]. The A, values measured 24 hr later were in the range of 14.4-35.5 R--’ mall’ cm’, indicating a significant degree of solvolysis of the complexes. The higher molar conductiv- ity values for the complexes in DMSO in comparison to those in DMF are explainable since DMSO is known to be a stronger donor than DMF 1251.
Infrared Spectra
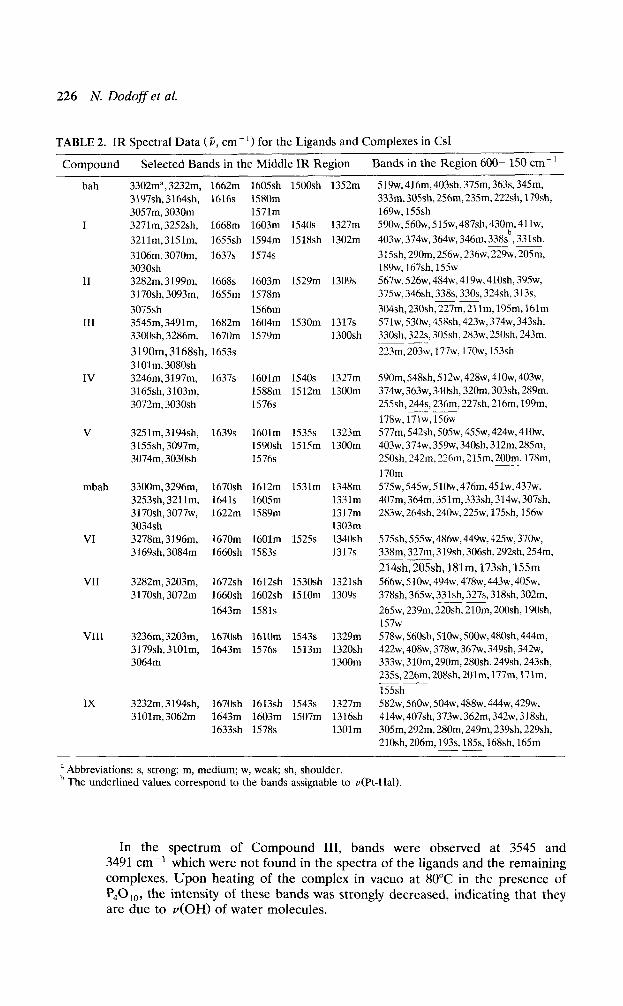
Two sampling techniques were applied for taking the IR spectra of the ligands and complexes: a) nujol mulls for the middle IR and polyethylene disks for the far IR region, and b) CsI disks for both spectral regions. This was done in order to establish whether a reaction between CsI and the complexes takes place. Both types of spectra were practically identical. Selected IR absorptions of the ligands and complexes are given in Table 2.
The IR spectrum of bah has been assigned by Mashima 126, 271 and the spectra of some platinum complexes of bah and mbah have been discussed by Kharitonov et al. [14, 161. The IR spectrum of Complex I was different than the spectrum of the complex [Pt(bah),Cl,].O.SH,O prepared by Kharitonov et al. 1141 under the same conditions. No bands were observed in the range of 3500 cm-’ in the spectrum of I in contrast to [Pt(bah),Cl,].0.5H,O, indicat- ing the absence of water in I. The spectrum of I was found to change upon standing; in Table 2, as well as in the remaining tables, the data for the freshly prepared compound are given. Complex II corresponds by its IR spectrum to the complex prepared by Kharitonov et al. [14] upon recrystallization of [Pt(bah),C1,1.0.5H,O from ethanol. The spectra of complexes VI and VIII are in accordance with those of the corresponding complexes prepared by Kharitonov et al. [16].
TAB
LE 1
. A
naly
tical
an
d Ph
ysic
al D
ata
for
the
Com
plex
es
Am
, a-
’ m
ol-
’ cm
2
(c =
0.8
5-1.
60.1
0-3
mol
.l-‘1
Com
plex
A
naly
sis:
Foun
d (c
alcd
.), %
D
MF
Solu
tion
DM
SO S
olut
ion
Num
ber
Form
ula
Col
or
C
H
N
Cl o
r B
r Pt
a
b a
b
I II
III
IV
V
VI VII
VII
I
IX
[Pt(
bah
)&l
[Pt(
NH
,Xba
h)C
l,.
OS
H,O
[Pt(
bah
),B
r,l
[Pt(
bah
IrIr
]
[Pt(
mba
h),
Cl,
]
[Pt(
NH
,Xm
bah
)CI,
]
[Pt(
mba
h),
Br,
]
[Pt(
mba
h),
I,l
ligh
t
iigh
t ye
llow
li
ght
yell
ow
lem
on
yell
ow
dark
ye
llow
li
ght
yell
ow
ligh
t
iem
on
yell
ow
dark
31.2
8 (3
1.24
) 30
.83
(31.
24)
19.8
8 (1
9.64
) 27
.24
(26.
81)
23.0
2 (2
3.32
) 32
.82
(32.
12)
20.9
8
(21.
39)
27.2
5 (2
7.96
) 24
.09
(24.
60)
3.37
(3.0
0)
3.11
(3.0
0)
2.94
(2
.82)
2.
54
(2.5
7)
2.56
(2
.24)
3.
65
(3.3
7)
3.11
(2
.92)
3.
07
(2.9
3)
2.59
(2
.58)
10.2
2 (1
0.41
) 10
.24
(10.
41)
9.95
(9
.81)
8.
87
(8.9
3)
7.85
(7
.77)
9.
70
(9.3
6)
(EZ
, a.
27
(8.1
5)
7.01
(7
.17)
12.9
7 (1
3.17
) 12
.94
(13.
17)
16.1
4 (1
6.56
) 25
.80
(25.
48)
11.5
0 (1
1.85
)
15.5
2 (1
5.78
) 24
.00
(23.
25)
36.4
8 (3
6.24
) 36
.58
(36.
24)
45.0
5 (4
5.56
) 31
.77
(31.
10)
28.0
5 (2
7.05
) 32
.22
(32.
60)
44.1
6
(43.
43)
29.3
0 (2
8.39
) 25
.39
(24.
97)
3.0
6.0
8.8
14.4
1.7
5.7
8.8
16.0
8.5
9.1
9.9
35.5
3.2
9.6
24.3
25
.6
7.9
29.8
31
.9
25.6
5.3
6.6
8.4
14.6
6.8
7.3
7.6
33.6
4.6
8.2
22.6
25
.9
10.8
21
.2
41.0
29
.1
a Im
med
iate
ly a
fter
dis
solu
tion
, b
24 h
r af
ter
diss
olu
tion
.
226 N. Dodoff et al.
TABLE 2. IR Spectral Data (5, cm-‘) for the Ligands and Complexes in CsI
Compound Selected Bands in the Middle IR Region Bands in the Region 600- 150 cm- ’
bah
I
II
III
IV
V
mbah
VI
VII
VIII
IX
3302m”, 3232m, 1662m 1605sh 15OOsh 3197sh, 3164sh, 1616s 1580m 3057m, 3030m 1571m 3271m, 3252sh, 1668m 1603m 1540s
3211m,3151m, 1655sh 1594m 1518sh
3106m, 3070m, 1637s 1574s 3030sh 3282m,3199m, 1668s 1603m 1529m 3 170sh, 3093m, 1655m 1578m
3075sh 1566m 3545m, 3491m, 1682m 1604m 1530m 33OOsh, 3286m, 1670m 1579m
3190m,3168sh, 1653s 3101m,3080sh 3246m,3197m, 1637s 1601m 1540s 3165sh, 3103m, 1588m 1512m 3072m. 3030sh 1576s
3251m,3194sh, 1639s 1601m 1535s 3155sh, 3097m, 1590sh 1515m 3074m, 3030sh 1576s
3300m, 3296m, 1670sh 1612m 1531m 1348m 3253sh, 3211m, 1641s 1605m 1331m 3170sh, 3077w, 1622m 1589m 1317m 3034sh 1303m 3278m, 3196m, 1670m 1601m 1525s 1340sh 3 169sh, 3084m 1660sh 1583s 1317s
3282m, 3203m, 1672sh 1612sh 1530sh 3 170sh, 3072m 1660sh 1602sh 1510m
1643m 1581s
3236m, 3203m, 1670sh 1610m 1543s 3179sh,3101m, 1643m 1576s 1513m 3064m
3232m, 3194sh, 1670sh 1613sh 1543s 1327m 3101m,3062m 1643m 1603m 1507m 1316sh
1633sh 1578s 1301m
1352m
1327m
1302m
1309s
1317s 1300sh
1327m 1300m
1323m 1300m
1321sh 1309s
1329m 1320sh
519w, 416m, 403sh, 375m, 363s 345m, 333m, 305sh,25hm, 235m. 222sh,179sh, 169w, 155sh 59Ow, 56Ow, 5 15w, 487sh, 430~ 41 lw,
403w, 374w, 364w, 346m, 338s ,331sh. __- 315sh, 290m, 256w, 236w, 229~. 205m. 189w, 167sh, 155~ 567w, 526w, 484w, 419w, 41Osh, 395w, 375w, 346sh, 338s 330s 324sh, 313s. __~ 304sh,23Osh,227m,211m, 195m, 161m 571w, 53Ow, 458sh, 423w, 374w, 343sh, 33Ush, 322s 305sh, 283w, 250sh, 243m,
223m,203w, 177w, 17Ow, 153sh
590m, 54&h, 5 12w, 428w, 41Ow, 403w, 374w, 363w, 340sh, 320m, 303sh, 289m. 255sh, 244s 236m, 227sh, 216m, 199m, _- 178w,171w,156w 577m,542sh, 505w,455w, 424w,41Ow, 403w, 374w, 359w, 340sh, 312m, 285m, 25&h, 242m, 22hm, 215m.200m, 178m,
170m 575w, 545w, 51Ow,476m, 451w, 437w, 407m,364m,351m,333sh,314w,307sh, 283w, 264sh. 24Ow, 225w, 175sh, 156~
575sh, 555w, 486w, 449w, 425w, 37Ow, 338m, 327m, 3 19sh, 306sh, 292sh. 254m, -- 214sh, 205sh, 181m, 173sh, 155m 566w, 5 1 Ow, 494w, 478~. 443w, 405w, 378sh, 365w, 33lsh, 327s, 318sh, 302m, -- 265w, 239m, 220sh, 21Om, 200sh, 190sh. 157w 578w, 560sh, 51oW, 50Ow,480sh, 444m, 422w, 408w, 378w, 367w, 349sh, 342~. 333w, 310m, 29Om, 280sh, 249sh, 243sh, 235s,226m,208sh, 201m, 177m, 171m. -___ 155sh 582w, 56Ow, 504w, 488w, 444w, 429w, 414w,407sh,373w,362m,342w,318sh, 305m, 292m, 280m. 249m, 239sh, 229sh, 21 Osh, 206m, 193s. 185s 168sh, 165m -_
a Abbreviations: s, strong; m, medium; w, weak; sh, shoulder. b The underlined values correspond to the bands assignable to v(Pt-Hal).
In the spectrum of Compound III, bands were observed at 3545 and 3491 cm-’ which were not found in the spectra of the ligands and the remaining complexes. Upon heating of the complex in vacua at 80°C in the presence of P,O,,, the intensity of these bands was strongly decreased, indicating that they are due to v(OH) of water molecules.
PT(I1) COMPLEXES OF HYDRAZIDES 227
According to Refs. [14, 16, 271, the bands in the range of 3302-3030 cm-’ observed in the spectra of the ligands and complexes can be assigned to NH and NH, stretching vibrations. Low-frequency shift of these bands in the spectra of the complexes in comparison to the free hgands takes place. This is an indication of coordination of the nitrogen atoms [14, 161. The NH,-stretching vibrations of Complexes III and VII could also fall in the above mentioned interval [28].
Following the assignments of Mashima [27], the bands at 1662 and 1616 cm-i in the spectrum of bah are due to Amide I and 6(NH,) vibrations, respectively, and those at 1605, 1590, and 1571 cm-* to v(C-C) vibrations of the aroma- tic ring. The corresponding bands for mbah were found at 1670, 1641, and 1622 cm-” (Amide I and 6(NH,)) and at 1612,1605, and 1589 cm-’ (v(C-C),,>. In the spectra of the complexes prepared by us, two groups of bands were observed in the interval of 1682-1566 cm-’ where Amide I, S(NH,), and .(C-Cl, vibrations are expected. For a series of complexes [PtL,X,] (L = bah, l-, 2-, and 3-methoxybenzoic acid hydrazide; X = Cl, Br), Kharitonov et al. [14, 161 have assigned the bands in the range of 1675-1625 cm-’ to Amide I and those in the range of 1610-1585 cm-’ to S(NH,) vibrations, but no assignments have been given for ZJ(C-Cl,, vibrations. It seems most acceptable to ascribe the bands in the range of 1682-1633 cm-’ observed in the spectra of the complexes prepared by us to Amide I and S(NH,) vibrations, whereas those in the inter- val of 1613-1566 cm-’ to .(C-C), vibrations. The assignments are addition- ally complicated for the ammonia-containing complexes III and VII since the S,(NH,) bands, as well as the S(OH) bands of water, are also expected in the range of about 1600 cm-’ [28].
The bands in the interval of 1543-1507 cm-’ observed in the spectra of the ligands and complexes can be assigned to Amide II vibrations [27, 291, whereas those in the range of 1352-1300 cm-’ to the &NH,) vibrations [14,16,27]. For complexes III and VII the latter can be expected to overlap with the a&NH,) bands [28].
In the far IR region, bah and mbah exhibit numerous absorptions, thus complicating the identification of the metal-ligand bands of the complexes. Nevertheless, in accordance with Refs. [14, 161, the pairs of bands in the intervals of 338-322 cm-’ (for Complexes I, II, III, VI, and VII) and of 244- 226 cm-” (for IV and VIII) are assignable to Pt-Cl and Pt-Br stretch- ings, respectively. The doublet character of these bands is an indication of c~-configuration [28, 301 of the complexes. The band at 200 cm-’ in the spec- trum of V and those at 193 and 185 cm-l in the spectrum of IX could be attributed to Pt-I stretchings; in the same region Y(Pt-I) bands for some diaminediiodoplatinum complexes have been found 131, 321.
‘H NMR Spectra
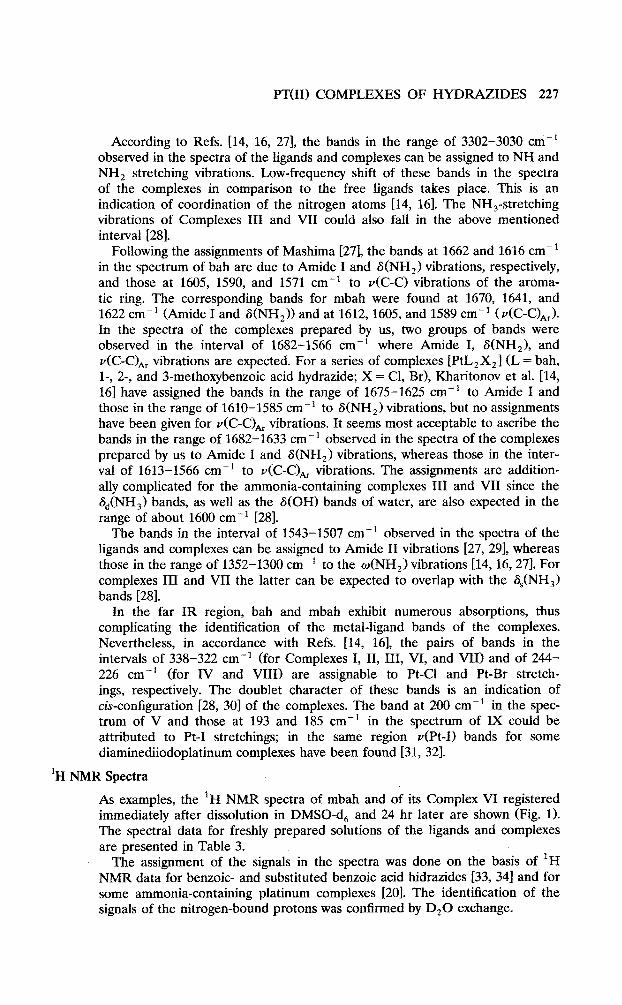
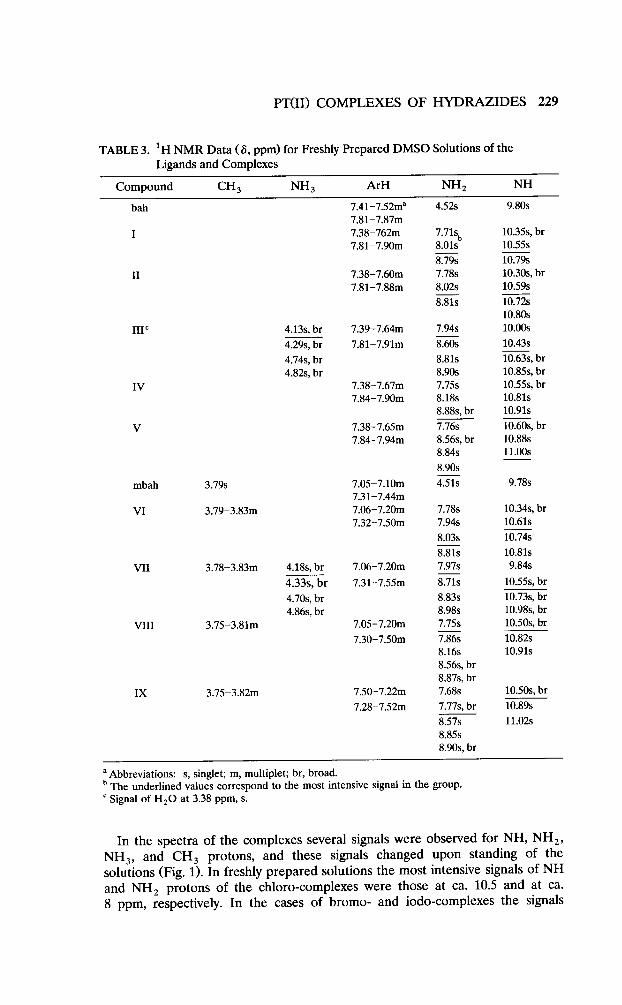
As examples, the ‘H NMR spectra of mbah and of its Complex VI registered immediately after dissolution in DMSO-d, and 24 hr later are shown (Fig. 1). The spectral data for freshly prepared solutions of the Iigands and complexes are presented in Table 3.
The assignment of the signals in the spectra was done on the basis of iH NMR data for benzoic- and substituted benzoic acid hidrazides [33, 341 and for some ammonia-containing platinum complexes [20]. The identification of the signals of the nitrogen-bound protons was unfixed by D,O exchange.

228 N. Dodoff et al.
.
(a)
J
-1 0 1 2 3 4 5 6 7 0 9 l0 1112
-1 0 1 2 3 4 5 6 7 8 9 10 11 12
, , I .I, ., ., * , 1 . I , ,
-1 0 1 2 3 4 5 6 7 8 9 10 II 12
6. ppm FIGURE 1. ‘H NMR spectra in DMSO-d,: (a) mbah, (b) [Pt(mbah),Cl,] immediately after dissolution, (c) [Pt(mbah),CI,] 24 hr after dissolution. The signals at 2.5 and at ca. 3.5 ppm are due to the presence of DMSO-d, and H,O, respectively, in the solvent.
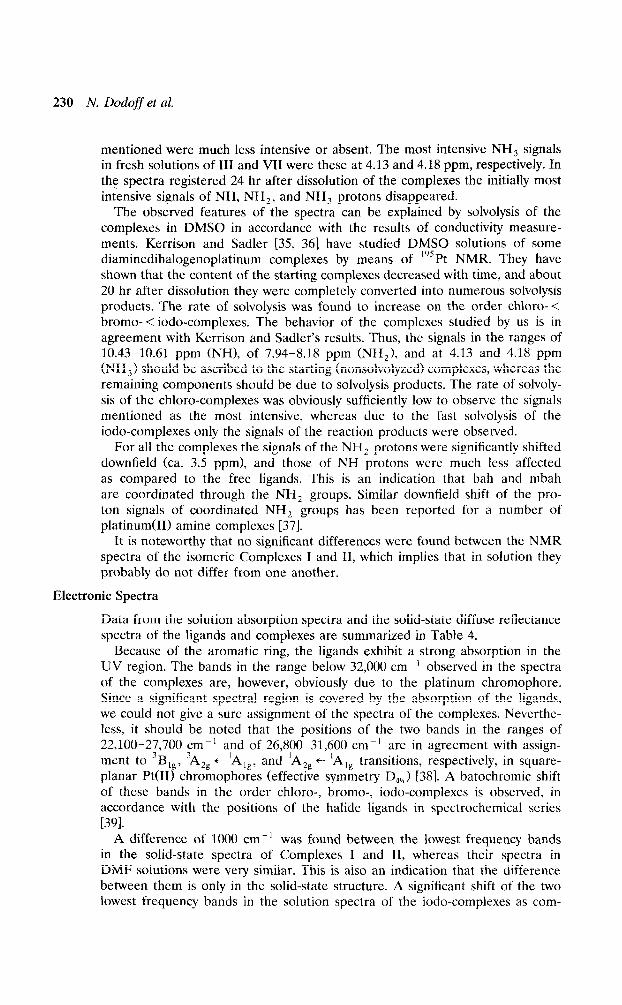
230 N. Dodoff et al.
mentioned were much less intensive or absent. The most intensive NH, signals in fresh solutions of III and VII were these at 4.13 and 4.18 ppm, respectively. In the spectra registered 24 hr after dissolution of the complexes the initially most intensive signals of NH, NH,, and NH, protons disappeared.
The observed features of the spectra can be explained by solvolysis of the complexes in DMSO in accordance with the results of conductivity measure- ments. Kerrison and Sadler [3.5, 361 have studied DMSO solutions of some diaminedihalogenoplatinum complexes by means of “‘Pt NMR. They have shown that the content of the starting complexes decreased with time, and about 20 hr after dissolution they were completely converted into numerous solvolysis products. The rate of solvolysis was found to increase on the order chloro-< bromo- < iodo-complexes. The behavior of the complexes studied by us is in agreement with Kerrison and Sadler’s results. Thus, the signals in the ranges of 10.43-10.61 ppm (NH), of 7.94-8.18 ppm (NH,), and at 4.13 and 4.18 ppm (NH,) should be ascribed to the starting (nonsolvolyzed) complexes, whereas the remaining components should be due to solvolysis products. The rate of solvoly- sis of the chloro-complexes was obviously sufficiently low to observe the signals mentioned as the most intensive, whereas due to the fast solvolysis of the iodo-complexes only the signals of the reaction products were observed.
For all the complexes the signals of the NH2 protons were significantly shifted downfield (ca. 3.5 ppm), and those of NH protons were much less affected as compared to the free ligands. This is an indication that bah and mbah are coordinated through the NH, groups. Similar downfield shift of the pro- ton signals of coordinated NH, groups has been reported for a number of platinum(B) amine complexes [37].
It is noteworthy that no significant differences were found between the NMR spectra of the isomeric Complexes I and II, which implies that in solution they probably do not differ from one another.
Electronic Spectra
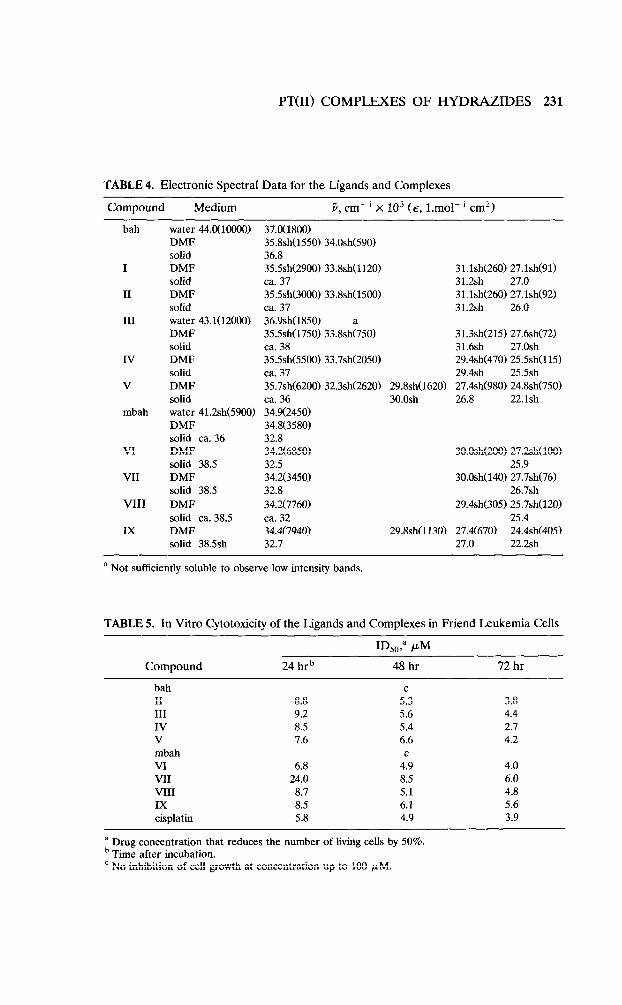
Data from the solution absorption spectra and the solid-state diffuse reflectance spectra of the ligands and complexes are summarized in Table 4.
Because of the aromatic ring, the ligands exhibit a strong absorption in the UV region. The bands in the range below 32,000 cm --I observed in the spectra of the complexes are, however, obviously due to the platinum chromophore. Since a significant spectral region is covered by the absorption of the ligands, we could not give a sure assignment of the spectra of the complexes. Neverthe- less, it should be noted that the positions of the two bands in the ranges of 22,100-27,700 cm-’ and of 26,800-31,600 cm-’ are in agreement with assign- ment to ‘Big, ‘AZg +‘Alg, and ‘A,, + ‘Alg transitions, respectively, in square- planar Pt(I1) chromophores (effective symmetry D,,) [38]. A batochromic shift of these bands in the order chloro-, bromo-, iodo-complexes is observed, in accordance with the positions of the halide ligands in spectrochemical series [391.
A difference of 1000 cm _’ was found between the lowest frequency bands in the solid-state spectra of Complexes I and II, whereas their spectra in DMF solutions were very similar. This is also an indication that the difference between them is only in the solid-state structure. A significant shift of the two lowest frequency bands in the solution spectra of the iodo-complexes as com-
PT(I1) COMPLEXES OF HYDFWZIDES 231
TABLE 4. Electronic Spectral Data for the Ligands and Complexes
Compound Medium 5, cm-’ X lo3 (E, l.mol-’ cm2)
bah
I
II
III
IV
V
mbah
VI
VII
VIII
IX
water 44.CWlOOO) DMF solid DMF solid DMF solid water 43.1(12000) DMF solid DMF solid DMF solid water 41.2sh(5900) DMF solid ca. 36 DMF solid 38.5 DMF solid 38.5 DMF solid ca. 38.5 DMF solid 38.5sh
37.0(1800) 35%sh(1550) 34.OshC590) 36.8 35.5shC2900) 33.8shC1120) 31.lsh(260) 27.lsh(91) ca. 37 31.2sh 27.0 35.5sh(3000) 33.8sh(1500) 31.lsh(260) 27.lshC921 ca. 37 31.2sh 26.0 36.9shC1850) 355sh(1750) 33.8sh;750) 31.3sh(2151 27.6shC72) ca. 38 31.6sh 27.0sh 35.5sh(5500) 33.7shC2050) 29.4sh(4701 25.5shC115) ca. 37 29.4sh 25.5sh 35.7shC6200) 32.3shC2620) 29%sh(1620) 27.4shC980) 24.8shC7501 ca. 36 30.0sh 26.8 22.lsh 34.9(2450) 34.8(3580) 32.8 34.2(6850) 30.Osh(200) 27.2shClOOl 32.5 25.9 34.2(3450) 30.0sh(140) 27.7shC761 32.8 26.7sh 34.2(7760) 29.4sh(305) 25.7sh020) ca. 32 25.4 34x7940) 29.8shCl130) 27.4(6701 24.4shC405) 32.7 27.0 22.2sh
a Not sufficiently soluble to observe low intensity bands.
TABLE 5. In Vitro Cytotoxicity of the Ligands and Complexes in Friend Leukemia Cells
ID M 5”Ta P
Compound 24 hrb
__
48 hr 72 hr
bah II III IV V mbah VI VII VIII IX cisplatin
8.8 9.2 8.5 7.6
6.8 24.0
8.7 8.5 5.8
5c3 5.6 5.4 6.6
4c9 8.5 5.1 6.1 4.9
3.8 4.4 2.7 4.2
4.0 6.0 4.8 5.6 3.9
a Drug concentration that reduces the number of living cells by 50%. b Time after incubation. ’ No inhibition of cell growth at concentration up to 100 PM.
pared to their solid-state spectra was observed. This might be due to solvolysis of the complexes in DMF. For the remaining complexes the differences between the solution- and solid-state spectra were less manifested.
The results of the elemental analysis, conductivity measurements, and spectral data for the complexes studied are in accordance with a c&square-planar structure with hydrazide ligands coordinated via the NH, groups.
Cytotoxic Effect
The growth-inhibitor effect of the ligands bah and mbah and their Complexes II-IX was examined on Friend leukemia cells in culture at different times after incubation with various concentrations of the compounds. The antitumor drug cisplatin was used as a positive control under the same conditions. The results are presented in Table 5. The complexes were found to have similar cytotoxic effect (ID,, values in the range of 6.8-9.2 E_~M after 24 hr incubation) compar- able with that of cisplatin (ID,,, = 5.8 PM). Only Complex VII was a little less inhibitory (ID,, = 24 wM). None of the complexes was more toxic than cisplatin during 72 hr of drug exposure. At the same time, the ligands bah and mbah did not inhibit the growth of cells at concentrations as high as 100 PM.
It is of particular interest to study the in vivo antitumor activity of these platinum complexes.
This work WLD supposed by grunt No. X-III of the ~uf~ona~ Fund for Scientific Reseurch nt the Bulgarian Ministry of Education, Science and Culture.
REFERENCES
1.
2. 3. 4. 5. 6. 7.
8.
9.
10. 11.
12. 13. 14. 15.
16.
M. P. Hacker, E. B. Douple, and I. H. Krakoff, Eds., Platinum Coordination Complexes in Cancer Chemotherapy, Martinus Nijhoff, Boston, 1984. P. C. Hydes and M. J. H. Russell, Cancer MetastusB Reu. 7, 67 (1988). T. Zsolnay, Biochem. Pharmacol. 11, 995 (1962). A. Kar, H. C. Gugnani, and U. A. Madumere, Pharmazie 35,466 (1980). G. W. Riggin and T. W. Schultz, Trans. Am. Microsc. Sot. 105, 197 (1986). Y. Takatsuka, T. Fukui, and K. Yoshida, Mie Med. J. 17, 83 (1967). H. Rutner, N. Lewin, E. C. Woodbury, T. J. McBride, and K. V. Rao, Cancer Chemother. Rep., Purt 1 58, 803 (1974). A. V. Tret’yakov, E. A. Ratovitskii, A. S. Peterov, and W. A. Golovatova, Vopr. Med. Khim. 29, 98 (1983). A. V. Tret’yakov, F. D. Onishchuk, and V. A. Filov, By&. Eksp. Biol. Med. 107, 200 (1989). K. K. Narang and M. Singh, Synth. React. Znorg. Met.-Org. Chem. 15, 821 (1985). K. K. Narang, J. P. Pandey, K. P. Singh, and P. K. Rai, Synth. React. Inorg. Met.-0% Chem. 20, 1301 (1990). Yu. Ya. Kharitonov and R. I. Machkhoshvili, Zh. Neorg. Khim. 16, 924 (1971). Yu. Ya. Kharitonov and R. I. Machkhoshviii, Zh. Neorg. Khim. 16, 1605 (1971). Yu. Ya. Kharitonov and R. I. Machkhoshvili, Zh. Neorg. Khim. 16, 1139 (1971). Yu. Ya. Kharitonov, R. I. Machkhoshv~li, A. N. Kravchenko, and R. N. Shchelokov, Zh. Neorg. Khim. 20, 275 (1975). Yu. Ya. Kharitonov, R. I. Machkhoshv~I~, A. N. Kravchenko, and R. N. Shchelokov, Koord. Khim. 1, 323 (1975).

F’T(I1) COMPLEXES OF HYDRAZIDES 233
17. P. L. Bellon, S. Cenini, F. Demartin, M. Manassero, M. Pizzotti, and F. Porta, J. Chem. Sot., Dalton Trans., 2060 (1980).
18. N. C. Spassovska, P. R. Bontchev, K. C. Grancharov, and E. V. Golovinsky, Bulgarian Patent., Reg. No 54667 (1981).
19. N. Dodoff, N. Spassovska, and S. Varbanov, Z. Naturforsch., B 44, 1323 (1989). 20. M. Muiri, M. E. Cadiz, and A. Baez, Znorg. Chim. Acta 151, 209 (1988). 21. G. Struve, J. Prakt. Chem. 50, 295 (1894). 22. K. Hutton, .Z. Org. Chem. 20, 855 (1955). 23. J. W. Mellor, A Comprehensive Treatise on Inorganic and Theoretical Chemistty,
Longmans, London, 1957, p. 375. 24. S. C. Dhara, Indian J. Chem. 8, 193 (1970). 25. W. J. Gear-y, Coord. Chem. Rev. 7, 81 (1971). 26. M. Mashima, Bull. Chem. Sot. Japan 35, 332 (1962). 27. M. Mashima, Bull. Chem. Sot. Japan 36, 210 (1963). 28. K. Nakamoto, Infrared and Raman Spectra of Inorganic and Coordination CornRounds,
Wiley, New York, 1978, Part III. 29. E. Cardillo, E. Giorgini, E. Maurelli, and G. Tosi, Monatsh. Chem. 123, 231 (19921. 30. R. H. Nuttall, Tahznta 15, 157 (1968). 31. S. Haghighi, C. A. McAuliffe, W. E. Hill, H. H. Kohl, and M. E. Friedman, Znorg.
Chim. Acta 43, 113 (1980). 32. A. Benedetti, C. Preti, and G. Tosi, .Z. Mol. Struct. 116, 397 (1984). 33. E. V. Titov, L. M. Kapkan, V. I. Rybachenko, and N. G. Korzhenevskaya, Reakts.
Sposobnost Org. Soed. 5, 673 (1968). 34. S. TumkeviEius and P. Vainilavicius, Org. Reactivity (Tartu) 20, 85 (1983). 35. S. J. S. Kerrison and P. J. Sadler, J. Chem. Sot., Chem. Commun., 861 (1977). 36. S. J. S. Kerrison and P. J. Sadler, Znorg. Chim. Acta 104, 197 (1985). 37. P. Bitha, S. G. Carvajal, R. V. Citarella, E. F. Delos Santos, F. E. Durr, J. J. Hlavka,
S. A. Lang Jr., L. J. P. Thomas, R. E. Vallace, and Y. Lin, J. Med. Chem. 32, 2063 (1989).
38. R. F. Fenske, D. S. Martin Jr., and K. Ruedenberg, Znorg Chem. 1, 441 (1962). 39. A. B. P. Lever, Inorganic Electronic Spectroscopy (Russian Edition), Mir, Moskow,
1987, Vol. II.
Received June 11, 1993; accepted July 14, 1993