
cytotoxic activity of indian, indonesian and uk plant extracts on ...
320
CYTOTOXIC ACTIVITY OF INDIAN, INDONESIAN AND UK PLANT EXTRACTS ON BREAST CANCER CELLS A thesis submitted for the degree of Doctor of Philosophy by Susan Jane Wagland Department of Life Sciences, College of Health and Life Sciences, Brunel University London October 2015
-
Upload
khangminh22 -
Category
Documents
-
view
3 -
download
0
Transcript of cytotoxic activity of indian, indonesian and uk plant extracts on ...

CYTOTOXIC ACTIVITY OF INDIAN,
INDONESIAN AND UK PLANT EXTRACTS
ON BREAST CANCER CELLS
A thesis submitted for the degree of Doctor of
Philosophy
by
Susan Jane Wagland
Department of Life Sciences, College of Health and Life
Sciences, Brunel University London
October 2015

i
Abstract
Many plants in biodiversity hotspots have not yet been screened for biological activity
in humans. Plants synthesise secondary metabolites that may be unique to each
species or induced in response to specific conditions. Assam in North East India forms
part of the Indo-Burma biodiversity hotspot for conservation and is a rich source of
medicinal plants for traditional Indian medicine. This study concerns the potential
cytotoxic effects of three Assamese medicinal plant extracts, from Clitoria ternatea root,
Mucuna pruriens seed and Cheilocostus speciosus rhizome. The aim of the study was
to characterise the cytotoxic activity, to elucidate the biological mechanism and to
isolate the bioactive agents for further investigation. Clitoria was prioritised for study, as
its crude extract was found to have a dose related, cytotoxic effect that was 2-3 fold
more effective on breast cancer cells than non-cancer cells. Two bioactive fractions of
Clitoria were isolated in bioassay-led fractionation with high performance liquid
chromatography. The fractions demonstrated a selective dose related cytotoxic effect
over a range of 100 to 700 ng/µL. In live cell observation, crude extract and a bioactive
fraction were cytostatic at non-lethal treatment doses, and crude extract reduced cells’
motility by 50%. Both crude extract and fractions caused structural changes in the actin
cytoskeleton which could be contributing to the cytotoxic and cytostatic effects and
reduced motility. Liquid Chromatography-Mass Spectrometry analysis indicates that the
two isolated bioactive agents are novel homoisoflavones, polyphenolic secondary
metabolites, which were also detected in extracts made from Indonesian sourced
Clitoria root and are likely to be in extract made from UK sourced Clitoria root. Results
suggest that bioactive components of Clitoria extract are worthy of further study and
may provide lead compounds for new cytotoxic or antiproliferative anti-cancer
therapies.

ii
Declaration
I, Susan Jane Wagland, declare that this thesis is my own work.
Signed ___________________________________ Date___________________
iii
Table of Contents
Table of Contents .........................................................................................................iii
List of Figures ............................................................................................................... x
List of Tables ........................................................................................................... xvii
Glossary.........................................................................................................................xx
Acknowledgments ..................................................................................................... xxiii
Chapter 1 Introduction .............................................................................................. 1
1.1 Breast cancer ................................................................................................. 1
1.2 Breast cancer therapies .................................................................................. 3
1.2.1 Introduction .............................................................................................. 3
1.2.2 Surgery .................................................................................................... 4
1.2.3 Radiotherapy ........................................................................................... 4
1.2.1 Chemotherapy ......................................................................................... 5
1.2.2 Targeted treatments ................................................................................ 8
1.2.2.1 Hormone therapy ......................................................................................... 11
1.2.2.2 Biological therapy ........................................................................................ 14
1.2.2.3 New developments in targeted treatments .................................................. 16
1.3 Cell death and chemotherapy ....................................................................... 18
1.4 The cytoskeleton in cancer ........................................................................... 22
1.4.1 Introduction ............................................................................................ 22
1.4.2 Microtubules in cell division ................................................................... 23
1.4.3 Drugs that target microtubules ............................................................... 24
iv
1.4.4 Actin filaments in cell motility ................................................................. 28
1.4.5 Actin filaments in cell division................................................................. 33
1.4.6 Drugs that target the actin cytoskeleton ................................................. 34
1.4.7 The need for new drugs ......................................................................... 36
1.5 Sources of new drugs ................................................................................... 37
1.5.1 Introduction ............................................................................................ 37
1.5.2 Target-based and phenotypic drug discovery ........................................ 38
1.5.3 Natural product drug discovery .............................................................. 40
1.6 Traditional medicine systems ........................................................................ 45
1.6.1 Traditional Chinese Medicine ................................................................. 45
1.6.2 Indian traditional medicine ..................................................................... 47
1.7 Aims and objectives of this study .................................................................. 48
1.7.1 Clitoria ternatea ..................................................................................... 48
1.7.2 Mucuna pruriens .................................................................................... 50
1.7.3 Cheilocostus speciosus ......................................................................... 51
1.7.4 Specific aims ......................................................................................... 52
1.7.5 Objectives .............................................................................................. 52
1.7.6 How this thesis is organised .................................................................. 53
Chapter 2 Materials and methods .......................................................................... 55
2.1 Preparation of plant extracts ......................................................................... 55
2.1.1 Sources of plant material ....................................................................... 55
2.1.2 Preparation of extracts ........................................................................... 56

v
2.2 Tissue culture ............................................................................................... 57
2.2.1 Cell lines ................................................................................................ 57
2.2.2 Cell maintenance ................................................................................... 58
2.2.3 Passaging .............................................................................................. 59
2.2.4 Cell storage, freezing and recovery ....................................................... 60
2.2.5 Cell counting .......................................................................................... 60
2.3 Cell doubling times ....................................................................................... 61
2.4 Cell viability assays ....................................................................................... 61
2.4.1 MTT protocol ......................................................................................... 62
2.4.2 PrestoBlue protocol ............................................................................... 63
2.4.3 Methylene blue assay protocol............................................................... 63
2.4.4 Dilution of biochanin A for cell viability assays ....................................... 64
2.4.5 Calculation of estimated half maximal inhibitory concentration from cell
viability assays ..................................................................................................... 64
2.4.6 Method development for cell viability assays ......................................... 65
2.4.6.1 Establishing optimum seeding density for MTT and PrestoBlue assays ......... 65
2.4.6.2 Establishing vehicle concentration ............................................................... 67
2.4.6.3 Establishing optimum incubation time for PrestoBlue assay ......................... 68
2.5 Cell counting assay ....................................................................................... 69
2.6 Metaphase spread preparation and counting ................................................ 70
2.7 Fluorescence microscopy ............................................................................. 71
2.7.1 Protocol ................................................................................................. 71
vi
2.7.2 Apoptosis assays ................................................................................... 73
2.8 Actin density measurement ........................................................................... 75
2.9 Live cell imaging ........................................................................................... 75
2.10 Movement tracking ....................................................................................... 76
2.11 Membrane ruffling ......................................................................................... 76
2.12 Phase contrast imaging ................................................................................ 77
2.13 High Performance Liquid Chromatography ................................................... 77
2.13.1 Chemicals .............................................................................................. 77
2.13.2 System .................................................................................................. 77
2.13.3 Instrument method ................................................................................. 78
2.13.4 Analytical HPLC ..................................................................................... 78
2.13.5 Semi-preparative and preparative fraction collection .............................. 78
2.13.6 Fraction drying and weighing ................................................................. 79
2.13.7 Preparing remixed fractions after HPLC ................................................. 79
2.13.8 Method scale-up from semi-preparative to preparative fractionation ...... 79
2.13.9 Calculation of retention factor ................................................................ 80
2.14 Liquid chromatography-mass spectrometry analysis ..................................... 80
2.15 Fourier transform infrared spectroscopy........................................................ 81
2.16 Chemical databases ..................................................................................... 81
2.17 Statistics ....................................................................................................... 82
Chapter 3 Cytotoxicity in Clitoria root extract .......................................................... 83
3.1 Introduction ................................................................................................... 83

vii
3.2 Results ......................................................................................................... 86
3.2.1 Cytotoxicity of the three Indian extracts ................................................. 86
3.2.2 Selective killing in Clitoria ...................................................................... 91
3.2.3 The relationship between cell doubling time and sensitivity ................... 96
3.2.4 Karotypes of cell lines tested ................................................................. 98
3.3 Discussion .................................................................................................. 100
3.4 Next steps ................................................................................................... 106
Chapter 4 High Performance Liquid Chromatography fractionation of extracts ..... 107
4.1 Introduction ................................................................................................. 107
4.2 Results ....................................................................................................... 112
4.2.1 Method development: Establishing optimum separation methods in
analytical HPLC ................................................................................................. 112
4.2.2 Semi-preparative fractionation of Clitoria with HPLC analytical column 116
4.2.3 Fractionation of Clitoria with preparative HPLC .................................... 119
4.2.1 Fractionation of Cheilocostus extract ................................................... 127
4.3 Discussion .................................................................................................. 128
4.4 Next steps ................................................................................................... 132
Chapter 5 Mechanism of action ............................................................................ 133
5.1 Introduction ................................................................................................. 133
5.2 Results ....................................................................................................... 135
5.2.1 Cell division ......................................................................................... 135
5.2.2 Cell movement ..................................................................................... 141
5.2.3 Cytoskeletal proteins ........................................................................... 142
viii
5.2.4 Nucleoli ................................................................................................ 149
5.2.5 Cytoskeletal proteins after fraction treatment ....................................... 164
5.2.6 Cell death ............................................................................................ 164
5.2.7 Summary ............................................................................................. 167
5.3 Discussion .................................................................................................. 169
5.4 Next steps ................................................................................................... 177
Chapter 6 Alternative sources of Clitoria .............................................................. 178
6.1 Introduction ................................................................................................. 178
6.2 Results ....................................................................................................... 181
6.2.1 Comparison of Clitoria extracts from Indonesia and UK in HPLC ......... 181
6.2.2 Fractionation of Indonesian Clitoria extract .......................................... 189
6.2.3 Comparison of fractions from Indian and Indonesian extracts .............. 197
6.2.4 Indonesian extraction conditions .......................................................... 200
6.3 Discussion .................................................................................................. 201
6.4 Next steps ................................................................................................... 206
Chapter 7 Results: Identification of bioactive agents in Clitoria root extract .......... 207
7.1 Introduction ................................................................................................. 207
7.2 Results ....................................................................................................... 211
7.2.1 Evidence for flavonoids ........................................................................ 211
7.2.2 Comparison of Indian Clitoria extracts ................................................. 212
7.2.3 Structural elucidation of compounds in Clitoria major peaks ................ 213
7.2.4 Non-polar bioactive compounds ........................................................... 216

ix
7.2.5 Biochanin A candidate compound ........................................................ 218
7.3 Discussion .................................................................................................. 222
Chapter 8 Discussion ........................................................................................... 228
8.1 Introduction ................................................................................................. 228
8.2 Major findings ............................................................................................. 230
8.3 Cytotoxic mechanism .................................................................................. 232
8.4 Limitations .................................................................................................. 240
8.5 Further work ............................................................................................... 241
8.6 Conclusion .................................................................................................. 242
References..................................................................................................................245
Appendix A: Compounds in Indian plants .................................................................. 285
Appendix B: Calculation of treatment dose for fractions after fractionation of Indian
Clitoria and Cheilocostus .......................................................................................... 291
Appendix C: Calculation of treatment dose for fractions after fractionation of Indonesian
Clitoria.........................................................................................................................293
Appendix D: Supplementary information ................................................................... 296

x
List of Figures
Figure 1-1: Diagram of lactating human breast. ............................................................ 2
Figure 1-2: Estrogen-ER complex initiates transcription of pro-growth genes in classical
and non-classical modes of action. ............................................................................. 10
Figure 1-3: HER2 signalling in breast cancer.. ............................................................ 11
Figure 1-4: Drugs targeting the estrogen receptor.. ..................................................... 13
Figure 1-5: Simplified model of the intrinsic and extrinsic apoptotic pathways.. ........... 20
Figure 1-6: Growth and shrinkage of a microtubule.. ................................................... 23
Figure 1-7: The cell cycle. A: Phases of the cell cycle and checkpoints.. .................... 25
Figure 1-8: Simplified model of growth of branched actin. ........................................... 29
Figure 1-9: Myosin II dimer structure, actomyosin structure and contractility mechanism
in minifilament. ............................................................................................................ 30
Figure 1-10: Schematic of actin fibres in a migrating fibroblast and the protrusion and
retraction cycle. ........................................................................................................... 32
Figure 1-11: Sources of new chemical entities introduced worldwide excluding Russia
and China, 1981-2010 and example anticancer drugs of each type.. .......................... 37
Figure 1-12: Schematic of the conventional approach for drug discovery, either target-
based or phenotypic. ................................................................................................... 38
Figure 1-13: Industry success rates at each preclinical and clinical phase of candidate
drug development 2005-2010 and description of phases of drug development ........... 39
Figure 1-14: A generic strategy for drug development from natural products in three
stages.. ....................................................................................................................... 43
Figure 1-15: Flowers of Clitoria ternatea, Mucuna pruriens, Cheilocostus speciosus. I.
................................................................................................................................... 49
xi
Figure 2-1: Diagram for calculating half maximal inhibitory concentration (IC50) .......... 65
Figure 2-2: Seeding density in MTT assays for measurement of cell death.. ............... 66
Figure 2-3: Seeding density in PrestoBlue assays for measurement of cell death.. ..... 67
Figure 2-4: Cells’ sensitivity to vehicle......................................................................... 68
Figure 2-5: Comparison of different incubation times for PrestoBlue assay. ................ 69
Figure 3-1: Cytotoxicity of Clitoria and Cheilocostus on breast cancer cells. ............... 84
Figure 3-2: Strategy for isolation of natural products showing the approach taken in this
study with Indian plant extracts.. ................................................................................. 84
Figure 3-3: Cytotoxicity of Clitoria and Cheilocostus on ER negative breast cancer
cells. ........................................................................................................................... 87
Figure 3-4: Cytotoxicity of Clitoria and Cheilocostus on ER positive and ER negative
breast cancer cells. ..................................................................................................... 89
Figure 3-5: Cytotoxicity of Clitoria and Cheilocostus on normal cells.. ......................... 90
Figure 3-6: Absence of cytotoxicity in Mucuna. ........................................................... 91
Figure 3-7: Difference in potency between Clitoria extracts CE and CE(B). ................ 92
Figure 3-8: Difference in sensitivity to Clitoria between cancer and non-cancer cells.. 93
Figure 3-9: Consistent difference in cell viability between cancer and normal cells after
Clitoria treatment......................................................................................................... 93
Figure 3-10: Cytotoxicity of Clitoria extract CE(B) on cancer cells compared to
treatment time. ............................................................................................................ 94
Figure 3-11: Cytotoxicity of Clitoria on primary breast epithelial cells compared to
treatment time.. ........................................................................................................... 95
Figure 3-12: Cytotoxicity of Clitoria extract on MDA-MB-231 cancer cells compared to
treatment time.. ........................................................................................................... 95
xii
Figure 3-13: Growth of MDA-MB-231 breast cancer epithelial cells and 2DD normal
fibroblasts.. ................................................................................................................. 96
Figure 3-14: Cytotoxicity of Clitoria on primary breast epithelial cells with different
doubling times. ............................................................................................................ 97
Figure 3-16: Example metaphase spreads.. ................................................................ 99
Figure 4-1: Strategy for isolation of natural products showing the approach taken in this
study with Indian plant extracts.. ............................................................................... 110
Figure 4-2: Chromatograms from initial method with Clitoria, Mucuna, Cheilocostus..
................................................................................................................................. 113
Figure 4-3: Chromatogram for separation method developed for Clitoria. ................. 114
Figure 4-4: Chromatogram for separation method developed for Mucuna.. ............... 115
Figure 4-5: Chromatogram for separation method developed for Cheilocostus. ........ 115
Figure 4-6: Bioactivity is retained after HPLC.. .......................................................... 116
Figure 4-7: Bioassay after semi-preparative fractionation of Clitoria on analytical
column.. .................................................................................................................... 117
Figure 4-8: Bioassay after semi-preparative fractionation of Clitoria on analytical
column.. .................................................................................................................... 118
Figure 4-9: Comparison of chromatograms from semi-preparative and preparative
fractionation of Clitoria extracts.. ............................................................................... 120
Figure 4-10: Bioassay after preparative fractionation of Clitoria.. .............................. 122
Figure 4-11: Images of cells treated with Clitoria fraction F17. .................................. 123
Figure 4-12: Comparison of bioactive fractions from Clitoria semi-preparative and
preparative fractionation............................................................................................ 124
Figure 4-13: Cytotoxicity in Clitoria extract fractions F17 and F18.. ........................... 125

xiii
Figure 4-14: Potency of Clitoria fractions F17 and F18.............................................. 126
Figure 4-15: Bioassay after semi-preparative fractionation of Cheilocostus fractions..
................................................................................................................................. 127
Figure 4-16: Schematic of bioassay led fractionation of Clitoria extract CE(B). ......... 129
Figure 5-1: Strategy for isolation of natural products showing the approach taken in this
study with Indian plant extracts.. ............................................................................... 134
Figure 5-2: Clitoria extract prevents cell division in breast cancer cells. .................... 135
Figure 5-3: Reduced cell division and longer duration of mitosis after treatment with
Clitoria.. .................................................................................................................... 136
Figure 5-4: Images of cancer cells in live cell imaging treated with Clitoria fraction F17.
................................................................................................................................. 138
Figure 5-5: Reduced cell division and longer duration of mitosis after treatment with
Clitoria fraction F17.. ................................................................................................. 139
Figure 5-6: Abnormal and incomplete cell division after treatment with Clitoria fractions.
................................................................................................................................. 140
Figure 5-7: Reduced motility in cells treated with Clitoria.. ........................................ 141
Figure 5-8: Actin in breast cancer epithelial cells after 18 hours treatment with Clitoria..
................................................................................................................................. 143
Figure 5-9: Actin in Clitoria treated breast cancer epithelial cells. .............................. 144
Figure 5-10: Stress fibres in Clitoria treated normal fibroblasts assayed at passage 23..
................................................................................................................................. 145
Figure 5-11: Microtubules in breast cancer epithelial cells after treatment with Clitoria..
................................................................................................................................. 147
Figure 5-12: Microtubules in breast cancer epithelial cells treated with Clitoria.. ....... 147
xiv
Figure 5-13: Microtubules in normal fibroblasts treated with Clitoria. ......................... 148
Figure 5-14: Transparent nucleoli in breast cancer epithelial cells treated with Clitoria..
................................................................................................................................. 150
Figure 5-15: Morphology of cancer cells treated with Clitoria fraction F18. ................ 151
Figure 5-16: Ki-67 and actin staining in breast cancer epithelial cells treated with
fraction F17 of Clitoria. MDA-MB-231........................................................................ 153
Figure 5-17: Ki-67 and actin staining in breast cancer epithelial cells treated with
fraction F18 of Clitoria. .............................................................................................. 154
Figure 5-18: Ki-67 and tubulin staining in breast cancer epithelial cells treated with
fraction F17 of Clitoria. .............................................................................................. 155
Figure 5-19: Ki-67 and tubulin staining in breast cancer epithelial cells treated with
fraction F18 of Clitoria.. ............................................................................................. 156
Figure 5-20: Ki-67 and actin staining in fibroblasts assayed at passage 19 and treated
with fraction F17 of Clitoria. ....................................................................................... 158
Figure 5-21: Ki-67 and tubulin staining in fibroblasts treated with fraction F17 of
Clitoria.. .................................................................................................................... 159
Figure 5-22: Ki-67 and actin staining in fibroblasts treated with fraction F18 of Clitoria..
................................................................................................................................. 161
Figure 5-23: Ki-67 and tubulin staining in fibroblasts treated with fraction F18 of Clitoria.
................................................................................................................................. 163
Figure 5-24: Indications of early apoptosis in Clitoria treated MCF-7 breast cancer
epithelial cells.. ......................................................................................................... 165
Figure 5-25: Indications of early apoptosis in Clitoria treated MDA-MB-231 breast
cancer epithelial cells.. .............................................................................................. 166
xv
Figure 6-1: Images of Clitoria collected in Guwahati, Jakarta, Marlow....................... 181
Figure 6-2: HPLC chromatograms from Clitoria extracts.. ......................................... 183
Figure 6-3: Cytotoxicity in Indonesian and UK Clitoria extracts. ................................ 185
Figure 6-4: Survival at timepoints in cells treated with Indonesian Clitoria.. ............... 187
Figure 6-5: Cell death after treatment with Indonesian Clitoria extract. ...................... 188
Figure 6-6: Cell death and reduced cell division after treatment with Indonesian Clitoria
extract.. ..................................................................................................................... 189
Figure 6-7: Bioassay of Clitoria extract CE(H) fractions.. .......................................... 191
Figure 6-8: Bioactivity in Indonesian Clitoria fractions F5-F6.. ................................... 192
Figure 6-9: Bioassay of Indonesian Clitoria extract fractions.. ................................... 194
Figure 6-10: Bioactive fractions in Indonesian Clitoria.. ............................................. 196
Figure 6-11: Bioassay with serial dilutions of Indonesian Clitoria. A:. ........................ 198
Figure 6-12: Comparison of bioactive fractions in (A) Indian and (B) Indonesian Clitoria
extracts.. ................................................................................................................... 199
Figure 6-13: Height of major peak in Clitoria root extracts related to extract
concentration.. .......................................................................................................... 200
Figure 6-14: Indonesian Clitoria extract potency and yield related to extraction
temperature.. ............................................................................................................ 201
Figure 6-15: Schematic of bioassay led fractionation of Indonesian Clitoria extract
CE(H)........................................................................................................................ 203
Figure 7-1: Strategy for isolation of natural products, showing the approach taken in
this study with Indian Clitoria extract. ........................................................................ 211
Figure 7-2: UV spectra of Clitoria bioactive fractions.. ............................................... 212
Figure 7-3: HPLC Chromatograms from Indian Clitoria extracts. ............................... 213
xvi
Figure 7-4: LC-MS chromatogram and total ion count of Indian Clitoria extract CE(B)
showing the peaks corresponding to bioactive fractions F17 and F18. ...................... 214
Figure 7-5: Mass spectrometry traces of bioactive peaks in Indian Clitoria from LC-MS..
................................................................................................................................. 215
Figure 7-6: Structures of Compound A and Compound B determined through structural
elucidation. ............................................................................................................... 216
Figure 7-7: Fourier transform infrared spectroscopy (FTIR) spectrum for Clitoria fraction
F10.4.. ...................................................................................................................... 217
Figure 7-8: Comparison of biochanin A and Indonesian Clitoria with HPLC. ............. 219
Figure 7-9: UV spectrum and structure of biochanin A. ........................................... 220
Figure 7-10: UV spectra of peaks in region of Rf=0.70 in Clitoria extract CE(B). ....... 220
Figure 7-11: Cytotoxicity of biochanin A.. .................................................................. 221
Figure 7-12: Structures of novel Compounds A and B, 5,4′-dihydroxy-7-methyl 3-benzyl
chromone, isoflavones biochanin A, genistein, daidzein and glycitein, 8-methyl-DBP,
flavonoid precursor benzo-A-pyrone and β-estradiol (estrogen) ................................ 223
Figure 8-1: Structures of molecules discussed in the text.......................................... 231
Figure 8-2: Binding sites on actin.. ............................................................................ 234
Figure 8-3: Model of flavonoid activity with actin filaments in breast cancer cells.. .... 236

xvii
List of Tables
Table 1-1: Simplified system for classification of breast cancer stages1. ....................... 3
Table 1-2: Primary modes of action of chemotherapy drugs commonly used in adjuvant
treatment for non-advanced breast cancer. ................................................................... 6
Table 1-3: Modes of action of chemotherapy drugs commonly used for advanced
breast cancer 1. ............................................................................................................. 7
Table 1-4: Cell death pathways initiated by chemotherapy1. ....................................... 19
Table 1-5: Actin involvement in stages of the cell cycle 1. ........................................... 33
Table 1-6: Some natural product compounds targeting actin directly 1. ....................... 34
Table 1-7: Sources of selected drugs derived from natural products in current use or
being studied. ............................................................................................................. 42
Table 1-8: Components of the traditional Chinese medicine Qingkailing injection, used
widely in China after stroke and cerebral edema to reduce brain damage1. ................ 46
Table 1-9: Compounds in Clitoria root extract with cytotoxic or growth-inhibitory
properties. ................................................................................................................... 50
Table 1-10: Compounds in Mucuna seed extract with growth-inhibitory properties. .... 51
Table 1-11: Compounds in Cheilocostus rhizome extract with cytotoxic or growth-
inhibitory properties..................................................................................................... 51
Table 2-1: Extractions of Clitoria performed at Brunel. ................................................ 57
Table 2-2: Yields and resuspensions from extractions of plant material. ..................... 57
Table 2-3: Sources of cell lines. .................................................................................. 58
Table 2-4: Resuspension volumes for cell counting assay. ......................................... 70
Table 2-5: Antibodies used in fluorescence microscopy. ............................................. 73

xviii
Table 2-6: HPLC system components. ........................................................................ 77
Table 2-7: Analytical column used for HPLC method development and semi-
preparative HPLC and preparative column used for preparative HPLC. ...................... 77
Table 2-8: Column loadings for methods with analytical HPLC. .................................. 78
Table 2-9: Scale-up for method for preparative fractionation. ...................................... 79
Table 2-10: HPLC solvent flow for fractionation with preparative column. ................... 80
Table 2-11: Conditions for liquid chromatography-electrospray ionisation-mass
spectrometry. .............................................................................................................. 81
Table 2-12: Tandem mass spectrometry for structural elucidation of Clitoria extract
CE(B). ......................................................................................................................... 81
Table 3-1: Estimated half maximal inhibitory concentration (IC50) of Clitoria root extract
CE on normal and breast cancer cells in MTT assays. ................................................ 90
Table 3-2: Estimated half maximal inhibitory concentration (IC50) of Clitoria root extracts
CE and CE(B) after 48 hours’ treatment on MCF-7 breast cancer cells in PrestoBlue
assays. ....................................................................................................................... 92
Table 3-3: Estimated half maximal inhibitory concentration (IC50) of Clitoria extract
CE(B) on normal and breast cancer cells. ................................................................... 92
Table 3-4: Comparison of growth of untreated MDA-MB-231 breast cancer epithelial
cells and 2DD normal fibroblasts. ................................................................................ 97
Table 3-5: Comparison of metaphase spreads of normal and cancer cells.................. 99
Table 4-1: Initial HPLC solvent flow for all extracts.................................................... 113
Table 4-2: HPLC solvent flow for method developed for Clitoria................................ 114
Table 4-3: HPLC solvent flow for method developed for Mucuna. ............................. 115
Table 4-4: HPLC solvent flow for method developed for Cheilocostus. ..................... 115

xix
Table 4-5: Approximate yields of bioactive Clitoria fractions from preparative
fractionation. ............................................................................................................. 126
Table 5-1: Summary of effects of Clitoria crude extract and its fractions F17 and F18 on
cancer and normal cells 1. ......................................................................................... 168
Table 6-1: Examples of causes of variation in plant secondary metabolite production.
................................................................................................................................. 180
Table 6-2: Environmental data for Clitoria growing locations. .................................... 181
Table 6-3: Characteristics of UV spectra of major peaks in extractions from Indonesian
and UK Clitoria root. Indian Clitoria root included for comparison. 10 µL injection of 1:50
dilution of each extract on same HPLC method. ....................................................... 184
Table 6-4: Estimated half maximal concentration (IC50) of Indonesian and UK
extracts1,2. ................................................................................................................. 186
Table 6-5: Summary of effects of Indian and Indonesian Clitoria crude extracts on
MDA-MB-231 breast cancer cells 1. .......................................................................... 189
Table 7-1: Secondary metabolite classes found in methanol extractions of the Indian
plant parts used in this study. ................................................................................... 210
Table 7-2: UV maxima of major peaks in Clitoria extracts CE and CE(B). ................. 213
Table 7-3: Retention times and UV maxima of major peaks in Clitoria extract CE(B)
when separated with HPLC at Brunel and LC-MS at Aberystwyth. ............................ 214
Table 7-4: Fourier transform infrared spectroscopy (FTIR) spectrum bands from
bioactive fraction 10.4 of Clitoria extract CE(B) and tentative assignment 1. .............. 218

xx
Glossary
7-AAD: 7-aminoactinomycin D
ABP: actin binding protein
ACN: acetonitrile
ADP: adenosine diphosphate
AI: aromatase inhibitor
ATP: adenosine triphosphate
BCS: breast conservation surgery
CC: centrifugal concentrator
CE: original Indian Clitoria ternatea extract
CE(B): second vial of Indian Clitoria ternatea extract
CE(E): Indonesian Clitoria ternatea extract
CE(F): Indonesian Clitoria ternatea extract
CE(G): Indonesian Clitoria ternatea extract
CE(H): Indonesian Clitoria ternatea extract
CE(J): Indonesian Clitoria ternatea extract
CE(UK): UK Clitoria ternatea extract
CMF: cyclophosphamide, methotrexate and fluorouracil
CRUK: Cancer Research UK
DAD: photodiode array detection
DAPI: 4',6-diamidino-2-phenylindole, dihydrochloride (fluorescent DNA stain)
DCIS: ductal carcinoma in situ
DISC: death inducing signalling complex
D-loop: DNase-binding loop
DMSO: dimethyl sulfoxide
DNA: deoxyribonucleic acid
EGF: epidermal growth factor
EGFR: epidermal growth factor receptor
ELSD: evaporative light scattering detection
ER: estrogen receptor
ERE: estrogen response element
ESI: electrospray ionisation
F-actin: filamentous actin
FADD: Fas associated death domain
FasL: Fas ligand
FASR: Fas receptor
FBS: fetal bovine serum
FDA: US Food and Drug Administration
xxi
FEC: fluorouracil, epirubicin and cyclophosphamide
FEC-T: fluorouracil, epirubicin, cyclophosphamide and docetaxel
FITC: fluorescein isothiocyanate
FTIR: Fourier transform infrared spectroscopy
G1: growth phase 1
G2: growth phase 2
G-actin: globular actin
GAP: GTPase activating protein
GC: gas chromatography
GDP: guanosine diphosphate
GEF: guanine nucleotide exchange factor
GTP: guanosine triphosphate
HEPES: 4-(2-hydroxyethyl)-1-piperazineethanesulfonic acid
HMEC: human mammary epithelial cell
HPLC: High performance liquid chromatography
IC50: estimated half maximal inhibitory concentration
LC-MS: liquid chromatography-mass spectrometry
LC-MSn: liquid chromatography-tandem mass spectrometry
LC-ESI-MSn: Liquid chromatography-electrospray ionisation-tandem mass
spectrometry
LT: Life Technologies
M: mitosis
MAPK: mitogen-activated protein kinase
MBC: metastatic breast cancer
MeOH: methanol
MHC: myosin heavy chain
microRNA: small non-coding ribonucleic acid molecule
MLC: myosin II light chain
MOMP: mitochondrial outer membrane permeabilisation
MS: mass spectrometry
MSn: tandem mass spectrometry
mTOR: mechanistic target of rapamycin
MTT: 3-[4,5-dimethylthiazol-2-yl]-2,5-diphenyl tetrazolium bromide
MW: molecular weight
m/z: mass-to-charge ratio
N: number of replicates
N. A.: not assayed
NCE: new chemical entity
NMR: nuclear magnetic resonance
N.S.: not significant
xxii
p: probability of rejecting the null hypothesis
PARP: poly ADP ribose polymerase inhibitor
PBS: phosphate buffered saline
PDA: photodiode array
PFA: paraformaldehyde
PI3K: phosphatidylinositide 3-kinase
PR: progesterone receptor
PS: phosphatidylserine
R: regression coefficient
RE: rotary evaporator
Rf: Retention factor
RNA: ribonucleic acid
ROCK: Rho kinase
RP-HPLC: reversed phase HPLC
rRNA: ribosomal RNA
R.T.: retention time
S: synthesis
SAC: spindle assembly checkpoint
SD: standard deviation
SD: subdomain
SPARC: secreted protein acid rich in cysteine
STS: staurosporine
TCM: traditional Chinese medicine
TFA: trifluoroacetic acid
TLC: thin layer chromatography
TM: traditional medicine
TMR: tetramethylrhodamine
TNF: tumour necrosis factor
TNFR: TNF receptor
UV: ultraviolet
VEGF: vascular endothelial growth factor
v/v: volume/volume
WASP: Wiskott-Aldrich syndrome protein
λmax: wavelength of peak
λmax1: wavelength of peak 1
λmax2: wavelength of peak 2

xxiii
Acknowledgments
First, thanks to my wonderful supervisors, Prof. Mariann Rand-Weaver and Dr. Gudrun
Stenbeck, who have taught me so much in the last 3½ years.
Thanks to Prof. Derek Fisher and Dr. Ian Garrard of Brunel Institute for Biosciences for
help with analytical chemistry. Thanks to Dr. Ifat Parveen Shah, Aberystwyth
University, and Prof. Mike Threadgill, University of Bath, for structural elucidation.
Thanks to Prof. Jogen Chandra Kalita, Gauhati University, for Indian plant extracts and
for inviting me to Guwahati. Thanks to Sri Murhandini, National Agency of Drug and
Food Control of the Republic of Indonesia, and Geoff Swinburn, Marlow and District
Horticultural Society, for plant material.
Thanks to Brunel University London for providing my PhD studentship and for giving
me this fantastic opportunity.
Thanks to my husband Jeff Wagland, to my daughters Jo Wagland and Ella Wagland,
and to my father Dr. John Wood, for their help, love and support.
1
Chapter 1 Introduction
1.1 Breast cancer
Breast cancer is the most common cancer in the UK, with around 50,000 new cases in
women and 350 in men per year, representing 15% of all cancers diagnosed (CRUK,
2014c). Globally it is the second most common cancer, with 12% of all cancer
incidence and 25% of all cancers in women (GLOBOCAN, 2015). Although the five-
year survival rate for women in the UK is 87% (CRUK, 2014b), breast cancer is the
second most common cause of UK cancer death in women (15%), after lung cancer
(21%) (CRUK, 2014d). It is the most common cause of female cancer death worldwide,
with 14.3% of all cancer deaths in women (GLOBOCAN, 2015).
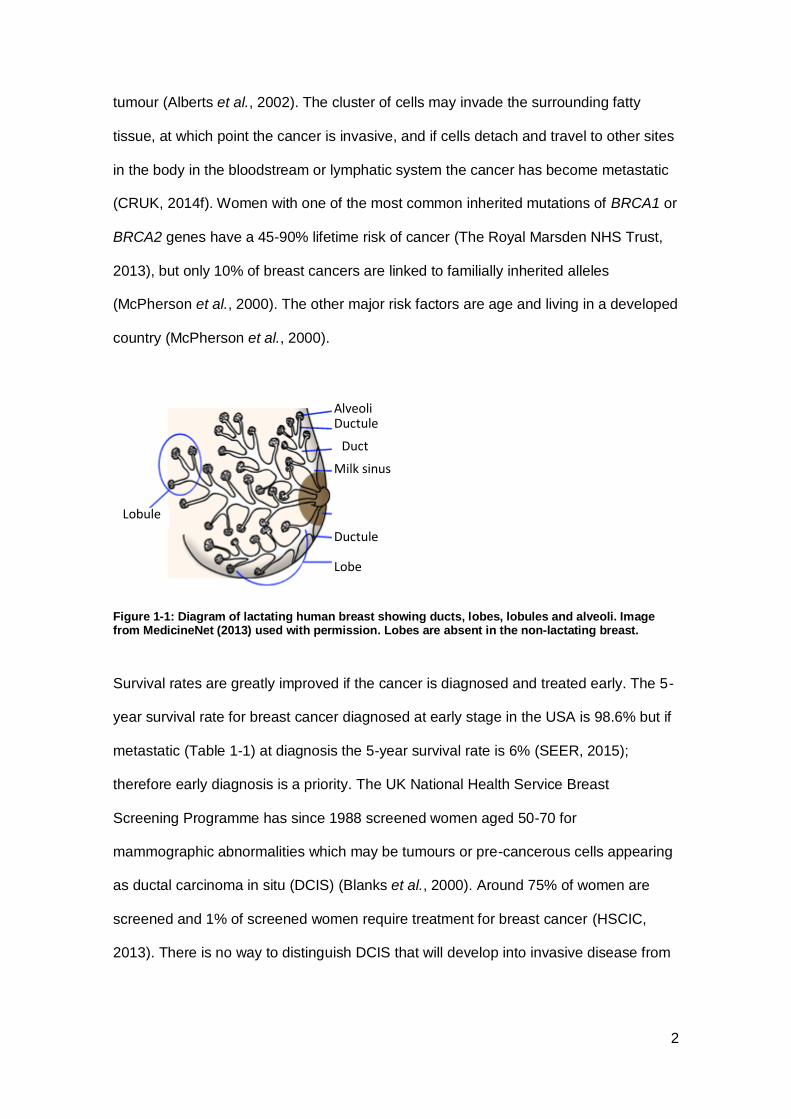
Human breasts contain around 20 milk-producing regions called lobes, separated by
fibrous septa and embedded in fat (Ellis, 2002). Each lobe, made up of many smaller
units called lobules, drains via a duct to a nipple which contains a cluster of secretory
alveoli (Figure 1-1) (Ellis, 2002). Both lobules and ducts are lined with an epithelium
consisting of luminal cells surrounding the lumen and basal myoepithelial cells adjacent
to the basal membrane (Visvader and Stingl, 2014). Alveoli are surrounded by
myoepithelial cells which can contract to force milk out of the breast (Seeley et al.,
2007). 85% of breast cancers occur in the ductal epithelium, primarily in luminal cells,
and the majority of the rest occur in the lobule (Seeley et al., 2007; Visvader and Stingl,
2014).
Spontaneous mutations in the DNA of a breast cell take place continuously as a result
of exposure to environmental chemicals, biochemical reactions, or errors during cell
division (Alberts et al., 2002). Many DNA errors, such as single erroneous bases, are
repaired (Pearl et al., 2015), and of those that are not, most are harmless, or cause a
cell to die (Lane, 1992), but if a series of errors occurs that gives a cell a growth
advantage over its neighbours, the dividing cells form a cluster which becomes a
2
tumour (Alberts et al., 2002). The cluster of cells may invade the surrounding fatty
tissue, at which point the cancer is invasive, and if cells detach and travel to other sites
in the body in the bloodstream or lymphatic system the cancer has become metastatic
(CRUK, 2014f). Women with one of the most common inherited mutations of BRCA1 or
BRCA2 genes have a 45-90% lifetime risk of cancer (The Royal Marsden NHS Trust,
2013), but only 10% of breast cancers are linked to familially inherited alleles
(McPherson et al., 2000). The other major risk factors are age and living in a developed
country (McPherson et al., 2000).
Figure 1-1: Diagram of lactating human breast showing ducts, lobes, lobules and alveoli. Image from MedicineNet (2013) used with permission. Lobes are absent in the non-lactating breast.
Survival rates are greatly improved if the cancer is diagnosed and treated early. The 5-
year survival rate for breast cancer diagnosed at early stage in the USA is 98.6% but if
metastatic (Table 1-1) at diagnosis the 5-year survival rate is 6% (SEER, 2015);
therefore early diagnosis is a priority. The UK National Health Service Breast
Screening Programme has since 1988 screened women aged 50-70 for
mammographic abnormalities which may be tumours or pre-cancerous cells appearing
as ductal carcinoma in situ (DCIS) (Blanks et al., 2000). Around 75% of women are
screened and 1% of screened women require treatment for breast cancer (HSCIC,
2013). There is no way to distinguish DCIS that will develop into invasive disease from
Alveoli Ductule
Duct
Milk sinus
Ductule
Lobe
Lobule
3
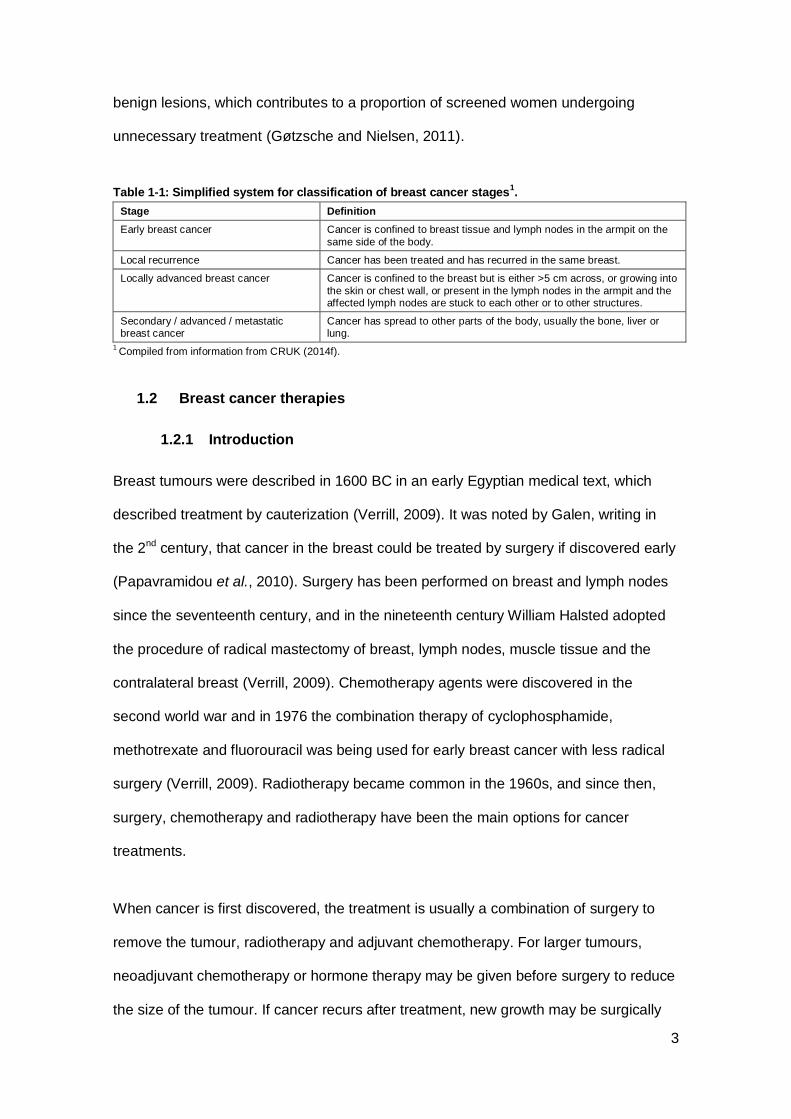
benign lesions, which contributes to a proportion of screened women undergoing
unnecessary treatment (Gøtzsche and Nielsen, 2011).
Table 1-1: Simplified system for classification of breast cancer stages1.
Stage Definition
Early breast cancer Cancer is confined to breast tissue and lymph nodes in the armpit on the
same side of the body.
Local recurrence Cancer has been treated and has recurred in the same breast.
Locally advanced breast cancer Cancer is confined to the breast but is either >5 cm across, or growing into
the skin or chest wall, or present in the lymph nodes in the armpit and the affected lymph nodes are stuck to each other or to other structures.
Secondary / advanced / metastatic breast cancer
Cancer has spread to other parts of the body, usually the bone, liver or lung.
1 Compiled from information from CRUK (2014f).
1.2 Breast cancer therapies
1.2.1 Introduction
Breast tumours were described in 1600 BC in an early Egyptian medical text, which
described treatment by cauterization (Verrill, 2009). It was noted by Galen, writing in
the 2nd century, that cancer in the breast could be treated by surgery if discovered early
(Papavramidou et al., 2010). Surgery has been performed on breast and lymph nodes
since the seventeenth century, and in the nineteenth century William Halsted adopted
the procedure of radical mastectomy of breast, lymph nodes, muscle tissue and the
contralateral breast (Verrill, 2009). Chemotherapy agents were discovered in the
second world war and in 1976 the combination therapy of cyclophosphamide,
methotrexate and fluorouracil was being used for early breast cancer with less radical
surgery (Verrill, 2009). Radiotherapy became common in the 1960s, and since then,
surgery, chemotherapy and radiotherapy have been the main options for cancer
treatments.
When cancer is first discovered, the treatment is usually a combination of surgery to
remove the tumour, radiotherapy and adjuvant chemotherapy. For larger tumours,
neoadjuvant chemotherapy or hormone therapy may be given before surgery to reduce
the size of the tumour. If cancer recurs after treatment, new growth may be surgically

4
removed, if possible, and a combination of hormone therapy, biological therapy or
chemotherapy may be offered (CRUK, 2014j).
1.2.2 Surgery
For early stage breast cancer the aim of the combination of surgery with other
therapies is to remove the cancer, to kill all remaining cancer cells from the breast and
to prevent cancer recurrence. As 87% of UK women survive for 5 years after breast
cancer, and 79% for 10 years (2010-2011 figures) this is an effective strategy (CRUK,
2014b). In the 5% of women who already have metastatic breast cancer (MBC) when
they present for treatment, surgery may be performed to remove the primary tumour
and secondary tumours, and those who undergo surgery have improved survival
(Ruiterkamp and Ernst, 2011).
Surgical options include removal of a breast (mastectomy) or radical mastectomy,
where the breast and additional tissues such as the axillary lymph node, the lymph
node into which most breast fluid drains, are removed, or less aggressive breast
conservation surgery (BCS) to remove either the lump alone (lumpectomy) or part of
the breast (partial mastectomy) (Chagpar et al., 2006). In advanced breast cancer,
surgery can be performed to remove secondary metastases, or radiofrequency ablation
can remove liver metastases (Ruiterkamp and Ernst, 2011).
1.2.3 Radiotherapy
Conventional external beam radiotherapy may be administered before surgery to
reduce the tumour or after surgery to kill any remaining cancerous cells. BCS is
normally offered with a 6-week programme of daily radiation therapy (Chagpar et al.,
2006). Although lumpectomy with radiotherapy led to a lower risk of recurrent disease
(14% recurrence) than lumpectomy without radiation (39% recurrence), in one study,
there was only a marginally significant difference in overall survival after 20 years
5
(Fisher et al., 2002). Side-effects of radiotherapy include skin reddening and
permanent changes to skin, fatigue and sometimes radiation damage to heart muscle
(CRUK, 2014e).
1.2.1 Chemotherapy
Chemotherapy targets dividing cells, killing a greater proportion of cancer cells
because they cycle faster than non-cancer cells. After surgery for early and localised
breast cancer, the aim of adjuvant chemotherapy is to kill remaining cancer cells in the
breast or that have migrated to other parts of the body and thereby to prevent the
cancer recurring. Adjuvant therapy is normally combination chemotherapy, both in
order to kill cells by more than one mechanism and to reduce the risk of tumours
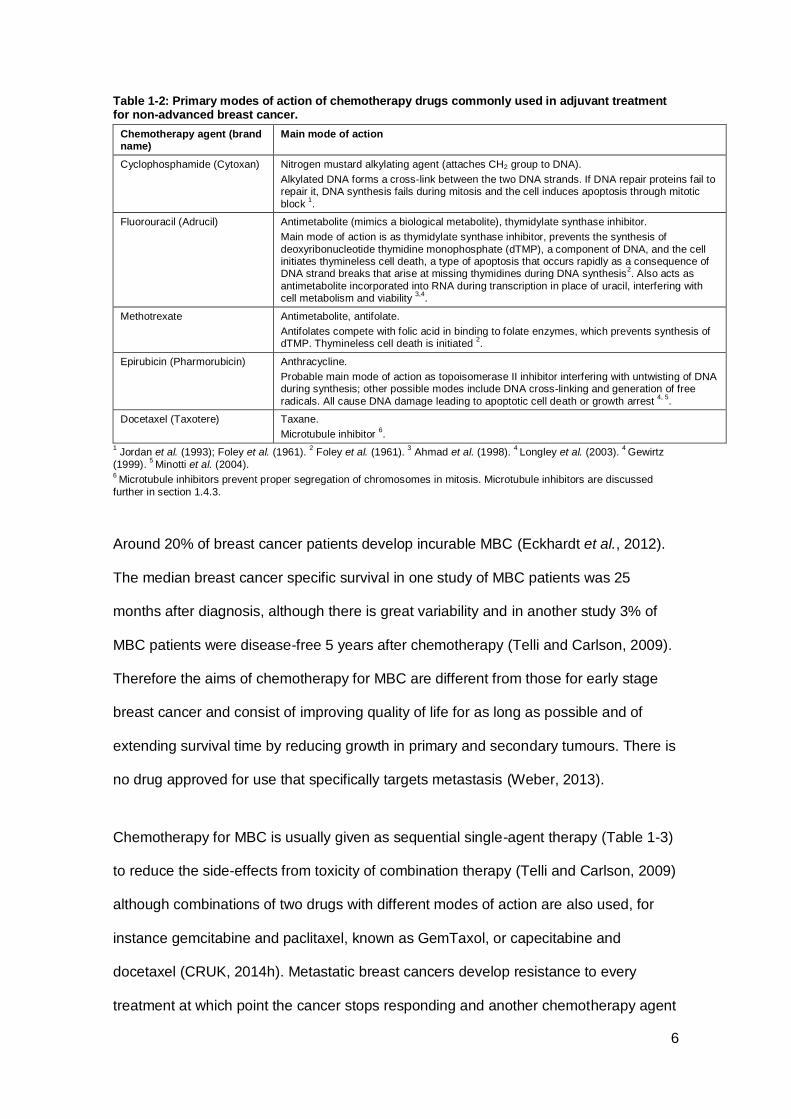
becoming drug resistant. There are many breast cancer chemotherapy regimens, but
each involves a combination of drugs with different cytotoxic modes of action. Two of
the most commonly used regimens for adjuvant chemotherapy are cyclophosphamide,
methotrexate and fluorouracil (CMF) and fluorouracil, epirubicin and cyclophosphamide
(FEC) or FEC with docetaxel (FEC-T) (Table 1-2). CMF is 4-6 4-weekly cycles which
each consist of 1 tablet per day for 14 days of cyclophosphamide, and injections on
day 1 and day 7 of methotrexate and fluorouracil (CRUK, 2012). FEC is 6-8 3-weekly
cycles of one injection of fluorouracil, epirubicin and cyclophosphamide, and in FEC-T
the FEC regimen is followed by 3-4 3-weekly cycles of a 1-hour infusion of docetaxel
(CRUK, 2012). Dosing is calculated based on patients’ body weight and other factors to
avoid both over- and under-dosing, but is imperfect because patients vary in their drug
metabolism and clearance (Gurney, 2002).
6
Table 1-2: Primary modes of action of chemotherapy drugs commonly used in adjuvant treatment for non-advanced breast cancer.
Chemotherapy agent (brand name)
Main mode of action
Cyclophosphamide (Cytoxan) Nitrogen mustard alkylating agent (attaches CH2 group to DNA).
Alkylated DNA forms a cross-link between the two DNA strands. If DNA repair proteins fail to repair it, DNA synthesis fails during mitosis and the cell induces apoptosis through mitotic
block 1.
Fluorouracil (Adrucil) Antimetabolite (mimics a biological metabolite), thymidylate synthase inhibitor.
Main mode of action is as thymidylate synthase inhibitor, prevents the synthesis of
deoxyribonucleotide thymidine monophosphate (dTMP), a component of DNA, and the cell initiates thymineless cell death, a type of apoptosis that occurs rapidly as a consequence of DNA strand breaks that arise at missing thymidines during DNA synthesis
2. Also acts as
antimetabolite incorporated into RNA during transcription in place of uracil, interfering with cell metabolism and viability
3,4.
Methotrexate Antimetabolite, antifolate.
Antifolates compete with folic acid in binding to folate enzymes, which prevents synthesis of dTMP. Thymineless cell death is initiated
2.
Epirubicin (Pharmorubicin) Anthracycline.
Probable main mode of action as topoisomerase II inhibitor interfering with untwisting of DNA during synthesis; other possible modes include DNA cross-linking and generation of free
radicals. All cause DNA damage leading to apoptotic cell death or growth arrest 4, 5
.
Docetaxel (Taxotere) Taxane.
Microtubule inhibitor 6.
1 Jordan et al. (1993); Foley et al. (1961).
2 Foley et al. (1961).
3 Ahmad et al. (1998).
4 Longley et al. (2003).
4 Gewirtz
(1999). 5 Minotti et al. (2004).
6 Microtubule inhibitors prevent proper segregation of chromosomes in mitosis. Microtubule inhibitors are discussed
further in section 1.4.3.
Around 20% of breast cancer patients develop incurable MBC (Eckhardt et al., 2012).
The median breast cancer specific survival in one study of MBC patients was 25
months after diagnosis, although there is great variability and in another study 3% of
MBC patients were disease-free 5 years after chemotherapy (Telli and Carlson, 2009).
Therefore the aims of chemotherapy for MBC are different from those for early stage
breast cancer and consist of improving quality of life for as long as possible and of
extending survival time by reducing growth in primary and secondary tumours. There is
no drug approved for use that specifically targets metastasis (Weber, 2013).
Chemotherapy for MBC is usually given as sequential single-agent therapy (Table 1-3)
to reduce the side-effects from toxicity of combination therapy (Telli and Carlson, 2009)
although combinations of two drugs with different modes of action are also used, for
instance gemcitabine and paclitaxel, known as GemTaxol, or capecitabine and
docetaxel (CRUK, 2014h). Metastatic breast cancers develop resistance to every
treatment at which point the cancer stops responding and another chemotherapy agent
7
with a different mode of action may be chosen. It is not certain that combination
therapy for MBC improves overall survival time or quality of life, but the time to
treatment failure may increase slightly with combination therapy, from around 6 to 8
months in one study (Conlin and Seidman, 2008; Dear et al., 2013). The number of
cycles for each agent ranges from 3 to 8 or until toxicity becomes unbearable (Gennari
et al., 2011).
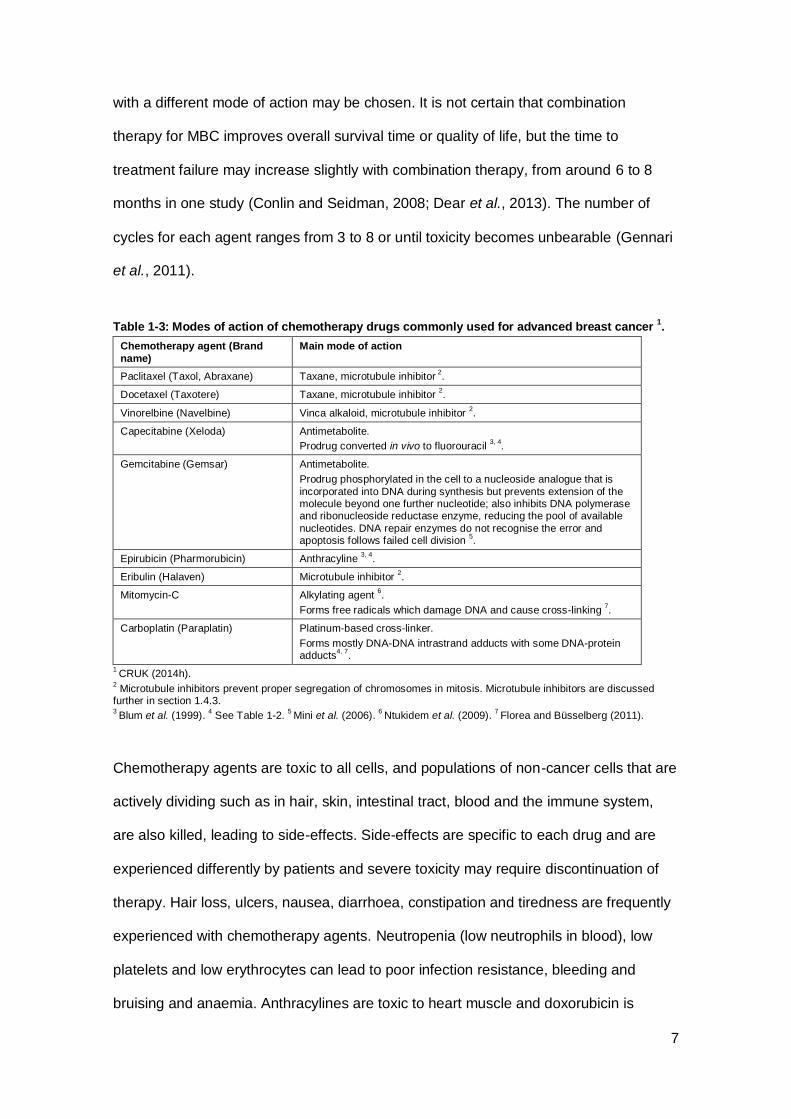
Table 1-3: Modes of action of chemotherapy drugs commonly used for advanced breast cancer 1.
Chemotherapy agent (Brand
name)
Main mode of action
Paclitaxel (Taxol, Abraxane) Taxane, microtubule inhibitor 2.
Docetaxel (Taxotere) Taxane, microtubule inhibitor 2.
Vinorelbine (Navelbine) Vinca alkaloid, microtubule inhibitor 2.
Capecitabine (Xeloda) Antimetabolite.
Prodrug converted in vivo to fluorouracil 3, 4
.
Gemcitabine (Gemsar) Antimetabolite.
Prodrug phosphorylated in the cell to a nucleoside analogue that is
incorporated into DNA during synthesis but prevents extension of the molecule beyond one further nucleotide; also inhibits DNA polymerase and ribonucleoside reductase enzyme, reducing the pool of available
nucleotides. DNA repair enzymes do not recognise the error and apoptosis follows failed cell division
5.
Epirubicin (Pharmorubicin) Anthracyline 3, 4
.
Eribulin (Halaven) Microtubule inhibitor 2.
Mitomycin-C Alkylating agent 6.
Forms free radicals which damage DNA and cause cross-linking 7.
Carboplatin (Paraplatin) Platinum-based cross-linker.
Forms mostly DNA-DNA intrastrand adducts with some DNA-protein adducts
4, 7.
1 CRUK (2014h).
2 Microtubule inhibitors prevent proper segregation of chromosomes in mitosis. Microtubule inhibitors are discussed
further in section 1.4.3. 3 Blum et al. (1999).
4 See Table 1-2.
5 Mini et al. (2006).
6 Ntukidem et al. (2009).
7 Florea and Büsselberg (2011).
Chemotherapy agents are toxic to all cells, and populations of non-cancer cells that are
actively dividing such as in hair, skin, intestinal tract, blood and the immune system,
are also killed, leading to side-effects. Side-effects are specific to each drug and are
experienced differently by patients and severe toxicity may require discontinuation of
therapy. Hair loss, ulcers, nausea, diarrhoea, constipation and tiredness are frequently
experienced with chemotherapy agents. Neutropenia (low neutrophils in blood), low
platelets and low erythrocytes can lead to poor infection resistance, bleeding and
bruising and anaemia. Anthracylines are toxic to heart muscle and doxorubicin is

8
associated with sensitivity to sunlight. Docetaxel and eribulin can cause peripheral
neuropathy (CRUK, 2012; FDA, 2010). Side-effects are carefully monitored and
patients are given a range of other drugs to treat side-effects.
To reduce toxicity of treatments, improvements are being made in the delivery of
chemotherapeutic agents. Dosages can be increased if more of the drug reaches the
tumour cells, or if the drug is better tolerated. Doxil is a formulation of doxorubicin
contained in liposomes that allow it to be transported in blood without eliciting an
immune response, which improves its circulation lifetime (Oja et al., 2000).
Capecitabine is converted to its active form in tumour cells and the toxic effect is better
targeted to the tumour. Epirubicin is a second-generation anthracycline with better
bioavailabilty and therefore lower dosage than doxorubicin (Minotti et al., 2004).
However, chemotherapy is systemic, toxic and still largely non-specific.
1.2.2 Targeted treatments
Newer treatments target breast cancer according to its biology. Hormone therapy
disrupts the growth signals of the estrogen pathway, while biological therapy targets
specific pro-growth cell mechanisms. In order to guide treatment and assess prognosis,
breast biopsies are tested immunohistochemically for expression of the estrogen
receptor (ER), progesterone receptor (PR) and HER2 receptor. Estrogen is a steroid
hormone that has many effects in the body, including control of the menstrual cycle,
development of the ductal system in the growing breast, and growth of ductal breast
tissue in the follicular phase of the cycle (Strauss III and Barbieri, 2013). The estrogen
receptors ERα and ERβ are transcription factors activated when bound to estrogen,
with distinct functions and distribution in the body (Pettersson and Gustafsson, 2001).
In the ER classical mode of action the estrogen-ERα complex binds to specific DNA
estrogen response elements (EREs) that promote the transcription of genes involved in
cell proliferation and cell cycle progression (Figure 1-2) (Ring and Dowsett, 2004). ERα
9
expression in normal breast tissue rises and falls with the menstrual cycle, but its
elevated expression is one of the earliest pre-cancerous changes in breast epithelial
cells and it is present in 75% of breast tumours, called ER positive (Hoskins et al.,
2009). High levels of ER may allow the tissue to respond to even low levels of estrogen
with increased growth (Allred et al., 2001). Absence of ER expression (ER negative) is
an indicator of disease progression and poorer prognosis (McGuire and Clark, 1986).
ERβ, on the other hand, when bound to estrogen inhibits transcription, reduces
angiogenesis and can reduce tumour growth in a mouse model (Hartman et al., 2006).
Many ERα binding sites on DNA also bind ERβ, suggesting that the resulting effect is
driven by the relative concentrations of both ERs in the cell (Grober et al., 2011). In
non-classical modes of action, ERα can also upregulate proliferation genes by binding
to transcription factors Jun and Fos (Figure 1-2), and it may have additional non-
nuclear activity through interacting with c-Src and activating the mitogen-activated
protein kinase (MAPK) pathway and the mechanistic target of rapamycin (mTOR)
pathway which induce transcription of pro-growth and anti-apoptotic genes (Ring and
Dowsett, 2004).
Around 50% of patients are PR positive, 6-10% of these testing negative for ER
(Hoskins et al., 2009). Progesterone is a steroid hormone secreted during the
menstrual cycle that stimulates growth of the terminal ducts and lobes (Strauss III and
Barbieri, 2013). In pre-cancerous stages PR expression increases, and its absence is
also a marker of progression and poor prognosis (McGuire and Clark, 1986). In MBC
patients, the worst prognosis is in patients whose ER and PR status are negative
(McGuire and Clark, 1986). There is a complex interaction between PR and ER, as PR
can act as a co-repressor for ER transcription, but can also activate the pro-
proliferation MAPK pathway either alone or by interacting with the ER (Ballaré et al.,
2003).

10
Figure 1-2: Estrogen-ER complex initiates transcription of pro-growth genes in classical (A) and non-classical (B, C) modes of action. ER: estrogen receptor α. ERE: estrogen receptor elements. coact: coactivator. MAPK: mitogen-activated protein kinase. mTOR: mechanistic target of rapamycin. Adapted and redrawn from Ring and Dowsett (2004).
The receptor tyrosine kinase receptor HER2, also called ErbB2 or Neu, is
overexpressed in 20–30% of breast cancers known as HER2-positive, and poor
prognosis correlates with the degree of amplification (Slamon et al., 1987). It is one of
four transmembrane proteins in the epidermal growth factor receptor (EGFR) or ErbB
family which also includes ErbB1, ErbB3 and ErbB4 (Badache and Gonçalves, 2006).
EGFR family members have an extracellular peptide-binding region and various
ligands bind ErbB1, ErbB3 and ErbB4, although none has been found that binds HER2
(Badache and Gonçalves, 2006). On binding, ErbB1, ErbB3 and ErbB4 change
conformation, dimerise as homo- or heterodimers and transduce an intracellular signal
(Figure 1-3) (Badache and Gonçalves, 2006). HER2 dimerises with one of the other
family members, frequently ErbB3, which binds a number of ligands (Badache and
Gonçalves, 2006). Overexpression of HER2 leads to signalling in the absence of ligand
(Badache and Gonçalves, 2006). The EGFR family proteins are signalling proteins in
the MAPK pathway and the mTOR pathway, which induce expression of genes
involved in survival, proliferation and cell migration (Tinoco et al., 2013).

11
Figure 1-3: HER2 signalling in breast cancer. A: Unliganded ErbB3 does not transduce signal. On binding, ErbB3 can dimerise with HER2 and transduce signal via the MAPK cascade (B) or the mTOR pathway (C). D: Overexpression of HER2 leads to signalling in the absence of ligand. E: Trastuzumab interferes with signalling from overexpressed HER2, while pertuzumab targets both overexpressed and ligand-induced signalling. MAPK: mitogen-activated protein kinase. mTOR: mechanistic target of rapamycin. Adapted and redrawn from Badache and Gonçalves (2006); Sabatini (2006).
1.2.2.1 Hormone therapy
Upregulation of the ER pathway is a major contributor to the cause and the growth of
breast cancer, and can to a large extent be controlled with hormone-based therapy.
During the menstrual cycle binding of estrogen to ERα stimulates proliferation of cells
in normal tissue, and continuous or enhanced transcription from the ER-estrogen
complex results in cell overgrowth. In addition, this repeated cell division provides more
opportunity for DNA replication errors or mutations, some of which are themselves
tumourigenic as they disrupt normal cell functions such as proliferation, apoptosis, DNA
repair or cell migration. ER positive breast cancer normally benefits from hormone
therapy drugs which reduce the activity of the ER pathway, either by blocking binding
of estrogen to the ER or by reducing estrogen synthesis. Hormone therapy may be
prescribed before surgery, to reduce the size of the tumour, or after surgery and

12
chemotherapy with the aim of preventing recurrence or secondary growth. If surgery is
not possible, hormone therapy is typically given for 18 months to two years (CRUK,
2014i). After recurrence, hormone therapy is still effective in many ER positive cases,
and other treatment options include surgical removal or chemical ablation of the
ovaries to stop their estrogen production (CRUK, 2014i; Telli and Carlson, 2009). The
two main hormone based therapies in use are tamoxifen and the aromatase inhibitors
(AIs).
Tamoxifen, patented in 1985, was the first estrogen-based treatment for breast cancer
and has been a highly successful orally administered treatment. Tamoxifen is initially
effective in 70% of ER positive breast cancers (Hoskins et al., 2009). With five years of
adjuvant tamoxifen after chemotherapy there is a 50% decrease in recurrences and a
one third decrease in mortality in ER positive patients 15 years after diagnosis
compared with chemotherapy alone (Jordan and Brodie, 2007; Davies et al., 2013).
Tamoxifen is a selective ER modulator that binds ERα with similar affinity to estrogen
but does not bind ERβ (Figure 1-4) (Katzenellenbogen et al., 2000; Matthews et al.,
2000). PR status is considered when prescribing. Adding tamoxifen to the regimen for
early breast cancer patients under 50 years old who are PR negative had a worse
outcome than the chemotherapy alone; however, in PR negative patients over 50 its
addition improved overall disease free survival (McGuire and Clark, 1986). Tamoxifen
carries an increased risk of endometrial cancer and thromboembolism and some risk of
osteoporosis in post-menopausal women due to its agonist estrogenic activity in the
uterus, vascular system and bone, but overall these risks are far outweighed by its
prevention of recurrence (Fisher et al., 1994; Chumsri et al., 2011; Jordan and Brodie,
2007). It is also effective in metastatic breast cancer (Gale et al., 1994).
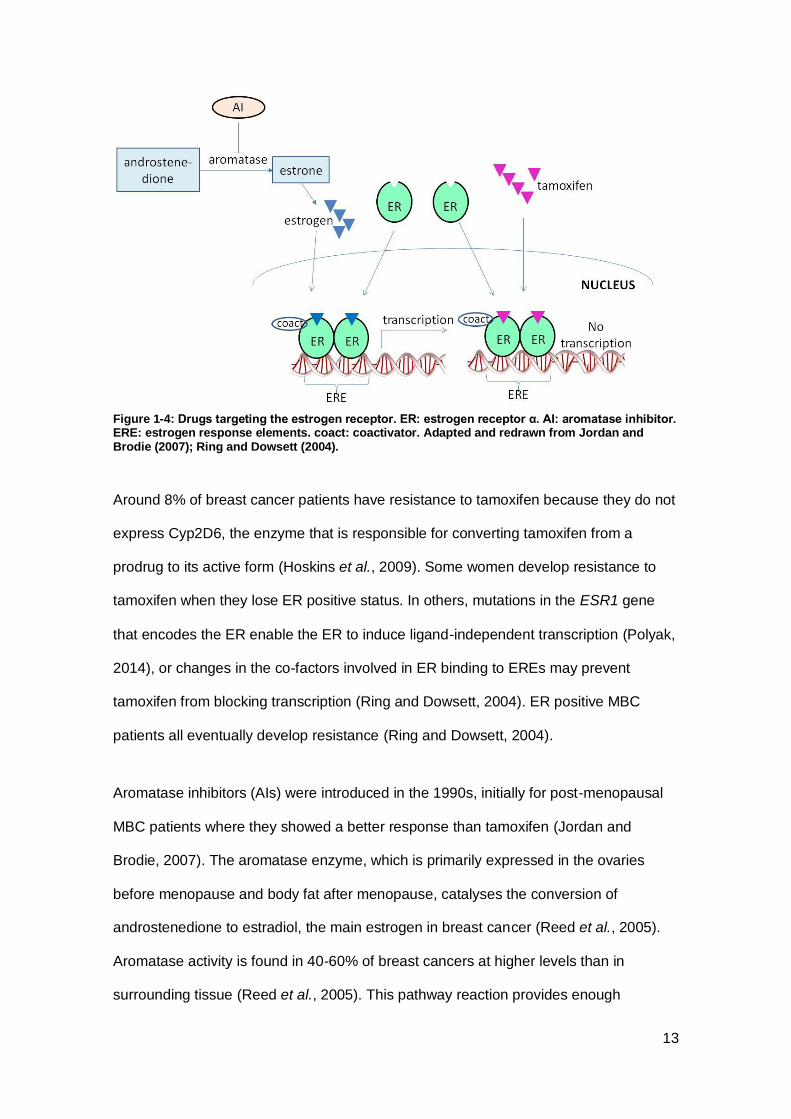
13
Figure 1-4: Drugs targeting the estrogen receptor. ER: estrogen receptor α. AI: aromatase inhibitor. ERE: estrogen response elements. coact: coactivator. Adapted and redrawn from Jordan and Brodie (2007); Ring and Dowsett (2004).
Around 8% of breast cancer patients have resistance to tamoxifen because they do not
express Cyp2D6, the enzyme that is responsible for converting tamoxifen from a
prodrug to its active form (Hoskins et al., 2009). Some women develop resistance to
tamoxifen when they lose ER positive status. In others, mutations in the ESR1 gene
that encodes the ER enable the ER to induce ligand-independent transcription (Polyak,
2014), or changes in the co-factors involved in ER binding to EREs may prevent
tamoxifen from blocking transcription (Ring and Dowsett, 2004). ER positive MBC
patients all eventually develop resistance (Ring and Dowsett, 2004).
Aromatase inhibitors (AIs) were introduced in the 1990s, initially for post-menopausal
MBC patients where they showed a better response than tamoxifen (Jordan and
Brodie, 2007). The aromatase enzyme, which is primarily expressed in the ovaries
before menopause and body fat after menopause, catalyses the conversion of
androstenedione to estradiol, the main estrogen in breast cancer (Reed et al., 2005).
Aromatase activity is found in 40-60% of breast cancers at higher levels than in
surrounding tissue (Reed et al., 2005). This pathway reaction provides enough

14
estrogen to stimulate growth of breast tumours in post-menopausal women. AIs inhibit
the aromatase enzyme, thus limiting the supply of estrogen as ligand for the ER (Figure
1-4). The newest, third-generation aromatase inhibitors bind to the heme group on
aromatase, saturating the binding site so that it is not available for substrate binding
(Chumsri et al., 2011). The AIs anastrozole, exemestane and letrozole are the
preferred hormone treatment for post-menopausal women with ER positive cancer both
as adjuvant treatment for early stage breast cancer to shrink a tumour pre-operatively,
to prevent recurrence after surgery, and to control growth of metastatic cancer
(Chumsri et al., 2011; Baum et al., 2002). Treatment duration with AIs after surgery is
normally four years (CRUK, 2014i).
AIs are well tolerated and do not increase the risk of endometrial cancer (Kaufmann et
al., 2007) or thromboembolism, but may cause loss of bone density with a risk of
osteoporosis and fractures (Gaillard and Stearns, 2011). If bone density drops
considerably, bisphosphonate drugs may be administered to prevent further fall
(Bundred, 2009). Many tamoxifen-resistant patients respond to AIs but AI resistance
develops in all patients with MBC and in some being treated with adjuvant AIs
(Chumsri et al., 2011).
1.2.2.2 Biological therapy
Biological therapy interferes with specific cell processes to reduce the growth of cancer
or the vasculature that supports a tumour and is normally administered alongside
chemotherapy to target two pro-proliferation mechanisms simultaneously (Tinoco et al.,
2013). Trastuzumab (Herceptin) is a monoclonal antibody that binds antagonistically to
the extracellular portion of the HER2 receptor (Figure 1-3) (Tinoco et al., 2013). It is
effective in the 20-25% of breast cancer patients who are HER2 positive and given to
both early stage and MBC patients (Bartsch et al., 2007). Early stage patients undergo
one cycle every three weeks for a year and MBC patients weekly or three-weekly
15
cycles until the cancer stops responding (CRUK, 2014g). A clinical trial in ER positive
MBC patients showed a 50% increase in progression free survival between patients
given anastrozole alone and those given anastrozole and trastuzumab, from 3.8
months to 5.6 months, but with no increase in overall survival between the groups
(Kaufman et al., 2009). However, many patients become resistant to trastuzumab. The
side-effects of trastuzumab consist of nausea, fatigue and occasionally cardiotoxicity
(Nielsen et al., 2013).
Other biological therapies are offered to patients with advanced breast cancer.
Pertuzumab (Perjeta) is a monoclonal antibody that binds to HER2 and obstructs its
dimerisation with other EGFR receptors (Figure 1-3) (Baselga and Swain, 2010).
Pertuzumab as monotherapy has shown a response rate of 3% and 10% in two studies
but when given with trastuzumab the response rate was 18% and progression free
survival improved from 7 weeks with pertuzumab to 17 weeks with pertuzumab and
trastuzumab together (Nielsen et al., 2013). It is approved for use with trastuzumab in
the USA.
Tumours cannot normally grow beyond a few millimetres in size without an improved
blood supply, and angiogenesis, the process that develops new vasculature, is
signalled through hypoxia in the tumour and a change in the balance of pro- and anti-
angiogenic factors, including vascular endothelial growth factor (VEGF)-A.
Bevacizumab (Avastin) is an angiogenesis inhibitor monoclonal antibody that targets
VEGF-A. It is used in the UK for MBC, administered intravenously every two or three
weeks (CRUK, 2014a). The ARTemis trial is looking at the effects of giving
bevacizumab with chemotherapy as neoadjuvant therapy for HER2 negative early
stage breast cancer (CRUK, 2015a). Patients on bevacizumab experience many of the
side effects common to chemotherapy, with nausea and digestive disturbance, but can
also suffer from increased bleeding, such as from gums, poor wound healing, high
16
blood pressure and peripheral neuropathy (CRUK, 2014a). Rarer side effects include
haemorrhaging from a tear in the bowel and heart failure (Couzin-Frankel and Ogale,
2011).
Triple negative breast cancer is a group with generally poor prognosis which tests
negative for ER, HER2 and PR. These cancers are unresponsive to hormone treatment
and HER2 targeted biological therapy and there are no other targeted treatments
specifically for this group, therefore chemotherapy is the favoured treatment, as single
agent or in combination. Bevacizumab is one of the few non-chemotherapy options for
triple negative breast cancer (Conlin and Seidman, 2008). A majority of triple negative
patients have low expression of the DNA repair protein BRCA1 and platinum agent
chemotherapy agents such as carboplatin that target the DNA repair pathway (Table
1-3) have shown good response (Conlin and Seidman, 2008).
Everolimus (Afinitor) is an mTOR inhibitor. Deregulation of the mTOR pathway (Figure
1-3) which is involved in glucose metabolism, protein synthesis, the cell cycle and cell
survival, is found in many breast cancers and is thought to play a major part in drug
resistance (Downward, 1998; Ghayad and Cohen, 2010). Everolimus is prescribed with
exemestane for post-menopausal women with advanced breast cancer (CRUK,
2014h). Side-effects that occur in women treated with this combination therapy include
stomatitis (inflammation of the mouth lining), anaemia, dyspnea (shortness of breath),
hyperglycemia, fatigue, and pneumonitis (inflammation of lung tissue) (Baselga et al.,
2012).
1.2.2.3 New developments in targeted treatments
Research into the mechanisms of cancer has identified a number of new biological
targets for cancer drugs, many of which have entered clinical trials. Among these, poly
ADP ribose polymerase (PARP) inhibitors aim to prevent DNA damage repair in
17
BRCA1/BRCA2 cancer by targeting the DNA repair pathway for single-strand DNA
breaks (Farmer et al., 2005). The PARP inhibitor olaparib (Lynparza) was approved by
the EU in 2014 for advanced ovarian cancer patients with familial BRCA1/BRCA2
(AstraZeneca, 2014) and is undergoing Phase III trials as a treatment for advanced
familial BRCA1/BRCA2 breast cancer (CRUK, 2015b). An inhibitor of cell cycle
regulators cyclin dependent kinase (CDK)4 and CDK6, Palbociclib (Ibrance), is in trials
with letrozole for ER positive, HER2 negative advanced stage post-menopausal
patients, having received accelerated approval from the FDA while in Phase II trials
(FDA, 2015; Cadoo et al., 2014). Trastuzumab emtansine (Kadcyla), a form of
trastuzumab conjugated to derivative of maytansine, a microtubule poison, binds
specifically to HER2 positive breast cancer cells with the dual action of biological
therapy and chemotherapy (LoRusso et al., 2011).
Breast cancers demonstrate considerable inter- and intra-tumoural heterogeneity
(Polyak, 2014). Even expression of the discriminating biomarkers ER, PR and HER2
can vary between clonal populations in the same tumour, and between primary tumour
and metastasis (Zardavas et al., 2015). It has been suggested that the tumour
microenvironment, including the immune system and the stroma, might be a more
stable target and less variable between patients (Zardavas et al., 2015).
Immunotherapy drugs stimulate the immune system to respond to tumour cells or make
tumour cells more visible to immune system cells. The immune system checkpoint
inhibitors Nivolumab (Opdivo), which targets programmed death receptor-1 (Johnson,
2015), and Ipilimumab (Yervoy), which targets cytotoxic T-lymphocyte antigen-4
(Tarhini et al., 2010), are in Phase III trials for melanoma (Crow, 2015). In breast
cancer, the immunotherapy focus is on cancer vaccines. The cancer vaccine
nelipepimut-S (NeuVax) is in Phase III trials to prevent recurrence in HER2 positive
18
patients after surgery (NIH, 2015) and in Phase II had low toxicity (Peoples et al.,
2008).
Processes and pathways that are common to many cancers, such as metastasis which
shares common features across cancer types, could offer more general targets
(Eckhardt et al., 2012). Cancer cells manipulate their environment. Breast cancer cells
secrete fibroblast-activating growth factors which generate a response in local cancer
associated fibroblasts (CAFs) of secreting growth factors for epithelial cells (Eckhardt
et al., 2012). Several drugs that target CAFs are in pre-clinical or Phase I-III trials (Mao
et al., 2013). The extracellular structural protein osteopontin is common to over 30
types of metastatic cancer including breast cancer (Weber, 2013) and may provide a
target. Vimentin is a protein component of intermediate filaments that is upregulated in
many cancers including breast cancer and important in metastasis and is considered a
druggable target (Satelli and Li, 2011). However, to assess toxicity, drugs have to be
tested on a representative model, and there is a shortage of animal models that can
reflect the metastatic process on a range of organs and tissues (Eckhardt et al., 2012).
1.3 Cell death and chemotherapy
Cell death is necessary to balance normal cell division and maintain homeostasis
(Galluzzi et al., 2007). There is controversy over precise definitions of the forms of cell
death (Table 1-4) and considerable crosstalk between the apoptosis, necrosis and
autophagy pathways with many signalling molecules having a role in one or more
routes (Nikoletopoulou et al., 2013). Uncontrolled cell proliferation is a hallmark of
cancer and the aim of cytotoxic cancer treatments is to induce cell death in the
excessive growth and the proliferating cancer cells. Chemotherapy drugs and
radiotherapy make use of one or more cell death pathways with different morphological
characteristics (Table 1-4).
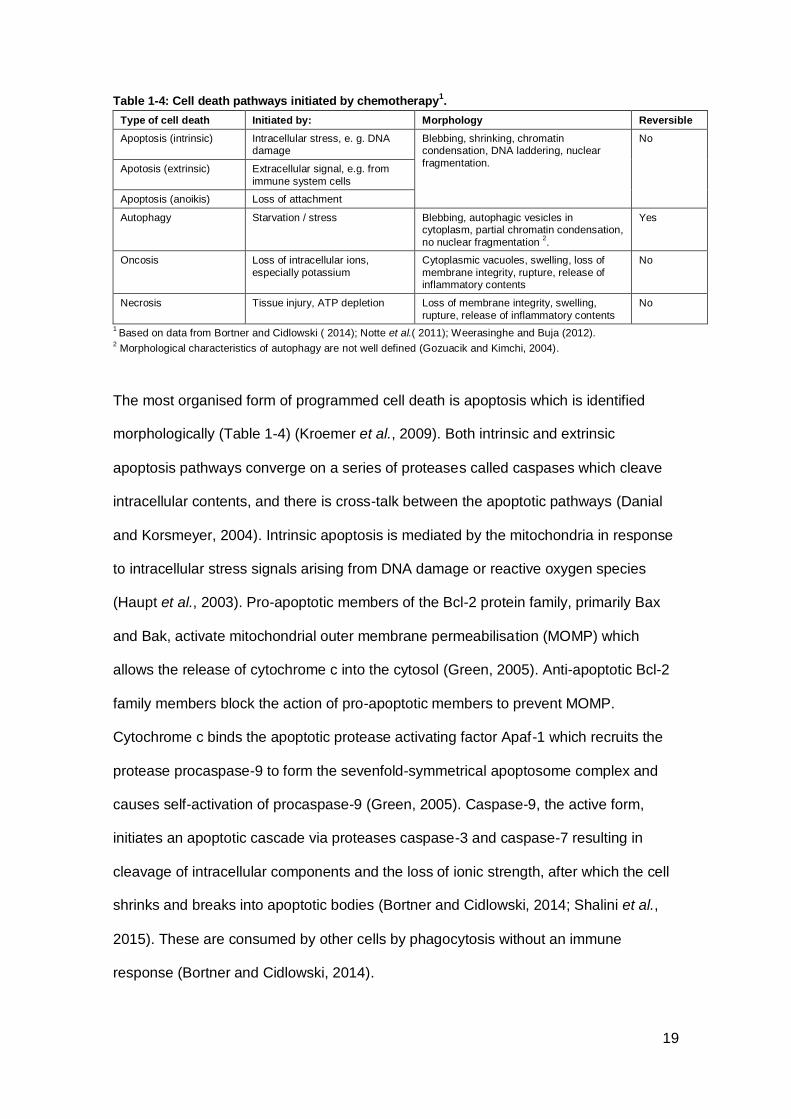
19
Table 1-4: Cell death pathways initiated by chemotherapy1.
Type of cell death Initiated by: Morphology Reversible
Apoptosis (intrinsic) Intracellular stress, e. g. DNA damage
Blebbing, shrinking, chromatin condensation, DNA laddering, nuclear
fragmentation.
No
Apotosis (extrinsic) Extracellular signal, e.g. from
immune system cells
Apoptosis (anoikis) Loss of attachment
Autophagy Starvation / stress Blebbing, autophagic vesicles in cytoplasm, partial chromatin condensation,
no nuclear fragmentation 2.
Yes
Oncosis
Loss of intracellular ions,
especially potassium
Cytoplasmic vacuoles, swelling, loss of
membrane integrity, rupture, release of inflammatory contents
No
Necrosis Tissue injury, ATP depletion Loss of membrane integrity, swelling,
rupture, release of inflammatory contents
No
1 Based on data from Bortner and Cidlowski ( 2014); Notte et al.( 2011); Weerasinghe and Buja (2012).
2 Morphological characteristics of autophagy are not well defined (Gozuacik and Kimchi, 2004).
The most organised form of programmed cell death is apoptosis which is identified
morphologically (Table 1-4) (Kroemer et al., 2009). Both intrinsic and extrinsic
apoptosis pathways converge on a series of proteases called caspases which cleave
intracellular contents, and there is cross-talk between the apoptotic pathways (Danial
and Korsmeyer, 2004). Intrinsic apoptosis is mediated by the mitochondria in response
to intracellular stress signals arising from DNA damage or reactive oxygen species
(Haupt et al., 2003). Pro-apoptotic members of the Bcl-2 protein family, primarily Bax
and Bak, activate mitochondrial outer membrane permeabilisation (MOMP) which
allows the release of cytochrome c into the cytosol (Green, 2005). Anti-apoptotic Bcl-2
family members block the action of pro-apoptotic members to prevent MOMP.
Cytochrome c binds the apoptotic protease activating factor Apaf-1 which recruits the
protease procaspase-9 to form the sevenfold-symmetrical apoptosome complex and
causes self-activation of procaspase-9 (Green, 2005). Caspase-9, the active form,
initiates an apoptotic cascade via proteases caspase-3 and caspase-7 resulting in
cleavage of intracellular components and the loss of ionic strength, after which the cell
shrinks and breaks into apoptotic bodies (Bortner and Cidlowski, 2014; Shalini et al.,
2015). These are consumed by other cells by phagocytosis without an immune
response (Bortner and Cidlowski, 2014).
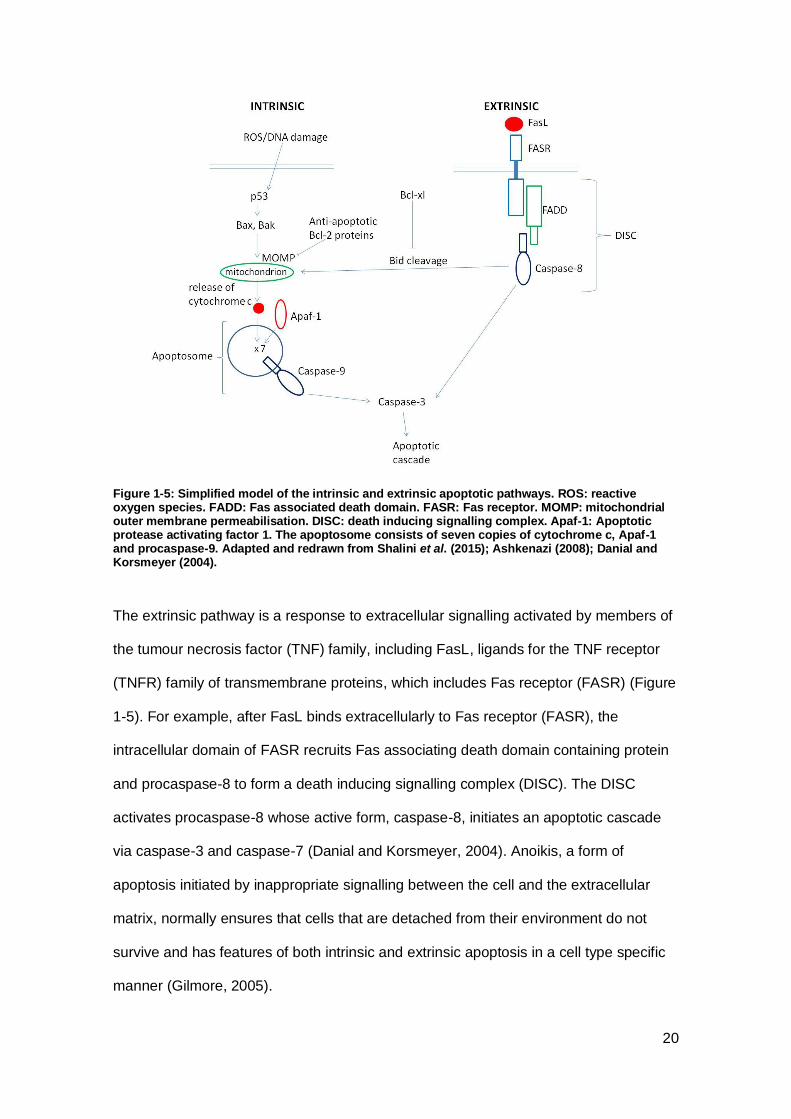
20
Figure 1-5: Simplified model of the intrinsic and extrinsic apoptotic pathways. ROS: reactive oxygen species. FADD: Fas associated death domain. FASR: Fas receptor. MOMP: mitochondrial outer membrane permeabilisation. DISC: death inducing signalling complex. Apaf-1: Apoptotic protease activating factor 1. The apoptosome consists of seven copies of cytochrome c, Apaf-1 and procaspase-9. Adapted and redrawn from Shalini et al. (2015); Ashkenazi (2008); Danial and Korsmeyer (2004).
The extrinsic pathway is a response to extracellular signalling activated by members of
the tumour necrosis factor (TNF) family, including FasL, ligands for the TNF receptor
(TNFR) family of transmembrane proteins, which includes Fas receptor (FASR) (Figure
1-5). For example, after FasL binds extracellularly to Fas receptor (FASR), the
intracellular domain of FASR recruits Fas associating death domain containing protein
and procaspase-8 to form a death inducing signalling complex (DISC). The DISC
activates procaspase-8 whose active form, caspase-8, initiates an apoptotic cascade
via caspase-3 and caspase-7 (Danial and Korsmeyer, 2004). Anoikis, a form of
apoptosis initiated by inappropriate signalling between the cell and the extracellular
matrix, normally ensures that cells that are detached from their environment do not
survive and has features of both intrinsic and extrinsic apoptosis in a cell type specific
manner (Gilmore, 2005).
21
Autophagy is selective degradation of organelles as a starvation response to make
cellular materials available for re-use and can lead to autophagic cell death or precede
apoptosis (Liang et al., 2006). In autophagy, Beclin 1 promotes the formation of
autophagosomes, structures enclosed by a double membrane in the cytoplasm, which
encapsulate organelles, including mitochondria (Notte et al., 2011). Autophagosomes
then fuse with lysosomes where the contents are degraded by lysosomal enzymes and
recycled within the cell (Ricci and Zong, 2006). There is crosstalk with other pathways.
For instance, in addition to its anti-apoptotic role in apoptosis, Bcl-2 is able to inhibit
Beclin-1 and prevent autophagy (Notte et al., 2011). Necrosis occurs as a result of
damage causing loss of ATP generation and has been thought of as accidental, but
there is now evidence for necrosis being induced by intracellular and extracellular
signals (Krysko et al., 2008). Swelling and membrane rupture release intracellular
contents that can cause local inflammation and an immune response (Kroemer et al.,
2009).
The means of cell death in cells treated by chemotherapy and radiotherapy is primarily
through apoptosis. DNA-damaging agents and ionizing radiation activate the DNA
damage response, leading to the stabilization of tumour suppressor protein p53 which
would otherwise be degraded by mouse double minute 2 homolog (Lane, 1992). p53
arrests the cell cycle temporarily to allow time for DNA damage repair, or initiates
intrinsic apoptosis by transcription of pro-apoptotic genes (Ricci and Zong, 2006). In
the cancer context, autophagy may have either a tumour suppressor function and
promote necrosis, or, later in the disease’s progress, a pro-survival function (Notte et
al., 2011). Pro-apoptotic Bid provides a route for convergence of the intrinsic and
extrinsic pathways (Figure 1-5) and autophagy may be an important means of cell
death in cancer cells with part of the apoptotic pathways disrupted (Notte et al., 2011;
Haupt et al., 2003).
22
1.4 The cytoskeleton in cancer
1.4.1 Introduction
The hallmarks of cancer include sustained cell division and cell invasion and
metastasis, both mediated by actions of the cytoskeleton (Hanahan and Weinberg,
2011). The cytoskeleton is the intracellular network of structural proteins composed of
actin filaments, microtubules and intermediate filaments. Both microtubules and actin
filaments are involved in cell division, while the actin network is also active in cell
motility (Hall, 2009). Microtubules are composite filaments of around 13 protofilaments
(Tilney et al., 1973) which are themselves polymers of tubulin protein subunits:
heterodimers of α-tubulin and β-tubulin each bound to guanosine triphosphate (GTP)
(Jordan and Wilson, 1998). Actin filaments or microfilaments are polymers formed of a
helix of two strands of filamentous actin (F-actin) which is polymerised from a pool of
free actin subunit monomers (G-actin) in solution in the cytoplasm and bound to
adenosine triphosphate (ATP) (Allingham et al., 2006).
There are similarities in the polymerisation mechanisms of microtubules and actin
filaments. Net polymerisation occurs when the concentration of subunits in the
cytoplasm is higher than the critical concentration for growth, and net depolymerisation
when it is lower (Raxworthy, 1988; Remedios et al., 2003). The filaments have a
polarised structure with a plus end where conditions are more favourable for growth
and a minus end where they are less favourable, although both growth and shrinkage
can occur at either end (Raxworthy, 1988; Remedios et al., 2003). Soon after the unit
binds to the filament, tubulin or actin catalyses hydrolysis of the triphosphate to
guanosine diphosphate (GDP) or adenosine diphosphate (ADP) (Figure 1-6), which
causes a conformational change in the subunit that introduces torsions in the filament
structure (Amos and Löwe, 1999; Oda et al., 2009). The torsional stress is overcome
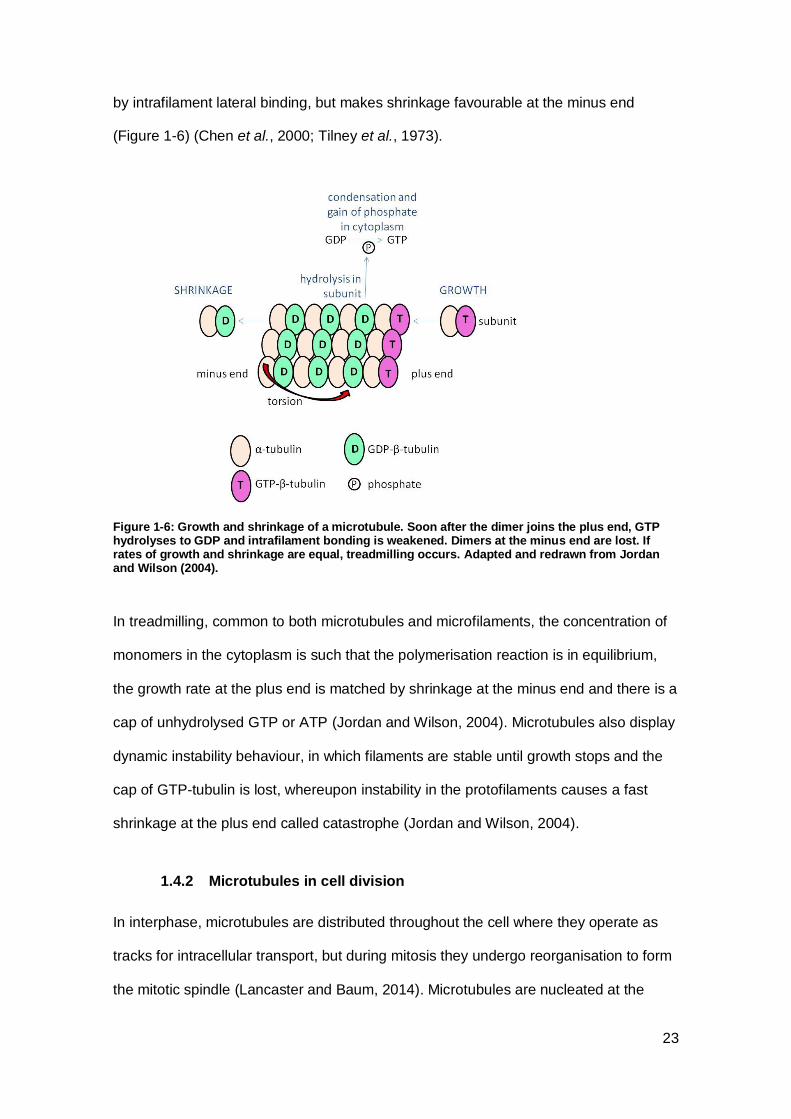
23
by intrafilament lateral binding, but makes shrinkage favourable at the minus end
(Figure 1-6) (Chen et al., 2000; Tilney et al., 1973).
Figure 1-6: Growth and shrinkage of a microtubule. Soon after the dimer joins the plus end, GTP hydrolyses to GDP and intrafilament bonding is weakened. Dimers at the minus end are lost. If rates of growth and shrinkage are equal, treadmilling occurs. Adapted and redrawn from Jordan and Wilson (2004).
In treadmilling, common to both microtubules and microfilaments, the concentration of
monomers in the cytoplasm is such that the polymerisation reaction is in equilibrium,
the growth rate at the plus end is matched by shrinkage at the minus end and there is a
cap of unhydrolysed GTP or ATP (Jordan and Wilson, 2004). Microtubules also display
dynamic instability behaviour, in which filaments are stable until growth stops and the
cap of GTP-tubulin is lost, whereupon instability in the protofilaments causes a fast
shrinkage at the plus end called catastrophe (Jordan and Wilson, 2004).
1.4.2 Microtubules in cell division
In interphase, microtubules are distributed throughout the cell where they operate as
tracks for intracellular transport, but during mitosis they undergo reorganisation to form
the mitotic spindle (Lancaster and Baum, 2014). Microtubules are nucleated at the
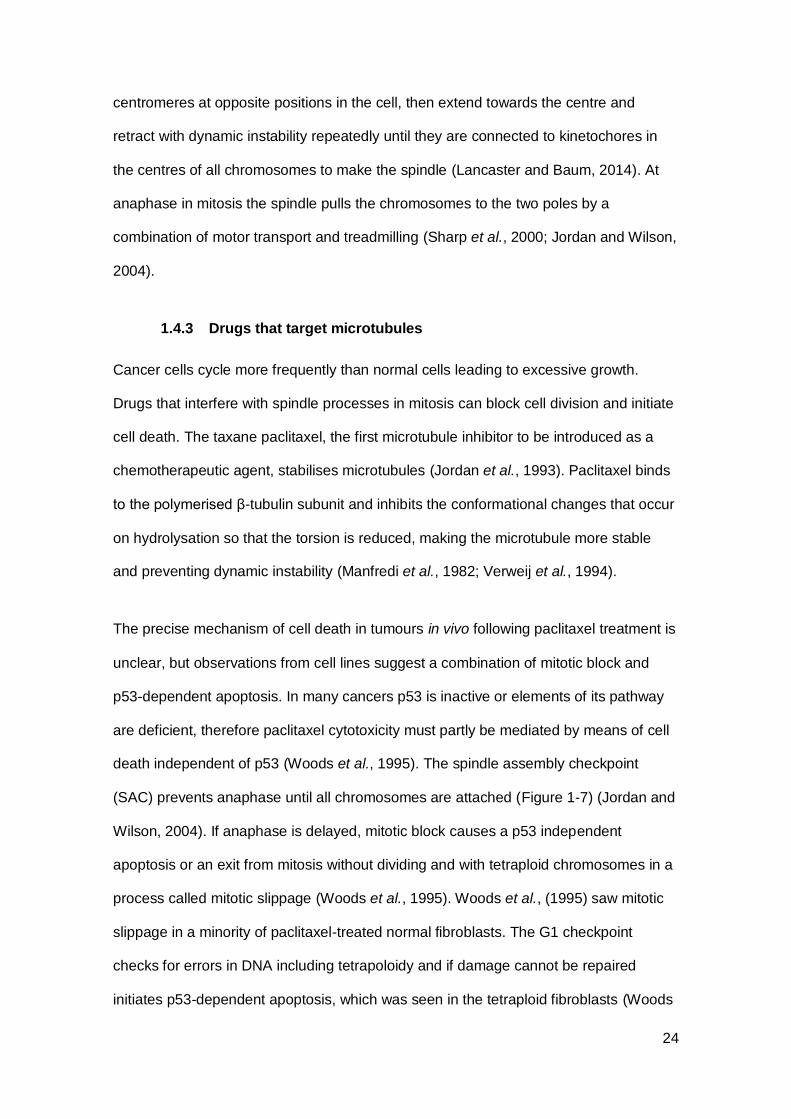
24
centromeres at opposite positions in the cell, then extend towards the centre and
retract with dynamic instability repeatedly until they are connected to kinetochores in
the centres of all chromosomes to make the spindle (Lancaster and Baum, 2014). At
anaphase in mitosis the spindle pulls the chromosomes to the two poles by a
combination of motor transport and treadmilling (Sharp et al., 2000; Jordan and Wilson,
2004).
1.4.3 Drugs that target microtubules
Cancer cells cycle more frequently than normal cells leading to excessive growth.
Drugs that interfere with spindle processes in mitosis can block cell division and initiate
cell death. The taxane paclitaxel, the first microtubule inhibitor to be introduced as a
chemotherapeutic agent, stabilises microtubules (Jordan et al., 1993). Paclitaxel binds
to the polymerised β-tubulin subunit and inhibits the conformational changes that occur
on hydrolysation so that the torsion is reduced, making the microtubule more stable
and preventing dynamic instability (Manfredi et al., 1982; Verweij et al., 1994).
The precise mechanism of cell death in tumours in vivo following paclitaxel treatment is
unclear, but observations from cell lines suggest a combination of mitotic block and
p53-dependent apoptosis. In many cancers p53 is inactive or elements of its pathway
are deficient, therefore paclitaxel cytotoxicity must partly be mediated by means of cell
death independent of p53 (Woods et al., 1995). The spindle assembly checkpoint
(SAC) prevents anaphase until all chromosomes are attached (Figure 1-7) (Jordan and
Wilson, 2004). If anaphase is delayed, mitotic block causes a p53 independent
apoptosis or an exit from mitosis without dividing and with tetraploid chromosomes in a
process called mitotic slippage (Woods et al., 1995). Woods et al., (1995) saw mitotic
slippage in a minority of paclitaxel-treated normal fibroblasts. The G1 checkpoint
checks for errors in DNA including tetrapoloidy and if damage cannot be repaired
initiates p53-dependent apoptosis, which was seen in the tetraploid fibroblasts (Woods
25
et al., 1995). In breast cancer cell lines, paclitaxel treated cells developed increasingly
abnormal spindle morphology as dose increased, resulting in star-shaped bundles or
Figure 1-7: The cell cycle. A: Phases of the cell cycle and checkpoints. G1, G2: growth phases. S: synthesis. M: mitosis. Interphase: G1, S, G2. B: Stages of mitosis. SAC: Spindle assembly checkpoint. Adapted and redrawn from Weaver and Cleveland (2005); Kunda and Baum (2009).
asters of microtubules, entered mitotic block and subsequently apoptosis after 24 hours
(Yeung et al., 1999). However, 50% of cells are blocked in mitosis at paclitaxel doses
too low to cause additional microtubule polymerisation, which suggests that a low level
of stabilisation alters microtubule dynamics to delay progression to anaphase (Jordan
A
B
26
and Wilson, 2004). The explanation for mitotic block causing apoptosis is unclear, but
may be through prolonged mitotic inhibition of protein transcription leading to a
reduction in levels of short-lived anti-apoptotic proteins and activation of either the
intrinsic or extrinsic pathway (Blagosklonny, 2007).
Paclitaxel can also cause the phosphorylation and inactivation of anti-apoptotic Bcl-2
through Raf-1, pushing the balance of pro- and anti-apoptotic proteins towards
mitochondria mediated apoptosis (Blagosklonny et al., 1996). Orth et al. (2012) showed
that prolonged mitotic arrest in breast cancer cells can also cause DNA damage and a
p53-dependent damage response. In addition, paclitaxel can initiate necrosis in breast
cancer cells, at least at higher than therapeutic levels (Yeung et al., 1999), and can
generate an autophagic response (Eum and Lee, 2011) although it is unclear whether
this protects against or promotes apoptosis.
Docetaxel is a semisynthetic analogue of paclitaxel that binds β-tubulin with greater
affinity and has a longer retention time in tumour cells (Gligorov and Lotz, 2004).
Abraxane is a form of paclitaxel bound to albumin as a nanoparticle delivery vehicle.
The presence of albumin aids drug delivery by binding to the cell surface receptor gp60
on vascular endothelial cells to make an albumin-gp60 complex which induces
caveolae formation, transcytoses across the blood vessel wall into the stroma, and
binds to secreted protein acid rich in cysteine (SPARC) often expressed by cancer cells
(Miele et al., 2009). Binding to SPARC releases the hydrophobic cargo paclitaxel which
then diffuses into the tumour cell (Miele et al., 2009). Breast cancer patients can
tolerate 70% higher doses because higher levels of paclitaxel are found in the tumour
than surrounding cells, and the antitumour effect is greater (Miele et al., 2009).
The vinca alkaloid drugs vincristine and vinblastine and their derivatives vindesine and
vinorelbine target microtubules by inhibiting polymerisation. Vinblastine binds to tubulin
27
polymers and dimers inducing self-association in dimers and prolonging the time a
microtubule spends neither growing nor shortening (Jordan and Wilson, 2004). It
seems to perturb microtubule dynamics sufficiently to delay anaphase leading to mitotic
block at the SAC and apoptosis (Jordan and Wilson, 2004). In a study of the effects of
vincristine and vinblastine, at doses which caused just less than 50% growth arrest,
spindles looked almost normal, with the exception of some unusually long astral
microtubules, yet 50% of cells were arrested in metaphase of mitosis (Jordan et al.,
1991). At doses that caused 70-90% mitotic arrest some cells had star-shaped
microtubule arrangements instead of a spindle while in others some chromosomes
were found at the poles instead of at the metaphase plate, yet polymerisation was only
inhibited at still higher doses when microtubules in the star shapes became shorter
(Jordan et al., 1991). Despite the differences in taxanes’ and vinca alkaloids’ binding to
tubulin, their mechanisms of action in preventing tubulin turnover, perturbing
microtubule dynamics and leading to mitotic block are similar.
Cancers that are unresponsive to taxanes or vinca alkaloids can be treated with drugs
that target microtubules in other ways. Eribulin (Halaven) is a microtubule inhibitor
antimetabolite that appears to operate by end-poisoning, or preventing growth of
microtubules during mitosis, and by forming aggregates with free tubulin, reducing the
available pool of tubulin for microtubule growth (Jordan et al., 2005). It was approved in
2010 by the USA Food and Drug Administration (FDA) for use on metastatic breast
cancer that has already been treated with two other chemotherapy regimens involving
taxanes and anthracyclines (FDA, 2010). The newer epothilone group of microtubule
inhibitors, which includes ixabepilone, appears to have a similar mode of action to the
taxanes, but binds to a different binding pocket on the β-tubulin subunit (Boehnke
Michaud, 2009). In both cases, as with the taxanes, treated cells enter mitotic block
and cell death (Boehnke Michaud, 2009).
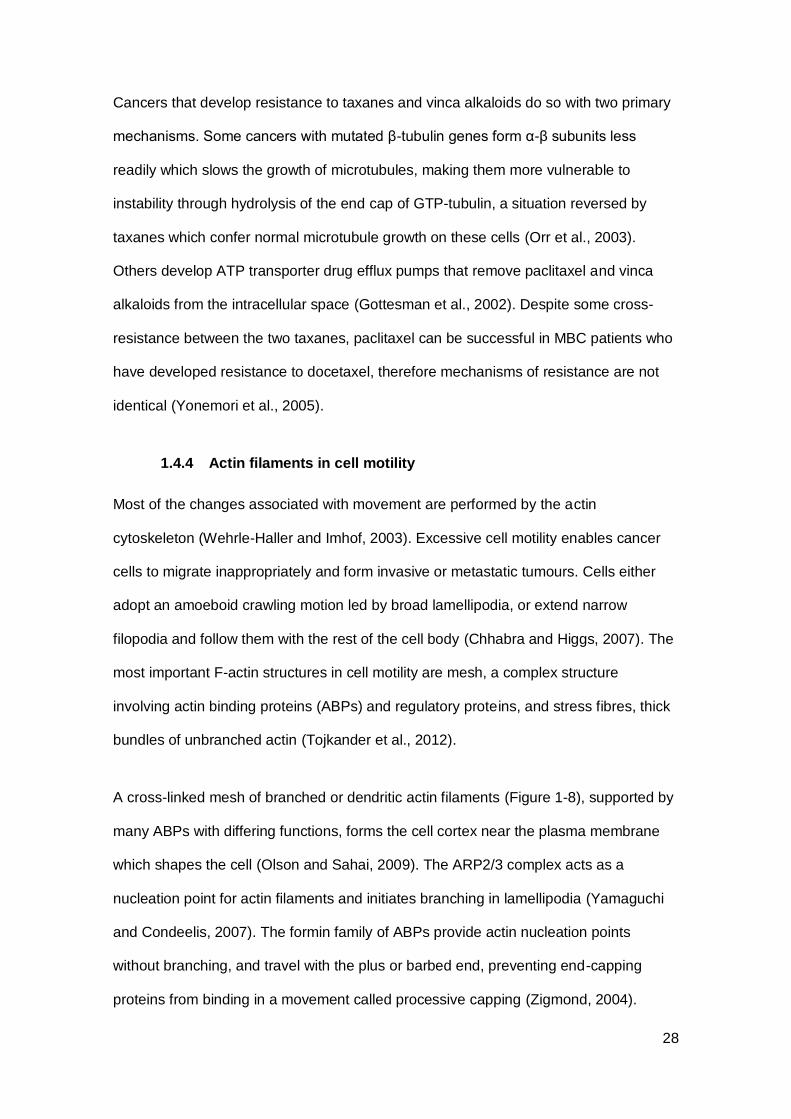
28
Cancers that develop resistance to taxanes and vinca alkaloids do so with two primary
mechanisms. Some cancers with mutated β-tubulin genes form α-β subunits less
readily which slows the growth of microtubules, making them more vulnerable to
instability through hydrolysis of the end cap of GTP-tubulin, a situation reversed by
taxanes which confer normal microtubule growth on these cells (Orr et al., 2003).
Others develop ATP transporter drug efflux pumps that remove paclitaxel and vinca
alkaloids from the intracellular space (Gottesman et al., 2002). Despite some cross-
resistance between the two taxanes, paclitaxel can be successful in MBC patients who
have developed resistance to docetaxel, therefore mechanisms of resistance are not
identical (Yonemori et al., 2005).
1.4.4 Actin filaments in cell motility
Most of the changes associated with movement are performed by the actin
cytoskeleton (Wehrle-Haller and Imhof, 2003). Excessive cell motility enables cancer
cells to migrate inappropriately and form invasive or metastatic tumours. Cells either
adopt an amoeboid crawling motion led by broad lamellipodia, or extend narrow
filopodia and follow them with the rest of the cell body (Chhabra and Higgs, 2007). The
most important F-actin structures in cell motility are mesh, a complex structure
involving actin binding proteins (ABPs) and regulatory proteins, and stress fibres, thick
bundles of unbranched actin (Tojkander et al., 2012).
A cross-linked mesh of branched or dendritic actin filaments (Figure 1-8), supported by
many ABPs with differing functions, forms the cell cortex near the plasma membrane
which shapes the cell (Olson and Sahai, 2009). The ARP2/3 complex acts as a
nucleation point for actin filaments and initiates branching in lamellipodia (Yamaguchi
and Condeelis, 2007). The formin family of ABPs provide actin nucleation points
without branching, and travel with the plus or barbed end, preventing end-capping
proteins from binding in a movement called processive capping (Zigmond, 2004).
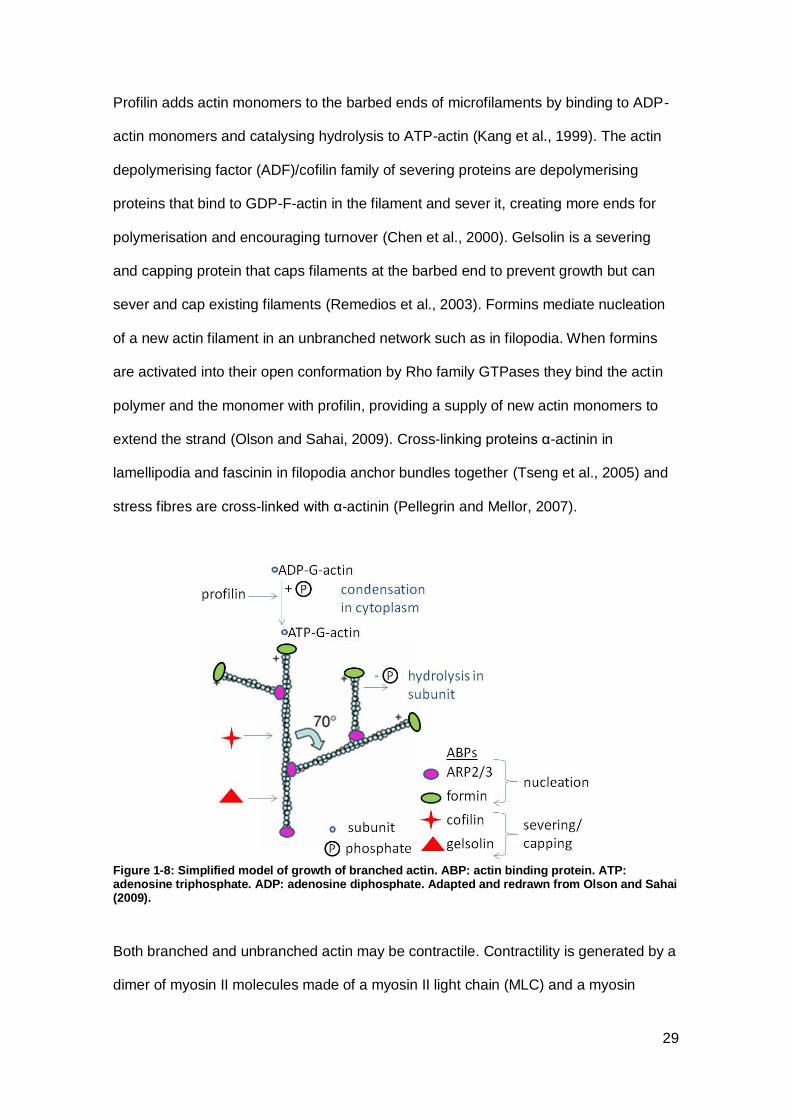
29
Profilin adds actin monomers to the barbed ends of microfilaments by binding to ADP-
actin monomers and catalysing hydrolysis to ATP-actin (Kang et al., 1999). The actin
depolymerising factor (ADF)/cofilin family of severing proteins are depolymerising
proteins that bind to GDP-F-actin in the filament and sever it, creating more ends for
polymerisation and encouraging turnover (Chen et al., 2000). Gelsolin is a severing
and capping protein that caps filaments at the barbed end to prevent growth but can
sever and cap existing filaments (Remedios et al., 2003). Formins mediate nucleation
of a new actin filament in an unbranched network such as in filopodia. When formins
are activated into their open conformation by Rho family GTPases they bind the actin
polymer and the monomer with profilin, providing a supply of new actin monomers to
extend the strand (Olson and Sahai, 2009). Cross-linking proteins α-actinin in
lamellipodia and fascinin in filopodia anchor bundles together (Tseng et al., 2005) and
stress fibres are cross-linked with α-actinin (Pellegrin and Mellor, 2007).
Figure 1-8: Simplified model of growth of branched actin. ABP: actin binding protein. ATP: adenosine triphosphate. ADP: adenosine diphosphate. Adapted and redrawn from Olson and Sahai (2009).
Both branched and unbranched actin may be contractile. Contractility is generated by a
dimer of myosin II molecules made of a myosin II light chain (MLC) and a myosin

30
heavy chain (MHC) with a globular head and a coiled-coil domain tail (Figure 1-9). On
phosphorylation of MLC by Rho associated coiled-coil containing kinase (ROCK), citron
kinase or MLC kinase (MLCK), the MHC tail is released, allowing interaction of myosin
Figure 1-9: Myosin II dimer structure (A), actomyosin structure (B) and contractility mechanism in minifilament. ROCK: Rho associated coiled-coil containing kinase. MLC: myosin light chain. MHC: myosin heavy chain. MLCK: MLC kinase. P: phosphorylation. +: plus/barbed end of actin filament. Red arrows in B show contraction of myosin. Adapted and redrawn from Levayer and Lecuit (2012).
II with the actin filament in an actomyosin complex (Levayer and Lecuit, 2012). During
stress fibre formation, ROCK phosphorylates LIM kinase (LIMK) which phosphorylates
and inactivates the severing protein cofilin (Olson and Sahai, 2009). Several
actomyosin fibres associate tail to tail to make a minifilament. Using energy from ATP,
the myosin head progresses along the actin filament towards the barbed end. When
two myosin filaments associate with opposite polarities they move relative to one
another, creating contractile force (Olson and Sahai, 2009). Tropomyosins (TMs)
polymerise to form filaments that lie in the major groove of actin filaments and regulate
the binding of ABPs to actin (Gunning et al., 2005). The family of ~40 TMs have
isoform-specific, cell type-specific effects (Gunning et al., 2005). When stimulated by
calcium, TM5NM1 moves to uncover the myosin binding site of actin and permit

31
actomyosin formation. In breast epithelial cells, TM1 stabilises stress fibres by
protecting them from severing by gelsolin and ADF/cofilin, and is often absent in breast
cancer cells (Gunning et al., 2005). In neurons, TMBr3 promotes gelsolin and
ADF/cofilin binding to actin and their severing activity, reduces stress fibres and
increases lamellipodia formation (Bryce et al., 2003).
The mechanisms for cell migration are specific to cell type and substrate. In a
stationary fibroblast on a 2D adhesive surface stress fibres are prominent but in a
migrating fibroblast (Figure 1-10) stress fibres are disassembled to provide a pool of G-
actin for polymerisation in a lamellipodium or filopodium (Lauffenburger and Horwitz,
1996). Migration is a cycle of protrusion and retraction at the leading edge (Giannone
et al., 2007). Polymerisation of branched actin mesh attached to a substrate at
stationary focal complexes provides sufficient force to push the leading edge of the cell
forward (Giannone et al., 2007). This is followed by retraction as, behind the actin rich
leading edge, actomyosin contracts to pull the lamellipodium backward and generate
downward pressure on the substrate where a new focal contact forms (Giannone et al.,
2007). Meanwhile, at the rear, stress fibres contract to pull the tail forward and focal
contacts slide (Wehrle-Haller and Imhof, 2003) or break off and are left on the
substrate (Lauffenburger and Horwitz, 1996). As more prominent stress fibres are seen
in less motile cells, they may inhibit cell migration (Pellegrin and Mellor, 2007), whereas
in fast moving cells such as some cancer cells, stress fibres are finer or absent
(Wehrle-Haller and Imhof, 2003). Possibly due to loss of polarity, cancer cells may
develop lamellipodia at two membrane locations, resulting in equal pull and
immobilisation (Wehrle-Haller and Imhof, 2003). In some cancer cells a continuous
extension and retraction of lamellipodia is seen without attachment in a process called
ruffling (Nobes and Hall, 1995).
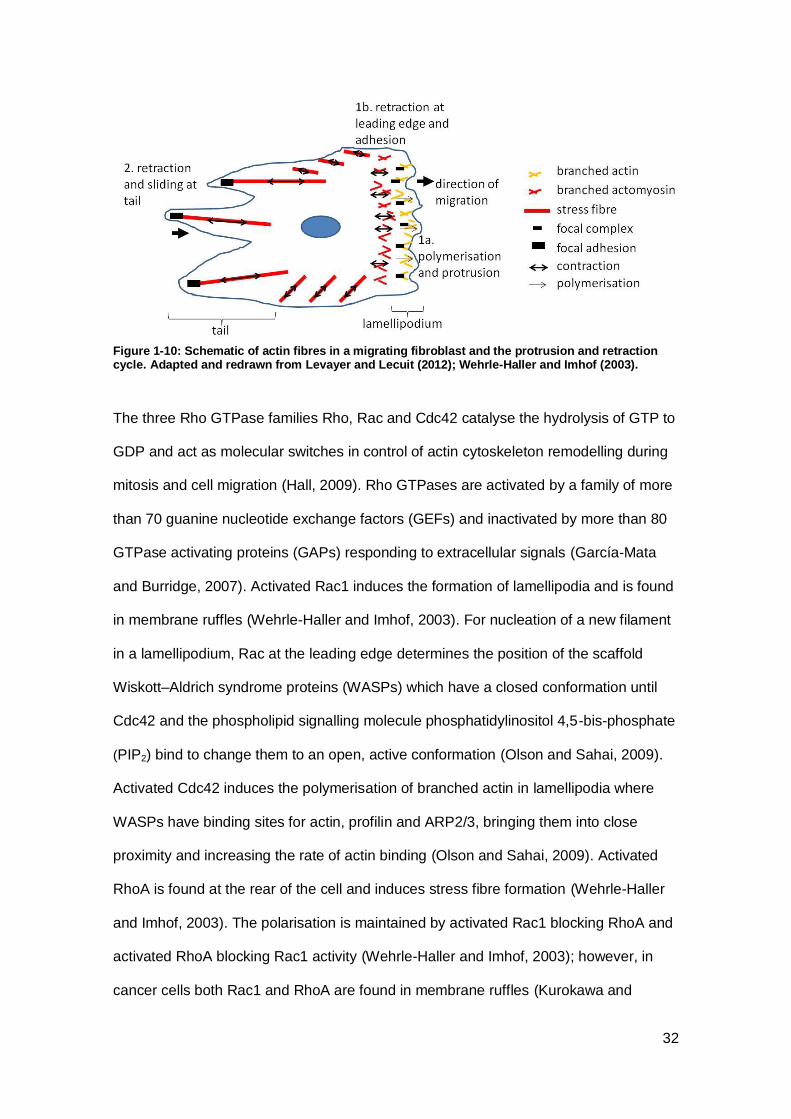
32
Figure 1-10: Schematic of actin fibres in a migrating fibroblast and the protrusion and retraction cycle. Adapted and redrawn from Levayer and Lecuit (2012); Wehrle-Haller and Imhof (2003).
The three Rho GTPase families Rho, Rac and Cdc42 catalyse the hydrolysis of GTP to
GDP and act as molecular switches in control of actin cytoskeleton remodelling during
mitosis and cell migration (Hall, 2009). Rho GTPases are activated by a family of more
than 70 guanine nucleotide exchange factors (GEFs) and inactivated by more than 80
GTPase activating proteins (GAPs) responding to extracellular signals (García-Mata
and Burridge, 2007). Activated Rac1 induces the formation of lamellipodia and is found
in membrane ruffles (Wehrle-Haller and Imhof, 2003). For nucleation of a new filament
in a lamellipodium, Rac at the leading edge determines the position of the scaffold
Wiskott–Aldrich syndrome proteins (WASPs) which have a closed conformation until
Cdc42 and the phospholipid signalling molecule phosphatidylinositol 4,5-bis-phosphate
(PIP2) bind to change them to an open, active conformation (Olson and Sahai, 2009).
Activated Cdc42 induces the polymerisation of branched actin in lamellipodia where
WASPs have binding sites for actin, profilin and ARP2/3, bringing them into close
proximity and increasing the rate of actin binding (Olson and Sahai, 2009). Activated
RhoA is found at the rear of the cell and induces stress fibre formation (Wehrle-Haller
and Imhof, 2003). The polarisation is maintained by activated Rac1 blocking RhoA and
activated RhoA blocking Rac1 activity (Wehrle-Haller and Imhof, 2003); however, in
cancer cells both Rac1 and RhoA are found in membrane ruffles (Kurokawa and

33
Matsuda, 2005). The GAPs and GEFs regulating the Rho GTPases in cell migration
are not fully understood.
1.4.5 Actin filaments in cell division
The actin cytoskeleton is involved at several stages of mitosis (Table 1-5). The
contractile ring, consisting of actomyosin, forms at the cell equator and tightens to
induce cytokinesis (Miller, 2011). If the contractile ring fails to form, cytokinesis does
not take place and the cell becomes binucleated (Davies and Canman, 2012).
Positioning of the contractile ring is partly controlled by microtubules through the GEF
GEF-H1, localised to microtubules and itself activated by microtubule depolymerisation,
which activates RhoA at the equator (D’Avino, 2009). Activated RhoA-GTP induces
formation of actin filaments for the contractile ring and linkage with myosin II via ROCK,
citron kinase, nucleation via the formin mDia and inactivation of cofilin in a similar way
to the formation of stress fibres (Figure 1-9) (Glotzer, 2001). Myosin II promotes
alignment of actomyosin bundles and provides contractile force in the contractile ring
(Glotzer, 2001). GAPs and GEFs may control cycling of active and inactive RhoA
during mitosis to ensure a constant supply of activated RhoA (Heng and Koh, 2010).
Table 1-5: Actin involvement in stages of the cell cycle 1.
Stage Event Role of microfilaments
Mitosis
Prophase Rounding, to facilitate spindle
positioning
Loss of adhesion and increased cortex rigidity. Separation
of centrosomes for correct spindle positioning.
Retraction fibres maintain attachment.
Metaphase Spindle attachment to chromosome
kinetochores
Associate with microtubules, possibly for correct spindle
orientation
Anaphase Spindle separates chromosomes
Cytokinesis Split into two daughter cells Actin-myosin filament assembly forms contractile ring.
Contraction of ring. Cortex reassembled to pull daughter cells apart
Interphase Spreading Regain adhesion
1 Based on data from Hall (2009); Heng and Koh (2010); Kunda and Baum (2009).
34
1.4.6 Drugs that target the actin cytoskeleton
Many of the actin cytoskeleton proteins are deregulated in cancer cells, and in breast
cancer cells these include ARP2/3, Cdc42, Rac1, RhoA, N-WASP, profilin, gelsolin,
and MLCK (Olson and Sahai, 2009). Metastatic breast cancer has increased actin
filaments and reducing the actin structure reduces cell motility (Trendowski, 2014).
There are no drugs approved for use that target the actin cytoskeleton and two recent
reviews of drug targets for metastasis did not include the actin cytoskeleton (Eckhardt
et al., 2012; Weber, 2013). However, some natural product compounds target actin
directly. They either inhibit polymerisation or depolymerise actin filaments; or enhance
polymerisation or stabilise actin filaments (Table 1-6) (Foerster et al., 2014). Many of
them have been investigated as potential anticancer drugs.
Table 1-6: Some natural product compounds targeting actin directly 1.
Type Example compound Mode of action
Filament inhibiting /
destabilizing
Cytochalasin B, curcumin
Binds to filaments and prevents addition of monomers.
Latrunculin A Sequesters G-actin: binds to the ATP-binding cleft and prevents
monomers polymerising by inhibiting the necessary conformational change.
Kabiramide C Sequesters G-actin: Binds to surface of barbed end of G-actin creating
steric hindrance to binding. May also cap microfilaments and prevent polymer growth.
Filament stabilizing
Phalloidin, jasplakinolide
Interacts with three actin monomers in filament to stabilise filament.
Dolastatin Interacts with two actin monomers in filament to stabilise filament.
1Based on data from Allingham et al. (2006); Trendowski (2014); Dhar et al. (2015).
Cytochalasin B can disrupt the contractile ring in cancer cells leading to unsuccessful
mitosis and large multinucleated cells (Trendowski, 2014). Kabiramide C, a trisoxazole
toxin, has a large hydrophobic ring that contacts a hydrophobic patch in the barbed end
of monomeric G-actin such that its long tail lies in the cleft and prevents monomers
from attaching (Allingham et al., 2006). The natural products that stabilise actin,
including cyclic peptides jasplakinolide and phalloidin, bind to more than one actin
subunit in the polymer to reinforce the intrafilament binding, and it is likely that they
induce conformational changes with effects that stabilise the filament at a distance from
35
the binding sites (Allingham et al., 2006). Both jasplakinolide and phalloidin appear to
have cell type specific effects. In prostate cancer cells at non-lethal doses
jasplakinolide caused cell rounding, membrane blebs, aggregation of filamentous actin
and reduced cell motility, and it inhibited cell division leading to the formation of
multinucleated cells (Senderowicz et al., 1995). At non-lethal doses jasplakinolide
increases actin polymerisation and cell migration in breast cancer and leukaemia cells
(Hayot et al., 2006; Kothakota et al., 1997; Stingl et al., 1992). In cervical cancer cells
phalloidin causes aggregation of actin and reduced cell motility and cell division
(Wehland et al., 1977).
Some drugs target the cytoskeleton accessory proteins. A synthetic triterpenoid has
been tested on Rat2 fibroblasts where it led to reduced ARP3 expression and ARP2/3
dependent branching, and knocking down ARP3 with a small interfering RNA reduced
cell motility (To et al., 2010). Tropomyosins are differentially expressed in cancers with
TM5NM1 upregulated in melanoma and neuroblastoma cells and TM1 expressed at
low levels or absent in most cancers including breast cancer (Gunning et al., 2008;
Stehn et al., 2013). The anti-tropomyosin synthetic compound TR100 targets
TM5NM1/2 (Stehn et al., 2013). Raval et al. (2003) found that TM1 had a tumour
suppressor function and expressing TM-1 in breast cancer cells could inhibit growth
and sensitise cells to apoptosis in anchorage independent conditions. However,
targeting the tropomyosins may prove challenging as their activity is dependent on the
availability and activity of other ABPs in each cell type and intracellular location
(Gunning et al., 2008). Due to the ubiquity of the actin cytoskeleton in all cells and the
difficulty of specifically targeting cancer cells, and the complexity in the cytoskeleton
which permits alternative pathways when one is blocked, there is still much to discover
about targeting the proteins in the actin cytoskeleton.
36
1.4.7 The need for new drugs
Breast cancer is heterogeneous. The choice of therapy and the specific agents
selected as monotherapy or in combination depend on the nature and stage of the
disease, and each patient’s cancer response. In a breast cancer classification of 537
tumours based on gene expression microarray analysis, Guedj et al. (2012) found that
breast cancer tumours clustered into six subgroups which they suggest could generate
new prognostic markers and therapeutic targets. They validated the classification
against external datasets of >3000 tumours and found distinct differences between
groups in clinical outcome (Guedj et al., 2012). However, others including Green et al.
(2013) dispute the validity of using microarray analysis for classification, preferring
immunohistological classification on grounds of clinical relevance, repeatability and
cost. Green et al. (2013) classified 93% of tumour specimens into six subgroups using
10 biochemical markers. Genetic classification is allowing drugs to be developed for
sub-groups of patients but the cost per patient is high. Currently, even drugs that target
sub-populations do not have an entirely predictable response: for example, tamoxifen
is only effective in 70% of ER positive cases (Hoskins et al., 2009). Drugs aimed at less
specific targets, that would be effective in more patients, would be more cost effective.
Very effective, if burdensome, treatments exist for early stage breast cancer, with the
exception of triple negative patients. Hormone therapy, chemotherapy and biological
therapy, used alone and in combination, offer huge benefit to patients and can prevent
or considerably delay the progress of disease. However, in advanced breast cancer,
after disease recurrence, metastasis and drug resistance, eventually palliative care is
the only option. There are currently no drugs available that target the process of cell
migration or metastasis, leaving MBC patients with no long-term treatment options.
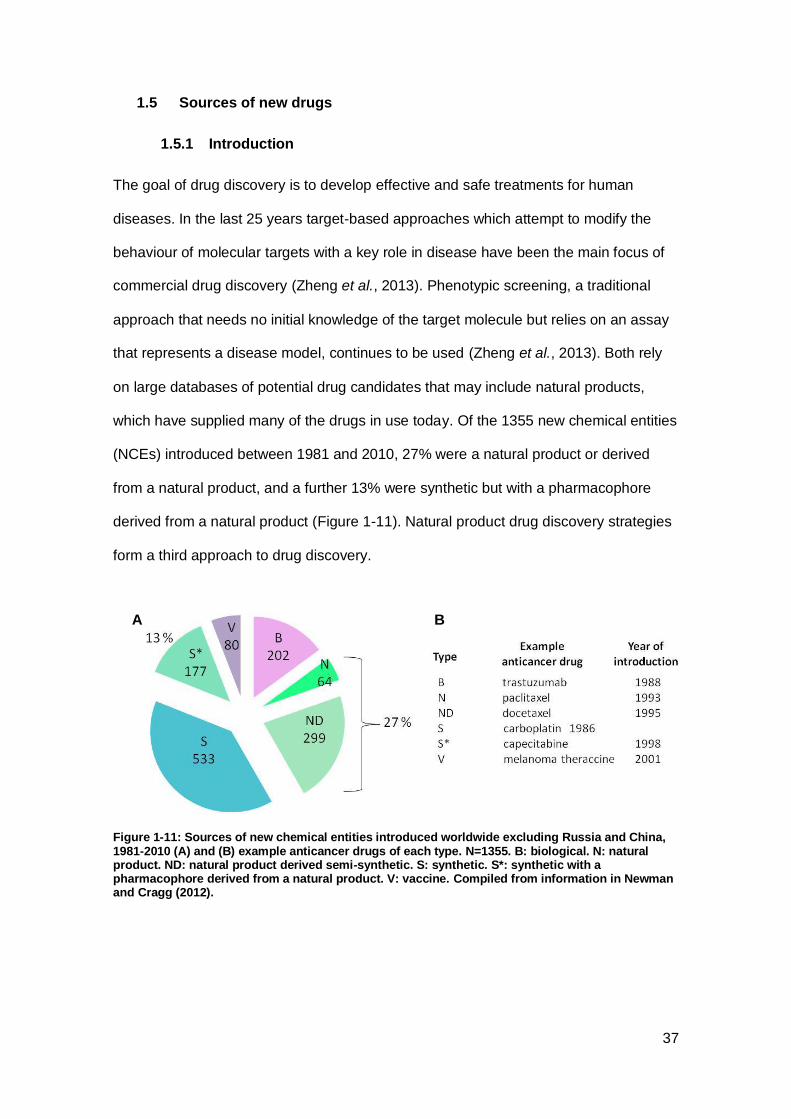
37
1.5 Sources of new drugs
1.5.1 Introduction
The goal of drug discovery is to develop effective and safe treatments for human
diseases. In the last 25 years target-based approaches which attempt to modify the
behaviour of molecular targets with a key role in disease have been the main focus of
commercial drug discovery (Zheng et al., 2013). Phenotypic screening, a traditional
approach that needs no initial knowledge of the target molecule but relies on an assay
that represents a disease model, continues to be used (Zheng et al., 2013). Both rely
on large databases of potential drug candidates that may include natural products,
which have supplied many of the drugs in use today. Of the 1355 new chemical entities
(NCEs) introduced between 1981 and 2010, 27% were a natural product or derived
from a natural product, and a further 13% were synthetic but with a pharmacophore
derived from a natural product (Figure 1-11). Natural product drug discovery strategies
form a third approach to drug discovery.
Figure 1-11: Sources of new chemical entities introduced worldwide excluding Russia and China, 1981-2010 (A) and (B) example anticancer drugs of each type. N=1355. B: biological. N: natural product. ND: natural product derived semi-synthetic. S: synthetic. S*: synthetic with a pharmacophore derived from a natural product. V: vaccine. Compiled from information in Newman and Cragg (2012).
A B

38
1.5.2 Target-based and phenotypic drug discovery
Since early work in the 1950s and 1960s on enzyme kinetics, it has become possible to
identify a molecular target with a key role in disease. The target-based methodology
(Figure 1-12) was adopted as it appeared to offer a more direct and efficient route to
finding effective NCEs. Genome analysis and recombinant DNA technology are two of
the many new methods available to assist development of assays that test whether a
drug interaction with a target will cause a change in the progress of a disease, and
miniaturization and robotic automation have allowed fast high-throughput screens for
activity of a range of compounds on a molecular target using large libraries of
compounds (typically 0.4-2 million) (Zheng et al., 2013). Lead identification can be
assisted with x-ray crystallography, computational modelling and virtual screening
(Swinney and Anthony, 2011). Nonetheless, drug discovery is an expensive process.
The average cost to develop a new drug over 10-12 years is accepted as around $1
billion and recent estimates place it at $2.5 billion when the losses from unsuccessful
drugs are included (Mullin, 2014). The recently elevated cost is attributed to more
complex clinical trials, additional testing to meet requirements for insurance and a
greater focus on difficult-to-treat chronic and degenerative diseases such as
Alzheimer’s, where animal models are not representative and trials require large
numbers of subjects to be followed for a longer time (Mullin, 2014; Cook et al., 2014).
Figure 1-12: Schematic of the conventional approach for drug discovery, either target-based (A) or phenotypic (B). ID: identification. HTS: high-throughput screening. Adapted and redrawn from Zheng et al. (2013); Suvarna (2010).
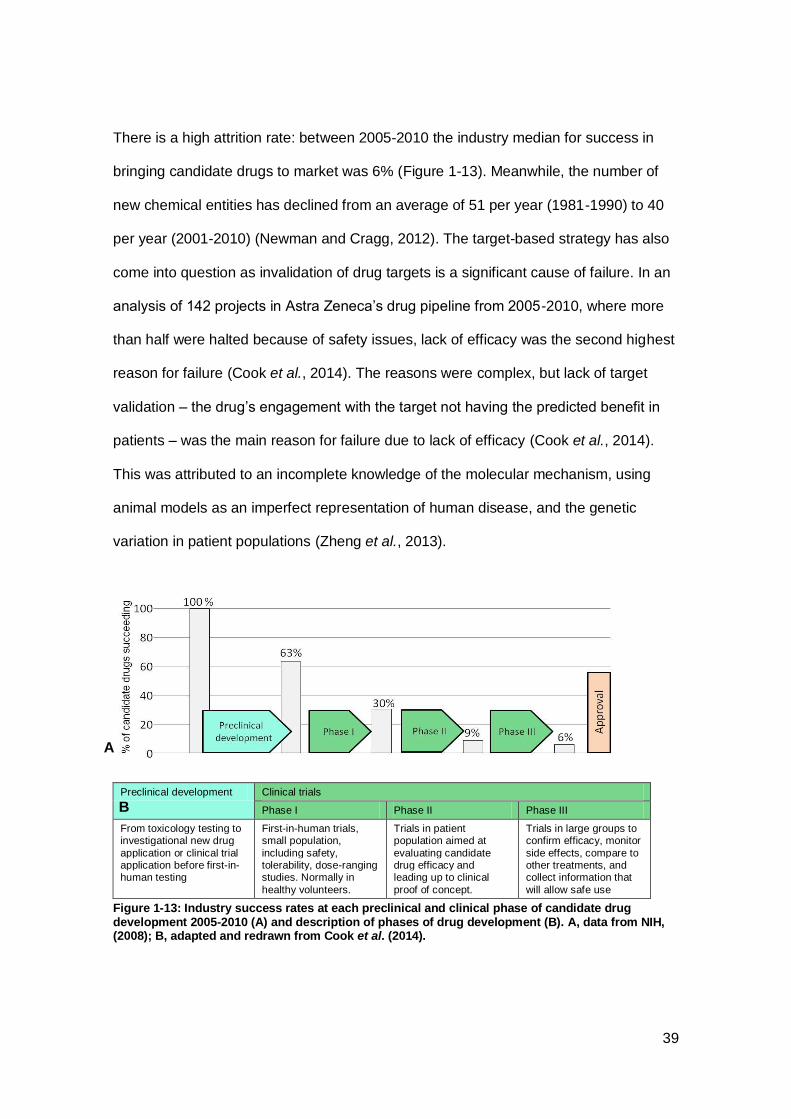
39
There is a high attrition rate: between 2005-2010 the industry median for success in
bringing candidate drugs to market was 6% (Figure 1-13). Meanwhile, the number of
new chemical entities has declined from an average of 51 per year (1981-1990) to 40
per year (2001-2010) (Newman and Cragg, 2012). The target-based strategy has also
come into question as invalidation of drug targets is a significant cause of failure. In an
analysis of 142 projects in Astra Zeneca’s drug pipeline from 2005-2010, where more
than half were halted because of safety issues, lack of efficacy was the second highest
reason for failure (Cook et al., 2014). The reasons were complex, but lack of target
validation – the drug’s engagement with the target not having the predicted benefit in
patients – was the main reason for failure due to lack of efficacy (Cook et al., 2014).
This was attributed to an incomplete knowledge of the molecular mechanism, using
animal models as an imperfect representation of human disease, and the genetic
variation in patient populations (Zheng et al., 2013).
Preclinical development Clinical trials
Phase I Phase II Phase III
From toxicology testing to investigational new drug
application or clinical trial application before first-in-human testing
First-in-human trials, small population,
including safety, tolerability, dose-ranging studies. Normally in
healthy volunteers.
Trials in patient population aimed at
evaluating candidate drug efficacy and leading up to clinical
proof of concept.
Trials in large groups to confirm efficacy, monitor
side effects, compare to other treatments, and collect information that
will allow safe use
Figure 1-13: Industry success rates at each preclinical and clinical phase of candidate drug development 2005-2010 (A) and description of phases of drug development (B). A, data from NIH, (2008); B, adapted and redrawn from Cook et al. (2014).
A
B

40
The impact of this data is that alternative strategies are being sought. Among many
other initiatives, there is an increase in phenotypic drug discovery (Figure 1-12 B).
Phenotypic screening relies on an assay that represents a disease model, usually a
physiologically relevant cell based assay such as a cell viability assay. As in target-
based approaches, large libraries of compounds are screened for activity in the assay.
After a candidate molecule is found, the target must be identified for lead optimization
and structure activity relationship work (Zheng et al., 2013). Among the first-in-class
small molecule drugs approved by the US FDA between 1999-2008, 28 were
discovered in a phenotypic screening approach and 17 in a target-based approach
(Swinney and Anthony, 2011).
1.5.3 Natural product drug discovery
Natural product drug discovery strategies have run in parallel alongside more
commercial target-based and phenotypic drug discovery. The term natural product
includes whole organisms, parts of organisms such as leaves, extracts made from
biological organisms, and pure chemicals isolated from extracts. Strategies for finding
useful natural products may focus on screening a natural product extract for chemicals,
and may quickly isolate and identify components of a natural product extract without
testing for bioactivity or isolating the compounds (Dias et al., 2012). For example, in a
recent study 24 hydroxycinnamates were isolated and identified from the leaf, and 26
compounds from the stem, of the grass Miscanthus × giganteus by liquid
chromatography-mass spectrometry (Parveen et al., 2011). To avoid isolating every
compound, fractions of extracts are also stored in libraries and used in high throughput
screening (Harvey et al., 2015). In some zones of biodiversity, for example Costa Rica,
all species are being documented which will facilitate scientific use including screening
for useful chemicals (INBio, 2014). Alternatively, in a bioassay-led approach to natural
product drug discovery, work concentrates on identification of bioactive components
with potential medicinal benefit from a natural product extract (Sarker and Nahar,
41
2012a). A recent bioassay-led approach to antifungal activity in turmeric and nutmeg
led to the isolation and identification of six potentially useful compounds (Radwan et al.,
2014). Spectroscopy techniques permit identification of novel compounds, and
metabolomics are being used to analyse medicinal products in traditional Chinese
medicine (Luo et al., 2012). The type of organism being studied has widened, for
instance to include more microorganisms and marine organisms, but 48% of drugs
from natural products are derived from plants (Harvey, 2008) (examples of sources in
Table 1-7).
Natural products offer a range of compounds with different chemical characteristics
from synthetics, offering potential advantages: they tend to have more fused and
bridged ring systems, offering some rigidity and binding to widely spaced targets; they
have more chiral centres, more carbon-oxygen bonds, fewer carbon-nitrogen bonds,
fewer aromatic atoms and more scaffold diversity (Drewry and Macarron, 2010). These
factors can introduce more diversity into screening libraries. They often bind with high
affinity to their targets, requiring minimal modification (Driggers et al., 2008). In addition
they tend to be more hydrophilic than synthetic drugs, potentially facilitating uptake into
cells (Ganesan, 2008). One disadvantage is that they can present challenges for
synthetic chemists in synthesis, preventing their inclusion in libraries, but advances in
synthesis techniques are changing this (Drewry and Macarron, 2010). There is a move
towards using smaller libraries based on a class of natural product such as flavonoids
or alkaloids, or based on chemically related scaffolds, and pooling structure data from
different institutions to facilitate virtual screening before obtaining the compound from
the institution that has isolated or synthesised it (Harvey, 2008).
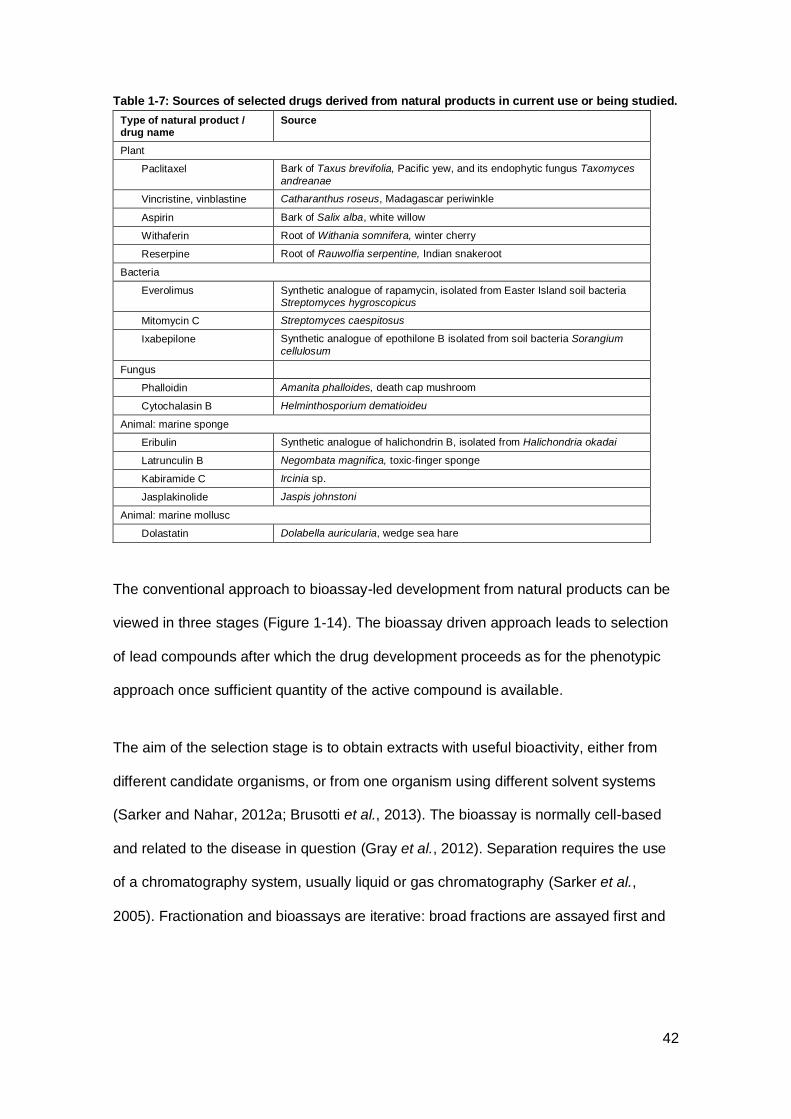
42
Table 1-7: Sources of selected drugs derived from natural products in current use or being studied.
Type of natural product / drug name
Source
Plant
Paclitaxel Bark of Taxus brevifolia, Pacific yew, and its endophytic fungus Taxomyces
andreanae
Vincristine, vinblastine Catharanthus roseus, Madagascar periwinkle
Aspirin Bark of Salix alba, white willow
Withaferin Root of Withania somnifera, winter cherry
Reserpine Root of Rauwolfia serpentine, Indian snakeroot
Bacteria
Everolimus Synthetic analogue of rapamycin, isolated from Easter Island soil bacteria Streptomyces hygroscopicus
Mitomycin C Streptomyces caespitosus
Ixabepilone Synthetic analogue of epothilone B isolated from soil bacteria Sorangium
cellulosum
Fungus
Phalloidin Amanita phalloides, death cap mushroom
Cytochalasin B Helminthosporium dematioideu
Animal: marine sponge
Eribulin Synthetic analogue of halichondrin B, isolated from Halichondria okadai
Latrunculin B Negombata magnifica, toxic-finger sponge
Kabiramide C Ircinia sp.
Jasplakinolide Jaspis johnstoni
Animal: marine mollusc
Dolastatin Dolabella auricularia, wedge sea hare
The conventional approach to bioassay-led development from natural products can be
viewed in three stages (Figure 1-14). The bioassay driven approach leads to selection
of lead compounds after which the drug development proceeds as for the phenotypic
approach once sufficient quantity of the active compound is available.
The aim of the selection stage is to obtain extracts with useful bioactivity, either from
different candidate organisms, or from one organism using different solvent systems
(Sarker and Nahar, 2012a; Brusotti et al., 2013). The bioassay is normally cell-based
and related to the disease in question (Gray et al., 2012). Separation requires the use
of a chromatography system, usually liquid or gas chromatography (Sarker et al.,
2005). Fractionation and bioassays are iterative: broad fractions are assayed first and
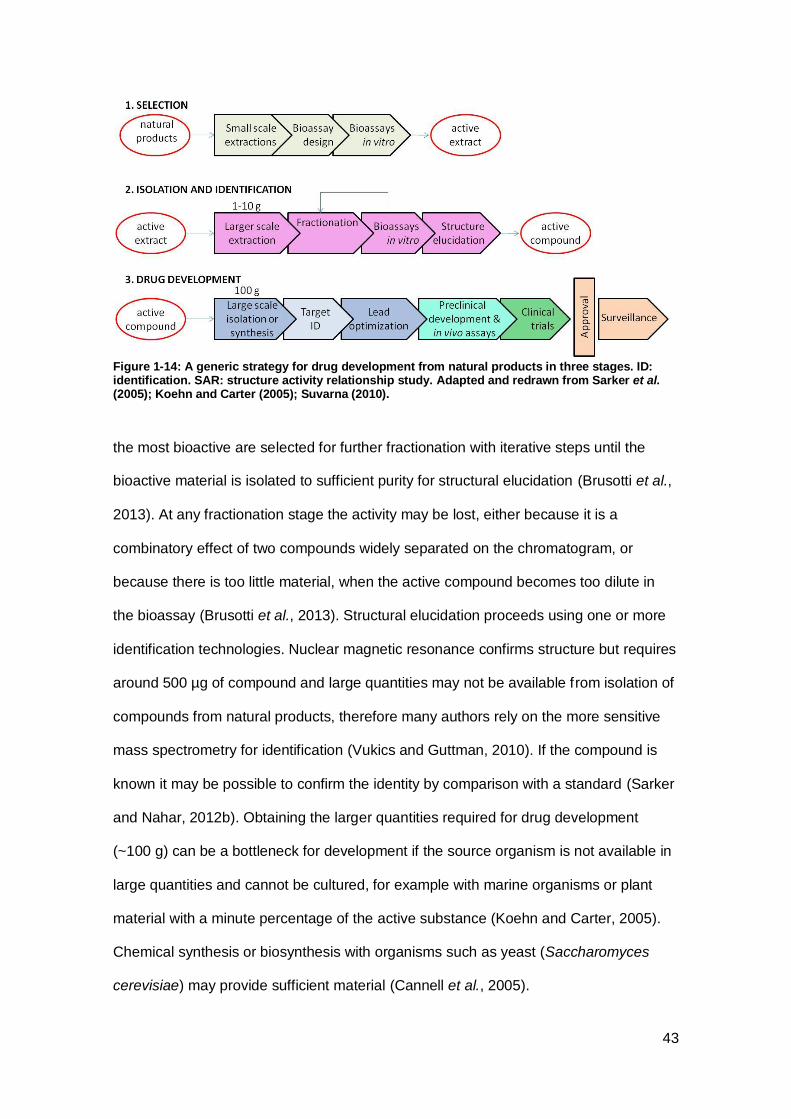
43
Figure 1-14: A generic strategy for drug development from natural products in three stages. ID: identification. SAR: structure activity relationship study. Adapted and redrawn from Sarker et al. (2005); Koehn and Carter (2005); Suvarna (2010).
the most bioactive are selected for further fractionation with iterative steps until the
bioactive material is isolated to sufficient purity for structural elucidation (Brusotti et al.,
2013). At any fractionation stage the activity may be lost, either because it is a
combinatory effect of two compounds widely separated on the chromatogram, or
because there is too little material, when the active compound becomes too dilute in
the bioassay (Brusotti et al., 2013). Structural elucidation proceeds using one or more
identification technologies. Nuclear magnetic resonance confirms structure but requires
around 500 µg of compound and large quantities may not be available from isolation of
compounds from natural products, therefore many authors rely on the more sensitive
mass spectrometry for identification (Vukics and Guttman, 2010). If the compound is
known it may be possible to confirm the identity by comparison with a standard (Sarker
and Nahar, 2012b). Obtaining the larger quantities required for drug development
(~100 g) can be a bottleneck for development if the source organism is not available in
large quantities and cannot be cultured, for example with marine organisms or plant
material with a minute percentage of the active substance (Koehn and Carter, 2005).
Chemical synthesis or biosynthesis with organisms such as yeast (Saccharomyces
cerevisiae) may provide sufficient material (Cannell et al., 2005).

44
There is an enormous variety of chemical entities in natural product extracts, with each
plant extract containing potentially 700 different chemicals of which many are non-
essential secondary metabolites that enable a plant to influence its environment and
compete for survival (Gray et al., 2012; Field et al., 2006). It has been estimated that
the higher plants collectively synthesise 100,000 secondary metabolites (The
Arabidopsis Genome Initiative, 2000), but with only around 10% of the higher plants
having been screened for bioactivity (Gransalke, 2011), there is a need to conserve
ecosystems as resources. The United Nations Convention on Biological Diversity
(United Nations, 1992) came into force in 1993. Recognising that natural resources
must be used by humans, two of its goals were conservation of biological diversity and
sustainable use of its components (United Nations, 1992). 25 biodiversity hotspots
representing 1.4% of the world land surface have been identified as conservation
priorities based on the species of plants they contain and the degree of threat (Myers et
al., 2000). Each hotspot contains at least 0.5% or 1,500 of the world's 300,000 vascular
plant species as endemic and has lost at least 70% of its primary vegetation (Myers et
al., 2000). Plants were chosen as a measure of biodiversity because of the available
data and the dependence of other species on plants, for instance as predator,
pollinator or symbiont (Myers et al., 2000). Paradoxically, the obligations that the
Convention imposes to reach its third goal, fair and equitable sharing of the benefits
arising from natural resources (United Nations, 1992), have been quoted as a reason
that pharmaceutical companies have moved away from natural products (Koehn and
Carter, 2005; Kirsop, 1996; United Nations, 1992). Nonetheless, pharmacognosy
based investigations where local medicinal products, usually from plants, are surveyed,
continue to be a rich source of starting material for natural product drug discovery
(Sarker and Nahar, 2012a). For example, the antiviral drug prostatin, which derives
from the bark of the mamala tree, was discovered in a Samoan therapy for hepatitis
(Wender et al., 2008).
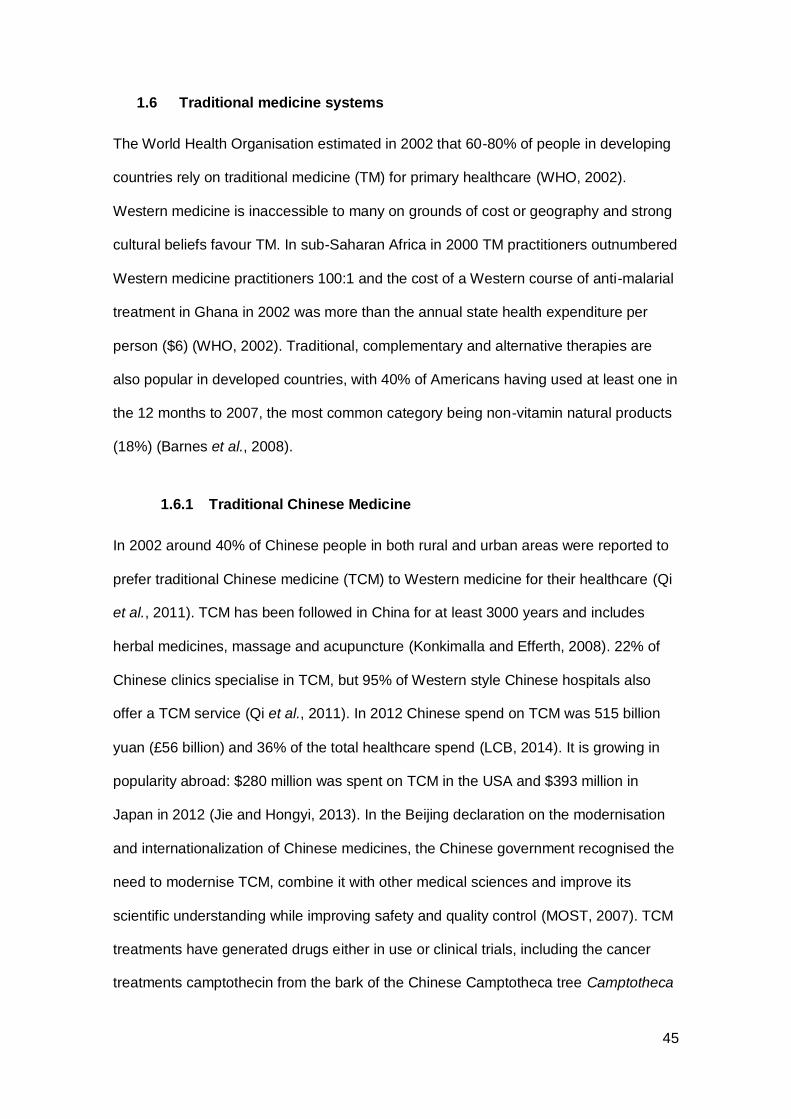
45
1.6 Traditional medicine systems
The World Health Organisation estimated in 2002 that 60-80% of people in developing
countries rely on traditional medicine (TM) for primary healthcare (WHO, 2002).
Western medicine is inaccessible to many on grounds of cost or geography and strong
cultural beliefs favour TM. In sub-Saharan Africa in 2000 TM practitioners outnumbered
Western medicine practitioners 100:1 and the cost of a Western course of anti-malarial
treatment in Ghana in 2002 was more than the annual state health expenditure per
person ($6) (WHO, 2002). Traditional, complementary and alternative therapies are
also popular in developed countries, with 40% of Americans having used at least one in
the 12 months to 2007, the most common category being non-vitamin natural products
(18%) (Barnes et al., 2008).
1.6.1 Traditional Chinese Medicine
In 2002 around 40% of Chinese people in both rural and urban areas were reported to
prefer traditional Chinese medicine (TCM) to Western medicine for their healthcare (Qi
et al., 2011). TCM has been followed in China for at least 3000 years and includes
herbal medicines, massage and acupuncture (Konkimalla and Efferth, 2008). 22% of
Chinese clinics specialise in TCM, but 95% of Western style Chinese hospitals also
offer a TCM service (Qi et al., 2011). In 2012 Chinese spend on TCM was 515 billion
yuan (£56 billion) and 36% of the total healthcare spend (LCB, 2014). It is growing in
popularity abroad: $280 million was spent on TCM in the USA and $393 million in
Japan in 2012 (Jie and Hongyi, 2013). In the Beijing declaration on the modernisation
and internationalization of Chinese medicines, the Chinese government recognised the
need to modernise TCM, combine it with other medical sciences and improve its
scientific understanding while improving safety and quality control (MOST, 2007). TCM
treatments have generated drugs either in use or clinical trials, including the cancer
treatments camptothecin from the bark of the Chinese Camptotheca tree Camptotheca

46
acuminata and its analogue topotecan (Patwardhan et al., 2005), and indirubin from a
herbal mixture used for leukaemia (Hoessel et al., 1999). The antimalarial artemisinin
was discovered in 1971 in the bark of the wormwood tree in a study of 2000 TCM
antimalarial remedies (Miller and Su, 2011).
TCM products are prescribed for cancer patients either alone or alongside Western
treatments (Hsiao and Liu, 2010). Many TCM herbal extracts have cytotoxic effects on
cancer cells in vitro (Hsiao and Liu, 2010). Although many studies have taken place,
there is little research on the effectiveness of TCM compared to Western medicine in
randomised clinical trials (Hsiao and Liu, 2010). A study of 115 trials of TCM products
for pain relief in cancer showed that TCM may provide pain relief as effectively as
Western analgesics, with few adverse side-effects, but most of the studies were
described as having methodological flaws (Xu et al., 2007). As many Chinese
treatments are mixtures of 4-14 different natural products (example in Table 1-8) and
the activity is attributed to synergistic effects, the active chemicals in Chinese formulae
are being researched with a systems biology approach (Luo et al., 2012). In the
process, a chemical fingerprint can be established for quality control (Zhang et al.,
2004).
Table 1-8: Components of the traditional Chinese medicine Qingkailing injection, used widely in China after stroke and cerebral edema to reduce brain damage
1.
Component Traditional source Modern alternative
Niuhuang Bovis calculus, gallstones of cattle Taurocholic acid and hyodesoxycholic acid, extracted from bovine bile
2
Jinyinhua Lonicera Japonicae Flos, flowers of
Japanese honeysuckle 3
Zhizi Gardenia fructus, fruit of Gardenia
jasminnoides, gardenia 3
Banlangen root of Coptis chinensis, goldthread
flower
Isatidis radix, root of Isatis tinctoria,
woad 3
Shuiniujao, hydrolyzed rhinoceros horn Bubali Cornu, buffalo horn 3
Zhenzhumu, hydrolysed Margaritifera usta, shell of shellfish including Pteria martensii
3
Huangqin Scutellariae radix, root of skullcap flower
3
1 Data extracted from Luo et al. (2012).
2 NZP (2011).
3 TCM Wiki,( 2012).

47
1.6.2 Indian traditional medicine
In India around 80% of the population relies on traditional medicine (TM) for healthcare,
either exclusively or in combination with Western medicine, and for 65% TM is the only
available option (Dargan et al., 2008; WHO, 2002). Indian TM systems comprise
Ayurveda, Yoga & Naturopathy, Unani, Siddha and Homeopathy, administered by 1.5
million practitioners, with Ayurveda most widely used (WHO, 2007; Mukherjee and
Wahile, 2006). There is a belief that natural therapies are safer than Western medicine,
although cases of toxicity and adulteration occur, with the result that the Indian
Government in 2002 launched a National Policy on Indian Systems of Medicine &
Homeopathy to improve safety and efficacy and to promote research (Dargan et al.,
2008; WHO, 2007). Ayurveda has been practiced since 5000 BCE and its main texts
date from the 6th century BCE (Mukherjee and Wahile, 2006). Today, over 25,000
herbal medicinal preparations are used but only 6% of species used in medicines have
been investigated scientifically (Mukherjee and Wahile, 2006). 600 Indian medicinal
plant species are found in Assam province in North-East India (Borthakur, 2012) which
forms part of the Indo-Burma biodiversity hotspot (Myers et al., 2000).
A number of Indian institutes are actively engaged in characterising Indian herbal
medicines and identifying the bioactive agents (Patwardhan et al., 2005). The
successful antipsychotic and antihypertensive drug reserpine originated from an
Ayurvedic remedy for insanity, fever and snakebite, extracted from root of Rauwolfia
serpentina (Indian snakeroot) (Plummer et al., 1954). Artrex is a combination of four
Ayurvedic medicines, extracts of Withania somnifera (winter cherry), Boswellia serrata
(Indian frankincense), Zingiber officinale (ginger) and Curcuma longa (turmeric), has
undergone clinical trials in India for the treatment of arthritis and is now sold in the USA
as a food supplement although not licensed as a drug (Chopra et al., 2004;
Patwardhan et al., 2005). Many compounds from Indian TM are being researched, for
instance withaferin from Withania somnifera may have anti-angiogenesis effects in
48
breast cancer (Thaiparambil et al., 2011) and andrographolide, found in Andrographis
paniculata (Nees), a TM treatment for infectious disease, may be cytotoxic to breast
and colon cancer cells and anti-asthmatic (Jada et al., 2008).
1.7 Aims and objectives of this study
The subject of this thesis is the cytotoxic or cytostatic effects of three plant extracts
chosen through collaboration with Gauhati University, Guwahati, Assam Province,
India: root of Clitoria ternatea, seed of Mucuna pruriens and rhizome of Cheilocostus
speciosus (Figure 1-15).
1.7.1 Clitoria ternatea
Clitoria ternatea (Butterfly pea, Aparajita) is a fast-growing climbing legume in the
Fabaceae family, native to Indonesia but naturalised in India, Asia, Africa, America,
China and Australia. It is used for cover in Africa, ornamentally in USA (Morris, 2009)
and as a forage crop in Brazil (Abreu et al., 2014) and the edible flowers make a blue
coloured drink in Thailand (Suwan, personal communication). All parts of the plant are
used in Ayurvedic medicine. When treating female infertility the root is ground and
mixed with goat’s milk and drunk for 21 days (Kalita, 2012). Extracts of the root, called
Shankapushpi, are also used to avert abortion; as a laxative; for indigestion, ascites,
constipation, fever, arthritis, eye and ear ailments, sore throat, skin diseases,
bronchitis, snakebite, rheumatism; for epilepsy and insanity; and the bitter fresh root is
given to children with honey and ghee as a general tonic and to improve mental
faculties, muscular strength and complexion (Mukherjee et al., 2008). Its use in
Ayurvedic cancer treatment appears to be restricted to a decoction of leaves of Clitoria
and two other herbs administered for purification after surgery to remove a major or
benign tumour, defined differently from Western medicine (Balachandran and
Govindarajan, 2005).

49
Figure 1-15: Flowers of (A) Clitoria ternatea, (B) Mucuna pruriens, (C) Cheilocostus speciosus. Images from (A) tropicalforages (2015); (B) JungleSeeds (2015); Kinsey (2105).
Non-root parts of the plant show cytotoxic activity in studies. The leaf extract is
cytotoxic to brine shrimp (Das and Chatterjee, 2013; Rahman et al., 2006) and cervical
cancer and Dalton’s lymphoma cells (Ramaswamy et al., 2011), the aerial parts to
cervical cancer cells (Sarumathy et al., 2011) and the flower extract to Dalton’s
Lymphoma ascites cells (Kumar and Bhat, 2011), ovarian cancer cells and breast
cancer cells (Neda et al., 2013). Much of the research on the root extract concerns
effects on brain and memory. Aqueous, methanolic and ethanolic root extracts have
been shown in rats to reduce memory impairment (Taranalli and Cheeramkuzhy, 2000)
and enhance dendritic branching in amygdala neurons (Rai et al., 2005), to be
antipyretic, anti-inflammatory (Parimala Devi et al., 2003) and analgesic (Kamilla et al.,
2014) and to reduce immune response to a challenge (Taur and Patil, 2011). However,
root extracts contain compounds that when tested alone are cytotoxic or growth-
inhibitory (Table 1-9). Other compounds found in Clitoria are identified in Appendix A.
A B C
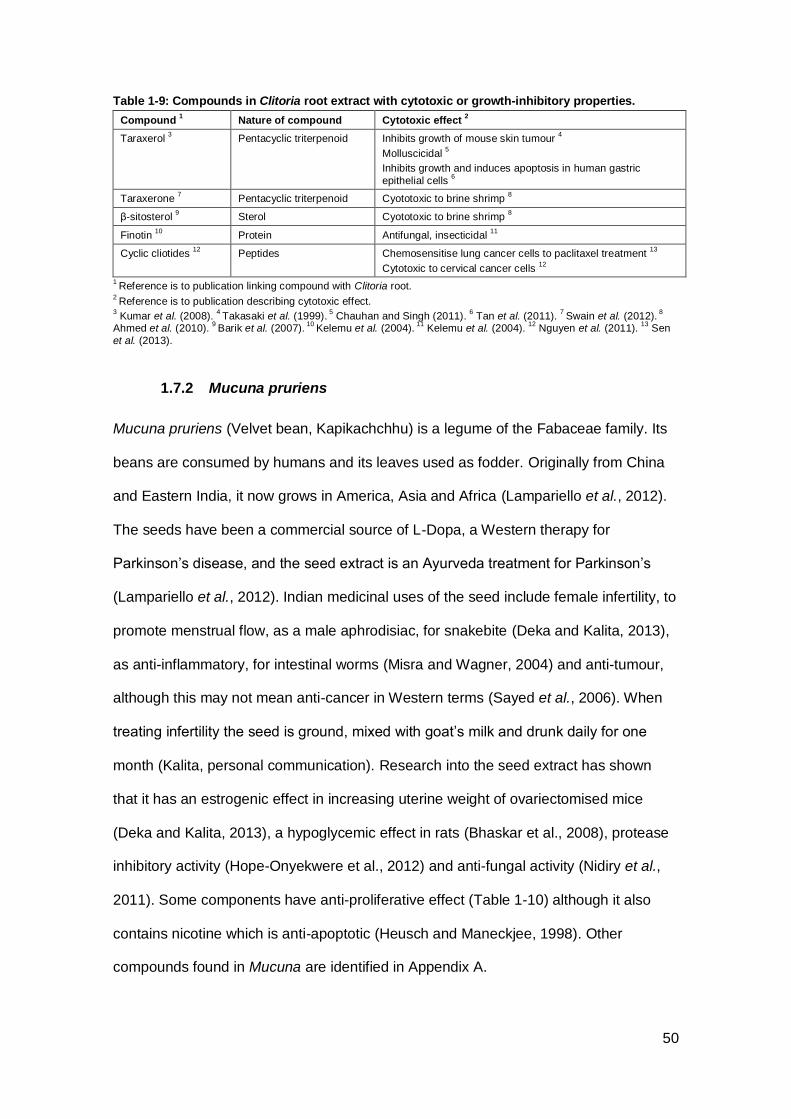
50
Table 1-9: Compounds in Clitoria root extract with cytotoxic or growth-inhibitory properties.
Compound 1
Nature of compound Cytotoxic effect 2
Taraxerol 3
Pentacyclic triterpenoid Inhibits growth of mouse skin tumour 4
Molluscicidal 5
Inhibits growth and induces apoptosis in human gastric
epithelial cells 6
Taraxerone 7
Pentacyclic triterpenoid Cyototoxic to brine shrimp 8
β-sitosterol 9
Sterol Cyototoxic to brine shrimp 8
Finotin 10
Protein Antifungal, insecticidal 11
Cyclic cliotides 12
Peptides Chemosensitise lung cancer cells to paclitaxel treatment 13
Cytotoxic to cervical cancer cells 12
1 Reference is to publication linking compound with Clitoria root.
2 Reference is to publication describing cytotoxic effect.
3 Kumar et al. (2008).
4 Takasaki et al. (1999).
5 Chauhan and Singh (2011).
6 Tan et al. (2011).
7 Swain et al. (2012).
8
Ahmed et al. (2010). 9 Barik et al. (2007).
10 Kelemu et al. (2004).
11 Kelemu et al. (2004).
12 Nguyen et al. (2011).
13 Sen
et al. (2013).
1.7.2 Mucuna pruriens
Mucuna pruriens (Velvet bean, Kapikachchhu) is a legume of the Fabaceae family. Its
beans are consumed by humans and its leaves used as fodder. Originally from China
and Eastern India, it now grows in America, Asia and Africa (Lampariello et al., 2012).
The seeds have been a commercial source of L-Dopa, a Western therapy for
Parkinson’s disease, and the seed extract is an Ayurveda treatment for Parkinson’s
(Lampariello et al., 2012). Indian medicinal uses of the seed include female infertility, to
promote menstrual flow, as a male aphrodisiac, for snakebite (Deka and Kalita, 2013),
as anti-inflammatory, for intestinal worms (Misra and Wagner, 2004) and anti-tumour,
although this may not mean anti-cancer in Western terms (Sayed et al., 2006). When
treating infertility the seed is ground, mixed with goat’s milk and drunk daily for one
month (Kalita, personal communication). Research into the seed extract has shown
that it has an estrogenic effect in increasing uterine weight of ovariectomised mice
(Deka and Kalita, 2013), a hypoglycemic effect in rats (Bhaskar et al., 2008), protease
inhibitory activity (Hope-Onyekwere et al., 2012) and anti-fungal activity (Nidiry et al.,
2011). Some components have anti-proliferative effect (Table 1-10) although it also
contains nicotine which is anti-apoptotic (Heusch and Maneckjee, 1998). Other
compounds found in Mucuna are identified in Appendix A.

51
Table 1-10: Compounds in Mucuna seed extract with growth-inhibitory properties.
Compound 1
Nature of compound Cytotoxic effect2
L-Dopa 3
Monoamine Inhibits growth in melanoma cell lines 4
Tryptamine 5
Amino acid Inhibits growth of cervical cancer cells 6
1 Reference is to publication linking compound with Mucuna seed.
2 Reference is to publication describing cytotoxic effect.
3 Brain (1976).
4 Paley (1999).
5 Misra and Wagner (2007).
6 Kable et al. (1989).
1.7.3 Cheilocostus speciosus
Cheilocostus speciosus (Crape ginger, Kebu), formerly Costus speciosus, is an
ornamental ginger native to South East Asia and now growing in India and Australia. Its
rhizome is an Indian commercial source for diosgenin, a steroid used in the
manufacture of contraceptives (Pandey et al., 2011). When pressed to extract juice, or
dried and ground, the rhizome is used for female infertility and for diabetes, as
aphrodisiac and as diuretic (Najma et al., 2012), for intestinal worms, leprosy, skin
diseases, asthma, bronchitis and to reduce fever (Joy et al., 1998). A rhizome extract
has been investigated for stimulating rat uterine contractions (Lijuan et al., 2011).
Although several components of the rhizome extract have cytotoxic or growth-inhibitory
effect (Table 1-11), most research interest is focussed on the anticancer activity and
suppression of cholesterol absorption seen with diosgenin (Cayen and Dvornik, 1979).
Other compounds found in Cheilocostus are identified in Appendix A.
Table 1-11: Compounds in Cheilocostus rhizome extract with cytotoxic or growth-inhibitory properties.
Compound1
Nature of compound Cytotoxic effect2
Disogenin 3
Steroidal saponin Inhibits growth and induces apoptosis in many types of cancer
cell 4
Costunolide 5
Sesquiterpene lactone Decreases attachment in breast cancer cells 6
Gracillin 7
Steroidal saponin Cytotoxic on some cancer cell lines 8
Protogracillin 9
Steroidal saponin Cytotoxic on some cancer cell lines 8
β-amyrin 10
Pentacyclic triterpene Antimicrobial and weakly cytotoxic on bladder cancer cells 11
Lupeol 10
Pentacyclic triterpene Inhibits growth in skin cancer and prostate cancer cells 12
1 Reference is to publication linking compound with Cheilocostus rhizome.
2 Reference is to publication describing cytotoxic effect.
3 Dasgupta and Pandey (1970).
4 Shishodia and Aggarwal (2005).
5 Duraipandiyan et al. (2012).
6 Whipple et al. (2013).
7 Joy et al. (1998).
8 Hu and Yao (2003).
9 Inoue and Ebizuka (1996).
10 Bhuyan and Zaman (2008).
11 Vásquez et al.
(2012). 12
Saleem (2009).
52
1.7.4 Specific aims
The aims of the project are:
(1) Confirm cytotoxic or cytostatic effects of Clitoria, Mucuna and Cheilocostus
and select one for further study.
(2) Characterise cytotoxic or cytostatic effects.
(3) Elucidate biological mechanism.
(4) Isolate bioactive agents for further investigation.
(5) Identify the bioactive agents.
1.7.5 Objectives
The objectives have been chosen to meet the aims of the project:
(1) Using cell-based assays, quantify the cytotoxic or cytostatic effects on cancer
cells. Use this data as a basis for selecting the most interesting extract for
further study.
(2) Establish with cell-based assays whether effects (i) are cytotoxic (ii) are dose-
dependent (iii) are time-dependent (iv) are cell type specific.
(3) Observe treated cells with live cell imaging and use immunohistochemistry to
gain information on the mechanism.
(4) Using High Performance Liquid Chromatography (HPLC) in a bioassay-driven
approach, fractionate the extract and test fractions with cell-based assays to
isolate the smallest bioactive fractions possible.
(5) Using structural elucidation methods, identify the chemical formula of the
bioactive agent(s) in the bioactive fractions.
53
1.7.6 How this thesis is organised
Chapter 1: Introduction
Contains background for understanding breast cancer and current treatments
for breast cancer, the cytoskeleton, drug discovery from natural products and
the aims and objectives of this study.
Chapter 2: Materials and methods
Contains materials and methods that apply to the whole thesis.
Chapter 3: Cytotoxicity in Clitoria root extract
Contains results of cell-based assays used to confirm the cytotoxic and
cytostatic effects of Clitoria, Mucuna and Cheilocostus and further
characterisation of the cytotoxic effects of Clitoria.
Chapter 4: High Performance Liquid Chromatography fractionation of extracts
Contains method development for fractionation of Clitoria, Mucuna and
Cheilocostus, results of bioassay-driven fractionation of Clitoria from preparative
HPLC and initial fractionation of Cheilocostus with analytical HPLC.
Chapter 5: Mechanism of action
Contains results of live cell imaging and fluorescence microscopy investigations
into the mechanism of the cytotoxic effect of Clitoria.
Chapter 6: Alternative sources of Clitoria
Contains results of analysis of Clitoria extracts from plant material sourced in
Indonesia and UK, using HPLC and cell-based assays.

54
Chapter 7: Identification of bioactive agents in Clitoria root extract
Contains structural elucidation of the bioactive agents in bioactive fractions of
Clitoria.
Chapter 8: Discussion
Contains a discussion of the impact of the results in this thesis in the context of
the literature, and a conclusion.

55
Chapter 2 Materials and methods
2.1 Preparation of plant extracts
2.1.1 Sources of plant material
The first plant extracts for this project originated from plants grown in India. Roots of
Clitoria ternatea, blue flowered form, and matured seeds of Mucuna pruriens were
collected from gardens and forest respectively in Guwahati, Assam, India and
authenticated in the Department of Botany, Gauhati University, Assam. Cheilocostus
speciosus rhizome was obtained and authenticated in Assam. None of the species are
listed as at risk on the UN Convention on International Trade in Endangered Species of
Wild Fauna and Flora list or the International Union for Conservation of Nature Red List
of endangered species (CITES, 2000; IUCN, 2014). Indian export restrictions allow the
export of medicinal extracts “in unrecognizable and physically inseparable form”
(Embassy of India, Beijing, 1992).
Further supplies of Clitoria extract were requested from India, but could not be supplied
within the timescale of this study, therefore alternative sources were investigated.
Fresh Clitoria root was obtained in Jakarta, Indonesia, by Sri Murhandini, Research
Center for Drug and Food, The National Agency of Drug and Food Control of the
Republic of Indonesia, Jakarta, and authenticated by Dr Joeni Setijo Rahajoe,
Indonesian Institute of Sciences, Jakarta. Clitoria seeds (Thompson & Morgan) were
germinated in 9 inch pots in May 2013 in a greenhouse in Marlow, UK by Geoff
Swinburn. The plants were transferred to 18 inch pots and moved in June to a
sheltered outdoor area. When the leaves died in October 2013, the plants were lifted
and the roots were washed in water and dried in a greenhouse. The plants were not
formally authenticated, but from photographic evidence they resemble Indian Clitoria.
56
2.1.2 Preparation of extracts
The Indian plant extracts were prepared in the laboratory of Professor Jogen Chandra
Kalita, Department of Zoology, Gauhati University, India. Clitoria root, Mucuna seed
and Cheilocostus rhizome were washed immediately after collection in tapwater and
scrubbed with hands. Lesions and dead tissue were removed from root and rhizome
with a knife. The plant material was left to dry overnight in the laboratory in the shade
at 25-35°C, then root and rhizome were cut with knife and scissors into 0.5 cm pieces
to aid drying. The material was left to dry further over four days without sun exposure in
the laboratory, then was ground in a mechanical grinder and 20 g was extracted with
200 mL Analar grade methanol (Fisher Scientific) for 18 hours in a Soxhlet extractor at
reflux (64°C) and dried in a Büchi R-205 rotary evaporator at 60°C. In November 2012
the initial Clitoria root extract (CE) was exhausted and a second vial supplied from
Assam, CE(B), was used in subsequent experiments.
Indonesian Clitoria root was washed and dried before shipping to the UK. UK Clitoria
root was washed with water and dried immediately after harvesting. On arrival at
Brunel, Indonesian and UK root was washed in ethanol (Fisher Scientific), dried and
ground in a coffee grinder to a coarse powder and extracted in 200 mL methanol
(Fisher Scientific) (Table 2-1). Indonesian and UK extracts and the material was
weighed, resuspended in ethanol (Table 2-2) and filtered. Yields were calculated for
Indian, Indonesian and UK extracts (Table 2-2).

57
Table 2-1: Extractions of Clitoria performed at Brunel.
Origin Extract Extraction apparatus
Weight of dry root (g)
Extraction temperature
(°C)
Drying down method /
temperature (°C)
Resulting material
Jakarta CE(E) Soxhlet flask in
water bath.
10 50 RE1 / 25, then CC
2 /
60
Brown oil.
CE(F) Soxhlet flask in water bath.
9.6 60-70 RE1
/ 25, then CC2
/ 60
CE(G) Soxhlet at
reflux.
8.07 64 CC2
/ 60
CE(H) Beaker on stirrer.
7.95 20-25 CC2
/ 45
Brown solid.
CE(J) Soxhlet flask in
water bath.
7.99 50 CC2
/ 45
Brown oil.
Marlow CE(UK) Beaker on stirrer.
7 20 RE1
/ 25, then CC2
/ 60
Golden brown oil.
1 Büchi R-205 rotary evaporator.
2 Eppendorf centrifugal concentrator 5301.
Table 2-2: Yields and resuspensions from extractions of plant material.
Extract Amount
recovered (g)
Yield (%) Ethanol
resuspension quantity (mL)
Final concentration
(mg/mL)
Extractions performed in India
Clitoria root CE 1 0.87 4.3 4.83 180
Clitoria root CE(B) 2
0.45 2.3 5 90
Mucuna seed
2.0276 10.1 11.26 180
Cheilocostus rhizome
0.45 2.3 5 90
Clitoria root extractions performed at Brunel 3
CE(E) 0.96 9.6 5 192
CE(F) 1.98 19.8 5 396
CE(G) 1.31 16.2 5 262
CE(H) 0.42 5.3 3 140
CE(J) 0.69 8.6 3 230
CE(UK) 0.87 12.4 3 290
1 Clitoria 1
st vial.
2 Clitoria 2
nd vial.
3 See Table 2-1.
2.2 Tissue culture
2.2.1 Cell lines
Breast cancer epithelial cells, normal breast epithelial cells, normal fibroblasts and
primary breast epithelial cells were obtained for this study (Table 2-3).

58
Table 2-3: Sources of cell lines.
Cell line Origin Reference Gift from
MCF-7 Breast cancer epithelial cells from pleural effusion.
Soule et al. (1973). A. Harvey (Brunel).
MDA-MBA-231 Breast cancer epithelial cells from pleural
effusion.
Cailleau et al. (1974).
MCF-10A Breast epithelial cells from fibrocystic
disease.
Cailleau et al. (1974).
2DD Normal dermal fibroblasts from juvenile
foreskin.
Bridger et al. (1993). C. Eskiw (Brunel).
HMEC 240L Primary human mammary epithelial cell
derived from reduction mammoplasty in a 21-year old patient.
Hammond et al. (1984);
Romanov et al. (2001). H.Yasaei (Brunel).
HMEC 184D/hT1
Primary human mammary epithelial cell
derived from reduction mammoplasty in a 16-year old patient. Immortalised with hTERT plasmid at Brunel.
Stampfer et al. (2001).
2DD normal fibroblasts in culture gradually cease active growth, until around passage
33 only ~5% are regularly dividing (Eskiw, Personal communication). When received at
passage 10, approximately 75% of cells had proliferative ability and they were assayed
at passages 14-26 as noted in all results. 240L human mammary epithelial cells
(HMECs), commonly used as normal primaries, cease active growth around passage
14-25 and were assayed at passage 12.
2.2.2 Cell maintenance
Cell culture work was performed in aseptic conditions in a tissue culture hood. Cells
were maintained at 37°C and 5% CO2. All cells except HMECs were maintained in
DMEM/F12 (Life Technologies (LT)) with 10% fetal bovine serum (FBS) (Invitrogen)
and 1% Glutamax (LT). 5-10 ng/mL epidermal growth factor (EGF) (LT), 5 µg/mL
insulin (LT) and 1 µg/mL hydrocortisone (Sigma) were added to medium for MCF-10A.
Cells were maintained without antibiotics until May 2013 and thereafter with penicillin-
streptomycin (LT). Cells were grown in 100 mm Cell+ cell culture dishes (Sarstedt).
HMECs were maintained in a 50:50 mixture of DMEM/F12 (LT) and Mammary
Epithelial Cell Growth Medium (Lonza). Supplements added were 1% glutamine (LT),
35 μg/mL bovine pituitary extract (LT), 7.5 μg/mL insulin (LT), 5 x 10⁻⁵ M isoproterenol
59
(LT), 0.1 μg/mL hydrocortisone (LT), 2.5 μg/mL apotransferrin (LT), 0.1 nM oxytocin
(LT), 0.5 ng/mL cholera toxin (LT), 5 ng/mL EGF, 5 x 10⁻¹⁰ M β-estradiol (LT), 5 x 10⁻⁹
M tri-iodothryonine (LT), 0.1% albumax (LT).
2.2.3 Passaging
MCF-7 and MDA-MB-231 cells were passaged at or before confluence. Cells were
washed in Versene buffer (0.02% ethylenediaminetetraacetic acid chelating agent
(Fisher) in phosphate buffered saline (PBS) (Sigma), dissociated from the dish surface
within 2-8 min in 2 mL of pre-warmed TrypLE Express (Invitrogen) dissociation reagent
at 37°C and transferred to a 50 mL tube. The dish was washed with 3 mL of Versene
which was added to the tube. An amount of the suspension appropriate for the required
split ratio was transferred to another 50 mL tube. Medium was added to the tube to
make up to 15 mL for each culture dish and the mixture was poured into a new culture
dish.
2DD cells were passaged twice per week and plated out at 3,000 cells/cm2. Cells were
washed and dissociated as described above. Cells were counted following the cell
counting protocol. An amount of the suspension appropriate for the required number of
cells was transferred to a 50 mL tube, medium was added to the tube to make up to 15
mL for each culture dish and the mixture was poured into a new culture dish.
HMECs were passaged when 60-70% confluent. Cells were dissociated in 0.05%
trypsin in saline base (LT) for 3-5 minutes. The dish was washed in PBS which was
added to the cell suspension. After spinning down at 1000 r.p.m. for 2 min, the pellet
was resuspended in medium. 20 µL of the suspension was mixed in an Eppendorf tube
with 20 µL of 0.4% Trypan blue (LT). 20 µL of the mixture was pipetted into a Countess
cell counting chamber (LT). The cells were counted in a Countess cell counter (LT).
The number of cells required was calculated for a density in flasks of 2500 cells cm-2,

60
the correct amount of cell suspension was transferred to a new 50 mL tube and
medium was added to make 15 mL of cell suspension per 100 mm culture dish. This
was poured into new culture dishes.
2.2.4 Cell storage, freezing and recovery
Cell stocks were stored in a liquid nitrogen freezer. For freezing, cells were washed
and dissociated as described in Section 2.2.3 and spun down at 1500 r.p.m. for 5 min.
The supernatant was aspirated, the pellet was resuspended in freezing medium
consisting of 10% dimethyl sulfoxide (DMSO) (Sigma) in FBS and the cell suspension
was placed in cryovials, each containing 5 x 10⁵ cells. Cells were frozen in a controlled
rate freezing container before moving to liquid nitrogen. To recover frozen cells, the
cryovial was warmed in a water bath at 37°C, before cells were transferred into
warmed medium and the cell suspension placed in a culture dish. The following day,
medium was aspirated to remove residual freezing medium, cells were washed with
Versene and fresh medium was added to the dish.
2.2.5 Cell counting
MDA-MB-231, MCF-7 and 2DD cells were washed and dissociated as described in
Section 2.2.3 and spun down for 5 min at 1500 r.p.m. The supernatant was aspirated
and the pellet was resuspended in a known amount of Versene or medium. 20 µL of
the cell suspension was pipetted into a hemocytometer chamber. Cells in five of the
hemocytometer regions were counted under a microscope. This figure was divided by
100 to give the cell number as a multiple of 105 cells mL-1. The required amount of cell
suspension was calculated and transferred to a tube for use. HMECs were washed,
dissociated and counted as described in Section 2.2.3.

61
2.3 Cell doubling times
Cell doubling times for 2DD and MDA-MB-231 cells were established for Brunel
laboratory conditions over a 5 day time period. MDA-MB-231 cells and 2DD cells at
passage 26 were seeded at density of 2,740 cells cm-2 and 2,700 cells cm-2
respectively in 60 mm culture dishes (Sarstedt). Cells were counted 1, 2, 3 and 4 days
after settling. Three dishes were counted at all timepoints except day 4 when 2 dishes
were counted for MDA-MB-231 cells. Medium was changed 2 days after seeding for
MDA-MB-231 and 3 days after seeding for 2DD cells. Doubling time was calculated
from mean cell counts (Roth, 2006). Human fibroblast cell growth has been shown to
decline linearly (Kill et al., 1994). When received at passage 10, ~ 75% of cells had
proliferative ability and at around passage 33 ~5% are regularly dividing (Eskiw,
Personal communication). From this data it was calculated that at passages 18 and 26
~ 50% and ~30% of 2DD cells could be expected to be actively proliferating. Cell
numbers for 2DD cells at passage 18 were estimated by multiplying the cell numbers
for cells at passage 26 by 5/3. Cell doubling times for HMECs were calculated from
growth of a continuously growing batch over 3 months (Yasei, personal
communication).
2.4 Cell viability assays
3-[4,5-dimethylthiazol-2-yl]-2,5-diphenyl tetrazolium bromide (MTT), PrestoBlue and
methylene blue cell viability assays were used to measure the cytotoxicity of plant
extracts and biochanin A on cells. MTT was used for assays with crude extract,
PrestoBlue for assays with crude extract, fractions and biochanin A, and methylene
blue for a resuspension of remixed fractions. MTT and PrestoBlue rely on a colour
change reaction in a reducing environment induced by active mitochondria, which is
quantified by reading absorbance. Methylene blue stains cells that remain alive and
adherent to the culture dish at the end of the treatment. When the dye is resuspended,
62
its absorbance provides a means of measuring cell viability. Unless stated, maximum
ethanol concentration in treatments was 1%.
2.4.1 MTT protocol
MTT (Millipore) is a tetrazolium dye that measures the activity of living cells via
mitochondrial dehydrogenase activity. In the presence of mitochondrial activity, MTT is
reduced from a yellow solution to purple insoluble crystals which can be dissolved in
acidified isopropanol and measured spectrophotometrically.
The MTT protocol was followed as described by the supplier (Millipore). Day 1: Cells
were seeded with a multichannel pipette in 96-well plates at 10,000 cells per well in
100 µL medium. Plates were incubated for 24 hours. Day 2: Each extract was diluted in
medium to obtain a dilution series from 1:100 to 1:32000. The medium was aspirated
from each well with a pastette and diluted extract was placed in each well using a
multichannel pipette. Control wells held medium, cells treated with ethanol vehicle at
1%, or cells in medium. The plate was incubated for 48 or 72 hours. Day 4 (48 hours
incubation) or day 5 (72 hours incubation): Medium was removed from each well using
a pastette. 100 µL of MTT reagent diluted 10x in medium was added to each well using
a multichannel pipette. The plate was incubated for 3 to 4 hours at 37°C. After
incubation, the medium was removed using a pastette and 100 µL of 0.1 N HCl
solubilising solution (Sigma) was added to each well. The solution was pipetted up and
down to aid solubilisation. The plate was read within 30 min on an Xmark Microplate
Spectrophotometer 96-well plate reader at 562 nm (absorbance) and 630 nm
(background).
To calculate fold proliferation, for each well, the reference reading was subtracted from
the absorbance reading. The mean of wells with medium only (blank) was calculated
and subtracted from all readings (A). The mean for ethanol treated cells (control mean)
63
was calculated. A was divided by the control mean to obtain fold proliferation. The
mean for each set of fold proliferation values with the same treatment was divided by
the control to give a normalised fold proliferation.
2.4.2 PrestoBlue protocol
PrestoBlue cell viability reagent (LT) is a resazurin-based solution that is reduced from
a blue resazurin to a red resorufin in the presence of mitochondrial activity. The
PrestoBlue protocol was followed as described by the supplier (LT). Day 1: Cells were
seeded and incubated as described for MTT. Day 2: Cells were treated with plant
extract as described for MTT and incubated for 48 hours or 72 hours. Day 4 (48 hours
incubation) or day 5 (72 hours incubation): Medium was removed from each well using
a pastette. 100 µL of PrestoBlue reagent diluted 10x in medium was added to each
well using a multichannel pipette. The plate was incubated for 3 hours at 37°C and was
read within 30 min at 570 nm (absorbance) and 600 nm (reference) on an Xmark
Microplate Spectrophotometer 96-well plate reader. Fold proliferation was calculated as
described for MTT. The alternative molar extinction coefficient calculation
recommended by the supplier was trialled and gave similar results to the subtraction
method above.
2.4.3 Methylene blue assay protocol
Day 1: Cells were seeded with a multichannel pipette in 96-well plates at 15,000 cells
per well in 100 µL medium, a seeding density of 45,000 cells cm-2. Plates were
incubated for 24 hours. Day 2: Cells were treated with 1 µL of the remixed fraction
solution (see Section 2.13.7), or 1 µL of a 1:20 dilution of Clitoria extract CE in ethanol.
Control wells held medium. The plate was incubated for 72 hours. Day 5: Medium was
removed from each well using a pastette. Cells were washed gently with tapwater,
drained and air-dried. Cells were fixed by placing 100 µL ethanol in each well. After 5
min the wells were washed in tapwater and air-dried. A 10% solution of methylene blue
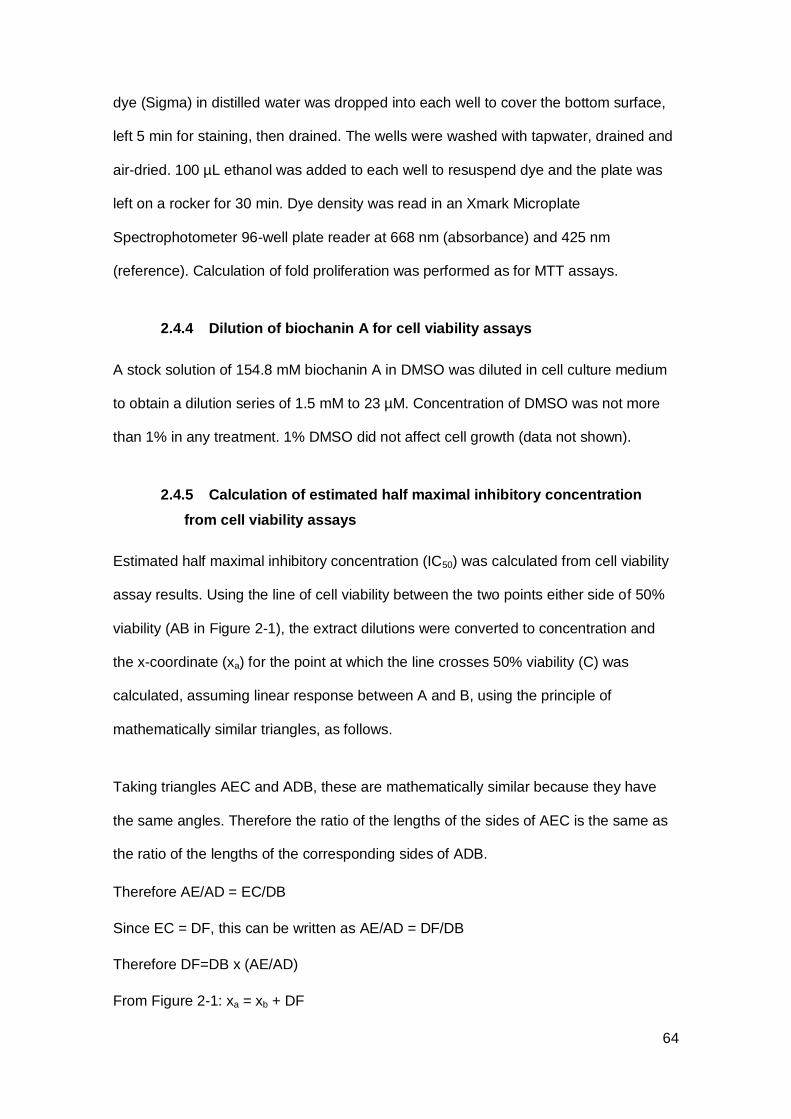
64
dye (Sigma) in distilled water was dropped into each well to cover the bottom surface,
left 5 min for staining, then drained. The wells were washed with tapwater, drained and
air-dried. 100 µL ethanol was added to each well to resuspend dye and the plate was
left on a rocker for 30 min. Dye density was read in an Xmark Microplate
Spectrophotometer 96-well plate reader at 668 nm (absorbance) and 425 nm
(reference). Calculation of fold proliferation was performed as for MTT assays.
2.4.4 Dilution of biochanin A for cell viability assays
A stock solution of 154.8 mM biochanin A in DMSO was diluted in cell culture medium
to obtain a dilution series of 1.5 mM to 23 µM. Concentration of DMSO was not more
than 1% in any treatment. 1% DMSO did not affect cell growth (data not shown).
2.4.5 Calculation of estimated half maximal inhibitory concentration
from cell viability assays
Estimated half maximal inhibitory concentration (IC50) was calculated from cell viability
assay results. Using the line of cell viability between the two points either side of 50%
viability (AB in Figure 2-1), the extract dilutions were converted to concentration and
the x-coordinate (xa) for the point at which the line crosses 50% viability (C) was
calculated, assuming linear response between A and B, using the principle of
mathematically similar triangles, as follows.
Taking triangles AEC and ADB, these are mathematically similar because they have
the same angles. Therefore the ratio of the lengths of the sides of AEC is the same as
the ratio of the lengths of the corresponding sides of ADB.
Therefore AE/AD = EC/DB
Since EC = DF, this can be written as AE/AD = DF/DB
Therefore DF=DB x (AE/AD)
From Figure 2-1: xa = xb + DF
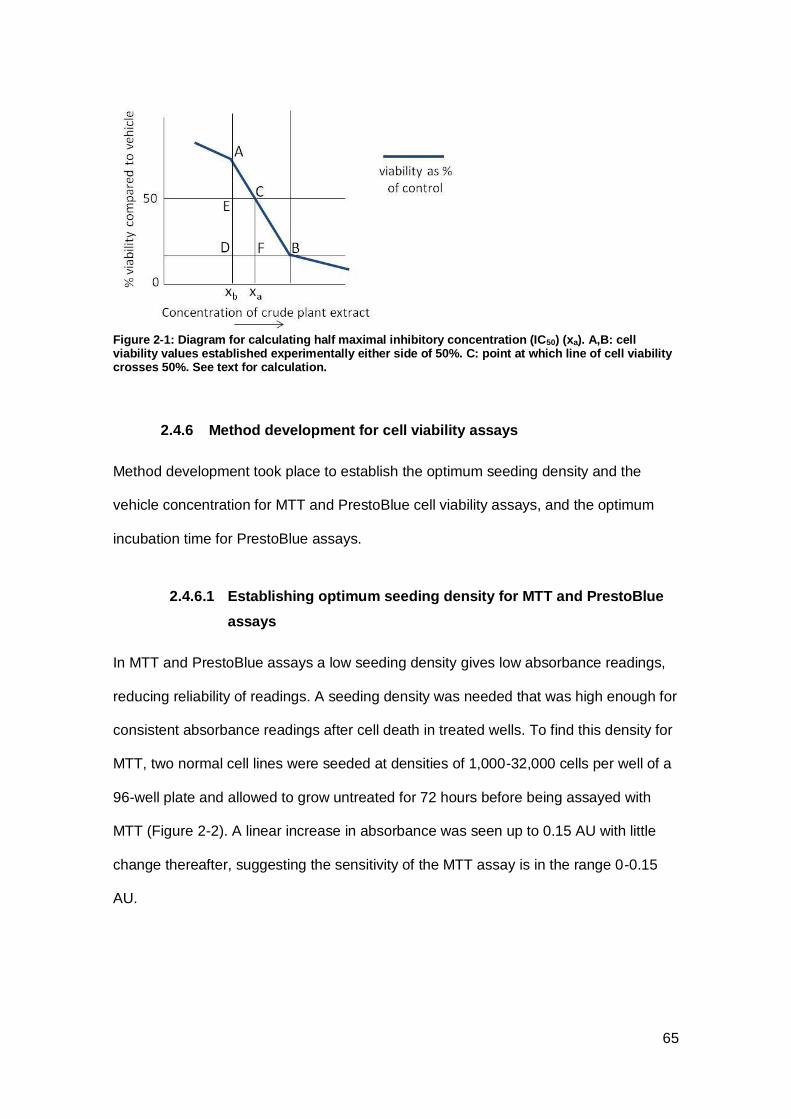
65
Figure 2-1: Diagram for calculating half maximal inhibitory concentration (IC50) (xa). A,B: cell viability values established experimentally either side of 50%. C: point at which line of cell viability crosses 50%. See text for calculation.
2.4.6 Method development for cell viability assays
Method development took place to establish the optimum seeding density and the
vehicle concentration for MTT and PrestoBlue cell viability assays, and the optimum
incubation time for PrestoBlue assays.
2.4.6.1 Establishing optimum seeding density for MTT and PrestoBlue
assays
In MTT and PrestoBlue assays a low seeding density gives low absorbance readings,
reducing reliability of readings. A seeding density was needed that was high enough for
consistent absorbance readings after cell death in treated wells. To find this density for
MTT, two normal cell lines were seeded at densities of 1,000-32,000 cells per well of a
96-well plate and allowed to grow untreated for 72 hours before being assayed with
MTT (Figure 2-2). A linear increase in absorbance was seen up to 0.15 AU with little
change thereafter, suggesting the sensitivity of the MTT assay is in the range 0-0.15
AU.
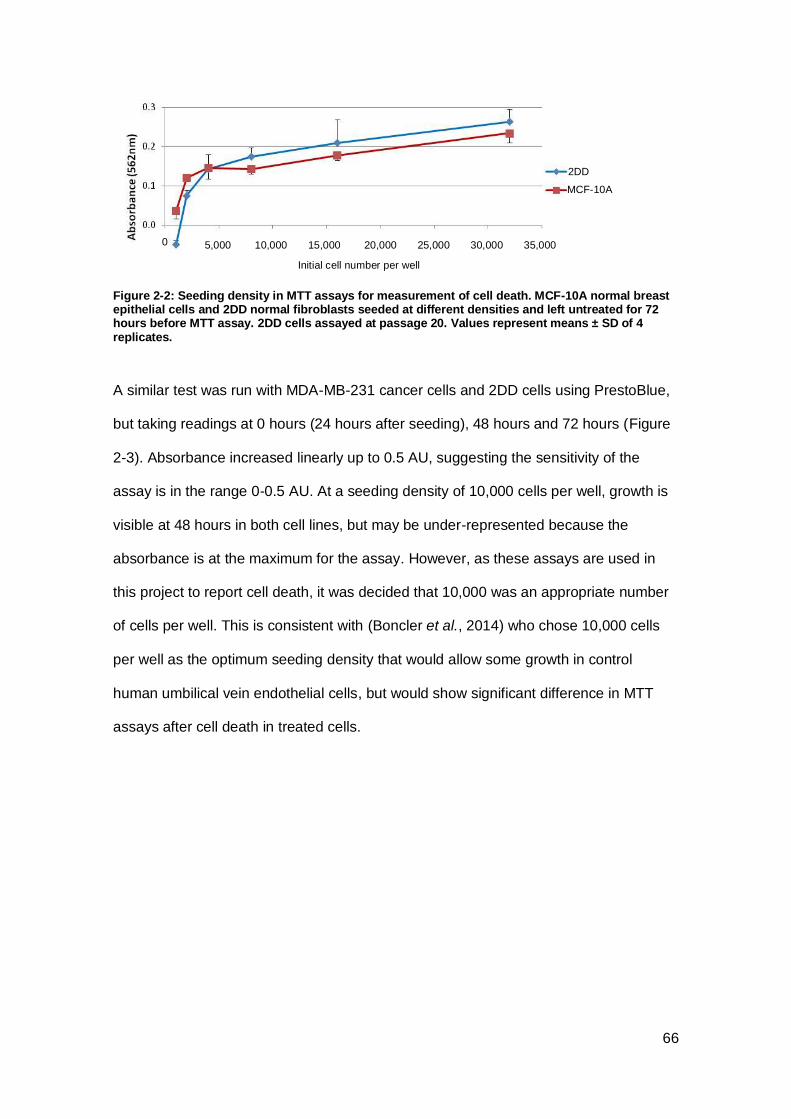
66
Figure 2-2: Seeding density in MTT assays for measurement of cell death. MCF-10A normal breast epithelial cells and 2DD normal fibroblasts seeded at different densities and left untreated for 72 hours before MTT assay. 2DD cells assayed at passage 20. Values represent means ± SD of 4 replicates.
A similar test was run with MDA-MB-231 cancer cells and 2DD cells using PrestoBlue,
but taking readings at 0 hours (24 hours after seeding), 48 hours and 72 hours (Figure
2-3). Absorbance increased linearly up to 0.5 AU, suggesting the sensitivity of the
assay is in the range 0-0.5 AU. At a seeding density of 10,000 cells per well, growth is
visible at 48 hours in both cell lines, but may be under-represented because the
absorbance is at the maximum for the assay. However, as these assays are used in
this project to report cell death, it was decided that 10,000 was an appropriate number
of cells per well. This is consistent with (Boncler et al., 2014) who chose 10,000 cells
per well as the optimum seeding density that would allow some growth in control
human umbilical vein endothelial cells, but would show significant difference in MTT
assays after cell death in treated cells.
Initial cell number per well
5,000 10,000 15,000 20,000 25,000 30,000 35,000
2DD
MCF-10A
0
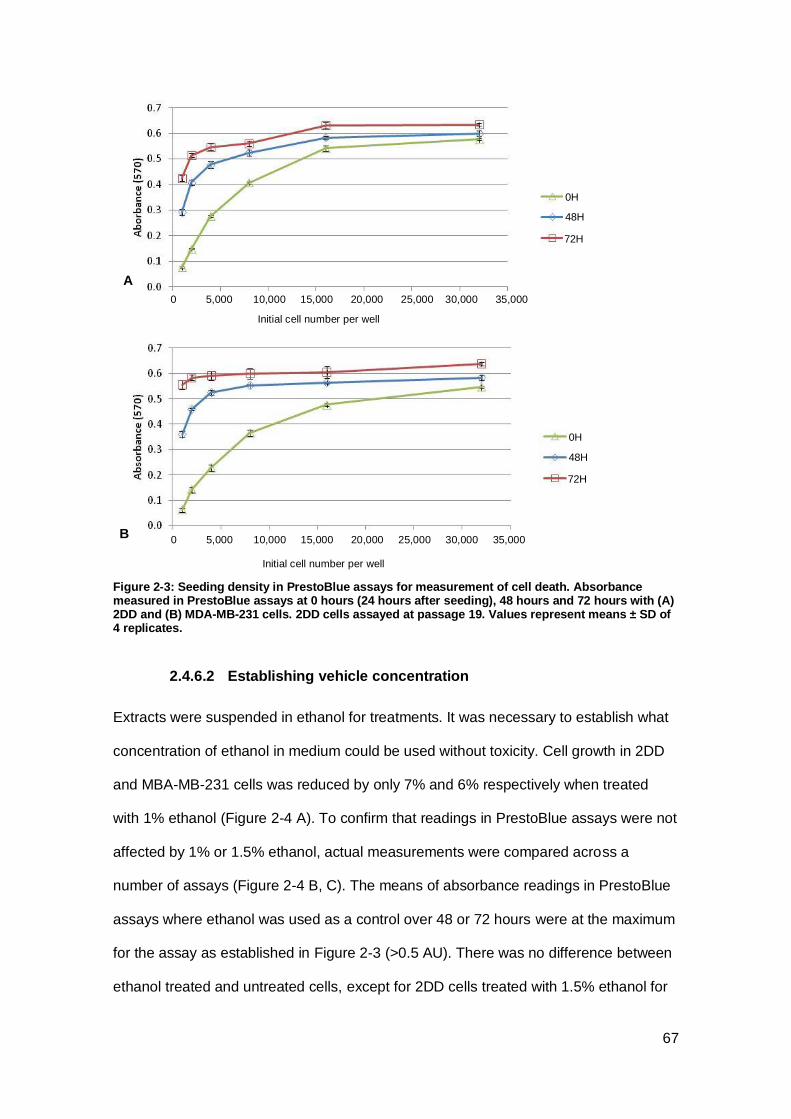
67
Figure 2-3: Seeding density in PrestoBlue assays for measurement of cell death. Absorbance measured in PrestoBlue assays at 0 hours (24 hours after seeding), 48 hours and 72 hours with (A) 2DD and (B) MDA-MB-231 cells. 2DD cells assayed at passage 19. Values represent means ± SD of 4 replicates.
2.4.6.2 Establishing vehicle concentration
Extracts were suspended in ethanol for treatments. It was necessary to establish what
concentration of ethanol in medium could be used without toxicity. Cell growth in 2DD
and MBA-MB-231 cells was reduced by only 7% and 6% respectively when treated
with 1% ethanol (Figure 2-4 A). To confirm that readings in PrestoBlue assays were not
affected by 1% or 1.5% ethanol, actual measurements were compared across a
number of assays (Figure 2-4 B, C). The means of absorbance readings in PrestoBlue
assays where ethanol was used as a control over 48 or 72 hours were at the maximum
for the assay as established in Figure 2-3 (>0.5 AU). There was no difference between
ethanol treated and untreated cells, except for 2DD cells treated with 1.5% ethanol for
A
Initial cell number per well
Initial cell number per well
B 0 5,000 10,000 15,000 20,000 25,000 30,000 35,000
0H
48H
72H
0H
48H
72H
0 5,000 10,000 15,000 20,000 25,000 30,000 35,000
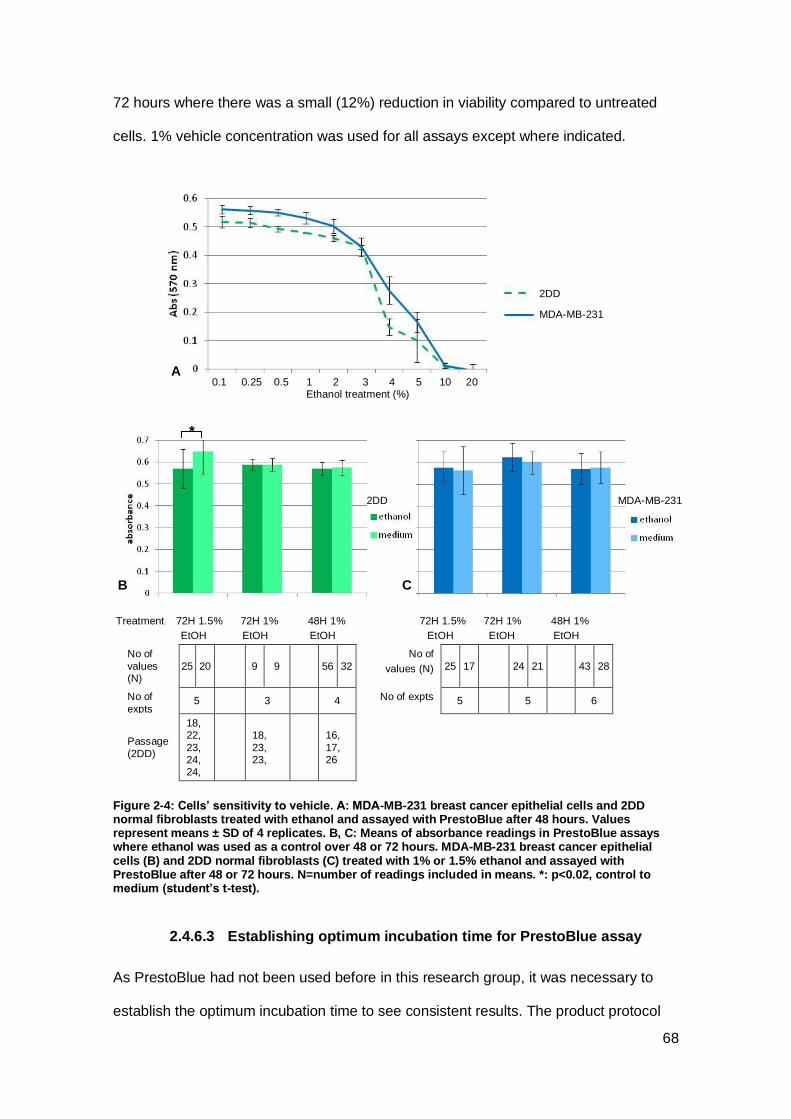
68
72 hours where there was a small (12%) reduction in viability compared to untreated
cells. 1% vehicle concentration was used for all assays except where indicated.
Treatment 72H 1.5% 72H 1% 48H 1% 72H 1.5% 72H 1% 48H 1%
EtOH EtOH EtOH EtOH EtOH EtOH
No of
values (N)
25 20 9 9 56 32
No of
values (N) 25 17 24 21 43 28
No of
expts 5 3 4 No of expts 5 5 6
Passage
(2DD)
18, 22,
23, 24, 24,
18,
23, 23,
16,
17, 26
Figure 2-4: Cells’ sensitivity to vehicle. A: MDA-MB-231 breast cancer epithelial cells and 2DD normal fibroblasts treated with ethanol and assayed with PrestoBlue after 48 hours. Values represent means ± SD of 4 replicates. B, C: Means of absorbance readings in PrestoBlue assays where ethanol was used as a control over 48 or 72 hours. MDA-MB-231 breast cancer epithelial cells (B) and 2DD normal fibroblasts (C) treated with 1% or 1.5% ethanol and assayed with PrestoBlue after 48 or 72 hours. N=number of readings included in means. *: p<0.02, control to medium (student’s t-test).
2.4.6.3 Establishing optimum incubation time for PrestoBlue assay
As PrestoBlue had not been used before in this research group, it was necessary to
establish the optimum incubation time to see consistent results. The product protocol
0.1 0.25 0.5 1 2 3 4 5 10 20 Ethanol treatment (%)
Eth
B
*
C
A
2DD MDA-MB-231
2DD
MDA-MB-231
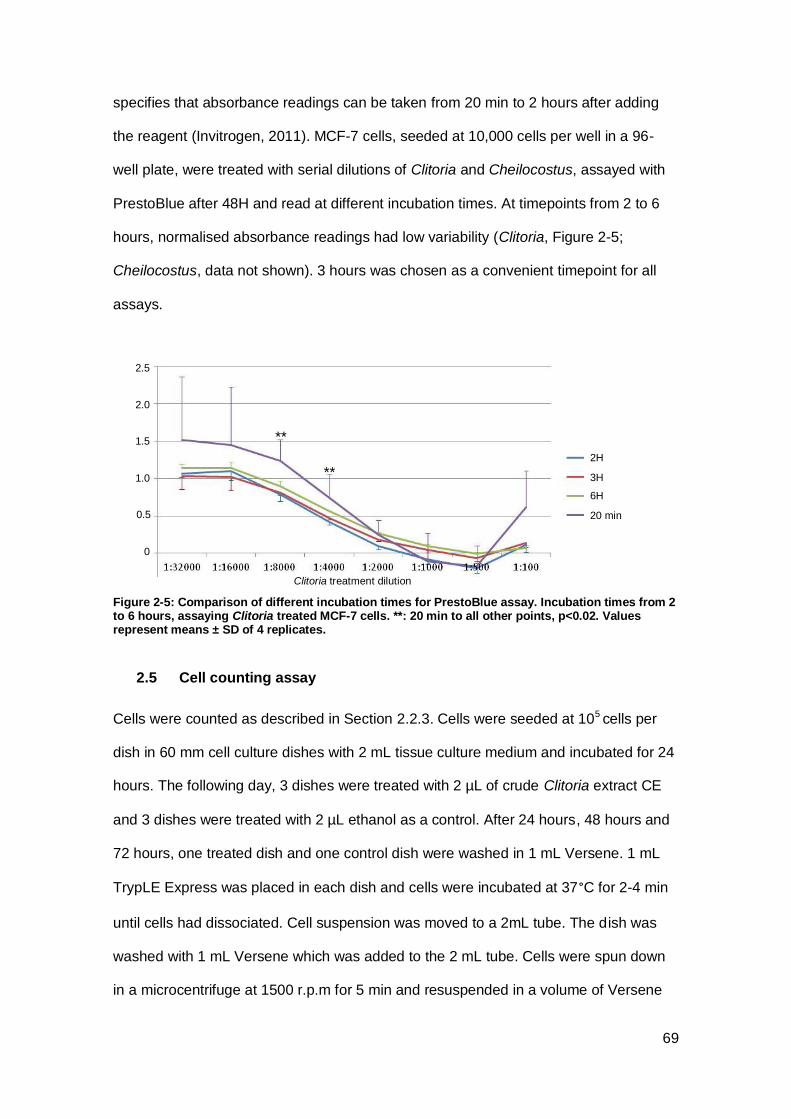
69
specifies that absorbance readings can be taken from 20 min to 2 hours after adding
the reagent (Invitrogen, 2011). MCF-7 cells, seeded at 10,000 cells per well in a 96-
well plate, were treated with serial dilutions of Clitoria and Cheilocostus, assayed with
PrestoBlue after 48H and read at different incubation times. At timepoints from 2 to 6
hours, normalised absorbance readings had low variability (Clitoria, Figure 2-5;
Cheilocostus, data not shown). 3 hours was chosen as a convenient timepoint for all
assays.
Figure 2-5: Comparison of different incubation times for PrestoBlue assay. Incubation times from 2 to 6 hours, assaying Clitoria treated MCF-7 cells. **: 20 min to all other points, p<0.02. Values represent means ± SD of 4 replicates.
2.5 Cell counting assay
Cells were counted as described in Section 2.2.3. Cells were seeded at 105 cells per
dish in 60 mm cell culture dishes with 2 mL tissue culture medium and incubated for 24
hours. The following day, 3 dishes were treated with 2 µL of crude Clitoria extract CE
and 3 dishes were treated with 2 µL ethanol as a control. After 24 hours, 48 hours and
72 hours, one treated dish and one control dish were washed in 1 mL Versene. 1 mL
TrypLE Express was placed in each dish and cells were incubated at 37°C for 2-4 min
until cells had dissociated. Cell suspension was moved to a 2mL tube. The dish was
washed with 1 mL Versene which was added to the 2 mL tube. Cells were spun down
in a microcentrifuge at 1500 r.p.m for 5 min and resuspended in a volume of Versene
**
**
Clitoria treatment dilution
2H
3H
6H
20 min
2.5
2.0
1.5
1.0
0.5
0
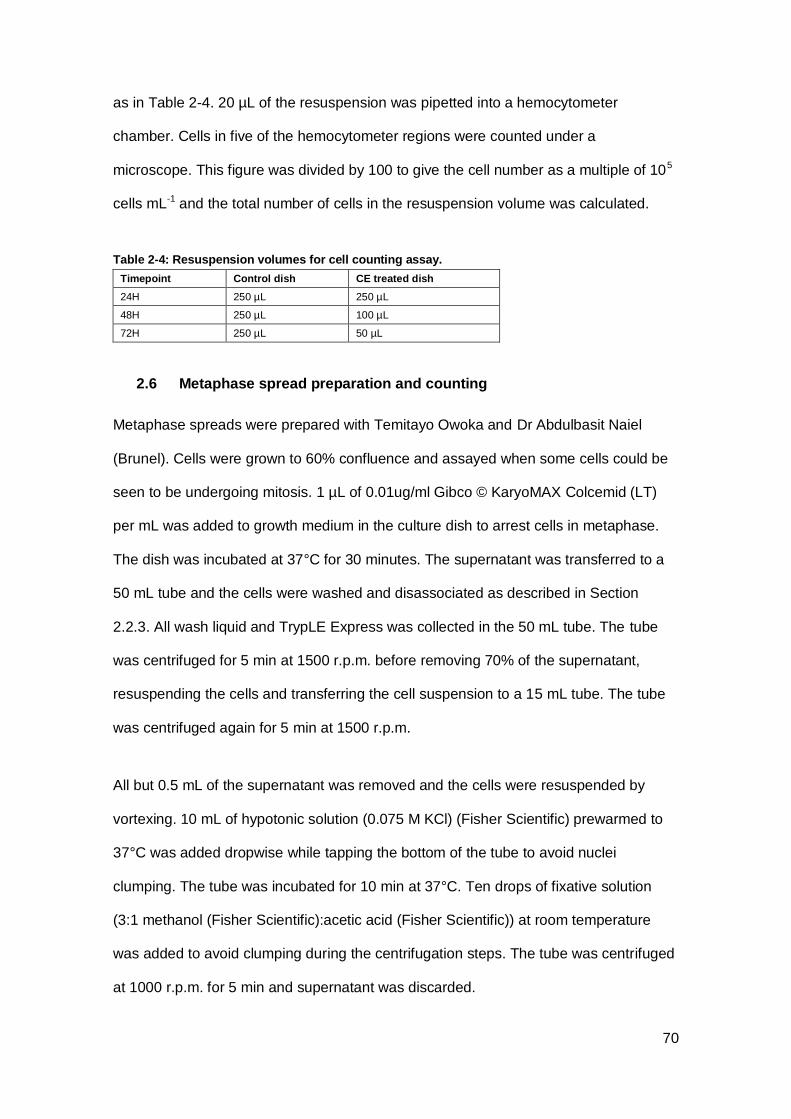
70
as in Table 2-4. 20 µL of the resuspension was pipetted into a hemocytometer
chamber. Cells in five of the hemocytometer regions were counted under a
microscope. This figure was divided by 100 to give the cell number as a multiple of 105
cells mL-1 and the total number of cells in the resuspension volume was calculated.
Table 2-4: Resuspension volumes for cell counting assay.
Timepoint Control dish CE treated dish
24H 250 µL 250 µL
48H 250 µL 100 µL
72H 250 µL 50 µL
2.6 Metaphase spread preparation and counting
Metaphase spreads were prepared with Temitayo Owoka and Dr Abdulbasit Naiel
(Brunel). Cells were grown to 60% confluence and assayed when some cells could be
seen to be undergoing mitosis. 1 µL of 0.01ug/ml Gibco © KaryoMAX Colcemid (LT)
per mL was added to growth medium in the culture dish to arrest cells in metaphase.
The dish was incubated at 37°C for 30 minutes. The supernatant was transferred to a
50 mL tube and the cells were washed and disassociated as described in Section
2.2.3. All wash liquid and TrypLE Express was collected in the 50 mL tube. The tube
was centrifuged for 5 min at 1500 r.p.m. before removing 70% of the supernatant,
resuspending the cells and transferring the cell suspension to a 15 mL tube. The tube
was centrifuged again for 5 min at 1500 r.p.m.
All but 0.5 mL of the supernatant was removed and the cells were resuspended by
vortexing. 10 mL of hypotonic solution (0.075 M KCl) (Fisher Scientific) prewarmed to
37°C was added dropwise while tapping the bottom of the tube to avoid nuclei
clumping. The tube was incubated for 10 min at 37°C. Ten drops of fixative solution
(3:1 methanol (Fisher Scientific):acetic acid (Fisher Scientific)) at room temperature
was added to avoid clumping during the centrifugation steps. The tube was centrifuged
at 1000 r.p.m. for 5 min and supernatant was discarded.
71
The pellet was resuspended in 1 mL of fixative solution by vortexing and 9 mL of
fixative solution was added slowly. The tube was incubated for 15 min at room
temperature, centrifuged at 1000 r.p.m. for 5 min and supernatant was discarded. This
stage was repeated twice omitting the incubation step.
Almost all the solution was removed without disturbing the pellet. The pellet was
resuspended in around 1 mL of fixative solution. 8-20 µL of solution was dropped onto
a slide and the slide was left in a tray lined with damp tissue. Slides were allowed to dry
and cure overnight in a dry black box at room temperature. The following day, slides
were stained with Vectashield mounting medium with DAPI (Vector) and covered with a
coverslip. Slides were imaged at 1000x magnification on an Olympus BX41 or on a
Leica DM4000 fluorescence microscope. Images were processed in ImageJ and
metaphases were counted manually by one person.
2.7 Fluorescence microscopy
2.7.1 Protocol
13 mm coverslips, rinsed in ethanol and then in PBS, were placed in the wells of a 24-
well plate and covered with 250 µL medium, then allowed to equilibrate at 37°C for 15
min. Cells were seeded either by adding 250 µL cell suspension to medium already in
the wells, or by aspirating the medium and replacing it with 250 µL cell suspension.
Plates were incubated for 24 hours to allow cells to adhere to the coverslips. Cells were
treated by replacing medium with extract diluted in medium and incubated for the
experiment’s treatment time at 37°C.
MDA-MB-231 breast cancer epithelial cells were first seeded at 40,000 cells per well
(20,000 cells cm-2) but when control cells appeared overgrown, they were seeded at
20,000 cells per well (10,000 cells cm-2) to avoid confounding effects of cell-cell
72
contact. The larger 2DD normal fibroblasts were seeded at 12,000 cells per well (6,000
cells cm-2).
For actin staining, coverslips were washed three times in PBS in the wells, then fixed
with 4% paraformaldehyde (PFA) electron microscopy grade (TAAB) for 10 min. They
were washed three times in PBS then left in 5% FBS in PBS (wash). Coverslips fixed in
PFA were permeabilised in permeabilisation buffer (20 mM (4-(2-hydroxyethyl)-1-
piperazineethanesulfonic acid) (HEPES) (pH 7.0 (NaOH)) (Sigma), 300 mM sucrose
(Sigma), 50 mM NaCl (Sigma), 3 mM MgCl2 (Sigma), 0.5% Triton (Roche)) on ice for 5
min, then washed three times in PBS. For tubulin staining, coverslips were washed
three times in PBS in the wells, then fixed and permeabilised with ice cold methanol for
30 sec (Fisher). They were washed three times in PBS then left in wash until staining.
Coverslips were blocked in wash for 30 min. Primary antibodies (Table 2-5) were
prepared immediately before use by dilution in 0.25% FBS in PBS. Coverslips were
removed from the wells, blotted on paper and placed on parafilm (Fisher) in an
incubation chamber lined with wet tissue. 30 µL of primary antibody solution was
dropped onto each coverslip. The incubation chamber was incubated for 60 min at
room temperature. Coverslips were blotted, dipped in wash, blotted and dipped again
and replaced on the parafilm. They were covered with wash using a dropper and left in
the chamber for 30 min at room temperature. Secondary antibodies (Table 2-5) were
prepared immediately before use. If using Hoechst, a 1:10,000 solution of Hoechst
(Invitrogen) in 0.25% FBS in PBS was prepared in an Eppendorf tube. Secondary
antibody was added to the Eppendorf tube which was vortexed to mix. The wash was
aspirated from the coverslips and 30 µL of antibody mixture was placed on the
coverslips. The incubation chamber was left for 30 min in the dark at room
temperature. The coverslips were washed three times in wash on the parafilm and the

73
last wash was left on. The incubation chamber was left for 30 min in the dark at room
temperature.
The coverslips were blotted and placed right way up on a slide, three or four to a slide.
10 µL of AF1 antifadent (CitiFluor) was placed on each coverslip before covering with
one large coverslip for each slide. The slides were viewed on an Olympus BX41
fluorescence microscope at 400x magnification.
Table 2-5: Antibodies used in fluorescence microscopy.
Primary/secondary Name Supplier Dilution used
Primary Anti-Ki-67 rabbit polyclonal Abcam 1:200
Anti-tubulin rat monoclonal Abcam 1:1000
488 phalloidin Alexa Fluor 1:100
Secondary 546 goat anti-rabbit IgG Alexa Fluor 1:100
488 goat anti-rat IgG Alexa Fluor 1:100
2.7.2 Apoptosis assays
Apoptosis assays were performed with FITC Annexin V Apoptosis Detection Kit I (BD
Biosciences) and with Cell Meter Apoptotic and Necrotic Detection Kit (Stratech).
Phosphatidylserine (PS) is a membrane phospholipid that moves to the extracellular
surface of the plasma membrane during early apoptosis (Martin et al., 1995). The BD
Biosciences kit employs annexin V, a phospholipid binding protein that binds to PS with
high affinity (van Engeland et al., 1998) and when conjugated to a fluorescent marker
such as FITC can be viewed with fluorescence microscopy, and propidium iodide, a red
membrane impermeable dye that binds to nucleic acid of cells with compromised
membrane integrity and is a marker for late apoptosis. The Stratech kit employs the
phospholipid binding protein Apopxin™ Green, with membrane impermeable red 7-
Aminoactinomycin D (7-AAD) which binds to DNA, and CytoCalceinTM Violet 450 which
stains cytoplasm in live cells. Staurosporine (STS) is a kinase inhibitor and inducer of
apoptosis commonly used as a positive control in apoptosis assays.

74
13 mm coverslips were prepared as described in the protocol for fluorescence
microscopy. When using the BD Biosciences kit, MCF-7 cells were seeded at 40,000
cells per well with 250 µL medium added, and allowed to settle for 24 hours. Cells were
treated with Clitoria extract CE at 1:2000 dilution in ethanol and incubated for 24 hours,
or 0.5 µM STS (Invitrogen) and incubated for 16 hours as positive control. Vehicle
control was 1% ethanol with 24 hours incubation. After incubation, coverslips were
removed, stained with a drop of reagent solution (200 µL 1X binding buffer (0.01 M
HEPES/NaOH (pH 7.4), 0.14 M NaCl, 2.5 mM CaCl2 in distilled water (BD
Biosciences)), 1 µL 1X Annexin V (BD Biosciences), 1 µL propidium iodide (BD
Biosciences)), and incubated for 15 min in the dark at room temperature. They were
replaced in the wells, washed twice in PBS, and 4% PFA in PBS was added to each
well. The plate was incubated for 5 minutes in the dark for fixing. The coverslips were
washed in PBS, placed right way up on a microscope slide (3 per slide) and covered
with a large coverslip before viewing on a Nikon Eclipse TE2000-S confocal
microscope.
When using the Stratech kit, MDA-MB-231 breast cancer epithelial cells were seeded
at 40,000 cells per well with 250 µL medium added, and allowed to settle for 48 hours.
Cells were treated with Clitoria extract CE at 1:2000 dilution in ethanol and incubated
for 24 hours, or 1.5 µM STS and incubated for 2 hours as positive control. Vehicle
control was 1% ethanol with 24 hours incubation. After incubation, 2 µL of 100X
Apopxin Green (Stratech) was added to 200 µL assay buffer (Stratech). 1 µL of 200X
7-AAD (Stratech) was added to the mixture, followed by 1 µL of 200X CytoCalceinTM
Violet 450 (Stratech) in DMSO. Coverslips were removed, stained with 25 µL of
reagent solution and incubated for 30 min in the dark at room temperature. They were
replaced in the wells and washed in PBS, placed inverted on a microscope slide (3 per
slide) and covered with a large coverslip before viewing on an Olympus BX41
fluorescence microscope.
75
2.8 Actin density measurement
ImageJ was used to measure actin density and to count the number of cells on each
image. On a red channel (actin) 8-bit image, the threshold was adjusted to include actin
filaments and to exclude rounded cells in mitosis. The unit of length was set to “pixel”.
The Measure feature was used to obtain the integrated density between thresholds for
the image. Integrated density results were copied into MS Excel. Cell nuclei were
counted on a blue channel (DAPI) 8-bit image. The threshold was adjusted to include
nuclei and nuclei were counted with the Analyze Particles feature set to show overlay
outlines. Nuclei count results were copied into Excel. The nuclei count data were
compared with the overlay outline image and adjustments were made where a particle
included more than one cell, where one cell had more than one measurement or where
a particle was an artefact. Rounded cells in mitosis were excluded. In Excel, the
integrated density was divided by the number of cells to obtain a mean actin density
per cell for each image, and means of two images were calculated.
2.9 Live cell imaging
Cells were seeded at 5,000-6,000 cells cm-2 in Falcon 12- or 24-well plates (VWR) in
their normal cell culture medium and incubated for 24 hours to attach. HEPES was
pipetted into the medium to make 35 mM dilution. Treatment was pipetted into the
medium and mixed by gentle agitation of the plate. The plate was immediately sealed
with parafilm and placed in a custom-made metal insert on the darkened stage of a
Nikon Eclipse TE2000-S confocal microscope. The stage was pre-warmed and
maintained at 37°C. Cells were observed at 200x magnification and phase contrast
images were captured at 5 min intervals for 24 or 48 hours. The acquisition software
was NIS-Elements AR version 3.22.11. Movies were transferred to Microsoft Windows
8 and edited in Windows Live Movie Maker version 2011.

76
2.10 Movement tracking
Movement tracking in movies was performed by Ashutosh Temang (Brunel). Cells that
remained within the field of view and did not enter cell division during the entire 48 hour
period observed were selected for tracking. Using the ImageJ Manual Tracking plug-in,
a new track was started. The centre of a cell nucleus was located manually and
clicked, the movie was played one frame at a time and and the location of the nucleus
centre was clicked for each frame. The 48 hour duration was recorded as 659 frames.
This provided a set of 659 xy coordinates in pixel units. The distance between adjacent
coordinates was calculated by the plug-in in μm. The track data was copied into MS
Excel and the distances between steps were summed to obtain a total distance moved.
2.11 Membrane ruffling
Movies of cells treated with Clitoria and control cells were viewed in ImageJ. From a 48
hour movie consisting of 659 frames, five sets of four frames were selected for
analysis: frames 1-5, 100-104, 200-204, 300-304 and 400-404. Cells were selected at
random in the first frame of each set from cells that had least contact with other cells..
A visual estimate was made of the amount of plasma membrane that ruffled as a
proportion of the exposed (not touching other cells) plasma membrane during the four
frames. Four control and four treated cells were viewed at each timepoint. It was not
possible to perform image analysis on movement of plasma membranes as in van
Larebeke et al. (1992) because movement of intracellular structures dominated the
signal.
Movies of cells treated with Clitoria fraction F17 and control cells and control cells were
viewed in ImageJ. From a 24 hour movie consisting of 289 frames, three sets of four
frames were selected for analysis: frames 1-5, 30-34, 60-64. Cells were selected and
the plasma membrane ruffling was estimated as described above. After frame 64,
exposed plasma membrane was minimal in control cells due to cell division.
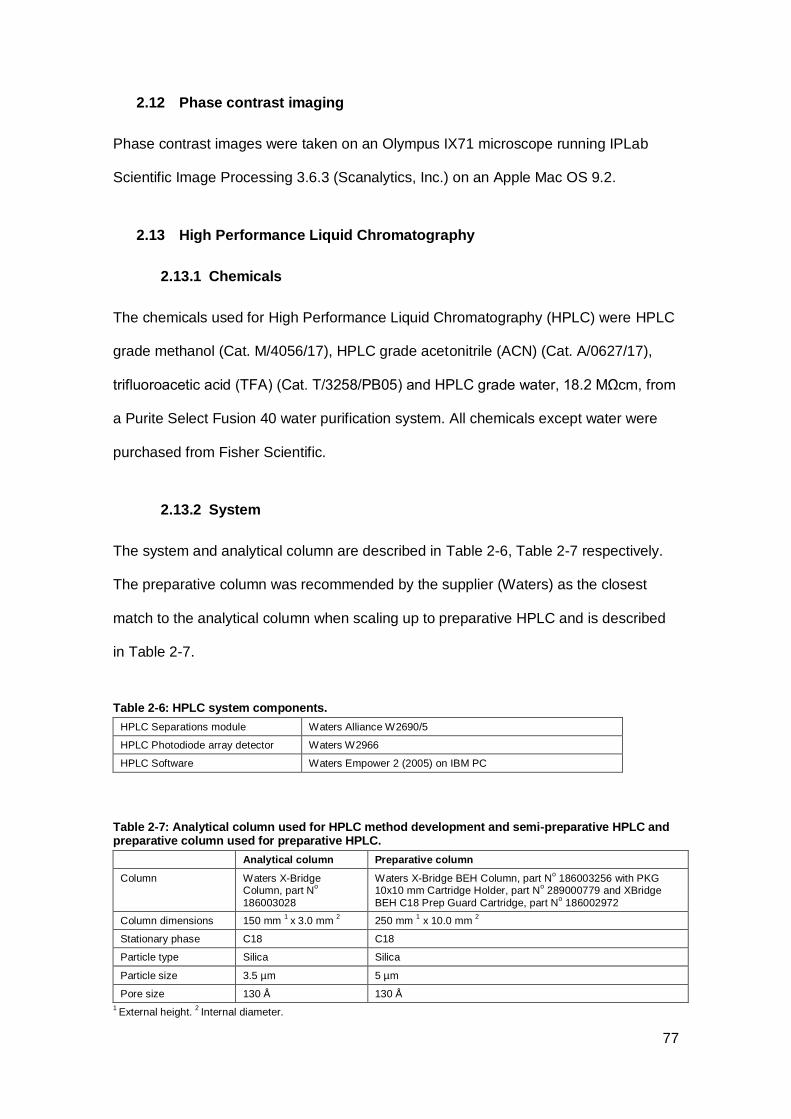
77
2.12 Phase contrast imaging
Phase contrast images were taken on an Olympus IX71 microscope running IPLab
Scientific Image Processing 3.6.3 (Scanalytics, Inc.) on an Apple Mac OS 9.2.
2.13 High Performance Liquid Chromatography
2.13.1 Chemicals
The chemicals used for High Performance Liquid Chromatography (HPLC) were HPLC
grade methanol (Cat. M/4056/17), HPLC grade acetonitrile (ACN) (Cat. A/0627/17),
trifluoroacetic acid (TFA) (Cat. T/3258/PB05) and HPLC grade water, 18.2 MΩcm, from
a Purite Select Fusion 40 water purification system. All chemicals except water were
purchased from Fisher Scientific.
2.13.2 System
The system and analytical column are described in Table 2-6, Table 2-7 respectively.
The preparative column was recommended by the supplier (Waters) as the closest
match to the analytical column when scaling up to preparative HPLC and is described
in Table 2-7.
Table 2-6: HPLC system components.
HPLC Separations module Waters Alliance W2690/5
HPLC Photodiode array detector Waters W2966
HPLC Software Waters Empower 2 (2005) on IBM PC
Table 2-7: Analytical column used for HPLC method development and semi-preparative HPLC and preparative column used for preparative HPLC.
Analytical column Preparative column
Column Waters X-Bridge Column, part N
o
186003028
Waters X-Bridge BEH Column, part No 186003256 with PKG
10x10 mm Cartridge Holder, part No 289000779 and XBridge
BEH C18 Prep Guard Cartridge, part No 186002972
Column dimensions 150 mm 1
x 3.0 mm 2
250 mm 1 x 10.0 mm
2
Stationary phase C18 C18
Particle type Silica Silica
Particle size 3.5 µm 5 µm
Pore size 130 Å 130 Å
1 External height.
2 Internal diameter.
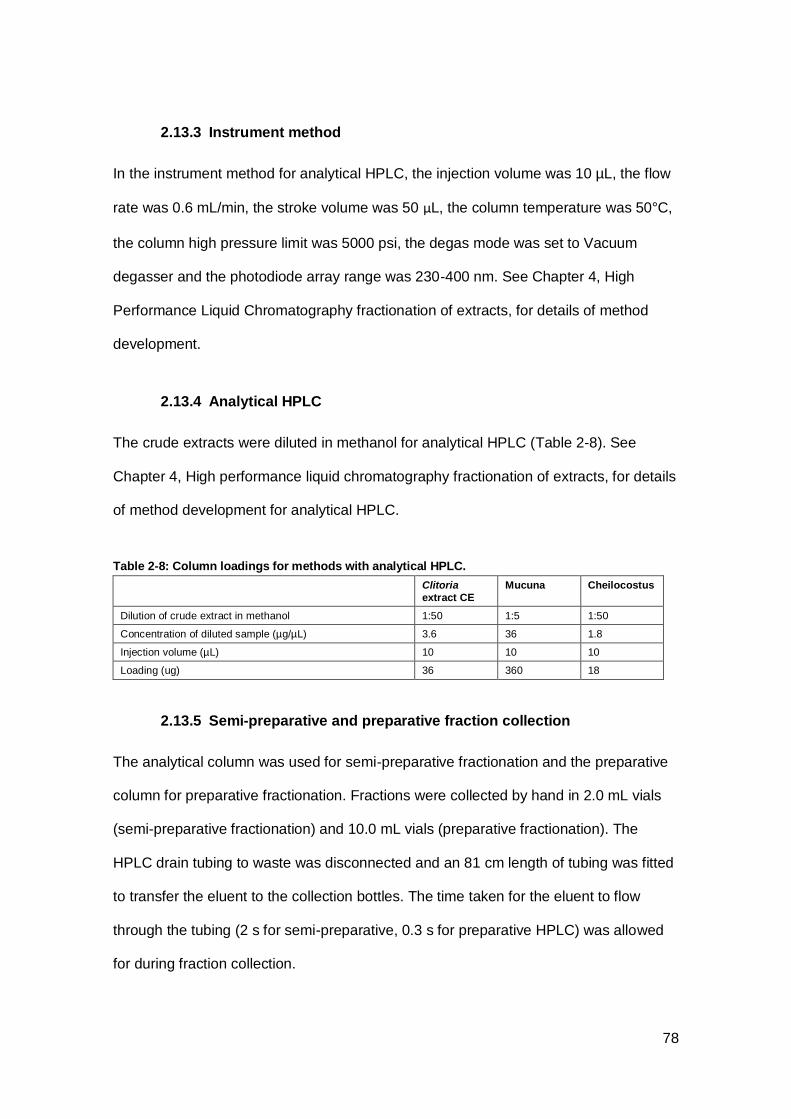
78
2.13.3 Instrument method
In the instrument method for analytical HPLC, the injection volume was 10 µL, the flow
rate was 0.6 mL/min, the stroke volume was 50 μL, the column temperature was 50°C,
the column high pressure limit was 5000 psi, the degas mode was set to Vacuum
degasser and the photodiode array range was 230-400 nm. See Chapter 4, High
Performance Liquid Chromatography fractionation of extracts, for details of method
development.
2.13.4 Analytical HPLC
The crude extracts were diluted in methanol for analytical HPLC (Table 2-8). See
Chapter 4, High performance liquid chromatography fractionation of extracts, for details
of method development for analytical HPLC.
Table 2-8: Column loadings for methods with analytical HPLC.
Clitoria
extract CE
Mucuna Cheilocostus
Dilution of crude extract in methanol 1:50 1:5 1:50
Concentration of diluted sample (µg/µL) 3.6 36 1.8
Injection volume (µL) 10 10 10
Loading (ug) 36 360 18
2.13.5 Semi-preparative and preparative fraction collection
The analytical column was used for semi-preparative fractionation and the preparative
column for preparative fractionation. Fractions were collected by hand in 2.0 mL vials
(semi-preparative fractionation) and 10.0 mL vials (preparative fractionation). The
HPLC drain tubing to waste was disconnected and an 81 cm length of tubing was fitted
to transfer the eluent to the collection bottles. The time taken for the eluent to flow
through the tubing (2 s for semi-preparative, 0.3 s for preparative HPLC) was allowed
for during fraction collection.
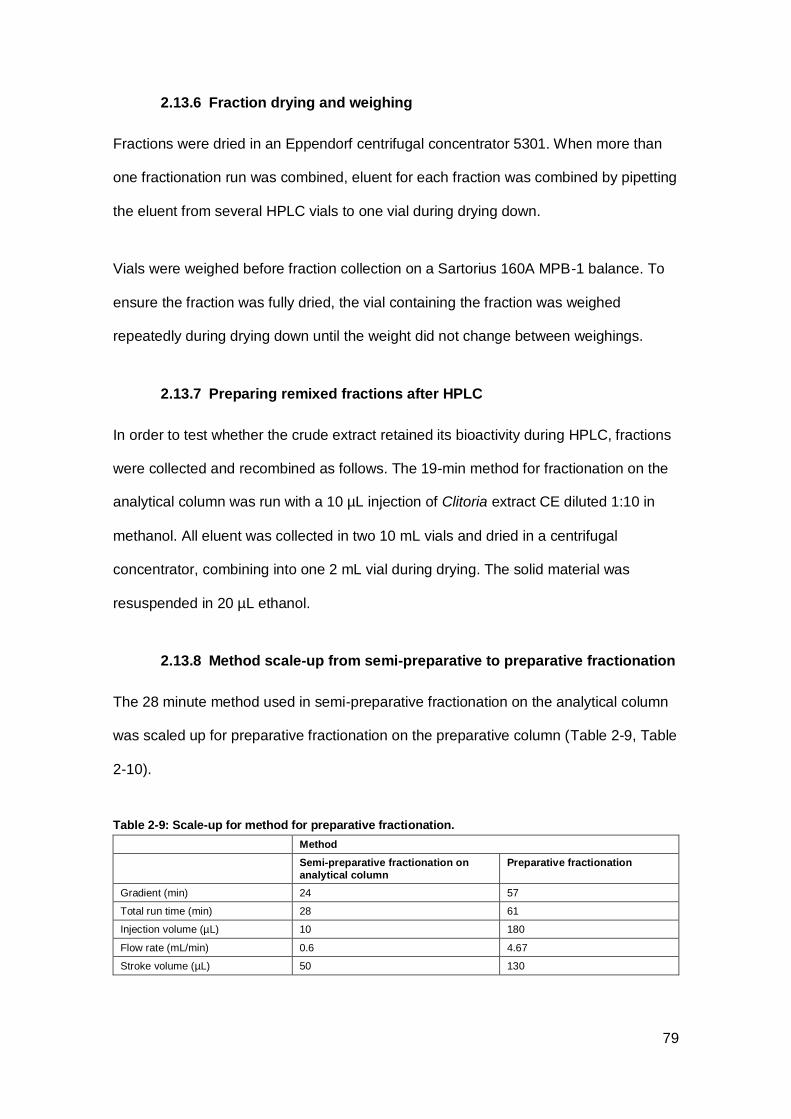
79
2.13.6 Fraction drying and weighing
Fractions were dried in an Eppendorf centrifugal concentrator 5301. When more than
one fractionation run was combined, eluent for each fraction was combined by pipetting
the eluent from several HPLC vials to one vial during drying down.
Vials were weighed before fraction collection on a Sartorius 160A MPB-1 balance. To
ensure the fraction was fully dried, the vial containing the fraction was weighed
repeatedly during drying down until the weight did not change between weighings.
2.13.7 Preparing remixed fractions after HPLC
In order to test whether the crude extract retained its bioactivity during HPLC, fractions
were collected and recombined as follows. The 19-min method for fractionation on the
analytical column was run with a 10 µL injection of Clitoria extract CE diluted 1:10 in
methanol. All eluent was collected in two 10 mL vials and dried in a centrifugal
concentrator, combining into one 2 mL vial during drying. The solid material was
resuspended in 20 µL ethanol.
2.13.8 Method scale-up from semi-preparative to preparative fractionation
The 28 minute method used in semi-preparative fractionation on the analytical column
was scaled up for preparative fractionation on the preparative column (Table 2-9, Table
2-10).
Table 2-9: Scale-up for method for preparative fractionation.
Method
Semi-preparative fractionation on
analytical column
Preparative fractionation
Gradient (min) 24 57
Total run time (min) 28 61
Injection volume (µL) 10 180
Flow rate (mL/min)
0.6 4.67
Stroke volume (µL) 50 130
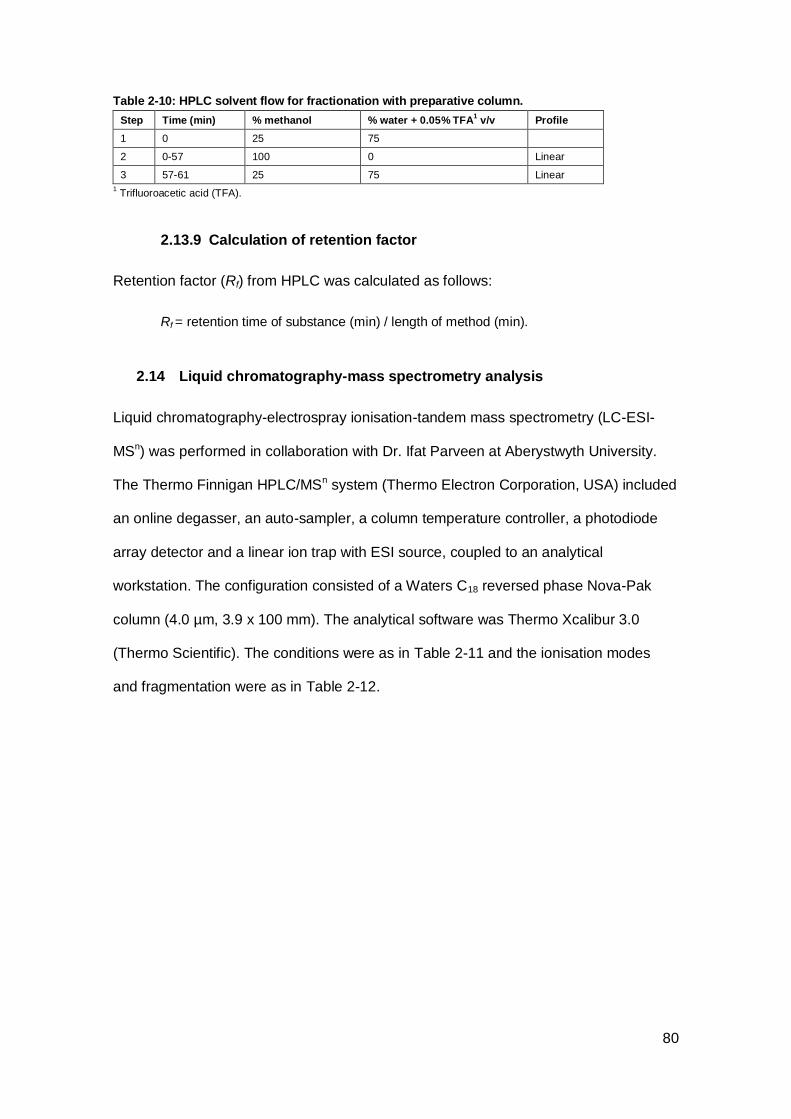
80
Table 2-10: HPLC solvent flow for fractionation with preparative column.
Step Time (min) % methanol % water + 0.05% TFA1 v/v
Profile
1 0 25 75
2 0-57 100 0 Linear
3
57-61 25 75 Linear
1 Trifluoroacetic acid (TFA).
2.13.9 Calculation of retention factor
Retention factor (Rf) from HPLC was calculated as follows:
Rf = retention time of substance (min) / length of method (min).
2.14 Liquid chromatography-mass spectrometry analysis
Liquid chromatography-electrospray ionisation-tandem mass spectrometry (LC-ESI-
MSn) was performed in collaboration with Dr. Ifat Parveen at Aberystwyth University.
The Thermo Finnigan HPLC/MSn system (Thermo Electron Corporation, USA) included
an online degasser, an auto-sampler, a column temperature controller, a photodiode
array detector and a linear ion trap with ESI source, coupled to an analytical
workstation. The configuration consisted of a Waters C18 reversed phase Nova-Pak
column (4.0 µm, 3.9 x 100 mm). The analytical software was Thermo Xcalibur 3.0
(Thermo Scientific). The conditions were as in Table 2-11 and the ionisation modes
and fragmentation were as in Table 2-12.
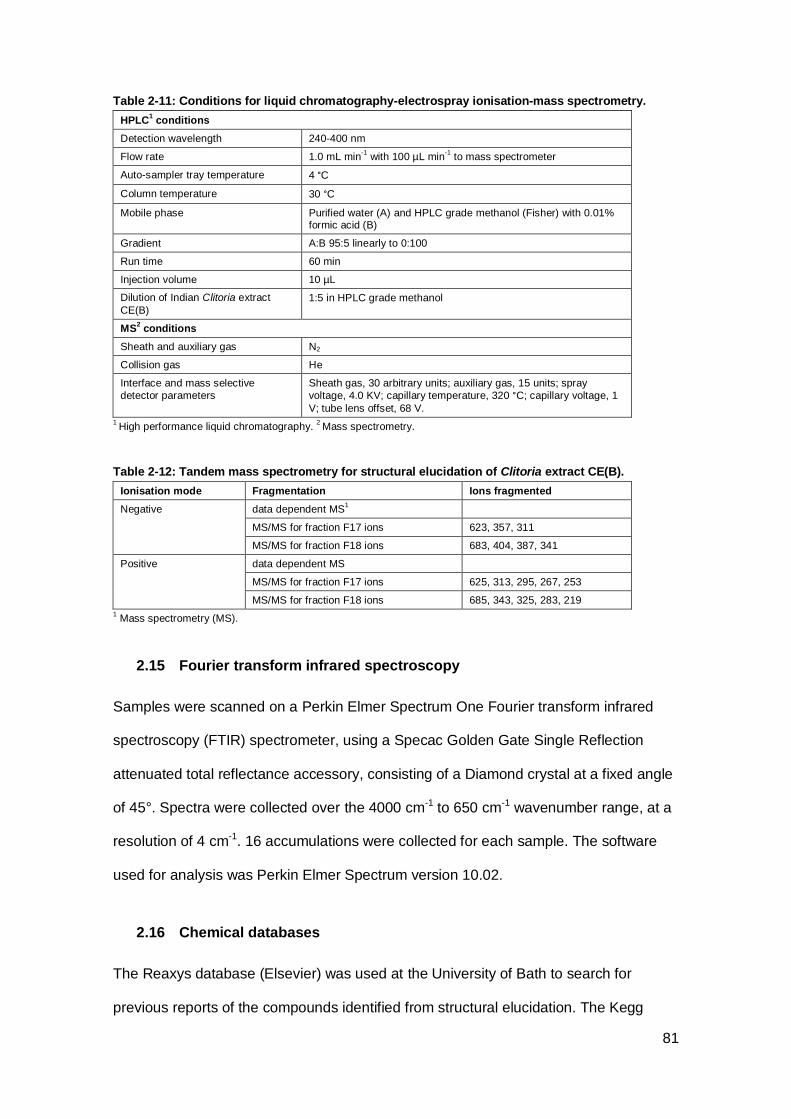
81
Table 2-11: Conditions for liquid chromatography-electrospray ionisation-mass spectrometry.
HPLC1 conditions
Detection wavelength 240-400 nm
Flow rate 1.0 mL min-1
with 100 µL min-1
to mass spectrometer
Auto-sampler tray temperature 4 °C
Column temperature 30 °C
Mobile phase Purified water (A) and HPLC grade methanol (Fisher) with 0.01% formic acid (B)
Gradient A:B 95:5 linearly to 0:100
Run time 60 min
Injection volume 10 µL
Dilution of Indian Clitoria extract
CE(B)
1:5 in HPLC grade methanol
MS2 conditions
Sheath and auxiliary gas N2
Collision gas He
Interface and mass selective
detector parameters
Sheath gas, 30 arbitrary units; auxiliary gas, 15 units; spray
voltage, 4.0 KV; capillary temperature, 320 °C; capillary voltage, 1
V; tube lens offset, 68 V.
1 High performance liquid chromatography.
2 Mass spectrometry.
Table 2-12: Tandem mass spectrometry for structural elucidation of Clitoria extract CE(B).
Ionisation mode Fragmentation Ions fragmented
Negative data dependent MS1
MS/MS for fraction F17 ions 623, 357, 311
MS/MS for fraction F18 ions 683, 404, 387, 341
Positive data dependent MS
MS/MS for fraction F17 ions 625, 313, 295, 267, 253
MS/MS for fraction F18 ions 685, 343, 325, 283, 219
1 Mass spectrometry (MS).
2.15 Fourier transform infrared spectroscopy
Samples were scanned on a Perkin Elmer Spectrum One Fourier transform infrared
spectroscopy (FTIR) spectrometer, using a Specac Golden Gate Single Reflection
attenuated total reflectance accessory, consisting of a Diamond crystal at a fixed angle
of 45°. Spectra were collected over the 4000 cm-1 to 650 cm-1 wavenumber range, at a
resolution of 4 cm-1. 16 accumulations were collected for each sample. The software
used for analysis was Perkin Elmer Spectrum version 10.02.
2.16 Chemical databases
The Reaxys database (Elsevier) was used at the University of Bath to search for
previous reports of the compounds identified from structural elucidation. The Kegg

82
Ligand database (Kanehisa Laboratories, 2012) was used to search for candidate
compounds.
2.17 Statistics
Correlation coefficients were calculated in Microsoft Excel and one-tailed p-values for
correlation coefficients were calculated using Statistics Calculators online calculator
(Soper, 2015). Two-tailed, two-sample unequal variance student’s t-tests were
performed and standard deviations were calculated in Excel.
83
Chapter 3 Cytotoxicity in Clitoria root extract
3.1 Introduction
It has been estimated that plants produce over 100,000 different secondary
metabolites, which are of sufficient importance to plants for large resources to be
concerned with their synthesis. 12.2% of the Arabidopsis genome, for example, is
concerned with plant defence (The Arabidopsis Genome Initiative, 2000) and
Arabidopsis synthesises over 170 of these chemicals (D’Auria and Gershenzon, 2005).
It is not surprising therefore that traditional medicine exploits the bioactivity of natural
product extracts, and many secondary metabolites have cytotoxic activity that is
retained in a medicinal extract.
In pharmacognosy work prior to this study, infertility therapies based on medicinal plant
extracts from Assam were proposed for investigation into estrogenic activity. During
this earlier work, in which breast cancer epithelial cells were used as a model, low
growth or cell death was observed in cells treated with three of the plant extracts. This
serendipitous observation led to preliminary studies on the three extracts, Clitoria,
Mucuna and Cheilocostus, which demonstrated cytotoxic activity in breast cancer cells
(Figure 3-1). Clitoria root extract and Cheilocostus rhizome extract had dose related
toxicity. Mucuna seed extract was cytotoxic only at the highest concentration.
A strategy for natural product drug discovery was proposed that would build on the
preliminary work (Figure 3-2). This chapter concerns bioassays with the three crude
extracts that were conducted to confirm which of the three had properties that justified
further study, and more extensive bioassays with Clitoria, conducted in order to
characterise the cytotoxic effects.
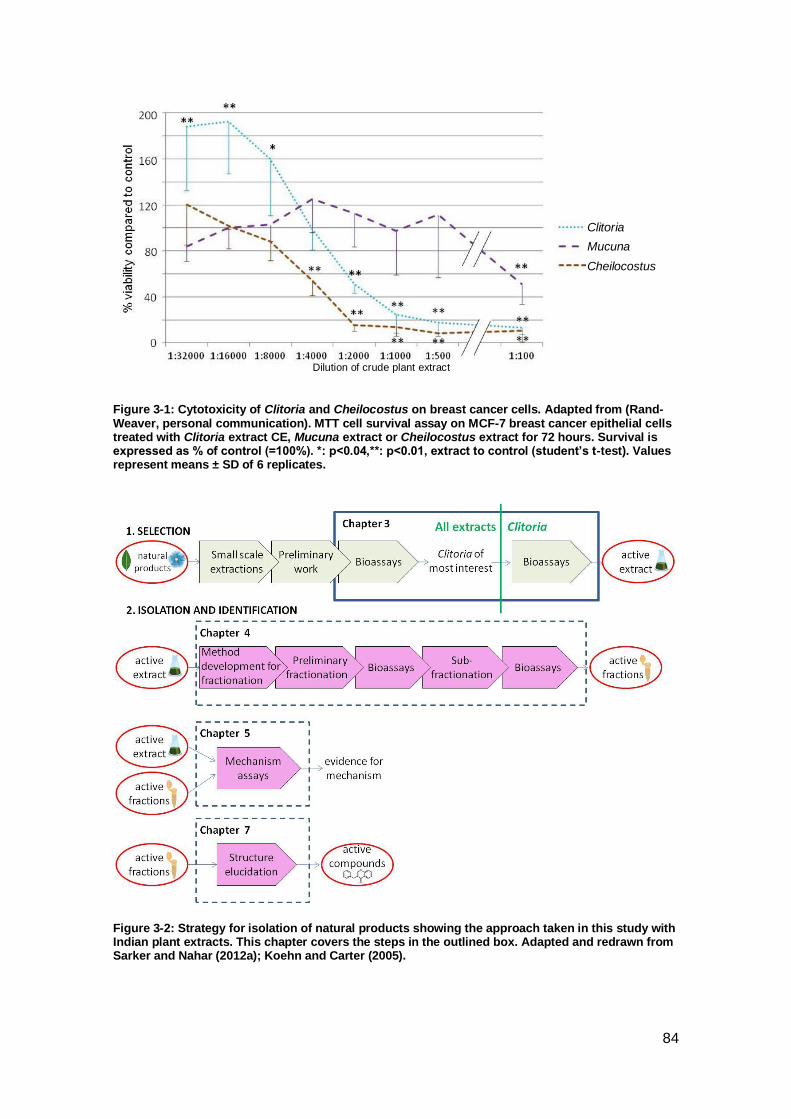
84
Figure 3-1: Cytotoxicity of Clitoria and Cheilocostus on breast cancer cells. Adapted from (Rand-Weaver, personal communication). MTT cell survival assay on MCF-7 breast cancer epithelial cells treated with Clitoria extract CE, Mucuna extract or Cheilocostus extract for 72 hours. Survival is expressed as % of control (=100%). *: p<0.04,**: p<0.01, extract to control (student’s t-test). Values represent means ± SD of 6 replicates.
Figure 3-2: Strategy for isolation of natural products showing the approach taken in this study with Indian plant extracts. This chapter covers the steps in the outlined box. Adapted and redrawn from Sarker and Nahar (2012a); Koehn and Carter (2005).
Dilution of crude plant extract
Clitoria
Mucuna
Cheilocostus

85
As supplies of extract were scarce, quantitative assessment of cytotoxicity in this study
was principally performed with the MTT and PrestoBlue cell survival assays in which
replicates can be obtained with small quantities of extract. MTT is a yellow substance
that is reduced by mitochondrial dehydrogenases to a purple formazan precipitate
which needs to be dissolved before measuring. The absorption reading for the
redissolved formazan correlates with the number of live cells, but if cells are killed by a
cytotoxic agent, the remaining cells reduce less of the MTT to formazan and the
absorption reading is lower (Ulukaya et al., 2008). Similarly, PrestoBlue is a blue
resazurin dye that is reduced by mitochondrial activity to a red resorufin whose
absorbance reading corresponds to the number of live cells, but PrestoBlue has the
advantage of not requiring dissolution (Boncler et al., 2014). In both cases the
absorbance of treated cells after a timepoint, usually 24-96 hours, is compared to that
of untreated control cells and an estimated half maximal concentration (IC50) can be
calculated (Cree, 2011). Cell counting assays were also used to support the cell
survival assay results.
Approximately 75% of breast cancers are ER positive (Hoskins et al., 2009), where
blocking the ER pathway with an estrogen antagonist can reduce tumour growth. All
three Indian plant extracts had been shown to induce an estrogenic response in a
yeast based assay for activation of the estrogen receptor (described in Arnold et al.,
1996), and with MCF-7 breast cancer epithelial cells, which are ER positive (Kalita and
Rand-Weaver, personal communication). There is also evidence in the literature for
estrogenic activity in extracts from the plants. Estrogenic activity with a yeast based
estrogen screen was seen in an extract of Clitoria aerial parts (El-Halawany et al.,
2011), and treatment with Mucuna seed extract (Deka and Kalita, 2013) and
Cheilocostus rhizome extract (Najma et al., 2012) induced an increase in mouse
uterine weight, an effect also seen in estrogen controls. In the current study, comparing
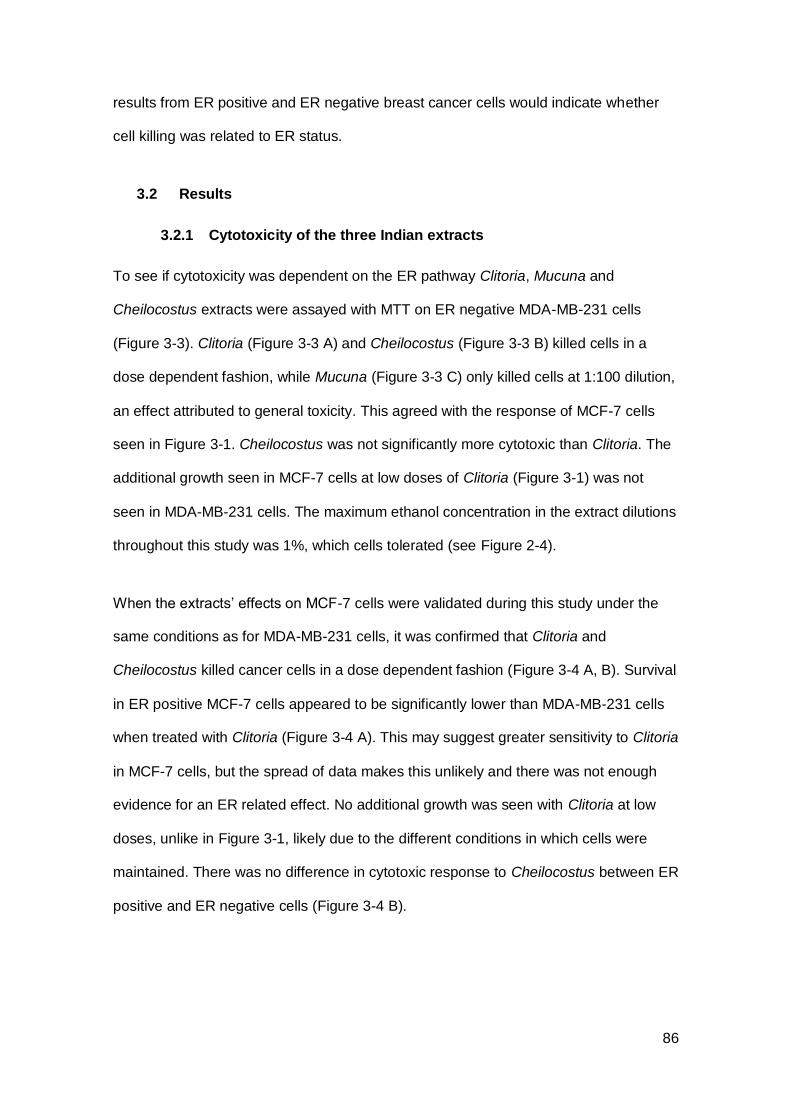
86
results from ER positive and ER negative breast cancer cells would indicate whether
cell killing was related to ER status.
3.2 Results
3.2.1 Cytotoxicity of the three Indian extracts
To see if cytotoxicity was dependent on the ER pathway Clitoria, Mucuna and
Cheilocostus extracts were assayed with MTT on ER negative MDA-MB-231 cells
(Figure 3-3). Clitoria (Figure 3-3 A) and Cheilocostus (Figure 3-3 B) killed cells in a
dose dependent fashion, while Mucuna (Figure 3-3 C) only killed cells at 1:100 dilution,
an effect attributed to general toxicity. This agreed with the response of MCF-7 cells
seen in Figure 3-1. Cheilocostus was not significantly more cytotoxic than Clitoria. The
additional growth seen in MCF-7 cells at low doses of Clitoria (Figure 3-1) was not
seen in MDA-MB-231 cells. The maximum ethanol concentration in the extract dilutions
throughout this study was 1%, which cells tolerated (see Figure 2-4).
When the extracts’ effects on MCF-7 cells were validated during this study under the
same conditions as for MDA-MB-231 cells, it was confirmed that Clitoria and
Cheilocostus killed cancer cells in a dose dependent fashion (Figure 3-4 A, B). Survival
in ER positive MCF-7 cells appeared to be significantly lower than MDA-MB-231 cells
when treated with Clitoria (Figure 3-4 A). This may suggest greater sensitivity to Clitoria
in MCF-7 cells, but the spread of data makes this unlikely and there was not enough
evidence for an ER related effect. No additional growth was seen with Clitoria at low
doses, unlike in Figure 3-1, likely due to the different conditions in which cells were
maintained. There was no difference in cytotoxic response to Cheilocostus between ER
positive and ER negative cells (Figure 3-4 B).
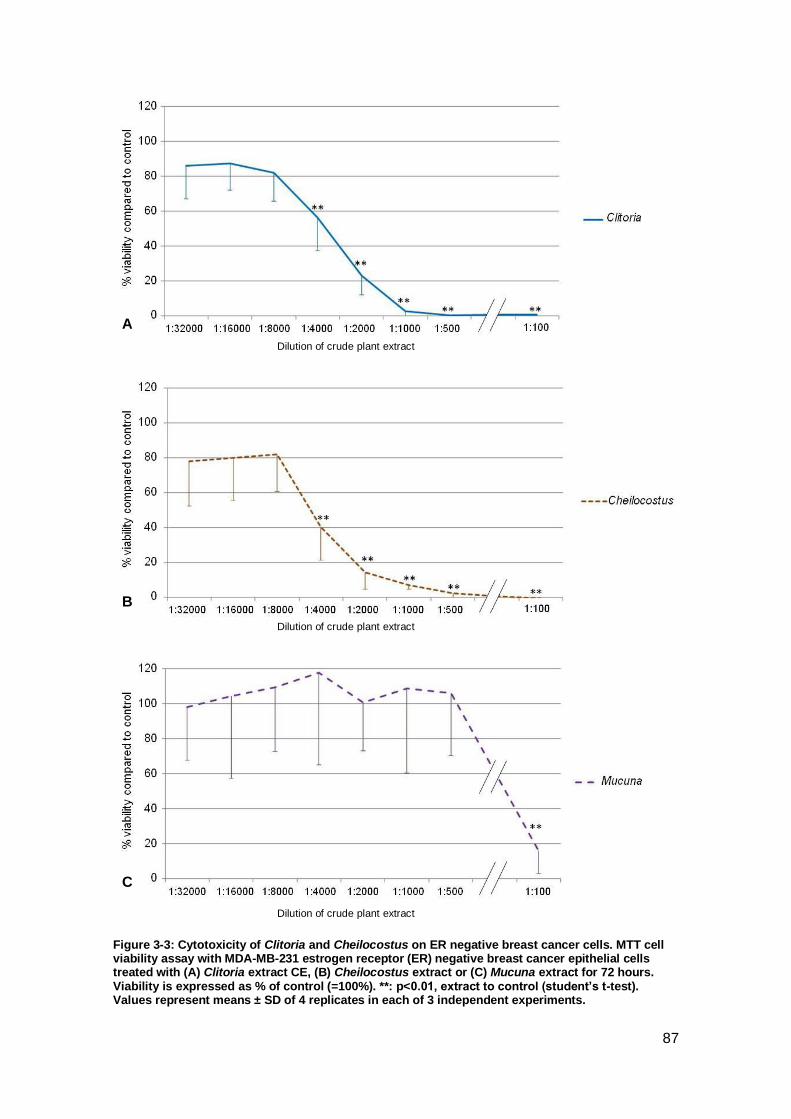
87
Figure 3-3: Cytotoxicity of Clitoria and Cheilocostus on ER negative breast cancer cells. MTT cell viability assay with MDA-MB-231 estrogen receptor (ER) negative breast cancer epithelial cells treated with (A) Clitoria extract CE, (B) Cheilocostus extract or (C) Mucuna extract for 72 hours. Viability is expressed as % of control (=100%). **: p<0.01, extract to control (student’s t-test). Values represent means ± SD of 4 replicates in each of 3 independent experiments.
Dilution of crude plant extract
Dilution of crude plant extract
Dilution of crude plant extract
A
B
C
88
In order to find out whether normal cells would respond similarly to Clitoria to cancer
cells, MCF-10A normal breast epithelial cells and 2DD normal foreskin fibroblasts were
assayed with MTT after treatment with the extracts. Observations on treated cancer
cells suggested an effect was seen after 48 hours, therefore treatment time for the MTT
assays on normal cells was 48 hours. There was considerably higher survival in normal
cells over 48 hours (Figure 3-5 A) than in cancer cells over 72 hours (Figure 3-4 A).
There was no significant difference between the two normal cell lines’ response to
Clitoria. The size of the difference between normal cells treated for 48 hours and
cancer cells treated for 72 hours (Table 3-1) was unexpected and it was hypothesised
that the cytotoxic effect might be related to the number of cell cycles undergone during
the different treatment times.
In contrast, although a dose response was seen in all cell lines treated with
Cheilocostus extract, there was no difference in cytotoxic response between cancer
cells treated for 72 hours and normal cells treated for 48 hours, (Figure 3-4 B, Figure
3-5 B). The MCF-10A data points were consistently above those for 2DD, and at
1:2000 dilution there was a significant difference between the two. This may suggest
greater sensitivity to Cheilocostus in 2DD cells, but the spread of data makes this
unlikely. Cytotoxicity of Cheilocostus appeared not to be related to the cell cycle. There
was no difference in the two cancer cell lines’ responses to Cheilocostus (Figure 3-4
B), indicating ER status does not affect survival.
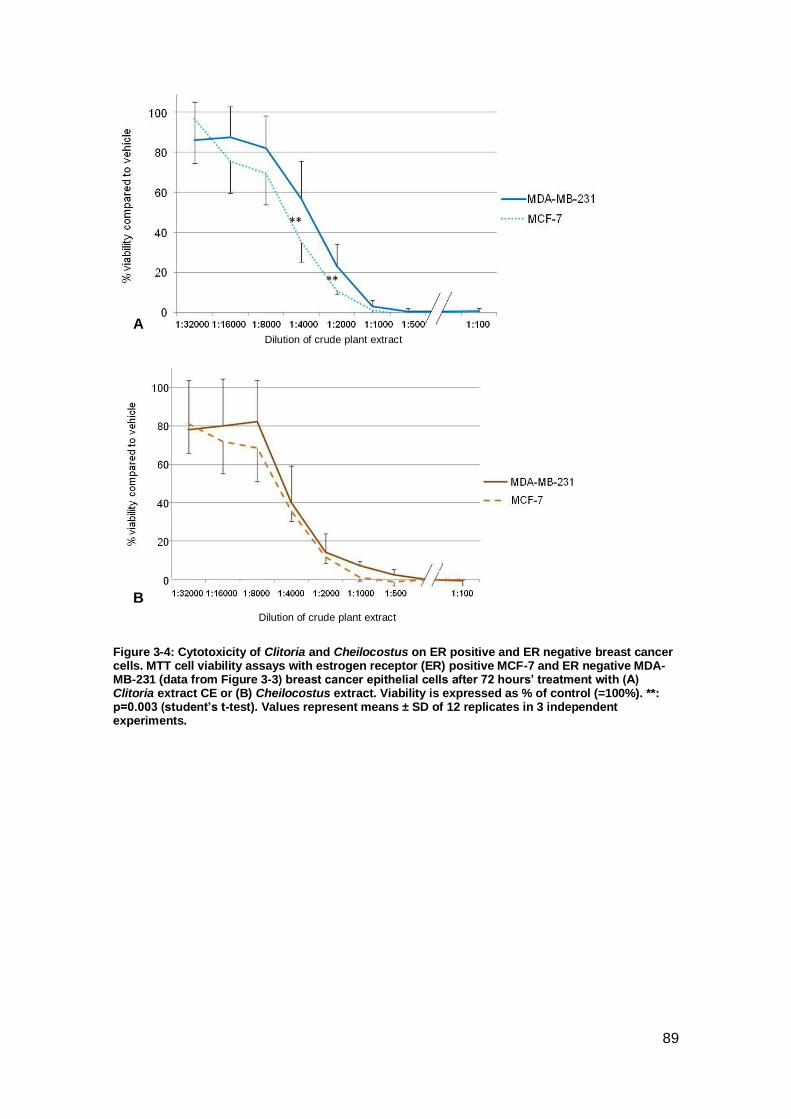
89
Figure 3-4: Cytotoxicity of Clitoria and Cheilocostus on ER positive and ER negative breast cancer cells. MTT cell viability assays with estrogen receptor (ER) positive MCF-7 and ER negative MDA-MB-231 (data from Figure 3-3) breast cancer epithelial cells after 72 hours’ treatment with (A) Clitoria extract CE or (B) Cheilocostus extract. Viability is expressed as % of control (=100%). **: p=0.003 (student’s t-test). Values represent means ± SD of 12 replicates in 3 independent experiments.
A Dilution of crude plant extract
B
Dilution of crude plant extract
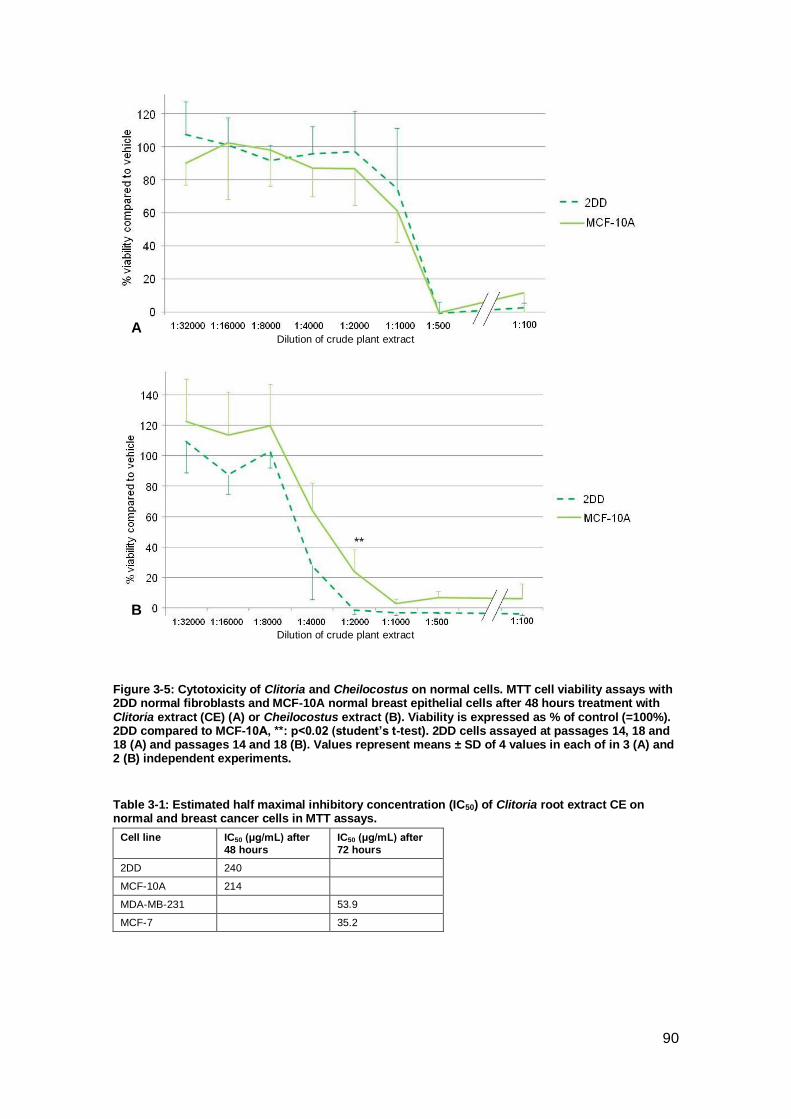
90
Figure 3-5: Cytotoxicity of Clitoria and Cheilocostus on normal cells. MTT cell viability assays with 2DD normal fibroblasts and MCF-10A normal breast epithelial cells after 48 hours treatment with Clitoria extract (CE) (A) or Cheilocostus extract (B). Viability is expressed as % of control (=100%). 2DD compared to MCF-10A, **: p<0.02 (student’s t-test). 2DD cells assayed at passages 14, 18 and 18 (A) and passages 14 and 18 (B). Values represent means ± SD of 4 values in each of in 3 (A) and 2 (B) independent experiments.
Table 3-1: Estimated half maximal inhibitory concentration (IC50) of Clitoria root extract CE on normal and breast cancer cells in MTT assays.
Cell line IC50 (μg/mL) after
48 hours
IC50 (μg/mL) after
72 hours
2DD 240
MCF-10A 214
MDA-MB-231 53.9
MCF-7 35.2
Dilution of crude plant extract
Dilution of crude plant extract
A
B
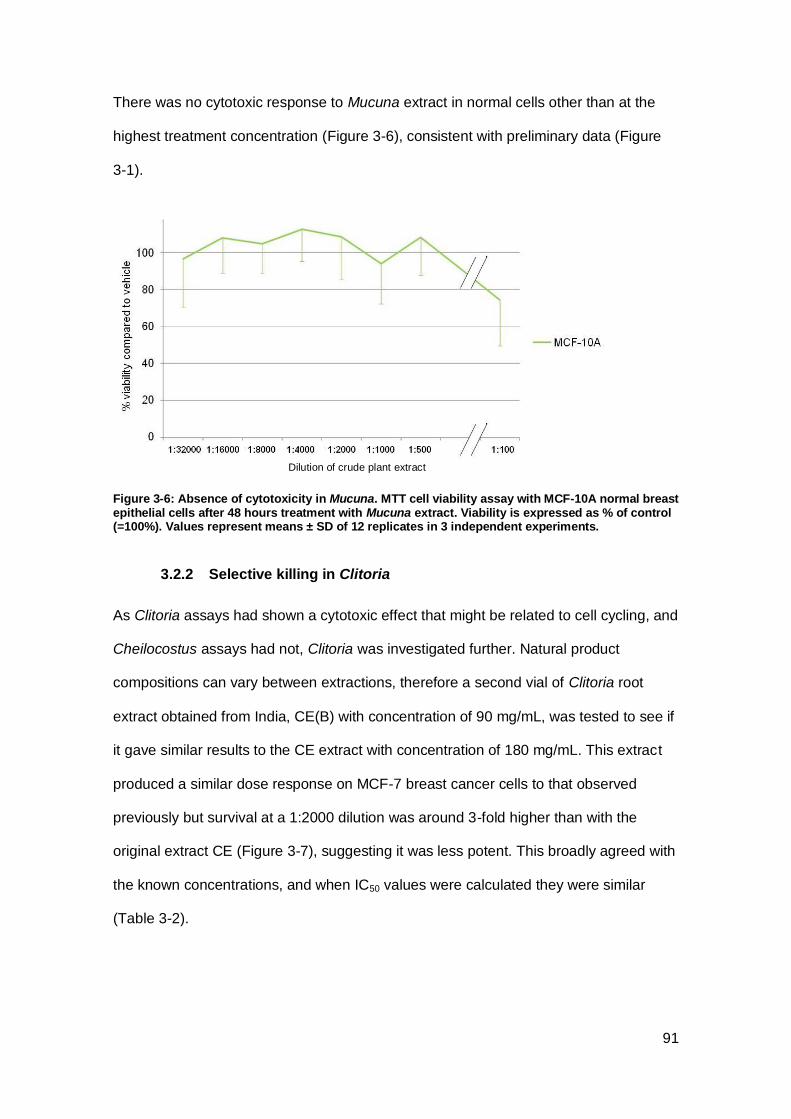
91
There was no cytotoxic response to Mucuna extract in normal cells other than at the
highest treatment concentration (Figure 3-6), consistent with preliminary data (Figure
3-1).
Figure 3-6: Absence of cytotoxicity in Mucuna. MTT cell viability assay with MCF-10A normal breast epithelial cells after 48 hours treatment with Mucuna extract. Viability is expressed as % of control (=100%). Values represent means ± SD of 12 replicates in 3 independent experiments.
3.2.2 Selective killing in Clitoria
As Clitoria assays had shown a cytotoxic effect that might be related to cell cycling, and
Cheilocostus assays had not, Clitoria was investigated further. Natural product
compositions can vary between extractions, therefore a second vial of Clitoria root
extract obtained from India, CE(B) with concentration of 90 mg/mL, was tested to see if
it gave similar results to the CE extract with concentration of 180 mg/mL. This extract
produced a similar dose response on MCF-7 breast cancer cells to that observed
previously but survival at a 1:2000 dilution was around 3-fold higher than with the
original extract CE (Figure 3-7), suggesting it was less potent. This broadly agreed with
the known concentrations, and when IC50 values were calculated they were similar
(Table 3-2).
Dilution of crude plant extract
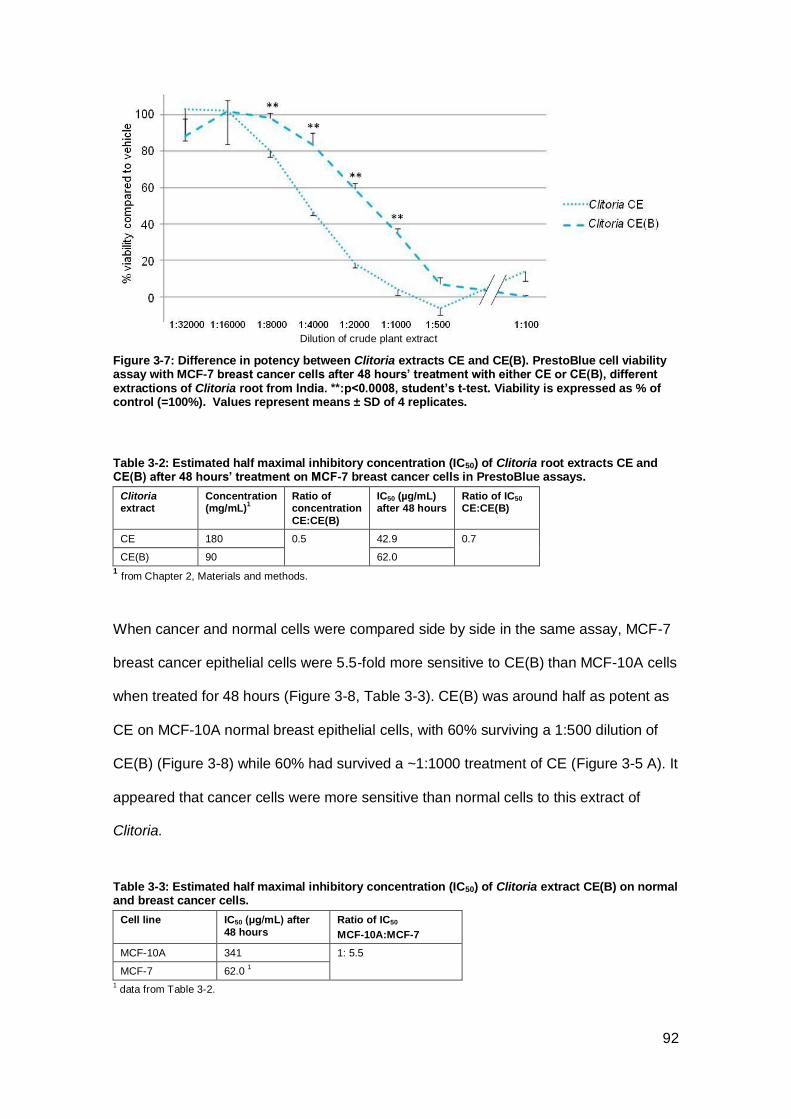
92
Figure 3-7: Difference in potency between Clitoria extracts CE and CE(B). PrestoBlue cell viability assay with MCF-7 breast cancer cells after 48 hours’ treatment with either CE or CE(B), different extractions of Clitoria root from India. **:p<0.0008, student’s t-test. Viability is expressed as % of control (=100%). Values represent means ± SD of 4 replicates.
Table 3-2: Estimated half maximal inhibitory concentration (IC50) of Clitoria root extracts CE and CE(B) after 48 hours’ treatment on MCF-7 breast cancer cells in PrestoBlue assays.
Clitoria extract
Concentration (mg/mL)
1 Ratio of concentration
CE:CE(B)
IC50 (µg/mL) after 48 hours
Ratio of IC50 CE:CE(B)
CE 180 0.5 42.9 0.7
CE(B) 90 62.0
1 from Chapter 2, Materials and methods.
When cancer and normal cells were compared side by side in the same assay, MCF-7
breast cancer epithelial cells were 5.5-fold more sensitive to CE(B) than MCF-10A cells
when treated for 48 hours (Figure 3-8, Table 3-3). CE(B) was around half as potent as
CE on MCF-10A normal breast epithelial cells, with 60% surviving a 1:500 dilution of
CE(B) (Figure 3-8) while 60% had survived a ~1:1000 treatment of CE (Figure 3-5 A). It
appeared that cancer cells were more sensitive than normal cells to this extract of
Clitoria.
Table 3-3: Estimated half maximal inhibitory concentration (IC50) of Clitoria extract CE(B) on normal and breast cancer cells.
Cell line IC50 (μg/mL) after
48 hours
Ratio of IC50
MCF-10A:MCF-7
MCF-10A 341 1: 5.5
MCF-7 62.0 1
1 data from Table 3-2.
Dilution of crude plant extract
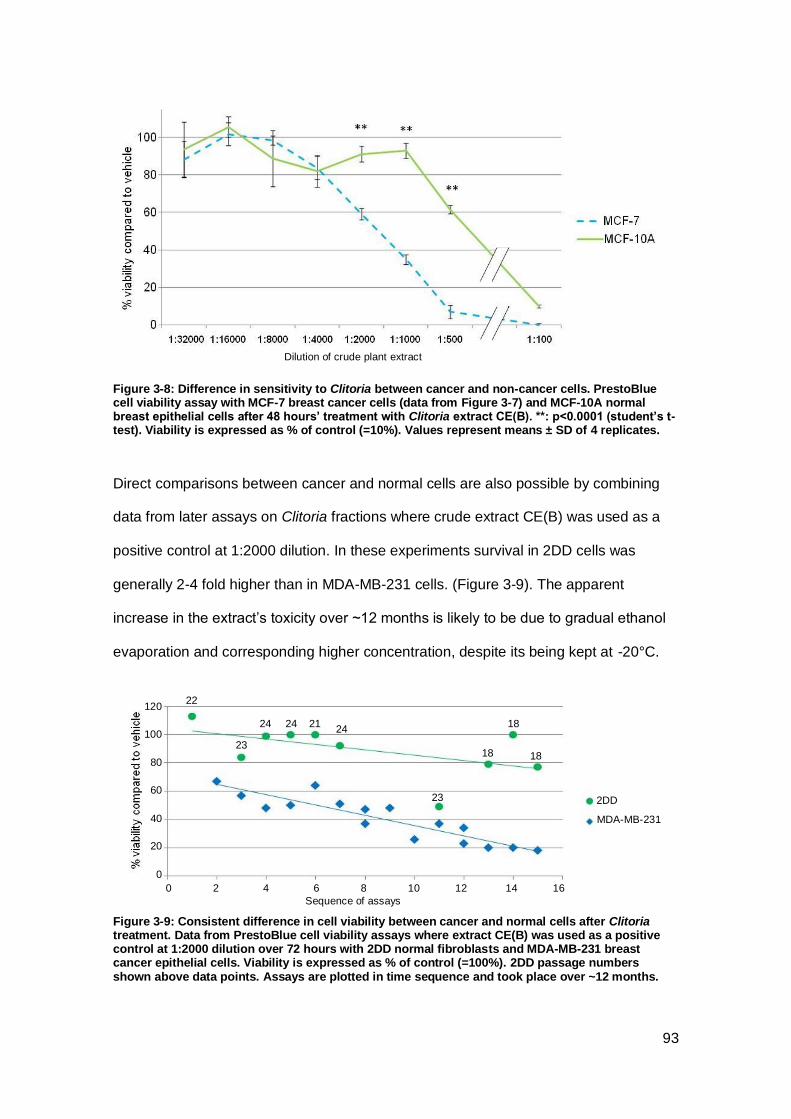
93
Figure 3-8: Difference in sensitivity to Clitoria between cancer and non-cancer cells. PrestoBlue cell viability assay with MCF-7 breast cancer cells (data from Figure 3-7) and MCF-10A normal breast epithelial cells after 48 hours’ treatment with Clitoria extract CE(B). **: p<0.0001 (student’s t-test). Viability is expressed as % of control (=10%). Values represent means ± SD of 4 replicates.
Direct comparisons between cancer and normal cells are also possible by combining
data from later assays on Clitoria fractions where crude extract CE(B) was used as a
positive control at 1:2000 dilution. In these experiments survival in 2DD cells was
generally 2-4 fold higher than in MDA-MB-231 cells. (Figure 3-9). The apparent
increase in the extract’s toxicity over ~12 months is likely to be due to gradual ethanol
evaporation and corresponding higher concentration, despite its being kept at -20°C.
Figure 3-9: Consistent difference in cell viability between cancer and normal cells after Clitoria treatment. Data from PrestoBlue cell viability assays where extract CE(B) was used as a positive control at 1:2000 dilution over 72 hours with 2DD normal fibroblasts and MDA-MB-231 breast cancer epithelial cells. Viability is expressed as % of control (=100%). 2DD passage numbers shown above data points. Assays are plotted in time sequence and took place over ~12 months.
Dilution of crude plant extract
Sequence of assays
80
0
60
40
100
20
120
0 2 4 6 8 10 12 14 16
2DD
MDA-MB-231
24
23
24
22
21 24
23
18
18
18
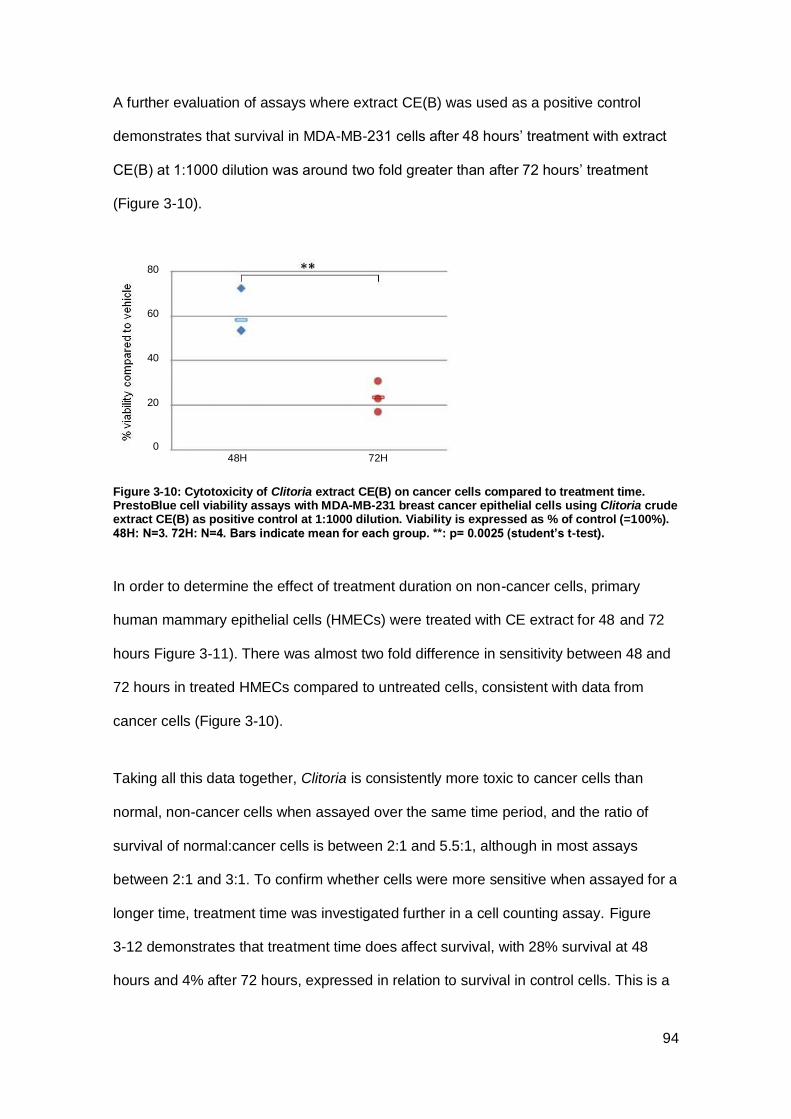
94
A further evaluation of assays where extract CE(B) was used as a positive control
demonstrates that survival in MDA-MB-231 cells after 48 hours’ treatment with extract
CE(B) at 1:1000 dilution was around two fold greater than after 72 hours’ treatment
(Figure 3-10).
Figure 3-10: Cytotoxicity of Clitoria extract CE(B) on cancer cells compared to treatment time. PrestoBlue cell viability assays with MDA-MB-231 breast cancer epithelial cells using Clitoria crude extract CE(B) as positive control at 1:1000 dilution. Viability is expressed as % of control (=100%). 48H: N=3. 72H: N=4. Bars indicate mean for each group. **: p= 0.0025 (student’s t-test).
In order to determine the effect of treatment duration on non-cancer cells, primary
human mammary epithelial cells (HMECs) were treated with CE extract for 48 and 72
hours Figure 3-11). There was almost two fold difference in sensitivity between 48 and
72 hours in treated HMECs compared to untreated cells, consistent with data from
cancer cells (Figure 3-10).
Taking all this data together, Clitoria is consistently more toxic to cancer cells than
normal, non-cancer cells when assayed over the same time period, and the ratio of
survival of normal:cancer cells is between 2:1 and 5.5:1, although in most assays
between 2:1 and 3:1. To confirm whether cells were more sensitive when assayed for a
longer time, treatment time was investigated further in a cell counting assay. Figure
3-12 demonstrates that treatment time does affect survival, with 28% survival at 48
hours and 4% after 72 hours, expressed in relation to survival in control cells. This is a
80
0
60
40
20
48H 72H
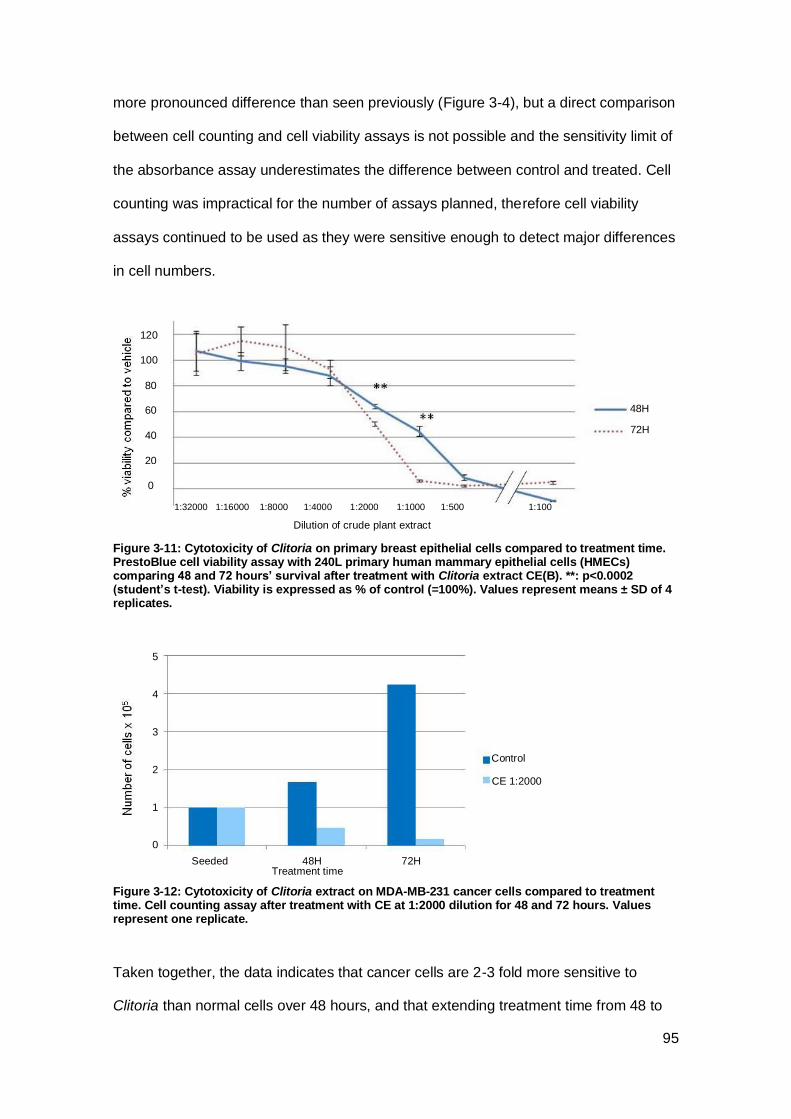
95
more pronounced difference than seen previously (Figure 3-4), but a direct comparison
between cell counting and cell viability assays is not possible and the sensitivity limit of
the absorbance assay underestimates the difference between control and treated. Cell
counting was impractical for the number of assays planned, therefore cell viability
assays continued to be used as they were sensitive enough to detect major differences
in cell numbers.
Figure 3-11: Cytotoxicity of Clitoria on primary breast epithelial cells compared to treatment time. PrestoBlue cell viability assay with 240L primary human mammary epithelial cells (HMECs) comparing 48 and 72 hours’ survival after treatment with Clitoria extract CE(B). **: p<0.0002 (student’s t-test). Viability is expressed as % of control (=100%). Values represent means ± SD of 4 replicates.
Figure 3-12: Cytotoxicity of Clitoria extract on MDA-MB-231 cancer cells compared to treatment time. Cell counting assay after treatment with CE at 1:2000 dilution for 48 and 72 hours. Values represent one replicate.
Taken together, the data indicates that cancer cells are 2-3 fold more sensitive to
Clitoria than normal cells over 48 hours, and that extending treatment time from 48 to
Treatment time
Dilution of crude plant extract
120
100
40
20
0
80
60
1:32000 1:16000 1:8000 1:4000 1:2000 1:1000 1:500 1:100
48H
72H
Seeded 48H 72H
Control
CE 1:2000
5
4
3
2
1
0
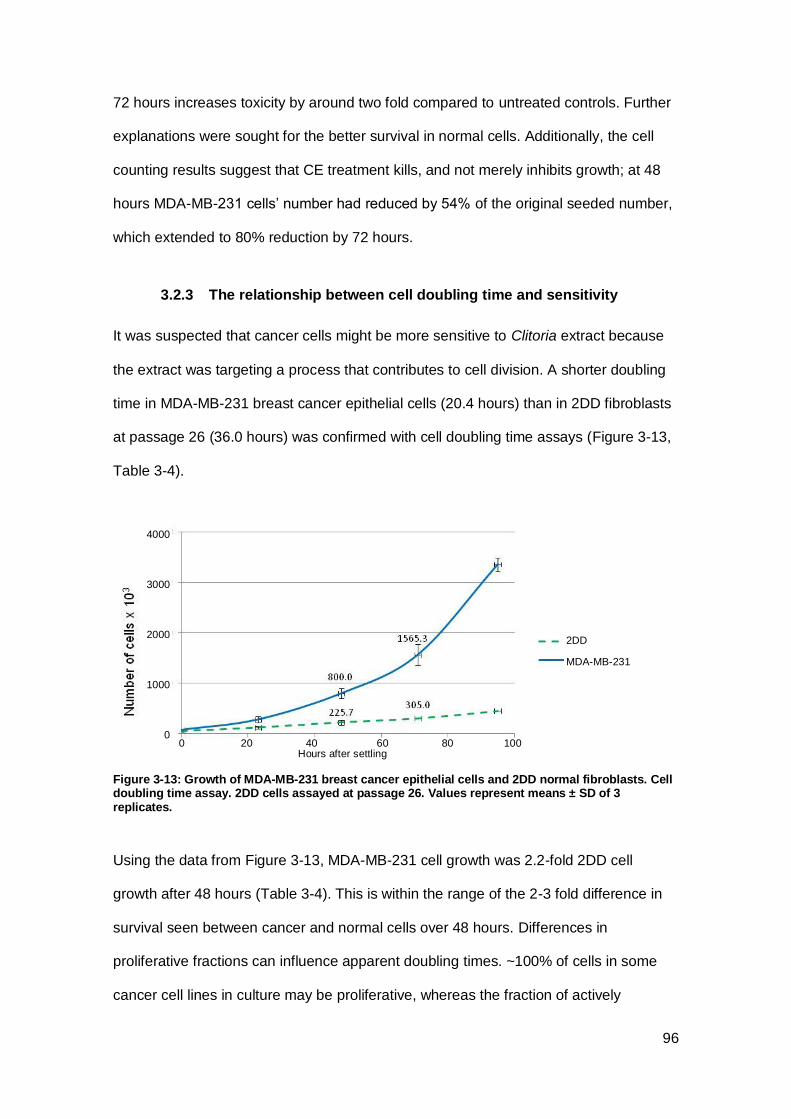
96
72 hours increases toxicity by around two fold compared to untreated controls. Further
explanations were sought for the better survival in normal cells. Additionally, the cell
counting results suggest that CE treatment kills, and not merely inhibits growth; at 48
hours MDA-MB-231 cells’ number had reduced by 54% of the original seeded number,
which extended to 80% reduction by 72 hours.
3.2.3 The relationship between cell doubling time and sensitivity
It was suspected that cancer cells might be more sensitive to Clitoria extract because
the extract was targeting a process that contributes to cell division. A shorter doubling
time in MDA-MB-231 breast cancer epithelial cells (20.4 hours) than in 2DD fibroblasts
at passage 26 (36.0 hours) was confirmed with cell doubling time assays (Figure 3-13,
Table 3-4).
Figure 3-13: Growth of MDA-MB-231 breast cancer epithelial cells and 2DD normal fibroblasts. Cell doubling time assay. 2DD cells assayed at passage 26. Values represent means ± SD of 3 replicates.
Using the data from Figure 3-13, MDA-MB-231 cell growth was 2.2-fold 2DD cell
growth after 48 hours (Table 3-4). This is within the range of the 2-3 fold difference in
survival seen between cancer and normal cells over 48 hours. Differences in
proliferative fractions can influence apparent doubling times. ~100% of cells in some
cancer cell lines in culture may be proliferative, whereas the fraction of actively
Hours after settling
4000
0 20 40 60 80 100
2DD
MDA-MB-231
0
3000
2000
1000
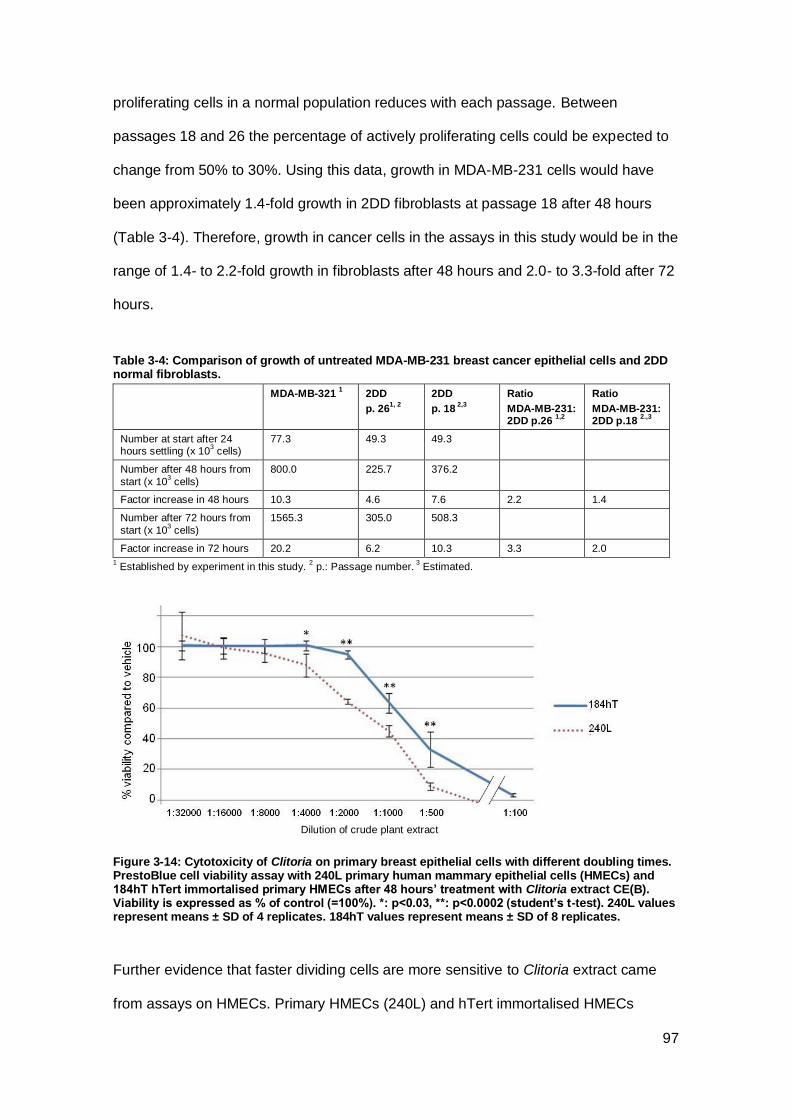
97
proliferating cells in a normal population reduces with each passage. Between
passages 18 and 26 the percentage of actively proliferating cells could be expected to
change from 50% to 30%. Using this data, growth in MDA-MB-231 cells would have
been approximately 1.4-fold growth in 2DD fibroblasts at passage 18 after 48 hours
(Table 3-4). Therefore, growth in cancer cells in the assays in this study would be in the
range of 1.4- to 2.2-fold growth in fibroblasts after 48 hours and 2.0- to 3.3-fold after 72
hours.
Table 3-4: Comparison of growth of untreated MDA-MB-231 breast cancer epithelial cells and 2DD normal fibroblasts.
MDA-MB-321 1
2DD
p. 261, 2
2DD
p. 18 2,3
Ratio
MDA-MB-231: 2DD p.26
1,2
Ratio
MDA-MB-231: 2DD p.18
2.,3
Number at start after 24 hours settling (x 10
3 cells)
77.3 49.3 49.3
Number after 48 hours from
start (x 103 cells)
800.0 225.7 376.2
Factor increase in 48 hours 10.3 4.6 7.6 2.2 1.4
Number after 72 hours from
start (x 103 cells)
1565.3 305.0 508.3
Factor increase in 72 hours 20.2 6.2 10.3 3.3 2.0
1 Established by experiment in this study.
2 p.: Passage number.
3 Estimated.
Figure 3-14: Cytotoxicity of Clitoria on primary breast epithelial cells with different doubling times. PrestoBlue cell viability assay with 240L primary human mammary epithelial cells (HMECs) and 184hT hTert immortalised primary HMECs after 48 hours’ treatment with Clitoria extract CE(B). Viability is expressed as % of control (=100%). *: p<0.03, **: p<0.0002 (student’s t-test). 240L values represent means ± SD of 4 replicates. 184hT values represent means ± SD of 8 replicates.
Further evidence that faster dividing cells are more sensitive to Clitoria extract came
from assays on HMECs. Primary HMECs (240L) and hTert immortalised HMECs
Dilution of crude plant extract
98
(184hT) have doubling times of 20 hours and 36 hours respectively (Yasei, personal
communication). When treated with Clitoria extract CE(B) over 48 hours, the faster
dividing 240L cells were twice as sensitive to the extract as 184hT cells (Figure 3-14).
Although the cell lines were derived from different patients, this data suggests that cells
that divide more quickly are more sensitive to killing by Clitoria extract.
3.2.4 Karotypes of cell lines tested
As this study frequently compared normal fibroblasts and cancer cells, it was
necessary to demonstrate that the normal cell line had not developed instability in
culture. Metaphase spreads from 2DD fibroblasts were compared with a sample from
one of the cancer cell lines, MDA-MB-231. The fibroblasts appeared largely normal
with 90% of the metaphase spreads analysed composed of 46 chromosomes (Table
3-5, Figure 3-15 A). In contrast, the karyotype of the MDA-MB-231 breast cancer cells
ranged from 65 to 221 chromosomes and no two metaphases had the same number
(Table 3-5, Figure 3-15 B). Interestingly, the level of cell death in treated 240L HMECs
(Figure 3-14) was similar to MCF-7 cancer cell death seen in Figure 3-8 with 60% of
cells surviving a treatment of 1:2000 dilution over 48 hours. It was surprising that
HMECs did not survive as well as other non-cancer cells studied, but other cultures of
HMECs are unstable and frequently aneuploid (Romanov et al., 2001) and HMECs
may thus be more comparable to cancer cells in their response. To confirm this with
the cells in this laboratory, HMEC primary epithelial cells were also spread and imaged.
Only 30% of the 240L HMECs analysed had 46 chromosomes (Table 3-5) and many
were dicentric (Figure 3-15 C).
Data was available from other research groups for the two other cell lines used in this
study, MCF-10A and MCF-7 (Table 3-5). It appeared that the MCF-10A immortalised
breast epithelial cells had some abnormalities but were stable with 47 chromosomes in

99
the most recent paper (Marella, 2009). Cells with low levels of abnormality were less
sensitive to Clitoria cytotoxicity than cells with high levels of abnormality.
Table 3-5: Comparison of metaphase spreads of normal and cancer cells.
Cell line Chromosome count data
Mode Range Mean Median N
Established in this study
2DD normal fibroblasts 1 46 46-49 46.8 46 10
HMEC 240L primary human mammary epithelial cells
46 40-46 43.3 44 9
MDA-MB-231 breast cancer
epithelial cells
73 65-221 92.7 73.5 10
Data obtained from other sources
MCF-10A normal breast epithelial cells
48
2 5% tetraploid
2
47 3
No variability
discussed 3
MCF-7 breast cancer
epithelial cells 4
82 66-87
MDA-MB-231 breast cancer epithelial cells
4 64 52-68
1 2DD cells assayed at passage 18.
2 Data extracted from Soule et al. (1990).
3 Data extracted from Marella et al. (2009).
4 Data from ATCC (2014).
Figure 3-15: Example metaphase spreads. A: 2DD normal fibroblasts at passage 18. B: MDA-MB-231 breast cancer epithelial cells. C: 240L primary human mammary epithelial cells (HMEC), suspected dicentric chromosomes arrowed. A, C imaged on Leica DM4000 microscope, 1000x magnification. B imaged on Olympus BX41 microscope, 1000x magnification. Scale bars: 10 μm.
A B C
100
3.3 Discussion
Three Indian extracts were proposed for study after they had been shown to have
cytotoxic activity on cancer cells in preliminary work. In this study, two of the extracts,
Clitoria and Cheilocostus, were seen to be highly cytotoxic to cancer cells while
Mucuna was only cytotoxic at the highest concentration tested. From a series of assays
on two breast cancer cell lines and two normal, non-cancer cell lines, it could be seen
that Clitoria killed cancer cells selectively whereas Cheilocostus was equally cytotoxic
on all cell lines tested. A 2-3 fold difference in cytotoxicity between cancer and normal
cells was consistently observed over a 48 hour treatment time, although this may be an
underestimate as cell viability assays underestimate the reduction in cell growth
compared to controls. Cells were around 2-fold more sensitive when assayed for 72
hours than 48 hours, and this was confirmed with breast cancer cells in a cell counting
assay.
Cells that divide faster were more sensitive to Clitoria treatment. This was seen both in
the comparison between MDA-MB-231 cancer cells and 2DD fibroblasts for which
doubling time was established, and in primary and immortalised HMECs where
doubling times were available from another source. Doubling times for MCF-7 (24
hours (Sutherland et al., 1983)) and MCF-10A cells (17.8 hours (Liu and Lin, 2004))
have been established but cannot be compared because protocols varied. The greater
sensitivity of faster dividing cells to Clitoria suggests that the extract targets cells during
cell division. Cancer cells divide more frequently than normal cells, so over any time
period are more vulnerable to agents that target mitosis. This hypothesis is supported
by the lower survival seen with a longer treatment.
Cancer cells appeared more sensitive to Clitoria than normal cells, yet human primary
mammary epithelial cells (HMECs), chosen as normal controls, were as sensitive as
the breast cancer cell line MCF-7. Although full karyotype analysis was not undertaken,
101
in analysis of 9 spreads, HMECs appeared abnormal, with fewer than 46 chromosomes
on average. HMECs at the passage used are known to have chromosomal
abnormalities despite often being used as an example of normal primary cells
(Romanov et al., 2001). The cancer cells used here were aneuploid. From analysis of
10 spreads MDA-MB-231 breast cancer cells had a modal chromosome count of 73
and wide variation, broadly in agreement with published data, and MCF-7 is known to
be an abnormal cell line with modal number 82 (ATCC, 2014). The two normal cell
lines appeared stable. MCF-10A breast epithelial cells’ karyotypes were seen to be
stable with 48 chromosomes although with some binucleation by the group that was
responsible for their establishment as an immortal non-tumourigenic cell line (Soule et
al., 1990) and more recently to be stable with 47 chromosomes (Marella et al., 2009).
For confirmation, the MCF-7 and MCF-10A stocks held in this laboratory would need to
be analysed. However, it appeared in this study that cancer cell lines were more
sensitive to Clitoria extract and the less abnormal cell lines were less sensitive.
The cell lines were chosen to explore any difference in sensitivity owing to ER status.
Although a p-value of 0.003 between ER positive MCF-7 cells and ER negative MDA-
MB-231 cells was obtained for cell viability in MTT assays, there were no significant
differences that could be borne out by the wide variability in the data. MCF-10A breast
epithelial cells are also ER negative (Soule et al., 1990) and survived better than MDA-
MB-231 cells. ER is generally expressed in skin fibroblasts (Hall and Phillips, 2005)
such as 2DDs, which survived better than MCF-7 cells. HMECs are ER negative (Soule
et al., 1990) yet their response was close to that of MCF-7 cells. There was therefore
no conclusive evidence that the difference in sensitivity to Clitoria was due to ER
status.
Others have found cytotoxic activity when extracts from different parts of Clitoria were
assayed on cells. Neda et al. (2013) found that a methanolic Clitoria flower extract had
102
a dose related cytotoxic effect on breast cancer and ovarian cancer cells, and survival
in normal fibroblasts was around 4-fold that of breast cancer cells. Sarumathy et al.
(2011) saw a dose response with an extract of aerial parts on cervical cancer cells and
Ramaswamy et al. (2011) found a Clitoria leaf extract to be cytotoxic on cervical cancer
and Dalton’s Lymphoma cells. These findings are broadly in agreement with the current
study.
Two methods were used to assess cytotoxicity: cell survival assays and cell counting
assays. When the same Clitoria treatment was compared using both techniques,
results appeared different. Survival in a cell counting assay appeared considerably
lower (4% of controls) than in MTT assays (23% of controls) after MDA-MB-231 cells
were treated for 72 hours with the same dilution of Clitoria, which demonstrates how
results can vary between techniques. Angst et al. (2013) used the same techniques to
study the effect of quercetin on pancreatic cancer cells and obtained widely differing
results where survival in MTT assays was consistently higher than in cell counting. The
cell survival assays give a percentage survival result for treated cells compared to an
untreated control, based on the amount of reduced dye, which is read as absorbance.
Because absorbance in control wells at the start of these cell survival assays was very
near maximum for the range of sensitivity of the assay, increases in control cell
numbers were not reflected in higher absorbances at the end of the assay. Therefore,
the difference between controls and treated cells at the end of the assay is likely to be
underestimated. Cell killing may be greater than these figures indicate and the
difference between cancer and non-cancer cells may also be underestimated by these
figures. In contrast, in cell counting, the number of live cells is calculated from a
counted sample for treated and control cells, which gives a truer indication of the effect
of treatment on numbers of live cells.
103
MTT is used widely for cell proliferation assays (Cree, 2011), for instance by
deGraffenried et al. (2004) in a study of mTOR inhibition on tamoxifen resistant MCF-7
breast cancer cells, and Fan et al. (1995) on sensitizing breast cancer cells to cisplatin
and pentoxifylline. Other methods based on mitochondrial activity are also used,
including PrestoBlue, for example by Sandi et al. (2014) when assessing susceptibility
to oxidative stress in mouse fibroblasts. Microplate assays based on dye that can be
read with fluorescence such as CyQuant which binds to nucleic acid may be more
sensitive and have greater range than absorbance based assays (Jones et al., 2001;
Cree, 2011). CyQuant was used by Olesen et al. (2008) in testing the small molecule
CHS-28 for cytotoxicity on small cell lung cancer cells. Equipment for fluorescence
based assays was not available to this study.
For cell survival assays conducted in microplates, absorbance can be read
simultaneously for many replicates whereas cell counting is not feasible for many
replicates. Boulay et al. (2005) used cell counting for assessing cell survival in MCF-7
breast cancer cells after treatment with mTOR inhibitor RAD001 but the results are
limited to three treatments with three replicates, whereas their cell proliferation assays
with automated plate reading include results from serial dilution assays with 9 dilutions.
Dye exclusion based on the impermeability of live cells to a dye such as Trypan blue,
may be used with counting to distinguish live from dead cells (Longo-Sorbello et al.,
2005). Countess, a semi-automated cell counter, was used with Trypan blue by Kim et
al. (2014) to produce counts of live mesenchymal stem cells transfected with
microRNAs, but using Countess slides for counting was also not feasible with the
number of replicates in this study.
Flow cytometry offers a fully automated means of counting cells (Shapiro, 2005) and
information about their response to treatments can be gathered at the same time by
means such as annexin V staining to indicate apoptosis, or DNA content to show cell
104
cycle stage, as performed by Angst et al. (2013) on quercetin treated pancreatic cancer
cells. However, it requires greater quantities of treated cells than cell survival assays,
and method development is necessary. Flow cytometry was not attempted due to
limitations on the supply of extract.
Clonogenic assays, in which cells are seeded at low density, treated, and allowed to
grow over a time period normally of 7-10 days, after which the number of colonies is
scored, are sensitive over a wide range (Pomp et al., 1996) and although they are
primarily a cell growth assay they are used by many groups as a longer term
cytotoxicity assay. For instance, Siddique et al. (2011) tested the long-term effects of
lupeol on prostate cancer cells over 14 days in a clonogenic assay and Stehn et al.
(2013) used clonogenic assays to confirm that knockdown of one gene did not impact
survival. However, clonogenic assays are not suitable for all cell lines, and, like MTT,
they do not differentiate between growth inhibition and cell death, as absence of colony
formation could be due to either (Hoffman, 1991). Besides, clonogenic assays could
not be used in this study because they require a large quantity of bioactive agent for
treatments which was not available in this study.
Theoretically, cell survival assays do not differentiate between cell growth inhibition and
cell death. However, in this study, initial seeding density was selected so that
absorbance was near the top of the range for the sensitivity of the assay at the point
when cells were treated. Consequently, any absorbance reading that is lower than the
control after 48 or 72 hours indicates cell death. Therefore these cell survival assay
results show cell death and are confirmed by the cell counting assay. This approach
agrees with Tyring (2012) who used cell counting after cell survival assays to confirm
cell killing. The same cell density as in the current study was used by Prabhakaran et
al. (2012) for evaluating cytotoxicity of nickel complexes on cancer cell lines.

105
With time (after around one year of experiments) bacterial contamination was noted in
Clitoria extract CE(B). Initially this was thought to be contamination introduced during
the project. Later, extractions made from Indonesian and UK Clitoria root (refer to
Chapter 6 for full details) were also discovered to be contaminated. The possibility of
endophytic bacteria including rhizobia, closely associated with nitrogenous plant root
cells, being co-extracted, was considered. A number of methods were tried to remove
the bacteria, which were tolerating an ethanolic extract of pH 3-4: Filtering twice with
0.2 µm filter; treatment with antibiotics penicillin, streptomycin, gentamicin and
amphotericin; and heating to 70°C for one hour. After this, use of the crude extracts
was limited, although assays with fractions continued. No bacterial infection was seen
in the fractions or in cells treated with the fractions.
Rhizobia are nitrogenous, endophytic bacteria which form symbiotic relationships that
are often specific to a small number of plant species (Mylona et al., 1995). They are
Gram-negative (Franche et al., 2009) and non spore-forming (Graham et al., 1963).
They respond to flavonoid chemoattractant signals from legume plant roots by moving
towards the root (Dharmatilake and Bauer, 1992), entering plant cells and expressing
Nod factors which cause the plant to initiate the formation of root nodules, where the
bacterial enzyme nitrogenase catalyses the fixation of nitrogen (Mylona et al., 1995).
There is no evidence that bacteria can produce flavonoids, which are thought to be
exclusively of plant origin (Pinheiro and Justino, 2012). Rhizobia can respire
anaerobically as well as aerobically (Daniel et al., 1980) and a very small percentage
are persister cells, which can resist desiccation and antibiotics (Denison and Kiers,
2011). In laboratory conditions some species have been shown to survive 60°C for 6
hours (Kulkarni and Nautiyal, 1999) and some are acid tolerant to pH 4.0 (Correa and
Barneix, 1997). Without DNA characterisation it is not possible to confirm the species
of the bacterial contaminant, but their appearance after one year of using the legume
extract and their persistence suggest that they may be rhizobia. If work were to

106
continue with Clitoria crude extract, methods for obtaining sterilised extracts without
affecting bioactivity would be required.
3.4 Next steps
Clitoria, as the extract with a differential killing effect, was considered the most
promising of the three Indian medicinal extracts for anti-cancer activity. Subsequent
stages of the work concerned fractionation and identification of the bioactive fraction
(see Chapter 4) and elucidation of the cytotoxic mechanism (see Chapter 5).
107
Chapter 4 High Performance Liquid Chromatography fractionation of
extracts
4.1 Introduction
Practitioners of traditional medicine systems administer plant extracts which are
complex mixtures of compounds, and Traditional Chinese Medicine (TCM) formulations
are often combinations of more than one extract, but quality control on such mixtures is
challenging (Efferth et al., 2007). This is a recognised problem in TCM, where
substantial effort is going into ways of improving standardisation and consistency in
TCM products, for example using High Performance Liquid Chromatography (HPLC)
for fingerprinting, whereby a number of marker compounds are identified from peaks in
traces for each component and used to compare formulations (Yang et al., 2014).
Alternative and complementary treatments in the USA and Europe are often made from
natural product extracts or mixtures. Natural product medicines are sold in the USA as
dietary supplements with legally specified controls on the claims they can make,
including a statement that the U. S. Food and Drug Administration (FDA) has not
validated the product for safety or efficacy (Bent and Ko, 2004). One example is Artrex,
a mixture of four Ayurvedic plant extracts which is sold in the USA in capsule form as a
food supplement (Patwardhan, 2012). In the USA, quality control is the responsibility of
the manufacturers, some of whom use chemical fingerprinting techniques to monitor
levels of what are thought to be the active agents, and some standardise their product
by blending several batches (Bent and Ko, 2004). However, in a survey of 25 ginseng
products on sale in the USA, the levels of the active ingredients, ginsenosides and
eleutherosides, varied by 15 to 36 and 43 to 200-fold in capsules and liquids
respectively (Harkey et al., 2001). Heavy metals which are added to some Ayurvedic
medicines have caused cases of poisoning in the UK from products bought in India
(Dargan et al., 2008) and in a survey of 175 Ayurvedic medicines on sale via the
internet from American suppliers, 20% contained lead, arsenic or mercury (Saper et al.,
108
2008). Batches of PC-SPES, a treatment for prostate cancer based on TCM herbs and
manufactured in the USA, were found to be adulterated with Western drugs including
the anticoagulant drug warfarin (Ko et al., 2003), and PC-SPES has been withdrawn
(Cassileth and Deng, 2004).
Western medicine treatments are based on single bioactive compounds, not crude
extracts or formulations from natural products, as without a standard product, clinical
outcomes are unpredictable, therefore it is essential with a natural product extract to
isolate and identify the active compound which will become the lead compound in drug
discovery (Zheng et al., 2013). During lead optimization, the compound is evaluated
and optimised for absorption, distribution, metabolism, excretion, and toxicity and
shown to be safe and effective, without which data the drug cannot progress to clinical
trials or gain approval from regulatory bodies (Corson and Crews, 2007). Polyphenon E
is a rare example where the FDA has approved a combination of compounds, but this
is a defined mixture of four green tea catechins and not a complex natural product
extract (Chen et al., 2008). Polyphenon E was approved in 2006 as an ointment for
genital warts (Chen et al., 2008) and is being investigated for treatment of cancers
including neuroblastoma (Santilli et al., 2013).
Bioassay-led analysis of a natural product extract to identify the active compound is
performed by chemical separation using one of the available chromatography methods
(Harvey et al., 2015). The crude extract is separated into fractions with less complexity
than the whole extract according to the time taken to elute, and fractions are tested for
bioactivity in an assay relevant to disease (Harvey et al., 2015). Before fractionation,
extracts can be pre-processed to remove classes of compounds and reduce the
complexity of the chromatogram, for instance partitioning in hexane to remove lipids
(Jones and Kinghorn, 2012). Bioassay results inform the selection of fractions for
further iterative fractionation until a pure substance is obtained (Sarker and Nahar,
109
2012a). Following this methodology, compounds with bioactivity are prioritised for
investigation, leading to quicker, more efficient and more cost-effective hit discovery of
candidate compounds for drug candidates (Harvey et al., 2015).
The chemotherapy drugs camptothecin, the vinca alkaloids and paclitaxel were all
identified in bioassay-led fractionation (Wall and Wani, 1995). In the discovery of
camptothecin, wood and bark of Camptotheca acuminata were extracted in ethanol
and found to be effective in a mouse leukemia life prolongation assay model by Wall
and Wani (1995). The isolation and purification of camptothecin required several steps.
After extractions in heptane and chloroform, and fractionation in counter current
chromatography,11 fractions were obtained, of which 6 had activity on human oral
carcinoma cells (Wall and Wani, 1995). Camptothecin was crystallised from the 6
recombined fractions (Wall and Wani, 1995).
In this study a strategy for isolation and purification was followed, based on a
conventional bioassay-guided approach (Figure 4-1). Several chromatographic
techniques were considered for analysis and fractionation. Thin Layer Chromatography
(TLC) confirmed that Clitoria, Mucuna and Cheilocostus were mixtures of many
different visible and UV active components. However, TLC requires method
development to find the best solvent system for separation, and the supply of extract
was not sufficient. Gas Chromatography (GC) was trialled, but no significant peaks
were detected, which was attributed to the compounds not being volatile at the
temperature used. It was decided that HPLC, a sensitive and non-destructive technique
for separating natural products that requires small quantities for analysis and can easily
be scaled up for fractionation (Wolfender, 2009), would be the best technique with the
limited supply of extract. In liquid chromatography, solutes in solvent (liquid phase) are
passed through a column packed with particles (stationary phase), and are separated
based on the time taken to elute, which depends on their affinity to the particles (Skoog
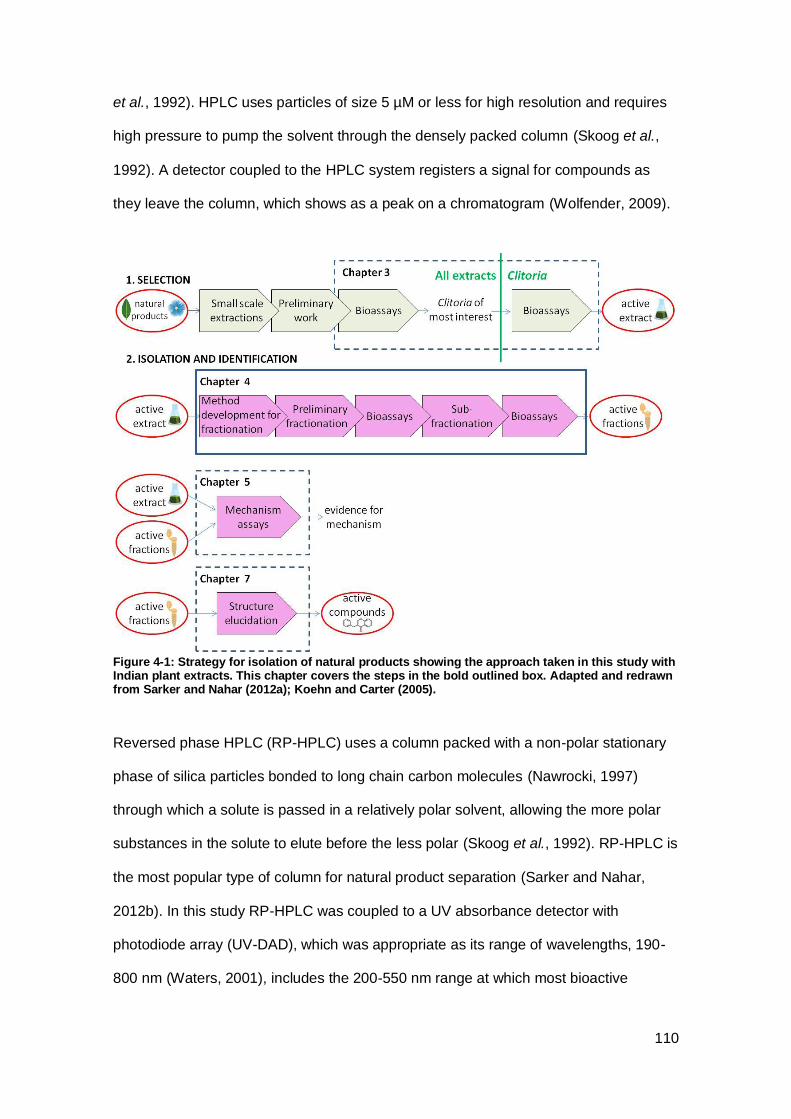
110
et al., 1992). HPLC uses particles of size 5 µM or less for high resolution and requires
high pressure to pump the solvent through the densely packed column (Skoog et al.,
1992). A detector coupled to the HPLC system registers a signal for compounds as
they leave the column, which shows as a peak on a chromatogram (Wolfender, 2009).
Figure 4-1: Strategy for isolation of natural products showing the approach taken in this study with Indian plant extracts. This chapter covers the steps in the bold outlined box. Adapted and redrawn from Sarker and Nahar (2012a); Koehn and Carter (2005).
Reversed phase HPLC (RP-HPLC) uses a column packed with a non-polar stationary
phase of silica particles bonded to long chain carbon molecules (Nawrocki, 1997)
through which a solute is passed in a relatively polar solvent, allowing the more polar
substances in the solute to elute before the less polar (Skoog et al., 1992). RP-HPLC is
the most popular type of column for natural product separation (Sarker and Nahar,
2012b). In this study RP-HPLC was coupled to a UV absorbance detector with
photodiode array (UV-DAD), which was appropriate as its range of wavelengths, 190-
800 nm (Waters, 2001), includes the 200-550 nm range at which most bioactive
111
substances from natural sources absorb UV radiation, and the stored UV data can be
analysed by peak distribution to assess purity (Wolfender, 2009).
The conventional approach to HPLC separation when the target compounds are
unknown is to begin with method development in analytical HPLC to obtain a
chromatogram with well resolved peaks, for which a very small quantity of sample is
sufficient (Sarker and Nahar, 2012a). Once analytical HPLC is satisfactory, coarse
fractions with similar polarities are collected and evaluated in bioassays, as performed
by Koehbach et al. (2013) on an extract of Oldenlandia affinis. Sections of the
chromatogram can then be excluded from further testing and the broad bioactive
fractions are subfractionated into less complex fractions, normally by running the
fraction through the column again with a modified solvent gradient (Harvey et al.,
2015). With a preparative column, a larger quantity of extract can be injected, resulting
in more concentrated fractions (Latif and Sarker, 2012). At any fractionation stage the
activity may be lost, either as it is a combinatory effect of two compounds widely
separated on the chromatogram, or because fractions that are too small can dilute the
target compound beyond the point at which bioactivity is seen (Harvey et al., 2015). For
example, Orhan and Sener (2003) partitioned extracts from Amaryllidaceae bulbs with
anticholinesterase activity to isolate the alkaloid fraction, which retained the activity.
However, when 8 alkaloids were isolated, identified and tested in bioassays, activity
per µg of material was halved, prompting the authors to attribute the alkaloid fraction
activity to a synergistic effect of more than one alkaloid (Orhan and Sener, 2003).
Clitoria was the most promising of the three extracts that are the subject of this study
due to the selectivity of its crude extract in bioassays, and it was prioritised for
separation. The aim was to fractionate as finely as possible so that the bioactive
fractions were pure enough to be presented for structural elucidation. Methods for
separation for Mucuna and Cheilocostus were established at the same time as for
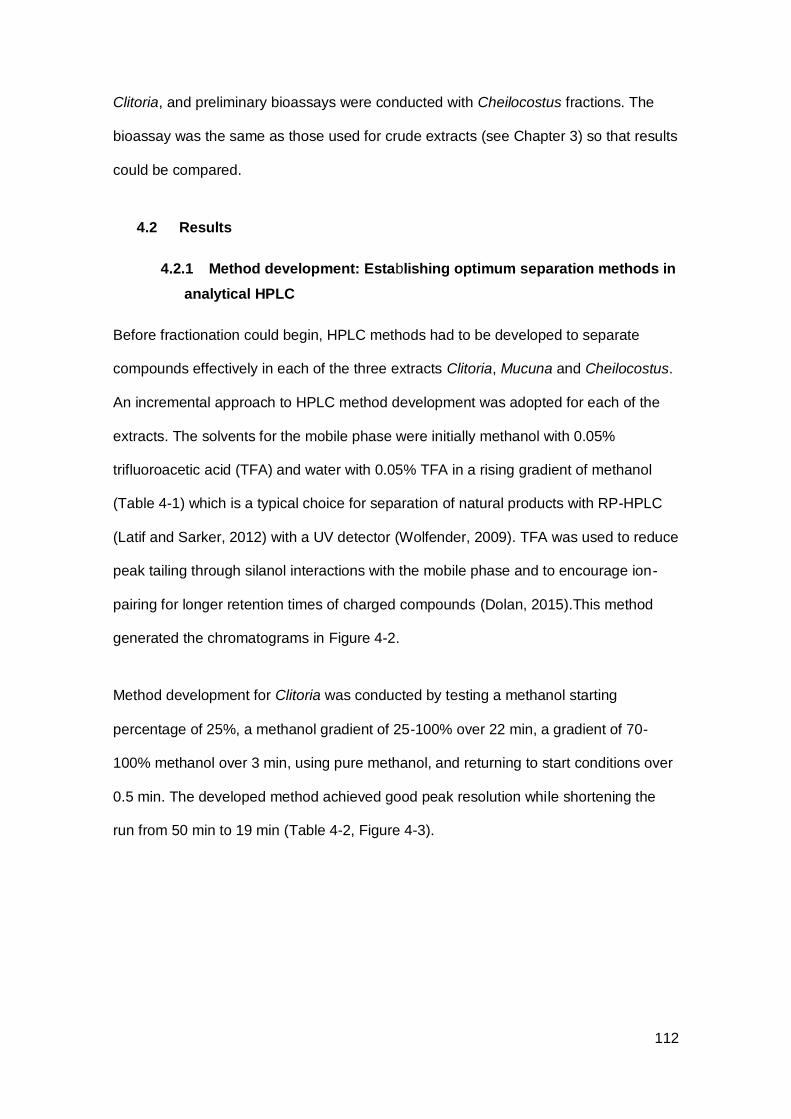
112
Clitoria, and preliminary bioassays were conducted with Cheilocostus fractions. The
bioassay was the same as those used for crude extracts (see Chapter 3) so that results
could be compared.
4.2 Results
4.2.1 Method development: Establishing optimum separation methods in
analytical HPLC
Before fractionation could begin, HPLC methods had to be developed to separate
compounds effectively in each of the three extracts Clitoria, Mucuna and Cheilocostus.
An incremental approach to HPLC method development was adopted for each of the
extracts. The solvents for the mobile phase were initially methanol with 0.05%
trifluoroacetic acid (TFA) and water with 0.05% TFA in a rising gradient of methanol
(Table 4-1) which is a typical choice for separation of natural products with RP-HPLC
(Latif and Sarker, 2012) with a UV detector (Wolfender, 2009). TFA was used to reduce
peak tailing through silanol interactions with the mobile phase and to encourage ion-
pairing for longer retention times of charged compounds (Dolan, 2015).This method
generated the chromatograms in Figure 4-2.
Method development for Clitoria was conducted by testing a methanol starting
percentage of 25%, a methanol gradient of 25-100% over 22 min, a gradient of 70-
100% methanol over 3 min, using pure methanol, and returning to start conditions over
0.5 min. The developed method achieved good peak resolution while shortening the
run from 50 min to 19 min (Table 4-2, Figure 4-3).
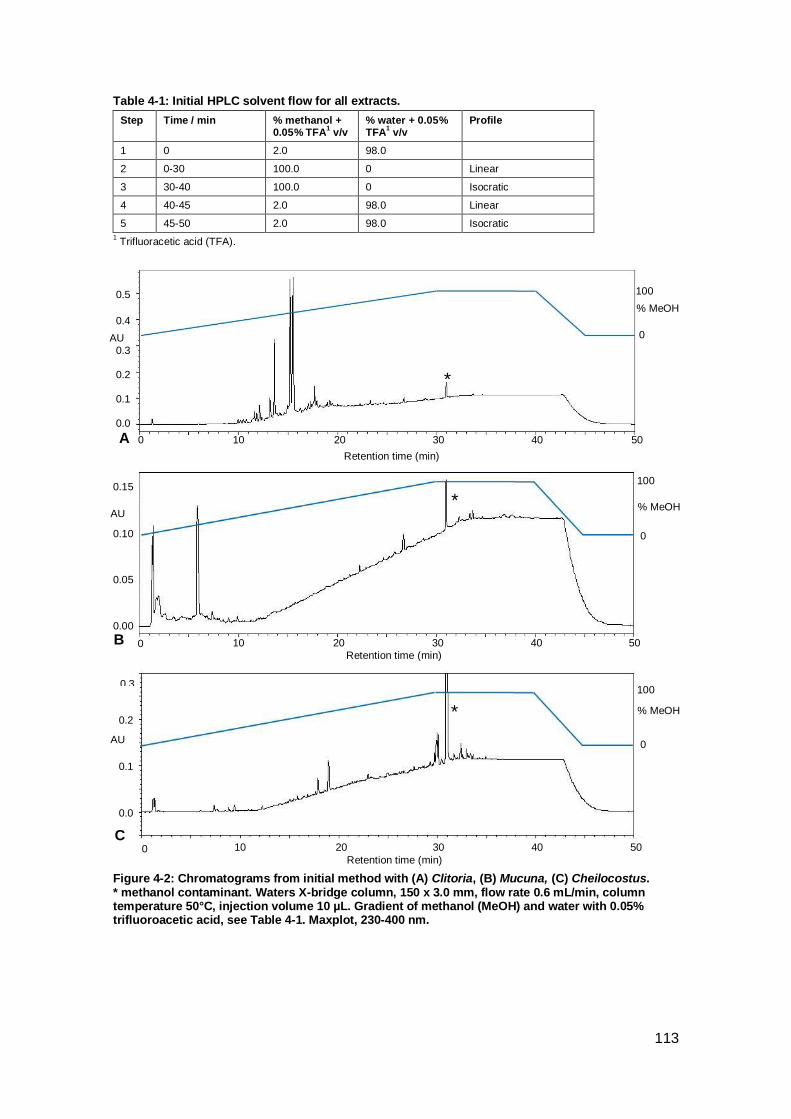
113
Table 4-1: Initial HPLC solvent flow for all extracts.
Step Time / min % methanol + 0.05% TFA
1 v/v
% water + 0.05% TFA
1 v/v
Profile
1 0 2.0 98.0
2 0-30 100.0 0 Linear
3 30-40 100.0 0 Isocratic
4 40-45 2.0
98.0 Linear
5 45-50
2.0 98.0 Isocratic
1 Trifluoracetic acid (TFA).
Figure 4-2: Chromatograms from initial method with (A) Clitoria, (B) Mucuna, (C) Cheilocostus. * methanol contaminant. Waters X-bridge column, 150 x 3.0 mm, flow rate 0.6 mL/min, column temperature 50°C, injection volume 10 µL. Gradient of methanol (MeOH) and water with 0.05% trifluoroacetic acid, see Table 4-1. Maxplot, 230-400 nm.
0.4
100
% MeOH
0
0.0
0.5
0.3
0.2
0.1
0.15
0.05
0.00
B
C
*
*
*
AU
0.10
10 20 0 50
Retention time (min)
30 40
100
% MeOH
0
10 20 0 50
Retention time (min)
30 40
AU
0.3
0.1
0.0
0.2
100
% MeOH
0
10 20 0 50
Retention time (min)
30 40
AU
A
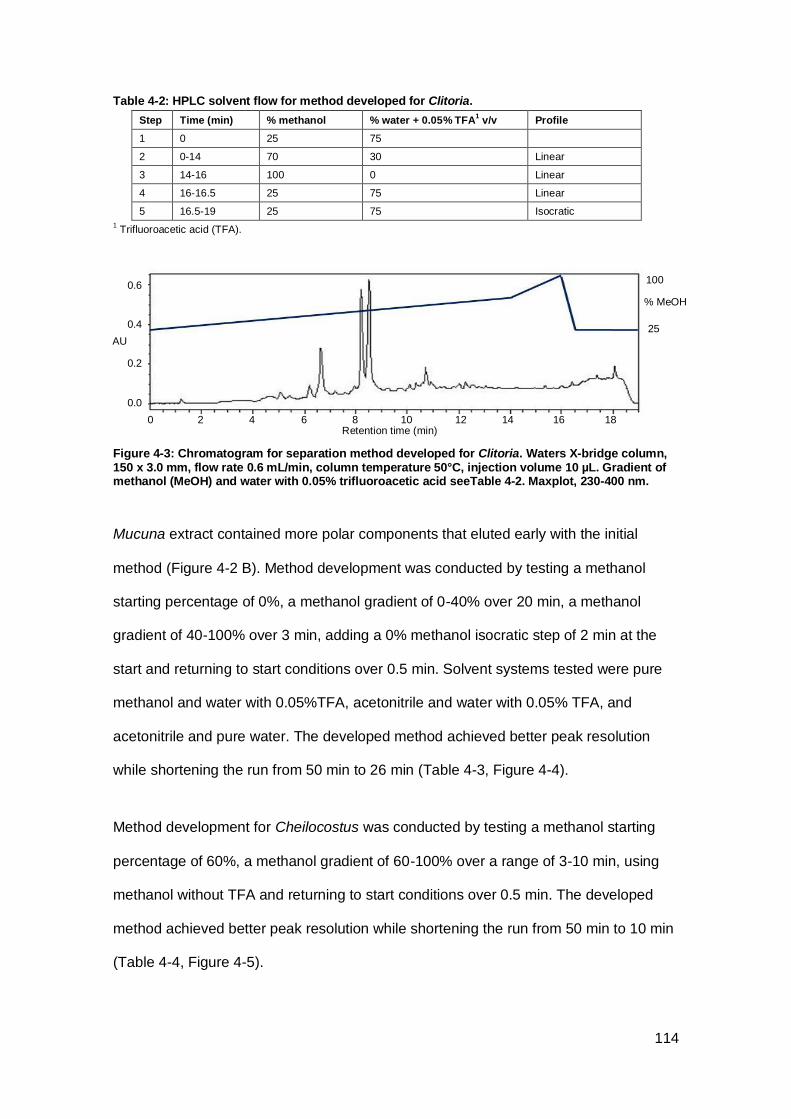
114
Table 4-2: HPLC solvent flow for method developed for Clitoria.
Step Time (min) % methanol
% water + 0.05% TFA1 v/v
Profile
1 0 25 75
2 0-14 70 30 Linear
3 14-16 100 0 Linear
4 16-16.5
25 75 Linear
5 16.5-19
25 75 Isocratic
1 Trifluoroacetic acid (TFA).
Figure 4-3: Chromatogram for separation method developed for Clitoria. Waters X-bridge column, 150 x 3.0 mm, flow rate 0.6 mL/min, column temperature 50°C, injection volume 10 µL. Gradient of methanol (MeOH) and water with 0.05% trifluoroacetic acid seeTable 4-2. Maxplot, 230-400 nm.
Mucuna extract contained more polar components that eluted early with the initial
method (Figure 4-2 B). Method development was conducted by testing a methanol
starting percentage of 0%, a methanol gradient of 0-40% over 20 min, a methanol
gradient of 40-100% over 3 min, adding a 0% methanol isocratic step of 2 min at the
start and returning to start conditions over 0.5 min. Solvent systems tested were pure
methanol and water with 0.05%TFA, acetonitrile and water with 0.05% TFA, and
acetonitrile and pure water. The developed method achieved better peak resolution
while shortening the run from 50 min to 26 min (Table 4-3, Figure 4-4).
Method development for Cheilocostus was conducted by testing a methanol starting
percentage of 60%, a methanol gradient of 60-100% over a range of 3-10 min, using
methanol without TFA and returning to start conditions over 0.5 min. The developed
method achieved better peak resolution while shortening the run from 50 min to 10 min
(Table 4-4, Figure 4-5).
0.4
100
% MeOH
25
0.0
0.6
AU
0.2
2 18 6 12 4 14 0 16 10 8 Retention time (min)
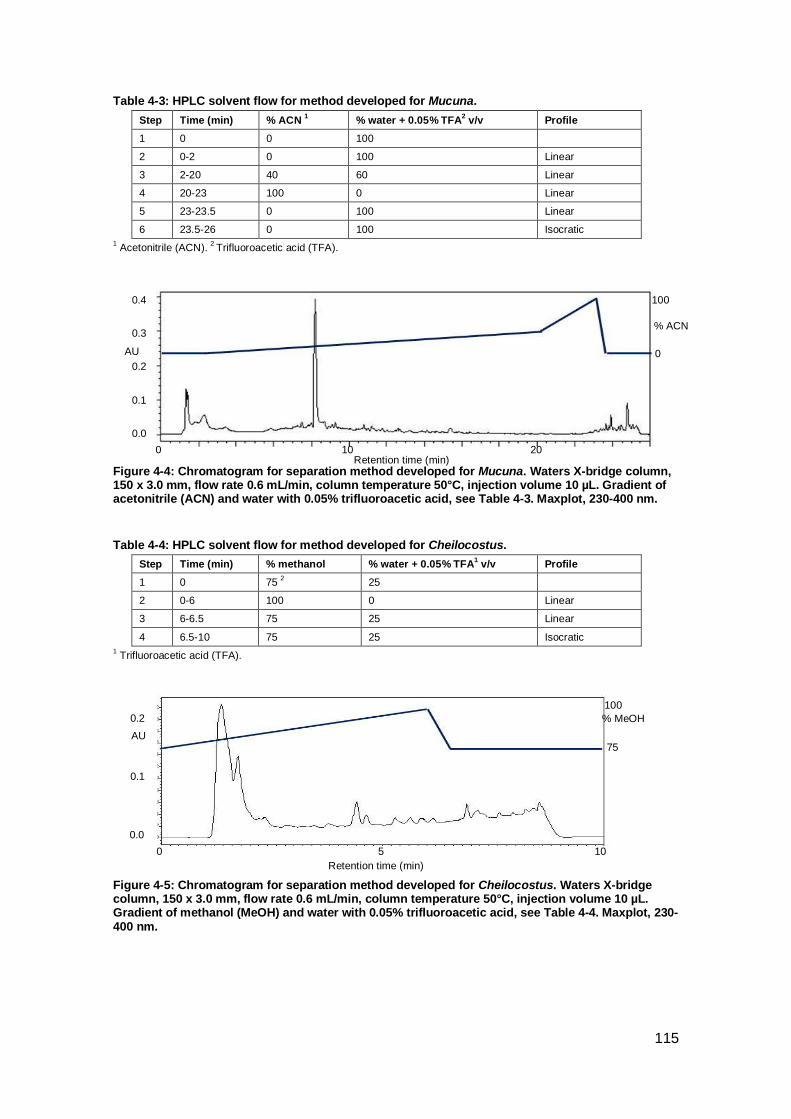
115
Table 4-3: HPLC solvent flow for method developed for Mucuna.
Step Time (min) % ACN 1
% water + 0.05% TFA2 v/v Profile
1 0 0 100
2 0-2 0 100 Linear
3 2-20 40 60 Linear
4 20-23 100 0 Linear
5 23-23.5
0 100 Linear
6 23.5-26
0 100 Isocratic
1 Acetonitrile (ACN).
2 Trifluoroacetic acid (TFA).
Figure 4-4: Chromatogram for separation method developed for Mucuna. Waters X-bridge column, 150 x 3.0 mm, flow rate 0.6 mL/min, column temperature 50°C, injection volume 10 µL. Gradient of acetonitrile (ACN) and water with 0.05% trifluoroacetic acid, see Table 4-3. Maxplot, 230-400 nm.
Table 4-4: HPLC solvent flow for method developed for Cheilocostus.
Step Time (min) % methanol % water + 0.05% TFA1 v/v
Profile
1 0 75 2
25
2 0-6 100 0 Linear
3 6-6.5
75 25 Linear
4 6.5-10
75 25 Isocratic
1 Trifluoroacetic acid (TFA).
Figure 4-5: Chromatogram for separation method developed for Cheilocostus. Waters X-bridge column, 150 x 3.0 mm, flow rate 0.6 mL/min, column temperature 50°C, injection volume 10 µL. Gradient of methanol (MeOH) and water with 0.05% trifluoroacetic acid, see Table 4-4. Maxplot, 230-400 nm.
100
% ACN
0
0.0
0.3
0.2
0.1
AU
0.4
10 0 Retention time (min)
20
100
% MeOH
75
5 0
Retention time (min)
10
0.0
0.2
0.1
AU
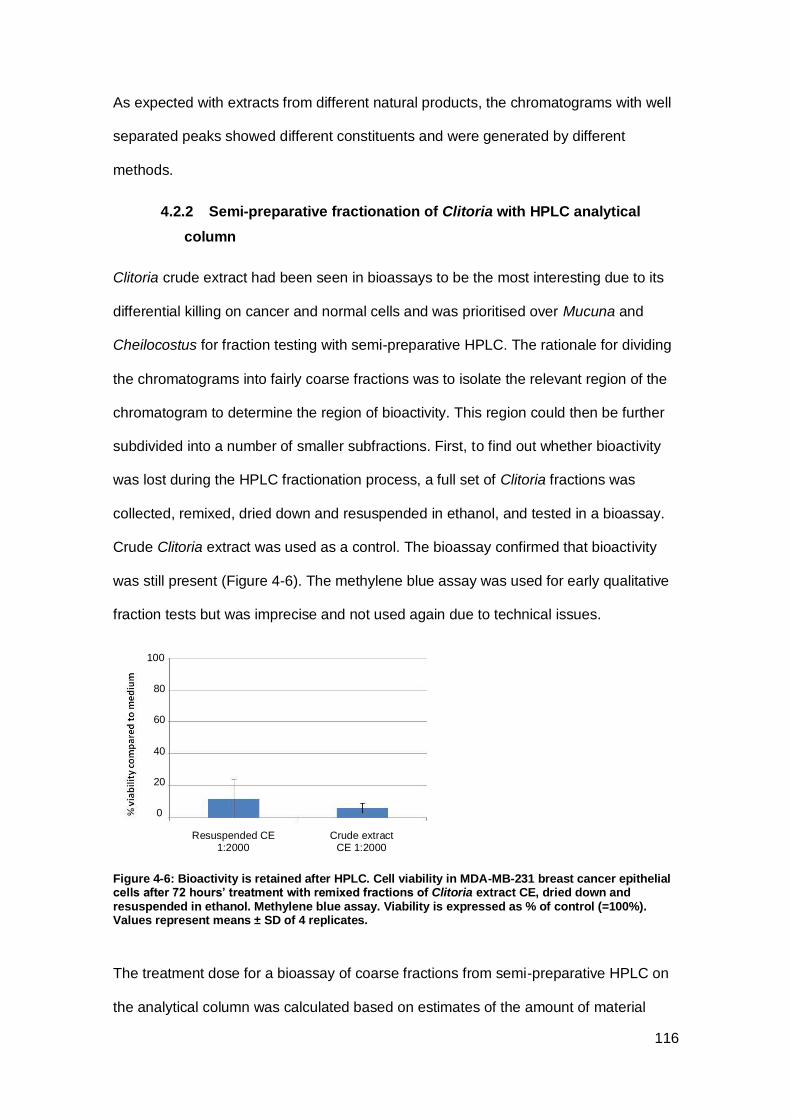
116
As expected with extracts from different natural products, the chromatograms with well
separated peaks showed different constituents and were generated by different
methods.
4.2.2 Semi-preparative fractionation of Clitoria with HPLC analytical
column
Clitoria crude extract had been seen in bioassays to be the most interesting due to its
differential killing on cancer and normal cells and was prioritised over Mucuna and
Cheilocostus for fraction testing with semi-preparative HPLC. The rationale for dividing
the chromatograms into fairly coarse fractions was to isolate the relevant region of the
chromatogram to determine the region of bioactivity. This region could then be further
subdivided into a number of smaller subfractions. First, to find out whether bioactivity
was lost during the HPLC fractionation process, a full set of Clitoria fractions was
collected, remixed, dried down and resuspended in ethanol, and tested in a bioassay.
Crude Clitoria extract was used as a control. The bioassay confirmed that bioactivity
was still present (Figure 4-6). The methylene blue assay was used for early qualitative
fraction tests but was imprecise and not used again due to technical issues.
Figure 4-6: Bioactivity is retained after HPLC. Cell viability in MDA-MB-231 breast cancer epithelial cells after 72 hours’ treatment with remixed fractions of Clitoria extract CE, dried down and resuspended in ethanol. Methylene blue assay. Viability is expressed as % of control (=100%). Values represent means ± SD of 4 replicates.
The treatment dose for a bioassay of coarse fractions from semi-preparative HPLC on
the analytical column was calculated based on estimates of the amount of material
100
Resuspended CE 1:2000
Crude extract CE 1:2000
80
60
40
20
0
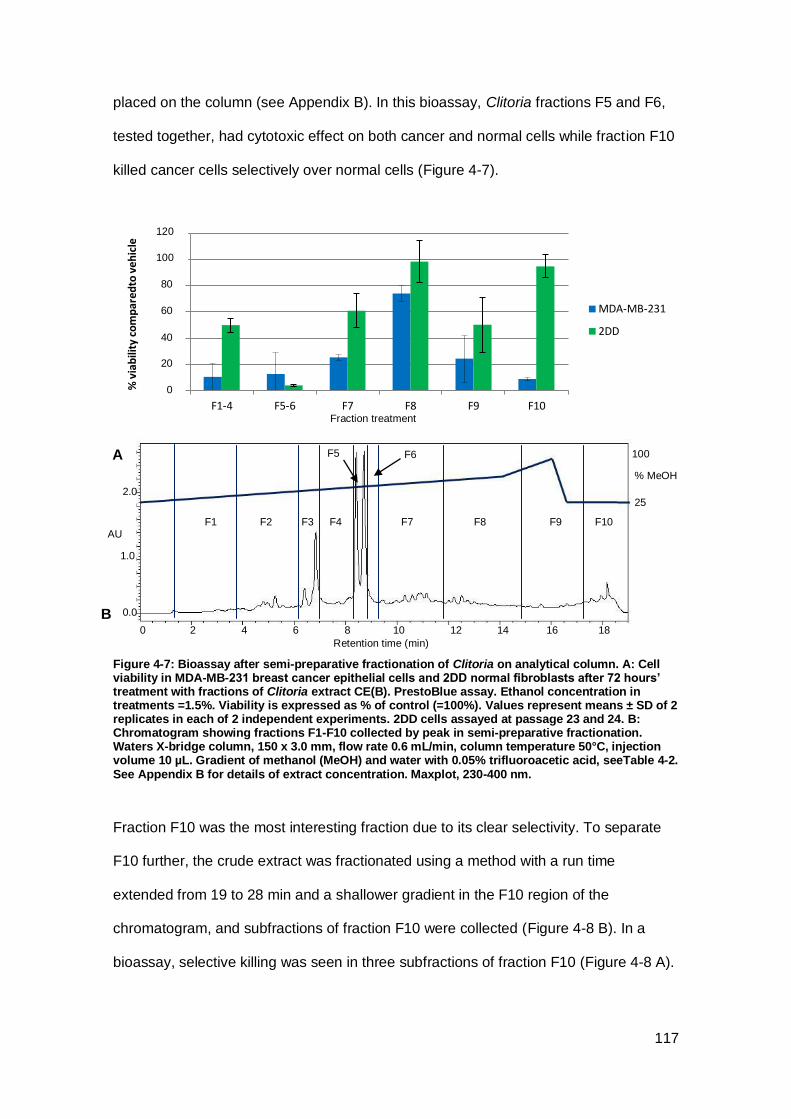
117
placed on the column (see Appendix B). In this bioassay, Clitoria fractions F5 and F6,
tested together, had cytotoxic effect on both cancer and normal cells while fraction F10
killed cancer cells selectively over normal cells (Figure 4-7).
Figure 4-7: Bioassay after semi-preparative fractionation of Clitoria on analytical column. A: Cell viability in MDA-MB-231 breast cancer epithelial cells and 2DD normal fibroblasts after 72 hours’ treatment with fractions of Clitoria extract CE(B). PrestoBlue assay. Ethanol concentration in treatments =1.5%. Viability is expressed as % of control (=100%). Values represent means ± SD of 2 replicates in each of 2 independent experiments. 2DD cells assayed at passage 23 and 24. B: Chromatogram showing fractions F1-F10 collected by peak in semi-preparative fractionation. Waters X-bridge column, 150 x 3.0 mm, flow rate 0.6 mL/min, column temperature 50°C, injection volume 10 µL. Gradient of methanol (MeOH) and water with 0.05% trifluoroacetic acid, seeTable 4-2. See Appendix B for details of extract concentration. Maxplot, 230-400 nm.
Fraction F10 was the most interesting fraction due to its clear selectivity. To separate
F10 further, the crude extract was fractionated using a method with a run time
extended from 19 to 28 min and a shallower gradient in the F10 region of the
chromatogram, and subfractions of fraction F10 were collected (Figure 4-8 B). In a
bioassay, selective killing was seen in three subfractions of fraction F10 (Figure 4-8 A).
0%
20%
40%
60%
80%
100%
120%
F1-4 F5-6 F7 F8 F9 F10
% v
iab
ility
co
mp
ared
to v
ehic
le
MDA-MB-231
2DD
F3 F4
F5 F6
F7 F2 F8 F9 F10 F1
100
% MeOH
25
0.0
2.0
AU
1.0
80
0
60
40
100
20
Fraction treatment
120
B
A
2 18 6 12 4 14 0 16 10 8
Retention time (min)
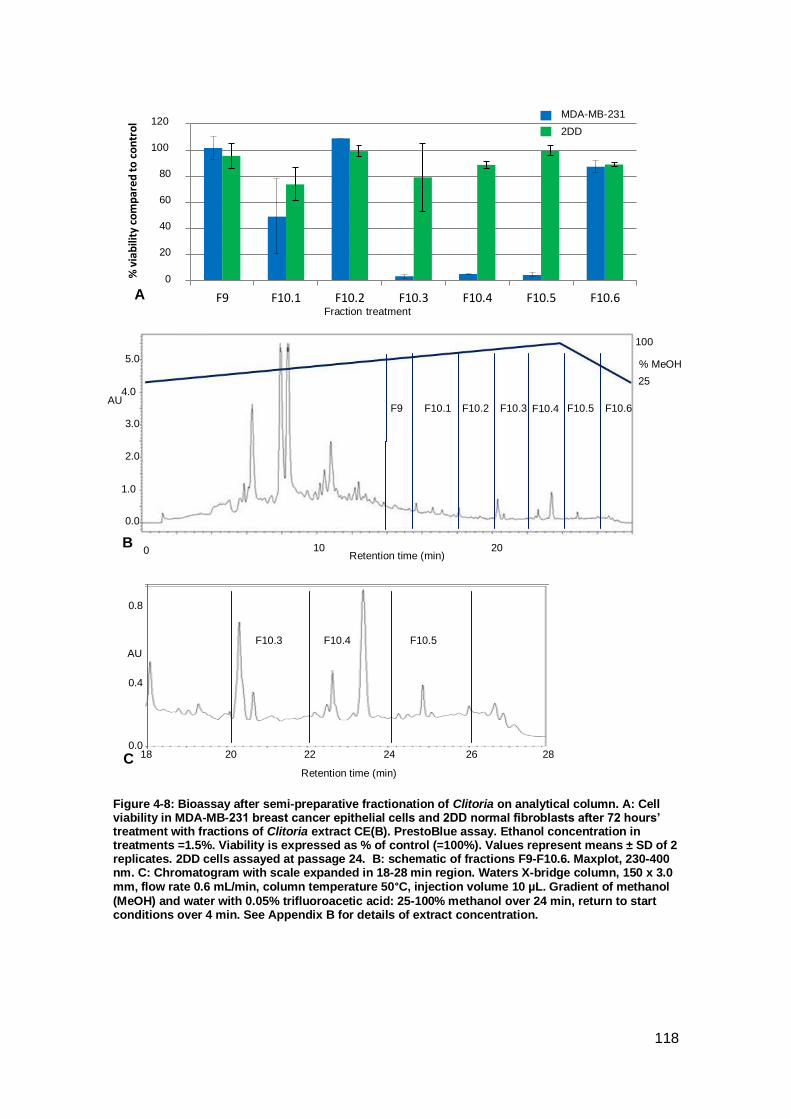
118
Figure 4-8: Bioassay after semi-preparative fractionation of Clitoria on analytical column. A: Cell viability in MDA-MB-231 breast cancer epithelial cells and 2DD normal fibroblasts after 72 hours’ treatment with fractions of Clitoria extract CE(B). PrestoBlue assay. Ethanol concentration in treatments =1.5%. Viability is expressed as % of control (=100%). Values represent means ± SD of 2 replicates. 2DD cells assayed at passage 24. B: schematic of fractions F9-F10.6. Maxplot, 230-400 nm. C: Chromatogram with scale expanded in 18-28 min region. Waters X-bridge column, 150 x 3.0 mm, flow rate 0.6 mL/min, column temperature 50°C, injection volume 10 µL. Gradient of methanol
(MeOH) and water with 0.05% trifluoroacetic acid: 25-100% methanol over 24 min, return to start conditions over 4 min. See Appendix B for details of extract concentration.
0%
20%
40%
60%
80%
100%
120%
F9 F10.1 F10.2 F10.3 F10.4 F10.5 F10.6
% v
iab
ility
co
mp
ared
to
co
ntr
ol
5.0
0.0
4.0
3.0
2.0
1.0
AU
0 10 20 Retention time (min)
F9 F10.6 F10.1 F10.3 F10.4 F10.5 F10.2
Retention time (min)
AU
18 0.0
20 28 22 24 26
F10.3
0.4
0.8
F10.4 F10.5
100
% MeOH
25
80
0
60
40
100
20
Fraction treatment
120
A
B
MDA-MB-231
2DD
C
119
When the scale was expanded for the chromatogram at the active region, each of the
fractions F10.3, F10.4 and F10.5 was seen to contain peaks representing UV-
absorbent compounds (Figure 4-8 C).
4.2.3 Fractionation of Clitoria with preparative HPLC
Semi-preparative fractionation of Clitoria extract with the analytical column required
pooling three fractionation runs for one bioassay. This approach had worked well, but
larger volumes of fractions were needed for testing on cells. Moving to a preparative
column allowed more extract to be fractionated and provided enough material for both
bioassays and an investigation into the mechanism of action, described in Chapter 5.
The method for semi-preparative fractionation on the analytical column was scaled up
for preparative fractionation. The run time was extended from 28 to 61 minutes, the
gradient was made shallower to maintain the same profile over a longer run time, the
flow rate was increased from 0.6 mL/min to 4.67 mL/min and the stroke volume was
increased from 50 to 130 µL.
Theoretically a scale-up from 10 µL injection volume to 180 µL was possible, but the
HPLC loop size restricted the injection volume to 100 µL. With a concentration of
Clitoria extract CE(B) of 9 µg/µL, 60 µL was the most appropriate injection volume for a
well resolved chromatogram. Fractions were collected at 1-minute intervals, each
containing 4.67 mL of eluent before drying down, and numbered F1 to F61 according to
retention time. The chromatogram for preparative HPLC showed well resolved peaks
and the major peaks from fractions F5 and F6 on the semi-preparative fractionation
were identifiable on the chromatogram from preparative fractionation as fractions F17
and F18 from shape and approximate % methanol (Figure 4-9). The major peaks also
had similar UV spectra with both peaks having λmax1=323.8 nm and λmax2=285.6 nm on
both chromatograms.

120
Approximate peak area presented a means of estimating the amount of material in
each fraction when moving from an analytical to a preparative column. In order to
estimate how much ethanol to resuspend the fractions in, the peak height at 323 nm
(λmax) multiplied by the fraction eluent volume was used to give an indication of the
amount of material in the fraction (see Appendix B). From this it was concluded that
when the material from one preparative fractionation run was resuspended in 4.5 µL
ethanol, 1 µL would be sufficient to treat one well and would theoretically have around
70% of the bioactive effect seen in the bioassays after semi-preparative fractionation.
Figure 4-9: Comparison of chromatograms from semi-preparative and preparative fractionation of Clitoria extracts. A: from semi-preparative fractionation of Clitoria extract CE(B). Waters X-bridge column, 150 x 3.0 mm, flow rate 0.6 mL/min, column temperature 50°C, injection volume 10 µL. Gradient of methanol (MeOH) and water with 0.05% trifluoroacetic acid: 25-100% methanol over 24 min, return to start conditions over 4 min. B: from preparative separation of Clitoria extract CE(B). Waters X-Bridge BEH column, 250 x 10 mm, flow rate 4.67 mL/min, column temperature 50°C, injection volume 60 µL. Gradient of methanol (MeOH) and water with 0.05% trifluoroacetic acid: 25-100% methanol over 57 min, return to start conditions over 4 min. Maxplot, 230-400 nm. See Appendix B for details of extract concentration.
0.0
A
B
17.2 min 47.7 % MeOH
8.4 min
51.2 % MeOH
8.0 min 49.8 % MeOH
5.0
0.0
4.0
3.0
2.0
1.0
AU
0 10 20 Retention time (min)
100
% MeOH
25
16.5 min 46.8 % MeOH
1.0
0.5
AU
0 20 40
Retention time (min)
100
% MeOH
25
60

121
As expected, there was bioactivity in some fractions from preparative fractionation
(Figure 4-10). From observation of cells under the microscope before the bioassay was
conducted, those treated with fraction F17 had rounded up and appeared dead (Figure
4-11), supporting the low cell viability readings for fraction F17 in the bioassay.
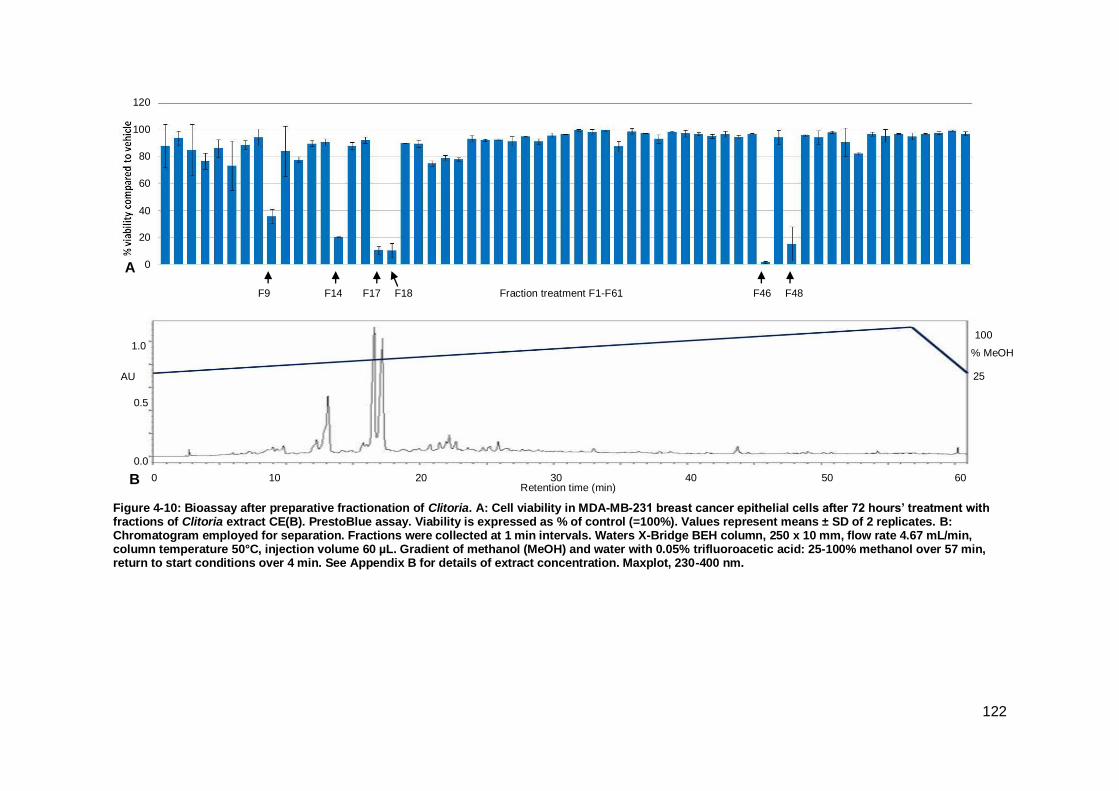
122
Figure 4-10: Bioassay after preparative fractionation of Clitoria. A: Cell viability in MDA-MB-231 breast cancer epithelial cells after 72 hours’ treatment with fractions of Clitoria extract CE(B). PrestoBlue assay. Viability is expressed as % of control (=100%). Values represent means ± SD of 2 replicates. B: Chromatogram employed for separation. Fractions were collected at 1 min intervals. Waters X-Bridge BEH column, 250 x 10 mm, flow rate 4.67 mL/min, column temperature 50°C, injection volume 60 µL. Gradient of methanol (MeOH) and water with 0.05% trifluoroacetic acid: 25-100% methanol over 57 min, return to start conditions over 4 min. See Appendix B for details of extract concentration. Maxplot, 230-400 nm.
80
0
60
40
100
20
Fraction treatment F1-F61
120
A
F9
1.0
AU
0.0
0.5
0 B 60 40 20 10 30 50 Retention time (min)
100
% MeOH
25
F14 F17 F18 F46 F48

123
Figure 4-11: Images of cells treated with Clitoria fraction F17. Phase contrast images of MDA-MB-231 breast cancer epithelial cells. A, C: ethanol control. B, D: treated with Clitoria fraction F17. A, B, 0H, 40x magnification. Scale bar: 40 μm. C, D: 72H, 200x magnification. Scale bar: 20 μm. Images of cells in 96-well plates used in the same assay shown in Figure 4-10.
All bioactive fractions from preparative fractionation colocated with bioactive fractions
from semi-preparative fractionation on the analytical column (Figure 4-12 A). Bioactive
fractions F14, F17 and F18 colocated with peaks representing UV absorbent
compounds whereas F46 and F48 did not (Figure 4-12 B). Although there were UV
peaks in the fractions that corresponded to fractions F10.4 and F10.5 from semi-
preparative fractionation, these fractions were not bioactive in preparative fractionation
(Figure 4-12 B).
C D
A B

124
Figure 4-12: Comparison of bioactive fractions from Clitoria semi-preparative and preparative fractionation. A: Chromatogram employed in preparative fractionation showing bioactive fractions with 60% cell viability or less on cancer cells (blue; data from Figure 4-10) and with 20% cell viability or less on cancer cells after semi-preparative fractionation on analytical column (red; data from Figure 4-7, Figure 4-8) aligned by peak. B: 43-60 minute region of chromatogram in A enlarged. Waters X-Bridge BEH column, 250 x 10 mm, flow rate 4.67 mL/min, column temperature 50°C, injection volume 60 µL. Gradient of methanol (MeOH) and water with 0.05% trifluoroacetic acid: 25-100% methanol over 57 min, return to start conditions over 4 min. See Appendix B for details of extract concentration. Maxplot, 230-400 nm.
The fractions that contained the major peaks (hereafter called fractions F17 and F18
from preparative fractionation) had previously killed both cancer and normal cells. To
find out whether this was because more material was in the fractions than in others,
and whether they would be selective if diluted, fractions F17 and F18 were tested in a
dilution series in a bioassay with the same cell lines that were used to test the crude
extract in Chapter 3, Figure 3-5: MCF-10A breast epithelial cells, 2DD normal
fibroblasts, and breast cancer epithelial cells MDA-MB-231 and MCF-7 (Figure 4-13).
Cytotoxicity with the highest concentration of fraction F17 was around 8 fold higher on
MDA-MB-231 cancer cells than normal cells, and around two fold higher on MCF-7
cancer cells than normal cells (Figure 4-13 A). Fraction F18 was also bioactive (Figure
AU
1.0
0.5
F9
F17 F18
F48 F46
F14
F7 F10.3 F10.4 F10.5
F5-6 F1-4
F46 F48
F10.3 F10.4 F10.5
0.0
A
B
0 40 20 60 Retention time (min)
AU
0.2
0.1
0.0
24 20
Retention time (min)
100
% MeOH
25
22 26
PREP
SEMI-PREP
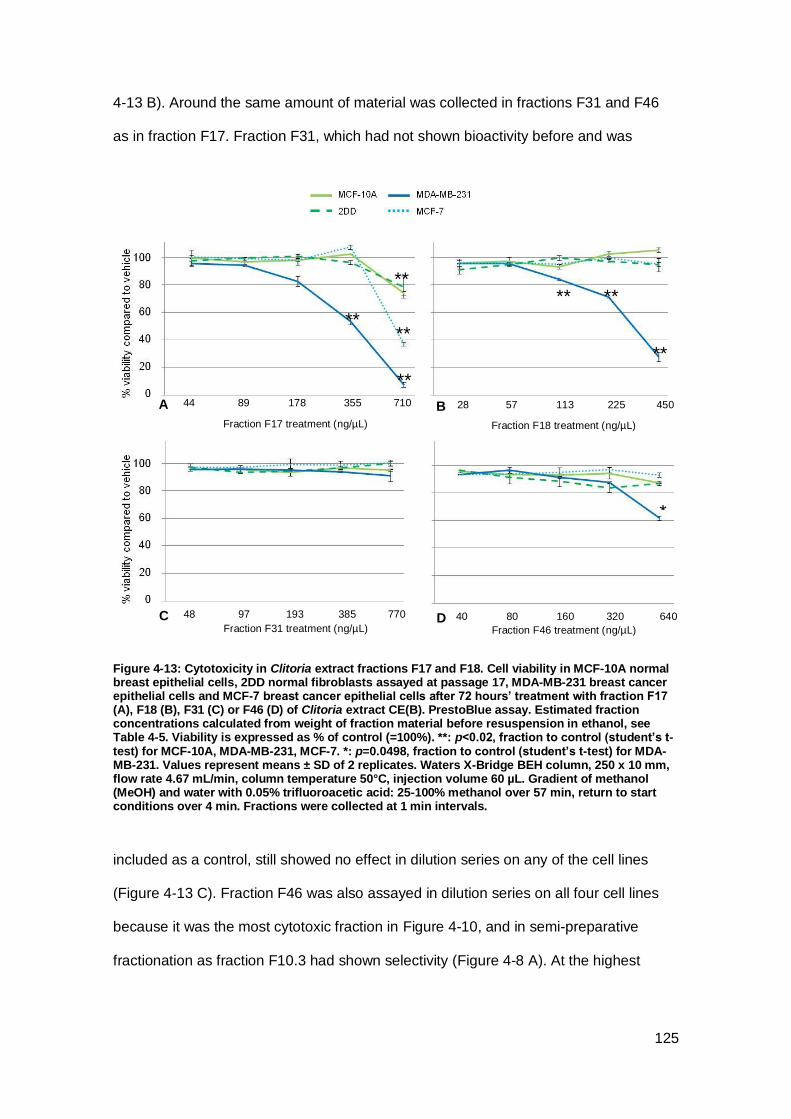
125
4-13 B). Around the same amount of material was collected in fractions F31 and F46
as in fraction F17. Fraction F31, which had not shown bioactivity before and was
Figure 4-13: Cytotoxicity in Clitoria extract fractions F17 and F18. Cell viability in MCF-10A normal breast epithelial cells, 2DD normal fibroblasts assayed at passage 17, MDA-MB-231 breast cancer epithelial cells and MCF-7 breast cancer epithelial cells after 72 hours’ treatment with fraction F17 (A), F18 (B), F31 (C) or F46 (D) of Clitoria extract CE(B). PrestoBlue assay. Estimated fraction concentrations calculated from weight of fraction material before resuspension in ethanol, see Table 4-5. Viability is expressed as % of control (=100%). **: p<0.02, fraction to control (student’s t-test) for MCF-10A, MDA-MB-231, MCF-7. *: p=0.0498, fraction to control (student’s t-test) for MDA-MB-231. Values represent means ± SD of 2 replicates. Waters X-Bridge BEH column, 250 x 10 mm, flow rate 4.67 mL/min, column temperature 50°C, injection volume 60 µL. Gradient of methanol (MeOH) and water with 0.05% trifluoroacetic acid: 25-100% methanol over 57 min, return to start conditions over 4 min. Fractions were collected at 1 min intervals.
included as a control, still showed no effect in dilution series on any of the cell lines
(Figure 4-13 C). Fraction F46 was also assayed in dilution series on all four cell lines
because it was the most cytotoxic fraction in Figure 4-10, and in semi-preparative
fractionation as fraction F10.3 had shown selectivity (Figure 4-8 A). At the highest
**
** **
Fraction F17 treatment (ng/µL)
44 89 178 355 710
** **
**
**
A
Fraction F18 treatment (ng/µL)
28 57 113 225 450 B
Fraction F31 treatment (ng/µL)
48 97 193 385 770 C Fraction F46 treatment (ng/µL)
40 80 160 320 640 D
*
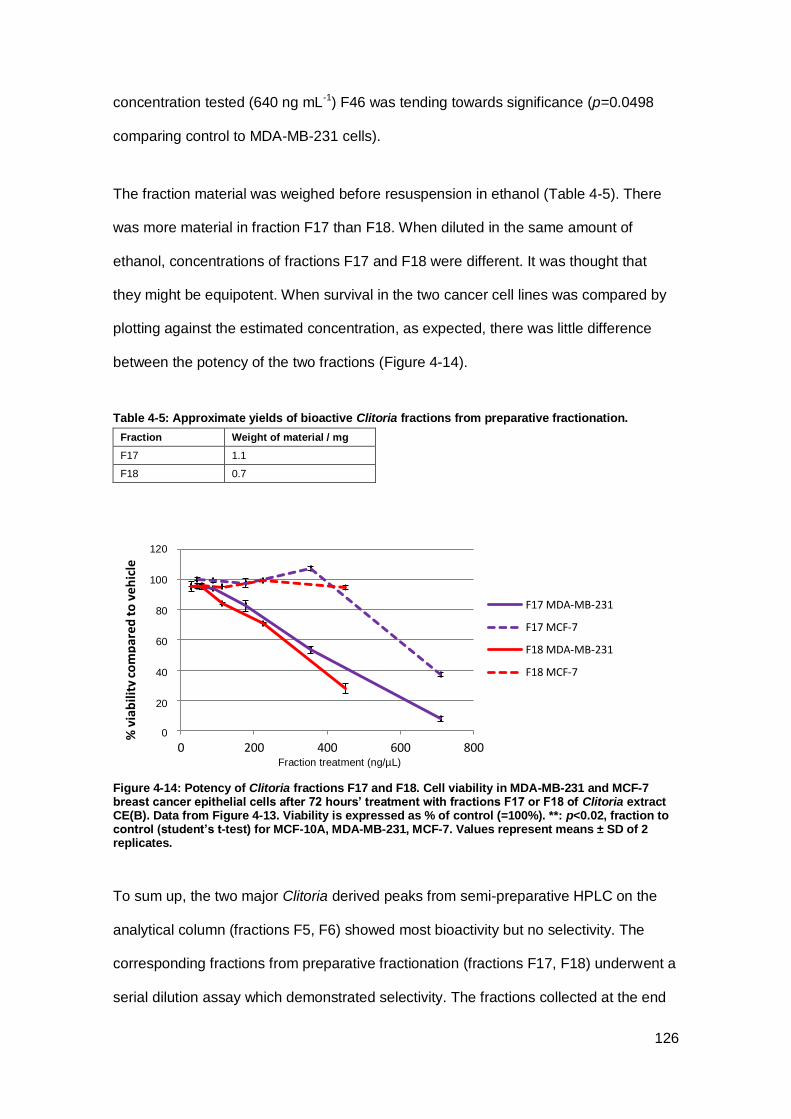
126
concentration tested (640 ng mL-1) F46 was tending towards significance (p=0.0498
comparing control to MDA-MB-231 cells).
The fraction material was weighed before resuspension in ethanol (Table 4-5). There
was more material in fraction F17 than F18. When diluted in the same amount of
ethanol, concentrations of fractions F17 and F18 were different. It was thought that
they might be equipotent. When survival in the two cancer cell lines was compared by
plotting against the estimated concentration, as expected, there was little difference
between the potency of the two fractions (Figure 4-14).
Table 4-5: Approximate yields of bioactive Clitoria fractions from preparative fractionation.
Fraction Weight of material / mg
F17 1.1
F18 0.7
Figure 4-14: Potency of Clitoria fractions F17 and F18. Cell viability in MDA-MB-231 and MCF-7 breast cancer epithelial cells after 72 hours’ treatment with fractions F17 or F18 of Clitoria extract CE(B). Data from Figure 4-13. Viability is expressed as % of control (=100%). **: p<0.02, fraction to control (student’s t-test) for MCF-10A, MDA-MB-231, MCF-7. Values represent means ± SD of 2 replicates.
To sum up, the two major Clitoria derived peaks from semi-preparative HPLC on the
analytical column (fractions F5, F6) showed most bioactivity but no selectivity. The
corresponding fractions from preparative fractionation (fractions F17, F18) underwent a
serial dilution assay which demonstrated selectivity. The fractions collected at the end
0%
20%
40%
60%
80%
100%
120%
0 200 400 600 800
% v
iab
ility
co
mp
ared
to
veh
icle
F17 MDA-MB-231
F17 MCF-7
F18 MDA-MB-231
F18 MCF-7
80
0
60
40
120
20
100
Fraction treatment (ng/µL)

127
of the chromatogram (85-100% methanol) in semi-preparative fractionation showed
most selective activity but the activity was not confirmed after preparative fractionation
and the peaks could not be identified.
4.2.1 Fractionation of Cheilocostus extract
Figure 4-15: Bioassay after semi-preparative fractionation of Cheilocostus fractions. A: Cell viability in MDA-MB-231 breast cancer epithelial cells and 2DD normal after 72 hours’ treatment with fractions of Cheilocostus extract. PrestoBlue assay. Ethanol concentration in treatments =1.5%. 2DD cells assayed at passage 17. Viability is expressed as % of control (=100%). Values represent means ± SD of 2 replicates. B: Chromatogram employed for separation with schematic of fractions collected by peak. Waters X-bridge column, 150 x 3.0 mm, flow rate 0.6 mL/min, column temperature 50°C, injection volume 10 µL. Gradient of methanol (MeOH) and water with 0.05% trifluoroacetic acid: , see Table 4-4. See Appendix B for details of extract concentration.
The study originally concerned three Indian medicinal crude plant extracts. Clitoria had
been shown to be the most interesting because of its selective cytotoxic effects on
cancer and normal cells, while Mucuna and Cheilocostus crude extracts were not
selective. Mucuna had very low bioactivity and was excluded from further study. To see
if there was any fraction in Cheilocostus with interesting cytotoxic activity, semi-
preparative fractionation was performed on the analytical column. In bioassays with the
2 3
4 5
6 7
1
A
0.0
0.1
0.2
0.3 100
% MeOH
75
B
AU
Fraction treatment
100
80
60
20
40
0
5 0 Retention time (min)
10
MDA-MB-231 2DD
128
fractions, cancer cells appeared more sensitive than normal cells to Cheilocostus
fraction F3 (Figure 4-15), although there was no highly UV absorbent peak
corresponding to fraction F3 on the chromatogram. Based on these results
Cheilocostus would have been a candidate for bioassay-led fractionation, but there was
not enough extract available to pursue this line of work.
4.3 Discussion
Bioassay-driven HPLC was successful for fractionation of Clitoria extract, leading to the
isolation of two strongly bioactive fractions (F17, F18) from preparative fractionation
which were selective in assays on cancer cells in a dose dependent manner similar to
the crude extract and could be proposed for identification and structural elucidation.
From initial coarse fractions from semi-preparative fractionation on the analytical
column, three fractions (F5-F6 combined, F10) were selected for subfractionation, and
four subfractions of interest (F17, F18, F46, F48) emerged from 61 1-minute
subfractions in preparative fractionation (Figure 4-16).
Bioactivity can be a synergistic effect of chemicals in a mixture and can be lost during
fractionation (Sarker and Nahar, 2012a), but in Clitoria cytotoxic activity was retained in
individual fractions. Some bioactivity was lost between moving from coarse to
preparative fractions, for example when subfractionating F10.4 and F10.5, which may
have been because material was too dilute in the preparative fractions (F49-F53) to
have a bioactive effect. Fraction 46 was not sufficiently potent for significant bioactivity
in a dilution series after preparative fractionation. Bioactive fractions F17 and F18
contained strongly UV absorbent compounds. There was not enough plant material to
refine each fraction repeatedly, therefore the purity of each fraction is unknown.
Bioactive fractions F46 and F48 were not strongly UV absorbent, suggesting that the
bioactive compounds in these fractions have no chromophores or may be UV
absorbent and present in very small concentrations.
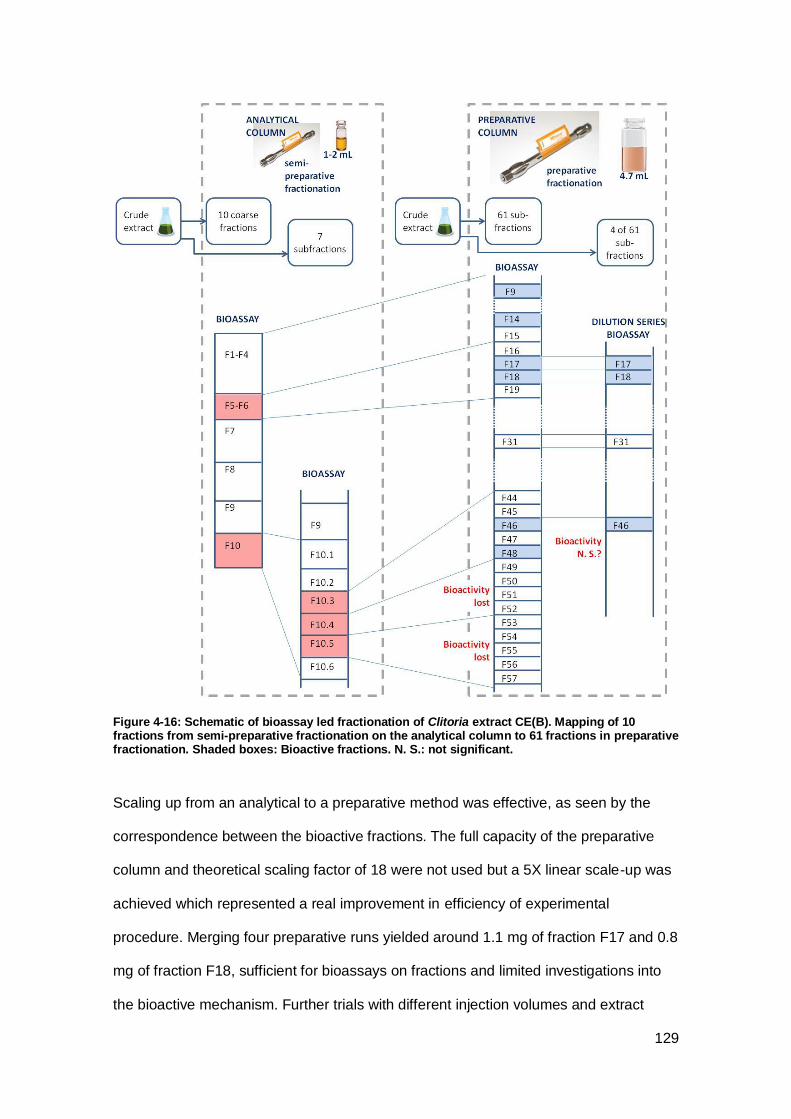
129
Figure 4-16: Schematic of bioassay led fractionation of Clitoria extract CE(B). Mapping of 10 fractions from semi-preparative fractionation on the analytical column to 61 fractions in preparative fractionation. Shaded boxes: Bioactive fractions. N. S.: not significant.
Scaling up from an analytical to a preparative method was effective, as seen by the
correspondence between the bioactive fractions. The full capacity of the preparative
column and theoretical scaling factor of 18 were not used but a 5X linear scale-up was
achieved which represented a real improvement in efficiency of experimental
procedure. Merging four preparative runs yielded around 1.1 mg of fraction F17 and 0.8
mg of fraction F18, sufficient for bioassays on fractions and limited investigations into
the bioactive mechanism. Further trials with different injection volumes and extract
130
concentrations that might have allowed a heavier loading were not conducted due to
limitations on the amount of crude extract available.
The differential response between cancer and normal cells that had already been seen
in the crude extract was also seen with fractions F17 and F18 in a dose dependent
manner. The limits of sensitivity of the assay prevented selectivity being visible at
concentrations below 225 ng/µL. Whereas the crude extract had appeared more toxic
on MCF-7 cells than MDA-MB-231 cells, the fractions seemed more toxic on MDA-MB-
231 cells than MCF-7 cells. However, the number of replicates in these fraction
bioassays was low (N=2) and it is possible that combining results of more assays
would have eroded this difference.
Detection with a UV detector with photodiode array (UV-DAD) was effective as an aid
to fractionation as it is non-destructive of the sample being collected and detects a wide
range of UV wavelengths. Active compounds in natural products tend to have
chromophores with conjugated bonds which are strongly UV absorbent (Wolfender,
2009). However, UV-DAD is not a universal detection technique. Compounds with
double bonds without conjugation are weakly UV active in the low end of the UV
spectrum (< 220 nm) and may not be seen against the methanol mobile phase signal
(Wolfender, 2009). Some saponins, terpenes, lipids and alkaloids are not UV active
and would not be detected (Wolfender, 2009). For instance, the active agents in the
medicinal extract of Gingko are flavonoids and ginkgolides acting synergistically
(Dubber and Kanfer, 2006). Ginkgolides are terpene lactones with very weak
chromophores, better detected by other detector systems such as evaporative light
scattering detection (ELSD) (Dubber and Kanfer, 2006). The alkaloid group includes
the vinca alkaloid chemotherapy drugs and saponins are also frequently bioactive
(Cmoch et al., 2008). The weakly UV absorbent bioactive agents in fractions F46 and
F48 may be alkaloids or saponins, known to be present in Clitoria root (Deka and

131
Kalita, 2011), or belong to other phytochemical classes for which ELSD would be more
appropriate.
The two major peaks in fractions F17 and F18 have identical UV maxima and elute in
close proximity, indicating they are of similar polarity. Although F18 appeared at first
less bioactive than F17, when similar concentrations were compared, it was equally
potent. From this, it can be hypothesised that they are closely related compounds. In a
study on apple pomace, Schieber et al,. (2001) isolated five glycosides of the flavonoid
quercetin, which differed only in their glycoside, as separately eluting peaks from HPLC
with a reversed phase column. To do this, they employed a slowly rising gradient of
ACN against water, achieving separation of peaks eluting closely together (Schieber et
al., 2001). In a faster rising gradient very closely related compounds would elute as one
peak and it is possible that fractions F17 or F18 may be composed of more than one
closely related compound although the good peak resolution argues against this.
HPLC methods are easily adapted for identification with liquid chromatography-mass
spectrometry (LC-MS) for identification, for example by Benayad et al. (2014) when
separating and identifying flavonoid glycosides from Moroccan fenugreek seed extract.
Moving to LC-MS for identification can require a change to the method to suit the MS,
for instance not using TFA in the HPLC solvent, which can alter the peak retention
times, and in any case substances may elute at different times on a different column
(Garrard, personal communication). Major peaks F17 and F18 were expected to be
easily identified in a method adapted for LC-MS with the crude extract. Identifying the
bioactive agents in fractions F46 and F48, potentially non-UV active compounds, would
be difficult with LC-MS unless a pure fraction for each containing only the bioactive
compound could be prepared or ELSD can be used.
132
Accounts of natural product isolation in the literature describe starting with 15 kg of
plant material (Michel et al., 2013) and can use up to 50 kg, although 250 g-1 kg is the
usual practice (Gray et al., 2012). Clitoria extracts in this study derived from 40 g plant
material and Mucuna and Cheilocostus from 20 g of plant material. If more extract had
been available a further iterative fractionation could have taken place, potentially
isolating the bioactive agents in F46 and F48. For example, Xu et al. (2015) employed
three fractionation steps to isolate the compound neobractatin, starting with 4.0 kg of
trunk of Garcinia bracteata. In addition, the extract could have been pre-processed to
remove classes of compound, for instance removing lipids by partitioning with hexane
(Jones and Kinghorn, 2012), which can simplify the chromatogram and assist
purification and identification of the active agents. Clitoria extract had tested positive in
qualitative analysis for several phytochemical classes including flavonoids, sterols and
alkaloids (Deka and Kalita, 2011). With more material, the active fractions could have
undergone similar tests which would have identified their chemical classes. Here,
however, the small quantity of extract available was used effectively and with positive
results.
4.4 Next steps
The crude Clitoria extract and its strongly bioactive and selective fractions F17 and F18
were investigated with the aim of finding the bioactive mechanisms (see Chapter 5,
Mechanism of action). Identification of the bioactive compounds in fractions F17 and
F18 was performed, and as bioactivity was not confirmed in F46 and lost in F48, but
present in their parent fraction F10.3, attempts were made to identify the bioactive
compound in F10.3 (see Chapter 7, Identification of bioactive agents in Clitoria root
extract).
133
Chapter 5 Mechanism of action
5.1 Introduction
During the drug discovery process, once a cytotoxic effect is confirmed and the drug
target is identified, work proceeds to understand the mechanism of action so that,
during the lead optimization stage, structure activity relationship work can attempt to
improve absorption, distribution, metabolism, excretion and pharmacokinetics (Zheng
et al., 2013). In this study a dose-dependent cytotoxic effect had been seen with
Clitoria extract and two Clitoria fractions F17 and F18. The next stages of the study
focussed on identification of the cytotoxic agent (see Chapter 7, Identification of
bioactive agents in Clitoria root extract) and elucidation of the cytotoxic mechanism, the
subject of this chapter (Figure 5-1).
In results from cell viability assays, cancer cells appeared to be 2-3 fold more sensitive
to the crude extract than normal cells and some difference in sensitivity between
cancer and normal cells was also seen with fraction F17. The effect with the crude
extract appeared to be time-dependent and cells with shorter doubling times were more
sensitive to Clitoria extract. The hypothesis was that Clitoria and its fractions were
targeting cells during cell division, similar to current chemotherapy drugs. In this
scenario, cancer cells would be more sensitive due to their faster cycling times and a
longer treatment would allow the drug to target more cell division events. In order to
see the effect of treatment, cells were observed and imaged over a 48-hour treatment
time. It was envisaged that images of morphological changes, cell division, cell death
and cell movement would provide information about the mechanism of action. In
particular, observation would reveal whether treated cells entered mitosis and whether
cell death occurred during mitosis.
As supplies of extract were limited, assays that used minimal quantities of extract or
fraction were chosen. Live cell imaging was performed in multiwell plates. In live cell
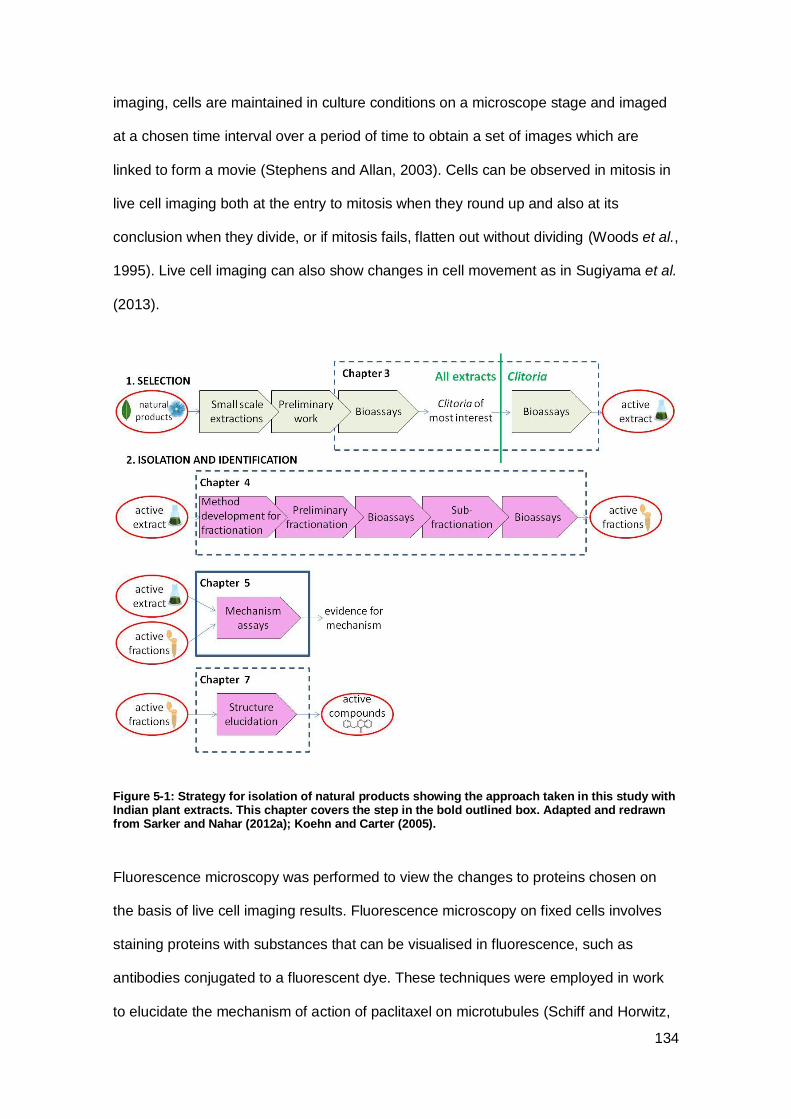
134
imaging, cells are maintained in culture conditions on a microscope stage and imaged
at a chosen time interval over a period of time to obtain a set of images which are
linked to form a movie (Stephens and Allan, 2003). Cells can be observed in mitosis in
live cell imaging both at the entry to mitosis when they round up and also at its
conclusion when they divide, or if mitosis fails, flatten out without dividing (Woods et al.,
1995). Live cell imaging can also show changes in cell movement as in Sugiyama et al.
(2013).
Figure 5-1: Strategy for isolation of natural products showing the approach taken in this study with Indian plant extracts. This chapter covers the step in the bold outlined box. Adapted and redrawn from Sarker and Nahar (2012a); Koehn and Carter (2005).
Fluorescence microscopy was performed to view the changes to proteins chosen on
the basis of live cell imaging results. Fluorescence microscopy on fixed cells involves
staining proteins with substances that can be visualised in fluorescence, such as
antibodies conjugated to a fluorescent dye. These techniques were employed in work
to elucidate the mechanism of action of paclitaxel on microtubules (Schiff and Horwitz,
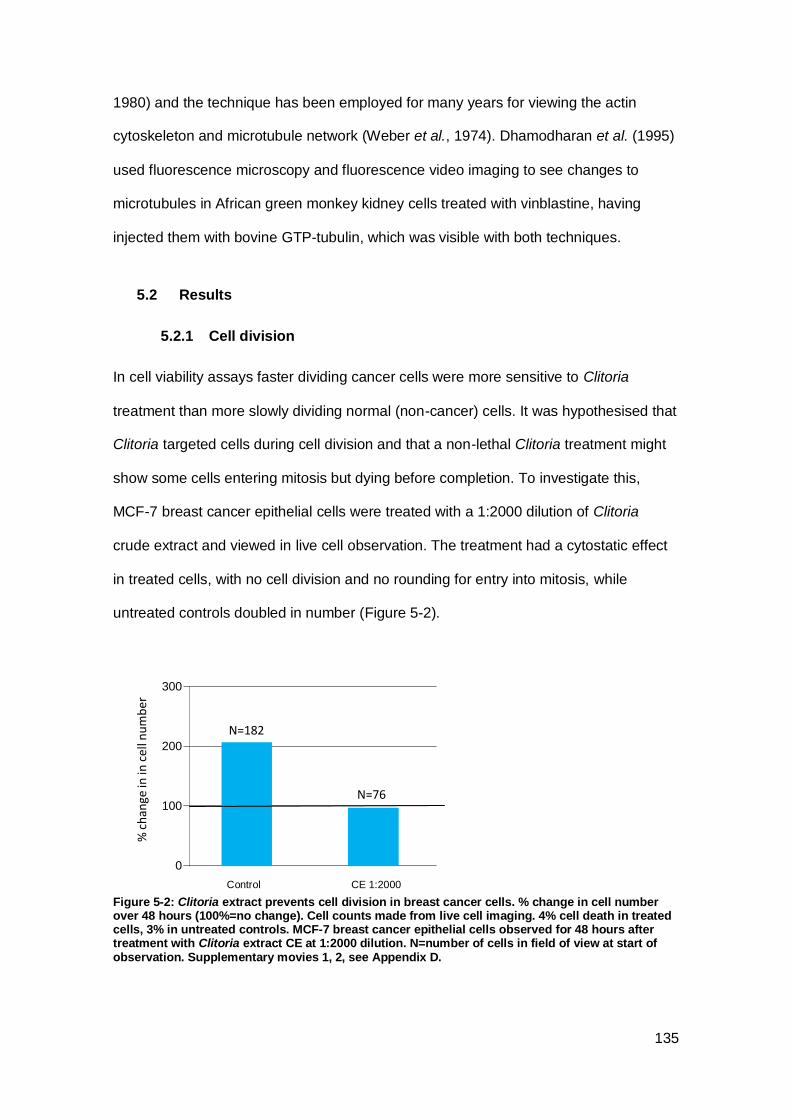
135
1980) and the technique has been employed for many years for viewing the actin
cytoskeleton and microtubule network (Weber et al., 1974). Dhamodharan et al. (1995)
used fluorescence microscopy and fluorescence video imaging to see changes to
microtubules in African green monkey kidney cells treated with vinblastine, having
injected them with bovine GTP-tubulin, which was visible with both techniques.
5.2 Results
5.2.1 Cell division
In cell viability assays faster dividing cancer cells were more sensitive to Clitoria
treatment than more slowly dividing normal (non-cancer) cells. It was hypothesised that
Clitoria targeted cells during cell division and that a non-lethal Clitoria treatment might
show some cells entering mitosis but dying before completion. To investigate this,
MCF-7 breast cancer epithelial cells were treated with a 1:2000 dilution of Clitoria
crude extract and viewed in live cell observation. The treatment had a cytostatic effect
in treated cells, with no cell division and no rounding for entry into mitosis, while
untreated controls doubled in number (Figure 5-2).
Figure 5-2: Clitoria extract prevents cell division in breast cancer cells. % change in cell number over 48 hours (100%=no change). Cell counts made from live cell imaging. 4% cell death in treated cells, 3% in untreated controls. MCF-7 breast cancer epithelial cells observed for 48 hours after treatment with Clitoria extract CE at 1:2000 dilution. N=number of cells in field of view at start of observation. Supplementary movies 1, 2, see Appendix D.
% c
han
ge in
in c
ell n
um
ber
N=182
N=76
Control CE 1:2000
100
0
200
300
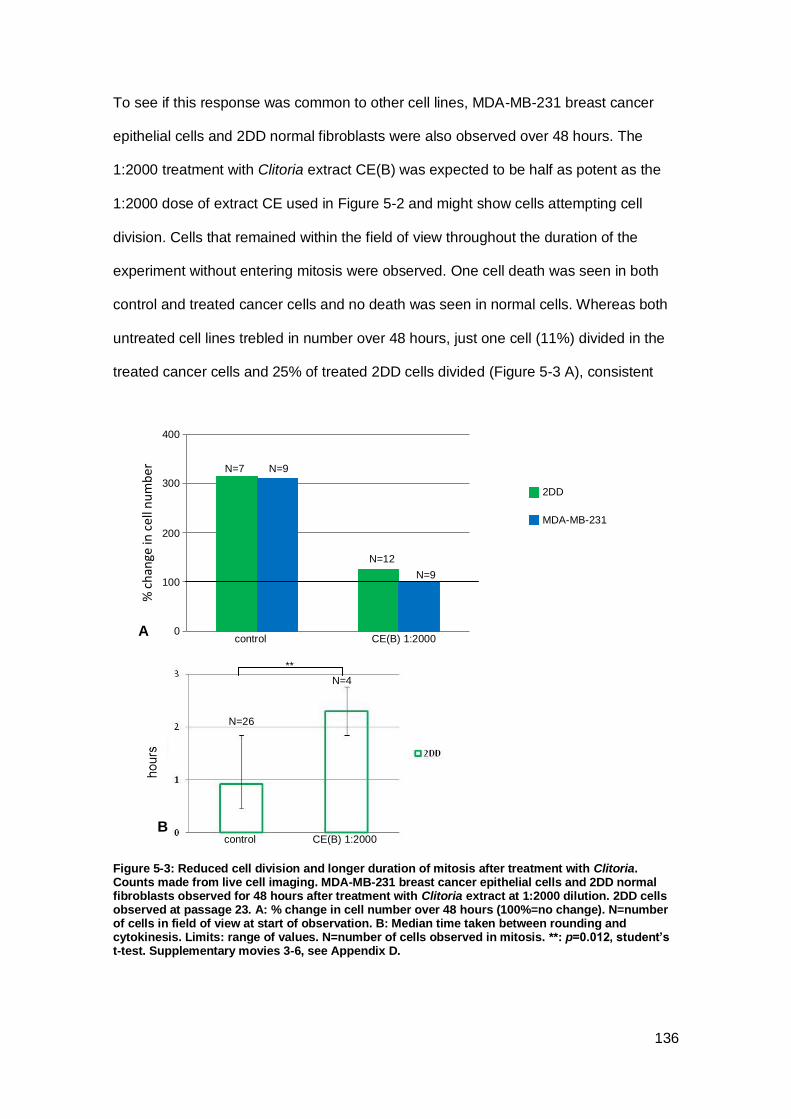
136
To see if this response was common to other cell lines, MDA-MB-231 breast cancer
epithelial cells and 2DD normal fibroblasts were also observed over 48 hours. The
1:2000 treatment with Clitoria extract CE(B) was expected to be half as potent as the
1:2000 dose of extract CE used in Figure 5-2 and might show cells attempting cell
division. Cells that remained within the field of view throughout the duration of the
experiment without entering mitosis were observed. One cell death was seen in both
control and treated cancer cells and no death was seen in normal cells. Whereas both
untreated cell lines trebled in number over 48 hours, just one cell (11%) divided in the
treated cancer cells and 25% of treated 2DD cells divided (Figure 5-3 A), consistent
Figure 5-3: Reduced cell division and longer duration of mitosis after treatment with Clitoria. Counts made from live cell imaging. MDA-MB-231 breast cancer epithelial cells and 2DD normal fibroblasts observed for 48 hours after treatment with Clitoria extract at 1:2000 dilution. 2DD cells observed at passage 23. A: % change in cell number over 48 hours (100%=no change). N=number of cells in field of view at start of observation. B: Median time taken between rounding and cytokinesis. Limits: range of values. N=number of cells observed in mitosis. **: p=0.012, student’s t-test. Supplementary movies 3-6, see Appendix D.
% c
han
ge in
cel
l nu
mb
er
N=7 N=9
100
2DD
MDA-MB-231
N=12
N=9
control CE(B) 1:2000
control CE(B) 1:2000
N=26
B
A
N=4
0
200
300
400
**
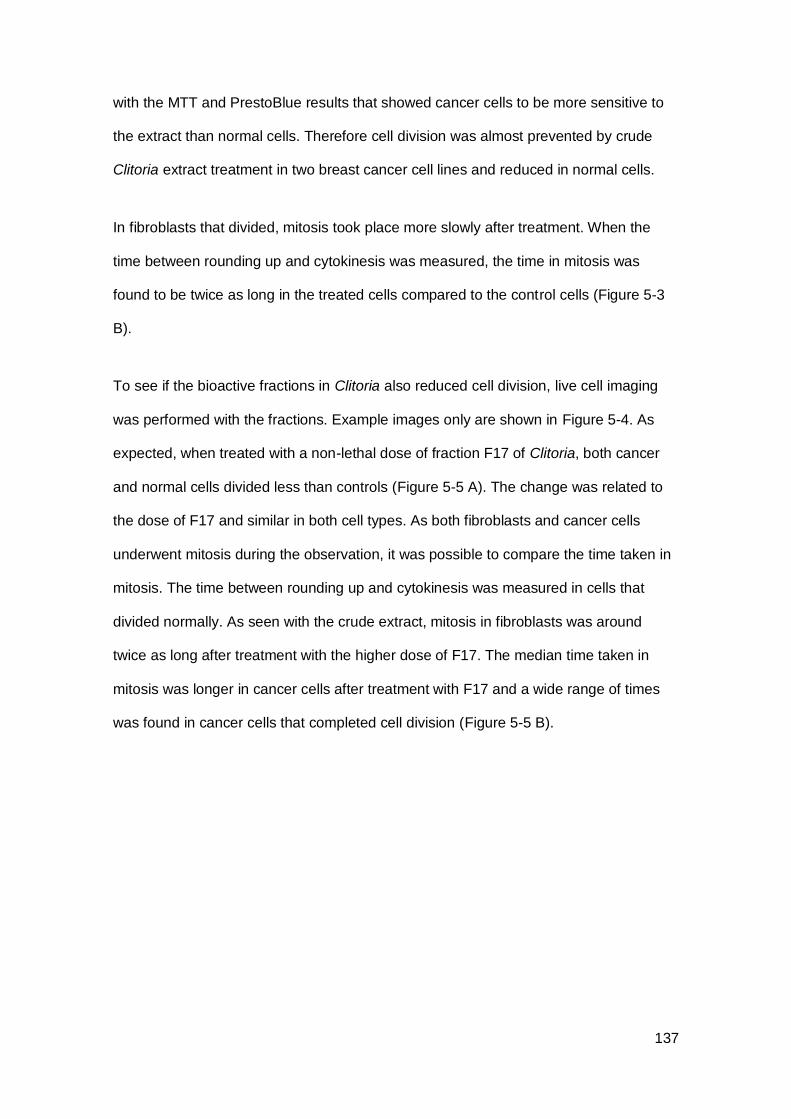
137
with the MTT and PrestoBlue results that showed cancer cells to be more sensitive to
the extract than normal cells. Therefore cell division was almost prevented by crude
Clitoria extract treatment in two breast cancer cell lines and reduced in normal cells.
In fibroblasts that divided, mitosis took place more slowly after treatment. When the
time between rounding up and cytokinesis was measured, the time in mitosis was
found to be twice as long in the treated cells compared to the control cells (Figure 5-3
B).
To see if the bioactive fractions in Clitoria also reduced cell division, live cell imaging
was performed with the fractions. Example images only are shown in Figure 5-4. As
expected, when treated with a non-lethal dose of fraction F17 of Clitoria, both cancer
and normal cells divided less than controls (Figure 5-5 A). The change was related to
the dose of F17 and similar in both cell types. As both fibroblasts and cancer cells
underwent mitosis during the observation, it was possible to compare the time taken in
mitosis. The time between rounding up and cytokinesis was measured in cells that
divided normally. As seen with the crude extract, mitosis in fibroblasts was around
twice as long after treatment with the higher dose of F17. The median time taken in
mitosis was longer in cancer cells after treatment with F17 and a wide range of times
was found in cancer cells that completed cell division (Figure 5-5 B).
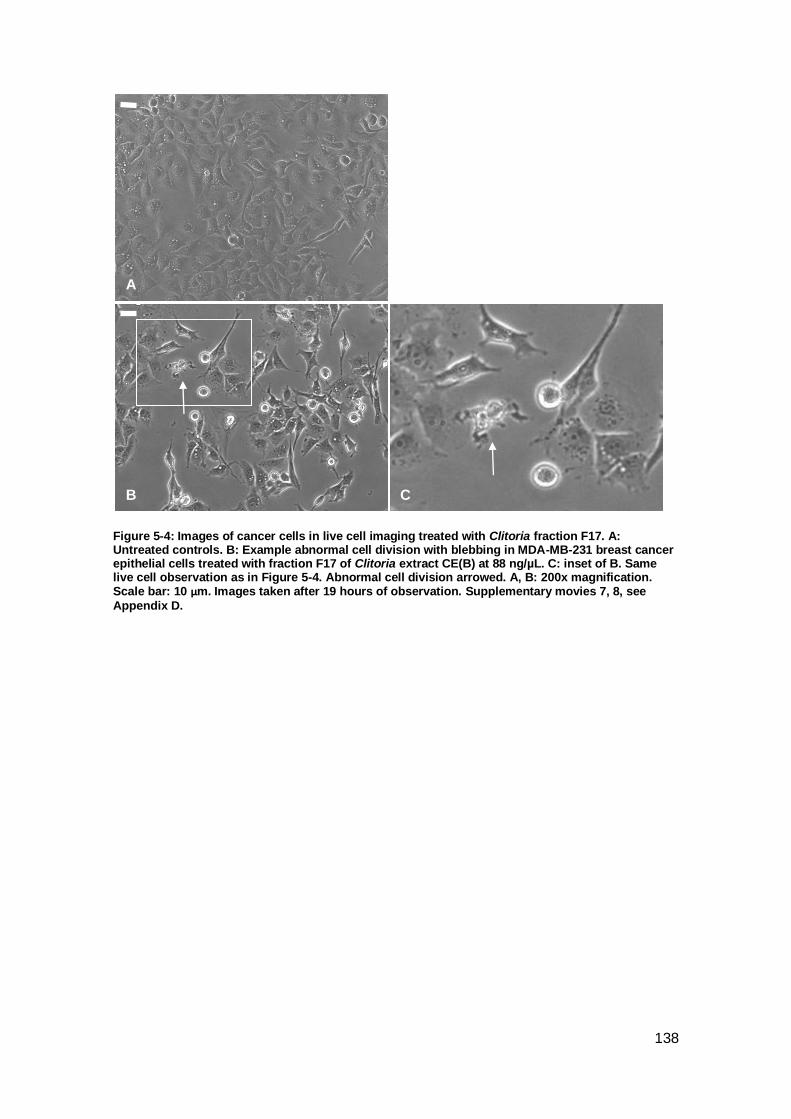
138
Figure 5-4: Images of cancer cells in live cell imaging treated with Clitoria fraction F17. A: Untreated controls. B: Example abnormal cell division with blebbing in MDA-MB-231 breast cancer epithelial cells treated with fraction F17 of Clitoria extract CE(B) at 88 ng/µL. C: inset of B. Same live cell observation as in Figure 5-4. Abnormal cell division arrowed. A, B: 200x magnification. Scale bar: 10 µm. Images taken after 19 hours of observation. Supplementary movies 7, 8, see
Appendix D.
A
B C
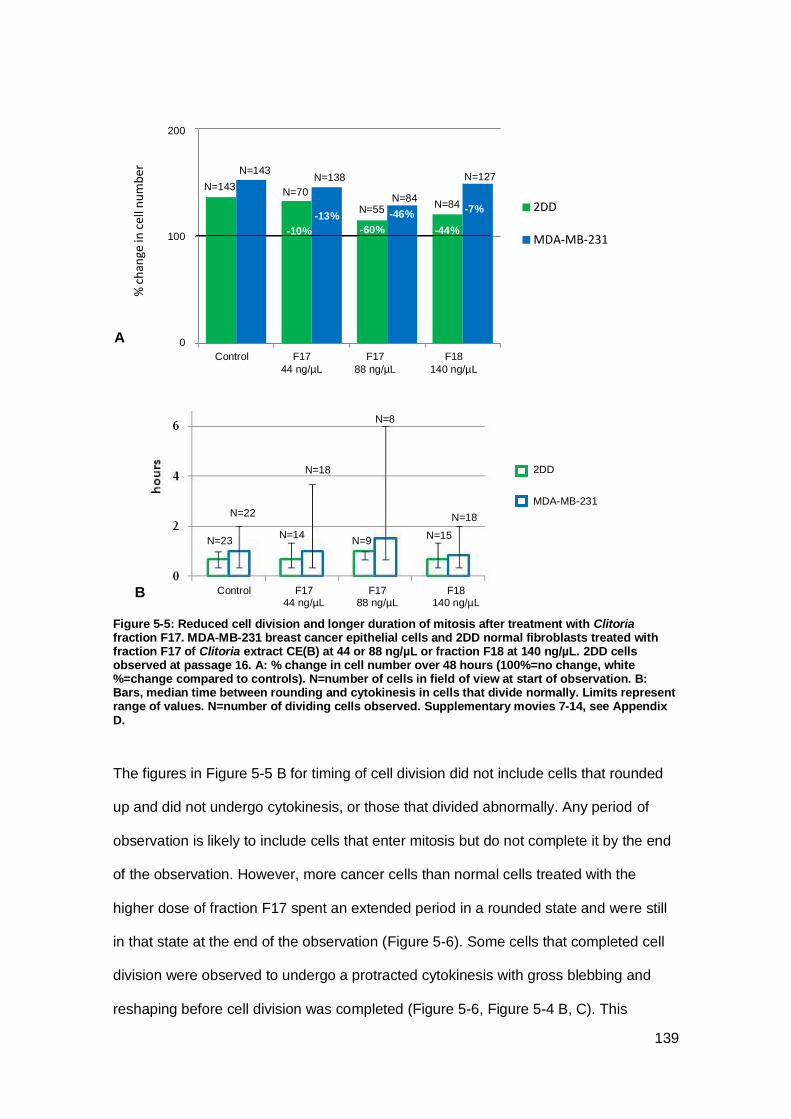
139
Figure 5-5: Reduced cell division and longer duration of mitosis after treatment with Clitoria fraction F17. MDA-MB-231 breast cancer epithelial cells and 2DD normal fibroblasts treated with fraction F17 of Clitoria extract CE(B) at 44 or 88 ng/µL or fraction F18 at 140 ng/µL. 2DD cells observed at passage 16. A: % change in cell number over 48 hours (100%=no change, white %=change compared to controls). N=number of cells in field of view at start of observation. B: Bars, median time between rounding and cytokinesis in cells that divide normally. Limits represent range of values. N=number of dividing cells observed. Supplementary movies 7-14, see Appendix D.
The figures in Figure 5-5 B for timing of cell division did not include cells that rounded
up and did not undergo cytokinesis, or those that divided abnormally. Any period of
observation is likely to include cells that enter mitosis but do not complete it by the end
of the observation. However, more cancer cells than normal cells treated with the
higher dose of fraction F17 spent an extended period in a rounded state and were still
in that state at the end of the observation (Figure 5-6). Some cells that completed cell
division were observed to undergo a protracted cytokinesis with gross blebbing and
reshaping before cell division was completed (Figure 5-6, Figure 5-4 B, C). This
0%
100%
200% %
ch
ange
in c
ell n
um
ber
2DD
MDA-MB-231
0
200
N=143 N=70
N=55
N=143 N=138
N=84
Control F17
44 ng/µL
F17
88 ng/µL
N=23
N=22
N=18
N=14 N=9
N=8
N=15
N=18
N=84
N=127
F18
140 ng/µL
-10%
-13%
-60%
-46%
-44%
-7%
A
B
100
Control F17 44 ng/µL
F17 88 ng/µL
F18 140 ng/µL
2DD
MDA-MB-231

140
abnormal cell division was seen occasionally in almost all groups of cells, but was
substantially increased in cancer cells treated with fraction F17 and appeared to be
dose related.
Figure 5-6: Abnormal and incomplete cell division after treatment with Clitoria fractions. Counts made from same live cell observations as in Figures 5-3, 5-4. A, B: 2DD normal fibroblasts observed at passage 16. C, D: MDA-MB-231 breast cancer epithelial cells. Supplementary movies 7-14, see Appendix D. B, D: same data as in Figure 5-3. Supplementary movies 3-6, see Appendix D.
Control N=143 F17 44 ng/µL N=70
F17 88 ng/µL N=55
Normal division
35%
1 %
30%
3%
13% 2%
20 %
2%
Incomplete division
Division with blebbing
No division
Death
F18 140 ng/µL N=84
Control N=143 F17 44 ng/µL N=138
F18 140 ng/µL N=127 F17 88 ng/µL N=84
C
50% 43%
43% 18%
3%
11%
11%
2% 6%
2%
3%
Normal division
Incomplete division
Division with blebbing
No division Death
A
CE(B) 1:2000 N=12 Control N=7 B
D
CE(B) 1:2000 N=9 Control N=9
100 %
25 %
78% 89%
62% 61%
84% 80% 75%
47% 53%
61% 49% 11%
2%
2% 3%
1% 11% 11%
NORMAL CELLS
BREAST CANCER CELLS
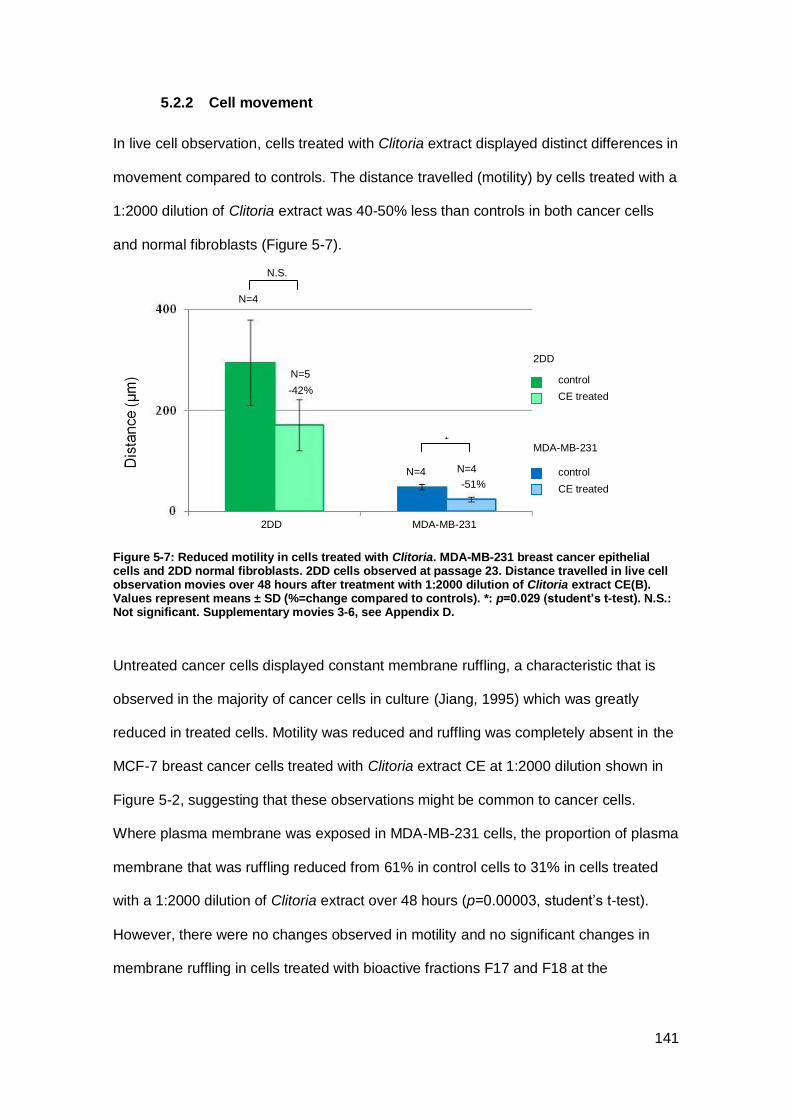
141
5.2.2 Cell movement
In live cell observation, cells treated with Clitoria extract displayed distinct differences in
movement compared to controls. The distance travelled (motility) by cells treated with a
1:2000 dilution of Clitoria extract was 40-50% less than controls in both cancer cells
and normal fibroblasts (Figure 5-7).
Figure 5-7: Reduced motility in cells treated with Clitoria. MDA-MB-231 breast cancer epithelial cells and 2DD normal fibroblasts. 2DD cells observed at passage 23. Distance travelled in live cell observation movies over 48 hours after treatment with 1:2000 dilution of Clitoria extract CE(B). Values represent means ± SD (%=change compared to controls). *: p=0.029 (student’s t-test). N.S.: Not significant. Supplementary movies 3-6, see Appendix D.
Untreated cancer cells displayed constant membrane ruffling, a characteristic that is
observed in the majority of cancer cells in culture (Jiang, 1995) which was greatly
reduced in treated cells. Motility was reduced and ruffling was completely absent in the
MCF-7 breast cancer cells treated with Clitoria extract CE at 1:2000 dilution shown in
Figure 5-2, suggesting that these observations might be common to cancer cells.
Where plasma membrane was exposed in MDA-MB-231 cells, the proportion of plasma
membrane that was ruffling reduced from 61% in control cells to 31% in cells treated
with a 1:2000 dilution of Clitoria extract over 48 hours (p=0.00003, student’s t-test).
However, there were no changes observed in motility and no significant changes in
membrane ruffling in cells treated with bioactive fractions F17 and F18 at the
2DD
MDA-MB-231
control
CE treated
control
CE treated
-42%
-51%
N=4
N=5
N=4 N=4
2DD MDA-MB-231
N.S.
*
142
concentrations used. The differences in cell division and cell movement between
treated and untreated cells were striking and were investigated further.
5.2.3 Cytoskeletal proteins
A reduction in cell division and slower cell division in treated cells suggested that
Clitoria and its cytotoxic fractions could be disrupting microtubules similarly to the
microtubule inhibitor chemotherapy drugs, while reduced cell motility and membrane
ruffling suggested inhibition of the actin cytoskeleton. To see the impact of treatment on
cytoskeletal proteins directly, cells were seeded at 20,000 cells cm-2, similar to the
density in the cell viability assays, treated with Clitoria for 18 hours and stained with
phalloidin, which binds to filamentous actin, and with anti-tubulin-β, conjugated to
fluorescent dyes. The actin cytoskeleton of cells treated with 1:2000 dilution of Clitoria
extract CE(B) showed differences in both cancer and normal cells (Figure 5-8). Actin in
epithelial cells forms a mesh of filaments at the plasma membrane. In treated MDA-
MB-231 cancer cells there was less dense actin at the cell membrane than in untreated
controls (Figure 5-8). Mean actin density was reduced from 48,000 pixels per cell (N=2
images, 180 cells) in control cells to 40,000 pixels per cell (N=2 images, 122 cells) in
treated cells.To see more clearly changes in individual cancer cells, they were seeded
at half the density (10,000 cells cm-2) and stained after a higher dose treatment
(1:1000) (Figure 5-9). With the lower density and higher dose, actin appeared granular
instead of in filaments or a mesh (Figure 5-9). Normal 2DD fibroblasts were seeded at
a lower density than cancer epithelial cells (6,000 cells cm-2) due to their larger size
and treated with Clitoria at 1:1000 dilution to see if they responded differently from
cancer cells. Fibroblasts in culture form stress fibres, which unexpectedly appeared
more prominent after treatment than in untreated controls (Figure 5-10). There was
also evidence that cancer cell division was inhibited by treatment, consistent with the
live cell imaging observations: Some cancer cells treated with the lower dose (1:2000)
were undergoing mitosis, indicated by the prominent cortical actin or chromosomes at
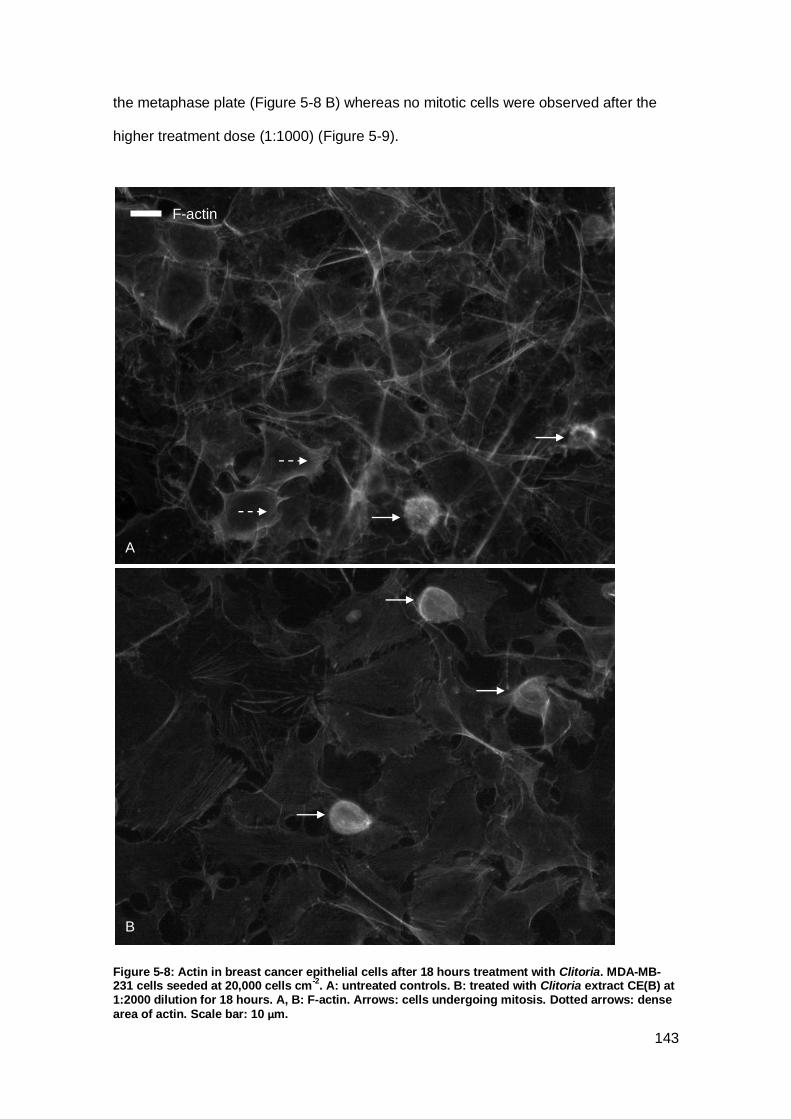
143
the metaphase plate (Figure 5-8 B) whereas no mitotic cells were observed after the
higher treatment dose (1:1000) (Figure 5-9).
Figure 5-8: Actin in breast cancer epithelial cells after 18 hours treatment with Clitoria. MDA-MB-231 cells seeded at 20,000 cells cm
-2. A: untreated controls. B: treated with Clitoria extract CE(B) at
1:2000 dilution for 18 hours. A, B: F-actin. Arrows: cells undergoing mitosis. Dotted arrows: dense
area of actin. Scale bar: 10 µm.
A
B
F-actin
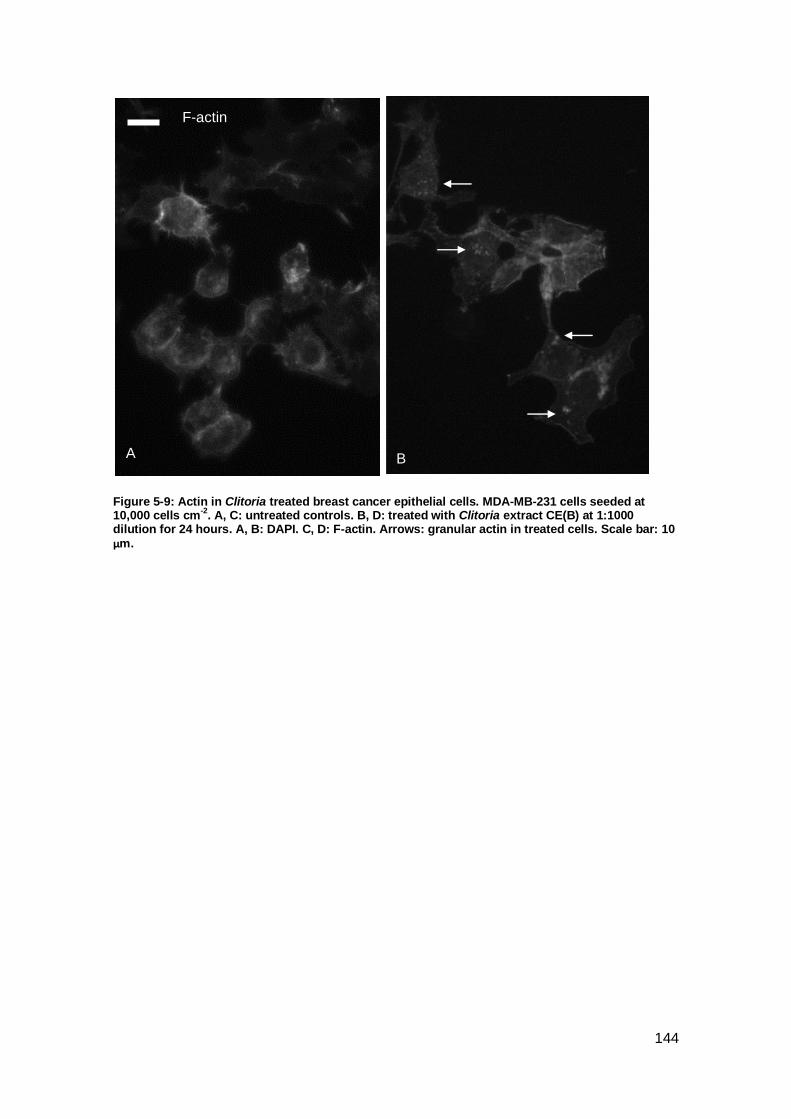
144
Figure 5-9: Actin in Clitoria treated breast cancer epithelial cells. MDA-MB-231 cells seeded at 10,000 cells cm
-2. A, C: untreated controls. B, D: treated with Clitoria extract CE(B) at 1:1000
dilution for 24 hours. A, B: DAPI. C, D: F-actin. Arrows: granular actin in treated cells. Scale bar: 10
µm.
C
F
A B
F-actin
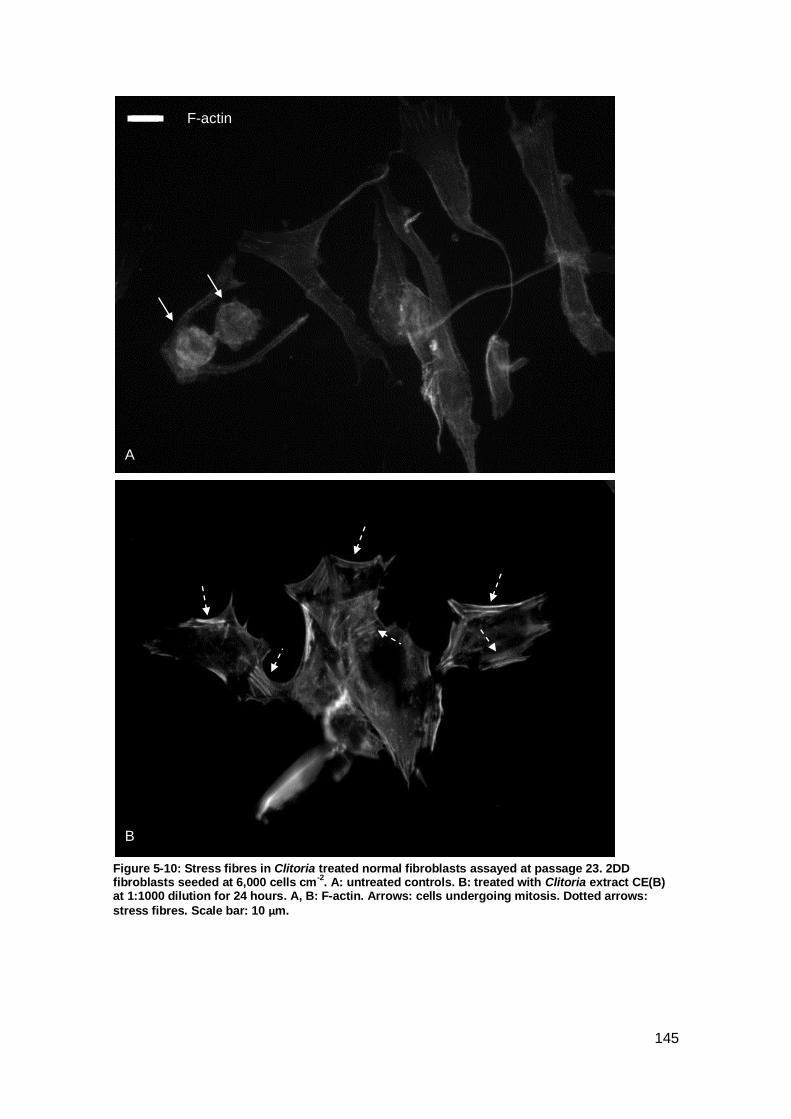
145
Figure 5-10: Stress fibres in Clitoria treated normal fibroblasts assayed at passage 23. 2DD fibroblasts seeded at 6,000 cells cm
-2. A: untreated controls. B: treated with Clitoria extract CE(B)
at 1:1000 dilution for 24 hours. A, B: F-actin. Arrows: cells undergoing mitosis. Dotted arrows:
stress fibres. Scale bar: 10 µm.
C
A
B
E
F
F-actin
146
Surprisingly, changes to microtubules were less pronounced than changes to actin
filaments. When stained for tubulin, cancer cells seeded at 20,000 cells cm-2 showed
little change after an 18-hour 1:2000 treatment with Clitoria extract (Figure 5-11). To
see whether an effect would be apparent with a higher treatment, or with less dense
seeding, a 1:1000 dilution of extract was used with cancer cells seeded at 10,000 cells
cm-2 but no strong effect was seen (Figure 5-12). Normal fibroblasts were also treated
with a 1:1000 Clitoria extract dilution and seeded less densely (6,000 cells cm-2) due to
their larger size. Microtubules were somewhat more noticeable in the normal fibroblasts
after treatment (Figure 5-13).
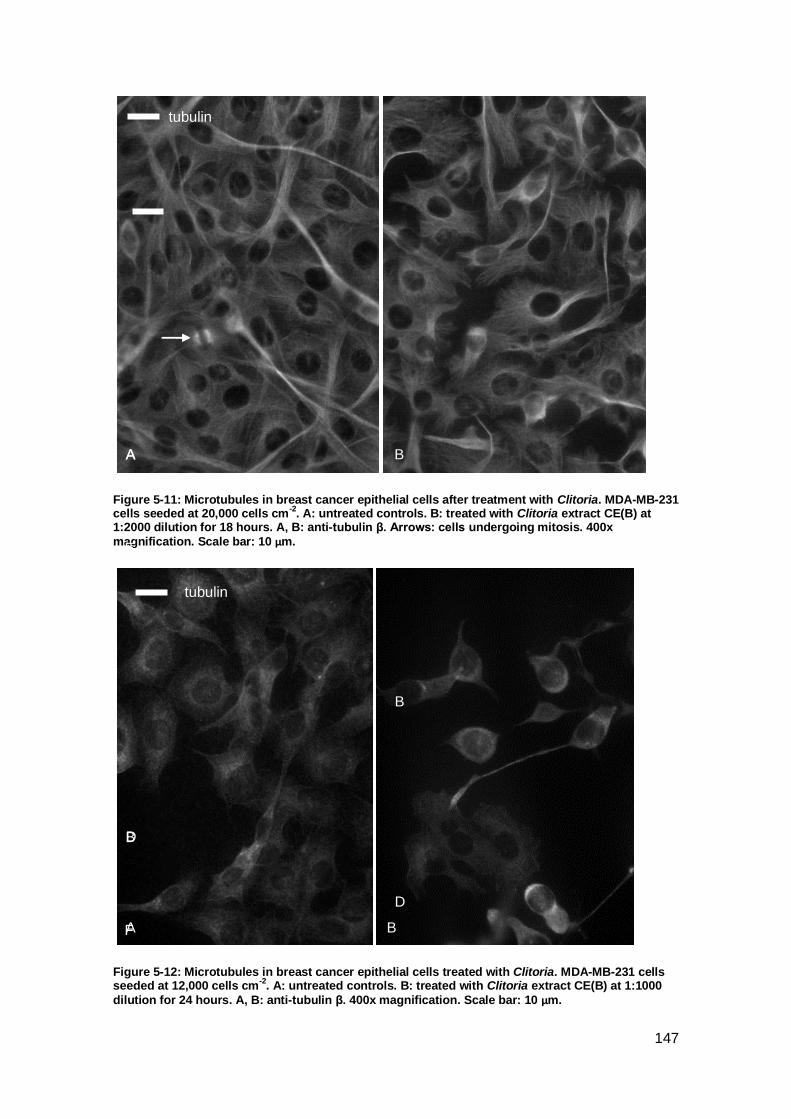
147
Figure 5-11: Microtubules in breast cancer epithelial cells after treatment with Clitoria. MDA-MB-231 cells seeded at 20,000 cells cm
-2. A: untreated controls. B: treated with Clitoria extract CE(B) at
1:2000 dilution for 18 hours. A, B: anti-tubulin β. Arrows: cells undergoing mitosis. 400x
magnification. Scale bar: 10 µm.
Figure 5-12: Microtubules in breast cancer epithelial cells treated with Clitoria. MDA-MB-231 cells seeded at 12,000 cells cm
-2. A: untreated controls. B: treated with Clitoria extract CE(B) at 1:1000
dilution for 24 hours. A, B: anti-tubulin β. 400x magnification. Scale bar: 10 µm.
C
C
A
B
B
D
F
A
D
E
A
E
F
B
tubulin
B
tubulin
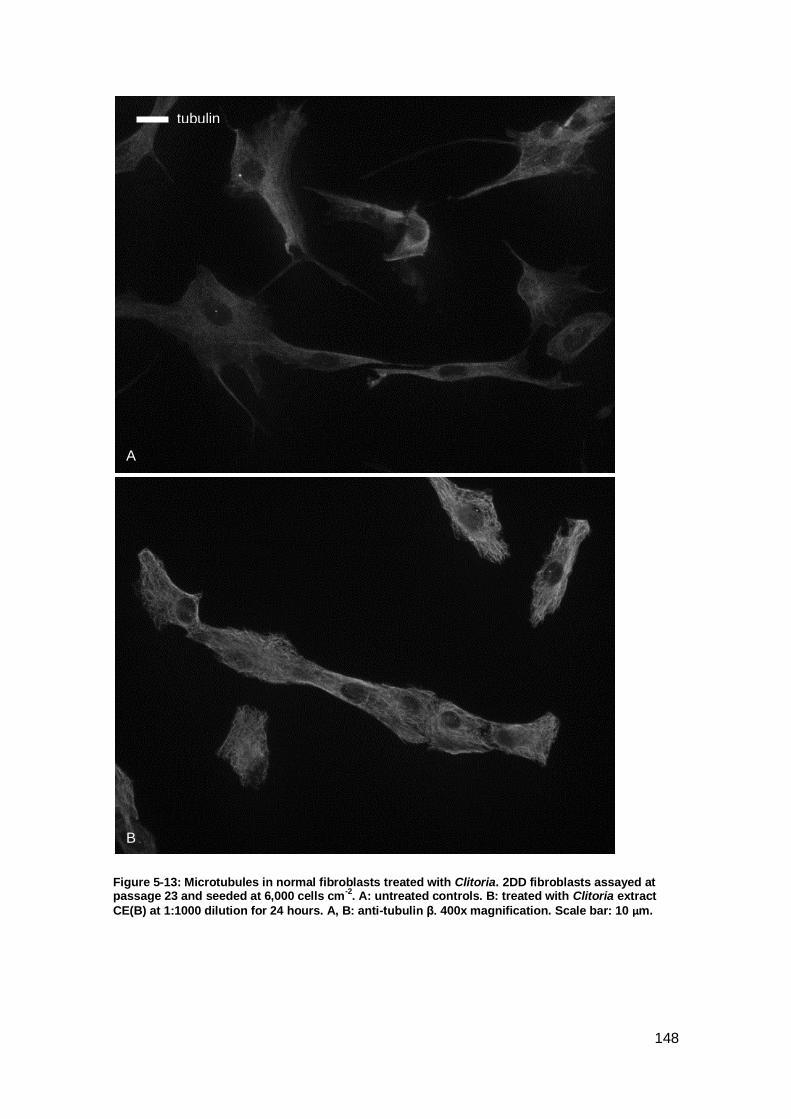
148
Figure 5-13: Microtubules in normal fibroblasts treated with Clitoria. 2DD fibroblasts assayed at passage 23 and seeded at 6,000 cells cm
-2. A: untreated controls. B: treated with Clitoria extract
CE(B) at 1:1000 dilution for 24 hours. A, B: anti-tubulin β. 400x magnification. Scale bar: 10 µm.
C F
A
B
E
F
tubulin
149
5.2.4 Nucleoli
The nucleolus is a structure within the nucleus where synthesis of ribosomal
components and assembly of the ribosome take place (Quin et al., 2014) and which
detects many forms of cellular stress, leading to the accumulation of p53 via the
nucleolar stress pathway (Rubbi and Milner, 2003). Nucleoli form around actively
transcribing 47S ribosomal RNA subunit precursors during early G1 and disassemble
at prophase in mitosis (Quin et al., 2014). A mature nucleolus has three distinct
regions: fibrillar centres, surrounded by dense fibrillar components, situated within
granular components (Kill, 1996). Chemotherapy drugs that intercalate DNA such as
cisplatin also damage rDNA and thereby inhibit RNA Polymerase I transcription and
ribosome biogenesis (Burger et al., 2010). Other anticancer agents including
topoisomerase inhibitors and everolimus also affect ribosome biogenesis, either
directly or indirectly (Quin et al., 2014).
Many MDA-MB-231 breast cancer cells in interphase developed transparent nucleoli
after 4-6 hours of Clitoria treatment which remained visible until the end of live cell
observation at 48 hours (Figure 5-14). This phenomenon was repeatedly seen in
different experiments, both in live cell imaging and in cell viability assays. It was also
seen in the same cell line after treatment with fractions F17 and F18. In one live cell
observation with a 88 ng/µL treatment of fraction F17 of Clitoria extract CE(B), 93% of
MDA-MB-231 cancer cells developed transparent nucleoli at between 2.5 and 20 hours
of treatment (mean 11 hours, N=27). Transparent nucleoli were not seen in untreated
cells, treated normal cells or treated MCF-7 cancer cells. However, in one cell viability
assay where cells were observed at the end of the 72-hour incubation, nucleoli
appeared normal, suggesting that cells are able to recover.

150
Figure 5-14: Transparent nucleoli in breast cancer epithelial cells treated with Clitoria. A, B: Phase contrast images of MDA-MB-231 breast cancer epithelial cells, untreated (A) or after 5 hours treatment with Clitoria extract CE(B) at 1:2000 dilution (B). Example transparent nucleoli arrowed.
200x magnification. Scale bar: 10 µm.
The transparent nucleoli appeared similar to those observed by Burger et al. (2010)
after treatment with cisplatin, therefore it was thought that Clitoria’s mechanism of
action might include targeting ribosome synthesis in the nucleoli. To find out more
about how the nucleoli were affected by treatment, MDA-MB-231 breast cancer cells
and normal fibroblasts were treated with 700 ng/µL of fraction F17 or 420 ng/µL of
fraction F18 and stained for Ki-67. Ki-67 is associated with the nucleolus in interphase
and with the chromosomes in mitosis, and during nucleolar stress is released into the
nucleoplasm as a consequence of loss of nucleolar integrity (Soldani et al., 2006). As
the concentrations of the two purified fractions isolated in HPLC were different, cancer
cells were observed hourly and fixed when changes were seen in the treated cells. F17
treated cells and controls were fixed after 2 hours when rounding, indicative of cell
stress, was observed (Figure 5-15 B), and F18 treated cells and controls were fixed
after 5 hours when some cancer cells developed transparent nucleoli. Phase contrast
images of control cancer cells before fixing showed some cells apparently in mitosis
(Figure 5-15 A), although after fixing and staining few control cells could be seen with
Ki-67 associated with chromosomes, indicative of mitosis (one is visible in Figure 5-19
A), suggesting some rounded cells in mitosis may have detached from the slide during
fixing. No treated cancer cells were in mitosis and few were rounded as had been seen
A B

151
in phase contrast images. This supported the hypothesis that the treatments cause
cells to lose attachment when they are rounded, either in mitosis or through stress.
Overall, Ki-67 staining in foci was less intense in the treated cancer cells than controls
and there was cytoplasmic Ki-67 in some F17 treated cells, suggesting a loss of
nucleolar integrity as a consequence of stress (Figure 5-18), not seen in Figure 5-16 or
Figure 5-23, probably due to different fixing protocols. Ki-67 tends to form many smaller
foci during G1 phase and fewer, larger foci during S and G2 phases (Kill, 1996). In
addition, cells treated with the kinase inhibitor and transcription inhibitor 5, 6-dichloro-1-
β-D-ribofuranosylbenzimidazole (DRB) display many small Ki-67 foci (Kill, 1996).
However, in cancer cells that stained positive for Ki-67, there was no apparent
difference in the number and size of foci between control and treated cells (Figure 5-16
to Figure 5-19), therefore no conclusion could be drawn concerning transcription
inhibition. No connection could be made between the transparent nucleoli and the
appearance of Ki-67 staining in cancer cells.
Figure 5-15: Morphology of cancer cells treated with Clitoria fraction F18. Phase contrast images of MDA-MB-231 breast cancer epithelial cells, untreated (A) or after 5 hours treatment with Clitoria fraction F18 at 420 ng/µL (B) A: cells appear flat as in interphase (arrow) or rounded as in mitosis (arrowhead). B: cells appear rounded as if stressed (arrows) and some show transparent nucleoli
(arrowheads). 200x magnification. Scale bar: 20 µm.
Over time, a population of normal cells in culture gradually enters a state of irreversible
growth arrest known as senescence, which is distinct from the reversible state of
growth arrest called quiescence (Rodier and Campisi, 2011). Absence of Ki-67 staining
A B

152
is a marker of cell senescence (Lawless et al, 2010). As expected with normal
fibroblasts, a small number stained negative for Ki-67 indicating they were senescent
(Figure 5-21). Similar to cancer cells, Ki-67 foci were less intensely stained and some
cells treated with fractions F17 or F18 showed cytoplasmic Ki-67 (Figure 5-20, Figure
5-22). There was no consistent difference in the Ki-67 foci between control and treated
fibroblasts. Fewer cells remained on slides than expected, suggesting some had lost
adherence during fixing, either through the effects of treatment or through rounding in
mitosis. Ki-67 staining in these experiments showed that treated cells were stressed,
but did not help to explain the appearance of transparent nucleoli.

153
Figure 5-16: Ki-67 and actin staining in breast cancer epithelial cells treated with fraction F17 of Clitoria. MDA-MB-231 cells seeded at 10,000 cells cm
-2. A, C: untreated controls. B, D: treated with
Clitoria extract CE(B) fraction F17 at 700 ng/µL for 2 hours. A, B: Ki-67. C, D: F-actin. Arrows: granular actin. Dotted arrows: actin prominent at plasma membrane. Arrowhead: cell staining
negative for Ki-67. 400x magnification. Scale bar: 10 µm.
C
B
D
F-actin
A
Ki-67

154
Figure 5-17: Ki-67 and actin staining in breast cancer epithelial cells treated with fraction F18 of Clitoria. MDA-MB-231 cells seeded at 10,000 cells cm
-2. A, C: untreated controls. B, D: treated with
Clitoria extract CE(B) fraction F18 at 420 ng/µL for 5 hours. A, B: Ki-67. C, D: F-actin. 400x
magnification. Scale bar: 10 µm.
A
C
B
D
F-actin
Ki-67
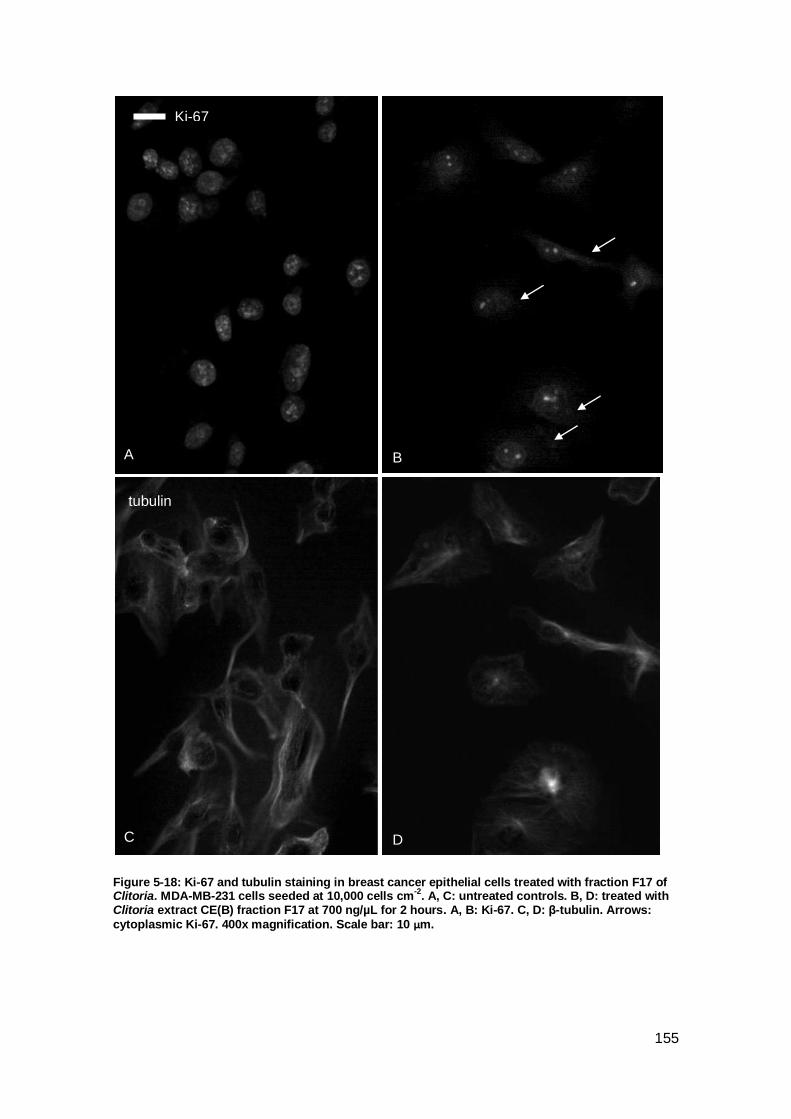
155
Figure 5-18: Ki-67 and tubulin staining in breast cancer epithelial cells treated with fraction F17 of Clitoria. MDA-MB-231 cells seeded at 10,000 cells cm
-2. A, C: untreated controls. B, D: treated with
Clitoria extract CE(B) fraction F17 at 700 ng/µL for 2 hours. A, B: Ki-67. C, D: β-tubulin. Arrows:
cytoplasmic Ki-67. 400x magnification. Scale bar: 10 µm.
A
C
B
D
tubulin
Ki-67

156
Figure 5-19: Ki-67 and tubulin staining in breast cancer epithelial cells treated with fraction F18 of Clitoria. MDA-MB-231 cells seeded at 10,000 cells cm
-2. A, C: untreated controls. B, D: treated with
Clitoria extract CE(B) fraction F18 at 420 ng/µL for 2 hours. A, B: Ki-67. C, D: β-tubulin. Arrows:
cells in mitosis. Arrowhead: cell negative for Ki-67. 400x magnification. Scale bar: 10 µm.
A
C D
B
tubulin
Ki-67

157
A
B
Ki-67
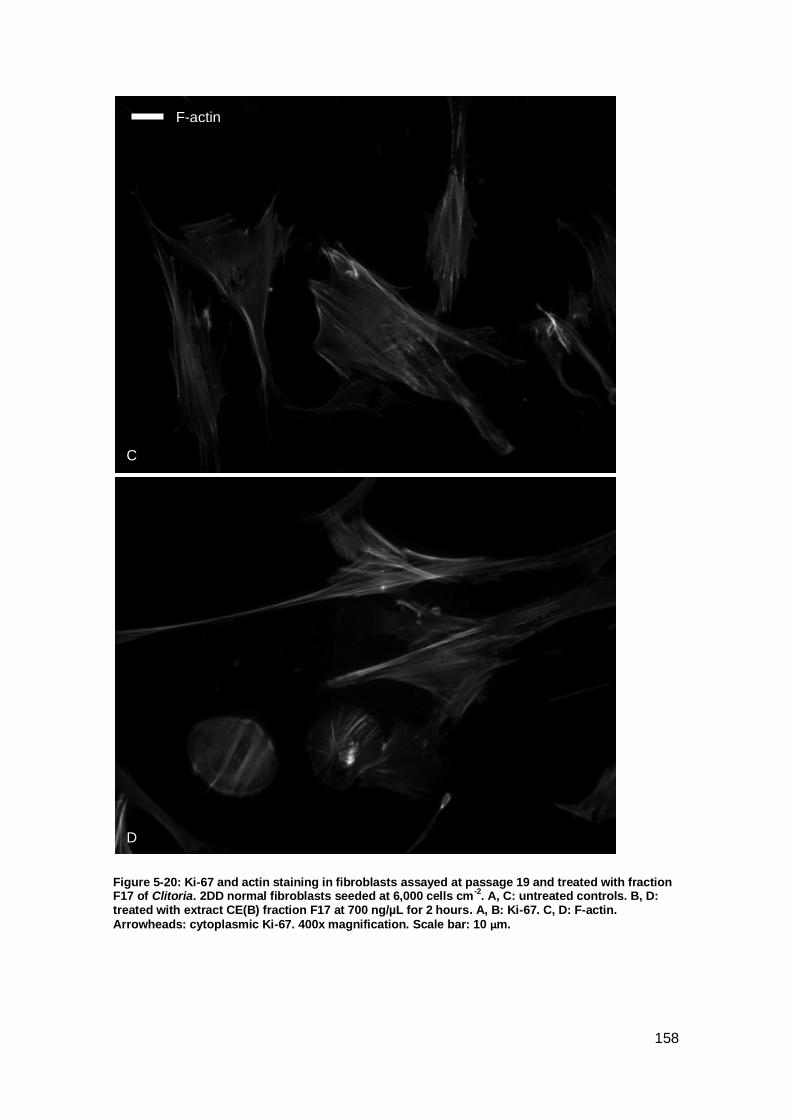
158
Figure 5-20: Ki-67 and actin staining in fibroblasts assayed at passage 19 and treated with fraction F17 of Clitoria. 2DD normal fibroblasts seeded at 6,000 cells cm
-2. A, C: untreated controls. B, D:
treated with extract CE(B) fraction F17 at 700 ng/µL for 2 hours. A, B: Ki-67. C, D: F-actin.
Arrowheads: cytoplasmic Ki-67. 400x magnification. Scale bar: 10 µm.
C
D
F-actin
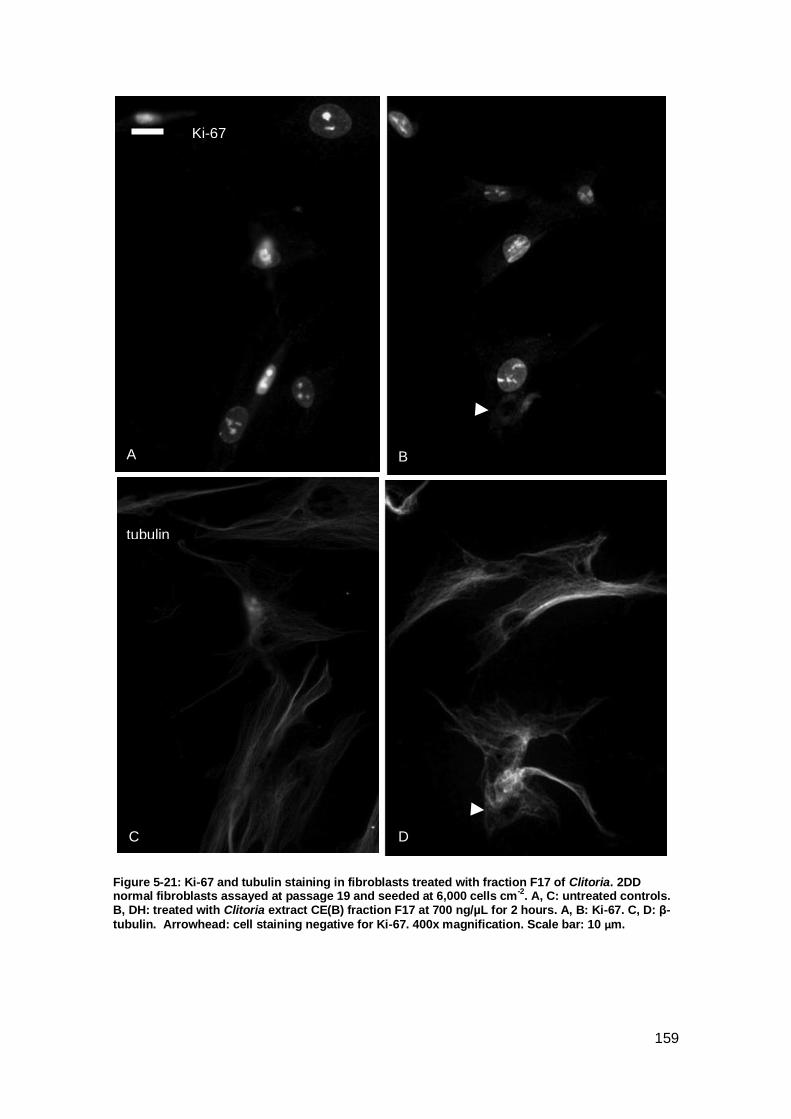
159
Figure 5-21: Ki-67 and tubulin staining in fibroblasts treated with fraction F17 of Clitoria. 2DD normal fibroblasts assayed at passage 19 and seeded at 6,000 cells cm
-2. A, C: untreated controls.
B, DH: treated with Clitoria extract CE(B) fraction F17 at 700 ng/µL for 2 hours. A, B: Ki-67. C, D: β-
tubulin. Arrowhead: cell staining negative for Ki-67. 400x magnification. Scale bar: 10 µm.
A
C
B
D
Ki-67
tubulin
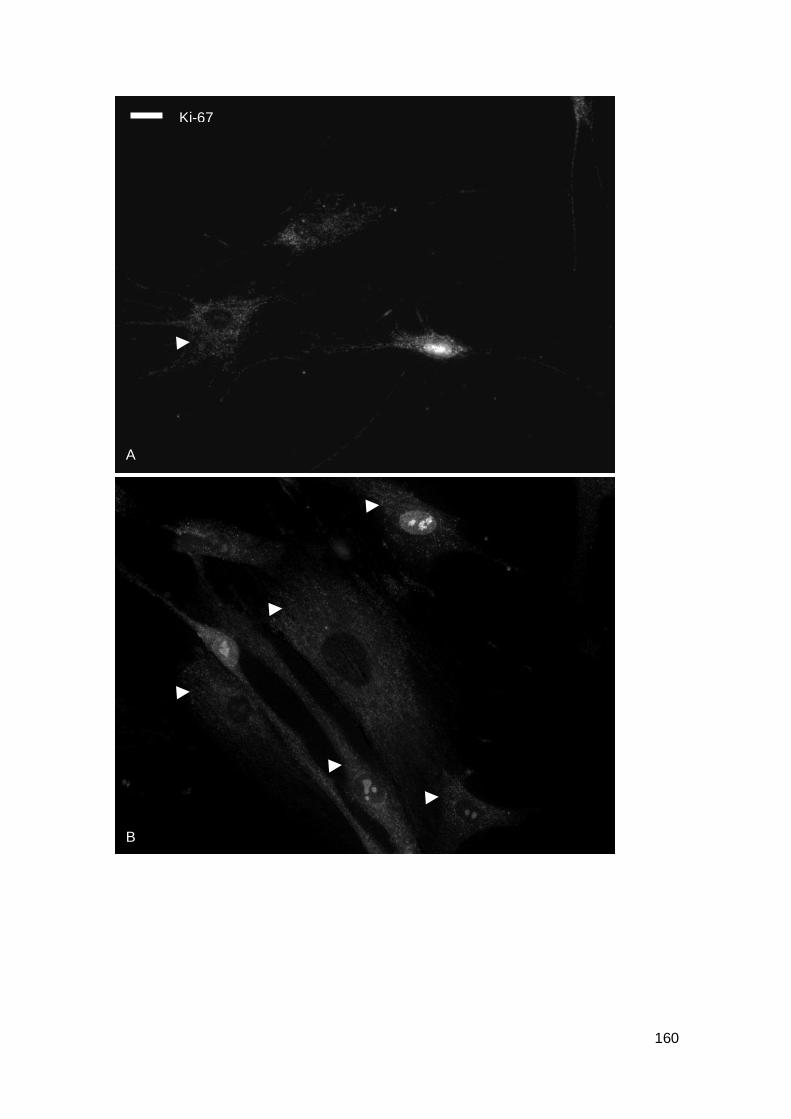
160
G
A
B
Ki-67

161
Figure 5-22: Ki-67 and actin staining in fibroblasts treated with fraction F18 of Clitoria. 2DD normal fibroblasts assayed at passage 21 and seeded at 6,000 cells cm
-2. A, C: untreated controls. B, D:
treated with Clitoria extract CE(B) fraction F18 at 420 ng/µL for 5 hours. A, B: Ki-67. C, D: F-actin. Arrowheads: cytoplasmic Ki-67. Arrows: noticeable stress fibres in treated cells. 400x
magnification. Scale bar: 10 µm.
C
D
F-actin
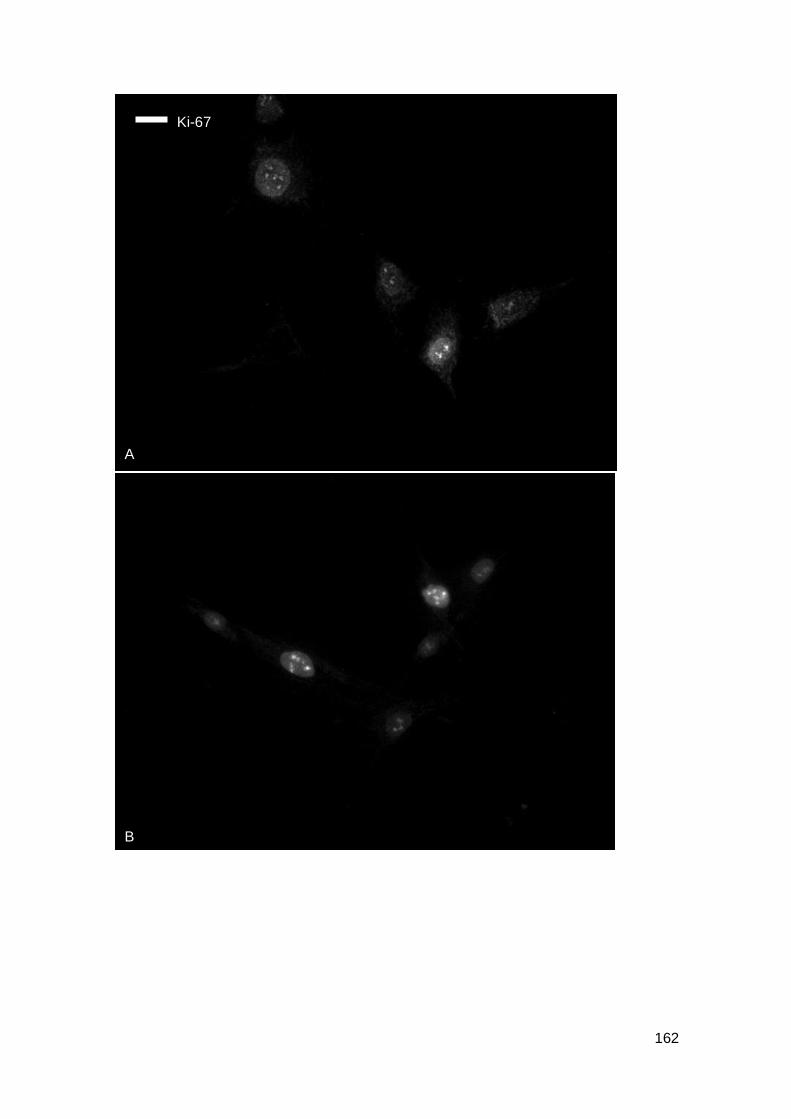
162
A
B
Ki-67
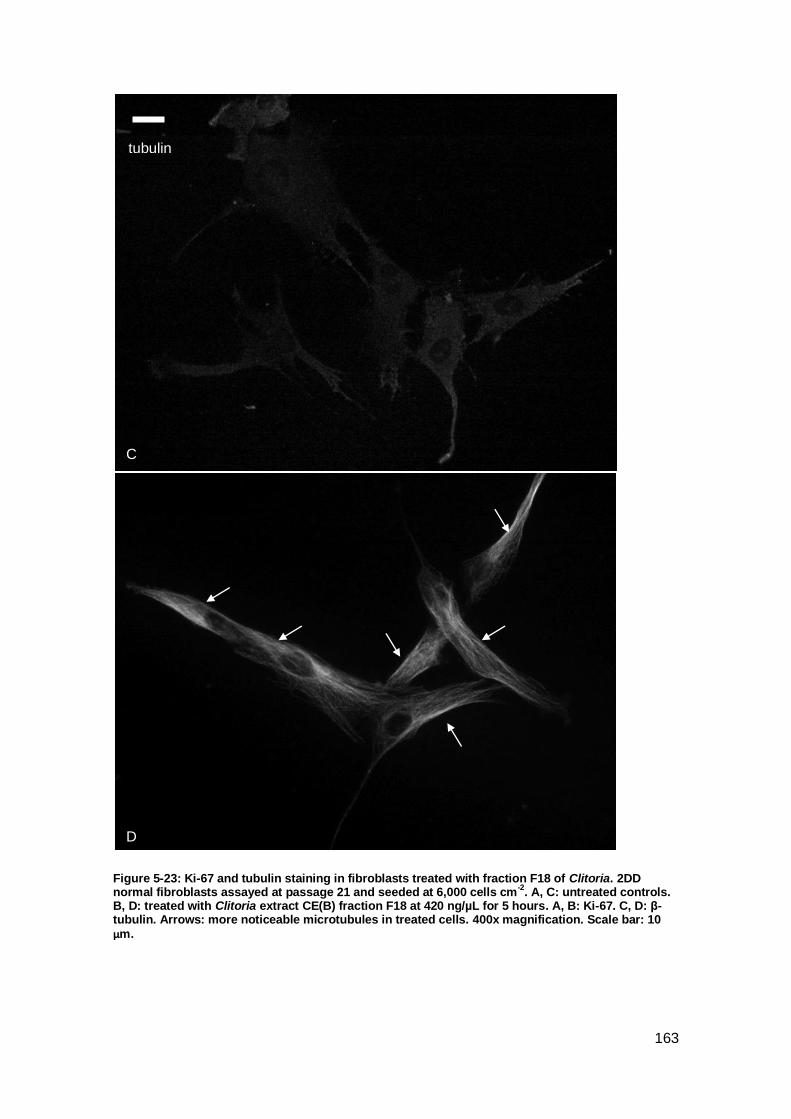
163
Figure 5-23: Ki-67 and tubulin staining in fibroblasts treated with fraction F18 of Clitoria. 2DD normal fibroblasts assayed at passage 21 and seeded at 6,000 cells cm
-2. A, C: untreated controls.
B, D: treated with Clitoria extract CE(B) fraction F18 at 420 ng/µL for 5 hours. A, B: Ki-67. C, D: β-tubulin. Arrows: more noticeable microtubules in treated cells. 400x magnification. Scale bar: 10
µm.
C
D
tubulin
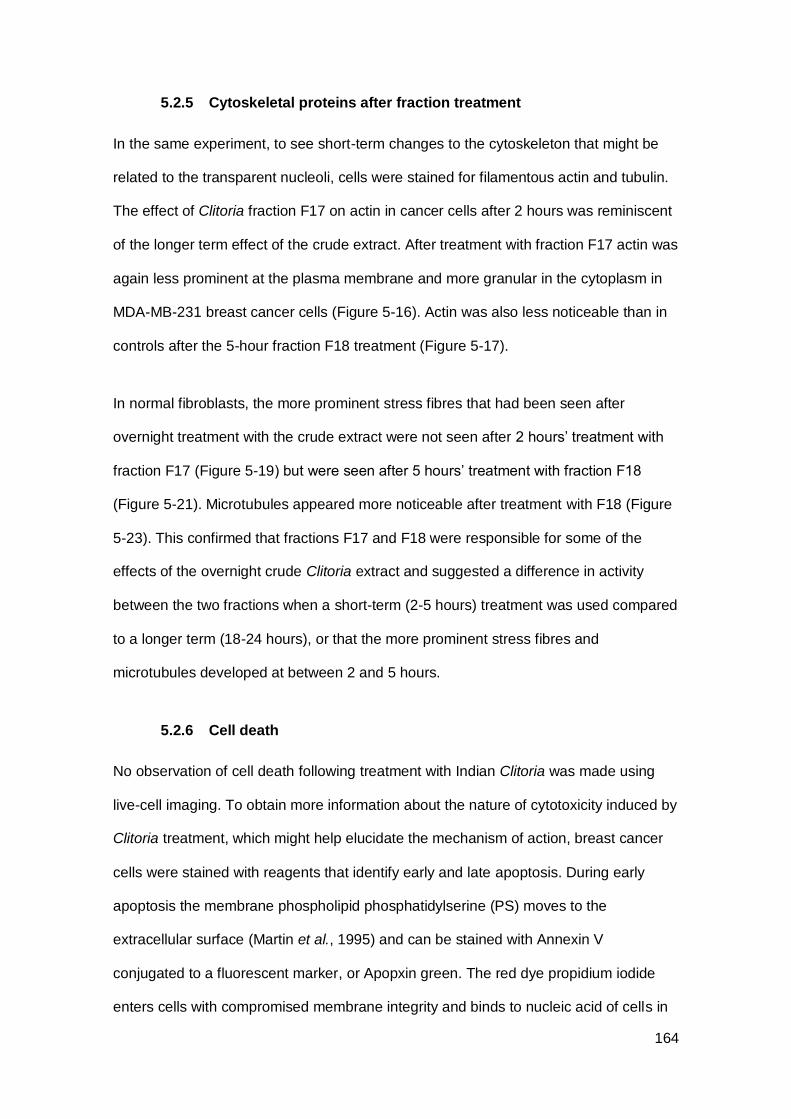
164
5.2.5 Cytoskeletal proteins after fraction treatment
In the same experiment, to see short-term changes to the cytoskeleton that might be
related to the transparent nucleoli, cells were stained for filamentous actin and tubulin.
The effect of Clitoria fraction F17 on actin in cancer cells after 2 hours was reminiscent
of the longer term effect of the crude extract. After treatment with fraction F17 actin was
again less prominent at the plasma membrane and more granular in the cytoplasm in
MDA-MB-231 breast cancer cells (Figure 5-16). Actin was also less noticeable than in
controls after the 5-hour fraction F18 treatment (Figure 5-17).
In normal fibroblasts, the more prominent stress fibres that had been seen after
overnight treatment with the crude extract were not seen after 2 hours’ treatment with
fraction F17 (Figure 5-19) but were seen after 5 hours’ treatment with fraction F18
(Figure 5-21). Microtubules appeared more noticeable after treatment with F18 (Figure
5-23). This confirmed that fractions F17 and F18 were responsible for some of the
effects of the overnight crude Clitoria extract and suggested a difference in activity
between the two fractions when a short-term (2-5 hours) treatment was used compared
to a longer term (18-24 hours), or that the more prominent stress fibres and
microtubules developed at between 2 and 5 hours.
5.2.6 Cell death
No observation of cell death following treatment with Indian Clitoria was made using
live-cell imaging. To obtain more information about the nature of cytotoxicity induced by
Clitoria treatment, which might help elucidate the mechanism of action, breast cancer
cells were stained with reagents that identify early and late apoptosis. During early
apoptosis the membrane phospholipid phosphatidylserine (PS) moves to the
extracellular surface (Martin et al., 1995) and can be stained with Annexin V
conjugated to a fluorescent marker, or Apopxin green. The red dye propidium iodide
enters cells with compromised membrane integrity and binds to nucleic acid of cells in
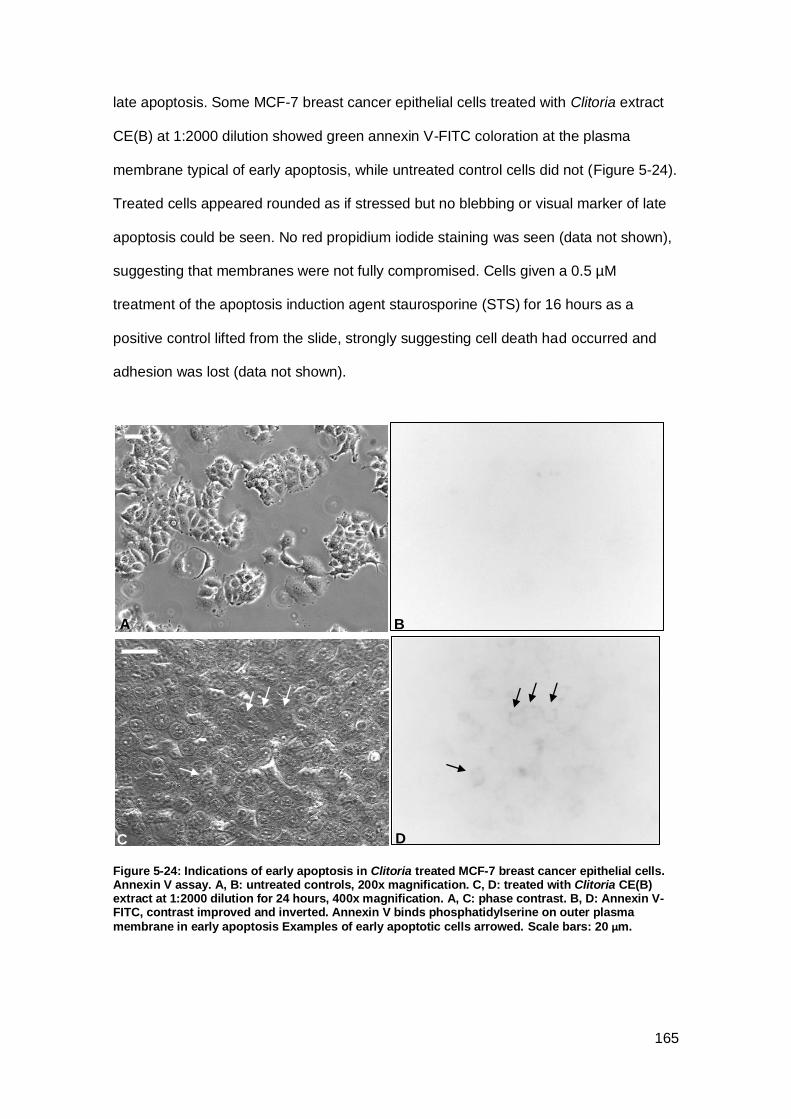
165
late apoptosis. Some MCF-7 breast cancer epithelial cells treated with Clitoria extract
CE(B) at 1:2000 dilution showed green annexin V-FITC coloration at the plasma
membrane typical of early apoptosis, while untreated control cells did not (Figure 5-24).
Treated cells appeared rounded as if stressed but no blebbing or visual marker of late
apoptosis could be seen. No red propidium iodide staining was seen (data not shown),
suggesting that membranes were not fully compromised. Cells given a 0.5 µM
treatment of the apoptosis induction agent staurosporine (STS) for 16 hours as a
positive control lifted from the slide, strongly suggesting cell death had occurred and
adhesion was lost (data not shown).
Figure 5-24: Indications of early apoptosis in Clitoria treated MCF-7 breast cancer epithelial cells. Annexin V assay. A, B: untreated controls, 200x magnification. C, D: treated with Clitoria CE(B) extract at 1:2000 dilution for 24 hours, 400x magnification. A, C: phase contrast. B, D: Annexin V-FITC, contrast improved and inverted. Annexin V binds phosphatidylserine on outer plasma
membrane in early apoptosis Examples of early apoptotic cells arrowed. Scale bars: 20 µm.
A
C D
B
166
Figure 5-25: Indications of early apoptosis in Clitoria treated MDA-MB-231 breast cancer epithelial cells. A, B: untreated controls. C, D: treated with CE(B) extract at 1:2000 dilution for 24 hours. E, F: treated with 1.5 µM staurosporine for 2 hours. A, C, E: CytoCalcein
TM Violet 450 staining cytoplasm.
B, D, F: Apopxin green, contrast enhanced and inverted. Apopxin green stains phosphatidylserine on outer plasma membrane in early apoptosis. Examples of early apoptotic cells arrowed.
Apoptotic and necrotic detection assay. 400x magnification. Scale bars: 10 µm.
An apoptotic and necrotic detection assay with Apopxin green was trialled to obtain
better staining of apoptotic cells. Some MD-MB-231 breast cancer epithelial cells
treated with Clitoria extract CE(B) showed signs of early apoptosis with Apopxin green
staining at the cell membrane (Figure 5-25 D). Cells treated with 1.5 µM STS for 2
A B
C D
E F
167
hours were rounded and smaller than controls, and some stained faintly positive for
Apopxin green at the plasma membrane, suggesting they were in early apoptosis
(Figure 5-25 E, F). No propidium iodide stain to indicate late apoptosis was seen in any
cells in this assay (data not shown).
Further assays would have been necessary to refine the protocols for the apoptosis
assays for optimum staining, but this was not done due to limitations in the supply of
extract. Nonetheless, the images did not exclude the possibility that cells treated with
Clitoria at these dilutions were in early apoptosis.
5.2.7 Summary
In summary, the effects on cell division, speed of mitosis, appearance of actin and
transparent nucleoli that were seen with crude Clitoria extract were also seen with one
or more treatments of the bioactive fractions F17 or F18. The reduced motility and
reduced membrane fluttering that had been seen with the crude extract were not seen
after treatment with a fraction (Table 5-1).
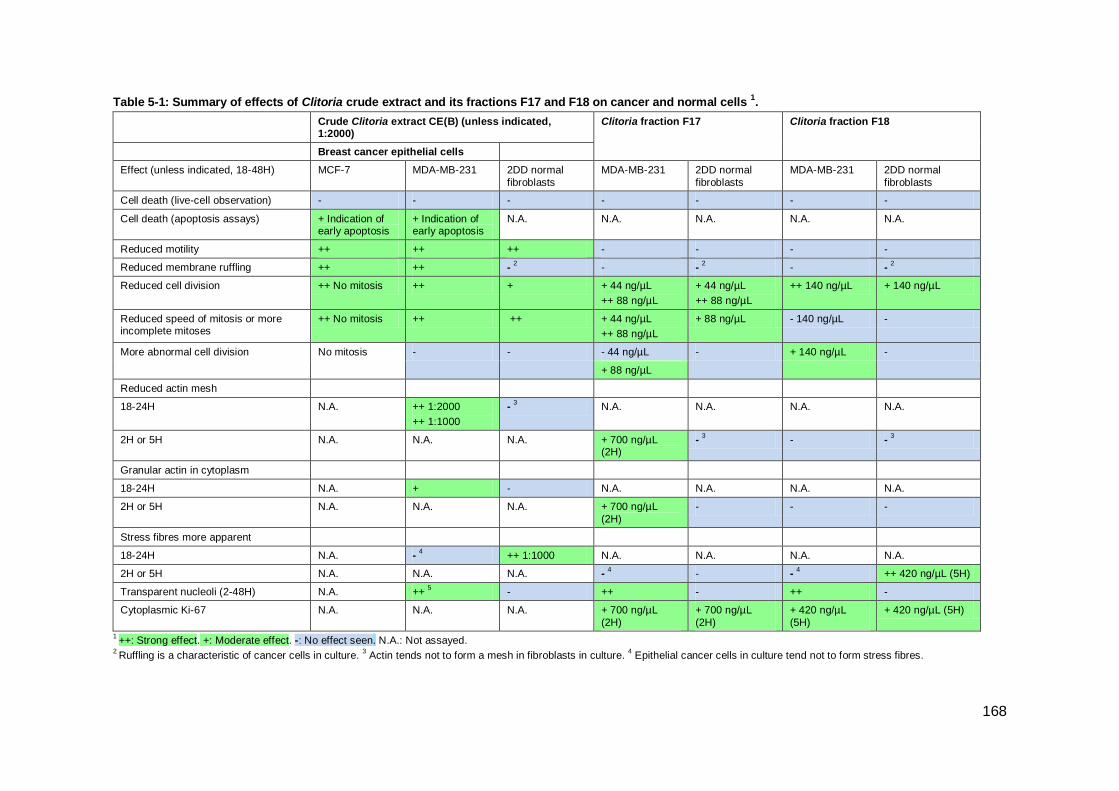
168
Table 5-1: Summary of effects of Clitoria crude extract and its fractions F17 and F18 on cancer and normal cells 1.
Crude Clitoria extract CE(B) (unless indicated, 1:2000)
Clitoria fraction F17 Clitoria fraction F18
Breast cancer epithelial cells
Effect (unless indicated, 18-48H) MCF-7 MDA-MB-231 2DD normal
fibroblasts
MDA-MB-231 2DD normal
fibroblasts
MDA-MB-231 2DD normal
fibroblasts
Cell death (live-cell observation) - - - - - - -
Cell death (apoptosis assays) + Indication of early apoptosis
+ Indication of early apoptosis
N.A. N.A. N.A. N.A. N.A.
Reduced motility ++ ++ ++ -
-
-
-
Reduced membrane ruffling ++ ++ - 2
-
- 2
-
- 2
Reduced cell division ++ No mitosis ++ + + 44 ng/µL
++ 88 ng/µL
+ 44 ng/µL
++ 88 ng/µL
++ 140 ng/µL
+ 140 ng/µL
Reduced speed of mitosis or more incomplete mitoses
++ No mitosis
++ ++ + 44 ng/µL
++ 88 ng/µL
+ 88 ng/µL
- 140 ng/µL -
More abnormal cell division No mitosis
- - - 44 ng/µL - + 140 ng/µL
-
+ 88 ng/µL
Reduced actin mesh
18-24H N.A. ++ 1:2000
++ 1:1000
- 3
N.A. N.A. N.A. N.A.
2H or 5H N.A. N.A. N.A. + 700 ng/µL (2H)
- 3
- - 3
Granular actin in cytoplasm
18-24H N.A. + - N.A. N.A. N.A. N.A.
2H or 5H N.A. N.A. N.A. + 700 ng/µL
(2H)
- - -
Stress fibres more apparent
18-24H N.A. - 4
++ 1:1000 N.A. N.A. N.A. N.A.
2H or 5H N.A. N.A. N.A. - 4
- - 4
++ 420 ng/µL (5H)
Transparent nucleoli (2-48H) N.A. ++ 5
- ++
- ++
-
Cytoplasmic Ki-67 N.A. N.A. N.A. + 700 ng/µL
(2H)
+ 700 ng/µL
(2H)
+ 420 ng/µL
(5H)
+ 420 ng/µL (5H)
1 ++: Strong effect. +: Moderate effect. -: No effect seen. N.A.: Not assayed.
2 Ruffling is a characteristic of cancer cells in culture.
3 Actin tends not to form a mesh in fibroblasts in culture.
4 Epithelial cancer cells in culture tend not to form stress fibres.
169
5.3 Discussion
Cell viability assay results had led to the hypothesis that Clitoria and its cytotoxic
fractions F17 and F18 were targeting actively cycling cells, like current chemotherapy
drugs, resulting in higher sensitivity in cancer cells which cycle faster than normal cells.
Live-cell observation showed that cell division was affected by Clitoria treatment,
therefore it was suspected that Clitoria might be acting as an inhibitor of microtubule
function like the taxanes and vinca alkaloids which also derive from natural products.
Cell movement was also affected, therefore the actin cytoskeleton was also considered
a target. Unexpectedly, when the cytoskeletal proteins were viewed with fluorescence
microscopy, microtubules were almost unaffected by treatment and the actin
cytoskeleton was substantially disrupted. Clitoria’s cytotoxic mechanism seen with
breast cancer cells appeared to be acting principally through the actin cytoskeleton.
Fraction F17’s effects on the actin cytoskeleton over a short (2 hour) period were
reminiscent of the effects of crude extract after an 18 or 24 hour period. Live-cell
imaging and fluorescence microscopy provided detailed information for small samples
of cells which showed that cancer cells were more sensitive than normal cells to effects
of Clitoria and F17 during mitosis.
The disruption in the actin cytoskeleton in cancer cells treated with Clitoria and F17
consisted of a reduction of actin mesh at the cell cortex and a granular appearance in
filamentous actin visible after 24 hours treatment with crude extract and to a lesser
degree after 2 hours treatment with F17. This was similar to, but not as pronounced as,
that seen by Kulms et al. (2002) when cervical cancer cells were treated with 100 µM of
the actin destabiliser cytochalasin B for 1 hour. It was also similar to the effects of the
actin stabiliser jasplakinolide seen by Senderowicz et al. (1995), where actin mesh was
reduced at the cell cortex and actin aggregates appeared in prostate cancer cells after
80 nM treatment for 1 hour. However, cell types vary in response as other authors
report that jasplakinolide increased stress fibres in lung cancer cells and increased
170
actin mesh in breast cancer cells (Hayot et al., 2006). This apparent paradox of actin
stabilisers and destabilisers having similar effects may be explained by jasplakinolide’s
secondary mechanism of action, increasing the rate of actin nucleation and reduction of
the concentration of actin monomers available for microfilament formation (Bubb et al.,
2000). As stabilisers and destabilisers of actin filaments can have similar effects and
cell type specific effects, it is difficult to draw any conclusions from fluorescence
microscopy results about whether Clitoria and F17 act through a stabilising or
destabilising mechanism.
The possibility of a disrupted actin cytoskeleton being responsible for the other effects
seen with Clitoria, namely reduced and slower cell division, reduced cell motility and
indications of cell death, was considered. Clitoria completely blocked cell division in
breast cancer cells and reduced cell division in normal fibroblasts, and fraction F17
reduced cell division in both cell lines in a dose dependent manner. Moreover, treated
cells that entered mitosis spent longer in the rounded state before progressing to
cytokinesis. During mitosis, actin filaments and microtubules associate to organise the
spindle and position the metaphase plate, and in cervical cancer cells in culture, astral
microtubules, connected to actin retraction fibres that tether the cell to the substrate,
may provide pulling forces for correct spindle positioning (Théry et al., 2007). If
microtubule-associated actin filaments or retraction fibres are disrupted, proper
positioning of the spindle could be prevented or delayed, leading to the prolonged
mitosis seen with Clitoria on normal fibroblasts and the considerably extended or
incomplete mitosis seen with fraction F17 on cancer cells. In support of this, the actin
destabilizing drug latrunculin can cause spindles to form asymmetrically in yeast
(Theesfeld et al., 1999). A reduction in cell division was also seen in three prostate
cancer cell lines treated with jasplakinolide for 48 hours, with 50% growth reduction at
treatments of 41-170 nM (Senderowicz et al., 1995).
171
More F17 treated cancer cells (11%) appeared to undergo a prolonged and abnormal
cytokinesis, compared to controls (6%), suggesting a defect in the formation of the
contractile ring. Treated daughter cells were observed to pull against each other, while
the plasma membranes on all sides showed gross blebbing. The contractile ring is
formed of actomyosin fibres and can be incorrectly positioned if actin retraction fibres
cannot align it correctly (Théry et al., 2007). Cytochalasin B treatment can prevent the
formation of a contractile ring and cleavage furrow in liver cancer cells (Cimini et al.,
1998). Frequently, binucleated and multinucleated cells have been seen after treatment
with cytochalasin B (Somers and Murphey, 1982; Zieve, 1884) or jasplakinolide
(Senderowicz et al., 1995). Binucleation can occur in the absence of a functional
contractile ring (Wu et al., 2010). No increase in binucleation was seen in treated cells
in this study, but it cannot be ruled out that with a higher concentration of F17, or if the
period of observation was longer, cells with abnormal cytokinesis might have failed to
divide resulting in binucleation.
Another mechanism whereby actin cytoskeleton disruption might cause blebbing during
cytokinesis is suggested by evidence from Werner et al. (2013). Similar blebbing and
shape deformation during cytokinesis were seen when levels of an actin capping
protein, EPS8, were prevented from rising in late mitosis (Werner et al., 2013). EPS8,
which promotes actin mesh construction, is degraded to allow rounding in
prometaphase, and levels rise at cytokinesis to permit the cortex to reform at distal
ends of daughter cells for separation (Werner et al., 2013). EPS8 is upregulated in 60%
of human breast cancer samples and in the cell line MDA-MB-231, where it promotes
cell proliferation and migration (Chen et al., 2015). Clitoria and F17 may be targeting an
actin binding protein that, like EPS8, regulates the actin cytoskeleton in a temporal
manner. A limitation of live-cell imaging is that the field of view includes a relatively
small sample of cells. A larger sample would be required to see whether the abnormal
cytokinesis events are a statistically significant result of treatment.

172
Results from cell viability assays and cell counting suggested strongly that Clitoria and
its bioactive fractions caused cell death, yet cell death was not observed in live-cell
imaging and only faint early signs of apoptosis were seen in assays designed to detect
early and late apoptosis. Although non-lethal treatments were chosen for live-cell
observation it is surprising that no increase in cell death was seen after treatment and
calls into question the conclusions from Chapters 3 and 4. Cells may appear to be
dying in the cell viability assays and not in the live-cell imaging due to the different
presentations of data in the types of assay, or the small samples in live-cell imaging are
unrepresentative. More live-cell observations with a range of concentrations of extract
or fraction would be needed to confirm these results, and cell death should be
confirmed by more than one type of assay.
Targeting the actin cytoskeleton could initiate cell death. Binucleated cells are normally
arrested at the G1 checkpoint and undergo p53-dependent apoptosis (Woods et al.,
1995), therefore if this had occurred in the cell viability assays it could account for
some of the cell death in cells with functional p53, although not in MDA-MB-231 breast
cancer cells which have mutant p53 (Morse et al., 2005). As treated cells spend more
time in mitosis in a rounded state with less adhesion to the substrate they may be more
vulnerable to detachment. Treated cells in mitosis may be particularly liable to
detachment if Clitoria and F17 target actin retraction filaments that tether the cell to the
substrate and could also be detached during agitation inherent in the assay process,
and be lost in the supernatant. Detachment could initiate anoikis cell death in
anchorage-dependent cells (Gilmore, 2005). In the fluorescence microscopy assays,
dying cells may have lost adhesion and lifted off the glass slides during incubation in
the same way as the staurosporine treated cells. With higher dose treatments in the
cell viability assays cell death may have occurred through oncosis rather than
apoptosis due to loss of ATP, failure of ion channels and loss of membrane integrity
like with other chemotherapy drugs including doxorubicin (Weerasinghe and Buja,
173
2012). No one type of assay is sufficient for an assessment of cell death, and
consequently most authors use more than one. For example, Hwang et al. (2013),
used several, including an Annexin V-based assay and a caspase activation assay to
confirm apoptosis in cervical cancer cells when treated for 24-48 hours with 8 µM of
cytochalasin B. The activation of specific caspases could be detected with FLICA
assays as performed by Cheng et al. (2010), to discover which apoptotic pathways
were activated. Other forms of cell death assay would need to be run to resolve the
question of whether and to what extent Clitoria and the fractions trigger cell death, but
this was not done in this study due to limitations on the supply of extract.
Other groups have seen cell death after treatment with an actin targeting drug but the
precise mechanism by which actin destabilising drugs cause apoptosis is not clear.
Hwang et al. (2013) saw evidence for an increase of reactive oxygen species, arrest in
S phase, and activation of a mitochondrial apoptosis pathway, with activated caspase-9
and caspase-3. This was in agreement with Kulms et al. (2002) where 50 µM
cytochalasin B for 1 hour caused a moderate level of apoptosis in cervical cancer cells,
cytochrome c release from mitochondria and caspase-3 cleavage. However,
cytochalasin B also caused clustering of the CD95/Fas receptor, suggesting that there
was crosstalk occurring between the extrinsic and intrinsic apoptosis pathways (Kulms
et al., 2002).
Disruption to the actin mesh stops lamellipodia formation, which inhibits cell migration,
as seen in pancreatic cancer cells when branching was inhibited by silencing of
ARP2/3 (Rauhala et al., 2013). Cell motility was reduced by 40-50% in both cell types
by Clitoria and less membrane ruffling was seen in breast cancer cells, suggesting that
actin cytoskeleton disruption was inhibiting the formation of lamellipodia (Borm et al.,
2005). Fraction F17 did not stop cell motility or ruffling, but as fluorescence microscopy
experiments showed a reduced actin cytoskeleton after a 2-hour treatment of 700
174
ng/µL of F17, the 88 ng/µL treatment in live-cell imaging may have been too low to
induce these effects. Actin targeting drugs can reduce cell motility: this was seen with
cytochalasin D in melanoma cells (Stracke et al., 1993) and with the actin stabiliser
curcumin in prostate cancer cells (Holy, 2004). It is also possible that another,
unisolated fraction in Clitoria is responsible for reduction in motility and ruffling.
Interestingly, normal fibroblasts treated with Clitoria for 24 hours or fraction F18 for 5
hours, but not F17 for 2 hours, displayed more noticeable stress fibres than untreated
controls, suggesting that F18 has a stabilising or growth-promoting effect on stress
fibres whereas F17 does not, or that 2 hours is too short a treatment time to see this.
Cancer cells, which tend not to form stress fibres (Wehrle-Haller and Imhof, 2003),
have a disrupted actin cytoskeleton when treated with Clitoria or fraction F17, but not
F18. This suggests either that the cell types respond differently to treatment, or that
F17 and F18 have subtly different effects on the cytoskeleton and Clitoria, which
includes both fractions, has the effects of both fractions. A cell type specific response
was seen with increased stress fibres in lung cancer cells and increased actin mesh in
breast cancer cells after 16 hours treatment with 10 nM jasplakinolide (Hayot et al.,
2006). In another example of a cell type specific response, a one hour treatment with
60 µM curcumin also caused androgen-dependent prostate cancer cells to develop
more prominent stress fibres but androgen-independent prostate cancer cells did not
(Holy, 2004). More experiments will be needed to resolve whether the more noticeable
stress fibres in fibroblasts in this study are a cell type specific or fraction specific
response.
To achieve the effects seen in this study on the actin cytoskeleton, Clitoria and its
bioactive fractions may bind directly to actin filaments or to upstream targets: Actin
binding proteins (ABPs), small Rho family GTPases or their effectors, or GEF or GAP
regulators of Rho GTPases which control their spatial and temporal activation. The
175
actin cytoskeleton includes many ABPs with overlapping roles in filament formation.
For instance, branched actin is nucleated by ARP2/3 and stress fibres rely on formins
for the same purpose (Olson and Sahai, 2009), therefore a Clitoria target with different
roles in branched and unbranched actin might explain the different effects on mesh and
stress fibres. Alternatively, the extract may target an ABP that is upregulated in cancer
cells such as the capping protein EPS8 that promotes mesh formation (Chen et al.,
2015), which could explain the distinction between cancer and normal cells’ responses.
If Clitoria and its fractions target a Rho GTPase, the most likely target is RhoA, as it
has a role in processes affected by Clitoria. In cell migration, active RhoA precedes
active Rac in lamella formation (Machacek et al., 2009) and RhoA can induce tail
retraction in cervical cancer cells (Kurokawa and Matsuda, 2005). Inhibition of RhoA
reduces membrane ruffling in cancer cells (Kurokawa and Matsuda, 2005), and
reduces adhesion (O’Connell et al., 1999). Experiments in Caenorhabditis elegans
showed that silenced RhoA prevents cleavage furrow formation (Jantsch-Plunger et al.,
2000), and when the Rho target ROCK was inhibited in human glioma cells, formation
of the cleavage furrow took three times longer than in control cells (Kosako et al.,
2000). Consequently, the abnormal cytokinesis seen in F17 treated cancer cells in this
study might be due to low activation of RhoA or a RhoA target kinase, leading to
incomplete cleavage furrow formation. However, RhoA inhibition would not explain the
increased stress fibre development seen in Clitoria and F18 treated fibroblasts, as
RhoA inhibition generally leads to less stress fibre development (Pellegrin and Mellor,
2007).
The bioactive agent in Clitoria could also exert its effects through inhibition or activation
of GEFs or GAPs. For example, the GEF Ect2 can bind to either RhoA or Rac at
different stages of mitosis, and both Ect2 and the GEF GEF-H1 control the positioning
of the contractile ring (D’Avino, 2009; Heng and Koh, 2010). In mouse embryo cells,
176
the GEF P190RhoGEF induces RhoA to form stress fibres but does not promote cell
membrane ruffling (van Horck et al., 2001) and activity of the GAP P190RhoGAP is
decreased during cell rounding in cervical cancer cells (Maddox and Burridge, 2003).
However, the functions of the RhoA regulators have not been fully elucidated, many
have multiple GTPase targets, and effects may be cell type specific, therefore a full
picture of their activities is not available.
Transparent nucleoli were visible in phase contrast in MDA-MB-231 breast cancer cells
after 2-5 hours of treatment with crude Clitoria extract, F17 or F18, and when observing
cells in cell viability assays, suggesting that treatments target the nucleoli. Many cancer
cells have dysregulated transcription and upregulated ribosome biogenesis, therefore
this might be a target where cancer cells were more vulnerable than normal cells.
Images of fibrosarcoma cells treated with the alkylating agent cisplatin which inhibits
transcription of rRNA genes also showed transparent nucleoli (Burger et al., 2010).
Actomyosin fibres are found in nucleoli where they may have a motor function in
elongation of ribosomal RNA transcripts (Fomproix and Percipalle, 2004), suggesting a
potential mechanism whereby actin disruption leads to reduced ribosome synthesis. Ki-
67 protein localises to the nucleoli in interphase (Kill, 1996). When F17-treated MDA-
MB-231 cells were stained with Ki-67, cytoplasmic Ki-67 increased, suggesting the
nucleolus structure was compromised and nucleolar contents were being released from
the nucleus into the cytoplasm. Environmental stresses and interruption of RNA
polymerase I transcription can compromise nucleolar integrity and trigger a nucleolar
stress response, by which nucleolar proteins in the nucleoplasm bind to mouse double
minute 2 and prevent its marking p53 for degradation (James et al., 2014). However,
the appearance of transparent nucleoli could not be associated with any other change
in Ki-67 staining or cell behaviour. As transparent nucleoli were not seen in any other
cell line, and were no longer apparent at 72 hours, it was concluded that they may be a
normal response of this cell line to stress.
177
In conclusion, Clitoria had distinct effects on cancer and normal cells which were more
pronounced on cancer cells, and Fraction F17 was responsible for most of the effects
seen with the crude extract. All the responses of cancer cells could be explained by
disruption to the actin cytoskeleton, which was seen in fluorescence microscopy with
Clitoria and F17. Although no cell death was seen, F17 appears to be targeting cells
during cell division, similarly to other cytotoxic agents, which would have proportionally
more effect on faster dividing cancer cells and may account for some of the difference
in cell viability between cancer and normal cells. Cell motility was also reduced by
Clitoria treatment and as inappropriate cell migration is a characteristic of metastatic
cancer cells and there are no agents in clinical use that target metastasis, this could be
a productive area for investigation. Fraction F18 appeared less potent than F17 and
was not seen to disrupt the actin cytoskeleton in cancer cells at the concentrations
tested. As a natural product extract, Clitoria is a complex mixture and it is not surprising
that a fraction did not induce the same response as the whole extract, or that the two
fractions had nonidentical effects. If more extract had been available, these
experiments could have been repeated to elucidate whether apparent differences
between the fractions were due to concentration, time of treatment or different
mechanisms of action, and whether higher treatment doses led to cell death.
5.4 Next steps
Experiments to elucidate the cytotoxic mechanism were limited by supplies of Indian
Clitoria extract, therefore root material was sourced from Jakarta, Indonesia and
Marlow, UK and extracted at Brunel. In the next stage of the study, the extractions
were compared with Indian Clitoria in HPLC and cell viability assays were run to
compare their cytotoxicity with Indian Clitoria (see Chapter 6, Alternative sources of
Clitoria). Work continued to identify the bioactive agents (see Chapter 7, Identification
of bioactive agents in Clitoria).
178
Chapter 6 Alternative sources of Clitoria
6.1 Introduction
When plant material is investigated for potentially useful secondary metabolites it must
be processed carefully to preserve the bioactive chemicals. Plant material is normally
washed thoroughly in distilled water immediately on collection, dried in shade to avoid
fungal growth and to minimise chemical reactions induced by UV radiation, and ground
to increase its surface area prior to extraction (Seidel, 2012). If the type of compound to
be extracted is known, an appropriate extraction method can be chosen and may be a
conventional extraction method – maceration, infusion, decoction or continuous
extraction in a Soxhlet – or one of the new non-conventional techniques such as
microwave- or ultrasound-assisted extraction (Brusotti et al., 2013). Soxhlet extraction
is popular as it requires little solvent and no expensive equipment, although the high
temperatures required to boil the solvent make it unsuitable for thermolabile
compounds (Bucar et al., 2013) such as carotenoids (Silva et al., 1998).
The role of the extraction solvent is to diffuse into plant cells, dissolve the secondary
metabolites and carry the compounds in solution (Seidel, 2012). Non-polar solvents
such as hexane extract non-polar compounds, for example fatty acids, sterols, some
terpenoids and alkaloids; medium polarity solvents such as chloroform are effective for
extraction of some alkaloids and flavonoids, as performed by Yam et al. (2010), and
polar solvents, for example methanol, are best for extracting polar compounds such as
flavonoid glycosides (Seidel, 2012). If the target compound is unknown, a standard
method for a series of extractions using progressively more polar solvents (hexane,
dichloromethane, ethyl acetate, methanol) may be followed and each extraction can be
analysed (Brusotti et al., 2013). After extraction the solvent is removed using rotary
evaporation or nitrogen gas for weighing of yield and to provide a more stable dried
product for chilled or freezer storage (Seidel, 2012). Water is less commonly used as a
179
solvent because solvents with lower boiling points reflux at lower temperatures and are
more quickly evaporated (Brusotti et al., 2013). Traditional medicine practitioners
typically use water as a solvent to prepare medicines as it is non-toxic and easily
available. If the target compound is unknown and the extract is a traditional medicine
then a solvent system close to that used in its preparation as a medicine is appropriate
(Brusotti et al., 2013).
The literature shows that simple, inexpensive solvents have been used for extractions
of Clitoria plant material without knowledge of the target secondary metabolites.
Kamilla et al. (2014) macerated both leaf and root in methanol to obtain extracts for an
anti-nociceptive assay on rats, and Jacob and Latha (2013) used a methanolic extract
of Clitoria seed with anticancer effect on a mouse model of Dalton’s lymphoma. An
ethanolic extract of Clitoria leaf was cytotoxic on brine shrimp (Das and Chatterjee,
2013). Water was used by Kelemu et al. (2004) to extract insectidal proteins from
Clitoria seed. Neda et al. (2013) made extracts of Clitoria flowers in both methanol and
water, finding that the aqueous extract was more cytotoxic on ovarian and breast
cancer cell lines than the methanolic extract. Water, methanol and chloroform were
also successful for extracting agents with antibacterial activity from Clitoria flowers,
while extracts obtained with organic solvents hexane and petroleum ether had no
antibacterial activity (Uma et al., 2009). With a known target, Kumar et al. (2008)
succeeded in extracting and isolating the terpenoid taraxerol from Clitoria root with four
48-hour macerations in ethanol.
It has been estimated that in a plant genome 15-25% of genes code for enzymes that
catalyse the synthesis of secondary metabolites (Pichersky and Gang, 2000). Many are
specific to a species, genus or family because the capacity for producing a new
secondary metabolite that offers evolutionary advantage is likely to be transmitted to
subsequent generations and to become prevalent in the local population (Hamberger
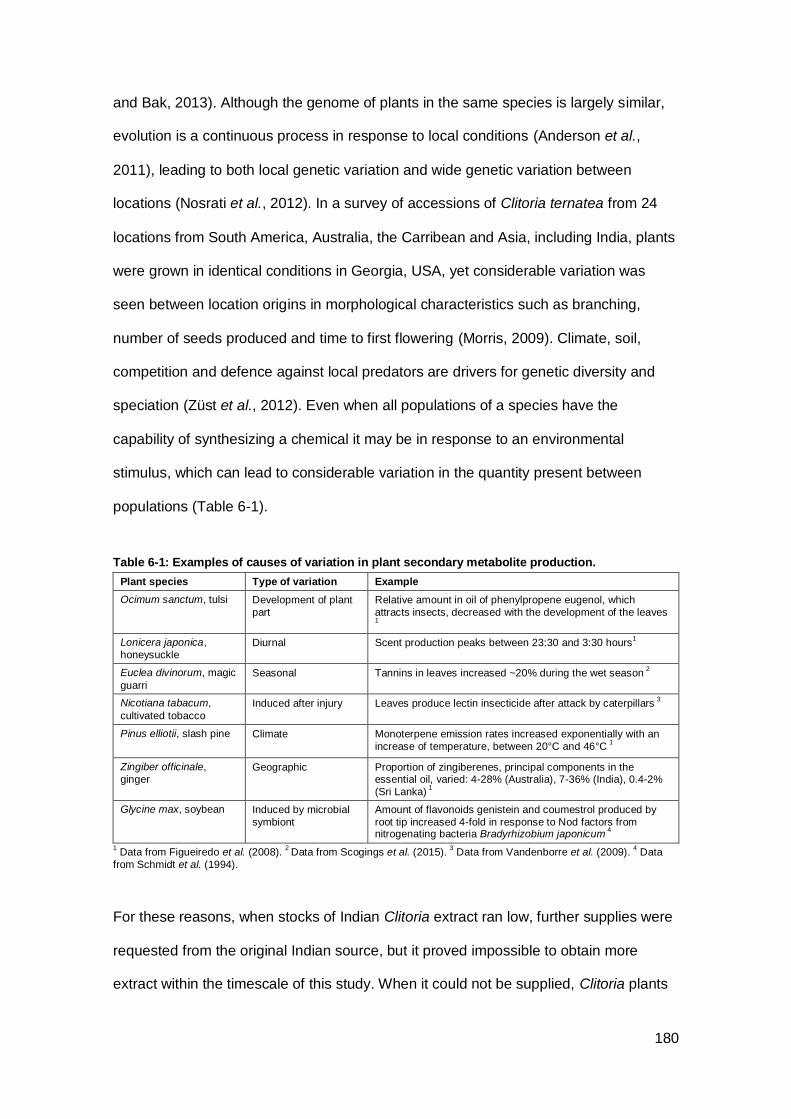
180
and Bak, 2013). Although the genome of plants in the same species is largely similar,
evolution is a continuous process in response to local conditions (Anderson et al.,
2011), leading to both local genetic variation and wide genetic variation between
locations (Nosrati et al., 2012). In a survey of accessions of Clitoria ternatea from 24
locations from South America, Australia, the Carribean and Asia, including India, plants
were grown in identical conditions in Georgia, USA, yet considerable variation was
seen between location origins in morphological characteristics such as branching,
number of seeds produced and time to first flowering (Morris, 2009). Climate, soil,
competition and defence against local predators are drivers for genetic diversity and
speciation (Züst et al., 2012). Even when all populations of a species have the
capability of synthesizing a chemical it may be in response to an environmental
stimulus, which can lead to considerable variation in the quantity present between
populations (Table 6-1).
Table 6-1: Examples of causes of variation in plant secondary metabolite production.
Plant species Type of variation Example
Ocimum sanctum, tulsi Development of plant
part
Relative amount in oil of phenylpropene eugenol, which
attracts insects, decreased with the development of the leaves 1
Lonicera japonica,
honeysuckle Diurnal Scent production peaks between 23:30 and 3:30 hours
1
Euclea divinorum, magic
guarri
Seasonal Tannins in leaves increased ~20% during the wet season 2
Nicotiana tabacum,
cultivated tobacco
Induced after injury Leaves produce lectin insecticide after attack by caterpillars 3
Pinus elliotii, slash pine
Climate Monoterpene emission rates increased exponentially with an
increase of temperature, between 20°C and 46°C 1
Zingiber officinale,
ginger Geographic Proportion of zingiberenes, principal components in the
essential oil, varied: 4-28% (Australia), 7-36% (India), 0.4-2%
(Sri Lanka) 1
Glycine max, soybean Induced by microbial
symbiont
Amount of flavonoids genistein and coumestrol produced by
root tip increased 4-fold in response to Nod factors from nitrogenating bacteria Bradyrhizobium japonicum
4
1 Data from Figueiredo et al. (2008).
2 Data from Scogings et al. (2015).
3 Data from Vandenborre et al. (2009).
4 Data
from Schmidt et al. (1994).
For these reasons, when stocks of Indian Clitoria extract ran low, further supplies were
requested from the original Indian source, but it proved impossible to obtain more
extract within the timescale of this study. When it could not be supplied, Clitoria plants
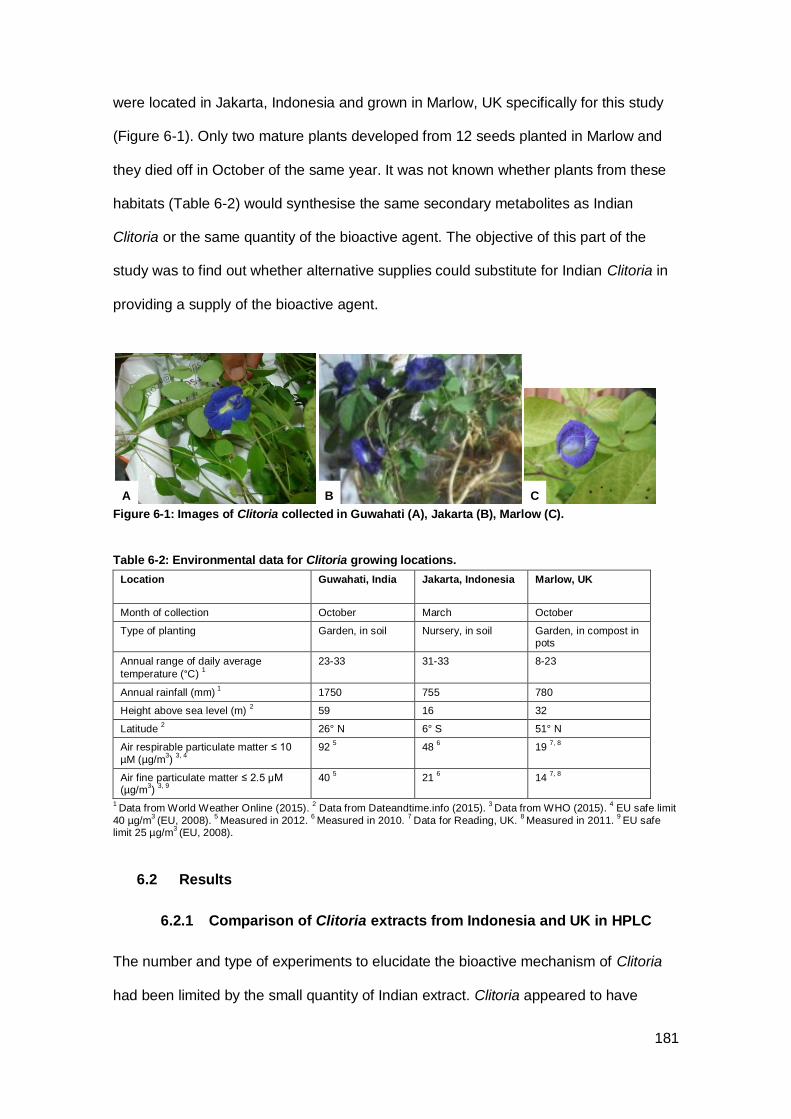
181
were located in Jakarta, Indonesia and grown in Marlow, UK specifically for this study
(Figure 6-1). Only two mature plants developed from 12 seeds planted in Marlow and
they died off in October of the same year. It was not known whether plants from these
habitats (Table 6-2) would synthesise the same secondary metabolites as Indian
Clitoria or the same quantity of the bioactive agent. The objective of this part of the
study was to find out whether alternative supplies could substitute for Indian Clitoria in
providing a supply of the bioactive agent.
Figure 6-1: Images of Clitoria collected in Guwahati (A), Jakarta (B), Marlow (C).
Table 6-2: Environmental data for Clitoria growing locations.
Location Guwahati, India Jakarta, Indonesia Marlow, UK
Month of collection October March October
Type of planting Garden, in soil Nursery, in soil Garden, in compost in pots
Annual range of daily average
temperature (°C) 1
23-33 31-33 8-23
Annual rainfall (mm) 1
1750 755 780
Height above sea level (m) 2
59 16 32
Latitude 2
26° N 6° S 51° N
Air respirable particulate matter ≤ 10
µM (µg/m3)
3, 4
92 5
48 6
19 7, 8
Air fine particulate matter ≤ 2.5 µM (µg/m
3)
3, 9
40 5
21 6
14 7, 8
1 Data from World Weather Online (2015).
2 Data from Dateandtime.info (2015).
3 Data from WHO (2015).
4 EU safe limit
40 µg/m3 (EU, 2008).
5 Measured in 2012.
6 Measured in 2010.
7 Data for Reading, UK.
8 Measured in 2011.
9 EU safe
limit 25 µg/m3 (EU, 2008).
6.2 Results
6.2.1 Comparison of Clitoria extracts from Indonesia and UK in HPLC
The number and type of experiments to elucidate the bioactive mechanism of Clitoria
had been limited by the small quantity of Indian extract. Clitoria appeared to have
A B C
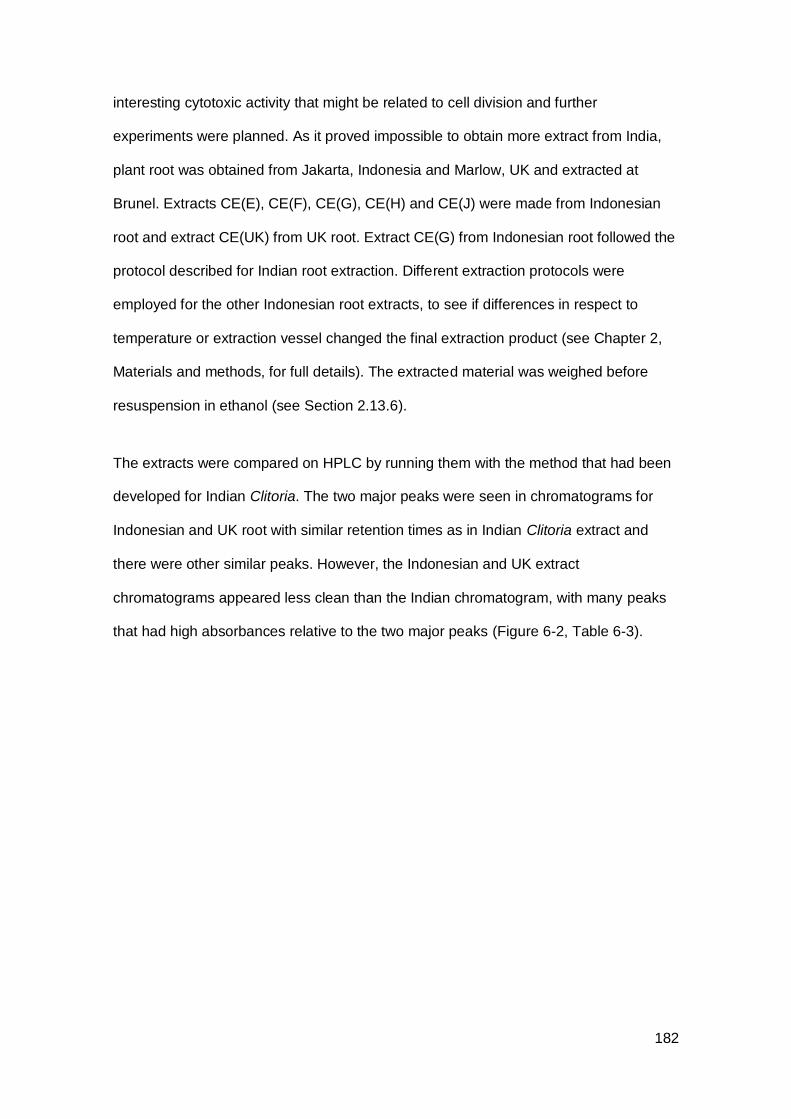
182
interesting cytotoxic activity that might be related to cell division and further
experiments were planned. As it proved impossible to obtain more extract from India,
plant root was obtained from Jakarta, Indonesia and Marlow, UK and extracted at
Brunel. Extracts CE(E), CE(F), CE(G), CE(H) and CE(J) were made from Indonesian
root and extract CE(UK) from UK root. Extract CE(G) from Indonesian root followed the
protocol described for Indian root extraction. Different extraction protocols were
employed for the other Indonesian root extracts, to see if differences in respect to
temperature or extraction vessel changed the final extraction product (see Chapter 2,
Materials and methods, for full details). The extracted material was weighed before
resuspension in ethanol (see Section 2.13.6).
The extracts were compared on HPLC by running them with the method that had been
developed for Indian Clitoria. The two major peaks were seen in chromatograms for
Indonesian and UK root with similar retention times as in Indian Clitoria extract and
there were other similar peaks. However, the Indonesian and UK extract
chromatograms appeared less clean than the Indian chromatogram, with many peaks
that had high absorbances relative to the two major peaks (Figure 6-2, Table 6-3).

183
Figure 6-2: HPLC chromatograms from Clitoria extracts. Indonesian extracts CE(E), CE(F), CE(G), CE(H), CE(J) and UK extract CE(UK). Indian extract CE(B) included for comparison. 10 µL injection of each extract diluted 1:50 dilution in methanol (MeOH). Waters X-bridge column, 150 x 3.0 mm, flow rate 0.6 mL/min, column temperature 50°C. Gradient of MeOH:water with 0.05% trifluoroacetic acid: 25-70% MeOH over 14 min, 70-100% MeOH over 2 min, return to start conditions over 0.5 min, hold for 2.5 min. R.T.: retention time. Maxplot, 230-400 nm.
Extract CE(F)
Extract CE(H) Extract CE(G)
Extract CE(J)
Extract CE(E)
Extract CE(UK)
AU
0.2
0.0
AU
0.1
0.0
19 0 R.T. (min)
AU
0.12
0.0
AU
0.14
0.0
AU
0.12
0.0
AU
0.14
0.0
Extract CE(B)
AU
1.5
0.0
19 0 R.T. (min)
19 0 R.T. (min) 19 0 R.T. (min)
19 0 R.T. (min) 19 0 R.T. (min)
19 0 R.T. (min)
MeOH
100
25
MeOH
100
25
MeOH
100
25
MeOH
100
25

184
Table 6-3: Characteristics of UV spectra of major peaks in extractions from Indonesian and UK Clitoria root. Indian Clitoria root included for comparison. 10 µL injection of 1:50 dilution of each extract on same HPLC method.
Extract 1st
major peak1
2nd
major peak1
R.T.2
(min) Height (AU)
UV maxima (nm) R.T.2
(min) Height (AU)
UV maxima (nm)
Indonesian:
CE(E) 8.2 0.20 286.4 325.6 8.5 0.21 287.6 325.6
CE(F) 8.2 0.10 286.4 325.6 8.5 0.11 287.6 325.6
CE(G) 8.0 0.09 285.6 323.8 8.3 0.10 285.6 325.0
CE(H) 7.9 0.13 284.4 323.8 8.2 0.14 285.6 325.0
CE(J) 8.0 0.11 284.4 325.0 8.3 0.13 285.6 325.0
UK:
CE(UK) 7.9 0.11 284.4 325.0 8.2 0.14 285.6 325.0
Indian:
CE(B) 9.2 1.07 286.4 324.4 9.5 1.10 287.6 324.4
1 From chromatograms in Figure 6-2.
2 Retention Time (R.T.).
To see if the Indonesian and UK extractions had cytotoxic effects on cells, cell viability
bioassays were run on breast cancer and normal cells. Results showed that all extracts
were, like the Indian extract, cytotoxic (Figure 6-3). A dose response was seen with
most extracts but was more prominent on 2DD cells than on MDA-MB-231 cells.
Further work would be necessary to confirm the dose response. This was different from
cells’ responses to the Indian extract which had displayed a clear dose response on
cancer cell lines. To see whether any of the Indonesian or UK extracts were selective,
the percentage viability of the two cell lines was compared for each extract and
treatment (Figure 6-3 C). Normal cells did not consistently survive better than cancer
cells when treated with any of the Indonesian or UK extracts.

185
Figure 6-3: Cytotoxicity in Indonesian and UK Clitoria extracts. Cell viability in (A) 2DD normal fibroblasts and (B) MDA-MB-231 breast cancer epithelial cells after 48 hours’ treatment with Indonesian extracts CE(E), CE(F), CE(G), CE(H) or CE(J) or UK extract CE(UK). PrestoBlue assays. 2DD cells assayed at passages 16, 26 (CE(E)), 26 (CE(F)), 16 (CE(G)), 20, 26 (CE(H)), 20 (CE(UK)). Viability is expressed as % of control (=100%). C: Same data as A and B, paired to show survival in cancer and normal cells with same treatment. N: number of replicates. For N=6 or 8, means of 2 independent experiments. For N=10, mean of 3 independent experiments. Green bars illustrate % viability.
80
0
60
40
100
20
A: 2DD
Dilution of crude plant extract
C
Dilution of crude plant extract
B: MDA-MB-231
186
The estimated half maximal inhibitory concentration (IC50) was calculated for all
Indonesian extracts and for the UK extract based on data from cell viability assays
where MDA-MB-231 cells were treated for 48 hours (Table 6-4). Extract CE(H) was the
most potent.
Table 6-4: Estimated half maximal concentration (IC50) of Indonesian and UK extracts1,2
.
Extract
concentration (mg/mL)
3
IC50 (µg/mL)
Indonesian extracts 4
CE(E) 192 188
CE(F) 396 516
CE(G) 262 500
CE(H) 140 80.2
CE(J) 230 390
UK extract 4
CE(UK) 290 933
1 For MDA-MB-231 breast cancer epithelial cells over 48 hours treatment.
2 Using data from Figure 6-3.
3 From Chapter 2, Materials and methods, Table 2-2.
4 Extract preparations described in Chapter 2, Materials and methods, Table 2-1.
Indonesian extract CE(H), the most potent of all extracts made at Brunel, was chosen
for further analysis. To see if its toxicity would be increased with a longer treatment
time, as had been the case with the Indian Clitoria, assays were run over 24, 48 and 72
hours (Figure 6-4). Unexpectedly, with these data, survival at 48 hours appeared to be
greater than survival at 24 hours, but the significance was based on a single data point
with large variation and would need to be confirmed in further work. The results
suggested that there was no time dependency. This was different from the response of
cancer cells to Indian Clitoria, where extending the time of treatment from 48 to 72
hours reduced survival by around 2-fold.
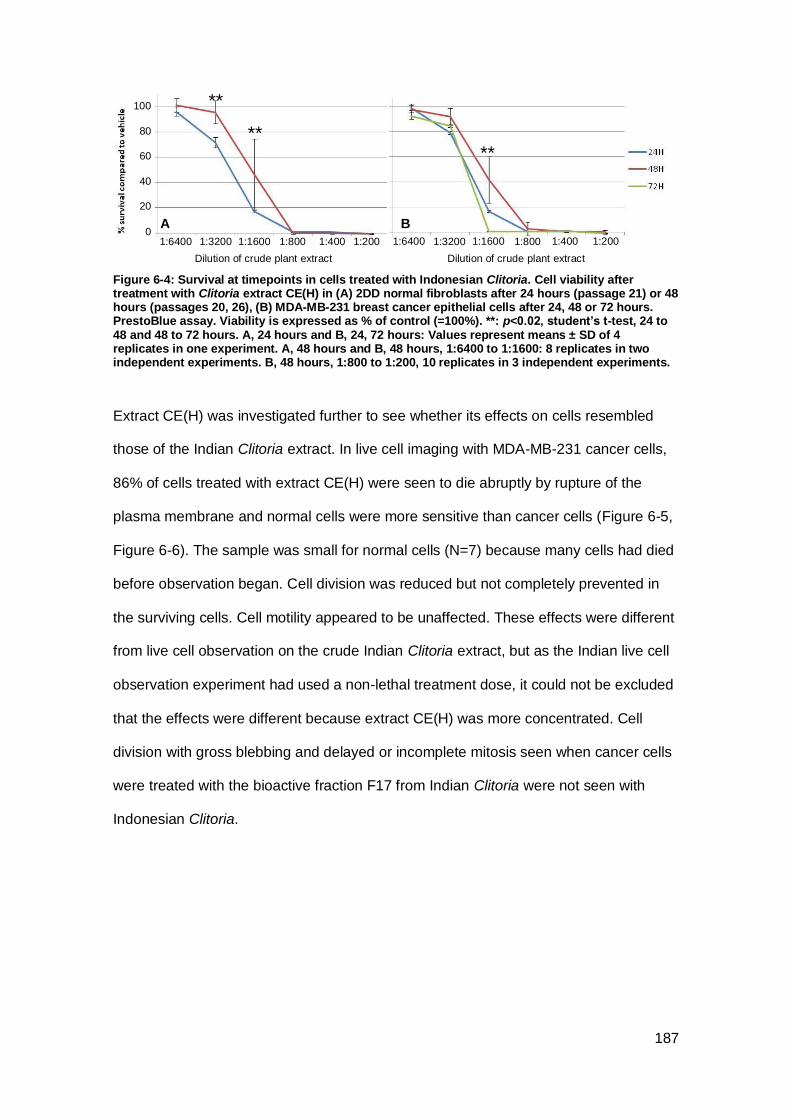
187
Figure 6-4: Survival at timepoints in cells treated with Indonesian Clitoria. Cell viability after treatment with Clitoria extract CE(H) in (A) 2DD normal fibroblasts after 24 hours (passage 21) or 48 hours (passages 20, 26), (B) MDA-MB-231 breast cancer epithelial cells after 24, 48 or 72 hours. PrestoBlue assay. Viability is expressed as % of control (=100%). **: p<0.02, student’s t-test, 24 to 48 and 48 to 72 hours. A, 24 hours and B, 24, 72 hours: Values represent means ± SD of 4 replicates in one experiment. A, 48 hours and B, 48 hours, 1:6400 to 1:1600: 8 replicates in two independent experiments. B, 48 hours, 1:800 to 1:200, 10 replicates in 3 independent experiments.
Extract CE(H) was investigated further to see whether its effects on cells resembled
those of the Indian Clitoria extract. In live cell imaging with MDA-MB-231 cancer cells,
86% of cells treated with extract CE(H) were seen to die abruptly by rupture of the
plasma membrane and normal cells were more sensitive than cancer cells (Figure 6-5,
Figure 6-6). The sample was small for normal cells (N=7) because many cells had died
before observation began. Cell division was reduced but not completely prevented in
the surviving cells. Cell motility appeared to be unaffected. These effects were different
from live cell observation on the crude Indian Clitoria extract, but as the Indian live cell
observation experiment had used a non-lethal treatment dose, it could not be excluded
that the effects were different because extract CE(H) was more concentrated. Cell
division with gross blebbing and delayed or incomplete mitosis seen when cancer cells
were treated with the bioactive fraction F17 from Indian Clitoria were not seen with
Indonesian Clitoria.
100
1:3200
Dilution of crude plant extract
**
1:6400 1:800 1:400 1:200 1:3200 1:1600
Dilution of crude plant extract
A B
**
** 80
0
60
40
20
1:6400 1:400 1:200 1:1600 1:800
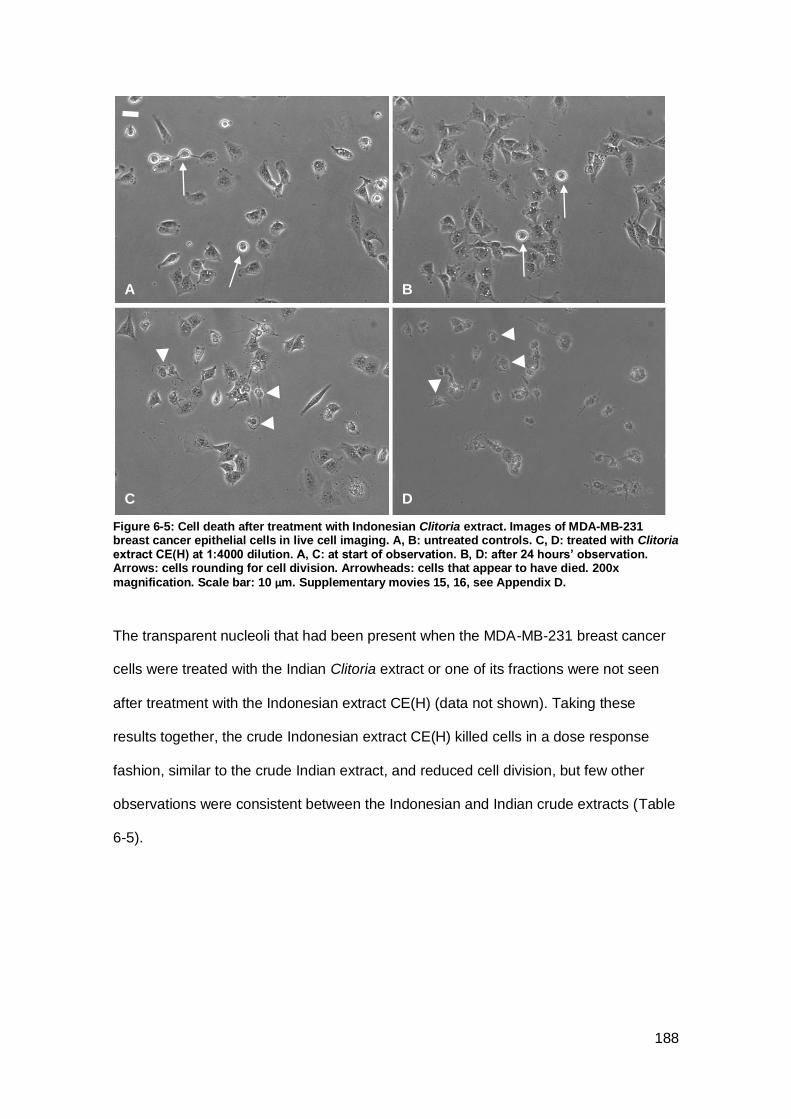
188
Figure 6-5: Cell death after treatment with Indonesian Clitoria extract. Images of MDA-MB-231 breast cancer epithelial cells in live cell imaging. A, B: untreated controls. C, D: treated with Clitoria extract CE(H) at 1:4000 dilution. A, C: at start of observation. B, D: after 24 hours’ observation. Arrows: cells rounding for cell division. Arrowheads: cells that appear to have died. 200x
magnification. Scale bar: 10 µm. Supplementary movies 15, 16, see Appendix D.
The transparent nucleoli that had been present when the MDA-MB-231 breast cancer
cells were treated with the Indian Clitoria extract or one of its fractions were not seen
after treatment with the Indonesian extract CE(H) (data not shown). Taking these
results together, the crude Indonesian extract CE(H) killed cells in a dose response
fashion, similar to the crude Indian extract, and reduced cell division, but few other
observations were consistent between the Indonesian and Indian crude extracts (Table
6-5).
A B
C D
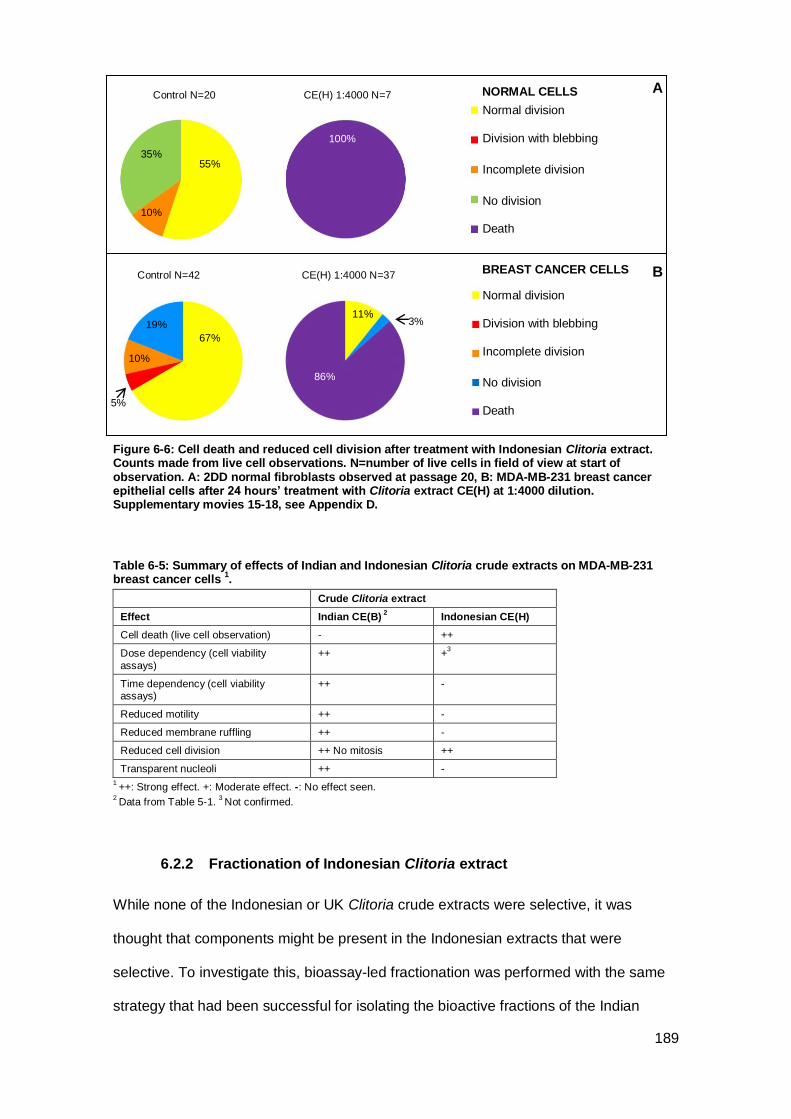
189
Figure 6-6: Cell death and reduced cell division after treatment with Indonesian Clitoria extract. Counts made from live cell observations. N=number of live cells in field of view at start of observation. A: 2DD normal fibroblasts observed at passage 20, B: MDA-MB-231 breast cancer epithelial cells after 24 hours’ treatment with Clitoria extract CE(H) at 1:4000 dilution. Supplementary movies 15-18, see Appendix D.
Table 6-5: Summary of effects of Indian and Indonesian Clitoria crude extracts on MDA-MB-231 breast cancer cells
1.
Crude Clitoria extract
Effect Indian CE(B) 2 Indonesian CE(H)
Cell death (live cell observation) - ++
Dose dependency (cell viability
assays)
++ +3
Time dependency (cell viability assays)
++ -
Reduced motility ++ -
Reduced membrane ruffling ++ -
Reduced cell division ++ No mitosis
++
Transparent nucleoli ++
-
1 ++: Strong effect. +: Moderate effect. -: No effect seen.
2 Data from Table 5-1.
3 Not confirmed.
6.2.2 Fractionation of Indonesian Clitoria extract
While none of the Indonesian or UK Clitoria crude extracts were selective, it was
thought that components might be present in the Indonesian extracts that were
selective. To investigate this, bioassay-led fractionation was performed with the same
strategy that had been successful for isolating the bioactive fractions of the Indian
CE(H) 1:4000 N=7
55%
10%
Normal division
Incomplete division
Division with blebbing
No division Death
Control N=42 CE(H) 1:4000 N=37
Normal division
Incomplete division
Division with blebbing
No division
Death
67%
10%
5%
11%
A
B
100%
35%
19% 3%
Control N=20
86%
NORMAL CELLS
BREAST CANCER CELLS

190
extract. Initially, only the analytical column was available, therefore fractionation was
performed on a semi-preparative scale. Extract CE(H), the most potent Indonesian
extract, was selected for semi-preparative fractionation on the analytical column. As
bioactivity had been noted in subfractions 10.3-10.5 in Indian Clitoria, subfractions from
Indonesian Clitoria were collected from the area of the chromatogram corresponding to
fractions 10.1-10.6 and coarser fractions from the rest of the chromatogram, using the
same HPLC subfractionation method as for Indian Clitoria. Fractions F5 and F6, which
coincided with the major peaks, were pooled to increase concentration. The
concentration of each single fraction was calculated to be approximately equivalent to a
1:900 dilution of crude extract, based on column loading (See Appendix C). In a
bioassay, results showed there was bioactivity in fractions, although not the same
fractions as for Indian Clitoria. Pooled fractions F5 and F6 killed cancer cells selectively
over normal cells (Figure 6-7 A), similar to results seen with Indian Clitoria extract.
Fractions F9 and F10.1 appeared equally cytotoxic to both cell lines, whereas they had
not been cytotoxic in the Indian Clitoria extract. On the other hand, fractions F10.3,
F10.4, F10.5 did not kill cells, whereas there had been evidence that they were
selectively cytotoxic in the Indian extract.
A further assay was run on fractions from a different series of fractionations to test
whether fractions F5-F6 were bioactive in a dose dependent fashion. To obtain enough
material for a dilution series on cancer and normal cells with the highest concentration
equivalent to that of fraction F5-F6 in the previous bioassay, 11 fractionation runs from
the analytical column were pooled (see Appendix C). In a 48 hour assay cancer cells
were again more sensitive to fractions F5-F6 than normal cells (Figure 6-8). As cancer
cell survival was significantly different from control at only the highest concentration
used, the dose dependency was not confirmed, but it was confirmed that bioactive
agents which were preferentially cytotoxic on cancer cells compared to normal cells
were present in the major peaks in the Indonesian extract CE(H), as had been seen
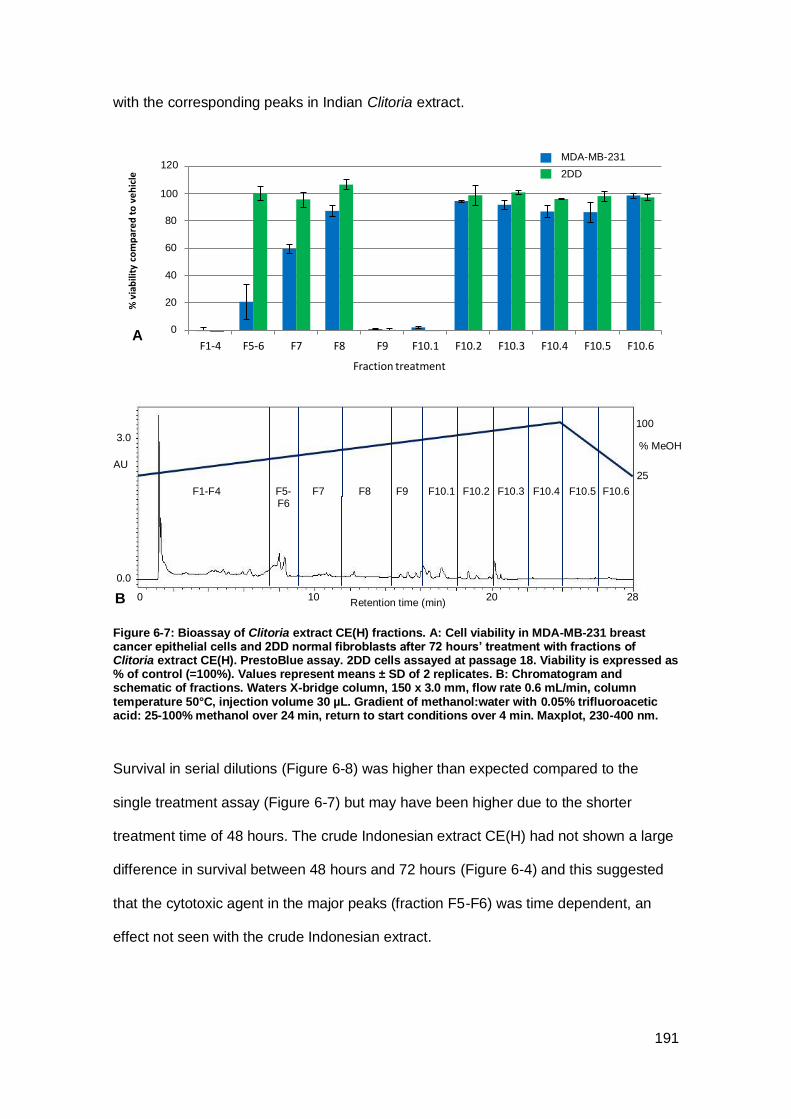
191
with the corresponding peaks in Indian Clitoria extract.
Figure 6-7: Bioassay of Clitoria extract CE(H) fractions. A: Cell viability in MDA-MB-231 breast cancer epithelial cells and 2DD normal fibroblasts after 72 hours’ treatment with fractions of Clitoria extract CE(H). PrestoBlue assay. 2DD cells assayed at passage 18. Viability is expressed as % of control (=100%). Values represent means ± SD of 2 replicates. B: Chromatogram and schematic of fractions. Waters X-bridge column, 150 x 3.0 mm, flow rate 0.6 mL/min, column temperature 50°C, injection volume 30 µL. Gradient of methanol:water with 0.05% trifluoroacetic acid: 25-100% methanol over 24 min, return to start conditions over 4 min. Maxplot, 230-400 nm.
Survival in serial dilutions (Figure 6-8) was higher than expected compared to the
single treatment assay (Figure 6-7) but may have been higher due to the shorter
treatment time of 48 hours. The crude Indonesian extract CE(H) had not shown a large
difference in survival between 48 hours and 72 hours (Figure 6-4) and this suggested
that the cytotoxic agent in the major peaks (fraction F5-F6) was time dependent, an
effect not seen with the crude Indonesian extract.
0%
20%
40%
60%
80%
100%
120%
F1-4 F5-6 F7 F8 F9 F10.1 F10.2 F10.3 F10.4 F10.5 F10.6
% v
iab
ility
co
mp
are
d t
o v
eh
icle
Fraction treatment
A
B
3.0
0.0
Retention time (min)
AU
0 28 10 20
F1-F4
100
% MeOH
25
80
60
40
20
0
F5- F6
F7 F10.2 F10.3 F10.4 F10.5 F10.6 F8 F9 F10.1
MDA-MB-231
2DD 120
100
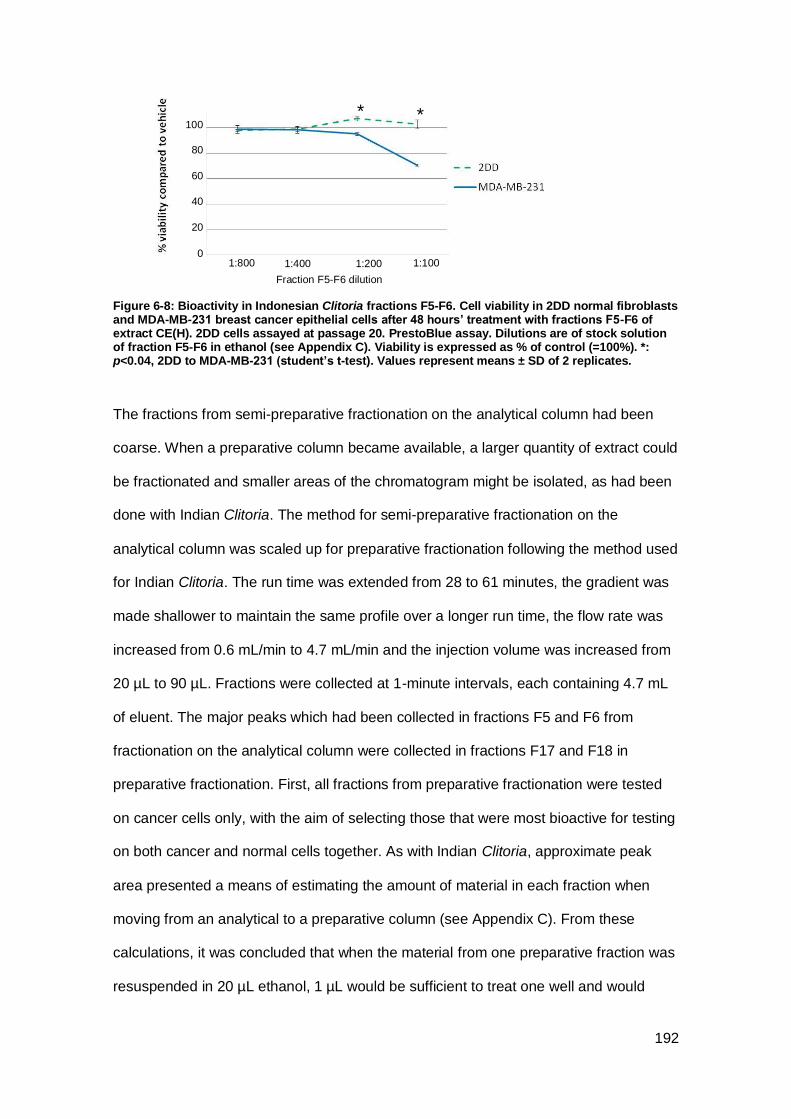
192
Figure 6-8: Bioactivity in Indonesian Clitoria fractions F5-F6. Cell viability in 2DD normal fibroblasts and MDA-MB-231 breast cancer epithelial cells after 48 hours’ treatment with fractions F5-F6 of extract CE(H). 2DD cells assayed at passage 20. PrestoBlue assay. Dilutions are of stock solution of fraction F5-F6 in ethanol (see Appendix C). Viability is expressed as % of control (=100%). *: p<0.04, 2DD to MDA-MB-231 (student’s t-test). Values represent means ± SD of 2 replicates.
The fractions from semi-preparative fractionation on the analytical column had been
coarse. When a preparative column became available, a larger quantity of extract could
be fractionated and smaller areas of the chromatogram might be isolated, as had been
done with Indian Clitoria. The method for semi-preparative fractionation on the
analytical column was scaled up for preparative fractionation following the method used
for Indian Clitoria. The run time was extended from 28 to 61 minutes, the gradient was
made shallower to maintain the same profile over a longer run time, the flow rate was
increased from 0.6 mL/min to 4.7 mL/min and the injection volume was increased from
20 µL to 90 µL. Fractions were collected at 1-minute intervals, each containing 4.7 mL
of eluent. The major peaks which had been collected in fractions F5 and F6 from
fractionation on the analytical column were collected in fractions F17 and F18 in
preparative fractionation. First, all fractions from preparative fractionation were tested
on cancer cells only, with the aim of selecting those that were most bioactive for testing
on both cancer and normal cells together. As with Indian Clitoria, approximate peak
area presented a means of estimating the amount of material in each fraction when
moving from an analytical to a preparative column (see Appendix C). From these
calculations, it was concluded that when the material from one preparative fraction was
resuspended in 20 µL ethanol, 1 µL would be sufficient to treat one well and would
Fraction F5-F6 dilution
1:800 1:400 1:200
* 100
1:100
*
80
60
40
20
0
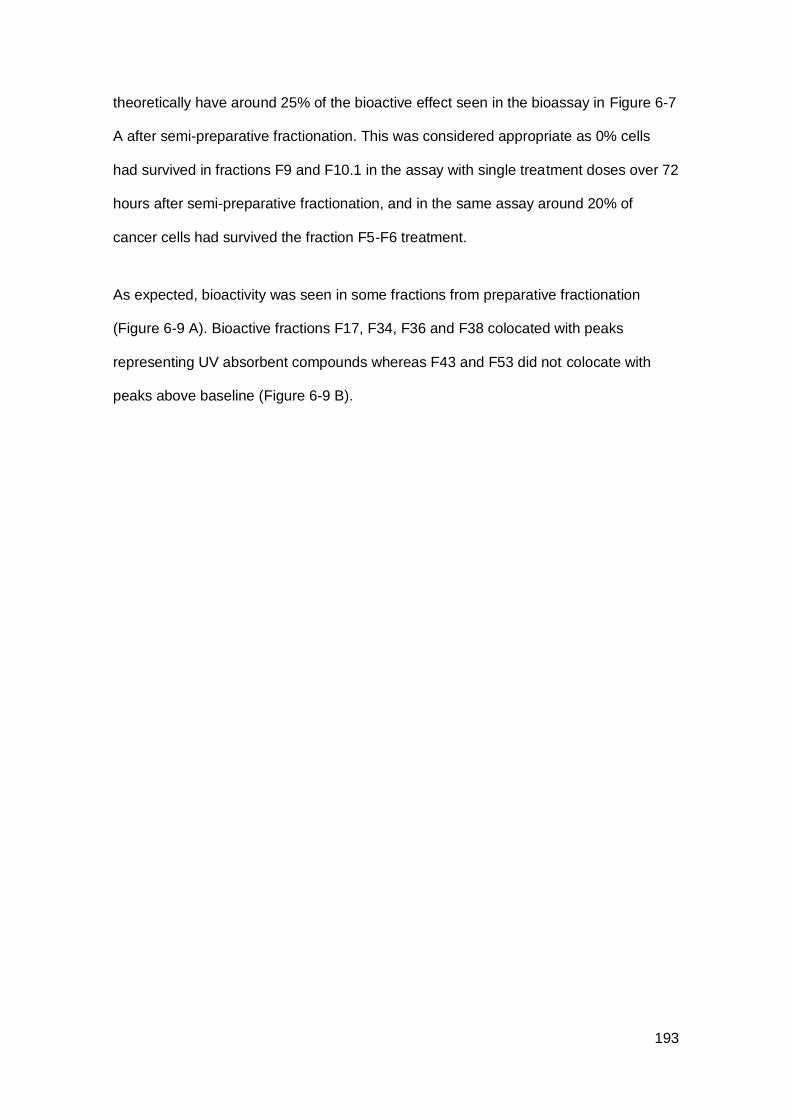
193
theoretically have around 25% of the bioactive effect seen in the bioassay in Figure 6-7
A after semi-preparative fractionation. This was considered appropriate as 0% cells
had survived in fractions F9 and F10.1 in the assay with single treatment doses over 72
hours after semi-preparative fractionation, and in the same assay around 20% of
cancer cells had survived the fraction F5-F6 treatment.
As expected, bioactivity was seen in some fractions from preparative fractionation
(Figure 6-9 A). Bioactive fractions F17, F34, F36 and F38 colocated with peaks
representing UV absorbent compounds whereas F43 and F53 did not colocate with
peaks above baseline (Figure 6-9 B).

194
Figure 6-9: Bioassay of Indonesian Clitoria extract fractions. A: Cell viability in MDA-MB-231 breast cancer epithelial cells after 72 hours’ treatment with fractions of extract CE(H). PrestoBlue assay. Viability is expressed as % of control (=100%). Values represent means ± SD of 2 replicates. B: Chromatogram from fractionation. Fractions were collected at 1 minute intervals. Fractions F21-F22 were pooled. Fractions F29-F30 were pooled. 90 µL injection of extract CE(H) diluted 1:10. Waters X-bridge column, 250 x 10.0 mm, flow rate 4.67 mL/min, column temperature 50°C. Gradient of MeOH:water with 0.05% trifluoroacetic acid: 25-100% MeOH over 57 min, return to start conditions over 4 min. Maxplot, 230-400 nm.
80
0
60
40
100
20
Fraction treatment F1-F61
A F17 F18 F34 F36 F38
F43 F53
0.0
1.0
1.5
0 B
60 40 20 10 30 50
Retention time (min)
100
% MeOH
25
0.5
AU
F34
F36 F38
F17
F18
F43 F53

195
Bioactivity in fraction F17 was indeed present at about 25% of the activity seen in semi-
preparative fractionation at the equivalent fraction, F5-F6, but fraction F18 was not
bioactive at this treatment dose (Figure 6-10). The estimate of material based on
approximate peak area was not as reliable a guide to the bioactivity as it was for the
Indian extract. The major peaks in the Indonesian extract were less pure than those in
the Indian extract, as confirmed by Liquid Chromatography-Mass Spectrometry (LC-
MS) (see Chapter 7, Identification of bioactive agents in Clitoria root extract), which
would have affected the relationship between peak height and activity. The bioactive
material in F18 may have been too dilute to see an effect and if the fractions tested had
been more concentrated, an effect similar to the Indian fraction F17 and F18 response
might have been seen. Additionally, there was poor resolution in the chromatogram
and a large amount of material eluted at the solvent front, showing it was likely that with
a 90 µL injection the column was overloaded. The poor resolution may have caused
bioactive material to be collected in adjacent fractions where it was too dilute for its full
effect to be seen.
Not all bioactive fractions from preparative fractionation colocated with bioactive
fractions from semi-preparative fractionation (Figure 6-10). Fractions F43 and F53 had
not been bioactive in semi-preparative fractionation. As fraction F53 fell on the border
between adjacent semi-preparative fractions, the material was likely divided between
the fractions collected and was too dilute for bioactivity to be visible in assays after
semi-preparative fractionation. Fraction F43 had not been strongly bioactive and may
have been too dilute in semi-preparative fractionation. Fractions F1-F4 from semi-
preparative fractionation were not bioactive in the finer fractions from preparative
fractionation.

196
Figure 6-10: Bioactive fractions in Indonesian Clitoria. Chromatogram from preparative fractionation showing bioactive fractions with around 80% cell viability or less on cancer cells after preparative fractionation (blue boxes; data from Figure 6-9) and with 20% cell viability or less on cancer cells after semi-preparative fractionation on analytical column (red boxes; data from Figure 6-7) aligned by peak. Gradient of MeOH:water with 0.05% trifluoroacetic acid: 25-100% MeOH over 57 min, return to start conditions over 4 min. Maxplot, 230-400 nm.
To see if there might be a selective response in one or more of the fractions from
preparative fractionation, a dilution series bioassay was conducted on both cancer and
normal cells with four strongly bioactive (≤80% viability) fractions from preparative
fractionation (Figure 6-9): F16-F18, F34, F36, F38. To obtain the material, two smaller
injections of 50 µL were fractionated to ensure that the column would not be
overloaded, and fractions from the two runs were combined. Using peak area to
calculate fraction dilution and treatment had been only moderately successful,
therefore fraction treatments were again based on estimates of column loading
compared to the previous bioassay with fractions from preparative fractionation (see
Appendix C). Fractions F16-F18 were pooled so that the most concentrated treatment
would theoretically be three times the concentration of the treatment in the previous
assay (Figure 6-9). Well resolved chromatograms were obtained with the 50 µL
injections (Figure 6-11). In this assay, fractions F34 and F36 were strongly bioactive,
but cancer cells were not more sensitive to these fractions than normal cells, and there
was no significant difference in the cell types’ response (Figure 6-11). No cytotoxic
effect significantly different from controls was seen with the pooled fractions F16-F18,
therefore no difference in survival between the two cell lines could be seen although
there was a tendency towards cancer cells surviving less well than normal cells. The
AU
1.5
0
0.5
1.0 F34 F17 F53 F43
F9 F10.1 F5-F6 F1-F4
F38
F36
100
% MeOH
25
F8 F7 F10.2 F10.3 F10.4 F10.5 F10.6
Retention time (min)
0 60 10 20 50 40 30
PREP
SEMI-PREP

197
low response to fractions F16-F18 was unexpected, but may have been lower due to a
shorter treatment time (48 hours) than for the assay with single treatments over 72
hours, and further suggested that the response to these fractions was time dependent.
Fraction F38 was not bioactive at the concentration tested (data not shown) which was
surprising, but the peak eluted later than in previous HPLC runs and may not all have
been collected in fraction F38.
6.2.3 Comparison of fractions from Indian and Indonesian extracts
Fraction F17 was the only fraction that was bioactive in both Indian and Indonesian
extracts (Figure 6-12). This confirmed that at least one of the major peaks was
bioactive in both extracts. It could not be excluded that if a higher concentration of
fraction F18 from Indonesian Clitoria had been assayed, it would also have been
bioactive as had been seen in the Indian extract.
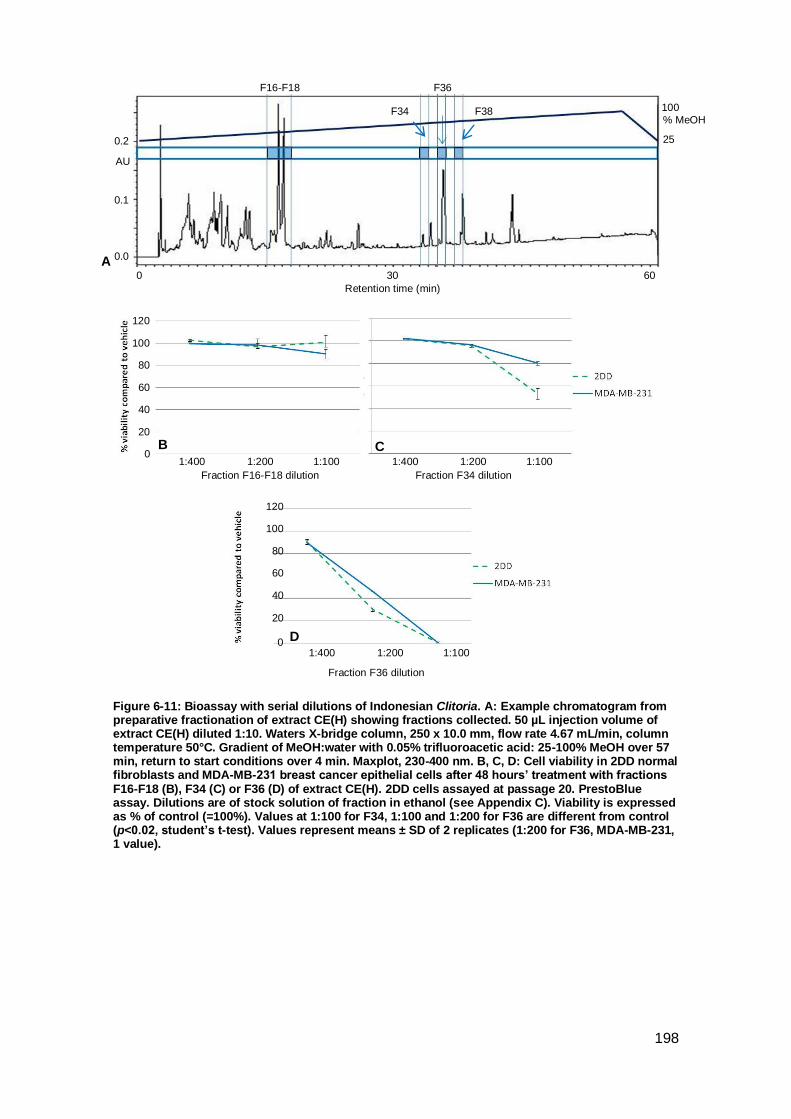
198
Figure 6-11: Bioassay with serial dilutions of Indonesian Clitoria. A: Example chromatogram from preparative fractionation of extract CE(H) showing fractions collected. 50 µL injection volume of extract CE(H) diluted 1:10. Waters X-bridge column, 250 x 10.0 mm, flow rate 4.67 mL/min, column temperature 50°C. Gradient of MeOH:water with 0.05% trifluoroacetic acid: 25-100% MeOH over 57 min, return to start conditions over 4 min. Maxplot, 230-400 nm. B, C, D: Cell viability in 2DD normal fibroblasts and MDA-MB-231 breast cancer epithelial cells after 48 hours’ treatment with fractions F16-F18 (B), F34 (C) or F36 (D) of extract CE(H). 2DD cells assayed at passage 20. PrestoBlue assay. Dilutions are of stock solution of fraction in ethanol (see Appendix C). Viability is expressed as % of control (=100%). Values at 1:100 for F34, 1:100 and 1:200 for F36 are different from control (p<0.02, student’s t-test). Values represent means ± SD of 2 replicates (1:200 for F36, MDA-MB-231, 1 value).
Fraction F16-F18 dilution
1:400
80
0
60
40
120
20
100
B 1:200 1:100
C
D
Fraction F34 dilution
A
AU
0.0
0.1
0.2
0 60 30
Retention time (min)
100
% MeOH
25
F16-F18 F36
F38 F34
Fraction F36 dilution
80
0
60
40
120
20
100
1:400 1:200 1:100
1:400 1:200 1:100

199
Figure 6-12: Comparison of bioactive fractions in (A) Indian and (B) Indonesian Clitoria extracts. Chromatograms from preparative fractionation showing bioactive fractions with (A) around 60% viability or less and (B) around 80% viability or less on cancer cells after preparative fractionation (blue boxes). Data from Chapter 4 (A) and Figure 6-10 (B). Gradient of MeOH:water with 0.05% trifluoroacetic acid: 25-100% MeOH over 57 min, return to start conditions over 4 min. Maxplot, 230-400 nm.
However, the amount of material in bioactive fraction F17 appeared lower, compared to
the other components in the extract, in the Indonesian extract CE(H) than in the Indian
extract CE(B), based on the relative heights of that peak in HPLC (Figure 6-2), and in
the Indonesian extracts there was no correlation between the height of the 1st major
peak and the concentration (R2=0.45; p=0.06) (Figure 6-13). It was likely that the
bioactive effects of the crude Indian extract might be more dependent on the contents
of the major peaks, while in the Indonesian crude extract other bioactive components,
for instance fractions F34 and F36, might dominate.
AU
1.5
0
0.5
1.0 F34 F17 F53 F43 F38
F36
Retention time (min)
AU
0 60 10 20 50 40 30
1.0
0
0.5
100
% MeOH
25
F18
F14
F9 F46 F48
A
B
100
25
% MeOH
Retention time (min)
0 60 10 20 50 40 30
F17
200
Figure 6-13: Height of major peak in Clitoria root extracts related to extract concentration. Height of 1
st major peak corresponding to Clitoria bioactive fraction F17 in Indonesian (blue) CE(E), CE(F),
CE(G), CE(H), CE(J), UK (red) CE(UK) and Indian (green) CE(B) extracts, compared to concentration of crude extract. Data from Table 6-4, Figure 6-2.
6.2.4 Indonesian extraction conditions
When extractions according to the Indian protocol had shown no selectivity on cells,
subsequent extractions were performed at different temperatures. A lower temperature
might retain substances that were degraded at 64°C and a higher temperature might
extract the bioactive substance more efficiently. In order to compare extractions, the
Indonesian crude extracts’ potency was calculated as estimated half maximal
concentration (IC50) for cancer cells over a 48 hour treatment time (see Materials and
methods). When extraction temperature was compared with IC50, a linear relationship
was seen whereby a lower extraction temperature correlated with a lower IC50 and
higher potency (Figure 6-14 A). A lower extraction temperature also correlated with a
lower extraction yield (Figure 6-14 B). It appeared that lower temperature extractions
caused less material to be extracted, and components that were extracted at low
temperature were strongly bioactive and not selective. There was no statistical
correlation between the extraction temperature and the height of the 1st major bioactive
peak in HPLC for Indonesian extracts (R2 = 0.143; p=0.26). Indian and UK extracts
could not be analysed in the same way as only one temperature was used for each
during extraction.
0
0.2
0.4
0.6
0.8
1
1.2
0 100 200 300 400 500
Pea
k h
eigh
t (A
U)
Extract concentration (mg/mL)
CE(H)
CE(B)
CE(F)
CE(J)
CE(E) CE(UK)
CE(G)
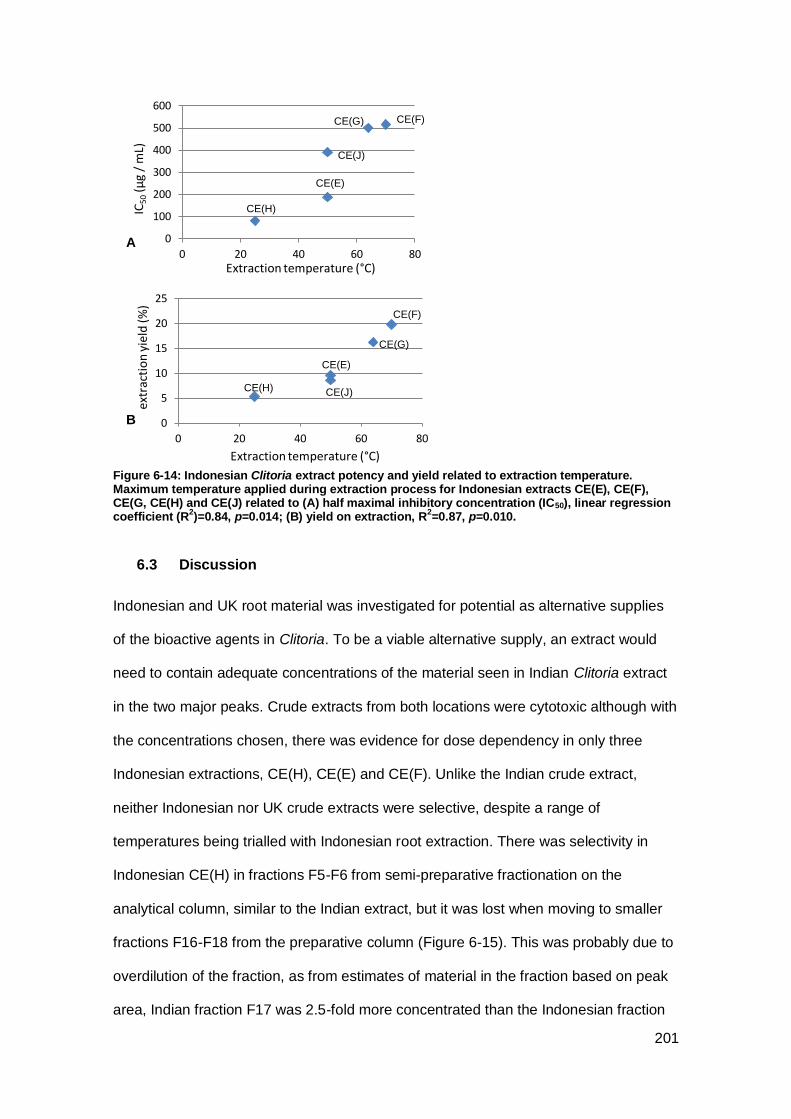
201
Figure 6-14: Indonesian Clitoria extract potency and yield related to extraction temperature. Maximum temperature applied during extraction process for Indonesian extracts CE(E), CE(F), CE(G, CE(H) and CE(J) related to (A) half maximal inhibitory concentration (IC50), linear regression coefficient (R
2)=0.84, p=0.014; (B) yield on extraction, R
2=0.87, p=0.010.
6.3 Discussion
Indonesian and UK root material was investigated for potential as alternative supplies
of the bioactive agents in Clitoria. To be a viable alternative supply, an extract would
need to contain adequate concentrations of the material seen in Indian Clitoria extract
in the two major peaks. Crude extracts from both locations were cytotoxic although with
the concentrations chosen, there was evidence for dose dependency in only three
Indonesian extractions, CE(H), CE(E) and CE(F). Unlike the Indian crude extract,
neither Indonesian nor UK crude extracts were selective, despite a range of
temperatures being trialled with Indonesian root extraction. There was selectivity in
Indonesian CE(H) in fractions F5-F6 from semi-preparative fractionation on the
analytical column, similar to the Indian extract, but it was lost when moving to smaller
fractions F16-F18 from the preparative column (Figure 6-15). This was probably due to
overdilution of the fraction, as from estimates of material in the fraction based on peak
area, Indian fraction F17 was 2.5-fold more concentrated than the Indonesian fraction
0
100
200
300
400
500
600
0 20 40 60 80
IC5
0 (µ
g /
mL)
Extraction temperature (°C)
0
5
10
15
20
25
0 20 40 60 80
extr
acti
on
yie
ld (%
)
Extraction temperature (°C)
CE(H)
CE(G) CE(F)
CE(J)
CE(E)
CE(H)
CE(G)
CE(F)
CE(J)
CE(E)
B
A

202
F16-F18, and the F17 and F18 peaks in the Indian extract were seen to be more pure
in later LC-MS. Nonetheless, the response of Indonesian fraction F16-F18 tended
towards selectivity and the Indonesian and UK peaks had similar retention times and
UV spectra in HPLC-photodiode array detection to the Indian peaks at F17 and F18,
indicating that they are probably the same or very similar compounds, but either the
compounds occur more abundantly in Indian Clitoria or lower amounts of these
compounds were extracted. UK Clitoria had similar major peaks, suggesting that it also
contains these compounds. A further UV-absorbent strongly bioactive agent (fraction
F34) was found that was not present in detectable quantities in the Indian extract. The
bioactive agents with very low UV absorbance in the Indian extract (fractions F46, F48)
were not present in the Indonesian extract.
The preparative column was expected to permit injections of 100 µL, the maximum
HPLC loop size. Surprisingly, a 90 µL injection of extract CE(H) diluted 1:10 overloaded
the preparative column, and injection volume had to be reduced to maintain resolution.
50 µL was found to give good resolution, and other injection volumes were not trialled
due to lack of time. Based on this data, four preparative fractionations of 50 µL of
Indonesian extract CE(H) might provide 12 µL of resuspended combined fraction F16-
F18, sufficient for one cell viability assay, but isolating enough material for
investigations into the bioactive mechanism of individual fractions would require many
more fractionation runs. The two Marlow Clitoria plants provided only 7 g of dried root
and UK extract was the least potent, therefore it probably would not offer an alternative
supply.
Extract CE(G) was extracted following the Indian protocol but when it was seen not to
be selective, extractions were tried at other temperatures. For temperatures below the
boiling point of methanol (64°C) the Soxhlet was redundant, therefore extractions
CE(H) and CE(UK) were performed by maceration. From analysis of extraction
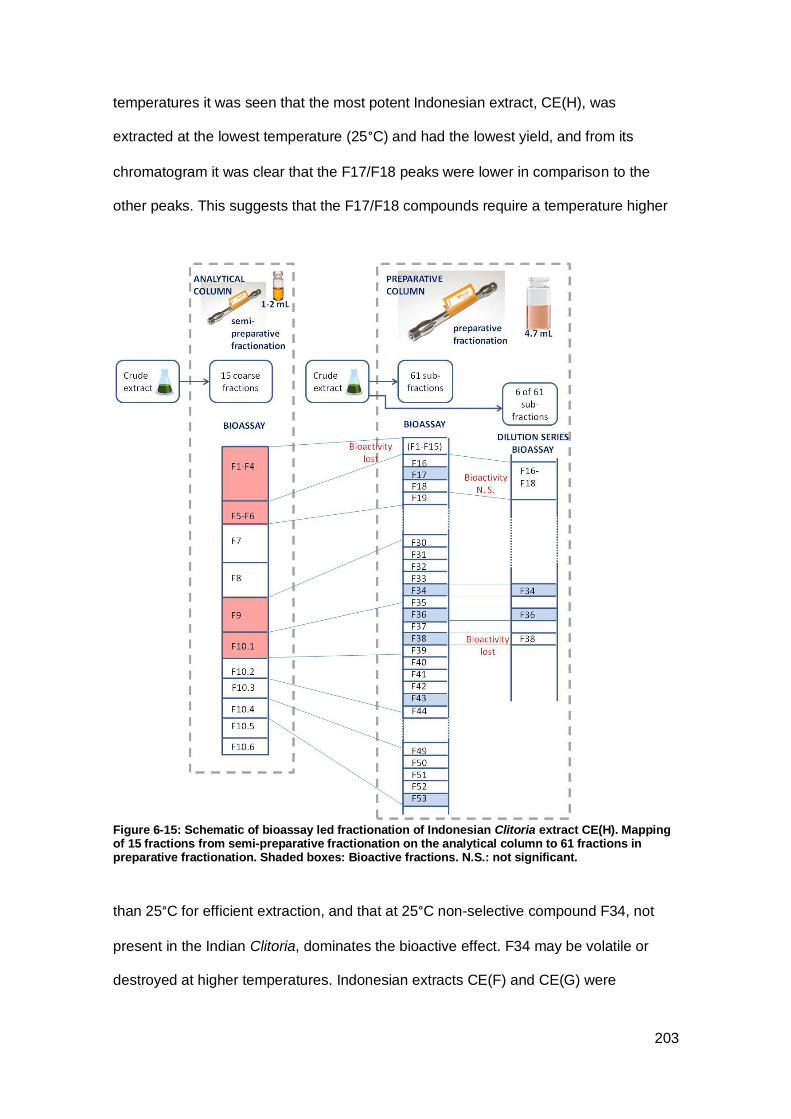
203
temperatures it was seen that the most potent Indonesian extract, CE(H), was
extracted at the lowest temperature (25°C) and had the lowest yield, and from its
chromatogram it was clear that the F17/F18 peaks were lower in comparison to the
other peaks. This suggests that the F17/F18 compounds require a temperature higher
Figure 6-15: Schematic of bioassay led fractionation of Indonesian Clitoria extract CE(H). Mapping of 15 fractions from semi-preparative fractionation on the analytical column to 61 fractions in preparative fractionation. Shaded boxes: Bioactive fractions. N.S.: not significant.
than 25°C for efficient extraction, and that at 25°C non-selective compound F34, not
present in the Indian Clitoria, dominates the bioactive effect. F34 may be volatile or
destroyed at higher temperatures. Indonesian extracts CE(F) and CE(G) were
204
extracted at the highest temperatures, had high yields and might provide more
abundant sources of the F17/F18 compounds than CE(H), but it is unknown how many
fractionations would be needed to collect material for assays.
Bioactive compounds that are extracted successfully in methanol by Soxhlet at 64°C
include tannins, some alkaloids (Seidel, 2012), saponins (Jones and Kinghorn, 2012)
and phenols (Tomsone et al., 2012), therefore Clitoria bioactive agents could belong to
any of these classes. Shamsa et al. (2008) found high phenol levels in Soxhlet
methanol extractions of 12 Iranian medicinal plants. A higher temperature increases
the efficiency of extraction by making cell walls more permeable and decreasing the
viscosity of the solvent (Santos-Buelga et al., 2012). Xu et al. (2005) compared the
effect of different conditions on ethanol extraction of Rubus L. genus (red raspberry)
and found that highest levels of flavonoids were obtained at 80°C and lower levels were
extracted at 95°C, probably due to oxidation above 80°C (Cai et al., 2010).
All extractions in this study were performed for 18 hours as in the Indian protocol.
However, a shorter extraction may be sufficient, as in a small scale comparison of
extraction durations with Indonesian CE(H) in methanol at 25°C with stirring, it was
found that the height of the F17/F18 peaks reached a maximum at 2 hours’ extraction
and remained at that level at durations up to 16 hours (Fisher and Garrard, personal
communication). Xu et al. (2005) also found that flavonoid content from Rubus L.
peaked at 2 hours of ethanol Soxhlet extraction and declined at 3 hours.
The Indian and Indonesian extractions had similar chromatograms yet different
biological results. The main differences were in the height of the major peaks relative to
the minor peaks, therefore the minor peaks may be more important for bioactivity in the
Indonesian extract. Alternatively the different bioactivity may lie in minor compounds
with strong potency or compounds with low UV detection, and synergistic effects may
205
differ. Cultivation conditions for Indian and Indonesian Clitoria are unknown and outside
the control of this study, but could have affected secondary metabolite content
(Pavarini et al., 2012). Pendbhaje et al. (2011) states that Clitoria requires average
daily temperatures of 15°C and grows in the Southern hemisphere at latitudes up to
24°S, conditions met by tropical locations Assam, although in the Northern hemisphere,
and Jakarta, but not by temperate UK (Table 6-2). UK Clitoria died off in October,
unlike Indian Clitoria which is perennial. The age of a plant affects the chemicals
produced: for instance, triterpene and flavonoid production in legume root is higher
during root development and nodule formation (Delis et al., 2011). The time of harvest
may also have impacted secondary metabolite production. Triterpene content in Salvia
officinalis (sage) in Saxony was almost 2-fold greater in a September cut than in a June
cut (Bart, 2011). It is likely that the three growing regions have different pathogens and
microbial symbionts to which the plants respond by synthesising different chemicals or
different quantities of the same chemicals (Pichersky and Gang, 2000). Environmental
pollution may contribute to more defensive secondary metabolite production in Indian
or Indonesian extracts than in UK Clitoria (Iriti and Faoro, 2009).
Correct plant material treatment at collection is vital to retain the bioactive compounds
(Seidel, 2012). The Indonesian root was washed and air-dried in shade before shipping
to the UK but this study had no control over its precise collection and cleaning
procedures. It cannot be ruled out that some bioactivity in Indonesian Clitoria is due to
enzymatic activity before washing or to the presence of a microbial contaminant.
In conclusion, it was likely that the selective bioactive agents seen in major peaks in
Indian Clitoria extractions were also present in Indonesian and UK Clitoria but in
smaller quantities, suggesting that they are common to this plant species and not due
to a contaminant or a local genetic variation. The different quantities obtained in
extracts could be due to environmental conditions or handling after collection. The

206
extraction process could be refined with shorter extraction times or different solvents,
but without a significant improvement in yield of the bioactive agents Indonesian
Clitoria cannot be considered as a substitute source for further experiments. Clitoria
does not grow well in the UK, therefore it is unlikely to produce enough root to provide
an alternative source.
6.4 Next steps
With Indian stocks of Clitoria extract running low and Indonesian Clitoria containing
small quantities of the active agent seen with Indian Clitoria, work turned to
identification of the bioactive agent in Clitoria major peaks (see Chapter 7). It was
hoped that the chemical could be purchased or synthesised, obviating the need for
fractionation to obtain the bioactive substance for future work.

207
Chapter 7 Results: Identification of bioactive agents in Clitoria root
extract
7.1 Introduction
The most commonly used techniques for structural elucidation of natural product
compounds are mass spectrometry (MS) and nuclear magnetic resonance (NMR)
(Pinheiro and Justino, 2012). MS equipment typically consists of an ion source, a mass
analyser and a detector, coupled to a data analysis system (Gross, 2004). In an
electrospray ionisation (ESI) ion source a sample in a liquid solvent is ionised by
pumping it though a highly charged capillary to form aerosolised droplets which,
desolvating, shed ions that enter the mass analyser (Banerjee and Mazumdar, 2012). If
the molecular ion has sufficient energy it may fragment into fragment ions (Johnstone
and Rose, 1996). The mass analyser separates the molecular and fragment ions
according to mass-to-charge ratio (m/z) (Banerjee and Mazumdar, 2012) which is then
converted to a voltage signal and recorded accurately by the detector to provide a
mass spectrum, a set of relative abundances of the ions produced (Johnstone and
Rose, 1996). In positive mode ESI, the sample passes through a positive charge which
creates protonated ions, while in negative mode the current is negative and the ions
are deprotonated (Banerjee and Mazumdar, 2012). In tandem mass spectrometry
(MSn) selected fragments are fragmented, providing further structural information (de
Hoffman, 1996). The molecular weight and structure can be determined through
deductions made from the mass spectrum and fragmentation pathways (de Hoffman,
1996).
Structural elucidation by NMR uses the resonance frequency of either 1H or 13C nuclei
in a magnetic field to determine properties of the structure of an organic molecule. In
NMR a sample is placed in a static magnetic field, which orients all the nuclear spins in
one direction, then a radiofrequency wave is applied perpendicular to the magnetic field
causing a change in the direction of spin (Havsteen, 2002). When the energy of the
208
magnetic field matches the separation between lower and higher energy levels, the
nuclear spin is reversed and the energy absorbed, the resonance signal, is recorded as
a line on a spectrum (Günther, 1995). As resonance depends on neighbouring nuclei in
the environment, structural information can be obtained (Havsteen, 2002). NMR has
the advantage that the data obtained can identify a molecule structure unequivocally,
but its main disadvantage in natural product analysis is that although some authors
claim 100 µg of material is sufficient, NMR typically requires at least 500 µg of pure
compound whereas the more sensitive MS can detect 1-10 µg of compound (Bucar et
al., 2013). For this reason MS is often used for natural products where sufficient
quantities for NMR cannot be isolated (Vukics and Guttman, 2010).
Infrared spectroscopy subjects a molecule to electromagnetic radiation in the infrared
region in order to excite it to a higher vibrational state, when it absorbs radiation at
certain wavelengths depending on the vibrational interactions of its atoms (Lin-Vien et
al., 1991), and detects the wavelengths absorbed to form an infrared spectrum. Fourier
transform infrared spectroscopy (FTIR), which involves a mathematical data conversion
using the Fourier transform process, improves sensitivity and is suitable for very small
samples (George and McIntyre, 1987). An FTIR spectrum can provide structural
information about functional groups but interpretation of an FTIR spectrum for a
complex molecule is often difficult. MS and FTIR can confirm the identity of a molecule
by comparison with a library spectrum, but NMR is required to confirm the structure of
an unknown molecule. Molecules with a chromophore have characteristic but not
unique ultraviolet (UV) spectra and, before the introduction of MS and NMR, UV
spectra were used to identify UV absorbent compounds, but they provide limited
information and are no longer used alone (Pinheiro and Justino, 2012).
Hyphenated techniques where a separation technique such as HPLC or gas
chromatography (GC) is coupled to a spectroscopic technique such as NMR or MS
209
became popular in the 1980s (Kite et al., 2003). GC-MS is effective for natural products
that are volatile and heat stable at high temperatures (up to 400°C) such as some
alkaloids and saponins, but LC-MS is more extensively used for a wide range of natural
product compounds (Patel et al., 2010), and is normally preferred over LC-NMR for
spectroscopic analysis of complex mixtures for reasons of cost and sensitivity (Kite et
al., 2003). Further hyphenation is possible with a combination such as LC-photodiode
array (DAD)-MS which includes UV spectrophotometry at the time of the LC
separation, so that the different sensitivities of UV and MS ensure substances are seen
(Gross, 2004). Due to advances in the technology of the interface between LC and MS
such as ESI where ionization takes place at atmospheric pressure, the cost of LC-MS
systems has reduced and made them more accessible to laboratories (Wolfender,
2009).
Plants contain many classes of secondary metabolites with potentially bioactive
properties, which can be grouped broadly into alkaloids, phenols, and terpenes and
terpenoids (Azmir et al., 2013). A literature review of the three plants that are the
subject of this study showed that they have been found to contain a number of
compounds that may be bioactive (see Introduction for those with cytotoxic properties
and Appendix A for other secondary metabolites found in the plants). Phytochemical
analyses of the same plant parts in methanol extractions showed the presence of
certain classes of secondary metabolites (Table 7-1).
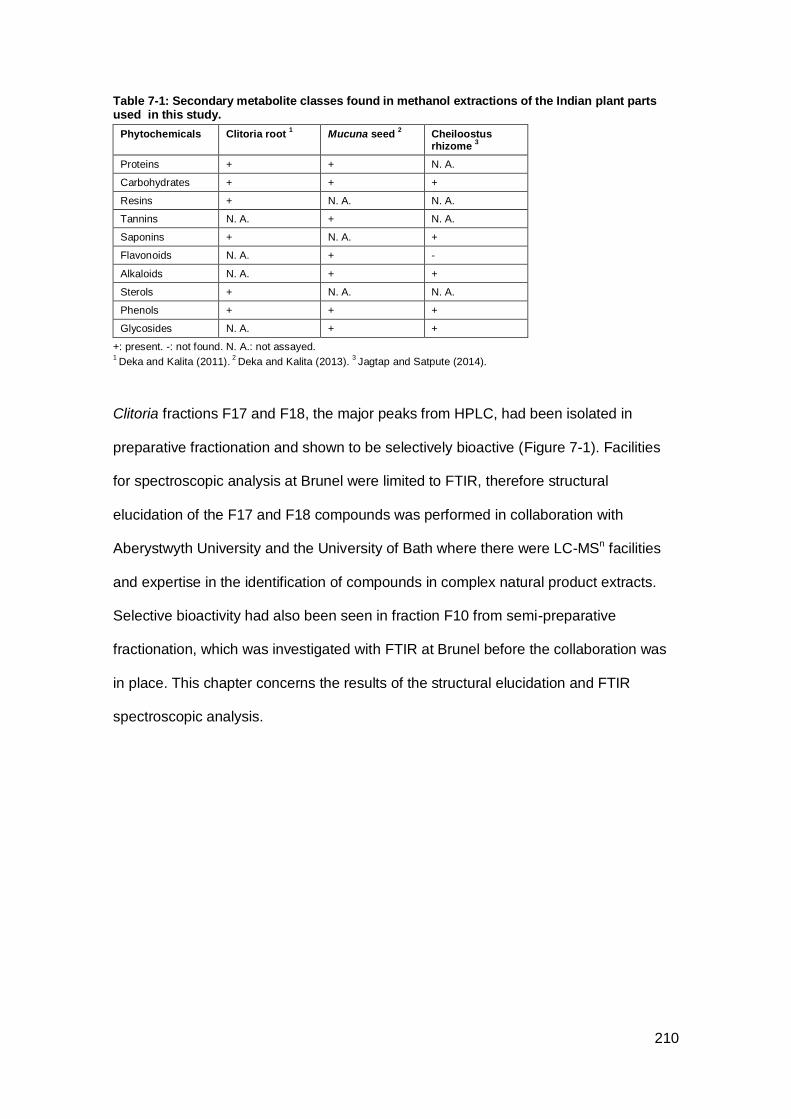
210
Table 7-1: Secondary metabolite classes found in methanol extractions of the Indian plant parts used in this study.
Phytochemicals Clitoria root 1
Mucuna seed 2
Cheiloostus rhizome
3
Proteins + + N. A.
Carbohydrates + + +
Resins + N. A. N. A.
Tannins N. A. + N. A.
Saponins + N. A. +
Flavonoids N. A. + -
Alkaloids N. A. + +
Sterols + N. A. N. A.
Phenols + + +
Glycosides N. A. + +
+: present. -: not found. N. A.: not assayed. 1 Deka and Kalita (2011).
2 Deka and Kalita (2013).
3 Jagtap and Satpute (2014).
Clitoria fractions F17 and F18, the major peaks from HPLC, had been isolated in
preparative fractionation and shown to be selectively bioactive (Figure 7-1). Facilities
for spectroscopic analysis at Brunel were limited to FTIR, therefore structural
elucidation of the F17 and F18 compounds was performed in collaboration with
Aberystwyth University and the University of Bath where there were LC-MSn facilities
and expertise in the identification of compounds in complex natural product extracts.
Selective bioactivity had also been seen in fraction F10 from semi-preparative
fractionation, which was investigated with FTIR at Brunel before the collaboration was
in place. This chapter concerns the results of the structural elucidation and FTIR
spectroscopic analysis.

211
Figure 7-1: Strategy for isolation of natural products, showing the approach taken in this study with Indian Clitoria extract. This chapter covers the step in the bold outlined box. Adapted and redrawn from Sarker and Nahar (2012a); Koehn and Carter (2005).
7.2 Results
7.2.1 Evidence for flavonoids
The major peaks from HPLC for Clitoria coincided with bioactive fractions F17 and F18
from bioassay-led fractionation. Both peaks in Clitoria extract CE(B) had UV spectra
with λmax1 in the range 300-550 nm and λmax2 close to the range 240-285 nm which are
the characteristic ranges of the flavonoid B- and A-rings respectively (Figure 7-2)
(Pinheiro and Justino, 2012). This suggested strongly that the compounds were
flavonoids.
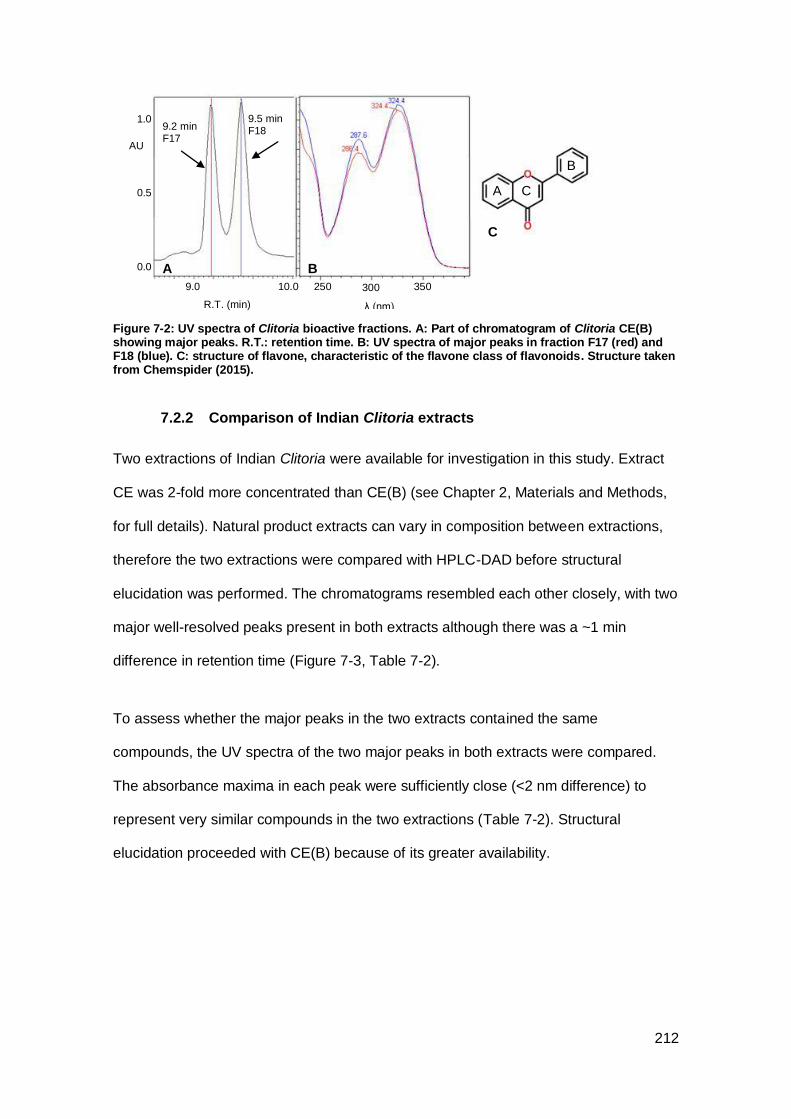
212
Figure 7-2: UV spectra of Clitoria bioactive fractions. A: Part of chromatogram of Clitoria CE(B) showing major peaks. R.T.: retention time. B: UV spectra of major peaks in fraction F17 (red) and F18 (blue). C: structure of flavone, characteristic of the flavone class of flavonoids. Structure taken from Chemspider (2015).
7.2.2 Comparison of Indian Clitoria extracts
Two extractions of Indian Clitoria were available for investigation in this study. Extract
CE was 2-fold more concentrated than CE(B) (see Chapter 2, Materials and Methods,
for full details). Natural product extracts can vary in composition between extractions,
therefore the two extractions were compared with HPLC-DAD before structural
elucidation was performed. The chromatograms resembled each other closely, with two
major well-resolved peaks present in both extracts although there was a ~1 min
difference in retention time (Figure 7-3, Table 7-2).
To assess whether the major peaks in the two extracts contained the same
compounds, the UV spectra of the two major peaks in both extracts were compared.
The absorbance maxima in each peak were sufficiently close (<2 nm difference) to
represent very similar compounds in the two extractions (Table 7-2). Structural
elucidation proceeded with CE(B) because of its greater availability.
9.5 min F18 9.2 min
F17
A
C
B
0.5
1.0
0.0
300 250
R.T. (min)
AU
350
λ (nm)
A
B
C
9.0 10.0
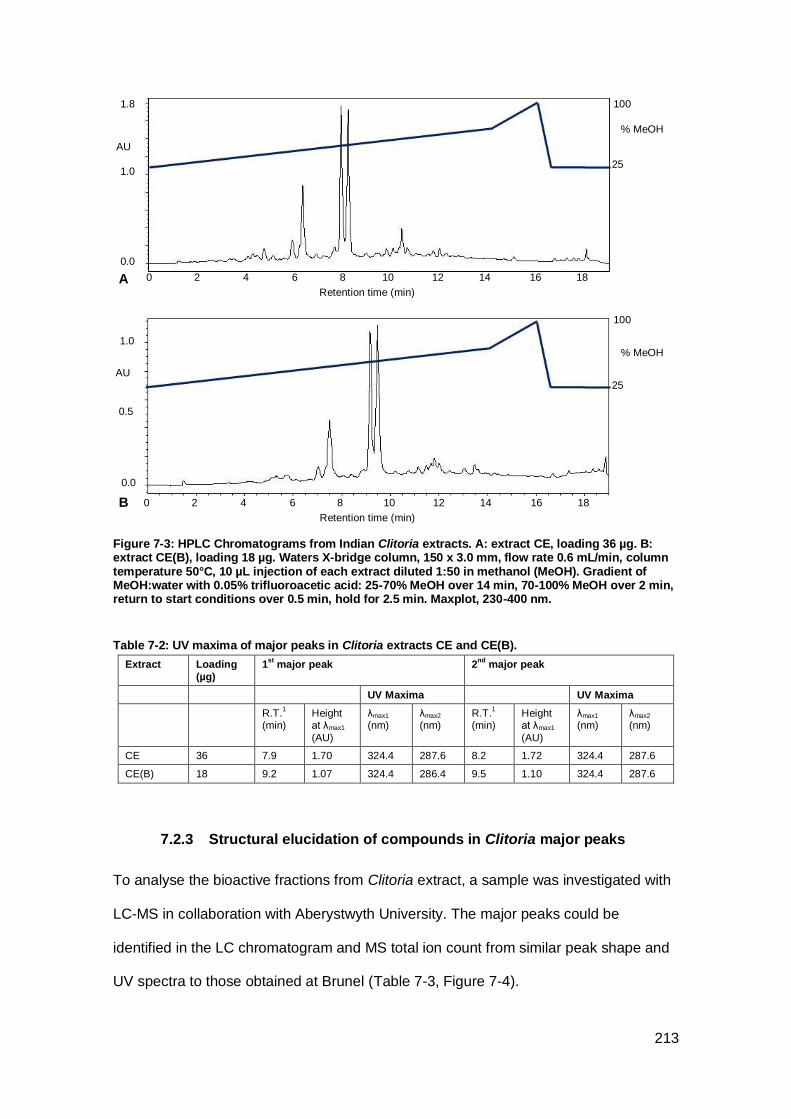
213
Figure 7-3: HPLC Chromatograms from Indian Clitoria extracts. A: extract CE, loading 36 µg. B: extract CE(B), loading 18 µg. Waters X-bridge column, 150 x 3.0 mm, flow rate 0.6 mL/min, column temperature 50°C, 10 µL injection of each extract diluted 1:50 in methanol (MeOH). Gradient of MeOH:water with 0.05% trifluoroacetic acid: 25-70% MeOH over 14 min, 70-100% MeOH over 2 min, return to start conditions over 0.5 min, hold for 2.5 min. Maxplot, 230-400 nm.
Table 7-2: UV maxima of major peaks in Clitoria extracts CE and CE(B).
Extract Loading
(µg)
1st
major peak 2nd
major peak
UV Maxima UV Maxima
R.T.1
(min) Height at λmax1
(AU)
λmax1 (nm)
λmax2
(nm) R.T.
1
(min) Height at λmax1
(AU)
λmax1 (nm)
λmax2
(nm)
CE 36 7.9 1.70 324.4 287.6 8.2 1.72 324.4 287.6
CE(B) 18 9.2 1.07 324.4 286.4 9.5 1.10 324.4 287.6
7.2.3 Structural elucidation of compounds in Clitoria major peaks
To analyse the bioactive fractions from Clitoria extract, a sample was investigated with
LC-MS in collaboration with Aberystwyth University. The major peaks could be
identified in the LC chromatogram and MS total ion count from similar peak shape and
UV spectra to those obtained at Brunel (Table 7-3, Figure 7-4).
Retention time (min)
100
1.0
1.8
0.0
25
% MeOH
100
1.0
0.5
0.0
25
% MeOH
2 18 6 12 4 14 0 16 10 8
AU
B
A
AU
Retention time (min)
2 18 6 12 4 14 0 16 10 8
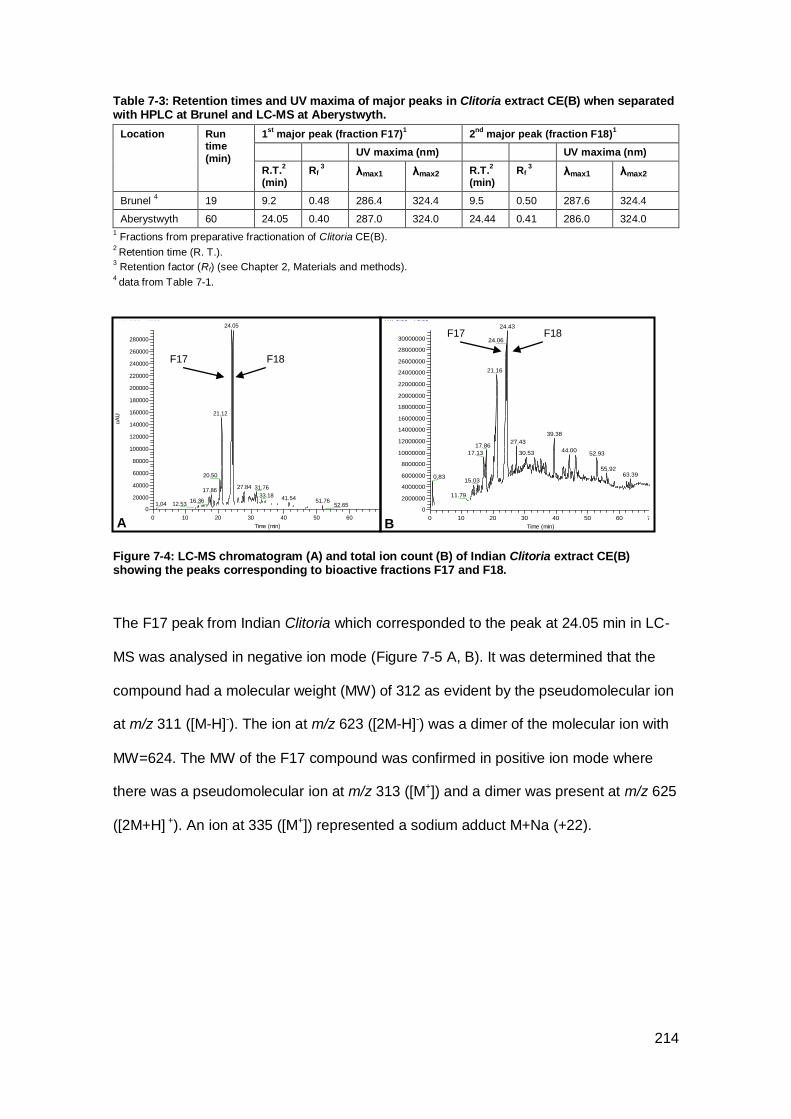
214
Table 7-3: Retention times and UV maxima of major peaks in Clitoria extract CE(B) when separated with HPLC at Brunel and LC-MS at Aberystwyth.
Location Run time
(min)
1st
major peak (fraction F17)1 2
nd major peak (fraction F18)
1
UV maxima (nm) UV maxima (nm)
R.T.2
(min) Rf
3 λmax1 λmax2 R.T.
2
(min) Rf
3 λmax1 λmax2
Brunel 4
19 9.2 0.48 286.4 324.4 9.5 0.50 287.6 324.4
Aberystwyth 60 24.05 0.40 287.0 324.0 24.44 0.41 286.0 324.0
1 Fractions from preparative fractionation of Clitoria CE(B).
2 Retention time (R. T.).
3 Retention factor (Rf) (see Chapter 2, Materials and methods).
4 data from Table 7-1.
Figure 7-4: LC-MS chromatogram (A) and total ion count (B) of Indian Clitoria extract CE(B) showing the peaks corresponding to bioactive fractions F17 and F18.
The F17 peak from Indian Clitoria which corresponded to the peak at 24.05 min in LC-
MS was analysed in negative ion mode (Figure 7-5 A, B). It was determined that the
compound had a molecular weight (MW) of 312 as evident by the pseudomolecular ion
at m/z 311 ([M-H]-). The ion at m/z 623 ([2M-H]-) was a dimer of the molecular ion with
MW=624. The MW of the F17 compound was confirmed in positive ion mode where
there was a pseudomolecular ion at m/z 313 ([M+]) and a dimer was present at m/z 625
([2M+H] +). An ion at 335 ([M+]) represented a sodium adduct M+Na (+22).
C:\Xcalibur\...\Indon_ExtractB_SW 12 Jun 14 16:57:49standards; with splitter
RT: 0.00 - 70.00
0 10 20 30 40 50 60 70
Time (min)
0
20000
40000
60000
80000
100000
120000
140000
160000
180000
200000
220000
240000
260000
280000
uA
U
24.05
21.12
20.50
27.84 31.7617.8633.18 41.5416.36 51.76
12.531.04 52.65
NL:
2.96E5
Total Scan
PDA
Indon_Extr
actB_SW
Indon_ExtractB_SW #7332 RT: 24.44 AV: 1 NL: 1.37E6 microAU
250 300 350 400 450 500 550 600
w avelength (nm)
0
100000
200000
300000
400000
500000
600000
700000
800000
900000
1000000
1100000
1200000
1300000
uA
U
324.00
286.00
379.00 410.00 445.00
RT: 0.00 - 70.00
0 10 20 30 40 50 60 70
Time (min)
0
2000000
4000000
6000000
8000000
10000000
12000000
14000000
16000000
18000000
20000000
22000000
24000000
26000000
28000000
30000000
Inte
nsity
24.43
24.06
21.16
39.38
27.4317.86
44.0017.13 30.53 52.93
55.9263.390.83
15.03
11.79
NL:
3.14E7
TIC F: ITMS - c
ESI Full ms [
100.00-2000.00]
MS
Indon_ExtractB_
SW
Indon_ExtractB_SW #1701 RT: 24.22 AV: 1 NL: 3.04E6
F: ITMS - c ESI Full ms [ 100.00-2000.00]
200 400 600 800 1000 1200 1400 1600 1800 2000
m/z
0
200000
400000
600000
800000
1000000
1200000
1400000
1600000
1800000
2000000
2200000
2400000
2600000
2800000
3000000
Inte
nsity
356.85
652.76
311.11622.91
386.76
424.76682.79
283.11454.57
136.74 766.78 910.55 1113.72 1461.72 1619.29 1965.35
A B
F18 F17
F18 F17

215
Figure 7-5: Mass spectrometry traces of bioactive peaks in Indian Clitoria from LC-MS. A, B: F17 peak. C, D: F18 peak. A, C: negative ion mode. B, D: positive ion mode.
The F18 peak which corresponded to the peak at 24.44 min in LC-MS was analysed in
negative ion mode (Figure 7-5 C, D). It was determined that the F18 compound had a
MW of 342 from the pseudomolecular ion at m/z 341 ([M-H]-). A dimer was present at
m/z 683 ([2M-H]-). The MW of the F18 compound was confirmed in positive ion mode
where there was a pseudomolecular ion at m/z 343 ([M+]) and a dimer was present at
m/z 685 ([2M+H] +). Ions at 365 ([M+]) and 706 ([M+]) represented sodium adducts
M+Na (+22) and 2M+Na (+22) respectively.
Fragmentation analysis of the two compounds was carried out with MSn in negative
mode giving major fragments 205 and 106 ([M-H]-) for the F17 peak and 205 and 136
([M-H]-) for the F18 peak. Based on this data, the compounds in the F17 and F18
peaks were determined to be Compounds A and B respectively with fragmentation at
the C3-9 bond (Figure 7-6). A Reaxys database search indicated that Compounds A and
C:\Xcalibur\...\Indon_ExtractB_SW 12 Jun 14 16:57:49standards; with splitter
RT: 0.00 - 70.00
0 10 20 30 40 50 60 70
Time (min)
0
20000
40000
60000
80000
100000
120000
140000
160000
180000
200000
220000
240000
260000
280000
uA
U
24.05
21.12
20.50
27.84 31.7617.8633.18 41.5416.36 51.76
12.531.04 52.65
NL:
2.96E5
Total Scan
PDA
Indon_Extr
actB_SW
Indon_ExtractB_SW #7332 RT: 24.44 AV: 1 NL: 1.37E6 microAU
250 300 350 400 450 500 550 600
w avelength (nm)
0
100000
200000
300000
400000
500000
600000
700000
800000
900000
1000000
1100000
1200000
1300000
uA
U
324.00
286.00
379.00 410.00 445.00
RT: 0.00 - 70.00
0 10 20 30 40 50 60 70
Time (min)
0
2000000
4000000
6000000
8000000
10000000
12000000
14000000
16000000
18000000
20000000
22000000
24000000
26000000
28000000
30000000
Inte
nsity
24.43
24.06
21.16
39.38
27.4317.86
44.0017.13 30.53 52.93
55.9263.390.83
15.03
11.79
NL:
3.14E7
TIC F: ITMS - c
ESI Full ms [
100.00-2000.00]
MS
Indon_ExtractB_
SW
Indon_ExtractB_SW #1701 RT: 24.22 AV: 1 NL: 3.04E6
F: ITMS - c ESI Full ms [ 100.00-2000.00]
200 400 600 800 1000 1200 1400 1600 1800 2000
m/z
0
200000
400000
600000
800000
1000000
1200000
1400000
1600000
1800000
2000000
2200000
2400000
2600000
2800000
3000000
Inte
nsity
356.85
652.76
311.11622.91
386.76
424.76682.79
283.11454.57
136.74 766.78 910.55 1113.72 1461.72 1619.29 1965.35
C:\Xcalibur\...\Indon_ExtractB_SW 12 Jun 14 16:57:49standards; with splitter
RT: 23.12 - 26.84
23.5 24.0 24.5 25.0 25.5 26.0 26.5
Time (min)
40000
60000
80000
100000
120000
140000
160000
180000
200000
220000
240000
260000
280000
uA
U
24.05 24.45 NL:
2.96E5
Total Scan
PDA
Indon_Extr
actB_SW
Indon_ExtractB_SW #7208 RT: 24.02 AV: 1 NL: 1.36E6 microAU
250 300 350 400 450 500 550 600
w avelength (nm)
0
100000
200000
300000
400000
500000
600000
700000
800000
900000
1000000
1100000
1200000
1300000
uA
U
324.00
287.00
379.00 410.00 439.00
RT: 22.08 - 25.67
22.5 23.0 23.5 24.0 24.5 25.0 25.5
Time (min)
5000000
10000000
15000000
20000000
25000000
30000000
35000000
40000000
45000000
50000000
55000000
Inte
nsity
24.4624.09
23.4523.3522.5725.46
25.17
NL:
5.69E7
TIC F: ITMS + c
ESI Full ms [
100.00-2000.00]
MS
Indon_ExtractB_
SW
Indon_ExtractB_SW #1691 RT: 24.09 AV: 1 NL: 6.51E6
F: ITMS + c ESI Full ms [ 100.00-2000.00]
200 400 600 800 1000 1200 1400 1600 1800 2000
m/z
0
500000
1000000
1500000
2000000
2500000
3000000
3500000
4000000
4500000
5000000
5500000
6000000
6500000
Inte
nsity
313.13 646.84
624.80
335.14
799.88
956.38
214.03 970.82488.20
1037.86 1362.41 1962.951721.94
C:\Xcalibur\...\Indon_ExtractB_SW 12 Jun 14 16:57:49standards; with splitter
RT: 23.66 - 25.89
24.0 24.5 25.0 25.5
Time (min)
0
20000
40000
60000
80000
100000
120000
140000
160000
180000
200000
220000
240000
260000
280000
uA
U
24.05 24.45
25.35
NL:
2.96E5
Total Scan
PDA
Indon_Extr
actB_SW
Indon_ExtractB_SW #7332 RT: 24.44 AV: 1 NL: 1.37E6 microAU
250 300 350 400 450 500 550 600
w avelength (nm)
0
100000
200000
300000
400000
500000
600000
700000
800000
900000
1000000
1100000
1200000
1300000uA
U
324.00
286.00
379.00 410.00 445.00
RT: 23.22 - 25.91
23.5 24.0 24.5 25.0 25.5
Time (min)
6000000
8000000
10000000
12000000
14000000
16000000
18000000
20000000
22000000
24000000
26000000
28000000
30000000
Inte
nsity
24.43
24.06
25.37 25.7125.20
NL:
3.14E7
TIC F: ITMS - c
ESI Full ms [
100.00-2000.00]
MS
Indon_ExtractB_
SW
Indon_ExtractB_SW #1721 RT: 24.48 AV: 1 NL: 7.89E6
F: ITMS - c ESI Full ms [ 100.00-2000.00]
200 400 600 800 1000 1200 1400 1600 1800 2000
m/z
0
1000000
2000000
3000000
4000000
5000000
6000000
7000000
Inte
nsity
682.81
341.18
403.99
522.66 718.30136.79 1025.03 1420.011278.88 1718.59 1874.09
C:\Xcalibur\...\Indon_ExtractB_SW 12 Jun 14 16:57:49standards; with splitter
RT: 23.12 - 26.84
23.5 24.0 24.5 25.0 25.5 26.0 26.5
Time (min)
40000
60000
80000
100000
120000
140000
160000
180000
200000
220000
240000
260000
280000uA
U
24.05 24.45 NL:
2.96E5
Total Scan
PDA
Indon_Extr
actB_SW
Indon_ExtractB_SW #7208 RT: 24.02 AV: 1 NL: 1.36E6 microAU
250 300 350 400 450 500 550 600
w avelength (nm)
0
100000
200000
300000
400000
500000
600000
700000
800000
900000
1000000
1100000
1200000
1300000
uA
U
324.00
287.00
379.00 410.00 439.00
RT: 22.08 - 25.67
22.5 23.0 23.5 24.0 24.5 25.0 25.5
Time (min)
5000000
10000000
15000000
20000000
25000000
30000000
35000000
40000000
45000000
50000000
55000000
Inte
nsity
24.4624.09
23.4523.3522.5725.46
25.17
NL:
5.69E7
TIC F: ITMS + c
ESI Full ms [
100.00-2000.00]
MS
Indon_ExtractB_
SW
Indon_ExtractB_SW #1719 RT: 24.46 AV: 1 NL: 6.85E6
F: ITMS + c ESI Full ms [ 100.00-2000.00]
200 400 600 800 1000 1200 1400 1600 1800 2000
m/z
0
500000
1000000
1500000
2000000
2500000
3000000
3500000
4000000
4500000
5000000
5500000
6000000
6500000
Inte
nsity
706.89343.15
684.78
365.18
874.78
1045.75
533.36
214.03
882.64 1127.65 1643.231394.86 1958.33
A B
C D
M-H 2M-H
M+H
M+H
M-H
2M-H
2M+H
2M+H
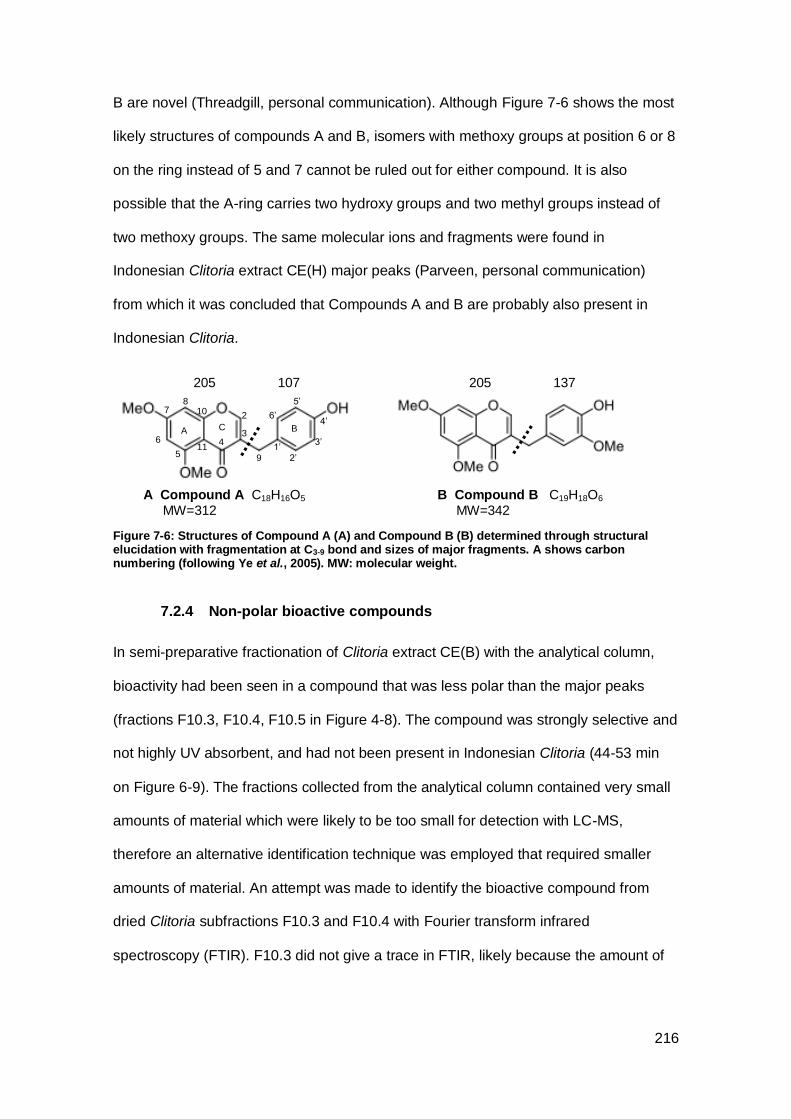
216
B are novel (Threadgill, personal communication). Although Figure 7-6 shows the most
likely structures of compounds A and B, isomers with methoxy groups at position 6 or 8
on the ring instead of 5 and 7 cannot be ruled out for either compound. It is also
possible that the A-ring carries two hydroxy groups and two methyl groups instead of
two methoxy groups. The same molecular ions and fragments were found in
Indonesian Clitoria extract CE(H) major peaks (Parveen, personal communication)
from which it was concluded that Compounds A and B are probably also present in
Indonesian Clitoria.
Figure 7-6: Structures of Compound A (A) and Compound B (B) determined through structural elucidation with fragmentation at C3-9 bond and sizes of major fragments. A shows carbon numbering (following Ye et al., 2005). MW: molecular weight.
7.2.4 Non-polar bioactive compounds
In semi-preparative fractionation of Clitoria extract CE(B) with the analytical column,
bioactivity had been seen in a compound that was less polar than the major peaks
(fractions F10.3, F10.4, F10.5 in Figure 4-8). The compound was strongly selective and
not highly UV absorbent, and had not been present in Indonesian Clitoria (44-53 min
on Figure 6-9). The fractions collected from the analytical column contained very small
amounts of material which were likely to be too small for detection with LC-MS,
therefore an alternative identification technique was employed that required smaller
amounts of material. An attempt was made to identify the bioactive compound from
dried Clitoria subfractions F10.3 and F10.4 with Fourier transform infrared
spectroscopy (FTIR). F10.3 did not give a trace in FTIR, likely because the amount of
7
A Compound A C18H16O5
MW=312
B Compound B C19H18O6
MW=342
8
6
5
10
11
2
4 3
9 1’
6’
2’
3’7
5’
4’ A C B
205 107 205 137
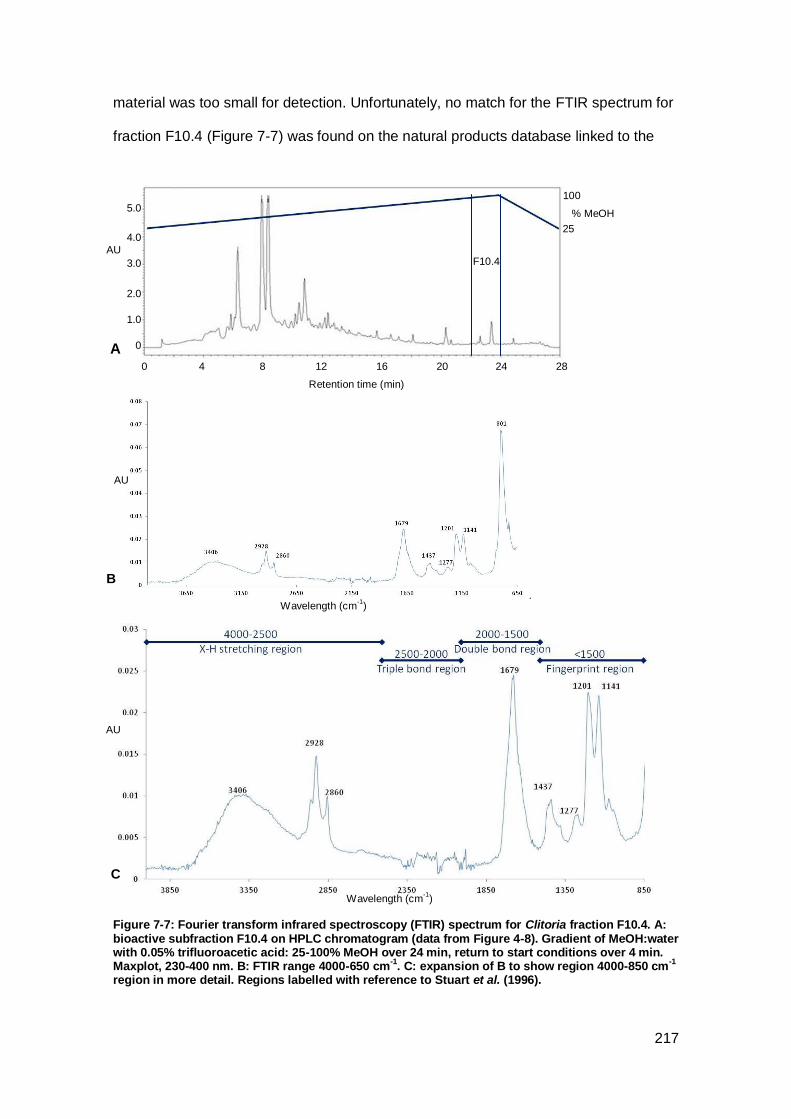
217
material was too small for detection. Unfortunately, no match for the FTIR spectrum for
fraction F10.4 (Figure 7-7) was found on the natural products database linked to the
.
Figure 7-7: Fourier transform infrared spectroscopy (FTIR) spectrum for Clitoria fraction F10.4. A: bioactive subfraction F10.4 on HPLC chromatogram (data from Figure 4-8). Gradient of MeOH:water with 0.05% trifluoroacetic acid: 25-100% MeOH over 24 min, return to start conditions over 4 min. Maxplot, 230-400 nm. B: FTIR range 4000-650 cm
-1. C: expansion of B to show region 4000-850 cm
-1
region in more detail. Regions labelled with reference to Stuart et al. (1996).
C
B
AU
AU
Wavelength (cm-1
)
Wavelength (cm-1
)
5.0
0
4.0
3.0
2.0
1.0
AU
0 28 4 8 12 16 20 24
Retention time (min)
F10.4
% MeOH
25
A
100
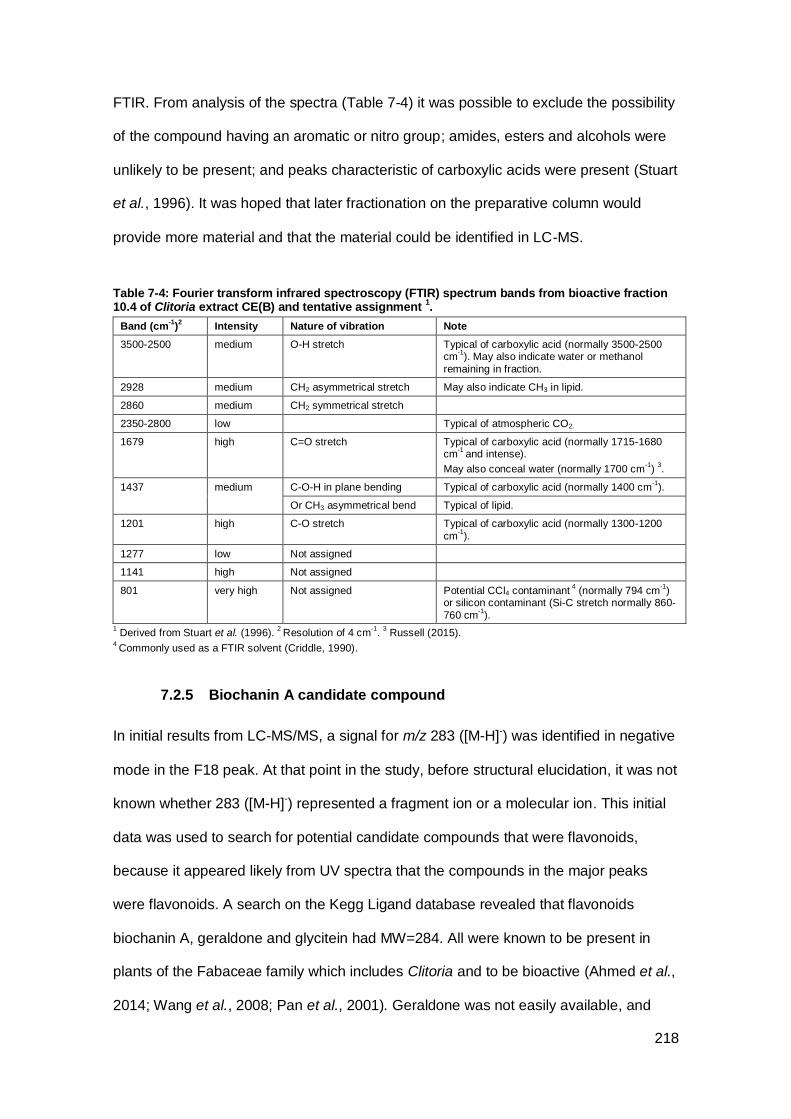
218
FTIR. From analysis of the spectra (Table 7-4) it was possible to exclude the possibility
of the compound having an aromatic or nitro group; amides, esters and alcohols were
unlikely to be present; and peaks characteristic of carboxylic acids were present (Stuart
et al., 1996). It was hoped that later fractionation on the preparative column would
provide more material and that the material could be identified in LC-MS.
Table 7-4: Fourier transform infrared spectroscopy (FTIR) spectrum bands from bioactive fraction 10.4 of Clitoria extract CE(B) and tentative assignment
1.
Band (cm-1
)2
Intensity Nature of vibration
Note
3500-2500 medium O-H stretch Typical of carboxylic acid (normally 3500-2500 cm
-1). May also indicate water or methanol
remaining in fraction.
2928 medium CH2 asymmetrical stretch May also indicate CH3 in lipid.
2860 medium CH2 symmetrical stretch
2350-2800 low Typical of atmospheric CO2.
1679 high C=O stretch Typical of carboxylic acid (normally 1715-1680 cm
-1 and intense).
May also conceal water (normally 1700 cm-1
) 3.
1437 medium C-O-H in plane bending Typical of carboxylic acid (normally 1400 cm-1
).
Or CH3 asymmetrical bend Typical of lipid.
1201 high C-O stretch Typical of carboxylic acid (normally 1300-1200
cm-1
).
1277 low Not assigned
1141 high Not assigned
801 very high Not assigned Potential CCl4 contaminant 4 (normally 794 cm
-1)
or silicon contaminant (Si-C stretch normally 860-
760 cm-1
). 1 Derived from Stuart et al. (1996).
2 Resolution of 4 cm
-1.
3 Russell (2015).
4 Commonly used as a FTIR solvent (Criddle, 1990).
7.2.5 Biochanin A candidate compound
In initial results from LC-MS/MS, a signal for m/z 283 ([M-H]-) was identified in negative
mode in the F18 peak. At that point in the study, before structural elucidation, it was not
known whether 283 ([M-H]-) represented a fragment ion or a molecular ion. This initial
data was used to search for potential candidate compounds that were flavonoids,
because it appeared likely from UV spectra that the compounds in the major peaks
were flavonoids. A search on the Kegg Ligand database revealed that flavonoids
biochanin A, geraldone and glycitein had MW=284. All were known to be present in
plants of the Fabaceae family which includes Clitoria and to be bioactive (Ahmed et al.,
2014; Wang et al., 2008; Pan et al., 2001). Geraldone was not easily available, and
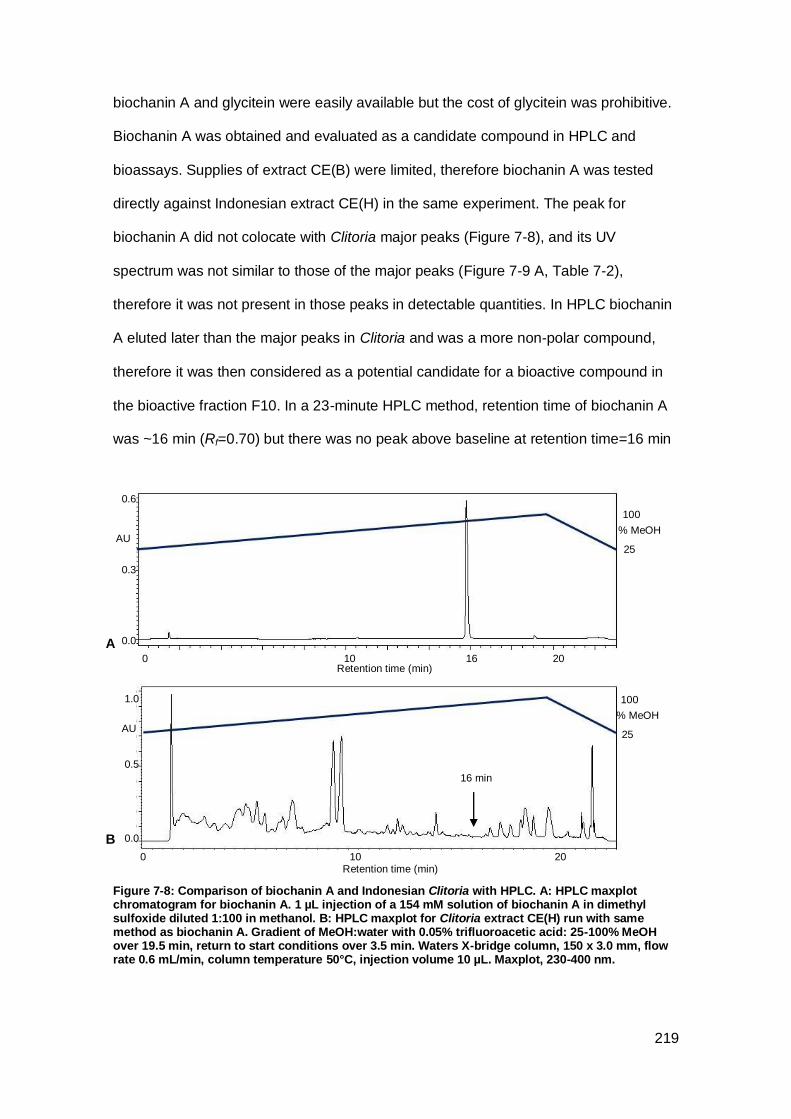
219
biochanin A and glycitein were easily available but the cost of glycitein was prohibitive.
Biochanin A was obtained and evaluated as a candidate compound in HPLC and
bioassays. Supplies of extract CE(B) were limited, therefore biochanin A was tested
directly against Indonesian extract CE(H) in the same experiment. The peak for
biochanin A did not colocate with Clitoria major peaks (Figure 7-8), and its UV
spectrum was not similar to those of the major peaks (Figure 7-9 A, Table 7-2),
therefore it was not present in those peaks in detectable quantities. In HPLC biochanin
A eluted later than the major peaks in Clitoria and was a more non-polar compound,
therefore it was then considered as a potential candidate for a bioactive compound in
the bioactive fraction F10. In a 23-minute HPLC method, retention time of biochanin A
was ~16 min (Rf=0.70) but there was no peak above baseline at retention time=16 min
Figure 7-8: Comparison of biochanin A and Indonesian Clitoria with HPLC. A: HPLC maxplot chromatogram for biochanin A. 1 µL injection of a 154 mM solution of biochanin A in dimethyl sulfoxide diluted 1:100 in methanol. B: HPLC maxplot for Clitoria extract CE(H) run with same method as biochanin A. Gradient of MeOH:water with 0.05% trifluoroacetic acid: 25-100% MeOH over 19.5 min, return to start conditions over 3.5 min. Waters X-bridge column, 150 x 3.0 mm, flow rate 0.6 mL/min, column temperature 50°C, injection volume 10 µL. Maxplot, 230-400 nm.
A 0.0
0.3
0.6
100
% MeOH
25
0 Retention time (min)
20
AU
10
B 0.0
0.5
1.0
AU
0 20 10 Retention time (min)
16 min
16
100
% MeOH
25
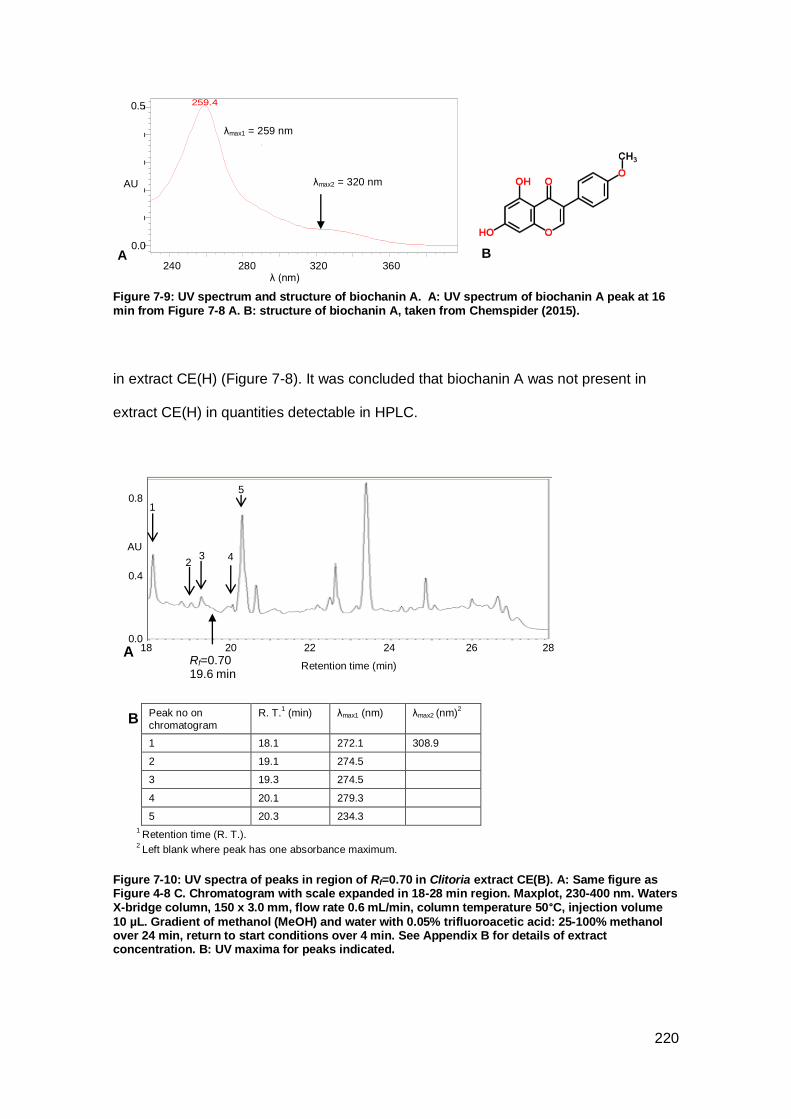
220
Figure 7-9: UV spectrum and structure of biochanin A. A: UV spectrum of biochanin A peak at 16 min from Figure 7-8 A. B: structure of biochanin A, taken from Chemspider (2015).
in extract CE(H) (Figure 7-8). It was concluded that biochanin A was not present in
extract CE(H) in quantities detectable in HPLC.
Peak no on
chromatogram
R. T.1 (min) λmax1 (nm) λmax2 (nm)
2
1 18.1 272.1 308.9
2 19.1 274.5
3 19.3 274.5
4 20.1 279.3
5 20.3 234.3
1 Retention time (R. T.).
2 Left blank where peak has one absorbance maximum.
Figure 7-10: UV spectra of peaks in region of Rf=0.70 in Clitoria extract CE(B). A: Same figure as Figure 4-8 C. Chromatogram with scale expanded in 18-28 min region. Maxplot, 230-400 nm. Waters X-bridge column, 150 x 3.0 mm, flow rate 0.6 mL/min, column temperature 50°C, injection volume
10 µL. Gradient of methanol (MeOH) and water with 0.05% trifluoroacetic acid: 25-100% methanol over 24 min, return to start conditions over 4 min. See Appendix B for details of extract concentration. B: UV maxima for peaks indicated.
259.4
AU
0.00
0.10
0.20
0.30
0.40
0.50
nm
240.00 260.00 280.00 300.00 320.00 340.00 360.00 380.00A 0.0
0.5
AU
240 280 320 360 λ (nm)
λmax2 = 320 nm
λmax1 = 259 nm
B
Retention time (min)
AU
18 0.0
20 28 22 24 26
0.4
0.8
Rf=0.70 19.6 min
A
1
2 3 4
5
B
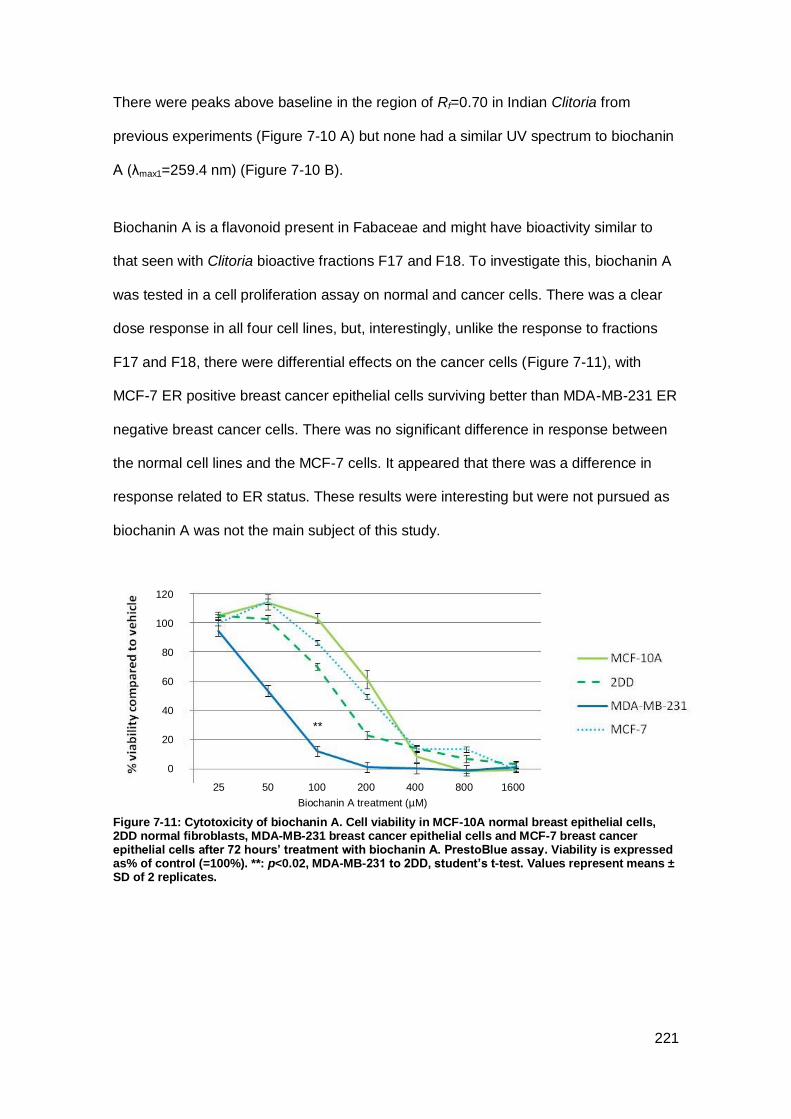
221
There were peaks above baseline in the region of Rf=0.70 in Indian Clitoria from
previous experiments (Figure 7-10 A) but none had a similar UV spectrum to biochanin
A (λmax1=259.4 nm) (Figure 7-10 B).
Biochanin A is a flavonoid present in Fabaceae and might have bioactivity similar to
that seen with Clitoria bioactive fractions F17 and F18. To investigate this, biochanin A
was tested in a cell proliferation assay on normal and cancer cells. There was a clear
dose response in all four cell lines, but, interestingly, unlike the response to fractions
F17 and F18, there were differential effects on the cancer cells (Figure 7-11), with
MCF-7 ER positive breast cancer epithelial cells surviving better than MDA-MB-231 ER
negative breast cancer cells. There was no significant difference in response between
the normal cell lines and the MCF-7 cells. It appeared that there was a difference in
response related to ER status. These results were interesting but were not pursued as
biochanin A was not the main subject of this study.
Figure 7-11: Cytotoxicity of biochanin A. Cell viability in MCF-10A normal breast epithelial cells, 2DD normal fibroblasts, MDA-MB-231 breast cancer epithelial cells and MCF-7 breast cancer epithelial cells after 72 hours’ treatment with biochanin A. PrestoBlue assay. Viability is expressed as% of control (=100%). **: p<0.02, MDA-MB-231 to 2DD, student’s t-test. Values represent means ± SD of 2 replicates.
80
0
60
40
120
20
Biochanin A treatment (µM)
100
1600
**
800 25 50 200 400 100
222
7.3 Discussion
Flavonoids are a class of polyphenols with a C6-C3-C6 skeleton mostly derived from
benzo-λ-pyrone (Figure 7-12 I) (Havsteen, 2002). Flavones are characterised by the
C=C double bond on the C-ring and carboxy group at C-4, and isoflavones have the B-
ring at position 3 on the C-ring (Figure 7-12 D-G) (Fotsis et al., 1997). LC-MSn proved
effective for structural elucidation of the bioactive compounds in Clitoria fractions F17
and F18, novel Compounds A and B, which are isoflavones and classed as
homoisoflavones, also called 3-benzyl-4-chromones (Tait et al., 2006) due to the
additional CH2 group between their B- and C-rings (Figure 7-12 A, B). Identification of
Compounds A and B in both Indian and Indonesian Clitoria suggests that they are
generally synthesised by this species. Just 20 homoisoflavones were known up to now
and Compounds A and B are uncommon homoisoflavones: the naturally occurring
homoisoflavones listed in a 2014 comprehensive review have hydroxy-substitution at
C-5 in the A-ring (Lin et al., 2014), where novel Compounds A and B have a methoxy
group. Only one other homoisoflavone in this group has been found in Fabaceae
(Figure 7-12 C), the other 19 occurring in Asparagaceae (Lin et al., 2014).
Compounds A and B are structurally similar, differing only in the methoxy group in
compound 2 on the B-ring, which accounts for their similar peak elution times and UV
spectra, and are strongly UV-absorbent due to their high level of conjugation.
Flavonoids are normally present in plants as glycosides (Vukics and Guttman, 2010)
but Compounds A and B are aglycones. It is possible that glycosides of the compounds
are also present and eluting earlier in HPLC due to their higher polarity or that they
were originally present and were hydrolysed during drying of the root, extraction or
HPLC (Havsteen, 2002; Santos-Buelga et al., 2012; Seidel, 2012). Koblovská et al.
(2008) found both aglycone and glycoside isoflavones in citrus plants after LC-MS. The
fragmentation at the homoisoflavonoid C3-9 bond is consistent with Ye et al. (2005) who
first described this fragmentation pattern in an identification study of 18

223
Figure 7-12: Structures of novel Compounds A (A) and B (B), 5,4′-dihydroxy-7-methyl 3-benzyl chromone (C), isoflavones biochanin A (D), genistein (E), daidzein (F) and glycitein (G), 8-methyl-DBP (H), flavonoid precursor benzo-A-pyrone (I) and β-estradiol (estrogen) (J). Structures of isoflavones, benzo-A-pyrone and β-estradiol taken from Chemspider (2015). Structure of 5,4′-dihydroxy-7-methyl 3-benzyl chromone taken from Kumar et al. (2006). Structure of 8-methyl-DBP taken from Rafi and Vastano (2007).
homoisoflavonoids in Ophiopogon japonicus root. The position and nature of the
groups on the A-ring remain to be confirmed (Parveen, personal communication) and
as supplies of extract are not sufficient for isolating enough pure sample for NMR,
synthetic supplies of Compounds A and B will be necessary for firm identification.
Weak cytotoxicity on liver and laryngeal cancer cells is seen with one other
homoisoflavone (Duan et al., 2009) of the 20 listed by Lin et al. (2014). A bioactive
homoisoflavanone from Polygonatum odoratum (Vietnamese coriander) similar to one
of the alternative isomers of Compound A but without the C-ring double bond, has been
described as 2,3-dihydro-3-[(15-hydroxyphenyl)-methyl]-5,7-dihydroxy-6,8-dimethyl-4H-
5,4′-dihydroxy-7-methyl
3-benzyl chromone
genistein
Compound A Compound B
benzo-A-pyrone
daidzein glycitein
β-estradiol
biochanin A
A B C
HOMOISOFLAVONES
D E
G F
ISOFLAVONES
J I
H3C
OH
8-methyl-DBP H
HOMOISOFLAVANONE
224
1-benzopyran-4-one8-methyl-DBP (8-methyl-DBP) (Figure 7-12 H) (Rafi and Vastano,
2007). These authors found that in breast cancer cells 8-methyl-DBP inhibited growth
in a clonogenic assay, induced G2/M cell cycle arrest and phosphorylation of anti-
apoptotic Bcl-2 and increased p53 expression (Rafi and Vastano, 2007). Another
homoisoflavanone inhibited activity of the proliferative MAPK pathway and the pro-
survival transcription factor NF-κB and protected neurons from inflammation (Zeng et
al., 2015). The cytotoxic activity of Compounds A and B is therefore consistent with
similar compounds.
Homoisoflavonoids also have antimutagenic activity against chemical mutagens
(Miadoková et al., 2002; Wall et al., 1989), insulin-sensitizing activity in glucose uptake
(Choi et al., 2004) and some have antiviral activity (Tait et al., 2006). Roy et al. (2013)
found that homoisoflavonoids could inhibit microbial efflux pumps and sensitise them 8
fold to growth inhibition by the DNA intercalating agent ethidium bromide. Compounds
A and B may likewise have other interesting bioactive properties.
Flavonoid roles in plants include flower colours, regulation of plant growth, antibacterial
agents, toxic metal-chelating agents, attracting symbiotic bacteria for nitrogen fixation
and protection against UV damage and free radicals (Di Carlo et al., 1999; Havsteen,
2002; Jones et al., 2007). Present in fruits, nuts, vegetables and grains, flavonoids
constitute 1% of the human diet where they may have anti-oxidant and cancer-
protective effects, regulate capillary permeability and act as anti-inflammatories (Di
Carlo et al., 1999). Isoflavones have better bioavailability than other classes of
flavonoids and longer half-lives (~9 hours) in the body (Cassidy et al., 2006; Hollman,
2004). Some isoflavone glycosides such as quercetin glucosides are absorbed in the
small intestine via specific transporters but other glycosides can only be cleaved in the
colon by gut enzymes or bacterial enzymes with some degradation of the aglycone,
resulting in lower bioavailability (Hollman, 2004).
225
Low toxicity makes flavonoids interesting as potential medicines. Flavonoids do not
accumulate in the liver and only demonstrate toxicity in very large quantities such as 1
mg/kg of daidzein which caused breeding female rats to have smaller mammary glands
but nonetheless had no effect on offspring (Galati and O’Brien, 2004). Polyphenon E, a
mixture of green tea catechins which are flavan-3-ol type flavonoids, has shown
cytotoxic activity in vitro on a range of different cancers and some clinical trials for
treatment or prevention of cancer have shown positive results (Bettuzzi et al., 2006).
Ipriflavone, an isoflavone and semi-synthetic derivative of daidzein, is prescribed for
post-menopausal women to prevent and treat osteoporosis (Delarmelina et al., 2014)
and many other flavonoids are being studied or are in clinical trials.
Biochanin A (Figure 7-12 D), an isoflavone known to be present in other plants of the
Fabaceae family (Wang et al., 2008), was considered as a candidate compound but its
peak in HPLC did not coincide with Clitoria bioactive fractions and its UV spectrum was
not similar to that of F17 or F18 bioactive compounds. However, biochanin A had a
dose related cytotoxic effect on cells and a differential response on cell lines as ER
negative breast cancer cells were 3-4 fold more sensitive to biochanin A than either
normal cells or ER positive breast cancer cells. Biochanin A was seen by Verma and
Goldin (1998) to have a biphasic effect on ER positive breast cancer cells, enhancing
proliferation at low treatment doses (<10 µM) and inhibiting proliferation at 100 µM, and
is known to bind ER (Jefferson et al., 2002). It is possible that biochanin A inhibits cell
viability more in cancer cells than in normal cells, but that MCF-7 cells respond to
estrogenic growth signals which override the growth inhibition. However, this effect
would need to be confirmed in further work.
Glycine max (soy), a Fabaceae family member, contains the isoflavones genistein,
daidzein and glycitein (Figure 7-12 E, F, G). They seem to have cancer-protective
effects, thought to be one of the reasons that populations in Japan and China with a
226
high level of soy in their diet have a lower incidence of breast cancer than people in the
USA (Sarkar and Li, 2003). Genistein has anti-proliferative effects on non small cell
lung cancer and breast cancer cells (Sarkar and Li, 2003). In breast cancer cells it
binds to ERα and may act as an antagonist competitively with estrogen, or bind to and
antagonise estrogen-metabolizing enzymes (Bouker and Hilakivi-Clarke, 2000) or bind
to anti-proliferative ERβ preferentially over ERα (Rietjens et al., 2012). However,
genistein also has a biphasic effect as at low concentrations (<1 µM) it is an ER agonist
and a growth factor in breast cancer cells (Zava and Duwe, 1997). The isoflavones
have some structural similarity with estrogen (Figure 7-12 I) despite being largely
planar molecules whereas estrogen has five tetrahedral carbons. Tsai et al. (2015)
isolated two homoisoflavanones from the Asparagaceae plant Lilirope muscarii, calling
them homoisoflavones in their publication. Interestingly, these homoisoflavanones
appear to be agonists of ERβ but not ERα (Tsai et al., 2015), which suggests the
possibility that Compounds A and B may also have estrogenic activity or specific ERβ
binding capability.
Analysis of the less polar Clitoria bioactive fraction F10.4 by FTIR was inconclusive
with no match on the available natural products database (15,000 entities), and
purchasing access to a larger database of FTIR spectra was beyond the scope of this
project. However, the sample was probably not sufficiently pure, as three small peaks
were apparent in the HPLC fraction, or it may be another novel compound. The small
peaks indicated low UV absorbency, and elution at around 100% methanol suggested
a low polarity compound. Known components of the root extract include the pentacyclic
triterpenoid taraxerol (C30H50O) (Kumar et al., 2008), a cytotoxic agent on mouse skin
cancer (Takasaki et al., 1999). Taraxerol’s structure suggests relatively low polarity and
weak UV absorbency but it is unlikely to be responsible for the bioactivity in fraction
F10, as exploratory GC-MS performed to identify taraxerol failed to detect it (Garrard,
personal communication).

227
In conclusion, two novel bioactive compounds were found in methanolic Clitoria root
extract by LC-MSn and identified as homoisoflavones, members of a relatively rare
group of flavonoids. Other homoisoflavones are seen in the literature to be bioactive,
and related homoisoflavonoids have a range of bioactive effects.
228
Chapter 8 Discussion
8.1 Introduction
Target-based drug development, where large libraries of compounds are screened for
activity against a molecular target, has led to the introduction of successful targeted
therapies for breast cancer which are largely responsible for the UK 5-year survival rate
rising from 61% in 1980-81 to 87% in 2010-11(CRUK, 2014b). However, they are not
effective on all types of breast cancer, and all cancer therapies have significant side-
effects, therefore there is a need for more treatment options. Other strategies for drug
discovery can also be productive. In a bioassay-led approach, an assay with biological
relevance is used to isolate compounds with useful bioactivity from a natural product
extract, without initial knowledge of the drug target. Natural products offer a diversity of
bioactive compounds, and plants used in traditional medicine have provided many
drugs in use today. In this study, a bioassay-led approach with an Indian medicinal
extract has been successful in isolating two potentially useful anti-cancer compounds.
Current chemotherapy drugs take advantage of the faster cycling of cancer cells over
normal cells by targeting cell division. The taxanes and vinca alkaloids target the
tubulin cytoskeleton by disrupting microtubules during their reorganisation to form the
mitotic spindle in cell division. Actin is also present in all cells and is reorganised during
cell division where it has a critical role. Both microtubules and actin filaments have
many functions, therefore off-target effects are inevitable, yet microtubule-targeting
drugs have become popular chemotherapy drugs and actin-targeting drugs have not
(Trendowski, 2014).
The principal reason for the absence of actin targeting drugs in current chemotherapy
appears to be lack of selectivity. Consequently, researchers have attempted to find
molecular targets that are differentially expressed in cancer. The tropomyosin targeting
small molecule TR100 (Figure 8-1 C) and the natural toxin cytochalasin B (Figure 8-1

229
B) illustrate the difficulty. TM5NM1/2 is a tropomyosin that was chosen as a target
when it was found to be expressed at lower levels in normal fibroblasts than
transformed fibroblasts and to be consistently expressed in a panel of neuroblastoma
and melanoma cell lines, whereas other tropomyosins vary in expression level between
cell types (Stehn et al., 2013). TR100 was chosen for study from a chemical library
after showing activity against TM5NM1/2 (Stehn et al., 2013). TR100 treated
neuroblastoma cells demonstrated loss of cytoplasmic F-actin, aggregated actin,
reduced growth and reduced motility and there was low toxicity towards normal
neurons and muscle cells (Stehn et al., 2013). However, IC50 values for neuroblastoma
and melanoma cell lines treated with TR100 for 48 hours ranged from 1.2-4.5 µM and
1.85-4.7 µM respectively, little different from the IC50 of 4.1 µM obtained for normal
melanocytes, showing no clear evidence of selectivity (Stehn et al., 2013). The natural
toxin cytochalasins are well studied for their actin destabilising activity and over 3000
articles had been published on in vitro activity of cytochalasin B by 1990 (Bousquet et
al., 1990) but the compounds are difficult to obtain because they must be isolated from
fungal sources (Trendowski et al., 2014). Cytochalasin B has a cytostatic effect on
melanoma cells (Bousquet et al., 1990) and inhibits cytokinesis leading to binucleation
in normal cells and multinucleation in cancer cells, as seen in mouse mammary
epithelial and cancer cells (Steiner et al., 1978). It can delay the appearance of lung
cancer in mice injected with lung cancer cells, but had no effect on tumour growth
(Bousquet et al., 1990). Without a strong cytotoxic effect or selectivity on cancer cells,
few groups are now studying the cytochalasins as potential cancer therapies.
Flavonoids are a class of compounds that are consumed and metabolised by humans
on a daily basis, therefore it is attractive to think that they would have low toxicity if
administered as drugs. Average dietary intake of flavonoids is estimated at 1g/day from
fruit, vegetables, grains and seeds, and they are thought to prevent against many
pathologies, including cancer, allergy and inflammation (Chahar et al., 2011). Human
230
small intestines and gut bacteria have synthesised enzymes to cleave aglycones from
sugars, and both aglycones and flavonoid glycosides can be absorbed through the gut
epithelium (Erlund, 2004). Flavonoids are metabolised in the colon, liver and kidney
(Hollman, 2004). There are reports in the literature of individual flavonoids having
potential toxicity and some in vivo studies demonstrate toxicity, but there is little
evidence of harm to humans. Quercetin, a flavonol found in onion and tea, is the most
abundant dietary flavonoid with average intake 5-40 mg/day but a review of dietary
quercetin concluded that only very high consumers of fresh produce, who may reach
200-500 mg/day, would be at risk of toxicity (Sone et al., 1999; Russo et al., 2012).
Epidemiological evidence that high fruit and vegetable consumption either makes no
difference to overall mortality or extends life expectancy by 1 year over moderate
consumption (Hung et al., 2004; Leenders et al., 2013) seems to argue against
substantial flavonoid toxicity. Therefore flavonoids as a class offer an attractive source
of lead compounds for anticancer drugs through the drug discovery process.
8.2 Major findings
In this study, Clitoria root extract was found to be 2-3 fold more cytotoxic on two breast
cancer cell lines than on two normal cell lines and cytotoxic in a dose- and time-
dependent manner. This is the first report of selectivity in a Clitoria root extract. A
flower extract of Clitoria showed a dose- and time-dependent cytotoxicity on breast,
ovarian and laryngeal cancer cells and not on normal fibroblasts, according to results
from one experiment (Neda et al., 2013), but these authors did not investigate the
bioactive mechanism. Neda et al. (2013) saw evidence in GC-MS of compounds
present in the flower extract, but none was confirmed as the bioactive agent. Other
authors describe non-selective cytotoxicity with Clitoria extracts of leaf and aerial parts
on Dalton's lymphoma ascites cells (Ramaswamy et al., 2011; Jacob and Latha, 2013);
with flower extract on laryngeal carcinoma cells (Sarumathy et al., 2011); with extract of
the whole plant on cervical cancer cells (Nguyen et al., 2011); and with seed extract on
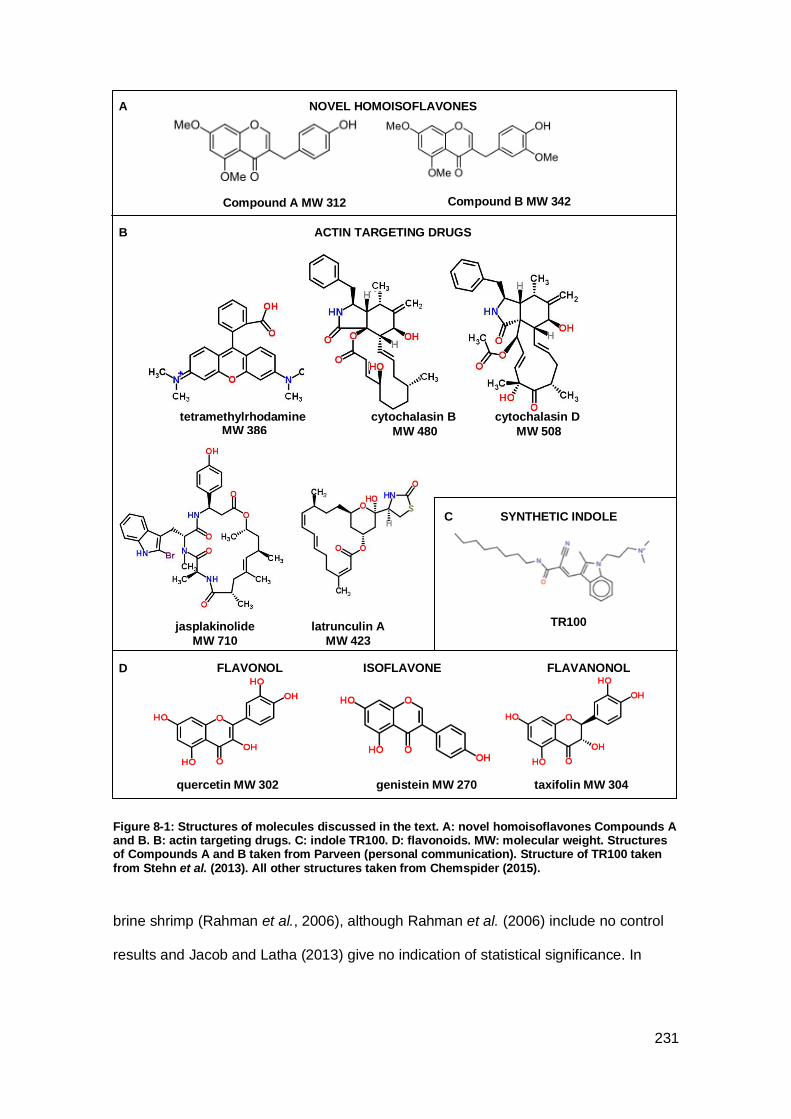
231
Figure 8-1: Structures of molecules discussed in the text. A: novel homoisoflavones Compounds A and B. B: actin targeting drugs. C: indole TR100. D: flavonoids. MW: molecular weight. Structures of Compounds A and B taken from Parveen (personal communication). Structure of TR100 taken from Stehn et al. (2013). All other structures taken from Chemspider (2015).
brine shrimp (Rahman et al., 2006), although Rahman et al. (2006) include no control
results and Jacob and Latha (2013) give no indication of statistical significance. In
genistein MW 270
Compound A MW 312 Compound B MW 342
quercetin MW 302
FLAVONOL
jasplakinolide
MW 710
cytochalasin D
MW 508
tetramethylrhodamine MW 386
taxifolin MW 304
ACTIN TARGETING DRUGS
ISOFLAVONE
A
B
cytochalasin B
MW 480
FLAVANONOL
C
D
SYNTHETIC INDOLE
TR100
NOVEL HOMOISOFLAVONES
latrunculin A
MW 423
232
addition, none of these groups have investigated the mechanism or the bioactive
agent.
In this study, Clitoria root extract and its bioactive fractions were also shown to reduce
cell motility, which has not previously been reported with Clitoria extract, and to
mediate these activities by disrupting the actin cytoskeleton. The active agents, seen
from bioassay-led fractionation with HPLC to be responsible for the majority of Clitoria
root extract effects on cells, were identified in LC-MS as two novel homoisoflavones
(Figure 7-12 A). The compounds appear to be present in Clitoria grown in three widely
separated locations, strongly suggesting that the enzymes responsible for their
synthesis are expressed by the species and not by a local Indian variant, and that the
compounds are not an environmental contaminant. According to a review by Lin et al.
(2014) they are unique among homoisoflavones reported in the literature so far in
having a carboxyl group in position 5 on the A-ring. Other authors describe the
cytotoxic nature of cyclic peptides, a protein, triterpenoids and a sterol found in Clitoria
root but none show evidence of selectivity towards cancer cells (see Chapter 1
Introduction, Table 1-9).
8.3 Cytotoxic mechanism
Evidence of disruption to the actin cytoskeleton is presented in Chapter 5, Mechanism
of action. Due to lack of time and limited quantities of compound the mode of action
could not be pursued further, therefore Compounds A and B were compared with
similar compounds in the literature. No studies were found that discussed
homoisoflavones’ effects on actin, but a recent paper provided a way of explaining the
action of Compounds A and B on actin, if they act similarly to quercetin. Quercetin
(Figure 8-1D) binds directly to actin and is able to inhibit actin polymerisation (Böhl et
al., 2005; Böhl et al., 2007). Similar to effects seen with Clitoria, in breast cancer cells
quercetin inhibits cell migration and shows a weak fragmentation of actin at the cell
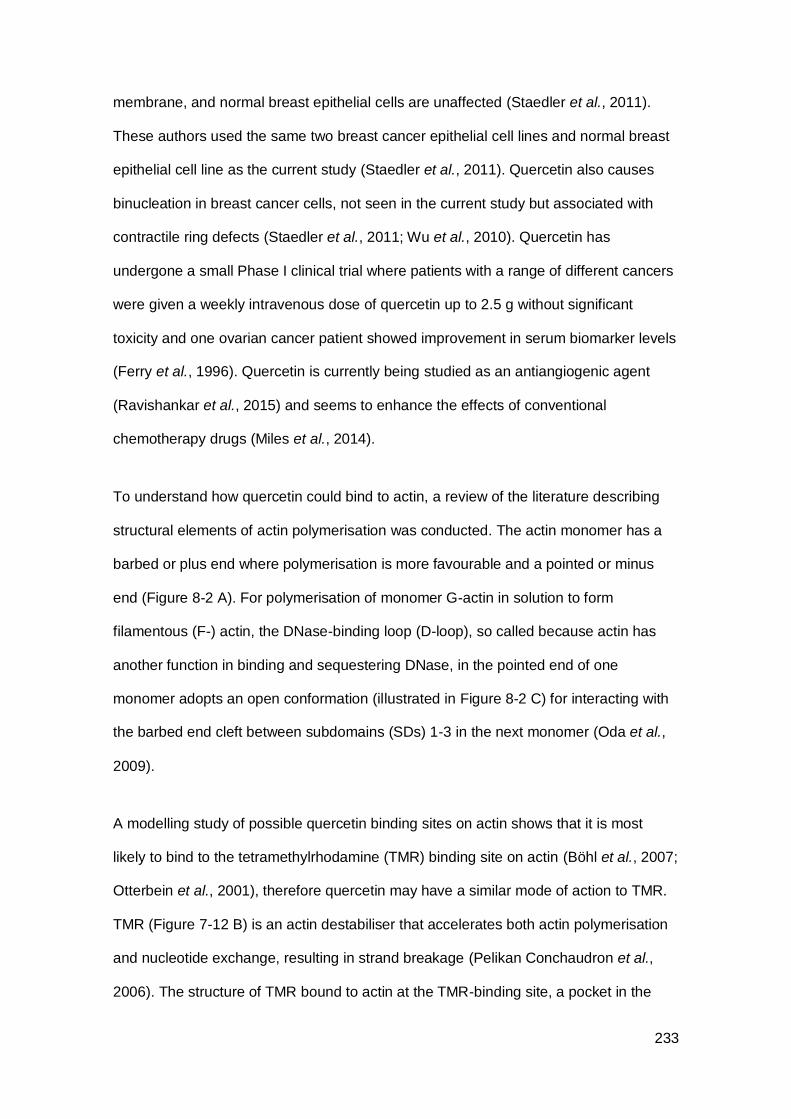
233
membrane, and normal breast epithelial cells are unaffected (Staedler et al., 2011).
These authors used the same two breast cancer epithelial cell lines and normal breast
epithelial cell line as the current study (Staedler et al., 2011). Quercetin also causes
binucleation in breast cancer cells, not seen in the current study but associated with
contractile ring defects (Staedler et al., 2011; Wu et al., 2010). Quercetin has
undergone a small Phase I clinical trial where patients with a range of different cancers
were given a weekly intravenous dose of quercetin up to 2.5 g without significant
toxicity and one ovarian cancer patient showed improvement in serum biomarker levels
(Ferry et al., 1996). Quercetin is currently being studied as an antiangiogenic agent
(Ravishankar et al., 2015) and seems to enhance the effects of conventional
chemotherapy drugs (Miles et al., 2014).
To understand how quercetin could bind to actin, a review of the literature describing
structural elements of actin polymerisation was conducted. The actin monomer has a
barbed or plus end where polymerisation is more favourable and a pointed or minus
end (Figure 8-2 A). For polymerisation of monomer G-actin in solution to form
filamentous (F-) actin, the DNase-binding loop (D-loop), so called because actin has
another function in binding and sequestering DNase, in the pointed end of one
monomer adopts an open conformation (illustrated in Figure 8-2 C) for interacting with
the barbed end cleft between subdomains (SDs) 1-3 in the next monomer (Oda et al.,
2009).
A modelling study of possible quercetin binding sites on actin shows that it is most
likely to bind to the tetramethylrhodamine (TMR) binding site on actin (Böhl et al., 2007;
Otterbein et al., 2001), therefore quercetin may have a similar mode of action to TMR.
TMR (Figure 7-12 B) is an actin destabiliser that accelerates both actin polymerisation
and nucleotide exchange, resulting in strand breakage (Pelikan Conchaudron et al.,
2006). The structure of TMR bound to actin at the TMR-binding site, a pocket in the
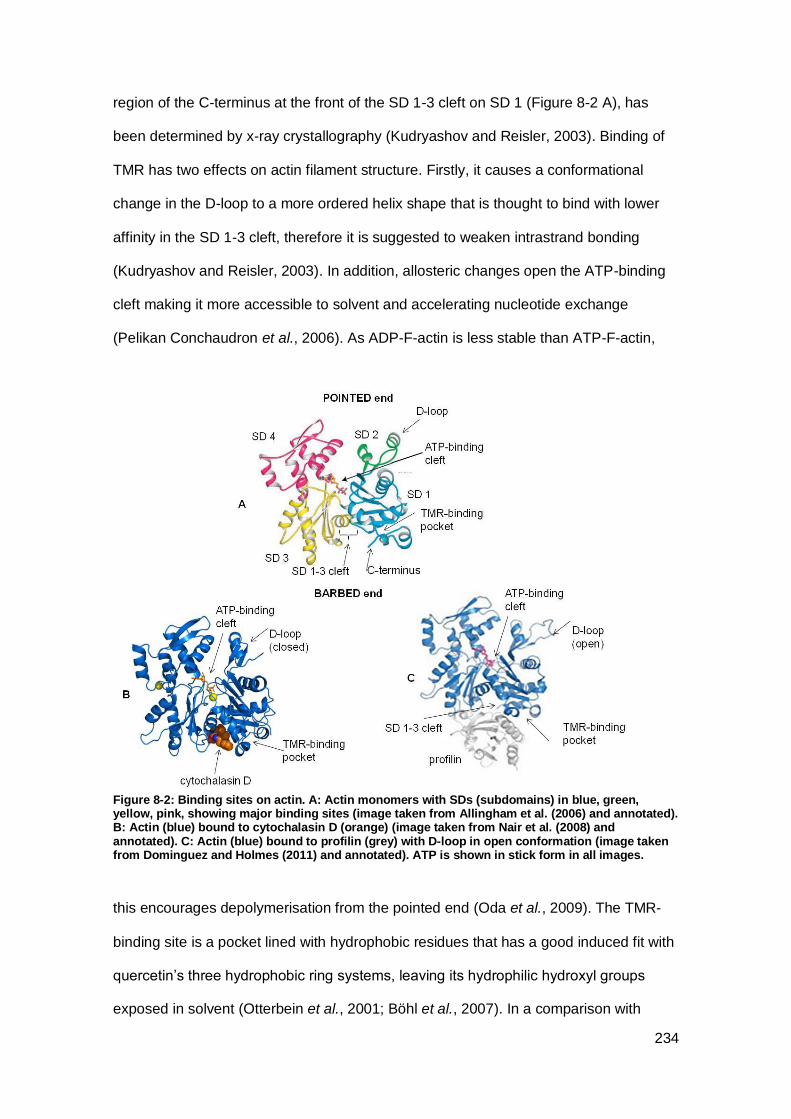
234
region of the C-terminus at the front of the SD 1-3 cleft on SD 1 (Figure 8-2 A), has
been determined by x-ray crystallography (Kudryashov and Reisler, 2003). Binding of
TMR has two effects on actin filament structure. Firstly, it causes a conformational
change in the D-loop to a more ordered helix shape that is thought to bind with lower
affinity in the SD 1-3 cleft, therefore it is suggested to weaken intrastrand bonding
(Kudryashov and Reisler, 2003). In addition, allosteric changes open the ATP-binding
cleft making it more accessible to solvent and accelerating nucleotide exchange
(Pelikan Conchaudron et al., 2006). As ADP-F-actin is less stable than ATP-F-actin,
Figure 8-2: Binding sites on actin. A: Actin monomers with SDs (subdomains) in blue, green, yellow, pink, showing major binding sites (image taken from Allingham et al. (2006) and annotated). B: Actin (blue) bound to cytochalasin D (orange) (image taken from Nair et al. (2008) and annotated). C: Actin (blue) bound to profilin (grey) with D-loop in open conformation (image taken from Dominguez and Holmes (2011) and annotated). ATP is shown in stick form in all images.
this encourages depolymerisation from the pointed end (Oda et al., 2009). The TMR-
binding site is a pocket lined with hydrophobic residues that has a good induced fit with
quercetin’s three hydrophobic ring systems, leaving its hydrophilic hydroxyl groups
exposed in solvent (Otterbein et al., 2001; Böhl et al., 2007). In a comparison with
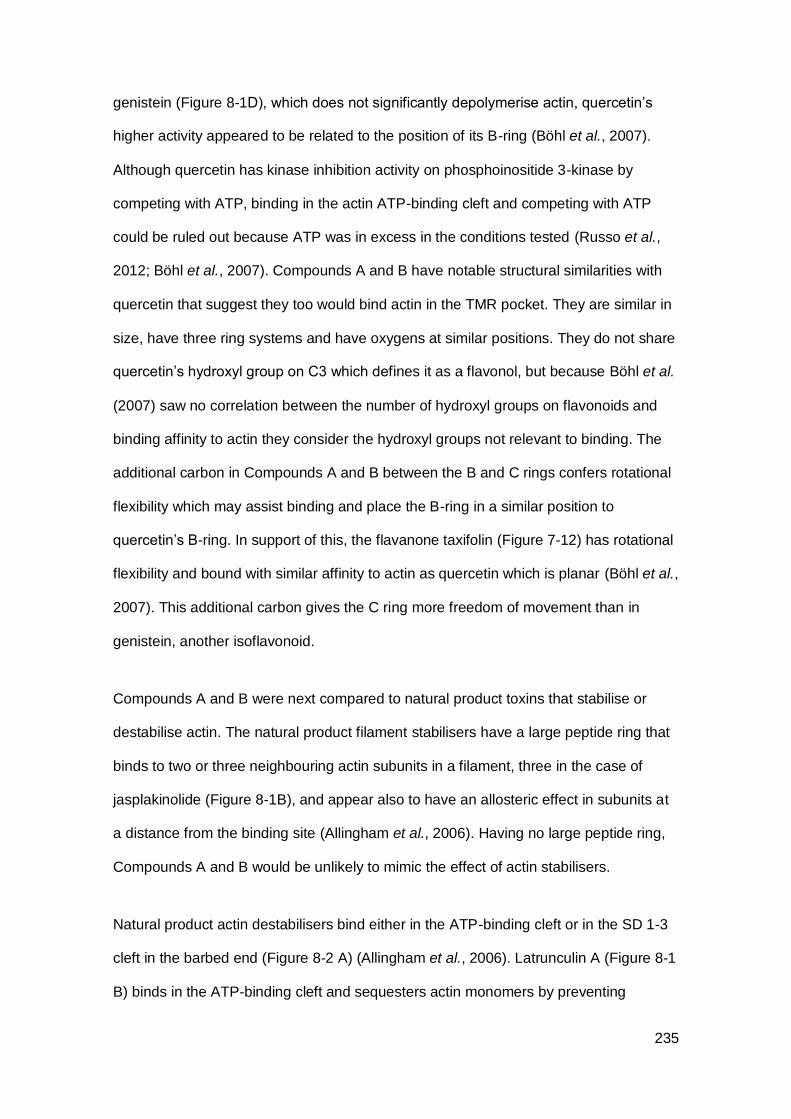
235
genistein (Figure 8-1D), which does not significantly depolymerise actin, quercetin’s
higher activity appeared to be related to the position of its B-ring (Böhl et al., 2007).
Although quercetin has kinase inhibition activity on phosphoinositide 3-kinase by
competing with ATP, binding in the actin ATP-binding cleft and competing with ATP
could be ruled out because ATP was in excess in the conditions tested (Russo et al.,
2012; Böhl et al., 2007). Compounds A and B have notable structural similarities with
quercetin that suggest they too would bind actin in the TMR pocket. They are similar in
size, have three ring systems and have oxygens at similar positions. They do not share
quercetin’s hydroxyl group on C3 which defines it as a flavonol, but because Böhl et al.
(2007) saw no correlation between the number of hydroxyl groups on flavonoids and
binding affinity to actin they consider the hydroxyl groups not relevant to binding. The
additional carbon in Compounds A and B between the B and C rings confers rotational
flexibility which may assist binding and place the B-ring in a similar position to
quercetin’s B-ring. In support of this, the flavanone taxifolin (Figure 7-12) has rotational
flexibility and bound with similar affinity to actin as quercetin which is planar (Böhl et al.,
2007). This additional carbon gives the C ring more freedom of movement than in
genistein, another isoflavonoid.
Compounds A and B were next compared to natural product toxins that stabilise or
destabilise actin. The natural product filament stabilisers have a large peptide ring that
binds to two or three neighbouring actin subunits in a filament, three in the case of
jasplakinolide (Figure 8-1B), and appear also to have an allosteric effect in subunits at
a distance from the binding site (Allingham et al., 2006). Having no large peptide ring,
Compounds A and B would be unlikely to mimic the effect of actin stabilisers.
Natural product actin destabilisers bind either in the ATP-binding cleft or in the SD 1-3
cleft in the barbed end (Figure 8-2 A) (Allingham et al., 2006). Latrunculin A (Figure 8-1
B) binds in the ATP-binding cleft and sequesters actin monomers by preventing
236
nucleotide exchange (Yarmola et al., 2000). However, latrunculin binding relies on a
biologically rare and very specific ring structure that is not shared by Compounds A and
B (Allingham et al., 2006). Cytochalasin D (Figure 8-1 B) is an example of an actin
destabiliser that binds the barbed end of G-actin and F-actin in the SD 1-3 cleft (Figure
8-2 B), which has two effects. Its bulky form inhibits the next actin monomer’s D-loop
binding in the cleft and it allosterically alters the shape of the D-loop in the same
monomer to a more ordered shape, therefore may weaken binding to the adjacent
monomer (Nair et al., 2008).
Figure 8-3: Model of flavonoid activity with actin filaments in breast cancer cells. A: without flavonoid, filaments are stable. B: with flavonoid, drug accelerates nucleotide exchange from ATP to ADP in the strand, D-loop binding may be weakened, ADP-actin depolymerises faster than ATP-actin. F: Flavonoid, i.e. Clitoria extract, Compound A, Compound B or quercetin. G-actin: globular (unpolymerised) actin. F-actin: filamentous actin. ADP: adenosine diphosphate. ATP: adenosine triphosphate. Illustration based on the exchange diffusion model for profilin discussed in Yarmola and Bubb (2009).
Compounds A and B appear too small to span or fill the SD 1-3 cleft like cytochalasin D
but they could bind in the cleft and sterically hinder the D-loop binding. However, due to
structural similarity, Compounds A and B are more likely to bind in the TMR-binding
loop similarly to quercetin. If this is correct, Compounds A and B would weaken
intrastrand binding by altering the shape of the D-loop and its fit in the SD 1-3 cleft, and
237
accelerate ATP exchange to ADP, making the filament less stable as illustrated in
Figure 8-3.
In the cell, the actin cytoskeleton interacts with a large number of actin binding proteins
(ABPs). One ABP that binds near the TMR binding site and has importance in cancer is
profilin (Figure 8-2 C), and it was considered how Compounds A and B might compete
with and either agonise or antagonise profilin binding to actin. Profilin has four isoforms
of which profilin-1 is expressed in almost all eukaryotic cells at >50 μM (Witke, 2004).
Several authors present evidence of profilin-1 as a tumour suppressor that is
downregulated in breast cancer. Ding et al. (2014) concluded from 193 human breast
tumours that profilin-1 was downregulated by around 20% compared to normal tissue,
with lowest expression found in the more advanced cancers. However, Rizwani et al.
(2014) found 1.6 ± 0.3-fold higher profilin-1 in breast cancer tissues than in surrounding
cells, therefore its low level of expression in breast cancer is not universal.
Profilin-1 appears to reduce cell proliferation and migratory activity, consistent with a
tumour suppressor role. Profilin-1 upregulation led to reduced proliferation and G1 cell
cycle arrest and reduced speed of cell migration in breast cancer cells (Zou et al.,
2010; Lorente et al., 2014). When profilin-1 is downregulated in breast cancer cells,
motility increases, invasion in matrigel increases and xenografts in mice become
hyperinvasive (Bae et al., 2009; Ding et al., 2014). Profilin-1 also has other anticancer
effects as it is able to reduce cell motility by binding phosphatidylinositol 4,5-
bisphosphate, preventing its hydrolysis by phospholipase C and its signalling via the
mammalian target of rapamycin (mTOR) pathway which promotes survival, proliferation
and motility, and it can increase the activity of phosphatase and tensin homolog, a
suppressor of the mTOR pathway in cancer, in breast cancer cells (Bae et al., 2010;
Das et al., 2009).
238
The overall effect of profilin-1 as a tumour suppressor on the actin cytoskeleton seems
to be to destabilise filaments and inhibit their growth (Yarmola and Bubb, 2009). Profilin
can fit in the SD 1-3 cleft at the same time as the D-loop of the adjacent monomer
therefore it does not block polymerisation (Figure 8-2 C) (Schutt et al., 1993), and it
interacts with the region of the TMR-binding site (Schutt et al., 1993). Similar to TMR,
profilin-1 can open the ATP-binding cleft and change the shape of the D-loop (Porta
and Borgstahl, 2012) (Dominguez, 2004). In addition, as the profilin-G-actin monomer
is more stable than the profilin-F-actin filament, profilin effectively sequesters actin in
the cytoplasm (Yarmola and Bubb, 2009). In normal cells actin is present in a 50:50
ratio of G:F-actin, but ~100-fold more G-actin is bound to profilin and unavailable for
polymerisation (Dominguez and Holmes, 2011).
The effect of Compounds A and B interacting with profilin-1 was considered with
reference to its expression level in the cell lines used in this study. Profilin-1 expression
levels were found for the MDA-MB-231 breast cancer cell line and the MCF-10A
normal breast epithelial cell line used in this study and were relatively low and high
respectively (Janke et al., 2000; Zou et al., 2007). In breast cancer cells with low
profilin-1 Clitoria may mimic and partially replace profilin-1 depolymerisation activity. In
cancer cells, fragmented filaments at the cell cortex would hinder cell migration and cell
ruffling as seen with Clitoria. In support of this hypothesis, images of MDA-MB-231
breast cancer cells with overexpressed profilin-1 have increased circumferential stress
fibres and also appear to show aggregated actin (Zou et al., 2009) similar to the
granular actin seen after treatment with Clitoria and its fraction F17. During cell
division, disruption to retraction filaments could cause cells to lose adhesion and a
weaker actin-rich contractile ring could delay cytokinesis as seen with Clitoria and
contribute to the blebbing at cytokinesis seen with some cancer cells treated with
Clitoria fraction F17.

239
No data could be found for levels of profilin-1 expression in normal fibroblasts but it
was hypothesised that these normal cells contained abundant profilin-1. When profilin-
1 is abundant, Compounds A and B may compete with it for actin binding but would
have to be present in large concentrations, and to bind actin with similar affinity, to
have any significant effect. However, if the majority of profilin-1 sequesters G-actin
monomers, Compounds A and B may promote depolymerisation of F-actin not bound
to profilin-1, reducing the growth or stability of actin filaments at the leading edge of
cells and reducing cell motility. β-actin and γ-actin are present in the cytoskeleton of all
cells (Perrin and Ervasti, 2010). β-actin is found in stress fibres and the contractile ring
and γ-actin in branched filaments, lamellae and the cortex of dividing cells, and in
stationary cells γ-actin relocates from the peripheral branched actin to stress fibres
(Dugina et al., 2009). The more noticeable stress fibres in normal fibroblasts treated
with Clitoria and fraction F18 may be due to γ-actin moving from the lamella to the
stress fibres as a result of becoming stationary. Therefore this model offers a potential
explanation for the differential response of cancer and normal cells to Clitoria and
Compounds A and B.
The possibility of Compounds A and B inhibiting small GTPase RhoA either directly or
indirectly was considered. RhoA is frequently upregulated in breast cancer and
associated with cell proliferation and metastasis (Bellizzi et al., 2008). The reduced cell
motility, reduced ruffling and delayed mitosis seen in this study could be associated
with lower RhoA activity. Few examples of flavonoid interaction with small Rho
GTPases or their effector GEFs and GAPs could be located in the literature, but there
are examples of lower RhoA activity after treatment with quercetin and the flavonoids
isoquercetin and flavone. When mice with implanted breast cancers were fed
quercetin, expression of RhoA, Rac1 and Cdc42 genes was reduced 1.5-2 fold and the
tumours were reduced in size (Martinez-Montemayor et al., 2010). In nerve cells,
inhibition of neurite formation caused by RhoA was reversed by treatment with

240
isoquercetin which reduced RhoA activity (Palazzolo et al., 2012), and Baek et al.
(2009) saw that flavone inhibited RhoA activation and reduced vascular contraction in
rat aortic rings. In contrast, in a study looking at proteins in oral cancer cells whose
expression was altered as a result of quercetin treatment, neither Rho nor Rac protein
expression was found to be changed (Lai et al., 2013). With this evidence, and as
Clitoria affects processes that involve RhoA, lower RhoA activation cannot be ruled out.
The differential response of fibroblasts to cancer cells and the apparent fragmentation
of actin filaments in cancer cells might be explained by different GEFs and GAPs acting
on RhoA in the different cell types.
8.4 Limitations
The aims of the project (see Chapter 1, Introduction) were all met. A major limitation of
the study was the small supply of extracts which limited both the type and number of
assays possible with Clitoria. Cheilocostus extract was also cytotoxic and one fraction
appeared to have differential toxicity towards cancer cells but due to the limited supply
of extract this work could not be pursued. However, the low supply prompted a search
for other sources of Clitoria extract leading to the interesting finding that the bioactive
homoisoflavones were present in plants from at least two and probably three locations.
It could not be confirmed that treated cells were dying in the cell viability assays,
although this appeared to be the case from visual examination. If more extract had
been available, assays would have been designed to resolve whether cells had died
due to treatment, had lost adhesion through treatment and died due to lack of
attachment and anoikis, or had detached without dying. It also proved challenging to
transfer doses between different types of assay, as a treatment of crude Clitoria that
appeared to kill 40% of cells in a cell viability assay did not kill cells in live cell imaging.
However, the assays provide very different types of information and this illustrates the
need for different types of assay to build a complete picture.
241
It was not possible to identify the selective non-polar bioactive agents in FTIR, and LC-
MS work in the limited timescale of the study focussed on the two major bioactive
peaks. With more extract, structural elucidation of these compounds could be pursued.
8.5 Further work
Compounds A and B are relatively simple to synthesise from freely available
precursors and this work is under way in collaboration with Aberystwyth University and
University of Bath. Once adequate supplies of the compounds are available, assays
will be repeated with the same cell lines to confirm that these compounds are
responsible for the effects seen in this study. To see whether the effects are specific to
breast cancer or are common to other cancers, the compounds will be tested on other
cancer cell lines. Other normal cell lines will also be assayed to see whether the
selectivity extends to more cell types.
With synthesised compounds, more investigations into the nature of cell death and the
mechanism of action can be performed. It can be confirmed at what treatment dose the
compounds are cytotoxic or cytostatic, and whether the relationship between doubling
time and sensitivity holds and extends to other cell lines. Suitable techniques for
confirming whether cells die through apoptosis or oncosis include flow cytometry with
Annexin V and assays for markers of apoptosis such as mitochondrial membrane
permeability, caspase activation and DNA laddering. To investigate the compounds’
effect on actin further, direct binding to actin can be assayed with a tryptophan
fluorescence quenching assay as performed by Böhl et al. (2005), and the G-actin:F-
actin ratio in treated cells can be assayed to see whether and by how much the
compounds depolymerise actin filaments using techniques in Stehn et al. (2013) or in
Lu et al. (2005).
242
It is not immediately clear how actin depolymerisation might lead to cell death in cancer
cells. From live cell imaging it appears that cancer cells treated with F17 undergo a
prolonged mitosis, frequently not completing it by the end of the assay, suggesting that
the spindle or the contractile ring are not functioning correctly. Actin filaments have a
role in spindle positioning which can be disrupted with latrunculin B (Gachet et al.,
2001) and the contractile ring is formed of actomyosin filaments which fail to form
correctly with cytochalasin B treatment (Zieve, 1884), therefore these functions can be
investigated. The microtubules and contractile ring can be visualised with fluorescence
microscopy. To see if cells enter mitotic arrest, they can be synchronised in prophase
and assayed for cell cycle stage after a period of time with flow cytometry. Alternatively,
actin retraction fibres could be disrupted, allowing detachment from the substrate and
anoikis cell death. Retraction fibres can be visualised through the proteins in the focal
adhesion complex that attaches them to the substrate.
Cell motility is seen in live cell imaging to be reduced by treatment with Clitoria extract
and fraction F17. This effect could be quantified with cell migration assays. RhoA is
involved in cell motility, actin stress fibres and the formation of the contractile ring and
any changes in RhoA activity in treated cells could be investigated.
8.6 Conclusion
Fractions from the major peaks in Clitoria are 2-3 fold more cytotoxic on breast cancer
cells than normal cells and appear to target the complex actin cytoskeleton similarly to
another flavonoid, quercetin. It is likely that the bioactive compounds in these fractions
are novel homoisoflavones Compounds A and B. If Compounds A and B replace the
function of a tumour suppressor cytoskeletal protein that is downregulated in cancer,
they offer selectivity not seen with other cytoskeleton targeting drugs, that may be
effective on a range of cancers and in many patient groups. Alternatively, if the

243
compounds target cells during mitosis, which cancer cells undergo more frequently,
they have potential as chemotherapeutic agents similar to microtubule inhibitors. As
flavonoids they are likely to be well tolerated by patients. Because sufficient quantities
of the compounds can be synthesised in the laboratory, obtaining plant material from
natural resources and running low yield extractions will be unnecessary. Anti-
proliferative and cytotoxic effects are directly relevant against cancer growth and
angiogenesis, and anti-migratory effects may combat metastasis for which there are
currently no effective drugs. Efficacy on both ER positive and ER negative breast
cancer cell lines suggests that they may offer a further option for the 25% of breast
cancer patients who are ER negative and have few other treatment options.
With their cytotoxicity and metastasis inhibition activities that appear to target more
actively dividing cells, novel Compounds A and B may offer a low cost option for a
large group of cancer patients. The UK National Institute of Health and Care
Excellence (NICE) has ruled out NHS use of olaparib (£4,200 per month) and Kadcyla
(£90,000 per course of treatment) after a cost-effectiveness assessment (FT, 2015).
Pharmaceutical companies justify high drug prices by quoting high research and
development costs for drugs where the target patient groups are often a small subset
of cancer patients (Kantarjian et al., 2013). A debate has arisen between those who
maintain that drug companies should be rewarded for innovation, risk and expense and
others who say that they cannot continue to charge high prices for drugs that show
small improvements in life expectancy or time to regression, or minimal advantages
compared to near rivals (Ward, 2015). In contrast, chemotherapy drugs are less
targeted and can be given to more patients. Unlike many current drugs which target a
small subset of cancers, have a small target market and are consequently very
expensive, novel Compounds A and B may be very cost effective. In conclusion, the
two novel homoisoflavones isolated from Clitoria in this study appear to be potential

244
lead compounds for anticancer drugs and to justify further work to identify the
molecular target.
245
References
Abreu, M.L.C., Vieira, R.A.M., Rocha, N.S., Araujo, R.P., Gloria, L.S., Fernandes, A.M., de Lacerda, P.D. and Junior, A.G. (2014) Clitoria ternatea L. as a Potential High Quality Forage Legume. Asian-Australasian Journal of Animal Sciences. 27(2), 169–178.
Ahmad, S.I., Kirk, S.H. and Eisenstark, A. (1998) Thymine Metabolism and Thymineless Death in Prokaryotes and Eukaryotes. Annual Review of Microbiology. 52(1), 591–625.
Ahmed, D., Kumar, V., Sharma, M. and Verma, A. (2014) Target guided isolation, in-vitro antidiabetic, antioxidant activity and molecular docking studies of some flavonoids from Albizzia Lebbeck Benth. bark. BMC Complementary and Alternative Medicine. 14(1), 155.
Ahmed, Y., Sohrab, M.H., Al-Reza, S.M., Tareq, F.S., Hasan, C.M. and Sattar, M.A. (2010) Antimicrobial and cytotoxic constituents from leaves of Sapium baccatum. Food and Chemical Toxicology: An International Journal Published for the British Industrial Biological Research Association. 48(2), 549–552.
Alberts, B., Johnson, A., Lewis, J., Raff, M., Roberts, K. and Walter, P. (2002) Molecular Biology of the Cell. 4th ed. New York: Garland Science.
Allingham, J.S., Klenchin, V.A. and Rayment, I. (2006) Actin-targeting natural products: structures, properties and mechanisms of action. Cellular and Molecular Life Sciences CMLS. 63(18), 2119–2134.
Allred, D.C., Mohsin, S.K. and Fuqua, S.A. (2001) Histological and biological evolution of human premalignant breast disease. Endocrine-Related Cancer. 8(1), 47–61.
Amos, L.A. and Löwe, J. (1999) How Taxol® stabilises microtubule structure. Chemistry & Biology. 6(3), R65–R69.
Anderson, J.T., Willis, J.H. and Mitchell-Olds, T. (2011) Evolutionary genetics of plant adaptation. Trends in genetics : TIG. 27(7), 258–266.
Angst, E., Park, J.L., Moro, A., Lu, Q.-Y., Lu, X., Li, G., King, J., Chen, M., Reber, H.A., Go, V.L.W., Eibl, G. and Hines, O.J. (2013) The flavonoid quercetin inhibits pancreatic cancer growth in vitro and in vivo. Pancreas. 42(2), 223–229.
Arnold, S.F., Robinson, M.K., Notides, A.C., Guillette, L.J. and McLachlan, J.A. (1996) A yeast estrogen screen for examining the relative exposure of cells to natural and xenoestrogens. Environmental Health Perspectives. 104(5), 544–548.
Ashkenazi, A. (2008) Targeting the extrinsic apoptosis pathway in cancer. Cytokine & Growth Factor Reviews. 19(3–4), 325–331.
AstraZeneca (2014) LYNPARZATM approved by the US food and drug administration for the treatment of advanced ovarian cancer in patients with germline BRCA-mutations. [online]. Available from: http://www.astrazeneca.com/Media/Press-releases/Article/20141219--lynparza-approved [Accessed June 8, 2015].
ATCC (2014) ATCC-LGC. [online]. Available from: http://www.lgcstandards-atcc.org/en.aspx [Accessed March 3, 2015].
246
Azmir, J., Zaidul, I.S.M., Rahman, M.M., Sharif, K.M., Mohamed, A., Sahena, F., Jahurul, M.H.A., Ghafoor, K., Norulaini, N.A.N. and Omar, A.K.M. (2013) Techniques for extraction of bioactive compounds from plant materials: A review. Journal of Food Engineering. 117(4), 426–436.
Badache, A. and Gonçalves, A. (2006) The ErbB2 signaling network as a target for breast cancer therapy. Journal of mammary gland biology and neoplasia. 11(1), 13–25.
Bae, Y.H., Ding, Z., Das, T., Wells, A., Gertler, F. and Roy, P. (2010) Profilin1 regulates PI(3,4)P2 and lamellipodin accumulation at the leading edge thus influencing motility of MDA-MB-231 cells. Proceedings of the National Academy of Sciences of the United States of America. 107(50), 21547–21552.
Bae, Y.H., Ding, Z., Zou, L., Wells, A., Gertler, F. and Roy, P. (2009) Loss of profilin-1 expression enhances breast cancer cell motility by Ena/VASP proteins. Journal of Cellular Physiology. 219(2), 354–364.
Baek, I., Jeon, S.B., Song, M.-J., Yang, E., Sohn, U.D. and Kim, I.K. (2009) Flavone Attenuates Vascular Contractions by Inhibiting RhoA/Rho Kinase Pathway. The Korean Journal of Physiology & Pharmacology: Official Journal of the Korean Physiological Society and the Korean Society of Pharmacology. 13(3), 201–207.
Balachandran, P. and Govindarajan, R. (2005) Cancer--an ayurvedic perspective. Pharmacological research: the official journal of the Italian Pharmacological Society. 51(1), 19–30.
Ballaré, C., Uhrig, M., Bechtold, T., Sancho, E., Di Domenico, M., Migliaccio, A., Auricchio, F. and Beato, M. (2003) Two domains of the progesterone receptor interact with the estrogen receptor and are required for progesterone activation of the c-Src/Erk pathway in mammalian cells. Molecular and Cellular Biology. 23(6), 1994–2008.
Banerjee, S. and Mazumdar, S. (2012) Electrospray Ionization Mass Spectrometry: A Technique to Access the Information beyond the Molecular Weight of the Analyte. International Journal of Analytical Chemistry. 2012, e282574.
Barik, D., Naik, S., Mudgal, A. and Chand, P. (2007) Rapid plant regeneration through in vitro axillary shoot proliferation of butterfly pea (Clitoria ternatea L.)—a twinning legume. In Vitro Cellular & Developmental Biology - Plant. 43(2), 144–148.
Barnes, P.M., Bloom, B. and Nahin, R.L. (2008) Complementary and alternative medicine use among adults and children: United States, 2007. National Health Statistics Reports. (12), 1–23.
Bart, H.-J. (2011) Extraction of Natural Products from Plants – An Introduction. In H.-J. Bart & S. Pilz, eds. Industrial Scale Natural Products Extraction. Wiley-VCH Verlag
GmbH & Co. KGaA, pp. 1–25.
Bartsch, R., Wenzel, C. and Steger, G.G. (2007) Trastuzumab in the management of early and advanced stage breast cancer. Biologics : Targets & Therapy. 1(1), 19–31.
Baselga, J., Campone, M., Piccart, M., Burris, H.A., Rugo, H.S., Sahmoud, T., Noguchi, S., Gnant, M., Pritchard, K.I., Lebrun, F., Beck, J.T., Ito, Y., Yardley, D., Deleu, I., Perez, A., Bachelot, T., Vittori, L., Xu, Z., Mukhopadhyay, P., Lebwohl, D. and Hortobagyi, G.N. (2012) Everolimus in Postmenopausal Hormone-Receptor–Positive Advanced Breast Cancer. New England Journal of Medicine. 366(6), 520–529.

247
Baselga, J. and Swain, S.M. (2010) CLEOPATRA: a phase III evaluation of pertuzumab and trastuzumab for HER2-positive metastatic breast cancer. Clinical breast cancer. 10(6), 489–491.
Baum, M., Budzar, A.U., Cuzick, J., Forbes, J., Houghton, J.H., Klijn, J.G.M. and Sahmoud, T. (2002) Anastrozole alone or in combination with tamoxifen versus tamoxifen alone for adjuvant treatment of postmenopausal women with early breast cancer: first results of the ATAC randomised trial. The Lancet. 359(9324), 2131–2139.
Bellizzi, A., Mangia, A., Chiriatti, A., Petroni, S., Quaranta, M., Schittulli, F., Malfettone, A., Cardone, R.A., Paradiso, A. and Reshkin, S.J. (2008) RhoA protein expression in primary breast cancers and matched lymphocytes is associated with progression of the disease. International Journal of Molecular Medicine. 22(1), 25–31.
Benayad, Z., Gómez-Cordovés, C. and Es-Safi, N.E. (2014) Characterization of Flavonoid Glycosides from Fenugreek (Trigonella foenum-graecum) Crude Seeds by HPLC–DAD–ESI/MS Analysis. International Journal of Molecular Sciences. 15(11),
20668–20685.
Bent, S. and Ko, R. (2004) Commonly used herbal medicines in the United States: a review. The American Journal of Medicine. 116(7), 478–485.
Bettuzzi, S., Brausi, M., Rizzi, F., Castagnetti, G., Peracchia, G. and Corti, A. (2006) Chemoprevention of Human Prostate Cancer by Oral Administration of Green Tea Catechins in Volunteers with High-Grade Prostate Intraepithelial Neoplasia: A Preliminary Report from a One-Year Proof-of-Principle Study. Cancer Research. 66(2),
1234–1240.
Bhaskar, A., Vidhya, V.G. and Ramya, M. (2008) Hypoglycemic effect of Mucuna pruriens seed extract on normal and streptozotocin-diabetic rats. Fitoterapia. 79(7-8),
539–543.
Bhattacharya, S. and Nagaich, U. (2010) Assessment of anti-nociceptive efficacy of Costus speciosus rhizome in Swiss albino mice. Journal of Advanced Pharmaceutical Technology & Research. 1(1), 34–40.
Bhuyan, B. and Zaman, K. (2008) Evaluation of hepatoprotective activity of rhizomes of Costus Speciosus (J. Konig) Smith. Pharmacologyonline. 3, 119–126.
Bisby, F. (1994) Phytochemical Dictionary of the Leguminosae. CRC Press.
Blagosklonny, M.V. (2007) Mitotic Arrest and Cell Fate: Why and How Mitotic Inhibition of Transcription Drives Mutually Exclusive Events. Cell Cycle. 6(1), 70–74.
Blagosklonny, M.V., Schulte, T., Nguyen, P., Trepel, J. and Neckers, L.M. (1996) Taxol-induced apoptosis and phosphorylation of Bcl-2 protein involves c-Raf-1 and represents a novel c-Raf-1 signal transduction pathway. Cancer Research. 56(8), 1851–1854.
Blanks, R.G., Moss, S.M., McGahan, E., Quinn, M.J. and Babb, P.J. (2000) Effect of NHS breast screening programme on mortality from breast cancer in England and Wales, 1990-8: comparison of observed with predicted mortality. British Medical Journal. 321(7262), 665–669.
248
Blum, J.L., Jones, S.E., Buzdar, A.U., LoRusso, P.M., Kuter, I., Vogel, C., Osterwalder, B., Burger, H.-U., Brown, C.S. and Griffin, T. (1999) Multicenter Phase II Study of Capecitabine in Paclitaxel-Refractory Metastatic Breast Cancer. Journal of Clinical Oncology. 17(2), 485–485.
Boehnke Michaud, L. (2009) The optimal therapeutic use of ixabepilone in patients with locally advanced or metastatic breast cancer. Journal of Oncology Pharmacy Practice: Official Publication of the International Society of Oncology Pharmacy Practitioners. 15(2), 95–106.
Böhl, M., Czupalla, C., Tokalov, S.V., Hoflack, B. and Gutzeit, H.O. (2005) Identification of actin as quercetin-binding protein: an approach to identify target molecules for specific ligands. Analytical Biochemistry. 346(2), 295–299.
Böhl, M., Tietze, S., Sokoll, A., Madathil, S., Pfennig, F., Apostolakis, J., Fahmy, K. and Gutzeit, H.O. (2007) Flavonoids Affect Actin Functions in Cytoplasm and Nucleus. Biophysical Journal. 93(8), 2767–2780.
Boncler, M., Różalski, M., Krajewska, U., Podsędek, A. and Watala, C. (2014) Comparison of PrestoBlue and MTT assays of cellular viability in the assessment of anti-proliferative effects of plant extracts on human endothelial cells. Journal of Pharmacological and Toxicological Methods. 69(1), 9–16.
Borm, B., Requardt, R.P., Herzog, V. and Kirfel, G. (2005) Membrane ruffles in cell migration: indicators of inefficient lamellipodia adhesion and compartments of actin filament reorganization. Experimental Cell Research. 302(1), 83–95.
Borthakur, S.K. (2012) Gauhati University Assam Plants. Assam Plants. [online]. Available from: http://assamplants.com/ [Accessed March 30, 2015].
Bortner, C.D. and Cidlowski, J.A. (2014) Ion channels and apoptosis in cancer. Philosophical Transactions of the Royal Society of London B: Biological Sciences. 369(1638), 20130104.
Bouker, K.B. and Hilakivi-Clarke, L. (2000) Genistein: does it prevent or promote breast cancer? Environmental Health Perspectives. 108(8), 701–708.
Boulay, A., Rudloff, J., Ye, J., Zumstein-Mecker, S., O’Reilly, T., Evans, D.B., Chen, S. and Lane, H.A. (2005) Dual inhibition of mTOR and estrogen receptor signaling in vitro induces cell death in models of breast cancer. Clinical cancer research: an official journal of the American Association for Cancer Research. 11(14), 5319–5328.
Bousquet, P.F., Paulsen, L.A., Fondy, C., Lipski, K.M., Loucy, K.J. and Fondy, T.P. (1990) Effects of cytochalasin B in culture and in vivo on murine Madison 109 lung carcinoma and on B16 melanoma. Cancer Research. 50(5), 1431–1439.
Brain, K.R. (1976) Accumulation of L-DOPA in cultures from Mucuna pruriens. Plant Science Letters. 7(3), 157–161.
Bridger, J., Kill, I., O’Farrell, M. and Hutchison, C. (1993) Internal lamin structures within G1 nuclei of human dermal fibroblasts. Journal of Cell Science. 104, 297–306.
Brusotti, G., Cesari, I., Dentamaro, A., Caccialanza, G. and Massolini, G. (2013) Isolation and characterization of bioactive compounds from plant resources: The role of

249
analysis in the ethnopharmacological approach. Journal of Pharmaceutical and Biomedical Analysis.
Bryce, N.S., Schevzov, G., Ferguson, V., Percival, J.M., Lin, J.J.-C., Matsumura, F., Bamburg, J.R., Jeffrey, P.L., Hardeman, E.C., Gunning, P. and Weinberger, R.P. (2003) Specification of Actin Filament Function and Molecular Composition by Tropomyosin Isoforms. Molecular Biology of the Cell. 14(3), 1002–1016.
Bubb, M.R., Spector, I., Beyer, B.B. and Fosen, K.M. (2000) Effects of Jasplakinolide on the Kinetics of Actin Polymerization. An Explanation for Certain in vivo Observations. Journal of Biological Chemistry. 275(7), 5163–5170.
Bucar, F., Wube, A. and Schmid, M. (2013) Natural product isolation – how to get from biological material to pure compounds. Natural Product Reports. 30(4), 525–545.
Bundred, N.J. (2009) Aromatase inhibitors and bone health. Current opinion in obstetrics & gynecology. 21(1), 60–67.
Burger, K., Muhl, B., Harasim, T., Rohrmoser, M., Malamoussi, A., Orban, M., Kellner, M., Gruber-Eber, A., Kremmer, E., Holzel, M. and Eick, D. (2010) Chemotherapeutic Drugs Inhibit Ribosome Biogenesis at Various Levels. The Journal of Biological Chemistry. 285(16), 12416–12425.
Cadoo, K.A., Gucalp, A. and Traina, T.A. (2014) Palbociclib: an evidence-based review of its potential in the treatment of breast cancer. Breast Cancer : Targets and Therapy. 6, 123–133.
Cai, W., Gu, X. and Tang, J. (2010) Extraction, Purification, and Characterisation of the Flavonoids from Opuntia milpa alta Skin. Czech Journal of Food Sciences. 28(2), 108–116.
Cailleau, R., Young, R., Olivé, M. and Reeves, Jr., W.J. (1974) Breast tumor cell lines from pleural effusions. Journal of the National Cancer Institute. 53(3), 661–674.
Cannell, R., Sarker, S. and Nahar, L. (2005) Follow-up of Natural Products Isolation. In S. Sarker & L. Nahar, eds. Natural Products Isolation. New Jersey: Humana Press.
Di Carlo, G., Mascolo, N., Izzo, A.A. and Capasso, F. (1999) Flavonoids: Old and new aspects of a class of natural therapeutic drugs. Life Sciences. 65(4), 337–353.
Cassidy, A., Brown, J.E., Hawdon, A., Faughnan, M.S., King, L.J., Millward, J., Zimmer-Nechemias, L., Wolfe, B. and Setchell, K.D.R. (2006) Factors Affecting the Bioavailability of Soy Isoflavones in Humans after Ingestion of Physiologically Relevant Levels from Different Soy Foods. The Journal of Nutrition. 136(1), 45–51.
Cassileth, B.R. and Deng, G. (2004) Complementary and Alternative Therapies for Cancer. The Oncologist. 9(1), 80–89.
Cayen, M.N. and Dvornik, D. (1979) Effect of diosgenin on lipid metabolism in rats. Journal of Lipid Research. 20(2), 162–174.
Chagpar, A.B., Studts, J.L., Scoggins, C.R., Martin, R.C.G., 2nd, Carlson, D.J., Laidley, A.L., El-Eid, S.E., McGlothin, T.Q., Noyes, R.D. and McMasters, K.M. (2006) Factors associated with surgical options for breast carcinoma. Cancer. 106(7), 1462–1466.
250
Chahar, M.K., Sharma, N., Dobhal, M.P. and Joshi, Y.C. (2011) Flavonoids: A versatile source of anticancer drugs. Pharmacognosy Reviews. 5(9), 1–12.
Chandrashekharaiah, K.S., Swamy, N.R. and Murthy, K.R.S. (2011) Carboxylesterases from the seeds of an underutilized legume, Mucuna pruriens; isolation, purification and characterization. Phytochemistry. 72(18), 2267–2274.
Chang, Y.Q., Tan, S.N., Yong, J.W.H. and Ge, L. (2011) Surfactant-assisted pressurized liquid extraction for determination of flavonoids from Costus speciosus by micellar electrokinetic chromatography. Journal of separation science. 34(4), 462–468.
Chauhan, N. (2012) Pharmacognostical, phytochemical and pharmacological review on Clitoria ternatea for antiasthmatic activity. International Journal of Pharmaceutical Sciences and Research. 3(2), 398–404.
Chauhan, S. and Singh, A. (2011) Impact of Taraxerol in combination with extract of Euphorbia tirucalli plant on biological parameters of Lymnaea acuminata. Revista do Instituto de Medicina Tropical de São Paulo. 53(5), 265–270.
Chemspider (2015) Chemspider. Royal Society of Chemistry. [online]. Available from:
http://www.chemspider.com/ [Accessed April 9, 2015].
Chen, C., Liang, Z., Huang, W., Li, X., Zhou, F., Hu, X., Han, M., Ding, X. and Xiang, S. (2015) Eps8 regulates cellular proliferation and migration of breast cancer. International Journal of Oncology. 46(1), 205–214.
Chen, H., Bernstein, B.W. and Bamburg, J.R. (2000) Regulating actin-filament dynamics in vivo. Trends in Biochemical Sciences. 25(1), 19–23.
Chen, S.T., Dou, J., Temple, R., Agarwal, R., Wu, K.-M. and Walker, S. (2008) New therapies from old medicines. Nature Biotechnology. 26(10), 1077–1083.
Cheng, F., Chen, A. Y., Best, S. M., Bloom, M., Pintel, D. and Jianming, Q. (2010) The Capsid Proteins of Aleutian Mink Disease Virus Activate Caspases and Are Specifically Cleaved during Infection. Journal of Virology. 84(6), 2687–2696.
Chhabra, E.S. and Higgs, H.N. (2007) The many faces of actin: matching assembly factors with cellular structures. Nature Cell Biology. 9(10), 1110–1121.
Choi, S.B., Wha, J.D. and Park, S. (2004) The insulin sensitizing effect of homoisoflavone-enriched fraction in Liriope platyphylla Wang et Tang via PI3-kinase pathway. Life Sciences. 75(22), 2653–2664.
Chopra, A., Lavin, P., Patwardhan, B. and Chitre, D. (2004) A 32-Week Randomized, Placebo-Controlled Clinical Evaluation of RA-11, an Ayurvedic Drug, on Osteoarthritis of the Knees. Journal of Clinical Rheumatology. 10, 236–245.
Chumsri, S., Howes, T., Bao, T., Sabnis, G. and Brodie, A. (2011) Aromatase, aromatase inhibitors, and breast cancer. The Journal of Steroid Biochemistry and Molecular Biology. 125(1–2), 13–22.
Cimini, D., Fioravanti, D., Tanzarella, C. and Degrassi, F. (1998) Simultaneous inhibition of contractile ring and central spindle formation in mammalian cells treated with cytochalasin B. Chromosoma. 107(6-7), 479–485.
251
CITES (2000) The CITES species. Convention on International Trade in Endangered Species of Wild Fauna and Flora. The CITES species. [online]. Available from: http://www.cites.org/eng/disc/species.php [Accessed March 30, 2015].
Cmoch, P., Pakulski, Z., Swaczynová, J. and Strnad, M. (2008) Synthesis of lupane-type saponins bearing mannosyl and 3,6-branched trimannosyl residues and their evaluation as anticancer agents. Carbohydrate Research. 343(6), 995–1003.
Conlin, A.K. and Seidman, A.D. (2008) Beyond Cytotoxic Chemotherapy for the First-Line Treatment of HER2-Negative, Hormone-Insensitive Metastatic Breast Cancer: Current Status and Future Opportunities. Clinical Breast Cancer. 8(3), 215–223.
Cook, D., Brown, D., Alexander, R., March, R., Morgan, P., Satterthwaite, G. and Pangalos, M.N. (2014) Lessons learned from the fate of AstraZeneca’s drug pipeline: a five-dimensional framework. Nature Reviews Drug Discovery. 13(6), 419–431.
Correa, O.S. and Barneix, A.J. (1997) Cellular mechanisms of pH tolerance in Rhizobium loti. World Journal of Microbiology and Biotechnology. 13(2), 153–157.
Corson, T.W. and Crews, C.M. (2007) Molecular Understanding and Modern Application of Traditional Medicines: Triumphs and Trials. Cell. 130(5), 769–774.
Couzin-Frankel, J. and Ogale, Y. (2011) Once on ‘Fast Track,’ Avastin Now Derailed. Science. 333(6039), 143–144.
Cree, I.A. ed. (2011) Cell Sensitivity Assays: An Overview. In Cancer Cell Culture Methods and Protocols. Methods in Molecular Biology. New York: Humana Press.
Criddle, W.J. (1990) Spectral and chemical characterisation of organic compounds. 3rd
ed. John Wiley & Sons Ltd.
Crow, D. (2015) FT Pharmaceuticals Clinical trials show cancer drug combo boosts survival rate. [online]. Available from: http://www.ft.com/cms/s/0/6703bf00-0742-11e5-80e7-00144feabdc0.html#axzz3cRseQSyt [Accessed June 8, 2015].
CRUK (2015a) CRUK A trial looking at giving bevacizumab (Avastin) with chemotherapy before surgery for early HER2 negative breast cancer (ARTemis). [online]. Available from: http://www.cancerresearchuk.org/cancer-help/trials/trial-giving-bevacizumab-avastin-chemotherapy-before-surgery-early-her2-negative-breast-cancer-artemis [Accessed December 30, 2012].
CRUK (2015b) CRUK A trial to see if olaparib can reduce the risk of triple negative breast cancer coming back after treatment (OLYMPIA). [online]. Available from: http://www.cancerresearchuk.org/about-cancer/find-a-clinical-trial/a-trial-to-see-if-olaparib-can-reduce-the-risk-triple-negative-breast-cancer-coming-back-after-treatment-olympia#undefined [Accessed February 6, 2015].
CRUK (2014a) CRUK Bevacizumab (Avastin). [online]. Available from: http://www.cancerresearchuk.org/about-cancer/cancers-in-general/treatment/cancer-drugs/bevacizumab?script=true [Accessed March 10, 2015].
CRUK (2014b) CRUK Breast cancer survival statistics. [online]. Available from: http://www.cancerresearchuk.org/cancer-info/cancerstats/types/breast/survival/ [Accessed January 8, 2013].
252
CRUK (2012) CRUK Cancer drugs. [online]. Available from: http://www.cancerresearchuk.org/cancer-help/about-cancer/treatment/cancer-drugs/ [Accessed March 10, 2015].
CRUK (2014c) CRUK Cancer incidence statistics. [online]. Available from: http://www.cancerresearchuk.org/cancer-info/cancerstats/incidence/ [Accessed March 10, 2015].
CRUK (2014d) CRUK Cancer mortality statistics. [online]. Available from: http://www.cancerresearchuk.org/health-professional/cancer-statistics/mortality [Accessed January 8, 2013].
CRUK (2014e) CRUK Radiotherapy for breast cancer. [online]. Available from: http://www.cancerresearchuk.org/about-cancer/type/breast-cancer/treatment/radiotherapy/ [Accessed March 26, 2015].
CRUK (2014f) CRUK TNM breast cancer staging. [online]. Available from: http://www.cancerresearchuk.org/about-cancer/type/breast-cancer/treatment/tnm-breast-cancer-staging [Accessed April 2, 2015].
CRUK (2014g) CRUK Trastuzumab (Herceptin). [online]. Available from: http://www.cancerresearchuk.org/about-cancer/cancers-in-general/treatment/cancer-drugs/trastuzumab#how [Accessed March 26, 2015].
CRUK (2014h) CRUK Treating secondary breast cancer. [online]. Available from: http://www.cancerresearchuk.org/about-cancer/type/breast-cancer/secondary/treatment/ [Accessed March 10, 2015].
CRUK (2014i) CRUK Types of breast cancer hormone therapy. [online]. Available from: http://www.cancerresearchuk.org/cancer-help/type/breast-cancer/treatment/hormone/types-of-breast-cancer-hormone-therapy [Accessed March 11, 2015].
CRUK (2014j) Treating breast cancer. [online]. Available from: http://www.cancerresearchuk.org/about-cancer/type/breast-cancer/treatment/ [Accessed March 9, 2015].
Danial, N. and Korsmeyer, S. (2004) Cell Death: Critical Control Points. Cell. 116, 205–219.
Daniel, R., Smith, I., Phillip, J., Ratcliffe, H., Drozd, J. and Bull, A. (1980) Anaerobic Growth and Dentrification by Rhizobium japonicum and Other Rhizobia. Journal of General Microbiology. 120, 517–521.
Dargan, P., Gawarammana, I., Archer, J., House, I., Shaw, D. and Wood, D. (2008) Heavy metal poisoning from Ayurvedic traditional medicines: an emerging problem? International Journal of Environment and Health. 2(3/4), 463–474.
Das, B., Thirupathi, P., Ravikanth, B., Aravind Kumar, R., Sarma, A. and Basha, S. (2009) Isolation, Synthesis, and Bioactivity of Homoisoflavonoids from Caesalpinia pulcherrima. Chemical and Pharmaceutical Bulletin. 57(10), 1139–1141.
Das, N. and Chatterjee, P. (2013) Evaluation of brine shrimp cytotoxicity of 50% aqueous ethanolic leaf extract of Clitoria ternatea L. Asian Journal of Pharmaceutical and Clinical Research. 7(1), 118–120.
253
Dasgupta, B. and Pandey, V.B. (1970) A new Indian source of diosgenin (Costus speciosus). Cellular and Molecular Life Sciences. 26(5), 475–476.
Dateandtime.info (2015) Dateandtime.info. [online]. Available from: http://dateandtime.info/ [Accessed May 5, 2015].
D’Auria, J.C. and Gershenzon, J. (2005) The secondary metabolism of Arabidopsis thaliana: growing like a weed. Current Opinion in Plant Biology. 8(3), 308–316.
Davies, T. and Canman, J.C. (2012) Stuck in the middle: Rac, adhesion, and cytokinesis. The Journal of cell biology. 198(5), 769–771.
Davies, C., Hongchao, P., Godwin, J., Fray, R., Arrigada, R., Raina, V., Abraham, M., Alencar, V., Badran, A., Bonfill, X., Bradbury, J., Clarke, M., Collins, R., Davis, S., Delmestri, A., Forbes, J., Haddad, P., Hou, M-F., Inbar, M., Khaled, H., Kielanowska, J., Kwan, W-H., Mathew, B., Mittra, I., Müller, B., Nicolucci, A., Peralta, O., Pernas, F., Petruzelka, L., Pienkowski, T., Radhika, R., Rajan, B., Rubach, M., Tort, S., Urrútia, G., Valentini, M., Wang, Y. and Peto, R. (2013) Long-term effects of continuing adjuvant tamoxifen to 10 years versus stopping at 5 years after diagnosis of oestrogen receptor-positive breast cancer: ATLAS, a randomised trial. The Lancet. 381(9869). 805–816.
D’Avino, P.P. (2009) How to scaffold the contractile ring for a safe cytokinesis – lessons from Anillin-related proteins. Journal of Cell Science. 122(8), 1071–1079.
Daxenbichler, M., VanEtten, C., Hallinan, E.A. and Earle, F. (1971) Seeds as Sources of L-Dopa. Journal of Medicinal Chemistry. 14(5), 463–465.
Dear, R.F., McGeechan, K., Jenkins, M.C., Barratt, A., Tattersall, M.H.N. and Wilcken, N. (2013) Combination versus sequential single agent chemotherapy for metastatic breast cancer. The Cochrane Database of Systematic Reviews. 12, CD008792.
deGraffenried, L.A., Friedrichs, W.E., Russell, D.H., Donzis, E.J., Middleton, A.K., Silva, J.M., Roth, R.A. and Hidalgo, M. (2004) Inhibition of mTOR activity restores tamoxifen response in breast cancer cells with aberrant Akt Activity. Clinical cancer research: an official journal of the American Association for Cancer Research. 10(23),
8059–8067.
Deka, M. and Kalita, J.C. (2013) Effect of Mucuna Pruriens Seed Extract on Uterus of Ovariectomized Mice. Indian Journal of Research. 2(8), 14–15.
Deka, M. and Kalita, J.C. (2011) Preliminary Phytochemical analysis and acute oral toxicity study of Clitoria ternatea Linn. roots in albino mice. International Research Journal of Pharmacy. 2(12), 139–40.
Delarmelina, J.M., Dutra, J.C.V. and Batitucci, M. do C.P. (2014) Antimutagenic activity of ipriflavone against the DNA-damage induced by cyclophosphamide in mice. Food and Chemical Toxicology. 65, 140–146.
Delis, C., Krokida, A., Georgiou, S., Peña-Rodríguez, L.M., Kavroulakis, N., Ioannou, E., Roussis, V., Osbourn, A.E. and Papadopoulou, K.K. (2011) Role of lupeol synthase in Lotus japonicus nodule formation. The New phytologist. 189(1), 335–346.
Denison, R.F. and Kiers, E.T. (2011) Life Histories of Symbiotic Rhizobia and Mycorrhizal Fungi. Current Biology. 21(18), R775–R785.
254
Dhamodharan, R., Jordan, M.A., Thrower, D., Wilson, L. and Wadsworth, P. (1995) Vinblastine suppresses dynamics of individual microtubules in living interphase cells. Molecular Biology of the Cell. 6(9), 1215–1229.
Dhar, G., Chakravarty, D., Hazra, J., Dhar, J., Poddar, A., Pal, M., Chakrabarti, P., Surolia, A. and Bhattacharyya, B. (2015) Actin-curcumin interaction: insights into the mechanism of actin polymerization inhibition. Biochemistry. 54(4), 1132–1143.
Dharmatilake, A.J. and Bauer, W.D. (1992) Chemotaxis of Rhizobium meliloti towards Nodulation Gene-Inducing Compounds from Alfalfa Roots. Applied and Environmental Microbiology. 58(4), 1153–1158.
Dias, D., Urban, S. and Roessner, U. (2012) A Historical Overview of Natural Products in Drug Discovery. Metabolites. 2, 303–336.
Ding, Z., Joy, M., Bhargava, R., Gunsaulus, M., Lakshman, N., Miron-Mendoza, M., Petroll, M., Condeelis, J., Wells, A. and Roy, P. (2014) Profilin-1 downregulation has contrasting effects on early vs late steps of breast cancer metastasis. Oncogene. 33(16), 2065–2074.
Dolan, J. (2015) HPLC Troubleshooting Guide. ACE. [online]. Available from: http://www.hplc.eu/Downloads/ACE_Guide_TroubleshootingHPLC.pdf [Accessed January 23, 2015].
Dominguez, R. (2004) Actin-binding proteins – a unifying hypothesis. Trends in Biochemical Sciences. 29(11), 572–578.
Dominguez, R. and Holmes, K.C. (2011) Actin Structure and Function. Annual review of biophysics. 40, 169–186.
Donati, D., Lampariello, L.R., Pagani, R., Guerranti, R., Cinci, G. and Marinello, E. (2005) Antidiabetic oligocyclitols in seeds of Mucuna pruriens. Phytotherapy research: PTR. 19(12), 1057–1060.
Downward, J. (1998) Mechanisms and consequences of activation of protein kinase B/Akt. Current opinion in cell biology. 10(2), 262–267.
Drewry, D.H. and Macarron, R. (2010) Enhancements of screening collections to address areas of unmet medical need: an industry perspective. Current Opinion in Chemical Biology. 14(3), 289–298.
Driggers, E.M., Hale, S.P., Lee, J. and Terrett, N.K. (2008) The exploration of macrocycles for drug discovery — an underexploited structural class. Nature Reviews Drug Discovery. 7(7), 608–624.
Duan, C.-L., Kang, Z.-Y., Lin, C.-R., Jiang, Y., Liu, J.-X. and Tu, P.-F. (2009) Two new homoisoflavonoids from the fibrous roots of Ophiopogon japonicus (Thunb.) Ker-Gawl. Journal of Asian Natural Products Research. 11(10), 876–879.
Dubber, M.-J. and Kanfer, I. (2006) Determination of terpene trilactones in Ginkgo biloba solid oral dosage forms using HPLC with evaporative light scattering detection. Journal of Pharmaceutical and Biomedical Analysis. 41(1), 135–140.
255
Dugina, V., Zwaenepoel, I., Gabbiani, G., Clément, S. and Chaponnier, C. (2009) Beta and gamma-cytoplasmic actins display distinct distribution and functional diversity. Journal of Cell Science. 122(Pt 16), 2980–2988.
Duraipandiyan, V., Al-Harbi, N.A., Ignacimuthu, S. and Muthukumar, C. (2012) Antimicrobial activity of sesquiterpene lactones isolated from traditional medicinal plant, Costus speciosus (Koen ex.Retz.) Sm. BMC Complementary and Alternative Medicine. 12(1), 13.
Eckhardt, B.L., Francis, P.A., Parker, B.S. and Anderson, R.L. (2012) Strategies for the discovery and development of therapies for metastatic breast cancer. Nature Reviews Drug Discovery. 11(6), 479–497.
Efferth, T., Li, P.C.H., Konkimalla, V.S.B. and Kaina, B. (2007) From traditional Chinese medicine to rational cancer therapy. Trends in Molecular Medicine. 13(8), 353–361.
Ekanem, A.P., Obiekezie, A., Kloas, W. and Knopf, K. (2004) Effects of crude extracts of Mucuna pruriens (Fabaceae) and Carica papaya (Caricaceae) against the protozoan fish parasite Ichthyophthirius multifiliis. Parasitology research. 92(5), 361–366.
El-Halawany, A.M., El Dine, R.S., Chung, M.H., Nishihara, T. and Hattori, M. (2011) Screening for estrogenic and antiestrogenic activities of plants growing in Egypt and Thailand. Pharmacognosy Research. 3(2), 107–113.
Eliza, J., Daisy, P., Ignacimuthu, S. and Duraipandiyan, V. (2009a) Antidiabetic and antilipidemic effect of eremanthin from Costus speciosus (Koen.)Sm., in STZ-induced diabetic rats. Chemico-biological interactions. 182(1), 67–72.
Eliza, J., Daisy, P., Ignacimuthu, S. and Duraipandiyan, V. (2009b) Normo-glycemic and hypolipidemic effect of costunolide isolated from Costus speciosus (Koen ex. Retz.)Sm. in streptozotocin-induced diabetic rats. Chemico-biological interactions. 179(2-3), 329–334.
Ellis, H. (2002) Clinical Anatomy. 10th ed. Oxford: Blackwell Science Ltd.
Embassy of India, Beijing (1992) Embassy of India, Beijing, Trade & Commerce Wing. Items banned for exports from India. Embassy of India, Beijing, Trade & Commerce Wing. Import from India >> Items banned for exports from India. [online]. Available
from: http://www.indianembassy.org.cn/commercialwing/DynamicContent.aspx?MenuId=3&SubMenuId=0 [Accessed April 8, 2015].
Van Engeland, M., Nieland, L.J.W., Ramaekers, F.C.S., Schutte, B. and Reutelingsperger, C.P.M. (1998) Annexin V-Affinity assay: A review on an apoptosis detection system based on phosphatidylserine exposure. Cytometry. 31(1), 1–9.
Erlund, I. (2004) Review of the flavonoids quercetin, hesperetin, and naringenin. Dietary sources, bioactivities, bioavailability, and epidemiology. Nutrition Research. 24(10), 851–874.
EU (2008) Directive 2008/50/EC of the European Parliament and of the Council of 21 May 2008 on ambient air quality and cleaner air for Europe. Official Journal of the European Union. [online]. Available from: http://eur-
256
lex.europa.eu/LexUriServ/LexUriServ.do?uri=OJ:L:2008:152:0001:0044:EN:PDF [Accessed May 21, 2015].
Eum, K.-H. and Lee, M. (2011) Crosstalk between autophagy and apoptosis in the regulation of paclitaxel-induced cell death in v-Ha-ras-transformed fibroblasts. Moelcular and Cellular Biochemistry. 348, 61–68.
Fan, S., Smith, M.L., Rivert, D.J., Duba, D., Zhan, Q., Kohn, K.W., Fornace, A.J. and O’Connor, P.M. (1995) Disruption of p53 Function Sensitizes Breast Cancer MCF-7 Cells to Cisplatin and Pentoxifylline. Cancer Research. 55(8), 1649–1654.
Farmer, H., McCabe, N., Lord, C.J., Tutt, A.N.J., Johnson, D.A., Richardson, T.B., Santarosa, M., Dillon, K.J., Hickson, I., Knights, C., Martin, N.M.B., Jackson, S.P., Smith, G.C.M. and Ashworth, A. (2005) Targeting the DNA repair defect in BRCA mutant cells as a therapeutic strategy. Nature. 434(7035), 917–921.
FDA (2015) FDA approves Ibrance for postmenopausal women with advanced breast cancer. [online]. Available from: http://www.fda.gov/NewsEvents/Newsroom/PressAnnouncements/ucm432871.htm [Accessed June 9, 2015].
FDA (2010) US Food and Drug Administration (FDA) About the Center for Drug Evaluation and Research - Eribulin Mesylate. [online]. Available from: http://www.fda.gov/AboutFDA/CentersOffices/OfficeofMedicalProductsandTobacco/CDER/ucm234527.htm [Accessed December 27, 2012].
Ferry, D.R., Smith, A., Malkhandi, J., Fyfe, D.W., deTakats, P.G., Anderson, D., Baker, J. and Kerr, D.J. (1996) Phase I clinical trial of the flavonoid quercetin: pharmacokinetics and evidence for in vivo tyrosine kinase inhibition. Clinical Cancer Research: An Official Journal of the American Association for Cancer Research. 2(4),
659–668.
Field, B., Jordán, F. and Osbourn, A. (2006) First encounters – deployment of defence-related natural products by plants. New Phytologist. 172(2), 193–207.
Figueiredo, A.C., Barroso, J.G., Pedro, L.G. and Scheffer, J.J.C. (2008) Factors affecting secondary metabolite production in plants: volatile components and essential oils. Flavour and Fragrance Journal. 23(4), 213–226.
Fisher, B., Anderson, S., Bryant, J., Margolese, R.G., Deutsch, M., Fisher, E.R., Jeong, J.-H. and Wolmark, N. (2002) Twenty-year follow-up of a randomized trial comparing total mastectomy, lumpectomy, and lumpectomy plus irradiation for the treatment of invasive breast cancer. The New England journal of medicine. 347(16), 1233–1241.
Fisher, B., Costantino, J.P., Redmond, C.K., Fisher, E.R., Wickerham, D.L. and Cronin, W.M. (1994) Endometrial cancer in tamoxifen-treated breast cancer patients: findings from the National Surgical Adjuvant Breast and Bowel Project (NSABP) B-14. Journal of the National Cancer Institute. 86(7), 527–537.
Florea, A.-M. and Büsselberg, D. (2011) Cisplatin as an Anti-Tumor Drug: Cellular Mechanisms of Activity, Drug Resistance and Induced Side Effects. Cancers. 3, 1351–
1371.
257
Foerster, F., Braig, S., Chen, T., Altmann, K.-H. and Vollmar, A.M. (2014) Pharmacological characterization of actin-binding (−)-Doliculide. Bioorganic & Medicinal Chemistry. 22(18), 5117–5122.
Foley, G.E., Friedman, O.M. and Drolet, B.P. (1961) Studies on the Mechanism of Action of Cytoxan Evidence of Activation in Vivo and in Vitro. Cancer Research. 21(1),
57–63.
Fomproix, N. and Percipalle, P. (2004) An actin–myosin complex on actively transcribing genes. Experimental Cell Research. 294(1), 140–148.
Fotsis, T., Pepper, M.S., Aktas, E., Breit, S., Rasku, S., Adlercreutz, H., Wähälä, K., Montesano, R. and Schweigerer, L. (1997) Flavonoids, dietary-derived inhibitors of cell proliferation and in vitro angiogenesis. Cancer Research. 57(14), 2916–2921.
Franche, C., Lindström, K. and Elmerich, C. (2009) Nitrogen-fixing bacteria associated with leguminous and non-leguminous plants. Plant and Soil. 321(1-2), 35–59.
FT (2015) FT View The dilemmas thrown up by the war on cancer. [online]. Available from: http://www.ft.com/cms/s/0/9161b9fa-091d-11e5-881f-00144feabdc0.html#axzz3cRseQSyt [Accessed June 8, 2015].
Gachet, Y., Tournier, S., Millar, J.B.A. and Hyams, J.S. (2001) A MAP kinase-dependent actin checkpoint ensures proper spindle orientation in fission yeast. Nature. 412(6844), 352–355.
Gaillard, S. and Stearns, V. (2011) Aromatase inhibitor-associated bone and musculoskeletal effects: new evidence defining etiology and strategies for management. Breast Cancer Research. 13(2), 205.
Galati, G. and O’Brien, P.J. (2004) Potential toxicity of flavonoids and other dietary phenolics: significance for their chemopreventive and anticancer properties. Free Radical Biology and Medicine. 37(3), 287–303.
Gale, K.E., Andersen, J.W., Tormey, D.C., Mansour, E.G., Davis, T.E., Horton, J., Wolter, J.M., Smith, T.J. and Cummings, F.J. (1994) Hormonal treatment for metastatic breast cancer. An eastern cooperative oncology group phase III trial comparing aminoglutethimide to tamoxifen. Cancer. 73(2), 354–361.
Galluzzi, L., Maiuri, M.C., Vitale, I., Zischka, H., Castedo, M., Zitvogel, L., Kroemer, G. (2007) Cell death modalities: classification and pathophysiological implications. Cell Death & Differentiation. 14(7), 1237–1243.
Ganesan, A. (2008) The impact of natural products upon modern drug discovery. Current Opinion in Chemical Biology. 12(3), 306–317.
García-Mata, R. and Burridge, K. (2007) Catching a GEF by its tail. Trends in Cell Biology. 17(1), 36–43.
Gennari, A., Stockler, M., Puntoni, M., Sormani, M., Nanni, O., Amadori, D., Wilcken, N., D’Amico, M., DeCensi, A. and Bruzzi, P. (2011) Duration of Chemotherapy for Metastatic Breast Cancer: A Systematic Review and Meta-Analysis of Randomized Clinical Trials. Journal of Clinical Oncology. 29(16), 2144–2149.

258
George, W.O. and McIntyre, P.S. (1987) Infrared Spectroscopy. 1st ed. Chichester:
John Wiley & Sons Ltd.
Gewirtz, D. (1999) A critical evaluation of the mechanisms of action proposed for the antitumor effects of the anthracycline antibiotics adriamycin and daunorubicin. Biochemical Pharmacology. 57(7), 727–741.
Ghayad, S. and Cohen, P. (2010) Inhibitors of the PI3K/Akt/mTOR Pathway: New Hope for Breast Cancer Patients. Recent Patents on Anti-Cancer Drug Discovery. 5,
29–57.
Giannone, G., Dubin-Thaler, B.J., Rossier, O., Cai, Y., Chaga, O., Jiang, G., Beaver, W., Döbereiner, H.-G., Freund, Y., Borisy, G. and Sheetz, M.P. (2007) Lamellipodial Actin Mechanically Links Myosin Activity with Adhesion-Site Formation. Cell. 128(3),
561–575.
Gilmore, A.P. (2005) Anoikis. Cell Death & Differentiation. 12(S2), 1473–1477.
Gligorov, J. and Lotz, J.P. (2004) Preclinical Pharmacology of the Taxanes: Implications of the Differences. The Oncologist. 9(Supplement 2), 3–8.
GLOBOCAN, C.R. (2015) World Heath Organization International Agency for Research on Cancer GLOBOCAN 2008. [online]. Available from: http://globocan.iarc.fr/Pages/fact_sheets_cancer.aspx [Accessed March 10, 2015].
Glotzer, M. (2001) Animal Cell Cytokinesis. Annual Review of Cell and Developmental Biology. 17(1), 351–386.
Gottesman, M.M., Fojo, T. and Bates, S.E. (2002) Multidrug resistance in cancer: role of ATP–dependent transporters. Nature Reviews Cancer. 2(1), 48–58.
Gøtzsche, P.C. and Nielsen, M. (2011) Screening for breast cancer with mammography. Cochrane database of systematic reviews (Online). (1), CD001877.
Gozuacik, D. and Kimchi, A. (2004) Autophagy as a cell death and tumor suppressor mechanism. Oncogene. 23(16), 2891–2906.
Graham, P.H., Parker, C.A., Oakley, A.E., Lange, R.T. and Sanderson, I.J.V. (1963) Spore formation and heat resistance in Rhizobium. Journal of Bacteriology. 86(6),
1353–1354.
Gransalke, K. (2011) Mother Nature’s Drug Cabinet. Lab Times. (1), 16–19.
Gray, A.I., Igoli, J.O. and Edrada-Ebel, R. (2012) Natural products isolation in modern drug discovery programs. In S. Sarker & L. Nahar, eds. Natural Products Isolation, Methods and Protocols. Methods in Molecular Biology. Hatfield, Hertfordshire: Humana Press.
Green, A.R., Powe, D.G., Rakha, E.A., Soria, D., Lemetre, C., Nolan, C.C., Barros, F.F.T., Macmillan, R.D., Garibaldi, J.M., Ball, G.R. and Ellis, I.O. (2013) Identification of key clinical phenotypes of breast cancer using a reduced panel of protein biomarkers. British Journal of Cancer. 109(7), 1886–1894.
Green, D.R. (2005) Apoptotic pathways: ten minutes to dead. Cell. 121(5), 671–674.
259
Grober, O., Mutarelli, M., Giurato, G., Ravo, M., Cicatiello, L., Filippo, M.D., Ferraro, L., Nassa, G., Papa, M., Paris, O., Tarallo, R., Luo, S., Schroth, G., Benes, V. and Weisz, A. (2011) Global analysis of estrogen receptor beta binding to breast cancer cell genome reveals an extensive interplay with estrogen receptor alpha for target gene regulation. BMC Genomics. 12(1), 36.
Gross, J. (2004) Mass Spectrometry A Textbook. 1st ed. Germany: Springer.
Guedj, M., Marisa, L., de Reynies, A., Orsetti, B., Schiappa, R., Bibeau, F., MacGrogan, G., Lerebours, F., Finetti, P., Longy, M., Bertheau, P., Bertrand, F., Bonnet, F., Martin, A.L., Feugeas, J.P., Bièche, I., Lehmann-Che, J., Lidereau, R., Birnbaum, D., Bertucci, F., de Thé, H.and Theillet, C. (2012) A refined molecular taxonomy of breast cancer. Oncogene. 31(9), 1196–1206.
Gunning, P., O’Neill, G. and Hardeman, E. (2008) Tropomyosin-based regulation of the actin cytoskeleton in time and space. Physiological reviews. 88(1), 1–35.
Gunning, P.W., Schevzov, G., Kee, A.J. and Hardeman, E.C. (2005) Tropomyosin isoforms: divining rods for actin cytoskeleton function. Trends in Cell Biology. 15(6),
333–341.
Günther, H. (1995) NMR Spectroscopy. 2nd ed. Chichester: John Wiley & Sons Ltd.
Gupta, M., Verma, R. and Akhila, A. (1986) Oxo acids and branched fatty acid esters from rhizomes of Costus speciosus. Phytochemistry. 25(8), 1899–1902.
Gurney, H. (2002) How to calculate the dose of chemotherapy. British Journal of Cancer. 86(8), 1297–1302.
Hall, A. (2009) The cytoskeleton and cancer. Cancer and Metastasis Reviews. 28(1-2), 5–14.
Hall, G. and Phillips, T.J. (2005) Estrogen and skin: The effects of estrogen, menopause, and hormone replacement therapy on the skin. Journal of the American Academy of Dermatology. 53(4), 555–568.
Hamberger, B. and Bak, S. (2013) Plant P450s as versatile drivers for evolution of species-specific chemical diversity. Philosophical Transactions of the Royal Society of London B: Biological Sciences. 368(1612), 20120426.
Hammond, S.L., Ham, R.G. and Stampfer, M.R. (1984) Serum-free growth of human mammary epithelial cells: rapid clonal growth in defined medium and extended serial passage with pituitary extract. Proceedings of the National Academy of Sciences of the United States of America. 81(17), 5435–5439.
Hanahan, D. and Weinberg, R.A. (2011) Hallmarks of cancer: the next generation. Cell. 144(5), 646–674.
Harkey, M.R., Henderson, G.L., Gershwin, M.E., Stern, J.S. and Hackman, R.M. (2001) Variability in commercial ginseng products: An analysis of 25 preparations. American Journal of Clinical Nutrition. 73(6), 1101–1106.
Hartman, J., Lindberg, K., Morani, A., Inzunza, J., Ström, A. and Gustafsson, J.-A. (2006) Estrogen receptor beta inhibits angiogenesis and growth of T47D breast cancer xenografts. Cancer research. 66(23), 11207–11213.
260
Harvey, A.L. (2008) Natural products in drug discovery. Drug Discovery Today. 13(19–
20), 894–901.
Harvey, A.L., Edrada-Ebel, R. and Quinn, R.J. (2015) The re-emergence of natural products for drug discovery in the genomics era. Nature Reviews Drug Discovery. 14(2), 111–129.
Haupt, S., Berger, M., Goldberg, Z. and Haupt, Y. (2003) Apoptosis - the p53 network. Journal of Cell Science. 116(Pt 20), 4077–4085.
Havsteen, B. (2002) The biochemistry and medical significance of the flavonoids. Pharmacology & Therapeutics. 96, 67–202.
Hayot, C., Debeir, O., Van Ham, P., Van Damme, M., Kiss, R. and Decaestecker, C. (2006) Characterization of the activities of actin-affecting drugs on tumor cell migration. Toxicology and Applied Pharmacology. 211(1), 30–40.
Heng, Y.-W. and Koh, C.-G. (2010) Actin cytoskeleton dynamics and the cell division cycle. The International Journal of Biochemistry & Cell Biology. 42, 1622–1633.
Heusch, W.L. and Maneckjee, R. (1998) Signalling pathways involved in nicotine regulation of apoptosis of human lung cancer cells. Carcinogenesis. 19(4), 551–556.
Hoessel, R., Leclerc, S., Endicott, J.A., Nobel, M.E.M., Lawrie, A., Tunnah, P., Leost, M., Damiens, E., Marie, D., Marko, D., Niederberger, E., Tang, W., Eisenbrand, G. and Meijer, L. (1999) Indirubin, the active constituent of a Chinese antileukaemia medicine, inhibits cyclin-dependent kinases. Nature Cell Biology. 1(1), 60–67.
De Hoffman, E. (1996) Tandem Mass Spectrometry: a Primer. Journal of Mass Spectrometry. 31, 129–137.
Hoffman, R. (1991) In Vitro Assays in Cancer: A Review, Analysis, and Prognosis. Journal of Clinical Laboratory Analysis. 5, 133–143.
Hollman, P. (2004) Absorption, Bioavailability, and Metabolism of Flavonoids. Pharmaceutial Biology. 42, S74–83.
Holy, J. (2004) Curcumin inhibits cell motility and alters microfilament organization and function in prostate cancer cells. Cell Motility and the Cytoskeleton. 58(4), 253–268.
Hope-Onyekwere, N.S., Ogueli, G.I., Cortelazzo, A., Cerutti, H., Cito, A., Aguiyi, J.C. and Guerranti, R. (2012) Effects of Mucuna pruriens Protease Inhibitors on Echis carinatus Venom. Phytotherapy research: PTR. 26(12), 1913–1919.
Van Horck, F.P., Ahmadian, M.R., Haeusler, L.C., Moolenaar, W.H. and Kranenburg, O. (2001) Characterization of p190RhoGEF, a RhoA-specific guanine nucleotide exchange factor that interacts with microtubules. The Journal of biological chemistry. 276(7), 4948–4956.
Hoskins, J.M., Carey, L.A. and McLeod, H.L. (2009) CYP2D6 and tamoxifen: DNA matters in breast cancer. Nature Reviews Cancer. 9(8), 576–586.
HSCIC (2013) HSCIC Breast Screening Programme, England - 2011-12 [NS].

261
Hsiao, W. and Liu, L. (2010) The Role of Traditional Chinese Herbal Medicines in Cancer Therapy – from TCM Theory to Mechanistic Insights. Planta Medica. 76, 1118–1131.
Hu, K. and Yao, X. (2003) The cytotoxicity of methyl protoneogracillin (NSC-698793) and gracillin (NSC-698787), two steroidal saponins from the rhizomes of Dioscorea collettii var. hypoglauca, against human cancer cells in vitro. Phytotherapy research: PTR. 17(6), 620–626.
Hung, H.-C., Joshipura, K.J., Jiang, R., Hu, F.B., Hunter, D., Smith-Warner, S.A., Colditz, G.A., Rosner, B., Spiegelman, D. and Willett, W.C. (2004) Fruit and Vegetable Intake and Risk of Major Chronic Disease. Journal of the National Cancer Institute. 96(21), 1577–1584.
Hwang, J., Yi, M., Zhang, X., Xu, Y., Jung, J.H. and Kim, D.-K. (2013) Oncology Reports. 30(4), 1929–1935.
INBio (2014) INBio. National Biodiversity Institute (INBio) Costa Rica. [online].
Available from: http://www.inbio.ac.cr/en [Accessed April 15, 2015].
Infante, M.E., Perez, A.M., Simao, M.R., Manda, F., Baquete, E.F., Fernandes, A.M. and Cliff, J.L. (1990) Outbreak of acute toxic psychosis attributed to Mucuna pruriens. The Lancet. 336(8723), 1129.
Inoue, K. and Ebizuka, Y. (1996) Purification and characterization of furostanol glycoside 26-O-β-glucosidase from Costus speciosus rhizomes. FEBS Letters. 378(2),
157–160.
Invitrogen (2011) Invitrogen PrestoBlue (TM) Cell Viability Reagent Protocol Product Information Sheet.
Iriti, M. and Faoro, F. (2009) Chemical Diversity and Defence Metabolism: How Plants Cope with Pathogens and Ozone Pollution. International Journal of Molecular Sciences. 10(8), 3371–3399.
IUCN (2014) The IUCN Red List of Threatened Species. The International Union for the Conservation of Nature Red List of Threatened Species. [online]. Available from:
http://www.iucnredlist.org/ [Accessed March 30, 2015].
Jacob, L. and Latha, M.S. (2013) Anticancer Activity of Clitoria ternatea Linn. Against Dalton’s Lymphoma. International Journal of Pharmacognosy and Phytochemical Research. 4(4), 207–212.
Jada, S.R., Matthews, C., Saad, M.S., Hamzah, A.S., Lajis, N.H., Stevens, M.F.G. and Stanslas, J. (2008) Benzylidene derivatives of andrographolide inhibit growth of breast and colon cancer cells in vitro by inducing G(1) arrest and apoptosis. British Journal of Pharmacology. 155(5), 641–654.
Jagtap, S. and Satpute, R. (2014) Phytochemical Screening and Antioxidant Activity of Rhizome Extracts of Costus speciosus (Koen.) J.E. Smith. Journal of Academia and Industrial Research. 3(1), 40–47.
James, A., Wang, Y., Raje, H., Rosby, R. and DiMario, P. (2014) Nucleolar stress with and without p53. Nucleus. 5(5), 402–426.
262
Janke, J., Schlüter, K., Jandrig, B., Theile, M., Kölble, K., Arnold, W., Grinstein, E., Schwartz, A., Estevéz-Schwarz, L., Schlag, P.M., Jockusch, B.M. and Scherneck, S. (2000) Suppression of tumorigenicity in breast cancer cells by the microfilament protein profilin 1. The Journal of Experimental Medicine. 191(10), 1675–1686.
Jantsch-Plunger, V., Gönczy, P., Romano, A., Schnabel, H., Hamill, D., Schnabel, R., Hyman, A.A. and Glotzer, M. (2000) Cyk-4 A Rho Family Gtpase Activating Protein (Gap) Required for Central Spindle Formation and Cytokinesis. The Journal of Cell Biology. 149(7), 1391–1404.
Jefferson, W.N., Padilla-Banks, E., Clark, G. and Newbold, R.R. (2002) Assessing estrogenic activity of phytochemicals using transcriptional activation and immature mouse uterotrophic responses. Journal of Chromatography B. 777(1–2), 179–189.
Jiang, W.G. (1995) Membrane ruffling of cancer cells: a parameter of tumour cell motility and invasion. European Journal of Surgical Oncology: The Journal of the European Society of Surgical Oncology and the British Association of Surgical Oncology. 21(3), 307–309.
Jie, L. and Hongyi, W. (2013) China Daily. TCM demand grows globally. China Daily. [online]. Available from: http://www.chinadaily.com.cn/cndy/2013-02/20/content_16238713.htm [Accessed April 5, 2015].
Johnson, M.S. (2015) 2015 update: Drugs on the horizon. Nursing Management. 46(1), 16–22.
Johnstone, R. and Rose, M. (1996) Mass spectrometry for chemists and biochemists.
2nd ed. Cambridge: Cambridge University Press.
Jones, K.M., Kobayashi, H., Davies, B.W., Taga, M.E. and Walker, G.C. (2007) How rhizobial symbionts invade plants: the Sinorhizobium–Medicago model. Nature Reviews Microbiology. 5(8), 619–633.
Jones, L.J., Gray, M., Yue, S.T., Haugland, R.P. and Singer, V.L. (2001) Sensitive determination of cell number using the CyQUANT cell proliferation assay. Journal of Immunological Methods. 254(1-2), 85–98.
Jones, W. and Kinghorn, D. (2012) Extraction of Plant Secondary Metabolites. In S. Sarker & L. Nahar, eds. Natural Products Isolation. Methods in Molecular Biology.
Springer Science+Business Media, LLC, pp. 341–366.
Jordan, M.A., Kamath, K., Manna, T., Okouneva, T., Miller, H.P., Davis, C., Littlefield, B.A. and Wilson, L. (2005) The primary antimitotic mechanism of action of the synthetic halichondrin E7389 is suppression of microtubule growth. Molecular cancer therapeutics. 4(7), 1086–1095.
Jordan, M.A., Thrower, D. and Wilson, L. (1991) Mechanism of Inhibition of Cell Proliferation by Vinca Alkaloids. Cancer Research. 51(8), 2212–2222.
Jordan, M.A., Toso, R., Thrower, D. and Wilson, L. (1993) Mechanism of mitotic block and inhibition of cell proliferation by taxol at low concentrations. Proceedings of the National Academy of Sciences. 90(20), 9552–9556.
Jordan, M.A and Wilson, L. (1998) Microtubules and actin filaments: dynamic targets for cancer chemotherapy. Current Opinion in Cell Biology. 10(1), 123–130.

263
Jordan, M.A. and Wilson, L. (2004) Microtubules as a target for anticancer drugs. Nature Reviews Cancer. 4(4), 253–265.
Jordan, V.C. and Brodie, A.M.H. (2007) Development and evolution of therapies targeted to the estrogen receptor for the treatment and prevention of breast cancer. Steroids. 72(1), 7–25.
Joy, P., Thomas, J., Mathew, S.and Skaria, B. (1998) Zingiberaceous Medicinal and Aromatic Plants. Odakkali, Asamannoor, Kerala, India: Aromatic and Medicinal Plants
Research Station.
JungleSeeds (2015) Tropical Climbers J to Z. JungleSeeds [online]. Available from: http://jungleseeds.co.uk/contents/en-uk/d37.html#p615 [Accessed September 15th, 2015].
Kable, E., Favler, D. and Parsons, P. (1989) Sensitivity of Human Melanoma Cells to L-Dopa and DL-Buthionine(S,R)sulfoximine. Cancer Research. 49, 2327–2331.
Kalita (2012) Personal communication.
Kamilla, L., Ramanathan, S., Sasidharan, S. and Mansor, S.M. (2014) Evaluation of antinociceptive effect of methanolic leaf and root extracts of Clitoria ternatea Linn. in rats. Indian Journal of Pharmacology. 46(5), 515–520.
Kanehisa Laboratories (2012) Kegg Ligand. Krypto Encyclopedia of Genes and Genomes Database. [online]. Available from: http://www.kegg.jp/kegg/ligand.html? [Accessed April 11, 2015].
Kang, F., Purich, D. and Southwick, F. (1999) Profilin Promotes Barbed-end Actin Filament Assembly without Lowering the Critical Concentration. Journal of Biological Chemistry. 274(52), 36963–36972.
Kantarjian, H.M., Fojo, T., Mathisen, M. and Zwelling, L.A. (2013) Cancer Drugs in the United States: Justum Pretium—The Just Price. Journal of Clinical Oncology. 31(28),
3600–3604.
Katzenellenbogen, B.S., Choi, I., Delage-Mourroux, R., Ediger, T.R., Martini, P.G., Montano, M., Sun, J., Weis, K. and Katzenellenbogen, J.A. (2000) Molecular mechanisms of estrogen action: selective ligands and receptor pharmacology. The Journal of steroid biochemistry and molecular biology. 74(5), 279–285.
Kaufman, B., Mackey, J.R., Clemens, M.R., Bapsy, P.P., Vaid, A., Wardley, A., Tjulandin, S., Jahn, M., Lehle, M., Feyereislova, A., Révil, C. and Jones, A. (2009) Trastuzumab plus anastrozole versus anastrozole alone for the treatment of postmenopausal women with human epidermal growth factor receptor 2-positive, hormone receptor-positive metastatic breast cancer: results from the randomized phase III TAnDEM study. Journal of clinical oncology: official journal of the American Society of Clinical Oncology. 27(33), 5529–5537.
Kaufmann, M., Jonat, W., Hilfrich, J., Eidtmann, H., Gademann, G., Zuna, I. and von Minckwitz, G. (2007) Improved Overall Survival in Postmenopausal Women With Early Breast Cancer After Anastrozole Initiated After Treatment With Tamoxifen Compared With Continued Tamoxifen: The ARNO 95 Study. Journal of Clinical Oncology. 25(19),
2664–2670.
264
Kazuma, K., Noda, N. and Suzuki, M. (2003) Malonylated flavonol glycosides from the petals of Clitoria ternatea. Phytochemistry. 62(2), 229–237.
Kelemu, S., Cardona, C. and Segura, G. (2004) Antimicrobial and insecticidal protein isolated from seeds of Clitoria ternatea, a tropical forage legume. Plant physiology and biochemistry: PPB / Société française de physiologie végétale. 42(11), 867–873.
Kill, I.R., Faragher, R. G. A., Lawrence, K. and Shall, S. (1994) The expression of proliferation-dependent antigens during the lifespan of normal and progeroid human fibroblasts in culture. Journal of Cell Science. 107, 571–579.
Kill, I.R. (1996) Localisation of the Ki-67 antigen within the nucleolus. Evidence for a fibrillarin-deficient region of the dense fibrillar component. Journal of Cell Science. 109(6), 1253–1263.
Kim, J.Y., Shin, K.K., Lee, A.L., Kim, Y.S., Park, H.J., Park, Y.K., Bae, Y.C. and Jung, J.S. (2014) MicroRNA-302 induces proliferation and inhibits oxidant-induced cell death in human adipose tissue-derived mesenchymal stem cells. Cell Death & Disease. 5(8),
e1385.
Kinsey, T. B. (2015) Costus Speciosus - Crepe Ginger. Photograph by T. Beth Kinsey used with permission. Hawaiian Plants and Tropical Flowers [online]. Available from:
http://wildlifeofhawaii.com/flowers/1082/costus-speciosus-crepe-ginger/ [Accessed September 15th, 2015].
Kirsop, B.E. (1996) The Convention on Biological Diversity: some implications for microbiology and microbial collections. Journal of Industrial Microbiology. 17, 505–511.
Kite, G.C., Veitch, N.C., Grayer, R.J. and Simmonds, M.S.J. (2003) The use of hyphenated techniques in comparative phytochemical studies of legumes. Biochemical Systematics and Ecology. 31(8), 813–843.
Koblovská, R., Macková, Z., Vítková, M., Kokoška, L., Klejdus, B. and Lapčík, O. (2008) Isoflavones in the rutaceae family: twenty selected representatives of the genera Citrus, Fortunella, Poncirus, Ruta and Severinia. Phytochemical Analysis. 19(1), 64–70.
Koehbach, J., O’Brien, M., Muttenthaler, M., Miazzo, M., Akcan, M., Elliott, A.G., Daly, N.L., Harvey, P.J., Arrowsmith, S., Gunasekera, S., Smith, T.J., Wray, S., Göransson, U., Dawson, P.E., Craik, D.J., Freissmuth, M. and Gruber, C.W. (2013) Oxytocic plant cyclotides as templates for peptide G protein-coupled receptor ligand design. Proceedings of the National Academy of Sciences. 110(52), 21183–21188.
Koehn, F.E. and Carter, G.T. (2005) The evolving role of natural products in drug discovery. Nature Reviews Drug Discovery. 4(3), 206–220.
Ko, R., Wilson, R. and Loscutoff, S. (2003) PC-SPES. Urology. 61, 1291–2.
Konkimalla, V.B. and Efferth, T. (2008) Evidence-based Chinese medicine for cancer therapy. Journal of Ethnopharmacology. 116(2), 207–210.
Kosako, H., Yoshida, T., Matsumura, F., Iskizaki, T., Narumiya, S. and Inagaki, M. (2000) Rho-kinase/ROCK is involved in cytokinesis through the phosphorylation of myosin light chain and not ezrin/radixin/moesin proteins at the cleavage furrow. Oncogene. 19(52), 6059–6064.
265
Kothakota, S., Azuma, T., Reinhard, C., Klippel, A., Tang, J., Chu, K., McGarry, T.J., Kirschner, M.W., Koths, K., Kwiatkowski, D.J. and Williams, L.T. (1997) Caspase-3-Generated Fragment of Gelsolin: Effector of Morphological Change in Apoptosis. Science. 278(5336), 294–298.
Kroemer, G., Galluzzi, L., Vandenabeele, P., Abrams, J., Alnemri, E., Baehrecke, E., Blagosklonny, M., El-Deiry, W., Golstein, P., Green, D., Hengartner, M., Knight, R., Kumar, S., Lipton, S., Malorni, W., Nuñez, G., Peter, M., Tschopp, J., Yuan, J., Piacentini, M., Zhivotovsky, B. and Melino, G. (2009) Classification of cell death. Cell death and differentiation. 16(1), 3–11.
Krysko, D.V., Vanden Berghe, T., D’Herde, K. and Vandenabeele, P. (2008) Apoptosis and necrosis: Detection, discrimination and phagocytosis. Methods. 44(3), 205–221.
Kudryashov, D.S. and Reisler, E. (2003) Solution Properties of Tetramethylrhodamine-Modified G-Actin. Biophysical Journal. 85(4), 2466–2475.
Kulkarni, S. and Nautiyal, C.S. (1999) Characterization of high temperature-tolerant rhizobia isolated from Prosopis juliflora grown in alkaline soil. The Journal of General and Applied Microbiology. 45(5), 213–220.
Kulms, D., Düssmann, H., Pöppelmann, B., Ständer, S., Schwarz, A. and Schwarz, T. (2002) Apoptosis induced by disruption of the actin cytoskeleton is mediated via activation of CD95 (Fas/APO-1). Cell Death and Differentiation. 9(6), 598–608.
Kumar, R., Ilyas, M., Parveen, M. and Shafiullah. (2006) A new chromone from Cassia nodosa. Journal of Asian Natural Products Research. 8(7), 595–598.
Kumar, S. and Bhat, K.I. (2011) In-vitro cytotoxic activity studies of Clitoria ternatea Linn flower extracts. International Journal of Pharmaceutical Sciences Review and Research. 6(2), 120–121.
Kumar, V., Mukherjee, K., Kumar, S., Mal, M. and Mukherjee, P.K. (2008) Validation of HPTLC method for the analysis of taraxerol in Clitoria ternatea. Phytochemical analysis: PCA. 19(3), 244–250.
Kumar Gupta, G., Chahal, J. and Bhatia, M. (2010) Clitoria ternatea (L.): Old and new aspects. Journal of Pharmacy Research. 3(11), 2610–2614.
Kunda, P. and Baum, B. (2009) The actin cytoskeleton in spindle assembly and positioning. Trends in Cell Biology. 19(4), 174–179.
Kurokawa, K. and Matsuda, M. (2005) Localized RhoA Activation as a Requirement for the Induction of Membrane Ruffling. Molecular Biology of the Cell. 16(9), 4294–4303.
Lai, W.-W., Hsu, S.-C., Chueh, F.-S., Chen, Y.-Y., Yang, J.-S., Lin, J.-P., Lien, J.-C., Tsai, C.-H. and Chung, J.-G. (2013) Quercetin inhibits migration and invasion of SAS human oral cancer cells through inhibition of NF-κB and matrix metalloproteinase-2/-9 signaling pathways. Anticancer Research. 33(5), 1941–1950.
Lampariello, L.R., Cortelazzo, A., Guerranti, R., Sticozzi, C. and Valacchi, G. (2012) The Magic Velvet Bean of Mucuna pruriens. Journal of Traditional and Complementary Medicine. 2(4), 331–339.
266
Lancaster, O.M. and Baum, B. (2014) Shaping up to divide: Coordinating actin and microtubule cytoskeletal remodelling during mitosis. Seminars in Cell & Developmental Biology. 34, 109–115.
Lane, D.P. (1992) p53, guardian of the genome. Nature. 358(6381), 15–16.
Latif, Z. and Sarker, S.D. (2012) Isolation of natural products by preparative high performance liquid chromatography (prep-HPLC). Methods in Molecular Biology (Clifton, N.J.). 864, 255–274.
Lawless, C., Wang, C., Jurk, D., Merz, A., von Zglinicki, T. and Passos, J. F. (2010) Quantitative assessment of markers for cell senescence. Experimental Gerontology. 345(10), 772–778.
Lauffenburger, D.A. and Horwitz, A.F. (1996) Cell Migration: A Physically Integrated Molecular Process. Cell. 84(3), 359–369.
LCB (2014) Learn Chinese Business. Traditional Chinese Medicine: A Profitable Worldwide Trend. LCB. [online]. Available from:
http://learnchinesebusiness.com/2014/03/06/traditional-chinese-medicine-a-profitable-worldwide-trend/ [Accessed April 5, 2015].
Leenders, M., Sluijs, I., Ros, M.M., Boshuizen, H.C., Siersema, P.D., Ferrari, P., Weikert, C., Tjønneland, A., Olsen, A., Boutron-Ruault, M.-C., Clavel-Chapelon, F., Nailler, L., Teucher, B., Li, K., Boeing, H., Bergmann, M.M., Trichopoulou, A., Lagiou, P., Trichopoulos, D., Palli, D., Pala, V., Panico, S., Tumino, R., Sacerdote, C., Peeters, P.H.M., van Gils, C.H., Lund, E., Engeset, D., Redondo, M.L., Agudo, A., Sánchez, M.J., Navarro, C., Ardanaz, E., Sonestedt, E., Ericson, U., Nilsson, L.M., Khaw, K.-T., Wareham, N.J., Key, T.J., Crowe, F.L., Romieu, I., Gunter, M.J., Gallo, V., Overvad, K., Riboli, E. and Bueno-de-Mesquita, H.B. (2013) Fruit and Vegetable Consumption and Mortality European Prospective Investigation Into Cancer and Nutrition. American Journal of Epidemiology. 178(4), 590–602.
Levayer, R. and Lecuit, T. (2012) Biomechanical regulation of contractility: spatial control and dynamics. Trends in Cell Biology. 22(2), 61–81.
Liang, C., Feng, P., Ku, B., Dotan, I., Canaani, D., Oh, B.-H. and Jung, J.U. (2006) Autophagic and tumour suppressor activity of a novel Beclin1-binding protein UVRAG. Nature Cell Biology. 8(7), 688–698.
Lijuan, W., Kupittayanant, P., Chudapongse, N., Wray, S. and Kupittayanant, S. (2011) The Effects of Wild Ginger (Costus speciosus (Koen) Smith) Rhizome Extract and Diosgenin on Rat Uterine Contractions. Reproductive Sciences. 18(6), 516–524.
Lin, L.-G., Liu, Q.-Y. and Ye, Y. (2014) Naturally Occurring Homoisoflavonoids and Their Pharmacological Activities. Planta Medica.
Lin-Vien, D., Colthup, N., Fateley, V. and Grasselli, J. (1991) The Handbook of Infrared and Raman Characteristic Frequencies of Organic Molecules. 1st ed. San Diego,
California: Academic Press.
Liu, S. and Lin, Y.C. (2004) Transformation of MCF-10A Human Breast Epithelial Cells by Zeranol and Estradiol-17β. The Breast Journal. 10(6), 514–521.

267
Longley, D.B., Harkin, D.P. and Johnston, P.G. (2003) 5-Fluorouracil: mechanisms of action and clinical strategies. Nature Reviews Cancer. 3(5), 330–338.
Longo-Sorbello, G., Saydam, G., Banerjee, D. and Bertino, J. (2005) Cytotoxicity and Cell Growth Assays. In C. Julio, C. Nigel, S. Kai, J. Small, T. Hunter, & S. David, eds. Cell Biology. A Laboratory Handbook. New York, USA: Academic Press, pp. 315–324.
Lorente, G., Syriani, E. and Morales, M. (2014) Actin Filaments at the Leading Edge of Cancer Cells Are Characterized by a High Mobile Fraction and Turnover Regulation by Profilin I. PLoS ONE. 9(1), e85817.
LoRusso, P.M., Weiss, D., Guardino, E., Girish, S. and Sliwkowski, M.X. (2011) Trastuzumab Emtansine: A Unique Antibody-Drug Conjugate in Development for Human Epidermal Growth Factor Receptor 2–Positive Cancer. Clinical Cancer Research. 17(20), 6437–6447.
Luo, G., Wang, Y., Liang, Q. and Liu, Q. (2012) Systems Biology for Traditional Chinese Medicine. Wiley-Blackwell.
Lu, Q.-Y., Jin, Y.-S., Pantuck, A., Zhang, Z.-F., Heber, D., Belldegrun, A., Brooks, M., Figlin, R.and Rao, J. (2005) Green tea extract modulates actin remodeling via Rho activity in an in vitro multistep carcinogenic model. Clinical cancer research: an official journal of the American Association for Cancer Research. 11(4), 1675–1683.
Luthra, P.M. and Singh, S. (2010) Identification and optimization of tyrosine hydroxylase activity in Mucuna pruriens DC. var. utilis. Planta. 231(6), 1361–1369.
Machacek, M., Hodgson, L., Welch, C., Elliott, H., Pertz, O., Nalbant, P., Abell, A., Johnson, G.L., Hahn, K.M. and Danuser, G. (2009) Coordination of Rho GTPase activities during cell protrusion. Nature. 461(7260), 99–103.
Maddox, A.S. and Burridge, K. (2003) RhoA is required for cortical retraction and rigidity during mitotic cell rounding. The Journal of Cell Biology. 160(2), 255–265.
Manfredi, J.J., Parness, J. and Horwitz, S.B. (1982) Taxol binds to cellular microtubules. The Journal of cell biology. 94(3), 688–696.
Manyam, B.V., Dhanasekaran, M. and Hare, T.A. (2004) Neuroprotective effects of the antiparkinson drug Mucuna pruriens. Phytotherapy research: PTR. 18(9), 706–712.
Mao, Y., Keller, E., Garfield, D., Shen, K. and Wang, J. (2013) Stromal cells in tumor microenvironment and breast cancer. Cancer and Metastasis Reviews. 32(32), 303–
315.
Marella, N.V., Malyavantham, K.S., Wang, J., Matsui, S., Liang, P. and Berezney, R. (2009) Cytogenetic and cDNA Microarray Expression Analysis of MCF10A Human Breast Cancer Progression Cell Lines. Cancer research. 69(14), 5946–5953.
Martinez-Montemayor, M., Otero-Franqui, E., Martinez, J., De La Mota-Peyado, A., Cubano, L. and Dhamawardhane, S. (2010) Individual and combined soy isoflavones exert differential effects on metastatic cancer progression. Clinical & Experimental Metastasis. [online]. Available from: http://link.springer.com/article/10.1007/s10585-010-9336-x/fulltext.html [Accessed May 14, 2015].
268
Martin, S.J., Reutelingsperger, C.P., McGahon, A.J., Rader, J.A., van Schie, R.C., LaFace, D.M. and Green, D.R. (1995) Early redistribution of plasma membrane phosphatidylserine is a general feature of apoptosis regardless of the initiating stimulus: inhibition by overexpression of Bcl-2 and Abl. The Journal of Experimental Medicine. 182(5), 1545–1556.
Matthews, J., Celius, T., Halgren, R. and Zacharewski, T. (2000) Differential estrogen receptor binding of estrogenic substances: a species comparison. Journal of Steroid Biochemistry & Molecular Biology. 74, 223–234.
McGuire, W.L. and Clark, G.M. (1986) Role of progesterone receptors in breast cancer. CA: a cancer journal for clinicians. 36(5), 302–309.
McPherson, K., Steel, C.M. and Dixon, J.M. (2000) Breast cancer—epidemiology, risk factors, and genetics. BMJ : British Medical Journal. 321(7261), 624–628.
MedicineNet (2013) MedicineNet Breastfeeding: Helpful tips. [online]. Available from: http://www.medicinenet.com/script/main/art.asp?articlekey=26015 [Accessed March 23, 2015]. Copyright 2013, WebMD, LLC. All rights reserved.
Miadoková, E., Masterová, I., Vlcková, V., Dúhová, V. and Tóth, J. (2002) Antimutagenic potential of homoisoflavonoids from Muscari racemosum. Journal of Ethnopharmacology. 81(3), 381–386.
Michel, C., El-sherei, M., Islam, W., Sleem, A. and Ahmed, S. (2013) Bioactivity-guided fractionation of the stem bark extract of Pterocarpus dalbergioides Roxb. ex Dc growing in Egypt. Bulletin of Faculty of Pharmacy, Cairo University. 51(1), 1–5.
Miele, E., Spinelli, G.P., Miele, E., Tomao, F. and Tomao, S. (2009) Albumin-bound formulation of paclitaxel (Abraxane® ABI-007) in the treatment of breast cancer. International Journal of Nanomedicine. 4, 99–105.
Miles, S.L., McFarland, M. and Niles, R.M. (2014) Molecular and physiological actions of quercetin: need for clinical trials to assess its benefits in human disease. Nutrition Reviews. 72(11), 720–734.
Miller, A.L. (2011) The contractile ring. Current Biology. 21(24), R976–R978.
Miller, L.H. and Su, X. (2011) Artemisinin: Discovery from the Chinese Herbal Garden. Cell. 146(6), 855–858.
Mini, E., Nobili, S., Caciagli, B., Landini, I. and Mazzei, T. (2006) Cellular pharmacology of gemcitabine. Annals of Oncology. 17(Supplement 5), v7–v12.
Minotti, G., Menna, P., Salvatorelli, E., Cairo, G. and Gianni, L. (2004) Anthracyclines: Molecular Advances and Pharmacologic Developments in Antitumor Activity and Cardiotoxicity. Pharmacological Reviews. 56(2), 185–229.
Misra, L. and Wagner, H. (2004) Alkaloidal constituents of Mucuna pruriens seeds. Phytochemistry. 65(18), 2565–2567.
Misra, L. and Wagner, H. (2007) Extraction of bioactive principles from Mucuna pruriens seeds. Indian journal of biochemistry & biophysics. 44(1), 56–60.
269
Misra, L. and Wagner, H. (2006) Lipid derivatives from Mucuna pruriens seeds. Indian Journal of Chemistry. 45B, 801–804.
Morris, J.B. (2009) Characterization of butterfly pea (Clitoria ternatea L.) accessions for
morphology, phenology, reproduction and potential nutraceutical, pharmaceutical trait utilization. Genetic Resources and Crop Evolution. 56, 421–427.
Morris, J. and Janick, J. (1999) Legume Genetic Resources with Novel ‘Value Added’ Industrial and Pharmaceutical Use. In Perspectives on new crops and new uses.
Alexandria, VA, USA: ASHS Press, pp. 196–201.
Morse, D.L., Gray, H., Payne, C.M. and Gillies, R.J. (2005) Docetaxel induces cell death through mitotic catastrophe in human breast cancer cells. Molecular Cancer Therapeutics. 4(10), 1495–1504.
MOST (2007) Ministry of Science and Technology of the People’s Republic of China. Beijing Declaration on International Traditional Chinese Medicine Cooperation in Science and Technology. MOST. [online]. Available from:
http://www.most.gov.cn/eng/pressroom/200712/t20071206_57649.htm [Accessed March 30, 2015].
Mukherjee, P., Kumar, V., Kumar, N. and Heinrich, M. (2008) The Ayurvedic medicine Clitoria ternatea—From traditional use to scientific assessment. Journal of Ethnopharmacology. 120, 291–301.
Mukherjee, P.K. and Wahile, A. (2006) Integrated approaches towards drug development from Ayurveda and other Indian system of medicines. Journal of Ethnopharmacology. 103(1), 25–35.
Mullin, R. (2014) Tufts Study Finds Big Rise In Cost Of Drug Development. Chemical & Engineering News. 92, 6.
Murthy, K. and Mishra, S. (2009) Quantification of β-Sitosterol from Mucuna pruriens by TLC. Chromatographia. 69(1-2), 183–186.
Myers, N., Mittermeier, R.A., Mittermeier, C.G., da Fonseca, G.A.B. and Kent, J. (2000) Biodiversity hotspots for conservation priorities. Nature. 403(6772), 853–858.
Mylona, P., Pawlowski, K. and Bisseling, T. (1995) Symbiotic Nitrogen Fixation. The Plant Cell. 7(7), 869–885.
Nair, U.B., Joel, P.B., Wan, Q., Lowey, S., Rould, M.A. and Trybus, K.M. (2008) Crystal structures of monomeric actin bound to cytochalasin D. Journal of Molecular Biology. 384(4), 848–864.
Najma, C., Kalita, J.C. and Ansarul, H. (2012) Effect of Costus Speciosus Koen on Reproductive Organs of Female Albino Mice. Indian Research Journal of Pharmacy. 3(4), 200–202.
Nawrocki, J. (1997) The silanol group and its role in liquid chromatography. Journal of Chromatography A. 779(1–2), 29–71.
Neda, G.D., Rabeta, M.S. and Ong, M.T. (2013) Chemical composition and anti-proliferative properties of flowers of Clitoria Ternatea. International Food Research Journal. 20(3), 1229–1234.

270
Newman, D.J. and Cragg, G.M. (2012) Natural Products as Sources of New Drugs over the 30 Years from 1981 to 2010. Journal of natural products. 75(3), 311–335.
Nguyen, G.K.T., Wang, S., Qiu, Y., Hemu, X., Lian, Y. and Tam, J.P. (2014) Butelase 1 is an Asx-specific ligase enabling peptide macrocyclization and synthesis. Nature Chemical Biology.
Nguyen, G.K.T., Zhang, S., Nguyen, N.T.K., Nguyen, P.Q.T., Chiu, M.S., Hardjojo, A. and Tam, J.P. (2011) Discovery and Characterization of Novel Cyclotides Originated from Chimeric Precursors Consisting of Albumin-1 Chain a and Cyclotide Domains in the Fabaceae Family. Journal of Biological Chemistry. 286(27), 24275–24287.
Nidiry, E.S., Ganeshan, G. and Lokesha, A.N. (2011) Antifungal Activity of Mucuna pruriens Seed Extractives and L-dopa. Journal of Herbs, Spices & Medicinal Plants. 17,
139–143.
Nielsen, D.L., Kümler, I., Palshof, J.A.E. and Andersson, M. (2013) Efficacy of HER2-targeted therapy in metastatic breast cancer. Monoclonal antibodies and tyrosine kinase inhibitors. The Breast. 22(1), 1–12.
NIH (2015) NIH Clinical Trials Efficacy and Safety Study of NeuVaxTM (Nelipepimut-S or E75) Vaccine to Prevent Breast Cancer Recurrence (PRESENT). [online]. Available from: https://clinicaltrials.gov/ct2/show/NCT01479244?term=NCT01479244.&rank=1 [Accessed June 8, 2015].
NIH (2008) NIH U.S. National Library of Medicine FAQ - Clinical Trial Phases. [online]. Available from: http://www.nlm.nih.gov/services/ctphases.html [Accessed March 28, 2015].
Nikoletopoulou, V., Markaki, M., Palikaras, K. and Tavernarakis, N. (2013) Crosstalk between apoptosis, necrosis and autophagy. Biochimica Et Biophysica Acta. 1833(12),
3448–3459.
Nobes, C.D. and Hall, A. (1995) Rho, Rac, and Cdc42 GTPases regulate the assembly of multimolecular focal complexes associated with actin stress fibers, lamellipodia, and filopodia. Cell. 81(1), 53–62.
Nosrati, H., Hosseinpour-Feizi, M.-A., Nikniazi, M. and Razban-Haghighi, A. (2012) Genetic variation among different accessions of Lathyrus sativus (Fabaceae) revealed by RAPDs. Botanica Serbica. 36(1), 41–47.
Notte, A., Leclere, L. and Michiels, C. (2011) Autophagy as a mediator of chemotherapy-induced cell death in cancer. Biochemical Pharmacology. 82(5), 427–434.
Ntukidem, N., Arce-Lara, C., Otterson, G.A., Kraut, E., Cataland, S. and Bekaii-Saab, T. (2009) Capped-dose mitomycin C: a pooled safety analysis from three prospective clinical trials. Cancer Chemotherapy and Pharmacology. 65(2), 319–324.
NZP (2011) Cholic Acid. New Zealand Pharmaceuticals Ltd. [online]. Available from:
Taurocholic acid [Accessed March 31, 2015].
O’Connell, C.B., Wheatley, S.P., Ahmed, S. and Wang, Y. (1999) The Small GTP-binding Protein Rho Regulates Cortical Activities in Cultured Cells during Division. The Journal of Cell Biology. 144(2), 305–313.
271
Oda, T., Iwasa, M., Aihara, T., Maéda, Y and Narita, A. (2009) The nature of the globular- to fibrous-actin transition. Nature. 457(7228), 441–445.
Oja, C., Tardi, P., Schutze-Redelmeier, M.-P and Cullis, P.R. (2000) Doxorubicin entrapped within liposome-associated antigens results in a selective inhibition of the antibody response to the linked antigen. Biochimica et Biophysica Acta (BBA) - Biomembranes. 1468(1–2), 31–40.
Olesen, U.H., Christensen, M.K., Björkling, F., Jäättelä, M., Jensen, P.B., Sehested, M and Nielsen, S.J. (2008) Anticancer agent CHS-828 inhibits cellular synthesis of NAD. Biochemical and Biophysical Research Communications. 367(4), 799–804.
Olson, M.F and Sahai, E. (2009) The actin cytoskeleton in cancer cell motility. Clinical & Experimental Metastasis. 26(4), 273–287.
Orhan, I and Sener, B. (2003) Bioactivity-Directed Fractionation of Alkaloids from Some Amaryllidaceae Plants and Their Anticholinesterase Activity. Chemistry of Natural Compounds. 39(4), 383–386.
Orr, G.A., Verdier-Pinard, P., McDaid, H and Horwitz, S.B. (2003) Mechanisms of Taxol resistance related to microtubules. Oncogene. 22(47), 7280–7295.
Orth, J.D., Loewer, A., Lahav, G and Mitchison, T.J. (2012) Prolonged mitotic arrest triggers partial activation of apoptosis, resulting in DNA damage and p53 induction. Molecular Biology of the Cell. 23(4), 567–576.
Osborn, R.W., De Samblanx, G.W., Thevissen, K., Goderis, I., Torrekens, S., Van Leuven, F., Attenborough, S., Rees, S.B and Broekaert, W.F. (1995) Isolation and characterisation of plant defensins from seeds of Asteraceae, Fabaceae, Hippocastanaceae and Saxifragaceae. FEBS Letters. 368(2), 257–262.
Otterbein, L., Graceffa, P. and Dominguez, R. (2001) The crystal structure of uncomplexed actin in the ADP state. Science. 293(5330), 708–711.
Palazzolo, G., Horvath, P. and Zenobi-Wong, M. (2012) The Flavonoid Isoquercitrin Promotes Neurite Elongation by Reducing RhoA Activity. PLoS ONE. 7(11), e49979.
Pan, W., Ikeda, K., Takebe, M and Yamori, Y. (2001) Genistein, Daidzein and Glycitein Inhibit Growth and DNA Synthesis of Aortic Smooth Muscle Cells from Stroke-Prone Spontaneously Hypertensive Rats. The Journal of Nutrition. 131(4), 1154–1158.
Pandey, A., Gupta, S. and Yadav, K.R. (2011) Agro Techniques of Costus speciosus:
An Important Endangered Medicinal Plant. In National Conference on Forest Biodiversity : Earth’s Living Treasure. Uttar Pradesh, India: Uttar Pradesh State Biodiversity Board, pp. 125–129.
Papavramidou, N., Papavramidis, T. and Demetriou, T. (2010) Ancient Greek and Greco–Roman Methods in Modern Surgical Treatment of Cancer. Annals of Surgical Oncology. 17(3), 665–667.
Parimala Devi, B., Boominathan, R. and Mandal, S.C. (2003) Anti-inflammatory, analgesic and antipyretic properties of Clitoria ternatea root. Fitoterapia. 74(4), 345–349.

272
Parveen, I., Threadgill, M.D., Hauck, B., Donnison, I. and Winters, A. (2011) Isolation, identification and quantitation of hydroxycinnamic acid conjugates, potential platform chemicals, in the leaves and stems of Miscanthus × giganteus using LC–ESI-MSn. Phytochemistry. 72(18), 2376–2384.
Patel, K.N., Patel, J.K., Patel, M.P., Rajput, G.C. and Patel, H.A. (2010) Introduction to hyphenated techniques and their applications in pharmacy. Pharmaceutical Methods. 1(1), 2–13.
Patwardhan, B. (2012) The quest for evidence-based Ayurveda: lessons learned. Current Science. 102(10), 1406–1417.
Patwardhan, B., Warude, D., Pushpangadan, P. and Bhatt, N. (2005) Ayurveda and Traditional Chinese Medicine: A Comparative Overview. Evidence-Based Complementary and Alternative Medicine. 2(4), 465–473.
Pavarini, D.P., Pavarini, S.P., Niehues, M. and Lopes, N.P. (2012) Exogenous influences on plant secondary metabolite levels. Animal Feed Science and Technology. 176(1–4), 5–16.
Pearl, L.H., Schierz, A.C., Ward, S.E., Al-Lazikani, B. and Pearl, F.M.G. (2015) Therapeutic opportunities within the DNA damage response. Nature Reviews Cancer. 15(3), 166–180.
Pelikan Conchaudron, A.P., Didry, D., Le, K.H.D., Larquet, E., Boisset, N., Pantaloni, D. and Carlier, M.-F. (2006) Analysis of Tetramethylrhodamine-labeled Actin Polymerization and Interaction with Actin Regulatory Proteins. Journal of Biological Chemistry. 281(33), 24036–24047.
Pellegrin, S. and Mellor, H. (2007) Actin stress fibres. Journal of Cell Science. 120(20),
3491–3499.
Pendbhaje, N., Sudheendra, G., Pathan, S. and Musmade, D. (2011) Ethnopharmacology, Pharmacognosy and Phytochemical Profile of Clitoria ternatea Linn: An Overview. Pharmacologyonline. 3, 166–175.
Peoples, G.E., Holmes, J.P., Hueman, M.T., Mittendorf, E.A., Amin, A., Khoo, S., Dehqanzada, Z.A., Gurney, J.M., Woll, M.M., Ryan, G.B., Storrer, C.E., Craig, D., Ioannides, C.G. and Ponniah, S. (2008) Combined Clinical Trial Results of a HER2/neu (E75) Vaccine for the Prevention of Recurrence in High-Risk Breast Cancer Patients: U.S. Military Cancer Institute Clinical Trials Group Study I-01 and I-02. Clinical Cancer Research. 14(3), 797–803.
Perrin, B.J. and Ervasti, J.M. (2010) The Actin Gene Family: Function Follows Isoform. Cytoskeleton (Hoboken, N.j.). 67(10), 630–634.
Pettersson, K. and Gustafsson, J.A. (2001) Role of estrogen receptor beta in estrogen action. Annual review of physiology. 63, 165–192.
Pichersky, E. and Gang, D. (2000) Genetics and biochemistry of secondary metabolites in plants: an evolutionary perspective. Trends in Plant Science. 5(10), 439–445.

273
Pinheiro, P. and Justino, G. (2012) Structural Analysis of Flavonoids and Related Compounds – A Review of Spectroscopic Applications. In V. Rao, ed. Phytochemicals - A Global Perspective of Their Role in Nutrition and Health. InTech, p. 538.
Plummer, A.J., Earl, A., Schneider, J.A., Trapold, J. and Barrett, W. (1954) Pharmacology of Rauwolfia Alkaloids, Including Reserpine. Annals of the New York Academy of Sciences. 59(1), 8–21.
Polyak, K. (2014) Tumor Heterogeneity Confounds and Illuminates: A case for Darwinian tumor evolution. Nature Medicine. 20(4), 344–346.
Pomp, J., Wike, J.L., Ouwerkerk, I.J.M., Hoogstraten, C., Davelaar, J., Schrier, P.I., Leer, J.W.H., Thames, H.D. and Brock, W.A. (1996) Cell density dependent plating efficiency affects outcome and interpretation of colony forming assays. Radiotherapy and Oncology. 40(2), 121–125.
Porta, J.C. and Borgstahl, G.E.O. (2012) Structural basis for profilin-mediated actin nucleotide exchange. Journal of Molecular Biology. 418(1-2), 103–116.
Prabhakaran, R., Kalaivani, P., Huang, R., Poomina, P., Vijaya Padma, V., Dallemer, F. and Natarajan, N. (2012) DNA binding, antioxidant, cytotoxicity (MTT, lactate dehydrogenase, NO), and cellular uptake studies of structurally different nickel(II) thiosemicarbazone complexes: synthesis, spectroscopy, electrochemistry, and X-ray crystallography - Springer. Journal of Biological Inorganic Chemistr. 18(2), 223–47.
Pras, N., Wichers, H.J., Bruins, A.P. and Malingré, T.M. (1988) Bioconversion of para-substituted monophenolic compounds into corresponding catechols by alginate entrapped cells of Mucuna pruriens. Plant Cell, Tissue and Organ Culture. 13(1), 15–26.
Pras, N., Woerdenbag, H.J., Batterman, S., Visser, J.F., Van Uden, W. (1993) Mucuna pruriens: improvement of the biotechnological production of the anti-Parkinson drug L-dopa by plant cell selection. Pharmacy world & science: PWS. 15(6), 263–268.
Quin, J.E., Devlin, J.R., Cameron, D., Hannan, K.M. and Pearson, R.B., Hannan, R.D. (2014) Targeting the nucleolus for cancer intervention. Biochimica Et Biophysica Acta. 1842(6), 802–816.
Qi, Z., Liming, Z. and van Lerberghe, W. (2011) The importance of traditional Chinese medicine services in health care provision in China. Universitas Forum. 2(2).
Zhang, Q., Zhu, L. and van Lerberghe, W. (2011) The importance of traditional Chinese medicine services in health care provision in China. Universitas Forum. 2(2).
Radwan, M.M., Tabanca, N., Wedge, D.E., Tarawneh, A.H.and Cutler, S.J. (2014) Antifungal compounds from turmeric and nutmeg with activity against plant pathogens. Fitoterapia. 99, 341–346.
Rafi, M.M. and Vastano, B.C. (2007) Identification of a structure specific Bcl-2 phosphorylating homoisoflavone molecule from Vietnamese coriander (Polygonatum odoratum) that induces apoptosis and G2/M cell cycle arrest in breast cancer cell lines. Food Chemistry. 104(1), 332–340.
274
Rahman, A.S., Arslan, I., Saha, R., Talukdera, N., Khaleque, S. and Au, H. (2006) Bioactivity guided cytotoxic activity of Clitoria ternatea utilizing brine shrimp lethality bioassay. Bangladesh Journal of Physiology and Pharmacology. 22, 18–21.
Rai, K.S., Murthy, K.D., Rao, M.S. and Karanth, K.S. (2005) Altered dendritic arborization of amygdala neurons in young adult rats orally intubated with Clitorea ternatea aqueous root extract. Phytotherapy Research. 19(7), 592–598.
Raina, A.P. and Khatri, R. (2011) Quantitative Determination of L-DOPA in Seeds of Mucuna Pruriens Germplasm by High Performance Thin Layer Chromatography. Indian Journal of Pharmaceutical Sciences. 73(4), 459–462.
Ramaswamy, V., Varghese, N. and Simon, A. (2011) An investigation on cytotoxic and antioxidant properties of Clitoria ternatea L. Internatonal Journal of Drug Discovery. 3(1), 74–77.
Rauhala, H.E., Teppo, S., Niemelä, S. and Kallioniemi, A. (2013) Silencing of the ARP2/3 Complex Disturbs Pancreatic Cancer Cell Migration. Anticancer Research. 33(1), 45–52.
Raval, G.N., Bharadwaj, S., Levine, E.A., Willingham, M.C., Geary, R.L., Kute, T. and Prasad, G.L. (2003) Loss of expression of tropomyosin-1, a novel class II tumor suppressor that induces anoikis, in primary breast tumors. Oncogene. 22(40), 6194–
6203.
Ravishankar, D., Watson, K.A., Boateng, S.Y., Green, R.J., Greco, F. and Osborn, H.M.I. (2015) Exploring quercetin and luteolin derivatives as antiangiogenic agents. European Journal of Medicinal Chemistry. 97, 259–274.
Raxworthy, M.J. (1988) Microtubules, tubulins and associated proteins. Biochemical Education. 16(1), 2–9.
Reed, M.J., Purohit, A., Woo, L.W.L., Newman, S.P. and Potter, B.V.L. (2005) Steroid Sulfatase: Molecular Biology, Regulation, and Inhibition. Endocrine Reviews. 26(2), 171–202.
Remedios, C.G.D., Chhabra, D., Kekic, M., Dedova, I.V., Tsubakihara, M., Berry, D.A. and Nosworthy, N.J. (2003) Actin Binding Proteins: Regulation of Cytoskeletal Microfilaments. Physiological Reviews. 83(2), 433–473.
Ricci, M.S. and Zong, W.-X. (2006) Chemotherapeutic Approaches for Targeting Cell Death Pathways. The Oncologist. 11(4), 342–357.
Rietjens, I.M.C.M., Sotoca, A.M., Vervoort, J. and Louisse, J. (2012) Mechanisms underlying the dualistic mode of action of major soy isoflavones in relation to cell proliferation and cancer risks. Molecular Nutrition & Food Research, n/a–n/a.
Ring, A. and Dowsett, M. (2004) Mechanisms of tamoxifen resistance. Endocrine-Related Cancer. 11(4), 643–658.
Rizwani, W., Fasim, A., Sharma, D., Reddy, D.J., Bin Omar, N.A.M. and Singh, S.S. (2014) S137 Phosphorylation of Profilin 1 Is an Important Signaling Event in Breast Cancer Progression. PLoS ONE. 9(8), e103868.
275
Rodier, F. and Campisis, J. (2011) Four faces of cellular senescence. Journal of Cell Biology. 192(4), 547–556.
Romanov, S.R., Kozakiewicz, B.K., Holst, C.R., Stampfer, M.R., Haupt, L.M. and Tlsty, T.D. (2001) Normal human mammary epithelial cells spontaneously escape senescence and acquire genomic changes. Nature. 409(6820), 633–637.
Roth, V. (2006) Doubling time. [online]. Available from: http://www.doubling-time.com/compute.php [Accessed November 4, 2014].
Roy, S.K., Kumari, N., Gupta, S., Pahwa, S., Nandanwar, H. and Jachak, S.M. (2013) 7-Hydroxy-(E)-3-phenylmethylene-chroman-4-one analogues as efflux pump inhibitors against Mycobacterium smegmatis mc2 155. European Journal of Medicinal Chemistry. 66, 499–507.
Roth, V. (2006) Doubling time. [online]. Available from: http://www.doubling-time.com/compute.php [Accessed November 4, 2014].
Rubbi, C. and Milner, J. (2003) Disruption of the nucleolus mediates stabilization of p53 in response to DNA damage and other stresses. The EMBO Journal. 22, 6068–6077.
Russell, B. (2015) Nanostructure Synthesis and Properties of Simple Organic and Organometallic Compounds. Brandon Russell. [online]. Available from:
http://www.brandon-russell.com/nanostructures.shtml [Accessed March 8, 2015].
Russo, M., Spagnuolo, C., Tedesco, I., Bilotto, S. and Russo, G.L. (2012) The flavonoid quercetin in disease prevention and therapy: Facts and fancies. Biochemical Pharmacology. 83(1), 6–15.
Sabatini, D.M. (2006) mTOR and cancer: insights into a complex relationship. Nature Reviews Cancer. 6(9), 729–734.
Saleem, M. (2009) Lupeol, a novel anti-inflammatory and anti-cancer dietary triterpene. Cancer Letters. 285(2), 109–115.
Sandhar, H.K., Kumar, B., Prasher, S., Tiwari, P., Salhan, M. and Sharma, P. (2011) A Review of Phytochemistry and Pharmacology of Flavonoids. Internationale Pharmaceutica Sciencia. 11(1).
Sandi, C., Sandi, M., Jassal, H., Ezzatizadeh, V., Anjomani-Virmouni, S., Al-Mahdawi, S. and Pook, M.A. (2014) Generation and Characterisation of Friedreich Ataxia YG8R Mouse Fibroblast and Neural Stem Cell Models. PLoS ONE. 9(2).
Santilli, G., Piotrowska, I., Cantilena, S., Chayka, O., D’Alicarnasso, M., Morgenstern, D.A., Himoudi, N., Pearson, K., Anderson, J., Thrasher, A.J. and Sala, A. (2013) Polyphenon E Enhances the Antitumor Immune Response in Neuroblastoma by Inactivating Myeloid Suppressor Cells. Clinical cancer research: an official journal of the American Association for Cancer Research. 19(5), 1116–25.
Santos-Buelga, C., Gonzalez-Manzano, S., Dueñas, M. and Gonzalez-Paramas, A.M. (2012) Extraction and isolation of phenolic compounds. In S. Sarker & L. Nahar, eds. Methods in Molecular Biology (Clifton, N.J.). pp. 427–464.

276
Saper, R.B., Phillips, R.S., Sehgal, A., Khouri, N., Davis, R.B., Paquin, J., Thuppil, V. and Kales, S.N. (2008) Lead, mercury, and arsenic in US- and Indian-manufactured Ayurvedic medicines sold via the Internet. JAMA. 300(8), 915–923.
Saraf, A. (2010) Phytochemical and Antimicrobial Studies of Medicinal Plant Costus Speciosus (Koen.). E-Journal of Chemistry. 7(s1), S405–S413.
Sarkar, F.H. and Li, Y. (2003) Soy Isoflavones and Cancer Prevention. Cancer Investigation. 21(5), 744.
Sarker, S., Latif, Z. and Gray, A.I. (2005) Natural products isolation: an overview. In S. Sarker & L. Nahar, eds. Natural Products Isolation. New Jersey: Humana Press.
Sarker, S. and Nahar, L. (2012a) An introduction to natural products isolation. In S. Sarker & L. Nahar, eds. Natural Products Isolation, Methods and Protocols. Methods in
Molecular Biology. Hatfield, Hertfordshire: Humana Press.
Sarker, S. and Nahar, L. (2012b) Hyphenated Techniques and Their Applications in Natural Products Analysis. In S. Sarker & L. Nahar, eds. Natural Products Isolation, Methods and Protocols. Methods in Molecular Biology. Hatfield, Hertfordshire: Humana
Press.
Sarumathy, K., Dhana Rajan, M.S., Vijay, T. and Thenmozhi, V. (2011) In vitro cytotoxic activity of Clitoria ternatea. International Journal of Universal Pharmacy and Life Sciences. 1(1), 19–28.
Satelli, A. and Li, S. (2011) Vimentin in cancer and its potential as a molecular target for cancer therapy. Cellular and molecular life sciences : CMLS. 68(18), 3033–3046.
Sayed, Z.N., Mukundan, U., Khan, I.A.and Khanum, A. (2006) A brief overview of medicinal plants of India. In Role of Biotechnology in Medicinal and Aromatic Plants.
India: Ukaaz Publications, pp. 107–164.
Schieber, A., Keller, P. and Carle, R. (2001) Determination of phenolic acids and flavonoids of apple and pear by high-performance liquid chromatography. Journal of Chromatography A. 910(2), 265–273.
Schiff, P.B. and Horwitz, S.B. (1980) Taxol stabilizes microtubules in mouse fibroblast cells. Proceedings of the National Academy of Sciences of the United States of America. 77(3 I), 1561–1565.
Schmidt, P., Broughton, W. and Werner, D. (1994) Nod Factors of Bradyrhizobium japonicum and Rhizobium sp. NGR234 Induce Flavonoid Accumulation in Soybean Root Exudate. Molecular Plant-Microbe Interactions. 7(3), 384–390.
Schutt, C.E., Myslik, J.C. and Rozycki, M.D., Goonesekere, N.C.W., Lindberg, U. (1993) The structure of crystalline profilin-β-actin. Nature. 365(6449), 810–816.
Scogings, P.F., Hattas, D., Skarpe, C., Hjältén, J., Dziba, L., Zobolo, A. and Rooke, T. (2015) Seasonal variations in nutrients and secondary metabolites in semi-arid savannas depend on year and species. Journal of Arid Environments. 114, 54–61.
Seeley, R., Stephens, T. and Tate, P. (2007) Anatomy and Physiology. 8th International ed. McGraw-Hill.
277
SEER (2015) SEER Stat Fact Sheets: Breast Cancer. [online]. Available from: http://seer.cancer.gov/statfacts/html/breast.html [Accessed March 10, 2015].
Seidel, V. (2012) Initial and Bulk Extraction of Natural Products Isolation. In S. D. Sarker & L. Nahar, eds. Natural Products Isolation. Totowa, NJ: Humana Press, pp.
27–41.
Sen, Z., Zhan, X.K., Jing, J., Yi, Z. and Wanqi, Z. (2013) Chemosensitizing activities of cyclotides from Clitoria ternatea in paclitaxel-resistant lung cancer cells. Oncology Letters. 5(2), 641–644.
Senderowicz, A.M.J., Kaur, G., Sainz, E., Laing, C., Inman, W.D., Rodriguez, J., Crews, P., Malspeis, L., Grever, M.R., Sausville, E.A., Duncan, K.L.K. (1995) Jasplakinolide’s Inhibition of the Growth of Prostate Carcinoma Cells In Vitro With Disruption of the Actin Cytoskeleton. Journal of the National Cancer Institute. 87(1), 46–51.
Shalini, S., Dorstyn, L., Dawar, S. and Kumar, S. (2015) Old, new and emerging functions of caspases. Cell Death & Differentiation. 22(4), 526–539.
Shamsa, F., Monsef, H., Ghamooshi, R. and Verdian-rizi, M. (2008) Spectrophotometric determination of total alkaloids in some Iranian medicinal plants. The Thai Journal of Pharmaceutical Sciences. 32, 17–20.
Shapiro, H.M. (2005) Practical Flow Cytometry. John Wiley & Sons Ltd.
Sharp, D.J., Rogers, G.C. and Scholey, J.M. (2000) Microtubule motors in mitosis. Nature. 407(6800), 41–47.
Shishodia, S. and Aggarwal, B.B. (2005) Diosgenin inhibits osteoclastogenesis, invasion, and proliferation through the downregulation of Akt, IκB kinase activation and NF-κB-regulated gene expression. Oncogene. 25(10), 1463–1473.
Siddhuraju, P., Vijayakumari, K.and Janardhanan, K. (1996) Chemical Composition and Protein Quality of the Little-Known Legume, Velvet Bean (Mucuna pruriens (L.) DC.). J. Agric. Food Chem.. 44(9), 2636–2641.
Siddique, H.R., Mishra, S.K., Karnes, R.J. and Saleem, M. (2011) Lupeol, a Novel Androgen Receptor Inhibitor: Implications in Prostate Cancer Therapy. Clinical Cancer Research. 17(16), 5379–5391.
Silva, G., Lee, I.-S. and Kinghorn, A.D. (1998) Special Problems with the Extraction of Plants. In R. Cannell, ed. Natural Products Isolation. Totowa, New Jersey: Humana
Press.
Skoog, D.A., West, D.M. and Holler, F.J. (1992) Fundamentals of Analytical Chemistry.
6th ed. Orlando, Florida: Saunders College Publishing.
Slamon, D.J., Clark, G.M., Wong, S.G., Levin, W.J., Ullrich, A. and McGuire, W.L. (1987) Human breast cancer: correlation of relapse and survival with amplification of the HER-2/neu oncogene. Science (New York, N.Y.). 235(4785), 177–182.
Soldani, C., Bottone, M., Pellicciari, C. and Scovassi, A. (2006) Nucleolus disassembly in mitosis and apoptosis: dynamic redistribution of phosphorylated-c-Myc, fibrillarin and Ki-67. European Journal of Histochemistry. 50(4), 273–280.
278
Somers, K.D. and Murphey, M.M. (1982) Multinucleation in response to cytochalasin B: a common feature in several human tumor cell lines. Cancer Research. 42(7), 2575–2578.
Sone, H., Tohyama, C., Aoki, Y. and Yonemoto, J. (1999) Risk assessment of the flavonoids, quercetin as an endocrine modifier. Journal of Risk Research. 2(2), 151–
166.
Soper, D. (2015) p-Value Calculator for Correlation Coefficients. [online]. Available from: http://www.danielsoper.com/statcalc3/calc.aspx?id=44 [Accessed March 3, 2015].
Soule, H.D., Maloney, T.M., Wolman, S.R., Peterson, W.D., Brenz, R., McGrath, C.M., Russo, J., Pauley, R.J., Jones, R.F. and Brooks, S.C. (1990) Isolation and characterization of a spontaneously immortalized human breast epithelial cell line, MCF-10. Cancer Research. 50(18), 6075–6086.
Soule, H.D., Vazquez, J., Long, A., Albert, S. and Brennan, M. (1973) A Human Cell Line From a Pleural Effusion Derived From a Breast Carcinoma. Journal of the National Cancer Institute. 51(5), 1409–1416.
Srivastava, S., Singh, P., Mishra, G., Jha, K.K. and Khosa, R.L. (2011) Costus speciosus (Keukand): A review. Der Pharmacia Sinica. 2(1), 118–128.
Staedler, D., Idrizi, E., Kenzaoui, B.H. and Juillerat-Jeanneret, L. (2011) Drug combinations with quercetin: doxorubicin plus quercetin in human breast cancer cells. Cancer Chemotherapy and Pharmacology. 68(5), 1161–1172.
Stampfer, M.R., Garbe, J., Levine, G., Lichtsteiner, S., Vasserot, A.P. and Yaswen, P. (2001) Expression of the telomerase catalytic subunit, hTERT, induces resistance to transforming growth factor beta growth inhibition in p16INK4A(-) human mammary epithelial cells. Proceedings of the National Academy of Sciences of the United States of America. 98(8), 4498–4503.
Stehn, J.R., Haass, N.K., Bonello, T., Desouza, M., Kottyan, G., Treutlein, H., Zeng, J., Nascimento, P.R.B.B., Sequeira, V.B., Butler, T.L., Allanson, M., Fath, T., Hill, T.A., McCluskey, A., Schevzov, G., Palmer, S.J., Hardeman, E.C., Winlaw, D., Reeve, V.E., Dixon, I., Weninger, W., Cripe, T.P. and Gunning, P.W. (2013) A Novel Class of Anticancer Compounds Targets the Actin Cytoskeleton in Tumor Cells. Cancer Research. 73(16), 5169–5182.
Steiner, M.R., Altenburg, B., Richards, C.S., Dudley, J.P., Medina, D. and Butel, J.S. (1978) Differential response of cultured mouse mammary cells of varying tumorigenicity to cytochalasin B. Cancer Research. 38(9), 2719–2721.
Stephens, D.J. and Allan, V.J. (2003) Light Microscopy Techniques for Live Cell Imaging. Science. 300(5616), 82–86.
Stingl, J., Andersen, R. and Emerman, J. (1992) In vitro screening of crude extracts and pure metabolites obtained from marine invertebrates for the treatment of breast cancer. Cancer chemotherapy and Pharmacology. 30, 401–406.
Stracke, M., Soroush, M., Liotta, L. and Schiffman, E. (1993) Cytoskeletal agents inhibit motility and adherence of human tumor cells. Kidney International. 43(1), 151–157.
279
Strauss III, J.F.S. and Barbieri, R.L. (2013) Yen & Jaffe’s Reproductive Endocrinology: Physiology, Pathophysiology, and Clinical Management. Elsevier Health Sciences.
Stuart, B., George, B. and McIntyre, P. (1996) Modern Infrared Spectroscopy.
Chichester: John Wiley & Sons Ltd.
Sugiyama, N., Gucciardo, E., Tatti, O., Varjosalo, M., Hyytiäinen, M., Gstaiger, M. and Lehti, K. (2013) EphA2 cleavage by MT1-MMP triggers single cancer cell invasion via homotypic cell repulsion. The Journal of Cell Biology. 201(3), 467–484.
Sutherland, R.L., Hall, R.E. and Taylor, I.W. (1983) Cell proliferation kinetics of MCF-7 human mammary carcinoma cells in culture and effects of tamoxifen on exponentially growing and plateau-phase cells. Cancer Research. 43(9), 3998–4006.
Suvarna, V. (2010) Phase IV of Drug Development. Perspectives in Clinical Research. 1(2), 57–60.
Swain, S.S., Rout, K.K. and Chand, P.K. (2012) Production of Triterpenoid Anti-cancer Compound Taraxerol in Agrobacterium-Transformed Root Cultures of Butterfly Pea (Clitoria ternatea L.). Applied biochemistry and biotechnology. 168(3), 487–503.
Swinney, D.C. and Anthony, J. (2011) How were new medicines discovered? Nature Reviews Drug Discovery. 10(7), 507–519.
Szabo, N.J. (2003) Indolealkylamines in Mucuna species. Tropical and Subtropical Agroecosystems. 1, 295–307.
Tait, S., Salvati, A.L., Desideri, N. and Fiore, L. (2006) Antiviral activity of substituted homoisoflavonoids on enteroviruses. Antiviral Research. 72(3), 252–255.
Takasaki, M., Konoshima, T., Tokuda, H., Masuda, K., Arai, Y., Shiojima, K. and Ageta, H. (1999) Anti-carcinogenic activity of Taraxacum plant. II. Biological & pharmaceutical bulletin. 22(6), 606–610.
Tan, B., Shi, H., Ji, G. and Xie, J. (2011) Effects of taraxerol and taraxerol acetate on cell cycle and apoptosis of human gastric epithelial cell line AGS. Zhong xi yi jie he xue bao = Journal of Chinese integrative medicine. 9(6), 638–642.
Taranalli, A.D. and Cheeramkuzhy, T.C. (2000) Influence of Clitoria ternatea extracts on memory and central cholinergic activity in rats. Pharmaceutical biology. 38(1), 51–56.
Tarhini, A., Lo, E. and Minor, D.R. (2010) Releasing the Brake on the Immune System: Ipilimumab in Melanoma and Other Tumors. Cancer Biotherapy & Radiopharmaceuticals. 25(6), 601–613.
Taur, D.J. and Patil, R.Y. (2011) Evaluation of antiasthmatic activity of Clitoria ternatea L. roots. Journal of ethnopharmacology. 136(2), 374–376.
TCM Wiki (2012) TCM Wiki. TCM Wiki. [online]. Available from: http://www.tcmwiki.com/ [Accessed March 31, 2015].
Telli, M.L. and Carlson, R.W. (2009) First-Line Chemotherapy for Metastatic Breast Cancer. Clinical Breast Cancer. 9, Supplement 2, S66–S72.

280
Thaiparambil, J.T., Bender, L., Ganesh, T., Kline, E., Patel, P., Liu, Y., Tighiouart, M., Vertino, P.M., Harvey, R.D., Garcia, A. and Marcus, A.I. (2011) Withaferin A inhibits breast cancer invasion and metastasis at sub-cytotoxic doses by inducing vimentin disassembly and serine 56 phosphorylation. International Journal of Cancer. Journal International Du Cancer. 129(11), 2744–2755.
The Arabidopsis Genome Initiative (2000) Analysis of the genome sequence of the flowering plant Arabidopsis thaliana. Nature. 408(6814), 796–815.
The Royal Marsden NHS Trust (2013) A Beginner’s Guide to BRCA1 and BRCA2.
Theesfeld, C.L., Irazoqui, J.E., Bloom, K. and Lew, D.J. (1999) The Role of Actin in Spindle Orientation Changes during the Saccharomyces cerevisiae Cell Cycle. The Journal of Cell Biology. 146(5), 1019–1032.
Théry, M., Jiménez-Dalmaroni, A., Racine, V., Bornens, M. and Jülicher, F. (2007) Experimental and theoretical study of mitotic spindle orientation. Nature. 447(7143),
493–496.
Tilney, L.G., Bryan, J., Bush, D.J., Fujiwara, K., Mooseker, M.S., Murphy, D.B. and Snyder, D.H. (1973) Microtubules: evidence for 13 protofilaments. The Journal of Cell Biology. 59(2 Pt 1), 267–275.
Tinoco, G., Warsch, S., Glück, S., Avancha, K. and Montero, A.J. (2013) Treating breast cancer in the 21st century: emerging biological therapies. Journal of Cancer. 4(2), 117–132.
To, C., Shilton, B.H. and Di Guglielmo, G.M. (2010) Synthetic triterpenoids target the Arp2/3 complex and inhibit branched actin polymerization. The Journal of Biological Chemistry. 285(36), 27944–27957.
Tojkander, S., Gateva, G. and Lappalainen, P. (2012) Actin stress fibers--assembly, dynamics and biological roles. Journal of Cell Science. 125(Pt 8), 1855–1864.
Tomsone, L., Kruma, Z. and Galoburda, R. (2012) Comparison of Different Solvents and Extraction Methods for Isolation of Phenolic Compounds from Horseradish Roots (Armoracia rusticana). World Academy of Science, Engineering and Technology. 6,
1155–1160.
Trendowski, M. (2014) Exploiting the cytoskeletal filaments of neoplastic cells to potentiate a novel therapeutic approach. Biochimica et Biophysica Acta (BBA) - Reviews on Cancer. 1846(2), 599–616.
Trendowski, M., Wong, V., Wellington, K., Hatfield, S. and Fondy, T.P. (2014) Tolerated Doses in Zebrafish of Cytochalasins and Jasplakinolide for Comparison with Tolerated Doses in Mice in the Evaluation of Pre-clinical Activity of Microfilament-directed Agents in Tumor Model Systems. In Vivo. 28(6), 1021–1031.
Tropical Forages (2015) Tropical Forages, An interactive selection tool. Photograph by Graeme Wilson used with permission. Australian Government, Australian Centre for International Agricultural Research. [online]. Available from: http://www.tropicalforages.info/key/Forages/Media/Html/Clitoria_ternatea.htm [Accessed September 15th, 2015].

281
Tsai, Y.-C., Hsu, C.-C., El-Shazly, M., Chiang, S.-Y., Wu, C.-C., Wu, C.-C., Lai, W.-C., Yen, M.-H., Wu, Y.-C. and Chang, F.-R. (2015) Phytochemicals and Estrogen-Receptor Agonists from the Aerial Parts of Liriope platyphylla. Molecules. 20(4), 6844–
6855.
Tseng, Y., Kole, T.P., Lee, J.S.H., Fedorov, E., Almo, S.C., Schafer, B.W. and Wirtz, D. (2005) How actin crosslinking and bundling proteins cooperate to generate an enhanced cell mechanical response. Biochemical and Biophysical Research Communications. 334(1), 183–192.
Tyring, S.K. (2012) Effect of Sinecatechins on HPV-Activated Cell Growth and Induction of Apoptosis. The Journal of Clinical and Aesthetic Dermatology. 5(2), 34–41.
Ulukaya, E., Ozdikicioglu, F., Oral, A.Y. and Demirci, M. (2008) The MTT assay yields a relatively lower result of growth inhibition than the ATP assay depending on the chemotherapeutic drugs tested. Toxicology in Vitro. 22(1), 232–239.
Uma, B., Prabhakar, K. and Rajendran, S. (2009) Phytochemical analysis and antimicrobial activity of Clitoria ternatea Linn against extended spectrum beta lactamase producing enteric and urinary pathogens. Asian Journal of Pharmaceutical and Clinical Research. 2(4), 94–96.
United Nations (1992) Convention on Biological Diversity.
van Larebeke, N., Bracke, M. and Mareel, M. (1992) Simple Method for Quantification of Fast Plasma Membrane Movements. Cytometry. 13, 1–8.
Vandenborre, G., Miersch, O., Hause, B., Smagghe, G., Wasternack, C. and Van Damme, E.J.M. (2009) Spodoptera littoralis-induced lectin expression in tobacco. Plant & Cell Physiology. 50(6), 1142–1155.
Vásquez, L., Palazon, J. and Navarro-Ocaña (2012) The Pentacyclic Triterpenes α, β-amyrins: A Review of Sources and Biological Activities. In V. Rao, ed. Phytochemicals - A Global Perspective of Their Role in Nutrition and Health. InTech.
Verma, S.P. and Goldin, B.R. (1998) Effect of soy‐derived isoflavonoids on the induced growth of MCF‐7 cells by estrogenic environmental chemicals. Nutrition and Cancer. 30(3), 232–239.
Verrill, M. (2009) Chemotherapy for early-stage breast cancer: a brief history. British Journal of Cancer. 101(Suppl 1), S2–S5.
Verweij, J., Clavel, M. and Chevalier, B. (1994) Paclitaxel (TaxolTM) and docetaxel (TaxotereTM): Not simply two of a kind. Annals of Oncology. 5(6), 495–505.
Visvader, J.E. and Stingl, J. (2014) Mammary stem cells and the differentiation hierarchy: current status and perspectives. Genes & Development. 28(11), 1143–1158.
Vukics, V. and Guttman, A. (2010) Structural characterization of flavonoid glycosides by multi-stage mass spectrometry. Mass Spectrometry Reviews. 29(1), 1–16.
Wall, M.E. and Wani, M.C. (1995) Camptothecin and Taxol: Discovery to Clinic—Thirteenth Bruce F. Cain Memorial Award Lecture. Cancer Research. 55(4), 753–760.
282
Wall, M.E., Wani, M.C., Manikumar, G., Taylor, H. and McGivney, R. (1989) Plant Antimutagens, 6. Intricatin and Intricatinol, New Antimutagenic Homoisoflavonoids from Hoffmanosseggia intricata. Journal of Natural Products. 52(4), 774–778.
Wang, Y., Man Gho, W., Chan, F.L., Chen, S. and Leung, L.K. (2008) The red clover (Trifolium pratense) isoflavone biochanin A inhibits aromatase activity and expression. The British Journal of Nutrition. 99(2), 303–310.
Ward, A. (2015) FT Pharmaceuticals Novartis chief backs shake-up in drug pricing. [online]. Available from: http://www.ft.com/cms/s/0/fff835be-0cf2-11e5-a83a-00144feabdc0.html#axzz3cRseQSyt [Accessed June 7, 2015].
Waters (2001) Waters 2966 PDA Detector Operator’s Guide 71500023202, Revision C.
Weaver, B. and Cleveland, D. (2005) Decoding the links between mitosis, cancer and chemotherapy: The mitotic checkpoint, adaptation, and cell death. Cancer cell. 8, 7–12.
Weber, G.F. (2013) Why does cancer therapy lack effective anti-metastasis drugs? Cancer Letters. 328(2), 207–211.
Weber, K., Lazarides, E., Goldman, R.D., Vogel, A. and Pollack, R. (1974) Localization and Distribution of Actin Fibers in Normal, Transformed and Revertant Cells. Cold Spring Harbor Symposia on Quantitative Biology. 39, 363–369.
Weerasinghe, P. and Buja, L.M. (2012) Oncosis: An important non-apoptotic mode of cell death. Experimental and Molecular Pathology. 93(3), 302–308.
Wehland, J., Osborn, M. and Weber, K. (1977) Phalloidin-induced actin polymerization in the cytoplasm of cultured cells interferes with cell locomotion and growth. Proceedings of the National Academy of Sciences of the United States of America. 74(12), 5613–5617.
Wehrle-Haller, B. and Imhof, B.A. (2003) Actin, microtubules and focal adhesion dynamics during cell migration. The International Journal of Biochemistry & Cell Biology. 35(1), 39–50.
Wender, P.A., Kee, J.-M. and Warrington, J.M. (2008) Practical Synthesis of Prostratin, DPP, and Their Analogs, Adjuvant Leads Against Latent HIV. Science. 320(5876),
649–652.
Werner, A., Disanza, A., Reifenberger, N., Habeck, G., Becker, J., Calabrese, M., Urlaub, H., Lorenz, H., Schulman, B., Scita, G. and Melchior, F. (2013) SCFFbxw5 mediates transient degradation of actin remodeler Eps8 to allow proper mitotic progression. Nature cell biology. 15(2), 179–188.
Whipple, R.A., Vitolo, M.I., Boggs, A.E., Charpentier, M.S., Thompson, K. and Martin, S.S. (2013) Parthenolide and costunolide reduce microtentacles and tumor cell attachment by selectively targeting detyrosinated tubulin independent from NF-κB inhibition. Breast cancer research: BCR. 15(5), R83.
WHO (2015) Ambient (outdoor) air pollution in cities database 2014. Public health, environmental and social determinants of health (PHE). [online]. Available from: http://www.who.int/phe/health_topics/outdoorair/databases/cities/en/ [Accessed May 6, 2015].
283
WHO (2007) WHO Country Cooperation Strategy 2006-2011 India Supplement on Traditional Medicine.
WHO (2002) WHO Traditional Medicine Strategy 2002–2005.
Witke, W. (2004) The role of profilin complexes in cell motility and other cellular processes. Trends in Cell Biology. 14(8), 461–469.
Wolfender, J.-L. (2009) HPLC in Natural Product Analysis: The Detection Issue. Planta Medica. 75(7), 719–734.
Woods, C.M., Zhu, J., McQueney, P.A., Bollag, D. and Lazarides, E. (1995) Taxol-induced mitotic block triggers rapid onset of a p53-independent apoptotic pathway. Molecular Medicine. 1(5), 506–526.
World Weather Online (2015) World Weather Online. [online]. Available from: http://www.worldweatheronline.com/ [Accessed May 5, 2015].
Wu, Q., Sahasrabudhe, R.M., Luo, L.Z., Lewis, D.W., Gollin, S.M. and Saunders, W.S. (2010) Deficiency in myosin light-chain phosphorylation causes cytokinesis failure and multipolarity in cancer cells. Oncogene. 29(29), 4183–4193.
Xu, D., Lao, Y., Xu, N., Hu, H., Fu, W., Tan, H., Gu, Y., Song, Z., Cao, P. and Xu, H. (2015) Identification and Characterization of Anticancer Compounds Targeting Apoptosis and Autophagy from Chinese Native Garcinia Species. Planta Medica. 81(01), 79–89.
Xu, L., Lao, L.X., Ge, A., Yu, S., Li, J. and Mansky, P.J. (2007) Chinese Herbal Medicine for Cancer Pain. Integrative Cancer Therapies. 6(3), 208–234.
Xu, Y., Zhang, R. and Fu, H. (2005) Studies on the Optimal Process to Extract Flavonoids from Red-raspberry Fruits. Nature and Science. 3(2), 43–46.
Yam, M.F., Lim, V., Salman, I.M., Ameer, O.Z., Ang, L.F., Rosidah, N., Abdulkarim, M.F., Abdullah, G.Z., Basir, R., Sadikun, A. and Asmawi, M.Z. (2010) HPLC and anti-inflammatory studies of the flavonoid rich chloroform extract fraction of Orthosiphon stamineus leaves. Molecules (Basel, Switzerland). 15(6), 4452–4466.
Yamaguchi, H. and Condeelis, J. (2007) Regulation of the actin cytoskeleton in cancer cell migration and invasion. Biochimica et biophysica acta. 1773(5), 642–652.
Yang, X., Yang, S.-P., Zhang, X., Yu, X.-D., He, Q.-Y. and Wang, B.-C. (2014) Study on the Multi-marker Components Quantitative HPLC Fingerprint of the Compound Chinese Medicine Wuwei Changyanning Granule. Iranian Journal of Pharmaceutical Research : IJPR. 13(4), 1191–1201.
Yarmola, E.G. and Bubb, M.R. (2009) How depolymerization can promote polymerization: the case of actin and profilin. BioEssays. 31(11), 1150–1160.
Yarmola, E.G., Somasundaram, T., Boring, T.A., Spector, I. and Bubb, M.R. (2000) Actin-Latrunculin A Structure and Function Differential Modulation of Actin-Binding Protein Function by Latrunculin A. Journal of Biological Chemistry. 275(36), 28120–
28127.

284
Ye, M., Guo, D., Ye, G. and Huang, C. (2005) Analysis of homoisoflavonoids in Ophiopogon japonicus by HPLC-DAD-ESI-MSn. Journal of the American Society for Mass Spectrometry. 16(2), 234–243.
Yeung, T.K., Germond, C., Chen, X. and Wang, Z. (1999) The Mode of Action of Taxol: Apoptosis at Low Concentration and Necrosis at High Concentration. Biochemical and Biophysical Research Communications. 263(2), 398–404.
Yonemori, K., Katsumata, N., Uno, H., Matsumoto, K., Kouno, T., Tokunaga, S., Yamanaka, Y., Shimizu, C., Ando, M., Takeuchi, M. and Fujiwara, Y. (2005) Efficacy of weekly paclitaxel in patients with docetaxel-resistant metastatic breast cancer. Breast Cancer Research and Treatment. 89(3), 237–241.
Zardavas, D., Irrthum, A., Swanton, C. and Piccart, M. (2015) Clinical management of breast cancer heterogeneity. Nature Reviews Clinical Oncology. advance online publication.
Zava, D.T. and Duwe, G. (1997) Estrogenic and antiproliferative properties of genistein and other flavonoids in human breast cancer cells in vitro. Nutrition and Cancer. 27(1),
31–40.
Zeng, K.-W., Yu, Q., Song, F.-J., Liao, L.-X., Zhao, M.-B., Dong, X., Jiang, Y. and Tu, P.-F. (2015) Deoxysappanone B, a homoisoflavone from the Chinese medicinal plant Caesalpinia sappan L., protects neurons from microglia-mediated inflammatory injuries via inhibition of IκB kinase (IKK)-NF-κB and p38/ERK MAPK pathways. European Journal of Pharmacology. 748, 18–29.
Zhang, H., Shen, P. and Cheng, Y. (2004) Identification and determination of the major constituents in traditional Chinese medicine Si-Wu-Tang by HPLC coupled with DAD and ESI–MS. Journal of Pharmaceutical and Biomedical Analysis. 34(3), 705–713.
Zheng, W., Thorne, N. and McKew, J.C. (2013) Phenotypic screens as a renewed approach for drug discovery. Drug Discovery Today. 18, 1067–1073.
Zieve, G. (1884) Nocodazole and cytochalasin D induce tetraploidy in mammalian cells. American Journal of Physiology - Cell Physiology. 15, C154–C156.
Zigmond, S.H. (2004) Formin-induced nucleation of actin filaments. Current Opinion in Cell Biology. 16(1), 99–105.
Zou, L., Ding, Z. and Roy, P. (2010) Profilin-1 overexpression inhibits proliferation of MDA-MB-231 breast cancer cells partly through p27kip1 upregulation. Journal of Cellular Physiology. 223(3), 623–629.
Zou, L., Hazan, R. and Roy, P. (2009) Profilin-1 overexpression restores adherence junctions in MDA-MB-231 breast cancer cells in R-cadherin dependent manner. Cell motility and the cytoskeleton. 66(12), 1048–1056.
Zou, L., Jaramillo, M., Whaley, D., Wells, A., Panchapakesa, V., Das, T. abd Roy, P. (2007) Profilin-1 is a negative regulator of mammary carcinoma aggressiveness. British Journal of Cancer. 97(10), 1361–1371.
Züst, T., Heichinger, C., Grossniklaus, U., Harrington, R., Kliebenstein, D.J. and Turnbull, L.A. (2012) Natural Enemies Drive Geographic Variation in Plant Defenses. Science. 338(6103), 116–119.

285
Appendix A: Compounds in Indian plants
Table A1: Compounds in Clitoria ternatea reported in the literature.
Class Component Part of plant 1
alcohol hexacosanol R 2
alkaloid caffeine F 3
amino acid glycine R 4
leucine R 4
glutamic acid R 4
arginine R 4
ornithine R 4
histidine R 4
alanine R 4
valine R 4
α-aminobutyric acid R 4
γ-methyleneglutamic acid R 4
γ-aminobutyric acid R 4
aspartic acid R 4
flavonoid astragalin F 5, L
5
biorobin L 5
cyanin (sic) F 5
delphin F 5
delphinidin F 5
genistein L 5
isoquercetin F 5
kaempferol F 6
quercetin F 6
malvidin F 5
myrecitin F 7
myrtillin F 5
nicotiflorin L 5
robinin F 5
15 ternatins F 7
flavonol glycoside delphinidin-3,3,5-triglucoside S 6
isorhamnetin-3-O-glucoside NS 8
kaempferol 3-neohesperidoside F 7, L
6
kaempferol 3-O-neohesperiodoside L 5
kaempferol 3-(2”-rhamnosyl-6”-malonyl)glucoside F 7
kaempferol 3-rutinoside F 7, L
6
kaempferol 3-glucoside F 7, L
6
kaempferol 3-O-(rhamnosylglucoside) (clitorin) S 7, L
6
kaempferol-3-robinobioside-7-rhamnoside NS 6
malvidin 3-glucoside F 5
myricetin 3-(2G-rhamnosylrutinoside) F 7
petunidin 3-O-beta-D-glucopyranoside F 5
quercetin 3-(2G-rhamnosylrutinoside) F 7
quercetin 3-(2”-rhamnosyl-6”-malonyl)glucoside F 7
quercetin 3-neohesperidoside F 7
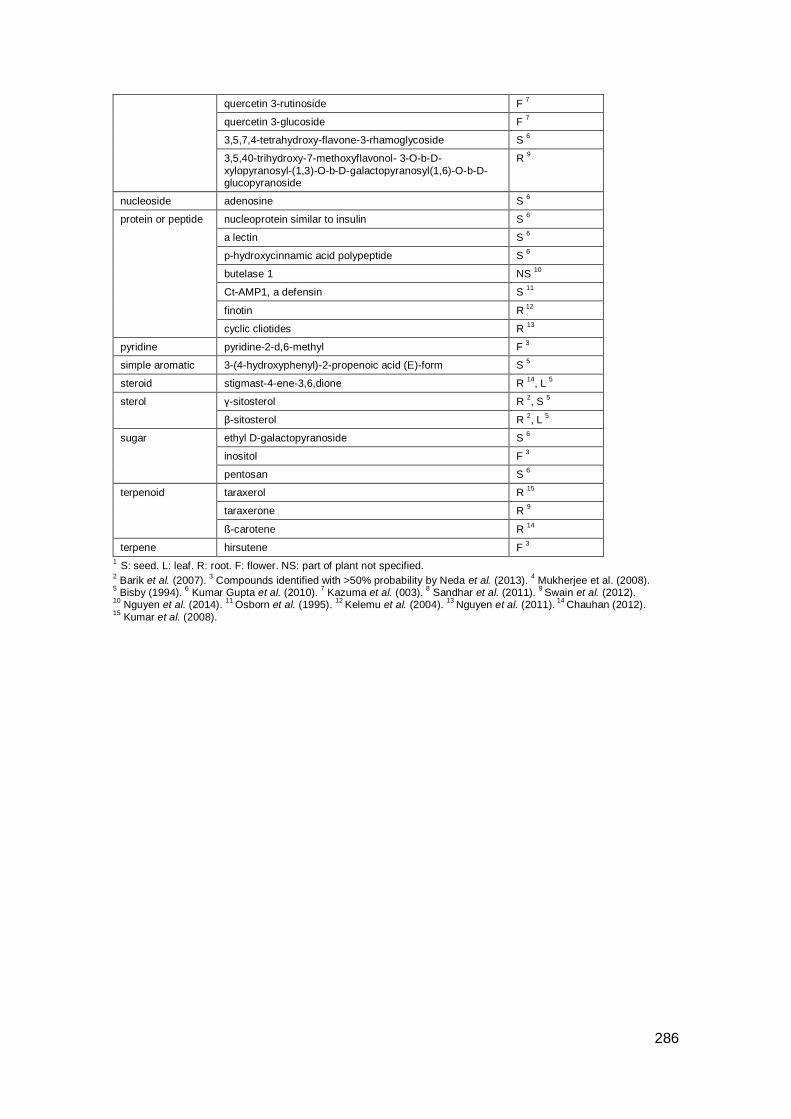
286
quercetin 3-rutinoside F 7
quercetin 3-glucoside F 7
3,5,7,4-tetrahydroxy-flavone-3-rhamoglycoside S 6
3,5,40-trihydroxy-7-methoxyflavonol- 3-O-b-D-
xylopyranosyl-(1,3)-O-b-D-galactopyranosyl(1,6)-O-b-D-glucopyranoside
R 9
nucleoside adenosine S 6
protein or peptide nucleoprotein similar to insulin S 6
a lectin S 6
p-hydroxycinnamic acid polypeptide S 6
butelase 1 NS 10
Ct-AMP1, a defensin S 11
finotin R 12
cyclic cliotides R 13
pyridine pyridine-2-d,6-methyl F 3
simple aromatic 3-(4-hydroxyphenyl)-2-propenoic acid (E)-form S 5
steroid stigmast-4-ene-3,6,dione R 14
, L 5
sterol γ-sitosterol R 2, S
5
β-sitosterol R 2, L
5
sugar ethyl D-galactopyranoside S 6
inositol F 3
pentosan S 6
terpenoid taraxerol R 15
taraxerone R 9
ß-carotene R 14
terpene hirsutene F 3
1 S: seed. L: leaf. R: root. F: flower. NS: part of plant not specified.
2 Barik et al. (2007).
3 Compounds identified with >50% probability by Neda et al. (2013).
4 Mukherjee et al. (2008).
5 Bisby (1994).
6 Kumar Gupta et al. (2010).
7 Kazuma et al. (003).
8 Sandhar et al. (2011).
9 Swain et al. (2012).
10 Nguyen et al. (2014).
11 Osborn et al. (1995).
12 Kelemu et al. (2004).
13 Nguyen et al. (2011).
14 Chauhan (2012).
15 Kumar et al. (2008).
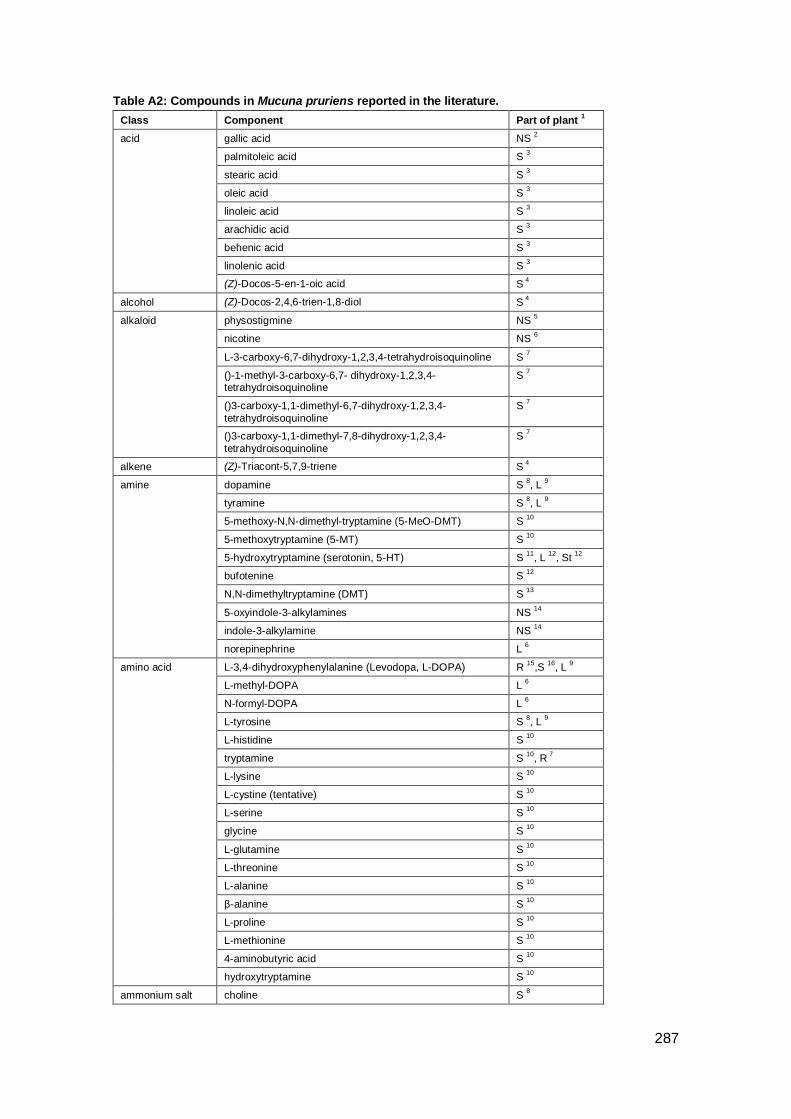
287
Table A2: Compounds in Mucuna pruriens reported in the literature.
Class Component Part of plant 1
acid gallic acid NS 2
palmitoleic acid S 3
stearic acid S 3
oleic acid S 3
linoleic acid S 3
arachidic acid S 3
behenic acid S 3
linolenic acid S 3
(Z)-Docos-5-en-1-oic acid S 4
alcohol (Z)-Docos-2,4,6-trien-1,8-diol S 4
alkaloid physostigmine NS 5
nicotine NS 6
L-3-carboxy-6,7-dihydroxy-1,2,3,4-tetrahydroisoquinoline S 7
()-1-methyl-3-carboxy-6,7- dihydroxy-1,2,3,4-tetrahydroisoquinoline
S 7
()3-carboxy-1,1-dimethyl-6,7-dihydroxy-1,2,3,4-
tetrahydroisoquinoline
S 7
()3-carboxy-1,1-dimethyl-7,8-dihydroxy-1,2,3,4-
tetrahydroisoquinoline
S 7
alkene (Z)-Triacont-5,7,9-triene S 4
amine dopamine S 8, L
9
tyramine S 8, L
9
5-methoxy-N,N-dimethyl-tryptamine (5-MeO-DMT) S 10
5-methoxytryptamine (5-MT) S 10
5-hydroxytryptamine (serotonin, 5-HT) S 11
, L 12
, St 12
bufotenine S 12
N,N-dimethyltryptamine (DMT) S 13
5-oxyindole-3-alkylamines NS 14
indole-3-alkylamine NS 14
norepinephrine L 6
amino acid L-3,4-dihydroxyphenylalanine (Levodopa, L-DOPA) R 15
,S 16
, L 9
L-methyl-DOPA L 6
N-formyl-DOPA L 6
L-tyrosine S 8, L
9
L-histidine S 10
tryptamine S 10
, R 7
L-lysine S 10
L-cystine (tentative) S 10
L-serine S 10
glycine S 10
L-glutamine S 10
L-threonine S 10
L-alanine S 10
β-alanine S 10
L-proline S 10
L-methionine S 10
4-aminobutyric acid S 10
hydroxytryptamine S 10
ammonium salt choline S 8
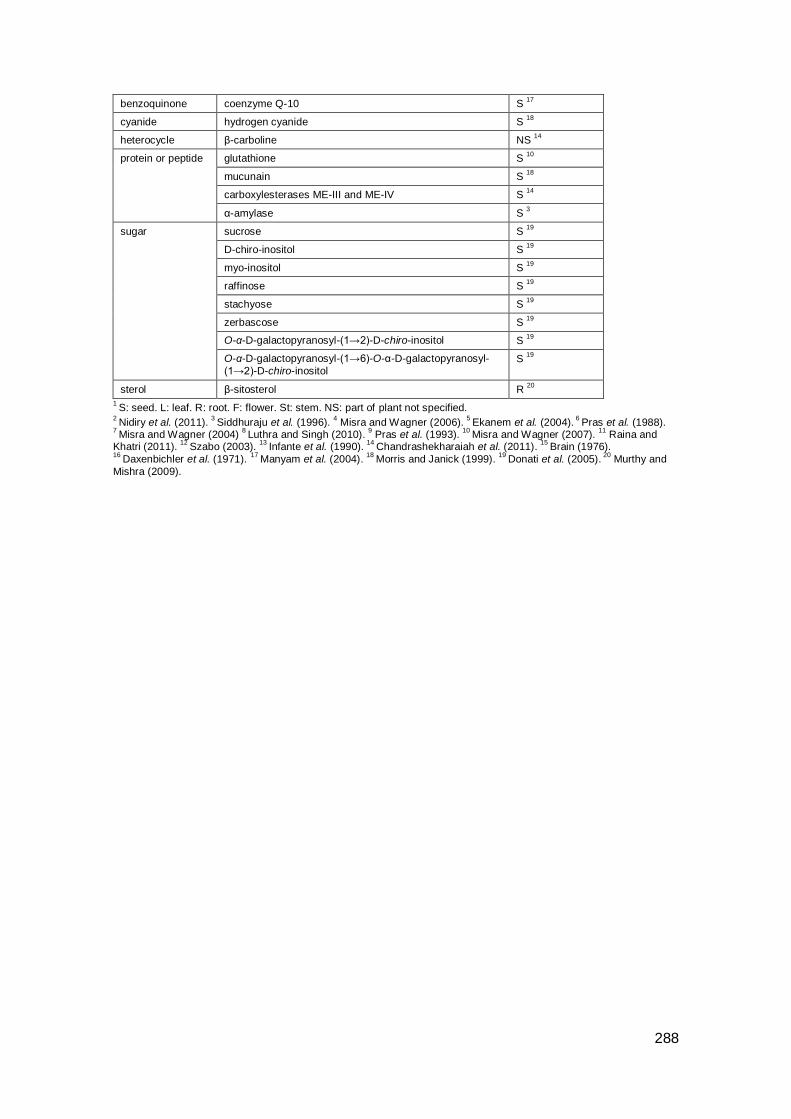
288
benzoquinone coenzyme Q-10 S 17
cyanide hydrogen cyanide S 18
heterocycle β-carboline NS 14
protein or peptide glutathione S 10
mucunain S 18
carboxylesterases ME-III and ME-IV S 14
α-amylase S 3
sugar sucrose S 19
D-chiro-inositol S 19
myo-inositol S 19
raffinose S 19
stachyose S 19
zerbascose S 19
O-α-D-galactopyranosyl-(1→2)-D-chiro-inositol S 19
O-α-D-galactopyranosyl-(1→6)-O-α-D-galactopyranosyl-
(1→2)-D-chiro-inositol S
19
sterol β-sitosterol R 20
1 S: seed. L: leaf. R: root. F: flower. St: stem. NS: part of plant not specified.
2 Nidiry et al. (2011).
3 Siddhuraju et al. (1996).
4 Misra and Wagner (2006).
5 Ekanem et al. (2004).
6 Pras et al. (1988).
7 Misra and Wagner (2004)
8 Luthra and Singh (2010).
9 Pras et al. (1993).
10 Misra and Wagner (2007).
11 Raina and
Khatri (2011). 12
Szabo (2003). 13
Infante et al. (1990). 14
Chandrashekharaiah et al. (2011). 15
Brain (1976). 16
Daxenbichler et al. (1971). 17
Manyam et al. (2004). 18
Morris and Janick (1999). 19
Donati et al. (2005). 20
Murthy and
Mishra (2009).

289
Table A3: Compounds in Cheilocostus speciosus reported in the literature.
Class Component Part of plant 1
acid
octacosanoic acid R2
1-tetradecanol R3
palmitic acid L2
4,7,10,13,16,19-docosahexacnoic acid R3
triacontanoic acid R4
stearic acid L2
oleic acid L2
linoleic acid L2
arachidic acid L2
gadoleic acid L2
behenic acid L2
p-coumaric acid R5
14-oxotricosanoic acid R4
14-oxoheptacosanoic acid R4
15-oxo-octacosanoic acid R4
benzeneacetic acid R3
acrylate methyl 3-(4-hydroxyphenyl)-2E-propenoate R6
alcohol
(+)-beta-costol R3
2,3,3a,4,5,5a,6,7,9a,9b-decahydro-
3,5a-9-trimethyl-7,9a-peroxy ,
5-(ethynyl) nona-1,8-dien-5-ol
R3
3-O-[α-L-rhamnopyranosyl(1→2)-β-D-glucopyranosyl]-26-
O-[ β-D-glucopyranosyl]-22 α-methoxy-(25R) furost-5-en-3β,26-diol
S7
3-O-[α-L-rhamnopyranosyl(1→2)-β-D-glucopyranosyl]-26-
O-[ β-Dglucopyranosyl]-22 α-methoxy-(25R)furost-5-en-3 β,26diol
R7
triacontanol R4
ester
methyl octadecanoate S7
methyl triacontanoate R7
methyl triacontanoate R7
tetracosanyl octadecanoate S7
tetradecyl13-methylpentadecanoate R4
tetradecyl 11-methyltridecanoate R4
5 α -stigmast-9(11)en-3-ol, methyl hexadecanoate S7
α-amyrin stearate R2
lupeol palmitate L8
flavonoid
quercetin F8
quercitrin F9
rutin F9
hydroquinone
glycoside
arbutin R10
ketone
p-methoxybenzophenone R6
1-benzopyran-2-one R10
24-hydroxytriacontan-26-one R7
24-hydroxytriacontan-27-one R7
8-hydroxy triacontane-25-one R7
phenol
α-tocopherol S8
cavacrol (sic) R6
G2-tocopherol S7
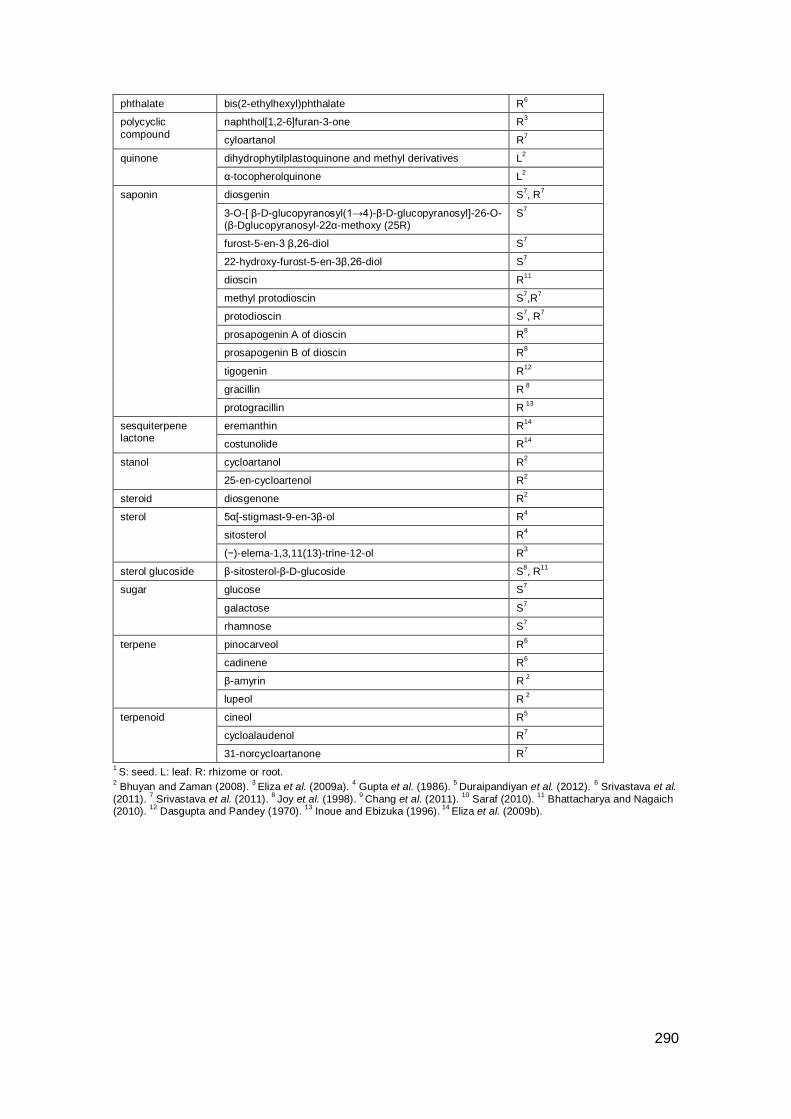
290
phthalate bis(2-ethylhexyl)phthalate R6
polycyclic
compound
naphthol[1,2-6]furan-3-one R3
cyloartanol R7
quinone dihydrophytilplastoquinone and methyl derivatives L2
α-tocopherolquinone L2
saponin
diosgenin S7, R
7
3-O-[ β-D-glucopyranosyl(1→4)-β-D-glucopyranosyl]-26-O-(β-Dglucopyranosyl-22α-methoxy (25R)
S7
furost-5-en-3 β,26-diol S7
22-hydroxy-furost-5-en-3β,26-diol S7
dioscin R11
methyl protodioscin S7,R
7
protodioscin S7, R
7
prosapogenin A of dioscin R8
prosapogenin B of dioscin R8
tigogenin R12
gracillin R 8
protogracillin R 13
sesquiterpene lactone
eremanthin R14
costunolide R14
stanol cycloartanol R2
25-en-cycloartenol R2
steroid diosgenone R2
sterol
5α[-stigmast-9-en-3β-ol R4
sitosterol R4
(−)-elema-1,3,11(13)-trine-12-ol R3
sterol glucoside β-sitosterol-β-D-glucoside S8, R
11
sugar
glucose S7
galactose S7
rhamnose S7
terpene
pinocarveol R6
cadinene R6
β-amyrin R 2
lupeol R 2
terpenoid
cineol R5
cycloalaudenol R7
31-norcycloartanone R7
1 S: seed. L: leaf. R: rhizome or root.
2 Bhuyan and Zaman (2008).
3 Eliza et al. (2009a).
4 Gupta et al. (1986).
5 Duraipandiyan et al. (2012).
6 Srivastava et al.
(2011). 7 Srivastava et al. (2011).
8 Joy et al. (1998).
9 Chang et al. (2011).
10 Saraf (2010).
11 Bhattacharya and Nagaich
(2010). 12
Dasgupta and Pandey (1970). 13
Inoue and Ebizuka (1996). 14
Eliza et al. (2009b).

291
Appendix B: Calculation of treatment dose for fractions after fractionation
of Indian Clitoria and Cheilocostus
The treatment doses after semi-preparative fractionation of Indian Clitoria and
Cheilocostus extract were calculated from estimates of the amount of material placed
on the column (column loading) in HPLC fractionation runs (Table B1).
Table B1: Calculation of approximate dose of Clitoria and Cheilocostus in bioassays based on distribution of material across fractions after semi-preparative fractionation.
Extract Clitoria extract CE(B) Cheilocostus
Assay Single treatment per
fraction after semi-preparative
fractionation on analytical column
Single treatment per
fraction after semi-preparative
fractionation on analytical column
Single treatment per
fraction after semi-preparative
fractionation on analytical column
Fractions in bioassay F1-F10 F1F9, F10.1-F10.6 F1 -F7
Figure presenting results Figure 4-7 Figure 4-8 Figure 4-15
Concentration of crude extract ( µg µL-1
) 90 90 90
Dilution of crude extract 1:10 1:10 1:10
Concentration of diluted sample (µg µL-1
) 9 9 9
No of fractionation runs 6 3 3
Total of injection volumes from
fractionation runs (µL)
120 60 30
Loading (ug) [=injection volume x concentration]
1080 540 270
Number of fractions 10 15 7
Approx material per fraction if evenly
distributed (µg) [=loading /number of fractions]
108 36 38.6
Ethanol resuspension volume (µL) 20 10 10
When fraction resuspended in ethanol,
concentration of stock solution (µg µL-1
)
5.4 3.6 3.86
Amount of stock solution added to 100
µL medium (µL) [A]
1.5 1.5 1.5
Approximate concentration of each
fraction treatment (ng μL-1
)
81 54 58
Equivalent dilution of crude extract 1:1111 1:1667 1:1560
1 Semi-preparative fractionation on analytical column.
As bioactivity was present in the UV absorbent peaks at F5-F6, it was thought that
peak area in HPLC might provide a more accurate measure of the material in the
fraction. Approximate peak area of the 1st major peak (F5 in semi-preparative
fractionation on analytical column; F17 in preparative fractionation) was calculated from
the total absorbances for all injections combined at λmax (323 nm) multiplied by the
fraction eluent volume. The concentration for fraction F17 in preparative fractionation
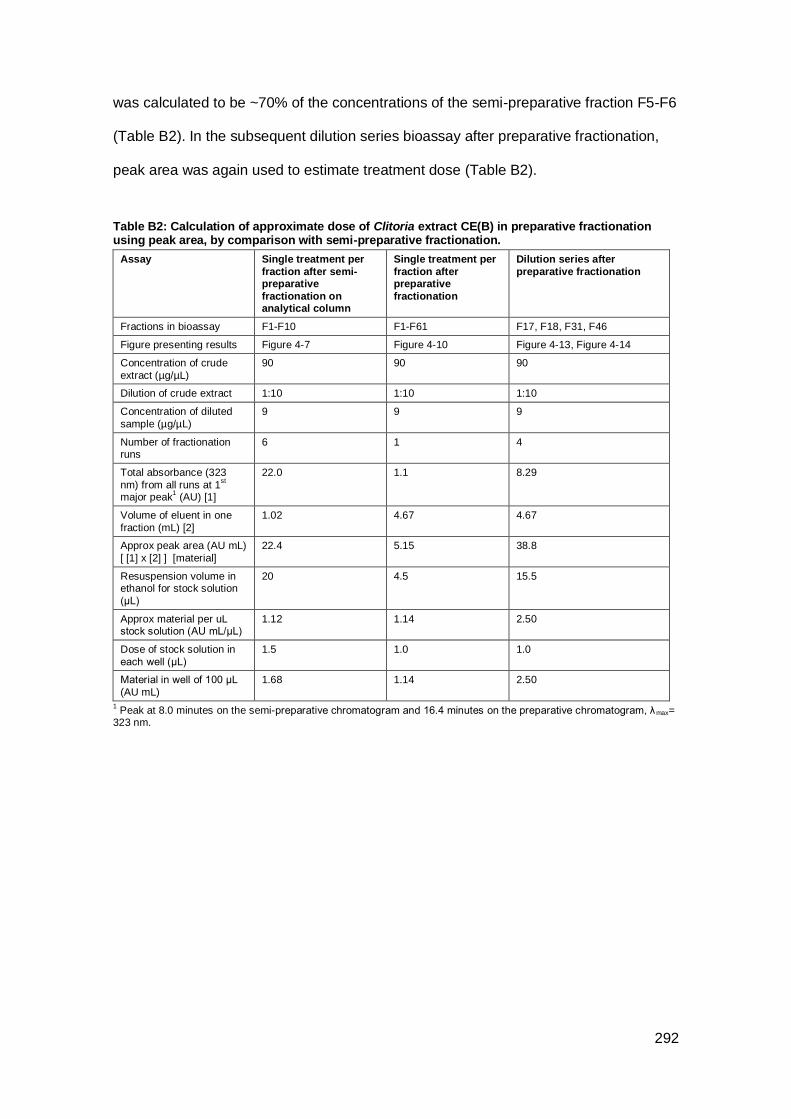
292
was calculated to be ~70% of the concentrations of the semi-preparative fraction F5-F6
(Table B2). In the subsequent dilution series bioassay after preparative fractionation,
peak area was again used to estimate treatment dose (Table B2).
Table B2: Calculation of approximate dose of Clitoria extract CE(B) in preparative fractionation using peak area, by comparison with semi-preparative fractionation.
Assay Single treatment per
fraction after semi-preparative
fractionation on analytical column
Single treatment per
fraction after preparative
fractionation
Dilution series after
preparative fractionation
Fractions in bioassay F1-F10 F1-F61 F17, F18, F31, F46
Figure presenting results Figure 4-7 Figure 4-10 Figure 4-13, Figure 4-14
Concentration of crude
extract (µg/µL)
90 90 90
Dilution of crude extract 1:10 1:10 1:10
Concentration of diluted
sample (µg/µL)
9 9 9
Number of fractionation runs
6 1 4
Total absorbance (323
nm) from all runs at 1st
major peak1 (AU) [1]
22.0 1.1 8.29
Volume of eluent in one
fraction (mL) [2]
1.02 4.67 4.67
Approx peak area (AU mL)
[ [1] x [2] ] [material]
22.4 5.15 38.8
Resuspension volume in ethanol for stock solution
(μL)
20 4.5 15.5
Approx material per uL stock solution (AU mL/μL)
1.12 1.14 2.50
Dose of stock solution in
each well (μL)
1.5 1.0 1.0
Material in well of 100 μL
(AU mL)
1.68 1.14 2.50
1 Peak at 8.0 minutes on the semi-preparative chromatogram and 16.4 minutes on the preparative chromatogram, λmax=
323 nm.
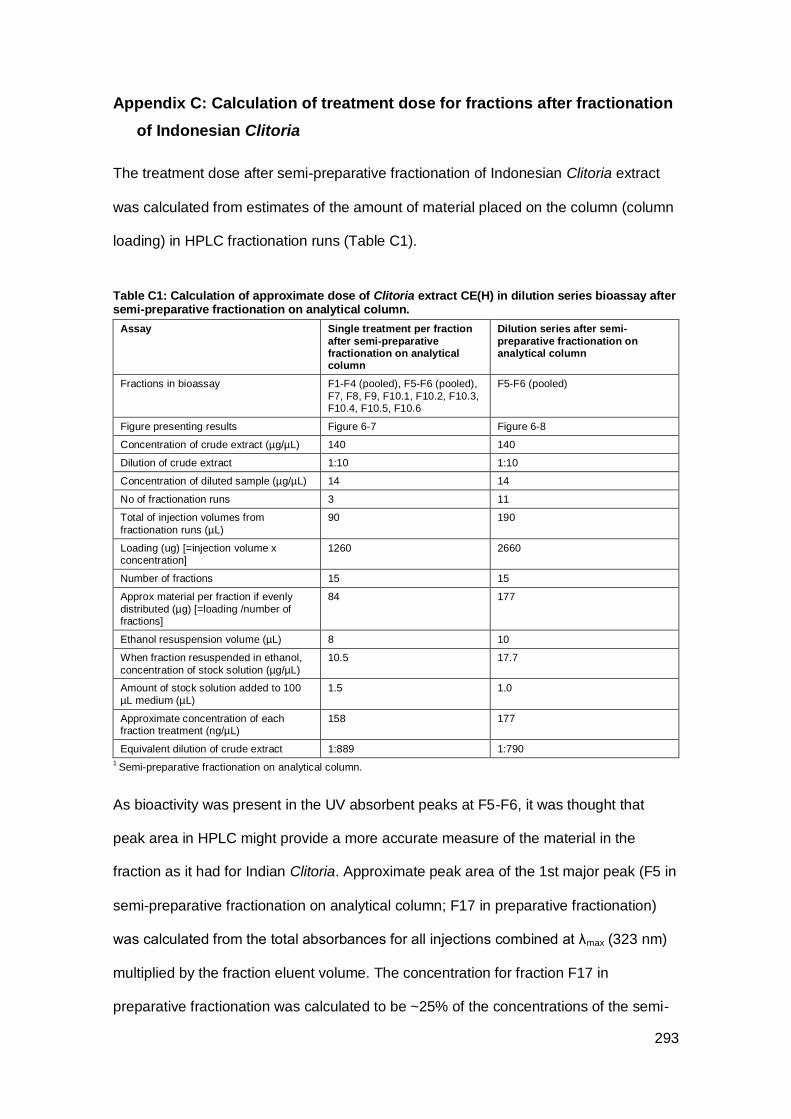
293
Appendix C: Calculation of treatment dose for fractions after fractionation
of Indonesian Clitoria
The treatment dose after semi-preparative fractionation of Indonesian Clitoria extract
was calculated from estimates of the amount of material placed on the column (column
loading) in HPLC fractionation runs (Table C1).
Table C1: Calculation of approximate dose of Clitoria extract CE(H) in dilution series bioassay after semi-preparative fractionation on analytical column.
Assay Single treatment per fraction
after semi-preparative fractionation on analytical column
Dilution series after semi-
preparative fractionation on analytical column
Fractions in bioassay F1-F4 (pooled), F5-F6 (pooled),
F7, F8, F9, F10.1, F10.2, F10.3, F10.4, F10.5, F10.6
F5-F6 (pooled)
Figure presenting results Figure 6-7 Figure 6-8
Concentration of crude extract (µg/µL) 140 140
Dilution of crude extract 1:10 1:10
Concentration of diluted sample (µg/µL) 14 14
No of fractionation runs 3 11
Total of injection volumes from
fractionation runs (µL)
90 190
Loading (ug) [=injection volume x concentration]
1260 2660
Number of fractions 15 15
Approx material per fraction if evenly
distributed (µg) [=loading /number of fractions]
84 177
Ethanol resuspension volume (µL) 8 10
When fraction resuspended in ethanol,
concentration of stock solution (µg/µL)
10.5 17.7
Amount of stock solution added to 100
µL medium (µL)
1.5 1.0
Approximate concentration of each fraction treatment (ng/µL)
158 177
Equivalent dilution of crude extract 1:889 1:790
1 Semi-preparative fractionation on analytical column.
As bioactivity was present in the UV absorbent peaks at F5-F6, it was thought that
peak area in HPLC might provide a more accurate measure of the material in the
fraction as it had for Indian Clitoria. Approximate peak area of the 1st major peak (F5 in
semi-preparative fractionation on analytical column; F17 in preparative fractionation)
was calculated from the total absorbances for all injections combined at λmax (323 nm)
multiplied by the fraction eluent volume. The concentration for fraction F17 in
preparative fractionation was calculated to be ~25% of the concentrations of the semi-
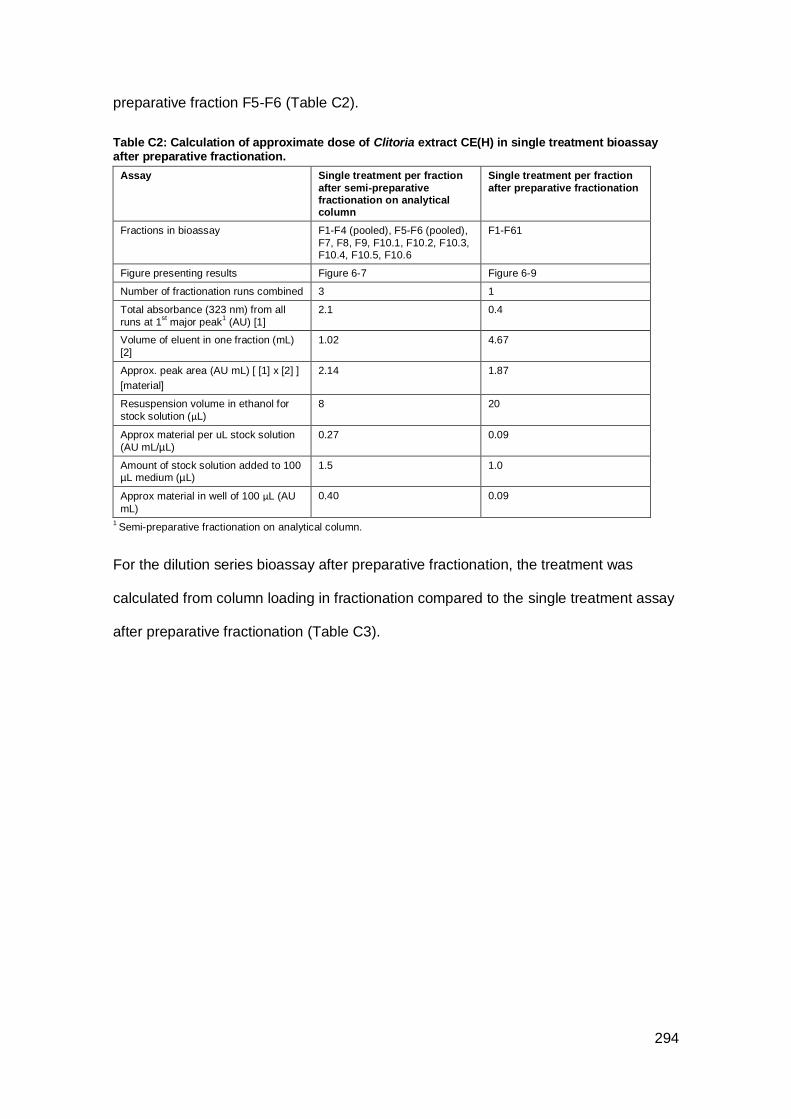
294
preparative fraction F5-F6 (Table C2).
Table C2: Calculation of approximate dose of Clitoria extract CE(H) in single treatment bioassay after preparative fractionation.
Assay Single treatment per fraction
after semi-preparative fractionation on analytical column
Single treatment per fraction
after preparative fractionation
Fractions in bioassay F1-F4 (pooled), F5-F6 (pooled),
F7, F8, F9, F10.1, F10.2, F10.3, F10.4, F10.5, F10.6
F1-F61
Figure presenting results Figure 6-7 Figure 6-9
Number of fractionation runs combined 3
1
Total absorbance (323 nm) from all
runs at 1st major peak
1 (AU) [1]
2.1 0.4
Volume of eluent in one fraction (mL)
[2]
1.02 4.67
Approx. peak area (AU mL) [ [1] x [2] ]
[material]
2.14 1.87
Resuspension volume in ethanol for
stock solution (μL)
8 20
Approx material per uL stock solution
(AU mL/µL)
0.27 0.09
Amount of stock solution added to 100 µL medium (µL)
1.5 1.0
Approx material in well of 100 μL (AU
mL)
0.40 0.09
1 Semi-preparative fractionation on analytical column.
For the dilution series bioassay after preparative fractionation, the treatment was
calculated from column loading in fractionation compared to the single treatment assay
after preparative fractionation (Table C3).
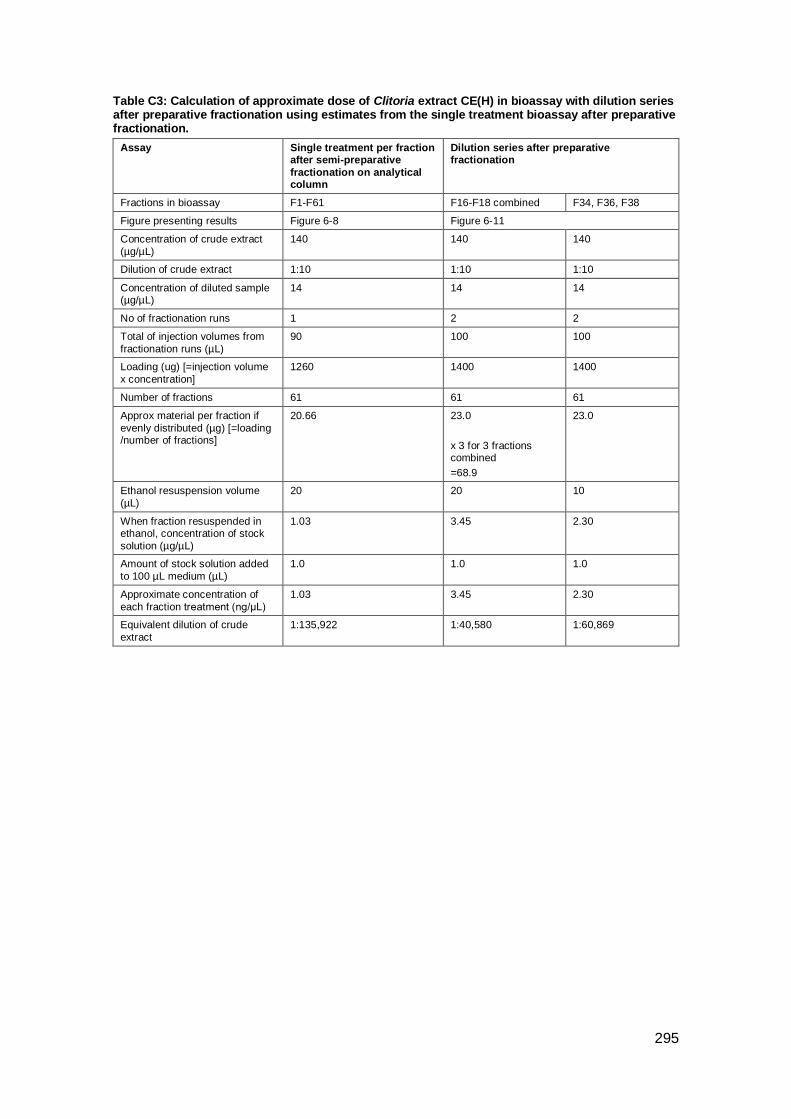
295
Table C3: Calculation of approximate dose of Clitoria extract CE(H) in bioassay with dilution series after preparative fractionation using estimates from the single treatment bioassay after preparative fractionation.
Assay Single treatment per fraction after semi-preparative
fractionation on analytical column
Dilution series after preparative fractionation
Fractions in bioassay F1-F61 F16-F18 combined F34, F36, F38
Figure presenting results Figure 6-8 Figure 6-11
Concentration of crude extract
(µg/µL)
140 140 140
Dilution of crude extract 1:10 1:10 1:10
Concentration of diluted sample (µg/µL)
14 14 14
No of fractionation runs 1 2 2
Total of injection volumes from
fractionation runs (µL)
90 100 100
Loading (ug) [=injection volume
x concentration]
1260 1400 1400
Number of fractions 61 61 61
Approx material per fraction if
evenly distributed (µg) [=loading /number of fractions]
20.66 23.0
x 3 for 3 fractions combined
=68.9
23.0
Ethanol resuspension volume
(µL)
20 20 10
When fraction resuspended in ethanol, concentration of stock
solution (µg/µL)
1.03 3.45 2.30
Amount of stock solution added
to 100 µL medium (µL)
1.0 1.0 1.0
Approximate concentration of
each fraction treatment (ng/μL)
1.03 3.45 2.30
Equivalent dilution of crude
extract
1:135,922 1:40,580 1:60,869
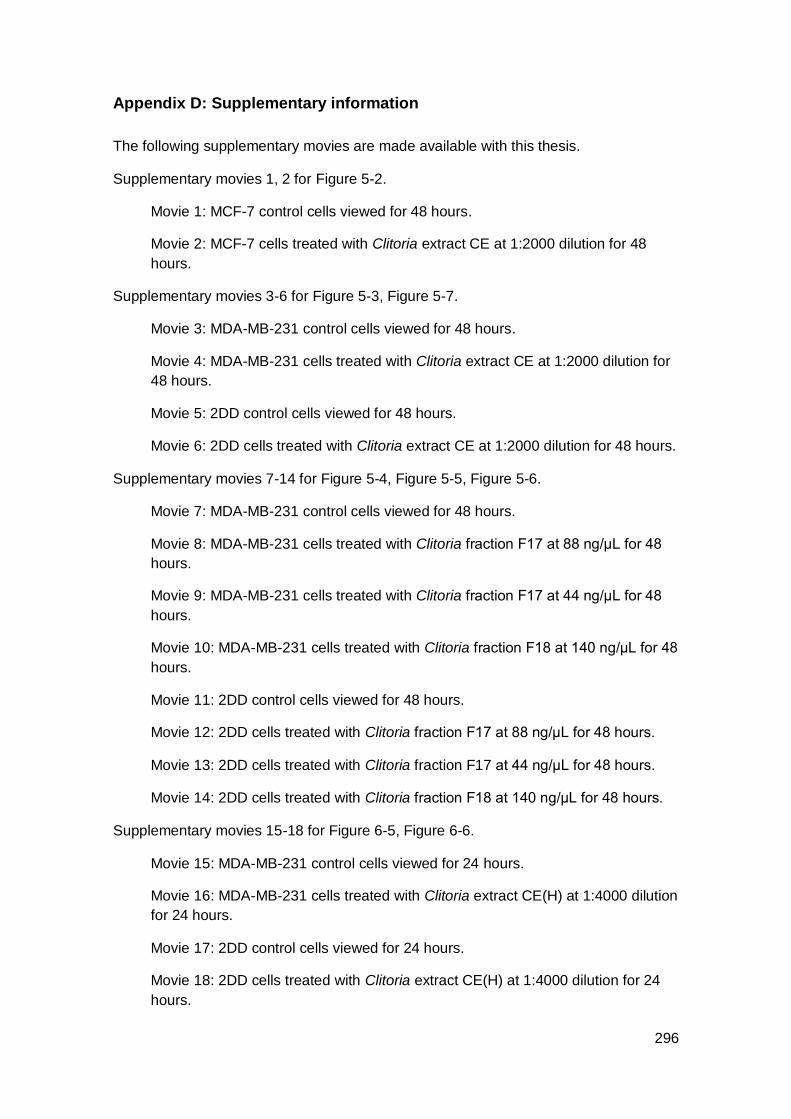
296
Appendix D: Supplementary information
The following supplementary movies are made available with this thesis.
Supplementary movies 1, 2 for Figure 5-2.
Movie 1: MCF-7 control cells viewed for 48 hours.
Movie 2: MCF-7 cells treated with Clitoria extract CE at 1:2000 dilution for 48
hours.
Supplementary movies 3-6 for Figure 5-3, Figure 5-7.
Movie 3: MDA-MB-231 control cells viewed for 48 hours.
Movie 4: MDA-MB-231 cells treated with Clitoria extract CE at 1:2000 dilution for
48 hours.
Movie 5: 2DD control cells viewed for 48 hours.
Movie 6: 2DD cells treated with Clitoria extract CE at 1:2000 dilution for 48 hours.
Supplementary movies 7-14 for Figure 5-4, Figure 5-5, Figure 5-6.
Movie 7: MDA-MB-231 control cells viewed for 48 hours.
Movie 8: MDA-MB-231 cells treated with Clitoria fraction F17 at 88 ng/μL for 48
hours.
Movie 9: MDA-MB-231 cells treated with Clitoria fraction F17 at 44 ng/μL for 48
hours.
Movie 10: MDA-MB-231 cells treated with Clitoria fraction F18 at 140 ng/μL for 48
hours.
Movie 11: 2DD control cells viewed for 48 hours.
Movie 12: 2DD cells treated with Clitoria fraction F17 at 88 ng/μL for 48 hours.
Movie 13: 2DD cells treated with Clitoria fraction F17 at 44 ng/μL for 48 hours.
Movie 14: 2DD cells treated with Clitoria fraction F18 at 140 ng/μL for 48 hours.
Supplementary movies 15-18 for Figure 6-5, Figure 6-6.
Movie 15: MDA-MB-231 control cells viewed for 24 hours.
Movie 16: MDA-MB-231 cells treated with Clitoria extract CE(H) at 1:4000 dilution
for 24 hours.
Movie 17: 2DD control cells viewed for 24 hours.
Movie 18: 2DD cells treated with Clitoria extract CE(H) at 1:4000 dilution for 24
hours.