
ENHANCING CYTOTOXIC T CELL KILLING BY PTEN ... - CORE
154
ENHANCING CYTOTOXIC T CELL KILLING BY PTEN DEPLETION A Dissertation Presented to the Faculty of the Weill Cornell Graduate School of Medical Sciences in Partial Fulfillment of the Requirements for the Degree of Doctor of Philosophy by Benjamin Mathias Whitlock May 2018
-
Upload
khangminh22 -
Category
Documents
-
view
0 -
download
0
Transcript of ENHANCING CYTOTOXIC T CELL KILLING BY PTEN ... - CORE

ENHANCING CYTOTOXIC T CELL KILLING BY PTEN DEPLETION
A Dissertation
Presented to the Faculty of the Weill Cornell Graduate School
of Medical Sciences
in Partial Fulfillment of the Requirements for the Degree of
Doctor of Philosophy
by
Benjamin Mathias Whitlock
May 2018

© 2018 Benjamin Mathias Whitlock

ENHANCING CYTOTOXIC T CELL KILLING BY PTEN DEPLETION
Benjamin Mathias Whitlock, Ph.D.
Cornell University 2018
The immunological synapse (IS) is a dynamic structure formed between
lymphocytes and antigen presenting cells. Previous work has shown that
enhancing PI3K signaling by depletion of the lipid phosphatase PTEN
increases the size of the IS. In addition, cytotoxic T lymphocytes (CTLs)
lacking PTEN exhibit increased killing capacity in vitro. We discovered that
CTL force exertion across the IS is coordinated with the release of the toxic
proteins perforin and granzyme and is correlated with specific lysis of target
cells. We connected these two observations and proposed a model in which T
cells use mechanical force at the IS to alter the tension of the target cell
plasma membrane, increasing target cell susceptibility to perforin. Adoptive T
cell therapies have shown the potential to transform the treatment of some
forms of cancer and are of great interest to clinicians. We hypothesized that
increasing the killing efficacy of the transferred T cells would increase the
effectiveness of these treatments. Accordingly, we assessed the potential of
PTEN deficiency to boost anti-cancer responses in a subcutaneous
transplantable tumor model. We found that depletion of PTEN in CTLs
resulted in reduced tumor rejection relative to wild type control CTLs. Our
work indicated that this decrease in tumor rejection stemmed from reduced
persistence of PTEN deficient CTLs in vivo. We examined the contributions to
persistence from migration, survival, and homeostatic proliferation. We found
that PTEN deficient CTLs have reduced migration and homeostatic
proliferation, which results in diminished persistence in vivo. Our work

highlights the importance of migration and homeostatic proliferation in
developing an anti-tumor response.

iii
ACKNOWLEDGEMENTS During my time in graduate school, I have experienced great personal
and intellectual growth. This would not have been possible without the
immense support and guidance from my advisors Dr. Morgan Huse and Dr.
Grégoire Altan-Bonnet. They have nurtured my intellectual development while
giving me the opportunity to explore my own interests. I am grateful for
everything they have taught me during my graduate studies. I would also like
to thank my committee members Dr. Joseph Sun, Dr. Michael Overholtzer,
and Dr. David Scheinberg for their direction and advice throughout my doctoral
studies.
I would also like to thank all the current and former members of the
Huse and Altan-Bonnet laboratories. From the Altan-Bonnet laboratory, I
would specifically like to thank Dr. Jennifer Oyler-Yaniv, Dr. Alon Oyler-Yaniv,
Dr. Robert Vogel, Dr. Guillaume Voisinne, and Carly Ziegler. From the Huse
laboratory, I would like to thank Niels Bantilan, Dr. Thinh Nguyen Duc, Dr. Xin
Liu, Dr. Roshni Basu, Dr. Audrey Le Floc’h, Dr. Anne Chauveau, Dr.
Jacquelyn Brown, Miguel Francisco M. de Jesus, Dr. Tyler El Rayes, Christina
Firl, Dr. Maria Tello Lafoz, Elisa Sanchez, Brian Santich, Dr. Fella Tamzalit,
Diana Tran, Mitchell Wang, and Dr. Minggang Zhang. I would also like to
thank the laboratories of Drs. Andrea Schietinger, Ming Li, and Joseph Sun for
sharing equipment, reagents, and ideas. I would also like to thank our
collaborators Weiyang “Susie” Jin and Dr. Lance Kam of Columbia University.
It has been a pleasure working and learning alongside all of you for the past
seven years.

iv
I have made many friends in and out of the laboratory during my time in
New York and I would like to thank all of them for their constant support. My
schedule has been difficult and sometimes unpredictable but they have
nevertheless been understanding. I could not have completed this without
them. I would like to thank my brother Samuel Moore, my mother Penelope
Moore, my father David Whitlock, my aunt Dr. Nicola Moore, and my
grandmother Dr. Sally Falk Moore for their love, support, and encouragement.
I would also like to thank Dr. Alison Thaler for her endless support.

v
TABLE OF CONTENTS
ACKNOWLEDGEMENTS .................................................... iii LIST OF FIGURES .............................................................. vii LIST OF ABBREVIATIONS ............................................... viii CHAPTER 1: Introduction ................................................... 1
1.1. Innate and adaptive immunity ................................................. 1 1.2. T cells ........................................................................................ 2
1.2.1. T cell signaling ...................................................................... 3 1.2.2. Immunological synapse ........................................................ 6 1.2.3. T cell motility ......................................................................... 8 1.2.4. T cell migration ..................................................................... 8 1.2.5. Apoptosis ............................................................................ 12 1.2.6. Lymphocyte cytotoxicity ..................................................... 14 1.2.7. Mechanobiology of T cell activation ................................... 18
1.3. Immune system and cancer .................................................. 19 1.4. Cancer Immunotherapies ...................................................... 21
1.4.1. Checkpoint blockade .......................................................... 21 1.4.2. Adoptive cell therapies ....................................................... 23
1.5. Conclusion .............................................................................. 25 CHAPTER 2: Cytotoxic T Cells Use Mechanical Force to Potentiate Target Cell Killing ............................................ 26
2.1. Introduction ............................................................................ 26 2.2. Results .................................................................................... 28
2.2.1. Cytotoxicity Correlates with Synaptic Force Exertion ......... 28 2.2.2. PI3K signaling Accelerates Perforin Pore Formation ......... 43 2.2.3. Cell Tension Potentiates Target Cell Lysis ......................... 44 2.2.4. Synaptic Force Exertion is Coordinated with Degranulation ..................................................................... 58
2.3. Discussion .............................................................................. 68 2.4. Materials and Methods .......................................................... 72
2.4.1. Mice .................................................................................... 72 2.4.2. Cell culture and transductions ............................................ 72 2.4.3. Pillar studies ....................................................................... 73 2.4.4. Micropillar deflection analysis ............................................. 73 2.4.5. Cytotoxicity assays ............................................................. 74 2.4.6. Perforin pore formation in microwells ................................. 75 2.4.7. Micropipette preparation and calibration ............................ 75 2.4.8. Micropipette-Based Force Measurements ......................... 76 2.4.9. Cellular perforation assay ................................................... 77 2.4.10. Perforin purification and fibronectin coating for perforation assay ......................................................... 78

vi
2.4.11. Lytic granule polarization .................................................. 78 2.4.12. Immunoblot ....................................................................... 79 2.4.13. Ca2+ imaging ..................................................................... 79
CHAPTER 3: Insights into Adoptive Cell Therapies from Modulating PI3K in a Transplantable Melanoma Model . 81
3.1. Introduction ............................................................................ 81 3.2. Results .................................................................................... 82
3.2.1. PTEN depletion increases cytotoxicity ............................... 82 3.2.2. PTEN depletion reduces anti-tumor effect ......................... 82 3.2.3. PTEN deficient T cells fail to persist in vivo ........................ 84 3.2.4. Persistence defect not due to shRNA specificity ................ 87 3.2.5. PTEN deficient T cells have a defect in migration .............. 89 3.2.6. PTEN deficient T cells have reduced expression of trafficking receptors ........................................................ 90 3.2.7. PTEN deficient T cells have increased cell survival in vitro ................................................................................. 92 3.2.8. Enhancing survival of PTEN deficient T cells does not rescue persistence in vivo ............................................ 98 3.2.9. PTEN deficient T cells have defect in homeostatic
proliferation ....................................................................... 101 3.2.10. PTEN deficient T cells experience mild proliferation defect in
vitro ................................................................................... 105 3.3. Discussion ............................................................................ 108 3.4. Materials and methods ........................................................ 113
3.4.1. Mice .................................................................................. 113 3.4.2. In vivo tumor experiments ................................................ 113 3.4.3. Lymphocyte isolation from tissues ................................... 113 3.4.4. Flow cytometry and staining ............................................. 114 3.4.5. Cloning ............................................................................. 114 3.4.6. Cell culture and transductions .......................................... 116 3.4.7. Immunoblot ....................................................................... 117 3.4.8. Nutrient depletion survival experiments ........................... 118 3.4.9. In vitro killing assays ........................................................ 118 3.4.10. RNA isolation and RT-PCR ............................................ 118
CHAPTER 4: Concluding remarks ................................. 120 BIBLIOGRAPHY ............................................................... 125

vii
LIST OF FIGURES Figure 1.1 Cartoon of the PI3K signaling pathway 5 Figure 1.2 Cartoon of the IS between a T cell and an APC 6 Figure 1.3 T cell migration on HEVs 9 Figure 1.4 Cartoon of Fas induced apoptosis 13 Figure 1.5 Cartoon of perforin and granzyme release and entry into target cells 16 Figure 2.1 shRNA-Mediated Suppression of Dock2 and PTEN 29 Figure 2.2 PTEN and Dock2 Are Not Required for Lytic Granule Polarization and Ca2+ Flux 30 Figure 2.3 PI3K Signaling Controls Force Exertion Perpendicular to the IS 34 Figure 2.4 PI3K Signaling and NMII Control Force Exertion Parallel to the IS 37 Figure 2.5 Antigen-Induced Forces on PDMS Micropillar Arrays 40 Figure 2.6 PTEN Deficiency Enhances Perforin Pore Formation 45 Figure 2.7 Hydrogel Stiffness Controls Cell Morphology 49 Figure 2.8 Cell Tension Promotes Perforin Pore Formation and CTL-Mediated Killing 50 Figure 2.9 Cell Tension Modulates Perforin Pore Formation 54 Figure 2.10 Matrix Stiffness Does Not Alter TCR-Induced Degranulation 57 Figure 2.11 Membrane Tension Potentiates Perforin Pore Formation 59 Figure 2.12 Degranulation Is Spatiotemporally Correlated with Force Exertion at the IS 62 Figure 2.13 Membrane Tension of B16 Target Cells 67 Figure 3.1 PTEN depletion enhancing cytotoxicity 83 Figure 3.2 PTEN deletion results in reduced anti-tumor effect in vivo 84 Figure 3.3 PTEN depleted T cells have reduced persistence in vivo 85 Figure 3.4 Loss of PTEN depleted cells is not due to shRNA 88 Figure 3.5 PTEN deficient cells have migration defect 90 Figure 3.6 Enhancing PI3K signaling disrupts expression of key receptors 91 Figure 3.7 PTEN Deficient cells have similar or increased survival relative to control T cells 93 Figure 3.8 Increasing survival of PTEN deficient cells has modest effect on persistence 99 Figure 3.9 PTEN deficient CTLs have defect in proliferation 102 Figure 3.10 PTEN deficient CTLs have proliferation defect in vitro 106

viii
LIST OF ABBREVIATIONS ACT adoptive cell therapies AFM atomic force microscope AKT protein kinase B APC antigen presenting cell Arp2/3 actin related protein-2/-3 complex Bak BCL2 Antagonist/Killer 1 Bax BCL2 Associated X Bcl-2 B-cell lymphoma 2 BID BH3 interacting-domain death agonist Ca2+ calcium CAR chimeric antigen receptor CCL19 C-C motif chemokine ligand 19 CCL21 C-C motif chemokine ligand 21 CCR7 C-C chemokine receptor type 7 CD62L L-selectin COG center of gravity cSMAC central supramolecular activation cluster CTLA-4 cytotoxic T-lymphocyte-associated protein 4 CTLs cytotoxic T lymphocytes DAG diacylglycerol DD death domain Dock2 dedicator of cytokinesis 2 DPP distance to displaced pillar dSMAC distal supramolecular activation cluster ERK mitogen-activated protein kinase F-actin filamentous actin FADD Fas associated death domain FasL Fas ligand FOXO1 forkhead box protein O1 GEF guanine nucleotide exchange factor GFP green fluorescent protein HBSS Hank’s balanced salt solution HER-2 human epidermal growth factor receptor 2 HEVs high endothelial venules i.v. intravenous ICAM-1 intercellular adhesion molecule 1 IFNγ interferon gamma IL-2 interleukin-2 IL-7 interleukin-7

ix
IL-7Rα interleukin-7 receptor alpha IL-15 interleukin-15 IP3 inositol 1,4,5-trisphosphate IS immunological synapse ITAMs immunoreceptor tyrosine-based activation motif KLF2 Krüppel-like Factor 2 LAG-3 lymphocyte-activation gene 3 LAT linker for activation of T cells Lck lymphocyte-specific protein tyrosine kinase LCMV lymphocytic choriomeningitis LDH lactate dehydrogenase LG lytic granules LPS lipopolysaccharides MCA methylcholanthrene MEK mitogen-activated protein kinase kinase MHC major histocompatibility complex MMP matrix metalloproteinase mTOR mammalian target of rapamycin mTORC1 mammalian target of rapamycin complex 1 mTORC2 mammalian target of rapamycin complex 2 NFAT muclear factor of activated T-cells NFκB nuclear factor kappa-light-chain-enhancer of activated B cells NK natural killer NMII nonmuscle myosin II Nur77 nerve growth factor IB OT-1 TCR specific for the OVA peptide OVA ovalbumin257–264 peptide PBMC peripheral blood mononuclear cell PD-1 programmed cell death protein 1 PD-L1 programmed death-ligand 1 PDK1 phosphoinositide-dependent kinase-1 PDMS polydimethylsiloxane pHluorin pH-sensitive GFP PI propidium iodide PI3K phosphoinositide 3-kinase PIP2 phosphatidylinositol-4,5-bisphosphate PIP3 phosphatidylinositol-3,4,5-trisphosphate PKCθ protein kinase C theta PLCγ phospholipase gamma PNAd peripheral node addressin poly(I:C) Polyinosinic:polycytidylic acid pSMAC peripheral supramolecular activation cluster

x
PTEN phosphatase and tensin homolog RAG Recombination-activating gene RAG-/- γC
-/- RAG and common gamma chain double knockout RASGRP1 RAS guanyl-releasing protein 1 s.c. subcutaneously S1P sphingosine-1-phosphate S1PR1 sphingosine-1-phosphate receptor 1 shDock2 shRNA targeting Dock2 shMyH9 shRNA targeting the myosin heavy chain MyH9 shNT nontargeting shRNA shPTEN shRNA targeting PTEN shRNA short hairpin RNA SLP76 lymphocyte cytosolic protein 2 tBID truncated BID TCR T cell receptor TIM-3 hepatitis A virus cellular receptor 2 TLR3 Toll like receptor 3 TNFα tumor necrosis factor alpha Tregs regulatory T cells VISTA V-domain Ig suppressor of T cell activation WASP Wiskott–Aldrich syndrome protein WAVE2 Wiskott-Aldrich syndrome protein family member 2 WT wild-type ZAP70 zeta-chain-associated protein kinase 70

1
CHAPTER 1: INTRODUCTION 1.1. Innate and adaptive immunity
Animals have evolved an immune system to protect against foreign
pathogens. The immune system is divided into two branches, which work
together to establish host immunity. The first arm of the immune system is the
innate immune system, which provides an initial defense against pathogens
and can be triggered very quickly but is limited in the scope of molecules it
recognizes. The second arm is the adaptive immune system, which is slower
to establish a response but can tailor that response to a specific antigen.
Innate immune cells have pattern recognition receptors that identify foreign
cells and proteins. These cells are important for presenting foreign molecules
to cells in the adaptive immune system.
The adaptive immune system is made up of B cells and T cells. The
primary role of B cells is to produce antibodies. These antibodies bind to
molecules and identify them as foreign to other immune cells. There are two
main subtypes of T cells, CD4+ and CD8+ T cells, which are named for the co-
receptor the cells express. These subtypes have very distinct roles in driving
host immunity. CD4+ T cells differentiate into T-helper cells and CD8+ T cells
differentiate into cytotoxic T lymphocytes (CTLs). CTLs are capable of killing
malignant or infected cells in addition to producing inflammatory cytokines
such as interleukin-2 (IL-2), interferon gamma (IFNγ), and tumor necrosis
factor alpha (TNFα)1.

2
1.2. T cells T cells are defined by expression of the T cell receptor (TCR). The TCR
is a multisubunit receptor consisting of α-, β-, γ-, δ-, ε-, and ζ-chains. These
subunits form a complex that recognizes an antigenic peptide in the major
histocompatibility complex (MHC) on an antigen-presenting cell (APC). There
are two categories of MHC molecules, which are called class I and class II
(referred to as MHC I and MHC II, respectively). The specificity of an αβ T cell
for MHC I or MHC II is determined by the co-receptor it expresses. CD8+ T
cells recognize peptides presented by MHC I and CD4+ T cells recognize
peptides presented by MHC II.
T cell development is a tightly regulated process that has been carefully
delineated. T cells differentiate from thymic progenitors that originate in the
bone marrow2. In the thymus, these cells go through several stages of
differentiation to become T cells. T cells undergo programmed rearrangement
of the β chain of the TCR to increase diversity of the TCRs2. During this
process, some TCRs become non-functional and unable to recognize pMHC
complexes. These cells undergo programmed cell death during beta
selection2. Next, cells undergo rearrangements of their α chain and
subsequent positive selection2. The surviving cells then go through negative
selection. This removes T cells with receptors that bind with high affinity to
MHC complexes containing host peptides2. Negative selection ensures that T
cells are removed if they express a TCR that would generate auto-immunity.
This process is not completely efficient and some self-reactive T cells survive
negative selection. Some of these T cells will differentiate into regulatory T
cells (Tregs), which play a crucial role in immune tolerance3. After all of these

3
checkpoints, naïve T cells leave the thymus where they begin the process of
surveying the host looking for infected or malignant cells.
1.2.1. T cell signaling Following the formation of a TCR-pMHC interaction and recognition of
an antigenic peptide, many downstream signaling pathways are activated.
These signaling events trigger rapid changes in T cell morphology and
function. TCR signaling begins with lymphocyte-specific protein tyrosine
kinase (Lck), a Src family kinase, phosphorylating the immunoreceptor
tyrosine-based activation motifs (ITAMs) on the TCR4. ITAMs are signaling
motifs contained within the cytoplasmic tails of the CD3 γ-, δ-, ε-, and ζ-
chains5. Phosphorylated ITAMs recruit the tyrosine kinase zeta-chain-
associated protein kinase 70 (ZAP70) to the TCR, where it phosphorylates the
scaffolding proteins linker for activation of T cells (LAT) and lymphocyte
cytosolic protein 2 (SLP76), inducing them to form a complex. This LAT-
SLP76 complex then recruits various downstream signaling proteins including
phospholipase gamma (PLCγ), which produces diacylglycerol (DAG) and
inositol 1,4,5-trisphosphate (IP3). IP3 signaling drives an increase in the level
of intracellular calcium (Ca2+), which results in nuclear factor of activated T
cells (NFAT) localizing to the nucleus. DAG, in turn allows RAS guanyl-
releasing protein 1 (RASGRP1) to be activated leading to the activation of Ras
and downstream signaling proteins including mitogen-activated protein kinase
(ERK) and mitogen-activated protein kinase kinase (MEK). DAG also induces
nuclear factor kappa-light-chain-enhancer of activated B cells (NFκB) signaling
through protein kinase C theta (PKCθ)6. Following these stages of activation,
T cells upregulate activation markers such as CD69 and secrete cytokines

4
including but not limited to IL-2, IFNγ, and TNFα. These pro-inflammatory
cytokines help coordinate an immune response among many cell types.
Activation of RAS also leads to the activation of the
phosphatidylinositol-4,5-bisphosphate 3-kinase (PI3K) signaling pathway
(Figure 1.1). In the first part of the pathway, PI3K phosphorylates the lipid
phosphatidylinositol-4,5-bisphosphate (PIP2), generating phosphatidylinositol-
3,4,5-trisphosphate (PIP3)7. Phosphatase and tensin homolog (PTEN)
attenuates PI3K signaling by dephosphorylating PIP3 to yield PIP2. PIP3 binds
to and recruits protein kinase B (AKT), localizing it to the plasma membrane
and allowing it to be phosphorylated by the regulatory Ser/Thr kinase
phosphoinositide-dependent kinase-1 (PDK1). Once phosphorylated, AKT
activates a number of pathways controlling cell growth and proliferation. In
another arm of the PI3K signaling pathway, PIP3 recruits the guanine
nucleotide exchange factor (GEF) dedicator of cytokinesis 2 (Dock2) to the
plasma membrane8. This branch of the pathway will be discussed below.
AKT signaling acts through a number of downstream proteins including
the mammalian target of rapamycin (mTOR)7. mTOR is a complex of several
proteins and has two main components named complex 1 and complex 2
(mTORC1 and mTORC2 respectively). mTORC2 has been found to activate
AKT, which in turn signals through mTORC19. These complexes play an
important role in nutrient sensing and cell growth. AKT also regulates forkhead
box protein O1 (FOXO1), which is responsible for controlling expression
interleukin-7 receptor alpha (IL-7Rα)10,11. An increase in AKT signaling
increases mTORC1 and reduces FOXO1 signaling, which reduces expression
of the transcription factor Krüppel-like Factor 2 (KLF2). KLF2 is responsible for

5
Figure 1.1 Cartoon of the PI3K signaling pathway T cell activation through TCR and LFA-1 results in the phosphorylation of PIP2 to PIP3 by PI3K. PIP3 accumulation results in several down stream signaling processes. PIP3 recruits AKT to the plasma membrane, which results in its phosphorylation by PDK1. mTORC2 signals through AKT and increases AKT signaling. AKT phosphorylates FOXO1, which prevents it from localizing to the nucleus and reduces expression of IL-7Rα. AKT also activates mTORC1 and the scaffold Raptor. Increased mTORC1 signaling has been shown to reduce KLF2 expression, which reduces expression of S1PR1, CCR7, and CD62L. PIP3 also recruits Dock2 and its scaffold Elmo to the plasma membrane. Elmo allows Rac/Rho small GTPases to bind and signals through WAVE complex to Arp2/3 to control actin growth.
mTORC1'Raptor'
PIP3'
AKT'
mTORC2'Rictor'
PDK1'Dock2'Elmo'
Rho/Rac'
CD62L'
FOXO1'
IL?7Rα'KLF2'
S1PR1' CCR7'
PIP2'
PI3K'
TCR'+'LFA?1'
PTEN'
WAVE'
Arp2/3'

6
regulating the expression C-C chemokine receptor type 7 (CCR7), L-selectin
(CD62L), and sphingosine-1-phosphate receptor 1 (S1PR1), which are
important regulators of T cell trafficking that will be discussed below.
1.2.2. Immunological synapse Upon binding of the TCR to pMHC on an APC, T cells undergo
dramatic changes in their cytoskeleton creating a structurally stereotyped
interface with the APC. This interaction, called the immunological synapse (IS)
is an annular structure that resembles a “bulls-eye” with a ring of actin making
up the perimeter (Figure 1.2). The IS has been shown to be important for the
targeted release of some cytokines and lytic granules (LG)13,14.
Following TCR activation, actin polymerization occurs rapidly forming
the IS. Previous work has demonstrated that the formation of this annular actin
structure depends on PIP3 accumulation following TCR activation8. PIP3
recruits the GEF Dock2, which induces the activation of the Rho family
Figure 1.2 Cartoon of the IS between a T cell and an APC (A) A diagram of a T cell forming a conjugate with an APC. The IS is depicted as a “bulls-eye” structure on the interface. (B) The IS is divided into the dSMAC, pSMAC, and cSMAC. During the formation and maturation of the IS, various proteins are segregated into the different regions. This figure was adapted from Yu, Y. et al.12.

7
GTPase Rac. Activated Rac then signals through the Wiskott-Aldrich
syndrome protein family member 2 (WAVE2) to facilitate lamellipodial
growth8,15. Rac does not interact with WAVE2 directly but interacts with the
WAVE complex containing WAVE2, Sra, Nap, and Brk115. WAVE2 then
promotes lamellipodial growth through the Arp2/3 protein complex. Arp2/3
initiates the formation of y-branches of actin at the lamellipodia16,17. The
observation that PIP3 controls actin dynamics by signaling through Dock2 and
Rho/Rac to Arp2/3 does not rule out the possibility that PIP3 could signal
through other molecules that have not been identified.
Segregation of proteins into different regions of the IS called the central,
peripheral, and distal supramolecular activation cluster (cSMAC, pSMAC,
and dSMAC respectively) has been observed in mature T cell-APC
synapses18. The cSMAC, which is located at the center of the IS, contains the
TCR, CD28, and PKCθ18,19. The pSMAC, which surrounds the cSMAC,
contains lymphocyte function-associated antigen 1 (LFA-1) and Talin18. CD45
is initially localized to the pSMAC, but is then gradually excluded based on the
size of its large ectodomain20. The dSMAC surrounds the pSMAC in the
mature IS and contains the F-actin ring and CD45. CD43 was also found to
localize to the dSMAC21. Most of the work characterizing the migration of
proteins to the different regions of the IS has been performed on lipid bilayers
containing stimulatory ligands. In these experiments, T cells form a single IS
that resembles a “bulls-eye.” However, the direct implications of this work are
unclear as synapses T cell-APC conjugates have been shown to form multiple
regions resembling the cSMAC19,22. Thus, lipid bilayers are not able to fully
recapitulate a proper T cell-APC conjugate. More research utilizing high-

8
resolution microscopy is needed to examine the precise structure of the T cell-
APC IS and to understand its function.
1.2.3. T cell motility Actin plays a very important role in T cell motility. It allows T cells to
migrate through lymphoid organs and the periphery. As T cell move, they
develop the classical “hand-mirror” morphology with a leading edge or
lamellipodia, consisting of highly branched actin23. Lymphocyte motility is
driven by the formation of a branched network of actin through the actin
related protein-2/-3 complex (Arp2/3), which facilitates actin nucleation
events17. These nucleation events occur at 70° making a y-shape branch17.
This process is highly regulated by members of the WAVE and Wiskott–
Aldrich syndrome protein (WASP) protein families, which were previously
described. The lamellipodial protrusions containing branched actin are also
involved in scanning the environment for antigens. Following antigen
recognition, the motility of the T cell is reduced and the migration of T cells is
halted. This stop signal has been found to be calcium dependent24.
1.2.4. T cell migration T cell homing and migration are complex processes that combine
chemokine signaling, integrins, and adhesion receptors. Naïve T cells circulate
among lymph nodes through lymphatic vessels and blood25. T cells use
CD62L to roll on high endothelial venules (HEVs) and to resist hemodynamic
flow (Figure 1.3). Upon activation, T cells shed CD62L by cleavage with matrix
metalloproteinase (MMPs)26. CD62L recognizes mucin like glycoproteins
called peripheral node addressin (PNAd). These proteins include which
include CD34, podocalyxin, endomucin, nepmucin, and glycosylation-

9
dependent cell adhesion molecule 1, and endothelial-expressed P-selectin
glycoprotein ligand 125,28. T cells rolling on HEVs express CCR7 and thus
respond to the C-C motif chemokine ligand 19 and 21 (CCL19 and CCL21
respectively). These chemokines are produced by the endothelial cells on
HEVs29. These signals upregulate LFA-1 on the T cells resulting in increased
adhesion to the HEVs, which express LFA-1’s binding partner intercellular
adhesion molecule 1 (ICAM-1)29. Thus begins the extravasation process
whereby T cells leave the circulatory system through the HEVs and enter the
lymph node25,28. T cells extravasate from the blood into the paracortex of
lymph nodes. Here naïve T cells scan dendritic cells in search of their cognate
peptide. If antigens are not detected, T cells will migrate to another lymph
node through the lymphatic vessels after 6-12 hours28,30. Memory T cells
reside close to HEVs, which positions them in a good location for encountering
APCs cells traveling through the lymphatics31. In the paracortex, naïve T cells
upregulate S1P1R1, which is the receptor that recognizes sphingosine-1-
Figure 1.3 T cell migration on HEVs T cells migrate through the circulatory system by rolling on HEVs. Rolling is facilitated by CD62L binding to molecules on the HEVs including PNAd. Epithelial cells secrete CCL19 and CCL21, which upregulate LFA-1 on the T cell. LFA-1 on the T cell surface binds to ICAM-1 on the epithelial cells and stops the T cell from rolling. T cells begin extravasating in between the epithelial cells. During this process, MMPs cleave CD62L on the T cells. This figure was adapted from Lewis, M. et al.27.

10
phosphate (S1P)25. Experiments utilizing pertussis toxin (an inhibitor of G-
protein coupled receptors) and the small molecule FTY720, which induces
S1P1R1 downregulation, have demonstrated the importance of S1P signaling
in maintaining T cells in the lymph node32,33. When S1P signaling is blocked
with either of these agents, lymphocytes are unable to egress and, as a result,
accumulate in the lymph nodes.
The migration of T cells towards APCs expressing their cognate antigen
is two sided as APCs also migrate in search of T cells. When a dendritic cell is
primed in the periphery, it matures, upregulating CCR7 and traveling through
lymphatics to the draining lymph node where it comes into contact with T cells.
In lymph nodes, a single APC is capable of scanning at least 500 T cells per
hour34. This suggests that in an hour 200 APCs are sufficient to identify a
single antigen specific T cell in 105 cells34. Over several days, T cells are
capable of scanning orders of magnitude more APCs. An important
consideration in these calculations is that scanning cannot occur too fast or
the T cell will be unable to properly recognize its cognate antigen. As a result,
T cells balance their ability to scan a wide variety of cells quickly with the need
to spend enough time on each contact to allow the T cell to become
activated35.
This scanning process is enabled by several characteristics of T cell
signaling. This process is aided by the fact that TCRs are highly sensitive and
a T cell is capable of recognizing a single pMHC molecule in vitro36. T cell
signaling has been shown to be digital in nature37. These characteristics allow
T cells to scan a large number of antigens while maintaining their high
specificity for their cognate peptide. The process of naïve T cell migration

11
through secondary lymphoid organs has been characterized as a random
walk38. This differs from the migration pattern of effector or memory T cells,
which undergo chemotaxis towards an area of injury or inflammation39.
As cancerous cells proliferate and establish a tumor, these cells require
additional nutrients. To resolve this problem, tumors undergo angiogenesis to
generate their own vasculature. This increases the ability of lymphocytes to
infiltrate tumors. One way that tumors evade detection by the immune system
is to evolve ways of preventing lymphocyte extravasation from blood. They
achieve this by down-regulating ICAM-1 and other integrins40. As a solid tumor
grows, the environment in its interior becomes hostile for lymphocytes40. This
results in tumor infiltrating lymphocytes dying and becoming dysfunctional41,42.
How to increase lymphocyte migration to tumors and to prevent or reverse
their dysfunction is an active area of research.
T cells that migrate to the tumor and survive its inhospitable
environment are exposed to a number of signals to reduce their activity.
Parallels have been drawn between dysfunctional T cells found in solid tumors
and T cell exhaustion that occurs from chronic infections such as HIV41,43. T
cells in mice infected with lymphocytic choriomeningitis virus (LCMV) clone 13
become exhausted and have reduced proliferation and cytokine production
upon restimulation42,44,45. These cells express high levels of the inhibitory
receptor programmed cell death protein 1 (PD-1). This is thought to occur in
response to chronic antigen stimulation through the TCR and perpetual
exposure to an inflammatory environment42. It is conceivable that reversal of
this dysfunctional phenotype would result in an increased immune response
against the infection or cancer. Thus, this is an active area of research. Some

12
approaches that are thought to reverse the tolerogenic environment of the
tumor will be discussed below.
1.2.5. Apoptosis The ability of cells to undergo programmed cell death is critical for
homeostasis. The acquired ability of cells to evade apoptosis and to become
resistant to programmed cell death is one of the hallmarks of cancer46. The
process of undergoing apoptosis is tightly regulated with many checkpoints to
ensure that it does not happen unintentionally.
One way cells undergo apoptosis is in response to Fas signaling, which
is initiated after trimeric FasL engages trimeric Fas (Figure 1.4)47. Binding of
Fas ligand (FasL) exposes the death domain (DD) protein motif on the
intracellular tail of Fas47. This results in the recruitment of Fas associated
death domain (FADD), which in turn recruits pro-caspase-8 to the receptor.
Pro-caspase-8 is then cleaved into its active form of caspase-8. The next step
varies between cell types, which undergo either Type I or Type II apoptosis. In
Type I cells, caspase-8 directly cleaves pro-caspase-3 to caspase-3, and
induces cell death. In Type II cells, caspase-8 cleaves BH3 interacting-domain
death agonist (BID) into truncated BID (tBID). In healthy cells, BID is located
on the mitochondrial membrane and is a pro-apoptotic member of the B-cell
lymphoma 2 (Bcl-2) family of proteins. tBID interacts with Bcl-2 associated X
(Bax) and Bcl-2 antagonist/killer 1 (Bak), triggering their insertion into the
mitochondrial membrane, which permeabilizes it. In cells that do not undergo
apoptosis, pro-survival Bcl-2 family proteins sequester Bax and Bak on the
mitochondrial surface and prevent them from puncturing the mitochondrial
membrane48. These pro-survival proteins include Bcl-2, BCL2 Like 1 (Bcl-XL),

13
Figure 1.4 Cartoon of Fas induced apoptosis Apoptosis can be triggered by binding of FasL to Fas. That results in exposure of DD and binding of FADD, which then cleaves pro-caspase-8. In cells undergoing Type I apoptosis, caspase-8 can cleave pro-caspase-3, which is a hallmark of apoptosis. In cells undergoing Type II apoptosis, caspase-8 cleaves BID to tBID. This activates Bax and Bak resulting in the permeabilization of the mitochondrial membrane and the release of cytochrome C. Cytochrome C then forms the apoptosome with Apaf-1, which then cleaves caspase-3 to induce apoptosis. This figure was modified from Houston, A. et al.47.

14
and myeloid cell leukemia sequence 1 (MCL-1). Following permeabilization of
the outer mitochondrial membrane, cytochrome C is released. This event is
considered to be the point of no return for cells undergoing apoptosis. The
release of cytochrome C leads to the formation of the apoptosome, a 7 subunit
protein complex consisting of cleaved cytochrome C and apoptotic protease
activating factor 1 (Apaf-1). The apoptosome then cleaves pro-caspase-9 into
caspase-9, which cleaves and activates pro-caspase-3, which leads to cell
death.
1.2.6. Lymphocyte cytotoxicity As CD8+ T cells differentiate into CTLs, they upregulate proteins
responsible for killing, namely FasL, perforin, and a number of granzymes.
These proteins are contained within LGs, which are secretory lysosomes. LGs
are also expressed and released by natural killer (NK) cells, which use the
same cytotoxic machinery as CTLs. The contents of LGs are released
following TCR stimulation of CTLs. Here we present the mechanics of how the
release of FasL, granzymes, and perforin are coordinated to induce apoptosis.
One way that cytotoxic lymphocytes induce death in target cells is
through Fas. Ligation of FasL to Fas induces signaling that leads to apoptosis.
Cell death through Fas signaling occurs more slowly than granzyme and
perforin mediated cytotoxicity but is still an important mechanism for inducing
cell death49. There are five granzymes in humans and ten in mice50.
Granzymes are serine proteases that have many targets within cells.
Granzyme B is the most highly expressed and most studied granzyme51. In
CTLs, granzyme B is one of the most highly expressed proteins and is
expressed at similar levels to actin. Targets of granzyme B include but are not

15
limited to caspase-3, caspase-7, caspase-9, and caspase-10. There have
been reports that granzyme B cleaves BID into tBID; however, these reports
have been disputed52,53. Granzymes have also been shown to play a role in
host defense against intracellular pathogens54,55. Granzyme A induces cell
death by triggering DNA damage51. The other granzymes induce cell death
through a variety of other mechanisms, many of which are not known. Cells
treated with granzymes do not undergo apoptosis as granzymes are unable to
penetrate the plasma membrane. Cytotoxic lymphocytes puncture the plasma
membrane using perforin, a protein that forms pores in a calcium dependent
manner. Perforin is stored in an inactive form in LGs at low pH. Upon
lymphocyte activation, perforin is released and forms pores 12-17nm in
diameter on the target cell membrane56.
The current model for perforin and granzyme mediated death begins
with the cytotoxic lymphocyte releasing the contents of LGs into the space
between itself and target cell (Figure 1.5)57. Perforin forms holes in the plasma
membrane, which trigger an influx of Ca2+ in the target cell57,58. Perforin has
been found to form pores within minutes of cytotoxic lymphocyte-target cell
interactions59. The influx of Ca2+ initiates membrane repair mechanisms, which
involve endocytosis of the target cell plasma membrane for repair57. This
brings perforin and granzyme from the extracellular space into the target cell in
endosomes. Inside endosomes, perforin makes holes in the membrane
releasing granzymes into the cytoplasm. Once in the cytoplasm, granzymes
induce cell death through caspase dependent and independent mechanisms
as discussed above60.

16
Figure 1.5 Cartoon of perforin and granzyme release and entry into target cells (1) Lytic granules are secreted from the cytotoxic lymphocyte into the space between the lymphocyte and target cell through the immunological synapse. Perforin forms holes in the target cell plasma membrane, which triggers an influx of Ca2+ (2). This influx of calcium initiates membrane repair mechanisms that result in membrane resealing (3). This then results in endocytosis of the plasma membrane, creating endosomes containing perforin and granzyme (4). Inside the endosomes, perforin makes holes in the endosome membrane releasing granzyme, which triggers apoptosis. This figure was modified from Keefe, D. et al.57.

17
Researchers have examined the roles of granzyme A, granzyme B, and
perforin in spontaneous and subcutaneous tumor growth experiments. Perforin
is indispensible for tumor rejection; however both granzyme A and granzyme
B are not required61. This suggests that there is some overlapping function for
granzymes and that if one granzyme is missing others are able to compensate
for it. Experiments to assess cytotoxicity of cells isolated from mice knocked
out for every granzyme have not been performed. However, mice lacking
perforin have a dramatic defect in cytotoxicity of CTLs and NK cells61,62.
Perforin deficient mice also experience increased rates of tumor
development in the methylcholanthrene (MCA) induced tumor model63. These
experiments demonstrate the unique role perforin plays in cytotoxicity. Perforin
appears to have an additional role in regulation of the immune system as
patients with familial hemophagocytic lymphohistiocytosis have nonsense
mutations in the perforin gene64. The importance of perforin to suppress the
immune system has also been shown for mice infected with LCMV clone 13.
Perforin deficient mice infected with LCMV clone 13 experienced decreased
survival due to over expansion of CD8+ T cells65. This stems from uncontrolled
inflammation produced by viral specific CD8+ T cells. Treating mice with
antibodies to deplete CD8+ T cells and to block cytokines prolongs survival66.
Furthermore, mice deficient for both perforin and Fas show an increase in
lymphoproliferative disease relative to mice deficient for Fas and heterozygous
for perforin65. These results highlight a key role for perforin and Fas outside of
lymphocyte cytotoxicity in maintaining immune homeostasis.

18
1.2.7. Mechanobiology of T cell activation Recent work has provided insight into how the TCR can distinguish
single amino acid substitutions in short peptides. Previous research has
shown that the ζ-chain of the TCR undergoes conformational changes to
expose phosphorylation sites in its ITAM domains67. Other work has shown
that the TCR is an anisotropic mechanosensor that requires force orthogonal
to the IS for the induction of calcium signaling68. The model that these two
observations suggest is that force is required to expose ITAM domains on the
TCR, which leads to the induction of membrane proximal signaling.
Furthermore, the TCR-pMHC interaction has been shown to function as a
catch bond69. A catch bond is a type of bond in which application of a force
increases the lifetime of the interaction. It was shown that the capacity to form
a catch bond plays a critical role in enabling the TCR to discriminate between
high and low affinity agonists69. Together these studies demonstrate the
important role of mechanobiology in TCR activation and signaling.
The IS has been shown to be a dynamic and physical structure that is
capable of exerting mechanical force70,71. Naïve T cells have been shown to
exert mechanical force on polydimethylsiloxane (PDMS) pillars coated with
activating proteins71. It is conceivable that T cells could exert forces as a way
of sensing the mechanical properties of activating surfaces. This is supported
by previous research demonstrating that T cells are more strongly activated on
softer rather than stiffer PDMS surfaces, as measured by cytokine production
and proliferation72. Activating peripheral blood mononuclear cells (PBMCs) on
softer surfaces with CD3/CD28 antibodies tended to increase shedding of
CD62L, which is a consequence of T cell activation72. This is intriguing

19
because the opposite phenomenon has been observed for naïve mouse T
cells activated on polyacrylamide surfaces with CD3/CD2873. Possible
explanations for this discrepancy include a difference between human and
mouse cells. It is also possible T cells respond differently to antibodies on
PDMS and polyacrylamide surfaces. Further research is needed to understand
the precise role of surface tension on T cell activation. Yet, these studies are
intriguing and support the concept that signaling and cell biology are not
merely biochemical reactions. These observations show that mechanical
properties of biology are important factors that have been largely overlooked
in immunology until recently.
1.3. Immune system and cancer The connection between the immune system and tumor development
has been active area of research for decades. The idea that the immune
system is capable of surveying a host and eliminating cancer was first coined
cancer immunosurveillance by Sir Macfarlane Burnet in 195774. This idea was
quickly abandoned for lack of evidence. The first evidence of this phenomenon
came from carcinogen induced cancer models75. This concept has evolved
into the model of immunoediting75,76. This term encapsulates
immunosurveillance as well as conveying the notion that the immune system
alters the tumor and shapes its development. The theory of cancer
immunoediting describes three components of the process, termed the three
E’s of immunoediting76. In the first stage, the immune system actively
eliminates transformed cells preventing the formation of a tumor76. In the
second stage, the transformed cells come to an equilibrium with the immune
system76. In the third stage, the transformed cells escape containment by the

20
immune system and grow out, forming a tumor76. Since the emergence of the
immunoediting model, there has been a tremendous amount of research
examining the precise relationship between the immune system and cancer.
As part of this research, the immune system has been identified as playing a
distinct role in the formation of tumors.
The tumor microenvironment is a dynamic landscape with many
different immune cell infiltrates including different types of T cells,
macrophages, and myeloid cells. These cells can promote both an anti-tumor
immune response and tumorigenesis77. For instance, macrophages can have
an M1 or M2 phenotype, and they play different roles in tumor progression. M1
macrophages produce pro-inflammatory cytokines and act as APCs, whereas
M2 macrophages promote tumorigenesis and produce anti-inflammatory
cytokines77. T cells also have both tumorigenic and anti-tumor effects. Both
CD4+ T cells and CD8+ CTLs are present in tumors. One subtype of CD4+ T
cell found in tumors is Tregs. In healthy individuals, Tregs provide
immunosuppressive functions78. Without Tregs, mice and patients develop
severe autoimmunity. However, in the tumor microenvironment, Tregs have a
complex and poorly understood role. The presence of Tregs in tumors has
been correlated with a poor prognosis in the case of breast and hepatocellular
carcinomas79,80. Alternatively, the presence of high numbers of Tregs in
colorectal cancer is an indicator of a good prognosis81. As CTLs infiltrate the
tumor, they are exposed to the immunosuppressive environment created by
macrophages, Tregs, and other cells. They are also exposed to chronic
stimulation through their TCR and pro-inflammatory cytokines. Chronic
overstimulation of the TCR in the tumor environment causes CTLs to become

21
dysfunctional and express various inhibitory markers such as PD-1, TIGIT,
and others41,42. There is a concerted effort in the scientific community to
reverse these immunosuppressive effects and to use the immune system as a
cancer treatment. Some of these approaches will be discussed next.
1.4. Cancer Immunotherapies Attempts to harness the immune system to treat illnesses predate a
simple understanding of the immune system with vaccines. More recently,
physicians have been using the adaptive immune system in their fight against
cancer. In the last several years there have been a number of significant
breakthroughs, which have generated a great deal of interest.
1.4.1. Checkpoint blockade The development of checkpoint blockade emerged from the discovery
of CD28 and co-stimulation82. When T cells encounter an APC, they receive
stimulation through their TCR. When a naïve T cell encounters an APC, its
activation depends on receiving a second signal through CD28. Co-stimulatory
ligands for CD28 include B7-1 and B7-2. Inhibitory receptors for B7-1 and B7-
2 have also been discovered, which include cytotoxic T-lymphocyte-
associated protein 4 (CTLA-4)83. Treating T cells with antibodies to block
CTLA-4 was found to increase their proliferation; whereas treating T cells with
antibodies to crosslink CTLA-4 reduced their proliferation83,84. In vitro, CTLA-4
has been shown to compete with CD28 for B7 molecules on the surface of the
APC, which results in reduced co-stimulation of T cells83. Further studies
showed that treatment of tumor bearing mice with CTLA-4 blocking antibodies
resulted in a significant improvement in the anti-tumor responses85. PD-1 is
structurally and functionally similar to CTLA-4 and has been shown to be a

22
negative regulator of T cell activation86. PD-1 is thought to attenuate TCR
signaling by inhibiting the phosphorylation of ZAP70, CD3ζ, and CD2887,88.
This work has led to many clinical trials, which found that treatment of cancer
patients with blocking antibodies for CTLA-4 and PD-1 resulted in a
remarkable increase in survival. Clinical trials have been performed with a
variety of cancers but the most success has been for patients with metastatic
melanoma89. While the mechanism for how CTLA-4 and PD-1 blockade work
in vitro is well understood, it is unclear how precisely they work in vivo90.
Understanding this is critical for improving and developing new cancer
therapies.
Following the discovery and success of monoclonal antibodies targeting
the receptors CTLA-4 and PD-1, there has been a great interest in developing
similar molecules to other receptors89,91,92. Additional targets include
Programmed death-ligand 1 (PD-L1), V-domain Ig suppressor of T cell
activation (VISTA), Hepatitis A virus cellular receptor 2 (TIM-3), and
Lymphocyte-activation gene 3 (LAG-3)93. There are also efforts to determine
whether the checkpoint blockade approach can be applied to other types of
cancer besides metastatic melanoma94.
One challenge that has emerged with new cancer therapies is that it is
difficult to determine which treatment is best for each patient. This
necessitates the discovery of good biomarkers that could identify the right drug
for a patient. This is especially true given the low response rates of some
forms of cancer to checkpoint blockade including non-small cell lung cancer
and renal cell carcinoma with response rates under 20% and 30%
respectively92. Biomarkers include PD-L1 expression, mutational burden, and

23
the number of T cell infiltrates in the tumor92. However, the utility of these
biomarkers is limited by tumor heterogeneity, inconsistent lymphocyte
infiltration, insufficient biopsies, and other reasons. Furthermore, the fact that
we do not understand the precise mechanism for checkpoint blockade further
limits our ability to identify biomarkers to predict responses.
1.4.2. Adoptive cell therapies Adoptive cell therapies (ACT) are another promising strategy for using
the immune system to treat cancer. These treatments rely on isolating
lymphocytes from the peripheral blood of patients and expanding them ex
vivo95–98. While they are being expanded, lymphocytes are sometimes treated
to express proteins to modulate their function such as chimeric antigen
receptors (CARs). The CAR is a fusion protein consisting of an extracellular
domain of a single chain antibody targeting a specific antigen, a
transmembrane domain, and various intracellular signaling domains99. There
is some variety with respect to which signaling domains are used and
optimizing the motifs is an area of active research. The CARs that have had
the most success are the ones targeting B cell malignancies via the CD19
antigen, which is very specifically expressed on B cells99. On-target off-tumor
side effects are a concern when the CAR antigen is widely expressed on non-
cancerous cells, even at low levels. At least one patient has died from cytokine
release syndrome likely due to on-target but off-tumor side effects following
treatment with a CAR against human epidermal growth factor receptor 2
(HER-2)100. Furthermore, as blood cancers are liquid tumors, they do not have
the same immunosuppressive environment of solid tumors, which was

24
previously discussed. These factors hint that it might be difficult to design CAR
treatments that would be effective in solid tumors.
Other types of ACT involve expanding patients’ lymphocytes and
transferring them back into the patient without transfecting them to express
novel receptors. Steven Rosenberg at the National Institutes of Health has
pioneered some of this work. He has performed clinical trials where polyclonal
tumor infiltrating lymphocytes were taken from patients, expanded, and
transferred back into the patients. Upon transfer, patients can experience a
dramatic reduction in tumor mass98. This approach has many benefits over
CAR therapies including success in solid tumors. However, one of the
limitations of this approach is that there is a large amount of patient-to-patient
variability. This makes a standard protocol difficult to develop as every patient
has a unique repertoire of T cells and a unique cancer.
One of the primary drawbacks to ACTs is the significant toxicity
observed in the clinical trails101. This has led to several trials being halted. One
of the ways to reduce the toxicity of ACT, in principle, is by using molecular
switches to turn on or off the transferred cells. For instance, synthetic Notch
receptors have been used to turn on expression of a CAR only when a cell has
encountered a second signal102. While cancer treatments involving these
molecular switches will be more complicated for physicians to administer, they
also provide increased flexibility and likely improved safety, which are both
lacking for traditional CARs. There are also switches that turn on suicide
genes to halt the progression of cytokine release syndrome101.

25
1.5. Conclusion The development of successful ACTs relies on a detailed
understanding of T cell activation, migration, and cytotoxicity. Here we
examine the mechanism behind the increase in CTL cytotoxicity observed
upon PTEN depletion. PTEN depletion increases CTL force exertion in
response to antigen in the plane of the IS and orthogonal to the IS. We
connect this increase in force exertion with faster perforin pore formation. We
demonstrate that tenser plasma membranes results in increased susceptibility
of cancer cells to perforin and CTL lysis. We further implicate force in
cytotoxicity by establishing a spatiotemporal relationship between force
exertion and degranulation events.
Given the increased cytotoxicity of PTEN depleted cells in vitro, we next
examined whether PTEN depletion could be used as a way to enhance tumor
rejection in a transplantable melanoma model of ACT. PTEN depleted cells
were found to have reduced anti-tumor effects in vivo. Tumor rejection
requires both CTL persistence and cytotoxicity. PTEN depleted cells were
found to have a defect in persistence, which we investigated to understand
how migration, survival, and proliferation contribute to persistence. T cells
depleted for PTEN were found to have defective migration, reduced
homeostatic proliferation, and increased survival. This work highlights the
importance of homeostatic expansion and migration as critical components of
ACT and illuminates them as functional targets for improving ACTs in the
future.

26
CHAPTER 2: CYTOTOXIC T CELLS USE MECHANICAL FORCE TO POTENTIATE
TARGET CELL KILLING* 2.1. Introduction
Cells exchange information through adhesive and highly dynamic cell-
cell interactions. Within these contacts, communicative chemical
processes are exposed to micrometer scale membrane
and cytoskeletal movements capable of imparting substantial mechanical
force. It is known that cells use applied force to sense the physical properties
of their environment and translate this information into afferent chemical
signals that flow into the cell. This process, called mechanotransduction, plays
critical roles in the activation and differentiation of multiple cell types103,104. In
principle, force could also modulate intercellular communication, particularly in
close cell-cell interactions where movement on one side of the interface
induces physical changes on the other side. Whether cell-derived forces
actually contribute to the transmission of efferent signals in this manner,
however, remains unclear.
Cell-cell contacts in the immune system represent an interesting
experimental context for exploring this question because they are structurally
dynamic and also mediate a substantial amount of information transfer. One of
* †Basu, R., †Whitlock, B.M., †Husson, J., Le Floc’h, A., Jin, W., Oyler-Yaniv, A., Dotiwala, F., Giannone, G., Hivroz, C., Lieberman, J., Kam, L.C., Huse, M. (2016). Cytotoxic T Cells Use Mechanical Force to Potentiate Target Cell Killing. Cell, 165(1), 100–110. http://doi.org/10.1016/j.cell.2016.01.021

27
the most important of these interactions is the IS used by CTLs to instruct
infected or transformed target cells to die. Target cell killing is crucial
for adaptive immune responses against intracellular pathogens, and it also
plays a central role in several cell-based anti-cancer immunotherapies97. IS
assembly is triggered by the recognition of pMHC on a potential target
by TCRs on the CTL. Once the IS forms, CTLs secrete a toxic mixture of
proteins into the synaptic space that includes perforin and
several granzyme proteases105. Perforin is a hydrophobic molecule that forms
calcium (Ca2+)-dependent pores in the target cell membrane. This induces a
repair response that enables granzymes to access the target cell cytoplasm,
where they induce apoptosis57,58.
Perforin and granzymes are stored in
secretory lysosomes called lytic granules, which cluster around
the centrosome in activated CTLs. During IS formation, the centrosome
reorients to the center of the contact, placing the granules in close apposition
to the synaptic membrane14. This polarization event is thought to enhance the
potency and the specificity of killing by promoting directional release of granule
contents toward the target. Recent results, however, indicate that CTLs kill
quite effectively in the absence of centrosome reorientation, suggesting there
are additional mechanisms by which the IS potentiates cytotoxicity106.
IS formation also involves intense remodeling of filamentous actin (F-
actin), which controls both the growth and the organization of the interface107.
Recently, we demonstrated that PI3K activity stimulates actin polymerization
within the IS by recruiting Dock2, an exchange factor for the Rho
GTPase Rac8. CTLs lacking Dock2 form miniaturized synapses that are

28
structurally unstable. Conversely, depletion of PTEN, a lipid phosphatase that
antagonizes PI3K, markedly enhances IS growth. Interestingly, whereas
Dock2-deficient CTLs kill target cells poorly, PTEN-deficient CTLs exhibit
dramatically enhanced cytotoxicity8. These results establish an intriguing link
between target cell killing and F-actin remodeling at the IS. The mechanistic
basis for this relationship, however, has remained unclear.
Synaptic F-actin is highly dynamic, exhibiting constant retrograde flow
toward the center of the IS as well as bursts of anterograde flow in the
opposite direction70,108,109. These and other effects enable the T cell to impart
nanonewton scale forces against the target cell71,110. In the present study, we
combined specific perturbations of PI3K-Dock2 signaling with single cell
biophysical approaches to investigate the impact of synaptic forces on CTL
function. We found that force exertion at the IS potentiates killing by straining
the target cell surface and thereby enhancing the pore forming activity of
perforin. These results demonstrate that T cells mix physical and chemical
outputs to enhance their effector responses and reveal an unexpected role
for cellular mechanics in intercellular communication.
2.2. Results 2.2.1. Cytotoxicity Correlates with Synaptic Force Exertion
The killing phenotypes observed in PTEN- and Dock2-deficient CTLs
implied an important role for PI3K-dependent F-actin remodeling in cellular
cytotoxicity. To investigate this relationship, we first examined the distribution
of lytic granules in CTL-target cell conjugates. CTLs expressing the OT-1
TCR, which recognizes the ovalbumin257–264 peptide (OVA) bound to the class
I MHC molecule H2-Kb, were transduced with short hairpin RNA (shRNA)

29
against PTEN (shPTEN) or Dock2 (shDock2) or with nontargeting control
shRNA (shNT) (Figure 2.1). They were then mixed with OVA-loaded EL4
target cells and the resulting conjugates fixed and stained to visualize lytic
granules (Figure 2.2A). Suppression of Dock2 or PTEN had no effect on
granule polarization to the IS (Figure 2.2B), indicating that intracellular
trafficking of cytotoxic cargo does not involve PI3K-Dock2 signaling. We also
quantified granule release (called degranulation) from CTLs by measuring
surface exposure of the granule resident protein Lamp1 after stimulation with
target cells. This response was unaffected by depletion of PTEN or Dock2
(Figure 2.2C), consistent with previous results8. Finally, we examined TCR-
induced calcium (Ca2+) flux, a requisite step for granule clustering and
exocytosis, by imaging CTLs on glass surfaces coated with H2-Kb-OVA and
ICAM-1 (a ligand for the αLβ2 integrin LFA-1)111,112. Dock2- and PTEN-deficient
CTLs displayed robust Ca2+ responses that were comparable to those of shNT
expressing controls (Figures 2.2D and 2E). Taken together, these data
Figure 2.1 shRNA-Mediated Suppression of Dock2 and PTEN Representative western blots showing typical levels of Dock2 and PTEN depletion in OT1 CTLs expressing shDock2 and shPTEN, respectively, relative to controls expressing shNT. Actin served as a loading control. Data are representative of at least 5 independent experiments. Audrey Le Floc'H performed these experiments.

30
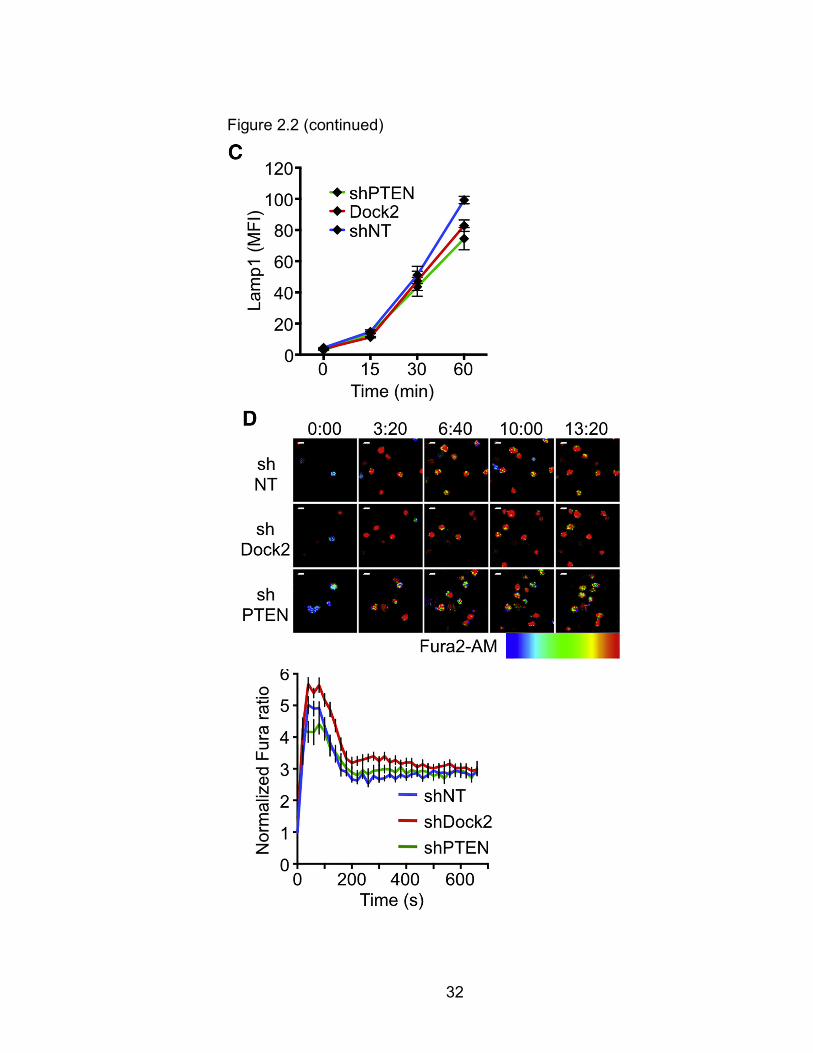
Figure 2.2 PTEN and Dock2 Are Not Required for Lytic Granule Polarization and Ca2+ Flux (A and B) OT1 CTLs expressing the indicated shRNAs were mixed with OVA-loaded EL4 cells, fixed, and stained for pericentrin and Lamp1 to visualize the centrosome and lytic granules, respectively. (A) Left: brightfield image of a representative CTL-target cell conjugate. Right: corresponding fluorescence image, with white lines indicating CTL boundaries. (B) Left: polarization index was calculated using the center of gravity (COG) of the lytic granules. Right: quantification of lytic granule polarization index (n ≥ 37 per sample). Differences were not significant (two-tailed Student’s t test). (C) OT1 CTLs expressing the indicated shRNAs were mixed with OVA-loaded EL4 cells and degranulation assessed by surface exposure of Lamp1. (D) CTLs expressing the indicated shRNAs were loaded with Fura2-AM and imaged on glass surfaces coated with H2-Kb-OVA and ICAM1. Left: representative time-lapse montages of CTLs contacting the stimulatory surfaces. Images are pseudocolored with warmer colors (e.g., orange, red) indicating higher concentrations of intracellular Ca2+. Time in MM:SS is indicated above the montages. Right: mean normalized Fura ratio graphed against time. n ≥ 21 cells per sample. All scale bars, 10 µm. Error bars denote SEM. Data are representative of at least two independent experiments. Audrey Le Floc'H and Morgan Huse performed these experiments.

31
32
Figure 2.2 (continued)

33
indicate that suppression of PTEN and Dock2 does not affect granule
polarization and fusion at the IS, implying that these perturbations influence
cytotoxicity via a different mechanism.
Force exertion across the IS could, in principle, provide a physical
avenue for control of target cell killing. To investigate this possibility, we first
asked whether PI3K-Dock2 signaling, which controls cytotoxic efficiency,
might also regulate IS mechanics. Accordingly, we compared synaptic force
exertion in OT-1 CTLs transduced with shNT, shPTEN, and shDock2. To
measure forces perpendicular to the IS, we used micropipettes to place
individual CTLs in contact with polystyrene beads coated with H2-Kb-OVA and
ICAM-1 (Figure 2.3A). Subsequent bead displacements toward or away from
the CTL were translated into force measurements using the known stiffness of
the micropipette holding the bead. Contact with stimulatory beads induced a
rapid CTL spreading response not unlike IS formation with a target cell.
Spreading was frequently accompanied by transient pushing of the bead away
from its initial position. This was followed in almost all cases by a pronounced
pulling phase in which the bead became engulfed by the CTL (Figure 2.3B).
Analysis of kymographs derived from each experimental trial enabled us to
determine the rate of bead movement during the pulling phase of the response
(Figure 2.3C), which is proportional to the pulling force. This parameter, called
the loading rate, was significantly enhanced in CTLs lacking PTEN and
markedly reduced in CTLs lacking Dock2 (Figure 2.3D). These results indicate
that PI3K-Dock2 signaling drives force exertion perpendicular to the CTL-
target cell interface.

34
Figure 2.3 PI3K Signaling Controls Force Exertion Perpendicular to the IS
(A) Schematic diagram of the micropipette-based system. (B) Time-lapse montage of a representative micropipette experiment. Dashed white line denotes the initial position of the bead. Time is indicated in M:SS in the bottom left corner of each image. (C) Kymograph of the experiment shown in (B). The loading rate can be derived from the slope of the red line. (D) Average loading rate during the pulling phase of the response, calculated for cells expressing the indicated shRNAs. Error bars denote SEM. n ≥ 10 cells per condition. ∗p < 0.05, ∗∗p < 0.01, calculated by two-tailed Mann-Whitney test. All scale bars, 5 µm. Data are representative of at least two independent experiments. Audrey Le Floc'H and Julien Husson performed these experiments.

35
36
To measure forces in the plane of the IS, we imaged OT-1 CTLs on
arrays of polydimethylsiloxane (PDMS) micropillars bearing immobilized H2-
Kb-OVA and ICAM-1 (Figure 2.4A)71. Because the dimensions (6 µm tall,
0.7 µm diameter) and composition of these pillars were known, observed pillar
deflections could be converted into force vectors. OT-1 CTLs exhibited cell
spreading and OVA-induced Ca2+ flux upon contact with the arrays, consistent
with canonical TCR activation and signaling (Figures 2.4B and 5A). In most
cells, spreading was associated with centrifugal pillar deflections, indicative of
outwardly oriented forces (Figures 2.4B and 4C). After the size of the interface
stabilized, these deflections tended to reverse polarity and point inward. The
progression from centrifugal “spreading” to centripetal “squeezing” was
reminiscent of the responses displayed by naive CD4+ T cells on pillar
arrays71. However, OT-1 CTLs exerted substantially more force per pillar than
naive cells (Figure 2.4D), and their force profiles were less symmetric71.
Indeed, instantaneous force exertion tended to be concentrated in “hotspots”
characterized by the strong deflection of one to three pillars (Figure 2.4B,
green asterisks). Importantly, suppression of PTEN markedly enhanced force
exertion on both individual pillars and also the entire array (Figures 2.4E
and 5B). Dock2 suppression gave less conclusive results, with some
experiments revealing a slight inhibitory effect and others indicating no
significant difference (Figures 2.4F and 5B). It is possible that forces in the
plane of the IS are less sensitive to reduced PI3K signaling than those in the
orthogonal dimension. Nevertheless, when taken together with our
micropipette data, these studies indicate that CTLs exert multidimensional
PI3K-dependent forces against the target cell.

37
Figure 2.4 PI3K Signaling and NMII Control Force Exertion Parallel to the IS (A) Schematic diagram of the micropillar system. (B–F) CTLs expressing shNT, shDock2, or shPTEN were imaged on stimulatory micropillar arrays. (B) Time-lapse montage of a representative CTL-micropillar interaction. Time is indicated in the top right corner of each image. Large pillar deflections are indicated by yellow arrows. Green asterisks denote “hotspots” of strong force exertion. (C) Average projection of pillar deflections along the line connecting each pillar to the cell's center of gravity (COG projection) was determined for the CTL shown in (B) and plotted against time. (D) Aggregate plot of instantaneous force per pillar exerted by the CTL in (B), graphed against time. Pink dots denote pillars in contact with the cell, and blue dots denote pillars outside of the interface. Average force per pillar within the interface is shown in green and background force per pillar in cyan. (E and F) Total force exertion against the pillar array graphed versus time for CTLs expressing the indicated shRNAs. n ≥ 6 cells per sample. (G) CTLs treated with 50 µM blebbistatin (Bleb) or vehicle control (Veh) were imaged on stimulatory micropillar arrays. Total force exertion against the array is graphed as in (E). (H) CTLs expressing the indicated shRNAs were mixed 1:1 with OVA-loaded RMA-s cells. Specific lysis is graphed as a function of OVA concentration. All error bars denote SEM. Data are representative of at least two independent experiments. Benjamin Whitlock, Weiyang Jin, and Morgan Huse performed these experiments.

38

39
Figure 2.4 (continued)

40
Figure 2.5 Antigen-Induced Forces on PDMS Micropillar Arrays (A) OT1 CTLs were loaded with Fura2-AM and then imaged on micropillars coated with the indicated ligands (pMHC = H2-Kb-OVA). Representative time-lapse montages are shown of CTLs coming into contact with the surface. Images are pseudocolored with warmer colors (e.g., orange, red) indicating higher concentrations of intracellular Ca2+. Scale bars, 10 µm. (B) CTLs expressing shNT, shDock2, and shPTEN were imaged on micropillar arrays coated with H2-Kb-OVA and ICAM1. Graphs show average force exertion per pillar versus time. n ≥ 6 cells per sample. (C) CTLs treated with 50 µM blebbistatin (Bleb) or vehicle control (Veh) were imaged on stimulatory micropillar arrays. The average COG projection (see Figure 3C) for cells in each condition is plotted against time. Positive values indicate centrifugal “spreading,” while negative values indicate centripetal “squeezing.” (D) Representative western blot showing typical levels of MyH9 relative to controls expressing shNT. Actin served as a loading control. (E) OT1 CTLs expressing the indicated shRNAs were mixed with OVA-loaded RMA-s target cells and degranulation assessed at various times by surface exposure of Lamp1. Although shMyH9-expressing CTLs displayed increased degranulation in this experiment, the result was not consistent. All error bars denote SEM. Data are representative of at least two independent experiments. Benjamin Whitlock, Weiyang Jin, and Morgan Huse performed these experiments.

41

42
Figure 2.5 (continued)

43
Myosin-based contractility is crucial for the generation of actin-
dependent forces in multiple cell types, and clusters of the nonmuscle myosin
II (NMII) isoform have been observed within the T cell IS113–115. Although the
precise function of synaptic NMII remains controversial, it is appropriately
positioned to contribute to force exertion116. To investigate this possibility, we
examined micropillar deflection in the presence of blebbistatin, a small
molecule myosin II inhibitor. Blebbistatin treatment dramatically reduced force
exertion during both the “spreading” and “squeezing” phases of the response
(Figures 2.4G and 2.5C), indicative of an important role for NMII in IS
mechanics. Next, we asked whether synaptic force exertion by NMII
modulates cytotoxicity. For these experiments, we utilized shRNA knockdown
of the myosin heavy chain MyH9 (shMyH9) to target the NMII complex
selectively in CTLs. This strategy yielded only partial suppression of MyH9
(Figure 2.5D), as previously reported117. CTLs expressing shMyH9 exhibited a
subtle, but consistent killing defect that paralleled the partial knockdown of the
protein (Figure 2.4H). Importantly, TCR-induced degranulation was not
inhibited in these cells (Figure 2.5E), indicating that TCR activation and
signaling remained intact. We conclude that myosin activity, like PI3K
signaling, controls both cytotoxicity and synaptic force exertion.
2.2.2. PI3K signaling Accelerates Perforin Pore Formation Next, we re-examined how PI3K signaling affects cytotoxicity, focusing
on events that occur downstream of perforin and granzyme secretion. Perforin
initiates killing by forming plasma membrane pores on the target cell60. This
event can be visualized by imaging CTLs and target cells in the presence of
high concentration (100 µM) propidium iodide (PI)57,59. Plasma membrane

44
perforation allows PI to access the cytoplasm, rendering the target
cell fluorescent (Figure 2.6A). To quantify the rate of perforin pore formation
using this approach, we imaged OVA-loaded RMA-s target cells together with
OT-1 CTLs in 50 × 50 µm PDMS microwells, which facilitate extended
observation of individual CTL-target cell interactions (Figure 2.6B). These
experiments revealed that CTLs expressing shPTEN were significantly more
effective at inducing perforin pore formation than shNT expressing controls.
The fraction of interactions associated with target cell PI incorporation was
higher (93% for shPTEN CTLs versus 71% for shNT CTLs), and among these,
the time delay between IS formation and PI fluorescence (influx time) was
significantly reduced (Figure 2.6C).
CTLs lacking PTEN exhibited higher total levels of perforin protein
(Figure 6D), which could, in principle, explain the enhanced pore formation we
observed. This increase in perforin expression could be reversed, however, by
removing one copy of the prf1 gene in the context of PTEN deficiency.
Importantly, killing by PTEN-deficient prf1+/− CTLs was essentially equivalent
to that of PTEN-deficient prf1+/+ CTLs and substantially greater than that
of prf1+/+ shNT controls (Figure 2.6E). Hence, it is unlikely that the accelerated
pore formation seen in the absence of PTEN resulted from changes in perforin
expression. Rather, PTEN suppression appeared to boost cytotoxicity by
increasing perforin activity on a per molecule basis.
2.2.3. Cell Tension Potentiates Target Cell Lysis Biophysical studies have shown that increasing the tension of target
membranes boosts the activity of pore forming peptides, implying that
tangential force can reduce the energetic cost of inserting a hydrophobic

45
Figure 2.6 PTEN Deficiency Enhances Perforin Pore Formation (A) Schematic diagram showing perforin pore detection by PI. (B and C) CTLs expressing shNT or shPTEN together with cyan fluorescent protein (CFP) were mixed with carboxyfluorescein succinimidyl ester (CFSE)-labeled, OVA-loaded RMA-s cells and imaged in PDMS microwells in the presence of 100 µM PI. (B) Time-lapse montage of a representative microwell showing conjugate formation (magenta asterisk) and PI influx (purple arrowhead). Time is indicated in H:MM in the bottom left corner of each image. (C) Time between conjugate formation and PI influx (PI influx time) quantified for shNT and shPTEN expressing CTLs. Error bars denote SEM. n ≥ 65 conjugates per sample. P value calculated by two-tailed Mann-Whitney test.(D) Perforin (Prf) expression in the indicated CTLs was analyzed by western blot. Actin served as a loading control. (E) prf1+/+ and prf1+/− CTLs expressing the indicated shRNAs were mixed 1:1 with OVA-loaded RMA-s cells. Specific lysis is graphed as a function of OVA concentration. Data are representative of at least two independent experiments. Benjamin Whitlock and Morgan Huse performed these experiments.

46

47
Figure 2.6 (continued)

48
molecule into the bilayer118–120. Accordingly, we reasoned that synaptic forces
might potentiate perforin pore formation by applying tension to the target cell.
To explore the relationship between cell tension and perforin function, we grew
adherent cells on polyacrylamide hydrogels of varying elasticity121. Cell tension
in this culture system mirrors the underlying hydrogel; stiff hydrogels enforce
high tension, while soft hydrogels induce the opposite effect122–125. Consistent
with this principle, we found that B16 melanoma cells adopted a stellate
architecture on stiff (E = 50 kPa) hydrogels characteristic of high tension, while
on soft (E = 12 kPa) hydrogels they displayed a more collapsed morphology
(Figure 2.7). To assess perforin pore formation under each condition, we
treated the cells with purified perforin protein (∼1 µg/ml) in the presence of
100 µM PI (Figure 2.8A). Although the capacity of perforin to induce PI influx
varied from day to day, we consistently observed that cells on 50 kPa
substrates were more sensitive to pore formation than those on 12 kPa
substrates, implying that increased cell tension potentiates perforin activity
(Figures 2.8B, 8C, and 2.9A).
Next, we investigated whether target cell tension similarly modulates
CTL-mediated killing. OT-1 CTLs were added to OVA-loaded B16 cells grown
on stiff or soft substrates and target cell lysis measured by the release of
lactate dehydrogenase (LDH), a cytoplasmic enzyme (Figure 2.8D). Killing
was significantly enhanced on 50 kPa hydrogels relative to 12 kPa hydrogels,
despite equivalent levels of TCR-induced degranulation (Figures 2.8E
and 2.10). Importantly, target cell killing by the small molecule staurosporine,
which induces apoptosis in multiple cell types, was unaffected by substrate
elasticity (Figures 8F and 8G). B16 cells grown on stiff matrices are therefore

49
not intrinsically less viable. Rather, they are selectively sensitized to perforin-
dependent killing.
Cell tension is imposed both by the cytoskeletal cortex and by the
plasma membrane. To determine the relative contributions of membrane and
cortical tension to perforin function, we assessed pore formation in the
presence of reagents that alter the two parameters differentially
(Figure 2.11A). Blebbistatin, by inhibiting myosin II, reduces cortical tension
while increasing membrane tension126,127. By contrast, the
actin depolymerization agent latrunculin A reduces both parameters128,129.
Treatment of adherent B16 cells with latrunculin A substantially decreased
pore formation by purified perforin, while blebbistatin reproducibly enhanced it
Figure 2.7 Hydrogel Stiffness Controls Cell Morphology B16 cells were cultured overnight on fibronectin-coated hydrogels of varying elasticity. Representative brightfield images show that cells spread on stiff (E = 50 kPa) substrates and adopt a more collapsed morphology on soft (E = 12 kPa) matrices. Data are representative of five independent experiments. Roshni Basu performed these experiments.

50
Figure 2.8 Cell Tension Promotes Perforin Pore Formation and CTL-Mediated Killing (A–C) B16 cells were cultured overnight on stiff (E = 50 kPa) or soft (E = 12 kPa) hydrogels, stained with Hoechst 33342, and treated with the indicated dilutions of perforin (1:1,000 ≈1 µg/ml final concentration) in the presence of 100 µM PI. (A) Schematic diagram of the perforation assay. (B) Representative images before and after perforin treatment on both stiff (top) and soft (bottom) hydrogels. Perforated cells were identified by their PI+ nuclei. (C) Quantification of a representative perforation experiment on hydrogels. Total cell counts are shown in parentheses above each bar. (D) Schematic diagram of a B16 killing assay on hydrogel substrate. (E) OT1 CTLs were added to OVA-loaded B16 cells grown on stiff or soft hydrogels. Specific lysis was quantified by LDH release at the indicated effector to target (E:T) ratios. (F) Schematic diagram of staurosporine-induced apoptosis on hydrogel substrate. (G) B16 cells grown on stiff or soft hydrogels were exposed to the indicated concentrations of staurosporine. Apoptosis was quantified by LDH release. Error bars denote SEM. Data are representative of at least two independent experiments. Roshni Basu, Benjamin Whitlock, and Morgan Huse performed these experiments.

51

52
Figure 2.8 (continued)

53
Figure 2.8 (continued)

54
Figure 2.9 Cell Tension Modulates Perforin Pore Formation Replicate experiments for Figures 2.8C, 11B, and 11D. (A) Quantification of perforin pore formation in B16 cells grown on stiff (E = 50 kPa) or soft (E = 12 kPa) fibronectin-coated hydrogels. (B) Quantification of perforin pore formation in the presence of 7.5 µM latrunculin A (Lat A) or vehicle control (Veh). (C) Quantification of perforin pore formation in the presence of the indicated concentrations of blebbistatin (Bleb) or Veh. (D) Quantification of perforin pore formation in hypertonic (Hyper), hypotonic (Hypo), and isotonic (Iso) medium. A 1:1000 dilution of perforin was used in all experiments except the left graph in (A), which was performed using a 1:25 dilution of a low concentration prep. In all graphs, total cell counts are shown in parentheses above each bar. Roshni Basu, Benjamin Whitlock, and Morgan Huse performed these experiments.

55

56
Figu
re 2
.9 (c
ontin
ued)

57
Figure 2.10 Matrix Stiffness Does Not Alter TCR-Induced Degranulation B16 cells were cultured overnight on fibronectin-coated hydrogels, loaded with OVA as necessary, and then mixed with OT1 CTLs. Representative histogram plots show T cell degranulation on stiff (50 kPa, above) or soft (12 kPa, below) matrices, as assessed by Lamp1 staining. Unstimulated samples (Unstim, no OVA) are shown in solid gray, and stimulated samples (Stim, OVA) in black outline. Mean Fluorescence Intensity (MFI) is indicated for each curve. Data are representative of two independent experiments. Roshni Basu performed these experiments.

58
(Figures 2.11B, 2.9B, and 9C). These results suggested that membrane
tension, rather than cortical tension, controls perforin activity. To further test
this idea, we treated cells with hypotonic and hypertonic buffers, which
increase and decrease, respectively, membrane tension (Figure 2.11C)126.
Pore formation was enhanced by hypotonic buffer and suppressed by
hypertonicity (Figures 2.11D and 2.9D), further supporting the idea that
perforin and membrane tension function synergistically.
2.2.4. Synaptic Force Exertion is Coordinated with Degranulation
Finally, we examined whether perforin release is spatiotemporally
correlated with the application of force at the IS, using a degranulation
probe containing a pH-sensitive GFP (pHluorin) attached to the C-terminal
domain of Lamp1130. pHluorin-Lamp1 is sorted into lytic granules, where its
fluorescence is quenched by the acidic environment. Granule fusion with the
plasma membrane, however, neutralizes the pH around the pHluorin, allowing
it to fluoresce. When CTLs expressing pHluorin-Lamp1 were imaged on
PDMS micropillars coated with H2-Kb-OVA and ICAM-1, degranulation events
appeared as abrupt increases in green fluorescence within the interface
between the CTL and the array (Figures 2.12A and 12B). Most events
occurred within 5 min of initial contact (Figure 2.12C) and many seemed to be
closely associated with hotspots of strong force exertion (Figure 2.12D).
To quantify the relationship between degranulation and force, we
computed the distance between each granule fusion event and the closest
pillar experiencing strong deflections during that time (called the distance to
displaced pillar [DDP]. We then compared each value to a null distribution

59
Figure 2.11 Membrane Tension Potentiates Perforin Pore Formation (A) Diagram schematizing the effects of blebbistatin (Bleb) and latrunculin A (Lat A) on cortical (C) and membrane (M) tension. Lamellipodial F-actin and stress fibers are indicated in orange. (B) B16 cells cultured on plastic were treated with perforin (1:1,000 dilution) in the presence of 100 µM PI and either 100 µM Bleb, 7.5 µM Lat A, or vehicle control (Veh) as indicated. Perforation was quantified by PI incorporation. (C) Diagram schematizing the effects of hypotonic (Hypo) or hypertonic (Hyper) medium on membrane tension. (D) B16 cells cultured on plastic were treated with perforin (1:1,000 dilution) in the presence of 100 µM PI either in isotonic (Iso), hypotonic, or hypertonic medium as indicated. Perforation was quantified by PI incorporation. In (B) and (D), total cell counts are shown in parentheses above each bar. Data are representative of three independent experiments. Roshni Basu performed these experiments.

60

61
Figure 2.11 (continued)

62
Figure 2.12 Degranulation Is Spatiotemporally Correlated with Force Exertion at the IS (A) Diagram schematizing fluorescent detection of degranulation during a micropillar experiment. (B–I) CTLs expressing pHluorin-Lamp1 were imaged on stimulatory micropillar arrays. (B) Representative time-lapse montage showing pillar deflections during a degranulation event (indicated by the yellow arrowhead). Time is indicated in M:SS in the top right corner of each image. (C) Graph of the offset time between contact formation and degranulation (degranulation time). (D) Graphical representation of the pillar array in (B), with the degranulation position depicted as a green circle and the cell envelope at the moment of degranulation shown in black. Pillars are color-coded based on their average deflection during the degranulation. Warmer colors (e.g., orange, red) denote stronger deflections. The DDP for this degranulation is indicated by the double-headed white arrow. (E) Histogram plot derived from the experiment in (B) showing the DDP for each position in the CTL interface. The mean value for the distribution is denoted by the vertical cyan line. The vertical green line indicates the DDP for the degranulation itself. (F) DDPs of degranulation (Degran) were compared to the mean values of their paired null distributions. ∗∗∗p < 0.001, calculated by two-tailed paired t test. (G) Schematic diagram of the CTL-array interface showing the radial shells used for spatial analysis. (H and I) The radial distribution of total force exertion (H) and degranulation position (I) in degranulating cells. Color-coding of the bars corresponds to the shells shown in (G). Gray bars indicate the spatial distribution that would be expected by chance (outer shells are larger than inner ones). All error bars denote SEM. For (C), (F), and (I), n = 49 degranulation events pooled from three independent experiments. Benjamin Whitlock, Weiyang Jin, and Morgan Huse performed these experiments.

63

64
Figure 12 (continued)

65
Figure 12 (continued)

66
generated by performing the DDP calculation for every x-y position within the
interface between the CTL and the array (Figure 2.12E). DDP values
associated with degranulation events were significantly lower than the mean
values of their paired null distributions, indicating that the observed coupling
between granule release and pillar deflection did not occur by chance
(Figure 2.12F). We also quantified the radial distribution of degranulation and
force exertion within the IS (Figure 2.12G) and found that both parameters
were enriched within an annular region slightly more than halfway between the
center of the IS and its outer edge (Figures 2.12H and 12I). Taken together,
these results suggest that CTLs spatiotemporally coordinate cytolytic secretion
with the local application of force, and they also identify a domain within the IS
in which these interactions occur.
Could forces within this degranulation zone apply enough membrane
tension to potentiate perforin pore formation? To address this question, we
first determined the membrane tension change necessary to sensitize a cell to
perforin. Using an established approach in which an optical trap is used to pull
a thin tether of membrane from the cell surface (Figures 2.13A and 13B), we
calculated the membrane tension of adherent B16 cells to be 100 µN/m131. In
the presence of latrunculin A, which protects cells from perforin pore formation
(Figures 2.11B and 2.9B), membrane tension decreased to 15 µN/m. These
data suggest that an ∼85 µN/m difference in membrane tension (equivalent to
85 × 10−18 J/µm2) is sufficient to make perforin pore formation more
energetically favorable (Figure 2.13C). Assuming a pore size of 15 nm, this
tensional difference implies a free energy change of 1.5 × 10⁻²⁰ J per pore. In
micropillar experiments, we routinely observed pillar deflections of >1 µm

67
Figure 2.13 Membrane Tension of B16 Target Cells (A) DIC image showing a membrane tether connecting a B16 cell to a 2 µm diameter polystyrene bead, which is held in an optical trap. (B) Membrane tethers were generated from B16 cells treated with 5 µM Latrunculin A (Lat A) or vehicle control (Veh) as indicated. Tether forces were determined from the displacement of the bead within the optical trap (n ≥ 15 for each sample). (C) Schematic diagram of the reaction coordinate for perforin pore formation in a membrane, illustrating how increased membrane tension can effectively reduce the activation barrier of the process. ΔGP = free energy of pore formation, ΔGT = free energy of tension release. Roshni Basu performed these experiments.

68
within force exertion hotspots. Each of these strong deflections required >340
pN of force (Figure 2.4D), implying the transfer of >170 × 10−18 J of
mechanical energy within an ∼1 µm2 region of the array. This degree of energy
transmission (170 × 10−18 J/µm2) compares favorably with the tensional
change (85 × 10−18 J/µm2) demonstrated by the tether experiments to
modulate perforin activity, and it would be sufficient, in principle, to
mechanically potentiate a large number of pores. Hence, under conditions of
close synaptic contact, CTLs should be capable of locally sensitizing the target
cell membrane to perforin.
2.3. Discussion Communication between immune cells is generally presented as a
chemical process based on ligand recognition by receptors. It is becoming
increasingly clear, however, that mechanical forces at cell-cell interfaces are
necessary both to enable and to regulate communicative chemical
interactions. Recent studies have documented the importance of cytoskeletally
driven pulling for receptor activation and antigen uptake, which are both
processes that mediate information flow into the lymphocyte69,132,133. Our
results demonstrate that physical forces can also modulate information flow
out of the cell, in this case by potentiating the activity of a secreted protein,
perforin. This synergy between applied force and outgoing chemical signals,
which we term mechanopotentiation, conceptually expands the purview of
cellular mechanics as an active mediator of not only afferent but also efferent
intercellular communication.
It has been proposed that the IS enhances the intensity and specificity
of intercellular communication by restricting the diffusion of secreted

69
factors13,134,135. Studies of cytokine-mediated communication, however,
indicate that soluble proteins escape the T cell-target cell interface very
quickly136–138. An alternative strategy for boosting selectivity and efficiency
would involve locally increasing the specific activity of secreted molecules.
Synaptic mechanopotentiation of perforin pore formation falls into this second
class of mechanisms. Synergy between force exertion and perforin activity
would reduce the amount of degranulation required for each killing event and
thereby limit bystander damage resulting from excessive cytolytic secretion. It
would also facilitate serial killing by enabling CTLs to reserve perforin and
granzyme for other targets. We expect that other cytotoxic lymphocytes will
also employ this strategy.
Our results demonstrate that NMII is critical for force exertion at the IS.
This is surprising given that myosin activity is dispensable for IS formation and
only modestly affects synaptic architecture113–115. We also found that depletion
of NMII reduced CTL-mediated cytotoxicity, implying that myosin-dependent
forces contribute to mechanopotentiation during target cell killing. Although we
favor this interpretation, it must be noted that CTLs lacking NMII also exhibit
delayed centrosome polarization117. A partial polarity defect could affect
cytotoxicity by altering the directionality of cytolytic secretion. Hence, at this
stage we cannot attribute the killing phenotype of NMII-deficient cells solely to
a defect in force exertion.
Perforin pores drive target cell killing by inducing a membrane repair
response that stimulates the uptake of additional perforin and granzymes57,58.
Although the methods used in this study assessed the effects of cellular
mechanics on initial pore formation, they did not address whether force might

70
also modulate membrane repair downstream. Membrane tension has been
implicated in the regulation of both exo- and endocytosis in multiple cell
types139. It is therefore quite plausible that CTL-induced distortions within the
IS could influence membrane repair and in this manner control not only the
initiation but also the progression of cytotoxicity.
F-actin accumulates in the periphery of the IS and is depleted from the
center, forming a stereotyped annular pattern107. Lytic granules cluster
beneath the center of the F-actin ring, and it has been proposed that they
release their contents primarily by fusing with the actin-free plasma membrane
in this region14,134. Using a fluorescent probe for degranulation, we found that
cytolytic secretory events are not enriched in the very center of the IS, but
rather in an intermediate domain that overlaps with the region of strongest
force exertion. In the canonical IS, this intermediate zone is occupied by the
inner aspect of the F-actin ring and clusters of integrin; it therefore contains
the adhesive and cytoskeletal machinery required to transmit force140. Super-
resolution imaging studies have demonstrated that this zone can also
accommodate the formation of actin hypodense regions of plasma membrane
suitable for vesicle fusion130,141. Accordingly, we favor a model in which
degranulation occurs at the border between the central F-actin-depleted area
and the peripheral F-actin ring. This would enable the CTL to balance the
physical requirements of exocytosis with the benefits of synaptic
mechanopotentiation.
The striking spatiotemporal correlation we observed between lytic
granule release and force exertion suggests that CTLs create local mechanical
hotspots on the target cell surface that are particularly sensitive to perforin.

71
Although the fluid nature of lipid bilayers generally promotes rapid equilibration
of applied force, local interactions with the cytoskeleton have been shown to
generate inhomogeneities in tension139. The idea that physical
inhomogeneities of this kind could be established within dynamic and strongly
adhesive interfaces, such as the IS, is quite intriguing, and represents an
interesting topic for future studies.
The mechanical component of cytotoxicity could be particularly
important in the context of anti-cancer immunity. Within solid tumors, cells tend
to be stiffer because of enhanced cytoskeletal contractility and extracellular
matrix rigidity142. Although increased stiffness would be expected to promote
CTL-mediated killing, any advantage gained by the immune system would
likely be overwhelmed by the tolerogenic signals that prevail within the tumor
microenvironment143. During metastatic dissemination, however, cells from the
tumor move away from this immunosuppressive milieu. In that regard, it is
interesting to note that isolated cancer cells tend to be softer than their non-
transformed counterparts144–146. This deformability could enable them to
resist immune-mediated attack when outside of the tumor microenvironment.
The intricate cytoskeletal dynamics of lymphocyte synapses include
both actin flows that propagate in the plane of the interface and filopodial
protrusions that can deform the surface of the target cell70,108,109,147,148. As we
work to define the functional relevance of these and other structures, it will be
important to consider their capacity to transmit information physically during
the effector phase of lymphocyte responses. Mechanical forces are well suited
for rapid and highly compartmentalized signaling within cell-cell interfaces and
72
as such, they represent a valuable mode of intercellular communication in
complex environments.
2.4. Materials and Methods 2.4.1. Mice
The animal protocols used for this study were approved by the
Institutional Animal Care and Use Committee of Memorial Sloan-Kettering
Cancer Center.
2.4.2. Cell culture and transductions CTLs were prepared by mixing T cells from OT-1 αβTCR transgenic
mice (Taconic) with irradiated congenic splenocytes pulsed with 100 nM OVA
and cultured in RPMI medium containing 10 % (vol/vol) FCS. Cells were
supplemented with interleukin 2 (IL2, 30 IU/ml) after 24 h and were split as
needed in RPMI containing IL-2. B16-F10 cells were maintained in DMEM
containing 10 % (vol/vol) FCS, while RMA-s and EL4 cells were grown in
RPMI containing 10 % (vol/vol) FCS.
Expression constructs for shNT, shDock2, shPTEN, shMyH9, and
pHluorinLamp1 have been described8,117,130. To prepare retrovirus, Phoenix E
cells were transfected with expression vectors together with packaging
plasmids using the calcium phosphate method. Ecotropic viral supernatants
were collected after 48 hr at 37°C and added to OT-1 blasts 2 days after
primary peptide stimulation. Mixtures were centrifuged at 1400 × g in the
presence of polybrene (4 µg/ml) at 35°C. T cells were then split 1:3 in medium
containing IL-2.

73
2.4.3. Pillar studies Micropillar coating and data acquisition. For coating, arrays were
washed with ethanol and phosphate buffered saline (PBS) and then incubated
in Alexa568-labeled streptavidin (20 µg/ml in PBS) at room temperature for at
least two hours. After further washing in PBS, the arrays were incubated with
biotinylated H2-Kb -OVA and ICAM-1 (each 20 µg/ml in PBS) for 2 hours at
room temperature. The pillars were then washed into colorless RPMI
containing 5% FCS (Imaging medium). Data acquisition was implemented
using Metamorph software. For standard force quantification experiments
(Figure 2.4), brightfield, Alexa488 (CTL), and Alexa568 (pillars) images were
collected every 15 s. For degranulation experiments (Figure 2.12), brightfield,
Alexa488 (degranulation), Alexa647 (CTL), and Alexa568 (pillars) images
were collected every 20 s. Images were exported as tif files and aligned using
a custom Matlab script.
2.4.4. Micropillar deflection analysis Center of gravity (COG) projections of pillar deflections were
determined by calculating the projection of each deflection along a line
connecting the pillar to the COG of the CTL footprint. Degranulation events
were identified as an abrupt increase in GFP fluorescence. To determine the
DDP (Distance to Displaced Pillar) parameter for a degranulation event,
average deflections were 2 determined for the time period beginning 40 s
before degranulation and extending 120 s after. “Strongly deflected” pillars
were then identified as pillars with mean deflections ≥ 0.75 × the mean
deflection of the most strongly deflected pillar during this time frame. The
distance between the degranulation position and the closest “strongly

74
deflected” pillar was defined as the DDP. DDP values for degranulation events
were compared to null distributions generated by performing the DDP
calculation for every position in the CTLarray interface at the time of
degranulation. Paired analysis of degranulation DDPs and mean DDPs from
null distributions was carried out using Prism (GraphPad). Radial shell
analysis was performed by determining the position of relevant pillars and
degranulation events along a segment beginning at the COG of the interface
(assigned a value of 0) and ending at the edge of the interface (assigned a
value of 10). The mechanical energy required for pillar deflections was
calculated using the following expression (E = Fd/2), where E is the energy, F
is the force, and d is the length of the deflection.
2.4.5. Cytotoxicity assays RMA-s cells labeled with the membrane dye PKH26 (Sigma-Aldrich)
were pulsed with varying concentrations of OVA and mixed 1:1 in 96-well
plates with OT-1 CTLs. After 6 hr at 37° C, samples were treated with 2.5 mM
EDTA to disrupt conjugate formation and specific lysis of PKH26+ target cells
was assessed by flow cytometry as described149.
B16-F10 cells were cultured overnight on fibronectin-coated hydrogels
in the presence of 20 ng/ml IFNγ, which was included to induce upregulation
of class I MHC. They were then loaded with 100 nM OVA for 1 hour and
washed three times in lactate dehydrogenase (LDH) release assay medium
(RPMI with 5% vol/vol FCS). OT-1 CTLs were added at various effector to
target (E:T) ratios and incubated for 5 hr at 37° C in LDH medium. Target cell
death was quantified with an LDH cytotoxicity assay kit (Clontech) using the
manufacturer’s recommended protocol. All measurements were performed in

75
triplicate. To assess degranulation responses, CTLs were added to B16-F10
cells at a 1:1 E:T ratio and incubated for 2 hr at 37° C in the presence of
eFluor660 conjugated anti-Lamp1 antibody (1 µg/ml, Clone 1D4B,
eBiosciences). Staining was quantified by flow cytometry. In staurosporine-
induced apoptosis assays, B16 cells cultured on fibronectin-coated hydrogels
were treated with varying concentrations of 3 staurosporine, and lysis was
quantified by LDH release after 17 h at 37 C.
2.4.6. Perforin pore formation in microwells PDMS grids containing 50 × 50 × 50 µm wells were submerged in
imaging medium and seeded with CFSE-labeled RMA-s cells that had been
pulsed with 1 µM OVA. In general, individual wells contained one to three
RMA-s cells; 100 µM PI (Life Technologies) was added to the medium
to enable real-time visualization of perforated cells. Then, CTLs expressing
shNT or shPTEN together with CFP were added and the cells imaged using a
20× objective lens (Olympus) at 6-min intervals for 8 hr. Brightfield, GFP, CFP,
and PI images were collected at each time point. Quantification was restricted
to target cells forming synapses with only one T cell during the first 6 hr of the
imaging experiment. All cells in this category were scored for the time of initial
IS formation and also for the first appearance of PI signal above background.
2.4.7. Micropipette preparation and calibration Tapered micropipettes were prepared by pulling borosilicate glass
capillaries (1 mm OD, 0.78 mm ID, Harvard Apparatus) with a P-97 device
(Sutter Instruments). A microforge (MF-200, WPI) was used to cut the bead
micropipette and the rigid CTL micropipette at the desired diameters (typically
1 µm and 3 µm, respectively). Another microforge (MF-900, Narishige) was

76
then used to introduce a 90° bend at the end of the bead micropipette. 45°
angles were also introduced into the bodies of both pipettes to position their
extremities orthogonal to the imaging plane during experiments. The bending
stiffness k of the bead micropipette was measured by pushing its tip against
the tip of a thicker micropipette of known stiffness. A single-axis piezo
translation stage (Thorlabs) was used to move the bead micropipette in a
sinusoidal fashion and the position of each tip was detected at 30Hz using a
homemade Labview program (National Instruments). The observed ratio of
pipette deflections was then used to deduce the stiffness of the bead
micropipette (typically k = 0.1 nN/µm).
2.4.8. Micropipette-Based Force Measurements Stimulatory beads were prepared by coating 6-µm diameter
streptavidin-coated polystyrene particles (Spherotech) with biotinylated H2-Kb-
OVA and ICAM-1 (1 µg/ml each) for 2 hr in 20 mM HEPES pH 7.5, 150 mM
NaCl, 2% w/v BSA. Micropipettes for stimulatory beads and CTLs were
prepared from borosilicate glass capillaries (1 mm OD, 0.78 mm ID, Harvard
Apparatus). Imaging was carried out in an open top, environmentally
controlled chamber mounted on an inverted microscope (Nikon TE300)
equipped with a 100× objective lens. The rigid CTL micropipette was attached
to a motorized micromanipulator (MP285, Sutter Instruments) and the bead
micropipette to manual micrometers (Thorlabs). Beads were aspirated into the
tip of the calibrated micropipette by applying ∼6 kPa aspiration pressure using
a syringe (typically 1 ml air volume depression). Two hundred pascals of
pressure (applied using a water reservoir) was used to aspirate a CTL into the
tip of the rigid pipette. Time-lapse recordings were started just before the CTL

77
was gently brought into contact with the bead. In general, 50 ms brightfield
exposures were taken at 2-s intervals for 3–5 min using Micromanager
software. The deflection of the flexible micropipette was determined by
tracking the position of the bead using a customized ImageJ macro110. Bead
position was determined with a precision of <60 nm, corresponding to a
precision in force better than 6 pN for probe bending stiffness k = 0.1 nN/µm.
2.4.9. Cellular perforation assay Twenty-four hours prior to imaging, B16-F10 cells were plated at
104cells/100 µl/well in either fibronectin-coated 96-well plates (Costar) or in 96-
well flat-bottom plates coated with polyacrylamide hydrogels (Matrigen)
and fibronectin. One hour prior to imaging, cells were transferred into C+ buffer
HBSS (Hank’s balanced salt solution) with 10 mM HEPES pH 7.2, 4 mM
CaCl2, 2 mM MgCl2, 0.4% BSA) containing Hoechst 33342 stain (1:2,000,
Invitrogen). PI (100 µM final concentration) was added along
with Blebbistatin (Sigma) or Latrunculin A (Sigma) as necessary. After 5 min,
Hoechst and PI images were collected at 2-min intervals for 30 min using an
inverted wide-field microscope (Zeiss Axiovert 200M, Metamorph acquisition
software) fitted with a 5× objective lens (Zeiss). Dilutions of purified perforin in
50 µl C− buffer (HBSS, 10 mM HEPES pH 7.2, 1 mM EGTA, 0.4% BSA) were
added 4 min into the imaging run. To vary tonicity, hypertonic (+150 mM
sucrose) or hypotonic (H2O instead of HBSS) C+ and C− buffers were used
instead of isotonic C+ and C−.

78
2.4.10. Perforin purification and fibronectin coating for perforation assay
Human perforin was purified from YT-Indy cells as described150, but
using the following modified relaxation buffer: 100 mM KCl, 3.5 mM MgCl2, 10
mM PIPES pH 6.8, 1.25 mM EGTA, and 1 mM ATP. Perforin is a metastable,
hydrophobic molecule with a tendency to aggregate. The overall activity of
each preparation varied considerably, and the activity of any one preparation
changed over the course of a few hours. To circumvent this issue, we
collected each experimental condition either right before or right after its
associated control, and switched the order of data collection in repeat
experiments. This enabled us to observe robust relative changes, despite the
day-to-day variation in overall perforin activity. For coating, plastic wells were
incubated with 10 µg/ml fibronectin (Calbiochem) for 1 hr at 37° C, and
polyacrylamide hydrogels (Matrigen) were incubated with 10 µg/ml fibronectin
for 30 min at room temperature.
2.4.11. Lytic granule polarization OT-1 CTLs expressing shNT, shDock2, or shPTEN together with GFP
were mixed 1:1 with EL4 thymoma cells that had been loaded with 1 µM OVA.
After 10 min, cells were transferred into warm HBSS, attached to poly-D-
lysine-coated coverslips, and fixed with 4% paraformaldehyde. After washing
with PBS and permeabilization with 0.2% Triton X-100 in PBS, cells were
blocked with PBS + 10% normal goat serum and then incubated in blocking
buffer containing antibodies against Lamp1 (eBioscience, clone 1D4B, 1:200
dilution) and pericentrin (Abcam, rabbit polyclonal, 1:200 dilution) overnight at
4° C. Cells were then washed in PBS and incubated in blocking buffer

79
containing Alexa594 labeled anti-Rat antibodies and Alexa647 labeled anti-
Rabbit antibodies (both 1:1000 dilution) for 2 hr at 4° C. After a final wash in
PBS, Cells were mounted on glass slides and sealed. CTL-target cell
conjugates were imaged using an inverted fluorescence microscope (Olympus
IX-81) fitted with a 65× objective lens (Olympus). In addition to a brightfield
image, z-stacks (1 µm increments, 20 µm total) of Alexa594, Alexa647, and
GFP were collected for each field of view. Lytic granule polarization was
quantified using projection images derived from the z-stack data. For each
CTL, intensity thresholding was used to establish a mask encompassing the
lytic granule compartment. Polarization of this mask toward the IS was then
quantified by calculating a polarization index = (Distance between the IS and
the center of gravity of the granule mask)/(Distance between the IS and the
opposite side of the CTL). T-test analysis of the resulting distributions was
performed in Prism.
2.4.12. Immunoblot 0.2-1 × 10⁶ CTLs were lysed in ice cold buffer containing 10 mM
TrisHCl, 5 mM EDTA, 1% NP-40, 0.5% sodium deoxycholate, and 0.15 M
NaCl. Perforin expression was assessed using a rabbit polyclonal antibody
(Cell Signaling). Actin served as a loading control (clone AC-15, Sigma).
2.4.13. Ca2+ imaging CTLs were loaded with 5 µg/ml Fura-2AM and then added to glass or
PDMS surfaces that had been coated with H2-Kb -OVA and ICAM-1.
Stimulatory PDMS was prepared as described above and glass surfaces were
coated using an established protocol149. Fura2 images using 340 nm and 380
nm excitation were acquired every 30 seconds for 20–30 min with a 20×

80
objective lens (Olympus). Single cell Ca2+ responses were quantified by
normalizing the Fura2 ratio of each cell using the last image before the initial
rise in Ca2+.

81
CHAPTER 3: INSIGHTS INTO ADOPTIVE CELL THERAPIES FROM MODULATING
PI3K IN A TRANSPLANTABLE MELANOMA MODEL
3.1. Introduction For decades, there has been great interest in using the immune system
to treat cancer. Recently, several pioneering strategies have emerged that
have reinvigorated the field, especially with respect to the idea of ACTs as a
way to treat cancer96,98. These treatments involve isolating a patient’s cells
from peripheral blood and expanding them ex vivo. When the cells are being
cultured ex vivo, they can be treated with various cytokine cocktails or
transfected with various plasmids. Constructs of interest include ones to drive
expression of an engineered receptor such as a CAR, which targets the T cell
to attack cells expressing tumor antigens like CD19. These expanded cells are
then transferred back into the patient where they attack the patient’s cancer.
We wondered whether the shRNA targeting PTEN we had identified
and characterized previously would be a viable way to increase the killing
capacity of T cells in vivo and to improve ACTs. We hypothesized that
increasing the cytotoxic potential of T cells used in ACT would increase the
efficiency of ACT. We chose to examine ACT using a mouse melanoma
model151,152. Surprisingly, we found that T cells expressing the shRNA
targeting PTEN performed worse than control cells despite exhibiting
increased cytotoxicity in vitro. We discovered that shPTEN T cells experienced
reduced persistence in vivo that diminished their ability to form an anti-tumor
82
response and to control tumor growth. This provided us with an opportunity to
examine how migration, survival, and proliferation contribute to persistence.
We discovered that shPTEN CTLs have defects in migration and homeostatic
proliferation, which contribute to reduced persistence relative to control CTLs.
3.2. Results 3.2.1. PTEN depletion increases cytotoxicity
Even though PTEN depletion has been previously shown to enhance T
cell cytotoxicity in vitro8,153, we wanted to demonstrate that the increase in
cytotoxicity we observe with shPTEN CTLs was not due to an off-target effect
of the shRNA. To do this, we isolated OT-1 T cells from a mouse expressing
Cas9 in the Rosa26 locus and transduced them with a retroviral construct to
express a gRNA targeting PTEN154. Complete deletion of PTEN was
confirmed by Western Blot (Figure 3.1A). Next, we assessed the cytotoxic
capacity of PTEN depleted cells, comparing cells that were treated with the
shRNA and the gRNA. We found that both methods of deleting PTEN result in
increased cytotoxicity relative to nontargeting control constructs (Figure 3.1B).
This shows that the increase in cytotoxicity we observe is due to PTEN
depletion and not off target effects of an shRNA.
3.2.2. PTEN depletion reduces anti-tumor effect We next assessed the effect shPTEN CTLs had on tumor rejection using a
transplantable B16-OVA melanoma model to evaluate ACT151,152. A schematic
of the experimental outline is shown in 3.2A. Mice were implanted with 2x10⁵
B16-OVA cells subcutaneously (s.c.) and small tumors were allowed to
develop. After 7-9 days, the mice were sublethally irradiated with 600cGy to
establish a lymphopenic environment. The following day, 1x10⁶ CTLs

83
transduced with either a control shNT or shPTEN vector were transferred to
the mice by i.v. injection. The tumors were then monitored over the next few
weeks and measured with calipers. We observed an impaired anti-tumor
response in mice that received shPTEN CTLs relative to control mice (Figure
3.2B). This was unexpected as we thought the mice receiving shPTEN CTLs
would experience an enhanced anti-tumor effect given their increased
cytotoxicity in vitro (Figure 3.1B). This provided us with an intriguing
opportunity to study the components of ACT necessary for anti-tumor effects
that are independent of cytotoxicity.
Figure 3.1 PTEN depletion enhancing cytotoxicity (A) PTEN was depleted using CRISPR/Cas9 and knockout was confirmed by Western Blot.(B) We observed a similar increase in cytotoxicity when we deleted PTEN using CRISPR/Cas9 as shRNA. The provided Western Blot was cropped from a single membrane to display the relevant bands. Error bars denote SEM.
10-11 10-10 10-9 10-8 10-70
20
40
60
80
Spec
ific
lysi
s (%
) shNTshPTENgRNA NTgRNA PTEN
Peptide (M)
Actin
A
B
PTEN
PTEN
NT PTEN
NT
shRNA gRNA

84
3.2.3. PTEN deficient T cells fail to persist in vivo To understand the diminished anti-tumor effect observed for mice
receiving shPTEN CTLs, we conducted experiments to monitor persistence of
the cells. We adapted our experimental setup to utilize congenic recipients.
This provided us with a way to differentiate host cells from transferred cells.
We transferred a 50:50 mixture of congenically marked CD45.1/2 CTLs
expressing shPTEN and shNT into a tumor bearing recipient mice expressing
CD45.2 (Figure 3.3A). We distinguished shPTEN and shNT cells by marking
them with different fluorescent reporters.
Figure 3.2 PTEN deletion results in reduced anti-tumor effect in vivo (A) Schematic showing experimental procedure where B16-OVA cells were implanted and OT-I cells were transferred after 9 days. (B) Tumor growth was measured over 15 days post transfer of T cells transduced to express the indicated shRNA. Error bars denote SEM.
0 5 10 150
1000
2000
3000
Days post T cell transfer
Tum
or v
olum
e (m
m3 )
PBSshNTshPTEN
-1 0 0+
Tumorsimplanted
s.c.
Sublethalirradiation(600cGy)
50:50 mixturetransferred
by i.v.
Tumorsmeasured
A
Days postT cell transfer-9
B

85
Figure 3.3 PTEN depleted T cells have reduced persistence in vivo (A) Schematic showing the experimental procedure where a mixture of CD45.1/2 expressing T cells were transferred into a tumor bearing CD45.2 recipient. (B) Organs were harvested at the indicated times and analyzed for the presence of transferred cells. The draining lymph node (dLN), non-draining lymph node (ndLN), and mesenteric lymph node (mLN) were also analyzed. (C) Additional organs were analyzed for the presence of shPTEN T cells after 3 days. Error bars denote SEM.

86
Tran
sfer
redDay
6
Day 13
Day 16
Day 20
0.0
0.5
1.0
1.5
Nor
mal
ized
rat
io(s
hPTE
N /
shN
T) Blood
-1 0 6+
Tumorsimplanted
s.c.
Sublethalirradiation(600cGy)
50:50 mixturetransferred
by i.v.
Organsharvest
A
B
Days postT cell transfer
Tran
sfer
redDay
6
Day 13
Day 16
Day 20
0.0
0.5
1.0
1.5
Nor
mal
ized
rat
io(s
hPTE
N /
shN
T) dLN
Tran
sfer
redDay
6
Day 13
Day 16
Day 20
0.0
0.5
1.0
1.5
Nor
mal
ized
rat
io(s
hPTE
N /
shN
T) TumorTr
ansf
erre
dDay
6
Day 13
Day 16
Day 20
0.0
0.5
1.0
1.5
Nor
mal
ized
rat
io(s
hPTE
N /
shN
T) Spleen
Tran
sfer
redDay
6
Day 13
Day 16
Day 20
0.0
0.5
1.0
1.5
Nor
mal
ized
rat
io(s
hPTE
N /
shN
T) ndLNTr
ansf
erre
dDay
6
Day 13
Day 16
Day 20
0.0
0.5
1.0
1.5
Nor
mal
ized
rat
io(s
hPTE
N /
shN
T) Liver
Tran
sfer
redDay
6
Day 13
Day 16
Day 20
0.0
0.5
1.0
1.5
Nor
mal
ized
rat
io(s
hPTE
N /
shN
T) mLN
Tran
sfer
redDay
6
Day 13
Day 16
Day 20
0.0
0.5
1.0
1.5
Nor
mal
ized
rat
io(s
hPTE
N /
shN
T) Lung
-9
C
Tran
sfer
red
Blood
Spleen
Bone Mar
rowBra
inGut0.0
0.5
1.0
1.5
Nor
mal
ized
rat
io(s
hPTE
N /
shN
T)

87
We found that that within 6 days after transfer there was a reduced ratio
of shPTEN cells to shNT control cells in all organs (Figure 3.3B). PTEN
depleted T cells seemed to stay in the lungs and liver temporarily. However,
the shPTEN cells were not present in the secondary lymphoid organs
including the spleen and various lymph nodes (Figure 3.3B). We assessed
whether the shPTEN cells could be homing to other tissues and examined the
gut, bone marrow, and brain (Figure 3.3C). The shPTEN cells found in these
tissues were at similar ratios to control cells as previously found (Figure 3.3B).
Hence, depletion of PTEN induced a persistence defect after adoptive transfer
into lymphopenic recipients.
3.2.4. Persistence defect not due to shRNA specificity We wanted to test whether the persistence phenotype we observed for
CTLs expressing shPTEN could be an off-target effect of the shRNA. To
address this, we conducted co-transfer experiments using multiple methods of
depleting PTEN. We depleted PTEN using the CRISPR/Cas9 system and
performed a co-transfer experiment with a nontargeting gRNA. We also
examined whether the phenomenon we had only observed in CD8+ T cells
could also occur in CD4+ T cells by transducing polyclonal T cells isolated from
a mouse expressing the PTENfl/fl allele with a retroviral Cre155. We observed
the same loss of CTLs in mice that received Cas9/gRNA and shRNA treated
cells (Figure 3.4A). Furthermore, we observed the same effect when we
adoptively transferred polyclonal T cells isolated from PTENfl/fl mice and
transduced with Cre or an empty vector control into a lymphopenic recipient
mouse (Figure 3.4B). Interestingly, we found that CD4+ T cells seemed to also
be affected but to a lesser degree than CD8+ T cells. This suggested to us that

88
the loss of PTEN deficient cells we were observing was the direct result of
PTEN loss and not an off-target effect.
These observations agree with previous work demonstrating that T cells
with a constitutively active AKT had a defect in persistence following LCMV
infection156. This is also consistent with work showing that enhancing PI3K
signaling in thymocytes isolated from Lck-Cre PTENfl/fl mice reduces their
persistence in a PDK1 dependent manner157. Together, these results
demonstrate that modulating PI3K signaling has detrimental effects on T cell
persistence in vivo.
Persistence of shPTEN cells in vivo is reflective of several factors
including survival, migration, and proliferation. As adoptively transferred cells
Figure 3.4 Loss of PTEN depleted cells is not due to shRNA Co-transfer experiments confirmed that depleting PTEN by CRISPR/Cas9 (A) and by transducing PTENfl/fl cells with Cre (B) phenocopy loss of shPTEN cells(A). Error bars denote SEM.
Tran
sfer
red
SpleenLive
r
Tum
or0.0
0.5
1.0
1.5
Nor
mal
ized
rat
io(s
hPTE
N /
shN
T)
shRNA
Tran
sfer
red
SpleenLive
r
Tum
or0.00.51.01.52.0
Nor
mal
ized
rat
io(C
re /
cont
rol)
PTENfl/fl CD4 T cells
Tran
sfer
red
SpleenLive
r
Tum
or0.0
0.5
1.0
1.5
Nor
mal
ized
rat
io(P
TEN
/ N
T gR
NA
) gRNA
Tran
sfer
red
SpleenLive
r
Tum
or0.0
0.5
1.0
1.5
Nor
mal
ized
rat
io(C
re /
cont
rol)
PTENfl/fl CD8 T cells
A
B

89
migrate through secondary lymphoid organs, they are exposed to survival
signals158. If transfer occurs into a lymphopenic host, the lymphocytes will
undergo homeostatic expansion, which can further obfuscate persistence. In
order to properly understand the persistence defect of shPTEN T cells, we
sought to disentangle these components and evaluate them separately.
3.2.5. PTEN deficient T cells have a defect in migration We wanted to assess whether the defect in persistence we observed
could be the result of a trafficking defect. We designed a series of short-term
migration experiments to assess the ability of shPTEN CTLs to migrate in vivo.
We transferred a 50:50 mixture of shPTEN and shNT cells as before (Figure
3.3A). Tissues were processed and analyzed 2 hours post transfer. At this
time point, most of the shNT and shPTEN cells were isolated from the lungs
and liver. An appreciable number of cells could also be found in the blood,
spleen, lymph nodes, and tumor, however, enabling comparative analysis.
The ratio of shPTEN to shNT cells was reduced within two hours after transfer
(Figure 3.5A). The shPTEN T cells were unable to migrate to secondary
lymphoid organs (Figure 3.5A-D). shPTEN T cells were mainly found in the
liver and lungs, but did not persist in these tissues long enough and were not
present after 6 days (Figure 3.3B). Between the 2 hour and 22 hour time point,
there was a significant loss of shPTEN cells in the blood and an increase in
the number of cells in the liver (Figure 3.5A-D). There was also an increase in
the number of shPTEN cells in the spleen at 22 hours even though the ratio is
unchanged. These data suggest that PTEN deficient cells have a defect in
migration in vivo.
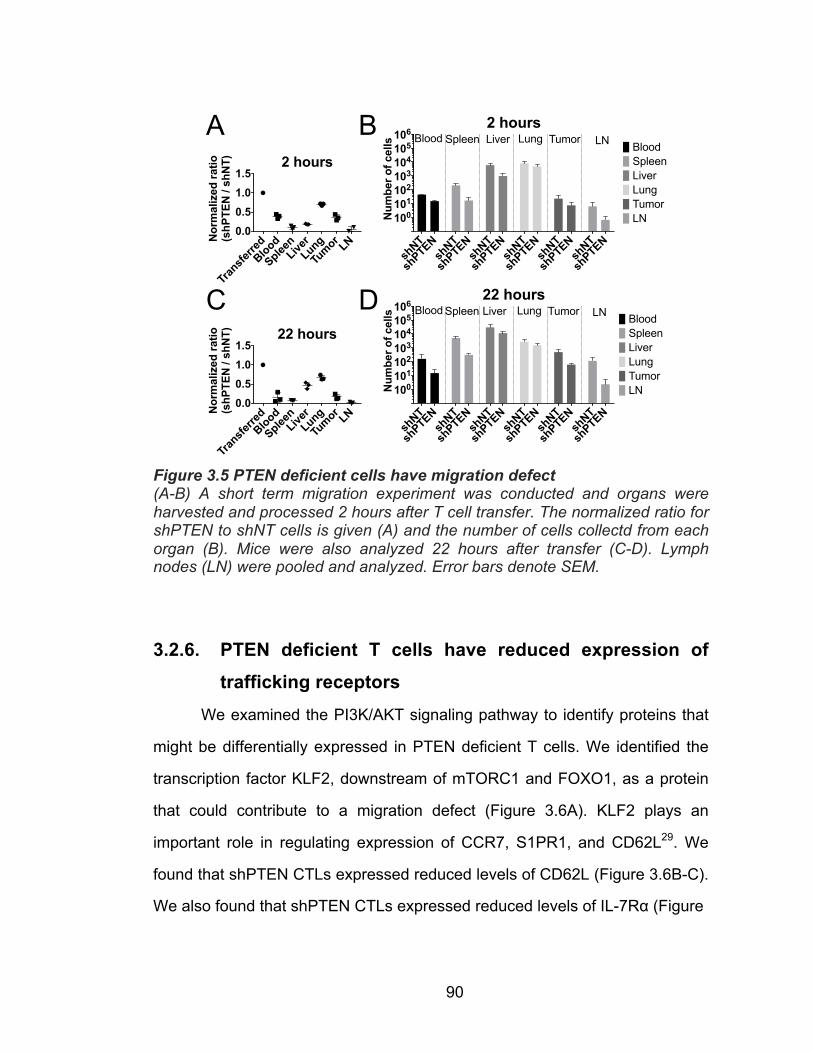
90
3.2.6. PTEN deficient T cells have reduced expression of trafficking receptors
We examined the PI3K/AKT signaling pathway to identify proteins that
might be differentially expressed in PTEN deficient T cells. We identified the
transcription factor KLF2, downstream of mTORC1 and FOXO1, as a protein
that could contribute to a migration defect (Figure 3.6A). KLF2 plays an
important role in regulating expression of CCR7, S1PR1, and CD62L29. We
found that shPTEN CTLs expressed reduced levels of CD62L (Figure 3.6B-C).
We also found that shPTEN CTLs expressed reduced levels of IL-7Rα (Figure
Figure 3.5 PTEN deficient cells have migration defect (A-B) A short term migration experiment was conducted and organs were harvested and processed 2 hours after T cell transfer. The normalized ratio for shPTEN to shNT cells is given (A) and the number of cells collectd from each organ (B). Mice were also analyzed 22 hours after transfer (C-D). Lymph nodes (LN) were pooled and analyzed. Error bars denote SEM.
Tran
sfer
red
Blood
SpleenLive
rLung
Tum
orLN
0.0
0.5
1.0
1.5
Nor
mal
ized
rat
io(s
hPTE
N /
shN
T) 2 hours
Tran
sfer
red
Blood
SpleenLive
rLung
Tum
orLN
0.0
0.5
1.0
1.5
Nor
mal
ized
rat
io(s
hPTE
N /
shN
T) 22 hours
A B
C D
shNT
shPTEN
shNT
shPTEN
shNT
shPTEN
shNT
shPTEN
shNT
shPTEN
shNT
shPTEN
100101102103104105106
Num
ber
of c
ells
2 hoursBloodSpleenLiverLungTumorLN
Blood Spleen Liver Lung Tumor LN
shNT
shPTEN
shNT
shPTEN
shNT
shPTEN
shNT
shPTEN
shNT
shPTEN
shNT
shPTEN
100101102103104105106
N
umbe
r of
cel
ls
22 hoursBloodSpleenLiverLungTumorLN
BloodSpleen Liver Lung Tumor LN

91
Figure 3.6 Enhancing PI3K signaling disrupts expression of key receptors (A) Diagram of PI3K signaling showing the proteins that are disrupted by depleting PTEN. (B) CD62L expression was reduced on shPTEN T cells. (C) CD62L and IL-7Rα was increased by treating cells with 2ng/mL IL-15 and 2nM rapamycin (R). (D) Expression of KLF2, S1PR1, and CCR7 was assessed by qPCR and found to be reduced in shPTEN CTLs.
0 102 103 104 105
<APC-Cy7-A>: IL7Ra
0
20
40
60
80
100
% o
f Max
0 102 103 104 105
<PE-Cy7-A>: CD62L
0
20
40
60
80
100
% o
f Max
A
B C
D
0 102 103 104 105
100
80
60
40
20
0
CD62L
% o
f Max
100
80
60
40
20
0
% o
f Max
0 102 103 104 105
IL-7Rα
shNTshPTEN
shNT
shPTEN
0
1
2
3
Rel
ativ
e ex
pres
sion
S1PR1
shNT
shPTEN
0
1
2
3CCR7
Rel
ativ
e ex
pres
sion
shNT
shPTEN
0
1
2
3KLF2
Rel
ativ
e ex
pres
sion
mTORC1'Raptor'
PIP3'
AKT'
mTORC2'Rictor'
PDK1'Dock2'Elmo'
Rac'
Ac9n'dynamics'
CD62L'
FOXO1'
ILB7Rα'KLF2'
S1PR1' CCR7'
PIP2'
PI3K'
TCR'+'LFAB1'
PTEN'

92
3.6C). Furthermore, we found that the expression of KLF2 was reduced by
qPCR. We also observed reduced expression of CCR7 and S1PR1 in
shPTEN CTLs by real time polymerase chain reaction (RT-PCR) (Figure
3.6D). These results agree with previous data implicating PI3K signaling in T
cell migration9,157. However, the observation that shPTEN cells have a defect
in migration does not rule out other defects that might contribute to defective
persistence.
3.2.7. PTEN deficient T cells have increased cell survival in vitro
Previous research has identified PTEN as a tumor suppressor as its
loss promotes increased cell growth and proliferation159,160. We hypothesized
that PTEN deficiency in T cells would drive a similar increase in cell survival
and proliferation through PI3K and AKT signaling. However, T cell survival in
vivo and homeostatic proliferation are driven by IL-7 and IL-15161. We found
that IL-7Rα was downregulated on shPTEN CTLs (Figure 3.6C). We
wondered whether this would effect the survival of shPTEN T cells in vivo
where they depend on IL-7. We also wondered whether the increase in cell
survival and proliferation associated with PTEN loss would occur in T cells
moving from a high nutrient environment in vitro to a low nutrient environment
in vivo. To assess these possibilities, we designed a survival assay to monitor
T cell survival in low nutrient conditions. To understand how cytokine signaling
could impact cell survival in low nutrient conditions, we incorporated a variety
of cytokine conditions into the assay. We monitored survival after 1 and 2 days
in the presence of 30 IU/mL IL-2, 1ng/mL IL-7, and 10ng/mL IL-7. As a control,
we also monitored survival in the absence of cytokines (Figure 3.7A-D). PTEN

93
Figure 3.7 PTEN Deficient cells have similar or increased survival relative to control T cells (A-D) CTLs transduced with shPTEN or shNT shRNAs were incubated for 1 or 2 days with the media with the indicated nutrients removed or present. Error bars denote SEM.

94
shNT
shPTENsh
NTsh
PTENsh
NTsh
PTENsh
NTsh
PTEN
020406080 Live (%)
shNT
shPTENsh
NTsh
PTENsh
NTsh
PTENsh
NTsh
PTEN020406080 Live (%)
shNT
shPTENsh
NTsh
PTENsh
NTsh
PTENsh
NTsh
PTEN
020406080 Live (%)
No
cyto
kine
30U
IL-2
1ng
IL-7
10ng
IL-7
shNT
shPTENsh
NTsh
PTENsh
NTsh
PTENsh
NTsh
PTEN020406080 Live (%)
shNT
shPTENsh
NTsh
PTENsh
NTsh
PTENsh
NTsh
PTEN
020406080 Live (%)
shNT
shPTENsh
NTsh
PTENsh
NTsh
PTENsh
NTsh
PTEN
020406080 Live (%)
No
cyto
kine
30U
IL-2
1ng
IL-7
10ng
IL-7
Glu
cose
Am
ino
acid
sS
erum
+ + +
+ +D
ialy
zed
+ + -
Day
1
Day
2
A

95
Glu
cose
Am
ino
acid
sS
erum
Day
1
Day
2
+ - +
+ -D
ialy
zed
+ - -
shNT
shPTENsh
NTsh
PTENsh
NTsh
PTENsh
NTsh
PTEN
020406080 Live (%)
shNT
shPTENsh
NTsh
PTENsh
NTsh
PTENsh
NTsh
PTEN020406080 Live (%)
shNT
shPTENsh
NTsh
PTENsh
NTsh
PTENsh
NTsh
PTEN
020406080 Live (%)
No
cyto
kine
30U
IL-2
1ng
IL-7
10ng
IL-7
shNT
shPTENsh
NTsh
PTENsh
NTsh
PTENsh
NTsh
PTEN020406080 Live (%)
shNT
shPTENsh
NTsh
PTENsh
NTsh
PTENsh
NTsh
PTEN
020406080 Live (%)
shNT
shPTENsh
NTsh
PTENsh
NTsh
PTENsh
NTsh
PTEN
020406080 Live (%)
No
cyto
kine
30U
IL-2
1ng
IL-7
10ng
IL-7
BFigi
ure
3.7
(con
tinue
d)

96
Glu
cose
Am
ino
acid
sS
erum Day
1
Day
2
- + +
- +D
ialy
zed
- + -sh
NTsh
PTENsh
NTsh
PTENsh
NTsh
PTENsh
NTsh
PTEN
020406080 Live (%)
shNT
shPTENsh
NTsh
PTENsh
NTsh
PTENsh
NTsh
PTEN020406080 Live (%)
shNT
shPTENsh
NTsh
PTENsh
NTsh
PTENsh
NTsh
PTEN
020406080 Live (%)
No
cyto
kine
30U
IL-2
1ng
IL-7
10ng
IL-7
shNT
shPTENsh
NTsh
PTENsh
NTsh
PTENsh
NTsh
PTEN020406080 Live (%)
shNT
shPTENsh
NTsh
PTENsh
NTsh
PTENsh
NTsh
PTEN
020406080 Live (%)
shNT
shPTENsh
NTsh
PTENsh
NTsh
PTENsh
NTsh
PTEN
020406080 Live (%)
No
cyto
kine
30U
IL-2
1ng
IL-7
10ng
IL-7
CFigi
ure
3.7
(con
tinue
d)

97
Glu
cose
Am
ino
acid
sS
erum Day
1
Day
2
- - +
- -D
ialy
zed
- - -
shNT
shPTENsh
NTsh
PTENsh
NTsh
PTENsh
NTsh
PTEN
020406080 Live (%)
shNT
shPTENsh
NTsh
PTENsh
NTsh
PTENsh
NTsh
PTEN020406080 Live (%)
shNT
shPTENsh
NTsh
PTENsh
NTsh
PTENsh
NTsh
PTEN
020406080 Live (%)
No
cyto
kine
30U
IL-2
1ng
IL-7
10ng
IL-7
shNT
shPTENsh
NTsh
PTENsh
NTsh
PTENsh
NTsh
PTEN020406080 Live (%)
shNT
shPTENsh
NTsh
PTENsh
NTsh
PTENsh
NTsh
PTEN
020406080 Live (%)
shNT
shPTENsh
NTsh
PTENsh
NTsh
PTENsh
NTsh
PTEN
020406080 Live (%)
No
cyto
kine
30U
IL-2
1ng
IL-7
10ng
IL-7
DFigi
ure
3.7
(con
tinue
d)

98
deficient cells were found to have the same or increased survival in every
condition measured. Thus, even though shPTEN T cells have reduced
expression of IL-7Rα, there is sufficient expression for an IL-7 dependent
increase survival relative to the no cytokine condition. However, the lack of
evidence supporting a cell survival defect in vitro does not rule out the
possibility that PTEN deficient T cells have a survival defect in vivo.
3.2.8. Enhancing survival of PTEN deficient T cells does not rescue persistence in vivo
To investigate the relationship between T cell survival and in vivo
persistence, we attempted to perturb cell survival in vivo. We chose to do this
by designing a construct to over express Bcl-2 together with the mApple
fluorescent reporter (Figure 3.8A). Over expression of this construct
significantly increased survival of T cells cultured without cytokines for 3 days
in vitro (Figure 3.8B). Expression of Bcl-2 was also confirmed by Western Blot
(Figure 3.8C).
We designed an experiment to test the effect of increased survival on T
cell persistence in vivo. The previous co-transfer experimental protocol (Figure
3.2A) was adapted to form three groups of mice. Group A was to measure the
effect that increased survival had on persistence (Figure 3.8D). Group B was a
control showing that PTEN deficiency results in a persistence defect. Group C
assessed whether increasing survival was able to rescue persistence in PTEN
deficient T cells (Figure 3.8D). We found that Bcl-2 overexpression resulted in
a marginal improvement to persistence in the blood, liver, and lung (Figure
3.8E-G). However, it did not boost persistence in the tumor, which confirms
the existence of the migration defect previously identified (Figure 3.8H, also

99
Figure 3.8 Increasing survival of PTEN deficient cells has modest effect on persistence (A) Schematic for the BCL-2 over expression construct that was used in these experiments. (B) BCL-2 over expression enhanced the survival of T cells transduced with the indicated constructs. Survival was evaluated after 3 days without cytokines. (C) BCL-2 over expression was confirmed by Western Blot. (D) Schematic showing the three groups A, B, and C that were transferred into tumor bearing CD45.2 mice. (E-H) Normalized ratios of each group after 6 days.

100
shNT + EmptyshNT + BCL-2
shNT + EmptyshPTEN + BCL-2
shNT + EmptyshPEN + Empty
Tran
sfer
red A B C
0.0
0.5
1.0
1.5
2.0
2.5Blood
Nor
mal
ized
rat
io(4
5.1/
2 / 4
5.1)
Tran
sfer
red A B C
0.0
0.5
1.0
1.5Liver
Nor
mal
ized
rat
io(4
5.1/
2 / 4
5.1)
Tran
sfer
red A B C
0
1
2
3Lung
Nor
mal
ized
rat
io(4
5.1/
2 / 4
5.1)
Tran
sfer
red A B C
0
2
4
6
Nor
mal
ized
rat
io(4
5.1/
2 / 4
5.1)
Tumor
shNT
shNT
shPTEN
shPTEN
0
20
40
60
Live
% (D
API
- )
BCL-2 +- +-
mApple P2A BCL-2
BCL-2 +- +-
A
C
B
D
F
G H
A
B C
E
CD45.1:CD45.1/2:CD45.1:CD45.1/2:CD45.1:CD45.1/2:

101
Figure 3.5A-D). There was a boost in the number of transferred cells
circulating in the blood, but this did not quite match the boost in circulating
cells observed for the control cells overexpressing Bcl-2 (Figure 3.8E). This
suggests that any survival defect in shPTEN T cells is likely minor and not
playing a predominant role in their persistence defect.
3.2.9. PTEN deficient T cells have defect in homeostatic proliferation
The transplantable model of melanoma used throughout this work relies
on a 600 cGy dose of radiation to create a lymphopenic environment for the
transferred cells to proliferate. Homeostatic proliferation is driven by IL-7 and
IL-15161, and PTEN deficient CTLs have reduced levels of IL-7Rα.
Accordingly, we hypothesized that PTEN depletion impairs homeostatic
proliferation, leading to defective persistence. To examine the role of
proliferation on persistence, we compared sublethally irradiated mice with wild-
type (WT) mice. We also examined mice that were double knockouts for
recombination-activating gene (RAG) and the common gamma chain receptor
(RAG-/- γC-/-) mice, which are very lymphopenic and lack B, T, and NK cells162.
We adapted our previous experimental setup to examine the role of
proliferation by harvesting organs after 4 days. We found that WT mice had
similar levels of transferred cells in the spleen and lungs after 4 days (Figure
3.9A). The ratio of shPTEN to shNT cells in the blood was reduced in both
sublethally irradiated mice and RAG-/- γC-/- mice relative to WT mice (Figure
3.9A). There was also a dramatic reduction in the ratio of shPTEN to shNT
cells in the spleen and lung of the lymphopenic mice compared with WT mice.
We observed an increase in the ratio of shPTEN to shNT cells in the liver in

102
Figure 3.9 PTEN deficient CTLs have defect in proliferation (A) T cells expressing either shNT or shPTEN shRNAs were transferred into WT, sublethally irradiated (600 cGy), or RAG-/- γC
-/- double knokckout tumor bearing mice. After 4 days, the normalized ratio was calculated for the cells present in the indicated organs. (B) Proliferation was assessed by dilution of CellTrace Violet on day 4 post transfer. Error bars denote SEM.

103
010
210
310
410
5
<Pac
ific
Blu
e-A
>: C
ellT
race
Vio
let
020406080100
% of Max
010
210
310
410
5
<Pac
ific
Blu
e-A
>: C
ellT
race
Vio
let
020406080100
% of Max
010
210
310
410
5
<Pac
ific
Blu
e-A
>: C
ellT
race
Vio
let
020406080100
% of Max
Tran
sfer
red
WT 60
0 cGy
RAG-/-γC-/-
0.0
0.5
1.0
1.5
Normalized ratio(shPTEN / shNT)
Blo
od
Tran
sfer
red
WT 60
0 cGy
RAG-/-γC-/-
0.0
0.5
1.0
1.5
Normalized ratio(shPTEN / shNT)
Spl
een
Tran
sfer
red
WT 60
0 cGy
RAG-/-γC-/-
02468
Normalized ratio(shPTEN / shNT)
Live
r
Tran
sfer
red
WT 60
0 cGy
RAG-/-γC-/-
0.0
0.5
1.0
1.5
2.0
Normalized ratio(shPTEN / shNT)
Lung
Tran
sfer
red
WT 60
0 cGy
RAG-/-γC-/-
0.0
0.5
1.0
1.5
Normalized ratio(shPTEN / shNT)
Tum
orA
010
210
310
410
5
<Pac
ific
Blu
e-A
>: C
ellT
race
Vio
let
020406080100
% of Max
010
210
310
410
5
<Pac
ific
Blu
e-A
>: C
ellT
race
Vio
let
020406080100
% of Max
010
210
310
410
5
<Pac
ific
Blu
e-A
>: C
ellT
race
Vio
let
020406080100
% of Max
010
210
310
410
5
<Pac
ific
Blu
e-A
>: C
ellT
race
Vio
let
020406080100
% of Max
010
210
310
410
5
<Pac
ific
Blu
e-A
>: C
ellT
race
Vio
let
020406080100
% of Max
010
210
310
410
5
<Pac
ific
Blu
e-A
>: C
ellT
race
Vio
let
020406080100
% of Max
100
100
100
100
100
100
100
100
WT
600
cGy
RA
G-/-
γC
-/-
Cel
lTra
ce V
iole
t
% of Max
010
210
310
410
5
<Pac
ific
Blu
e-A
>: C
ellT
race
Vio
let
020406080100
% of Max
010
210
310
410
5
<Pac
ific
Blu
e-A
>: C
ellT
race
Vio
let
020406080100
% of Max
010
210
310
410
5
<Pac
ific
Blu
e-A
>: C
ellT
race
Vio
let
020406080100
% of Max
010
210
310
410
5
<Pac
ific
Blu
e-A
>: C
ellT
race
Vio
let
020406080100
% of Max
010
210
310
410
5
<Pac
ific
Blu
e-A
>: C
ellT
race
Vio
let
020406080100
% of Max
Blood Spleen Liver
010
210
310
410
5
<Pac
ific
Blu
e-A
>: C
ellT
race
Vio
let
020406080100
% of Max
WT
600
cGy
RA
G-/-
γC
-/-
0 0
100
100
100
100
100
100
100
Lung Tumor
B80 60 40 20 0
80 60 40 20 0
80 60 40 20 0
80 60 40 20 0
80 60 40 20 0
80 60 40 20 0
80 60 40 20 010
210
310
410
50
102
103
104
105
010
210
310
410
5
102
103
104
105
010
210
310
410
50
102
103
104
105
80 60 40 20 080 60 40 20 0
80 60 40 20 0
80 60 40 20 0
80 60 40 20 0
80 60 40 20 0 80 60 40 20 0
80 60 40 20 00
102
103
104
105
010
210
310
410
50
102
103
104
105
010
210
310
410
50
102
103
104
105
010
210
310
410
5
010
210
310
410
50
102
103
104
105
010
210
310
410
5
shN
Tsh
PTE
N

104
non-lymphopenic mice (Figure 3.9A). This was not surprising as we have
already shown that PTEN depletion results a migration defect that enhances T
cells ‘propensity to traffic to the liver over secondary lymphoid organs.
However, all groups of mice had reduced ratios of shPTEN cells to shNT cells
in the tumor (Figure 3.9A). This further reinforces our previous observation
that shPTEN cells are unable to properly migrate in vivo. In the absence of
proliferation, there are reduced numbers of shPTEN cells in the tumor relative
to shNT control cells. These results indicate that by removing the homeostatic
proliferation component of persistence we rescued the persistence of shPTEN
cells in a subset of organs (lung, liver, and spleen). This demonstrates that
part of the problem shPTEN T cells have persisting in vivo results from a
defect in homeostatic proliferation.
To assess whether PTEN depleted cells undergo reduced levels of
proliferation, we stained a mixture of shPTEN and shNT T cells with a
fluorescent dye and monitored dilution of the dye after 4 days in vivo. We
found that the cells transferred into WT mice underwent almost no proliferation
in vivo as expected (Figure 3.9B). We saw that shPTEN T cells transferred
into mice treated with 600 cGy of radiation underwent reduced proliferation in
the spleen, liver, and lung. Control T cells transferred into RAG-/- γC-/- mice
underwent robust homeostatic proliferation but the shPTEN T cells had
reduced levels of proliferation in the blood, spleen, liver, and lung. This
suggests that PTEN deficient cells have a reduced ability to undergo
homeostatic proliferation, which could be due to decreased expression of IL-
7Rα.

105
It is important to note that there are similar levels of proliferation for
shPTEN and shNT cells in the tumor of WT as in the spleen (Figure 3.9B).
This is interesting because the cells in the tumor are exposed to antigen,
which promotes antigen driven proliferation. T cells in the spleen are not
exposed to antigen and thus are only undergoing homeostatic proliferation.
Cells isolated from the tumors of lymphopenic mice were found to have
undergone proliferation (Figure 3.9B). This demonstrates that homeostatic
proliferation plays an important role in ACT and suggests that tumor-infiltrating
lymphocytes may undergo homeostatic proliferation before entering the tumor.
This suggests that while antigen driven proliferation is important in the tumor
and likely driving the anti-tumor response, homeostatic proliferation may play a
critical role prior to antigen driven proliferation. This is an interesting
observation and supports the idea that creating a lymphopenic environment is
crucial component for ACT.
3.2.10. PTEN deficient T cells experience mild proliferation defect in vitro
In order to establish the role of reduced IL-7Rα expression in the
homeostatic proliferation defect, we attempted to recapitulate the proliferation
phenotype in vitro using recombinant cytokines. We cultured a mixture of
shPTEN and shNT transduced T cells under a variety of conditions and
monitored proliferation. We found that activating T cells with CD3/CD28
dynabeads induced robust proliferation, but there was no difference between
shPTEN and shNT cells (Figure 3.10). This is consistent with our hypothesis
that the defect in proliferation observed in vivo stems from reduced level of IL-
7Rα effecting IL-7 signaling and homeostatic proliferation. Interestingly, PTEN

106
Figure 3.10 PTEN deficient CTLs have proliferation defect in vitro T cells transduced to express shNT or shPTEN were stained with CellTrace Violet and proliferation was assessed after the indicated number of days. CD3/CD28 stimulation was performed with dynabeads. IL-2 was used at 30IU/mL. IL-7 and IL-15 were used at 5ng/mL. The mixture of IL-7 and IL-15 contained 5ng/mL of each cytokine.

107
010
210
310
410
5
Pac
ific
Blu
e-A
: Cel
lTra
ce V
iole
t
020406080100
% of MaxIL-2
+ C
D3/
28Day 3 Day 5
IL-2
IL-7
IL-1
5IL
-7 +
IL-1
5
010
210
310
410
5
Pac
ific
Blu
e-A
: Cel
lTra
ce V
iole
t
020406080100
% of Max
010
210
310
410
5
Pac
ific
Blu
e-A
: Cel
lTra
ce V
iole
t
020406080100
% of Max
010
210
310
410
5
Pac
ific
Blu
e-A
: Cel
lTra
ce V
iole
t
020406080100
% of Max0
102
103
104
105
Pac
ific
Blu
e-A
: Cel
lTra
ce V
iole
t
020406080100
% of Max0
102
103
104
105
Pac
ific
Blu
e-A
: Cel
lTra
ce V
iole
t
020406080100
% of Max
010
210
310
410
5
Pac
ific
Blu
e-A
: Cel
lTra
ce V
iole
t
020406080100
% of Max
010
210
310
410
5
Pac
ific
Blu
e-A
: Cel
lTra
ce V
iole
t
020406080100
% of Max
010
210
310
410
5
Pac
ific
Blu
e-A
: Cel
lTra
ce V
iole
t
020406080100
% of Max
010
210
310
410
5
Pac
ific
Blu
e-A
: Cel
lTra
ce V
iole
t
020406080100
% of Max
100
0
100
0
100
0
100
0
100
0
100
0
100
0
100
0
100
010
210
310
410
5
80 60 40 20 0
102
103
104
105
80 60 40 20 0
102
103
104
105
80 60 40 20 0
102
103
104
105
80 60 40 20 0
102
103
104
105
80 60 40 20 0
102
103
104
105
80 60 40 20 0
102
103
104
105
80 60 40 20 0
102
103
104
105
80 60 40 20 010
210
310
410
5
80 60 40 20 0
100 80 60 40 20 0
010
210
310
410
5
Cel
lTra
ce V
iole
t
% of Max
shN
Tsh
PTE
N

108
deficient T cells exhibited a modest proliferation defect with IL-2, IL-7, IL-15
and a mixture of IL-7 and IL-15 (Figure 3.10). These defects in proliferation
were milder that the defects observed in vivo. This suggests that the
environment for promoting homeostatic proliferation in vivo is more complex
than our in vitro environment and that we were not able to fully reconstitute it.
Hence, more research is needed to fully implicate decreased expression of IL-
7Rα as the cause for reduced homeostatic expansion of shPTEN CTLs.
3.3. Discussion The goal of this work was to examine whether we could apply our
knowledge of cytotoxicity to improve ACTs. While we have not identified a way
to harness the increased cytotoxicity of shPTEN CTLs, we have learned a
significant amount about the necessary components of successful ACTs. We
have shown that PTEN depletion reduces T cell anti-tumor effects in a
transplantable model (Figure 3.2B). Furthermore, we showed that this is due
to a loss of shPTEN T cells relative to control cells (Figure 3.3B). We
examined the possible causes for this loss of shPTEN cells and discovered
these cells display multiple defects that limit their utility in vivo.
First, shPTEN T cells have a defect in migration that is associated with
reduced expression of KLF2, which likely stems from increased PI3K/AKT
signaling (Figure 3.6A). We believe that this results in reduced levels of
CD62L, CCR7, and S1PR1 (Figure 3.6C-D), which causes the migration
defect experienced by PTEN deficient cells.
In addition, shPTEN T cells have a defect in homeostatic proliferation
(Figure 9B). We suspect this stems from reduced expression of IL-7Rα due to

109
increased AKT signaling, which increases the pool of phospho-FOXO1 (Figure
3.6A). This reduction in IL-7Rα expression does not impair IL-7 dependent
survival of T cells in vitro, but seems to be sufficient to result in a significant
defect in homeostatic proliferation in vivo. To confirm that the defect in
homeostatic proliferation results from decreased levels of IL-7Rα, future work
will investigate whether T cells lacking IL-7Rα phenocopy the PTEN
deficiency.
Over expression of Bcl-2 robustly blocks cell death in vitro (Figure
3.8C), but only provides a slight improvement to the number of shPTEN cells
migrating to the tumor. Furthermore, there is only a slight improvement in the
number of cells in the blood, suggesting that something other than cell death
is driving the apparent loss of shPTEN cells. These observations suggest that
any defect in the survival of shPTEN T cells in vivo appears to be secondary to
the defects in trafficking and proliferation.
Subcutaneous tumor models require lymphocytes to undergo extensive
migration to travel from the circulatory system to the secondary lymphoid
organs and to the tumor. We found that CTLs expressing shPTEN had defects
in migration that resulted in reduced ability of the cells to migrate to the tumor.
This limited our ability to assess whether PTEN deficiency increases
cytotoxicity in vivo. In order to demonstrate this, it may be necessary to
examine shPTEN CTLs in a different tumor model. A model of lung or liver
cancer may be better suited for evaluating the cytotoxicity of shPTEN T cells
since they are capable of migrating to and surviving in the lung and liver.
Another possible way to avoid the trafficking defects of shPTEN T cells is to
perform on an intratumoral injection of T cells. While this is a technically

110
difficult procedure, it would circumvent the trafficking issues observed in the
melanoma model. These avenues are worth considering as we examine ways
to improve ACT using PTEN deficiency.
The other issue with the model we used is that it relies on homeostatic
proliferation to expand the adoptively transferred cells in order to generate an
anti-tumor effect. When shPTEN cells were transferred into non-lymphopenic
mice, they were able to persist at the same level as control cells in the spleen,
liver, and lung even though they had reduced levels in the blood. It is worth
considering whether shPTEN cells could provide increased survival in a tumor
model that did not rely on homeostatic proliferation.
In order to mitigate some of the negative side effects of PTEN
deficiency, we examined whether we could reduce PI3K signaling with an
inhibitor. We chose to use the AKT inhibitor A-443654 because previous work
had demonstrated its ability to alter AKT signaling in vivo156. We pretreated
mice with A-443654 before adoptively transferring T cells. However, treatment
with A-443654 was unable to rescue the persistence of the transferred cells
(data not shown). We also tried treating T cells in vitro prior to transfer with the
AKT inhibitor ab142088. T cells were highly sensitive to this inhibitor and it
was quite toxic (data not shown). The cells that survived the treatment had
increased expression of CD62L but it is unclear how long this expression
would have remained after transfer into mice. Nonetheless, it may be possible
to boost the duration of effect by treating mice with different AKT inhibitors or
by combining it with preconditioning the CTLs.

111
Another possible way to mitigate the negative side effects of enhanced
PI3K/AKT signaling is by treating mice with rapamycin. Rapamycin is highly
specific inhibitor for mTOR159. Pretreating mice with rapamycin might be able
to reduce mTOR signaling enough to restore KLF2 and FOXO1 expression in
the transferred cells. Rapamycin has been shown to enhance the formation of
memory CD8+ T cells in response to an LCMV infection163. Modulating mTOR
signaling with rapamycin may be a better way forward than treating mice with
AKT inhibitors. It is also worth considering a combination approach whereby
CTLs are pretreated with IL-15 and rapamycin and transferred into mice that
are subsequently treated with rapamycin. Accordingly, we wondered whether
we could apply combined rapamycin-IL15 treatment to increase the level of
trafficking proteins to resolve the migration defect caused by enhanced PI3K
signaling. Treating shPTEN and shNT CTLs with IL-15 and rapamycin
increased the level of CD62L and IL-7Rα (data not shown). However,
pretreating shPTEN CTLs with rapamycin and IL-15 was unable to improve
persistence after 6 days (data not shown). The mice were not treated with
rapamycin and IL-15 after ACT, however, and it is possible that levels of
CD62L And IL7R reverted during this time. Hence, more research is needed to
fully examine this strategy as a way to fix the persistence defect.
Another possible way to mitigate the effects of enhanced PI3K/AKT
signaling is by increasing IL-7 or IL-15 signaling to improve homeostatic
proliferation. This could be achieved by treating mice with lipopolysaccharides
(LPS) or polyinosinic:polycytidylic acid (poly(I:C)). LPS and poly(I:C) stimulate
IL-15 production by APCs through toll-like receptor 3 (TLR3)161,164. Treating
with poly(I:C) may be more impactful as it has been shown to stimulate

112
hepatocytes to produce IL-7165. Enhancing production of IL-7 by hepatocytes
could boost IL-7 signaling in PTEN deficient T cells, which we have shown
have a tendency to reside in the liver. However, it is conceivable that the
expression of IL-7Rα is sufficiently low to make it the limiting factor in IL-7
signaling. In this case increasing the levels of IL-7 will be unable to restore IL-
7 signaling.
Another way to enhance IL-7 signaling is to over express of IL-7Rα.
This could rescue enough IL-7 signaling to restore homeostatic proliferation. It
is also worth considering over expression of FOXO1 or a constitutively active
FOXO1 to achieve this. This is more complicated, however, than over
expressing IL-7Rα as FOXO1 signaling is important for many cellular process
and could generate unanticipated consequences. FOXO1 is downstream of
AKT and mTOR, but it also regulates genes that modulate the activity of AKT
and mTOR166. This makes understanding the consequences of increased
PI3K/AKT coupled with increased FOXO1 activity hard to predict.
Furthermore, expression of a constitutively active mutant of FOXO1 in T cells
has been shown to decrease tumor infiltration, which is already a problem for
shPTEN CTLs167.
Our studies of shPTEN T cells have highlighted the importance of T cell
trafficking and homeostatic proliferation in the B16-OVA melanoma model of
ACT. This work also suggests that while examining cytotoxicity in vitro can
provide mechanistic insight, it may not be the best way to improve ACTs.
Improving ACT with T cell screens assessing tumor infiltration, migration, and
tumor growth may be more impactful than studies optimizing for cytotoxicity in
vitro.

113
3.4. Materials and methods 3.4.1. Mice
The animal protocols used for this study were approved by the
Institutional Animal Care and Use Committee of Memorial Sloan-Kettering
Cancer Center. For in vivo experiments, C57BL/6J mice were purchased from
Jackson Laboratories (stock #000664) at 6-8 weeks old. For experiments
requiring congenic mice, B6.SJL-PtprcaPepcb/BoyJ mice were purchased from
Jackson Laboratory (stock #002014). For experiments utilizing gRNAs, OT-1
mice (Taconic) were crossed to Rosa26-Cas9 knockin mice
(Gt(ROSA)26Sortm1.1(CAG-cas9*,-EGFP)Fezh/J, stock #024858)154. PTENfl/fl
mice were purchased from Jackson Laboratories (stock #006440)155. RAG-/-
γC-/- mice were purchased from Taconic Farms (stock #: 4111).
3.4.2. In vivo tumor experiments B16-OVA cells were a gift from Jedd Wolchok. The cells were grown for
at least 2 passages before they were counted, washed into PBS, and
transferred s.c. to mice. The tumors were allowed to grow for 7-9 days before
the mice were exposed to a sublethal dose of irradiation (600cGy). The
following day, CTLs were transferred into the mice i.v. by retro-orbital injection.
The tumor volume was calculated as 𝑉 = !!!
!!. Measurements were performed
with a caliper.
3.4.3. Lymphocyte isolation from tissues Lung, liver, tumor, gut, and brain tissues were prepared by mechanical
disruption followed by 40 min treatment with collagenase (Sigma, C5138) at
1mg/mL in Hanks Buffered Salt Solution with calcium and magnesium. The
tissues were washed filtered through 70 µm filters and subsequently layered in

114
a 44% and 66% percoll gradient (Sigma). The percoll gradient was performed
by centrifuging at 3000 rpm for 30 minutes without the brake. The cells were
collected from the interface and analyzed by flow cytometry.
3.4.4. Flow cytometry and staining All flow cytometry was performed on a BD LSR II (Becton Dickinson).
Antibodies used were purchased from Tonbo Biosciences, Biolgend,
eBiosciences, and BD. The gating strategy used to detect cells that were
transferred in vivo consisted of gating on single lymphocytes, CD3+ CD8+
double positive cells, and then the appropriate congenic marker. In
experiments utilizing only one congenic in a co-transfer, GFP was used with
either cyan fluorescent protein or mApple to distinguish the populations of
cells. The ratio of shPTEN to shNT cells was calculated and then normalized
by the ratio of the cells that were transferred into mice.
The clones for antibodies used are as follows: CD127/IL-7Rα (A7R34),
CD62L (MEL-14), CD3ε (145-2C11), CD8α (53-6.7), CD4 (RM4-5), CD45.1
(A20), and CD45.2 (104). Cells were stained at room temperature for at least
15 minutes in FACs buffer. Cells were stained with CellTrace Violet (Life
Technologies) according to the manufacturers directions.
3.4.5. Cloning The Bcl-2 over expression construct was generated from mouse cDNA
was generated by PCR using the primers P2A-BCL2-fw (5’-
AGAACCCAGGCCCTATGGCGCAAGCC -3’) and BglII-BCL2-rev (5’-
AAAAAAGATCTTCACTTGTGGCCCAGGTATGCACC -3’). A P2A site was
added to mApple-N1 by PCR with the oligos: NotI-mApple-fw (5’-

115
TTTTTGCGGCCGCATGGTGAGC -3’), P2A-rev (5’-
GGCTTGCGCCATAGGGCCTGGGTTCT -3’), and the P2A fragment (5’-
GGAAGTGGTGCAACAAATTTCAGCCTTCTCAAACAAGCAGGTGATGTCGA
GGAGAACCCAGGCCCT -3’). mApple-N1 was a gift from Michael Davidson
(Addgene plasmid # 54567).168 The final product was cloned into an empty
MSCV vector containing a Zeocin resistance cassette using NotI and BglII. A
control was also generated of mApple in the same vector. The PCR was
performed using Phusion (NEB) and according to the manufacturers protocol.
The constructs were confirmed by sequencing (Genewiz).
Expression constructs for shNT and shPTEN that were previously
described were moved the LEPG vector with a miR30E backbone8,117,169. The
miR30E vector was a gift from Scott Lowe. The primers to move the hairpins
from their original vector to the miR30E vector were miRE-Xho-fw (5’-
TGAACTCGAGAAGGTATAT TGCTGTTGACAGTGAGCG -3’) and miRE-
EcoOligo-rev (5’-TCTCGAATTCT AGCCCCTTGAAGTCCGAGGCAGTAGGC
-3’)169. The mApple fluorescent protein as cloned into the miR30E vector by
performing PCR to assemble an IRES-mApple fragment with PacI and ApaI
cut sites. The mApple fragment was generated using primers IRES-mApple-F
(5’- TGGCCACAACCATGGTGAGCAAG -3’) and (5’-
ATAATTCTTAATTAATTCACTTGTACAGCTCGTCCATG -3’). The IRES
fragment was generated using ApaI-IRES-F (5’-
AATGTGAGGGCCCGGAAACC -3’) and IRES-mApple-R (5’
CCATGGTTGTGGCCATATTATCATCG -3’). PCR was performed to combine
these two fragments and the product was cloned into the miR30E vector using

116
the PacI and ApaI cutsites (NEB). Proper insertion of mApple was confirmed
by sequencing (Genewiz).
gRNAs to knokckout PTEN were generated using previously published
methods170. The selected gRNA was made by annealing oligo-1 (5’-
CACCGaacttgtcctcccgccgcgt -3’) and (5’- AAACacgcggcgggaggacaagttC -3’)
and cloned into the lenti-Guide-Puro vector according to published
protocols171,172. The portion of the construct containing the gRNA was then
amplified by PCR using LMP BamHI F2 (5’-
TTTTTGGATCCTAGTAGGAGGCTTGGTAG -3’) and LMP EcoRI R2 (5’-
TTTTTGAATTCTGTCTACTATTCTTTCCC -3’). This fragment was digested
with BamHI and EcoRI (NEB) and ligated into the miR30E vector digested with
EcoRI and BglII (NEB). The presence of the gRNA was confirmed by
sequencing (Genewiz).
3.4.6. Cell culture and transductions CTLs were prepared by mixing T cells from OT-1 αβTCR transgenic
mice (Taconic) with irradiated congenic splenocytes pulsed with 100nM OVA
and cultured in RPMI medium containing 10 % (vol/vol) FCS. Polyclonal T
cells were activated using CD3/CD28 Dynabeads (Life Technologies).
Lymphocytes were isolated from the spleen, counted, and incubated with
dynabeads at a 1:1 ratio. Cells were supplemented with interleukin 2 (IL2, 30
IU/ml) after 24 h and were split as needed in RPMI containing IL-2. B16-OVA
cells were maintained in RPMI containing 10 % (vol/vol) FCS with 50ug/mL
G418, while RMA-s cells were grown in RPMI containing 10 % (vol/vol) FCS.

117
To prepare retrovirus, Phoenix E cells were transfected with expression
vectors together with packaging plasmids using the calcium phosphate
method. Ecotropic viral supernatants were collected after 48 hr at 37°C and
added to OT-1 blasts 2 days after primary peptide stimulation. Mixtures were
centrifuged at 1400 × g in the presence of polybrene (4 µg/ml) at 35°C. T cells
were then split 1:3 in medium containing IL-2. Selection was added 24 hours
after transduction. Puromycin was used at 5-10ug/mL and Zeocin was used at
100ug/mL (Life Technologies).
Restimulation experiments were conducted with CD3/CD28 dynabeads
(Life Technologies) at a 1:1 ratio. For other experiments, cells were treated in
2ng/mL mouse IL-15 (eBioscience), 5ng/mL mouse IL-7 (eBioscience), and
2nM rapamycin (EMD Millipore) overnight at 37°C.
For in vitro experiments involving AKT inhibitors, we used The AKT1/2
inhibitor ab142088 (Abcam). For the AKT inhibitor A-443654 (Abovchem), we
injected mice s.c. twice per day as previously described156.
3.4.7. Immunoblot 0.2-1 × 10⁶ CTLs were lysed in ice cold buffer containing 10 mM
TrisHCl, 5 mM EDTA, 1% NP-40, 0.5% sodium deoxycholate, and 0.15 M
NaCl. PTEN expression was assessed using a rabbit monoclonal antibody
(clone: D4.3, Cell Signaling). Actin served as a loading control (clone: AC-15,
Sigma). Images were collected on film or with the LICOR.
118
3.4.8. Nutrient depletion survival experiments For all experiments, media was obtained form the Memorial Sloan
Kettering Cancer Center Media Preparation core facility. For the nutrient
depletion experiments, RPMI was purchased without glucose, amino acids, or
both. Fetal bovine serum (Sigma) or dialyzed fetal bovine serum (Sigma) was
added to 10% (v/v). Human IL-2 was used at 30IU/mL. Mouse IL-7 (Life
Technologies) was used at 1ng/mL and 10ng/mL. Cells were incubated in flat
bottom 96 well plates at 37°C for 1 or 2 days. The samples were then washed
into FACS buffer, stained with DAPI, and analyzed by flow cytometry.
3.4.9. In vitro killing assays Cytotoxicity assays were performed using RMA-s cells that were
stained with CellTrace Violet (Life Technologies) and then pulsed with varying
concentrations of the SIINFEKL peptide for 1 hour. The cells were washed,
counted and mixed with OT-1 CTLs at a 1:2 (effector:target) ratio in V bottom
96 well plates in triplicate and incubated at 37°C for 3-4 hours. The cells were
washed into FACS buffer and cell death was measured by flow cytometry.
3.4.10. RNA isolation and RT-PCR RNA was generated from CTLs by performing a Trizol (Life
Technologies) extraction with chloroform following standard protocols (Sigma).
RNA was used to generate cDNA using qScript cDNA Supermix (Quanta
Biosciences). For all reactions, GAPDH was used as a control. RT-PCR was
performed using the primers: GAPDH-fw (5’-
CTTTGTCAAGCTCATTTCCTGG -3’), GAPDH-rev (5’-
TCTTGCTCAGTGTCCTTGC -3’), KLF2-fw (5’-
GGCTAGATGCCTTGTGAGAAA -3’), KLF2-rev (5’-

119
TGCCATCGTCTCCCTTATAGA -3’), S1P1R-fw (5’-
GGAGTATGTTTGTGGCTCTCTC -3’), S1PR1-rev (5’-
TGCTCCCGTTGTGTAGTTTC -3’), CCR7-fw (5’-
GGTTCCTGCCTCTCATGTATT -3’), and CCR7-rev (5’-
GTAGGTATCCGTCATGGTCTTG -3’).

120
CHAPTER 4: CONCLUDING REMARKS In the present study, we examined T cell cytotoxicity and discovered an
association between mechanical force and target cell killing. We examined
force generation by T cells both in the plane of the IS and orthogonal to the IS.
We found that shPTEN CTLs exerted larger pulling and pushing forces in both
dimensions. We showed that these forces correlate with the increased
cytotoxicity observed in PTEN deficient cells. We demonstrated a relationship
between increased membrane tension on target cells and increased
susceptibility to perforin. We proposed a model in which CTLs use the
mechanical properties of the IS to increase membrane tension of target cells,
thereby increasing the potency of LGs. We propose that the increased plasma
membrane tension destabilizes the membrane by increasing the space
between the phospholipids. Although our data supports this model, there are
additional hypotheses for the mechanism of increased cytotoxicity, and some
key questions related to our study remain unanswered.
There are several alternative hypotheses for how force could contribute
to perforin function that we did not address in our study. Force could increase
the membrane susceptibility to perforin pore formation directly or it could alter
the lipid composition of membrane, thereby enhancing its affinity for perforin. It
is also possible that increased membrane tension could alter the topology of
the membrane (e.g. by enforcing either convex or concave curvature), which
could alter its susceptibility to perforin. Another possibility is that CTL-derived
forces could physically damage target cells and that the target cell’s response
to this damage might increase its susceptibility to perforin. These hypotheses

121
are not mutually exclusive with our other hypotheses and additional research
is needed to address them.
Although our studies implied that T cells alter target cell tension by
exerting synaptic forces, we did not show this definitively. Technical limitations
prevented us from examining plasma membrane tension in CTL-target cell
conjugates. Current approaches to measure membrane tension rely on atomic
force microscopy (AFM) or an optical trap. Unfortunately, the cantilever tip of
an AFM is unable to access the target cell plasma membrane within the IS.
The same is true for the optical trap approach. One way to circumvent these
limitations, in principle, is by using genetically encoded tension sensors. There
are fluorescent reporters that measure cortical membrane tension173, but these
do not report the tension of the plasma membrane.
Another way to measure membrane tension could be to use various
tension sensitive ion channels, such as Piezo1 and Piezo2174. These ion
channels have been shown to permit the flow of calcium ions in response to
increased membrane tension174. We could over express these proteins on
target cells and use intracellular calcium as a readout for membrane tension
using a small molecule dye. We would then be able to monitor membrane
tension during a CTL-target cell conjugate. This approach is intriguing but it
would be unable to distinguish between alterations in global membrane
tension versus localized membrane tension within the IS. Membrane tension
has been shown to modify the activity of other pore forming proteins such as
alamethicin175, but these proteins would have the same issues. Furthermore, it
is conceivable that T cells could disrupt the integrity of the target cell
membrane in a perforin independent manner within a conjugate. T cells

122
perform trogocytosis while in T cell-target cell conjugates so it is possible that
T cells could disrupt the integrity of the plasma membrane. This could make
changes in ion concentration an inaccurate readout for membrane tension.
We would like to monitor membrane tension of T cells during the
formation of conjugates and visualize it with degranulation using the pHluorin-
Lamp1 reporter. If this could be done at high resolution, it might be possible to
examine whether a T cell releases lytic granules near regions of enhanced
target cell membrane tension. It would also be interesting to measure
membrane tension of the CTL plasma membrane to see whether it could play
a role in protecting CTLs from perforin and granzyme. The precise mechanism
of how CTLs protect themselves is unknown and membrane tension could
play a role. Unfortunately, monitoring T cell membrane tension has the same
associated challenges as monitoring it in target cells.
Out efforts to apply PTEN deficiency to ACT have generated a number
of interesting observations. We have demonstrated that modulating PI3K
signaling by depleting PTEN does not improve tumor rejection in a
transplantable melanoma model. In fact, we observed the opposite effect, and
our subsequent studies highlighted the importance of trafficking and
homeostatic proliferation for productive anti-tumor responses.
In T cells, PI3K signaling drives cytoskeletal remodeling through
Dock2/Rac and transcriptional and metabolic responses through AKT. We
believe that this branched pathway structure explains why enhanced PI3K
signaling leads to an increase in cytotoxicity (via Dock2/Rac) at the cost of
reduced homeostatic proliferation and defects in migration (downstream of

123
AKT). By properly separating the two arms of the pathway, we might be able
to increase cytotoxicity without diminishing homeostatic proliferation and
migratory potential of the T cells. One way to do this is to only deplete PTEN
upon TCR activation. Then the T cell will migrate properly to the tumor and,
upon engagement of the TCR with pMHC, it will turn on expression of the
shRNA to deplete PTEN. We previously tried expressing the PTEN shRNA
under control of early T cell signaling promoters including nerve growth factor IB
(Nur77), IL-2, and NFAT. These constructs resulted in leaky expression of the
shRNA and depletion of PTEN in the absence of TCR signaling. Hence, we
were not able to fully explore the potential of this idea.
Relying on homeostatic proliferation to generate anti-tumor responses
might be a better approach than transferring more cells into a patient.
Expanding CTLs in vitro over many generations can cause the cells to become
dysfunctional and express exhaustion markers176. Dysfunctional CTLs respond
poorly to antigen and produce reduced levels of cytokines upon restimulation.
These cells also upregulate various inhibitory molecules including PD-1,
VISTA, and others41,42,93. That being said, homeostatically expanded T cells
are also known to express exhaustion markers and to exhibit some signs of
dynsfunction177. These factors make the idea of using homeostatic expansion
as an alternative to in vitro expansion less appealing. However, our work
suggests that homeostatic proliferation as part of ACT is important and that it
increases the anti-tumor response.
Future studies will seek to find the optimal balance between CTL
cytotoxicity, migration, and homeostatic proliferation when mounting an anti-
tumor immune response. In an anti-tumor response, cytotoxicity is obviously

124
important as it allows T cells to kill, but it seems unlikely that maximizing
cytotoxicity will be an effective approach if it comes at the expense of
homeostatic proliferation and migration. Indeed, our data imply that the
opposite strategy may even be more fruitful. If, for example, a T cell could be
modified to significantly enhance homeostatic proliferation and tumor
infiltration by a factor of 10 while reducing in vitro cytotoxicity by half, these
cells might provide an enhanced anti-tumor effect while performing worse in
cytotoxicity assays in vitro. Ideally, T cell proliferation and migration could be
improved without altering cytotoxicity but reduced cytotoxicity in vitro could still
lead to an improvement in ACT in vivo if other alterations compensated for this
deficiency.

125
BIBLIOGRAPHY 1. Cox MA, Harrington LE, Zajac AJ. Cytokines and the inception of CD8 T
cell responses. Trends Immunol [Internet]. 2011;32(4):180–6. Available from: http://dx.doi.org/10.1016/j.it.2011.01.004
2. Carpenter AC, Bosselut R. Decision checkpoints in the thymus. Nat Immunol. 2010;11(8):666–73.
3. Lee HM, Bautista JL, Hsieh CS. Thymic and Peripheral Differentiation of Regulatory T Cells [Internet]. 1st ed. Vol. 112, Advances in Immunology. Elsevier Inc.; 2011. 25-71 p. Available from: http://dx.doi.org/10.1016/B978-0-12-387827-4.00002-4
4. Huse M. The T-cell-receptor signaling network. J Cell Sci [Internet]. 2009;122(9):1269–73. Available from: http://jcs.biologists.org/cgi/doi/10.1242/jcs.042762
5. Kane LP, Lin J, Weiss A. Signal transduction by the TCR for antigen. Curr Opin Immunol. 2000;12(3):242–9.
6. Lin X, Mahony AO, Mu Y, Geleziunas R, Greene WC. Protein Kinase C- θ Participates in NF- κ B Activation Induced by CD3-CD28 Costimulation through Selective Activation of I κ B Kinase β Protein Kinase C- Participates in NF- B Activation Induced by CD3-CD28 Costimulation through Selective Activation o. Society. 2000;20(5):1–9.
7. Martini M, De Santis MC, Braccini L, Gulluni F, Hirsch E. PI3K/AKT signaling pathway and cancer: An updated review. Ann Med. 2014;46(6):372–83.
8. Le Floc’h A, Tanaka Y, Bantilan NS, Voisinne G, Altan-Bonnet G, Fukui Y, et al. Annular PIP3 accumulation controls actin architecture and modulates cytotoxicity at the immunological synapse. J Exp Med [Internet]. 2013 Nov 18 [cited 2013 Nov 7];210(12):2721–37. Available from: http://www.ncbi.nlm.nih.gov/pubmed/24190432
9. Sinclair L V, Finlay D, Feijoo C, Cornish GH, Gray A, Ager A, et al. Phosphatidylinositol-3-OH kinase and nutrient-sensing mTOR pathways control T lymphocyte trafficking. Nat Immunol [Internet]. 2008;9(5):513–21. Available from: http://www.nature.com/doifinder/10.1038/ni.1603
10. Ouyang W, Beckett O, Flavell RA, Li MO. An Essential Role of the Forkhead-Box Transcription Factor Foxo1 in Control of T Cell Homeostasis and Tolerance. Immunity [Internet]. 2009;30(3):358–71. Available from: http://dx.doi.org/10.1016/j.immuni.2009.02.003
11. Kerdiles YM, Beisner DR, Tinoco R, Dejean AS, Castrillon DH, DePinho

126
RA, et al. Foxo1 links homing and survival of naive T cells by regulating L-selectin, CCR7 and interleukin 7 receptor. Nat Immunol [Internet]. 2009;10(2):176–84. Available from: http://www.nature.com/doifinder/10.1038/ni.1689
12. Yu Y, Smoligovets AA, Groves JT. Modulation of T cell signaling by the actin cytoskeleton. J Cell Sci [Internet]. 2013 Mar 1;126(5):1049–58. Available from: http://jcs.biologists.org/cgi/doi/10.1242/jcs.098210
13. Huse M, Lillemeier BF, Kuhns MS, Chen DS, Davis MM. T cells use two directionally distinct pathways for cytokine secretion. Nat Immunol [Internet]. 2006 Mar [cited 2012 May 9];7(3):247–55. Available from: http://www.ncbi.nlm.nih.gov/pubmed/16444260
14. Stinchcombe JC, Majorovits E, Bossi G, Fuller S, Griffiths GM. Centrosome polarization delivers secretory granules to the immunological synapse. Nature [Internet]. 2006 Sep 28 [cited 2015 Jan 4];443(7110):462–5. Available from: http://www.ncbi.nlm.nih.gov/pubmed/17006514
15. Derivery E, Gautreau A. Generation of branched actin networks: Assembly and regulation of the N-WASP and WAVE molecular machines. BioEssays. 2010;32(2):119–31.
16. Goley ED, Welch MD. The ARP2/3 complex: An actin nucleator comes of age. Nat Rev Mol Cell Biol. 2006;7(10):713–26.
17. Mullins RD, Heuser JA, Pollard TD. The interaction of Arp2/3 complex with actin: Nucleation, high affinity pointed end capping, and formation of branching networks of filaments. Proc Natl Acad Sci [Internet]. 1998;95(11):6181–6. Available from: http://www.pnas.org/cgi/doi/10.1073/pnas.95.11.6181
18. Monks CRF, Freiberg B a, Kupfer H, Sciaky N, Kupfer A. Three-dimensional segregationofsupramolecular activation clustersinTcells. Nature [Internet]. 1998;395(6697):82–6. Available from: http://www.nature.com/doifinder/10.1038/25764
19. Tseng S-Y, Waite JC, Liu M, Vardhana S, Dustin ML. T Cell-Dendritic Cell Immunological Synapses Contain TCR-dependent CD28-CD80 Clusters That Recruit Protein Kinase C . J Immunol [Internet]. 2008;181(7):4852–63. Available from: http://www.jimmunol.org/cgi/doi/10.4049/jimmunol.181.7.4852
20. Freiberg BA, Kupfer H, Maslanik W, Delli J, Kappler J, Zaller DM, et al. Staging and resetting T cell activation in SMACs. Nat Immunol. 2002;3(10):911–7.
21. Delon J, Kaibuchi K, Germain RN. Exclusion of CD43 from the immunological synapce is mediated by phosphorylation-regulated

127
relocation of the cytoskeletal adaptor Moesin. Immunity. 2001;15(5):691–701.
22. Brossard C, Feuillet V, Schmitt A, Randriamampita C, Romao M, Raposo G, et al. Multifocal structure of the T cell - dendritic cell synapse. Eur J Immunol [Internet]. 2005 Jun [cited 2013 Aug 26];35(6):1741–53. Available from: http://www.ncbi.nlm.nih.gov/pubmed/15909310
23. Dupré L, Houmadi R, Tang C, Rey-Barroso J. T lymphocyte migration: An action movie starring the actin and associated actors. Front Immunol. 2015;6(NOV).
24. Negulescu PA, Krasieva TB, Khan A, Kerschbaum HH, Cahalan MD. Polarity of T cell shape, motility, and sensitivity to antigen. Immunity [Internet]. 1996 May;4(5):421–30. Available from: http://www.ncbi.nlm.nih.gov/pubmed/8630728
25. Hunter MC, Teijeira A, Halin C. T cell trafficking through lymphatic vessels. Front Immunol. 2016;7(DEC).
26. Preece G, Murphyt G, Ager A. Metalloproteinase-mediated regulation of L-selectin levels on leucocytes. J Biol Chem. 1996;271(20):11634–40.
27. Lewis M, Tarlton JF, Cose S. Memory versus naive T-cell migration. Immunol Cell Biol [Internet]. 2008 Mar;86(3):226–31. Available from: http://doi.wiley.com/10.1038/sj.icb.7100132
28. Girard JP, Moussion C, Förster R. HEVs, lymphatics and homeostatic immune cell trafficking in lymph nodes. Nat Rev Immunol [Internet]. 2012;12(11):762–73. Available from: http://dx.doi.org/10.1038/nri3298
29. Sackstein R, Schatton T, Barthel SR. T-lymphocyte homing: an underappreciated yet critical hurdle for successful cancer immunotherapy. Lab Investig [Internet]. 2017;97(6):669–97. Available from: http://www.nature.com/doifinder/10.1038/labinvest.2017.25
30. Tomura M, Yoshida N, Tanaka J, Karasawa S, Miwa Y, Miyawaki A, et al. Monitoring cellular movement in vivo with photoconvertible fluorescence protein “Kaede” transgenic mice. Proc Natl Acad Sci [Internet]. 2008;105(31):10871–6. Available from: http://www.pnas.org/cgi/doi/10.1073/pnas.0802278105
31. Kastenmüller W, Brandes M, Wang Z, Herz J, Egen JG, Germain RN. Peripheral Prepositioning and Local CXCL9 Chemokine-Mediated Guidance Orchestrate Rapid Memory CD8+T Cell Responses in the Lymph Node. Immunity. 2013;38(3):502–13.
32. Chaffin KE, Perlmutter RM. A pertussis toxin-sensitive process controls thymocyte emigration. Eur J Immunol [Internet]. 1991 Oct;21(10):2565–73. Available from: http://doi.wiley.com/10.1002/eji.1830211038

128
33. Sharma S, Mathur A, Pradhan S, Singh D, Gupta S. Fingolimod (FTY720): First approved oral therapy for multiple sclerosis. J Pharmacol Pharmacother [Internet]. 2011;2(1):49. Available from: http://www.jpharmacol.com/text.asp?2011/2/1/49/77118
34. Bousso P, Robey E. Dynamics of CD8+ T cell priming by dendritic cells in intact lymph nodes. Nat Immunol [Internet]. 2003 Jun;4(6):579–85. Available from: http://www.ncbi.nlm.nih.gov/pubmed/12730692
35. Krummel MF, Bartumeus F, Gérard A. T cell migration, search strategies and mechanisms. Nat Rev Immunol [Internet]. 2016;16(3):193–201. Available from: http://dx.doi.org/10.1038/nri.2015.16
36. Huang J, Brameshuber M, Zeng X, Xie J, Li Q jing, Chien Y hsiu, et al. A Single peptide-major histocompatibility complex ligand triggers digital cytokine secretion in CD4+ T Cells. Immunity [Internet]. 2013;39(5):846–57. Available from: http://dx.doi.org/10.1016/j.immuni.2013.08.036
37. Altan-Bonnet G, Germain RN. Modeling T cell antigen discrimination based on feedback control of digital ERK responses. PLoS Biol. 2005;3(11):1925–38.
38. Miller MJ, Wei SH, Cahalan MD, Parker I. Autonomous T cell trafficking examined in vivo with intravital two-photon microscopy. Proc Natl Acad Sci U S A. 2003;100(5):2604–9.
39. Weninger W, Crowley MA, Manjunath N, von Andrian UH. Migratory properties of naive, effector, and memory CD8(+) T cells. J Exp Med [Internet]. 2001 Oct 1;194(7):953–66. Available from: http://www.pubmedcentral.nih.gov/articlerender.fcgi?artid=2193483&tool=pmcentrez&rendertype=abstract
40. Bellone M, Calcinotto A. Ways to Enhance Lymphocyte Trafficking into Tumors and Fitness of Tumor Infiltrating Lymphocytes. Front Oncol [Internet]. 2013;3(September):1–15. Available from: http://journal.frontiersin.org/article/10.3389/fonc.2013.00231/abstract
41. Pauken KE, Wherry EJ. Overcoming T cell exhaustion in infection and cancer. Trends Immunol [Internet]. 2015;36(4):1–12. Available from: http://dx.doi.org/10.1016/j.it.2015.02.008
42. Wherry EJ. T cell exhaustion. Nat Immunol [Internet]. 2011;12(6):492–9. Available from: http://dx.doi.org/10.1038/ni.2035
43. Quigley M, Pereyra F, Nilsson B, Porichis F, Fonseca C, Eichbaum Q, et al. Transcriptional analysis of HIV-specific CD8+ T cells shows that PD-1 inhibits T cell function by upregulating BATF. Nat Med [Internet]. 2010;16(10):1147–51. Available from: http://dx.doi.org/10.1038/nm.2232
44. Chang JT, Wherry EJ, Goldrath AW. Molecular regulation of effector and

129
memory T cell differentiation. Nat Immunol [Internet]. 2014;15(12):1104–15. Available from: http://www.nature.com/doifinder/10.1038/ni.3031
45. Wherry EJ, Blattman JN, Murali-krishna K, Most R Van Der, Ahmed R. Viral Persistence Alters CD8 T-Cell Immunodominance and Tissue Distribution and Results in Distinct Stages of Functional Impairment Viral Persistence Alters CD8 T-Cell Immunodominance and Tissue Distribution and Results in Distinct Stages of Functional Im. J Virol. 2003;77(8):4911–3927.
46. Hanahan D, Weinberg RA. The hallmarks of cancer. Cell [Internet]. 2000;100(1):57–70. Available from: http://www.ncbi.nlm.nih.gov/pubmed/10647931
47. Houston A, O’Connell J. The Fas signalling pathway and its role in the pathogenesis of cancer. Curr Opin Pharmacol. 2004;4(4):321–6.
48. Westphal D, Dewson G, Czabotar PE, Kluck RM. Molecular biology of Bax and Bak activation and action. Biochim Biophys Acta - Mol Cell Res [Internet]. 2011;1813(4):521–31. Available from: http://dx.doi.org/10.1016/j.bbamcr.2010.12.019
49. Hassin D, Garber OG, Meiraz A, Schiffenbauer YS, Berke G. Cytotoxic T lymphocyte perforin and Fas ligand working in concert even when Fas ligand lytic action is still not detectable. Immunology [Internet]. 2011 Jun [cited 2013 Nov 12];133(2):190–6. Available from: http://www.pubmedcentral.nih.gov/articlerender.fcgi?artid=3088981&tool=pmcentrez&rendertype=abstract
50. Kaiserman D, Bird CH, Sun J, Matthews A, Ung K, Whisstock JC, et al. The major human and mouse granzymes are structurally and functionally divergent. J Cell Biol. 2006;175(4):619–30.
51. Lieberman J. The ABCs of granule-mediated cytotoxicity: new weapons in the arsenal. Nat Rev Immunol [Internet]. 2003 May [cited 2013 Nov 16];3(5):361–70. Available from: http://www.ncbi.nlm.nih.gov/pubmed/12766758
52. Sutton VR, Davis JE, Cancilla M, Johnstone RW, Ruefli a a, Sedelies K, et al. Initiation of apoptosis by granzyme B requires direct cleavage of bid, but not direct granzyme B-mediated caspase activation. J Exp Med [Internet]. 2000 Nov 20;192(10):1403–14. Available from: http://www.pubmedcentral.nih.gov/articlerender.fcgi?artid=2193191&tool=pmcentrez&rendertype=abstract
53. Metkar SS, Wang B, Ebbs ML, Kim JH, Lee YJ, Raja SM, et al. Granzyme B activates procaspase-3 which signals a mitochondrial amplification loop for maximal apoptosis. J Cell Biol [Internet]. 2003 Mar 17 [cited 2013 Dec 3];160(6):875–85. Available from: http://www.pubmedcentral.nih.gov/articlerender.fcgi?artid=2173758&tool

130
=pmcentrez&rendertype=abstract
54. Dotiwala F, Mulik S, Polidoro RB, Ansara JA, Burleigh BA, Walch M, et al. Killer lymphocytes use granulysin, perforin and granzymes to kill intracellular parasites. Nat Med. 2016;22(2):210–6.
55. Walch M, Dotiwala F, Mulik S, Thiery J, Kirchhausen T, Clayberger C, et al. Cytotoxic Cells Kill Intracellular Bacteria through Granulysin-Mediated Delivery of Granzymes. Cell [Internet]. 2014 Jun [cited 2014 Jun 5];157(6):1309–23. Available from: http://linkinghub.elsevier.com/retrieve/pii/S0092867414005923
56. Law RHP, Lukoyanova N, Voskoboinik I, Caradoc-Davies TT, Baran K, Dunstone MA, et al. The structural basis for membrane binding and pore formation by lymphocyte perforin. Nature [Internet]. 2010 Nov 18 [cited 2012 Mar 20];468(7322):447–51. Available from: http://www.ncbi.nlm.nih.gov/pubmed/21037563
57. Keefe D, Shi L, Feske S, Massol R, Navarro F, Kirchhausen T, et al. Perforin triggers a plasma membrane-repair response that facilitates CTL induction of apoptosis. Immunity [Internet]. 2005 Sep [cited 2012 Mar 23];23(3):249–62. Available from: http://www.ncbi.nlm.nih.gov/pubmed/16169498
58. Thiery J, Keefe D, Boulant S, Boucrot E, Walch M, Martinvalet D, et al. Perforin pores in the endosomal membrane trigger the release of endocytosed granzyme B into the cytosol of target cells. Nat Immunol [Internet]. 2011 Aug [cited 2014 Aug 8];12(8):770–7. Available from: http://www.pubmedcentral.nih.gov/articlerender.fcgi?artid=3140544&tool=pmcentrez&rendertype=abstract
59. Lopez JA, Susanto O, Jenkins MR, Lukoyanova N, Sutton VR, Law RHPP, et al. Perforin forms transient pores on the target cell plasma membrane to facilitate rapid access of granzymes during killer cell attack. Blood [Internet]. 2013 Apr 4 [cited 2013 Nov 22];121(14):2659–68. Available from: http://www.ncbi.nlm.nih.gov/pubmed/23377437
60. Pipkin ME, Lieberman J. Delivering the kiss of death: progress on understanding how perforin works. Curr Opin Immunol. 2007;19(3):301–8.
61. Smyth MJ, Street SEA, Trapani JA. Cutting edge: granzymes A and B are not essential for perforin-mediated tumor rejection. J Immunol [Internet]. 2003 Jul 15;171(2):515–8. Available from: http://www.jimmunol.org/cgi/doi/10.4049/jimmunol.171.2.515
62. Kägi D, Ledermann B, Bürki K, Seiler P, Odermatt B, Olsen KJ, et al. Cytotoxicity mediated by T cells and natural killer cells is greatly impaired in perforin-deficient mice. Nature [Internet]. 1994;369(6475):31–7. Available from:

131
http://www.nature.com/doifinder/10.1038/369031a0
63. van den Broek ME, Kägi D, Ossendorp F, Toes R, Vamvakas S, Lutz WK, et al. Decreased tumor surveillance in perforin-deficient mice. J Exp Med [Internet]. 1996 Nov 1;184(5):1781–90. Available from: http://www.ncbi.nlm.nih.gov/pubmed/8920866
64. Stepp SE, Dufourcq-Lagelouse R, Le Deist F, Bhawan S, Certain S, Mathew PA, et al. Perforin gene defects in familiar hemophagocytic lymphohistiocytosis. Science (80- ). 1999;286(5446):1957–9.
65. Matloubian M, Suresh M, Glass A, Galvan M, Chow K, Whitmire JK, et al. A role for perforin in downregulating T-cell responses during chronic viral infection. J Virol [Internet]. 1999 Mar;73(3):2527–36. Available from: http://www.ncbi.nlm.nih.gov/pubmed/9971838
66. Katano H, Cohen JI. Perforin and lymphohistiocytic proliferative disorders. Br J Haematol [Internet]. 2005 Mar;128(6):739–50. Available from: http://doi.wiley.com/10.1111/j.1365-2141.2004.05305.x
67. Aivazian D, Stern LJ. Phosphorylation of T cell receptor ζ is regulated by a lipid dependent folding transition. Nat Struct Biol. 2000;7(11):1023–6.
68. Kim ST, Takeuchi K, Sun ZYJ, Touma M, Castro CE, Fahmy A, et al. The αβ T cell receptor is an anisotropic mechanosensor. J Biol Chem. 2009;284(45):31028–37.
69. Liu B, Chen W, Evavold BD, Zhu C. Accumulation of dynamic catch bonds between TCR and agonist peptide-MHC triggers T cell signaling. Cell [Internet]. 2014 Apr 10 [cited 2014 Jul 10];157(2):357–68. Available from: http://www.cell.com/article/S0092867414003419/fulltext
70. Ritter AT, Asano Y, Stinchcombe JC, Dieckmann NMG, Chen BC, Gawden-Bone C, et al. Actin Depletion Initiates Events Leading to Granule Secretion at the Immunological Synapse. Immunity [Internet]. 2015;42(5):864–76. Available from: http://dx.doi.org/10.1016/j.immuni.2015.04.013
71. Bashour KT, Gondarenko A, Chen H, Shen K, Liu X, Huse M, et al. CD28 and CD3 have complementary roles in T-cell traction forces. Proc Natl Acad Sci [Internet]. 2014 Jan 27 [cited 2014 Jan 30];111(6):2241–6. Available from: http://www.ncbi.nlm.nih.gov/pubmed/24469820
72. O’Connor RS, Hao X, Shen K, Bashour K, Akimova T, Hancock WW, et al. Substrate Rigidity Regulates Human T Cell Activation and Proliferation. J Immunol [Internet]. 2012;189(3):1330–9. Available from: http://www.jimmunol.org/cgi/doi/10.4049/jimmunol.1102757
73. Judokusumo E, Tabdanov E, Kumari S, Dustin ML, Kam LC. Mechanosensing in T lymphocyte activation. Biophys J [Internet].

132
2012;102(2):L5–7. Available from: http://dx.doi.org/10.1016/j.bpj.2011.12.011
74. BURNET M. Cancer-A Biological Approach. Br Med J [Internet]. 1957 Apr 6;1(5022):779–86. Available from: http://www.ncbi.nlm.nih.gov/pubmed/13404306%0Ahttp://www.pubmedcentral.nih.gov/articlerender.fcgi?artid=PMC1973174
75. Shankaran V, Ikeda H, Bruce AT, White JM, Swanson PE, Old LJ, et al. IFNγ, and lymphocytes prevent primary tumour development and shape tumour immunogenicity. Nature. 2001;410(6832):1107–11.
76. Dunn GP, Bruce AT, Ikeda H, Old LJ, Schreiber RD. Cancer immunoediting: From immunosurveillance to tumor escape. Nat Immunol. 2002;3(11):991–8.
77. Quail DF, Joyce JA. Microenvironmental regulation of tumor progression and metastasis. Nat Med [Internet]. 2013 Nov 1;19(11):1423–37. Available from: http://www.nature.com/articles/nm.3394
78. Gasteiger G, Hemmers S, Firth MA, Le Floc’h A, Huse M, Sun JC, et al. IL-2–dependent tuning of NK cell sensitivity for target cells is controlled by regulatory T cells. J Exp Med [Internet]. 2013 Jun 3;210(6):1167–78. Available from: http://www.jem.org/lookup/doi/10.1084/jem.20122462
79. Bates GJ, Fox SB, Han C, Leek RD, Garcia JF, Harris AL, et al. Quantification of regulatory T cells enables the identification of high-risk breast cancer patients and those at risk of late relapse. J Clin Oncol. 2006;24(34):5373–80.
80. Fu J, Xu D, Liu Z, Shi M, Zhao P, Fu B, et al. Increased Regulatory T Cells Correlate With CD8 T-Cell Impairment and Poor Survival in Hepatocellular Carcinoma Patients. Gastroenterology [Internet]. 2007 Jun;132(7):2328–39. Available from: http://linkinghub.elsevier.com/retrieve/pii/S0016508507006282
81. Frey DM, Droeser RA, Viehl CT, Zlobec I, Lugli A, Zingg U, et al. High frequency of tumor-infiltrating FOXP3 + regulatory T cells predicts improved survival in mismatch repair-proficient colorectal cancer patients. Int J Cancer [Internet]. 2010;2643. Available from: http://doi.wiley.com/10.1002/ijc.24989
82. Harding FA, McArthur JG, Gross JA, Raulet DH, Allison JP. CD28-mediated signalling co-stimulates murine T cells and prevents induction of anergy in T-cell clones. Nature [Internet]. 1992 Apr 16;356(6370):607–9. Available from: http://www.nature.com/doifinder/10.1038/356607a0
83. Krummel MF, Allison JP. CD28 and CTLA-4 have opposing effects on the response of T cells to stimulation. J Exp Med [Internet]. 1995 Aug

133
1;182(2):459–65. Available from: http://jem.rupress.org/content/182/2/459
84. Walunas TL, Lenschow DJ, Bakker CY, Linsley PS, Freeman GJ, Green JM, et al. CTLA-4 can function as a negative regulator of T cell activation. Immunity [Internet]. 1994 Aug 1;1(5):405–13. Available from: http://www.ncbi.nlm.nih.gov/pubmed/21934098
85. Leach DR, Krummel MF, Allison JP. Enhancement of Antitumor Immunity by CTLA-4 Blockade. Science (80- ) [Internet]. 1996;271(5256):1734–6. Available from: http://www.sciencemag.org/cgi/doi/10.1126/science.271.5256.1734
86. Freeman GJ, Long AJ, Iwai Y, Bourque K, Chernova T, Nishimura H, et al. Engagement of the PD-1 immunoinhibitory receptor by a novel B7 family member leads to negative regulation of lymphocyte activation. J Exp Med [Internet]. 2000 Oct 2;192(7):1027–34. Available from: http://www.jem.org/lookup/doi/10.1084/jem.192.7.1027
87. Sheppard K-A, Fitz LJ, Lee JM, Benander C, George JA, Wooters J, et al. PD-1 inhibits T-cell receptor induced phosphorylation of the ZAP70/CD3zeta signalosome and downstream signaling to PKCtheta. FEBS Lett [Internet]. 2004 Sep 10;574(1–3):37–41. Available from: http://www.ncbi.nlm.nih.gov/pubmed/15358536
88. Hui E, Vale RD. In vitro membrane reconstitution of the T-cell receptor proximal signaling network. Nat Struct Mol Biol [Internet]. 2014;21(2):133–42. Available from: http://dx.doi.org/10.1038/nsmb.2762
89. Wolchok JD, Chiarion-Sileni V, Gonzalez R, Rutkowski P, Grob J-J, Cowey CL, et al. Overall Survival with Combined Nivolumab and Ipilimumab in Advanced Melanoma. N Engl J Med [Internet]. 2017;NEJMoa1709684. Available from: http://www.nejm.org/doi/10.1056/NEJMoa1709684
90. Wei SC, Levine JH, Cogdill AP, Zhao Y, Anang NAAS, Andrews MC, et al. Distinct Cellular Mechanisms Underlie Anti-CTLA-4 and Anti-PD-1 Checkpoint Blockade. Cell [Internet]. 2017;170(6):1120–1133.e17. Available from: http://dx.doi.org/10.1016/j.cell.2017.07.024
91. Larkin J, Chiarion-Sileni V, Gonzalez R, Grob JJ, Cowey CL, Lao CD, et al. Combined Nivolumab and Ipilimumab or Monotherapy in Untreated Melanoma. N Engl J Med [Internet]. 2015;373(1):23–34. Available from: http://www.nejm.org/doi/10.1056/NEJMoa1504030
92. Nishino M, Ramaiya NH, Hatabu H, Hodi FS. Monitoring immune-checkpoint blockade: response evaluation and biomarker development. Nat Rev Clin Oncol [Internet]. 2017;14(11):655–68. Available from: http://www.nature.com/doifinder/10.1038/nrclinonc.2017.88

134
93. Wherry EJ, Kurachi M. Molecular and cellular insights into T cell exhaustion. Nat Rev Immunol [Internet]. 2015;15(8):486–99. Available from: http://www.nature.com/doifinder/10.1038/nri3862
94. Maxwell R, Jackson CM, Lim M. Clinical Trials Investigating Immune Checkpoint Blockade in Glioblastoma. Curr Treat Options Oncol. 2017;18(8).
95. Srivastava S, Riddell SR. Chimeric Antigen Receptor T Cell Therapy: Challenges to Bench-to-Bedside Efficacy. J Immunol [Internet]. 2018;200(2):459–68. Available from: http://www.jimmunol.org/lookup/doi/10.4049/jimmunol.1701155
96. Porter DL, Levine BL, Kalos M, Bagg A, June CH. Chimeric antigen receptor-modified T cells in chronic lymphoid leukemia. N Engl J Med [Internet]. 2011 Aug 25 [cited 2015 Jan 5];365(8):725–33. Available from: http://www.pubmedcentral.nih.gov/articlerender.fcgi?artid=3387277&tool=pmcentrez&rendertype=abstract
97. Grupp SA, June CH. Adoptive Cellular Therapy. In: Dranoff G, editor. Cancer Immunology and Immunotherapy [Internet]. Berlin, Heidelberg: Springer Berlin Heidelberg; 2011. p. 149–72. Available from: https://doi.org/10.1007/82_2010_94
98. Tran E, Turcotte S, Gros A, Robbins PF, Lu Y, Dudley ME, et al. Cancer immunotherapy based on mutation-specific CD4+ T cells in a patient with epithelial cancer. Science [Internet]. 2014 May 9 [cited 2014 Jul 10];344(6184):641–5. Available from: http://www.ncbi.nlm.nih.gov/pubmed/24812403
99. Brudno JN, Kochenderfer JN. Chimeric antigen receptor T-cell therapies for lymphoma. Nat Rev Clin Oncol [Internet]. 2018;15(1):31–46. Available from: http://dx.doi.org/10.1038/nrclinonc.2017.128
100. Morgan RA, Yang JC, Kitano M, Dudley ME, Laurencot CM, Rosenberg SA. Case Report of a Serious Adverse Event Following the Administration of T Cells Transduced With a Chimeric Antigen Receptor Recognizing ERBB2. Mol Ther [Internet]. 2010 Apr;18(4):843–51. Available from: http://dx.doi.org/10.1038/mt.2010.24
101. Bonifant CL, Jackson HJ, Brentjens RJ, Curran KJ. Toxicity and management in CAR T-cell therapy. Mol Ther - Oncolytics [Internet]. 2016;3(February):16011. Available from: http://dx.doi.org/10.1038/mto.2016.11
102. Roybal KT, Rupp LJ, Morsut L, Walker WJ, McNally KA, Park JS, et al. Precision Tumor Recognition by T Cells with Combinatorial Antigen-Sensing Circuits. Cell. 2016;164(4):770–9.

135
103. Ingber DE. Cellular mechanotransduction: putting all the pieces together again. FASEB J [Internet]. 2006;20(7):811–27. Available from: http://eutils.ncbi.nlm.nih.gov/entrez/eutils/elink.fcgi?dbfrom=pubmed&id=16705083&retmode=ref&cmd=prlinks%5Cnfile:///Users/LizMacari/Library/Application Support/Papers2/Articles/2006/Schlueter/The FASEB Journal 2006 Schlueter.pdf%5Cnpapers2://publication/
104. Orr AW, Helmke BP, Blackman BR, Schwartz MA. Mechanisms of mechanotransduction. Dev Cell. 2006;10(1):11–20.
105. Stinchcombe JC, Griffiths GM. Secretory mechanisms in cell-mediated cytotoxicity. Annu Rev Cell Dev Biol [Internet]. 2007 Jan [cited 2014 Dec 15];23:495–517. Available from: http://www.ncbi.nlm.nih.gov/pubmed/17506701
106. Bertrand F, Muller S, Roh K-H, Laurent C, Dupre L, Valitutti S. An initial and rapid step of lytic granule secretion precedes microtubule organizing center polarization at the cytotoxic T lymphocyte/target cell synapse. Proc Natl Acad Sci [Internet]. 2013;110(15):6073–8. Available from: http://www.pnas.org/cgi/doi/10.1073/pnas.1218640110
107. Le Floc’h A, Huse M. Molecular mechanisms and functional implications of polarized actin remodeling at the T cell immunological synapse. Cell Mol Life Sci [Internet]. 2015 Feb;72(3):537–56. Available from: http://link.springer.com/10.1007/s00018-014-1760-7
108. Bunnell SC, Kapoor V, Trible RP, Zhang W, Samelson LE. Dynamic actin polymerization drives T cell receptor-induced spreading: A role for the signal transduction adaptor LAT. Immunity. 2001;14(3):315–29.
109. Grakoui a, Bromley SK, Sumen C, Davis MM, Shaw a S, Allen PM, et al. The immunological synapse: a molecular machine controlling T cell activation. Science. 1999;285(5425):221–7.
110. Husson J, Chemin K, Bohineust A, Hivroz C, Henry N. Force generation upon T cell receptor engagement. PLoS One. 2011;6(5).
111. Beal AM, Anikeeva N, Varma R, Cameron TO, Vasiliver-Shamis G, Norris PJ, et al. Kinetics of Early T Cell Receptor Signaling Regulate the Pathway of Lytic Granule Delivery to the Secretory Domain. Immunity [Internet]. 2009;31(4):632–42. Available from: http://dx.doi.org/10.1016/j.immuni.2009.09.004
112. Ostergaard HL, Kane KP, Mescher MF, Clark WR. Cytotoxic T lymphocyte mediated lysis without release of serine esterase. Nature [Internet]. 1987;330(6143):71–2. Available from: http://www.nature.com/nature/journal/v330/n6143/abs/330071a0.html%5Cnhttp://www.ncbi.nlm.nih.gov/pubmed/3118212
113. Babich A, Li S, O’Connor RS, Milone MC, Freedman BD, Burkhardt JK.

136
F-actin polymerization and retrograde flow drive sustained PLCγ1 signaling during T cell activation. J Cell Biol. 2012;197(6):775–87.
114. Jacobelli J, Chmura SA, Buxton DB, Davis MM, Krummel MF. A single class II myosin modulates T cell motility and stopping, but not synapse formation. Nat Immunol. 2004;5(5):531–8.
115. Yi J, Wu XS, Crites T, Hammer JA. Actin retrograde flow and actomyosin II arc contraction drive receptor cluster dynamics at the immunological synapse in Jurkat T cells. Mol Biol Cell [Internet]. 2012;23(5):834–52. Available from: http://www.molbiolcell.org/cgi/doi/10.1091/mbc.E11-08-0731
116. Hammer JA, Burkhardt JK. Controversy and consensus regarding myosin II function at the immunological synapse. Curr Opin Immunol [Internet]. 2013;25(3):300–6. Available from: http://dx.doi.org/10.1016/j.coi.2013.03.010
117. Liu X, Kapoor TM, Chen JK, Huse M. Diacylglycerol promotes centrosome polarization in T cells via reciprocal localization of dynein and myosin II. Proc Natl Acad Sci [Internet]. 2013;110(29):11976–81. Available from: http://www.pnas.org/cgi/doi/10.1073/pnas.1306180110
118. Huang HW, Chen FY, Lee MT. Molecular mechanism of peptide-induced pores in membranes. Phys Rev Lett. 2004;92(19):1–4.
119. Lee M-T, Hung W-C, Chen F-Y, Huang HW. Mechanism and kinetics of pore formation in membranes by water-soluble amphipathic peptides. Proc Natl Acad Sci [Internet]. 2008;105(13):5087–92. Available from: http://www.pnas.org/cgi/doi/10.1073/pnas.0710625105
120. Polozov I V., Anantharamaiah GM, Segrest JP, Epand RM. Osmotically induced membrane tension modulates membrane permeabilization by class L amphipathic helical peptides: Nucleation model of defect formation. Biophys J [Internet]. 2001;81(2):949–59. Available from: http://dx.doi.org/10.1016/S0006-3495(01)75753-0
121. Engler AJ, Sen S, Sweeney HL, Discher DE. Matrix Elasticity Directs Stem Cell Lineage Specification. Cell. 2006;126(4):677–89.
122. Chan CE, Odde DJ. Traction dynamics of filopodia on compliant substrates. Science (80- ). 2008;322(5908):1687–91.
123. Hui KL, Balagopalan L, Samelson LE, Upadhyaya A. Cytoskeletal forces during signaling activation in Jurkat T-cells. Mol Biol Cell [Internet]. 2015;26(4):685–95. Available from: http://www.molbiolcell.org/cgi/doi/10.1091/mbc.E14-03-0830
124. Lo CM, Wang HB, Dembo M, Wang YL. Cell movement is guided by the rigidity of the substrate. Biophys J [Internet]. 2000;79(1):144–52.

137
Available from: http://dx.doi.org/10.1016/S0006-3495(00)76279-5
125. Oakes PW, Patel DC, Morin NA, Zitterbart DP, Fabry B, Reichner JS, et al. Neutrophil morphology and migration are affected by substrate elasticity. Blood. 2009;114(7):1387–95.
126. Houk AR, Jilkine A, Mejean CO, Boltyanskiy R, Dufresne ER, Angenent SB, et al. Membrane tension maintains cell polarity by confining signals to the leading edge during neutrophil migration. Cell [Internet]. 2012;148(1–2):175–88. Available from: http://dx.doi.org/10.1016/j.cell.2011.10.050
127. Lee C-Y, Herant M, Heinrich V. Target-specific mechanics of phagocytosis: protrusive neutrophil response to zymosan differs from the uptake of antibody-tagged pathogens. J Cell Sci [Internet]. 2011;124(7):1106–14. Available from: http://jcs.biologists.org/cgi/doi/10.1242/jcs.078592
128. Masters TA, Pontes B, Viasnoff V, Li Y, Gauthier NC. Plasma membrane tension orchestrates membrane trafficking, cytoskeletal remodeling, and biochemical signaling during phagocytosis. Proc Natl Acad Sci [Internet]. 2013;110(29):11875–80. Available from: http://www.pnas.org/cgi/doi/10.1073/pnas.1301766110
129. Wakatsuki T, Schwab B, Thompson NC, Elson EL. Effects of cytochalasin D and latrunculin B on mechanical properties of cells. J Cell Sci. 2001;114(Pt 5):1025–36.
130. Rak GD, Mace EM, Banerjee PP, Svitkina T, Orange JS. Natural Killer cell lytic granule secretion occurs through a pervasive actin network at the immune synapse. PLoS Biol. 2011;9(9).
131. Dai J, Sheetz MP. Mechanical properties of neuronal growth cone membranes studied by tether formation with laser optical tweezers. Biophys J [Internet]. 1995;68(3):988–96. Available from: http://dx.doi.org/10.1016/S0006-3495(95)80274-2
132. Comrie WA, Babich A, Burkhardt JK. F-actin flow drives affinity maturation and spatial organization of LFA-1 at the immunological synapse. J Cell Biol. 2015;208(4):475–91.
133. Natkanski E, Lee W-Y, Mistry B, Casal A, Molloy JE, Tolar P. B Cells Use Mechanical Energy to Discriminate Antigen Affinities. Science (80- ) [Internet]. 2013 Jun 28;340(6140):1587–90. Available from: http://www.sciencemag.org/cgi/doi/10.1126/science.1237572
134. Stinchcombe JC, Griffiths GM. Secretory Mechanisms in Cell-Mediated Cytotoxicity. Annu Rev Cell Dev Biol [Internet]. 2007;23(1):495–517. Available from: http://www.annualreviews.org/doi/10.1146/annurev.cellbio.23.090506.12

138
3521
135. Woodsworth DJ, Dunsing V, Coombs D. Design Parameters for Granzyme-Mediated Cytotoxic Lymphocyte Target-Cell Killing and Specificity. Biophys J [Internet]. 2015;109(3):477–88. Available from: http://dx.doi.org/10.1016/j.bpj.2015.06.045
136. Feinerman O, Jentsch G, Tkach KE, Coward JW, Hathorn MM, Sneddon MW, et al. Single-cell quantification of IL-2 response by effector and regulatory T cells reveals critical plasticity in immune response. Mol Syst Biol [Internet]. 2010 Nov 30 [cited 2013 Aug 14];6:437. Available from: http://www.pubmedcentral.nih.gov/articlerender.fcgi?artid=3010113&tool=pmcentrez&rendertype=abstract
137. Müller AJ, Filipe-Santos O, Eberl G, Aebischer T, Späth GF, Bousso P. CD4+ T Cells Rely on a Cytokine Gradient to Control Intracellular Pathogens beyond Sites of Antigen Presentation. Immunity [Internet]. 2012 Jun; Available from: http://linkinghub.elsevier.com/retrieve/pii/S1074761312002282
138. Sanderson NSR, Puntel M, Kroeger KM, Bondale NS, Swerdlow M, Iranmanesh N, et al. Cytotoxic immunological synapses do not restrict the action of interferon-γ to antigenic target cells. Proc Natl Acad Sci U S A [Internet]. 2012 Apr 30 [cited 2012 May 12];109(20):7835–40. Available from: http://www.ncbi.nlm.nih.gov/pubmed/22547816
139. Diz-Muñoz A, Fletcher DA, Weiner OD. Use the force: Membrane tension as an organizer of cell shape and motility. Trends Cell Biol. 2013;23(2):47–53.
140. Dustin ML, Chakraborty AK, Shaw AS. Understanding the structure and function of the immunological synapse. Cold Spring HarbPerspectBiol. 2010;2(1943–0264 (Electronic)):a002311.
141. Brown ACN, Oddos S, Dobbie IM, Alakoskela JM, Parton RM, Eissmann P, et al. Remodelling of cortical actin where lytic granules dock at Natural Killer cell immune synapses revealed by super-resolution microscopy. PLoS Biol. 2011;9(9).
142. Paszek MJ, Zahir N, Johnson KR, Lakins JN, Rozenberg GI, Gefen A, et al. Tensional homeostasis and the malignant phenotype. Cancer Cell. 2005;8(3):241–54.
143. Rabinovich GA, Gabrilovich D, Sotomayor EM. Immunosuppressive Strategies that are Mediated by Tumor Cells. Annu Rev Immunol [Internet]. 2007;25(1):267–96. Available from: http://www.annualreviews.org/doi/10.1146/annurev.immunol.25.022106.141609
144. Guck J, Schinkinger S, Lincoln B, Wottawah F, Ebert S, Romeyke M, et

139
al. Optical deformability as an inherent cell marker for testing malignant transformation and metastatic competence. Biophys J. 2005;88(5):3689–98.
145. Hou HW, Li QS, Lee GYH, Kumar AP, Ong CN, Lim CT. Deformability study of breast cancer cells using microfluidics. Biomed Microdevices. 2009;11(3):557–64.
146. Xu W, Mezencev R, Kim B, Wang L, McDonald J, Sulchek T. Cell Stiffness Is a Biomarker of the Metastatic Potential of Ovarian Cancer Cells. PLoS One. 2012;7(10).
147. Sage PT, Varghese LM, Martinelli R, Sciuto TE, Kamei M, Dvorak AM, et al. Antigen Recognition Is Facilitated by Invadosome-like Protrusions Formed by Memory/Effector T Cells. J Immunol [Internet]. 2012;188(8):3686–99. Available from: http://www.jimmunol.org/cgi/doi/10.4049/jimmunol.1102594
148. Ueda H, Morphew MK, McIntosh JR, Davis MM. CD4+ T-cell synapses involve multiple distinct stages. Proc Natl Acad Sci [Internet]. 2011;108(41):17099–104. Available from: http://www.pnas.org/cgi/doi/10.1073/pnas.1113703108
149. Quann EJ, Merino E, Furuta T, Huse M. Localized diacylglycerol drives the polarization of the microtubule-organizing center in T cells. Nat Immunol. 2009;10(6):627–35.
150. Thiery J, Walch M, Jensen DK, Martinvalet D, Lieberman J. Isolation of cytotoxic T cell and NK granules and purification of their effector proteins. Curr Protoc Cell Biol [Internet]. 2010 Jun [cited 2014 Feb 12];Chapter 3:Unit3.37. Available from: http://www.ncbi.nlm.nih.gov/pubmed/20521234
151. Dobrzanski MJ, Reome JB, Dutton RW. Therapeutic effects of tumor-reactive type 1 and type 2 CD8+ T cell subpopulations in established pulmonary metastases. J Immunol [Internet]. 1999 Jun 1;162(11):6671–80. Available from: http://www.ncbi.nlm.nih.gov/pubmed/10352285
152. Brown DM, Fisher TL, Wei C, Frelinger JG, Lord EM. Tumours can act as adjuvants for humoral immunity. Immunology [Internet]. 2001 Apr;102(4):486–97. Available from: http://doi.wiley.com/10.1046/j.1365-2567.2001.01213.x
153. Locke FL, Zha Y, Zheng Y, Driessens G, Gajewski TF. Conditional deletion of PTEN in peripheral T cells augments TCR-mediated activation but does not abrogate CD28 dependency or prevent anergy induction. J Immunol [Internet]. 2013;191(4):1677–85. Available from: http://www.pubmedcentral.nih.gov/articlerender.fcgi?artid=3759681&tool=pmcentrez&rendertype=abstract%5Cnhttp://www.ncbi.nlm.nih.gov/pubmed/23851688

140
154. Platt RJ, Chen S, Zhou Y, Yim MJ, Swiech L, Kempton HR, et al. CRISPR-Cas9 knockin mice for genome editing and cancer modeling. Cell [Internet]. 2014;159(2):440–55. Available from: http://dx.doi.org/10.1016/j.cell.2014.09.014
155. Lesche R, Groszer M, Gao J, Wang Y, Messing A, Sun H, et al. Cre/loxP-mediated inactivation of the murine Pten tumor suppressor gene. Genesis. 2002;32(2):148–9.
156. Kim EH, Sullivan JA, Plisch EH, Tejera MM, Jatzek A, Choi KY, et al. Signal Integration by Akt Regulates CD8 T Cell Effector and Memory Differentiation. J Immunol [Internet]. 2012;188(9):4305–14. Available from: http://www.jimmunol.org/cgi/doi/10.4049/jimmunol.1103568
157. Finlay DK, Sinclair L V, Feijoo C, Waugh CM, Hagenbeek TJ, Spits H, et al. Phosphoinositide-dependent kinase 1 controls migration and malignant transformation but not cell growth and proliferation in PTEN-null lymphocytes. J Exp Med. 2009;206(11):2441–54.
158. Jameson SC. Maintaining the norm: T-cell homeostasis. Nat Rev Immunol [Internet]. 2002 Aug;2(8):547–56. Available from: http://www.nature.com/articles/nri853
159. Sabatini DM, Erdjument-Bromage H, Lui M, Tempst P, Snyder SH. RAFT1: A mammalian protein that binds to FKBP12 in a rapamycin-dependent fashion and is homologous to yeast TORs. Cell. 1994;78(1):35–43.
160. Saxton RA, Sabatini DM. mTOR Signaling in Growth, Metabolism, and Disease. Cell [Internet]. 2017;168(6):960–76. Available from: http://dx.doi.org/10.1016/j.cell.2017.02.004
161. Boyman O, Krieg C, Homann D, Sprent J. Homeostatic maintenance of T cells and natural killer cells. Cell Mol Life Sci. 2012;69(10):1597–608.
162. Mazurier F, Fontanellas A, Salesse S, Taine L, Landriau S, Moreau-Gaudry F, et al. A novel immunodeficient mouse model--RAG2 x common cytokine receptor gamma chain double mutants--requiring exogenous cytokine administration for human hematopoietic stem cell engraftment. J Interferon Cytokine Res [Internet]. 1999 May;19(5):533–41. Available from: http://www.liebertonline.com/doi/abs/10.1089/107999099313983
163. Araki K, Turner AP, Shaffer VO, Gangappa S, Keller SA, Bachmann MF, et al. mTOR regulates memory CD8 T-cell differentiation. Nature [Internet]. 2009;460(7251):108–12. Available from: http://www.nature.com/doifinder/10.1038/nature08155
164. Zhang X, Sun S, Hwang I, Tough DF, Sprent J. Potent and selective stimulation of memory-phenotype CD8+ T cells in vivo by IL-15.

141
Immunity [Internet]. 1998;8(5):591–9. Available from: http://www.ncbi.nlm.nih.gov/pubmed/9620680
165. Sawa Y, Arima Y, Ogura H, Kitabayashi C, Jiang JJ, Fukushima T, et al. Hepatic Interleukin-7 Expression Regulates T Cell Responses. Immunity [Internet]. 2009;30(3):447–57. Available from: http://dx.doi.org/10.1016/j.immuni.2009.01.007
166. Chen CC, Jeon SM, Bhaskar PT, Nogueira V, Sundararajan D, Tonic I, et al. FoxOs Inhibit mTORC1 and Activate Akt by Inducing the Expression of Sestrin3 and Rictor. Dev Cell [Internet]. 2010;18(4):592–604. Available from: http://dx.doi.org/10.1016/j.devcel.2010.03.008
167. Luo CT, Liao W, Dadi S, Toure A, Li MO. Graded Foxo1 activity in Treg cells differentiates tumour immunity from spontaneous autoimmunity. Nature [Internet]. 2014;529(7587):121–36. Available from: http://www.pubmedcentral.nih.gov/articlerender.fcgi?artid=4522873&tool=pmcentrez&rendertype=abstract%5Cnhttp://www.ncbi.nlm.nih.gov/pubmed/24378538%5Cnhttp://www.nature.com/doifinder/10.1038/nature16486
168. Shaner NC, Lin MZ, McKeown MR, Steinbach PA, Hazelwood KL, Davidson MW, et al. Improving the photostability of bright monomeric orange and red fluorescent proteins. Nat Methods. 2008;5(6):545–51.
169. Fellmann C, Hoffmann T, Sridhar V, Hopfgartner B, Muhar M, Roth M, et al. An Optimized microRNA Backbone for Effective Single-Copy RNAi. Cell Rep [Internet]. 2013;5(6):1704–13. Available from: http://linkinghub.elsevier.com/retrieve/pii/S2211124713006876
170. Haeussler M, Schönig K, Eckert H, Eschstruth A, Mianné J, Renaud JB, et al. Evaluation of off-target and on-target scoring algorithms and integration into the guide RNA selection tool CRISPOR. Genome Biol [Internet]. 2016;17(1):1–12. Available from: http://dx.doi.org/10.1186/s13059-016-1012-2
171. Shalem O, Sanjana NE, Hartenian E, Shi X, Scott DA, Mikkelsen TS, et al. Genome-scale CRISPR-Cas9 knockout screening in human cells. Science (80- ). 2014;343(6166):84–7.
172. Sanjana NE, Shalem O, Zhang F. Improved vectors and genome-wide libraries for CRISPR screening. Nat Methods [Internet]. 2014;11(8):783–4. Available from: http://dx.doi.org/10.1038/nmeth.3047
173. Ringer P, Weißl A, Cost AL, Freikamp A, Sabass B, Mehlich A, et al. Multiplexing molecular tension sensors reveals piconewton force gradient across talin-1. Nat Methods. 2017;14(11):1090–6.
174. Wu J, Lewis AH, Grandl J. Touch, Tension, and Transduction - The Function and Regulation of Piezo Ion Channels. Trends Biochem Sci

142
[Internet]. 2017;42(1):57–71. Available from: http://dx.doi.org/10.1016/j.tibs.2016.09.004
175. Opsahl LR, Webb WW. Transduction of membrane tension by the ion channel alamethicin. Biophys J [Internet]. 1994 Jan;66(1):71–4. Available from: http://dx.doi.org/10.1016/S0006-3495(94)80751-9
176. Baitsch L, Legat A, Barba L, Marraco SA, Rivals JP, Baumgaertner P, et al. Extended co-expression of inhibitory receptors by human CD8 T-cells depending on differentiation, antigen-specificity and anatomical localization. PLoS One. 2012;7(2):1–10.
177. Lin S-J, Peacock CD, Bahl K, Welsh RM. Programmed death-1 (PD-1) defines a transient and dysfunctional oligoclonal T cell population in acute homeostatic proliferation. J Exp Med [Internet]. 2007;204(10):2321–33. Available from: http://www.jem.org/lookup/doi/10.1084/jem.20062150