An automated preconcentration system for the determination of manganese in food samples
6
Original Article An automated preconcentration system for the determination of manganese in food samples Valfredo Azevedo Lemos *, Cleber Galva ˜o Novaes, Marcos Almeida Bezerra Universidade Estadual do Sudoeste da Bahia, Nu ´cleo de Quı´mica Analı´tica da Bahia (NQA), Laborato ´rio de Quı´mica Analı´tica (LQA), Campus de Jequie ´, Jequie ´, Bahia 45.506-191, Brazil 1. Introduction Manganese is an essential micronutrient for the growth of plants. The metal is therefore added in the form of manganese salts in places where there is deficiency of the element in the soil. Manganese is an essential element for the activity of a group of enzymes called phosphotranferases (Knap et al., 2007). It is important also to microorganisms and animals. Excessive exposure to manganese causes toxicity to the central nervous, respiratory, cardiac and reproductive systems. The central nervous system is the critical target of exposure, since toxic effects arise in this system at lower concentrations than in the other systems. Even at low concentrations, the effects observed in the central nervous system are quite worrisome. The neurotoxicity of manganese is well-known, however, the neurochemical effects produced by this metal are not completely understood. Foods are the major source of manganese for humans. The largest concentrations are found in foods of vegetal origin, especially wheat and rice. Thus, the determination of manganese levels in food is very important. Some reports found in the literature have described the determination of manganese levels in several foods using diverse analytical techniques. Table 1 presents some of these works. The techniques involving atomic absorption spectrometry (AAS) are extensively used for the quantification of metallic species. Among these techniques, flame atomic absorption spectrometry (FAAS) presents advantageous characteristics, such as robustness of the equipment, low cost, speed, ease of operation, high analytical frequency and selectivity (Welz and Sperling, 1999; Ferreira et al., 2008). However, the direct determination of trace elements by FAAS is generally difficult due to the low concentra- tion of metals in the samples. This problem can be suppressed by using a separation or preconcentration procedure before the detection. Several enrichment techniques have been used for the determination of metals, such as coprecipitation (Soylak and Tuzen, 2008), liquid–liquid (LLE) (Jamali et al., 2007) cloud-point (CPE) (Bezerra et al., 2006; Lemos et al., 2006) or solid-phase extraction (SPE) (Ferreira et al., 2003). Many authors have chosen SPE technique for their work based on factors such as simplicity, reduction of disposal costs and extraction time, the achievement of high enrichment factors and the ease of automation. Solid-phase extraction is an effective technique for the preconcentration of trace manganese in a great variety of ambient samples, such as natural water, soil and food. The need to automate analytical procedures stems from the demand for fast and reliable methods for the evaluation of many Journal of Food Composition and Analysis 22 (2009) 337–342 ARTICLE INFO Article history: Received 2 August 2008 Received in revised form 23 November 2008 Accepted 24 November 2008 Keywords: Food Preconcentration On-line system Polyurethane foam Br-TAO Manganese Trace metals in food Food analysis Food composition Determination ABSTRACT In this work, an on-line automated system for the preconcentration and evaluation of manganese in food samples is proposed. The preconcentration of manganese ions is carried out using two mini-columns packed with 4-(5 0 -bromo-2 0 -thiazolylazo)orcinol (Br-TAO) loaded polyurethane foam. After a preconcentration step, a stream of hydrochloric acid is passed through the mini-column in order to transport the manganese directly to the flame atomic absorption spectrometer. The sample frequency was 60 h 1 for a 60 s preconcentration time. The limit of detection and enrichment factor were 0.70 mgL 1 and 17, respectively. The accuracy of the procedure was evaluated by analysis of biological reference materials (spinach leaves, tomato leaves and pine needles). The procedure was successfully applied for the evaluation of manganese in several food samples, such as corn, rice and cassava flour. ß 2009 Elsevier Inc. All rights reserved. * Corresponding author. Fax: +55 73 35289630. E-mail address: [email protected] (V.A. Lemos). Contents lists available at ScienceDirect Journal of Food Composition and Analysis journal homepage: www.elsevier.com/locate/jfca 0889-1575/$ – see front matter ß 2009 Elsevier Inc. All rights reserved. doi:10.1016/j.jfca.2008.11.019
-
Upload
independent -
Category
Documents
-
view
0 -
download
0
Transcript of An automated preconcentration system for the determination of manganese in food samples

Journal of Food Composition and Analysis 22 (2009) 337–342
Original Article
An automated preconcentration system for the determination of manganese infood samples
Valfredo Azevedo Lemos *, Cleber Galvao Novaes, Marcos Almeida Bezerra
Universidade Estadual do Sudoeste da Bahia, Nucleo de Quımica Analıtica da Bahia (NQA), Laboratorio de Quımica Analıtica (LQA), Campus de Jequie, Jequie, Bahia 45.506-191, Brazil
A R T I C L E I N F O
Article history:
Received 2 August 2008
Received in revised form 23 November 2008
Accepted 24 November 2008
Keywords:
Food
Preconcentration
On-line system
Polyurethane foam
Br-TAO
Manganese
Trace metals in food
Food analysis
Food composition
Determination
A B S T R A C T
In this work, an on-line automated system for the preconcentration and evaluation of manganese in food
samples is proposed. The preconcentration of manganese ions is carried out using two mini-columns
packed with 4-(50-bromo-20-thiazolylazo)orcinol (Br-TAO) loaded polyurethane foam. After a
preconcentration step, a stream of hydrochloric acid is passed through the mini-column in order to
transport the manganese directly to the flame atomic absorption spectrometer. The sample frequency
was 60 h�1 for a 60 s preconcentration time. The limit of detection and enrichment factor were
0.70 mg L�1 and 17, respectively. The accuracy of the procedure was evaluated by analysis of biological
reference materials (spinach leaves, tomato leaves and pine needles). The procedure was successfully
applied for the evaluation of manganese in several food samples, such as corn, rice and cassava flour.
� 2009 Elsevier Inc. All rights reserved.
Contents lists available at ScienceDirect
Journal of Food Composition and Analysis
journa l homepage: www.e lsev ier .com/ locate / j fca
1. Introduction
Manganese is an essential micronutrient for the growth ofplants. The metal is therefore added in the form of manganese saltsin places where there is deficiency of the element in the soil.Manganese is an essential element for the activity of a group ofenzymes called phosphotranferases (Knap et al., 2007). It isimportant also to microorganisms and animals. Excessive exposureto manganese causes toxicity to the central nervous, respiratory,cardiac and reproductive systems. The central nervous system isthe critical target of exposure, since toxic effects arise in thissystem at lower concentrations than in the other systems. Even atlow concentrations, the effects observed in the central nervoussystem are quite worrisome. The neurotoxicity of manganese iswell-known, however, the neurochemical effects produced by thismetal are not completely understood.
Foods are the major source of manganese for humans. Thelargest concentrations are found in foods of vegetal origin,especially wheat and rice. Thus, the determination of manganeselevels in food is very important. Some reports found in theliterature have described the determination of manganese levels in
* Corresponding author. Fax: +55 73 35289630.
E-mail address: [email protected] (V.A. Lemos).
0889-1575/$ – see front matter � 2009 Elsevier Inc. All rights reserved.
doi:10.1016/j.jfca.2008.11.019
several foods using diverse analytical techniques. Table 1 presentssome of these works.
The techniques involving atomic absorption spectrometry(AAS) are extensively used for the quantification of metallicspecies. Among these techniques, flame atomic absorptionspectrometry (FAAS) presents advantageous characteristics, suchas robustness of the equipment, low cost, speed, ease of operation,high analytical frequency and selectivity (Welz and Sperling, 1999;Ferreira et al., 2008). However, the direct determination of traceelements by FAAS is generally difficult due to the low concentra-tion of metals in the samples. This problem can be suppressed byusing a separation or preconcentration procedure before thedetection. Several enrichment techniques have been used for thedetermination of metals, such as coprecipitation (Soylak andTuzen, 2008), liquid–liquid (LLE) (Jamali et al., 2007) cloud-point(CPE) (Bezerra et al., 2006; Lemos et al., 2006) or solid-phaseextraction (SPE) (Ferreira et al., 2003). Many authors have chosenSPE technique for their work based on factors such as simplicity,reduction of disposal costs and extraction time, the achievement ofhigh enrichment factors and the ease of automation. Solid-phaseextraction is an effective technique for the preconcentration oftrace manganese in a great variety of ambient samples, such asnatural water, soil and food.
The need to automate analytical procedures stems from thedemand for fast and reliable methods for the evaluation of many
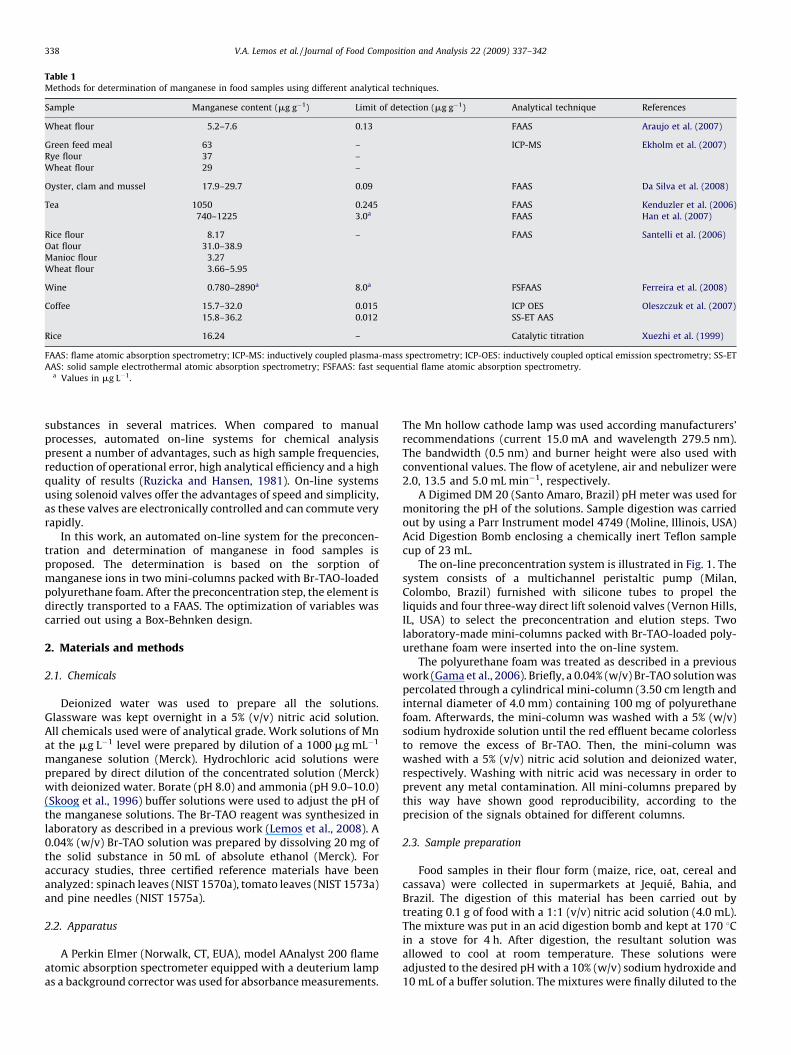
Table 1Methods for determination of manganese in food samples using different analytical techniques.
Sample Manganese content (mg g�1) Limit of detection (mg g�1) Analytical technique References
Wheat flour 5.2–7.6 0.13 FAAS Araujo et al. (2007)
Green feed meal 63 – ICP-MS Ekholm et al. (2007)
Rye flour 37 –
Wheat flour 29 –
Oyster, clam and mussel 17.9–29.7 0.09 FAAS Da Silva et al. (2008)
Tea 1050 0.245 FAAS Kenduzler et al. (2006)
740–1225 3.0a FAAS Han et al. (2007)
Rice flour 8.17 – FAAS Santelli et al. (2006)
Oat flour 31.0–38.9
Manioc flour 3.27
Wheat flour 3.66–5.95
Wine 0.780–2890a 8.0a FSFAAS Ferreira et al. (2008)
Coffee 15.7–32.0 0.015 ICP OES Oleszczuk et al. (2007)
15.8–36.2 0.012 SS-ET AAS
Rice 16.24 – Catalytic titration Xuezhi et al. (1999)
FAAS: flame atomic absorption spectrometry; ICP-MS: inductively coupled plasma-mass spectrometry; ICP-OES: inductively coupled optical emission spectrometry; SS-ET
AAS: solid sample electrothermal atomic absorption spectrometry; FSFAAS: fast sequential flame atomic absorption spectrometry.a Values in mg L�1.
V.A. Lemos et al. / Journal of Food Composition and Analysis 22 (2009) 337–342338
substances in several matrices. When compared to manualprocesses, automated on-line systems for chemical analysispresent a number of advantages, such as high sample frequencies,reduction of operational error, high analytical efficiency and a highquality of results (Ruzicka and Hansen, 1981). On-line systemsusing solenoid valves offer the advantages of speed and simplicity,as these valves are electronically controlled and can commute veryrapidly.
In this work, an automated on-line system for the preconcen-tration and determination of manganese in food samples isproposed. The determination is based on the sorption ofmanganese ions in two mini-columns packed with Br-TAO-loadedpolyurethane foam. After the preconcentration step, the element isdirectly transported to a FAAS. The optimization of variables wascarried out using a Box-Behnken design.
2. Materials and methods
2.1. Chemicals
Deionized water was used to prepare all the solutions.Glassware was kept overnight in a 5% (v/v) nitric acid solution.All chemicals used were of analytical grade. Work solutions of Mnat the mg L�1 level were prepared by dilution of a 1000 mg mL�1
manganese solution (Merck). Hydrochloric acid solutions wereprepared by direct dilution of the concentrated solution (Merck)with deionized water. Borate (pH 8.0) and ammonia (pH 9.0–10.0)(Skoog et al., 1996) buffer solutions were used to adjust the pH ofthe manganese solutions. The Br-TAO reagent was synthesized inlaboratory as described in a previous work (Lemos et al., 2008). A0.04% (w/v) Br-TAO solution was prepared by dissolving 20 mg ofthe solid substance in 50 mL of absolute ethanol (Merck). Foraccuracy studies, three certified reference materials have beenanalyzed: spinach leaves (NIST 1570a), tomato leaves (NIST 1573a)and pine needles (NIST 1575a).
2.2. Apparatus
A Perkin Elmer (Norwalk, CT, EUA), model AAnalyst 200 flameatomic absorption spectrometer equipped with a deuterium lampas a background corrector was used for absorbance measurements.
The Mn hollow cathode lamp was used according manufacturers’recommendations (current 15.0 mA and wavelength 279.5 nm).The bandwidth (0.5 nm) and burner height were also used withconventional values. The flow of acetylene, air and nebulizer were2.0, 13.5 and 5.0 mL min�1, respectively.
A Digimed DM 20 (Santo Amaro, Brazil) pH meter was used formonitoring the pH of the solutions. Sample digestion was carriedout by using a Parr Instrument model 4749 (Moline, Illinois, USA)Acid Digestion Bomb enclosing a chemically inert Teflon samplecup of 23 mL.
The on-line preconcentration system is illustrated in Fig. 1. Thesystem consists of a multichannel peristaltic pump (Milan,Colombo, Brazil) furnished with silicone tubes to propel theliquids and four three-way direct lift solenoid valves (Vernon Hills,IL, USA) to select the preconcentration and elution steps. Twolaboratory-made mini-columns packed with Br-TAO-loaded poly-urethane foam were inserted into the on-line system.
The polyurethane foam was treated as described in a previouswork (Gama et al., 2006). Briefly, a 0.04% (w/v) Br-TAO solution waspercolated through a cylindrical mini-column (3.50 cm length andinternal diameter of 4.0 mm) containing 100 mg of polyurethanefoam. Afterwards, the mini-column was washed with a 5% (w/v)sodium hydroxide solution until the red effluent became colorlessto remove the excess of Br-TAO. Then, the mini-column waswashed with a 5% (v/v) nitric acid solution and deionized water,respectively. Washing with nitric acid was necessary in order toprevent any metal contamination. All mini-columns prepared bythis way have shown good reproducibility, according to theprecision of the signals obtained for different columns.
2.3. Sample preparation
Food samples in their flour form (maize, rice, oat, cereal andcassava) were collected in supermarkets at Jequie, Bahia, andBrazil. The digestion of this material has been carried out bytreating 0.1 g of food with a 1:1 (v/v) nitric acid solution (4.0 mL).The mixture was put in an acid digestion bomb and kept at 170 8Cin a stove for 4 h. After digestion, the resultant solution wasallowed to cool at room temperature. These solutions wereadjusted to the desired pH with a 10% (w/v) sodium hydroxide and10 mL of a buffer solution. The mixtures were finally diluted to the

Fig. 1. Schematic diagram of the automated on-line preconcentration system for manganese determination using Br-TAO-loaded polyurethane foam. S: sample; E: eluent; W,
waste; C1 and C2: mini-columns packed with Br-TAO-loaded polyurethane foam; P: peristaltic pump; FAAS: flame atomic absorption spectrometer; 1: preconcentration on
mini-column C1, elution on mini-column C2; 2: elution on mini-column C1,
preconcentration on mini-column C1.
Table 2Variables and their levels for the Box-Behnken design.
Variable Minimum (�) Maximum (+) Central point (0)
pH 8.0 10.0 9.0
Concentration of buffer (CB) 0.100 mol L�1 0.200 mol L�1 0.150 mol L�1
Concentration of eluent (CE) 0.5 mol L�1 1.5 mol L�1 1.0 mol L�1
Table 3Variables for the Box-Behnken design with real and coded values. CB: concentration
of buffer; CE: concentration of eluent.
Experiment pH CB (mol L�1) CE (mol L�1) Analytical signal
1 8.0 (�) 0.20 (+) 1.0 (0) 0.079
2 9.0 (0) 0.20 (+) 1.5 (+) 0.160
3 9.0 (0) 0.20 (+) 0.5 (�) 0.163
4 10.0 (+) 0.20 (+) 1.0 (0) 0.232
5 8.0 (�) 0.15 (0) 1.5 (+) 0.112
6 8.0 (�) 0.15 (0) 0.5 (�) 0.112
7 9.0 (0) 0.15 (0) 1.0 (0) 0.185
8 9.0 (0) 0.15 (0) 1.0 (0) 0.189
9 9.0 (0) 0.15 (0) 1.0 (0) 0.178
10 10.0 (+) 0.15 (0) 1.5 (+) 0.258
11 10.0 (+) 0.15 (0) 0.5 (�) 0.248
12 8.0 (�) 0.10 (�) 1.0 (0) 0.096
13 9.0 (0) 0.10 (�) 1.5 (+) 0.198
14 9.0 (0) 0.10 (�) 0.5 (�) 0.191
15 10.0 (+) 0.10 (�) 1.0 (0) 0.298
Fig. 2. Surface response obtained for Box-Behnken design, pH � CB. CB:
concentration of buffer.
V.A. Lemos et al. / Journal of Food Composition and Analysis 22 (2009) 337–342 339
desired final volume (50 or 100 mL) by using deionized water.Spiked samples were also prepared in order to calculate therecovery of the digestion procedure. Blanks were prepared in asimilar fashion.
2.4. On-line preconcentration system
The on-line preconcentration system represented in Fig. 1operates in a time-based mode for sample introduction. Thesample and eluent flow rates were fixed at 6.0 mL min�1. When thesolenoid valves were turned on, a Mn solution was passed throughmini-column C1. During this step, the manganese ions wereretained on the sorbent and the remaining solution flowed towaste while a stream of eluent was passed through mini-columnC2. After 60 s, the four valves were automatically turned off and theeluent was passed through mini-column C1, transporting themanganese ions to the FAAS. The sorption then occurred in mini-column C2. Signals were measured as absorbance, using thesoftware of the spectrometer. The design of this system allowedalternate steps of preconcentration and elution in the two mini-columns, resulting in a sample frequency of 60 h�1.
2.5. Optimization strategy
The optimization process was carried out by means of themethodology of response surface. A Box-Behnken design (Ferreiraet al., 2007) was used for the optimization of three experimentalvariables: pH, concentration of the buffer (CB) and concentration ofeluent (CE). The variables were studied in three levels. Theconcentration of the manganese solution was 100 mg L�1 in alloptimization experiments. Hydrochloric acid was used as theeluent. The absorbance was used as the analytical response and theexperimental data were processed using STATISTICA software witha 95% confidence level.
3. Results and discussion
3.1. Optimization of variables
A Box-Behnken design was used to investigate the influence ofthree variables on the preconcentration system. The designallowed for the evaluation of the importance of each variable inthe process. The studied variables and their established levels areshown in Table 2. Table 3 presents the matrix of the experimentaldesign and the average absorbance (n = 3). The assays were carriedout at random. These assays generated the surface responsespresented in Figs. 2–4. The surface responses can be described for

Fig. 3. Surface response obtained for Box-Behnken design, pH � CE. CE:
concentration of eluent.
Fig. 4. Surface response obtained for Box-Behnken design, CB � CE. CE:
concentration of buffer; CE: concentration of eluent.
Table 4Analytical characteristics of the automated on-line preconcentration system for
manganese determination using Br-TAO-loaded polyurethane foam.
Limit of detection 0.70 mg L�1
Limit of quantification 2.4 mg L�1
Precision 2.1 and 4.5%
Linear range 2.4–100.0 mg L�1
Enrichment factor 17
Concentration efficiency 17 min�1
Consumptive index 0.4 mL
Sample frequency 60 h�1
V.A. Lemos et al. / Journal of Food Composition and Analysis 22 (2009) 337–342340
Eq. (1), resulting from an adjustment of the quadratic model.
RðMnÞ ¼ 0:1840 � þ0:1592 � ðpHÞ � 0:00325ðpHÞ2 � 0:0372
� ðCBÞ � 0:0122ðCBÞ2 þ 0:0035ðCEÞ þ 0:00025ðCEÞ2
� 0:0245 � ðpHÞðCBÞ þ 0:0050ðpHÞðCEÞ
� 0:0050ðCBÞðCEÞ (1)
The values marked with * are considered significant and R is theanswer for the metal. The coordinates of the maximum point arefound by means of the first derivative of the mathematicalfunction. The derivation of the general equation considering pH,concentration of buffer (CB) and concentration of eluent (CE)results in Eqs. (2)–(4). The resolution of this system of equationssupplies the coordinates of the maximum point.
@R
@ðpHÞ ¼ 0:1592� 0:0065ðpHÞ � 0:0245ðCBÞ þ 0:0050ðCEÞ ¼ 0
(2)
@R
@ðCBÞ ¼ �0:0372� 0:0244ðCBÞ � 0:0245ðpHÞ � 0:0050ðCEÞ ¼ 0
(3)
@R
@ðCEÞ ¼ 0:0035þ 0:0005ðCEÞ þ 0:0050ðpHÞ � 0:0050ðCBÞ ¼ 0 (4)
By application of the Lagrange criteria (Ferreira et al., 2007), it isobserved that the critical point is characterized as a saddle point,that is, a region of intersection between a relative maximum and arelative minimum. However, the coordinates of the saddle pointwill not show the optimum conditions of the studied system.Therefore, a visual inspection of the surfaces should be performedin order to find the optimum conditions for the preconcentrationsystem. Thus, it can be observed that the best signal is obtained forthe highest pH values and the lowest concentration of buffer. Theconcentration of eluent does not influence the system. In this way,for the evaluated experimental domain, the established experi-mental conditions were: pH 10.0, concentration of buffer –0.10 mol L�1 and concentration of eluent – 1.0 mol L�1. Othervariables were pre-established, such as sample and eluent flowrates (6.0 mL min�1) and the amount of polyurethane foam(100 mg). These variables were chosen according to worksdescribed in the literature and previous experiments.
The mathematical model was evaluated using the analysis ofvariance (ANOVA) and the analysis of the residues generatedbetween the predicted values and the observed values. The resultsdemonstrated that the employed mathematical model is wellsuited to the obtained values.
3.2. Analytical features
Under the optimized conditions, some analytical features forthe on-line system were calculated. The system allows for thedetermination of manganese in the concentration range between2.4 and 100.0 mg L�1. The calibration curve over this interval wasdetermined to be A = 1.82 � 10�3 + 2.12 � 10�3C, where A is theanalytical signal, measured as absorbance, and C is the concentra-tion of manganese in the solution (mg L�1). When manganese ismeasured using direct aspiration, the calibration curve isA = 5.81 � 10�3 + 1.26 � 10�4C, for concentrations between 50.00and 2,500.00 mg L�1. Table 4 presents a summary of the analyticalcharacteristics of the developed system.
The enrichment factor (EF) of the developed procedure wascalculated as the ratio between the linear section of the calibration

Table 5Selectivity of the automated on-line preconcentration system for determination of
manganese (100 mg L�1) using Br-TAO-loaded polyurethane foam.
Substance Maximum amount tolerable
Al(III) 10.0 mg L�1
Br(�I) 10.0 g L�1
Ca(II) 10.0 g L�1
Cd(II) 5.0 mg L�1
Cl(�I) 50.0 g L�1
Co(II) 5.0 mg L�1
Cr(VI) 10.0 mg L�1
Cu(II) 10.0 mg L�1
Fe(II) 0.5 mg L�1
Fe(III) 2.0 mg L�1
K(I) 50.0 g L�1
Mg(II) 1.0 g L�1
Na(I) 50.0 g L�1
Ni(II) 10.0 mg L�1
NO3(�I) 20.0 g L�1
Pb(II) 1.0 mg L�1
SO4(�II) 50.0 g L�1
Zn(II) 10.0 mg L�1
Table 6Determination of manganese in standard reference material (n = 3).
Material Manganese content (mg g�1)
Certified Found
NIST 1575a Pine needles 488 � 12 479 � 28
NIST 1570a Spinach leaves 75.9 � 1.9 73.0 � 6.9
NIST 1573a Tomato leaves 246 � 8 246 � 13
Table 7Results found for determination of manganese in food samples (n = 3).
Sample Manganese content (mg g�1) Recovery (%)
Added Found
Corn flour 0 8.1 � 1.3 –
50 57.3 � 5.7 98.4
Oat flour 0 41.9 � 3.6 –
50 94.5 � 5.3 105.2
Rice flour 0 17.2 � 2.5 –
50 70.2 � 3.5 106.0
Infant formula 0 17.2 � 0.2 –
50 70.5 � 3.9 106.6
Cereal flour 0 21.1 � 1.2 –
50 70.1 � 1.99 98.0
Cassava flour 1 0 13.4 � 1.2 –
50 66.3 � 2.0 105.8
Cassava flour 2 0 17.6 � 1.3 –
50 69.6 � 5.5 104.0
Cassava flour 3 0 10.6 � 0.7 –
50 60.3 � 2.9 99.4
Cassava flour 4 0 15.8 � 2.1 –
50 64.4 � 3.4 97.2
V.A. Lemos et al. / Journal of Food Composition and Analysis 22 (2009) 337–342 341
graph for the systems before and after preconcentration. Theconcentration efficiency (CEF) is defined as the product of theenrichment factor and the sample frequency, expressed in min�1.The consumptive index (CI) was calculated by the ratio betweenthe volume of the sample, in milliliters, and EF (Fang, 1993). Thelimit of detection was calculated as 3 (s/m), where s is the standarddeviation of 12 measurements of a reagent blank, and m is theslope of the calibration curve. The quantification limit (LOQ) wascalculated as LOQ = 10 (s/m). The repeatability was assessed as therelative standard deviation (RSD) by measuring the analyticalsignal for seven cycle times at levels of 50 and 100 mg L�1 Mn.
3.3. Effect of foreign ions
Solutions containing Mn(II) and a single co-existing ion wereprepared in order to evaluate the interference of co-existing ionson the developed procedure. The ions were added to a 100 mg L�1
manganese solution and the metal was determined using theproposed procedure. The effect of each ion was considered asinterference if it caused an increase or reduction in the analyticalsignal by 5%. The results are shown in Table 5. According the data inthe table, the presence of large amounts of species commonlypresent in food samples have no significant effect on thedetermination of manganese by the proposed procedure.
3.4. Analysis of standard reference materials
The determination of manganese was performed in threestandard reference materials (spinach leaves, NIST 1570a; tomatoleaves, NIST 1573a and pine needles, NIST 1575a) in order toevaluate the accuracy of the developed method. These sampleswere digested using the dissolution procedure described in Section2.3. Table 6 presents the results of this experiment. The manganesecontents established by the present procedure agreed well withthe certified values. The results indicate the effectiveness andaccuracy of the method.
3.5. Determination of manganese in food samples
The proposed procedure has been applied to the determinationof manganese in food samples. The results are presented in Table 7.The values of the recoveries in the table have been calculated byusing the following equation: R(%) = {(Cm � Co)/m} � 100, whereCm is the concentration of Mn in a spiked sample, Co isconcentration of Mn in a sample and m is the amount of themetal spiked. The obtained recoveries were satisfactory for allsamples. These results demonstrate the applicability of theproposed on-line system for the determination of manganese infood matrices. Considering the mass of the food, the detection limitof the method is 0.7 mg g�1.
4. Conclusion
The automated on-line preconcentration system using a mini-column packed with Br-TAO-loaded polyurethane foam is simpleand easy to construct and operate. The use of two mini-columnsallowed for the determination of manganese with a samplefrequency of 60 h�1. The automation of the system diminishedthe errors associated with the operation of manual valves. The Box-Behnken design resulted efficient and fast to optimize the involvedchemical variables in the system. The system significantly increasedthe performance of the FAAS, presenting analytical characteristicscomparable to many methods for Mn found in the literature. Theresults proved that the method is not affected by substancesgenerally present in food samples. The contents of manganese foundin the analyzed matrices are at a satisfactory level, suggesting thatthese foods are adequate for human consumption. The developedmethod is presented as a good alternative for the routinedetermination of manganese in food samples.
Acknowledgements
The authors acknowledge the financial support of ConselhoNacional de Desenvolvimento Cientıfico e Tecnologico (CNPq),Financiadora de Estudos e Projetos (FINEP) and Fundacao deAmparo a Pesquisa do Estado da Bahia (FAPESB).

V.A. Lemos et al. / Journal of Food Composition and Analysis 22 (2009) 337–342342
References
Araujo, R.G.O., Dias, F.S., Macedo, S.M., dos Santos, W.N.L., Ferreira, S.L.C., 2007.Method development for the determination of manganese in wheat flour byslurry sampling flame atomic absorption spectrometry. Food Chemistry 101,397–400.
Bezerra, M.D., Conceicao, A.L.B., Ferreira, S.L.C., 2006. A pre-concentration proce-dure using cloud point extraction for the determination of manganese in salineeffluents of a petroleum refinery by flame atomic absorption spectrometry.Microchimica Acta 154, 149–152.
Da Silva, E.G.P., Hatje, V., dos Santos, W.N.L., Costa, L.M., Nogueira, A.R.A., Ferreira,S.L.C., 2008. Fast method for the determination of copper, manganese and ironin seafood samples. Journal of Food Composition and Analysis 21, 259–263.
Ekholm, P., Reinivuo, H., Mattila, P., Pakkala, H., Koponen, J., Happonen, A., Hell-strom, J., Ovaskainen, M., 2007. Changes in the mineral and trace elementcontents of cereals, fruits and vegetables in Finland. Journal of Food Composi-tion and Analysis 20, 487–495.
Fang, Z., 1993. Flow Injection Separation and Preconcentration. John Wiley & Sons,New York, NY, USA.
Ferreira, S.L.C., Bezerra, M.A., dos Santos, W.N.L., Neto, B.B., 2003. Application ofDoehlert designs for optimisation of an on-line preconcentration system forcopper determination by flame atomic absorption spectrometry. Talanta 61,295–303.
Ferreira, S.L.C., Bruns, R.E., Ferreira, H.S., Matos, G.D., David, J.M., Brandao, G.C., daSilva, E.G.P., Portugal, L.A., dos Reis, P.S., Souza, A.S., dos Santos, W.N.L., 2007.Box-Behnken design: an alternative for the optimization of analytical methods.Analytica Chimica Acta 597, 179–186.
Ferreira, S.L.C., Souza, A.S., Brandao, G.C., Ferreira, H.S., dos Santos, W.N.L., Pimentel,M.F., Vale, M.G.R., 2008. Direct determination of iron and manganese in wineusing the reference element technique and fast sequential multi-element flameatomic absorption spectrometry. Talanta 74, 699–702.
Gama, E.M., Lima, A.D., Lemos, V.A., 2006. Preconcentration system for cadmiumand lead determination in environmental samples using polyurethane foam/Me-BTANC. Journal of Hazardous Materials 136, 757–762.
Han, S., Gan, W., Su, Q., 2007. On-line sample digestion using an electromagneticheating column for the determination of zinc and manganese in tea leaf byflame atomic absorption spectrometry. Talanta 72, 1481–1486.
Jamali, M.R., Assadi, Y., Shemirani, F., 2007. Homogeneous liquid–liquid extractionand determination of cobalt, copper, and nickel in water samples by FlameAtomic Absorption Spectrometry. Separation Science and Technology 42, 3503–3515.
Kenduzler, E., Turker, A.R., Yalcinkaya, O., 2006. Separation and preconcentration oftrace manganese from various samples with Amberlyst 36 column and deter-mination by flame atomic absorption spectrometry. Talanta 69, 835–840.
Knap, M., Kilian, K., Pyrzynska, K., 2007. On-line enrichment system for manganesedetermination in water samples using FAAS. Talanta 71, 406–410.
Lemos, V.A., Santos, J.S., Baliza, P.X., 2006. Me-BTABr reagent in cloud pointextraction for spectrometric determination of copper in water samples. Journalof the Brazilian Chemical Society 17, 30–35.
Lemos, V.A., Baliza, P.X., Carvalho, A.L., Oliveira, R.V., Teixeira, L.S.G., Bezerra, M.A.,2008. Development of a new sequential injection in-line cloud point extractionsystem for flame atomic absorption spectrometric determination of manganesein food samples. Talanta 77, 388–393.
Oleszczuk, N., Castro, J.T., Silva, M.M., Korn, M.G.A., Welz, B., Vale, M.G.R., 2007.Method development for the determination of manganese, cobalt and copper ingreen coffee comparing direct solid sampling electrothermal atomic absorptionspectrometry and inductively coupled plasma optical emission spectrometry.Talanta 73, 862–869.
Ruzicka, J., Hansen, E.H., 1981. Flow Injection Analysis. WiIey-Interscience, NewYork, NY, USA.
Santelli, R.E., Bezerra, M.A., Santana, O.D., Cassella, R.J., Ferreira, S.L.C., 2006. Multi-variate technique for optimization of digestion procedure by focussed micro-wave system for determination of Mn, Zn and Fe in food samples using FAAS.Talanta 68, 1083–1088.
Skoog, D.A., West, D.M., Holler, F.J., 1996. Fundamentals of Analytical Chemistry.Saunders College Publishing, Orlando, FL, USA.
Soylak, M., Tuzen, M., 2008. Coprecipitation of gold(III), palladium(II) and lead(II)for their flame atomic absorption spectrometric determinations. Journal ofHazardous Materials 152, 656–661.
Welz, B., Sperling, M., 1999. Atomic Absorption Spectrometry. Wiley-VCH, Wein-heim, Baden-Wurttemberg, Germany.
Xuezhi, D., Deliang, L., Chunshan, C., Jingwei, Z., 1999. Determination of manganesein grain by potential titration with catalytic end-point indication. Talanta 50,947–952.