Seismotectonic framework and seismic source area models in ...
285
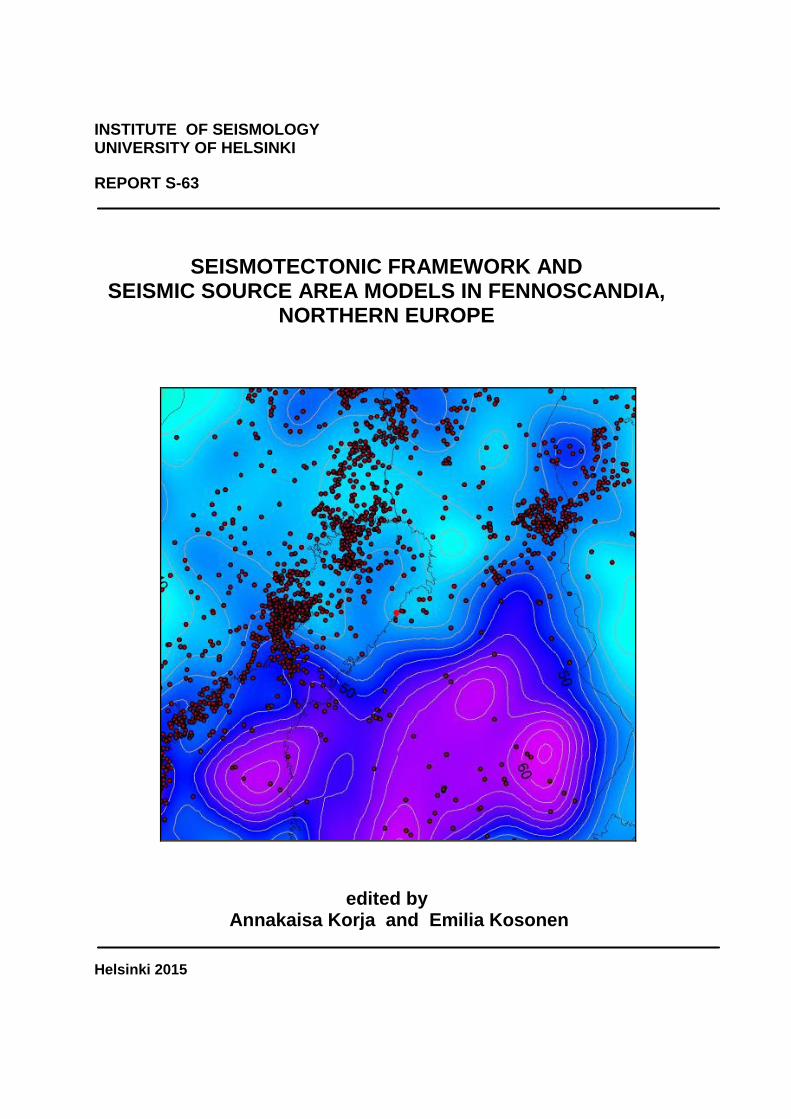
INSTITUTE OF SEISMOLOGY UNIVERSITY OF HELSINKI REPORT S-63 SEISMOTECTONIC FRAMEWORK AND SEISMIC SOURCE AREA MODELS IN FENNOSCANDIA, NORTHERN EUROPE edited by Annakaisa Korja and Emilia Kosonen Helsinki 2015
-
Upload
khangminh22 -
Category
Documents
-
view
1 -
download
0
Transcript of Seismotectonic framework and seismic source area models in ...
INSTITUTE OF SEISMOLOGY UNIVERSITY OF HELSINKI
REPORT S-63
SEISMOTECTONIC FRAMEWORK AND SEISMIC SOURCE AREA MODELS IN FENNOSCANDIA,
NORTHERN EUROPE
edited by Annakaisa Korja and Emilia Kosonen
Helsinki 2015

Editor-in-Chief: Pekka Heikkinen
Guest Editors: Annakaisa Korja and Emilia Kosonen Corresponding author: Annakaisa Korja
Department of Geosciences and Geography
Institute of Seismology
P.O.Box 68
FI-00014 University of Helsinki
Finland
Email: Annakaisa.Korja@ helsinki.fi
Publisher: Institute of Seismology
P.O. Box 68
FI-00014 University of Helsinki
Finland
Phone: +358-294-1911 (switchboard)
Fax: +358-2941-51598 http://www.helsinki.fi/geo/seismo/
ISSN 0357-3060
ISBN 978-952-10-9583-2 (PDF)
ISBN 978-952-10-5078-7 (Paperback)
Unigrafia
Helsinki 2015

3
Seismotectonic framework and seismic source area models
in Fennoscandia, northern Europe Host organization: Institute of Seismology, Department of Geosciences and
Geography, University of Helsinki ISUH - Institute of Seismology, University of Helsinki Korja, Annakaisa (scientific leader) Hellqvist, Niina Koskinen, Paula Kosonen, Emilia Mäntyniemi, Päivi Uski, Marja Valtonen, Outi GTK - Geological Survey of Finland Airo, Meri-Liisa Huotari-Halkosaari, Taija Kallio, Jarmo Laine, Mirva Nironen, Mikko Sutinen, Raimo SGU - Geological Survey of Sweden Grigull, Susanne Stephens, Michael UU – University of Uppsala Högdahl, Karin Lund, Björn
4
Preface
The following people have written the different sections in the text: Summary Annakaisa Korja has written the summary. Section 1 Annakaisa Korja has written section 1. Section 2 Susanne Grigull (Sweden) and Meri-Liisa Airo, Taija Huotari-Halkosaari and Mikko Nironen (Finland) have presented the geological and geophysical data used in the respective countries in sections 2.1 to 2.5; Karin Högdahl has written about the submarine data in the Gulf of Bothnia in section 2.6; Susanne Grigull, Raimo Sutinen and Emilia Kosonen have written about the faults active during the Quaternary period in section 2.7; and Björn Lund, Marja Uski and Päivi Mäntyniemi have written section 2.8 on the seismicity data in Sweden and Finland. Päivi Mäntyniemi prepared the historical earthquake database and the respective table and figures. Annakaisa Korja has written the section 2.9. Section 3 Michael Stephens, Mikko Nironen and Annakaisa Korja have presented the major lithotectonic units in the study area in section 3.1.1. Mikko Nironen and Annakaisa Korja have written the parts of section 3.1.2 that concern the deformation zones in the Karelia and Inari lithotectonic units, the Central Finland lithotectonic unit and the Southern Finland unit. Michael Stephens has written the parts of section 3.1.2 that concern the deformation zones in the Ljusdal lithotectonic unit, the Bothnia-Skellefteå lithotectonic unit and the lithotectonic units inside the Caledonian orogen. Karin Högdahl and Michael Stephens have written section 3.1.3 on the faults in the Gulf of Bothnia. Raimo Sutinen, Emilia Kosonen and Björn Lund have written section 3.2 on the glaciation cycles during the Quaternary period. Colby Smith and Lars Rodhe (SGU) have commented section 3.2. Section 4 Marja Uski and Björn Lund have written subsection 4.1. Päivi Mäntyniemi has written subsection 4.2. Marja Uski, Annakaisa Korja and Björn Lund have written subsection 4.3. Section 5 Paula Koskinen and Annakaisa Korja have written subsections 5.1-5.3 and Annakaisa Korja has written subsection 5.4. Marja Uski, Björn Lund and Annakaisa Korja have written the subsections 5.5-5.7. Section 6 Paula Koskinen and Annakaisa Korja have written section 6. Section 7 Annakaisa Korja and Nina Hellqvist have completed the literature review in section 7 summarizing current seismotectonic and previous seismic source area models in Fennoscandia. Section 8 Annakaisa Korja has written section 8.1.

5
Michael Stephens has written the general methodology and result for spatial model 1 in section 8.2. Michael Stephens and Mikko Nironen have written the geological and tectonic framework descriptions of the Swedish and Finnish source areas respectively. Marja Uski and Björn Lund have written the descriptions of the seismic source geometry and seismological parameters in Finland and Sweden, respectively. Päivi Mäntyniemi has written the parts on historical earthquakes in model 1. Susanne Grigull and Annakaisa Korja have written the general methodology and result for spatial models 2 and 3 in section 8.3. Susanne Grigull, Annakaisa Korja and Emilia Kosonen have written geological and tectonic framework. Björn Lund and Marja Uski have written the descriptions of source areas (seismic source geometry and seismological parameters). Päivi Mäntyniemi has written the parts on historical earthquakes in models 2 and 3. Section 9 Annakaisa Korja has written the discussion. Päivi Mäntyniemi has written the comments on historical earthquakes in subchapters 9.2 and 9.5.1. Mikko Nironen, Marja Uski, Päivi Mäntyniemi and Björn Lund have commented the discusssion. Section 10 Annakaisa Korja has outlined the conclusions. Mikko Nironen, Päivi Mäntyniemi, Marja Uski and Björn Lund have commented the conclusions. Section 11 Emilia Kosonen has compiled the references. Appendices Appendix 1 Mirva Laine, Taija Huotari-Halkosaari and Mikko Nironen have summarized the geological and geophysical studies previously carried out by GTK for Fennovoima Oy. Outi Valtonen and Annakaisa Korja have written the section on geodetic studies and the instrumental seismic monitoring at the target site. Päivi Mäntyniemi has written the section on historical seismicity in the vicinity of the Hanhikivi site. Annakaisa Korja has written the summary and collected the conclusions and suggestions from the previous studies. Appendix 2 was compiled by Päivi Mäntyniemi.
Appendix 3 was compiled by Emilia Kosonen and Taija Huotari-Halkosaari.
Appendix 4 was produced by Emilia Kosonen.

6
Summary
A. Korja
This study aims to identify seismic source areas and to address the seismotectonic framework as a basis for a seismic hazard evaluation at the potential nuclear power plant site at Hanhikivi, Pyhäjoki, Northern Ostrobothnia, Finland. The study has been carried out for Fennovoima Oy by geoscientific expert groups from both Finland (Institute of Seismology University of Helsinki) (ISUH), Geological Survey of Finland (GTK)) and Sweden (University of Uppsala, Geological Survey of Sweden) using the latest documented geological, geophysical and seismological data sets from both countries. The study area comprises a circle with 500 km radius around the Hanhikivi site including land and marine areas of Finland and Sweden. The study has been carried out in six working stages. Task 1 provided a review summarizing the existing and ongoing geological and geophysical studies carried out around the Hanhikivi site by GTK, the Finnish Geodetic Institute (FGI) and ISUH. The results of stage 1 are summarized in Appendix 1. Task 2 involved the compilation and description of a regional-scale geological and geophysical upgradable database for present and future studies in the site area. The metadatabase is described in Appendix 3 and the methodology used to evaluate historical seismicity is described in Appendix 3. Task 3 presented an overview of the paleotectonic evolution and the Quaternary glacial history and the current tectonic framework inside the study area. Task 4 described seismicity and earthquake source parameters
of the study area. Task 5 involved a review of the current conceptual seismotectonic models and previous seismic source area models for Fennoscandia. Task 6 identified and described alternative spatial models for seismic source areas in the study area. Task 1: (Appendix 1) Previous studies describing the geological and geophysical features around the Hanhikivi site have been launched in regional (25-300 km), near-regional (5-25 km) and site-vicinity (<5 km) scales. Hanhikivi is located on bedrock composed of rocks belonging to the so-called Svecofennian Domain. The area in the vicinity of the Hanhikivi site is framed to the south and north by NNE-SSW and NW-SE oriented deformation zones that are part of the Raahe-Ladoga shear complex. However, no regional-scale deformation zones seem to cross the site area. None of the significant fracture zones has been active during post-glacial time. The closest known active post-glacial fault zone is in Västerbotten, Sweden, 180 km west of Hanhikivi site. Based on the available data sets, it was concluded that no post-glacial faults could be identified in the near-regional and site-vicinity areas around the Hanhikivi site and that the existence of post-glacial fault structures (and capable faults) in the near-regional study area (25 km) is unlikely. However, the data sets do not cover
the study area completely. Geophysical surveys have been recommended for more precise structural studies of the fracture zones in onshore and offshore studies. To gain information on the local-scale (in mm scale) horizontal movements within the study area, a local dense network of permanent GNSS stations should be established for a minimum period of five years. The historical seismicity data available for Northern Ostrobothnia between 1740 and 1930 suggest that many of the largest historical earthquakes have been felt at Hanhikivi. A virtual seismic history has therefore been compiled. A special feature is that the known historical earthquakes occurred in different countries and in different directions from the site. The estimated intensities at Hanhikivi site have not been larger than I=4-5 (EMS-98). The
7
compiled seismic history is not long enough to capture the recurrence times of earthquakes of magnitude above 4. The spatial coverage of the national seismic network in Northern Ostrobothnia was too sparse for detailed or regional seismicity studies around potential power plants. Based on a recommedation by the University of Helsinki, Fennovoima Oy decided to build a local network of 10 stations within a radius of 50 km from the Hanhikivi site. Task 2: The current study is based on the following previously existing GIS data sets from: 1) the Geological Surveys of Finland and Sweden; including lithological, structural, airborne magnetic and Bouguer gravity anomaly maps, post-glacial faults and the interpretation of shallow marine seismo-acoustic data from the Gulf of Bothnia; and 2) the Universities of Helsinki and Uppsala; including an updated instrumental and historical seismicity database, Moho topography, and the interpretation of deep seismic reflection data (BABEL, FIRE). In addition, freely available topographic data (GLOBE) from the Globe Task Team and bathymetric data (GEBCO) from the British Oceanographic Data Centre have been used. The data sets are supplied with adequate metadata information (Appendix 3) and are archived in an ArcGIS-based database at Fennovoima Oy.
The parametric earthquake catalogue FENCAT covers the years 13752011. Macroseismic datapoint (MDP) datasets have been complied for 20 historical earthquakes, which has led to some changes in the non-instrumental part of the FENCAT. The instrumental dataset from FENCAT has been supplemented with a preliminary version of the 2012 earthquake catalogue and a micro-earthquake catalogue for 2000-2013 in Sweden. Mining-induced seismic events as well as events with questionable seismic origin have been removed from the data within or close to the study area. Task 3: The northern part of the Fennoscandian Shield is surrounded by the Caledonian orogenic belt to the west, the North Atlantic continental platform to the north and the East European platform to the south and east. Offshore, in the Gulf of Bothnia, Meso-Neoproterozoic and Lower Paleozoic sedimentary rocks provide a cover to the crystalline bedrock. We have divided the bedrock addressed in this study into thirteen lithotectonic units. The majority of these units contain rocks with a distinct tectonothermal history and are mostly separated from each other by regional-scale, ductile and brittle deformation zones or an angular unconformity. The major part of the study area consists of seven lithotectonic units (Karelia, Inari, Central Finland, Southern Finland, Ljusdal, Bothnia-Skellefteå, and Norrbotten) that attained their current architecture during orogenic activity at 2.0–1.8 Ga. The northeastern part of the study area (Karelia, Inari and Norrbotten) contains Archean crust affected by NeoArchean orogeny and later Paleoproterozoic extension at 2.5–2.0 Ga prior to orogenic reworking at 2.0–1.8 Ga. Latest Paleoproterozoic and Mesoproterozoic magmatic rocks and Mesoproterozoic sedimentary provinces, which formed around and after 1.6 Ga in extensional paleotectonic environments, form a unit located mostly in and around the Gulf of Bothnia and the White Sea. These rocks are well-preserved, unaffected by later orogenic activity and complete the Precambrian lithotectonic framework in the Fennoscandian Shield. Ediacaran–Cambrian and Ordovician sedimentary rocks form a platformal cover and together form their own lithotectonic unit. The Caledonian orogen

8
(0.5–0.4 Ga) in the northwestern part of the study area has been divided into four lithotectonic units. Deformation zones that were formed during transpressional-compressional and transtensional-extensional events are described for different groups of lithotectonic units. Seismic reflection profiles suggest that most of the ductile deformation zones are limited to the upper crust. They seem either to terminate or to flatten out at the upper-middle crustal boundary, which serves as a major décollement. Only a few major shear complexes extend to the middle-lower crustal boundary and even fewer penetrate the Moho boundary (in central Lapland and along the Raahe-Ladoga shear complex). During the Quaternary Period (ca. 2.6 Ma–present), the study area was affected by several climate oscillations, from warm to cold with interglacial and glacial phases, respectively, and associated loading and unloading events. In Fennoscandia, there are sediments preserved from three large glaciations (Elsterian, Saalian and Weichselian) and two interglacials (Holstein and Eem) that interrupted the glaciation stages. The last deglaciation period, starting at 18 ka BP, reached southern Finland at 13 ka, stagnated during the colder Younger Dryas at 13-11.5 ka and reached the Gulf of Bothnia at 10 ka; the remainder of the glacier had melted completely by 9 ka. The sedimentary formations deposited during the last glacial cycle are the ones that are best preserved. During the deglaciation period, the sedimentary material was deposited in rivers and lakes, and the bedrock started to rebound to its original position. The highest Baltic Sea shorelines are situated at different altitudes in Fennoscandia, depending on the differences in crustal depression and rebound velocities as well as the sea-level changes during different Baltic Sea stages. The rebounding is not only expressed in retreating sea level observations but also along post-glacial faults. Post-glacial faults suggest sudden stress release and earthquake activity. The onset of the Fennoscandian fault activity started at the end of the deglaciation phase, and the maximum fault instability was reached during the Younger Dryas and Early Holocene period 13-10 ka BP. Vertical ground motion taking place in Fennoscandia is mostly attributed to glacial isostatic adjustment (GIA), commonly referred to as post-glacial rebound. It is caused by the slow return flow of mantle material back to its original position below the depression of the lithosphere caused by the ice load during the latest glaciation. The still remaining isostatic imbalance is being adjusted by slow land uplift. The latter is centered in northeastern Sweden and the Bay of Bothnia i.e. within the study area. According to a recent land uplift model, the maximum rate of uplift is 8–9 mm/a. The strain field in central Fennoscandia, where the rate of post-glacial rebound is the highest, is dominated by an extension rate of 5 nanostrain/a. The southeastern parts are compressed at strain rates -6 and -1 nanostrain/a. The orientation of the overall maximum horizontal stress field in northern Europe is WNW–ESE to NW–SE. The azimuth of the plate motion direction relative to North America in Finland is between 115° and 132° and the azimuth increases from south to north. In the northern part of the study area, the minimum principal stress (σ3) is vertical, the maximum horizontal stress is horizontal and mostly reverse faulting takes place. In the Bothnia regions, where vertical stresses overcome horizontal ones, the maximum principal stress (σ1) is vertical and normal faulting takes place. The stress indicators suggest that changes in topography and in thickness of the crust and lithosphere may cause local and regional changes in the stress field in Fennoscandia.

9
Offshore areas are associated with topographical depressions and thinner crust than the surrounding onshore areas in most cases. A few exceptions are found. The thickest parts of the crust are characterized by subdued topography whereas the highest mountains in the Scandes to the west are characterized by the lack of crustal roots and thinner crust. This suggests that the mountains are not isostatically compensated from below and that other forces are acting on the Fennoscandian margin. It is noted that the present land-uplift maximum is loosely spatially associated with the area hosting the thin to normal crust and that the seismically active areas around the northern part of the Gulf of Bothnia (Bay of Bothnia and southern Lapland) have risen/rebounded slower than model predictions. The negative deviation suggests that either the model has to be updated or that rebounding has been hindered by local structure. It seems that plate boundary forces, GIA and seismicity have complex interwoven relationships that need to futher studied in the future. Task 4: Northern Ostrobothnia is situated in a seismically quiet continental intraplate setting in the northern part of the Fennoscandian Shield. Current tectonic and seismic activity in the study area is caused by processes associated with both intraplate and plate margin processes: opening of the North Atlantic Ocean, post-glacial rebound and local stress caused by local mass anomalies. Higher seismic activity is found along the east coast of Sweden, in the Gulf of Bothnia, in Lapland, and in the Kuusamo and Wiborg areas. Instrumentally recorded earthquakes in the study area have magnitudes between ML 0 and 5.2 and have taken place from shallow crustal depths down to 40 km. Some historical earthquakes may have exceeded magnitude 5 in the study area. The seismicity in the study area is clustered along NE–SW-trending zones that are parallel to the Norwegian margin and the Mid-Atlantic ridge. A slight change in the general seismicity pattern takes place across an N–S-trending zone running east of the Finnish-Swedish national border (Pajala shear zone and its northerly continuation). East of this zone, the seismic activity rates are lower and the NE–SW trend is less obvious. The reliable depth estimates available indicate that the majority of the earthquakes seem to have occurred in the upper 17 km of crust, By the definition that lower limit of the seismogenic zone is where 99% of the earthquakes occur; the results suggest that the seismogenic layer reached down to the depth of 31 km. In the Wiborg batholith, the Skellefteå area (Bothnia-Skellefteå lithotectonic unit) and the Kuusamo district as well as along the Hirvaskoski and Oulujärvi shear zones in the Karelia lithotectonic unit, the depth distribution differs from the general pattern. The earthquake swarms in the Wiborg batholith are unusually shallow, mostly occurring within the first 1–2 km of crust. In the Skellefteå area, roughly 50 % of the events occur in the middle and lower crust, at depths between 15 and 45 km. In the Kuusamo area and along the Hirvaskoski and Oulujärvi shear zones, the seismicity took place down to 30 km and > 50% occurred in the middle crust, at depths below 15 km. The focal mechanisms in the study area show a combination of mostly strike-slip and reverse faulting conditions. In south-central Sweden, strike-slip is the most common mechanism while reverse mechanisms are more common further to the north. In Finland, reverse and strike-slip mechanisms occur intermixed over the whole country. Deformation zones that are optimally oriented in the present stress field can potentially be reactivated. The deformation zones archived in the structural database were analysed for
10
their length and azimuth and they were assigned a potential reactivation type (reverse, normal or strike slip) according to their azimuth alone. The earthquakes in the seismically most active area, close to Skellefteå along the western coast of the Gulf of Bothnia and its northeasterly continuation, appear to cluster around the shoreline and along post-glacial faults, which are mostly oriented optimally for reverse or strike slip faulting. Fault systems in many directions that are optimal for reactivation transect the seismically active Kuusamo area. Stage 5: Currently, most authors agree that the sources of the seismicity in Fennoscandia are multiple and diverse in nature, ranging from plate-wide to local scales. The dominant driving forces of seismicity are related to opening of the North Atlantic Ocean, post-glacial rebound and lateral variations in lithospheric structure. The current seismotectonic models for Fennoscandia favor combinations of different sources of stress as the origin of seismicity. One of the models has claimed that the Scandinavian passive margin has a hyperextension architecture that developed during large magnitude extension associated with the opening of the North Atlantic Ocean. Based on topographic and lithospheric thickness data, Scandinavia has been divided into distal margin, proximal margin, hinterland and craton parts that are separated from each other by a taper break, an escarpment and a hinterland break-in slope, respectively, all associated with high seismicity belts. This model suggests that seismicity is concentrated along the boundaries steered by extensional tectonics during the opening and spreading of the North Atlantic Ocean, and further developed throughout the cooling and ongoing accommodation period. The seismically active structures have been and are being reactivated in connection with the loading and unloading events during the latest glaciation period. Several papers have argued that second order stress fields associated with post-glacial rebound account for most of the seismicity in Fennoscandia. A conceptual rebound dome-forebulge model has been proposed to explain the current seismicity patterns as a response to migrating post-glacial doming of the center and subsidence of the surrounding basins. Post-glacial uplift models are most commonly based on geodetic measurements that show concentric ellipsoidal patterns of both uplift and horizontal displacement around the maximum uplift center. It should be remembered that the GPS maps show residuals after the removal of the standard plate movement, i.e. absolute movement towards the NE and relative SE movement away from North America (ridge push). Since the spatial distribution of the registered earthquakes exhibits little to no correlation with the pattern of rebound in Fennoscandia and the level of seismicity is rather low, it has been concluded that there is no clear evidence that the rebound stress is still able to trigger seismicity in Fennoscandia today. However, post-glacial rebound has had a much more important role in earthquake generation in late-glacial and early post-glacial times. The present study area has at least partly been included in six previous seismic source area models and six hazard maps. Three seismic hazard estimates have been calculated for Hanhikivi site. In a map of median seismic hazard (horizontal peak ground acceleration or PGA), an area of enhanced hazard with maximum values of 0.15–0.20 m/s2 was identified in the Bay of Bothnia and its surroundings. The highest hazard (0.20–0.25 m/s2) was recognized in the Kuusamo district. The smallest hazard values, below 0.1 m/s2, were identified in southern Finland. Although the northern and western areas have a large affect on the

11
seismic hazard calculations, the most influential seismic source area was inferred to be the Raahe-Ladoga shear complex, where the site is located. Task 6: In the current study, three alternative seismic source area models have been identified and described by two independent groups. Group 1 produced spatial model 1 and focused their analysis on the potential reactivation of geologically ancient features. They have used data sets bearing on historical and instrumental seismicity, lithology, deformation zones including brittle components (faults), lineaments defined on the basis of magnetic and gravity data, and broader crustal structure including Moho depth. Group 2 produced the spatial models 2 and 3. They focused their analysis on the recently active structures using data sets bearing on recent high-quality seismicity data, post-glacial faults (PGF), topography, bathymetry, lineaments defined on the basis of magnetic data and the current stress field. Model 3 is a slightly modified version of spatial model 2 and contains additional polygons. Discussion and conclusions: The updated seismicity catalogue is more complete and its location precision is better than the FENCAT catalog. The new seismic catalogue is well-suited for earthquake studies and hazard estimations, provided that the magnitudes are homogenized prior to the calculations. Based on a subdataset of the most recent earthquake data (2000-2012), most of the earthquakes (80%) occur in the upper crust down to 17 km in depth, a minority (19%) in the middle crust (17-31 km) and only a few in the lower crust 31-45 km (1%). If the lower limit of the seismogenic zone is the depth above which 99% of the earthquakes occur, the results suggest that the seismogenic layer reaches down to the depth of 31 km. The layer seems to be rather uniform across Fennoscandia. We suggest that the middle to lower crustal boundary may add compositional and rheological constraints to the depth extent of the seismogenic zone in the study area. It is suggested that the décollement controlling the depth extent of fault zones is controlling the lower limit of present seismicity within a given source area. The seismically active areas are located in areas with crustal thickness <50 km. Where the crustal thickness gradient trends in a NE–SW direction, as along the faulted western margin of the Bothnian Sea and along the Auho-Kandalaksha fault zone in the Kuusamo area, the gradient seems to be associated with a zone of increased seismicity. This observation should be studied in more detail in the future. It is suggested that seismically active Western Lapland fault system is underlain by an inverted rift system which may have inherited its elastic properties from the Paleoporpterozoic rifting phase. The relationships between precollisional inverted rift structures of the lower crust, the Western Lapland fault system and orthogonal PGF faulting should be studied more carefully before any final conclusions. We suggest that the wide range of fault plane solutions documented within the Pärvie Fault could be signaling the movement of a complex thrust system. The implied link between increased seismicity in Kuusamo and Hirvaskoski shear zones and Auho-Kandalaksha fault zones to inverted rift structures should also be looked at. The three seismic source area models (Models 1, 2 and 3) are closely related because: 1) Seismicity is linked to reactivation of old faults in the present stress field. 2) Post-glacial faults are associated with reactivation of old faults. 3) Topography is influenced by the structure and composition of the Precambrian bedrock. 4) The current tectonic stress field
12
might be influenced by the structure of the Precambrian bedrock. The boundaries within the seismic source area models are strongly steered by the instrumentally detected earthquake patterns. Hence, a key uncertainty concerns the analysis of the earthquakes; their source location, magnitude and focal mechanism. There are major similarities and only minor differences between the models. The minor differences are found in the offshore areas in the Bay of Bothnia where structural control of neither the Precambrian faults nor the PGFs or bathymetry is very good and the seismic location accuracy is the poorest. When comparing the models developed in this study with existing models, it is clear that increased amount of data has enabled to draw smaller polygons in the vicinity of the increased zones of seismicity. Models 1, 2 and 3 resemble most clearly the Saari et al. (2009) seismic source area model that has been used as a national reference model. Although Models 1,2 and 3 are more detailed they comply with the large scale features outlined by the latest European scale reference model SHARE (Giardini et al., 2013). The distribution of Models 1-3 polygon boundaries are aligned with the major tectonic boundaries presented in Redfield and Osmundsen (2013). The western polygons could be classified as located in the hinterland of the Scandes, the high seismicity polygons overlapping with the hinterland-break-in-slope, and the eastern blocks are located with the craton part. The seismicity zone is located in close proximity to the western boundary of the Bay of Bothnia basin that was active already in the Mesoproterozoic and maybe even earlier. The major source of seismicity is the opening of the Atlantic only secondly come local sources such as post-glacial rebound or local changes in topography or crustal thickness. The relationship between post-glacial rebound and seismicity patterns is problematic and not easy to solve. First of all, the known PGFs are not parallel to the isolines of the rebound ellipsoid. We note, however, that the zones of increased seismicity in the western flank of the Gulf of Bothnia are parallel and along the long axes of the GIA anomaly. The elongation axis of GIA ellipsoid is parallel to the Norwegian margin and opening of the Atlantic and thus inherited from the previous tectonic processes. The direction of the long axis of the ellipsoid is orthogonal to and the short axis is parallel to the maximum horizontal stress in Fennoscandia stemming from the opening of the Atlantic. It seems that plate boundary forces, GIA and seismicity have complex interwoven relationships that need to be futher studied in the future.
Keywords: seismicity, seismotectonics, seismic source areas, Fennoscandia, Precambrian,
postglacial faults, database, nuclear power plant site, Hanhikivi
13
Contents
1 Introduction .................................................................................................................................. 15
1.1 Background .................................................................................................................................. 15
1.2 Outline of the study area ............................................................................................................ 17
1.3 Objective and scope .................................................................................................................... 19
2 Data framework and databases .................................................................................................... 20
2.1 Magnetic and gravity field data ................................................................................................... 20
2.2 Bathymetric and topographic data ............................................................................................. 30
2.3 Outcrop data ............................................................................................................................... 32
2.4 Lithological map database ........................................................................................................... 34
2.5 Structural map database ............................................................................................................. 38
2.6 Submarine data in the Gulf of Bothnia ........................................................................................ 46
2.7 Faults active during the Quaternary period ................................................................................ 49
2.8 Seismicity database ..................................................................................................................... 55
2.8.1 Earthquake database ............................................................................................................ 55
2.8.2 Seismic networks and changes in detection capability ........................................................ 59
2.9 Deep seismic reflection lines ....................................................................................................... 61
3 Geological framework ................................................................................................................... 63
3.1 Paleotectonic evolution............................................................................................................... 63
3.1.1 Major lithotectonic units ...................................................................................................... 63
3.1.2 Ductile shear zones, faults and lineaments .......................................................................... 71
3.1.3 Faults affecting sedimentary cover rocks in the Gulf of Bothnia ......................................... 81
3.2 Glaciation cycles in the Quaternary period ................................................................................. 89
3.2.1 The Weichselian glaciation (115 – 11.5 ka) .......................................................................... 91
3.2.2 Weichselian deglaciation and the Holocene Epoch in northern Europe ............................. 94
3.2.3 Faults active during the late Weichselian deglaciation ........................................................ 96
4 Seismicity and seismic parameters ............................................................................................. 102
4.1 Seismicity ................................................................................................................................... 102
4.2 Historical seismicity ................................................................................................................... 103
4.3 Fault plane solutions ................................................................................................................. 106
5 Current tectonic framework ........................................................................................................ 113
5.1 Plate movement and current stress field .................................................................................. 113
5.2 Orientation of the maximum horizontal stress ......................................................................... 114
5.3 Surface strain ............................................................................................................................. 116

14
5.4 Changes in the stress field imposed by changes in crustal and lithospheric thickness ............ 119
5.5 Seismogenic thickness and the depth range of deformation zones and earthquakes ............. 125
5.5.1 Crustal layering and depth extent of the ancient deformation zones ............................... 125
5.6 Rheological layering .................................................................................................................. 127
5.7 Observed depth of seismicity .................................................................................................... 129
6 Deformation zones in the current stress field ............................................................................. 132
6.1 Orientation of deformation zones in the context of the current stress field ........................... 132
6.2 Structural line orientations and seismicity ................................................................................ 135
7 Current seismotectonic and previous seismic source area models ............................................ 138
7.1 Seismotectonic models ............................................................................................................. 138
7.2 Seismic source area models ...................................................................................................... 144
8 Identification and description of seismic source areas ............................................................... 152
8.1 Basis for modeling ..................................................................................................................... 152
8.2 Spatial model 1 .......................................................................................................................... 154
8.2.1 General methodology and result ....................................................................................... 154
8.2.2 Description ......................................................................................................................... 159
8.3 Spatial models 2 and 3 .............................................................................................................. 184
8.3.1 General methodology and result ....................................................................................... 184
8.3.2 Description ......................................................................................................................... 191
9 Discussion .................................................................................................................................... 212
9.1 The database and the completeness of the compiled data sets ............................................... 213
9.2 Seismicity ................................................................................................................................... 216
9.3 Geological and geophysical boundaries and shear zones ......................................................... 218
9.4 Seismogenic zone ...................................................................................................................... 223
9.5 Alternative seismic source area (SSA) models .......................................................................... 225
9.5.1 Uncertainties of the SSA models ........................................................................................ 230
9.6 Comparison to existing SSA models .......................................................................................... 233
9.7 Comparison to conceptual models............................................................................................ 238
10 Conclusions .......................................................................................................................... 242
11 References ........................................................................................................................... 245
Appendixes .......................................................................................................................................... 269
Appendix 1. Previous studies around the Hanhikivi site ...................................................... 269
Appendix 2. On historical earthquake data .......................................................................... 269
Appendix 3. Metadatabase ................................................................................................... 276
Appendix 4. Seismic source area coordinates ...................................................................... 277
15
1 Introduction A. Korja
1.1 Background
Fennovoima Oy is planning to build a new nuclear power plant (NPP) at the Hanhikivi site situated in
the municipality of Pyhäjoki, Northern Ostrobothnia, Finland (Fig. 1.1.1). The safety standards for a
NPP require that the level of seismic hazard is evaluated. This report is exclusively focused on a
description of the seismotectonic background information necessary for the assessment of hazard
associated with vibratory motion due to natural earthquakes at the Hanhikivi site. The
characterization of other potentially destructive earthquake effects and seismic hazard phenomena
involving permanent ground displacement (e.g. liquefaction and ground collapse) are outside the
scope of this project. International recommendations (such as IAEA 2010 guidelines) are followed in
order to perform a site-specific probabilistic seismic hazard assessment (PSHA) at Hanhikivi.
For the analysis to be successful the regional geological and seismological framework should be well
described and the potential seismic sources should be analyzed and described quantitatively. The
following geological and geophysical information is needed in hazard calculation: tectonic
framework, seismic source geometry, distance of the source to the site, activity and recurrence of
the seismic sources, and seismological parameters including: earthquake magnitude, style of faulting
and fault length, distance to site and local site conditions.
International guidelines for the planning of NPP facilities (IAEA 2010, section 4.1.) require that the
above-mentioned information is compiled into a database and a seismotectonic model, from where
all the required information could be retrieved when evaluating seismic hazard. A seismotectonic
model describes the relationships between geological, geophysical, geotechnical and seismological
databases and thus provides a foundation for the calculation of the seismic hazard.
Several geological, geophysical and seismic studies have been conducted around the Hanhikivi site
with the help of geoscientific consultants, the Geological Survey of Finland (GTK), the Finnish
Geodetic Institute (FGI), the Institute of Seismology at the University of Helsinki (ISUH) and ÅF
consultants (ÅF) (see Appendix 1). However, the data sets generated by these studies have not been
merged into a unified database. Merging of the datasets into a database is one of the priorities of
this project report.

16
Figure 1.1.1 Map of Fennoscandia and the 500 km radius study area around the Hanhikivi site.
Locations mentioned in the text are shown in the map.
There have been three previous evaluations of the seismic hazard at the Hanhikivi site (Mäntyniemi,
2008a; Saari et al., 2009; Korja et al., 2011). These have been based on three different seismic source
area models using data from Finland and to lesser extent from Sweden. Since the Hanhikivi site is
17
situated along the western coast of Finland and only 65 km from the Finnish-Swedish national
border, earthquakes in eastern Sweden and the Gulf of Bothnia are felt also at Hanhikivi (Mäntyniemi
2012a,b; FENCAT). It is therefore pertinent that Swedish geoscientific data sets are included in the
databases and taken into account in seismic hazard assessments.
1.2 Outline of the study area
The Hanhikivi site is situated in a continental intraplate setting in the northern part of the
Fennoscandian Shield; it is surrounded by the Caledonian orogenic belt to the west, the North
Atlantic continental platform to the north and the East European platform to the south and east (Fig.
1.2.1). Offshore, in the Gulf of Bothnia, Meso- and Neoproterozoic as well as Cambrian to Ordovician
sedimentary rocks form a cover on the rocks belonging to the shield. The latest plate tectonic event
that has affected the study area is the opening and spreading of the Atlantic Ocean that initiated 60
Ma ago. This ongoing event has subjected the area to a long-standing tectonic stress-field oriented in
a WNW-ESE direction. During the Pleistocene glaciations, the area has been subjected to repeated
glacial cycles and associated loading and unloading events. The present geomorphology was largely
shaped during the last Weichselian glacial period (Hirvas, 1991; Lundqvist, 1992; Donner, 1995;
Fredén, 2002) and the area is still rebounding (see section 5.3).
The intraplate seismicity in the Hanhikivi site vicinity is low (Fig. 1.2.1). Higher seismic activity is
found along the eastern coast of Sweden, in the Gulf of Bothnia, and in the Lapland and Kuusamo
areas. The highest seismic activity in Fennoscandia is found along the Norwegian coast and the
eastern coast of Sweden, parallel to the continental margin. Current tectonic/seismic activity in the
northern part of the Fennoscandia is caused by a complex interplay of intraplate and plate margin
processes; the opening of the northern Atlantic Ocean, glacial isostatic adjustment (GIA) and local
stress caused by local mass deficit or excess (gravitational potential energy) (Fjeldskaar et al., 2000;
Bungum et al., 2010; Redfield and Osmundsen, 2013).
To understand the effect of these global and regional processes on the current seismicity and seismic
hazard, we have studied an area with a 500 km radius around Hanhikivi. According to IAEA (2010, p.
8), the size of the relevant region may vary, but its radial extent is typically 300 km. In intraplate
settings in particular, more distant seismic sources may have to be considered. The study area
includes Finland, northeasternmost Norway, Sweden north of latitude 60oN and northwesternmost
Russia (Fig. 1.1.1). The study area includes all the seismotectonically similar areas whereas it excludes
the part of the Caledonian orogen and the passive continental margin of the North Atlantic that has
considerably higher rate of seismicity.

18
Figure 1.2.1. Seismicity (FENCAT database in Chapter 3) and major geological units of Fennoscandia
modified from Lahtinen et al. (2005). Hanhikivi site: black box.

19
1.3 Objective and scope
This study focuses on gathering geological, geophysical and seismological background information
required by seismic hazard assessment, on setting up an upgradable database and on outlining
alternative seismic source areas. The analysis is based on literature reviews, on overviews of previous
studies in the area, and on recycling and merging of existing data sets stored at the Geological
Surveys of Finland (GTK) and Sweden (SGU), as well as at the Universities of Helsinki (ISUH) and
Uppsala (UU). Key historical earthquakes in the study region have been re-appraised and the
respective information has been collected into a database of historical earthquakes (see Appendix 2).
Since the focus of this report is to define regional patterns of seismicity (source areas) and to
describe their differences in seismicity and geological evolution/framework, we have used 1: 1
million scale data sets.
A seismotectonic model describes both the spatial relationships between seismicity and tectonic
framework and the processes producing the current seismicity. The first phase in developing
seismotectonic models is to outline seismic source regions – areas with different seismicity patterns
and tectonic history.
The study has six tasks. The first task is to review and summarize the existing and ongoing geological
and geophysical studies carried out around the Hanhikivi site by GTK, FGI and ISUH (Appendix 1). The
second task is to compile and describe a regional-scale geological and geophysical upgradable
database for the present and future studies of the site area (Section 2 and Appendix 3). The third task
is to present an overview of the paleotectonic evolution, Quaternary glacial history and current
tectonic framework inside the study area. The fourth task is to describe seismicity and earthquake
source parameters of the study area. The fifth task is to review and evaluate the current conceptual
seismotectonic models and seismic source region models for Fennoscandia. The sixth task is to
identify and describe seismic source regions and to outline alternative source area models for seismic
hazard calculations for the Hanhikivi site area.
20
2 Data framework and databases
In this section, we will describe the data sets used in this study and how they are archived and
arranged in the database delivered to Fennovoima Oy in the context of the current project. The map
compilations are based on previously published lithological, structural and geophysical maps and
databases: lithological, structural, aeromagnetic and Bouguer anomaly maps, bathymetry,
topography, instrumental and historical seismicity and post-glacial faults. The data are supplied with
adequate metadata information (Appendix 3) and stored in an ArcGIS-based database which will be
administered by Fennovoima Oy.
Databases at the Geological Survey of Sweden (SGU) and the Geological Survey of Finland (GTK) as
well as Finnish Geodetic Institute (FGI) are constantly being updated. The data delivered to the
Fennovoima database therefore represents the most up-to-date material available at the time of
designing phase of the seismic source areas at workshop in November 2013. Similarly, the
earthquake catalogues at the University of Uppsala and at the Institute of Seismology in the
University of Helsinki are constantly changing, both with new events and with updated analysis of
older events. The earthquake data delivered to the Fennovoima database represent the state of the
SNSN (Swedish National Seismic Network) and FNSN (Finnish National Seismic Network) catalogues
on the 30th June, 2013, and the 31st December, 2012, respectively.
2.1 Magnetic and gravity field data
Grigull, S., M.-L. Airo, T. Huotari-Halkosaari & M. Nironen
Airborne magnetic measurements have been carried out over most of Sweden (Fig. 2.1.1). Lines were
usually flown in N–S or E–W direction at a speed of 230 km/h, a line spacing of 200 m, and a
measurement interval of 40 m before, and 17 m after 1995. Flight altitude was 30 m before, and 60
m after 1995. The resulting magnetic anomaly maps (Fig. 2.1.2) are available at resolutions 200 m x
200 m or 50 m x 50 m. For this study, the magnetic maps with resolution 50 m x 50 m were used.
SGU has collected new magnetic data during 2012 in the very northern part of the Gulf of Bothnia,
southeast of Kalix (Fig. 2.1.3). The lines for these data were flown in an E–W direction and at a line
spacing of 400 m.

21
Figure 2.1.1. Degree of coverage of Sweden with airborne magnetic data. Flight line directions and
line spacing are indicated. Hanhikivi site: black dot.
22
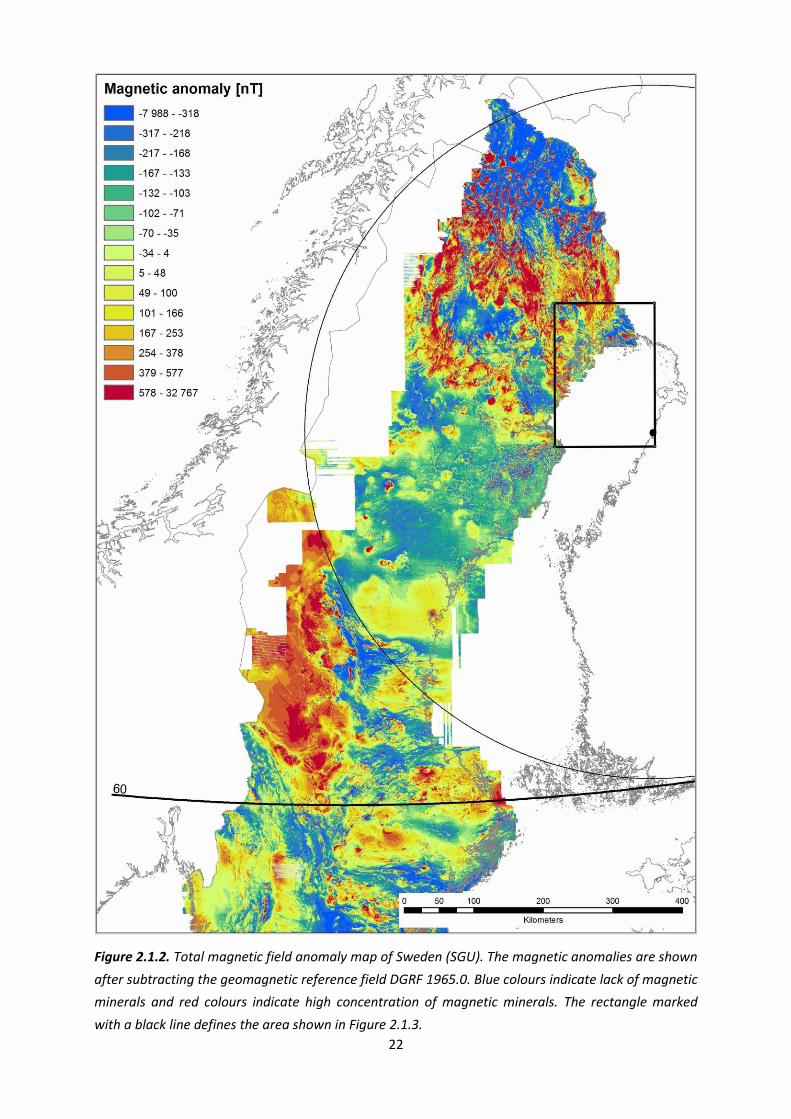
Figure 2.1.2. Total magnetic field anomaly map of Sweden (SGU). The magnetic anomalies are shown
after subtracting the geomagnetic reference field DGRF 1965.0. Blue colours indicate lack of magnetic
minerals and red colours indicate high concentration of magnetic minerals. The rectangle marked
with a black line defines the area shown in Figure 2.1.3.

23
Figure 2.1.3. Area (inside white line) where new airborne magnetic data were collected by SGU during
2012 southeast of Kalix (see also Figure 2.1.2). These new data have been integrated with lower
resolution data to the east in Finland and to the south and with higher resolution data to the north
and west. The magnetic anomalies are shown after subtracting the geomagnetic reference field DGRF
1965.0.
The available Swedish gravity data is of variable frequency and extent. Currently, 180 719 gravity
measurement sites are listed in SGU´s databases and their distribution inside the study area is shown
24
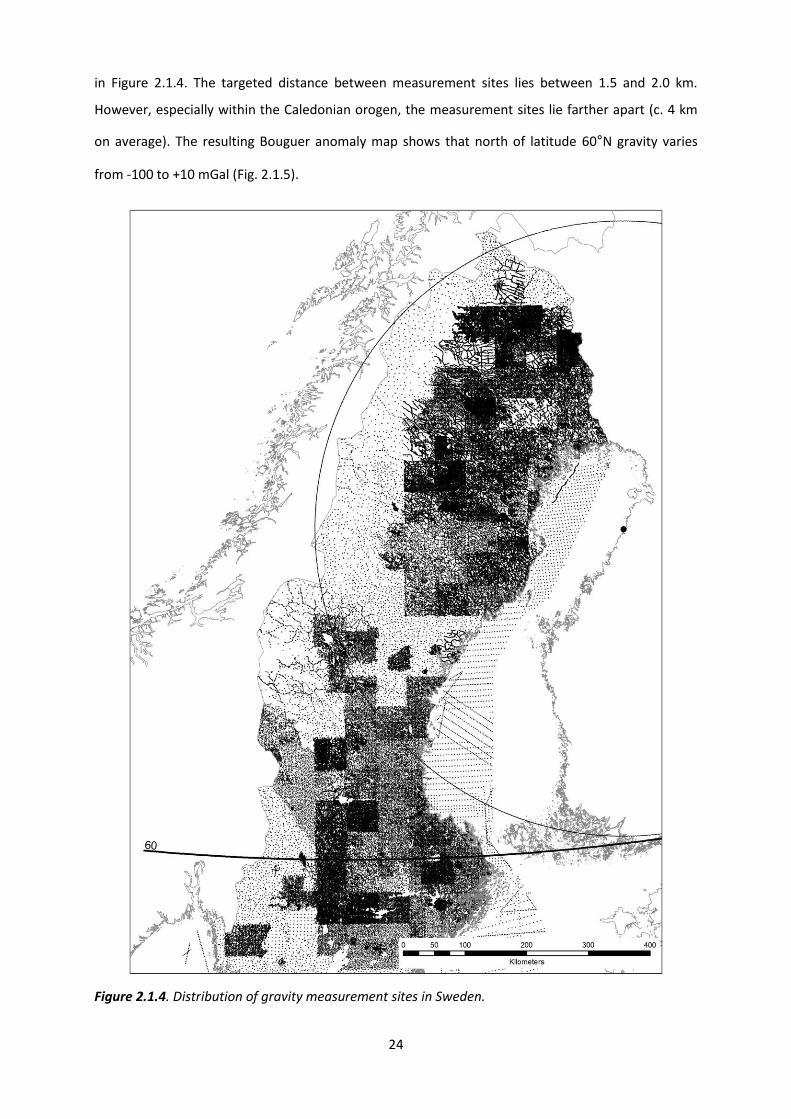
in Figure 2.1.4. The targeted distance between measurement sites lies between 1.5 and 2.0 km.
However, especially within the Caledonian orogen, the measurement sites lie farther apart (c. 4 km
on average). The resulting Bouguer anomaly map shows that north of latitude 60°N gravity varies
from -100 to +10 mGal (Fig. 2.1.5).
Figure 2.1.4. Distribution of gravity measurement sites in Sweden.
25
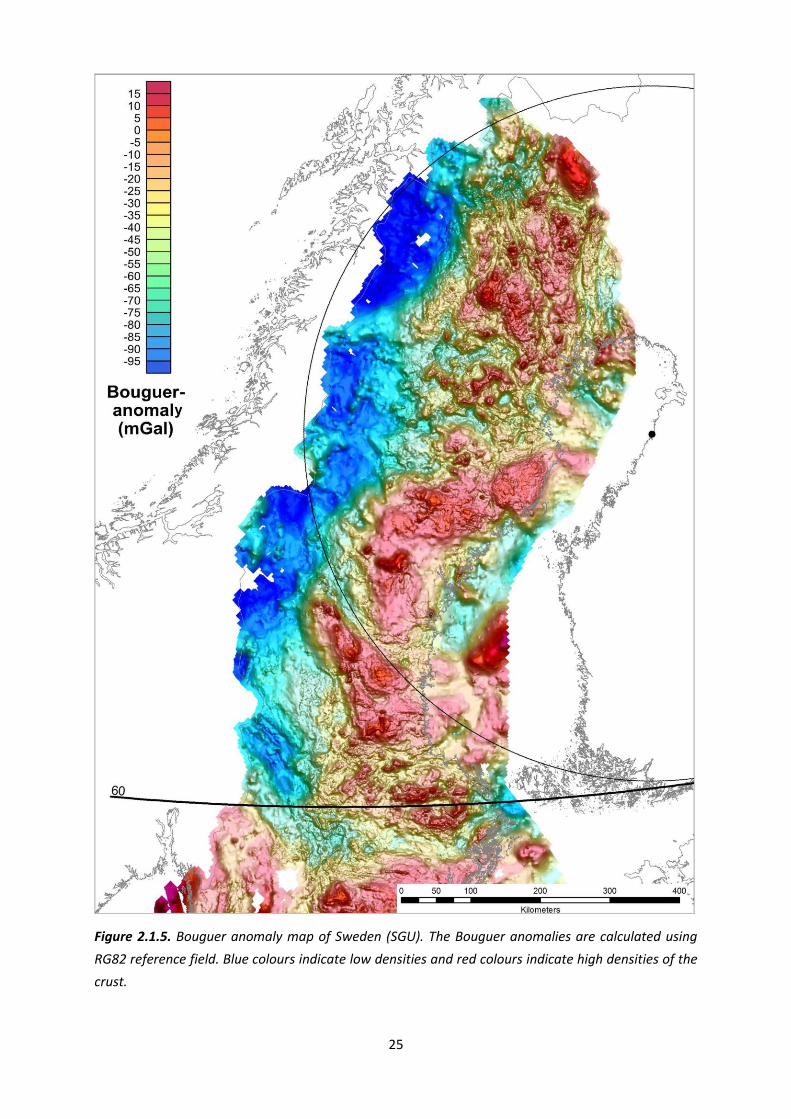
Figure 2.1.5. Bouguer anomaly map of Sweden (SGU). The Bouguer anomalies are calculated using
RG82 reference field. Blue colours indicate low densities and red colours indicate high densities of the
crust.
26
The magnetic data sets used here in the analysis of structures over Finland are based on GTK´s
countrywide airborne geophysical surveys conducted during two systematic national survey
programmes. During the First National Airborne Geophysical Mapping Programme (the so-called
high-altitude programme) in 1952-1972, the survey altitude was 150 m and flight-line separation 400
m. These surveys covered also the Finnish offshore areas. Following this programme, the Second
National Airborne Geophysical Mapping Programme (finished in 2007) was conducted systematically
at the nominal survey altitude of 30 m and with a flight-line spacing of 200 m. The flight direction was
east-west or north-south. These high-resolution, multi-component geophysical data (magnetic,
electromagnetic and radiometric datasets) formed the basis for detailed structural investigations
(Airo et al., 2011b). The airborne magnetic grid of GTK (cell size 50/50m) covers the continental and
coastal areas of Finland (Fig. 2.1.6) and was used here for the detailed structural investigations. The
interpretation of geological structures also benefited from the use of Bouguer anomaly grid of
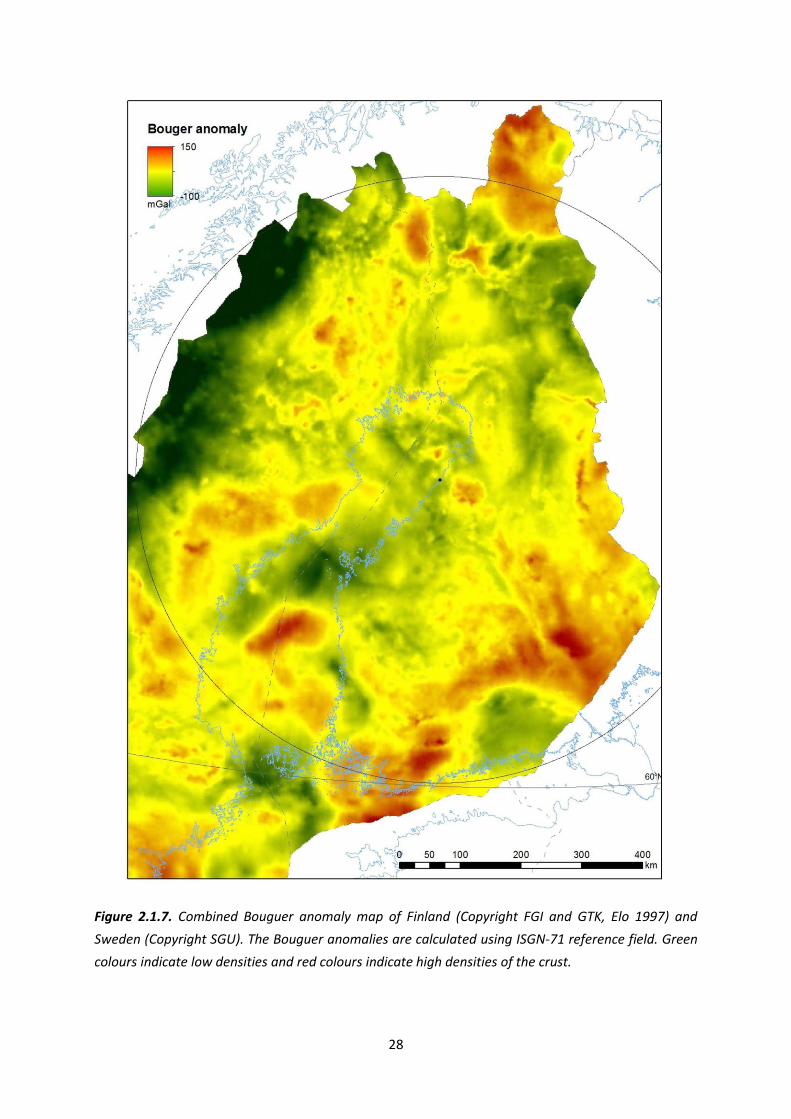
Finland (by FGI and GTK, Elo, 1997) and of the Fennoscandian Shield, grid cell sixe ~1000/1000m (Fig.
2.1.7). In the region of the Gulf of Bothnia, we also used the ”high-altitude” data grid and scanned
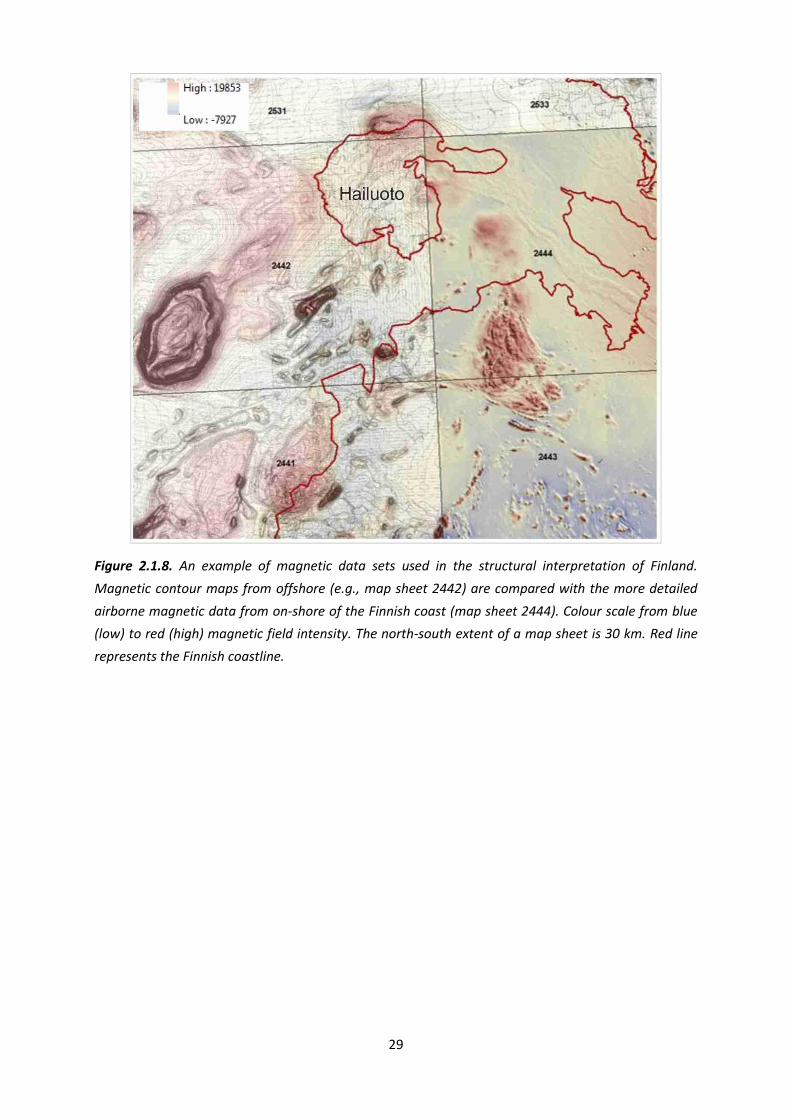
contour maps. Large scale structural framework was interpreted using the Fennoscandian Shield
magnetic data at the cell size of 500/500m (see example in figure 2.1.8).
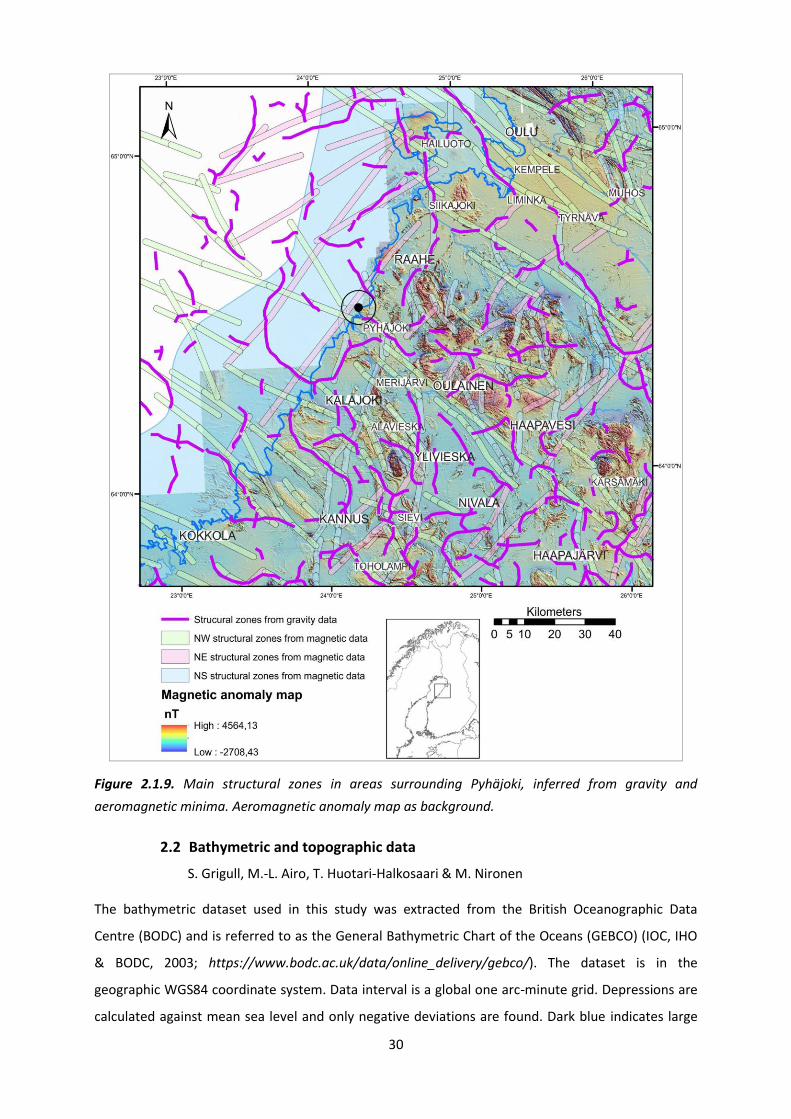
A semi-automatic method for detection of zones of gravity minima which may correspond to fault
and shear zones was applied to the gravity data of Finland. Bouguer anomaly data (by FGI and GTK)
were analyzed for curvature minima by using a raster analysis method implemented by US Geological
Survey for Oasis Montaj (Phillips, 2007). The method determines the existence of local gravity
minima points with associated strike direction. These points were vectorized in ArcGIS and compared
with structural zones (fault and shear zones) interpreted from aeromagnetic data (Figure 2.1.9). This
kind of procedure was conducted over whole Finland to analyze the regional distribution of
geophysically interpreted fault and shear zones.

27
Figure 2.1.6. Combined total magnetic field anomaly map of Finland (Copyright GTK) and Sweden
(Copyright SGU). The magnetic anomalies are shown after subtracting the geomagnetic reference
field DGRF 1965.0. White colour indicates low and black colour indicates high magnetic field intensity.
Hanhikivi site: red dot.
28
Figure 2.1.7. Combined Bouguer anomaly map of Finland (Copyright FGI and GTK, Elo 1997) and
Sweden (Copyright SGU). The Bouguer anomalies are calculated using ISGN-71 reference field. Green
colours indicate low densities and red colours indicate high densities of the crust.
29
Figure 2.1.8. An example of magnetic data sets used in the structural interpretation of Finland.
Magnetic contour maps from offshore (e.g., map sheet 2442) are compared with the more detailed
airborne magnetic data from on-shore of the Finnish coast (map sheet 2444). Colour scale from blue
(low) to red (high) magnetic field intensity. The north-south extent of a map sheet is 30 km. Red line
represents the Finnish coastline.
30
Figure 2.1.9. Main structural zones in areas surrounding Pyhäjoki, inferred from gravity and
aeromagnetic minima. Aeromagnetic anomaly map as background.
2.2 Bathymetric and topographic data
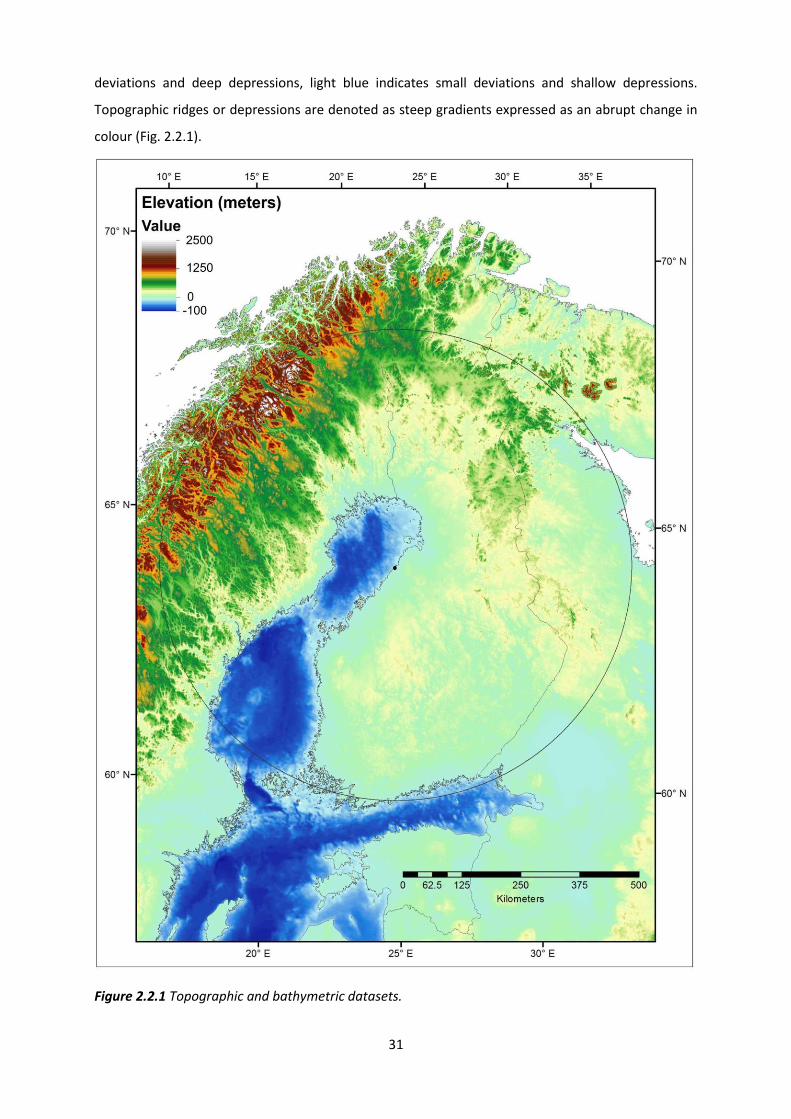
S. Grigull, M.-L. Airo, T. Huotari-Halkosaari & M. Nironen The bathymetric dataset used in this study was extracted from the British Oceanographic Data
Centre (BODC) and is referred to as the General Bathymetric Chart of the Oceans (GEBCO) (IOC, IHO
& BODC, 2003; https://www.bodc.ac.uk/data/online_delivery/gebco/). The dataset is in the
geographic WGS84 coordinate system. Data interval is a global one arc-minute grid. Depressions are
calculated against mean sea level and only negative deviations are found. Dark blue indicates large
31
deviations and deep depressions, light blue indicates small deviations and shallow depressions.
Topographic ridges or depressions are denoted as steep gradients expressed as an abrupt change in
colour (Fig. 2.2.1).
Figure 2.2.1 Topographic and bathymetric datasets.
32
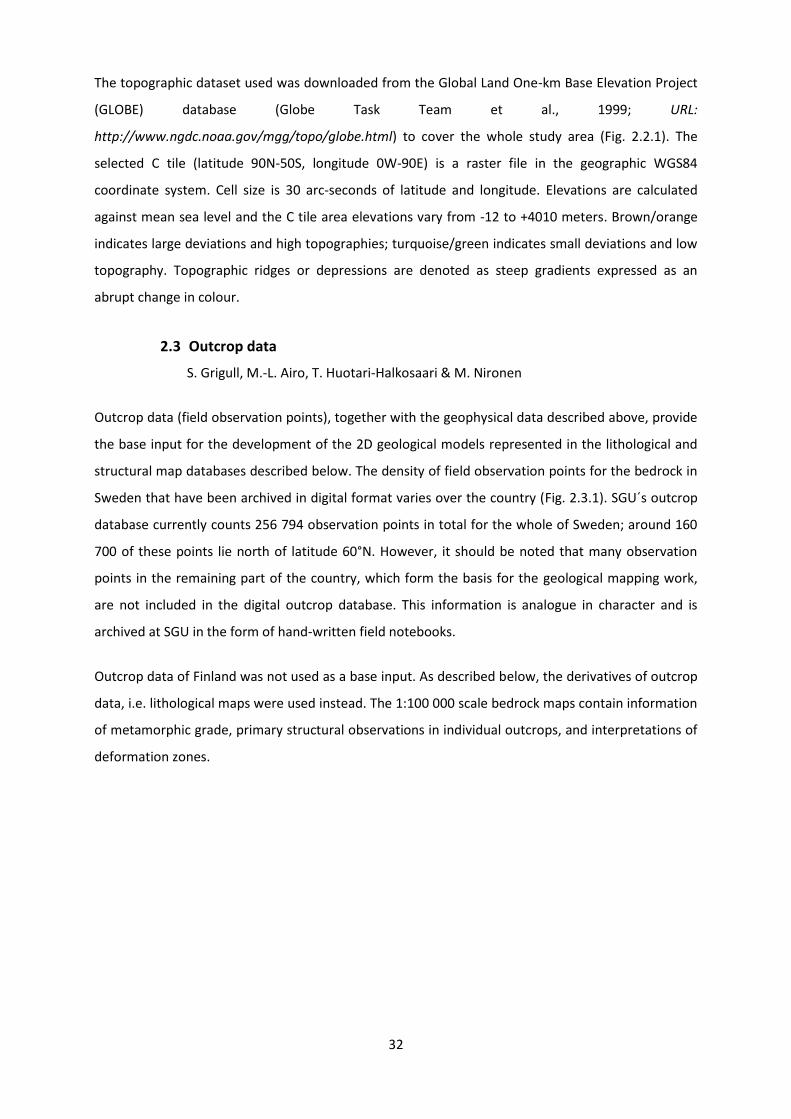
The topographic dataset used was downloaded from the Global Land One-km Base Elevation Project
(GLOBE) database (Globe Task Team et al., 1999; URL:
http://www.ngdc.noaa.gov/mgg/topo/globe.html) to cover the whole study area (Fig. 2.2.1). The
selected C tile (latitude 90N-50S, longitude 0W-90E) is a raster file in the geographic WGS84
coordinate system. Cell size is 30 arc-seconds of latitude and longitude. Elevations are calculated
against mean sea level and the C tile area elevations vary from -12 to +4010 meters. Brown/orange
indicates large deviations and high topographies; turquoise/green indicates small deviations and low
topography. Topographic ridges or depressions are denoted as steep gradients expressed as an
abrupt change in colour.
2.3 Outcrop data
S. Grigull, M.-L. Airo, T. Huotari-Halkosaari & M. Nironen
Outcrop data (field observation points), together with the geophysical data described above, provide
the base input for the development of the 2D geological models represented in the lithological and
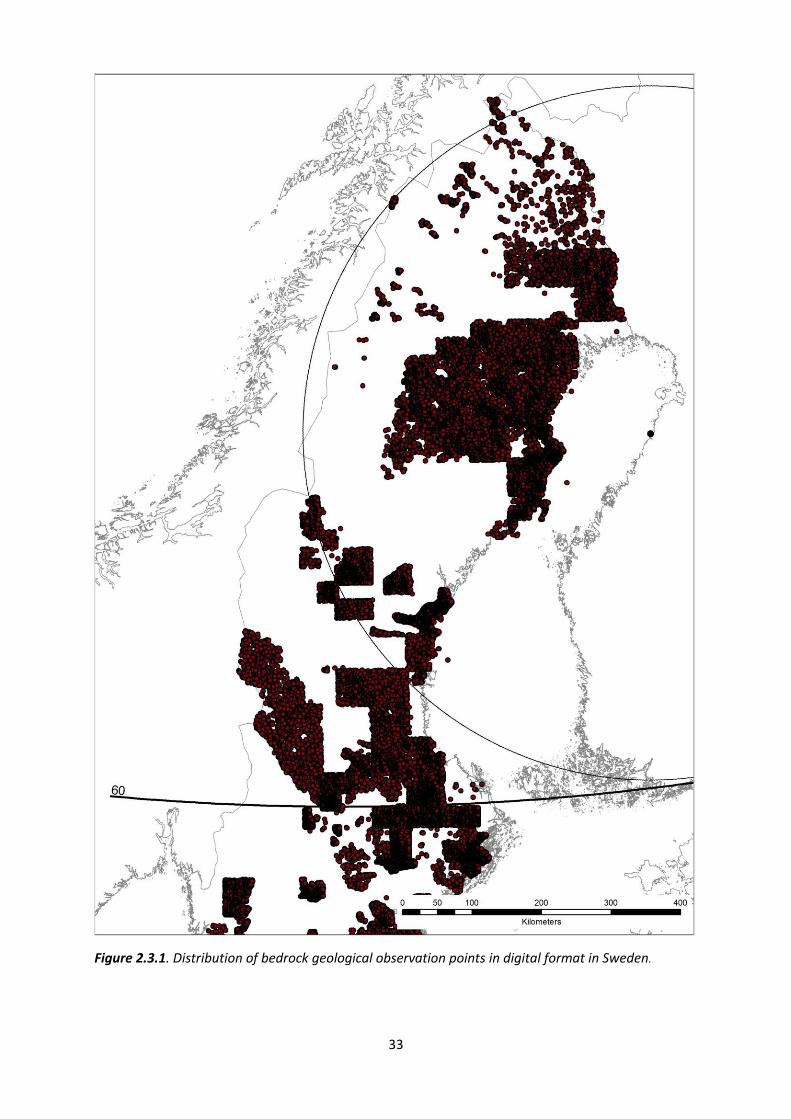
structural map databases described below. The density of field observation points for the bedrock in
Sweden that have been archived in digital format varies over the country (Fig. 2.3.1). SGU´s outcrop
database currently counts 256 794 observation points in total for the whole of Sweden; around 160
700 of these points lie north of latitude 60°N. However, it should be noted that many observation
points in the remaining part of the country, which form the basis for the geological mapping work,
are not included in the digital outcrop database. This information is analogue in character and is
archived at SGU in the form of hand-written field notebooks.
Outcrop data of Finland was not used as a base input. As described below, the derivatives of outcrop
data, i.e. lithological maps were used instead. The 1:100 000 scale bedrock maps contain information
of metamorphic grade, primary structural observations in individual outcrops, and interpretations of
deformation zones.
33
Figure 2.3.1. Distribution of bedrock geological observation points in digital format in Sweden.
34
2.4 Lithological map database
S. Grigull, M.-L. Airo, T. Huotari-Halkosaari & M. Nironen
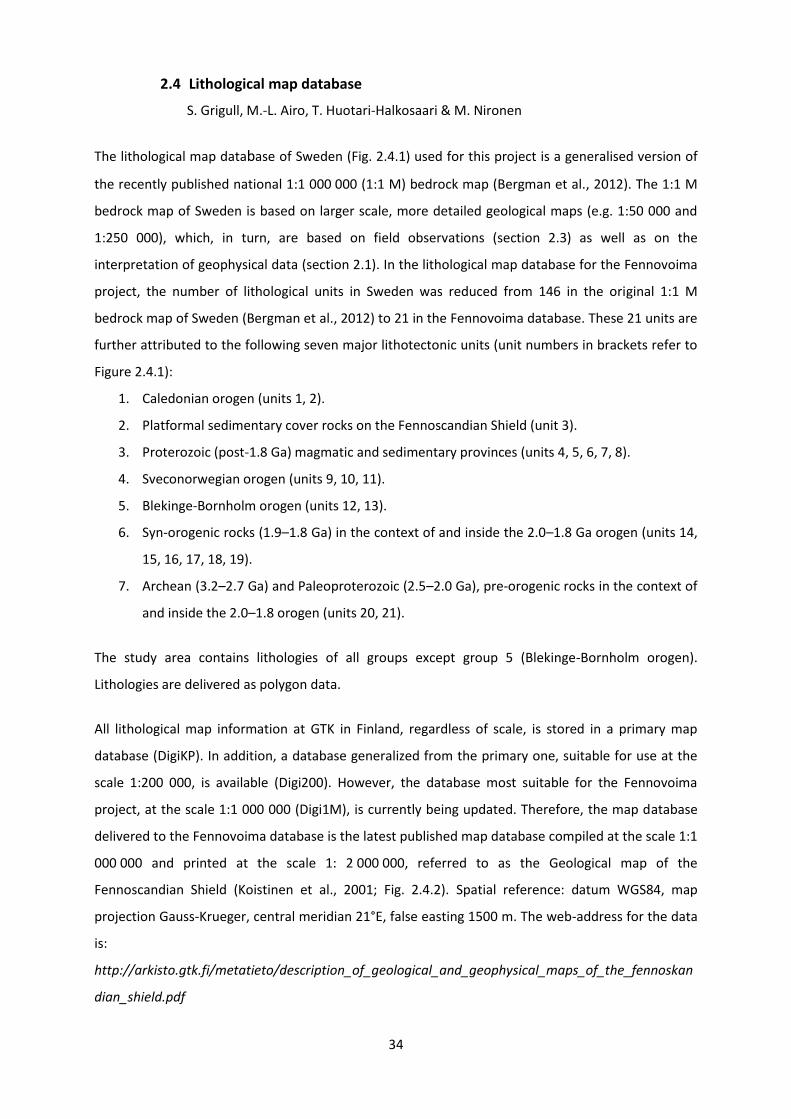
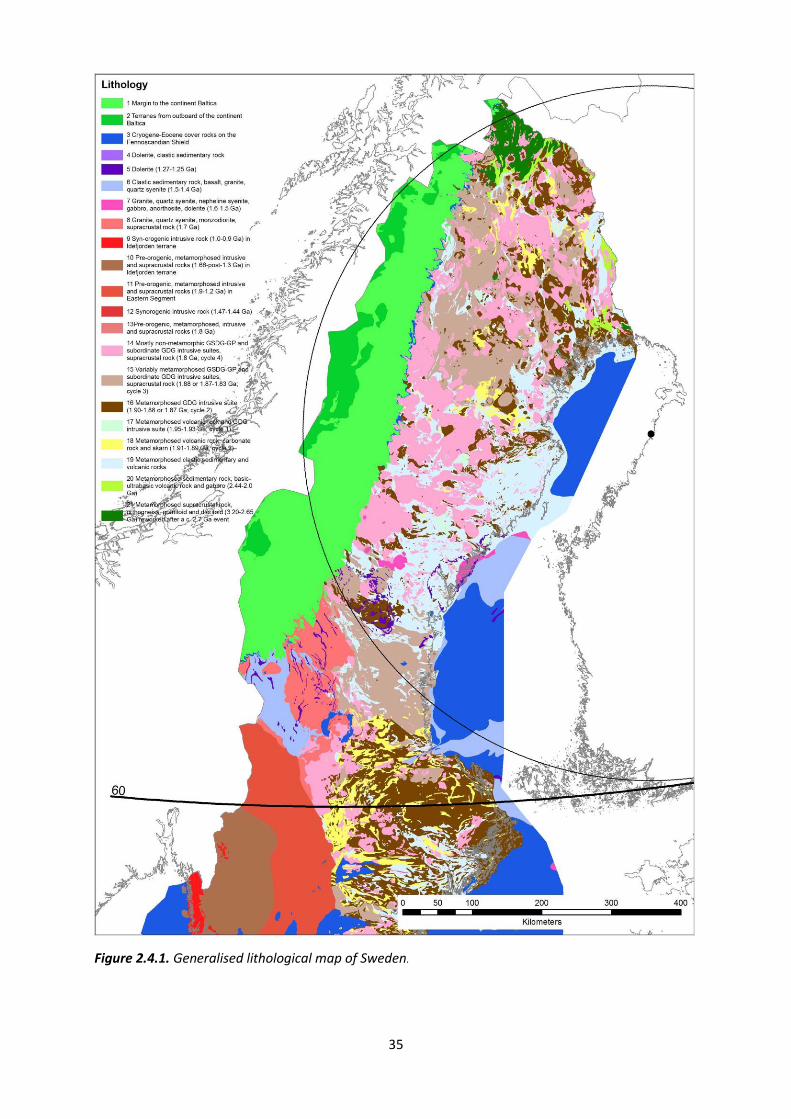
The lithological map database of Sweden (Fig. 2.4.1) used for this project is a generalised version of
the recently published national 1:1 000 000 (1:1 M) bedrock map (Bergman et al., 2012). The 1:1 M
bedrock map of Sweden is based on larger scale, more detailed geological maps (e.g. 1:50 000 and
1:250 000), which, in turn, are based on field observations (section 2.3) as well as on the
interpretation of geophysical data (section 2.1). In the lithological map database for the Fennovoima
project, the number of lithological units in Sweden was reduced from 146 in the original 1:1 M
bedrock map of Sweden (Bergman et al., 2012) to 21 in the Fennovoima database. These 21 units are
further attributed to the following seven major lithotectonic units (unit numbers in brackets refer to
Figure 2.4.1):
1. Caledonian orogen (units 1, 2).
2. Platformal sedimentary cover rocks on the Fennoscandian Shield (unit 3).
3. Proterozoic (post-1.8 Ga) magmatic and sedimentary provinces (units 4, 5, 6, 7, 8).
4. Sveconorwegian orogen (units 9, 10, 11).
5. Blekinge-Bornholm orogen (units 12, 13).
6. Syn-orogenic rocks (1.9–1.8 Ga) in the context of and inside the 2.0–1.8 Ga orogen (units 14,
15, 16, 17, 18, 19).
7. Archean (3.2–2.7 Ga) and Paleoproterozoic (2.5–2.0 Ga), pre-orogenic rocks in the context of
and inside the 2.0–1.8 orogen (units 20, 21).
The study area contains lithologies of all groups except group 5 (Blekinge-Bornholm orogen).
Lithologies are delivered as polygon data.
All lithological map information at GTK in Finland, regardless of scale, is stored in a primary map
database (DigiKP). In addition, a database generalized from the primary one, suitable for use at the
scale 1:200 000, is available (Digi200). However, the database most suitable for the Fennovoima
project, at the scale 1:1 000 000 (Digi1M), is currently being updated. Therefore, the map database
delivered to the Fennovoima database is the latest published map database compiled at the scale 1:1
000 000 and printed at the scale 1: 2 000 000, referred to as the Geological map of the
Fennoscandian Shield (Koistinen et al., 2001; Fig. 2.4.2). Spatial reference: datum WGS84, map
projection Gauss-Krueger, central meridian 21°E, false easting 1500 m. The web-address for the data
is:
http://arkisto.gtk.fi/metatieto/description_of_geological_and_geophysical_maps_of_the_fennoskan
dian_shield.pdf
35
Figure 2.4.1. Generalised lithological map of Sweden.
36
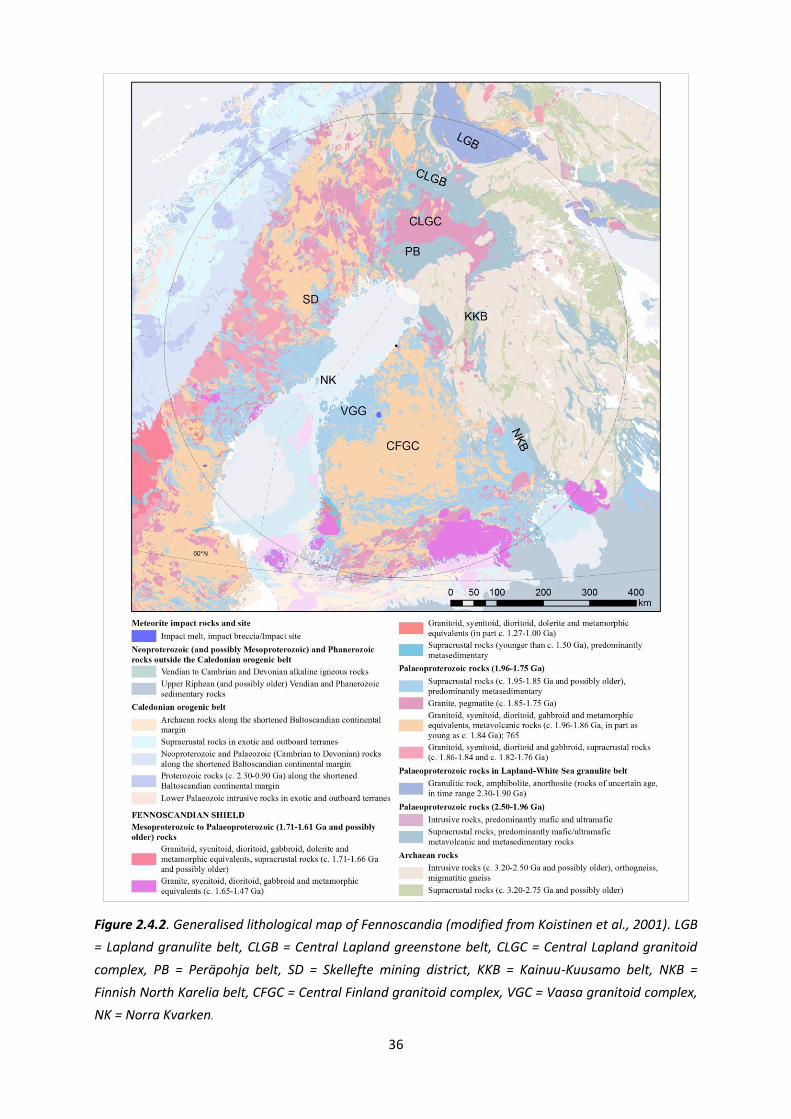
Figure 2.4.2. Generalised lithological map of Fennoscandia (modified from Koistinen et al., 2001). LGB
= Lapland granulite belt, CLGB = Central Lapland greenstone belt, CLGC = Central Lapland granitoid
complex, PB = Peräpohja belt, SD = Skellefte mining district, KKB = Kainuu-Kuusamo belt, NKB =
Finnish North Karelia belt, CFGC = Central Finland granitoid complex, VGC = Vaasa granitoid complex,
NK = Norra Kvarken.

37
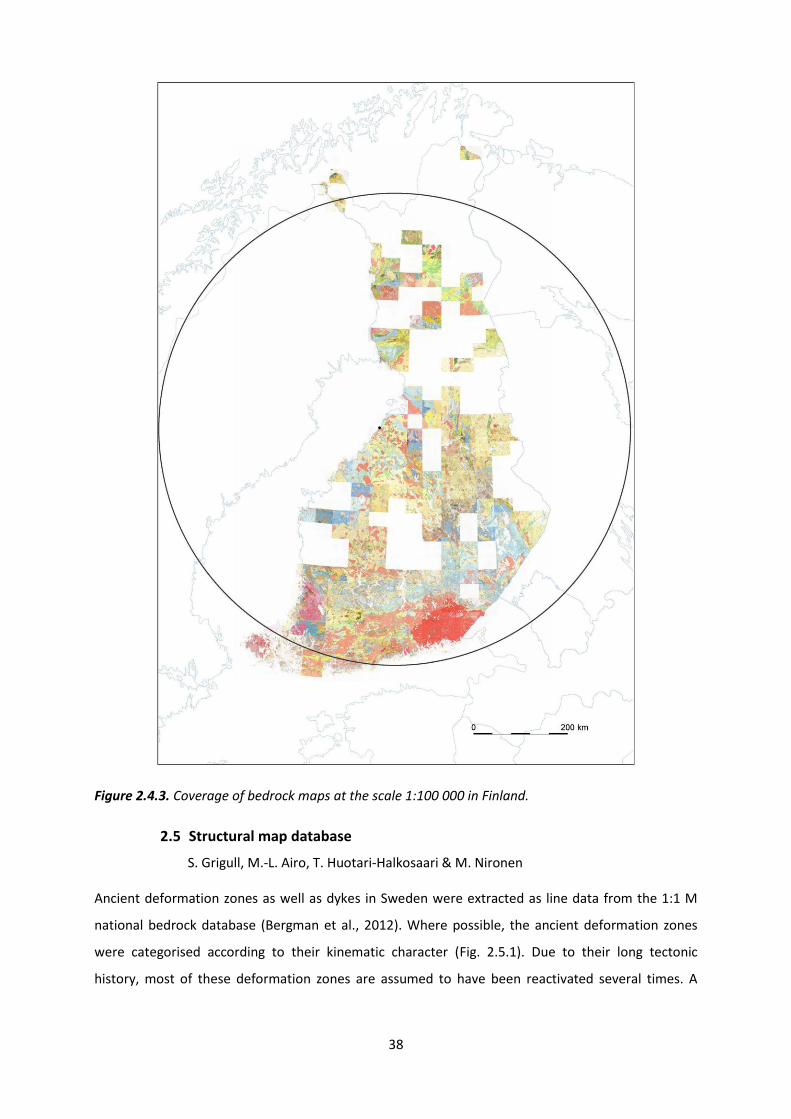
A set of printed bedrock map sheets at the scale 1:100 000 that have been published over Finland
were used as an addition to the lithological database. The maps do not cover the whole of Finland
(Fig. 2.4.3). The maps contain information of bedrock areas, observation sites, drilling sites, primary
structural observations, ore minerals, and metamorphic index minerals. A printed explanation exists
for most of the map sheets. In addition to the Geological map of the Fennoscandian Shield, data
bearing on the Central Finland Granitoid Complex bedrock map (Nironen et al., 2000) was used.
For licence reasons, the lithologies in the Russian and Norwegian parts lying within the 500 km circle
are delivered in raster format (Copyright GTK 1999, applied to original data owned by the Geological
Survey of Norway (NGU) and the Northwest Regional Geological Centre of Russia (NWRGC)).
The Bedrock Map of Finland (Korsman et al., 1997) was used as source material for the Geological
map of the Fennoscandian Shield (Koistinen et al., 2001). This material was updated with structural
and lithological map information at 1:1 000 000 scale from the Raahe-Ladoga shear complex and with
the research data available. The sources of information for the Gulf of Bothnia region and the Gulf of
Finland were Lundqvist et al. (1996) and Koistinen (1994), respectively.
38
Figure 2.4.3. Coverage of bedrock maps at the scale 1:100 000 in Finland.
2.5 Structural map database
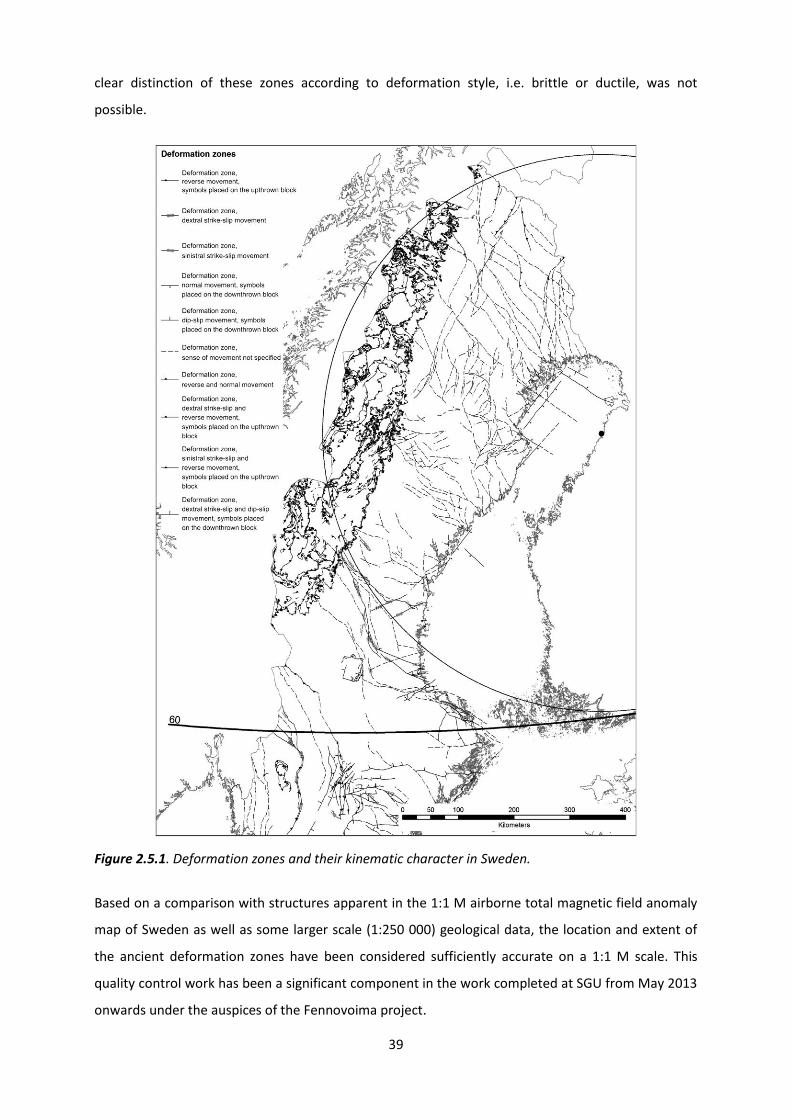
S. Grigull, M.-L. Airo, T. Huotari-Halkosaari & M. Nironen Ancient deformation zones as well as dykes in Sweden were extracted as line data from the 1:1 M
national bedrock database (Bergman et al., 2012). Where possible, the ancient deformation zones
were categorised according to their kinematic character (Fig. 2.5.1). Due to their long tectonic
history, most of these deformation zones are assumed to have been reactivated several times. A
39
clear distinction of these zones according to deformation style, i.e. brittle or ductile, was not
possible.
Figure 2.5.1. Deformation zones and their kinematic character in Sweden.
Based on a comparison with structures apparent in the 1:1 M airborne total magnetic field anomaly
map of Sweden as well as some larger scale (1:250 000) geological data, the location and extent of
the ancient deformation zones have been considered sufficiently accurate on a 1:1 M scale. This
quality control work has been a significant component in the work completed at SGU from May 2013
onwards under the auspices of the Fennovoima project.

40
Some modifications were made to deformation zones in the northernmost part of Sweden, and in
the northern part of the Gulf of Bothnia (Bay of Bothnia), making use of the new airborne
geophysical data collected by SGU during 2012. The original line data representing the brittle-ductile
deformation zones in the Fennovoima database were slightly adjusted, extended, or newly drawn
following magnetic minima on the magnetic anomaly map (section 2.1). The modifications are
presented in Figure 2.5.2. Some minor modifications along the national border between Finland and
Sweden were also made when integrating the two separate data sets in Sweden and Finland (Fig.
2.5.3). These modifications involved the removal of minor discrepancies in the position of
deformation zones on each side of the national border, and the removal of zones in Finland with a
trace length at the ground surface not conformable with the 1:1 M scale of resolution adopted in this
study. The modifications were carried out with the help of the total magnetic field anomaly maps for
Sweden and Finland (Figs. 2.1.2 and 2.1.6).
The deformation zones were interpreted from GTK's countrywide airborne geophysical data sets:
magnetic, electromagnetic (apparent resistivity) and, to a lesser extent, gamma radiation
(Hautaniemi et al., 2005). Moreover, the bedrock map of Finland (1:1 000 000) and printed 1:100 000
bedrock maps (Fig. 2.4.3) were used for the location of ancient deformation zones. The structural
data from Russia were interpreted from lower-quality geophysical data that were provided for
compilation of the Geological map of the Fennoscandian Shield 1: 2 000 000 (Koistinen et al., 2001).
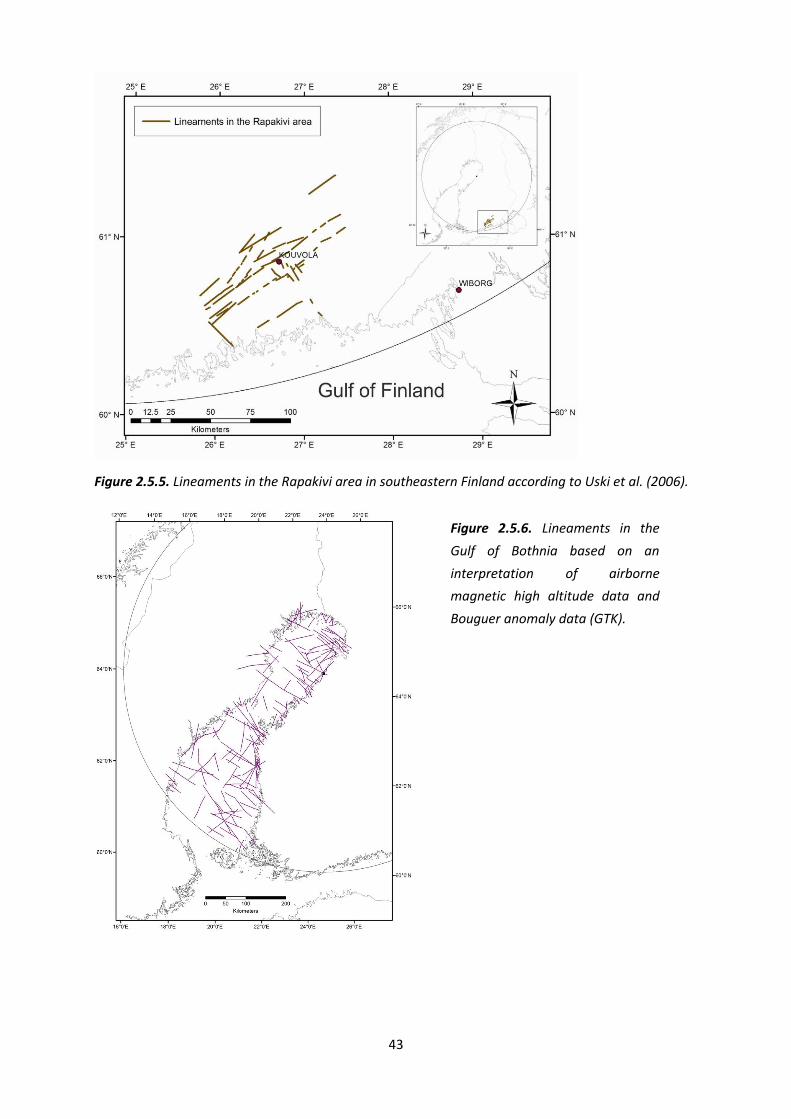
The Rapakivi area lineaments (Fig. 2.5.5) were drawn according to aeromagnetic data and the
interpretations was already published in Uski et al. (2006).
An interpretation of lineaments in the offshore area beneath the Gulf of Bothnia (Fig. 2.5.6) was
carried out using airborne magnetic and Bouguer anomaly data for the Fennoscandian shield
(Korhonen et al., 2002a,b).
The old morphological lineaments
The interpretation of the old morphological lineaments from Finland is made using 10 m x 10 m DEM
with elevation contours (© National Land Survey of Finland). The lineaments in the old study area
having a radius of 150 km around Pyhäjoki (Kuivamäki et al. 2011; Kukkonen 2011) in Figure 2.5.7 are
categorized in 4 groups by length: Group 4: < 1 km, Group 3: 1-5 km, Group 2: 5-20 km and Group 1:
> 20 km. In the new 500 km area around Hanhikivi only categories 1 and 2 are presented in the
database. The interpretations of the lineaments in the 500 km area around Hanhikivi are the same as
for the interpretations for the whole Finland, but they are cut according to circle boarder. The
lineaments from Karelia region are drawn using topographic maps and Landsat figures (Landsat
TM742 Suomi). The precision of the interpretation is not at the same level for Karelia region as for

41
Finland (scale is approximate 1:200 000-1:400 000). The lineament interpretation from the bottom of
Lake Ladoga was not made due to lack of depth data. The Group 1: > 20 km lineaments in 500 km
area are presented in the Figure 2.5.8. The geophysical study from the Russia is based on the
geological and topographical data. Some background information can be found from the reports by
Kuivamäki et al. (2011) and Kukkonen (2011).
Figure 2.5.2. Map showing modifications
made to deformation zones in the
northernmost part of Sweden using the
SGU airborne magnetic data from 2012.
The green lines correspond to the original
data set extracted from Bergman et al.
(2012) and the black lines correspond to
the few modified lines.
Figure 2.5.3. Map showing modifications
made to deformation zones across the
border between Finland and Sweden in
connection with integration of the
respective data sets. The green lines
correspond to the resulting deformation
zones in the Fennovoima database and the
red and blue lines correspond to the
original data sets in Finland and Sweden,
respectively.

42
Figure 2.5.4. Deformation
zones and their kinematic
character in Finland.
43
Figure 2.5.5. Lineaments in the Rapakivi area in southeastern Finland according to Uski et al. (2006).
Figure 2.5.6. Lineaments in the
Gulf of Bothnia based on an
interpretation of airborne
magnetic high altitude data and
Bouguer anomaly data (GTK).

44
Figure 2.5.7. The lineaments in the old 150 km study area around Hanhikivi (Kuivamäki et al., 2011)
are categorized in 4 groups by length: Group 4: < 1 km, Group 3: 1-5 km, Group 2: 5-20 km and Group
1: > 20 km.

45
Figure 2.5.8. Morphological lineaments around Hanhikivi. The smaller circle is 150 km and the larger
500 km around Hanhikivi. The lengths of the lineaments are in 4 groups: Group 1 > 20 km, Group 2 5-
20 km, Group 3 1-5 km and Group 4 < 1 km. Only group 1 is visualized from the 500 km area around
Hanhikivi.
46
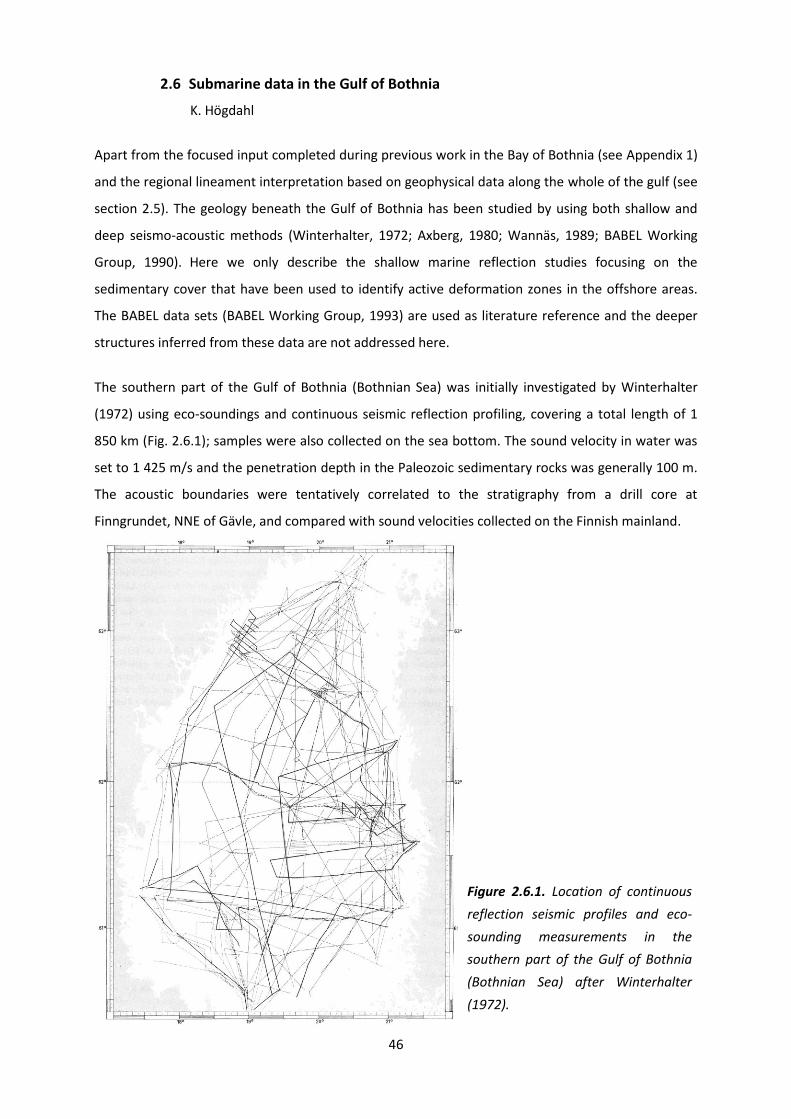
2.6 Submarine data in the Gulf of Bothnia
K. Högdahl
Apart from the focused input completed during previous work in the Bay of Bothnia (see Appendix 1)
and the regional lineament interpretation based on geophysical data along the whole of the gulf (see
section 2.5). The geology beneath the Gulf of Bothnia has been studied by using both shallow and
deep seismo-acoustic methods (Winterhalter, 1972; Axberg, 1980; Wannäs, 1989; BABEL Working
Group, 1990). Here we only describe the shallow marine reflection studies focusing on the
sedimentary cover that have been used to identify active deformation zones in the offshore areas.
The BABEL data sets (BABEL Working Group, 1993) are used as literature reference and the deeper
structures inferred from these data are not addressed here.
The southern part of the Gulf of Bothnia (Bothnian Sea) was initially investigated by Winterhalter
(1972) using eco-soundings and continuous seismic reflection profiling, covering a total length of 1
850 km (Fig. 2.6.1); samples were also collected on the sea bottom. The sound velocity in water was
set to 1 425 m/s and the penetration depth in the Paleozoic sedimentary rocks was generally 100 m.
The acoustic boundaries were tentatively correlated to the stratigraphy from a drill core at
Finngrundet, NNE of Gävle, and compared with sound velocities collected on the Finnish mainland.
Figure 2.6.1. Location of continuous
reflection seismic profiles and eco-
sounding measurements in the
southern part of the Gulf of Bothnia
(Bothnian Sea) after Winterhalter
(1972).

47
During 1972–1978, additional continuous reflection seismic profiling and eco-sounding were carried
out along 8 000 km of section lines (Fig. 2.6.2A) in the Bothnia Sea (Axberg, 1980); 10 measurements
of continuous refraction seismic soundings were also carried out (Fig. 2.6.2B). The sound velocity in
water was calculated to 1 430 m/s and the penetration depth ranged from 50–300 m. The vertical
resolution of bedrock layers was normally 2–6 m but spanned between 0.6 and 16 m depending on
the sound velocity of the rocks and the applied frequency band (50–900 Hz). Five of the acoustic
boundaries were compared with and correlated to the stratigraphy along two drill cores collected at
Västra Banken (R3) and Finngrundet (R7), NNE of Gävle (Fig. 2.6.2B).
Figure 2.6.2. A) Location of continuous reflection seismic profiles and eco-sounding measurements in
the southern part of the Gulf of Bothnia (Bothnian Sea) after Axberg (1980). B). Location of 10
refraction seismic stations in the Bothnian Sea after Axberg (1980). The two southernmost asterisks
(R3 and R7) mark the locations of Västra Banken (to the southwest) and Finngrundet (to the
northeast). The reader is referred to Figure 5 in Axberg (1980) for the explanation to the rock units
shown on land in Figure 2.6.2B.
During 1978–1980, continuous reflection seismic profiling and eco-sounding along 2 800 km of
section lines (Fig. 2.6.3A) were carried out in the Bay of Bothnia, in the northern part of the Gulf of
Bothnia (Wannäs, 1989); 62 sonobouy refraction seismic measurements were also shot (Fig. 2.6.3B).
The reflection seismic data were collected using an analogue, single-channel seismic reflection
profiler (Wannäs, 1989). The penetration depth with this method is variable, being a function of
water depth and sound velocities in the rocks below, and of the ratio between the sound velocities of
A B

48
the water and the Quaternary deposits. The sound velocity in water was calculated to 1 430 m/s. The
range of the vertical resolution was not provided in Wannäs (1989). The acoustic boundaries were
compared with data collected on land in the Finnish mainland and on Hailuoto Island, and correlated
to the stratigraphy in one drill core from the same island that covers some of the acoustic
boundaries.
Figure 2.6.3. A) Location of continuous reflection seismic profiles in the northern part of the Gulf of
Bothnia (Bay of Bothnia) after Wannäs (1989). B) Location of the 64 sonobouy refraction seismic
stations in the Bay of Bothnia after Wannäs (1989). The reader is referred to Figure 3 in Wannäs
(1989) for the explanation to the rock units shown on land in Figure 2.6.3B.
All these data have been used to calculate the sound velocities in the sedimentary cover rocks, and
to determine the depth to the seismic markers and, thereby, the water depth, the thickness of the
sedimentary rocks and the depth to the crystalline basement. The data were also used to identify the
locations of faults that disturb the sedimentary cover rocks and their inferred vertical component of
displacement.
The data collected by Winterhalter (1972) are stored at the Geological Survey of Finland. The seismic
data collected by Axberg (1980) and Wannäs (1989) were recorded on tape and stored as analogue
data at the Department of Earth Sciences, Stockholm University. However, in connection with
relocation of this institution from central Stockholm and its reorganisation on several occasions, it is
difficult to evaluate exactly how much of the original data are currently preserved. None of these
data have been converted to modern digital formats. Inspection of primary data was not completed
in this study and the evaluation presented here solely makes use of the interpretations presented in
Winterhalter (1972, 2000), Axberg (1980) and Wannäs (1989).
A B

49
In the acoustic-seismic sounding study by Rantataro et al. (2011) in the Bay of Bothnia (Appendix 1,
Fig. A1.2), lineaments interpreted by Wannäs (1989) and Kuivamäki et al. (2011) were observed
typically as bedrock depressions, but no indications of post-glacial faulting were found in the
investigated area.
2.7 Faults active during the Quaternary period
S. Grigull, R. Sutinen & E. Kosonen
Munier & Fenton (2004) and Lagerbäck & Sundh (2008) describe criteria for the identification of
post-glacial faults (PGF), including points such as the faults cutting overlying Quaternary deposits,
displacement of both late and post-glacial deposits and reactivation occurring close in time to local
deglaciation.
The knowledge about the location, displacement properties and length of these faults is largely
based on geological work focused on the northern half of Sweden since the 1970´s (Lundqvist and
Lagerbäck, 1976; Lagerbäck and Henkel, 1977; Lagerbäck, 1979, 1990; Lagerbäck and Sundh, 2008).
Post-glacial faults in northern Finland were first discovered by Kujansuu (1964, 1972). These findings
were later confirmed by Kuivamäki et al. (1998). Lagerbäck and Sundh (2008) described the methods
used to identify the presently known faults active during the Quaternary in Sweden and summarised
the present state of knowledge of nine major confirmed fault systems (Fig. 2.7.1). Potential fault
candidates were identified using aerial photographs to discover the location and frequency of
landslides developed in glacial tills and spatially related fault traces. Field reconnaissance studies
were carried out mostly involving trenching across the fault scarps and studying soft sediment
deformation structures (Lagerbäck and Sundh, 2008). An interpretation and catalogue of
paleoseismicity in Sweden have also been presented by Mörner (2005) and a detailed search for
PGFs was carried out during the site investigations for a repository for spent nuclear fuel in
Östhammar and Oskarshamn (Lagerbäck and Sundh, 2003; Lagerbäck et al., 2004a,b; Lagerbäck et al.
2005a,b; Lagerbäck et al. 2006 [six SKB reports]).
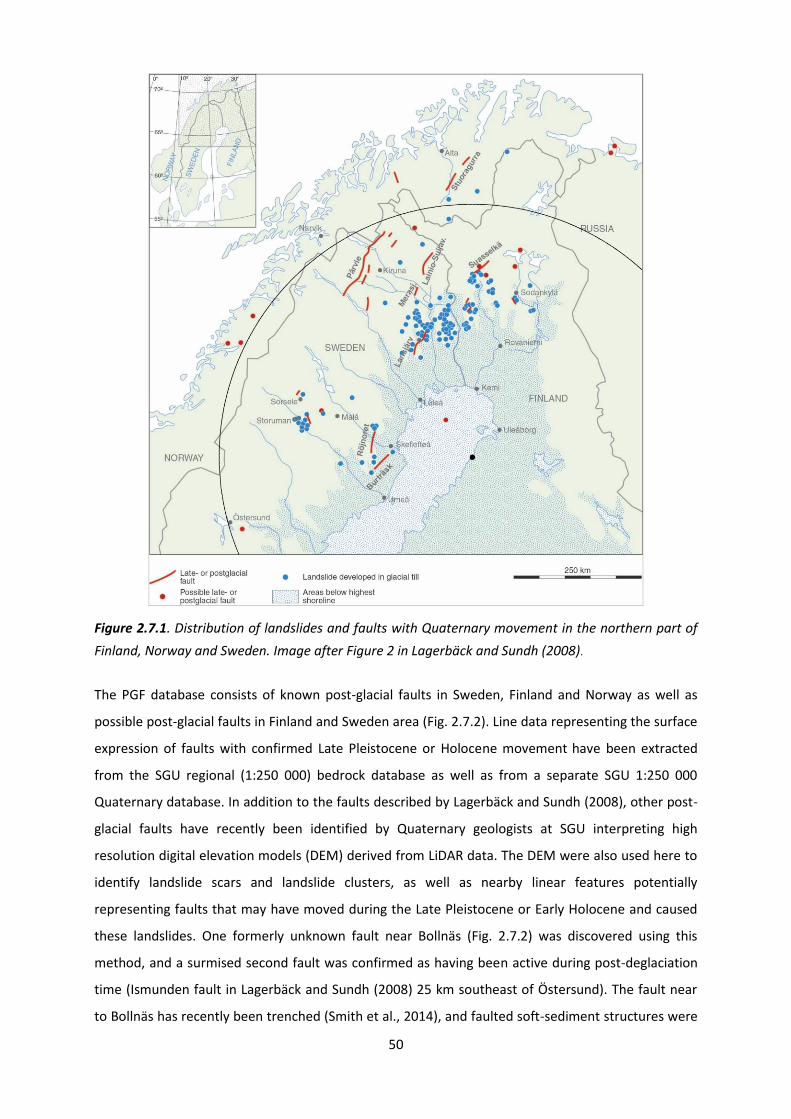
50
Figure 2.7.1. Distribution of landslides and faults with Quaternary movement in the northern part of
Finland, Norway and Sweden. Image after Figure 2 in Lagerbäck and Sundh (2008).
The PGF database consists of known post-glacial faults in Sweden, Finland and Norway as well as
possible post-glacial faults in Finland and Sweden area (Fig. 2.7.2). Line data representing the surface
expression of faults with confirmed Late Pleistocene or Holocene movement have been extracted
from the SGU regional (1:250 000) bedrock database as well as from a separate SGU 1:250 000
Quaternary database. In addition to the faults described by Lagerbäck and Sundh (2008), other post-
glacial faults have recently been identified by Quaternary geologists at SGU interpreting high
resolution digital elevation models (DEM) derived from LiDAR data. The DEM were also used here to
identify landslide scars and landslide clusters, as well as nearby linear features potentially
representing faults that may have moved during the Late Pleistocene or Early Holocene and caused
these landslides. One formerly unknown fault near Bollnäs (Fig. 2.7.2) was discovered using this
method, and a surmised second fault was confirmed as having been active during post-deglaciation
time (Ismunden fault in Lagerbäck and Sundh (2008) 25 km southeast of Östersund). The fault near
to Bollnäs has recently been trenched (Smith et al., 2014), and faulted soft-sediment structures were

51
discovered, strongly indicating late- to post-glacial fault movement. Both newly discovered faults
(Smith et al., 2014; Mikko et al., 2014) are included in the current Fennovoima database (Fig. 2.7.2).
Stereo airphoto interpretation from the 1960’s and more recently a 10 m resolution digital elevation
model (DEM) by the National Land Survey of Finland have been applied to detect PGFs. The current
airborne LiDAR-data allows precise detection of even minor ruptures under the forest canopies (Fig.
2.7.3) as well as reconnaissance of earthquake induced morphological features, such as landslides
(Sutinen et al., 2013). New post-glacial faults (Isovaara, Kultima, Paatsikkojoki, Palojärvi) have been
found and identified from Finland in past years (Sutinen et al., 2013, 2014) and added to the
Fennovoima database (Fig. 2.7.2).
The possible post-glacial faults in the Storuman/Sorsele and Malå region (Sweden), first mentioned
during Quaternary mapping (Johansson and Ransed, 2003; Ransed and Wahlroos, 2007), have been
included in the database as a separate dataset (Fig. 2.7.2). The Sorsele and Malå faults have been
drawn according to Lagerbäck and Sundh (2008). The possible post-glacial faults in Finland,
Vaalajärvi, Siyliövaara, Kotijänkä and Sevetti (Fig. 2.7.2) are also included in the database, since most
of them are cited in past literature as post-glacial faults (Kujansuu 1964, Kuivamäki et al. 1998); they
are currently considered as possible post-glacial faults and await further analysis. The Stuoragurra
and Nordmannvik post-glacial faults were drawn according to Lagerbäck and Sundh (2008).
During the process of compiling the current structural lines database, it emerged that most of the
late- or post-glacial faults are situated parallel, and spatially close, to ancient deformation zones or
even coincide with them. This relationship between ancient crustal zones of weakness and the fault
zones active during the Quaternary has already been suggested by Lagerbäck and Henkel (1977). For
this reason, the initiative was taken to complete a more detailed lineament study around the known
late- or post-glacial faults in Sweden using the magnetic data described in section 2.1 and an
interpretation of the total magnetic field anomaly map generated by SGU and shown in Figure 2.1.2.
On a 1:100 000 scale map, magnetic minima were traced and compared to available larger scale
maps. The resulting line data are also included in the current Fennovoima database and an example
is provided in Figure 2.7.4.
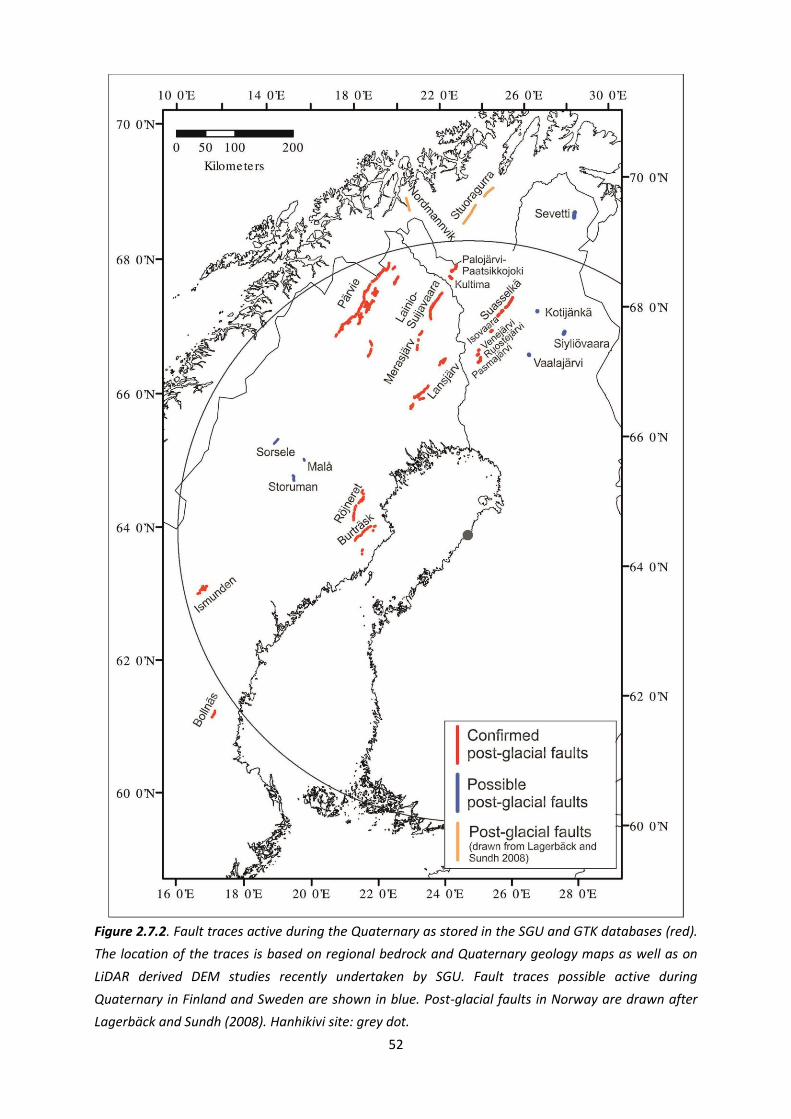
52
Figure 2.7.2. Fault traces active during the Quaternary as stored in the SGU and GTK databases (red).
The location of the traces is based on regional bedrock and Quaternary geology maps as well as on
LiDAR derived DEM studies recently undertaken by SGU. Fault traces possible active during
Quaternary in Finland and Sweden are shown in blue. Post-glacial faults in Norway are drawn after
Lagerbäck and Sundh (2008). Hanhikivi site: grey dot.
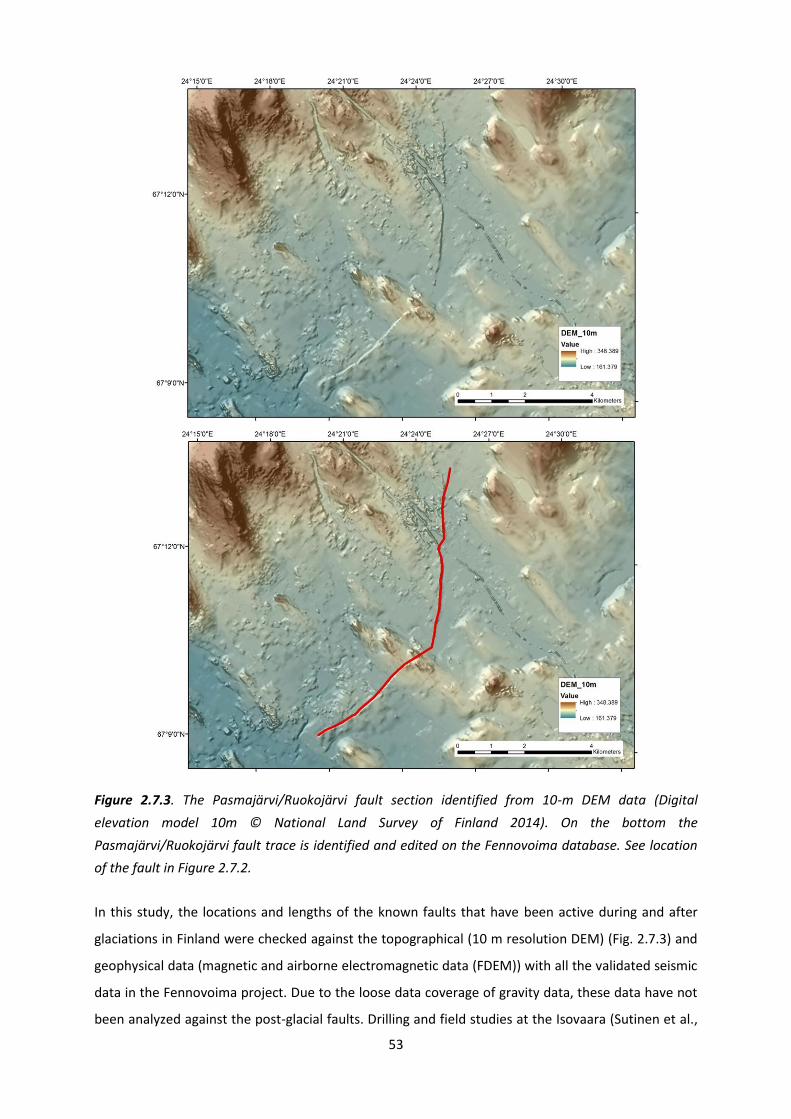
53
Figure 2.7.3. The Pasmajärvi/Ruokojärvi fault section identified from 10-m DEM data (Digital
elevation model 10m © National Land Survey of Finland 2014). On the bottom the
Pasmajärvi/Ruokojärvi fault trace is identified and edited on the Fennovoima database. See location
of the fault in Figure 2.7.2.
In this study, the locations and lengths of the known faults that have been active during and after
glaciations in Finland were checked against the topographical (10 m resolution DEM) (Fig. 2.7.3) and
geophysical data (magnetic and airborne electromagnetic data (FDEM)) with all the validated seismic
data in the Fennovoima project. Due to the loose data coverage of gravity data, these data have not
been analyzed against the post-glacial faults. Drilling and field studies at the Isovaara (Sutinen et al.,
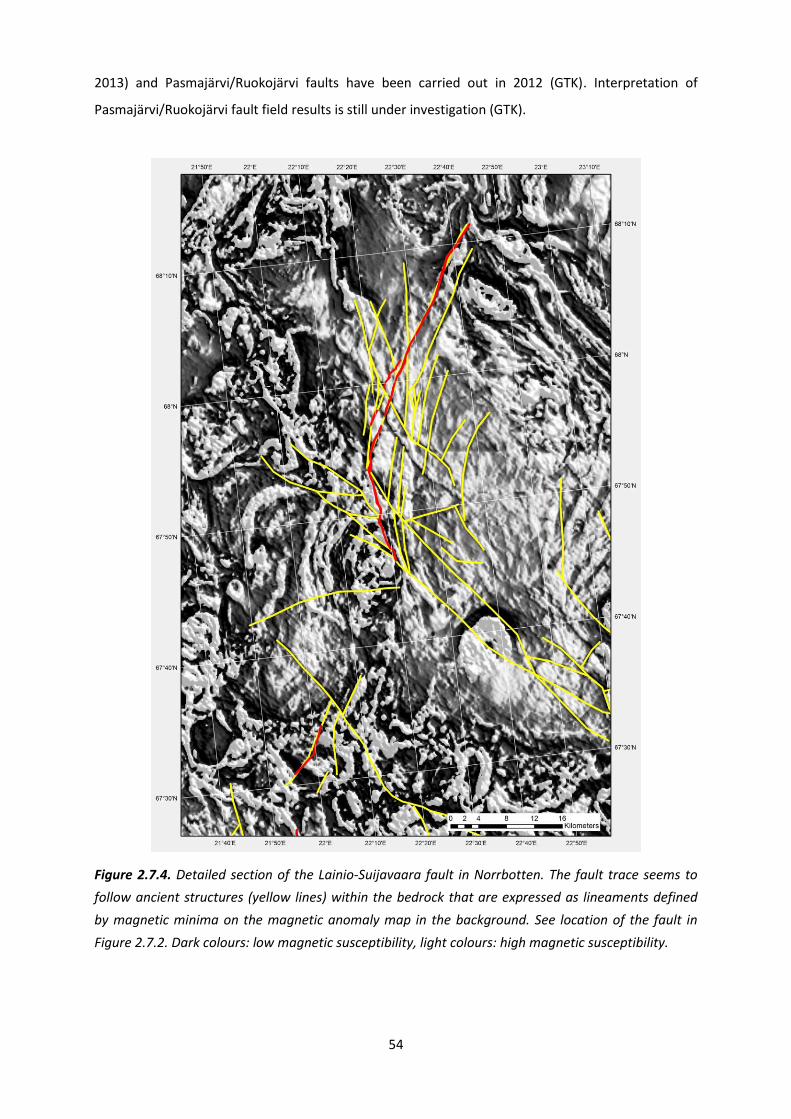
54
2013) and Pasmajärvi/Ruokojärvi faults have been carried out in 2012 (GTK). Interpretation of
Pasmajärvi/Ruokojärvi fault field results is still under investigation (GTK).
Figure 2.7.4. Detailed section of the Lainio-Suijavaara fault in Norrbotten. The fault trace seems to
follow ancient structures (yellow lines) within the bedrock that are expressed as lineaments defined
by magnetic minima on the magnetic anomaly map in the background. See location of the fault in
Figure 2.7.2. Dark colours: low magnetic susceptibility, light colours: high magnetic susceptibility.
55
2.8 Seismicity database
B. Lund, M. Uski & Mäntyniemi, P.
The study area is situated in the Fennoscandian Shield, where geological conditions are favourable
for detecting and recording seismic signals. The ancient, stable Precambrian crust is seismologically
quiet and transfers seismic waves well due to its low attenuation properties. The parametric
Fennoscandian earthquake catalogue FENCAT has been used as a primary seismicity reference in this
project. FENCAT is a compilation of earthquake reports from cooperating seismological agencies in
the Nordic countries, Estonia and NW Russia.
2.8.1 Earthquake database
The parametric earthquake catalogue FENCAT (Ahjos and Uski, 1992; with updates at
http://www.seismo.helsinki.fi/english/bulletins/catalog_northeurope.html) is the most
comprehensive source of seismicity data available in the study region. It covers the years 13752011
(Figs. 2.8.1.1 and 2.8.1.2). Besides the earthquake magnitude and epicentral coordinates, it provides
the macroseismic parameters area of perceptibility and maximum intensity for the non-instrumental
earthquakes and also for many instrumental earthquakes. Reliable depth estimates are available for
only a number of the most recent earthquakes.
In addition, a preliminary version of the 2012 earthquake catalogue has been prepared for this
project. It is based on earthquake reports from the Finnish (FNSN) and Swedish (SNSN) national
seismic networks. For the current project, the SNSN has provided a supplementary data set not
included in the metadatabase (Appendix 3) or open-access FENCAT, including all micro-earthquakes
detected within Sweden since August 2000 (Fig. 2.8.1.3). The locations are routine processing, single
event locations, and no effort has been made here to further refine the location of the events.
Mining-induced seismic events, such as rock bursts and mine collapses, as well as events with
questionable seismic origin (e.g., frost shocks, events interpreted as misidentified blasts) have been
removed from the data sets.
Besides earthquake parameters, macroseismic data point (MDP) datasets have been prepared for
key historical earthquakes in the study region (see Appendix 2, Table A2.1). Effects of local and
regional earthquakes have been reported in writing throughout centuries. The textual information is
helpful for seismicity studies provided that the rigorous rules of historical seismology are followed.
Consulting primary written documentary materials reporting felt earthquake effects has led to a
more comprehensive understanding and re-appraisal of the earthquakes. The investigated
earthquakes noteworthy in seismic hazard assessment are listed in Table 2.8.1.1.
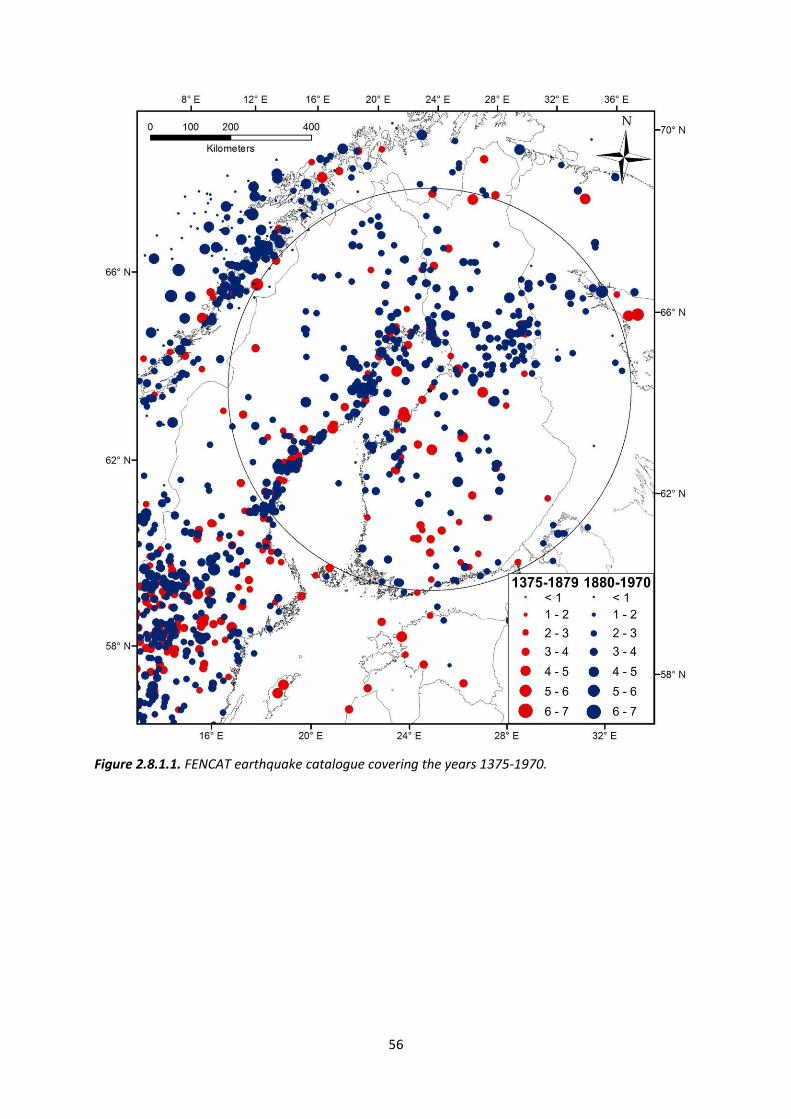
56
Figure 2.8.1.1. FENCAT earthquake catalogue covering the years 1375-1970.
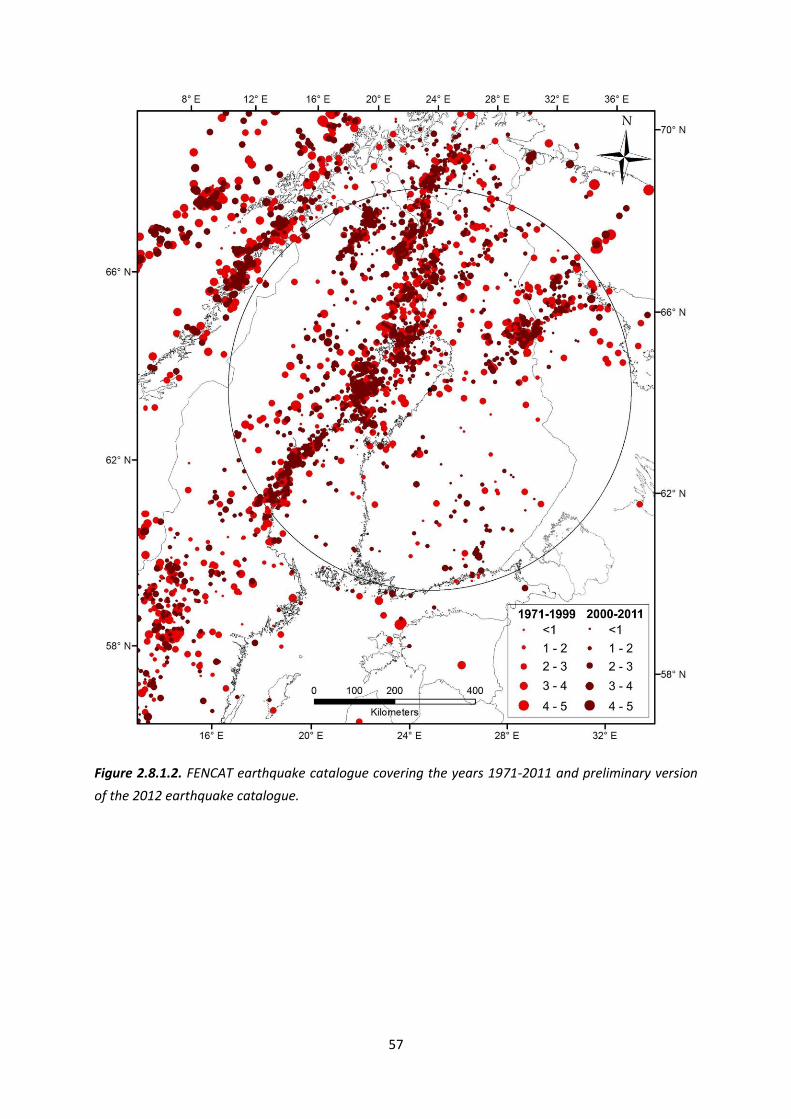
57
Figure 2.8.1.2. FENCAT earthquake catalogue covering the years 1971-2011 and preliminary version
of the 2012 earthquake catalogue.

58
Figure 2.8.1.3. SNSN supplementary data set including micro-earthquakes detected within Sweden
since August 2000.
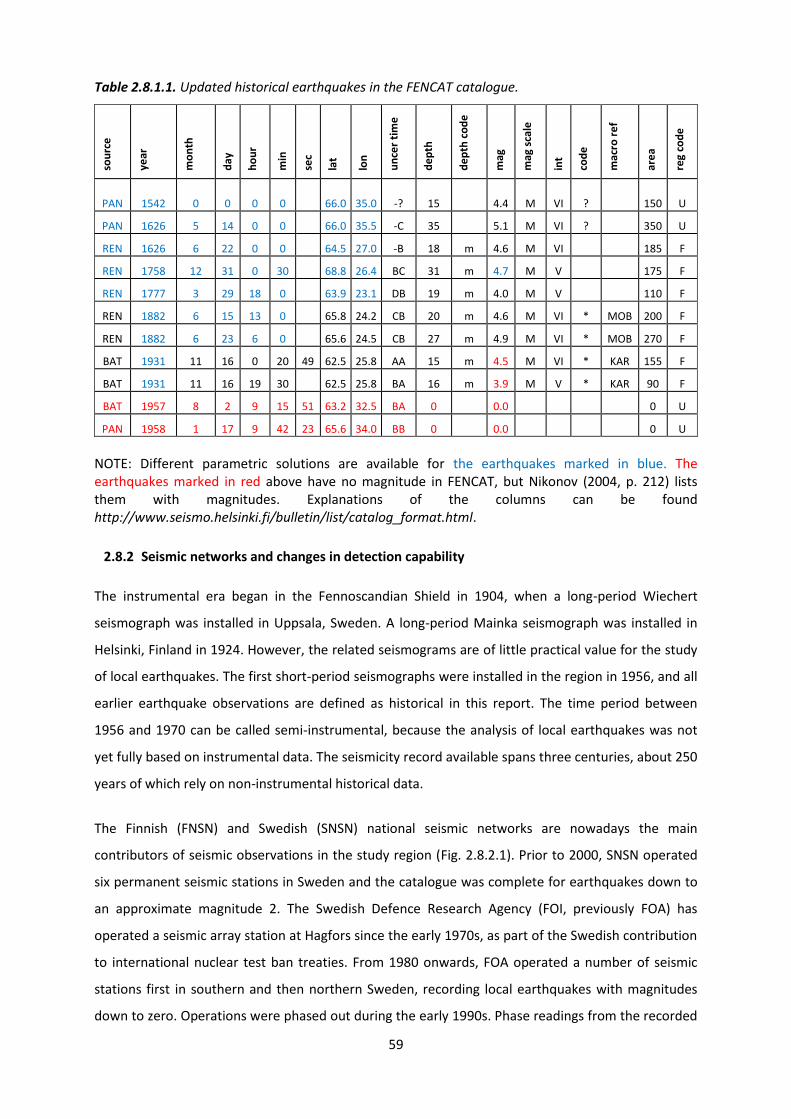
59
Table 2.8.1.1. Updated historical earthquakes in the FENCAT catalogue. so
urc
e
year
mo
nth
day
ho
ur
min
sec
lat
lon
un
cer
tim
e
de
pth
de
pth
co
de
mag
mag
sca
le
int
cod
e
mac
ro r
ef
are
a
reg
cod
e
PAN 1542 0 0 0 0 66.0 35.0 -? 15 4.4 M VI ? 150 U
PAN 1626 5 14 0 0 66.0 35.5 -C 35 5.1 M VI ? 350 U
REN 1626 6 22 0 0 64.5 27.0 -B 18 m 4.6 M VI 185 F
REN 1758 12 31 0 30 68.8 26.4 BC 31 m 4.7 M V 175 F
REN 1777 3 29 18 0 63.9 23.1 DB 19 m 4.0 M V 110 F
REN 1882 6 15 13 0 65.8 24.2 CB 20 m 4.6 M VI * MOB 200 F
REN 1882 6 23 6 0 65.6 24.5 CB 27 m 4.9 M VI * MOB 270 F
BAT 1931 11 16 0 20 49 62.5 25.8 AA 15 m 4.5 M VI * KAR 155 F
BAT 1931 11 16 19 30 62.5 25.8 BA 16 m 3.9 M V * KAR 90 F
BAT 1957 8 2 9 15 51 63.2 32.5 BA 0 0.0 0 U
PAN 1958 1 17 9 42 23 65.6 34.0 BB 0 0.0 0 U NOTE: Different parametric solutions are available for the earthquakes marked in blue. The earthquakes marked in red above have no magnitude in FENCAT, but Nikonov (2004, p. 212) lists them with magnitudes. Explanations of the columns can be found http://www.seismo.helsinki.fi/bulletin/list/catalog_format.html.
2.8.2 Seismic networks and changes in detection capability
The instrumental era began in the Fennoscandian Shield in 1904, when a long-period Wiechert
seismograph was installed in Uppsala, Sweden. A long-period Mainka seismograph was installed in
Helsinki, Finland in 1924. However, the related seismograms are of little practical value for the study
of local earthquakes. The first short-period seismographs were installed in the region in 1956, and all
earlier earthquake observations are defined as historical in this report. The time period between
1956 and 1970 can be called semi-instrumental, because the analysis of local earthquakes was not
yet fully based on instrumental data. The seismicity record available spans three centuries, about 250
years of which rely on non-instrumental historical data.
The Finnish (FNSN) and Swedish (SNSN) national seismic networks are nowadays the main
contributors of seismic observations in the study region (Fig. 2.8.2.1). Prior to 2000, SNSN operated
six permanent seismic stations in Sweden and the catalogue was complete for earthquakes down to
an approximate magnitude 2. The Swedish Defence Research Agency (FOI, previously FOA) has
operated a seismic array station at Hagfors since the early 1970s, as part of the Swedish contribution
to international nuclear test ban treaties. From 1980 onwards, FOA operated a number of seismic
stations first in southern and then northern Sweden, recording local earthquakes with magnitudes
down to zero. Operations were phased out during the early 1990s. Phase readings from the recorded

60
SNSN and FOA earthquakes were reported to FENCAT. A rapid expansion of the SNSN commenced in
2000 and, by the end of 2012, 60 additional permanent stations had been constructed and
instrumented.
All SNSN stations have broadband instruments with frequency bands of 120 s, 60 s and 30 s to 50 Hz
and, since 2008, all stations transmit continuous waveform data at 100 Hz sampling frequency to
Uppsala. Since August 2000, the automatic SIL system has been in operation in Uppsala (Böðvarsson
and Lund, 2003), providing detection and location capabilities that allow the SNSN to record
earthquakes of magnitudes down to -1. After analyst review and manual relocation, phase picks for
events that are large enough to be recorded outside of Sweden (~ML > 1 events) are supplied to
FENCAT. The SNSN is currently complete to approximately magnitude 0.3 within the network
(Böðvarsson et al., 2006). For the SNSN standard processing, the epicentral uncertainties are on the
order of 2 km (B. Lund, pers. comm., 2011).
A significant upgrade of FNSN occurred during the late 1970’s when digital tripartite arrays in
southern and central Finland became fully operational, allowing for systematic use of instrumental
detection, location and magnitude determination methods. Today, the FNSN consists of 26 on-line
stations (Fig. 2.8.2.1), 4 operated by the University of Oulu and 22 by the Institute of Seismology at
the University of Helsinki (ISUH). One of the stations is a small-aperture seismic array (FINES), others
have three-component broad-band seismographs. The latest extension comprised four stations
deployed around the planned Hanhikivi NPP in March-April 2013 (Appendix 1). All stations are
connected to the ISUH via Internet or satellite and provide continuous waveform data at 40 Hz
(array) or 100-250 Hz sampling frequency. In addition to the on-line stations, 4 three-component
short-period stations recording in an off-line mode provide supplementary data for FENCAT
processing. Three of the stations belong to a portable network that has been in operation in the
Kuusamo region since 2003.
Since 2007, the ISUH has had an in-house designed automatic seismic data processing system, which
utilizes the available on-line three-component and array stations in Finland and in the neighbouring
countries (Figure 4 in Tiira et al., 2011). After analyst review and manual relocation, phase picks for
local earthquakes are forwarded to final FENCAT processing.
The FNSN has relatively large inter-station distances, on average 90 km. For the FNSN standard
processing, the epicenter location uncertainty is estimated to be 2-5 km within the network (Korja et
al., 2011a). The instrumental earthquake catalogue has different levels of completeness. Tiira et al.
(2011) estimated the local earthquake catalogue in the area with a 50 km radius surrounding
Hanhikivi to be complete down to magnitude 1.5 from 1979 onwards. Today the automatic seismic
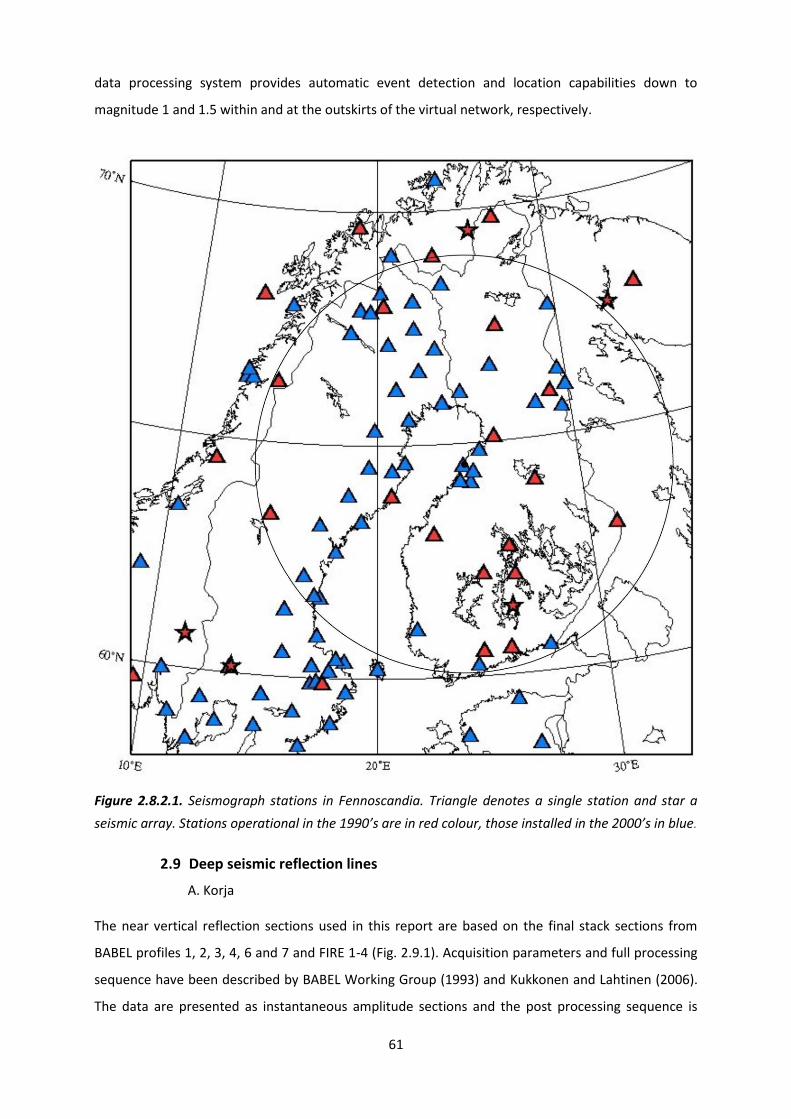
61
data processing system provides automatic event detection and location capabilities down to
magnitude 1 and 1.5 within and at the outskirts of the virtual network, respectively.
Figure 2.8.2.1. Seismograph stations in Fennoscandia. Triangle denotes a single station and star a
seismic array. Stations operational in the 1990’s are in red colour, those installed in the 2000’s in blue.
2.9 Deep seismic reflection lines
A. Korja The near vertical reflection sections used in this report are based on the final stack sections from
BABEL profiles 1, 2, 3, 4, 6 and 7 and FIRE 1-4 (Fig. 2.9.1). Acquisition parameters and full processing
sequence have been described by BABEL Working Group (1993) and Kukkonen and Lahtinen (2006).
The data are presented as instantaneous amplitude sections and the post processing sequence is
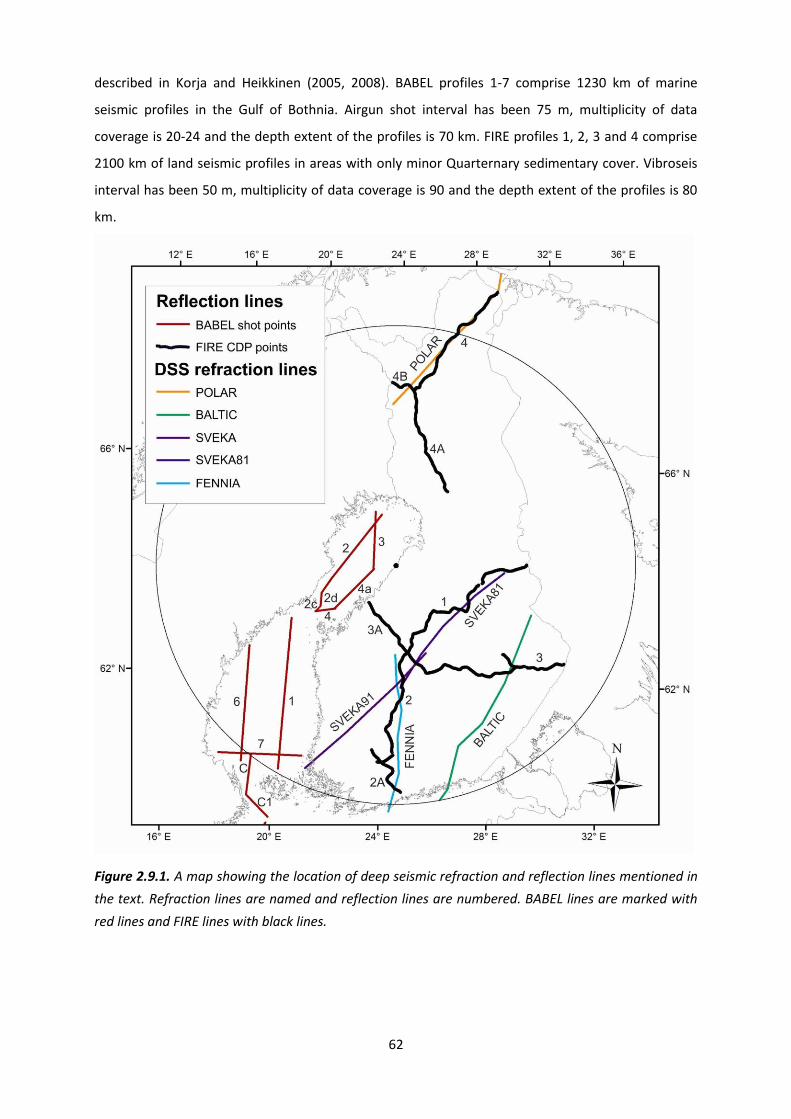
62
described in Korja and Heikkinen (2005, 2008). BABEL profiles 1-7 comprise 1230 km of marine
seismic profiles in the Gulf of Bothnia. Airgun shot interval has been 75 m, multiplicity of data
coverage is 20-24 and the depth extent of the profiles is 70 km. FIRE profiles 1, 2, 3 and 4 comprise
2100 km of land seismic profiles in areas with only minor Quarternary sedimentary cover. Vibroseis
interval has been 50 m, multiplicity of data coverage is 90 and the depth extent of the profiles is 80
km.
Figure 2.9.1. A map showing the location of deep seismic refraction and reflection lines mentioned in
the text. Refraction lines are named and reflection lines are numbered. BABEL lines are marked with
red lines and FIRE lines with black lines.

63
3 Geological framework
3.1 Paleotectonic evolution
3.1.1 Major lithotectonic units
M. Stephens, M. Nironen & A. Korja
The currently used nomenclature for the geological framework and paleotectonic evolution of the
bedrock in the northern part of Europe (Gaál and Gorbatshev, 1987) mixes together lithodemic (e.g.
Karelia Province, Svecofennian Domain, Transscandinavian Igneous Belt) and tectonic (e.g.
Svecofennian orogeny, Caledonides, Platform Cover) concepts. In order to avoid confusion in
conceptual understanding and to take account of currently ongoing developments on the structural
framework in the Fennoscandian Shield at the geological surveys in Finland and Sweden, an
alternative division of the bedrock into lithotectonic units is adopted here. The term “lithotectonic
unit” is defined in the international literature as "an assemblage of rocks that is unified on the basis
of structural or deformational features, mutual relations, origin, or historical evolution. It may be
igneous, sedimentary, or metamorphic" (Neuendorf et al., 2005).
Based on the bedrock national databases for Finland and Sweden (Korsman et al., 1997; Bergman et
al., 2012), the Fennoscandian Shield database (Koistinen et al., 2001) and recent broader syntheses
of the stratigraphy, structure and tectonic evolution of the geological framework (Hölttä et al., 2008;
Lahtinen et al., 2008; Bingen et al., 2008, Stephens and Wahlgren, 2008; Stephens and Weihed,
2013), we have divided the bedrock in the study area with 500 km radius around Hanhikivi into
thirteen lithotectonic units (Fig. 3.1.1.1). The majority of these units contain rocks with a distinct
tectonothermal history and are separated from each other by regional-scale, ductile and brittle
deformation zones or an angular unconformity.
The major part of the study area consists of seven lithotectonic units (Karelia, Inari, Central Finland,
Southern Finland, Ljusdal, Bothnia-Skellefteå, and Norrbotten; Fig. 3.1.1.1) that attained their current
architecture during orogenic activity at 2.0–1.8 Ga. The terms “Svecofennian orogeny” and
“Svecokarelian orogeny” are avoided due to the lack of agreement between geoscientists in Finland
and Sweden on the usage of these two terms. The units in the northeastern half of the study area
(Karelia, Inari and Norrbotten) contain Archean crust affected by Neoarchean orogeny and later
Paleoproterozoic extension at 2.5-2.0 Ga prior to orogenic reworking at 2.0–1.8 Ga (e.g. Gaál and
Gorbatschev, 1987; Lahtinen et al., 2005).
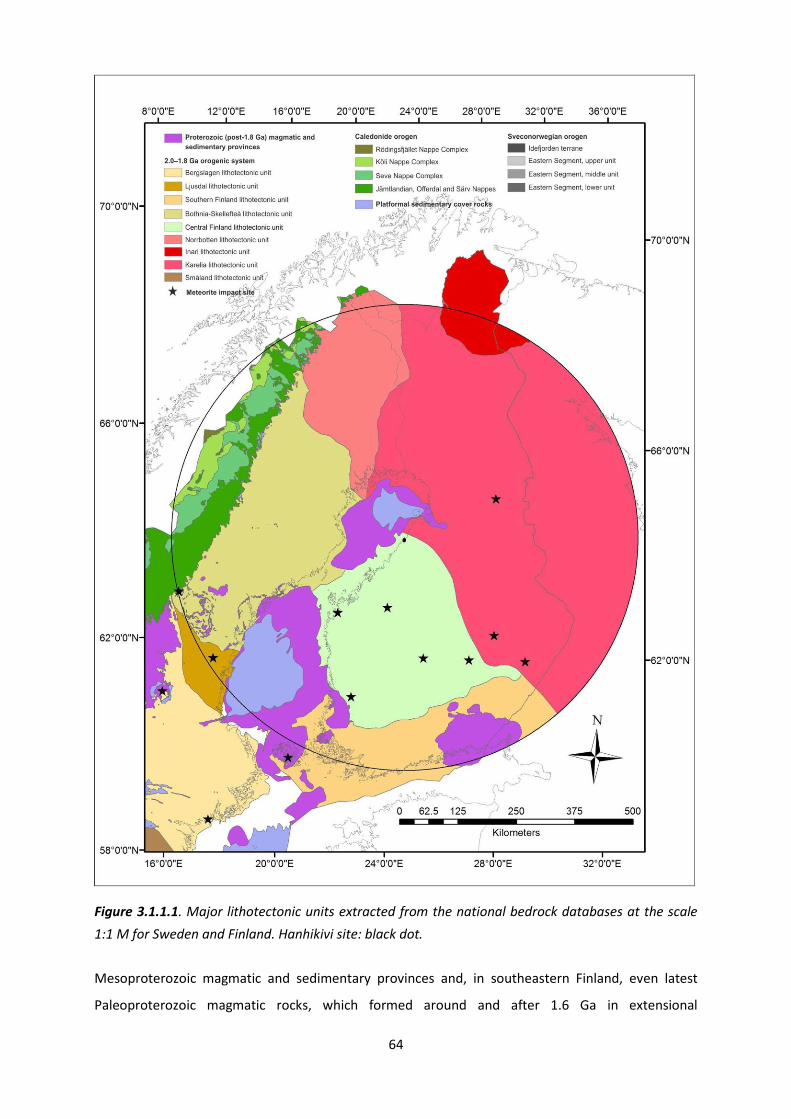
64
Figure 3.1.1.1. Major lithotectonic units extracted from the national bedrock databases at the scale
1:1 M for Sweden and Finland. Hanhikivi site: black dot.
Mesoproterozoic magmatic and sedimentary provinces and, in southeastern Finland, even latest
Paleoproterozoic magmatic rocks, which formed around and after 1.6 Ga in extensional
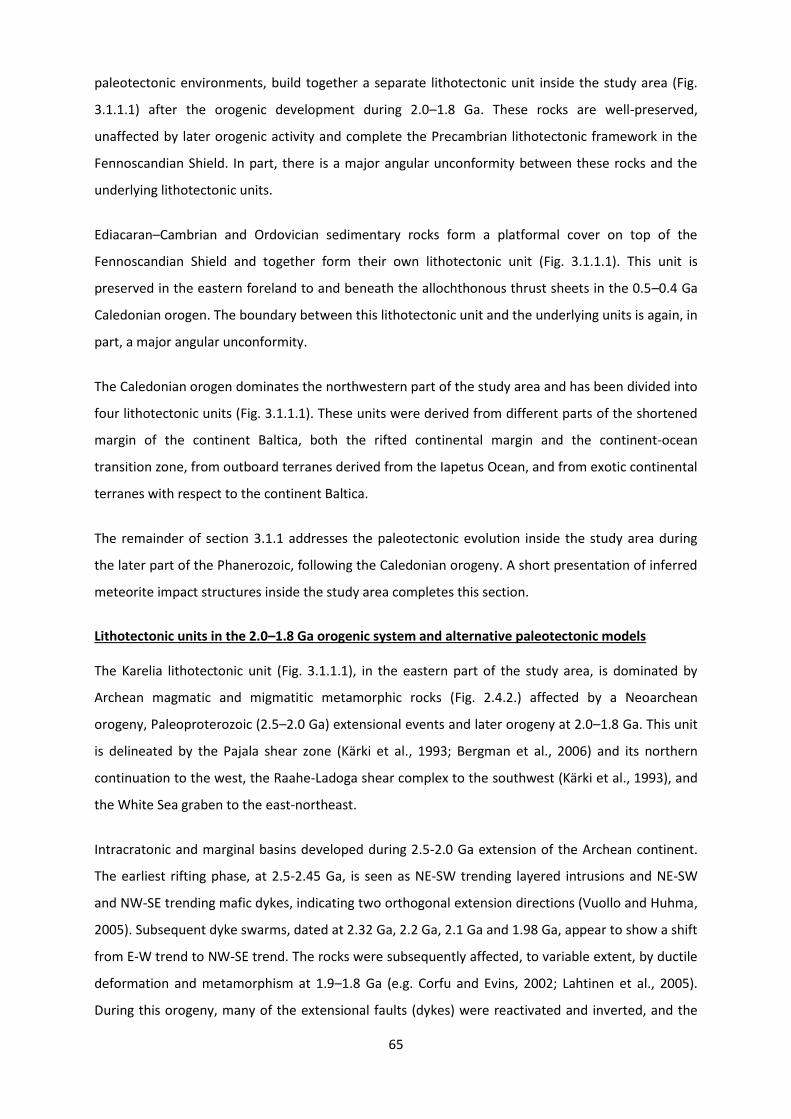
65
paleotectonic environments, build together a separate lithotectonic unit inside the study area (Fig.
3.1.1.1) after the orogenic development during 2.0–1.8 Ga. These rocks are well-preserved,
unaffected by later orogenic activity and complete the Precambrian lithotectonic framework in the
Fennoscandian Shield. In part, there is a major angular unconformity between these rocks and the
underlying lithotectonic units.
Ediacaran–Cambrian and Ordovician sedimentary rocks form a platformal cover on top of the
Fennoscandian Shield and together form their own lithotectonic unit (Fig. 3.1.1.1). This unit is
preserved in the eastern foreland to and beneath the allochthonous thrust sheets in the 0.5–0.4 Ga
Caledonian orogen. The boundary between this lithotectonic unit and the underlying units is again, in
part, a major angular unconformity.
The Caledonian orogen dominates the northwestern part of the study area and has been divided into
four lithotectonic units (Fig. 3.1.1.1). These units were derived from different parts of the shortened
margin of the continent Baltica, both the rifted continental margin and the continent-ocean
transition zone, from outboard terranes derived from the Iapetus Ocean, and from exotic continental
terranes with respect to the continent Baltica.
The remainder of section 3.1.1 addresses the paleotectonic evolution inside the study area during
the later part of the Phanerozoic, following the Caledonian orogeny. A short presentation of inferred
meteorite impact structures inside the study area completes this section.
Lithotectonic units in the 2.0–1.8 Ga orogenic system and alternative paleotectonic models
The Karelia lithotectonic unit (Fig. 3.1.1.1), in the eastern part of the study area, is dominated by
Archean magmatic and migmatitic metamorphic rocks (Fig. 2.4.2.) affected by a Neoarchean
orogeny, Paleoproterozoic (2.5–2.0 Ga) extensional events and later orogeny at 2.0–1.8 Ga. This unit
is delineated by the Pajala shear zone (Kärki et al., 1993; Bergman et al., 2006) and its northern
continuation to the west, the Raahe-Ladoga shear complex to the southwest (Kärki et al., 1993), and
the White Sea graben to the east-northeast.
Intracratonic and marginal basins developed during 2.5-2.0 Ga extension of the Archean continent.
The earliest rifting phase, at 2.5-2.45 Ga, is seen as NE-SW trending layered intrusions and NE-SW
and NW-SE trending mafic dykes, indicating two orthogonal extension directions (Vuollo and Huhma,
2005). Subsequent dyke swarms, dated at 2.32 Ga, 2.2 Ga, 2.1 Ga and 1.98 Ga, appear to show a shift
from E-W trend to NW-SE trend. The rocks were subsequently affected, to variable extent, by ductile
deformation and metamorphism at 1.9–1.8 Ga (e.g. Corfu and Evins, 2002; Lahtinen et al., 2005).
During this orogeny, many of the extensional faults (dykes) were reactivated and inverted, and the

66
western part of the Archean continent acted as basement to thin-skinned thrusting of ophiolite-
bearing allochthons (in the Finnish North Karelia and Kainuu-Kuusamo belts and the Central Lapland
greenstone belt) (Fig. 2.4.2; Koistinen, 1981; Hanski, 1997; Peltonen and Kontinen, 2004; Peltonen et
al., 2008; Patison et al., 2006; Korja et al., 2006a,b). These rocks were later intruded by granitoids
(Fig. 2.4.2). Tiira et al. (2014) described an inverted rift basin previously recognised by Patison et al.
(2006) below the thrust units of Central Lapland. The NW-SE directed sub-vertical transfer faults in
the paleo-rift system (NW-SE) appear to have survived several later tectonic events.
In the northernmost part of the study area, the Karelia lithotectonic unit is situated in the footwall to
a major thrust complex (Lapland granulite belt and Tanaelv sequence) containing 2.0–1.9 Ga
sedimentary and magmatic rocks (Daly et al., 2006; Patison et al., 2006). The latter were deformed
and metamorphosed under high-pressure granulite conditions around 1.9 Ga; orogenic activity with
ductile deformation, some magmatism and lower grade metamorphism continued until 1.8 Ga (Daly
et al., 2006; Tuisku and Huhma, 2006). These syn-orogenic rocks are included here in the Inari
lithotectonic unit (Fig. 3.1.1.1).
The bedrock in the western and central parts of the study area, west of the Pajala shear zone and
southwest of the Raahe-Ladoga shear complex, consist predominantly of 2.0–1.8 Ga old
metasedimentary and magmatic rocks, which are syn-orogenic with respect to the 2.0–1.8 Ga
orogenic event. Five lithotectonic units have been identified (Central Finland, Southern Finland,
Ljusdal, Bothnia-Skellefteå and Norrbotten; Fig. 3.1.1.1). A characteristic feature of all these units is
the presence of siliciclastic sedimentary rocks, predominantly deposited as turbidites, as well as
traces of magmatic provinces; the magmatic rocks span in age from 1.95–1.78 Ga. The Norrbotten
lithotectonic unit, in the northern part of the study area (Fig. 3.1.1.1), comprises both Archean (3.2–
2.6 Ga) magmatic rocks and Paleoproterozoic (2.5–2.0 Ga) sedimentary and mainly basic magmatic
rocks that are stratigraphically overlain or intruded by the 2.0–1.8 Ga syn-orogenic rocks. These rocks
resemble those in the western part of the Karelia lithotectonic unit but are separated from it by the
Pajala shear complex and its northerly extension (Lahtinen et al., 2005).
The rocks in these five lithotectonic units were affected by ductile deformation and metamorphism
under high temperature and low pressure conditions, in part reaching amphibolite to granulite facies
and, in several areas, including migmatization during the 2.0–1.8 Ga orogeny. The extent of these
secondary processes varies in space and time, and this variation is an important criterion for the
division into lithotectonic units.
Major crustal thickness variation across the Gulf of Bothnia (see section 5 and Grad et al. 2009) as
well as a difference in the age of plutonic activity in northern Sweden (large proportion of crust
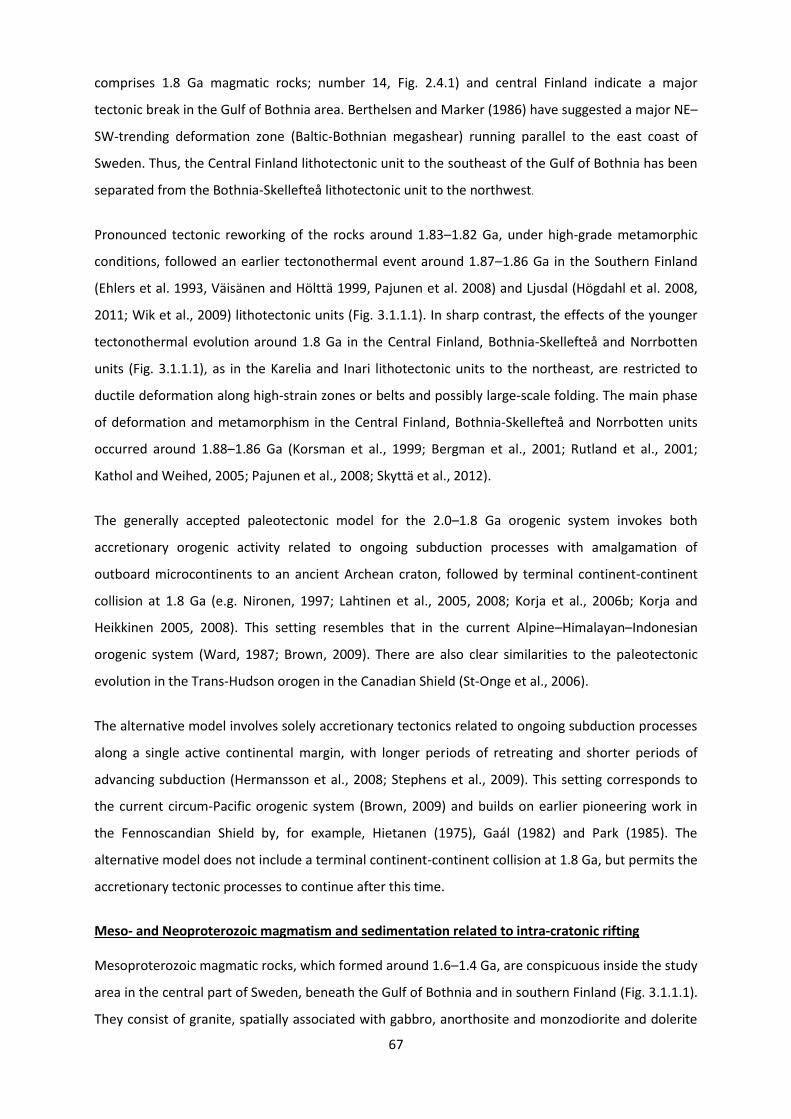
67
comprises 1.8 Ga magmatic rocks; number 14, Fig. 2.4.1) and central Finland indicate a major
tectonic break in the Gulf of Bothnia area. Berthelsen and Marker (1986) have suggested a major NE–
SW-trending deformation zone (Baltic-Bothnian megashear) running parallel to the east coast of
Sweden. Thus, the Central Finland lithotectonic unit to the southeast of the Gulf of Bothnia has been
separated from the Bothnia-Skellefteå lithotectonic unit to the northwest.
Pronounced tectonic reworking of the rocks around 1.83–1.82 Ga, under high-grade metamorphic
conditions, followed an earlier tectonothermal event around 1.87–1.86 Ga in the Southern Finland
(Ehlers et al. 1993, Väisänen and Hölttä 1999, Pajunen et al. 2008) and Ljusdal (Högdahl et al. 2008,
2011; Wik et al., 2009) lithotectonic units (Fig. 3.1.1.1). In sharp contrast, the effects of the younger
tectonothermal evolution around 1.8 Ga in the Central Finland, Bothnia-Skellefteå and Norrbotten
units (Fig. 3.1.1.1), as in the Karelia and Inari lithotectonic units to the northeast, are restricted to
ductile deformation along high-strain zones or belts and possibly large-scale folding. The main phase
of deformation and metamorphism in the Central Finland, Bothnia-Skellefteå and Norrbotten units
occurred around 1.88–1.86 Ga (Korsman et al., 1999; Bergman et al., 2001; Rutland et al., 2001;
Kathol and Weihed, 2005; Pajunen et al., 2008; Skyttä et al., 2012).
The generally accepted paleotectonic model for the 2.0–1.8 Ga orogenic system invokes both
accretionary orogenic activity related to ongoing subduction processes with amalgamation of
outboard microcontinents to an ancient Archean craton, followed by terminal continent-continent
collision at 1.8 Ga (e.g. Nironen, 1997; Lahtinen et al., 2005, 2008; Korja et al., 2006b; Korja and
Heikkinen 2005, 2008). This setting resembles that in the current Alpine–Himalayan–Indonesian
orogenic system (Ward, 1987; Brown, 2009). There are also clear similarities to the paleotectonic
evolution in the Trans-Hudson orogen in the Canadian Shield (St-Onge et al., 2006).
The alternative model involves solely accretionary tectonics related to ongoing subduction processes
along a single active continental margin, with longer periods of retreating and shorter periods of
advancing subduction (Hermansson et al., 2008; Stephens et al., 2009). This setting corresponds to
the current circum-Pacific orogenic system (Brown, 2009) and builds on earlier pioneering work in
the Fennoscandian Shield by, for example, Hietanen (1975), Gaál (1982) and Park (1985). The
alternative model does not include a terminal continent-continent collision at 1.8 Ga, but permits the
accretionary tectonic processes to continue after this time.
Meso- and Neoproterozoic magmatism and sedimentation related to intra-cratonic rifting
Mesoproterozoic magmatic rocks, which formed around 1.6–1.4 Ga, are conspicuous inside the study
area in the central part of Sweden, beneath the Gulf of Bothnia and in southern Finland (Fig. 3.1.1.1).
They consist of granite, spatially associated with gabbro, anorthosite and monzodiorite and dolerite
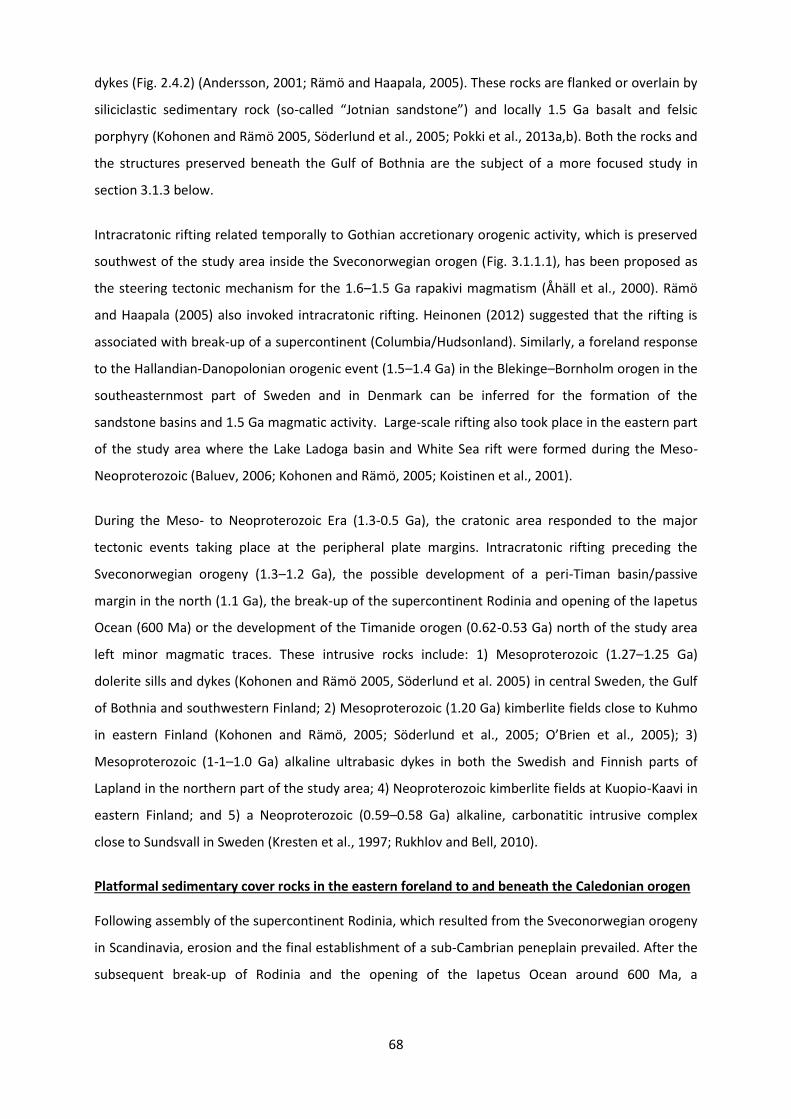
68
dykes (Fig. 2.4.2) (Andersson, 2001; Rämö and Haapala, 2005). These rocks are flanked or overlain by
siliciclastic sedimentary rock (so-called “Jotnian sandstone”) and locally 1.5 Ga basalt and felsic
porphyry (Kohonen and Rämö 2005, Söderlund et al., 2005; Pokki et al., 2013a,b). Both the rocks and
the structures preserved beneath the Gulf of Bothnia are the subject of a more focused study in
section 3.1.3 below.
Intracratonic rifting related temporally to Gothian accretionary orogenic activity, which is preserved
southwest of the study area inside the Sveconorwegian orogen (Fig. 3.1.1.1), has been proposed as
the steering tectonic mechanism for the 1.6–1.5 Ga rapakivi magmatism (Åhäll et al., 2000). Rämö
and Haapala (2005) also invoked intracratonic rifting. Heinonen (2012) suggested that the rifting is
associated with break-up of a supercontinent (Columbia/Hudsonland). Similarly, a foreland response
to the Hallandian-Danopolonian orogenic event (1.5–1.4 Ga) in the Blekinge–Bornholm orogen in the
southeasternmost part of Sweden and in Denmark can be inferred for the formation of the
sandstone basins and 1.5 Ga magmatic activity. Large-scale rifting also took place in the eastern part
of the study area where the Lake Ladoga basin and White Sea rift were formed during the Meso-
Neoproterozoic (Baluev, 2006; Kohonen and Rämö, 2005; Koistinen et al., 2001).
During the Meso- to Neoproterozoic Era (1.3-0.5 Ga), the cratonic area responded to the major
tectonic events taking place at the peripheral plate margins. Intracratonic rifting preceding the
Sveconorwegian orogeny (1.3–1.2 Ga), the possible development of a peri-Timan basin/passive
margin in the north (1.1 Ga), the break-up of the supercontinent Rodinia and opening of the Iapetus
Ocean (600 Ma) or the development of the Timanide orogen (0.62-0.53 Ga) north of the study area
left minor magmatic traces. These intrusive rocks include: 1) Mesoproterozoic (1.27–1.25 Ga)
dolerite sills and dykes (Kohonen and Rämö 2005, Söderlund et al. 2005) in central Sweden, the Gulf
of Bothnia and southwestern Finland; 2) Mesoproterozoic (1.20 Ga) kimberlite fields close to Kuhmo
in eastern Finland (Kohonen and Rämö, 2005; Söderlund et al., 2005; O’Brien et al., 2005); 3)
Mesoproterozoic (1-1–1.0 Ga) alkaline ultrabasic dykes in both the Swedish and Finnish parts of
Lapland in the northern part of the study area; 4) Neoproterozoic kimberlite fields at Kuopio-Kaavi in
eastern Finland; and 5) a Neoproterozoic (0.59–0.58 Ga) alkaline, carbonatitic intrusive complex
close to Sundsvall in Sweden (Kresten et al., 1997; Rukhlov and Bell, 2010).
Platformal sedimentary cover rocks in the eastern foreland to and beneath the Caledonian orogen
Following assembly of the supercontinent Rodinia, which resulted from the Sveconorwegian orogeny
in Scandinavia, erosion and the final establishment of a sub-Cambrian peneplain prevailed. After the
subsequent break-up of Rodinia and the opening of the Iapetus Ocean around 600 Ma, a

69
transgressive platformal sequence was deposited on top of the Precambrian crystalline rocks in the
Fennoscandian Shield.
Platformal Ediacaran–Cambrian sandstone and overlying Cambrian shale, including black oil shale,
are exposed inside the study area along the eastern erosional front of the Caledonian orogen (thin
strip in Fig. 3.1.1.1). Cambrian (and possibly Ediacaran) sandstone and Ordovician limestone and
shale are also preserved in the submarine area beneath the Gulf of Bothnia (Fig. 3.1.1.1). The
boundary between the lithotectonic units represented by the platformal sedimentary cover rocks
and the crystalline basement is a major angular unconformity along the Caledonian front, while both
faulted and primary unconformable contacts to the underlying crystalline basement are present in
the Gulf of Bothnia. More details on both the rocks and the structures preserved beneath the Gulf of
Bothnia are presented in section 3.1.3 below.
Tectonostratigraphic units in the 500–400 Ma Caledonian orogen and paleotectonic setting
The Caledonian orogen consists of allochthonous thrust sheets arranged in a systematic
tectonostratigraphic sequence (Kulling, 1972; Roberts and Gee, 1985) above autochthonous
platformal sedimentary cover rocks and older Proterozoic and Archean rocks belonging to the
Bothnia-Skellefteå and Norrbotten lithotectonic units (Fig. 3.1.1.1). Sedimentation and magmatic
activity that took place in connection with continental rifting are conspicuous in the structurally
lower thrust sheets (Jämtlandian, Offerdal and Särv Nappes, and Seve Nappe Complex; Fig. 3.1.1.1).
Rocks formed in connection with a glaciation at high southerly latitudes during the later part of the
Neoproterozoic, during ultimate continental break-up and formation of the Iapetus Ocean at 600 Ma
and along the subsequent passive margin development to the continent Baltica are also present in
these nappes. Subsequently, foreland basin sedimentation related to the initiation of convergence
and orogenesis took over during the Ordovician and Silurian and is well-preserved in the lowest
thrust sheets (Jämtlandian Nappes; Fig. 3.1.1.1).
Sedimentation and magmatic activity with an oceanic affinity, which occurred in connection with
destruction of the Iapetus Ocean during the late Cambrian to Silurian (510–430 Ma), are present in
the structurally higher thrust sheets (Köli Nappe Complex; Fig. 3.1.1.1); exotic terranes derived from
the continental margin of Laurentia are also preserved in the overlying Rödingsfjället Nappe Complex
(Fig. 3.1.1.1). A conspicuous feature of the higher thrust sheets is the occurrence of several
fragments of ophiolite derived from ancient oceanic back-arc basins.
Ductile deformation and metamorphism during the Caledonian orogeny was related to continent-arc
collisions and ultimately a terminal collision between the Baltica and Laurentia during the latest
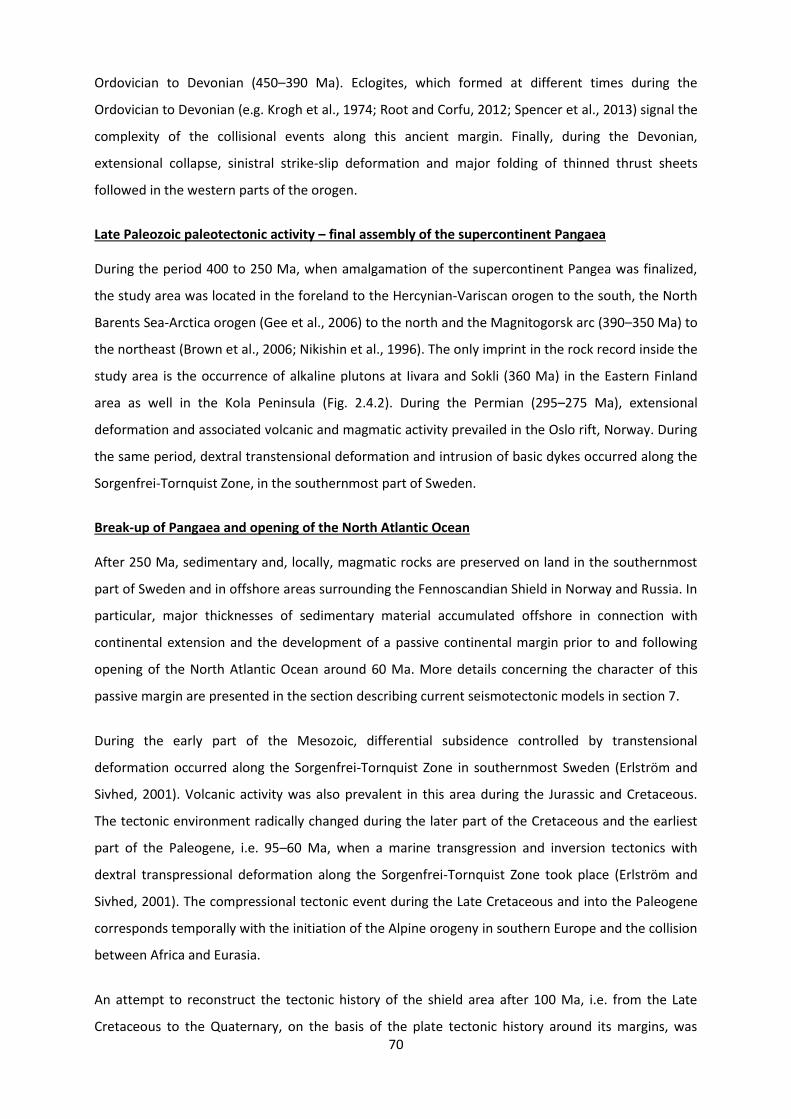
70
Ordovician to Devonian (450–390 Ma). Eclogites, which formed at different times during the
Ordovician to Devonian (e.g. Krogh et al., 1974; Root and Corfu, 2012; Spencer et al., 2013) signal the
complexity of the collisional events along this ancient margin. Finally, during the Devonian,
extensional collapse, sinistral strike-slip deformation and major folding of thinned thrust sheets
followed in the western parts of the orogen.
Late Paleozoic paleotectonic activity – final assembly of the supercontinent Pangaea
During the period 400 to 250 Ma, when amalgamation of the supercontinent Pangea was finalized,
the study area was located in the foreland to the Hercynian-Variscan orogen to the south, the North
Barents Sea-Arctica orogen (Gee et al., 2006) to the north and the Magnitogorsk arc (390–350 Ma) to
the northeast (Brown et al., 2006; Nikishin et al., 1996). The only imprint in the rock record inside the
study area is the occurrence of alkaline plutons at Iivara and Sokli (360 Ma) in the Eastern Finland
area as well in the Kola Peninsula (Fig. 2.4.2). During the Permian (295–275 Ma), extensional
deformation and associated volcanic and magmatic activity prevailed in the Oslo rift, Norway. During
the same period, dextral transtensional deformation and intrusion of basic dykes occurred along the
Sorgenfrei-Tornquist Zone, in the southernmost part of Sweden.
Break-up of Pangaea and opening of the North Atlantic Ocean
After 250 Ma, sedimentary and, locally, magmatic rocks are preserved on land in the southernmost
part of Sweden and in offshore areas surrounding the Fennoscandian Shield in Norway and Russia. In
particular, major thicknesses of sedimentary material accumulated offshore in connection with
continental extension and the development of a passive continental margin prior to and following
opening of the North Atlantic Ocean around 60 Ma. More details concerning the character of this
passive margin are presented in the section describing current seismotectonic models in section 7.
During the early part of the Mesozoic, differential subsidence controlled by transtensional
deformation occurred along the Sorgenfrei-Tornquist Zone in southernmost Sweden (Erlström and
Sivhed, 2001). Volcanic activity was also prevalent in this area during the Jurassic and Cretaceous.
The tectonic environment radically changed during the later part of the Cretaceous and the earliest
part of the Paleogene, i.e. 95–60 Ma, when a marine transgression and inversion tectonics with
dextral transpressional deformation along the Sorgenfrei-Tornquist Zone took place (Erlström and
Sivhed, 2001). The compressional tectonic event during the Late Cretaceous and into the Paleogene
corresponds temporally with the initiation of the Alpine orogeny in southern Europe and the collision
between Africa and Eurasia.
An attempt to reconstruct the tectonic history of the shield area after 100 Ma, i.e. from the Late
Cretaceous to the Quaternary, on the basis of the plate tectonic history around its margins, was

71
presented by Muir Wood (1995). From 60 Ma and onwards, the North Atlantic Ocean started to open
and to spread. During this time, plate motions associated with spreading of the North Atlantic Ocean
have dominated the geodynamics of northern Europe. After approximately 12 Ma, during the
Neogene period, a maximum principal stress in a WNW–ESE or NW–SE horizontal direction, steered
by ridge push from the mid-Atlantic ridge and, as a consequence, the relative plate motion between
the Eurasian and American plates, has prevailed in northern Europe (Muir Wood, 1995). More details
concerning the current stress field and surface strain are presented in section 5.
Meteorite impact structures
Several meteorite impact structures have been identified in the Fennoscandian Shield and its
sedimentary overburden (Wickman, 1988; Henkel and Pesonen, 1992; see Fig. 3.1.1.1). Inside the
study area in Sweden, impact structures that occurred during the Ordovician and Cretaceous periods
have been recognised at Lockne near to Östersund (Lindström et al., 2008) and at Dellen close to
Hudiksvall (Deutsch et al., 1992; Wik et al., 2009), respectively; impact melt is preserved at Dellen.
The Cretaceous (77 Ma) Lappajärvi meteorite crater in Ostrobothnia, with a diameter of c. 15 km, is
the largest reliably documented impact structure in Finland (Lehtinen, 1976; Reimold, 1982). Impact
melt and breccia are preserved at Lappajärvi. Other inferred impact structures (Sääksjärvi, Iso-
Naakkima, Saarijärvi, Söderfjärden, Lumparn) are small and their ages are unknown (Dypvik et al.,
2008).
3.1.2 Ductile shear zones, faults and lineaments
M. Nironen, A. Korja & M. Stephens
Ductile to brittle transition, timing of cratonization and the evolution of fault systems
The interpretation of predominantly airborne geophysical (magnetic, gravity and electromagnetic)
and digital topographic data in combination with geological field data have been the primary sources
of information for the identification of deformation zones in the bedrock (Fig. 3.1.2.1). In Finland, the
voluminous data along the FIRE reflection seismic profiles (Kukkonen and Lahtinen, 2006) have
provided a valuable addition to the identification of deformation zones. By contrast, geological field
data, addressing stratigraphic, structural and metamorphic relationships between rock units, in
combination with reflection seismic data along a few profiles in central Sweden have been the
primary sources of information in the Caledonian orogen, in the westernmost part of the study area.
The paleotectonic evolution in the Karelia and Norrbotten lithotectonic units suggests crustal
stabilization following orogeny during the later part of the Neoarchean. However, together with
younger (2.5–2.0 Ga), mainly sedimentary and volcanic rocks formed in connection with extensional

72
deformation, this ancient continental nucleus was tectonically reworked, to variable extent, during
the later orogenic activity at 2.0–1.8 Ga. Final establishment of a cratonic condition could not have
taken place until after 1.8 Ga in a larger part of these two units.
K-Ar isotope data from the Central Finland lithotectonic unit indicate that at 1.85 Ga the rocks
presently at the erosion surface had cooled beneath 500 °C deep in the crust, under ductile
deformation conditions. As the result of exhumation these rocks had been uplifted to higher crustal
levels with temperatures below 300 °C and brittle deformation regime by 1.78 Ga (Haudenschild,
1995). On the basis of 40Ar-39Ar data immediately south of the Ljusdal lithotectonic unit (Bergslagen
unit) and inside the Southern Finland unit, a brittle regime was established between 1.8 and 1.7 Ga
(Söderlund et al., 2009) or after 1.8 Ga (Torvela et al., 2008), respectively.
There are very few studies of the evolution of the character, kinematics and timing of deformation in
the brittle tectonic regime inside the Fennoscandian Shield, including the study area. Most attention
has been on the early ductile deformation. The determination of paleostress fields in combination
with low-temperature geochronology work at Forsmark (Stephens and Wahlgren, 2008; Sandström
et al., 2009; Saintot et al., 2011) and Oskarshamn (Stephens and Wahlgren, 2008; Drake et al., 2009;
Viola et al., 2009) in southeastern Sweden, south of the study area, has demonstrated the
reactivation of pre-existing ductile deformation zones or the formation of new zones in the brittle
deformation regime during 1.5–1.4 Ga (Hallandian-Danopolonian), 1.1 Ga (Sveconorwegian), 0.4 Ga
(Caledonian) and even Permian far-field tectonic events (see section 3.1.1). The brittle
Sveconorwegian event at Forsmark, for example, caused a marked inversion of the kinematics along
structures with WNW–ESE or NW–SE strike compared to the ductile strain around 1.8 Ga (Saintot et
al., 2011). Similarly, K-Ar dating of illite at Olkiluoto in southwestern Finland revealed brittle
deformation related to Sveconorwegian inferred build-up (1.1–1.0 Ga) and collapse (1.0–0.9 Ga;
Viola et al., 2013).
Bearing in mind the poor understanding of the brittle deformational history inside especially the
Fennoscandian Shield, the focus in the text below on the major deformation zones is directed to the
ductile strain close to the time of their formation. However, since stratigraphic time markers are
available in the Gulf of Bothnia, which provide a broader insight into the significance of faulting in
this part of the study area from the Mesoproterozoic until after the Ordovician, attention on the
faults affecting the rocks preserved in the Gulf of Bothnia is placed in a separate section (3.1.3).

73
Karelia and Inari lithotectonic units in the 2.0–1.8 Ga orogenic system
As indicated in section 3.1, NE-SW and NW-SE trending mafic dykes were reactivated during the 2.0–
1.8 Ga orogeny. Thrusting towards the northeast is seen in the Finnish North Karelia belt (Fig. 2.4.2;
e.g. Koistinen, 1981; Ward, 1987; Kohonen, 1995), and towards the east in the Kainuu-Kuusamo belt
(Fig. 2.4.2; Tuisku and Laajoki, 1990). During subsequent transpression deformation partitioned into
shear zones between rigid Archean blocks. The northern part of the Kainuu-Kuusamo belt developed
into the N-S trending dextral, ductile, subvertical Hirvaskoski shear zone (Fig. 3.1.2.1; Kärki et al.,
1993). The NE-SW trending, sinistral, subvertical Oulunjärvi shear zone deforms the Hirvaskoski shear
zone. The Auho fault at the northwestern margin of the Oulunjärvi shear zone is a semi-brittle
structure that extends further northeast and, together with other faults in Russia, forms a NNE-SSW
trending fault set, here called the Auho-Kandalaksha fault zone. The Auho-Kandalaksha fault zone
(Fig. 3.1.2.1) consists of several parallel faults extending from central Finland up to the Kandalaksha
Gulf in northwestern Russia (Elo, 1991a). Magnetic and gravity data suggest sinistral movement or
shear and steep dips for the faults (Elo, 1991b).

74
Figure 3.1.2.1. Major Paleoproterozoic deformation zones extracted from the national bedrock
databases at the scale 1:1 M for Sweden and Finland and modified slightly in the context of this study
(see section 2.5). Zones or complexes of zones showing ductile shear deformation with or without
brittle deformation are shown in blue colour, brittle deformation zones (fault zones) are shown in pink
colour. 1- Sottunga-Jurmo shear zone; 2- Kynsikangas shear zone; 3- Kuortti shear zone; 4- Malax
shear zone; 5- Hassela shear zone; 6- Burträsk shear zone; 7- Raahe-Ladoga shear complex; 8-
Oulunjärvi shear zone; 9- Hirvaskoski shear zone; 10- Pajala shear zone; 11- Venejoki shear zone; 12-
Vuotso shear zone; 13- Auho-Kandalaksha fault zone; 14- Muhos fault zone; 15- Western Lapland
fault system; 16 -Karesuando–Arjeplog deformation zone; 17- Kiruna–Naimakka deformation zone.
Ductile deformation zones with E-W strike dominate in the Peräpohja belt (Figs. 2.4.2 and 3.1.2.1;
e.g. Laajoki, 2005). FIRE 4 seismic data suggest that only minor shortening occurred in this belt after
initial basin development (Patison et al., 2006). The central Lapland part of the Karelia lithotectonic
unit may be divided structurally into three parts. In the western part (in the Kittilä greenstone), a set
75
of east-bending convex shear zones have been interpreted as thrusts with displacement towards the
east—northeast (Lehtonen et al., 1998; Hölttä et al., 2007). In the northern part, another set of
roughly N-S trending shear zones have been interpreted as thrusts with displacement towards the
west–southwest (Hölttä et al., 2007). The variable tectonic movement directions may be partly
explained by later folding of the thrusts. In the eastern part, sub-horizontal thrusts, with
displacement towards the south, were inferred by Evins and Laajoki (2002). They associated this
thrust nappe tectonics to the composite (Archean-Proterozoic) Lapland-Kola orogen (including the
Inari lithotectonic unit) with Archean continental crust (the Karelia lithotectonic unit). The dominant
thrust system inside the Inari lithotectonic unit, with thrusting towards the southwest, is the result of
the same collision between 1.93 and 1.91 Ga (Gaál et al., 1989; Daly et al., 2006). The thrust system
continues into a shear zone, named here as the Vuotso shear zone (Fig. 3.1.2.1), flanking the
southern margin of the Inari lithotectonic unit.
The boundary between central and southern Lapland is marked by the crustal scale deformation
zone referred to as the Venejoki shear zone (Patison et al., 2006), curving around the Central Lapland
granitoid complex (Figs. 2.4.2 and 3.1.2.1). South of this zone, the deformation zones are either NW-
SE or NE-SW trending brittle-ductile faults (Airo, 1999), which are still active in southern Lapland
(Uski et al., 2003). Tiira et al. (2013) suggested that the shear zones originated during the 2.5-2.4 Ga
rifting event.
Ductile and brittle deformation zones with N–S, NE–SW and NNW–SSE trends comprise the complex
deformation belt referred to as the Pajala shear zone (Kärki et al., 1993; Bergman et al., 2001, 2006),
the western border of which defines the boundary between the Norrbotten (to the west) and Karelia
(to the east) lithotectonic units (Figs. 3.1.1.1 and 3.1.2.1). Bergman et al. (2006) suggested a
polyphase tectonothermal evolution in two lithotectonic units during the time span 1.86–1.74 Ga
with different histories on both sides of the Pajala shear zone. Wikström et al. (1996) also suggested
that ductile deformation along the Pajala shear zone took place earlier around 1.88 Ga. At least parts
of the Pajala shear zone with N–S strike show an east-side-up and sinistral displacement during its
development (Wikström et al., 1996; Bergman et al., 2001). The eastern border of the Pajala shear
zone more or less follows the Swedish national boundary. In the north, the shear zone diminishes
into a single shear zone that continues northwards into Norway; the sense of shear in that part is
unknown.
Ductile and brittle deformation zones with N–S strike, which belong to the southernmost extension
of the Pajala shear zone (Fig. 3.1.2.1), terminate southwards against a deformation zone with NW–SE
strike. This zone corresponds to a fault that disturbs the sedimentary cover in the Bay of Bothnian
(see section 3.1.3 and Fig. 3.1.2.1) but it also lies close to or along the blind surface separating the
76
Norrbotten and Karelia lithotectonic units to the north and the Bothnia-Skellefteå and Central
Finland lithotectonic units to the south (Figs. 3.1.1.1 and 3.1.2.1; Öhlander et al., 1993; Mellqvist et
al., 1999). This zone continues to the southeast in Finland as part of the Raahe-Ladoga shear
complex.
A set of NW-SE striking faults extend from the Norrbotten lithotectonic unit through the Pajala shear
zone to the Karelia lithotectonic unit. The faults overprint the N-S shear zones in the Pajala shear
zone, and offset NE-SW striking lithologies in the Karelia lithotectonic unit. They are narrow and
probably semi-brittle but the sense of movement in these faults is unknown. Here these faults are
collectively named as the Western Lapland fault system (Fig. 3.1.2.1). Faults with similar NW–SE
strike extend to the Bay of Bothnia; these have been related to the development of the Muhos Basin
on the mainland of Finland, containing Mesoproterozoic and Neoproterozoic rocks (Wannäs, 1989;
Winterhalter, 2000). Wannäs (1989) called the NW-SE striking lineament system Senja-Oulujoki
Tectonic Zone, but since the Muhos basin is slightly more to the north, we have named the zone in
Figure 3.1.2.1 as Muhos fault zone.
Lithotectonic units in the 2.0–1.8 Ga orogenic system west of the Gulf of Bothnia
Steeply dipping deformation zones with WNW–ESE to NW–SE or N–S to NNW–SSE strike dominate
inside the Ljusdal lithotectonic unit and the major part of the Bothnia-Skellefteå lithotectonic unit
(Fig. 3.1.2.1), south of and including the Skellefte mining district (Fig. 2.4.2). A few detailed studies
are available that have addressed the character, kinematics and timing of deformation along the
deformation zones inside or close to this part of the study area.
Ductile shear displacement with a significant dextral strike-slip component of movement occurred
around 1.87–1.86 Ga and later around 1.82–1.81 Ga along the zones or broader shear belts with
WNW–ESE to NW–SE strike close to the southwestern border of the study area (Högdahl and
Sjöström, 2001; Högdahl et al., 2009). One of these zones, the Hassela Shear Zone (HSZ; Fig. 3.1.2.1;
Högdahl and Sjöström, 2001), marks the boundary between the Ljusdal and Bothnia-Skellefteå
lithotectonic units. A complex interplay between steeply dipping ductile and brittle shear zones with
WNW–ESE (or E–W) and ENE–WSW strike, the latter showing a sinistral strike-slip component of
shear in an apparent conjugate relationship, are present along and in the vicinity of the Hassela
Shear Zone.
In the northern part of the Bothnia-Skellefteå lithotectonic unit, the most conspicuous structural
feature is the Burträsk shear zone, composed of zones with ENE-WSW to NE-SW strike (Figs. 2.4.2
and 3.1.2.1). This shear zone also shows a dextral strike-slip component of displacement and was
active in the ductile regime at least around 1.82 Ga (Romer and Nisca, 1995; Weihed et al., 2002).
77
Some modification in the bulk shortening direction along the orogenic belt is apparent (e.g. HSZ; Fig.
3.1.2.1). Inversion tectonics with transpressive deformation at 1.88–1.86 Ga, following normal
faulting, has been inferred along steeply dipping zones with WNW–ESE strike in the Skellefte mining
district (Bauer et al., 2011; Skyttä et al., 2012).
North of the Skellefte mining district, in the northernmost of the Bothnia-Skellefteå lithotectonic unit
and in the Norrbotten unit, the structural pattern for the regionally significant deformation zones
changes radically; steeply dipping zones with NNE–SSW to NE–SW strike, NW–SE strike or N–S to
NNW–SSE strike dominate (Fig. 3.1.2.1). Information in the structural map database (Figure 3.1.2.1)
and in Bergman et al. (2001) indicates that deformation zones trending NNE–SSW to NE–SW (e.g.
Kiruna–Naimakka and Karesuando–Arjeplog deformation zones) show a west-side-up, apparently
reverse sense of displacement, while a zone with NW–SE strike further south shows a southwest-
side-up, again apparently reverse sense of displacement. These structures were active in the ductile
regime at least until 1.8 Ga. The sense of movement along these structures appears to be opposite to
that observed along the regionally significant Pajala shear zone to the east, along the boundary to
the Karelia lithotectonic unit, and along two steeply dipping zones with N–S to NNW–SSE strike
situated between the Karesuando–Arjeplog and Pajala deformation zones (Fig. 3.1.2.1).
Lithotectonic units in the 2.0–1.8 Ga orogenic system east of the Gulf of Bothnia
Within the Central Finland lithotectonic unit (Fig. 3.1.1.1), ductile high strain structures curve around
an igneous complex referred to as the Central Finland granitoid complex (Fig. 2.4.2). The complex is
bounded by a major NW-SE trending structure, the Raahe-Ladoga shear complex (Korsman and
Glebovitsky, 1999) in the northeast, the WNW-ESE trending Malax shear zone in the west, the NW-
SE trending Kynsikangas shear zone (Pajunen et al., 2008) in the southwest, and the Kuortti shear
zone in the south/southeast (Fig. 3.1.2.1).
Within the granitoid complex, the lineaments are trending NW-SE, NE-SW as well as N-S and E-W.
The NE-SW and E-W trending lineaments are imaged by shallow dipping listric reflections whereas
the NE-SW and N-S trending lineaments are imaged by subvertical reflections on FIRE1 and FIRE3
lines (Korja et al., 2009). Nironen et al. (2000) have interpreted the NW-SE-lineaments to be shear
zones with a dextral strike-slip sense of movement that developed in a transtensional tectonic
environment at 1.88–1.87 Ga. Korja et al (2009) suggested that the most of the shear zones were at
least reactivated during a lateral spreading event at 1.88 Ga.
The Raahe-Ladoga shear complex (Fig. 3.1.2.1) is a major NW-SE trending crustal feature separating
the Karelia lithotectonic unit to the northeast, containing an Archean crustal basement beneath
Paleoproterozoic rocks, and the Central Finland lithotectonic unit to the southwest apparently

78
lacking an Archean crustal component. The boundaries of this shear complex are difficult to delineate
exactly; it is at least 350 km long with a maximum width of about 100 km (Korsman and Glebovitsky,
1999; Kärki et al., 2012). It is characterized by linear Bouguer gravity minima (Figs. 2.1.7 and 2.1.9;
see Korsman et al., 1999). The shear complex consists of ductile shear zones in varying directions,
overprinted by semi-brittle and brittle faults (Pajunen 1986, Kärki et al. 1993, Kärki and Laajoki 1995;
Korsman and Glebovitsky, 1999). On the basis of SVEKA deep seismic sounding profile (Fig. 2.9.1)
Luosto et al. (1984) and Korsman et al. (1999) suggested that shear zones within the central part of
the complex are sub-vertical and extend to the base of the crust. The reflection seismic FIRE 1 and
FIRE3 profiles transect a NNW–SSE trending shear complex and they image a set of steeply west-
dipping structures (Korja et al., 2006a; Sorjonen–Ward, 2006; Korja and Heikkinen, 2008). The shear
zones can be followed from the surface to at least the middle crust.
The sense of horizontal movement and magnitude of displacement along the length of the Raahe-
Ladoga shear complex are not fully known. Both dextral (Halden, 1982) and sinistral (Gaál, 1980)
horizontal shearing have been suggested along relatively late shear zones. Pajunen (1986) studied a
30 km by 30 km area in the central part of the shear complex and detected a sequence of
deformation with dextral strike-slip movement along a vertical shear zone with NW–SE strike,
overprinted by a vertical, sinistral ductile shear zone with NNW–SSE strike that is deformed by
dextral semi-brittle faults with N-S strike. Dextral shearing has been proposed for two shear zones in
the northwestern part of the shear complex (Weihed and Mäki, 1997). Vertical movements also
occurred during development of the shear complex (Korsman et al., 1984; Korsman and Glebovitsky,
1999).
Ductile shearing in the central part of the Raahe-Ladoga shear complex initiated at 1.885 Ga (Vaasjoki
and Sakko, 1988; Korsman et al., 1999) and ductile deformation was associated with mafic to felsic
magmatism from 1.885 Ga to at least 1.87 Ga. Evidence for late brittle deformation (temperatures
around 300°C) and development of a metamorphic block structure at 1.78–1.6 Ga is provided by K-Ar
ages (Haudenschild, 1988, 1995), and the apatite fission-track method yielded even lower ages of
0.9–0.7 Ga (Lehtovaara, 1976).
In summary, the sequence of deformation in the Central Finland lithotectonic unit can be divided
into three phases: 1) Contraction associated with accretion initiated before 1.90 Ga, leading to
compressional deformation along the western margin of the Karelia lithotectonic unit; 2)
transpressional deformation during continued contraction, leading to mainly dextral shearing and the
initial development of the Raahe-Ladoga shear complex at 1.885 Ga; 3) transtensional deformation at
around 1.88 Ga, leading to lateral spreading in the Central Finland granitoid complex, development

79
of a metamorphic block structure and reactivation or development of shear zones with varying
senses of movement.
The structural pattern in the Southern Finland lithotectonic unit differs from that in the Central
Finland lithotectonic unit (Fig. 3.1.2.1). The intersection of E–W- and WNW–ESE-trending shear zones
in the Southern Finland unit gives rise to a lozenge-shaped pattern on the exposure level (Fig.
3.1.2.1). The E–W-trending zones probably have both vertical and horizontal movement components
whereas at least some NNE–SSW-trending zones are normal faults (Nironen et al., 2006; Väisänen
and Skyttä, 2007). The structural pattern developed at 1.84–1.83 Ga and controlled the emplacement
of the 1.84–1.81 granites that occur as rather thin sheets in the Southern Finland lithotectonic unit
(Ehlers et al., 1993). The deformational history in this unit at 1.84–1.80 Ga was complicated and
involved bulk shortening in varying directions (Pajunen et al., 2008; Skyttä and Mänttäri, 2008). A
shear zone network with roughly E–W and NNE–SSW strikes developed after 1.81 Ga (Väisänen and
Skyttä, 2007). The shear zones with E–W strike show both vertical and horizontal movement
components whereas at least some of the zones with NNE–SSW strike are normal faults (Nironen et
al., 2006; Väisänen and Skyttä, 2007). Torvela et al. (2013) suggested that the crustal architecture is
characterised by an extensional shear fabric observable in the reprocessed seismic sections of
FIRE2a.
Three shear zones extend from southern Finland westward to the Gulf of Bothnia (Fig. 3.1.2.1). In the
northernmost of these, the WNW-ESE trending Malax shear zone, the sense of shear is unknown. The
zone follows the strike of a peculiar rock association (Vittinki mafic volcanic rocks and chert) that may
define an important tectonic boundary. Further south there is the NW-SE trending Kynsikangas shear
zone, with inferred kinematic history as sinistral horizontal movement followed by normal faulting
(Pietikäinen, 1994). The shear zone developed at 1.87 Ga and was reactivated repeatedly afterwards
(Pajunen et al., 2008). The southernmost shear zone, referred to as the Sottunga-Jurmo shear zone
(Torvela and Ehlers, 2010), shows dextral transpressional deformation that can be followed more
than 150 km. To the northwest in the Gulf of Bothnia, this zone is transected by the Åland rapakivi
granite and covered by Paleozoic sedimentary rocks. In the Sottunga-Jurmo shear zone three ductile
deformation events, from 1.85 Ga to 1.79 Ga, were followed by semi-brittle deformation (mylonite
zones) and brittle deformation (pseudotachylites), the latter bracketed between 1.78 Ga and 1.58 Ga
(Torvela et al., 2008).
Caledonian orogen
The Caledonian orogen is dominated by thrusts with top-to-the-southeast displacement (Kulling,
1972; Roberts and Gee, 1985). These structures were active in the ductile and ductile–brittle regimes

80
mainly during the Silurian, in connection with the terminal collision of the continents Laurentia and
Baltica (Gee, 1975; Stephens, 1988; Gee et al., 2010). Some thrust zones, not least those lying
internally within the Seve Nappe Complex and Offerdal Nappe, may have been active earlier during
the Ordovician, in connection with the accretionary tectonic phase and continent-arc collision
(Stephens, 1988).
The thrusts form the boundaries to allochthonous slices of bedrock and the basal thrust forms a
detachment in Cambrian black oil shale, placing the allochthonous units on top of autochthonous
platformal cover rocks and underlying Precambrian crystalline rocks (Fig. 3.1.2.2). The presence of
transported slabs of Proterozoic basement inside the allochthonous sheets indicates the thick-
skinned stacking.
Figure 3.1.2.2. A cross-section through the central part of the Caledonian orogen in Scandinavia
showing the gently dipping tectonostratigraphic framework of this orogen (modified after Gee et al.,
2010). The Offerdal Nappe corresponds to the unit labelled “Mylonitic granite and feldspathic
sandstone” and the Jämtlandian Nappes consist of allochthonous Baltoscandian sedimentary cover
and basement in the Lower Allochthon.
The thrusts dip gently, generally westwards (Figs. 3.1.2.1 and 3.1.2.2), but the area is also affected by
later, upright folding with axial surface traces parallel to the orogen. These folds rotate the thrust
contacts and, thereby, give rise to dips of thrusts to the east and an apparent normal sense of
movement. However, the contact between the Seve Nappe Complex, derived from the rifted outer
continental margin of Baltica, and the Köli Nappe Complex with its oceanic affinities shows evidence
for normal top-to-the-northwest displacement (Trouw, 1986; Greiling et al., 1998) after
amalgamation of these two complexes.
81
3.1.3 Faults affecting sedimentary cover rocks in the Gulf of Bothnia
K. Högdahl & M. Stephens
Lithological and structural framework
The submarine area in the Gulf of Bothnia is underlain by sedimentary cover rocks that lie
stratigraphically on top of older Proterozoic crystalline basement (Fig. 3.1.3.1). The bathymetric and
topographic high in the Norra Kvarken area separates two fault-controlled sub-basins in the Bothnian
Sea to the south and the Bay of Bothnia to the north (Fig. 3.1.3.1).
In the Bothnian Sea, Mesoproterozoic sandstone (Jotnian sandstone), is intruded by 1.27–1.26 Ga
(Söderlund et al. 2006; Suominen 1991) dolerites with either NE–SW trends or saucer shapes (Fig.
3.1.3.1; Winterhalter, 1972; Axberg, 1980; BABEL Working Group, 1990, 1993; Korja et al., 2001). The
significant thickness (up to 3 km) (Fig. 3.1.3.2; Korja et al., 2001) of the sandstone sequence has been
explained by penecontemporaneous subsidence of the basin and down-warping along flexure folds
and faults (Axberg 1980) and by collapse of the underlying rapakivi granite body (Korja et al., 2001).
In the western part, rocks are overlain by Cambrian sandstone and Ordovician limestone and shale
(Fig. 3.1.3.1) up to nearly 400 m thick, which are also disturbed by faulting (Winterhalter, 1972;
Axberg, 1980). Sedimentary cover rocks in the Bay of Bothnia are dominated by Mesoproterozoic and
Neoproterozoic (Ediacaran?) siltstone and sandstone (referred to as “Middle Riphean and Upper
Vendian” in Winterhalter, 2000) overlain by Cambrian sandstone; all rocks are affected by faulting
(Fig. 3.1.3.1; Wannäs, 1989; Winterhalter, 2000; Koistinen et al., 2001).
Brittle structures are frequent in the Gulf of Bothnia (Winterhalter, 1972; Axberg, 1980; Wannäs,
1989) and predominantly strike NE–SW to NNE–SSW, NW–SE and less commonly NNW–SSE and N –S
(Figs. 3.1.3.2 and 3.1.3.3). Many of these faults and joints have been repeatedly active and are
parallel or sub-parallel to structures and lineaments found on land (e.g. Axberg, 1980). Bearing in
mind the discussion in section 3.1.2 of the deformation zones on the Swedish and Finnish mainlands,
it is likely that some of the major brittle structures preserved in the Gulf of Bothnia have ductile
precursors that affected the underlying crystalline basement and have been repeatedly reactivated.

82
Figure 3.1.3.1. BABEL lines 1 and 7 on a geological map of the Gulf of Bothnia (after Koistinen et al.,
2001). Babel profiles 1 (red line; N-S) and 7 (red line; W-E).
The western coast of the Gulf of Bothnia is partly characterised by rather steep fjord-like valleys with
elevations reaching to heights of up to 300 m, whereas the eastern coast defines a flat and broad
coastal zone (Axberg, 1980; Veltheim, 1962; 1969). The NE–SW to NNE–SSW Bothnian Zone (Axberg,
1980) or Bothnian Fracture Zone (Wannäs, 1989) can be traced along the western coast from the
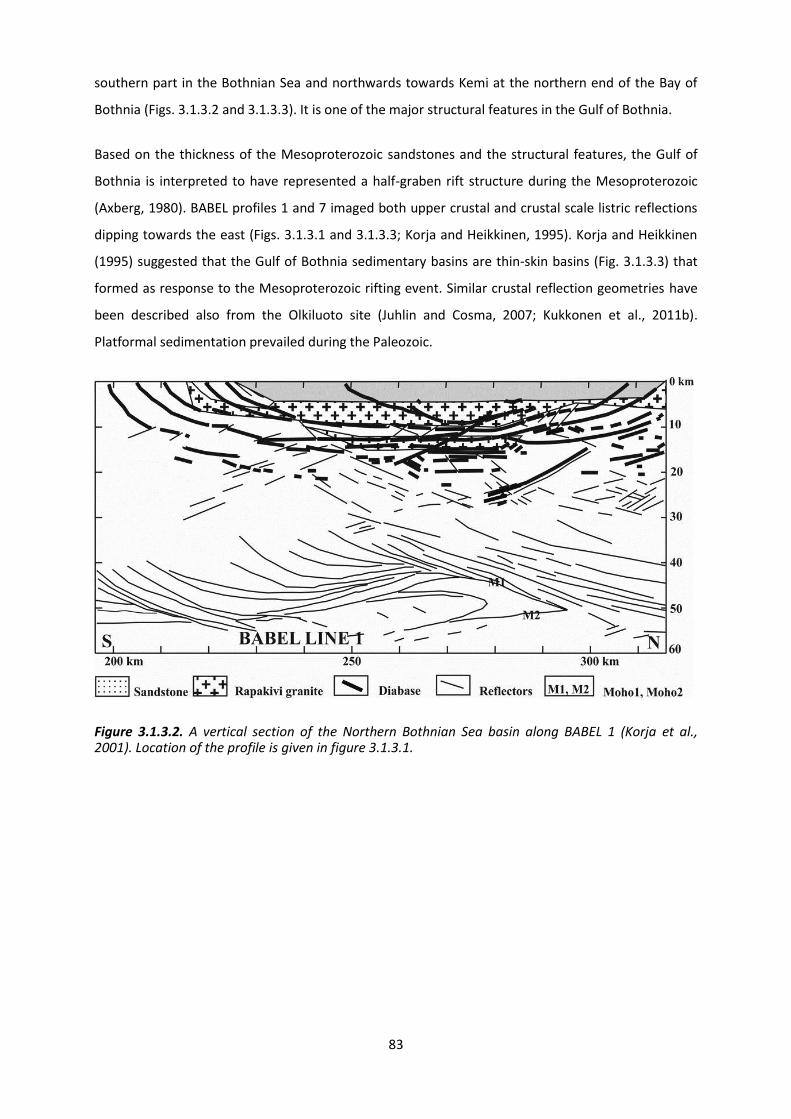
83
southern part in the Bothnian Sea and northwards towards Kemi at the northern end of the Bay of
Bothnia (Figs. 3.1.3.2 and 3.1.3.3). It is one of the major structural features in the Gulf of Bothnia.
Based on the thickness of the Mesoproterozoic sandstones and the structural features, the Gulf of
Bothnia is interpreted to have represented a half-graben rift structure during the Mesoproterozoic
(Axberg, 1980). BABEL profiles 1 and 7 imaged both upper crustal and crustal scale listric reflections
dipping towards the east (Figs. 3.1.3.1 and 3.1.3.3; Korja and Heikkinen, 1995). Korja and Heikkinen
(1995) suggested that the Gulf of Bothnia sedimentary basins are thin-skin basins (Fig. 3.1.3.3) that
formed as response to the Mesoproterozoic rifting event. Similar crustal reflection geometries have
been described also from the Olkiluoto site (Juhlin and Cosma, 2007; Kukkonen et al., 2011b).
Platformal sedimentation prevailed during the Paleozoic.
Figure 3.1.3.2. A vertical section of the Northern Bothnian Sea basin along BABEL 1 (Korja et al., 2001). Location of the profile is given in figure 3.1.3.1.
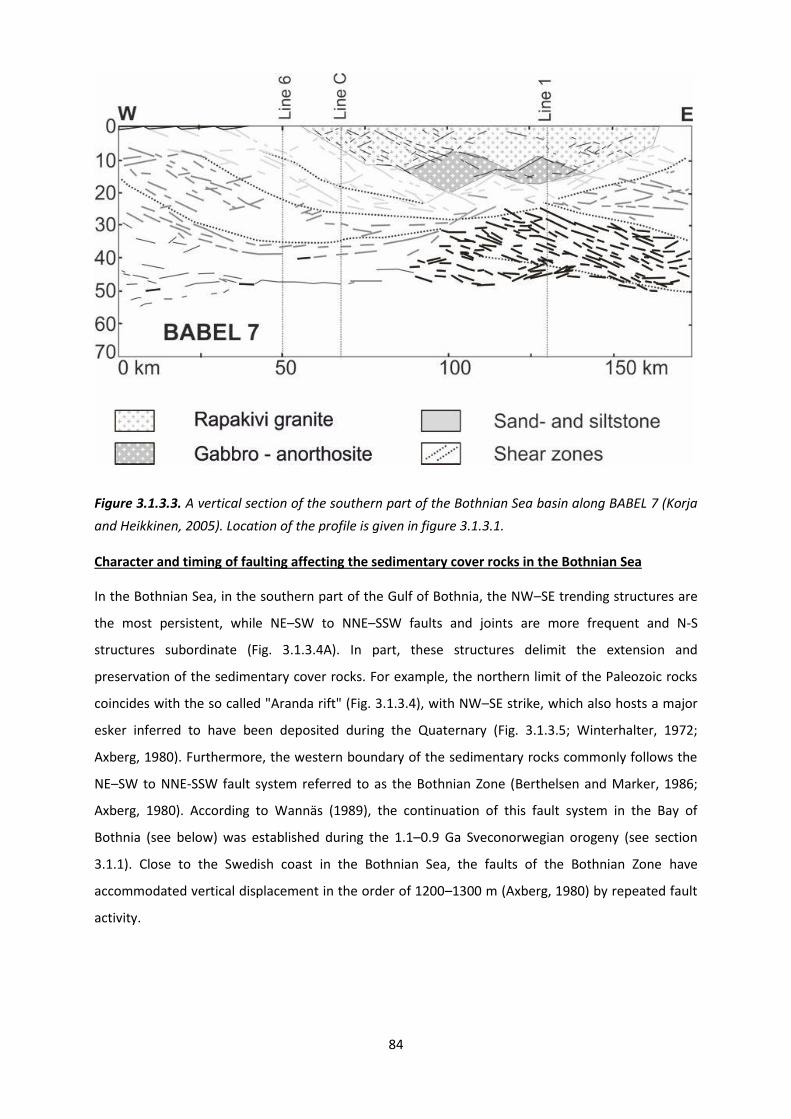
84
Figure 3.1.3.3. A vertical section of the southern part of the Bothnian Sea basin along BABEL 7 (Korja
and Heikkinen, 2005). Location of the profile is given in figure 3.1.3.1.
Character and timing of faulting affecting the sedimentary cover rocks in the Bothnian Sea
In the Bothnian Sea, in the southern part of the Gulf of Bothnia, the NW–SE trending structures are
the most persistent, while NE–SW to NNE–SSW faults and joints are more frequent and N-S
structures subordinate (Fig. 3.1.3.4A). In part, these structures delimit the extension and
preservation of the sedimentary cover rocks. For example, the northern limit of the Paleozoic rocks
coincides with the so called "Aranda rift" (Fig. 3.1.3.4), with NW–SE strike, which also hosts a major
esker inferred to have been deposited during the Quaternary (Fig. 3.1.3.5; Winterhalter, 1972;
Axberg, 1980). Furthermore, the western boundary of the sedimentary rocks commonly follows the
NE–SW to NNE-SSW fault system referred to as the Bothnian Zone (Berthelsen and Marker, 1986;
Axberg, 1980). According to Wannäs (1989), the continuation of this fault system in the Bay of
Bothnia (see below) was established during the 1.1–0.9 Ga Sveconorwegian orogeny (see section
3.1.1). Close to the Swedish coast in the Bothnian Sea, the faults of the Bothnian Zone have
accommodated vertical displacement in the order of 1200–1300 m (Axberg, 1980) by repeated fault
activity.
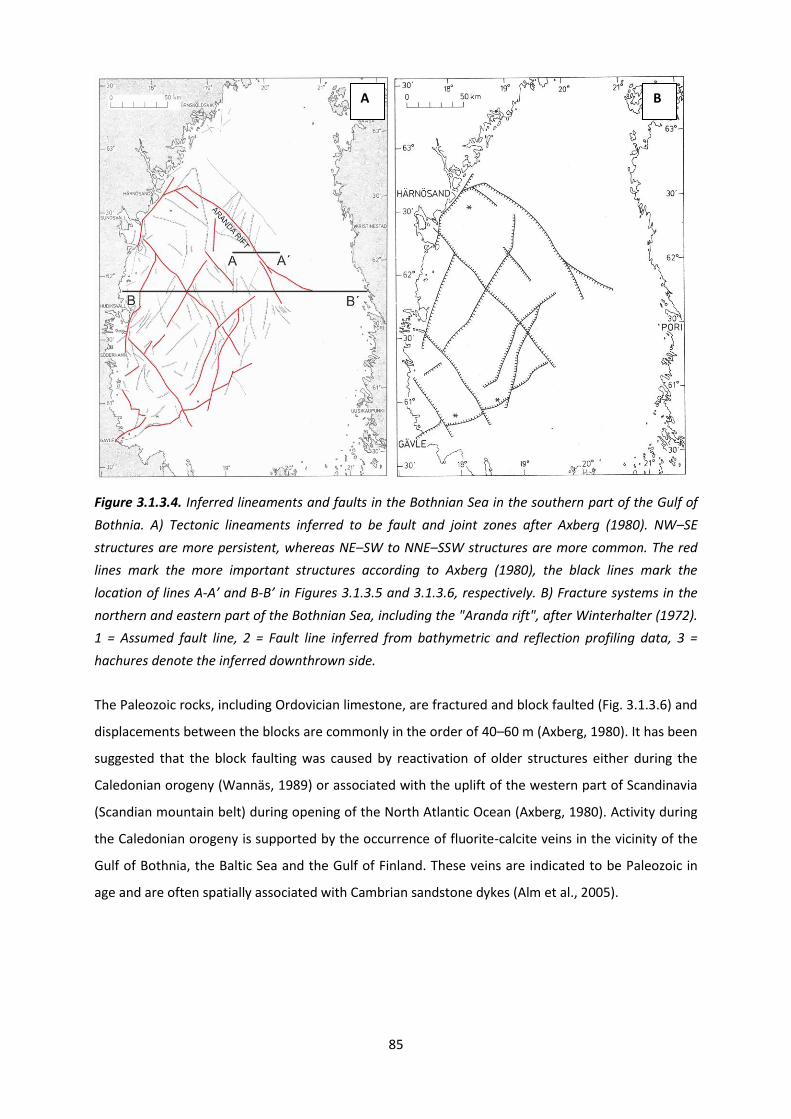
85
Figure 3.1.3.4. Inferred lineaments and faults in the Bothnian Sea in the southern part of the Gulf of
Bothnia. A) Tectonic lineaments inferred to be fault and joint zones after Axberg (1980). NW–SE
structures are more persistent, whereas NE–SW to NNE–SSW structures are more common. The red
lines mark the more important structures according to Axberg (1980), the black lines mark the
location of lines A-A’ and B-B’ in Figures 3.1.3.5 and 3.1.3.6, respectively. B) Fracture systems in the
northern and eastern part of the Bothnian Sea, including the "Aranda rift", after Winterhalter (1972).
1 = Assumed fault line, 2 = Fault line inferred from bathymetric and reflection profiling data, 3 =
hachures denote the inferred downthrown side.
The Paleozoic rocks, including Ordovician limestone, are fractured and block faulted (Fig. 3.1.3.6) and
displacements between the blocks are commonly in the order of 40–60 m (Axberg, 1980). It has been
suggested that the block faulting was caused by reactivation of older structures either during the
Caledonian orogeny (Wannäs, 1989) or associated with the uplift of the western part of Scandinavia
(Scandian mountain belt) during opening of the North Atlantic Ocean (Axberg, 1980). Activity during
the Caledonian orogeny is supported by the occurrence of fluorite-calcite veins in the vicinity of the
Gulf of Bothnia, the Baltic Sea and the Gulf of Finland. These veins are indicated to be Paleozoic in
age and are often spatially associated with Cambrian sandstone dykes (Alm et al., 2005).
A B
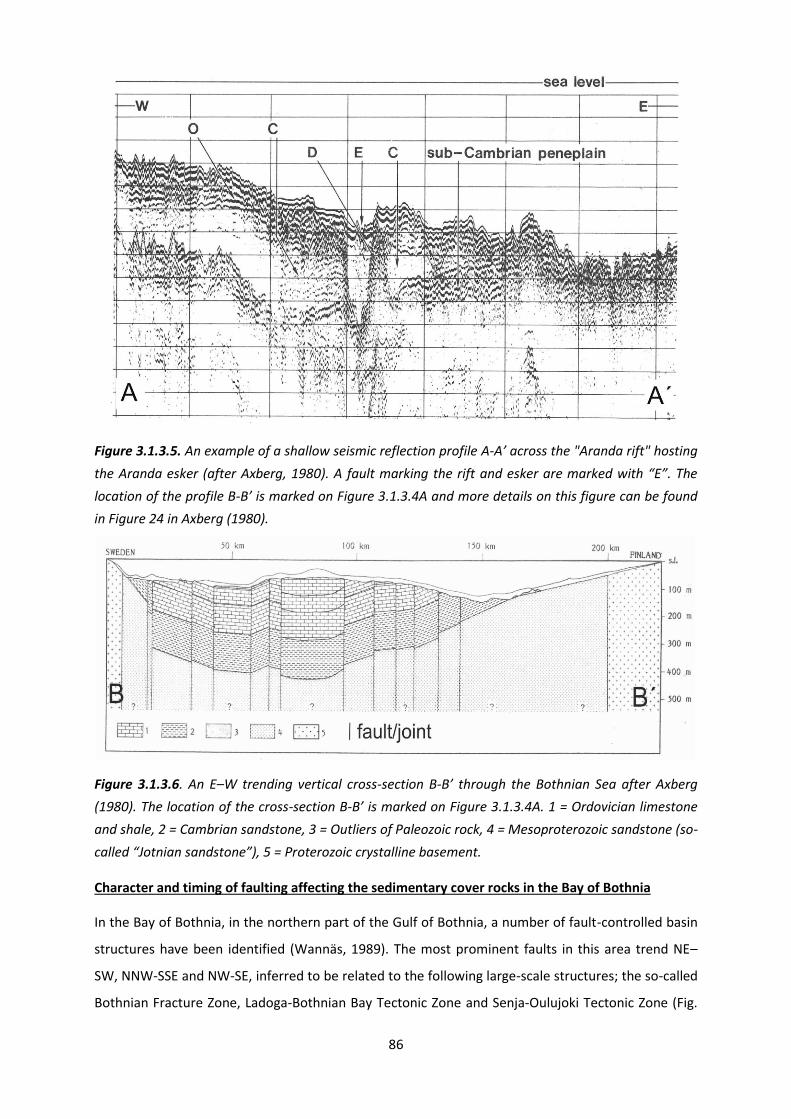
86
Figure 3.1.3.5. An example of a shallow seismic reflection profile A-A’ across the "Aranda rift" hosting
the Aranda esker (after Axberg, 1980). A fault marking the rift and esker are marked with “E”. The
location of the profile B-B’ is marked on Figure 3.1.3.4A and more details on this figure can be found
in Figure 24 in Axberg (1980).
Figure 3.1.3.6. An E–W trending vertical cross-section B-B’ through the Bothnian Sea after Axberg
(1980). The location of the cross-section B-B’ is marked on Figure 3.1.3.4A. 1 = Ordovician limestone
and shale, 2 = Cambrian sandstone, 3 = Outliers of Paleozoic rock, 4 = Mesoproterozoic sandstone (so-
called “Jotnian sandstone”), 5 = Proterozoic crystalline basement.
Character and timing of faulting affecting the sedimentary cover rocks in the Bay of Bothnia
In the Bay of Bothnia, in the northern part of the Gulf of Bothnia, a number of fault-controlled basin
structures have been identified (Wannäs, 1989). The most prominent faults in this area trend NE–
SW, NNW-SSE and NW-SE, inferred to be related to the following large-scale structures; the so-called
Bothnian Fracture Zone, Ladoga-Bothnian Bay Tectonic Zone and Senja-Oulujoki Tectonic Zone (Fig.
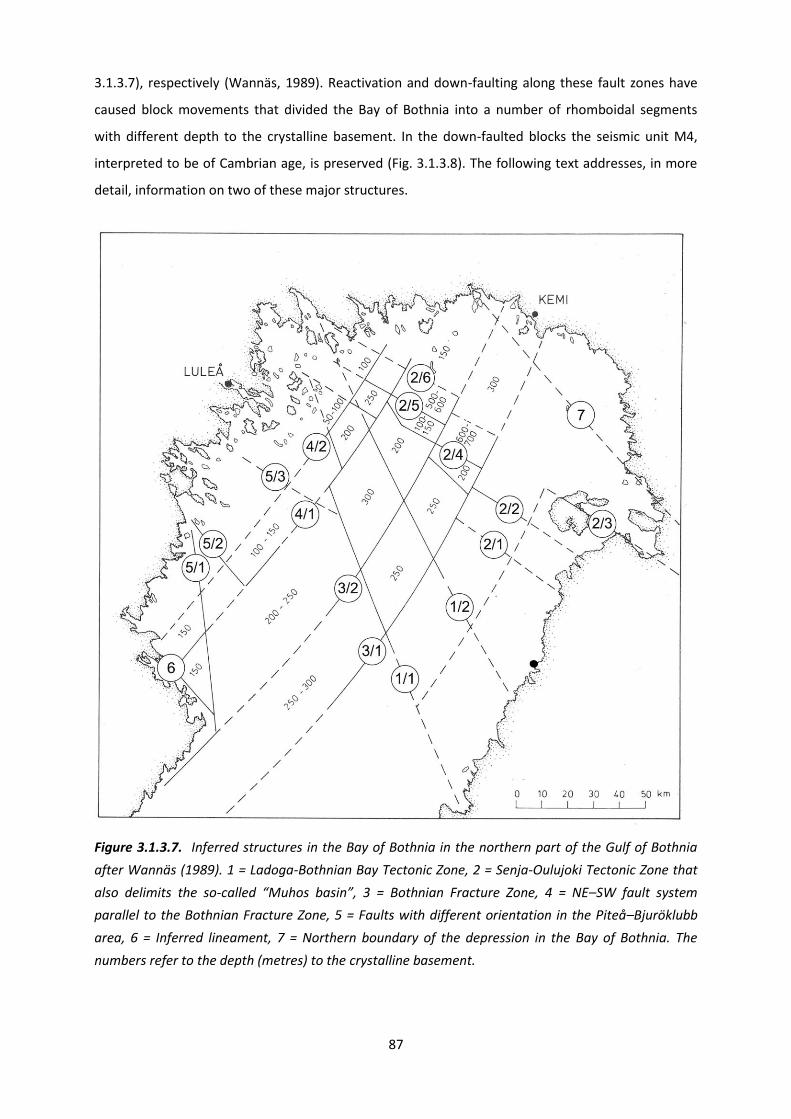
87
3.1.3.7), respectively (Wannäs, 1989). Reactivation and down-faulting along these fault zones have
caused block movements that divided the Bay of Bothnia into a number of rhomboidal segments
with different depth to the crystalline basement. In the down-faulted blocks the seismic unit M4,
interpreted to be of Cambrian age, is preserved (Fig. 3.1.3.8). The following text addresses, in more
detail, information on two of these major structures.
Figure 3.1.3.7. Inferred structures in the Bay of Bothnia in the northern part of the Gulf of Bothnia
after Wannäs (1989). 1 = Ladoga-Bothnian Bay Tectonic Zone, 2 = Senja-Oulujoki Tectonic Zone that
also delimits the so-called “Muhos basin”, 3 = Bothnian Fracture Zone, 4 = NE–SW fault system
parallel to the Bothnian Fracture Zone, 5 = Faults with different orientation in the Piteå–Bjuröklubb
area, 6 = Inferred lineament, 7 = Northern boundary of the depression in the Bay of Bothnia. The
numbers refer to the depth (metres) to the crystalline basement.
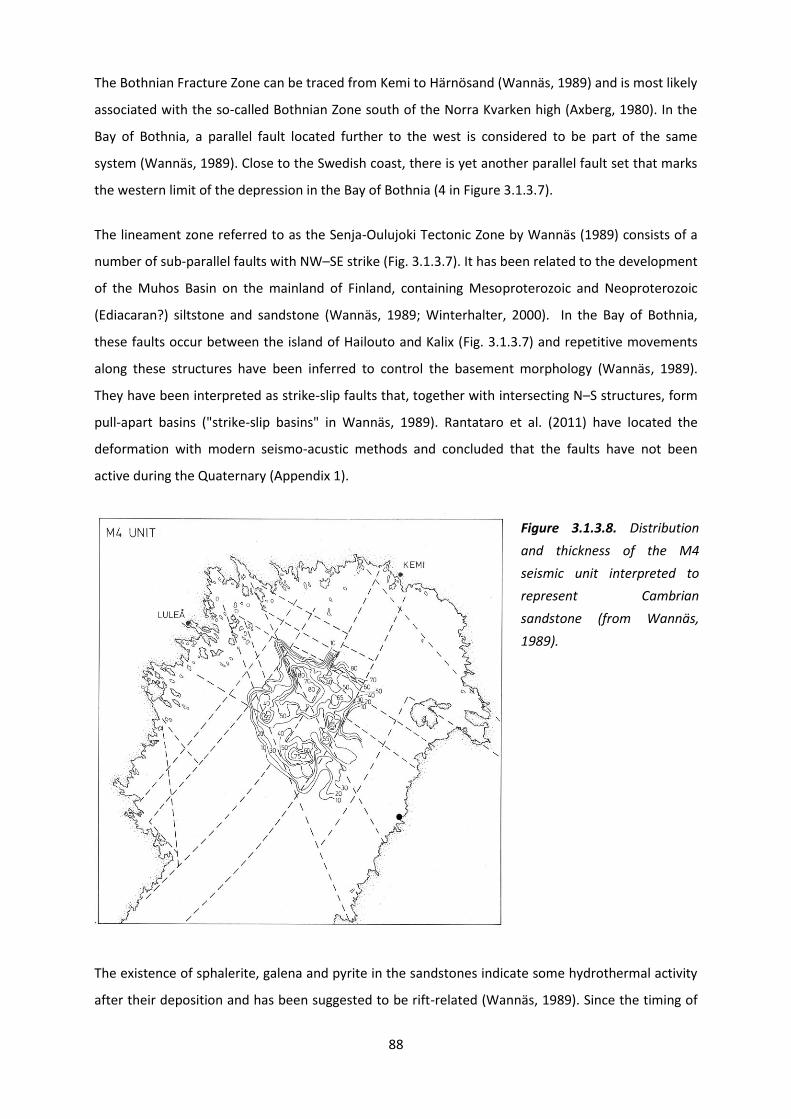
88
The Bothnian Fracture Zone can be traced from Kemi to Härnösand (Wannäs, 1989) and is most likely
associated with the so-called Bothnian Zone south of the Norra Kvarken high (Axberg, 1980). In the
Bay of Bothnia, a parallel fault located further to the west is considered to be part of the same
system (Wannäs, 1989). Close to the Swedish coast, there is yet another parallel fault set that marks
the western limit of the depression in the Bay of Bothnia (4 in Figure 3.1.3.7).
The lineament zone referred to as the Senja-Oulujoki Tectonic Zone by Wannäs (1989) consists of a
number of sub-parallel faults with NW–SE strike (Fig. 3.1.3.7). It has been related to the development
of the Muhos Basin on the mainland of Finland, containing Mesoproterozoic and Neoproterozoic
(Ediacaran?) siltstone and sandstone (Wannäs, 1989; Winterhalter, 2000). In the Bay of Bothnia,
these faults occur between the island of Hailouto and Kalix (Fig. 3.1.3.7) and repetitive movements
along these structures have been inferred to control the basement morphology (Wannäs, 1989).
They have been interpreted as strike-slip faults that, together with intersecting N–S structures, form
pull-apart basins ("strike-slip basins" in Wannäs, 1989). Rantataro et al. (2011) have located the
deformation with modern seismo-acustic methods and concluded that the faults have not been
active during the Quaternary (Appendix 1).
The existence of sphalerite, galena and pyrite in the sandstones indicate some hydrothermal activity
after their deposition and has been suggested to be rift-related (Wannäs, 1989). Since the timing of
Figure 3.1.3.8. Distribution
and thickness of the M4
seismic unit interpreted to
represent Cambrian
sandstone (from Wannäs,
1989).
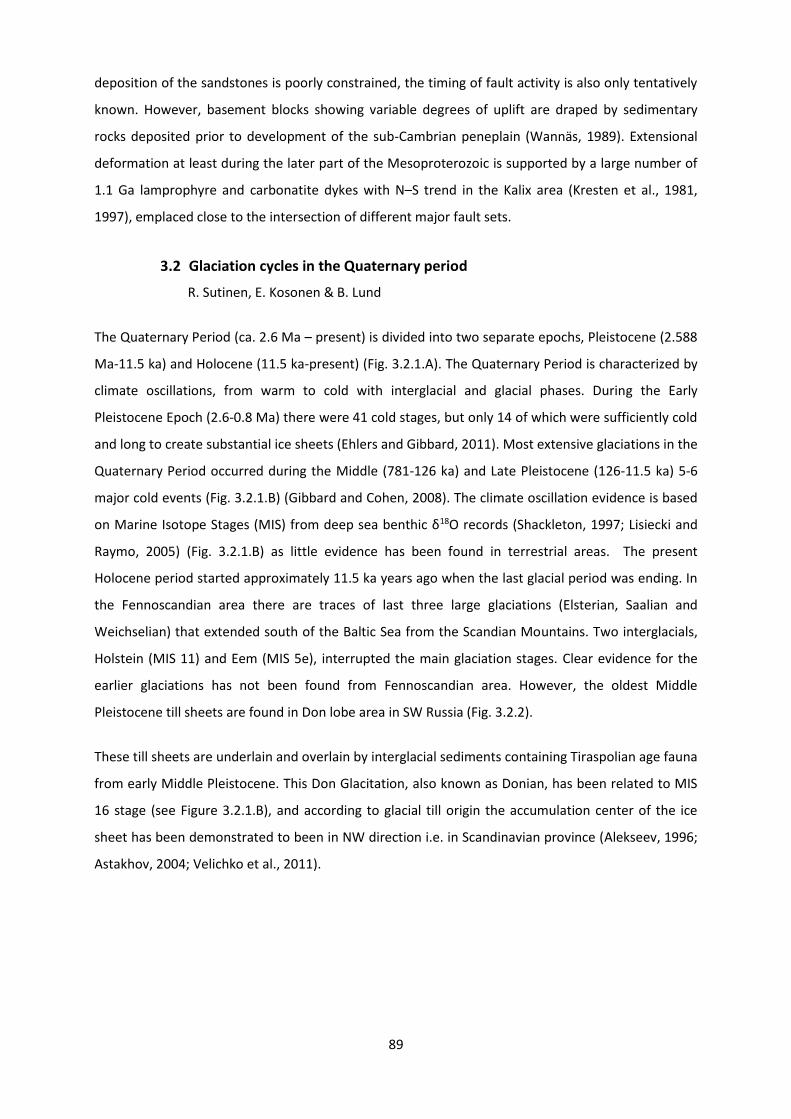
89
deposition of the sandstones is poorly constrained, the timing of fault activity is also only tentatively
known. However, basement blocks showing variable degrees of uplift are draped by sedimentary
rocks deposited prior to development of the sub-Cambrian peneplain (Wannäs, 1989). Extensional
deformation at least during the later part of the Mesoproterozoic is supported by a large number of
1.1 Ga lamprophyre and carbonatite dykes with N–S trend in the Kalix area (Kresten et al., 1981,
1997), emplaced close to the intersection of different major fault sets.
3.2 Glaciation cycles in the Quaternary period
R. Sutinen, E. Kosonen & B. Lund
The Quaternary Period (ca. 2.6 Ma – present) is divided into two separate epochs, Pleistocene (2.588
Ma-11.5 ka) and Holocene (11.5 ka-present) (Fig. 3.2.1.A). The Quaternary Period is characterized by
climate oscillations, from warm to cold with interglacial and glacial phases. During the Early
Pleistocene Epoch (2.6-0.8 Ma) there were 41 cold stages, but only 14 of which were sufficiently cold
and long to create substantial ice sheets (Ehlers and Gibbard, 2011). Most extensive glaciations in the
Quaternary Period occurred during the Middle (781-126 ka) and Late Pleistocene (126-11.5 ka) 5-6
major cold events (Fig. 3.2.1.B) (Gibbard and Cohen, 2008). The climate oscillation evidence is based
on Marine Isotope Stages (MIS) from deep sea benthic δ18O records (Shackleton, 1997; Lisiecki and
Raymo, 2005) (Fig. 3.2.1.B) as little evidence has been found in terrestrial areas. The present
Holocene period started approximately 11.5 ka years ago when the last glacial period was ending. In
the Fennoscandian area there are traces of last three large glaciations (Elsterian, Saalian and
Weichselian) that extended south of the Baltic Sea from the Scandian Mountains. Two interglacials,
Holstein (MIS 11) and Eem (MIS 5e), interrupted the main glaciation stages. Clear evidence for the
earlier glaciations has not been found from Fennoscandian area. However, the oldest Middle
Pleistocene till sheets are found in Don lobe area in SW Russia (Fig. 3.2.2).
These till sheets are underlain and overlain by interglacial sediments containing Tiraspolian age fauna
from early Middle Pleistocene. This Don Glacitation, also known as Donian, has been related to MIS
16 stage (see Figure 3.2.1.B), and according to glacial till origin the accumulation center of the ice
sheet has been demonstrated to been in NW direction i.e. in Scandinavian province (Alekseev, 1996;
Astakhov, 2004; Velichko et al., 2011).
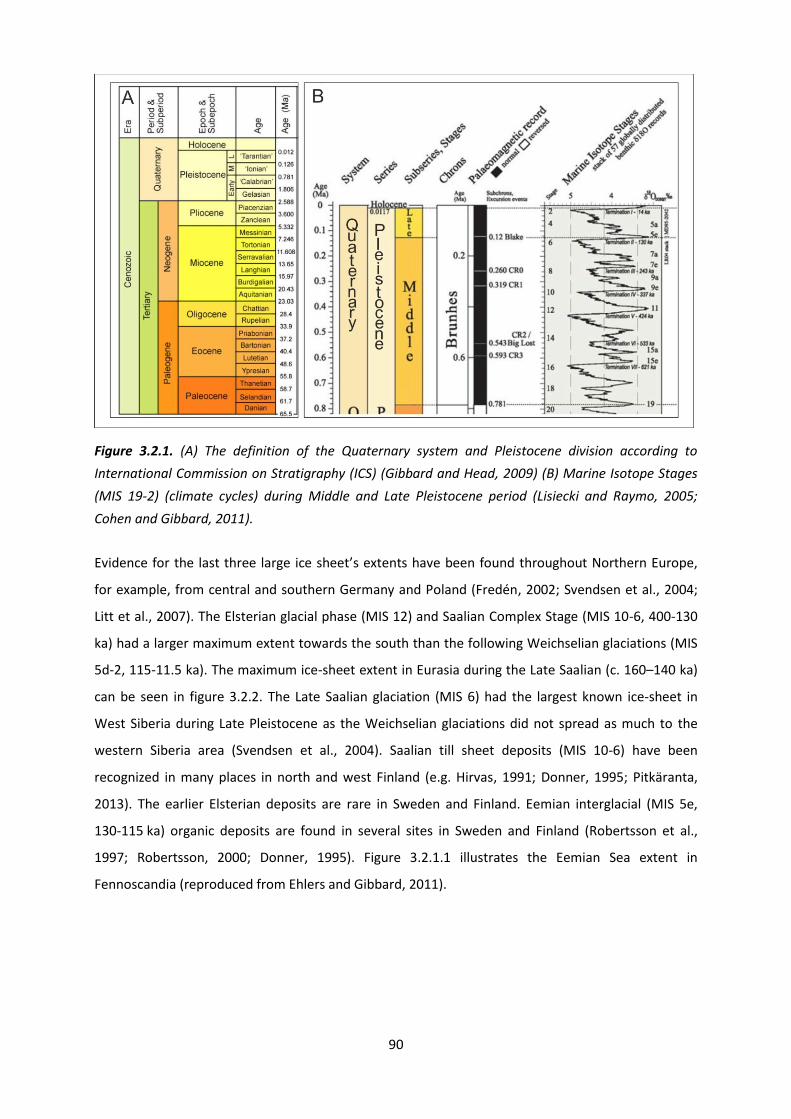
90
Figure 3.2.1. (A) The definition of the Quaternary system and Pleistocene division according to
International Commission on Stratigraphy (ICS) (Gibbard and Head, 2009) (B) Marine Isotope Stages
(MIS 19-2) (climate cycles) during Middle and Late Pleistocene period (Lisiecki and Raymo, 2005;
Cohen and Gibbard, 2011).
Evidence for the last three large ice sheet’s extents have been found throughout Northern Europe,
for example, from central and southern Germany and Poland (Fredén, 2002; Svendsen et al., 2004;
Litt et al., 2007). The Elsterian glacial phase (MIS 12) and Saalian Complex Stage (MIS 10-6, 400-130
ka) had a larger maximum extent towards the south than the following Weichselian glaciations (MIS
5d-2, 115-11.5 ka). The maximum ice-sheet extent in Eurasia during the Late Saalian (c. 160–140 ka)
can be seen in figure 3.2.2. The Late Saalian glaciation (MIS 6) had the largest known ice-sheet in
West Siberia during Late Pleistocene as the Weichselian glaciations did not spread as much to the
western Siberia area (Svendsen et al., 2004). Saalian till sheet deposits (MIS 10-6) have been
recognized in many places in north and west Finland (e.g. Hirvas, 1991; Donner, 1995; Pitkäranta,
2013). The earlier Elsterian deposits are rare in Sweden and Finland. Eemian interglacial (MIS 5e,
130-115 ka) organic deposits are found in several sites in Sweden and Finland (Robertsson et al.,
1997; Robertsson, 2000; Donner, 1995). Figure 3.2.1.1 illustrates the Eemian Sea extent in
Fennoscandia (reproduced from Ehlers and Gibbard, 2011).

91
Figure 3.2.2. Maximum extent of Late Saalian ice-sheet in Eurasia (c. 160-140 ka) (figure from
Svendsen et al., 2004). The Don lobe shows the maximum ice-sheet extent during the Don glaciations
(MIS 16, early Middle Pleistocene).
3.2.1 The Weichselian glaciation (115 – 11.5 ka)
Clear evidence for Late Pleistocene Weichselian glaciations (115 – 11.5 ka) are found in
Fennoscandia. Glaciogenic and glaciofluvial deposits from the last glacial periods, Early, Middle and
Late Weichselian, can be found in Sweden and Finland (Hirvas, 1991; Lundqvist, 1992; Sutinen, 1992;
Donner, 1995; Fredén, 2002; Sohlenius and Hedenström, 2008; Pitkäranta, 2013). The major part of
the present soft sediment deposits are generally considered to be Late Weichselian, even though
there is no strong evidence for this. The Late Weichselian deposits have buried the earlier remnants.
Consequently the extents of the earlier glaciations are more difficult to determine, and there are
differences in the Early Weichselian stratigraphy in Swedish and Finnish Lapland as well as
uncertainties in the Middle Weichselian glacial extent.
Two end moraine zones (W1 and W2) across northern Finland are the most prominent features
evidencing the pre-Late Weichselian ice advance. The end moraine zone in the Pudasjärvi-Oulu
region is built of vast masses of sand and gravel, and based on seismic and radar data these coarse-
textured deposits vary in thickness from 25 to 60 m (Sutinen, 1992). The ridge formations are
covered with a till of Late Weichselian origin. South of the Pudasjärvi end moraine the Late
Weichselian till overlies the Eemian (organic) sediments suggesting that the Pudasjärvi end moraine
marks the Early Weichselian (W1, MIS 5b) termination (Fig. 3.2.1.1A). The extension of this end

92
moraine further south along the coast of the Gulf of Baltic is not known. Also, the northern extension
in Lapland towards the Arctic Ocean is unknown. The Early and Middle Weichselian moraines (e.g.
Veiki moraines), that survived the later glaciations, have been found in a wide area in Swedish
Lapland (e.g. Lagerbäck, 1988; Sigfúsdóttir, 2013).
During the early Middle Weichselian (MIS 4, 70-60 ka) it is believed that the ice sheet covered the
whole of Sweden and Finland (Fig. 3.2.1.1C) (e.g. Saarnisto & Salonen, 1995; Svendsen et al., 2004;
Salonen et al., 2008). Another end moraine zone in Lapland (W2, MIS 3) can be followed from the
Pello area in the west to Kittilä and Porttipahta in central Lapland towards Savukoski and cross the
Finnish-Russian border to the east (Sutinen, 1992). Based on the radar evidence from the Porttipahta
area, the foreset beds of these glaciofluvial formations are tilting south. Between the ‘Porttipahta’
and Pudasjärvi end moraines the Eemian sediments are overlain by two Weichselian sedimentary
units, hence, suggesting that the ‘Porttipahta’ end moraine marks the mid-Weichselian (W2, MIS 3)
termination. As is the case with W1, no evidence has been found so far to indicate the northern
extent. However, the glacial dispersal on the northern side of the W2-termination is extremely
complicated and indicates at least three major ice flow phases (Sutinen, 1992; Sutinen et al., 2013).
Weichselian ice sheets have had large differences in volume as well as variations in spatial and
temporal extents and the ice sheet accumulation center location has also varied. The Early
Weichselian ice sheet has been interpreted to have been the most extensive towards the northeast
(Svendsen et al., 2004). The Late Weichselian (MIS 2) on the other hand was the most extensive to
the west and south being the largest of the Weichselian period ice sheets. The Late Weichselian last
glacial maximum (LGM) border (22 000 years ago) is seen in Figure 3.2.1.1D. The Weichselian period
had also many known interstadials, when Fennoscandia was free of ice over 10 000 year long
periods. Also Saalian and Elsterian are thought to have undergone several ice free interstadials.

93
Figure 3.2.1.1. Extent of interglacial Eemian Sea (A), Early (B) and Middle Weichselian (C) glaciations
and Late Weichselian Last Glacial Maximum (LGM) (D). A and D are based on Ehlers and Gibbard
(2011) and B and C are based on Svendsen et al. (2004).
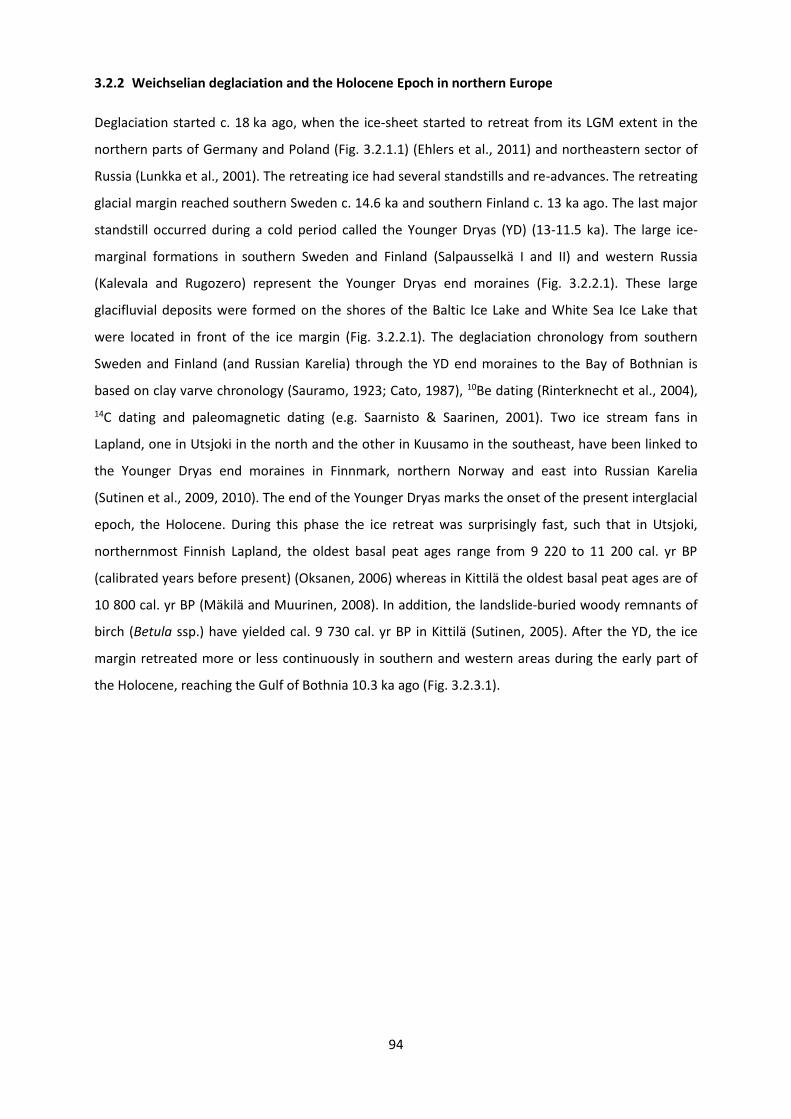
94
3.2.2 Weichselian deglaciation and the Holocene Epoch in northern Europe
Deglaciation started c. 18 ka ago, when the ice-sheet started to retreat from its LGM extent in the
northern parts of Germany and Poland (Fig. 3.2.1.1) (Ehlers et al., 2011) and northeastern sector of
Russia (Lunkka et al., 2001). The retreating ice had several standstills and re-advances. The retreating
glacial margin reached southern Sweden c. 14.6 ka and southern Finland c. 13 ka ago. The last major
standstill occurred during a cold period called the Younger Dryas (YD) (13-11.5 ka). The large ice-
marginal formations in southern Sweden and Finland (Salpausselkä I and II) and western Russia
(Kalevala and Rugozero) represent the Younger Dryas end moraines (Fig. 3.2.2.1). These large
glacifluvial deposits were formed on the shores of the Baltic Ice Lake and White Sea Ice Lake that
were located in front of the ice margin (Fig. 3.2.2.1). The deglaciation chronology from southern
Sweden and Finland (and Russian Karelia) through the YD end moraines to the Bay of Bothnian is
based on clay varve chronology (Sauramo, 1923; Cato, 1987), 10Be dating (Rinterknecht et al., 2004),
14C dating and paleomagnetic dating (e.g. Saarnisto & Saarinen, 2001). Two ice stream fans in
Lapland, one in Utsjoki in the north and the other in Kuusamo in the southeast, have been linked to
the Younger Dryas end moraines in Finnmark, northern Norway and east into Russian Karelia
(Sutinen et al., 2009, 2010). The end of the Younger Dryas marks the onset of the present interglacial
epoch, the Holocene. During this phase the ice retreat was surprisingly fast, such that in Utsjoki,
northernmost Finnish Lapland, the oldest basal peat ages range from 9 220 to 11 200 cal. yr BP
(calibrated years before present) (Oksanen, 2006) whereas in Kittilä the oldest basal peat ages are of
10 800 cal. yr BP (Mäkilä and Muurinen, 2008). In addition, the landslide-buried woody remnants of
birch (Betula ssp.) have yielded cal. 9 730 cal. yr BP in Kittilä (Sutinen, 2005). After the YD, the ice
margin retreated more or less continuously in southern and western areas during the early part of
the Holocene, reaching the Gulf of Bothnia 10.3 ka ago (Fig. 3.2.3.1).
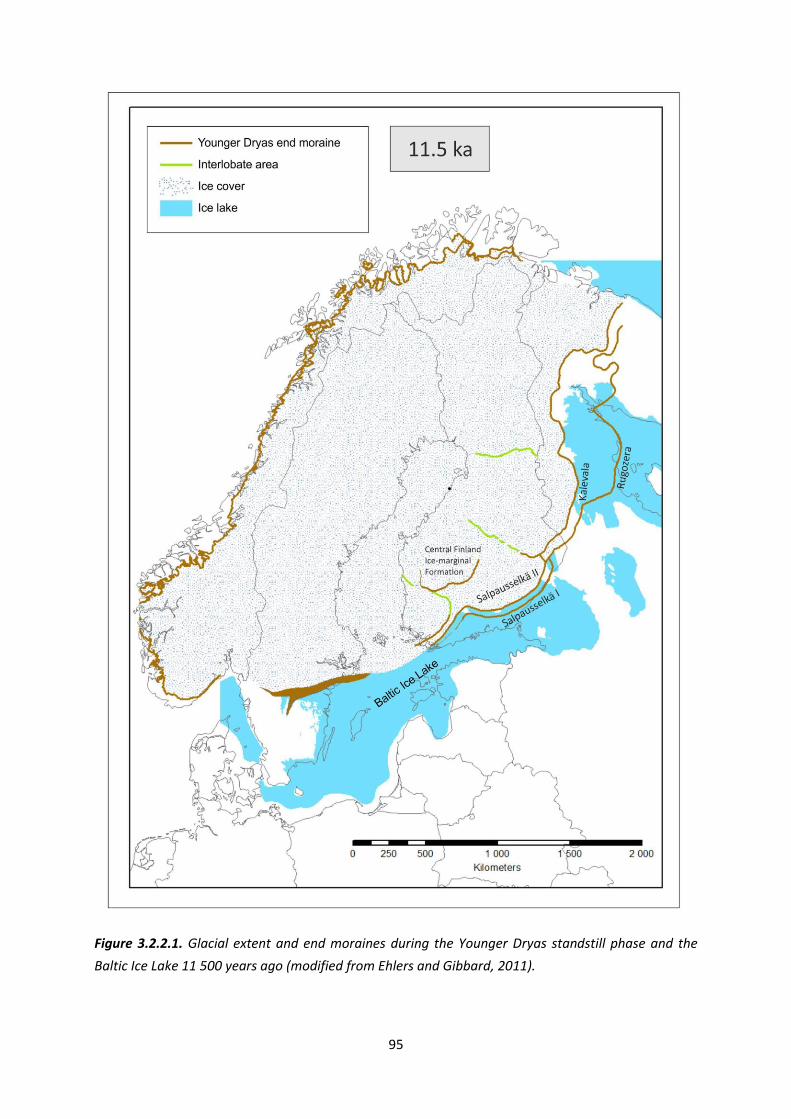
95
Figure 3.2.2.1. Glacial extent and end moraines during the Younger Dryas standstill phase and the
Baltic Ice Lake 11 500 years ago (modified from Ehlers and Gibbard, 2011).

96
Finland was completely deglaciated by 10 000 years ago, and the last remnants of the ice sheet in
Sweden have been dated to 9000-8500 BP (e.g. Lundqvist, 2004; Johansson et al., 2011). The
deglaciation curves and known post-glacial faults are seen in Figure 3.2.3.1. After the Baltic Ice Lake
(14 000 – 11 550 cal. yr BP) the Baltic Sea area experienced Yoldia Sea (11 550 – 10 700 cal. yr BP)
that was followed by Ancylus Lake (10 700 – 9 800 cal. yr BP) and Litorina Sea (9 800 –present cal. yr
BP) stages in the Early Holocene (Björck, 1995; Björck, 2008; Andrén et al., 2011). The highest Baltic
Sea shorelines are situated at different altitudes in the Fennoscandian area depending on the
differences in crustal depression and rebound velocities as well as the sea-level changes during
different Baltic Sea stages. Also, an important factor is when the area became ice-free. Ancylus and
Litorina shorelines reached the southern Lapland area as the ice had already retreated to the
Scandian mountain area. These past Baltic Sea stages have deposited silt and clay sediments along
low-lying coastal areas of Sweden and Finland.
The average thickness of the Quaternary sediments in Finland has been estimated to be 8.6 m and
the most common thickness being 3-4 m (Okko, 1964). The thickest continuous deposits are found in
southwestern Finland (clay deposits) and in the Salpausselkä end moraine zones. In Finland and
Sweden, the thickest sediment covers are found in valleys extending to over 100 meters (Lundqvist,
1958; Pitkäranta, 2013). The average bedrock erosion in Sweden during the Quaternary Period has
been estimated to be 12 m with 1 meter per glaciation (Påsse, 2004).
3.2.3 Faults active during the late Weichselian deglaciation
The Late Weichselian deglaciation resulted in active faulting of the bedrock in northern
Fennoscandia. Approximately a dozen late- or post-glacial reverse fault scarps have been identified in
northern Fennoscandia from the 1960s onwards (see section 2.7) (e.g. Kujansuu, 1964; Lagerbäck,
1979; Olesen, 1988; Kuivamäki et al., 1998). The faults have displacements and scarps from a few
centimeters to 30 meters high (Lagerbäck & Sundh, 2008; Olesen, 1988; Kuivamäki et al., 1998) and
the seismic events may have reached magnitudes of up to 8 or larger (Muir Wood, 1993; Arvidsson,
1996). Post-glacial faults (PGF) in Fennoscandia are shown in Figure 3.2.3.1 and listed in Table
3.2.3.1. The post-glacial faults generally follow old weakness zones which were reactivated in a
combination of tectonic, glacial isostatic adjustment (GIA) and local stresses (e.g. Wu et al., 1999;
Lund, 2005; Lund et al., 2009). In most of the Lapland area, the spacing of the SW-NE oriented post-
glacial faults is about 100 km.

97
Figure 3.2.3.1. Post-glacial faults and deglaciation curves of the Late Weichselian ice sheet.
Deglaciation chronology is based on Lunkka et al. (2004) and Lundqvist (2004). Two long PGF-lines
are presented (boxes). PGFs are also presented in section 2.7.
Kilometer scale PGFs have only been found in Fennoscandia (e.g. Munier & Fenton, 2004), in regions
undergoing glacio-isostatic uplift. Relative dating of the rupture of the Fennoscandian PGFs is
uncertain (Lagerbäck & Sundh, 2008) but one hypothesis is that they ruptured as final deglaciation
occurred at a site, such that the first faults to move were the ones in eastern Lapland and Sweden
shoreline areas (Muir Wood, 1993) (Fig. 3.2.3.1). The faults have been inferred to form during
different phases of the last deglaciation: 1) beneath the retreating ice-sheet, 2) during the
uncovering of the ice-sheet and 3) after local deglaciation (Lagerbäck & Witschard, 1983; Lagerbäck
98
and Sundh, 2008; Sutinen et al., 2013; 2014). Displacement on the post-glacial faults is inferred to
have occurred as single events, observed in trenches as single ruptures through glacial sediments and
then continued sedimentation, and no conclusive evidence has been found for repeated movements
(e.g. Lagerbäck & Sundh, 2008). Indirect observations of dated landslides and sediment disturbances
may indicate that the period of increased seismicity may have lasted several thousand years after
deglaciation (e.g. Sutinen, 2005; Sutinen et al., 2014; Mörner, 2003).
The NNE trending reverse Pärvie fault system consists of linear series of fault scarps and is a 155 km
long fault line. Also two long SW-NE trending PGF-lines continue across the borders in Lapland (see
Figure 3.2.3.1). Similar to most PGFs in Sweden, the majority of the PGFs in Finland follow the SW-NE
trending geometry. The Suasselkä PGF (see Table 3.2.3.1 and Fig. 3.2.3.1), first reported by Kujansuu
(1964), seems to have a continuation to Isovaara PGF and further SW to Pasmajärvi-
Ruokojarvi/Venejärvi/Ruostejärvi fault swarm and perhaps even into the Lansjärv fault system in
Norrbotten Sweden (see Lagerbäck and Sundh, 2008). In a similar manner, the Palojärvi fault in
western Finnish Lapland could be associated not only with the Lainio-Suijavaara PGF-system in
Sweden (Sutinen et al., 2014; see Lagerbäck and Sundh, 2008) but also in the NE to the Stuoragurra
PGF in Finnmark, Norway (see Olesen, 1988). These features indicate that the PGF lines could be
much longer than previously thought.
Other than these two main PGF-lines (Lansjärv/Pasmajärvi/Venejärvi/Ruostejärvi/Suasselkä and
Lainio-Suijavaara/Palojärvi/Stuoragurra), some discrete and unverified fault patterns have been
described e.g. in central Lapland. The Vaalajärvi/Huotarinkuusikko (Table 3.2.3.1), for example,
diverts in orientation from the main stress pattern (Kuivamäki et al., 1998) and therefore these will
be further studied as the airborne LiDAR will be available in the near future. The excavation across
the Vaalajärvi scarp has shown that there are no clear indications of faulting in the overburden
Quaternary deposits and the fault is now classified only as a possible post-glacial fault (Kuivamäki et
al., 2001).
In Utsjoki, northernmost Finnish Lapland, a significant concentration of landslides (Sutinen et al.,
2009) suggests a high magnitude seismic event. According to the historical earthquake-induced
landslide model by Keefer (2002), the area affected by a Mw≈7 earthquake approximates 10,000 km2
and the maximum lateral distance of a landslide from the fault-rupture zone approximates 150 km.
Therefore, Stuoragurra may have contributed to the Utsjoki landslides. These slides, however,
occurred in a nunatak position at some 11.9 ka (Sutinen et al., 2009). The Sevetti fault (Table 3.2.3.1)
is closer to Utsjoki, but this structure has not been verified. In the next few years, airborne LiDAR
data will be available for northern Finland and Sweden allowing more thorough investigations
(targeted trenchings/ drillings/ datings) of PGFs and earthquake induced landforms.
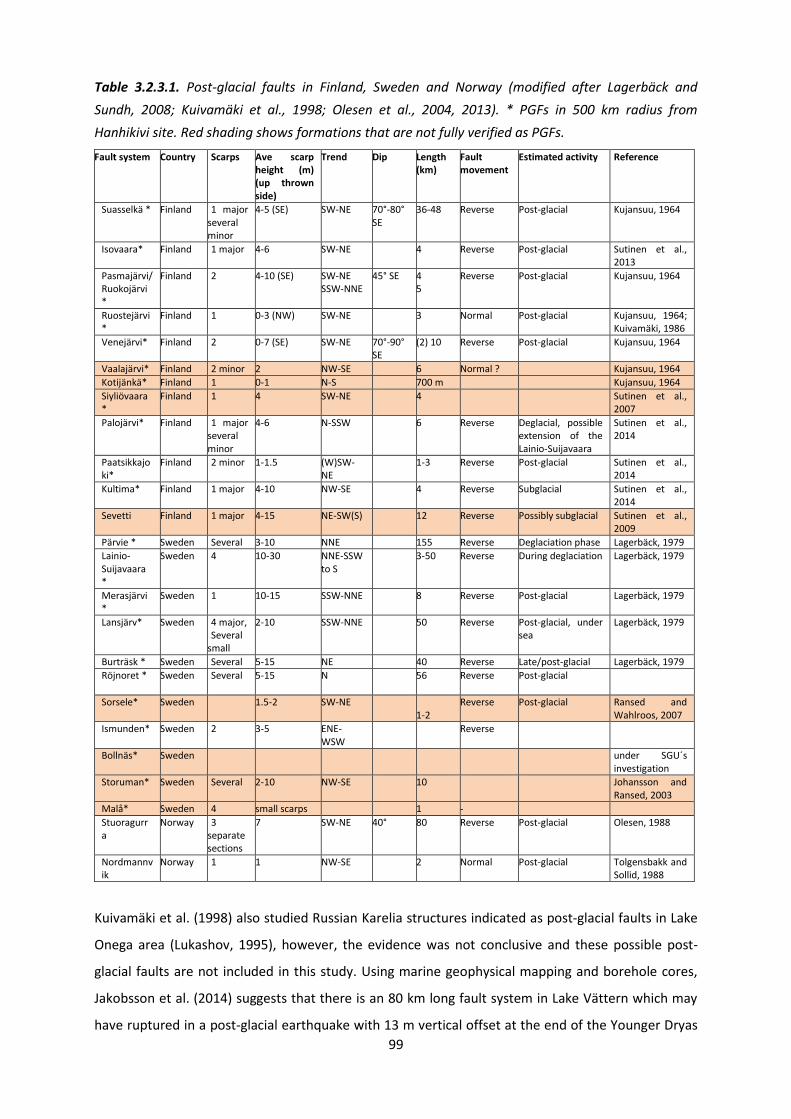
99
Table 3.2.3.1. Post-glacial faults in Finland, Sweden and Norway (modified after Lagerbäck and
Sundh, 2008; Kuivamäki et al., 1998; Olesen et al., 2004, 2013). * PGFs in 500 km radius from
Hanhikivi site. Red shading shows formations that are not fully verified as PGFs.
Fault system Country Scarps Ave scarp height (m) (up thrown side)
Trend Dip Length (km)
Fault movement
Estimated activity Reference
Suasselkä * Finland 1 major several minor
4-5 (SE) SW-NE 70°-80° SE
36-48 Reverse Post-glacial Kujansuu, 1964
Isovaara* Finland 1 major 4-6 SW-NE 4 Reverse Post-glacial Sutinen et al., 2013
Pasmajärvi/ Ruokojärvi *
Finland 2 4-10 (SE) SW-NE SSW-NNE
45° SE 4 5
Reverse Post-glacial Kujansuu, 1964
Ruostejärvi*
Finland 1 0-3 (NW) SW-NE 3 Normal Post-glacial Kujansuu, 1964; Kuivamäki, 1986
Venejärvi* Finland 2 0-7 (SE) SW-NE 70°-90° SE
(2) 10 Reverse Post-glacial Kujansuu, 1964
Vaalajärvi* Finland 2 minor 2 NW-SE 6 Normal ? Kujansuu, 1964
Kotijänkä* Finland 1 0-1 N-S 700 m Kujansuu, 1964
Siyliövaara*
Finland 1 4 SW-NE 4 Sutinen et al., 2007
Palojärvi* Finland 1 major several minor
4-6 N-SSW 6 Reverse Deglacial, possible extension of the Lainio-Suijavaara
Sutinen et al., 2014
Paatsikkajoki*
Finland 2 minor 1-1.5 (W)SW-NE
1-3 Reverse Post-glacial Sutinen et al., 2014
Kultima* Finland 1 major 4-10 NW-SE 4 Reverse Subglacial Sutinen et al., 2014
Sevetti Finland 1 major 4-15 NE-SW(S) 12 Reverse Possibly subglacial Sutinen et al., 2009
Pärvie * Sweden Several 3-10 NNE 155 Reverse Deglaciation phase Lagerbäck, 1979 Lainio-Suijavaara *
Sweden 4 10-30 NNE-SSW to S
3-50 Reverse During deglaciation Lagerbäck, 1979
Merasjärvi *
Sweden 1 10-15 SSW-NNE 8 Reverse Post-glacial Lagerbäck, 1979
Lansjärv* Sweden 4 major, Several
small
2-10 SSW-NNE 50 Reverse Post-glacial, under sea
Lagerbäck, 1979
Burträsk * Sweden Several 5-15 NE 40 Reverse Late/post-glacial Lagerbäck, 1979 Röjnoret * Sweden Several 5-15 N 56 Reverse Post-glacial
Sorsele* Sweden 1.5-2 SW-NE 1-2
Reverse Post-glacial Ransed and Wahlroos, 2007
Ismunden* Sweden 2 3-5 ENE-WSW
Reverse
Bollnäs* Sweden under SGU´s investigation
Storuman* Sweden Several 2-10 NW-SE 10 Johansson and Ransed, 2003
Malå* Sweden 4 small scarps 1 -
Stuoragurra
Norway 3 separate sections
7 SW-NE 40° 80 Reverse Post-glacial Olesen, 1988
Nordmannvik
Norway 1 1 NW-SE 2 Normal Post-glacial Tolgensbakk and Sollid, 1988
Kuivamäki et al. (1998) also studied Russian Karelia structures indicated as post-glacial faults in Lake
Onega area (Lukashov, 1995), however, the evidence was not conclusive and these possible post-
glacial faults are not included in this study. Using marine geophysical mapping and borehole cores,
Jakobsson et al. (2014) suggests that there is an 80 km long fault system in Lake Vättern which may
have ruptured in a post-glacial earthquake with 13 m vertical offset at the end of the Younger Dryas
100
(ca. 11.5 ka). Other post-glacial seismic activities have been reported from southern Sweden,
including landslides and turbidites associated with a fault in northern Lake Vättern (Mörner, 1985).
There have furthermore been studies on defining features e.g. disturbed sediment structures,
bedrock cave systems, landslides to seismo-tectonic or glaciotectonic origin (e.g. Mörner, 2003;
Lagerbäck et al., 2005a). In Finland there are also some evidence of microsize (cm-m) post-glacial
faults cutting bedrock and the glacial striations in Ilomantsi area (eastern Finland) (Nenonen and
Huhta, 1993) and in archipelago SW Finland (See Figure 5 in Kuivamäki et al., 1998).
Even though the recent excavations by Rantataro et al. (2011) in the Bay of Bothnia near Hanhikivi
did not reveal any paleoseismic events or structures, the high-resolution echo-sounding profiles from
Bothnian Sea sediments near Olkiluoto (Fig. 3.2.3.1) have revealed two sites with post-glacial
paleoseismicity structures in sediments (e.g. disturbed structures, submarine slides and slumps,
debris-flow structures) (Kotilainen and Hutri, 2004). Hutri et al. (2007) dated these events with
paleomagnetic, biostratigraphy and lithostratigraphical methods give estimated age between 10 650
cal. yr BP and 10 200 cal. yr BP. This age estimation is in line with the Northern Fennoscandian
paleoseismic events, but occurred a few hundred years after the ice had retreated from the Olkiluoto
area (Kukkonen et al., 2010).
Modelling of fault reactivation during glaciations has been performed by e.g. Wu & Hasegawa
(1996a,b), Wu et al. (1999), Lund (2005) and Lund et al. (2009). These model predictions suggest that
the onset of the Fennoscandian fault activity started at 15 ka BP, and that maximum fault instability
was reached during the Younger Dryas and Early Holocene periods 13-10 ka BP. The studies show
that the glacially induced stresses are not sufficient to drive fault rupture on their own, but that it is
the combination of glacial and tectonic stresses that causes the post-glacial earthquakes. In
particular, the tectonic stress field must be reverse for the superposition of glacial and tectonic
stresses to act to destabilize faults at the end of deglaciation (e.g. Lund et al., 2009). This is in good
agreement with the observation that most of the PGFs strike SW-NE, perpendicular to the direction
of ridge-push induced horizontal stresses, and that the fault directions do not follow the outline of
the former Fennoscandian ice dome.
The glacial history of Swedish and Finnish Lapland reveal that two large (Elsterian and Saalian) ice
sheets and three consecutive Weichselian ice sheets have loaded the region with known PGFs.
Lagerbäck and Sundh (2008) found no evidence of reactivation of the faults during the previous
Weichselian glacial periods, it is however not known if they ruptured at the end of the earlier
Pleistocene glaciations. The modeling results discussed above indicate that faults will reactivate at
the end of all glacial periods, if the faults are critically stressed at the start of glaciation. However, as

101
strain accumulation in the Fennoscandian Shield is low (e.g. Scherneck et al., 2010), it may take
100,000 years or more to reload a fault after a large earthquake.
102
4 Seismicity and seismic parameters
4.1 Seismicity
M. Uski & B. Lund
Fennoscandia is a stable intraplate region characterized by low to moderate seismicity. Historical
earthquakes have magnitudes up to 6.1 (FENCAT). Instrumentally recorded earthquakes have
magnitudes between ML -1 and 5.5 and take place from shallow crustal depths down to 40 km (e.g.
Böðvarsson et al., 2006; Uski et al., 2012). Earthquakes in the study area are generally small and
there are roughly 2 magnitude ≥ 3 events per year. The seismicity in the study area is clustered along
NE–SW-trending zones that are parallel to the Norwegian margin and the opening of the Atlantic
Ocean along the Mid-Atlantic ridge (Figs. 1.2.1 and 4.1.1). A slight change in the general pattern takes
place across an N–S-trending zone running east of the Finnish-Swedish national border (Pajala shear
zone; 10 in Fig. 3.1.2.1). East of this zone, the seismicity rates are lower and the NE–SW trend is less
obvious. Underground mining also causes local perturbations in the stress field, resulting in shallow
mining-induced/influenced seismicity (e.g. Roth and Bungum, 2003) in and around the large mines of
northern Sweden, Kola Peninsula and Pyhäsalmi.
The NE-SW trending earthquake clusters in northern Sweden and Finland have been associated with
PGF zones and western flank of the Gulf of Bothnia (Lagerbäck, 1990; Lindblom et al., 2011; Olesen et
al., 2013; Uski et al., 2003). The most active NE–SW-trending zone in Finland is the Kuusamo-
Kandalaksa zone spatially associated with the Precambrian Auho-Kandalaksha fault zone. Low
magnitude seismic swarms occur within the major 1.7–1.6 Ga rapakivi granite batholith (Wiborg
batholith) in southeastern Finland and Russia (Uski et al., 2006). The coastal areas of northern
Norway are also known for relatively shallow swarm-type seismic activity (Fig. 4.1.1). A total of
10,000 events with local magnitudes up to ML=3.2 have been recorded in Meløy during 1978-79
(Bungum et al., 1979, 1982). Earthquake swarms or sequences have also been observed in Steigen
and Rana (Atakan et al., 1994; Hicks et al., 2000a).
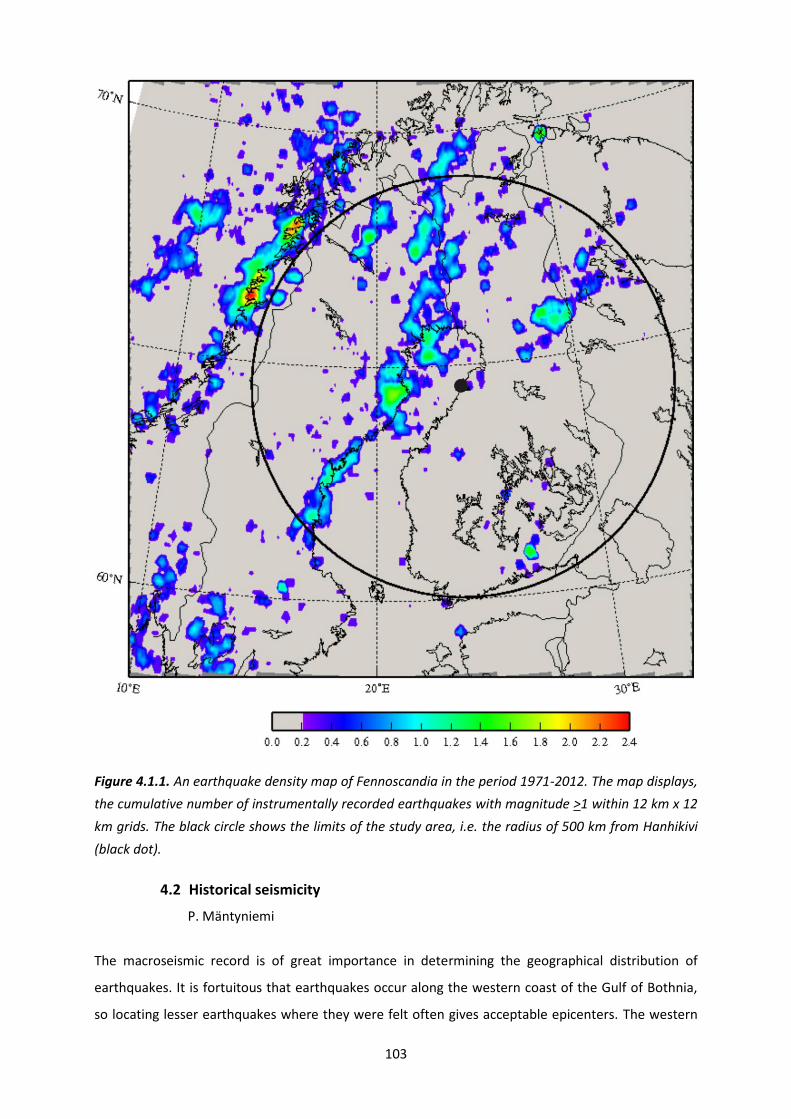
103
Figure 4.1.1. An earthquake density map of Fennoscandia in the period 1971-2012. The map displays,
the cumulative number of instrumentally recorded earthquakes with magnitude >1 within 12 km x 12
km grids. The black circle shows the limits of the study area, i.e. the radius of 500 km from Hanhikivi
(black dot).
4.2 Historical seismicity
P. Mäntyniemi
The macroseismic record is of great importance in determining the geographical distribution of
earthquakes. It is fortuitous that earthquakes occur along the western coast of the Gulf of Bothnia,
so locating lesser earthquakes where they were felt often gives acceptable epicenters. The western
104
coastline of the Gulf of Bothnia has long been recognized as one area of enhanced seismicity in the
Fennoscandian Shield. Early ideas about the spatial distribution of accumulating onshore seismicity
observations were relatively accurate elsewhere as well, so the Vänern area in Sweden, Kuusamo in
Finland, and the Oslo area in southeastern Norway were recognized as areas of recurrent lesser
earthquakes. Instrumental studies gradually improved the location accuracy (e.g. Husebye et al.,
1978; Bungum and Fyen, 1979).
On the other hand, large earthquakes are more likely to awaken wide interest and to be subjected to
detailed studies. Early investigations in the study area were compiled by Moberg (1891, 1901) for the
earthquakes of the 15 and 23 June 1882 and 4 November 1898 (UTC), respectively. They were mostly
lists of observations sorted according to place, but a classification of the strength of earthquake
effects on a three-degree intensity scale was included and the respective isoseismals were plotted on
maps.
A renewed interest in large historical earthquakes in Fennoscandian began in the 2000s. For instance,
Kebeasy and Husebye (2003) re-assessed the Kattegat earthquake of 1759 and Husebye and Kebeasy
(2004) the Lurøy earthquake of 1819. Mäntyniemi (2004a) studied the earthquake of 16 November
1931 and its aftershock in Central Finland, and Mäntyniemi (2008b) reinvestigated the earthquake of
4 November 1898 in northern Finland and Sweden. Tatevossian et al. (2011, 2013) investigated
earthquake activity in the Finnish-Russian border region in the spring of 1626 and in the winter of
1758, respectively. Further searches into the primary written materials of earthquake effects were
made in the framework of the Hanhikivi projects (Mäntyniemi, 2012a,b; see also Appendix 2).
Despite these efforts, many entries in parametric catalogues, such as those of Båth (1956) and
Wahlström (1990), do not rely on a comprehensive investigation with macroseismic intensities
assessed for each reported locality.
An effective and straightforward way to illustrate the strength of an earthquake is by plotting the
area of perceptibility (example in Fig 4.2.1). Such plots show that a number of large-magnitude
earthquakes (ML > 4) occurred in the study region and its vicinity between 1882 and 1909, whereas
the last thirty years exhibit much lower levels of seismic activity. The observation of temporal
variation of seismicity is by no means novel, but nevertheless important for assessing seismicity and
seismic potential. Although two and a half centuries is a very short time at plate interiors and a
rather modest extension of the seismicity record back in time, it turns out to be very helpful.
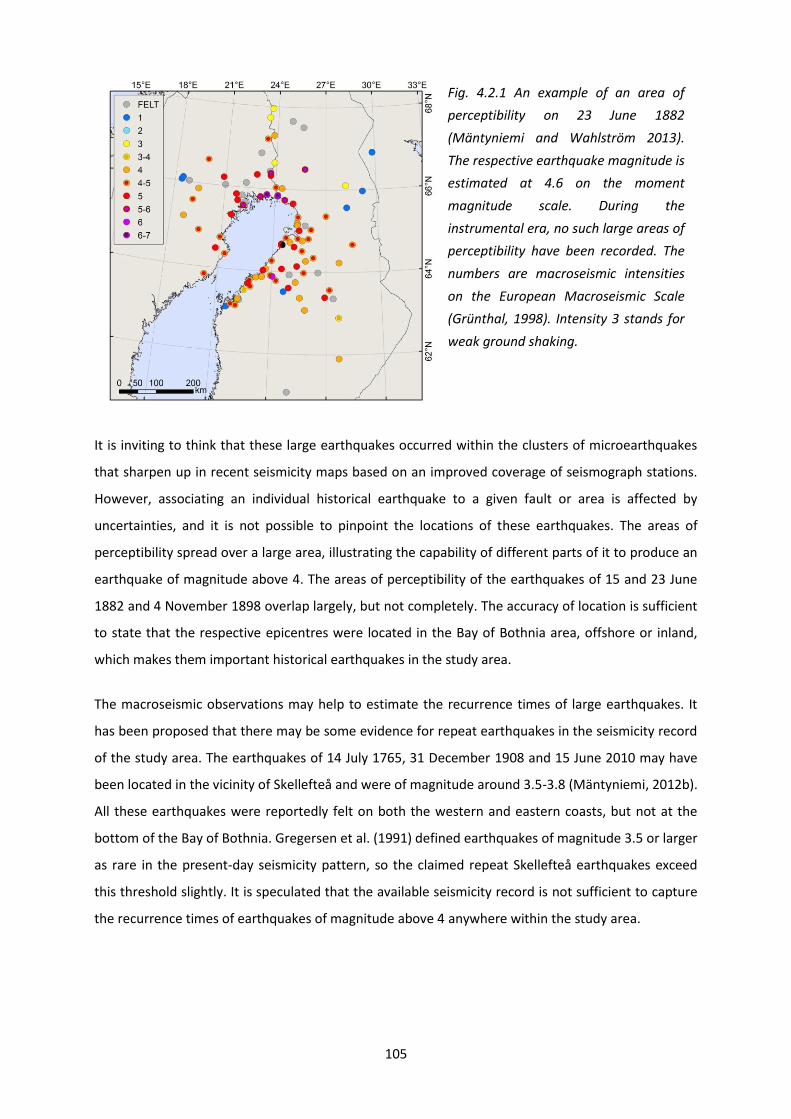
105
It is inviting to think that these large earthquakes occurred within the clusters of microearthquakes
that sharpen up in recent seismicity maps based on an improved coverage of seismograph stations.
However, associating an individual historical earthquake to a given fault or area is affected by
uncertainties, and it is not possible to pinpoint the locations of these earthquakes. The areas of
perceptibility spread over a large area, illustrating the capability of different parts of it to produce an
earthquake of magnitude above 4. The areas of perceptibility of the earthquakes of 15 and 23 June
1882 and 4 November 1898 overlap largely, but not completely. The accuracy of location is sufficient
to state that the respective epicentres were located in the Bay of Bothnia area, offshore or inland,
which makes them important historical earthquakes in the study area.
The macroseismic observations may help to estimate the recurrence times of large earthquakes. It
has been proposed that there may be some evidence for repeat earthquakes in the seismicity record
of the study area. The earthquakes of 14 July 1765, 31 December 1908 and 15 June 2010 may have
been located in the vicinity of Skellefteå and were of magnitude around 3.5-3.8 (Mäntyniemi, 2012b).
All these earthquakes were reportedly felt on both the western and eastern coasts, but not at the
bottom of the Bay of Bothnia. Gregersen et al. (1991) defined earthquakes of magnitude 3.5 or larger
as rare in the present-day seismicity pattern, so the claimed repeat Skellefteå earthquakes exceed
this threshold slightly. It is speculated that the available seismicity record is not sufficient to capture
the recurrence times of earthquakes of magnitude above 4 anywhere within the study area.
Fig. 4.2.1 An example of an area of
perceptibility on 23 June 1882
(Mäntyniemi and Wahlström 2013).
The respective earthquake magnitude is
estimated at 4.6 on the moment
magnitude scale. During the
instrumental era, no such large areas of
perceptibility have been recorded. The
numbers are macroseismic intensities
on the European Macroseismic Scale
(Grünthal, 1998). Intensity 3 stands for
weak ground shaking.
106
4.3 Fault plane solutions
M. Uski, A. Korja & B. Lund
Focal mechanisms are generally classified using Andersonian faulting theory (Anderson, 1951). He
realized that the surface of the Earth must be a principal plane of stress, containing two of the three
principal stress directions (σ1, σ2, σ3). Hence the third principal stress direction is oriented normal to
the Earth's surface. Two of the three principal stresses are horizontal (σH and σh) and one is vertical
(σv). The value and direction of the principal stress defines the mode of faulting. If Mohr-Coulomb
failure criterion is applicable and a coefficient of friction is 0.6 then the direction of rupturing can be
predicted (Fig. 4.3.1). In a strike-slip stress regime, the maximum and the minimum principal stress
are horizontal (σH>σv>σh), and rupturing takes place at approximately 30° angle to the maximum
principal stress (σH). Reverse/thrust faulting takes place when the minimum principal stress is vertical
(σH>σh>σv). The faults would strike perpendicular to the direction of σH, the dip direction is parallel to
σH and dip angle is ~30°. Normal faulting only happens when maximum principal stress (σ1) is vertical
(σv>σH>σh), in which case the strike of the fault is parallel to σH= σ2 and the dip of the fault is ~60°
(~30° to σ1) (Fig. 4.3.2).
In Figure 4.3.2 the faulting mechanisms are associated with earthquake focal mechanisms, so called
beach balls. They are projections on a horizontal plane of the quadrants of compression and tension
of the lower half of a focal sphere surrounding the earthquake source. Fault plane solutions for the
study area are presented in Figure 4.3.3 and Table 4.3.1.
The focal mechanisms in the study area show a combination of mostly strike-slip and reverse faulting
conditions (Fig. 4.3.3). Slunga (1991) showed that in south-central Sweden, earthquake focal
mechanisms are generally of strike-slip type and point to a NW-SE direction for the maximum
horizontal stress. Reverse mechanisms occur more frequently further to the north. Recent focal
mechanism determinations along the Swedish northeast coast (Fig.4.3.3) corroborate these results as
they show predominantly strike-slip faulting. In Finland, reverse and strike-slip mechanisms occur
intermixed over the whole country.
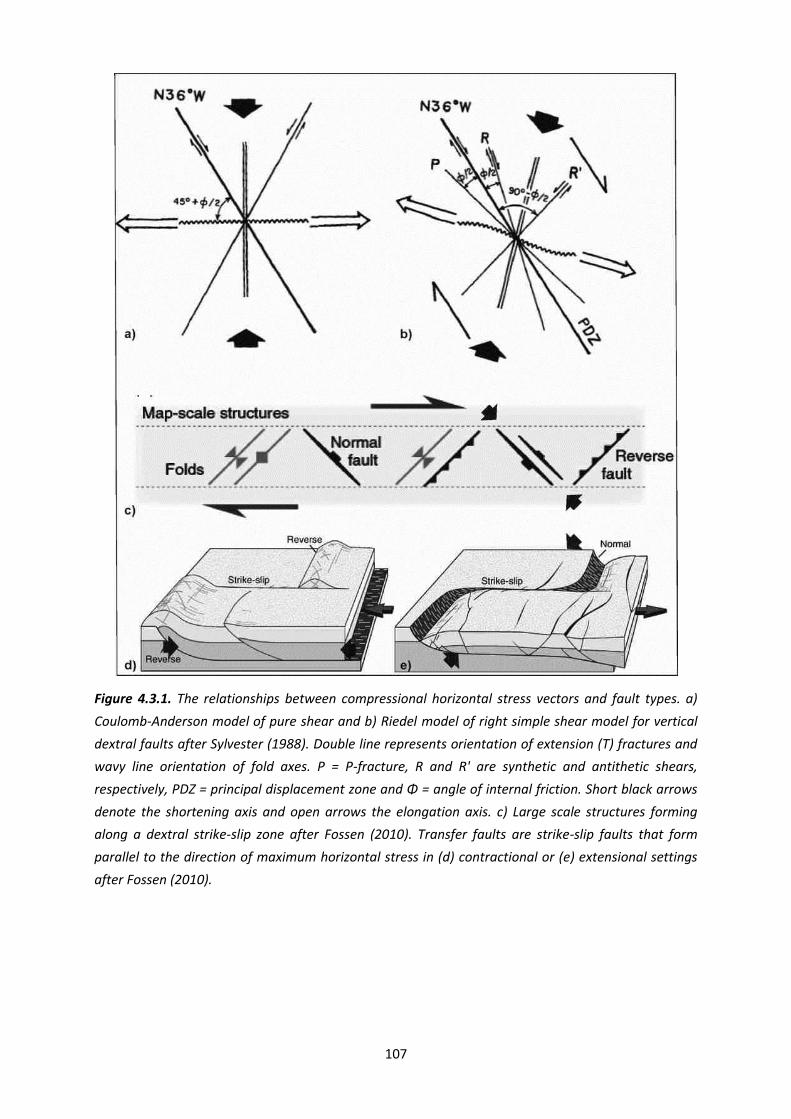
107
Figure 4.3.1. The relationships between compressional horizontal stress vectors and fault types. a)
Coulomb-Anderson model of pure shear and b) Riedel model of right simple shear model for vertical
dextral faults after Sylvester (1988). Double line represents orientation of extension (T) fractures and
wavy line orientation of fold axes. P = P-fracture, R and R' are synthetic and antithetic shears,
respectively, PDZ = principal displacement zone and Φ = angle of internal friction. Short black arrows
denote the shortening axis and open arrows the elongation axis. c) Large scale structures forming
along a dextral strike-slip zone after Fossen (2010). Transfer faults are strike-slip faults that form
parallel to the direction of maximum horizontal stress in (d) contractional or (e) extensional settings
after Fossen (2010).

108
Figure 4.3.2. Earthquake focal mechanisms on stereographic projections (“beach balls”) and their
associated faulting mechanisms modified after Shearer (2009). Fault mechanics are shown for both of
the possible fault planes. Abbreviations: P - compression axis, T - tension axis.
Strike-slip is the dominant component of motion in and around the Gulf of Bothnia, although some
normal faulting solutions have also been reported. First results from the Ostrobothnia local seismic
network agree well with the general pattern. The mechanisms determined so far (no. 37-39, Table
4.3.1, Fig. 4.3.3) are of strike-slip type with a small component of extension, indicating transtension.
The preferred nodal planes are trending approximately NNW-SSE, i.e. parallel to lineaments within
the Raahe–Ladoga shear complex (Valtonen et al., 2014). Also in central Finland, a composite focal
mechanism determined for the ML 3.8 Lappajärvi event (no. 3, Table 4.3.1, Fig. 4.3.3) and its
aftershock indicates strike-slip movement along N-S striking sub-vertical fault plane (Slunga and
Ahjos, 1986).
In the Wiborg batholith, composite fault-plane solutions for the 2003 and 2011 earthquake swarms
correspond to dip-slip motion along WSW-ENE and SW-NE striking subvertical fault planes (no. 30
and 36, Table 4.3.1, Fig. 4.3.3). In a nearby area, source mechanisms of 15 micro-earthquakes are
characterized by strike-slip or reverse motion along subvertical structures (Saari, 1998).
Thrust/reverse mechanisms have also been computed for two shallow events in southern Finland
(no. 27 and 33, Table 4.3.1, Fig. 4.3.3).
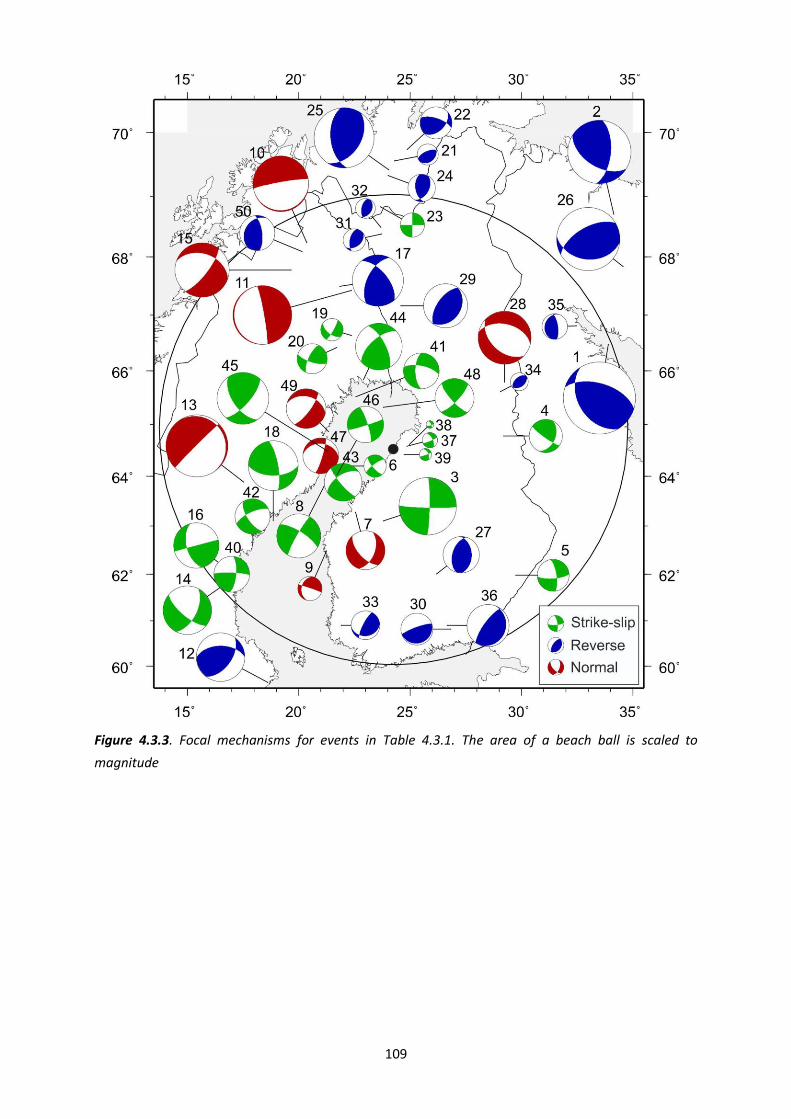
109
Figure 4.3.3. Focal mechanisms for events in Table 4.3.1. The area of a beach ball is scaled to
magnitude

110
Table 4.3.1. A compilation of focal mechanisms for a selected set of earthquakes within the study
area. Beach balls are shown in figure 4.3.3.
Ev.no Date (YrMonDay)
Lat. oN Lon. oE ML Strike Dip Rake Ref.*
1 19670520 66.60 33.70 4.8 287 57 64 A
2 19810410 68.70 37.20 4.2 122 52 39 A
3 19790217 63.08 23.92 3.8 1 85 -4 B
4 19801128 64.78 29.20 2.2 125 81 48 B
5 19810327 61.98 29.75 2.1 351 73 -17 B
6 19830428 64.20 22.43 1.5 139 73 -15 B
7 19830825 63.28 22.55 2.6 138 61 -134 B
8 19840302 63.80 21.14 2.9 302 73 -173 B
9 19840315 62.49 21.25 1.6 288 87 -122 B
10 19670413 68.10 20.80 3.7 260 85 -90 C
11 19750811 67.50 22.50 3.9 350 85 -90 C
12 19791223 59.63 18.62 3.1 36 54 51 C
13 19830929 63.89 17.53 4.1 225 88 -82 C
14 19860125 61.80 16.90 3.2 130 70 -146 C
15 19870419 67.80 19.80 3.6 38 74 -127 C
16 19870723 61.70 17.50 3.0 75 90 -35 C
17 19880516 67.50 22.00 3.4 320 60 40 C
18 19890725 63.03 18.82 3.2 90 57 -57 C
19 19870527 66.61 22.42 1.5 30 80 -34 D
20 19870718 66.50 21.23 2.0 205 70 20 D
21 19890109 69.46 24.64 1.7 45 30 70 E
22 19890713 69.63 25.27 2.5 45 45 35 E
23 19891116 68.75 23.60 1.9 0 90 0 E
24 19910413 69.29 24.08 2.6 30 45 120 E
25 19960121 69.34 24.00 3.8 174 53 64 E
26 19990817 67.84 34.56 4.3 240 60 70 F
27 20000511 62.02 26.25 2.4 358 42 76 G
28 20000915 65.79 29.23 3.5 133 47 -69 G
29 20010502 67.17 24.62 2.9 35 30 90 G
30 20030509 60.81 26.83 2.1 250 80 90 H
31 20070116 68.38 23.73 1.5 193 57 66 I
32 20070225 68.47 23.69 1.3 191 56 78 I
33 20070103 60.91 21.91 1.9 207 76 69 J
34 20060117 65.64 29.03 1.2 226 50 83 K
35 20060218 66.80 32.49 1.7 351 70 79 K
36 20111201 60.90 26.67 2.8 216 75 95 L
37 20130526 64.59 24.87 1.0 333 61 -9 M
38 20131207 64.62 24.98 0.5 333 66 -26 M
39 20131216 64.42 24.73 0.8 335 51 -9 M
40 20061020 62.03 17.62 2.4 5 70 8 N
41 20080918 65.52 22.56 2.4 282 67 -151 N
42 20081120 62.61 17.93 2.3 246 70 -154 N
43 20090505 63.68 21.48 2.5 237 57 -166 N
44 20090722 65.84 22.91 3.1 229 62 154 N
45 20100615 64.49 21.30 3.5 145 58 24 N
46 20110131 64.03 21.72 2.4 342 80 176 N
47 20111216 64.40 20.99 2.4 274 32 -15 N
48 20120518 65.33 23.80 2.6 44 75 165 N
49 20121002 64.87 21.34 2.6 286 38 -26 N
50 20130411 68.09 20.14 2.3 213 29 127 N
* References: A: Assinovskaya (1986); B: Slunga and Ahjos (1986); C: Arvidsson and Kulhanek (1994); D: Arvidsson (1996); E: Bungum and Lindholm (1996); F: Roth and Bungum ( 2003); G: Uski et al. (2003); H: Uski et al. (2006); I: Uski and Korja (2007); J: Saari (2008); K: Uski et al. (2012); L: Smedberg et al. (2012); M: Valtonen
et al. (2014); N: SNSN database, Böðvarsson and Lund (2003).
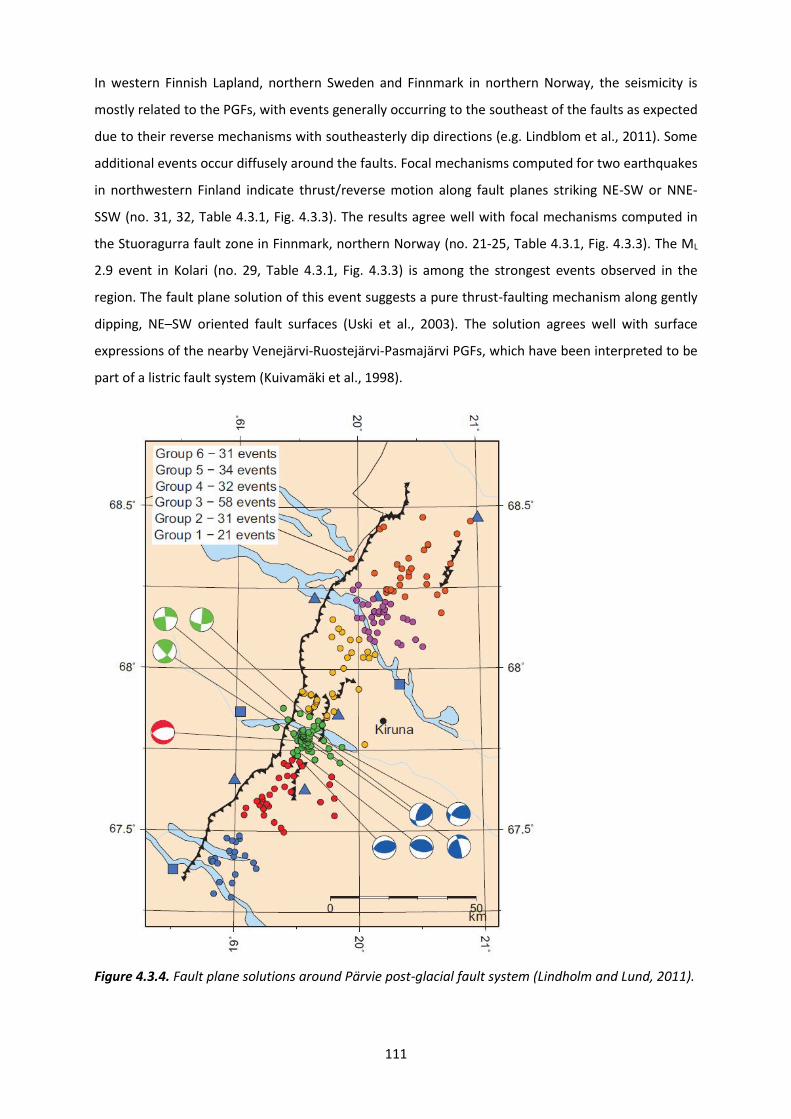
111
In western Finnish Lapland, northern Sweden and Finnmark in northern Norway, the seismicity is
mostly related to the PGFs, with events generally occurring to the southeast of the faults as expected
due to their reverse mechanisms with southeasterly dip directions (e.g. Lindblom et al., 2011). Some
additional events occur diffusely around the faults. Focal mechanisms computed for two earthquakes
in northwestern Finland indicate thrust/reverse motion along fault planes striking NE-SW or NNE-
SSW (no. 31, 32, Table 4.3.1, Fig. 4.3.3). The results agree well with focal mechanisms computed in
the Stuoragurra fault zone in Finnmark, northern Norway (no. 21-25, Table 4.3.1, Fig. 4.3.3). The ML
2.9 event in Kolari (no. 29, Table 4.3.1, Fig. 4.3.3) is among the strongest events observed in the
region. The fault plane solution of this event suggests a pure thrust-faulting mechanism along gently
dipping, NE–SW oriented fault surfaces (Uski et al., 2003). The solution agrees well with surface
expressions of the nearby Venejärvi-Ruostejärvi-Pasmajärvi PGFs, which have been interpreted to be
part of a listric fault system (Kuivamäki et al., 1998).
Figure 4.3.4. Fault plane solutions around Pärvie post-glacial fault system (Lindholm and Lund, 2011).
112
In the vicinity of the Pärvie post-glacial fault, the focal mechanisms are very variable, both in terms of
faulting regime and nodal plane directions (Fig. 4.3.4; Lindblom and Lund, 2011). A majority of the
212 mechanisms show dominant sinistral strike-slip faulting, 25 % have reverse faulting and 15 %
normal faulting. The strain along the fault is in general reverse with obliquity toward strike-slip. This
indicates transpressional regime.
Available source mechanisms for the Kuusamo region suggest dominantly reverse or thrust type
faulting along NNE–SSW striking fault planes, albeit contrasting mechanisms and variable styles of
fault slip are also found. A normal faulting mechanism has been computed for the ML 3.5 earthquake
that occurred in Kuusamo on September 15 2000 (no. 28, Table 4.3.1, Fig. 4.3.3; Uski et al., 2003).
The source mechanism for the ML 4.8 Kandalaksha event implies predominantly reverse motion
along a fault plane with NW–SE strike (no.1, Table 4.3.1, Fig. 4.3.3). A reverse mechanism with
different strike orientation, N-S, has been computed for a shallow earthquake that took place on 18
February 2006 at the western flank of the Kandalaksha Gulf (no. 35, Table 4.3.1, Fig. 4.3.3).
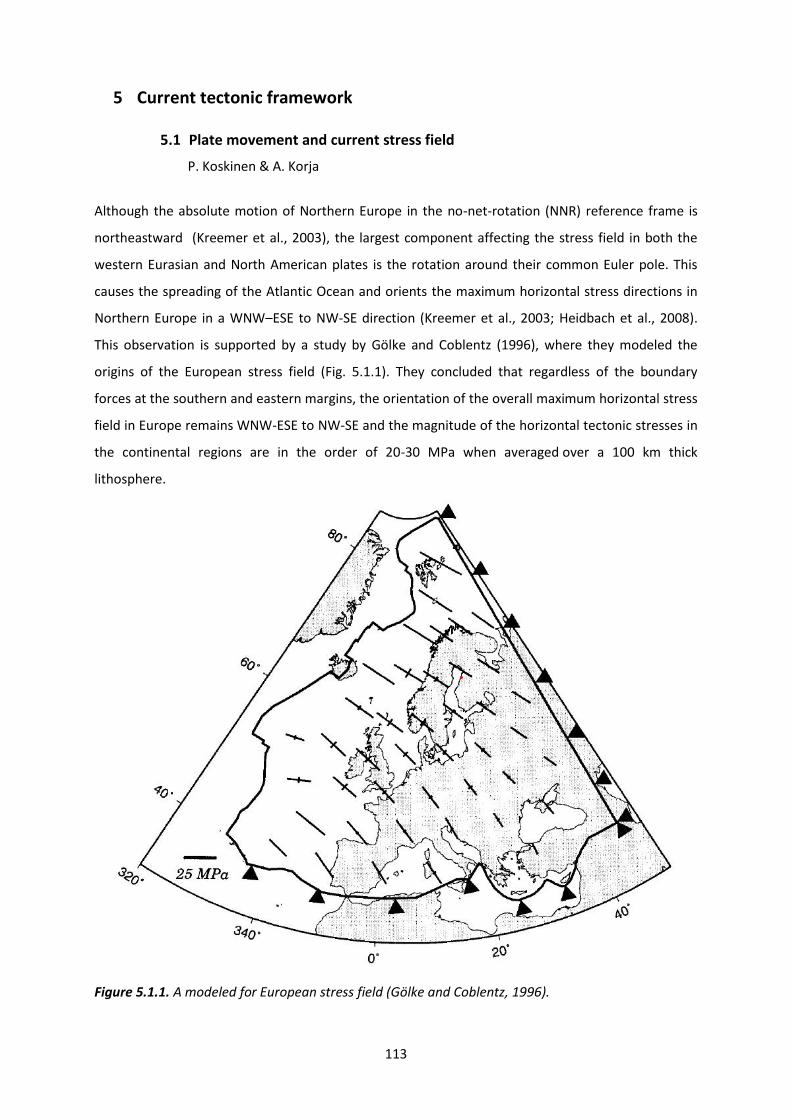
113
5 Current tectonic framework
5.1 Plate movement and current stress field
P. Koskinen & A. Korja
Although the absolute motion of Northern Europe in the no-net-rotation (NNR) reference frame is
northeastward (Kreemer et al., 2003), the largest component affecting the stress field in both the
western Eurasian and North American plates is the rotation around their common Euler pole. This
causes the spreading of the Atlantic Ocean and orients the maximum horizontal stress directions in
Northern Europe in a WNW–ESE to NW-SE direction (Kreemer et al., 2003; Heidbach et al., 2008).
This observation is supported by a study by Gölke and Coblentz (1996), where they modeled the
origins of the European stress field (Fig. 5.1.1). They concluded that regardless of the boundary
forces at the southern and eastern margins, the orientation of the overall maximum horizontal stress
field in Europe remains WNW-ESE to NW-SE and the magnitude of the horizontal tectonic stresses in
the continental regions are in the order of 20-30 MPa when averaged over a 100 km thick
lithosphere.
Figure 5.1.1. A modeled for European stress field (Gölke and Coblentz, 1996).

114
Figure 5.1.2. A comparison of the stress indicators (classes A-D; Heidbach et al., 2008) and the
movement of Fennoscandia relative to North America (Jules Verne Voyager, 2011). Purple vectors are
observed geodetic velocities that have been rotated into a best-fit model reference frame for the
model GSRM 1.2. Stress regimes are indicated with colours: pink- normal (σv>σH>σh), green- strike-
slip (σH>σv>σh); light blue and blue – thrust (σH>σh>σv). Hanhikivi site: red dot.
The azimuth of the plate motion direction relative to North America is ~119° for southernmost
Finland and 128° for northern Lapland, with a standard deviation of ~4° when using the ITRF2000
reference frame (UNAVCO Plate Motion Calculator, 2012). Thus, the azimuth falls between 115° and
132° and the azimuth increases from south to north. For Sweden, the same azimuth interval is 110°-
127°. The movement of the Eurasian relative to the North American plate is compared with the
observed regional stress field indicators from the World Stress Map 2008 database (Heidbach et al.,
2008) in Figure 5.1.2.
5.2 Orientation of the maximum horizontal stress
P. Koskinen & A. Korja
The azimuth data from the World Stress Map (WSM) 2008 database (Heidbach et al., 2008) suggests
that the maximum horizontal stress in Fennoscandia is oriented in a WNW-ESE to NW-SE direction
(Fig. 5.2.1). The orientation of maximum horizontal crustal stress indicators (σH) in Finland and
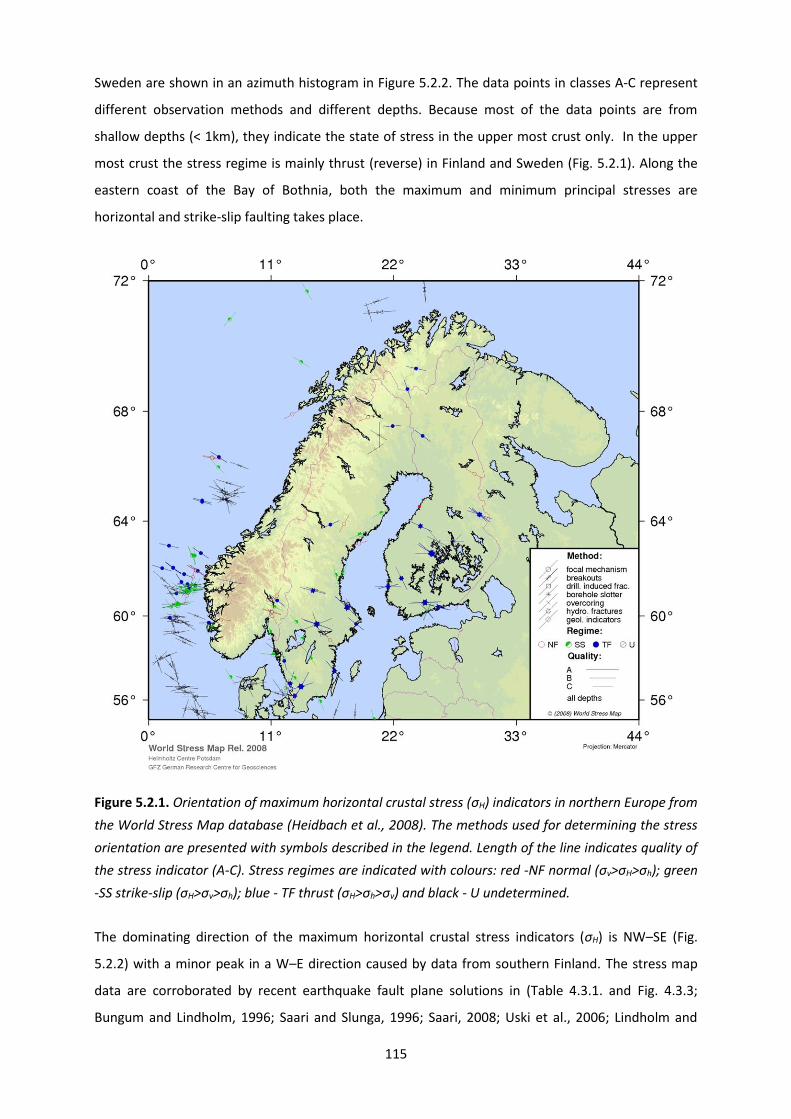
115
Sweden are shown in an azimuth histogram in Figure 5.2.2. The data points in classes A-C represent
different observation methods and different depths. Because most of the data points are from
shallow depths (< 1km), they indicate the state of stress in the upper most crust only. In the upper
most crust the stress regime is mainly thrust (reverse) in Finland and Sweden (Fig. 5.2.1). Along the
eastern coast of the Bay of Bothnia, both the maximum and minimum principal stresses are
horizontal and strike-slip faulting takes place.
Figure 5.2.1. Orientation of maximum horizontal crustal stress (σH) indicators in northern Europe from
the World Stress Map database (Heidbach et al., 2008). The methods used for determining the stress
orientation are presented with symbols described in the legend. Length of the line indicates quality of
the stress indicator (A-C). Stress regimes are indicated with colours: red -NF normal (σv>σH>σh); green
-SS strike-slip (σH>σv>σh); blue - TF thrust (σH>σh>σv) and black - U undetermined.
The dominating direction of the maximum horizontal crustal stress indicators (σH) is NW–SE (Fig.
5.2.2) with a minor peak in a W–E direction caused by data from southern Finland. The stress map
data are corroborated by recent earthquake fault plane solutions in (Table 4.3.1. and Fig. 4.3.3;
Bungum and Lindholm, 1996; Saari and Slunga, 1996; Saari, 2008; Uski et al., 2006; Lindholm and
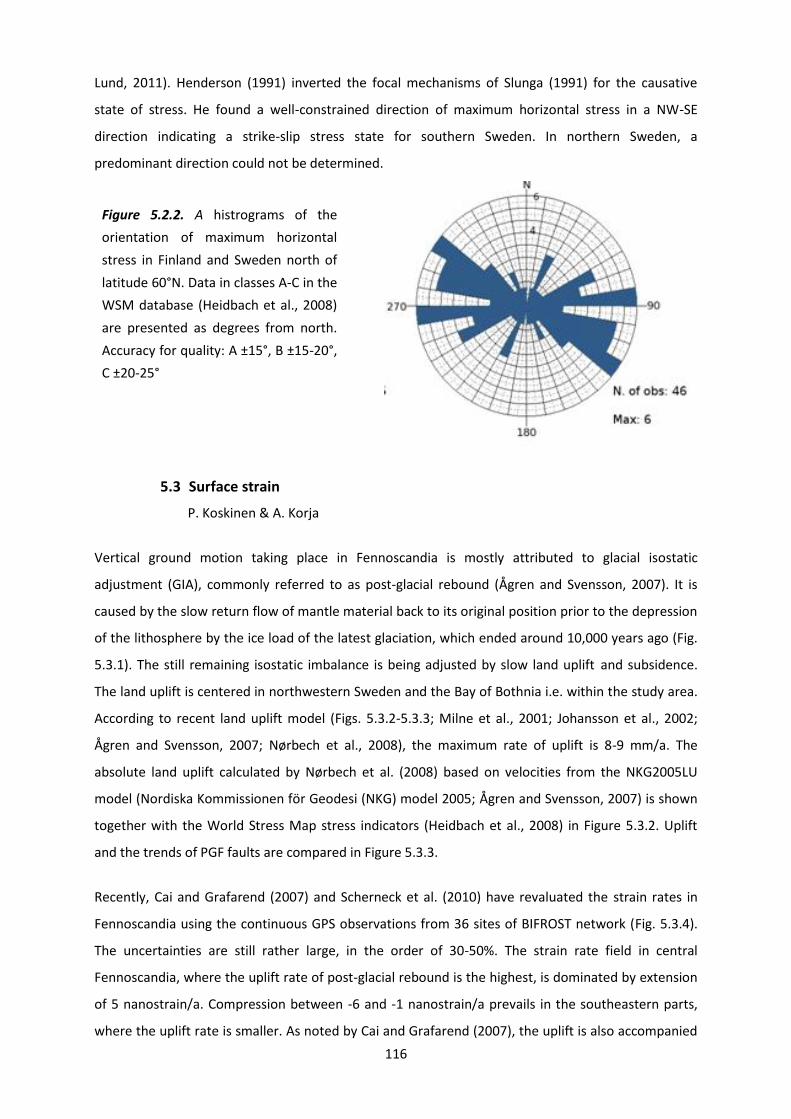
116
Lund, 2011). Henderson (1991) inverted the focal mechanisms of Slunga (1991) for the causative
state of stress. He found a well-constrained direction of maximum horizontal stress in a NW-SE
direction indicating a strike-slip stress state for southern Sweden. In northern Sweden, a
predominant direction could not be determined.
5.3 Surface strain
P. Koskinen & A. Korja
Vertical ground motion taking place in Fennoscandia is mostly attributed to glacial isostatic
adjustment (GIA), commonly referred to as post-glacial rebound (Ågren and Svensson, 2007). It is
caused by the slow return flow of mantle material back to its original position prior to the depression
of the lithosphere by the ice load of the latest glaciation, which ended around 10,000 years ago (Fig.
5.3.1). The still remaining isostatic imbalance is being adjusted by slow land uplift and subsidence.
The land uplift is centered in northwestern Sweden and the Bay of Bothnia i.e. within the study area.
According to recent land uplift model (Figs. 5.3.2-5.3.3; Milne et al., 2001; Johansson et al., 2002;
Ågren and Svensson, 2007; Nørbech et al., 2008), the maximum rate of uplift is 8-9 mm/a. The
absolute land uplift calculated by Nørbech et al. (2008) based on velocities from the NKG2005LU
model (Nordiska Kommissionen för Geodesi (NKG) model 2005; Ågren and Svensson, 2007) is shown
together with the World Stress Map stress indicators (Heidbach et al., 2008) in Figure 5.3.2. Uplift
and the trends of PGF faults are compared in Figure 5.3.3.
Recently, Cai and Grafarend (2007) and Scherneck et al. (2010) have revaluated the strain rates in
Fennoscandia using the continuous GPS observations from 36 sites of BIFROST network (Fig. 5.3.4).
The uncertainties are still rather large, in the order of 30-50%. The strain rate field in central
Fennoscandia, where the uplift rate of post-glacial rebound is the highest, is dominated by extension
of 5 nanostrain/a. Compression between -6 and -1 nanostrain/a prevails in the southeastern parts,
where the uplift rate is smaller. As noted by Cai and Grafarend (2007), the uplift is also accompanied
Figure 5.2.2. A histrograms of the
orientation of maximum horizontal
stress in Finland and Sweden north of
latitude 60°N. Data in classes A-C in the
WSM database (Heidbach et al., 2008)
are presented as degrees from north.
Accuracy for quality: A ±15°, B ±15-20°,
C ±20-25°

117
by lateral strain in the order of 1-2 nanostrain/a that is caused by the Earth's surface curving, tilting
and rising.
Figure 5.3.2. A comparison of the absolute land uplift velocity model (NKG_RF03vel; Nørbech et al.,
2008) and stress indicators (Heidbach et al., 2008). Uplift velocity is expressed in mm/a. Stress
regimes are indicated with colours: red -NF normal (σv>σH>σh); green -SS strike-slip (σH>σv>σh); blue -
TF thrust (σH>σh>σv). Hanhikivi site: black dot.
Figure 5.3.1. A schematic model of the
uplift and subsidence processes during a)
glaciations and b) deglaciation.
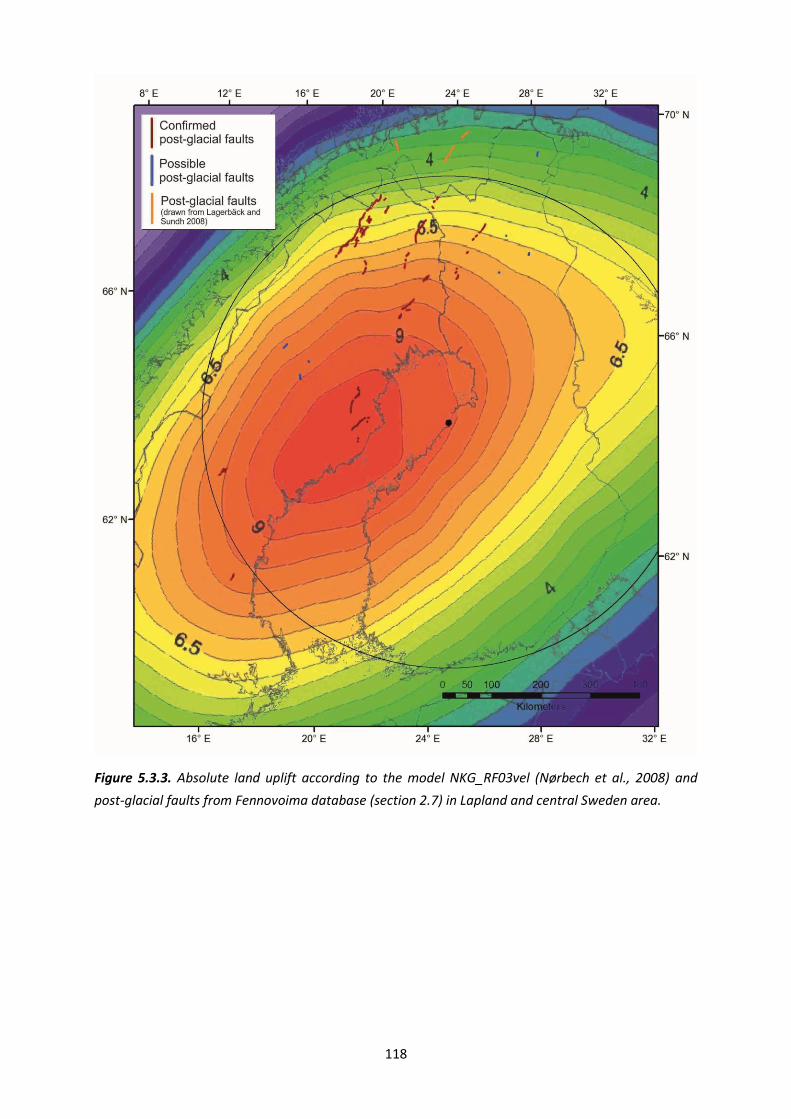
118
Figure 5.3.3. Absolute land uplift according to the model NKG_RF03vel (Nørbech et al., 2008) and
post-glacial faults from Fennovoima database (section 2.7) in Lapland and central Sweden area.

119
Figure 5.3.4. A map of the principal strain rates and associated residual velocities in Fennoscandia
based on GPS triangulation between 36 BIFROST sites. (Cai and Grafarend, 2007). Red arrow –
direction of extension; blue arrow – direction contraction; black arrows – direction of residual
velocity.
5.4 Changes in the stress field imposed by changes in crustal and lithospheric thickness
A. Korja
Pascal and Cloething (2009) suggested that the stress field in Scandinavia is affected by local and
regional changes in the thickness of the crust and lithosphere and in topographic elevation (Fig.
5.4.1) in addition to tectonic forces or rebound stresses. The local changes affect the level of
gravitational potential energy (GPE) which in turn modifies the horizontal stresses stemming from
plate movements and changes in the plate velocity fields (Ghosh et al., 2009; Pascal and Cloething,
2009; Zhu and Tromp, 2013). Earlier Hagaseva (1985) suggested that the large thickness changes of
the crust modify the effect of ridge push forces on continental margins locally. Fejerskov and
Lindholm (2000) suggested the change in crustal thickness to affect the local stress fields in Norway.

120
According to them, in areas with thick rigid crust, the ridge push force is distributed over larger width
range and thus the tectonic stress and earthquake activity is reduced. Areas with thinner crust are
marked by higher stress levels and seismic activity, respectively.
Figure 5.4.1. A cartoon illustrating how gravitational stresses affect a passive continental margin
(Pascal and Cloetingh, 2009). The upper panel shows the variation in gravitational potential energy
(GPE) and its associated geoid undulations. a) Continental landmasses are elevated and their GPE
level exceeds GPE values at mid-oceanic ridges: the continent is under extension and adds a lateral
compressive force on its passive margins. b) Continental landmasses are characterized by thick crust
and subdued topography: ridge push forces dominate both onshore and offshore.
The study area includes the thick Precambrian core of the continental Eurasian plate (Grad et al.,
2009; Fig. 5.4.2). Recently, several authors have published crustal thickness maps or the depth to the
Moho boundary maps of Fennoscandia (e.g. Grad et al., 2009; Artemieva and Thybo, 2013). In all of
the maps, the crustal thickness varies markedly across the study area. The largest thicknesses (> 50-
65 km) are found in central and southern Finland, in the Bothnian Sea and in western Lapland. The
Bay of Bothnia and its surroundings, Eastern Lapland, Kola and Karelia and rapakivi areas are
characterized by thicknesses around 40 km. Northern and central Sweden are characterized by
moderate thicknesses of 45-50 km in depth. A marked thinning of the crust takes place below the
Scandes, where the crust thins to 36 km over a short distance.
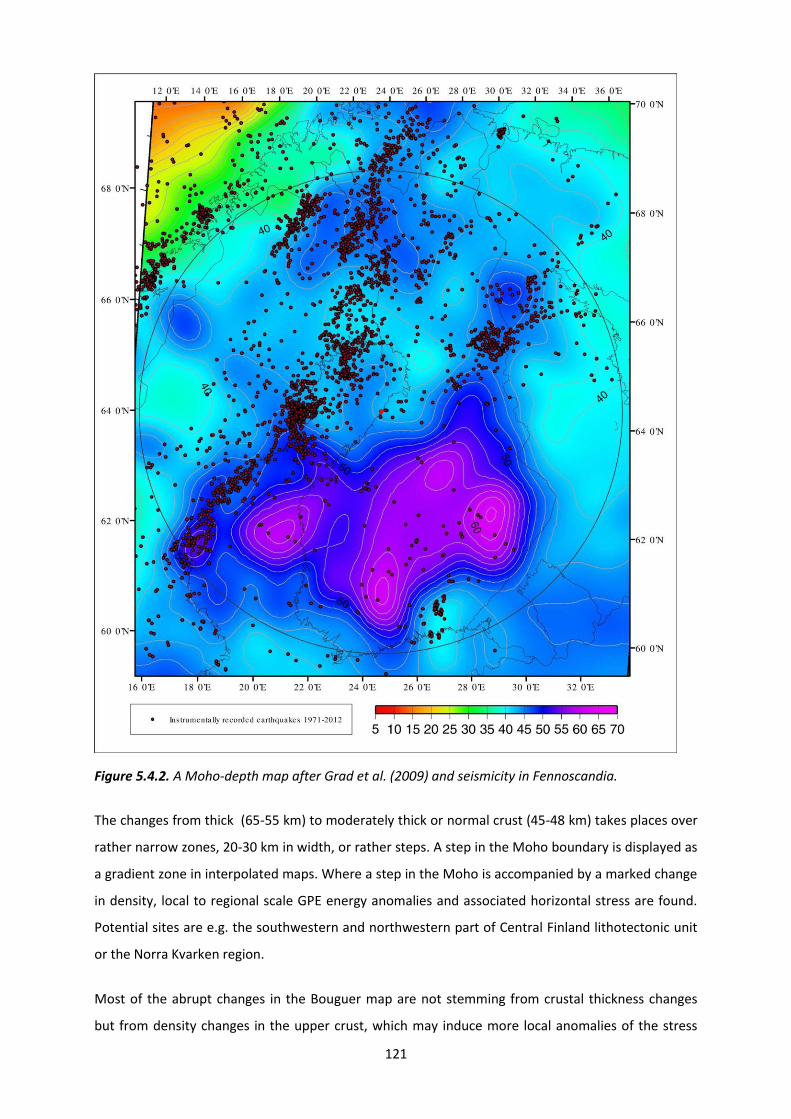
121
Figure 5.4.2. A Moho-depth map after Grad et al. (2009) and seismicity in Fennoscandia.
The changes from thick (65-55 km) to moderately thick or normal crust (45-48 km) takes places over
rather narrow zones, 20-30 km in width, or rather steps. A step in the Moho boundary is displayed as
a gradient zone in interpolated maps. Where a step in the Moho is accompanied by a marked change
in density, local to regional scale GPE energy anomalies and associated horizontal stress are found.
Potential sites are e.g. the southwestern and northwestern part of Central Finland lithotectonic unit
or the Norra Kvarken region.
Most of the abrupt changes in the Bouguer map are not stemming from crustal thickness changes
but from density changes in the upper crust, which may induce more local anomalies of the stress
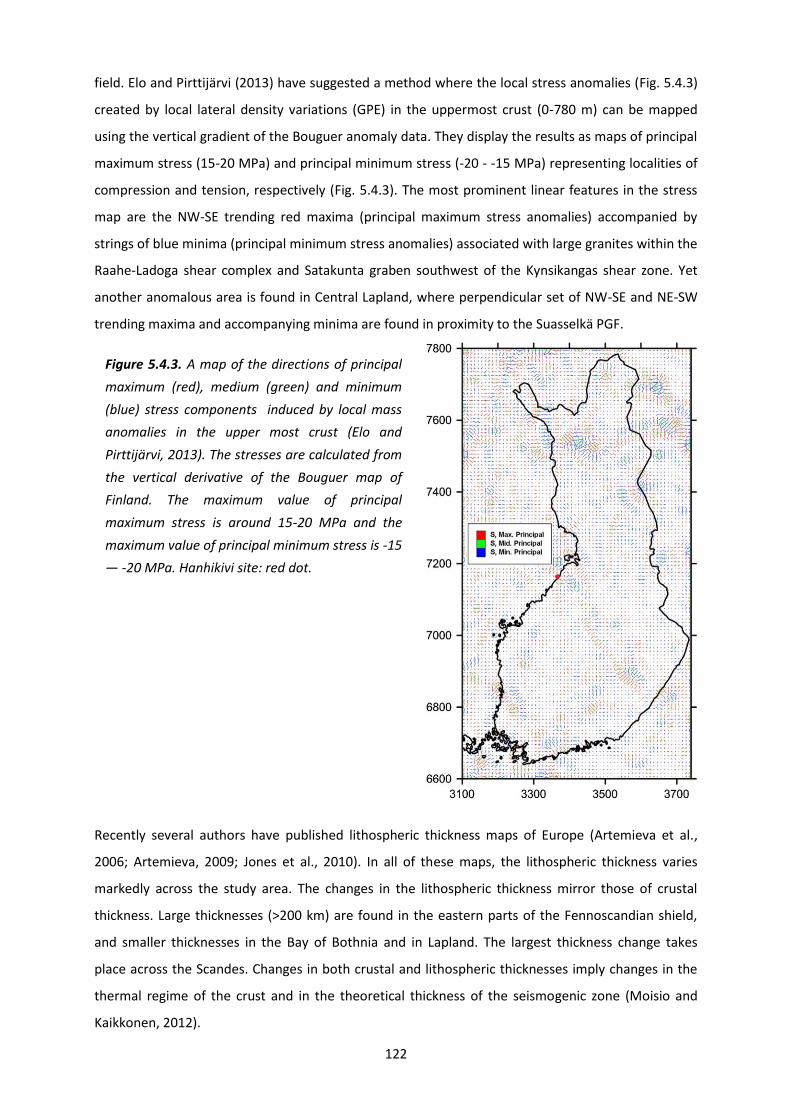
122
field. Elo and Pirttijärvi (2013) have suggested a method where the local stress anomalies (Fig. 5.4.3)
created by local lateral density variations (GPE) in the uppermost crust (0-780 m) can be mapped
using the vertical gradient of the Bouguer anomaly data. They display the results as maps of principal
maximum stress (15-20 MPa) and principal minimum stress (-20 - -15 MPa) representing localities of
compression and tension, respectively (Fig. 5.4.3). The most prominent linear features in the stress
map are the NW-SE trending red maxima (principal maximum stress anomalies) accompanied by
strings of blue minima (principal minimum stress anomalies) associated with large granites within the
Raahe-Ladoga shear complex and Satakunta graben southwest of the Kynsikangas shear zone. Yet
another anomalous area is found in Central Lapland, where perpendicular set of NW-SE and NE-SW
trending maxima and accompanying minima are found in proximity to the Suasselkä PGF.
Recently several authors have published lithospheric thickness maps of Europe (Artemieva et al.,
2006; Artemieva, 2009; Jones et al., 2010). In all of these maps, the lithospheric thickness varies
markedly across the study area. The changes in the lithospheric thickness mirror those of crustal
thickness. Large thicknesses (>200 km) are found in the eastern parts of the Fennoscandian shield,
and smaller thicknesses in the Bay of Bothnia and in Lapland. The largest thickness change takes
place across the Scandes. Changes in both crustal and lithospheric thicknesses imply changes in the
thermal regime of the crust and in the theoretical thickness of the seismogenic zone (Moisio and
Kaikkonen, 2012).
Figure 5.4.3. A map of the directions of principal
maximum (red), medium (green) and minimum
(blue) stress components induced by local mass
anomalies in the upper most crust (Elo and
Pirttijärvi, 2013). The stresses are calculated from
the vertical derivative of the Bouguer map of
Finland. The maximum value of principal
maximum stress is around 15-20 MPa and the
maximum value of principal minimum stress is -15
— -20 MPa. Hanhikivi site: red dot.

123
Figure 5.4.4. The correlation of topography and seismicity (instrumental events 1971-2012, Fig.
2.8.1.2) in Fennoscandia. Line C-C’ locates a topographic cross-section in figure 5.4.5.
The topography (Figs. 2.2.1 and 5.4.4) changes from east to west and south to north. The changes
mimic to some extent the geological boundaries. The most abrupt changes take place in an NW-SE
direction (Figs. 5.4.4 and 5.4.5). The platformal margin to the Atlantic Ocean changes abruptly in
elevation to the Scandian mountain belt along the Norwegian margin which reaches the topographic
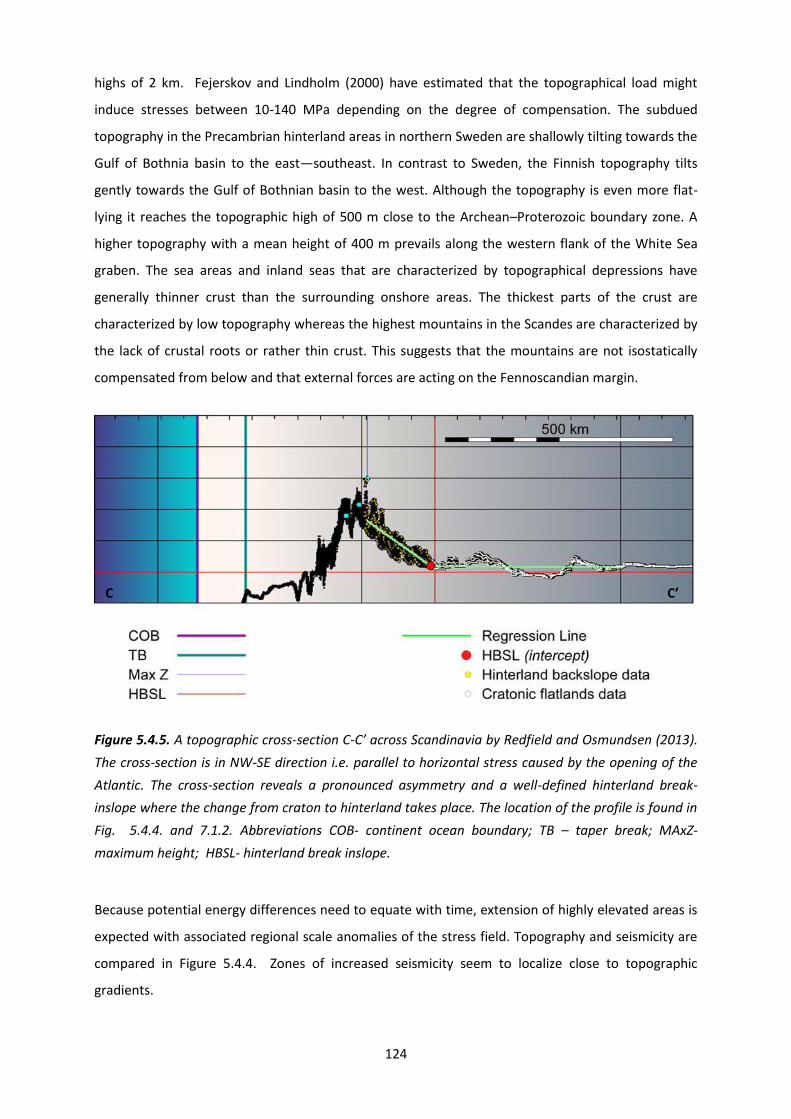
124
highs of 2 km. Fejerskov and Lindholm (2000) have estimated that the topographical load might
induce stresses between 10-140 MPa depending on the degree of compensation. The subdued
topography in the Precambrian hinterland areas in northern Sweden are shallowly tilting towards the
Gulf of Bothnia basin to the east—southeast. In contrast to Sweden, the Finnish topography tilts
gently towards the Gulf of Bothnian basin to the west. Although the topography is even more flat-
lying it reaches the topographic high of 500 m close to the Archean–Proterozoic boundary zone. A
higher topography with a mean height of 400 m prevails along the western flank of the White Sea
graben. The sea areas and inland seas that are characterized by topographical depressions have
generally thinner crust than the surrounding onshore areas. The thickest parts of the crust are
characterized by low topography whereas the highest mountains in the Scandes are characterized by
the lack of crustal roots or rather thin crust. This suggests that the mountains are not isostatically
compensated from below and that external forces are acting on the Fennoscandian margin.
Figure 5.4.5. A topographic cross-section C-C’ across Scandinavia by Redfield and Osmundsen (2013).
The cross-section is in NW-SE direction i.e. parallel to horizontal stress caused by the opening of the
Atlantic. The cross-section reveals a pronounced asymmetry and a well-defined hinterland break-
inslope where the change from craton to hinterland takes place. The location of the profile is found in
Fig. 5.4.4. and 7.1.2. Abbreviations COB- continent ocean boundary; TB – taper break; MAxZ-
maximum height; HBSL- hinterland break inslope.
Because potential energy differences need to equate with time, extension of highly elevated areas is
expected with associated regional scale anomalies of the stress field. Topography and seismicity are
compared in Figure 5.4.4. Zones of increased seismicity seem to localize close to topographic
gradients.
C
C’
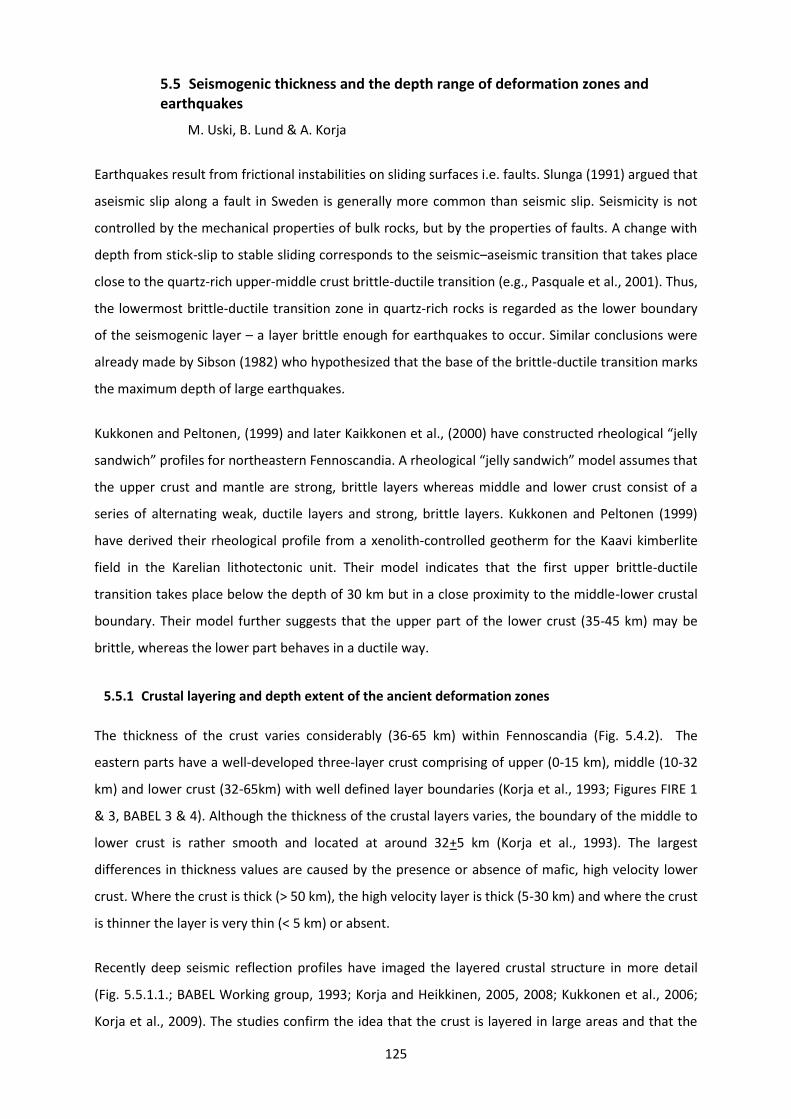
125
5.5 Seismogenic thickness and the depth range of deformation zones and earthquakes
M. Uski, B. Lund & A. Korja
Earthquakes result from frictional instabilities on sliding surfaces i.e. faults. Slunga (1991) argued that
aseismic slip along a fault in Sweden is generally more common than seismic slip. Seismicity is not
controlled by the mechanical properties of bulk rocks, but by the properties of faults. A change with
depth from stick-slip to stable sliding corresponds to the seismic–aseismic transition that takes place
close to the quartz-rich upper-middle crust brittle-ductile transition (e.g., Pasquale et al., 2001). Thus,
the lowermost brittle-ductile transition zone in quartz-rich rocks is regarded as the lower boundary
of the seismogenic layer – a layer brittle enough for earthquakes to occur. Similar conclusions were
already made by Sibson (1982) who hypothesized that the base of the brittle-ductile transition marks
the maximum depth of large earthquakes.
Kukkonen and Peltonen, (1999) and later Kaikkonen et al., (2000) have constructed rheological “jelly
sandwich” profiles for northeastern Fennoscandia. A rheological “jelly sandwich” model assumes that
the upper crust and mantle are strong, brittle layers whereas middle and lower crust consist of a
series of alternating weak, ductile layers and strong, brittle layers. Kukkonen and Peltonen (1999)
have derived their rheological profile from a xenolith-controlled geotherm for the Kaavi kimberlite
field in the Karelian lithotectonic unit. Their model indicates that the first upper brittle-ductile
transition takes place below the depth of 30 km but in a close proximity to the middle-lower crustal
boundary. Their model further suggests that the upper part of the lower crust (35-45 km) may be
brittle, whereas the lower part behaves in a ductile way.
5.5.1 Crustal layering and depth extent of the ancient deformation zones
The thickness of the crust varies considerably (36-65 km) within Fennoscandia (Fig. 5.4.2). The
eastern parts have a well-developed three-layer crust comprising of upper (0-15 km), middle (10-32
km) and lower crust (32-65km) with well defined layer boundaries (Korja et al., 1993; Figures FIRE 1
& 3, BABEL 3 & 4). Although the thickness of the crustal layers varies, the boundary of the middle to
lower crust is rather smooth and located at around 32+5 km (Korja et al., 1993). The largest
differences in thickness values are caused by the presence or absence of mafic, high velocity lower
crust. Where the crust is thick (> 50 km), the high velocity layer is thick (5-30 km) and where the crust
is thinner the layer is very thin (< 5 km) or absent.
Recently deep seismic reflection profiles have imaged the layered crustal structure in more detail
(Fig. 5.5.1.1.; BABEL Working group, 1993; Korja and Heikkinen, 2005, 2008; Kukkonen et al., 2006;
Korja et al., 2009). The studies confirm the idea that the crust is layered in large areas and that the
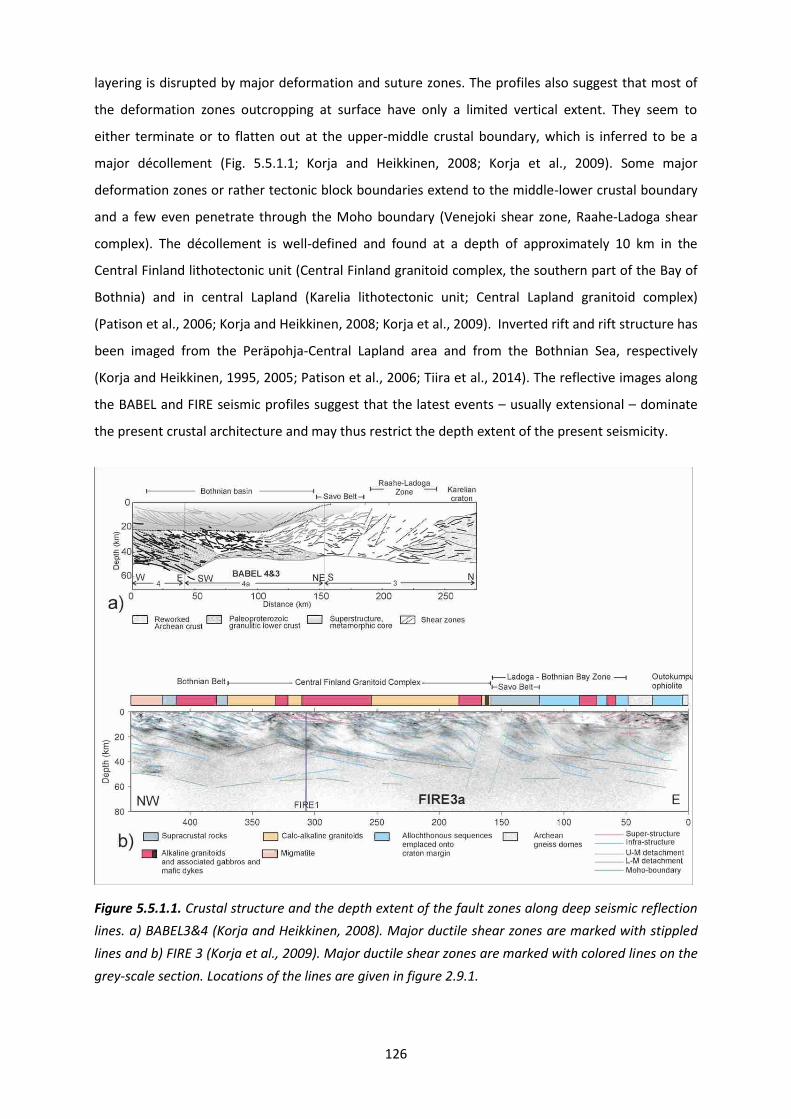
126
layering is disrupted by major deformation and suture zones. The profiles also suggest that most of
the deformation zones outcropping at surface have only a limited vertical extent. They seem to
either terminate or to flatten out at the upper-middle crustal boundary, which is inferred to be a
major décollement (Fig. 5.5.1.1; Korja and Heikkinen, 2008; Korja et al., 2009). Some major
deformation zones or rather tectonic block boundaries extend to the middle-lower crustal boundary
and a few even penetrate through the Moho boundary (Venejoki shear zone, Raahe-Ladoga shear
complex). The décollement is well-defined and found at a depth of approximately 10 km in the
Central Finland lithotectonic unit (Central Finland granitoid complex, the southern part of the Bay of
Bothnia) and in central Lapland (Karelia lithotectonic unit; Central Lapland granitoid complex)
(Patison et al., 2006; Korja and Heikkinen, 2008; Korja et al., 2009). Inverted rift and rift structure has
been imaged from the Peräpohja-Central Lapland area and from the Bothnian Sea, respectively
(Korja and Heikkinen, 1995, 2005; Patison et al., 2006; Tiira et al., 2014). The reflective images along
the BABEL and FIRE seismic profiles suggest that the latest events – usually extensional – dominate
the present crustal architecture and may thus restrict the depth extent of the present seismicity.
Figure 5.5.1.1. Crustal structure and the depth extent of the fault zones along deep seismic reflection
lines. a) BABEL3&4 (Korja and Heikkinen, 2008). Major ductile shear zones are marked with stippled
lines and b) FIRE 3 (Korja et al., 2009). Major ductile shear zones are marked with colored lines on the
grey-scale section. Locations of the lines are given in figure 2.9.1.

127
5.6 Rheological layering
M. Uski, B. Lund & A. Korja
Rheological strength envelops for Finland (Fig. 5.6.1; Table 5.6.1) have been constructed using a
xenolith-controlled geotherm for the Kaavi kimberlite field (Kukkonen and Peltonen, 1999) and 3-
layer crustal models obtained from DSS profiles (Fig. 2.9.1 and 5.6.2; Kaikkonen et al., 2000; Moisio
and Kaikkonen, 2000, 2004, 2006, 2012). The models comprise two relatively weak layers (upper and
middle crust) and a strong layer comprising the lower crust. The lowermost parts of the layers are
very weak zones. Rheologically weak zones locate above the reflective layer boundaries of the
refraction models (Fig. 5.6.1; Moisio and Kaikkonen, 2004). For example in FENNIA model the weak
layers are located above velocity jumps 6.20-6.25 km/s and 6.60-7.00 km/s marking the change from
upper to middle crust and from middle to lower crust, respectively. The depth of brittle-ductile
transition zone (BTZ) is highly dependent on the model parameters. In areas where the crust contains
several layers, BTZ is located at around the depth of 10 km (e.g. Central Finland lithotectonic unit),
whereas in models and areas where crustal layering is not well-developed BTZ may be found at
depths around > 40 km (Karelia lithotectonic unit) (Moisio and Kaikkonen, 2006, 2012).
Moiso and Kaikkonen (2006) have modeled hypothetical situation where Fennoscandia is subjected
to a pressure of 50 MPa. In this case, the stress field is quite uniformly distributed at different crustal
layers. The stress intensity in the upper crust had values between 42 and 45 MPa, the middle crust
around 50 MPa and the lower crust around 60 MPa. In the models, the state of the stress was mostly
governed by elastic parameters rather than by applied rheological structure. At such low stress levels
no ductile deformation was generated, no failure took place and only areas close to surface could
potentially fail. Another modeling study where wet crustal rheologies were used suggested distinct
decoupling of strong upper crust, weak lower crust and strong upper mantle (Moisio and Kaikkonen,
2000). They suggest that decoupling interrupts the transmission of differential stress from the brittle
upper crust to the ductile lower crust and upper mantle.

128
Figure 5.6.1. Examples of rheological strength profiles of Svecofennian crust along DSS profiles a-b)
BALTIC profile with dry wet rheologies (Moisio and Kaikkonen, 2000), c) FENNIA-N (wet upper crust,
dry lower crust) (Moisio and Kaikkonen, 2004), d) southern and central Finland (Moisio and
Kaikkonen, 2006).
Table 5.6.1. An example of material parameters used in layered or jelly-sandwich rheological models
of Central Fennoscandian Shield by Moisio and Kaikkonen (2006).
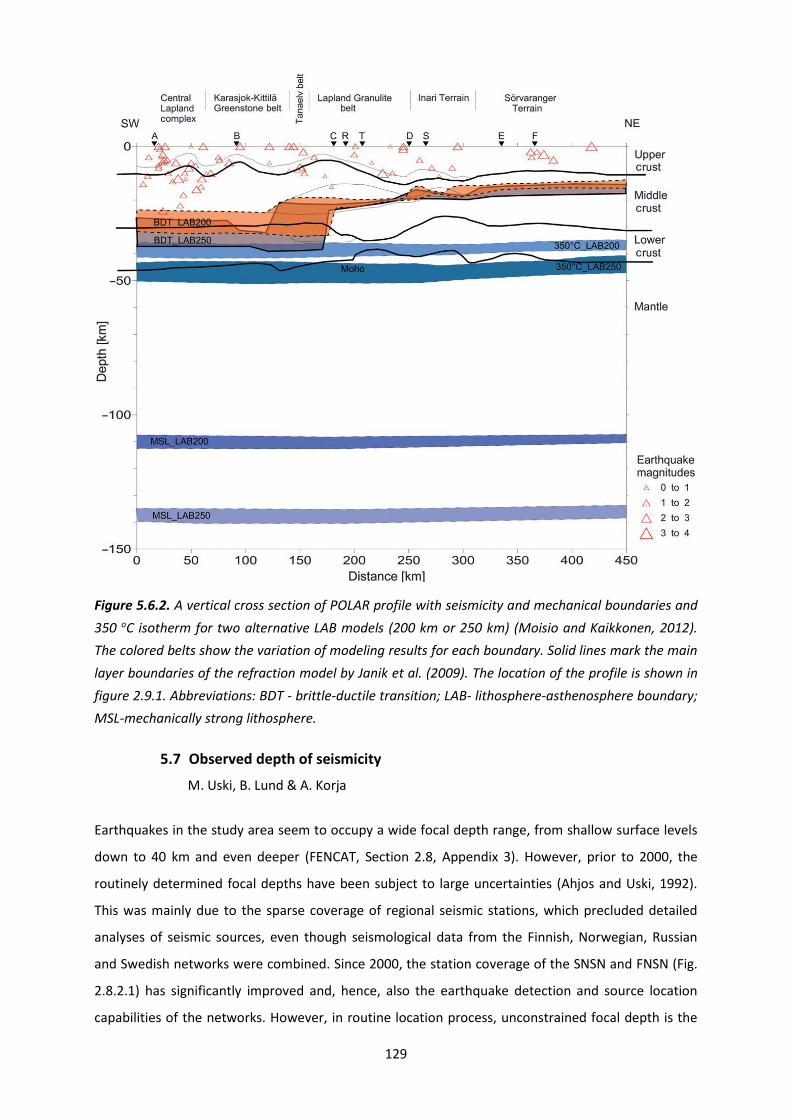
129
Figure 5.6.2. A vertical cross section of POLAR profile with seismicity and mechanical boundaries and
350 oC isotherm for two alternative LAB models (200 km or 250 km) (Moisio and Kaikkonen, 2012).
The colored belts show the variation of modeling results for each boundary. Solid lines mark the main
layer boundaries of the refraction model by Janik et al. (2009). The location of the profile is shown in
figure 2.9.1. Abbreviations: BDT - brittle-ductile transition; LAB- lithosphere-asthenosphere boundary;
MSL-mechanically strong lithosphere.
5.7 Observed depth of seismicity
M. Uski, B. Lund & A. Korja
Earthquakes in the study area seem to occupy a wide focal depth range, from shallow surface levels
down to 40 km and even deeper (FENCAT, Section 2.8, Appendix 3). However, prior to 2000, the
routinely determined focal depths have been subject to large uncertainties (Ahjos and Uski, 1992).
This was mainly due to the sparse coverage of regional seismic stations, which precluded detailed
analyses of seismic sources, even though seismological data from the Finnish, Norwegian, Russian
and Swedish networks were combined. Since 2000, the station coverage of the SNSN and FNSN (Fig.
2.8.2.1) has significantly improved and, hence, also the earthquake detection and source location
capabilities of the networks. However, in routine location process, unconstrained focal depth is the

130
parameter most sensitive to deficiencies in input data (e.g., phase identification and picking errors,
uncertain velocity model). Good azimuthal coverage and distance to the nearest station are also
regarded as prime controls for accurate estimation of source depth. A rule of thumb is that the
distance to the nearest station should not exceed 1.5 times the source depth. The strict criteria are
seldom fulfilled within permanent seismic networks such as the FNSN and SNSN. Thus the shallowest
depth estimates have the largest uncertainties.
Figure 5.7.1. Depth distribution of earthquakes for the period 2000-2012. Depths routinely fixed to 10
or 15 km are not included
A map of earthquake depth distributions for the period 2000-2012 (Fig. 5.7.1) shows that the
majority of earthquakes in the study area occur within the uppermost 15 km of the crust. The depth
distribution differs from the general pattern in four areas and zones: Wiborg batholith, the Skellefteå

131
area, the Kuusamo area and the Hirvaskoski and Oulujärvi shear zones. In the Wiborg batholith, the
earthquake swarms are unusually shallow, mostly occurring within the first 1–2 km of crust. In the
Skellefteå area, roughly 50 % of the events occur in the middle and lower crust, at depths between
16 and 45 km. In the Kuusamo area and in the vicinity of the Hirvaskoski and Oulujärvi shear zones,
the seismicity takes place between depths of a few kilometers and ~30 km. Note that in this region
more than half of the events occur in the middle crust between depths of 15 and 30 km.
Furthermore, a detailed study of depth distribution within the Kuusamo temporary seismic network
(Fig. 5.7.2) suggests that the uppermost crust down to about 8 km is aseismic (Uski et al., 2012). The
apparent aseismicity of the uppermost crust has been explained by the excess of strong, high density
mafic material within the Kuusamo block.
Figure 5.7.2. The focal depth distribution of ‘well-constrained’ earthquakes in northeastern
Fennoscandia for 1990-2009 (Uski et al., 2012). Events within 70 km from the centre of the Kuusamo
network are highlighted by dark grey and those from the surrounding Karelian lithotectonic unit by
light grey. The data are grouped in 2 km intervals. Numbers denote the cumulative percentage of
earthquakes occurring above the marked depth).
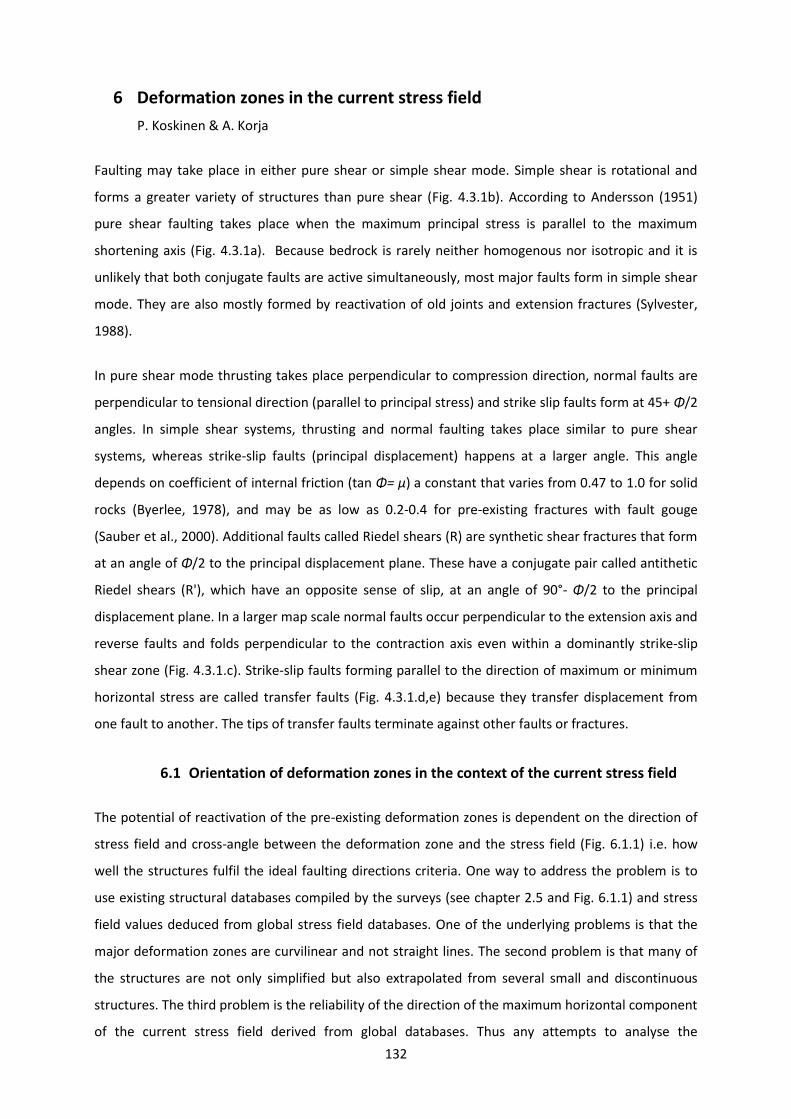
132
6 Deformation zones in the current stress field
P. Koskinen & A. Korja
Faulting may take place in either pure shear or simple shear mode. Simple shear is rotational and
forms a greater variety of structures than pure shear (Fig. 4.3.1b). According to Andersson (1951)
pure shear faulting takes place when the maximum principal stress is parallel to the maximum
shortening axis (Fig. 4.3.1a). Because bedrock is rarely neither homogenous nor isotropic and it is
unlikely that both conjugate faults are active simultaneously, most major faults form in simple shear
mode. They are also mostly formed by reactivation of old joints and extension fractures (Sylvester,
1988).
In pure shear mode thrusting takes place perpendicular to compression direction, normal faults are
perpendicular to tensional direction (parallel to principal stress) and strike slip faults form at 45+ Φ/2
angles. In simple shear systems, thrusting and normal faulting takes place similar to pure shear
systems, whereas strike-slip faults (principal displacement) happens at a larger angle. This angle
depends on coefficient of internal friction (tan Φ= μ) a constant that varies from 0.47 to 1.0 for solid
rocks (Byerlee, 1978), and may be as low as 0.2-0.4 for pre-existing fractures with fault gouge
(Sauber et al., 2000). Additional faults called Riedel shears (R) are synthetic shear fractures that form
at an angle of Φ/2 to the principal displacement plane. These have a conjugate pair called antithetic
Riedel shears (R'), which have an opposite sense of slip, at an angle of 90°- Φ/2 to the principal
displacement plane. In a larger map scale normal faults occur perpendicular to the extension axis and
reverse faults and folds perpendicular to the contraction axis even within a dominantly strike-slip
shear zone (Fig. 4.3.1.c). Strike-slip faults forming parallel to the direction of maximum or minimum
horizontal stress are called transfer faults (Fig. 4.3.1.d,e) because they transfer displacement from
one fault to another. The tips of transfer faults terminate against other faults or fractures.
6.1 Orientation of deformation zones in the context of the current stress field
The potential of reactivation of the pre-existing deformation zones is dependent on the direction of
stress field and cross-angle between the deformation zone and the stress field (Fig. 6.1.1) i.e. how
well the structures fulfil the ideal faulting directions criteria. One way to address the problem is to
use existing structural databases compiled by the surveys (see chapter 2.5 and Fig. 6.1.1) and stress
field values deduced from global stress field databases. One of the underlying problems is that the
major deformation zones are curvilinear and not straight lines. The second problem is that many of
the structures are not only simplified but also extrapolated from several small and discontinuous
structures. The third problem is the reliability of the direction of the maximum horizontal component
of the current stress field derived from global databases. Thus any attempts to analyse the
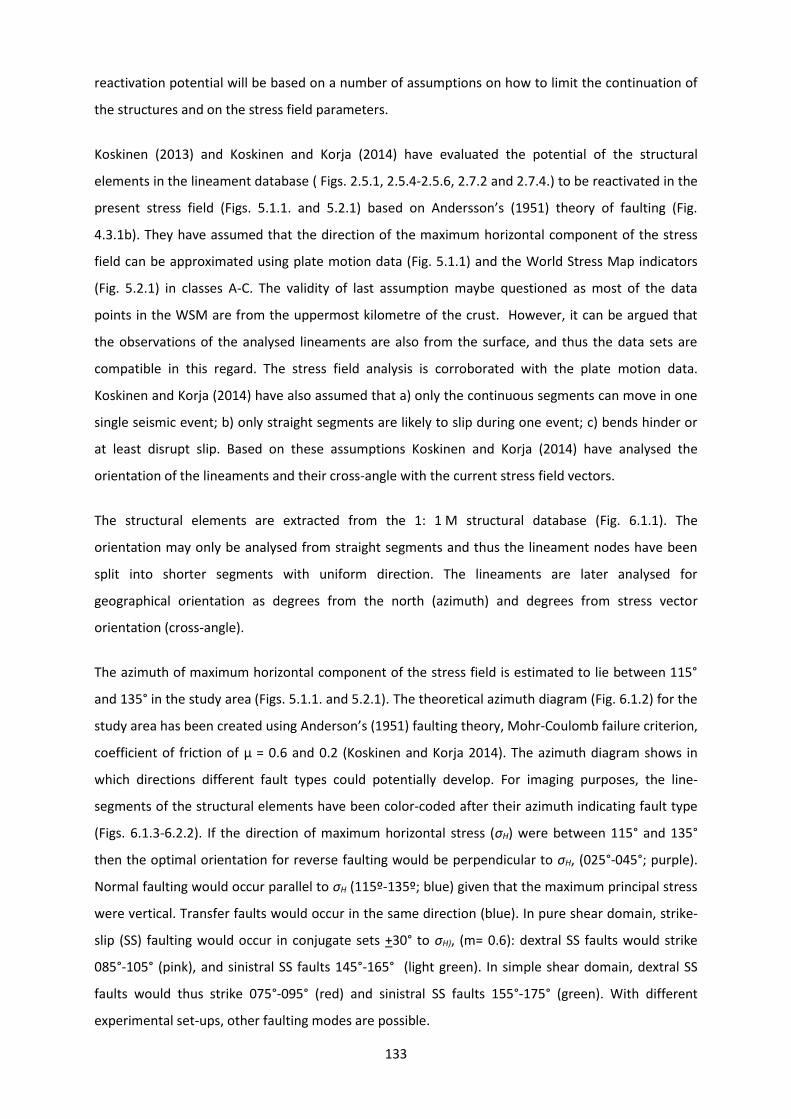
133
reactivation potential will be based on a number of assumptions on how to limit the continuation of
the structures and on the stress field parameters.
Koskinen (2013) and Koskinen and Korja (2014) have evaluated the potential of the structural
elements in the lineament database ( Figs. 2.5.1, 2.5.4-2.5.6, 2.7.2 and 2.7.4.) to be reactivated in the
present stress field (Figs. 5.1.1. and 5.2.1) based on Andersson’s (1951) theory of faulting (Fig.
4.3.1b). They have assumed that the direction of the maximum horizontal component of the stress
field can be approximated using plate motion data (Fig. 5.1.1) and the World Stress Map indicators
(Fig. 5.2.1) in classes A-C. The validity of last assumption maybe questioned as most of the data
points in the WSM are from the uppermost kilometre of the crust. However, it can be argued that
the observations of the analysed lineaments are also from the surface, and thus the data sets are
compatible in this regard. The stress field analysis is corroborated with the plate motion data.
Koskinen and Korja (2014) have also assumed that a) only the continuous segments can move in one
single seismic event; b) only straight segments are likely to slip during one event; c) bends hinder or
at least disrupt slip. Based on these assumptions Koskinen and Korja (2014) have analysed the
orientation of the lineaments and their cross-angle with the current stress field vectors.
The structural elements are extracted from the 1: 1 M structural database (Fig. 6.1.1). The
orientation may only be analysed from straight segments and thus the lineament nodes have been
split into shorter segments with uniform direction. The lineaments are later analysed for
geographical orientation as degrees from the north (azimuth) and degrees from stress vector
orientation (cross-angle).
The azimuth of maximum horizontal component of the stress field is estimated to lie between 115°
and 135° in the study area (Figs. 5.1.1. and 5.2.1). The theoretical azimuth diagram (Fig. 6.1.2) for the
study area has been created using Anderson’s (1951) faulting theory, Mohr-Coulomb failure criterion,
coefficient of friction of µ = 0.6 and 0.2 (Koskinen and Korja 2014). The azimuth diagram shows in
which directions different fault types could potentially develop. For imaging purposes, the line-
segments of the structural elements have been color-coded after their azimuth indicating fault type
(Figs. 6.1.3-6.2.2). If the direction of maximum horizontal stress (σH) were between 115° and 135°
then the optimal orientation for reverse faulting would be perpendicular to σH, (025°-045°; purple).
Normal faulting would occur parallel to σH (115º-135º; blue) given that the maximum principal stress
were vertical. Transfer faults would occur in the same direction (blue). In pure shear domain, strike-
slip (SS) faulting would occur in conjugate sets +30° to σH), (m= 0.6): dextral SS faults would strike
085°-105° (pink), and sinistral SS faults 145°-165° (light green). In simple shear domain, dextral SS
faults would thus strike 075°-095° (red) and sinistral SS faults 155°-175° (green). With different
experimental set-ups, other faulting modes are possible.

134
Figure 6.1.1. A subset of structures for which potential reactivation properties are calculated. A
compilation of subsets shown in figures 2.5.1, 2.5.4-2.5.6, 2.7.2 and 2.7.4. Hanhikivi site: black dot.
Figure 6.1.2. The theoretical azimuth diagram showing
intervals of the optimal orientation categories for
reverse, normal and strike-slip regimes in Central
Fennoscandia. The intervals have been calculated
assigning the direction of maximum horizontal stress
(σH) between 115° and 135° and coefficient of friction
(µ) to 0.2. Strike slip regimes in pure shear domain are
in pink and light green. Strike slip regimes in simple
shear domain are in red and green.
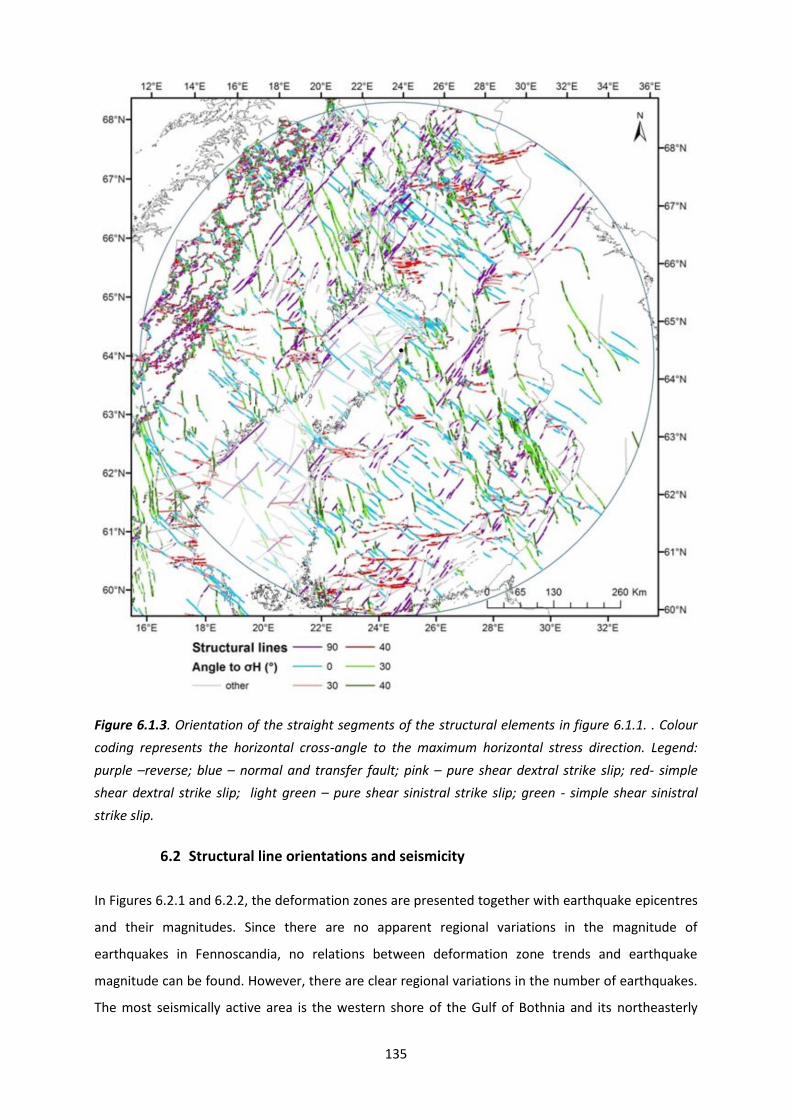
135
Figure 6.1.3. Orientation of the straight segments of the structural elements in figure 6.1.1. . Colour
coding represents the horizontal cross-angle to the maximum horizontal stress direction. Legend:
purple –reverse; blue – normal and transfer fault; pink – pure shear dextral strike slip; red- simple
shear dextral strike slip; light green – pure shear sinistral strike slip; green - simple shear sinistral
strike slip.
6.2 Structural line orientations and seismicity
In Figures 6.2.1 and 6.2.2, the deformation zones are presented together with earthquake epicentres
and their magnitudes. Since there are no apparent regional variations in the magnitude of
earthquakes in Fennoscandia, no relations between deformation zone trends and earthquake
magnitude can be found. However, there are clear regional variations in the number of earthquakes.
The most seismically active area is the western shore of the Gulf of Bothnia and its northeasterly
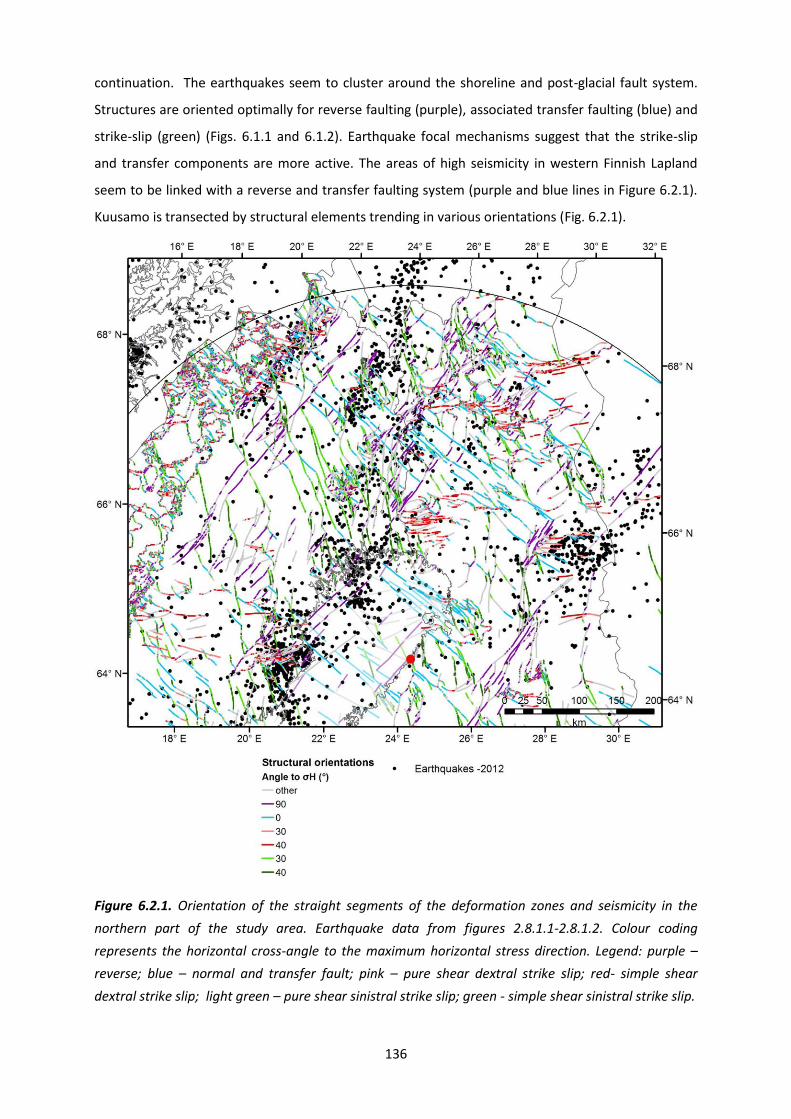
136
continuation. The earthquakes seem to cluster around the shoreline and post-glacial fault system.
Structures are oriented optimally for reverse faulting (purple), associated transfer faulting (blue) and
strike-slip (green) (Figs. 6.1.1 and 6.1.2). Earthquake focal mechanisms suggest that the strike-slip
and transfer components are more active. The areas of high seismicity in western Finnish Lapland
seem to be linked with a reverse and transfer faulting system (purple and blue lines in Figure 6.2.1).
Kuusamo is transected by structural elements trending in various orientations (Fig. 6.2.1).
Figure 6.2.1. Orientation of the straight segments of the deformation zones and seismicity in the
northern part of the study area. Earthquake data from figures 2.8.1.1-2.8.1.2. Colour coding
represents the horizontal cross-angle to the maximum horizontal stress direction. Legend: purple –
reverse; blue – normal and transfer fault; pink – pure shear dextral strike slip; red- simple shear
dextral strike slip; light green – pure shear sinistral strike slip; green - simple shear sinistral strike slip.

137
Figure 6.2.2. Orientation of the straight segments of the deformation zones and seismicity in the
southern part of the study area. Earthquake data from figures 2.8.1.1-2.8.1.2. Colour coding
represents the horizontal cross-angle to the maximum horizontal stress direction. Legend: purple –
reverse; blue – normal and transfer fault; pink – pure shear dextral strike slip; red- simple shear
dextral strike slip; light green – pure shear sinistral strike slip; green - simple shear sinistral strike slip.
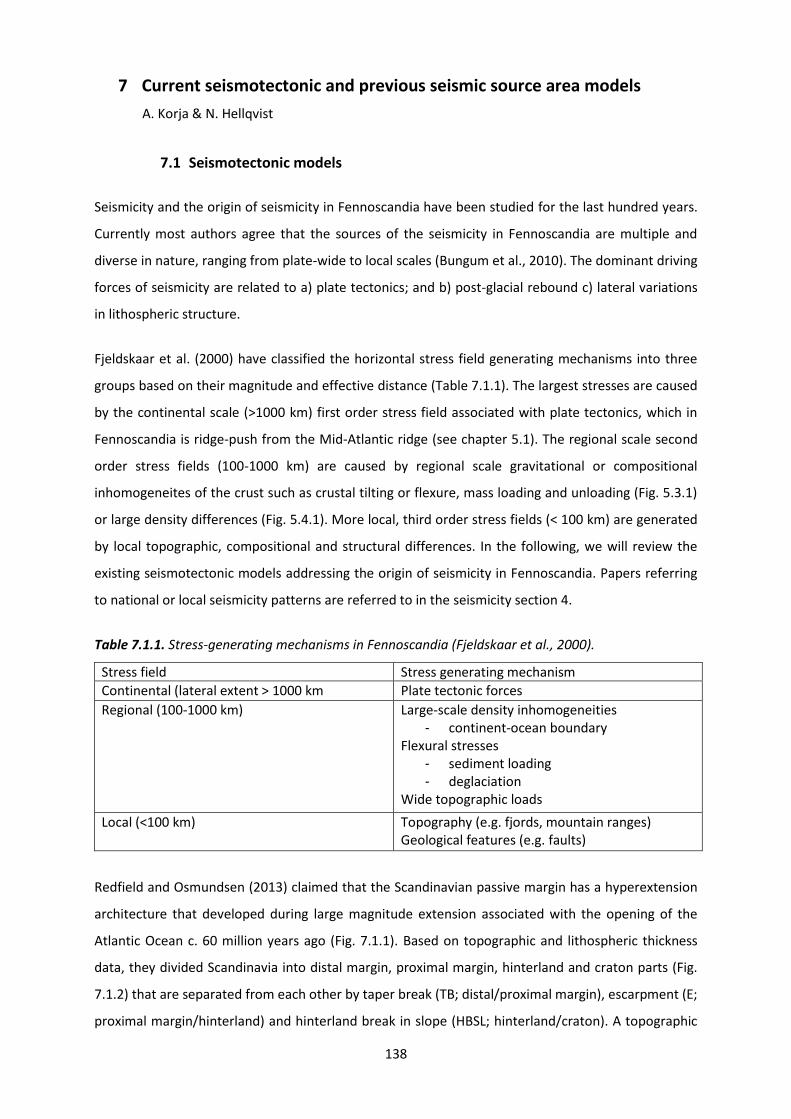
138
7 Current seismotectonic and previous seismic source area models
A. Korja & N. Hellqvist
7.1 Seismotectonic models
Seismicity and the origin of seismicity in Fennoscandia have been studied for the last hundred years.
Currently most authors agree that the sources of the seismicity in Fennoscandia are multiple and
diverse in nature, ranging from plate-wide to local scales (Bungum et al., 2010). The dominant driving
forces of seismicity are related to a) plate tectonics; and b) post-glacial rebound c) lateral variations
in lithospheric structure.
Fjeldskaar et al. (2000) have classified the horizontal stress field generating mechanisms into three
groups based on their magnitude and effective distance (Table 7.1.1). The largest stresses are caused
by the continental scale (>1000 km) first order stress field associated with plate tectonics, which in
Fennoscandia is ridge-push from the Mid-Atlantic ridge (see chapter 5.1). The regional scale second
order stress fields (100-1000 km) are caused by regional scale gravitational or compositional
inhomogeneites of the crust such as crustal tilting or flexure, mass loading and unloading (Fig. 5.3.1)
or large density differences (Fig. 5.4.1). More local, third order stress fields (< 100 km) are generated
by local topographic, compositional and structural differences. In the following, we will review the
existing seismotectonic models addressing the origin of seismicity in Fennoscandia. Papers referring
to national or local seismicity patterns are referred to in the seismicity section 4.
Table 7.1.1. Stress-generating mechanisms in Fennoscandia (Fjeldskaar et al., 2000).
Stress field Stress generating mechanism
Continental (lateral extent > 1000 km Plate tectonic forces
Regional (100-1000 km) Large-scale density inhomogeneities - continent-ocean boundary
Flexural stresses - sediment loading - deglaciation
Wide topographic loads
Local (<100 km) Topography (e.g. fjords, mountain ranges) Geological features (e.g. faults)
Redfield and Osmundsen (2013) claimed that the Scandinavian passive margin has a hyperextension
architecture that developed during large magnitude extension associated with the opening of the
Atlantic Ocean c. 60 million years ago (Fig. 7.1.1). Based on topographic and lithospheric thickness
data, they divided Scandinavia into distal margin, proximal margin, hinterland and craton parts (Fig.
7.1.2) that are separated from each other by taper break (TB; distal/proximal margin), escarpment (E;
proximal margin/hinterland) and hinterland break in slope (HBSL; hinterland/craton). A topographic

139
cross-section reveals a pronounced asymmetry and a well-defined hinterland break in slope (HBSL;
Fig. 5.4.5). They argued that stretching resulted in a highly attenuated pervasively faulted and
permanently weakened distal margin; an extended proximal margin wedge, where most of the
thickness reduction of the crust is located; and a flexure in the hinterland.
Figure 7.1.1. A hyperextended continental margin model (Redfield and Osmundsen, 2013). A
complimentary vertical cross-section of the topography is shown in Fig. 5.4.5.
Redfield and Osmundsen (2013) defined four seismic energy belts located along the older structural
boundaries. The seismicity zones defined by Redfield and Osmundsen (2013) are compared with the
seismicity earthquake database used in this study (Fig. 7.1.3). The first belt is the offshore belt of
seismic activity that runs along the outermost edge of the proximal margin, just inboard of and
roughly parallel to the TB (TB; Figs. 7.1.2 and 7.1.3). It is characterized by reverse faults and
earthquake hypocenters deeper than 15 km. The second belt of near-shore to onshore seismicity
runs along the inner proximal margin edge, roughly parallel to and seaward of the topographic
escarpments (Figs. 7.1.2 and 7.1.3). Earthquakes on this belt occur usually at depths shallower than
12 km and their focal mechanism is oblique-normal slip. The third belt marks the transition from
unextended but upwarped lithosphere to unextended, unwarped lithosphere that is located just
inboard of the HBSL (Figs. 7.1.2 and 7.1.3). This third belt is characterized by small earthquakes
(Mw≤2). Outside our study area Redfield and Osmundsen (2013) found fourth additional seismicity
belt that is follows the thinned crust of North Sea–Viking graben rift systems outboard of the thicker
Horda Platform in the North Sea. Seismically quiet areas are found in the Trøndelag Platform and in
the hinterland between the escarpment (E) and the hinterland break in slope (HSBL).
Redfield and Osmundsen (2013) suggested that seismicity is concentrated along the boundaries
defined by extensional tectonics, further developed throughout the cooling and ongoing

140
accommodation period. The structures have been and are being reactivated by the loading and
unloading events of the Plio–Pleistocene glaciation period. They concluded that, while the structures
originated from an old tectonic event, their present seismic activity is not only associated with ridge
push but also with isostatic post-glacial uplift and with erosion associated with the on-going
accommodation phase.
Figure 7.1.2. A map showing the division of Scandinavia into four tectonic domains related to
extensional deformation and opening of the Atlantic Ocean (Redfield and Osmundsen, 2013). Line C-
C’ shows the location of figure 5.4.5. Abbreviations: C – Craton; COB -Continent Ocean Boundary;
DM-Distal Margin; H –Hinterland; HBSL- Hinterland break- inslope; PM - Proximal Margin; TB - Taper
Break.
Several workers have argued that second order stress fields associated with post-glacial rebound
(Fig. 5.3.1) account for most of the seismicity in Fennoscandia (e.g. Muir Wood, 2000; Gudmundsson,
1999). Muir Wood presented a conceptual rebound dome - forebulge model that explains the
current seismicity patterns as a response to migrating post-glacial doming of the center and sinking
of the surrounding basins (Fig. 7.1.4). Similar relationships between seismicity and post glacial uplift
were obtained with rheological modeling by Gudmundsson (1999) and Fjeldskaar et al. (2000).
Mörner (1990) suggested that the uploading/unloading is fully compensated at the lithosphere-
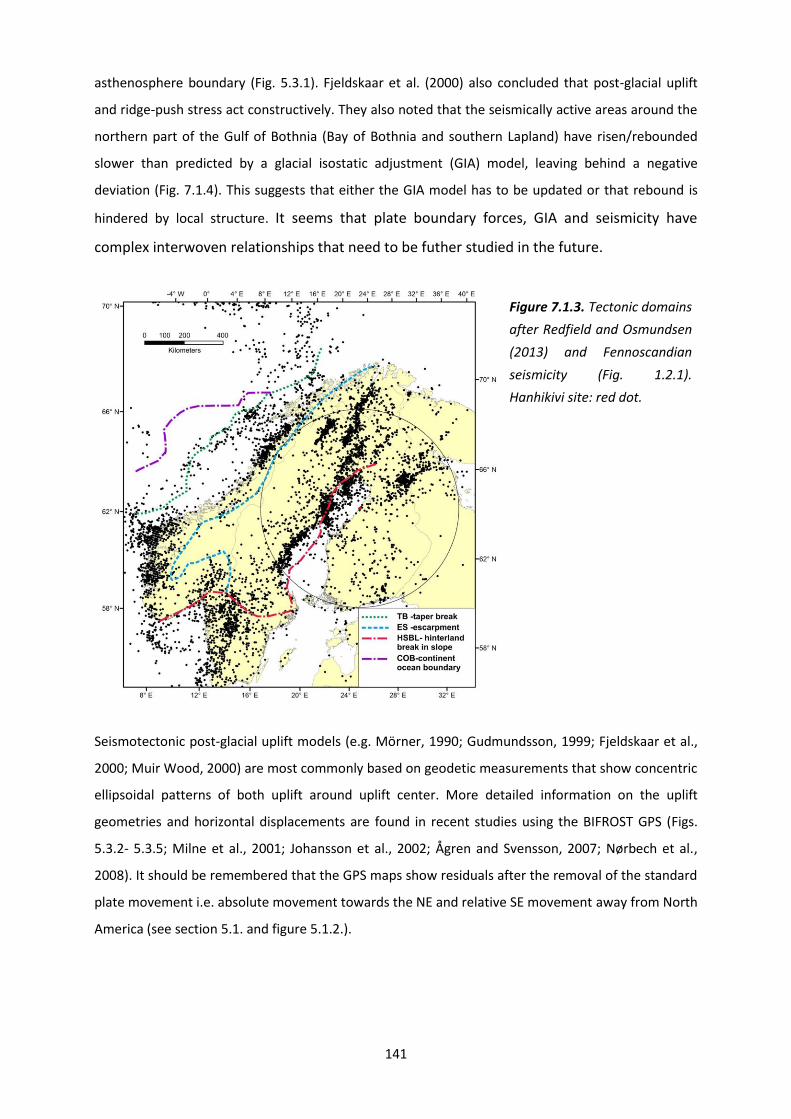
141
asthenosphere boundary (Fig. 5.3.1). Fjeldskaar et al. (2000) also concluded that post-glacial uplift
and ridge-push stress act constructively. They also noted that the seismically active areas around the
northern part of the Gulf of Bothnia (Bay of Bothnia and southern Lapland) have risen/rebounded
slower than predicted by a glacial isostatic adjustment (GIA) model, leaving behind a negative
deviation (Fig. 7.1.4). This suggests that either the GIA model has to be updated or that rebound is
hindered by local structure. It seems that plate boundary forces, GIA and seismicity have
complex interwoven relationships that need to be futher studied in the future.
Seismotectonic post-glacial uplift models (e.g. Mörner, 1990; Gudmundsson, 1999; Fjeldskaar et al.,
2000; Muir Wood, 2000) are most commonly based on geodetic measurements that show concentric
ellipsoidal patterns of both uplift around uplift center. More detailed information on the uplift
geometries and horizontal displacements are found in recent studies using the BIFROST GPS (Figs.
5.3.2- 5.3.5; Milne et al., 2001; Johansson et al., 2002; Ågren and Svensson, 2007; Nørbech et al.,
2008). It should be remembered that the GPS maps show residuals after the removal of the standard
plate movement i.e. absolute movement towards the NE and relative SE movement away from North
America (see section 5.1. and figure 5.1.2.).
Figure 7.1.3. Tectonic domains
after Redfield and Osmundsen
(2013) and Fennoscandian
seismicity (Fig. 1.2.1).
Hanhikivi site: red dot.
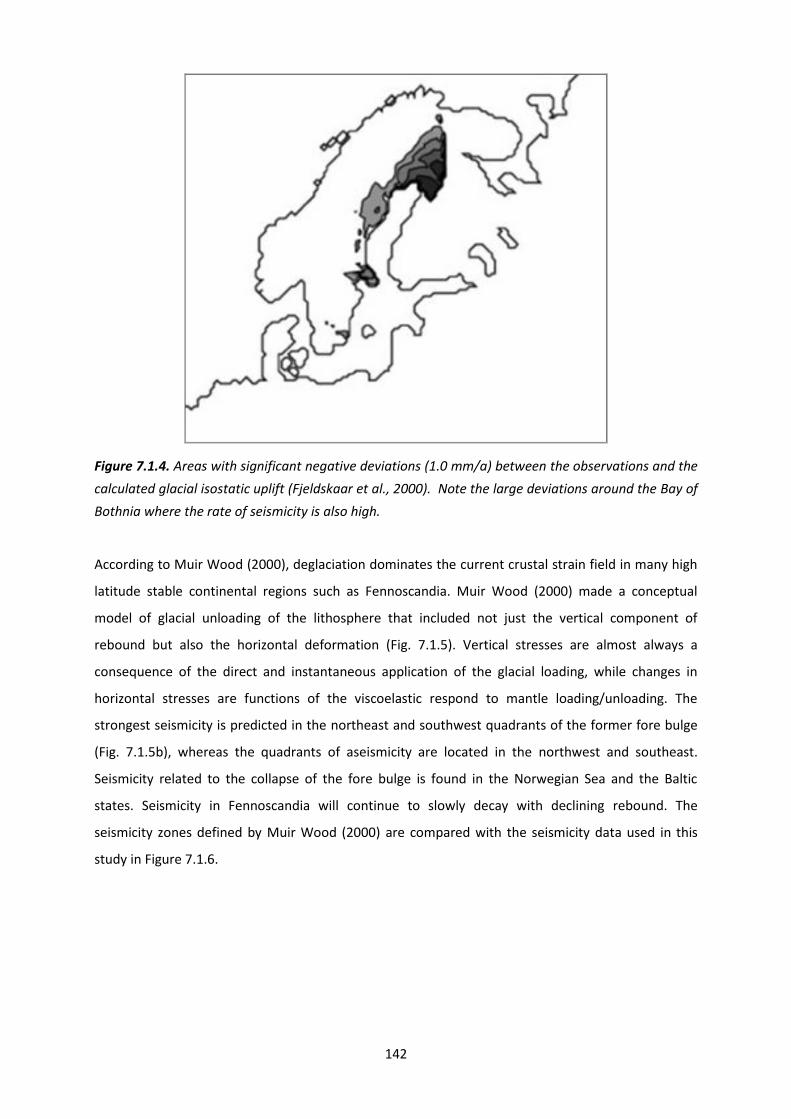
142
Figure 7.1.4. Areas with significant negative deviations (1.0 mm/a) between the observations and the
calculated glacial isostatic uplift (Fjeldskaar et al., 2000). Note the large deviations around the Bay of
Bothnia where the rate of seismicity is also high.
According to Muir Wood (2000), deglaciation dominates the current crustal strain field in many high
latitude stable continental regions such as Fennoscandia. Muir Wood (2000) made a conceptual
model of glacial unloading of the lithosphere that included not just the vertical component of
rebound but also the horizontal deformation (Fig. 7.1.5). Vertical stresses are almost always a
consequence of the direct and instantaneous application of the glacial loading, while changes in
horizontal stresses are functions of the viscoelastic respond to mantle loading/unloading. The
strongest seismicity is predicted in the northeast and southwest quadrants of the former fore bulge
(Fig. 7.1.5b), whereas the quadrants of aseismicity are located in the northwest and southeast.
Seismicity related to the collapse of the fore bulge is found in the Norwegian Sea and the Baltic
states. Seismicity in Fennoscandia will continue to slowly decay with declining rebound. The
seismicity zones defined by Muir Wood (2000) are compared with the seismicity data used in this
study in Figure 7.1.6.

143
Figure 7.1.5. a) The impact on horizontal stress of interference between radiating and polarized
tectonic strain field (Muir Wood, 2000). b) Quadrants of active and inactive seismicity from 1880-
1990 in Fennoscandia according to Muir Wood (2000). Uplift rates are shown in mm/a. Most of the
intraplate seismicity is associated with rise of the deglaciation dome and fall of the forebulge.
Figure 7.1.6. A comparison of Fennoscandian seismicity (FENCAT) and the quadrants of active and
inactive seismicity of the deglaciation dome and the forebulge of Muir Wood (2000).
a) b)
144
Wu et al. (1999) have modeled fault instability during and after glaciations. They claim that the
flexure of the lithosphere due to glaciations induce large instabilities in the crust at the end of
deglaciation. Minor instabilities (1 MPa) still exist at the center of the rebound and the predicted
mode of failure is thrusting. Because the level of seismicity is rather low, they conclude that there is
no clear evidence that the rebound stress is still able to trigger seismicity in Fennoscandia today. The
post-glacial rebound has had a much more important role in earthquake generation in late glacial
and early post-glacial times. Wu et al. (1999) noted that the spatial pattern of the earthquakes
exhibit little to no correlation with the pattern of rebound in Fennoscandia.
Pascal and Cloetingh (2009) also concluded that post-glacial rebound has had a significant influence
in the past on the stress regime in Fennoscandia but that it is not effective today. This is evident
through the measurements done in Finnmark where stress-relief structures were found to be
consistent with a regional NW-SE compression associated with ridge push forces (Pascal et al., 2005).
At present, the stress field is mainly consistent with plate tectonic forces and no clear correlation
with glacial unloading can be seen. Other stress sources such as sedimentary loading/unloading and
rebound have only local and/or short term significance. Observed variations in lithospheric structure
and elevation from the margin towards the continental interiors may produce significant potential
stresses which together with tectonic forces exert control on the dynamic evolution of the margin.
Pascal and Cloetingh (2009) also proposed that the buoyancy forces created by the Cenozoic uplift of
Fennoscandia might have contributed to the observed decreased rates of the spreading of the North
Atlantic ridge, similar to that observed in South America.
7.2 Seismic source area models
The Hanhikivi site is included in six existing seismic source area models (Mäntyniemi et al., 1993;
NFR/NORSAR and NGI, 1998; Grünthal and the GSHAP Region 3 Working Group, 1999; Wahlström
and Grünthal, 2001; Mäntyniemi, 2008a; Saari et al., 2009; Korja et al., 2011; Giardini et al., 2013),
hazard maps (Grünthal and the GSHAP Region 3 Working Group, 1999; Wahlström and Grünthal,
2000, 2001; Mäntyniemi et al., 2001; Giardini et al., 2013). Seismic hazard estimates have been
calculated for the Hanhikivi site (Mäntyniemi et al., 2001; Mäntyniemi, 2008a; Saari et al., 2009;
Korja et al., 2011).
Mäntyniemi et al. (1993) used 8 subregions for Norway, Sweden, Finland, and Denmark (Fig. 7.2.1).
Kijko et al. (1993) divided Sweden into the northern and southern parts and further in the Lake
Vänern and the eastern coast of the Gulf of Bothnia subregions. Grünthal and the GSHAP Region 3
Working Group (1999) modified the northern subregions of the model somewhat when calculating
the seismic hazard of Fennoscandia within the framework of the Global Seismic Hazard Assessment

145
Program (GSHAP) (Fig. 7.2.2). Seismic hazard in Fennoscandia is low according to GSHAP estimates
(Fig. 7.2.3).
In 2001, Wahlström and Grünthal presented yet another updated seismic source region model for
Norway, Sweden, Finland, and Denmark. In this model they have used three sets of seismic source
regions: a) a revised version of NFR/NORSAR and NGI (1998) used for GSHAP-Global Seismic Hazard
Assessment Program (Fig. 7.2.2; Grünthal and the GSHAP Region 3 Working Group, 1999;
http://www.seismo.ethz.ch/static/gshap/ceurope/) including 31 source regions. b) A model with 21
source regions based on the seismicity distribution. c) A model with 14 source regions based mainly
on tectonic maps of Sweden, Finland, and Denmark in addition to 21 regions for Norway and its
offshore area from the NFR/NORSAR and NGI (1998) model. As a result, they presented a map of
median values of hazard values or horizontal PGA (m/s2) values for a mean return period of 475 years
(Fig. 7.2.4). The highest hazard in Fennoscandia, with values up to 0.45 m/s2 - 0.70 m/s2, is found
along the Norwegian coast. An area of enhanced hazard is also found in areas surrounding the Bay of
Bothnia, with maximum values of 0.15-0.20 m/s2. The highest hazard in the study area is in the
Kuusamo district 0.20-0.25 m/s2. The smallest hazard values below 0.1 m/s2 are found in southern
Finland.
Figure 7.2.1. A Seismic source area model for Fennoscandia (Mäntyniemi et al., 1993). Hanhikivi site:
black/red dot.
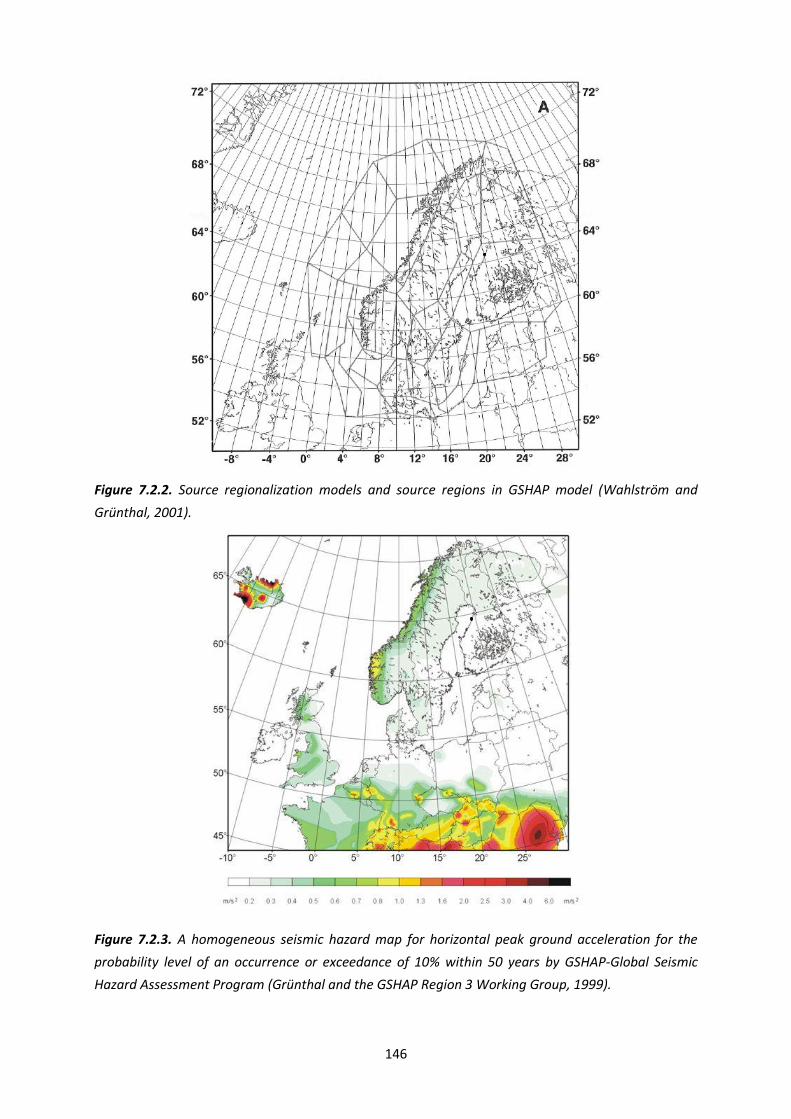
146
Figure 7.2.2. Source regionalization models and source regions in GSHAP model (Wahlström and
Grünthal, 2001).
Figure 7.2.3. A homogeneous seismic hazard map for horizontal peak ground acceleration for the
probability level of an occurrence or exceedance of 10% within 50 years by GSHAP-Global Seismic
Hazard Assessment Program (Grünthal and the GSHAP Region 3 Working Group, 1999).

147
The EU-project SHARE (Seismic Hazard Harmonization in Europe, http://www.share-eu.org)
attempted to harmonize the probabilistic hazard assessments of Europe (Fig. 7.2.5) and produced a
second version of European areal seismic source zone model (SSZM) (Arvidsson et al., 2010). In
Scandinavia, SHARE model is largely based on GSHAP model. According to Arvidsson et al. (2010), the
source area models for the Baltic Sea, the Baltic countries and Finland have been largely reworked so
that zonation corresponds better to large scale tectonic features and seismicity. The North European
seismic source area model (GSHAP; Fig 7.2.2) has been included in EU-project SHARE - Seismic Hazard
Harmonization in Europe (http://www.share-eu.org), attempting to harmonize the probabilistic
hazard assessments of Europe (Fig. 7.2.5) and to establish as a regional reference model. In Sweden
two smaller source areas have been merged into one, but the over-all geometry has not changed.
Seismic hazard is estimated to be low in the study area and very low in the site vicinity (Fig. 7.2.6).
SHARE model is included in the ongoing global seismic hazard assessment mapping initiative GEM -
Global Earthquake Model (http://www.globalquakemodel.org/). GEM aims to produce a uniform,
independent and open access standard for calculation of earthquake hazard.
Figure 7.2.4. A map of 90%
probability of non-exceedance of
horizontal PGA (m/s2) in 50 years,
corresponding to a mean return
period of 475 years (Wahlström and
Grünthal, 2001). Median hazard
values are given.
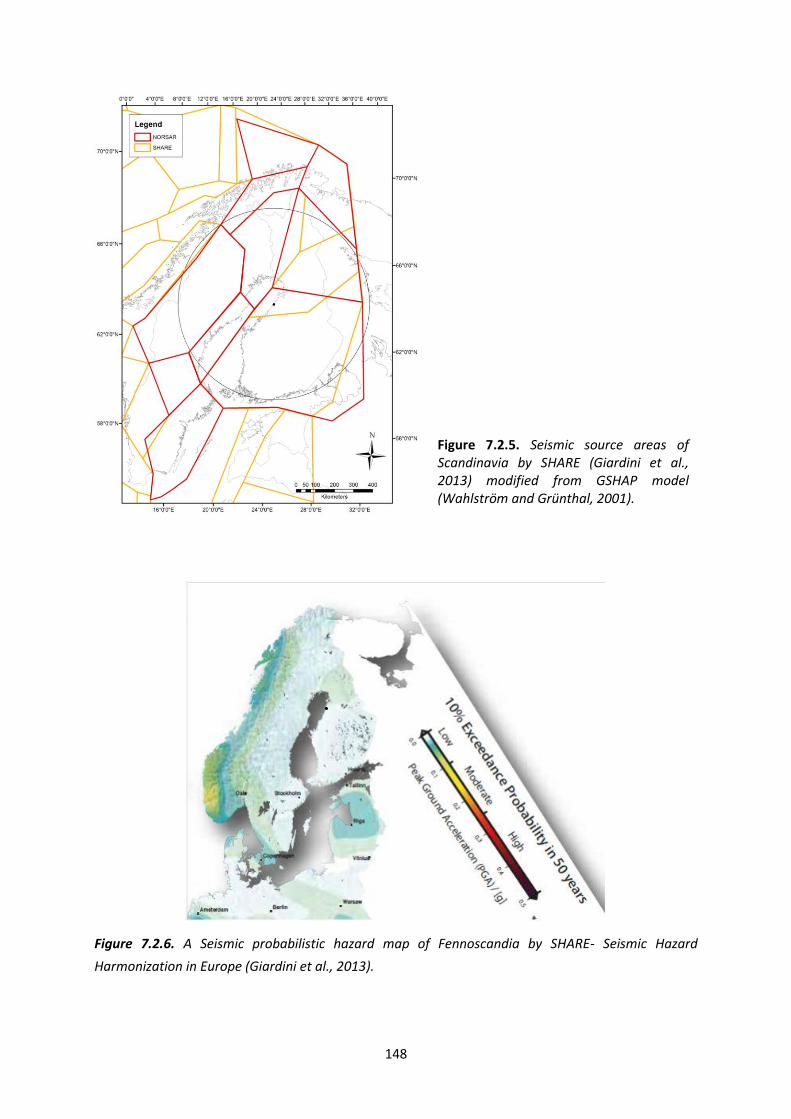
148
Figure 7.2.6. A Seismic probabilistic hazard map of Fennoscandia by SHARE- Seismic Hazard
Harmonization in Europe (Giardini et al., 2013).
Figure 7.2.5. Seismic source areas of Scandinavia by SHARE (Giardini et al., 2013) modified from GSHAP model (Wahlström and Grünthal, 2001).
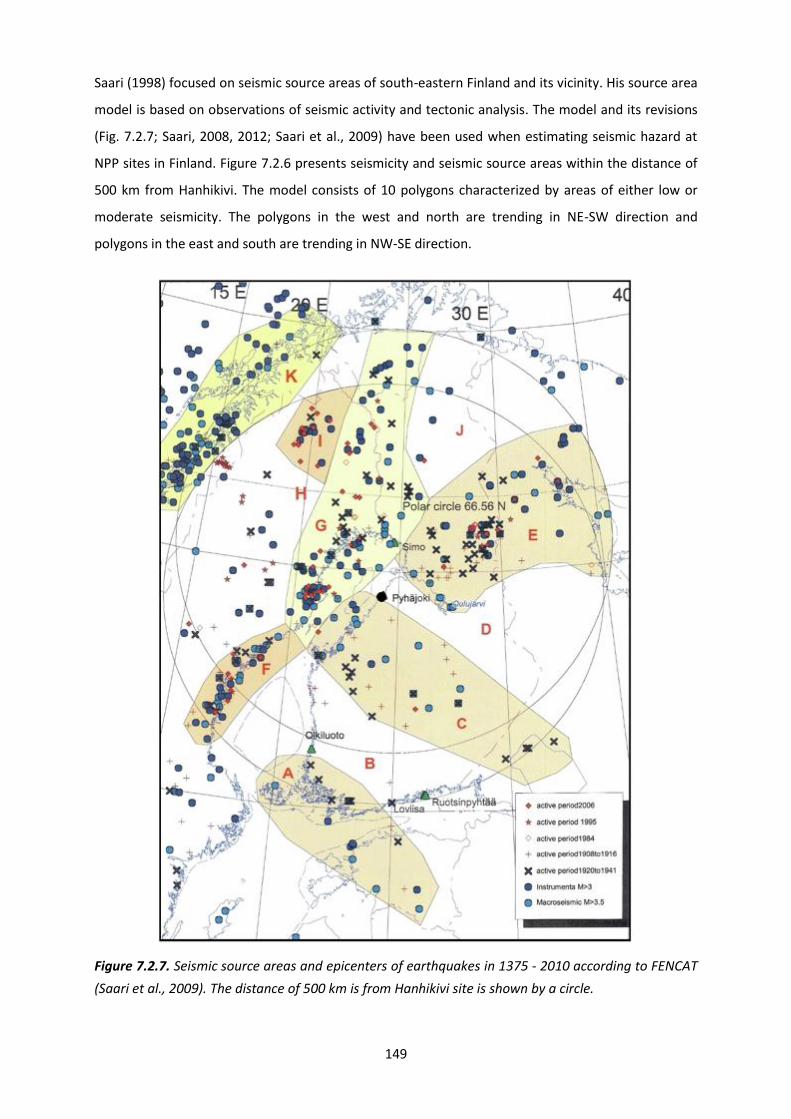
149
Saari (1998) focused on seismic source areas of south-eastern Finland and its vicinity. His source area
model is based on observations of seismic activity and tectonic analysis. The model and its revisions
(Fig. 7.2.7; Saari, 2008, 2012; Saari et al., 2009) have been used when estimating seismic hazard at
NPP sites in Finland. Figure 7.2.6 presents seismicity and seismic source areas within the distance of
500 km from Hanhikivi. The model consists of 10 polygons characterized by areas of either low or
moderate seismicity. The polygons in the west and north are trending in NE-SW direction and
polygons in the east and south are trending in NW-SE direction.
Figure 7.2.7. Seismic source areas and epicenters of earthquakes in 1375 - 2010 according to FENCAT
(Saari et al., 2009). The distance of 500 km is from Hanhikivi site is shown by a circle.

150
Mäntyniemi et al. (2001) prepared a seismic hazard map for Fennoscandia on the basis of knowledge
of past seismicity. Probabilities of occurrence of magnitudes were computed for time intervals of one
year and 50 and 100 years. No seismic source areas were defined. The peak ground acceleration
values along the eastern coast of the Gulf of Bothnia were in the range 0.01-0.015g for a mean
return period of 475 years. They also estimated site-specific hazard for a hypothetical engineering
structure located on the eastern coast. Maximum ground amplitude was chosen as the ground-
motion descriptor in the site-specific hazard assessment, and seismicity data inside a circle with a
350 km radius from the site were taken into account.
Mäntyniemi (2008a) described the seismicity in the vicinity of three candidate NPP sites in the
municipalities of Pyhäjoki, Ruotsinpyhtää and Simo. The seismic source areas defined in the
framework of the GSHAP were used when computing a preliminary estimate of site-specific seismic
hazard for each site. A peak ground acceleration value 0.12g corresponding to a 10-5 annual
probability of exceedance was given for Hanhikivi.
Korja et al. (2011a) outlined alternative seismic source areas around the Hanhikivi site for seismic
hazard calculation of the regional area. They suggested that seismicity in northern Finland is mainly
Figure 7.2.8. Seismicity in
Fennoscandia according to Korja et
al. (2011a). Historical earthquakes
are from FENCAT – catalogue and
instrumental earthquakes (1971-
2010) from the Fennoscandian
earthquake catalogue.
151
concentrated to ancient weakness zones and faults that have been reactivated in the current stress
field. In the report by Korja et al. (2011a), twelve source regions were defined in the areas
surrounding the Bay of Bothnia (Fig. 7.2.8). Since the precision in epicenter location turned out to be
rather low, it was not possible to attach single earthquakes to single faults or shear zones. For this
reason, seismic source areas comprising several faults and larger earthquakes (magnitude over 3.5)
were defined. Although the northern and western areas have a large effect on the seismic hazard
calculations, the most influential seismic source area is still the Raahe-Ladoga shear complex, where
the Hanhikivi site is located. The closest known active post-glacial fault zone is in Västerbotten,
Sweden, 180 km west of this site.
152
8 Identification and description of seismic source areas
In the first part of this report we have described the new digital datasets now available for seismic
source area modeling. The seismic data set within the study area is by far larger than those used in
previous seismic source area models. We have used large amounts of small magnitude earthquake
data from SNSN network that outline the zones of increased seismicity with higher precision than in
the previous studies. We have also carefully checked the data to remove mining-induced events and
explosions that degrade the quality of some of the previously published seismotectonic studies (e.g.
Redfield and Osmundsen, 2013). By adding to the high quality seismic data also other high quality
geophysical and geological data sets we augmented the geoscientific information of the study area.
The high quality data sets warrant the design of more detailed seismic source area models than
those based on fewer data (Saari et al., 2009), focusing on Scandinavia (Wahlström and Grünthal,
2001) or made for regional to global scale reference (SHARE; Giardini et al., 2013).
8.1 Basis for modeling
A. Korja
We have defined seismic source areas as areas with spatially distinct seismicity patterns. These
patterns arise since seismic stress release favours pre-existing zones of weakness and, in
intracratonic areas, earthquakes tend to occur along reactivated faults, ductile shear zones, failed
rifts or other weak zones suitably oriented in the current stress field. A variation in earthquake
occurrence and change in seismicity pattern is therefore likely to be due to local changes in the
current stress field caused by such heterogeneities in the structural or lithological framework. As
stated earlier in the text, we refer to reactivated faults and ductile shear zones in more general terms
in this report as deformation zones.
In a seismic source area model, the studied area is divided into polygons with differing seismicity
patterns. The patterns may comprise discrete seismogenic structures (i.e. faults), diffuse seismicity
belts or regions, where seismicity is not attributable to specific structures, or a combination of the
two. The definition of the polygons is based on various geological, geophysical and seismological
datasets. A subsequent hazard analysis requires information on the geological and tectonic
framework, seismic source geometries and seismological parameters from each polygon. A more
detailed list is shown in Table 8.1.1.
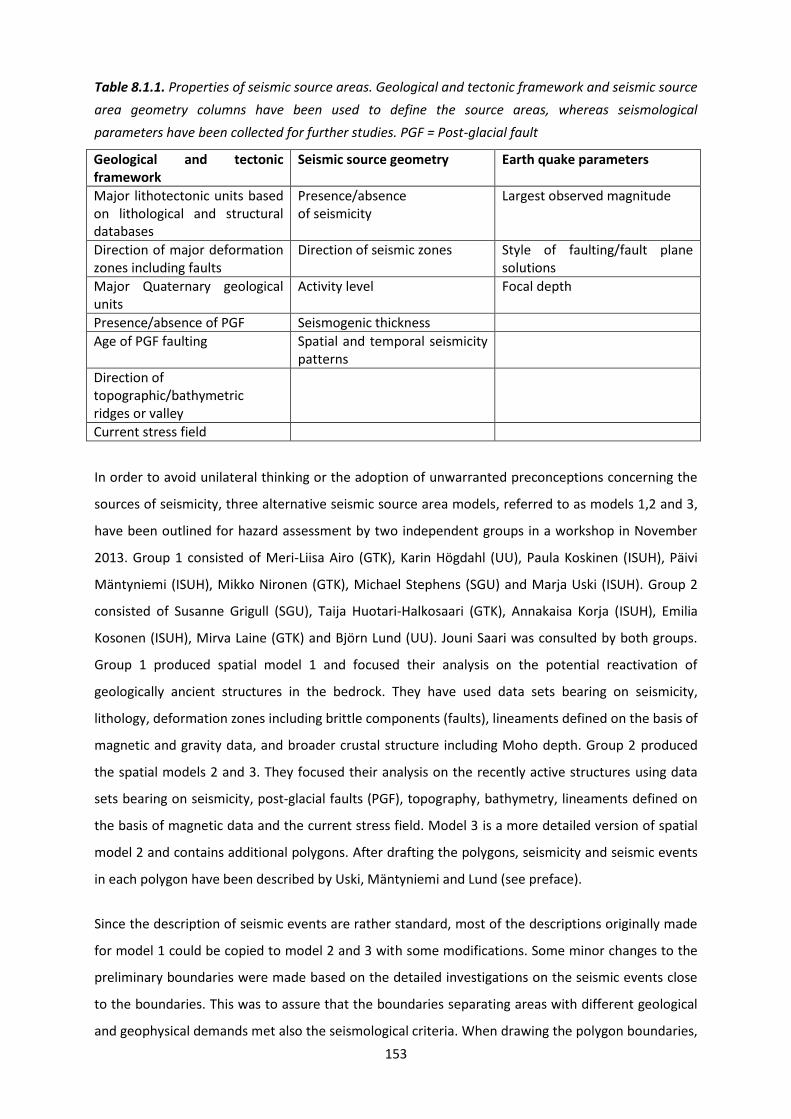
153
Table 8.1.1. Properties of seismic source areas. Geological and tectonic framework and seismic source
area geometry columns have been used to define the source areas, whereas seismological
parameters have been collected for further studies. PGF = Post-glacial fault
Geological and tectonic framework
Seismic source geometry Earth quake parameters
Major lithotectonic units based on lithological and structural databases
Presence/absence of seismicity
Largest observed magnitude
Direction of major deformation zones including faults
Direction of seismic zones Style of faulting/fault plane solutions
Major Quaternary geological units
Activity level Focal depth
Presence/absence of PGF Seismogenic thickness
Age of PGF faulting Spatial and temporal seismicity patterns
Direction of topographic/bathymetric ridges or valley
Current stress field
In order to avoid unilateral thinking or the adoption of unwarranted preconceptions concerning the
sources of seismicity, three alternative seismic source area models, referred to as models 1,2 and 3,
have been outlined for hazard assessment by two independent groups in a workshop in November
2013. Group 1 consisted of Meri-Liisa Airo (GTK), Karin Högdahl (UU), Paula Koskinen (ISUH), Päivi
Mäntyniemi (ISUH), Mikko Nironen (GTK), Michael Stephens (SGU) and Marja Uski (ISUH). Group 2
consisted of Susanne Grigull (SGU), Taija Huotari-Halkosaari (GTK), Annakaisa Korja (ISUH), Emilia
Kosonen (ISUH), Mirva Laine (GTK) and Björn Lund (UU). Jouni Saari was consulted by both groups.
Group 1 produced spatial model 1 and focused their analysis on the potential reactivation of
geologically ancient structures in the bedrock. They have used data sets bearing on seismicity,
lithology, deformation zones including brittle components (faults), lineaments defined on the basis of
magnetic and gravity data, and broader crustal structure including Moho depth. Group 2 produced
the spatial models 2 and 3. They focused their analysis on the recently active structures using data
sets bearing on seismicity, post-glacial faults (PGF), topography, bathymetry, lineaments defined on
the basis of magnetic data and the current stress field. Model 3 is a more detailed version of spatial
model 2 and contains additional polygons. After drafting the polygons, seismicity and seismic events
in each polygon have been described by Uski, Mäntyniemi and Lund (see preface).
Since the description of seismic events are rather standard, most of the descriptions originally made
for model 1 could be copied to model 2 and 3 with some modifications. Some minor changes to the
preliminary boundaries were made based on the detailed investigations on the seismic events close
to the boundaries. This was to assure that the boundaries separating areas with different geological
and geophysical demands met also the seismological criteria. When drawing the polygon boundaries,
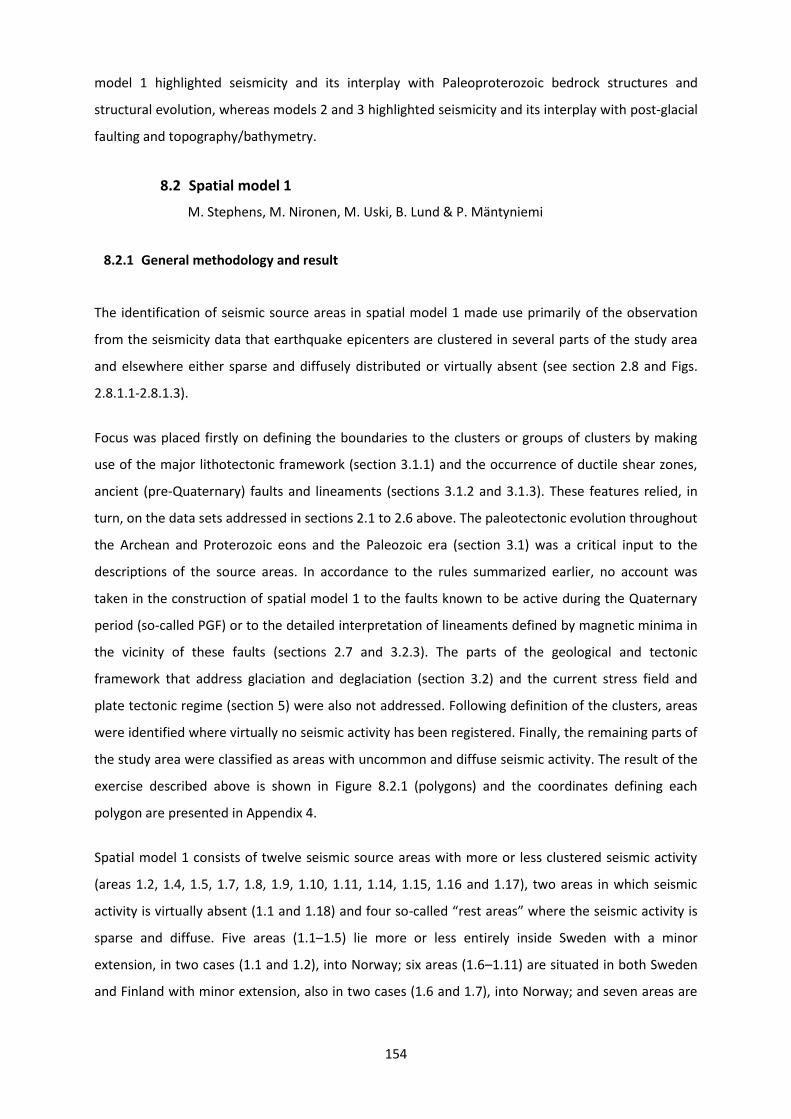
154
model 1 highlighted seismicity and its interplay with Paleoproterozoic bedrock structures and
structural evolution, whereas models 2 and 3 highlighted seismicity and its interplay with post-glacial
faulting and topography/bathymetry.
8.2 Spatial model 1
M. Stephens, M. Nironen, M. Uski, B. Lund & P. Mäntyniemi
8.2.1 General methodology and result
The identification of seismic source areas in spatial model 1 made use primarily of the observation
from the seismicity data that earthquake epicenters are clustered in several parts of the study area
and elsewhere either sparse and diffusely distributed or virtually absent (see section 2.8 and Figs.
2.8.1.1-2.8.1.3).
Focus was placed firstly on defining the boundaries to the clusters or groups of clusters by making
use of the major lithotectonic framework (section 3.1.1) and the occurrence of ductile shear zones,
ancient (pre-Quaternary) faults and lineaments (sections 3.1.2 and 3.1.3). These features relied, in
turn, on the data sets addressed in sections 2.1 to 2.6 above. The paleotectonic evolution throughout
the Archean and Proterozoic eons and the Paleozoic era (section 3.1) was a critical input to the
descriptions of the source areas. In accordance to the rules summarized earlier, no account was
taken in the construction of spatial model 1 to the faults known to be active during the Quaternary
period (so-called PGF) or to the detailed interpretation of lineaments defined by magnetic minima in
the vicinity of these faults (sections 2.7 and 3.2.3). The parts of the geological and tectonic
framework that address glaciation and deglaciation (section 3.2) and the current stress field and
plate tectonic regime (section 5) were also not addressed. Following definition of the clusters, areas
were identified where virtually no seismic activity has been registered. Finally, the remaining parts of
the study area were classified as areas with uncommon and diffuse seismic activity. The result of the
exercise described above is shown in Figure 8.2.1 (polygons) and the coordinates defining each
polygon are presented in Appendix 4.
Spatial model 1 consists of twelve seismic source areas with more or less clustered seismic activity
(areas 1.2, 1.4, 1.5, 1.7, 1.8, 1.9, 1.10, 1.11, 1.14, 1.15, 1.16 and 1.17), two areas in which seismic
activity is virtually absent (1.1 and 1.18) and four so-called “rest areas” where the seismic activity is
sparse and diffuse. Five areas (1.1–1.5) lie more or less entirely inside Sweden with a minor
extension, in two cases (1.1 and 1.2), into Norway; six areas (1.6–1.11) are situated in both Sweden
and Finland with minor extension, also in two cases (1.6 and 1.7), into Norway; and seven areas are
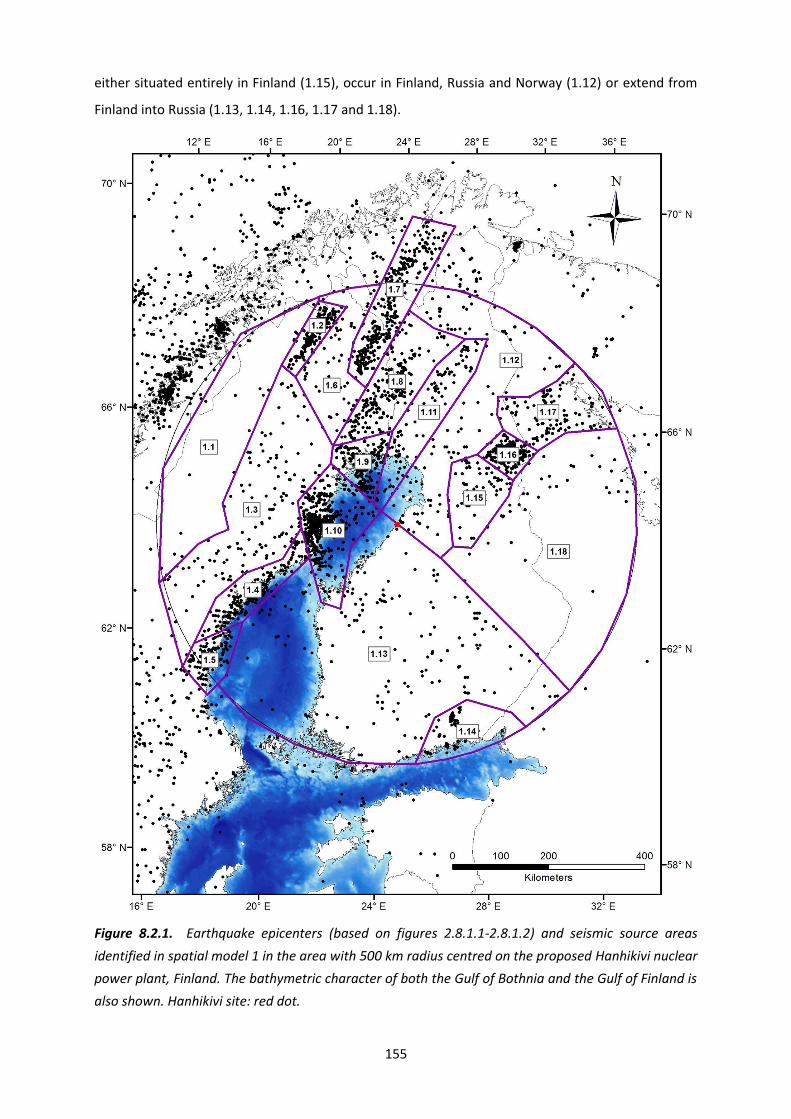
155
either situated entirely in Finland (1.15), occur in Finland, Russia and Norway (1.12) or extend from
Finland into Russia (1.13, 1.14, 1.16, 1.17 and 1.18).
Figure 8.2.1. Earthquake epicenters (based on figures 2.8.1.1-2.8.1.2) and seismic source areas
identified in spatial model 1 in the area with 500 km radius centred on the proposed Hanhikivi nuclear
power plant, Finland. The bathymetric character of both the Gulf of Bothnia and the Gulf of Finland is
also shown. Hanhikivi site: red dot.
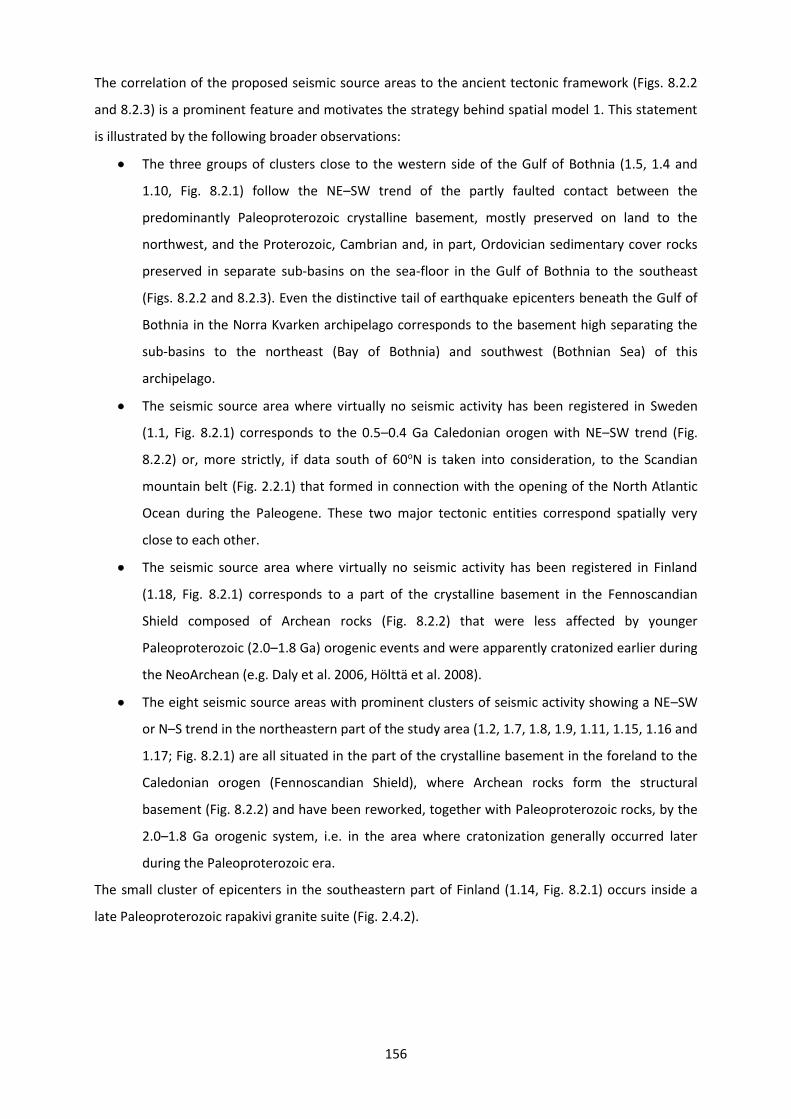
156
The correlation of the proposed seismic source areas to the ancient tectonic framework (Figs. 8.2.2
and 8.2.3) is a prominent feature and motivates the strategy behind spatial model 1. This statement
is illustrated by the following broader observations:
The three groups of clusters close to the western side of the Gulf of Bothnia (1.5, 1.4 and
1.10, Fig. 8.2.1) follow the NE–SW trend of the partly faulted contact between the
predominantly Paleoproterozoic crystalline basement, mostly preserved on land to the
northwest, and the Proterozoic, Cambrian and, in part, Ordovician sedimentary cover rocks
preserved in separate sub-basins on the sea-floor in the Gulf of Bothnia to the southeast
(Figs. 8.2.2 and 8.2.3). Even the distinctive tail of earthquake epicenters beneath the Gulf of
Bothnia in the Norra Kvarken archipelago corresponds to the basement high separating the
sub-basins to the northeast (Bay of Bothnia) and southwest (Bothnian Sea) of this
archipelago.
The seismic source area where virtually no seismic activity has been registered in Sweden
(1.1, Fig. 8.2.1) corresponds to the 0.5–0.4 Ga Caledonian orogen with NE–SW trend (Fig.
8.2.2) or, more strictly, if data south of 60oN is taken into consideration, to the Scandian
mountain belt (Fig. 2.2.1) that formed in connection with the opening of the North Atlantic
Ocean during the Paleogene. These two major tectonic entities correspond spatially very
close to each other.
The seismic source area where virtually no seismic activity has been registered in Finland
(1.18, Fig. 8.2.1) corresponds to a part of the crystalline basement in the Fennoscandian
Shield composed of Archean rocks (Fig. 8.2.2) that were less affected by younger
Paleoproterozoic (2.0–1.8 Ga) orogenic events and were apparently cratonized earlier during
the NeoArchean (e.g. Daly et al. 2006, Hölttä et al. 2008).
The eight seismic source areas with prominent clusters of seismic activity showing a NE–SW
or N–S trend in the northeastern part of the study area (1.2, 1.7, 1.8, 1.9, 1.11, 1.15, 1.16 and
1.17; Fig. 8.2.1) are all situated in the part of the crystalline basement in the foreland to the
Caledonian orogen (Fennoscandian Shield), where Archean rocks form the structural
basement (Fig. 8.2.2) and have been reworked, together with Paleoproterozoic rocks, by the
2.0–1.8 Ga orogenic system, i.e. in the area where cratonization generally occurred later
during the Paleoproterozoic era.
The small cluster of epicenters in the southeastern part of Finland (1.14, Fig. 8.2.1) occurs inside a
late Paleoproterozoic rapakivi granite suite (Fig. 2.4.2).
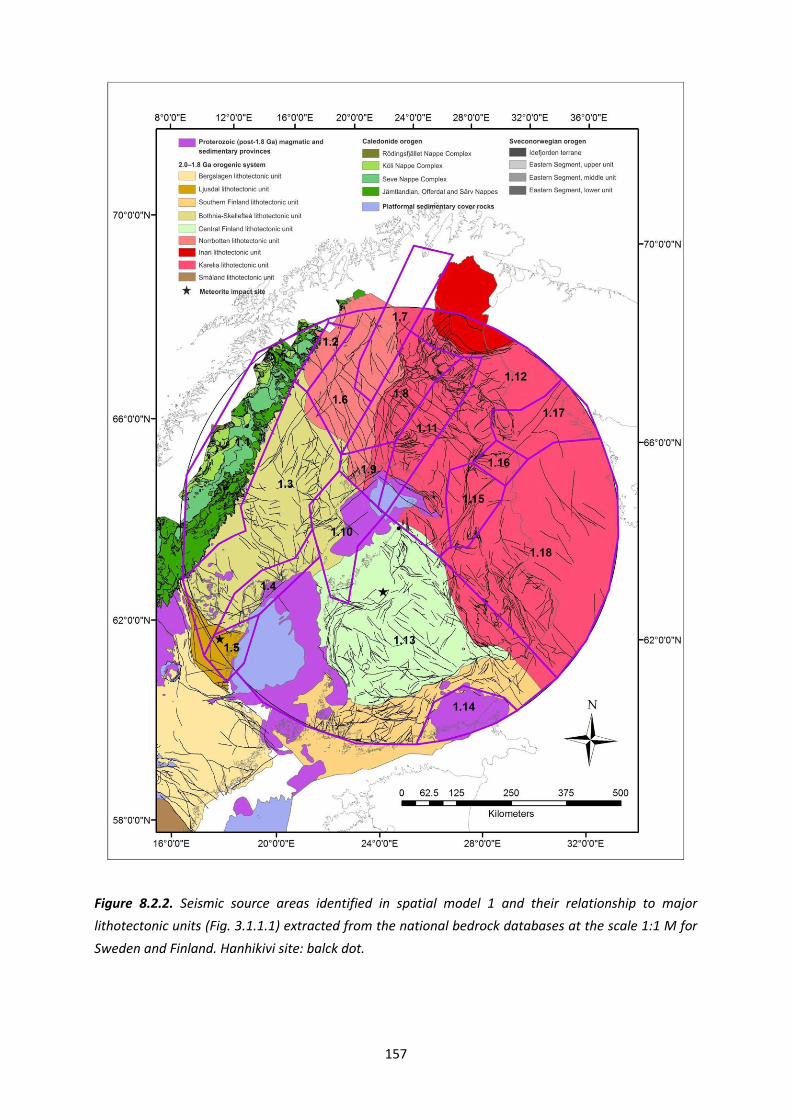
157
Figure 8.2.2. Seismic source areas identified in spatial model 1 and their relationship to major
lithotectonic units (Fig. 3.1.1.1) extracted from the national bedrock databases at the scale 1:1 M for
Sweden and Finland. Hanhikivi site: balck dot.
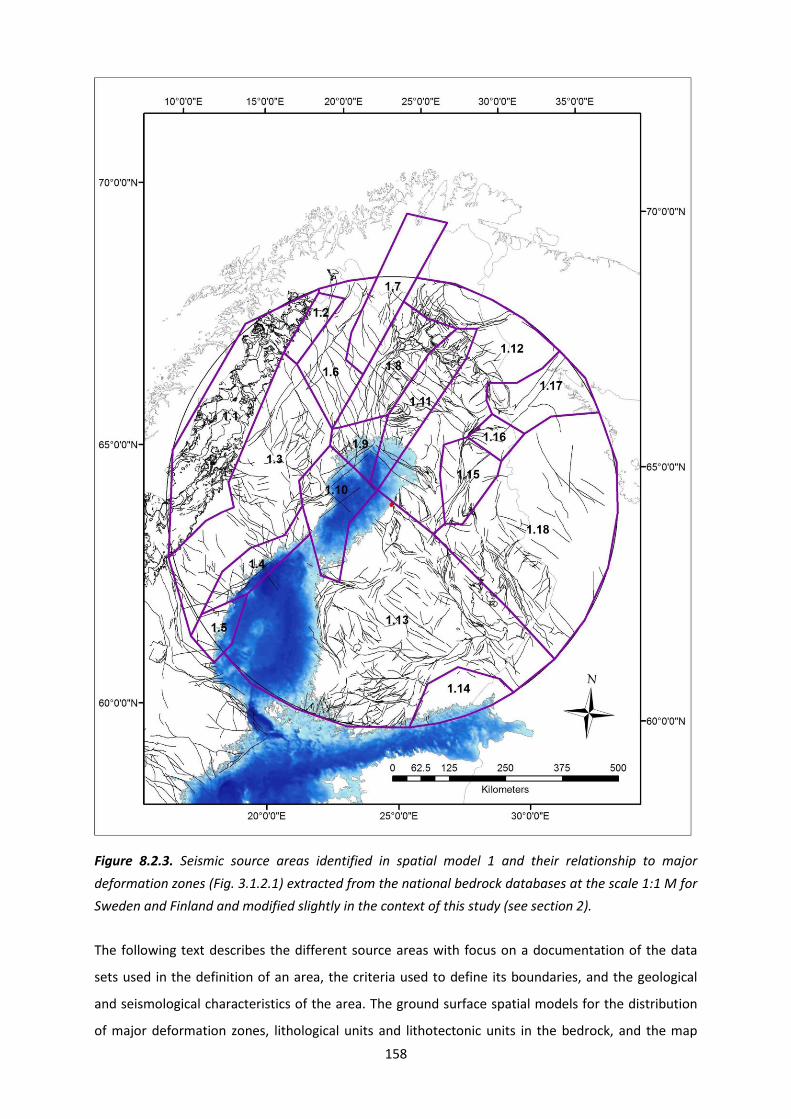
158
Figure 8.2.3. Seismic source areas identified in spatial model 1 and their relationship to major
deformation zones (Fig. 3.1.2.1) extracted from the national bedrock databases at the scale 1:1 M for
Sweden and Finland and modified slightly in the context of this study (see section 2).
The following text describes the different source areas with focus on a documentation of the data
sets used in the definition of an area, the criteria used to define its boundaries, and the geological
and seismological characteristics of the area. The ground surface spatial models for the distribution
of major deformation zones, lithological units and lithotectonic units in the bedrock, and the map

159
showing the airborne magnetic anomalies identified using data collected at 30–60 m above ground
level (Fig. 2.1.1 for Sweden) were continually used during the work with each seismic source area,
both for the definition of its boundaries and for internal characterisation.
8.2.2 Description
Seismic source area 1.1
The seismicity data in combination with the information bearing on the major lithotectonic units and
the major ductile and brittle deformation zones in the bedrock have been used to define and
characterise seismic source area 1.1. The seismicity data consists of events both from the historical
and instrumental data in the FENCAT catalogues (Figs. 2.8.1.1-2.8.1.2). The major lithotectonic units
have been recognised using the combined information in the lithological and structural map
databases. The information in these two databases inside source area 1.1 is based mainly on field
outcrop data. Apart from some limited seismic reflection data along a W–E profile between
Östersund and Norway (see overview in Gee et al., 2010), geophysical data have provided only
limited information.
The western boundary of seismic source area 1 corresponds to the western limit of the study area
with 500 km radius (Fig. 8.2.1). The eastern boundary has been constructed by essentially following
the eastern erosional front of the 0.5–0.4 Ga Caledonian orogen (Fig. 8.2.2), which corresponds
closely to the Scandian mountain belt that formed during the Paleogene. A minor modification from
this trend was carried out in the north-central part of Sweden, north of Östersund, to include an area
where epicenters are absent and regionally significant deformation zones have not been identified
(Figs. 8.2.1 and 8.2.3).
Apart from the minor bulge referred to above, which lies within the Bothnia-Skellefteå lithotectonic
unit, seismic source area 1.1 occurs entirely within the Caledonian orogen with its prominent NE–SW
trend (Fig. 8.2.2). A distinctive feature of this orogenic belt is the occurrence of predominantly
sedimentary and, in western areas, magmatic rocks, which formed during the Neoproterozoic to
Silurian, that are thrust on top of and consequently allochthonous with respect to the underlying
crystalline basement (see, for example, overviews in Roberts and Gee, 1985; Stephens, 1988; Gee et
al., 2010; Figs. 3.1.2.2 and 8.2.3). The rocks show variable grades of metamorphism, locally under
high-pressure conditions during different tectonic events (490–480 Ma and 450–440 Ma). The
occurrence of transported slabs of Proterozoic basement inside the allochthonous sheets indicates
the thick-skinned character of the thrust tectonics. The thrusts dip gently, generally westwards (Fig.
8.2.3), but the area is also affected by later, upright folding with axial surface traces parallel to the
orogen. These folds rotate the thrust contacts and, thereby, give rise to dips of thrusts to the east

160
and an apparent normal sense of movement. The tectonostratigraphy was established during the
Silurian in connection with a terminal continent-continent collision.
Source area 1.1 has very little seismicity and the events are widely distributed in the area (Fig. 8.2.1).
The strongest instrumental event occurred on 17 November 1984 in the northwestern corner of the
area and had a magnitude of 2.9. As the area has only one seismic station, in the southernmost
corner, the events in the area have poor depth determinations and larger than average uncertainties
in the epicentral locations. Focal depths vary between a few kilometres and 35 km, with large
uncertainties. The conditions for documenting possible historical earthquakes were not favourable
due to a sparse population and short literary tradition. However, the large Norwegian earthquake of
9 March 1866 was reportedly felt in the southern part of this area.
Seismic source area 1.2
The same types of data and information as in seismic source area 1.1 have been used to define and
characterise source area 1.2. Furthermore, the major lithotectonic units have been recognised using
the combined information in the lithological and structural map databases and the information in
these databases is based, in turn, on an integrated evaluation of data derived mainly from field
outcrop studies and airborne magnetic field measurements; gravity field measurements have also
been used in particularly the interpretation of major lithotectonic units.
The boundaries of source area 1.2 are steered primarily by the reduction in the frequency of
epicenters around the source area with its distinctive cluster pattern (Fig. 8.2.1). The western
boundary corresponds to the boundary with seismic source area 1.1 and the eastern erosional front
of the Caledonian orogen. The eastern boundary is steered mainly by the gradient in seismic activity
but partly by ancient geological features. In the south, the boundary follows a deformation zone with
NNE–SSW to NE–SW trend that disturbs mainly 1.8 Ga rocks at the ground surface (Fig. 8.2.3); in the
Kiruna area in the central part, it follows the structural anisotropy defined by the strike of lithological
units; in the north, it lies along a deformation zone with NNE–SSW to NE–SW trend affecting Archean
rocks at the ground surface (Fig. 8.2.3). The southern boundary takes account of the fall in frequency
of epicenters (Fig. 8.2.1) and lies also close to the boundary two lithotectonic units (Fig. 8.2.2); the
Norrbotten lithotectonic unit to the north, containing 1.9–1.8 Ga magmatic rocks with an Archean
component in their source rock, and the northern part of the Bothnia-Skellefteå lithotectonic unit to
the south, containing similar rocks apparently lacking such a source component (Öhlander et al.,
1993; Mellqvist et al., 1999). The northern boundary simply follows the sharp decrease in seismic
activity (Fig. 8.2.1).
161
As indicated above, virtually the whole of seismic source 1.2 lies in the Norrbotten lithotectonic unit
(Fig. 8.2.2), with its Archean basement and important metallic mineral deposits, comprising a major
component inside the 2.0–1.8 Ga orogenic system. Archean orthogneiss intruded by dolerite (2.3–2.0
Ga) forms a conspicuous lithological component at the ground surface in the northern part of the
area (Bergman et al., 2001). These rocks were subsequently affected, to variable extent, by
deformation and metamorphism during orogenic activity at 2.0–1.8 Ga (Bergman et al., 2001). The
remainder of source area 1.2 at the ground surface consists of Paleoproterozoic (2.4–2.0 Ga),
metamorphosed sedimentary and volcanic rocks, which formed prior to the 2.0–1.8 Ga orogenic
activity, and younger Paleoproterozoic variably metamorphosed, magmatic and sedimentary rocks,
which formed during this activity, all underlain by Archean basement (Bergman et al., 2001). Volcanic
rocks with variable composition from basaltic to rhyolitic (1.89–1.88 Ga) and felsic intrusive rocks
(1.88–1.86 Ga) are volumetrically conspicuous in the near-surface realm.
Steeply dipping, ductile and brittle deformation zones with NNE–SSW to NE–SW, NW–SE or N–S
strike occur within and along the eastern boundary of source area 1.2 (Fig. 8.2.3). Material in the
structural map database and Bergman et al. (2001) indicates that one of the deformation zones with
NNE–SSW to NE–SW strike in the northeasternmost corner of the source area (Kiruna–Naimakka
deformation zone; Fig. 3.1.2.1; Bergman et al., 2001) shows a west-side-up, apparently reverse sense
of displacement, while a zone with NW–SE strike further south shows a southwest-side-up, again
apparently reverse sense of displacement (Fig. 8.2.3). These structures have affected the rocks
described above but their tectonic evolution after 1.8 Ga is poorly constrained. Gently dipping
thrusts with top-to-the-southeast displacement are present close to the western boundary of source
area 1.2 directly west of the erosional front to and inside the Caledonian orogen (Fig. 8.2.3). These
structures formed in connection with the continent-continent collision between Laurentia and Baltica
during the period 450–390 Ma (Gee, 1975; Stephens, 1988; Gee et al., 2010). Faults in seismic source
area 1.2 inferred to have been active during the Quaternary period are discussed below in spatial
models 2 and 3.
Earthquakes in source area 1.2 (Fig. 8.2.1) are strongly correlated in space with the mapped surface
trace of the post-glacial Pärvie fault which trends NNE–SSW (see spatial models 2 and 3). Events
mostly occur to the southeast of the fault, as expected from its reverse mechanism with
southeasterly dip direction. Permanent seismic stations of the SNSN were established in the area in
2003 and, during 2007–2010, a temporary seismic network of eight additional stations operated
along the Pärvie fault. SNSN locations in area 1.2 generally have low epicentral uncertainties. Events
with well-defined depths indicate that earthquakes occur from very shallow down to 35 km depth.
However, the majority of events are confined to the upper 20 km of crust (Lindblom et al., 2011). The
162
strongest observed earthquake is a shallow ML 3.6 event that took place on 26 December 1987 about
30 km WSW of Kiruna. No large historical earthquakes are known in this area.
Seismic source area 1.3
The same types of data and information as in source area 1.1 have been used to define and
characterise seismic source area 1.3. Furthermore, the major lithotectonic units, the lithological units
and the major ductile and brittle deformation zones in the bedrock have been recognised using the
same type of data as that presented in source area 1.2.
Source area 1.3 with its sparse and diffuse seismic pattern (Fig. 8.2.1) emerged during the spatial
model 1 work as one of two “rest areas” in the northwestern part of the study area following
definition of the surrounding source areas 1.1, 1.2, 1.4, 1.5, 1.7, 1.8, 1.9 and 1.10. The boundary
between source area 1.3 and the second “rest area” 1.6 was constructed by following approximately
the line separating the Norrbotten and Bothnia-Skellefteå lithotectonic units at the ground surface
(Fig. 8.2.2). The contact to the Archean rocks inside the Norrbotten lithotectonic unit dips to the
south and west.
Virtually the whole of seismic source area 1.3 is situated inside the Bothnia-Skellefteå lithotectonic
unit belonging to the 2.0–1.8 Ga orogenic system (Fig. 8.2.2). A rapakivi granite suite and dolerite sills
intruded this unit after the 2.0–1.8 Ga orogeny (Fig. 8.2.2). The northernmost and southernmost
parts occur inside the neighbouring Norrbotten and Ljusdal lithotectonic units, respectively (Fig.
8.2.2). More information on the geology in these marginal areas is presented in seismic source areas
1.2 and 1.5.
The major part of seismic source area 1.3 consists of migmatitic paragneiss and some better
preserved metamorphosed greywacke (1.89 Ga and older), gneissic granitoid and leucocratic granite.
In the northern part, magmatic provinces composed of rocks formed at 1.89–1.88 Ga and 1.88–1.86
Ga, the former with major metallic mineral deposits (Skellefte ore district), dominate; older
magmatic rocks that formed at 1.95–1.93 Ga are locally present (Kathol and Weihed, 2005). All these
rocks are intruded by large volumes of 1.8 Ga and, in southern parts, even 1.85 Ga granites
(Lundqvist et al., 1990; Högdahl and Sjöström, 2001; Kathol and Weihed, 2005). Regional polyphase
deformation and metamorphism at 1.88–1.86 Ga has been identified in the Bothnia-Skellefteå
lithotectonic unit (Rutland et al., 2001; Kathol and Weihed, 2005; Skyttä et al., 2012). Ductile
deformation along shear zones continued until 1.8 Ga. The bedrock in the southern part of the
source area (see Fig. 8.2.2) is intruded by anorthosite, gabbro and granite belonging to the so-called
rapakivi granite suite (1.53–1.51 Ga) and dolerite sills (1.27–1.26 Ga).

163
Steeply dipping, ductile and brittle deformation zones with WNW–ESE or NNW–SSE strike occur in
the central and southern parts of source area 1.3, south of and including the Skellefte ore district
(Fig. 8.2.3). North of this district the structural pattern changes radically and regionally significant
deformation zones with NNE–SSW to NE–SW strike as well as zones with NW–SE or NNW–SSE strike
are present (Fig. 8.2.3). Only a few detailed studies are available that have addressed the tectonic
development along the deformation zones. Dextral transpressive deformation around 1.82 Ga has
been inferred along the Hassela Shear Zone with WNW–ESE strike in the southernmost part of the
source area (Högdahl and Sjöström, 2001) and inversion tectonics with transpressive deformation at
1.88–1.86 Ga following normal faulting has been inferred in the Skellefte ore district to the north
(Bauer et al., 2011; Skyttä et al., 2012). Faults in source area 1.3 inferred to have been active during
the Quaternary period are discussed below in spatial models 2 and 3.
In source area 1.3, seismicity increases from the Caledonian orogen or Scandian mountain belt in the
west eastwards toward the coast and the Gulf of Bothnia (Fig. 8.2.1). There are no clear patterns in
the event locations and the seismicity is diffuse (Fig. 8.2.1). Seismic stations are located in the
eastern part of the area, making the western seismicity less well-determined. Earthquakes occur
from shallow levels down to 40 km depth. Information regarding large historical earthquakes is
missing. The Solberg earthquake of 29 September 1983 with magnitude around 4 (Table 4.3.1, No.
13) was located toward the coast in this area (Kim et al., 1985). The area of perceptibility extended to
the coastline.
Seismic source area 1.4
The same types of data and information as in seismic source area 1.1 have been used to define and
characterise source area 1.4. Furthermore, the major lithotectonic units, the lithological units, the
major ductile and brittle deformation zones on land and some of the brittle deformation zones
(faults) in the offshore realm, close to the coast of the Gulf of Bothnia, have been recognised using
the same type of data as that presented in source area 1.2. Information on faults affecting the
sedimentary cover rocks in the Gulf of Bothnia offshore area (Axberg, 1980), with a higher level of
data spatial resolution, have also been used in the characterisation of seismic source area 1.4.
The boundaries of seismic source area 1.4 are steered mainly by the reduction in the frequency of
epicenters around a broad group of earthquake clusters, the overall trend of which is NE–SW parallel
to a fault in the offshore area and more or less parallel to the coastline of the Gulf of Bothnia (Fig.
8.2.1). In the southern part of the source area, this fault forms the boundary between the crystalline
bedrock to the northwest and the sedimentary cover in submarine areas to the southeast (Fig. 8.2.2).
The southern, northern and eastern boundaries of source area 1.4 have been constructed so as to
follow the orientation of deformation zones or the fault in the submarine area with ENE–WSW,

164
NNW–SSE and NE–SW strike, respectively, which occur in the close vicinity of the gradient in seismic
activity (Figs. 8.2.1 and 8.2.3). Since the earthquakes in the north appear to be clustered in a more
N–S direction close to a deformation zone with the same orientation (Figs. 8.2.1 and 8.2.3), there
was some uncertainty concerning the position of the northern boundary and whether or not a
separate source area should be identified. The western boundary of source area 1.4 is more arbitrary
in character and steered solely by the reduction in frequency of epicenters (Fig. 8.2.1).
Apart from a small corner in the southwesternmost part of source area 1.4, south of the Hassela
Shear Zone, this source area is predominantly situated inside the Bothnia-Skellefteå lithotectonic
unit, close to its partly faulted contact to younger Mesoproterozoic and Paleozoic sedimentary rocks
to the southeast (Fig. 8.2.2). Rocks belonging to the rapakivi granite suite, dolerite sills and an
alkaline complex intruded the rocks in the Bothnia-Skellefteå lithotectonic unit after the 2.0–1.8 Ga
orogeny (Fig. 8.2.2).
The Bothnia-Skellefteå lithotectonic unit inside source area 1.4 consists of migmatitic paragneiss and
some better preserved metamorphosed greywacke (1.89 Ga and older), gneissic granitoid (1.9 Ga)
and leucocratic granite (Lundqvist et al. 1990). The bedrock in this unit is intruded by anorthosite,
gabbro and granite belonging to the so-called rapakivi granite suite (1.58 and 1.51 Ga) which, in turn,
are overlain, both on land and offshore, by Mesoproterozoic sandstone; 1.27-1.26 Ga dolerite sills
and, at one location, an Ediacaran alkaline complex intruded these rocks (Fig. 8.2.2; Winterhalter,
1972, 2000; Axberg, 1980; Lundqvist et al., 1990). Cambrian sandstone and Ordovician shale,
sandstone and limestone form the youngest rocks in the source area and are only preserved in the
submarine area in the Gulf of Bothnia (Fig. 8.2.2; Winterhalter, 1972, 2000; Axberg, 1980). Seismic
reflection data along profiles in the Gulf of Bothnia (e.g. BABEL Working Group, 1990, 1993; Korja
and Heikkinen, 2005, 2008) confirm the continuation of the Mesoproterozoic magmatic and
sedimentary rocks beneath the Paleozoic cover rocks in the offshore area.
Steeply dipping deformation zones with WNW–ESE to NW–SE and N–S strike, generally with a poorly
understood tectonic evolution, occur on land in source area 1.4 (Fig. 8.2.3). Both these sets as well as
faults with NE–SW strike have been identified using all the data available in the offshore area (see
section 2.6), where they displace the Mesoproterozoic and younger Paleozoic rocks (Winterhalter,
1972, 2000; Axberg, 1980). Formation of faults with NE–SW trend and reactivation of older
structures in the crystalline basement are suggested during the Mesoproterozoic and later tectonic
evolution. The stratigraphic relationships in the southern part of seismic source area 1.4 show also
that all these faults were active at least during or after the Ordovician period. The fault with NE–SW
strike close to the coast, northwest of which the earthquake epicenters appear to be clustered, has
been inferred to show a southeast-side-down displacement (Axberg, 1980). If some of the
earthquake clustering is related to this fault, then it should dip to the northwest, at least at depth,
165
and have a reverse sense of displacement during or after the Ordovician. The dip-slip displacements
along both the NW–SE and N–S fault sets in the offshore area are variable (Axberg, 1980).
Source area 1.4 belongs to the general band of seismicity that lines the Swedish northeast coast (Fig.
8.2.1). The area is well covered by the permanent station network constructed during 2000–2002,
making the epicentral locations relatively well-constrained. At a more detailed level of observation
inside area 1.4, some events form clusters of seismicity but the majority of the earthquakes occur in
a more diffuse pattern (Fig. 8.2.1). Earthquakes occur from shallow depth to almost 40 km depth.
The ML 3.6 Sundsvall earthquake on 4 June 1974 is the strongest instrumental event observed in
source area 1.4. It is challenging for studies of historical earthquakes, because the areas of
perceptibility may be very incomplete, extending over water toward the east and areas of sparse
settlement toward the west. An earthquake felt between Umeå and Härnösand and, in many places
in the north, occurred on the morning of 28 July 1888. The area of perceptibility extended to Finland,
where ground tremor was noticed in Pietarsaari (Swedish Jakobstad) and the archipelago. The
magnitude has been estimated at about MM4.
Seismic source area 1.5
The same types of data and information as in seismic source area 1.1 have been used to define and
characterise seismic source area 1.5. Furthermore, the major lithotectonic units, the lithological
units, the major ductile and brittle deformation zones on land and some of the brittle deformation
zones (faults) in the offshore realm, close to the coast of the Gulf of Bothnia, have been recognised
using the same type of data as that presented in source area 1.2. As for source area 1.4, information
on faults affecting the sedimentary cover rocks in the Gulf of Bothnia offshore area (Axberg, 1980),
with a higher level of data spatial resolution, have also been used in the characterisation of seismic
source area 1.5.
The boundaries of seismic source area 1.5 are steered mainly by the reduction in the frequency of
epicenters around a broad group of earthquake clusters (Fig. 8.2.1). The overall trend of this broad
concentration of earthquakes is slightly oblique to the coastline to the Gulf of Bothnia that more or
less follows in orientation the boundary between the crystalline bedrock to the west and the
sedimentary cover in submarine areas to the east (Fig. 8.2.2). The gradients are commonly situated
close to deformation zones with WNW–ESE (southern boundary), ENE–WSW (northern boundary) or
NNE–SSW to NE–SW (offshore, eastern boundary) strike and the boundaries have been constructed
so as to follow these trends in the three areas (Fig. 8.2.3). As for source area 1.4, the western
boundary of source area 1.5 is more arbitrary in character and steered solely by the reduction in
frequency of epicenters (Fig. 8.2.1).

166
The major part of source area 1.5 is situated inside the Ljusdal lithotectonic unit, belonging to the
2.0–1.8 Ga orogenic system, close to the contact with younger Mesoproterozoic and Paleozoic
sedimentary rocks to the southeast (Fig. 8.2.2). In the northernmost part of the source area, north of
the Hassela Shear Zone and inside the neighbouring Bothnia-Skellefteå unit, Mesoproterozoic
dolerite sills (1.27–1.26 Ga) intruded the gneissic bedrock after the 2.0–1.8 Ga orogeny (Fig. 8.2.2).
The bedrock in source area 1.5 is dominated by migmatitic paragneiss (1.89 Ga and older) intruded
by gneissic granitoid (1.87–1.84 Ga); diatexitic migmatite and leucocratic granite are more
conspicuous north of Hudiksvall, in the northern part of the source area (Wik et al., 2009). Regional
polyphase deformation and metamorphism around 1.87–1.86 Ga and 1.83–1.82 Ga has been
identified in the Ljusdal lithotectonic unit but only around 1.87–1.86 Ga in the southwestern part of
the Bothnia-Skellefteå lithotectonic unit, west of the Gulf of Bothnia (Högdahl et al., 2008, 2011; Wik
et al., 2009). In the offshore area, a layered sequence of Mesoproterozoic sandstone that passes
upwards and eastwards into Cambrian sandstone and Ordovician shale, sandstone and limestone is
preserved above the crystalline bedrock (Fig. 8.2.2; Winterhalter, 1972; Axberg, 1980). Impact melt
and breccia inside a shock zone, related to a meteorite impact structure during the Cretaceous
(Deutsch et al., 1992), occur in the western part of source area 1.5 around the lake Dellen (Fig. 8.2.2).
Steeply dipping, ductile and brittle deformation zones with WNW–ESE or NNW–SSE strike occur close
to the southern and western boundaries of the source area (Fig. 8.2.3; Högdahl et al., 2009; Wik et
al., 2009). A significant dextral strike-slip component of ductile shear displacement around 1.87–1.86
Ga and later around 1.81 Ga has been inferred along some of these zones (Högdahl et al., 2009). A
complex interplay between steeply dipping ductile and brittle shear zones with E–W and ENE–WSW
trend, the latter showing a sinistral strike-slip component of shear, are present in the northern part
of the source area. The E–W zones appear to be an easterly continuation of the Hassela Shear Zone
with its dextral transpressive deformation around 1.82 Ga (Högdahl and Sjöström, 2001) and
probably earlier. Bearing in mind data with a higher level of spatial resolution (see section 2.6), faults
with NNE–SSW to NE–SW trend showing predominantly east-side-down displacement are prominent
in the offshore area close to the eastern boundary of the source area; more persistent faults with
NW–SE strike and northeast-side-down displacement are also present (Fig. 8.2.3). The stratigraphic
relationships indicate that these faults were active at least during or after the Ordovician period.
Source area 1.5 belongs to the general band of seismicity that lines the Swedish northeast coast as
described in source area 1.4 (Fig. 8.2.1). The area is well-covered by the permanent station network
constructed during 2000–2002, making the epicentral locations relatively well-constrained. In area
1.5, many of the events occur in a wide cluster or band trending NE–SW north of the town of
Hudiksvall (Fig. 8.2.1). North and south of this cluster there is more diffuse seismicity (Fig. 8.2.1).

167
Earthquakes occur from shallow levels down to 35 km depth. The strongest event recorded is the ML
3.4 earthquake on 15 December 1991 offshore Sundsvall. No large historical earthquakes are known
in this area.
Seismic source area 1.6
The same types of data and information as in seismic source area 1.1 have been used to define and
characterise seismic source area 1.6. Furthermore, the major lithotectonic units, the lithological units
and the major ductile and brittle deformation zones in the bedrock have been recognised using the
same type of data as that presented in source area 1.2.
Source area 1.6 with its sparse and diffuse seismic pattern emerged during the spatial model 1 work
as the second “rest area” in the northwestern part of the study area following definition of the
surrounding source areas 1.1, 1.2, 1.7, 1.8 and 1.9 (Fig. 8.2.1). As described above, the boundary
between this source area and the second “rest area” 1.3 was constructed by following approximately
the line separating the Norrbotten and Bothnia-Skellefteå lithotectonic units at the ground surface
(Fig. 8.2.2).
Seismic source 1.6 is situated more or less entirely inside the Norrbotten lithotectonic unit (Fig.
8.2.2), with its Archean basement and important metallic mineral deposits, comprising a major
component inside the 2.0–1.8 Ga orogenic system. The Archean rocks are a continuation of the
Archean bedrock observed in source area 1.2; they were affected, to variable extent, by deformation
and metamorphism during orogenic activity at 2.0–1.8 Ga (Bergman et al., 2001). The remainder of
source area 1.2 at the ground surface consists of Paleoproterozoic (2.4–2.0 Ga), metamorphosed
sedimentary and volcanic rocks, which formed prior to the 2.0–1.8 Ga orogenic activity, and younger
Paleoproterozoic variably metamorphosed, magmatic and sedimentary rocks, which formed during
this activity, all underlain by Archean basement (Bergman et al., 2001). Rocks belonging to different
magmatic provinces and formed at 1.89–1.88 Ga, 1.88–1.86 Ga and around 1.8 Ga are volumetrically
the most conspicuous in the near-surface realm.
Steeply dipping, ductile and brittle deformation zones with NW–SE strike (e.g. Nautanen deformation
zone) strongly dominate inside source area 1.6 (Bergman et al., 2001; Fig. 8.2.3). These zones are
part of the Western Lapland fault system (Fig. 3.1.2.1) that deforms older structures throughout
Lapland. This fault system appears to end at the NNE-SSW to NE-SW trending Karesuando-Arjeplog
deformation zone. Zones with N-S strike are locally present in the Karesuando-Arjeplog deformantion
zone (Bergman et al., 2001; Fig. 8.2.3). The Karesuando–Arjeplog deformation zone shows both west-
side-up, apparently reverse dip-slip and a dextral strike-slip sense of displacement (Bergman et al.,
2001). The deformation zones in source area 1.6 have affected all the rocks described above.
168
However, their tectonic evolution after 1.8 Ga is poorly constrained. Faults in source area 1.6
inferred to have been active during the Quaternary period are discussed below in spatial models 2
and 3.
Source area 1.6 is located in the region between some of the better established post-glacial faults
identified in northern Sweden (see spatial models 2 and 3). However, such faults have been
identified in the southwestern part of the source area (see spatial models 2 and 3) and appear to be
spatially associated with ancient, regionally more important zones striking NW–SE as well as a
segment of the Karesuando–Arjeplog deformation zone. The area shows a low activity rate diffuse
seismicity (Fig. 8.2.1) and has been well-covered by seismic stations since 2004, making epicentral
locations relatively well-determined. Earthquake depths range from shallow to 40 km. The strongest
event recorded is the ML 3.7 earthquake on 13 April 1967 about 40 km northwest of Kiruna (Table
4.3.1, No. 10). No large historical earthquakes are known in this area.
Seismic source area 1.7
The same types of data and information as in seismic source area 1.1 have been used to define and
characterise source area 1.7. Furthermore, the major lithotectonic units, the lithological units and
the major ductile and brittle deformation zones in the bedrock have been recognised using the same
type of data as that presented in source area 1.2.
The western, southern and eastern boundaries of seismic source area 1.7 in Sweden proved difficult
to define in the context of ancient geological features in the bedrock and were drawn mainly on the
basis of the reduction in the frequency of epicenters around the clusters in the central part of the
source area (Fig. 8.2.1). The eastern boundary is situated partly in the vicinity of a lithological
boundary on the ground surface between intrusive rocks with an age range of 1.89–1.80 Ga to the
east and of 1.89–1.86 Ga to the west.
In Sweden, source area 1.7 is situated between the Karesuando–Arjeplog deformation zone
(Bergman et al., 2001) to the west and the Pajala shear zone (Kärki et al., 1993; Bergman et al., 2001,
2006) to the east, inside the Norrbotten lithotectonic unit (Fig. 8.2.2). The northern boundary of this
unit is not well-constrained. It has been extended tentatively here as far north as a major system of
shear zones inside source area 1.7 that strikes NNW–SSE through Finland and into Norway, which
appear to link together with the Pajala shear zone (Fig. 8.2.2). The dominant pattern in earthquake
locations also appears to turn from NE–SW to NNW–SSE direction in this part of the source area (Fig.
8.2.1 and Fig. 8.2.3). On the basis of these considerations, the northeasternmost part of seismic
source area 1.7 inside the study area has been included in the Karelia lithotectonic unit (Fig. 8.2.2).

169
Source area 1.7 consists of Paleoproterozoic (2.0–1.8 Ga), variably metamorphosed, magmatic and
sedimentary rocks, which formed during the 2.0–1.8 Ga orogenic activity, overlying Paleoproterozoic
(2.4–2.0 Ga), metamorphosed sedimentary and volcanic rocks, which formed prior to this activity
(Bergman et al., 2001); the latter are more conspicuous in the northern part of the source area. All
these rocks are underlain by Archean crystalline basement rocks that are not exposed at the ground
surface (Bergman et al., 2001). The syn-orogenic lithological units include rocks belonging to different
magmatic provinces formed at 1.89–1.88 Ga, 1.88–1.86 Ga and around 1.8 Ga. A conspicuous
positive Bouguer gravity anomaly indicative of mass surplus at depth, spatially associated with an
anomaly in the total magnetic field, occurs inside source area 1.7 in Sweden directly south of the
border to Finland (Figs. 2.1.1 and 2.1.2, respectively).
Steeply dipping, ductile and brittle deformation zones with NW–SE, NNW–SSE or N–S strike are
present inside source area 1.7 (Bergman et al., 2001, Korsman et al., 1997; Fig. 8.2.3) and mainly
coincide with the trends of the boundaries between major lithological units (Fig. 2.4.1). The tectonic
evolution of these structures is, in general, poorly constrained. The NW-SE trending deformation
zones are part of the Western Lapland fault system. Faults in source area 1.7 inferred to have been
active during the Quaternary period are discussed below in spatial models 2 and 3.
Source area 1.7 encompasses the major post-glacial faults Merasjärvi and Lainio-Suijavaara in
Sweden and Stuoragurra in Norway (see spatial models 2 and 3), all of which show appreciable
seismic activity (Fig. 8.2.1). Recently, small PGFs have also been found in Enontekiö, in the Finnish
part of the source area; the Paatsikkajoki and Palojärvi faults trend NE–SW and NNE–SSW,
respectively, and the Kultima fault in a NW–SE direction (Table 3.2.3.1 and see spatial models 2 and
3). The southern segment of the Lainio-Suijavaara fault is spatially associated with one of the
regionally important deformation zones with NNW–SSE strike. In Sweden, the activity is well-
monitored since the station installations in 2004. The Stuoragurra fault in Norway was investigated
with a temporary seismic network in the late 1990´s. However, none of these data were available for
the current study.
The seismicity in the area is mostly related to the post-glacial faults, with events occurring to the
southeast of the faults as expected due to their reverse mechanisms with southeasterly dip
directions. Some additional events occur diffusely away from the faults. In Enontekiö, the trends in
seismicity range from NNW–SSE, the dominant orientation, to NNE–SSW, i.e. roughly parallel and
perpendicular to the major deformation zone.
Events occur from shallow depths down to 35 km depth. The greatest instrumentally recorded
earthquake is the 25 February 25 1975 ML 4.0 event in Finnmark, northern Norway. No notable

170
historical earthquakes are known for this area. The area has been sparsely populated and devoid of
major centers of documentation, so possible earthquakes could have passed unnoticed. Ground
tremor was reported from Karasjok, in Norway, at the end of 1758, but the respective epicenter has
been placed in Finland (Tatevossian et al., 2013).
Seismic source area 1.8
The same types of data and information as in seismic source area 1.1 have been used to define and
characterise source area 1.8. Furthermore, the major lithotectonic units, the lithological units and
the major ductile and brittle deformation zones in the bedrock have been recognised using the same
type of data as that presented in source area 1.2. In addition, data from the FIRE 4 reflection seismic
profile (Patison et al., 2006) were used.
The boundaries of seismic source area 1.8 proved difficult to define in the context of ancient
geological features in the bedrock and were drawn mainly on the basis of the reduction in the
frequency of epicenters around concentrations mainly in the central and southwestern parts of the
source area (Fig. 8.2.1). However, as indicated above, the boundary to source area 1.7 to the west is
situated partly in the vicinity of a lithological boundary on the ground surface between intrusive
rocks that formed at 1.89-1.80 Ga (east) and 1.89–1.86 Ga (west). Furthermore, the concentrations
of earthquake epicenters in the central and southwestern parts of the source area are situated inside
or in close vicinity to the major shear belt referred to as the Pajala shear zone (Fig. 8.2.3; Kärki et al.,
1993; Bergman et al., 2001, 2006).
The southwestern part of seismic source area 1.8 is situated to the west of the Pajala shear zone and
forms a part of the Norrbotten lithotectonic unit. A larger part of the source area occurs within and
to the east of the Pajala shear zone and is included here in the Karelia lithotectonic unit (Fig. 8.2.2).
Seismicity is generally more diffuse in the northeastern part of the source area, to the east of this
shear zone. The northern boundary of the source area has been drawn so that the source area is
confined to the Karelia lithotectonic unit and does not include the earthquakes with a different
spatial pattern immediately southwest of the Inari lithotectonic unit (Figs. 8.2.1 and 8.2.2).
Source area 1.8 consists of similar rocks as those present in area 1.7. Archean crystalline basement
rocks, which are only exposed at the ground surface in the northeastern part of the source area, are
overlain by Paleoproterozoic (2.4–2.0 Ga), metamorphosed sedimentary and volcanic rocks. All these
rocks formed prior to but were affected by the 2.0–1.8 Ga orogenic activity and are overlain, in turn,
by Paleoproterozoic (2.0–1.8 Ga), variably metamorphosed magmatic and sedimentary rocks, which
formed during the 2.0–1.8 Ga orogenic activity. The syn-orogenic lithological units include rocks
belonging to different magmatic provinces formed at 1.89–1.88 Ga, 1.88–1.86 Ga and around 1.8 Ga.

171
Ductile and brittle deformation zones with N–S, NE–SW and NNW–SSE trends comprise the complex
deformation belt referred to as the Pajala shear zone (Kärki et al., 1993; Bergman et al., 2001, 2006),
a major structural component inside source area 1.8 (Fig. 8.2.3). Bergman et al. (2006) suggested a
polyphase tectonothermal evolution in the Norrbotten and Karelia lithotectonic units during the time
span 1.86–1.74 Ga with different histories on both sides of this zone. Rocks to the west of it were
little affected by the younger event around 1.8 Ga and the earlier history around 1.86–1.85 Ga was
preserved in this area. Wikström et al. (1996) also suggested that ductile deformation along the
Pajala shear zone took place earlier around 1.88 Ga. At least parts of the Pajala shear zone show an
east-side-up and sinistral displacement during its development (Wikström et al., 1996; Bergman et
al., 2001), i.e. opposite to that observed along the regionally significant Karesuando–Arjeplog
deformation zone in source area 1.6 to the west.
A large part of source area 1.8 is also affected by faults with NW–SE strike, on both sides of and
cross-cutting the Pajala shear zone (Fig. 8.2.3). These faults are part of the Western Lapland fault
system. By contrast, the structural framework is different in the northeastern part of the source area,
east of the Pajala shear zone (Fig. 8.2.3). In this area (Central Lapland belt), a set of east-bending
convex shear zones dominate the structural pattern (Fig. 8.2.3). These ductile deformation zones
have been interpreted as thrusts with displacement towards east or northeast (Lehtonen et al., 1998;
Hölttä et al., 2007). In the the northernmost part of source area 1.8, another set of shear zones, with
roughly N-S strike, have been interpreted as thrusts with displacement towards the west – southwest
(Hölttä et al., 2007). The variable kinematics in this area may be partly explained by later folding of
the thrusts. In the center of source area 1.8 (east of the Pajala shear zone), a semi-circular area
(Central Lapland granitoid complex) is bounded in the north by the Venejoki shear zone (Fig. 3.1.2.1),
interpreted on the basis reflection seismic data (Patison et al., 2006) as a thrust zone with
displacement towards the north. Faults inside source area 1.8 inferred to have been active during the
Quaternary period are discussed below in spatial models 2 and 3.
In Sweden, the seismic activity has been well-monitored since the installation of the northernmost
SNSN in 2004. The SNSN network together with the installation of new stations (RNF, TOF) in
northern Finland has also improved event location accuracy on the Finnish side of the border. The
southwestern and central parts of source area 1.8 are characterized by a moderate amount of low-
magnitude seismic activity.
The source area encompasses the Lansjärv post-glacial fault in Sweden and extends into Finland
where the Venejärvi, Ruostejärvi and Pasmajärvi post-glacial faults are situated; two post-glacial
faults, Isovaara and Suasselkä (Fig. 2.7.2), are also located in the seismically quieter, northeastern
172
part of the area (see spatial models 2 and 3). The seismicity is located mostly to the southeast of the
PGFs, with an appreciable NE–SW band of seismicity (Fig. 8.2.1) connecting the faults in Sweden and
Finland. The NW–SE-striking Western Lapland fault system (Fig. 3.1.2.1) traversing the Central
Lapland granitoid complex (see above) are prominent in the central part of the area. Intense
clustering of earthquake epicenters takes place at locations where such zones and the post-glacial
faults intersect. The events occur from shallow depth down to 40 km depth. The largest instrumental
event is from the early instrumental recording period. It occurred on 4 September 1968 close to Pello
in the Finland-Sweden border zone and had a magnitude of ML 3.4.
A rather widely noticed earthquake occurred within source area 1.8 on February 17, 1819; it was
reportedly felt in places such as Pajala, Kittilä, Muonio and Kolari. Some minor damage (broken
windowpanes and stoves) was reported from Kittilä and the macroseismic intensity was I = 56
(EMS-98). Mäntyniemi (2008b) proposed that the epicenter of the earthquake of 4 November 1898
may have had its origin in this source area. An aftershock was widely felt less than an hour after the
main shock. The respective area of perceptibility supports the notion that the epicenter was located
in this area rather than in area 1.11.
Seismic source area 1.9
The same types of data and information as in seismic source area 1.1 have been used to define and
characterise source area 1.9. Furthermore, the major lithotectonic units, the lithological units, the
major ductile and brittle deformation zones on land and some of the brittle deformation zones
(faults) in the offshore realm, in the Bay of Bothnia, have been recognised using the same type of
data as that presented in source area 1.2. Further Information on possible faults affecting the
sedimentary cover rocks in the Bay of Bothnia presented in Wannäs (1989) have also been used in
the characterisation of seismic source area 1.9.
The boundaries of source area 1.9 are steered mainly by the reduction in the frequency of epicenters
around an area where there is a concentration of earthquake clusters (Fig. 8.2.1). To the west and
south, the gradients are situated close to deformation zones with N–S and NW–SE strike,
respectively, and these structures have been used to define the western and southern boundaries of
the polygon (Fig. 8.2.3). The deformation zone along the southern boundary also corresponds to a
bathymetric disturbance in the Bay of Bothnia (Fig. 8.2.3). The boundary on the eastern side has
been drawn so as to simply follow the gradient in seismicity (Fig. 8.2.1); it corresponds approximately
to the eastern limit of the Pajala shear zone (Kärki et al. 1993, Bergman et al. 2001, 2006) with N–S
trend (Fig. 8.2.3). The gradient and boundary on the northern side appears to be independent of and
traverses across the Pajala shear zone (Fig. 8.2.3).
173
Source area 1.9 encompasses a geological highly complex area. The western part of the area, to the
west of the Pajala shear zone, is situated more or less entirely inside the Norrbotten lithotectonic
unit and the northeastern part, including the rocks in the shear belt referred to as the Pajala shear
zone, belongs to the Karelia lithotectonic unit (Fig. 8.2.2). In the southeastern part of source area 1.9,
beneath the Bay of Bothnia, these units are stratigraphically overlain by sedimentary cover rocks that
were deposited during the Meso- or Neoproterozoic and Cambrian (Fig. 8.2.2). The deformation zone
along the southern boundary to source area 1.9 is a fault that disturbs the sedimentary cover but this
structure also lies close to or along the blind surface separating the Norrbotten and Karelia
lithotectonic units to the north, where 1.9–1.8 Ga magmatic rocks at the ground surface show an
Archean crustal input, and the Bothnia-Skellefteå lithotectonic unit to the south, where such rocks
are more juvenile and lack an Archean input (Fig. 8.2.2; Öhlander et al., 1993; Mellqvist et al., 1999).
The Precambrian rocks in seismic source area 1.9 resemble those described in the neighbouring area
to the north and the reader is referred to source area 1.8 for more information. A conspicuous new
lithological component is the occurrence of alkaline ultrabasic dykes that intruded the crystalline
bedrock around 1.1 Ga. The sedimentary cover rocks preserved offshore in the Bay of Bothnia consist
of Cambrian sandstone overlying reddish Meso- or Neoproterozoic sandstone and siltstone.
Ductile and brittle deformation zones with N–S strike, which belong to the southernmost extension
of the Pajala shear zone, appear to terminate southwards against the conspicuous deformation zone
with NW–SE strike along the southern boundary of source area 1.9 (Fig. 8.2.3). More information on
the tectonic evolution along and on both sides of the Pajala shear zone is presented above in source
area 1.8. Zones with N–S, NE–SW and NW–SE strike are prominent on land to the west of the Pajala
shear zone (Fig. 8.2.3), while faults with NE–SW, NW–SE and NNW–SSE strike apparently affected the
sedimentary cover rocks in the sub-marine area in the Bay of Bothnia (see section 3.1.3). The
stratigraphic relationships indicate that these faults were active at least during or after the Cambrian
period.
Source area 1.9 may have been the host area of the earthquake of 27 November 1757 felt at the
bottom of the Bay of Bothnia and along both the western and eastern coast. Wahlström (1990) gave
its magnitude as MM3.7, but it may have been slightly stronger. The largest instrumental earthquake
is the ML 3.6 event that occurred on 6 June 1991 in Luleå. The area has appreciable seismicity (Fig.
8.2.1) but it has not been correlated to a known post-glacial fault (see spatial models 2 and 3). The
area has been relatively well-covered since the SNSN network installation in 2004 and one additional
permanent station was installed in the area in 2010. There is seismicity along the coastline in a NE–
SW direction from Sweden into Finland, but also a well-defined band of seismicity that extends
southwards into the Bay of Bothnia and a second one extending in a NW–SE direction in Sweden (Fig.
174
8.2.1). The offshore events have generally less well constrained locations than the events within the
SNSN network. Events occur from shallow levels down to 45 km depth.
Seismic source area 1.10
The same types of data and information as in seismic source area 1.1 have been used to define and
characterise source area 1.10. Furthermore, the major lithotectonic units, the lithological units, the
major ductile and brittle deformation zones on land and some of the brittle deformation zones
(faults) in the offshore realm, close to the coast of the Bay of Bothnia, have been recognised using
the same type of data as that presented in source area 1.2. As in source area 1.9, information on
faults affecting the sedimentary cover rocks in the Bay of Bothnia offshore area (see section 3.1.3),
with a higher level of data spatial resolution, have also been used in the characterisation of source
area 1.10.
The boundaries of seismic source area 1.10 are steered mainly by the reduction in the frequency of
epicenters around several clusters, situated mainly on land and in the offshore area (Norra Kvarken)
between Umeå and Vaasa (Fig. 8.2.1). The southwestern boundary conforms with the boundary
deformation zone to source area 1.4 (Fig. 8.2.3), and extends this boundary both to the northwest on
land along the zone (Fig. 8.2.3) and to the southeast into the Norra Kvarken area. This area is
geologically significant since it marks a bathymetric and topographic high separating two sub-basins
filled with sedimentary cover rocks in the Gulf of Bothnia (see section 3.1.3 and Fig. 8.2.2;
Winterhalter, 1972, 2000; Axberg, 1980; Wannäs, 1989).
The northern boundary of source area 1.10 follows the fault with NW–SE strike and bathymetric
disturbance separating area 1.10 from source areas 1.9 and 1.11 (Fig. 8.2.3). This fault is also
geologically significant since it is inferred to mark a blind lithotectonic unit boundary beneath the
sedimentary cover (see text above for source area 1.9 and Figure 8.2.2). The southern boundary on
the Finnish side of the Gulf of Bothnia has also been placed close to a deformation zone with similar
trend (Fig. 8.2.3). The northwestern and southeastern boundaries have been drawn somewhat
arbitrarily along the boundaries to the two source areas (1.3 and 1.13, respectively) with sparser and
more diffuse seismic activity (Fig. 8.2.1).
The western and southern parts of source area 1.10 are situated in the Bothnia-Skellefteå and
Central Finland lithotectonic units, respectively (Fig. 8.2.2). By contrast in the northeastern part,
north of Norra Kvarken beneath the Bay of Bothnia, the rocks in these units are stratigraphically
overlain by sedimentary cover rocks that were deposited during the Meso- or Neoproterozoic and
Cambrian (Fig. 8.2.2).

175
The Bothnia-Skellefteå lithotectonic unit, inside source area 1.10, consists of migmatitic paragneiss
and some better preserved metamorphosed greywacke (1.89 Ga and older), gneissic granitoid and
gabbro-diorite (1.9 Ga) and younger (1.8 Ga) granite (Kathol and Weihed, 2005). Similar lithologies
are found in the Vaasa granitoid complex, in the western part of the Central Finland lithotectonic unit
(see Fig. 2.4.2). Regional deformation and migmatization, partly diatexitic in character, occurred
around 1.88–1.86 Ga (Rutland et al., 2001) prior to the intrusion of the younger granites. However,
ductile deformation and metamorphism apparently continued along deformation zones in the
Bothnia-Skellefteå lithotectonic unit until at least 1.82 Ga (Romer and Nisca, 1995; Weihed et al.,
2002). The sedimentary rocks overlying the crystalline basement rocks and preserved offshore in the
Bay of Bothnia consist of reddish Meso- or Neoproterozoic sandstone and siltstone beneath
Cambrian sandstone (Winterhalter, 1972, 2000; Wannäs, 1989).
The most conspicuous deformation zone in source area 1.10 is the complex ductile and brittle
Burträsk shear zone southwest of the Skellefteå mining district (Figure 8.2.3; see also Figures 2.4.2
and 3.1.2.1). The shear zone shows a dextral strike-slip component of displacement and was active in
the ductile regime at 1.82 Ga (Romer and Nisca, 1995). Apart from the deformation zone with NNW–
SSE strike along the southwestern boundary of the source area, regionally significant deformation
zones have not been identified on land in the gneisses south of this major shear belt and west of the
Gulf of Bothnia (Fig. 8.2.3). By contrast, north of the shear zone, to the west and north of Skellefteå,
the structural pattern is more complicated with different sets of zones striking N–S, NW–SE and even
NE–SW (Fig. 8.2.3). Sets of faults with similar trend have also been inferred in the offshore area in
the Bay of Bothnia. Stratigraphic relationships indicate that these faults were active at least during or
after the Cambrian period (Fig. 8.2.3; Wannäs, 1980). In the gneissic rocks of the Central Finland
lithotectonic unit, in the southernmost part of source area 1.10, deformation zones with WNW–ESE
are present. The southern boundary of source area 1.10 is the Malax shear zone (Fig. 3.1.2.1). The
zone follows the strike of a peculiar rock association (Vittinki mafic volcanic rocks and chert) that may
define an important tectonic boundary.
Source area 1.10 is Sweden's currently most seismically active area. The area contains the Burträsk
and Röjnoret post-glacial faults (see spatial models 2 and 3), which show some spatial relationship to
the ENE–WSW to NE–SW shear belt south of Skellefteå and the N–S system of deformation zones
west of this town, respectively (see above). The area has been well-monitored by seismic stations
since 2001. During 2012, a temporary network of six additional stations was installed around the
Burträsk shear zone. A large proportion of the events in the area are aligned along and to the
southeast of this fault. Seismicity extends to the northeast past the end of the surface mapped fault
scarp into the Bay of Bothnia where it appears to be sparser (Fig. 8.2.1). There is less seismicity
associated with the Röjnoret fault, but the area in between the faults contains significant diffuse
176
seismicity, which continues northward along the coastline (Fig. 8.2.1). Focal depths in the source area
are from very shallow down to 45 km depth. In the Skellefteå district, the focal depth pattern differs
from the neighbouring source areas as well as from the shallow seismicity pattern on the Finnish side
of source area 1.10. Approximately 50% of the events occur in the middle and lower crust, at depths
between 15 and 45 km.
The largest instrumental event in the area is from the early instrumental recording period. It
occurred on 28 September 1962 close to Burträsk and measured ML 4.0. During the operational
period of the SNSN network, the largest observed earthquake is a strike-slip event of ML 3.5 that took
place on 15 June 2010 at the northeastern extension of the Burträsk fault (Table 4.3.1, No. 45).
The largest earthquake in the study area in the 1900´s (9 March 1909, ML = 4.6 according to FENCAT,
ML = 5 according to Båth, 1956) occurred almost certainly in source area 1.10. No aftershocks are
known to have been reported. Three epicenters have been proposed in the published literature,
including an offshore epicenter (FENCAT), one on the coast (Båth, 1956), and one tentatively placed
close to Skellefteå (Mäntyniemi, 2012b). Several historical earthquakes since 1762 were reportedly
felt in this town. The earthquakes of 14 July 1765 and 31 December 1908 were also simultaneously
felt on the eastern coast. Several earthquake reports have been reported for the town of Vaasa on
the eastern coast. They are probably related to offshore earthquakes. In most cases, no observations
in Sweden have been found. Only in one case (earthquake of 26 May 1907) does the area of
perceptibility extend from the Swedish territory to Vaasa. The macroseismic data suggest that this
may have been a rather deep earthquake.
Seismic source area 1.11
The major lithotectonic units have been recognised using the combined information in the
lithological and structural map databases. The information in the lithological database is based
mainly on field outcrop data whereas information of the structural database is based mainly on
evaluation of data derived from airborne magnetic field measurements. In addition, data from the
FIRE reflection seismic profiles (Kukkonen and Lahtinen, 2006) were used. Furthermore, gravity field
measurements have been used in the interpretation of major lithotectonic units.
The boundaries of seismic source area 1.11 are difficult to define in the context of ancient geological
features in the bedrock and were drawn mainly on the basis of the reduction in the frequency of
epicenters around concentrations mainly in the southern and northern parts of the source area (Fig.
8.2.1). The source area is mainly confined to the Karelia lithotectonic unit. The northern boundary
roughly follows the margin to the Inari lithotectonic unit (Fig. 8.2.2).

177
Seismic source area 1.11 consists of Archean crystalline basement rocks, only exposed in the
southernmost part of the source area, overlain by Paleoproterozoic (2.4–2.0 Ga), metamorphosed
sedimentary and volcanic rocks. These rocks were affected by the 2.0–1.8 Ga orogenic activity and
are overlain, in turn, by Paleoproterozoic (2.0–1.8 Ga), variably metamorphosed magmatic and
sedimentary rocks, which formed during the 2.0–1.8 Ga orogenic activity. The syn-orogenic
lithological units include rocks belonging to different magmatic provinces formed at 1.89–1.88 Ga
and around 1.8 Ga.
Ductile deformation zones with E-W strike dominate in the Paleoproterozoic sedimentary and
volcanic rocks in the central part of the source area (Peräpohja belt; Korsman et al., 1997; Fig. 8.2.3).
Another set of roughly E-W trending ductile shear zones, curving towards NE-SW, are located in the
northern part. These zones were interpreted by Evins and Laajoki (2002) as subhorizontal thrusts
with displacement towards the south. The central part of source area 1.11 is characterized by NW-SE
trending ductile-brittle faults that are part of the Western Lapland fault system (Fig. 3.1.2.1).
In the northeast instrumental seismicity forms a NE-SW-trending pattern that agrees with the small-
scale rather than the major structural lines. The pattern is interrupted in central Lapland by NW-SE
trending faults constituting the Western Lapland fault system (Fig. 3.1.2.1). The central part of source
area 1.11 exhibits sparse and diffuse seismicity. Seismic activity increases towards the Bay of Bothnia
area, where epicenters again follow the NW-SE trend. Overall, the local earthquakes are weak and
shallow, mostly occurring within the first 15 km of crust. The largest instrumental event in source
area 1.11 is from the early instrumental recording period. It occurred on 17 February 1961 in the Bay
of Bothnia, about 40 km offshore Oulu and measured ML 3.7.
This is probably the host area of the 15 June and 23 June 1882 earthquakes. The latter is among the
strongest events, if not the strongest, in the seismological record. It is also unique for the Gulf of
Bothnia region with two widely felt earthquakes within a time interval of only eight days. The largest
intensities (I = 67 EMS-98) were assigned to Tornio in Finland and Sangis-Kalix area in Sweden
(Mäntyniemi and Wahlström, 2013). It is not possible to resolve whether the maximum intensity was
6 or 7, although related documentation could be uncovered in archives. It is not possible to pinpoint
whether the epicenter was offshore or onshore. An epicenter given by Båth (1956) to the earthquake
of 4 November 1898 (5 November local time) places the ML>4 earthquake in this source area, but it
has later been proposed that the epicenter was located more westward, in this case in source area
1.8 (Mäntyniemi, 2008b).
178
Seismic source area 1.12
The same types of data and information as in seismic source area 1.11 have been used to define and
characterize seismic source area 1.12. The seismicity of the area is sparse and diffuse compared to
the adjacent areas, 1.11 in the west and 1.15- 1.17 in the east (Fig. 8.2.1). The area is considered as a
“rest area” in between source areas with more distinct seismicity pattern. The boundary between
this area and the southern “rest area”, 1.13, was constructed by following approximately the
seismicity that parallels the Archean-Proterozoic boundary. The northern boundary corresponds to
the northern limit of the study area with 500 km radius (Fig. 8.2.1).
Seismic source area 1.12 situates in the Karelia and Inari lithotectonic units (Fig. 8.2.2) and consists of
Archean crystalline basement rocks, exposed mainly in the southern and northeastern parts of the
source area. These rocks are overlain by Paleoproterozoic (2.4–2.0 Ga), metamorphosed sedimentary
and volcanic rocks that are found in both lithotectonic units. These rocks were affected by the 2.0–
1.8 Ga orogenic activity and are overlain, in turn, by Paleoproterozoic (2.0–1.8 Ga), variably
metamorphosed magmatic and sedimentary rocks, which formed during the 2.0–1.8 Ga orogenic
activity. The syn-orogenic lithological units include rocks belonging to different magmatic provinces
formed at 1.89–1.88 Ga and around 1.8 Ga. Neoproterozoic sedimentary rocks (Muhos sandstone)
are found in the southwestern part of the source area.
The central part of source area 1.12 is affected by deformation zones with NW–SE strike, the same
that can be detected in source area 1.2, 1.6-1.8 and 1.11 (Fig. 8.2.3). The central part of source area
1.12 is affected by deformation zones with NW–SE strike, belonging to the Western Lapland fault
system. The Vuotso shear zone (see Figure 3.1.2.1), flanks the southern margin of the Inari
lithotectonic unit. The shear zone has been interpreted as a set of thrusts with displacement towards
southwest (Gaál et al., 1989; Patison et al., 2006).
The instrumental earthquakes have been small, shallow and randomly scattered across the area.
There are no distinct seismicity clusters except in the north, where a curved lineament of epicenters
correlates with the Vuotso shear zone. A remarkable historical earthquake was felt at Utsjoki and on
the Norwegian side of the border at the end of 1758 (Tatevossian et al., 2013). A large earthquake in
the early instrumental era occurred on 20 February 1960 and its magnitude is given as ML4.0.
Another large instrumental earthquake in the region is the ML 3.6 event on 21 June 1974 in Ranua.
Seismic source area 1.13
The same types of data and information as in seismic source area 1.11 have been used to define and
characterize seismic source area 1.13. This is a source area of quite diffuse seismicity (Fig. 8.2.1).
During the spatial model 1 work it emerged as the second “rest area” in the eastern part of the study

179
area. The southern boundary of the area corresponds to the southern limit of the study area with
500 km radius (Fig. 8.2.1), whereas the NW-SE boundary is constructed by following approximately
seismicity that parallels the Archean-Proterozoic boundary. The other boundaries follow definitions
of the surrounding source areas 1.4, 1.5, 1.10 and 1.14.
The northeastern part of seismic source area 1.13 belongs to the Karelia lithotectonic unit (Fig.
8.2.2). This part consists of Archean crystalline basement rocks, overlain by Paleoproterozoic (2.4–2.0
Ga) metamorphosed sedimentary rocks; these rocks were affected by the 2.0–1.8 Ga orogenic
activity and are intruded by 1.87-1.86 Ga magmatic rocks. Most of seismic source area 1.13 is
situated inside the Central and Southern Finland units belonging to the 2.0–1.8 Ga orogenic system.
A rapakivi granite suite and dolerite sills intruded this unit after the 2.0–1.8 Ga orogeny, and in the
western part, beneath the Bay of Bothnia, the rocks in this unit are stratigraphically overlain by
sedimentary cover rocks that were deposited during the Mesoproterozoic and Cambrian (Fig. 8.2.2).
In the central part of the Central Finland lithotectonic unit, east of the Gulf of Bothnia, ductile shear
zones curve around the Central Finland granitoid complex (see Figure 2.4.2). In the northeastern
part of the igneous complex, a major NW-SE trending structure, the Raahe-Ladoga shear complex,
transects the igneous complex. The shear complex consists of ductile shear zones in varying
directions, overprinted by semi-brittle and brittle faults (Pajunen, 1986; Kärki et al., 1993; Kärki and
Laajoki, 1995). The horizontal movement directions and rates along the length of the shear complex
are not known: both dextral (Halden, 1982) and sinistral (Gaál, 1980) horizontal shearing have been
suggested along relatively late shear zones. Dextral shearing has been proposed for two shear zones
in the northwestern part of the shear complex (Weihed and Mäki, 1997). NW-SE trending dextral
shear zones exist in the area of the Central Finland granitoid complex, and Nironen et al. (2000)
interpreted that they developed in a transtensional tectonic environment. To the southwest of the
Central Finland granitoid complex there is a NW-SE trending shear zone (Kynsikangas shear zone).
The inferred deformation history for the zone is sinistral horizontal movement followed by normal
faulting (Pietikäinen, 1994).
Within the Southern Finland lithotectonic unit E-W and WNW-ESE trending shear zones cause a
lozenge-shaped pattern (Fig. 8.2.3). A shear zone network with roughly E-W and NNE-SSW trends
overprints this pattern (Väisänen and Skyttä, 2007). The E-W trending late shear zones have both
vertical and horizontal movement components whereas at least some NNE-SSW trending zones are
normal faults.
The few earthquakes in southern and central Finland are randomly scattered. However, the largest
instrumental earthquake to occur in Finland, the ML 3.8 event in Lappajärvi on February 17, 1979 is
180
located within this source area (No. 3, Table 4.3.1). The majority of earthquakes are confined within
the first 15 km of crust.
According to non-instrumental earthquake data available, the southernmost Finnish coastline up to
the border toward source area 1.10 exhibits low seismicity, the largest earthquake being that felt in
the town of Uusikaupunki on 18 April 1926. The magnitude possibly exceeded ML 3. The upper part
of the coastline may have experienced historical earthquakes felt over rather long distances of the
coastline. A strong candidate is the earthquake of 29 March 1777. No Swedish observations have
been uncovered for this earthquake. The largest earthquake known in central Finland (ML 4.3 0.2)
occurred on the early morning of 16 November 1931. It was followed by a widely felt aftershock
about 15 hours later (Mäntyniemi 2004b).
Seismic source area 1.14
The same types of data and information as in seismic source area 1.11 have been used to define and
characterize seismic source area 1.14 (Fig. 8.2.1.). The area is located at the ground surface within
the lithotectonic unit referred to as “Proterozoic (post-1.8 ga) magmatic and sedimentary provinces”
(Fig. 8.2.2) and is confined to a 1.65 rapakivi granite (Wiborg granite; Rämö and Haapala, 2005). The
southern boundary corresponds to the southern limit of the study area with 500 km radius (Fig.
2.4.2). There are no major lineaments in the source area (Fig. 8.2.3).
Source area 1.14 is separated from the surrounding area 1.13 due to its unique seismicity pattern.
The Wiborg granite area is characterized by shallow swarm-type earthquake activity (Uski et al.,
2006). The latest swarm has been occurring since December 2011 in and around the town of Kouvola
(Table 4.3.1, No. 36). More than 200 earthquakes, with magnitudes ranging from ML -1 to 2.8, have
been recorded so far. The earthquake swarms are unusually shallow, most likely occurring within the
first 2 km from the surface. The overall distribution of seismicity follows closely the NE-SW-oriented
contacts of rapakivi intrusions, which seem to form local zones of crustal weakness inside the
batholith. A shallow shock of ML 2.9 on 21 July 1982 is the greatest instrumentally recorded event in
the area. No aftershocks have been reported for the event.
This source area hosts the oldest earthquake in the Finnish seismicity record, that of 1610. There is
an early report of an earthquake swarm in 175152. The occurrence during the winter months may
cast some doubt on whether it was weather-induced; however, similar seismicity patterns later
support the notion that it was of seismic origin. The largest non-instrumental event of ML 3.1 belongs
to the Lapinjärvi earthquake swarm in the 1950’s.

181
Seismic source area 1.15
The same types of data and information as in seismic source area 1.11 have been used to define and
characterize seismic source area 1.15. The northern, eastern and western boundaries of source area
1.15 are drawn mainly on the basis of the reduction in the frequency of epicenters that cluster
around the two major lineaments, the trends of which are N-S and NNE-SSW (Figs. 8.2.1 and 3.1.2.1).
In the northeast, the boundary is controlled by the increased seismicity level within source area 1.16.
Since both historical and instrumental seismic data were insufficient to define the southern borders
of polygon 1.15, the boundaries are defined such that the southern ends of the Hirvaskoski and
Oulunjärvi shear zones (Fig. 3.1.2.1) are included in 1.15.
Seismic source area 1.15 is located in the Karelia lithotectonic unit (Figs. 8.2.2 and 3.1.2.1). The
source area consists mainly of Archean crystalline basement rocks. These rocks are overlain by
Paleoproterozoic (2.4–2.0 Ga), metamorphosed sedimentary and (minor) volcanic rocks that are
confined in and around shear zones. These rocks were affected by the 2.0–1.8 Ga orogenic activity
and are intruded by Paleoproterozoic (1.8 Ga) granites (Korsman et al., 1997).
Seismic source area 1.15 contains two major subvertical shear zones: the N-S trending Hirvaskoski
shear zone and a NNE-SSW trending Oulunjärvi shear zone deforming the Hirvaskoski shear zone (Fig.
8.2.3). The Hirvaskoski shear zone has been interpreted an ancient thrust belt (thrusting towards
east) that was subsequently deformed with a dextral shear component (Tuisku and Laajoki, 1990;
Kärki et al., 1993). The sense of shear in the Oulunjärvi shear zone was sinistral (Kärki et al., 1993).
Deformation style varied from ductile to semi-brittle, and a NNE trending semi-brittle fault (Auho
fault) continues north towards seismic source area 1.16.
Earthquakes cluster at the intersection of the Hirvaskoski and Oulunjärvi shear zones and follow their
strike to the north and northeast. However, the trends in earthquake distribution imply activity along
NW-SE to NNW-SSE oriented smaller scale faults within the major deformation zones. The
seismogenic layer extends from few km below the surface down to a depth of about 30 km. Nearly
50 % of the events occur in the middle crust, at depths between 15 and 30 km.
There are some interesting historical earthquakes probably associated with this source area. The
earthquake of 10 April 1902 had a very rare area of perceptibility that extended across the border to
Russia. Its magnitude exceeded ML4. A lesser earthquake occurred on 26 December 1911. The
uncertainty associated with the June 1626 epicenter is large, but the earthquake was felt within this
source area (Tatevossian et al., 2011). The strongest instrumental earthquake is a magnitude ML 2.9
event on 9 November 1990 in Puolanka.
182
Seismic source area 1.16
The same types of data and information as in seismic source area 1.11 have been used to define
andcharacterise seismic source area 1.16. This area, Kuusamo, is the seismically most active area in
Finland. The boundaries of the area are based solely on the higher rate of seismicity and the
distinctive cluster pattern with relation to the neighboring source areas (Fig. 8.2.1).
The area is located in the Karelia lithotectonic unit (Fig. 8.2.2). It consists of Archean crystalline
basement rocks intruded by Paleoproterozoic (2.4–2.0 Ga), mafic layered intrusions and dykes. It is
also partly overlain by coeval sedimentary and volcanic rocks. The area was reactivated and
metamorphosed during the 2.0–1.8 Ga orogenic activity.
The area is transected by a complex system of NNE-SSW and NW-SE oriented major shear zones and
their minor conjugates. The NNE-SSW trending Auho-Kandalaksha fault zone (Fig. 3.1.2.1) consists of
several parallel faults extending across source areas 1-15-1.17 from central Finland up to the
Kandalaksha Gulf in northwestern Russia (Elo, 1991a). Magnetic and gravity data suggest sinistral
movement or shear and steep dips for the faults (Elo, 1991b). The NW-SE trending faults are
considered to be continuation of the Western Lapland fault system that stretches over a vast area
(including source areas 1.2, 1.6-1.8, 1.11-1.12) from northern Norway to the central Lapland
granitoid (Berthelsen and Marker, 1986; Elo, 1991a; Airo, 1999). In addition, roughly WNW-ESE
oriented belt of layered intrusions seems to act as a zone of crustal weakness in the local stress field.
The most intense clustering of earthquake epicenters coincides with the area where the above
mentioned three major lineaments intersect (Uski et al., 2003, 2006). The seismogenic layer extend
from few kilometers below the surface down to a depth of about 30 km, i.e., close to the basement
of the middle crust. More than half of the events occur in the middle crust, at depths below 15 km.
The central part of the area that is occupied by layered mafic intrusions appears to be aseismic down
to 6-7 km depth (Uski et al., 2012).
The historical seismicity record begins in 1731 and largely consists of recurrent microearthquakes.
The area has been poorly covered by seismic stations until 2005 when a dense temporary network of
4-7 stations became operational. Earthquake determinations before 2005 may therefore contain
large uncertainties, whereas the later determinations are well constrained. The largest earthquake
(18 August 1926) in this source area has magnitude above ML 4. The largest instrumentally recorded
earthquake is the ML 3.5 event on 15 September 2000 in Kuusamo (Table 4.3.1, No. 28).
Seismic source area 1.17
Seismic source area 1.17 is located in the Karelia lithotectonic unit (Fig. 8.2.2). The area consists of
Archean crystalline basement rocks, partly overlain by Paleoproterozoic (2.4–2.0 Ga),
183
metamorphosed sedimentary and volcanic rocks. These rocks were affected by the 2.0–1.8 Ga
orogenic activity.
The resolution of the geophysical data for interpretation of lineaments is poor in this source area. A
NNW-SSE trending lineament exists in the westernmost part of the area, and on lithological basis it
probably is a thrust fault. The NNE-SSW trending Auho-Kandalaksha fault zone that continues from
source area 1.16 can be discerned.
The same types of data and information as in seismic source area 1.11 have been used to define and
characterize seismic source area 1.17. The boundaries do not follow specific ancient geological
features in the bedrock and were therefore drawn mainly on the basis of the reduction in the
frequency of epicenters (Fig. 8.2.1). The southern and northern limits are based primarily on
distribution of epicenters around the broad NNE-SSW trending Auho-Kandalaksha fault zone. The
western boundary coincides with the decreased activity rate NNW of the Kuusamo area, and the
eastern boundary corresponds to northeastern limits of both the study area and the deformation
zone.
Seismicity seems to follow the NNE-SSW trend of the Auho-Kandalaksha fault zone, although roughly
NW- trending clusters are also visible. The events are shallower than in the neighboring Kuusamo
area: less than 10 % of the events have focal depth exceeding 15 km. Here also, the deepest events
seem to concentrate within a zone occupied by mafic layered intrusions. However, due to lack of
seismic stations in the area, uncertainties in earthquake source parameters may be high.
An earthquake was felt at the bottom of the Bay of Kandalaksha on 17 December 1758, and it is
possible that the observations were made in the vicinity of the epicenter. The maximum intensity
may have been up to I=67 (EMS-98), because damages to the masonry parts of dwellings were
reported (Tatevossian et al., 2013).
The only instrumental earthquake of magnitude greater than 4.0 in northeastern Fennoscandia was
located on the eastern fringes of this area. The event took place on 20 May 1967 in the Kandalaksha
Gulf and was assigned with magnitudes ranging from 4.8 to 5.2 (Table 4.3.1, No. 1).
Seismic source area 1.18
The same types of data and information as in seismic source area 1.11 have been used to define and
characterise seismic source area 1.18. Seismicity of the source area is diffuse, and evidence of
seismic activity diminishes toward south (Fig. 8.2.1). The boundaries of seismic source area 1.18 do
not follow specific ancient geological features in the bedrock except in the south where the boundary
has the same NW-SE trend as the Archean-Proterozoic boundary. The eastern boundary of the area
184
corresponds to the eastern limit of the study area with 500 km radius (Fig. 8.2.1), whereas the
southern boundary is drawn up by following the Raahe-Ladoga shear complex with its NW-SE trend
(Fig. 3.1.2.1). Zones of enhanced seismic activity (source areas 1.15-1.17) dictate the northwestern
and northern boundaries of area 1.18.
Seismic source area 1.18 is located in the Karelia lithotectonic unit (Fig. 8.2.2). The source area
consists of Archean crystalline basement rocks, partly overlain by Paleoproterozoic (2.4–2.0 Ga),
metamorphosed sedimentary and volcanic rocks. These rocks in the western part of the seismic
source area were affected by the 2.0–1.8 Ga orogenic activity but the effects of this activity diminish
eastwards.
The western part of the area is characterized by slightly curving, generally NNW-SSE trending
lineaments that have been interpreted as thrust faults (thrusting towards NE at 1.91-1.88 Ga;
Kohonen, 1995). The resolution of the geophysical data for interpretation of lineaments is poor in the
eastern part of the source area.
The few instrumental events have been weak, shallow and randomly scattered. In addition, lack of
seismic stations in the Russian side of the border has precluded detailed analyses of earthquake
mechanisms. The strongest event, the ML 3.7 earthquake on 24 August 1991, is located at the
northeastern corner of the source area, close to the Kandalaksha seismicity zone (area 1.17). No
notable historical earthquakes are known in this source area. It could be explained by a lack of
documentation due to sparsely distributed population and a border area. However, the area appears
quite devoid of earthquake epicenters in the instrumental era as well.
8.3 Spatial models 2 and 3
S. Grigull, A. Korja, E. Kosonen, B. Lund, M. Uski & P. Mäntyniemi
8.3.1 General methodology and result
The identification of seismic source areas in spatial models 2 and 3 made use primarily of the
seismicity data and the observation that earthquake epicenters in the study area 1) occur in clusters,
2) are generally sparse and diffusely distributed or 3) are virtually absent (sections 2.8 and 4). The
seismic data used in the modeling work consists of events both from the SNSN and the FENCAT
catalogues (Figs 2.8.1.1-2.8.1.3). Focus was placed on defining the boundaries to these three
different styles of seismic activity by making use of the data bearing on faults active during the
Quaternary as described in sections 2.7 (Fig. 2.7.2) and 3.2. In model 3, bathymetric and topographic
information was also used (section 2.2). No account was taken in spatial models 2 and 3 to
lithological information (sections 2.1, 2.3-2.4), geologically ancient structures (sections 2.1–2.3, 2.5
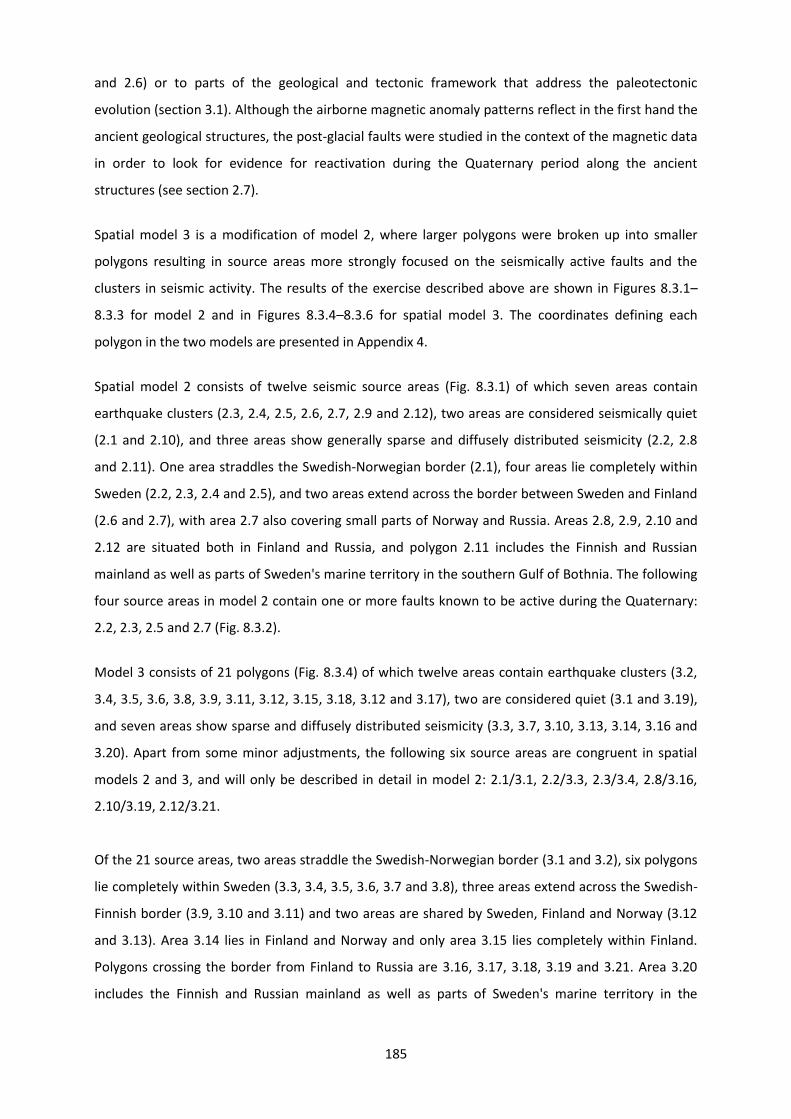
185
and 2.6) or to parts of the geological and tectonic framework that address the paleotectonic
evolution (section 3.1). Although the airborne magnetic anomaly patterns reflect in the first hand the
ancient geological structures, the post-glacial faults were studied in the context of the magnetic data
in order to look for evidence for reactivation during the Quaternary period along the ancient
structures (see section 2.7).
Spatial model 3 is a modification of model 2, where larger polygons were broken up into smaller
polygons resulting in source areas more strongly focused on the seismically active faults and the
clusters in seismic activity. The results of the exercise described above are shown in Figures 8.3.1–
8.3.3 for model 2 and in Figures 8.3.4–8.3.6 for spatial model 3. The coordinates defining each
polygon in the two models are presented in Appendix 4.
Spatial model 2 consists of twelve seismic source areas (Fig. 8.3.1) of which seven areas contain
earthquake clusters (2.3, 2.4, 2.5, 2.6, 2.7, 2.9 and 2.12), two areas are considered seismically quiet
(2.1 and 2.10), and three areas show generally sparse and diffusely distributed seismicity (2.2, 2.8
and 2.11). One area straddles the Swedish-Norwegian border (2.1), four areas lie completely within
Sweden (2.2, 2.3, 2.4 and 2.5), and two areas extend across the border between Sweden and Finland
(2.6 and 2.7), with area 2.7 also covering small parts of Norway and Russia. Areas 2.8, 2.9, 2.10 and
2.12 are situated both in Finland and Russia, and polygon 2.11 includes the Finnish and Russian
mainland as well as parts of Sweden's marine territory in the southern Gulf of Bothnia. The following
four source areas in model 2 contain one or more faults known to be active during the Quaternary:
2.2, 2.3, 2.5 and 2.7 (Fig. 8.3.2).
Model 3 consists of 21 polygons (Fig. 8.3.4) of which twelve areas contain earthquake clusters (3.2,
3.4, 3.5, 3.6, 3.8, 3.9, 3.11, 3.12, 3.15, 3.18, 3.12 and 3.17), two are considered quiet (3.1 and 3.19),
and seven areas show sparse and diffusely distributed seismicity (3.3, 3.7, 3.10, 3.13, 3.14, 3.16 and
3.20). Apart from some minor adjustments, the following six source areas are congruent in spatial
models 2 and 3, and will only be described in detail in model 2: 2.1/3.1, 2.2/3.3, 2.3/3.4, 2.8/3.16,
2.10/3.19, 2.12/3.21.
Of the 21 source areas, two areas straddle the Swedish-Norwegian border (3.1 and 3.2), six polygons
lie completely within Sweden (3.3, 3.4, 3.5, 3.6, 3.7 and 3.8), three areas extend across the Swedish-
Finnish border (3.9, 3.10 and 3.11) and two areas are shared by Sweden, Finland and Norway (3.12
and 3.13). Area 3.14 lies in Finland and Norway and only area 3.15 lies completely within Finland.
Polygons crossing the border from Finland to Russia are 3.16, 3.17, 3.18, 3.19 and 3.21. Area 3.20
includes the Finnish and Russian mainland as well as parts of Sweden's marine territory in the

186
southern Gulf of Bothnia. The following six source areas in model 3 contain one or more faults known
to be active during the Quaternary: 3.2, 3.3, 3.6, 3.11, 3.12 and 3.15 (Fig. 8.3.6).
Figure 8.3.1. Earthquake epicenters (Figs. 2.8.1.1-2.8.1.2) and seismic source areas identified in
spatial model 2 in the area with 500 km radius centred on the proposed Hanhikivi nuclear power
plant, Finland. The bathymetric character of both the Gulf of Bothnia and the Gulf of Finland is also
shown.
The work with spatial models 2 and 3 has clearly shown that most earthquake clusters are spatially
related to the occurrence of single fault lines or fault systems that show evidence for Pleistocene and
Holocene movement. This relationship is reflected in the choice of polygon geometries in both
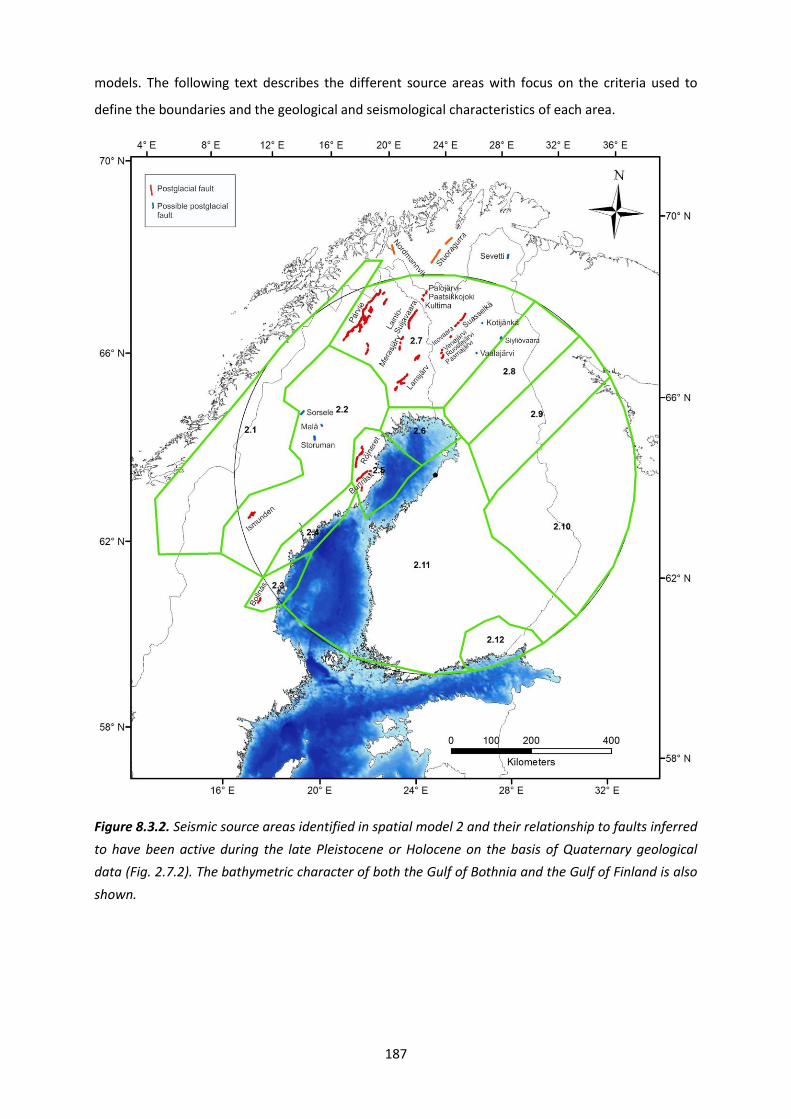
187
models. The following text describes the different source areas with focus on the criteria used to
define the boundaries and the geological and seismological characteristics of each area.
Figure 8.3.2. Seismic source areas identified in spatial model 2 and their relationship to faults inferred
to have been active during the late Pleistocene or Holocene on the basis of Quaternary geological
data (Fig. 2.7.2). The bathymetric character of both the Gulf of Bothnia and the Gulf of Finland is also
shown.
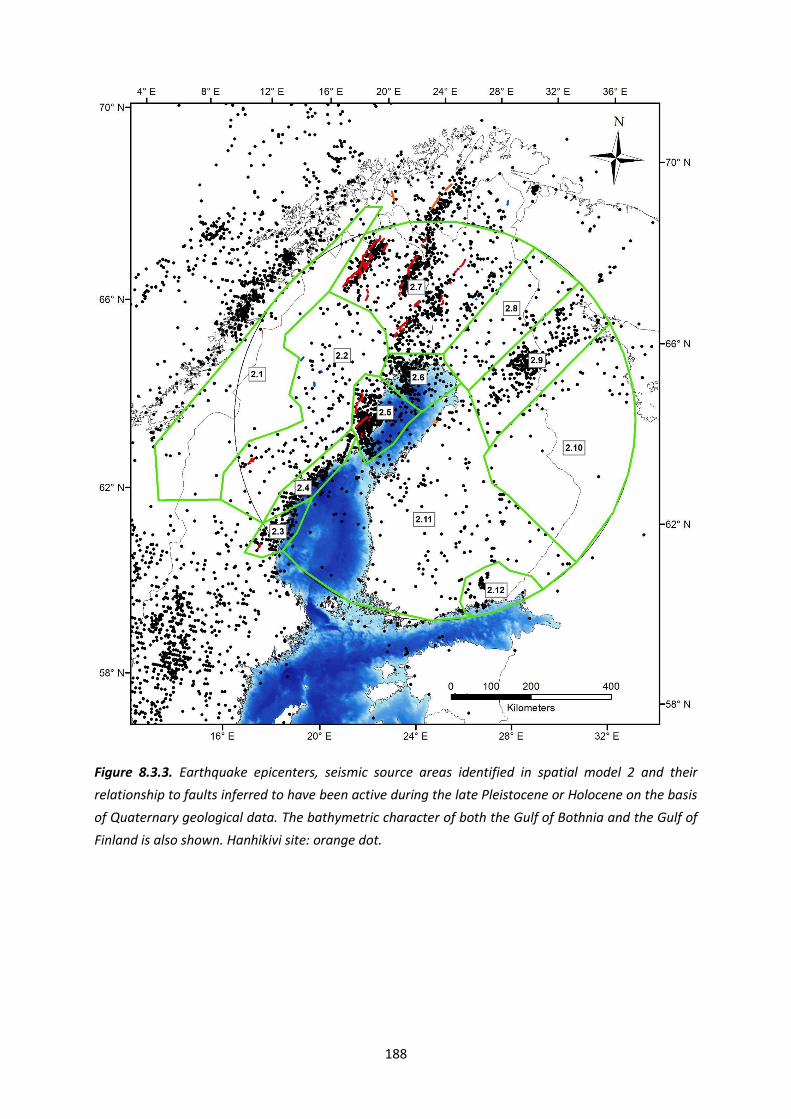
188
Figure 8.3.3. Earthquake epicenters, seismic source areas identified in spatial model 2 and their
relationship to faults inferred to have been active during the late Pleistocene or Holocene on the basis
of Quaternary geological data. The bathymetric character of both the Gulf of Bothnia and the Gulf of
Finland is also shown. Hanhikivi site: orange dot.
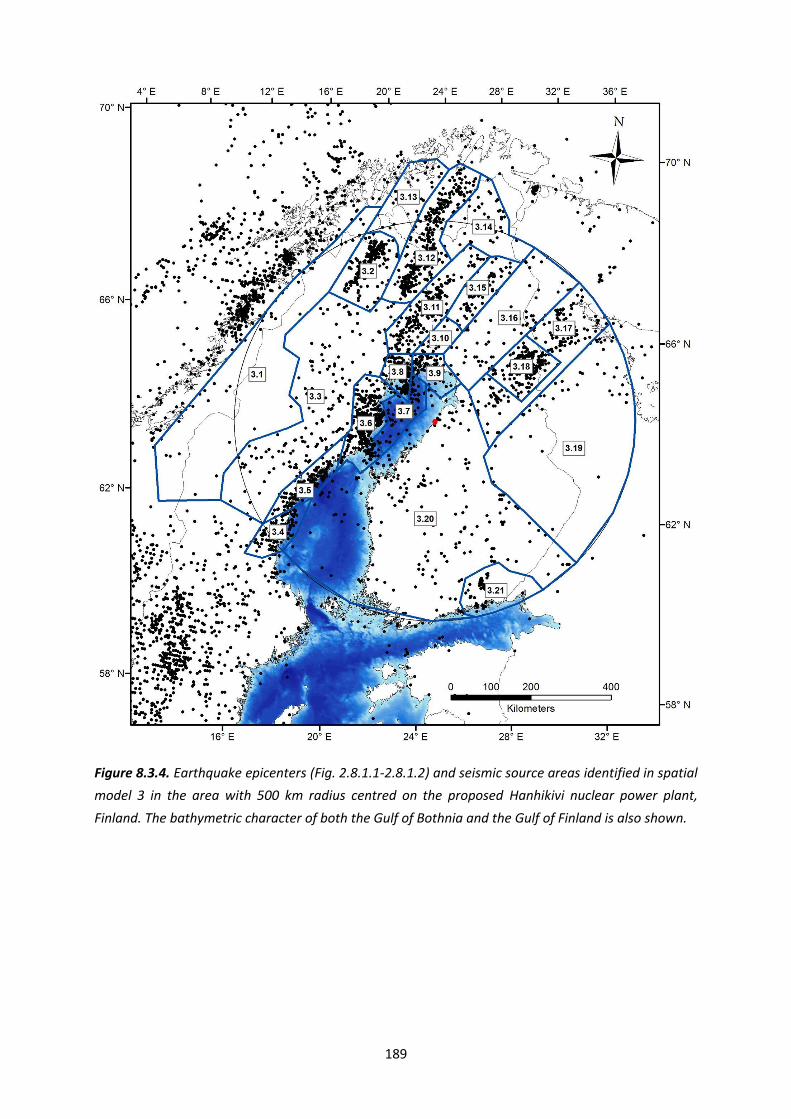
189
Figure 8.3.4. Earthquake epicenters (Fig. 2.8.1.1-2.8.1.2) and seismic source areas identified in spatial
model 3 in the area with 500 km radius centred on the proposed Hanhikivi nuclear power plant,
Finland. The bathymetric character of both the Gulf of Bothnia and the Gulf of Finland is also shown.
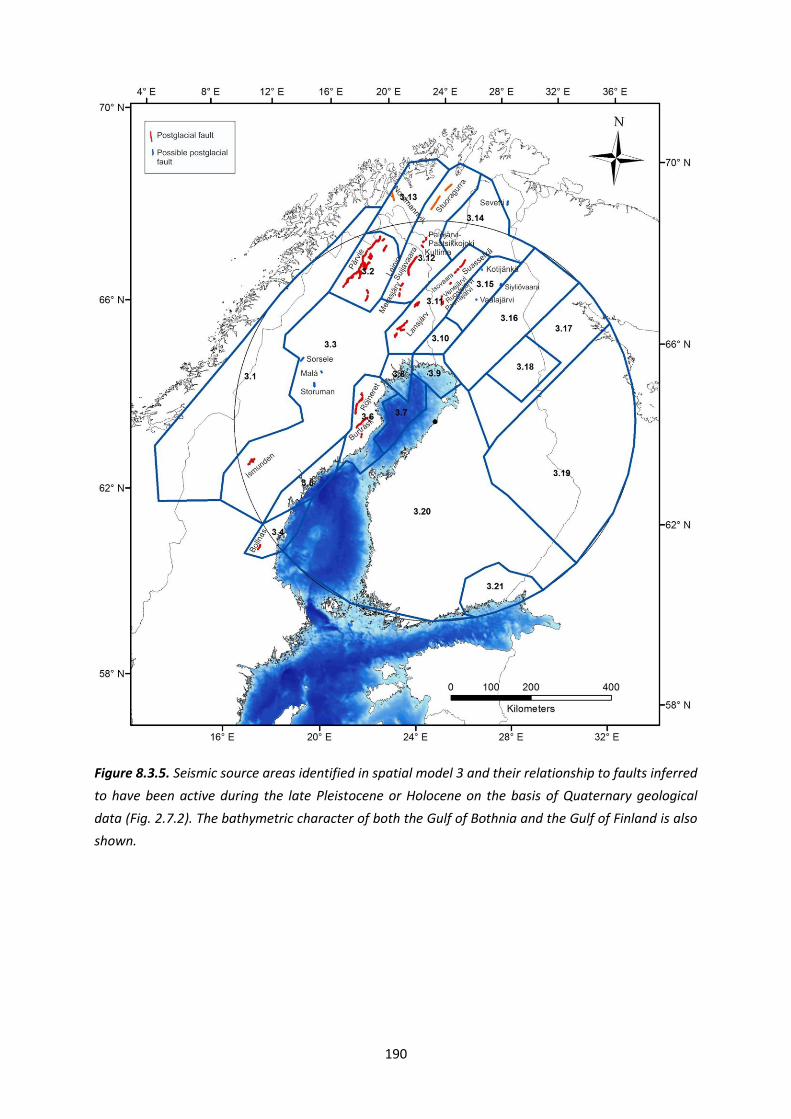
190
Figure 8.3.5. Seismic source areas identified in spatial model 3 and their relationship to faults inferred
to have been active during the late Pleistocene or Holocene on the basis of Quaternary geological
data (Fig. 2.7.2). The bathymetric character of both the Gulf of Bothnia and the Gulf of Finland is also
shown.
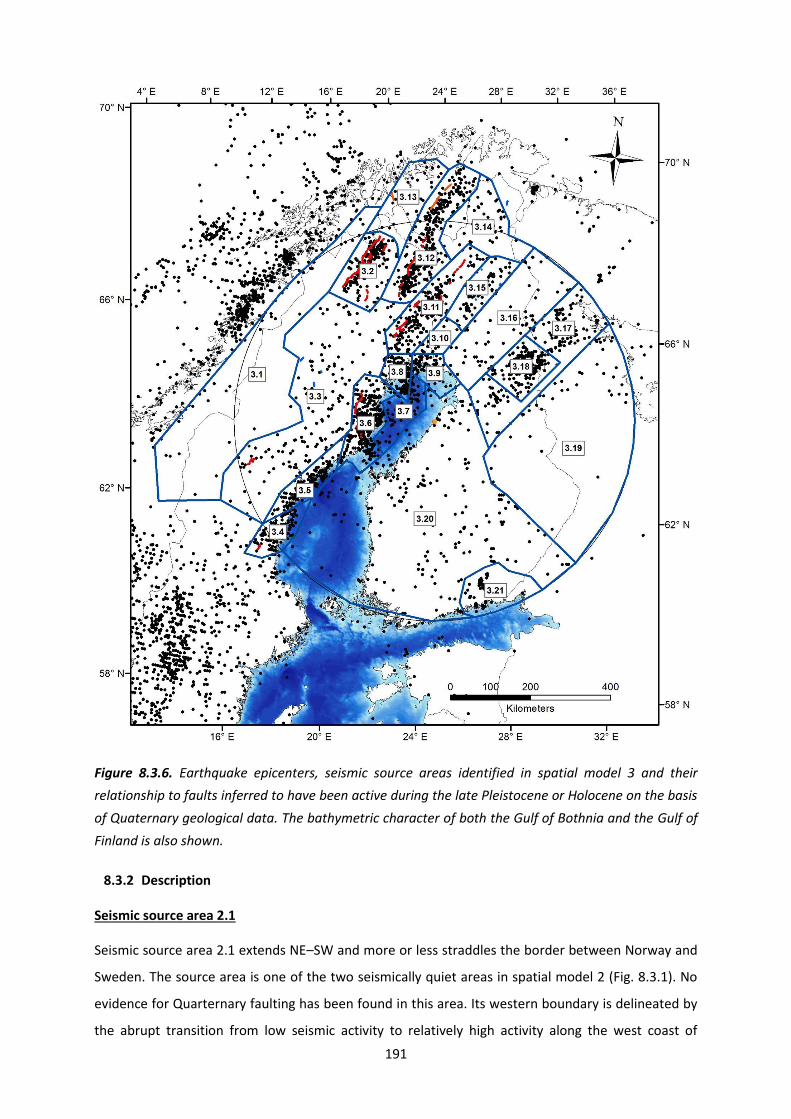
191
Figure 8.3.6. Earthquake epicenters, seismic source areas identified in spatial model 3 and their
relationship to faults inferred to have been active during the late Pleistocene or Holocene on the basis
of Quaternary geological data. The bathymetric character of both the Gulf of Bothnia and the Gulf of
Finland is also shown.
8.3.2 Description
Seismic source area 2.1
Seismic source area 2.1 extends NE–SW and more or less straddles the border between Norway and
Sweden. The source area is one of the two seismically quiet areas in spatial model 2 (Fig. 8.3.1). No
evidence for Quarternary faulting has been found in this area. Its western boundary is delineated by
the abrupt transition from low seismic activity to relatively high activity along the west coast of

192
Norway (Fig. 8.3.1). The northeastern boundary of the source area is also marked by an abrupt
transition from seismically quiet to a cluster of high activity around the Pärvie fault system in source
area 2.7 (Fig. 8.3.1). The boundary shared with polygon 2.2 is somewhat arbitrary but follows
approximately the transition from almost no seismicity to increased diffuse seismicity (Fig. 8.3.1).
Seismic source area 2.1 corresponds to the Scandian mountain belt. The reader is referred to seismic
source area 1.1 in spatial model 1 for the area's relationship to ancient geological features
(lithotectonic affiliation, lithology and geologically ancient structures).
Source area 2.1 has very little seismicity and the events are widely distributed in the area. Since there
is no seismic station in the area, the events have poor depth determinations and larger than average
uncertainties in the epicentral locations. Focal depths vary between a few kilometres and 35 km,
with large uncertainties. However, according to the parameterization given in FENCAT, the epicenter
of the large Norwegian earthquake of 31 August 1819 was located in this source area. The area of
perceptibility extended to the eastern coast of the Gulf of Bothnia. The respective magnitude is
assessed at 5.8 based on the studies of Ambraseys (1985) and Muir Wood (1988). Husebye and
Kebeasy (2004) proposed a lower magnitude. The largest instrumental event in the area is the MS 3.8
event that occurred on 29 April 1978 in the west coast of Norway, i.e outside the study area with a
500-km radius.
Seismic source area 2.2
Seismic source area 2.2 extends NE–SW and is slightly SE-arcuate (Fig. 8.3.1). Seismicity in this area is
generally sparse and diffusely distributed (Fig. 8.3.1). Three minor faults with recorded displacement
during the Quaternary are reported within the source area: Storuman, Sorsele and Ismunden. (Fig.
8.3.2; Lagerbäck and Sundh, 2008). Recent work with a LiDAR-derived high resolution DEM at SGU
rendered it questionable if the linear features east of Storuman are indeed faults with recorded
Quaternary displacement. The existence of a fourth fault west of Malå was suspected but is no
longer considered likely after a thorough study by SGU of newly available LiDAR data in the area.
There are no clear patterns in the seismic event locations, and no epicenter clusters could
unambiguously be attributed to any of these faults (Fig. 8.3.3). The western boundary of the seismic
source area is the somewhat arbitrarily defined boundary to polygon 2.1. The eastern boundary is
defined by the transition from diffuse to clustered seismicity in polygons 2.3, 2.4, 2.5, 2.6 that extend
along the west coast of the Gulf of Bothnia (Fig. 8.3.1). The northern boundary of seismic source area
2.2 delineates the southernmost extent of the clustered seismicity around the faults active during
the Quaternary that are included in source area 2.7 (Fig. 8.3.1). The reader is referred to seismic
source area 1.3 in spatial model 1 for the area's relationship to ancient geological features.
193
All seismic stations but one are located in the eastern part of the area, making the seismicity in the
west less well-determined. In source area 2.2, seismicity increases somewhat from the Scandian
mountain belt in the west towards the coast of the Gulf of Bothnia in the east (Fig. 8.3.1).
Earthquakes occur from shallow levels down to 40 km depth. No large historical earthquakes are
known for this source area. Possible earthquakes in particular close to the mountains could easily
have passed unreported due to the sparse population and lack of documentation centres. The largest
instrumental event, the Solberg earthquake of 29 September 1983 with magnitude around 4 (Table
4.3.1, No. 13) was located toward the coast in this area (Kim et al., 1985). The area of perceptibility
extended to the coastline.
Seismic source area 2.3
Seismic source area 2.3 extends NE–SW and its western, southern and eastern boundaries are mainly
steered by the reduction in frequency of epicenters around the source area (Fig. 8.3.1). At least one
fault with reported Quaternary movement (the recently discovered Bollnäs fault; ongoing activities
at SGU) occurs in the southwestern corner of the source area outside the study area (Fig. 8.3.2). The
northern border to seismic source area 2.4 was drawn along a NE–SW-trending break in the
seismicity pattern along the coastline (Fig. 8.3.1). The reader is referred to seismic source area 1.5 in
spatial model 1 for the area's relationship to ancient geological features.
Source area 2.3 belongs to the general band of seismicity that lines the northeastern coast of
Sweden. The area is well-covered by the permanent station network constructed during 2000–2002,
making the epicentral locations relatively well-constrained. In source area 2.3, many of the events
occur in a wide NE–SW trending cluster north of the town of Hudiksvall (Fig. 8.3.1) and slightly
oblique to the Swedish coastline of the southern Gulf of Bothnia (NNE–SSW). North and south of this
band there is more diffuse seismicity (Fig. 8.3.1). Earthquakes occur from shallow levels down to 35
km depth. The largest historical earthquake reported occurred on 21 December 1886 and had a
magnitude of around 3.9. The largest instrumental event is the ML 3.4 earthquake on 15 December
1991 offshore Sundsvall.
Seismic source area 2.4
Seismic source area 2.4 extends NE–SW and its western and eastern boundaries are mainly steered
by the reduction in frequency of epicenters around the source area, i.e. in areas 2.2 and 2.11,
respectively (Fig. 8.3.1). The southern end corresponds to the boundary shared with polygon 2.3 and
the northern boundary abuts against area 2.5, which contains two faults active during the
Quaternary (Fig. 8.3.2) and forming a different type of earthquake cluster (Fig. 8.3.1). Most of the
seismicity in area 2.4 occurs in a NE–SW-oriented belt along the western shore of the southern part
194
of the Gulf of Bothnia (Fig. 8.3.1). However, an approximately N-S trending string of earthquake
events in the northernmost part of the polygon seems to form a separate earthquake cluster (Fig.
8.3.1). In spatial model 2, this cluster has been included in source area 2.4 whereas, in model 3, it has
been attributed to a separate area (3.6).
No faults with Quaternary movement have been described in area 2.4. However, this may be due to
the fact that the area is located below the highest shoreline formed after the latest glaciation, so that
erosion may have eliminated morphological proof of a potentially active fault or that it is covered
under thick post-glacial sediments. It is questionable though whether a potential step in the
basement rock could have been eroded under water. The reader is referred to seismic source area
1.4 in spatial model 1 for the area's relationship to ancient geological features.
Source area 2.4 belongs to the general band of seismicity that lines the northeastern coast of Sweden
(Fig. 8.3.1). The area is well-covered by the permanent station network constructed during 2000–
2002, making the locations of the epicenters relatively well-constrained. In area 2.4, some events
form clusters of seismicity but the majority of the earthquakes occur in a more diffuse pattern.
Earthquakes occur from shallow depth down to almost 40 km depth. A number of historical
earthquakes with magnitude around 4 are known for this area, including those of August 1723, 14
November 1751, 10 March 1930 and 10 October 1935. The macroseismic dataset for the earthquake
of 28 July 1888 has been revised (Appendix 2). The area of perceptibility extended westward to
seismic source area 2.2 and to Finland. The ML 3.6 Sundsvall earthquake on 4 June 1974 is the largest
instrumental event observed in source area 2.4.
Seismic source area 2.5
Seismic source area 2.5 is more or less triangular in shape (Fig. 8.3.1). Apart from using the transition
from clustered to diffuse seismicity (Fig. 8.3.1), bathymetric data for the northern part of the Gulf of
Bothnia (Bay of Bothnia) were used to define the SE-facing and NE-facing boundaries. To the
southeast, the polygon edge was drawn parallel to the NE–SW-trending margin of the Bay of Bothnia
coinciding with a reduction in frequency of epicenters towards polygon 2.11 (Fig. 8.3.1). To the
northeast, the polygon edge is delineated by a bathymetric high trending NW–SE and separating the
Bay of Bothnia into two separate segments (Fig. 8.3.1). The bathymetric high coincides with a break
in the seismicity pattern towards a different cluster included in polygon 2.6 (Fig. 8.3.1). To the west,
source area 2.5 shares a boundary with polygon 2.2, defined by the transition from clustered (2.5) to
diffuse (2.2) seismicity (Fig. 8.3.1). The SW-facing boundary of polygon 2.5 follows another
topographic and bathymetric high known as Norra Kvarken, which divides the Gulf of Bothnia into
northern and southern sub-basins (Winterhalter, 1972; Axberg, 1980; Wannäs, 1989) and also seems
to coincide with a break in the seismicity pattern (Fig. 8.3.1).
195
Source area 2.5 is Sweden's currently most seismically active area and seismicity in the area is
clustered mainly around two major faults that were active during the Quaternary (Lagerbäck and
Sundh, 2008); the NE–SW-trending Burträsk fault and the N–S trending Röjnoret fault to the west
and southwest of Skellefteå, respectively (Figs. 8.3.2 and 8.3.3). The reader is referred to seismic
source area 1.10 in spatial model 1 for the area's relationship to ancient geological features and the
historical seismicity there.
The area has been well-monitored by seismic stations since 2001. In 2012, a temporary network of
six additional stations was installed around the Burträsk fault. A large proportion of the events in the
area are aligned along and to the southeast of the Burträsk fault. Seismicity extends to the northeast
past the end of the surface-mapped fault scarp into the Bay of Bothnia. There is less seismicity
associated with the Röjnoret fault, but the area in between the faults contains significant diffuse
seismicity, which continues northward along the coastline. Focal depths are from very shallow down
to 45 km depth. The largest instrumental event in the area is from the early instrumental recording
period. It occurred on 28 September 1962 close to Burträsk and measured ML 4.0. During the
operational period of the SNSN network, the largest observed earthquake is a strike-slip event of ML
3.5 that took place on 15 June 2010 at the northeastern extension of the Burträsk fault (Table 4.3.1,
No.45).
Seismic source area 2.6
Seismic source area 2.6 comprises the northernmost part of the Gulf of Bothnia as well as a slim strip
around the Swedish and Finnish coastline approximately from Piteå in Sweden to Kuivaniemi in
Finland (Fig. 8.3.1). The area includes one E–W- and one N–S-oriented cluster of earthquakes on the
western side of the Bay of Bothnia merging into more diffuse seismicity on its eastern side towards
source area 2.11 (Fig. 8.3.1). This boundary as well as the northeastern boundary was drawn
somewhat arbitrarily but with respect to the decrease in earthquake frequency towards the east and
northeast, respectively (Fig. 8.3.1). The southeastern boundary was also drawn to follow the shallow
basinal part of the Bay of Bothnia along the eastern shore. To the north, the area abuts against
polygon 2.7 containing several different seismic clusters that seem to follow a more NE–SW trend
(Fig. 8.3.1). To the west, the boundary is simply defined by the abrupt change from clustered (2.6) to
diffuse seismicity (2.2) and the southwestern boundary corresponds to the border shared with
polygon 2.5 (Fig. 8.3.1). Events occur from shallow levels down to 45 km depth. The largest
instrumental event in source area 2.6 is from the early instrumental recording period. It occurred on
17 February 1961 in the Bay of Bothnia, about 40 km offshore Oulu and measured ML 3.7.
196
Despite the high earthquake frequency, it has not been possible to correlate the seismicity to a
known fault active during the Quaternary. This may be due to the fact that the area is located below
the highest shoreline, and that erosion may have eliminated morphological proof of a potentially
active fault (see also text above). Lagerbäck and Sundh (2008) suggested a location for a "possible
late- or post-glacial fault" in the northern part of the Bay of Bothnia, which would be situated in
seismic source area 2.6. The reader is referred to seismic source area 1.9 in spatial model 1 for the
area's relationship to ancient geological features.
This seismic source area may have been the host area of the earthquake of 27 November 1757 felt at
the bottom of the Bay of Bothnia and along both the western and eastern coast. Wahlström (1990)
gave its magnitude as MM3.7, but it may have been slightly stronger. This is almost certainly the host
area of the 15 June and 23 June 1882 earthquakes. The latter is among the strongest events, if not
the strongest, in the seismological record. It is also unique for the Gulf of Bothnia region with two
widely felt earthquakes within a time interval of only eight days. The largest intensities (I = 67 EMS-
98) were assigned to Tornio in Finland and Sangis-Kalix area in Sweden (Mäntyniemi and Wahlström,
2013). It is not possible to resolve whether the maximum intensity was 6 or 7, although related
documentation could be uncovered in archives. It is not possible to pinpoint whether the epicenter
was offshore or onshore.
The land and near-shore area of source area 2.6 have been relatively well covered since the SNSN
network installation in 2004 and one additional permanent station was installed in the area in 2010.
FNSN additional station was added in the area in 2010 to enhance the areas event location accuracy.
The offshore events have generally less well-constrained locations than the events within the SNSN
or FNSN networks. The Finnish and Swedish joint-processing analysis has been working since 2010
and coastal areas seismic networks have improved during the years 2010-2013.
Seismic source area 2.7
The northern boundary of seismic source area 2.7 corresponds to the border of the study area with
its 500 km radius around the target site for the nuclear power plant (Fig. 8.3.1). The other polygon
edges were drawn according to the drop in earthquake frequencies and lack of faults active during
the Quaternary towards the west and east of the source area (Fig. 8.3.1). The southernmost border is
shared with polygon 2.6 and corresponds to a break in the seismicity cluster orientation (Fig. 8.3.1).
Seismic source area 2.7 contains several fault systems inferred to have been active during the
Quaternary (Lagerbäck and Sundh, 2008; Kuivamäki et al., 1998) and with earthquake epicenters
clustered around these faults (Fig. 8.3.3). The following verified faults are included in source area 2.7:
Pärvie, Merasjärvi, Lainio-Suijavaara, Lansjärv, Palojärvi-Paatsikkojoki, Kultima,

197
Pasmajärvi/Ruokojärvi-Ruostejärvi-Venejärvi, Isovaara and Suasselkä (Fig. 8.3.2). These fault systems
trend NE–SW, and seismicity is recorded mainly in the hanging-walls of these faults. Exceptions in
Finland are Pasmajärvi-Ruostejärvi-Venejärvi, Isovaara and Suosselkä fault systems that are optimally
oriented but no clear seismicity is found in the hanging-wall side. The area has also possible post-
glacial faults Vaalajärvi, Siyliövaara and Kotijänkä near the eastern edge of the area (see section
3.2.3.). The Siyliövaara, Kotijänkä and Vaalajärvi faults are situated within a NE-SW oriented corridor
of high seismic activity, but the surface traces are oriented in three different directions, SW-NE, N-S
and NW-SE, respectively. The region with known PGFs has been affected by three consecutive
Weichselian ice caps (see section 3.2). The topographical lineaments (glaciofluvial esker formations)
are oriented mostly on SW-NE and NW-SE directions.
Four earthquake clusters are dominant in polygon 2.7 (Fig. 8.3.1). The westernmost cluster trends
NNE–SSW and is very likely produced by the Pärvie fault system (Fig. 8.3.2). This system consists of a
moderately east-dipping main fault to the west and west-dipping faults at various distances from the
main fault further to the east (Lagerbäck and Sundh, 2008). Both fault dip directions show hanging
wall up (reverse) movement and seismicity is restricted to the areas between these faults. Lagerbäck
and Sundh (2008) attribute also an arcuate, east-facing fault scarp around 60 km to the southeast of
the main Pärvie fault line to the Pärvie fault system (Lagerbäck and Sundh, 2008). However, the fault
seems to be seismically inactive at the moment since no earthquake cluster could be associated with
it. The second earthquake cluster also trends NNE–SSW and occurs in the hanging walls of the
Merasjärvi-Lainio-Suijavaara fault system in Sweden and Palojärvi-Paatsikkojoki fault system in
Finland (Fig. 8.3.2); east-side-up (reverse) movement has also been inferred here from field studies
(e.g. Lagerbäck and Sundh, 2008; Sutinen et al., 2014). The reverse NW–SE trending Kultima fault is
also located in the cluster (Sutinen et al., 2014). The seismicity follows the NNE–SSW trend towards
the Stuoragurra fault system situated outside the study area in Norway (Fig. 8.3.2). Further to the
east of this cluster, the third earthquake cluster occurs along the NE–SW oriented Lansjärv-Suasselkä
fault systems starts from Länsjärv fault (Sweden), continues northeastwards as Pasmajärvi-
Ruokojarvi/ Venejärvi/ Ruostejärvi fault system (Finland) through Isovaara fault to Suasselkä fault
system (Kujansuu, 1964; Kuivamäki et al., 1998) (Fig. 8.3.2). The fourth earthquake cluster that is
located further to the east is also trending in NE–SW direction (Fig. 8.3.1). Discrete and unverified
post-glacial faults Vaalajärvi, Kotijänkä and Siyliövaara are located in this cluster (Fig. 8.3.2). In
between the zones of fault-related seismicity, there are quieter areas with sparse and diffuse
seismicity (Fig. 8.3.1). The reader is referred to seismic source areas 1.2, 1.6, 1.7, 1.8, 1.9 and 1.11 in
spatial model 1 for the area's relationship to ancient geological features.
The Swedish section of the area has had seismic station coverage since the installation of the
northernmost SNSN network in 2004 and a temporary network was installed at the Stuoragurra fault

198
in Norway in the late 1990´s: However, none of the data generated from this temporary network
were available for this study. Since 2007 the FNSN seismic network coverage has been good in the
Lapland area. Earthquakes occur in the area from shallow levels down to 40 km depth. The deeper
level earthquakes (> 15 km) are only found in the western section of the 2.7 area. The largest
instrumental earthquake is the ML 3.9 event that occurred on 11 August 1975 about 50 km
northwest of Pajala (Table 4.3.1, No. 11).
It has been proposed that the epicenter of the earthquake of 4 November 1898 (5 November local
time) was located in this area (Mäntyniemi, 2008b). Another interesting earthquake occurred on 17
February 1819 along the river valley (seismic source area 1.8 of model 1). However, the earthquake
of 31 December 1758 was not located inside source area 2.7 (Tatevossian et al., 2013).
Seismic source area 2.8
The seismic source area 2.8 is in NE-SW direction and there is no evidence of Quaternary faulting.
Longest topographical lineaments are in ESE-WNW direction that follows the esker formation and
retreating ice-margin direction. Mostly the area is characterized with hummocky moraine deposits.
The northeastern corner reaches over the Russian border and near the Kola Peninsula area and the
border was drawn to follow the 500 km study area radius. Otherwise the edges were drawn to
separate the low seismicity area 2.8 from the increasing seismicity areas 2.6, 2.7 and 2.9 (Fig. 8.3.1).
The northwestern border separates the area 2.8 area from area 2.7 characterized by PGF active
during the Quaternary (Fig. 8.3.2). The southeastern border is parallel to the NE-SW oriented
seismicity cluster in the Kuusamo area 2.9. The reader is referred to seismic source area 1.12 in
spatial model 1 for the area's relationship to ancient geological features.
The area has low seismicity and the earthquakes are sporadically distributed. Earthquake depths are
from shallow down to about 20 km. The western part of the area is well-monitored since 2007. The
event location accuracy decreases towards the Finnish-Russian border. In the early instrumental era,
a large earthquake has occurred on 20 February 1960 and the magnitude has been estimated to be
at around 4.
Seismic source area 2.9
The seismic source area 2.9 is NE-SW direction and in area has no evidence of Quaternary faulting.
However, the area exhibits the most intense seismicity in Finland (Fig. 8.3.1). The seismic source area
is located on Finnish and Russian territory. The southeastern area includes the Oulunjärvi area and
the northeastern side reaches the Kandalaksha Gulf in White Sea, Russia (Fig. 8.3.1). The polygon
edges were drawn to follow the decreasing seismic activity as the area is surrounded by the lowest
seismicity areas (2.8, 2.10 and 2.11) in Finland. The shape of the polygon imitates the areas SW-NE

199
oriented seismicity pattern. The southwestern border was drawn to detach the decreasing
earthquake frequency seen in area 2.11. There is no clear main lineament direction in the area, but
the esker formations are oriented in E-W pattern to show the retreating ice-margin direction (Fig.
8.2.2). The Early Weichselian (W1) termination end-moraines are found in the western corner of the
seismic source area. The reader is referred to seismic source area 1.15, 1.16 and 1.17 in spatial model
1 for the area's relationship to ancient geological features. The seismic source area forms also
topographically higher area in the Finland side.
Source area 2.9 is the most active seismic area in the eastern part of the study area with a 500 km
radius around Hanhikivi. The earthquakes appear more or less in SW-NE-oriented pattern and, in the
central part of the area, there is a large cluster of earthquakes. The topographically highest area,
Kuusamo highland, coincides with the high seismicity cluster. These events are diffused uniformly in
the seismicity area, but small swarms also appear. The area has clearly the deepest events in Finland.
The source depths vary from shallow levels down to about 30 km, i.e., close to the base of the middle
crust. Since mid 2000s, the Kuusamo area has been well-monitored by a local network comprising 3-7
temporal stations along with 2 permanent stations. Three of the temporal stations are still in
operation. The eastern part of the area has no seismic stations and the good location and depth
accuracy in the Finnish side changes to moderate and poor in the Russian side of the national border.
The largest historical earthquake in Kuusamo had magnitude above ML4 and occurred on 18 August
1926. There are some other interesting historical earthquakes associated with this source area. The
earthquake of 10 April 1902 had a very rare area of perceptibility that extended across the border to
Russia. Its magnitude exceeded ML4. A lesser earthquake occurred on 26 December 1911. The
respective epicenters were located west of Kuusamo. The uncertainty associated with the June 1626
epicenter is large, but the earthquake was felt within this source area (Tatevossian et al., 2011). The
earthquake of 17 December 1758 possibly occurred in this source area, close to the Bay of
Kandalaksha (Tatevossian et al., 2013). The only instrumental earthquake of magnitude greater than
4.0 in northeastern Fennoscandia locates on the eastern fringes of this area. The event took place on
20 May 1967 in the Kandalaksha Gulf and was assigned with magnitudes ranging from 4.8 to 5.2
(Table 4.3.1, No. 1). In Kuusamo, the strongest instrumentally recorded earthquake is the ML 3.5
event on 15 September 2000 (Table 4.3.1, No. 28).
Seismic source area 2.10
The seismic source area 2.10 is triangular shape area starting from Eastern Finland (Karelia) area and
widening to Russian Karelia side (Fig. 8.3.1). The area reaches also the Russian Kandalaksha Gulf and
Onega Bay in White Sea. The area is the seismically quietest area in Finland side and there is no
evidence of post-glacial faults found in the area. However, there are some evidence of microsize (cm)
200
post-glacial faults cutting bedrock and the glacial striations in Ilomantsi area, eastern Finland
(Nenonen and Huhta, 1993; Kuivamäki et al., 1998). The polygon edges were drawn to separate the
seismically active Kuusamo area 2.9 in north and the border was drawn parallel to the SW-NE
oriented cluster of events. The eastern border corresponds to the border of the study area (500 km
radius). The western and southwestern border was drawn to separate the slightly increasing
seismicity in central Finland area. The seismic source area 2.10 was first area in the study region to
be deglaciated after the last glacial maximum (see section 3.2.2). No clear dominant geophysical
lineament direction was found in the area; however, the topographical and glaciofluvial esker
formations are oriented in SE-NW and SSE-NNW direction. The reader is referred to seismic source
area 1.18 in spatial model 1 for the area's relationship to ancient geological features.
The area is seismically very quiet in Finland and also in the Russian part of the study area. There are
no instrumentally recorded events in the southern part of the triangular area. Increase in seismic
activity is seen in the northeastern corner near the Kandalaksha area. Some seismic events seem to
follow the geophysical lineaments in the Russian area. The area has sparse seismic network (1 station
in FNSN network) and the location and depth accuracy changes from moderate to poor towards the
eastern part.
The largest event, the ML 3.7 earthquake on 24 August 1991, is located at the northeastern corner of
the source area, close to the seismically more active source area 2.9. No notable historical
earthquakes are known in this source area. It could be explained by a lack of documentation due to
sparsely distributed population and a border area. However, the area appears quite devoid of
earthquake epicenters in the instrumental era as well.
Seismic source area 2.11
The seismic source area 2.11 is large area in southern and central Finland. The polygon edges were
drawn so that western border is connected with the Sweden side seismically active areas 2.3, 2.4, 2.5
and 2.6 and the border is located on Gulf of Bothnia area (Fig. 8.3.1). The northern part of the border
in Bay of Bothnia is drawn to follow the basins shallow part in Finland side. In Bothnian Sea area the
border is close to Sweden shoreline leaving the deep basin inside the seismic source area 2.11. The
border in northeastern corner was drawn to separate the increasing seismicity trend in area 2.9.
There is no evidence of post-glacial faults in the area (Fig. 8.3.2). Most of the western and southern
area in Finland was located under the highest shoreline during the ancient phases (Baltic Ice Lake,
Yoldia Sea, Anculys Lake, Litorina Sea) of Baltic Sea and the possible formed scarps have been
destroyed by the wave action. However, there are evidence of microsize (cm) post-glacial faults
cutting the bedrock and the glacial striations in southwestern coastal area, for example in Kustavi
Island (Kujansuu, 1964). The area has the longest topographical patterns formed on the advancing
201
ice-margins (drumlins) and retreating ice-margin direction with long glaciofluvial esker formations SE-
NW direction and the standstill ice-marginal (delta, sandur-delta etc.) formations SW-NE direction.
The longest lineaments are in the direction of SE-NW, N-S, and SW-NE. The reader is referred to
seismic source area 1.10, 1.12 and 1.13 in spatial model 1 for the area's relationship to ancient
geological features.
The seismic source area has a low seismic activity and the events are widely distributed. No clear
pattern or epicenter clusters are found in this area. However, the largest instrumental earthquake to
occur in Finland, the ML 3.8 event in Lappajärvi on February 17, 1979 (Table 4.3.1, No. 3) is located
within this source area. The largest non-instrumental earthquake occurred in central Finland on 16
November 1931 (magnitude in the range 4.1 – 4.5). Interesting historical earthquakes occurred on
the eastern coast of the Gulf of Bothnia (the reader is referred to source area 1.13 of model 1). The
earthquakes occur from shallow depths down to about 30 km. In the Finnish mainland, source area
2.11 is well-covered by FNSN and event locations are relatively well constrained. In coastal and sea
areas the event location accuracy has improved since the expansion of SNSN in 2000. A number of
new stations have also been constructed in the Finnish and Estonian coasts in 2000s (Fig. 2.8.2.1).
Seismic source area 2.12
The seismic source area 2.12 is located in the S-SE corner of the study area. The area is surrounded
by the 2.11 area and the study area border in south. The area was separated from the seismic source
area 2.11 due to the different seismicity pattern. Orientations of largest geophysical lineaments are
mostly in SW-NE and NW-SE direction. The reader is referred to seismic source area 1.14 in spatial
model 1 for the area's relationship to ancient geological features.
The area is seismically active and it has many small earthquake swarms (Table 4.3.1, No. 30 & 36).
The swarms have no clear unified pattern, but there can be seen one small SE-NW oriented cluster
and few round centered clusters. The largest swarms are located in the middle of the seismic area
2.12. The swarm events are unusually shallow, most likely occurring within the first 2 km from the
surface. A shallow shock of ML 2.9 on 21 July 1982 is the largest instrumentally recorded event in the
area. No aftershocks have been reported for the event. Earthquake swarms also known from the
historical era, in 175152 and 195152 in particular. The largest historical event of MM 3.1 belongs to
the 1951-52 swarm. The area has been well-monitored since 2003. The eastern part has lower
location accuracy due to lack of seismic stations in the Russian part of the study area.
Seismic source area 3.1
Source area 3.1 corresponds to source area 2.1 in spatial model 2.
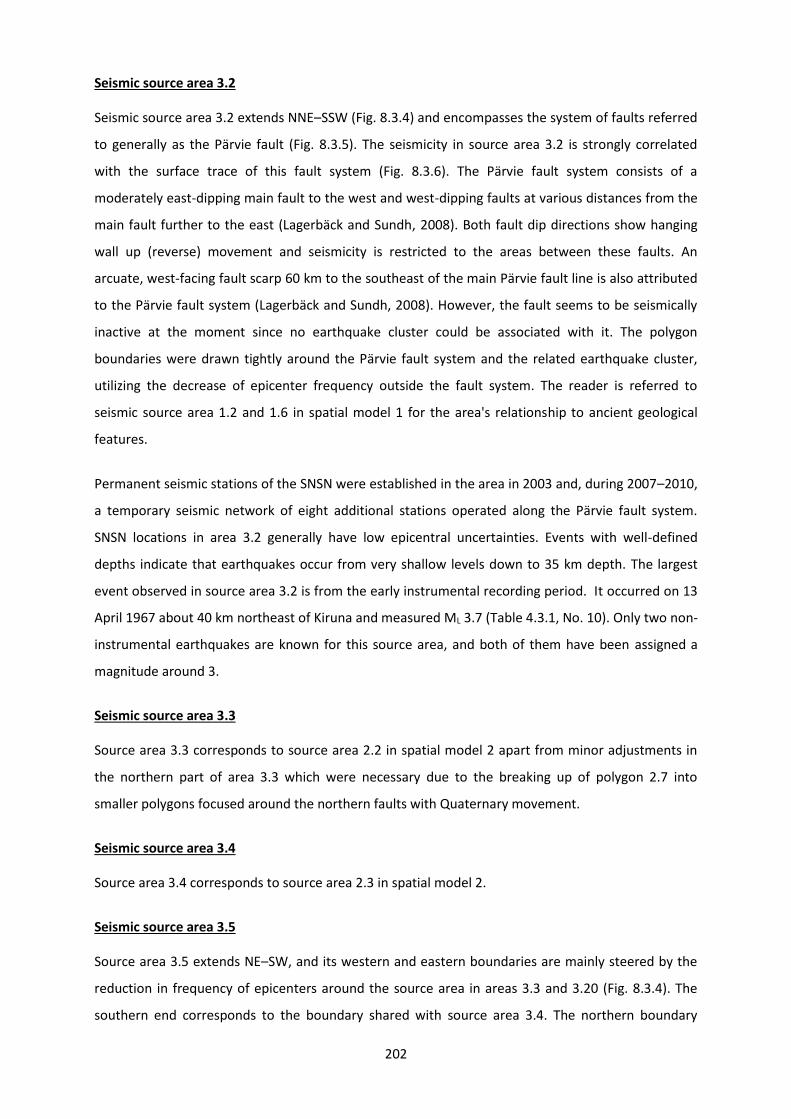
202
Seismic source area 3.2
Seismic source area 3.2 extends NNE–SSW (Fig. 8.3.4) and encompasses the system of faults referred
to generally as the Pärvie fault (Fig. 8.3.5). The seismicity in source area 3.2 is strongly correlated
with the surface trace of this fault system (Fig. 8.3.6). The Pärvie fault system consists of a
moderately east-dipping main fault to the west and west-dipping faults at various distances from the
main fault further to the east (Lagerbäck and Sundh, 2008). Both fault dip directions show hanging
wall up (reverse) movement and seismicity is restricted to the areas between these faults. An
arcuate, west-facing fault scarp 60 km to the southeast of the main Pärvie fault line is also attributed
to the Pärvie fault system (Lagerbäck and Sundh, 2008). However, the fault seems to be seismically
inactive at the moment since no earthquake cluster could be associated with it. The polygon
boundaries were drawn tightly around the Pärvie fault system and the related earthquake cluster,
utilizing the decrease of epicenter frequency outside the fault system. The reader is referred to
seismic source area 1.2 and 1.6 in spatial model 1 for the area's relationship to ancient geological
features.
Permanent seismic stations of the SNSN were established in the area in 2003 and, during 2007–2010,
a temporary seismic network of eight additional stations operated along the Pärvie fault system.
SNSN locations in area 3.2 generally have low epicentral uncertainties. Events with well-defined
depths indicate that earthquakes occur from very shallow levels down to 35 km depth. The largest
event observed in source area 3.2 is from the early instrumental recording period. It occurred on 13
April 1967 about 40 km northeast of Kiruna and measured ML 3.7 (Table 4.3.1, No. 10). Only two non-
instrumental earthquakes are known for this source area, and both of them have been assigned a
magnitude around 3.
Seismic source area 3.3
Source area 3.3 corresponds to source area 2.2 in spatial model 2 apart from minor adjustments in
the northern part of area 3.3 which were necessary due to the breaking up of polygon 2.7 into
smaller polygons focused around the northern faults with Quaternary movement.
Seismic source area 3.4
Source area 3.4 corresponds to source area 2.3 in spatial model 2.
Seismic source area 3.5
Source area 3.5 extends NE–SW, and its western and eastern boundaries are mainly steered by the
reduction in frequency of epicenters around the source area in areas 3.3 and 3.20 (Fig. 8.3.4). The
southern end corresponds to the boundary shared with source area 3.4. The northern boundary

203
abuts against area 3.6 which contains two faults active during the Quaternary (Fig. 8.3.5) and forming
a different type of earthquake cluster. Source area 3.5 corresponds almost to source area 2.4 in
spatial model 2. However, the approximately N-S trending string of earthquake events in the
northernmost part of area 2.4 has been excluded from source area 3.5 and attributed to 3.6. No
faults with Quaternary movement have been described in area 3.5. However, this may be due to the
fact that the area is located below the highest shoreline, so that erosion may have eliminated
morphological proof of a potentially active fault (see also earlier text).
Seismic source area 3.5 belongs to the general NE–SW-oriented band of seismicity that lines the
western coast of the Gulf of Bothnia in Sweden (Fig. 8.3.4). The area is well-covered by the
permanent station network constructed during 2000–2002, making the epicentral locations relatively
well–constrained. In area 3.5, some events form clusters of seismicity but the majority of the
earthquakes occurs in a more diffuse pattern. Earthquakes occur from shallow depth to almost 40
km depth. A number of historical earthquakes with magnitude around 4 are known for this area,
including those of August 1723, 14 November 1751, 10 March 1930 and 10 October 1935. The
macroseismic dataset for the earthquake of 28 July 1888 has been revised (Appendix 2). The area of
perceptibility extended westward to seismic source area 3.3 and eastward to Finland. The ML 3.6
Sundsvall earthquake on 4 June 1974 is the largest instrumental event observed in source area 3.5.
Seismic source area 3.6
Source area 3.6 extends in a more or less N–S direction (Fig. 8.3.4). Apart from using the transition
from clustered to diffuse seismicity (Fig. 8.3.4), bathymetric data for the northern part of the Gulf of
Bothnia (Bay of Bothnia) was used to define the eastern and southern boundaries. The eastern
boundary follows the margin of the basin defined by the Bay of Bothnia, coinciding with a reduction
in frequency of epicenters towards source area 3.7 (Fig. 8.3.4). The southern boundary follows a
bathymetric and topographic high at Norra Kvarken, which divides the Gulf of Bothnia into northern
and southern sub-basins (Winterhalter, 1972; Axberg, 1980; Wannäs, 1989) and which also seems to
coincide with a break in the seismicity pattern (Fig. 8.3.4). To the northeast, the polygon edge is
delineated by the on-shore continuation of a bathymetric high trending NW–SE separating the Bay of
Bothnia into two separate segments; the bathymetric high also coincides with a break in the
seismicity pattern towards a different cluster included in source area 3.8 (Fig. 8.3.4). To the west,
source area 3.6 shares a boundary with area 3.3, defined by the transition from clustered (3.6) to
diffuse (3.3) seismicity (Fig. 8.3.4). Additionally, area 3.6 incorporates the N–S extending string of
seismic events in its southern part that was previously attributed to source area 2.4 in spatial model
2 (Figs. 8.3.1 and 8.3.4).
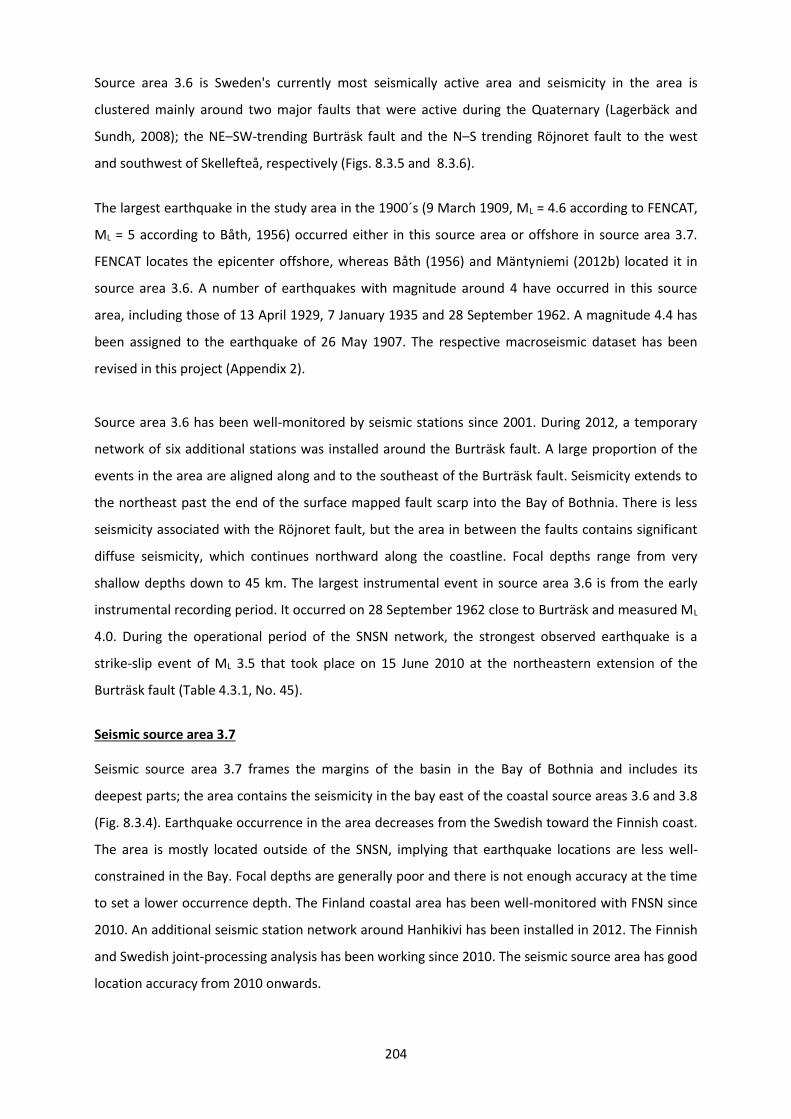
204
Source area 3.6 is Sweden's currently most seismically active area and seismicity in the area is
clustered mainly around two major faults that were active during the Quaternary (Lagerbäck and
Sundh, 2008); the NE–SW-trending Burträsk fault and the N–S trending Röjnoret fault to the west
and southwest of Skellefteå, respectively (Figs. 8.3.5 and 8.3.6).
The largest earthquake in the study area in the 1900´s (9 March 1909, ML = 4.6 according to FENCAT,
ML = 5 according to Båth, 1956) occurred either in this source area or offshore in source area 3.7.
FENCAT locates the epicenter offshore, whereas Båth (1956) and Mäntyniemi (2012b) located it in
source area 3.6. A number of earthquakes with magnitude around 4 have occurred in this source
area, including those of 13 April 1929, 7 January 1935 and 28 September 1962. A magnitude 4.4 has
been assigned to the earthquake of 26 May 1907. The respective macroseismic dataset has been
revised in this project (Appendix 2).
Source area 3.6 has been well-monitored by seismic stations since 2001. During 2012, a temporary
network of six additional stations was installed around the Burträsk fault. A large proportion of the
events in the area are aligned along and to the southeast of the Burträsk fault. Seismicity extends to
the northeast past the end of the surface mapped fault scarp into the Bay of Bothnia. There is less
seismicity associated with the Röjnoret fault, but the area in between the faults contains significant
diffuse seismicity, which continues northward along the coastline. Focal depths range from very
shallow depths down to 45 km. The largest instrumental event in source area 3.6 is from the early
instrumental recording period. It occurred on 28 September 1962 close to Burträsk and measured ML
4.0. During the operational period of the SNSN network, the strongest observed earthquake is a
strike-slip event of ML 3.5 that took place on 15 June 2010 at the northeastern extension of the
Burträsk fault (Table 4.3.1, No. 45).
Seismic source area 3.7
Seismic source area 3.7 frames the margins of the basin in the Bay of Bothnia and includes its
deepest parts; the area contains the seismicity in the bay east of the coastal source areas 3.6 and 3.8
(Fig. 8.3.4). Earthquake occurrence in the area decreases from the Swedish toward the Finnish coast.
The area is mostly located outside of the SNSN, implying that earthquake locations are less well-
constrained in the Bay. Focal depths are generally poor and there is not enough accuracy at the time
to set a lower occurrence depth. The Finland coastal area has been well-monitored with FNSN since
2010. An additional seismic station network around Hanhikivi has been installed in 2012. The Finnish
and Swedish joint-processing analysis has been working since 2010. The seismic source area has good
location accuracy from 2010 onwards.
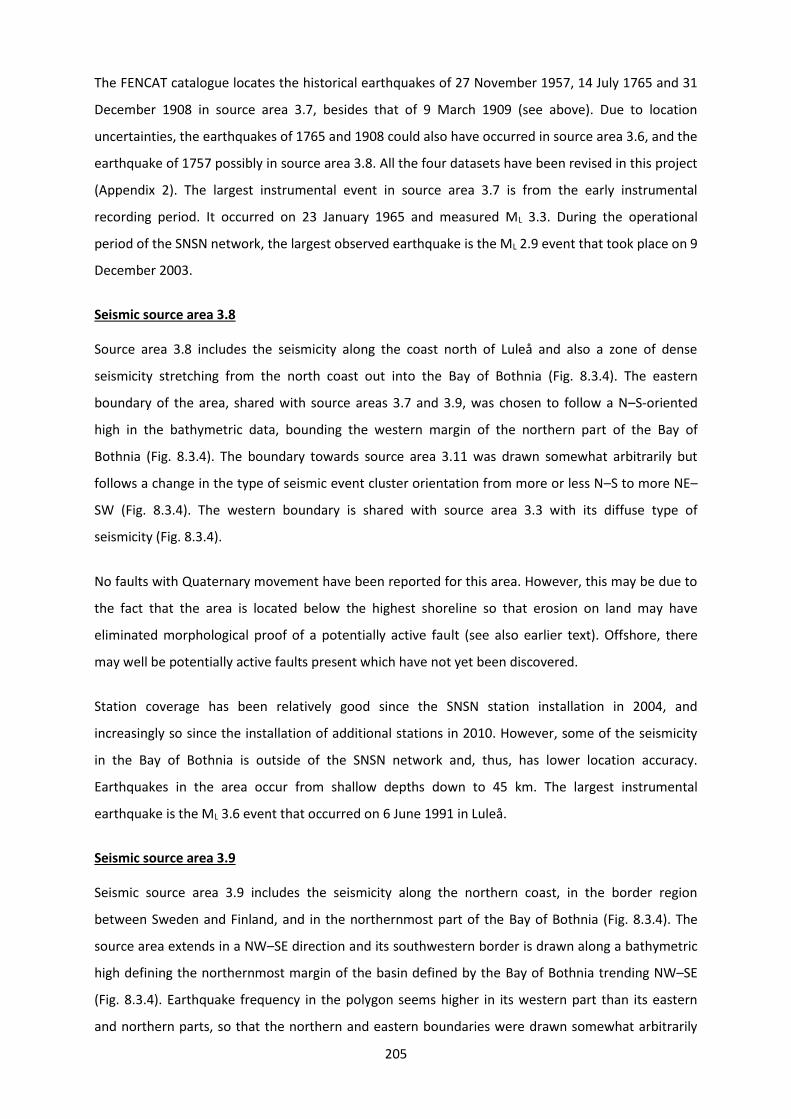
205
The FENCAT catalogue locates the historical earthquakes of 27 November 1957, 14 July 1765 and 31
December 1908 in source area 3.7, besides that of 9 March 1909 (see above). Due to location
uncertainties, the earthquakes of 1765 and 1908 could also have occurred in source area 3.6, and the
earthquake of 1757 possibly in source area 3.8. All the four datasets have been revised in this project
(Appendix 2). The largest instrumental event in source area 3.7 is from the early instrumental
recording period. It occurred on 23 January 1965 and measured ML 3.3. During the operational
period of the SNSN network, the largest observed earthquake is the ML 2.9 event that took place on 9
December 2003.
Seismic source area 3.8
Source area 3.8 includes the seismicity along the coast north of Luleå and also a zone of dense
seismicity stretching from the north coast out into the Bay of Bothnia (Fig. 8.3.4). The eastern
boundary of the area, shared with source areas 3.7 and 3.9, was chosen to follow a N–S-oriented
high in the bathymetric data, bounding the western margin of the northern part of the Bay of
Bothnia (Fig. 8.3.4). The boundary towards source area 3.11 was drawn somewhat arbitrarily but
follows a change in the type of seismic event cluster orientation from more or less N–S to more NE–
SW (Fig. 8.3.4). The western boundary is shared with source area 3.3 with its diffuse type of
seismicity (Fig. 8.3.4).
No faults with Quaternary movement have been reported for this area. However, this may be due to
the fact that the area is located below the highest shoreline so that erosion on land may have
eliminated morphological proof of a potentially active fault (see also earlier text). Offshore, there
may well be potentially active faults present which have not yet been discovered.
Station coverage has been relatively good since the SNSN station installation in 2004, and
increasingly so since the installation of additional stations in 2010. However, some of the seismicity
in the Bay of Bothnia is outside of the SNSN network and, thus, has lower location accuracy.
Earthquakes in the area occur from shallow depths down to 45 km. The largest instrumental
earthquake is the ML 3.6 event that occurred on 6 June 1991 in Luleå.
Seismic source area 3.9
Seismic source area 3.9 includes the seismicity along the northern coast, in the border region
between Sweden and Finland, and in the northernmost part of the Bay of Bothnia (Fig. 8.3.4). The
source area extends in a NW–SE direction and its southwestern border is drawn along a bathymetric
high defining the northernmost margin of the basin defined by the Bay of Bothnia trending NW–SE
(Fig. 8.3.4). Earthquake frequency in the polygon seems higher in its western part than its eastern
and northern parts, so that the northern and eastern boundaries were drawn somewhat arbitrarily

206
against areas of very low seismicity (Fig. 8.3.4). Both detection capabilities of the SNSN and location
accuracy for epicenters diminish east of the network. FNSN Tornio station was added in 2010 to
enhance the areas event location accuracy. Seismic events in FENCAT located using stations in both
Finland and Sweden have smaller uncertainties. Earthquakes occur down to 35 km depth.
This is probably the host area of the 23 June 1882 earthquake, which is among the strongest events,
if not the strongest, in the seismicity record of the study area. It is not possible to pinpoint whether
the epicenter was offshore or onshore. It has been preceded by a lesser earthquake on 15 June 1882.
It is not attested to by a large dataset, and the epicenter could also be located in the neighboring
source areas. The macroseismic datasets of the two earthquakes have been revised by Mäntyniemi
and Wahlström (2013). The largest instrumental earthquake in this source area has occurred in Kalix
on 22 July 2009 with magnitude ML 3.1 to 3.4 (Table 4.3.1, No. 44).
Seismic source area 3.10
Seismic source area 3.10 extends NE–SW and is an area of sparse and diffusely distributed seismicity,
away from the more active north coast and not associated with a fault active during the Quaternary
(Figs. 8.3.4 and 8.3.5). This area emerged as a “rest area” after dividing up source area 2.7 in spatial
model 2 into smaller areas that are more focused around the faults active during the Quaternary,
such as the Lansjärv fault in source area 3.11 to the northwest of area 3.10. Earthquakes in the area
occur in shallow depths (> 12 km). The largest instrumental earthquake in source area 3.10 is the ML
2.7 event that took place on 12 October 1996 in Ylitornio. The SNSN has very limited accuracy in this
area. The FNSN has new seismic station installed in Tornio (area 3.9) in 2010 that enhance the area´s
accuracy from moderate to good. The reader is referred to seismic source area 1.11 in spatial model
1 for the area's relationship to ancient geological features. An interesting historical earthquake
(among the largest in the study area) is that of 4 November 1898. Mäntyniemi (2008b) proposed a
new epicenter that would be in this source area.
Seismic source area 3.11
Source area 3.11 extends NE-SW and frames the area from Lansjärv post-glacial fault in Sweden to
the the Suasselkä fault system in Finland (Fig. 8.3.5). All polygon boundaries correspond to areas
where seismicity clearly decreases away from the faults; the western and eastern polygon edges
were drawn such that they are parallel to the surface traces of the Lansjärv, Pasmajärvi-Ruostejärvi-
Venejärvi, Isovaara and Suasselkä fault area (Fig. 8.3.6). The reader is referred to seismic source area
1.8 in spatial model 1 for the area's relationship to ancient geological features.
In Sweden, the seismic activity has been well-monitored since the installation of the northernmost
SNSN in 2004. Seismic network FNSN in Finland is well covered in this area giving a good accuracy on
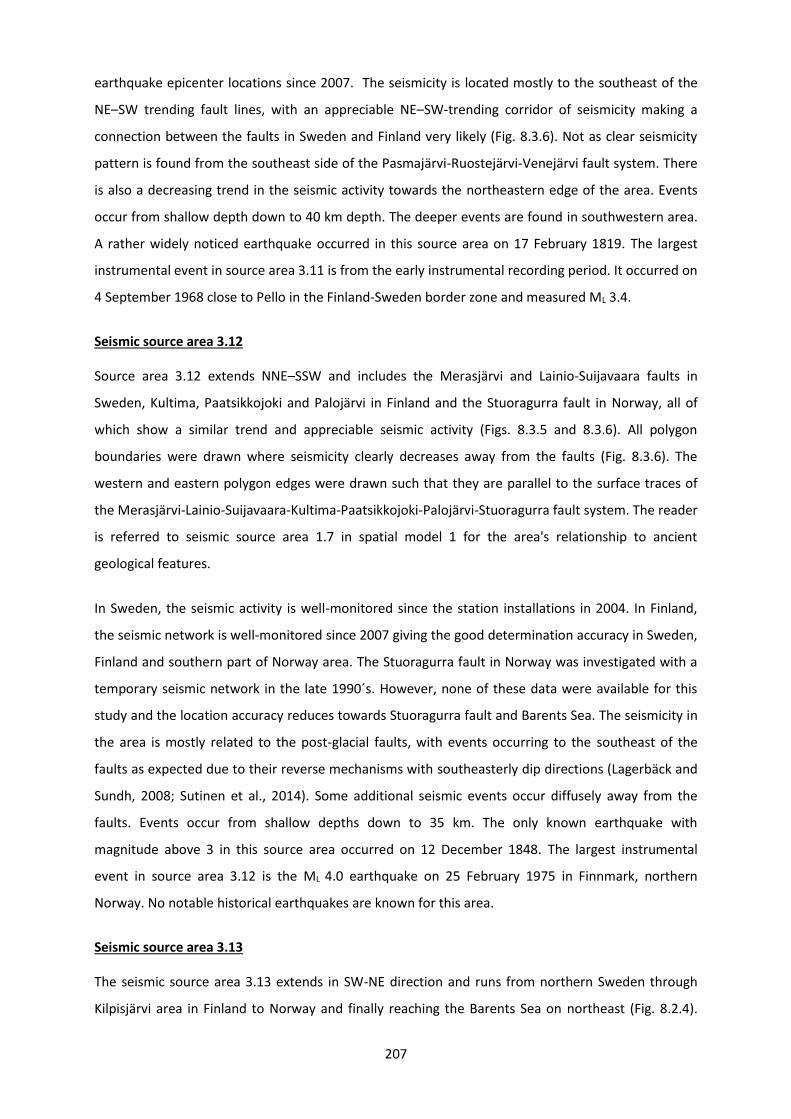
207
earthquake epicenter locations since 2007. The seismicity is located mostly to the southeast of the
NE–SW trending fault lines, with an appreciable NE–SW-trending corridor of seismicity making a
connection between the faults in Sweden and Finland very likely (Fig. 8.3.6). Not as clear seismicity
pattern is found from the southeast side of the Pasmajärvi-Ruostejärvi-Venejärvi fault system. There
is also a decreasing trend in the seismic activity towards the northeastern edge of the area. Events
occur from shallow depth down to 40 km depth. The deeper events are found in southwestern area.
A rather widely noticed earthquake occurred in this source area on 17 February 1819. The largest
instrumental event in source area 3.11 is from the early instrumental recording period. It occurred on
4 September 1968 close to Pello in the Finland-Sweden border zone and measured ML 3.4.
Seismic source area 3.12
Source area 3.12 extends NNE–SSW and includes the Merasjärvi and Lainio-Suijavaara faults in
Sweden, Kultima, Paatsikkojoki and Palojärvi in Finland and the Stuoragurra fault in Norway, all of
which show a similar trend and appreciable seismic activity (Figs. 8.3.5 and 8.3.6). All polygon
boundaries were drawn where seismicity clearly decreases away from the faults (Fig. 8.3.6). The
western and eastern polygon edges were drawn such that they are parallel to the surface traces of
the Merasjärvi-Lainio-Suijavaara-Kultima-Paatsikkojoki-Palojärvi-Stuoragurra fault system. The reader
is referred to seismic source area 1.7 in spatial model 1 for the area's relationship to ancient
geological features.
In Sweden, the seismic activity is well-monitored since the station installations in 2004. In Finland,
the seismic network is well-monitored since 2007 giving the good determination accuracy in Sweden,
Finland and southern part of Norway area. The Stuoragurra fault in Norway was investigated with a
temporary seismic network in the late 1990´s. However, none of these data were available for this
study and the location accuracy reduces towards Stuoragurra fault and Barents Sea. The seismicity in
the area is mostly related to the post-glacial faults, with events occurring to the southeast of the
faults as expected due to their reverse mechanisms with southeasterly dip directions (Lagerbäck and
Sundh, 2008; Sutinen et al., 2014). Some additional seismic events occur diffusely away from the
faults. Events occur from shallow depths down to 35 km. The only known earthquake with
magnitude above 3 in this source area occurred on 12 December 1848. The largest instrumental
event in source area 3.12 is the ML 4.0 earthquake on 25 February 1975 in Finnmark, northern
Norway. No notable historical earthquakes are known for this area.
Seismic source area 3.13
The seismic source area 3.13 extends in SW-NE direction and runs from northern Sweden through
Kilpisjärvi area in Finland to Norway and finally reaching the Barents Sea on northeast (Fig. 8.2.4).
208
The eastern and southern boundaries correspond to the areas were seismicity increases and the
eastern border is parallel to the Merasjärv-Stuoragurra fault system in area 3.12. The southern
border separates the seismically active Pärvie post-glacial fault system in area 3.2. The western
border was drawn to include the Quaternary active fault Nordmannvik in the seismic source area
(Tolgensbakk and Sollid, 1988). The area has very low seismicity and no clear seismicity pattern can
be connected to the NW-SE-trending Nordmannvik post-glacial fault (Fig. 8.3.6). The only historical
earthquake known in this source area occurred on 3 April 1930 and has been assigned a magnitude
of 4.4. The largest instrumental event, the ML 3.0 earthquake on 26 November 1992, locates about
60 km east of the Nordmannvik fault. The events in source area 3.13 are occurring from shallow
depths down to 30 km. The Kilpisjärvi area has contained permanent seismic network station since
2003 providing relatively good coverage for the southern part of the seismic source area. The reader
is referred to seismic source area 1.6 in spatial model 1 for the area's relationship to ancient
geological features in the southern part of the area.
Seismic source area 3.14
The seismic source area 3.14 is part of the 2.7 post-glacial fault area in spatial model 2. The area has
no evidence of Quaternary faults and it has low seismic activity (Fig. 8.3.6). Southern and western
boundaries outline the SW-NE oriented seismicity patters and the fault systems active during the
Quaternary. The northwestern edge was defined to exclude the weakening seismicity and decreasing
elevation towards the Barents Sea. The Sevetti fault (seen in Figure 8.3.5) is located just outside of
the northeastern edge. This fault has been classified as a possible post-glacial fault as its structure
has not been verified yet and was therefore excluded from the area. Also no seismicity pattern can
be connected to this fault. There have been reported many early post-glacial landslides in the Utsjoki
area referring to high-magnitude seismic events (Sutinen et al., 2009). However, the vicinity of
Stuoragurra fault in west (area 3.12) could have affected the Utsjoki area (see section 3.2.3). In the
topographical lineaments the directions SW-NE and NW-SE are quite even. The last ice retreating
direction and most of the glaciofluvial eskers in the area are oriented in SW-NE direction. The reader
is referred to seismic source area 1.12 in spatial model 1 for the area's relationship to ancient
geological features in southern part of the area.
The area has sparse seismicity and the events occur in shallow depths (above ~11 km). The
earthquake of 31 December 1758 and magnitude above 4 may have occurred in the source area
(Tatevossian et al., 2013). The largest instrumental event in the area is the ML 3.5 earthquake on 7
November 1977 in Inari. The area is in the outer border of FNSN seismic network and the
uncertainties in event location increase towards the Barents Sea.

209
Seismic source area 3.15
Seismic source area 3.15 is one part of spatial model 2 area 2.7. All polygon boundaries were drawn
where the seismicity was decreasing around the SW-NE oriented seismicity cluster. The Kotijänkä,
Vaalajärvi (Huotarinkuusikko) and Siyliövaara faults are located in the area. All of these faults are
classified as possible post-glacial faults (see section 3.2.3) (Kuivamäki, 1998; Olesen et al., 2004;
Sutinen et al., 2007). The Siyliövaara fault is situated 20 km S from artificial Lake Loka in NE part of
the area and it is trending to SW-NE. There are several topographical lineaments nearby that have
the same orientation as this fault. The fault follows the magnetic anomaly and it is also near gravity
minimum. Kotijänkä (also known as Porttipahta) fault is situated in SW corner of artificial Lake
Porttipahta and it is not associated with clear topographical or geophysical lineaments. The Kotijänkä
fault is trending nearly to N-S direction. There are some topographical lineaments near the fault that
have the same N-S direction. Vaalajärvi fault is located 15 km SW from Sodankylä town and it is
trending to SE-NW direction. The fault itself is not associated with clear topographical or geophysical
features; however, most of the topographical faults seen in area 3.15 have the same SE-NW trend.
Longest topographical lineaments in the polygon are in the direction of NW-SE and SW-NE. The
reader is referred to seismic source area 1.11 and 1.12 in spatial model 1 for the area's relationship
to ancient geological features.
The seismic source area 3.15 is seismically active and the seismicity is focused on the southeastern
side of the area. Even though the area is seismically active the seismicity has no clear pattern related
to Kotijänkä or Siyliövaara faults. However, seismic activity is seen in the NE side of Vaalajärvi fault
(Fig. 8.3.6). Vaalajärvi fault is classified as normal fault with W-SW side as hanging wall (Kuivamäki,
1998). The earthquakes occur from shallow down to 21 km depth. The largest instrumental event in
source area 3.15 is from the early instrumental recording period. It occurred on 20 March 1965 in
Sodankylä and measured ML 3.5. No large historical earthquakes are known is this source area. The
FNSN seismic station network coverage has been good in the area since 2007.
Seismic source area 3.16
Source area 3.16 corresponds to source area 2.8 in spatial model 2.
Seismic source area 3.17
The seismic source area 3.17 is part of seismic source area 2.9 in spatial model 2. The area 2.9 was
divided to separate the large earthquake cluster located in the central part of the area near Russian
border to its own area 3.18 (Fig. 8.3.4). The seismic source area 3.17 has no evidence of Quaternary
faulting. The seismic source area is located on the territory of Finland and Russia. The polygon edges
were drawn following the seismic activity and the area is surrounded by the lowest seismicity areas

210
(3.16, 3.19 and 3.20) in Finland and Russia. The reader is referred to seismic source area 1.15 and
1.17 in spatial model 1 for the area's relationship to ancient geological features and historical
earthquakes there.
The source area 3.17 is a seismically active area. The events are concetrated in the northwestern and
central parts of the source area with decreasing seismicity towards the southeastern border. In the
northeastern Russian side of the area WSW-ENE and S-N oriented earthquake clusters can be seen
(Fig. 8.3.4). The southwestern side of the area is well-monitored but in the northeastern part the
estimates of source parameters are more uncertain due to the lack of Russian seismic stations. The
events vary from shallow levels down to about 30 km depth. The only instrumental earthquake of
magnitude greater than 4.0 in northeastern Fennoscandia locates on the eastern fringes of this area.
The event took place on 20 May 1967 in the Kandalaksha Gulf and was assigned with magnitudes
ranging from 4.8 to 5.2 (Table 4.3.1, No. 1).
Seismic source area 3.18
The seismic source area 3.18 is part of seismic source area 2.9 in spatial model 2. The polygon edges
were drawn to separate Finland’s seismically most active area from seismic source area 3.17 (Fig.
8.3.4). Seismic source area 3.18 is located on Kuusamo highland area with elevation varying from
350-500 m a.s.l. being 200 meters higher than the surrounding western and northern areas. The
highland (400 m) area continues to northeast to seismic source area 3.17. The reader is referred to
seismic source area 1.15 and 1.16 in spatial model 1 for the area's relationship to ancient geological
features and the historical seismicity.
Source area 3.18 is the most active seismic area in Finland. The earthquakes are more or less equally
spread in the area and the events occur from shallow depths down to about 30 km. Since mid 2000s,
the area has been well-monitored by a local network comprising 4-7 temporal stations along with 2
permanent stations. Three of the temporal stations are still in operation. The strongest
instrumentally recorded earthquake in Kuusamo is the ML 3.5 event on 15 September 2000 in
Kuusamo (Table 4.3.1, No. 28).
Seismic source area 3.19
Source area 3.19 corresponds to source area 2.10 in spatial model 2.
Seismic source area 3.20
Source area 3.20 corresponds to source area 2.11 in spatial model 2.

211
Seismic source area 3.21
Source area 3.21 corresponds to source area 2.12 in spatial model 2.
212
9 Discussion
A. Korja
The Hanhikivi site at Pyhäjoki, Ostrobothnia, Finland is situated in a low seismicity intraplate area
where recent seismic hazard evaluation by international and national scientific groups have found
that the hazard is indeed low (Figs. 7.2.4 and 7.2.6; Wahlström and Grünthal, 2001; Giardini et al.,
2013; Mäntyniemi, 2008a; Saari et al., 2009; Korja et al., 2011a). Nevertheless, the hazard for a
potential nuclear power plant site has also to be assessed locally (IAEA, 2010). Hazard estimations
are inherently difficult in areas of low seismicity since the earthquake data sets are small and thus
their statistical analyses may pose problems. This problem can be tackled by increasing the number
of observations. The amount of earthquake observations can be increased by adding historical events
and by installing seismic stations that capture small but numerous events. Hazard calculations are
based on knowledge on the distribution of seismicity, regional geology and seismotectonics and on
scientific theories on the driving mechanisms of seismicity. In this report we have gathered
background information and data for hazard calculations for the Hanhikivi site. We have collected
and organized the data into an ArcGIS-based database, from which the data can be retrieved in
future studies. This will ensure that data and results are accessible for future projects and
inspections.
The project has had six tasks: 1) to review and summarize the existing and ongoing geoscientific
studies around the Hanhikivi site (Appendix 1), 2) to compile and describe a regional-scale geological
and geophysical upgradable database for the present and future studies of the site (Appendix 3), 3)
to present an overview of the paleotectonic evolution, Quaternary glacial history and current
tectonic framework inside the study area (Chapters 3, 5, 6), 4) to describe seismicity and earthquake
source parameters of the study area (Chapter 4), 5) to review and evaluate the current conceptual
seismotectonic models and seismic source region models for Fennoscandia (Chapter 7) , 6) to identify
and describe seismic source regions and to outline alternative source area models for seismic hazard
calculations for the Hanhikivi site area (Chapter 8).
In following, we will discuss the completeness of the compiled database, distribution of seismicity,
the lithotectonic units and the orientation of shear zones post glacial faults in respect to the current
stress field. We will also discuss the new seismic source area Models 1-3 and compare the models to
the conceptual seismotectonic models of Fennoscandia and with previously published seismic source
area models from the study area.
213
9.1 The database and the completeness of the compiled data sets
Along the guidelines of IAEA (2010) we have established an upgradable database on the geological,
geophysical and seismological data used in this report and to be used in seismic hazard assessments.
The data collected during the project have been stored in an ArcGIS database with metadata
described in Appendix 3 and the datasets in Chapter 2.
The study area is a 500 km radius circle around the Hanhikivi site. It is larger in size than in the
previous geological and geophysical studies (< 300 km; Appendix 1) and the same size as in the last
hazard evaluation study by Saari et al. (2009). Hence the geological and geophysical data sets are
more extensive as they cover a wider area. The previous studies have relied mainly on the data from
Finland that covers only little over half of the study area. The data sets from the Swedish part have
consisted on publicly available data sets that have been less detailed and more extrapolated. The
current data set is thus more extensive and its precision is more uniform across the study area.
Because the current dataset covers the entire study area the results should be less biased towards
Finland than in the previous studies where Swedish data has had less impact. It is also noted that the
all the datasets are now for the first time in one single database and thus it is easier to correctly
compare different subsets.
Based on observation data sets at the geological surveys of Finland and Sweden and on a literature
review we have compiled and added a PGF data set to the database. The PGFs have uniform co-
ordinate information on the identified and verified PGFs from Finland and Sweden for the first time.
The data can now more easily be compared with other digital datasets as was done also in this study.
Some of the faults are marked on their exact locations as they have been checked against 10-m DEM
data (see Figure 2.7.3) and some have been drilled or examined by on-site excavation on Quaternary
deposits. The uncertainty in the position of the inferred PGFs in Sweden is approximately 1 km or
less. Close to possible deep drilling sites (ICDP- the International Continental Drilling Programme;
Kukkonen et al., 2010, 2011a) the location precision is much higher. The database contains also
“possible post-glacial faults” that are still under investigation by SGU and GTK and these sites and
data should be verified later. It has to be borne in mind that not all PGFs have yet been found in the
Fennoscandia area. The most challenging areas are the offshore areas that are less data-intensive
and the large lowland areas that were under the influence of the ancient Baltic Sea phases after
deglaciation (13 000-2000 years ago). In these areas the sedimentation processes may have covered
and obliterated the potential PGF features. However, new approaches e.g. LiDAR, microseismicity
studies, marine seismics and satellite images might prove useful in search for new PGFs.

214
Structural datasets in the database are largely based on geological interpretations of aeromagnetic
datasets in different scales. The rule of thumb is that the precision of the hand drawn structural lines
cannot exceed that of line width of 1 mm (in 1:1M maps 1mm equals 1km). In the previous studies
(Korja et al., 2011), 1:1M or larger scale maps were used in the Finnish territory and 1:5M scale maps
(Koistinen et al., 2001) in the Swedish territory. Thus by using 1:1M scale data also in Sweden, the
lateral location uncertainty of deformation zones in the western part of the study area has decreased
from 5 km to 1 km. Recall that although some of the deformation zones are up to 8 km wide in
nature they have been approximated with only one line in the database. In addition, the lineaments
crossing the national border were adjusted to fit data from both sides (Fig. 2.5.3). Although the
changes to individual lineaments were small, the large scale picture is clearer. For instance, the
regional continuation of the NW-SE trending Western Lapland fault system from Finland to Sweden is
more evident than in the previous compilations. It can also be inferred that the Western Lapland
fault system transects the much older N-S trending Pajala shear zone. Both structural entities are
associated with increased seismicity. Understanding of the regional coverage of the Western Lapland
fault system is especially important as it is orthogonal to NE-SW trending PGF faults or rather to the
reverse faults facilitating PGF.
Information on bedrock, structural trends and lineaments of the offshore study area i.e. Gulf of
Bothnia, is mostly based on geophysical datasets and to lesser degree on geological sampling. The
resolution of the offshore data is poorer than in land areas and thus the positioning of the structural
trends is less precise. Fracture zones have also been mapped with marine acoustic methods. The
regional scale acoustic profiles (Fig. 2.6.1-2.6.3) were collected already in the 1970’s and 1980’s by
Winterhalter (1972), Axberg (1980) and Wannäs (1989). These datasets have severe limitations, the
most important being the very low positioning accuracy of the seismic profiles. The second limitation
is that the original datasets are analogue recordings on paper and the third is the low energy
contents of the air-guns. The new shallow marine seismic dataset (Appendix 1; Rantataro et al., 2011;
Alanen et al., 2013) have been compared with morphological and magnetic lineaments and Wannäs
lineaments (Fig. A1.4-A1.5). In some of the checked locations, there were hints of fractures co-
locating with aeromagnetic and morphological lineaments within couple of hundred meters. In other
locations, there were no indications of fractures. The nearest possible Wannäs lineament (lineament
122) is situated at about 14 km southwest from Hanhikivi. The existing shallow marine seismic
profiling data does not reach into that area. It seems that the major lineaments outlined by Wannäs
(1989) are matched by parallel lineaments in contemporary topographic, bathymetric and
aeromagnetic maps (Kuivamäki et al., 2011; Airo et al., 2011a) and acoustic datasets (Rantataro et
al., 2011; Alanen et al., 2013). The contemporary lineaments are, however, off-set by several
hundreds of meters to kilometers from the suggested position by Wannäs. Even if the analogue
215
recordings could be digitized (this may take years) it is not clear if any new relevant information
would be gained. We suggest that the old data sets should only be used in a regional scale (1: 1M).
For more detailed information new data with GPS positioning should be acquired.
The current seismicity database has been improved by deleting misinterpreted mining explosions
from the Swedish data in FENCAT, by adding subsets of microearthquakes recorded by denser
seismic networks of SNSN in 2000-2012 and OBF in 2013, and by re-appraising the location and
magnitudes of a few historical earthquakes. The addition of new datasets has not changed the
general spatial distribution of seismicity (Figs. 2.8.1.2 and 2.8.1.3). With increased station density the
location precision is better and the clusters and trends of seismicity have become sharper or
condensed. Also the other focal parameters are more precisely determined allowing for a more
reliable estimation of focal depths (Fig. 5.7.1) and fault plane solutions (Fig. 4.3.2-4.3.3). Because the
data sets are more complete and the location precision is better, the merged data are well-suited for
studying the intraplate seismicity of Fennoscandia.
Because different agencies have calculated magnitudes using different equations and parameters in
the FENCAT catalogue and the current catalogues, the magnitudes are not comparable. The
magnitudes should be homogenized before hazard calculation. We conclude that the updated
seismicity catalogue is well-suited for earthquake studies and hazard estimations, provided that the
magnitudes are homogenized prior to the calculations.
The addition of SNSN data set has increased the location precision especially close to the PGF faults
in Sweden and the OBF data in the proximity of the Hanhikivi site. As an example of the high
precision of the SNSN data is our new observation made at the workshop in October 2013. There is a
N-S directed trend of microseismicity aligned with and on top of a parallel magnetic lineament (Fig.
9.1.1). We suggest that this fault is active and that it should be checked for evidence of post-glacial
faulting.
By checking the earthquake catalogue data for mining explosions we have added the reliability of the
datasets in scientific earthquake studies. A good example of problems related to using publicly
available, unchecked catalogues is the study by Redfield and Osmundsen (2013). They have used the
automatic seismic event list published by International Seismological Centre (ICS;
http://www.isc.ac.uk/) to study the origin seismicity in Fennoscandia. Unfortunately the seismic
events included explosions in addition to earthquakes. The data set includes several seismic events
M>3 that are explosions in Finland alone. If these events were earthquakes, it would have major
consequences for hazard estimations.
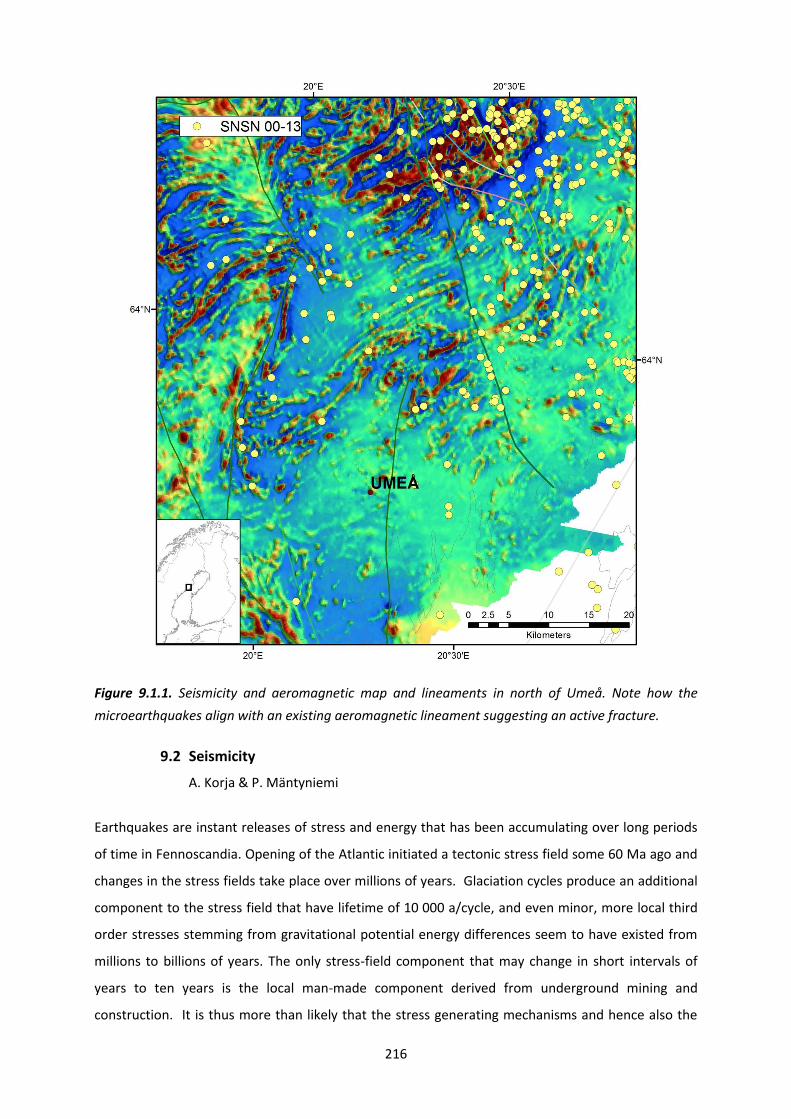
216
Figure 9.1.1. Seismicity and aeromagnetic map and lineaments in north of Umeå. Note how the
microearthquakes align with an existing aeromagnetic lineament suggesting an active fracture.
9.2 Seismicity
A. Korja & P. Mäntyniemi
Earthquakes are instant releases of stress and energy that has been accumulating over long periods
of time in Fennoscandia. Opening of the Atlantic initiated a tectonic stress field some 60 Ma ago and
changes in the stress fields take place over millions of years. Glaciation cycles produce an additional
component to the stress field that have lifetime of 10 000 a/cycle, and even minor, more local third
order stresses stemming from gravitational potential energy differences seem to have existed from
millions to billions of years. The only stress-field component that may change in short intervals of
years to ten years is the local man-made component derived from underground mining and
construction. It is thus more than likely that the stress generating mechanisms and hence also the
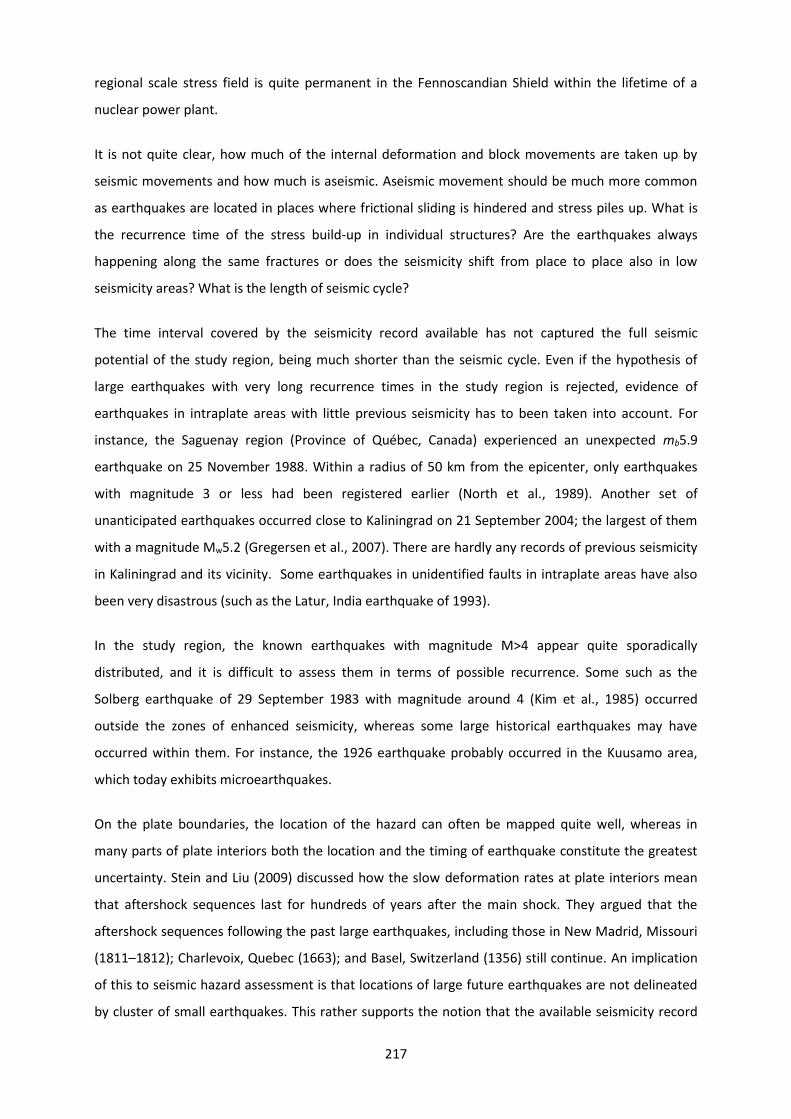
217
regional scale stress field is quite permanent in the Fennoscandian Shield within the lifetime of a
nuclear power plant.
It is not quite clear, how much of the internal deformation and block movements are taken up by
seismic movements and how much is aseismic. Aseismic movement should be much more common
as earthquakes are located in places where frictional sliding is hindered and stress piles up. What is
the recurrence time of the stress build-up in individual structures? Are the earthquakes always
happening along the same fractures or does the seismicity shift from place to place also in low
seismicity areas? What is the length of seismic cycle?
The time interval covered by the seismicity record available has not captured the full seismic
potential of the study region, being much shorter than the seismic cycle. Even if the hypothesis of
large earthquakes with very long recurrence times in the study region is rejected, evidence of
earthquakes in intraplate areas with little previous seismicity has to been taken into account. For
instance, the Saguenay region (Province of Québec, Canada) experienced an unexpected mb5.9
earthquake on 25 November 1988. Within a radius of 50 km from the epicenter, only earthquakes
with magnitude 3 or less had been registered earlier (North et al., 1989). Another set of
unanticipated earthquakes occurred close to Kaliningrad on 21 September 2004; the largest of them
with a magnitude Mw5.2 (Gregersen et al., 2007). There are hardly any records of previous seismicity
in Kaliningrad and its vicinity. Some earthquakes in unidentified faults in intraplate areas have also
been very disastrous (such as the Latur, India earthquake of 1993).
In the study region, the known earthquakes with magnitude M>4 appear quite sporadically
distributed, and it is difficult to assess them in terms of possible recurrence. Some such as the
Solberg earthquake of 29 September 1983 with magnitude around 4 (Kim et al., 1985) occurred
outside the zones of enhanced seismicity, whereas some large historical earthquakes may have
occurred within them. For instance, the 1926 earthquake probably occurred in the Kuusamo area,
which today exhibits microearthquakes.
On the plate boundaries, the location of the hazard can often be mapped quite well, whereas in
many parts of plate interiors both the location and the timing of earthquake constitute the greatest
uncertainty. Stein and Liu (2009) discussed how the slow deformation rates at plate interiors mean
that aftershock sequences last for hundreds of years after the main shock. They argued that the
aftershock sequences following the past large earthquakes, including those in New Madrid, Missouri
(1811–1812); Charlevoix, Quebec (1663); and Basel, Switzerland (1356) still continue. An implication
of this to seismic hazard assessment is that locations of large future earthquakes are not delineated
by cluster of small earthquakes. This rather supports the notion that the available seismicity record

218
cannot be used to infer the locations of future earthquakes in the region, which is in accordance with
the occurrence of surprise earthquakes. However, if some seismicity observed today is indeed
aftershocks of previous large earthquakes, it would imply that there is decreasing seismicity that
would at some point come to an end. Basically it is not impossible that a large earthquake occurred
many centuries ago, but whether the aftershocks are still occurring is an open question.
Occurrences of very large (Paleo)earthquakes in the study region have been dated to have taken
place shortly after the deglaciation, thus belonging to a stress regime different from that of today.
However, some authors have claimed large-magnitude earthquakes considerably younger than the
paleoevents. Lukashov (1995) proposed a 2300-year interval of higher seismicity in the Lake Onega
Domain, Russian Karelia. According to Mörner (2009), large-magnitude paleoearthquakes have
occurred in Sweden in the Late Holocene.
9.3 Geological and geophysical boundaries and shear zones
Korja, A
In chapter three the geological background information has been described using the concept of
lithotectonic units which have similar tectonic histories and structural grains. The study area includes
eleven lithotectonic units that were delineated based on major structural unconformities and other
structural criteria. The lithotectonic units have been described in relation to the Paleoproterozoic
orogen and Caledonian orogen. Sedimentary and magmatic rocks that have not been emplaced in
either of the two orogenies and belong to intervening rift stages have also been described. The
resulting map is simple enough for large scale studies. This approach emphasizes the effect of
orogenies on the structural development of the terranes and stresses the importance of orogenic
folding and faulting as source of structures that can be later reactivated in the current stress field.
The classification overlooks the possibility that precollisional rift structures could be inverted and
later be reactivated in following orogenies and during the current stress field.
From Figures 9.3.1-9.3.3 it is apparent that seismicity in the central Fennoscandian Shield is
associated with gravitational potential energy differences rising from local and regional variations of
the topography and bathymetry, crustal thickness and post-glacial rebound anomalies (Fig. 5.4.1). In
general, the changes in seismicity patterns are not associated with lithotectonic boundaries (Fig.
9.3.2). Noticeable exceptions are found at the western boundaries of the Mesoproterozoic units, of
the Norbotten-Karelia contact, perhaps also a slight change along southern contact of the Inari unit.
The Caledonian unit does not host any earthquakes.
The maps indicate that the areas with thick or overthickened crust (> 50 km) have only moderately
seismic activity and the earthquakes are shallow (Figs. 5.4.2 and 9.3.3). The seismically active areas
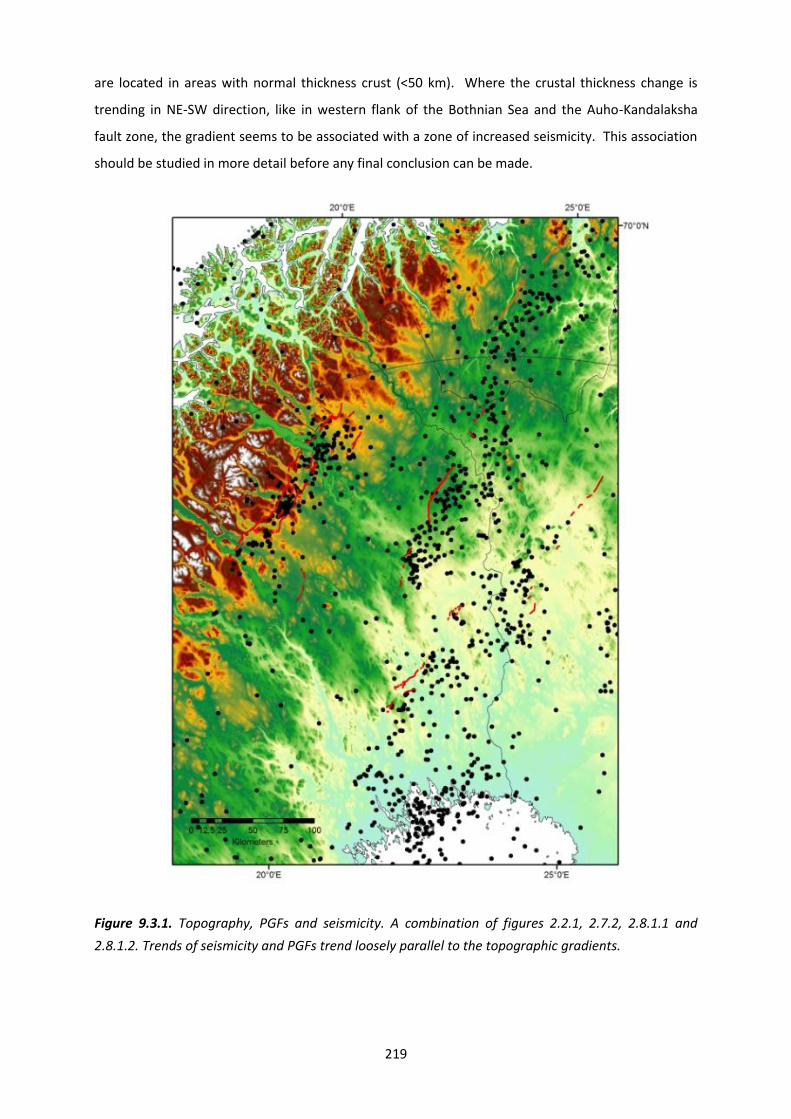
219
are located in areas with normal thickness crust (<50 km). Where the crustal thickness change is
trending in NE-SW direction, like in western flank of the Bothnian Sea and the Auho-Kandalaksha
fault zone, the gradient seems to be associated with a zone of increased seismicity. This association
should be studied in more detail before any final conclusion can be made.
Figure 9.3.1. Topography, PGFs and seismicity. A combination of figures 2.2.1, 2.7.2, 2.8.1.1 and
2.8.1.2. Trends of seismicity and PGFs trend loosely parallel to the topographic gradients.

220
Figure 9.3.2. Lithotectonic units, seismicity and Model 1. A combination of figures 3.1.1.1, 2.8.1.1,
2.8.1.2 and 8.2.1. Hanhikivi site: red dot.
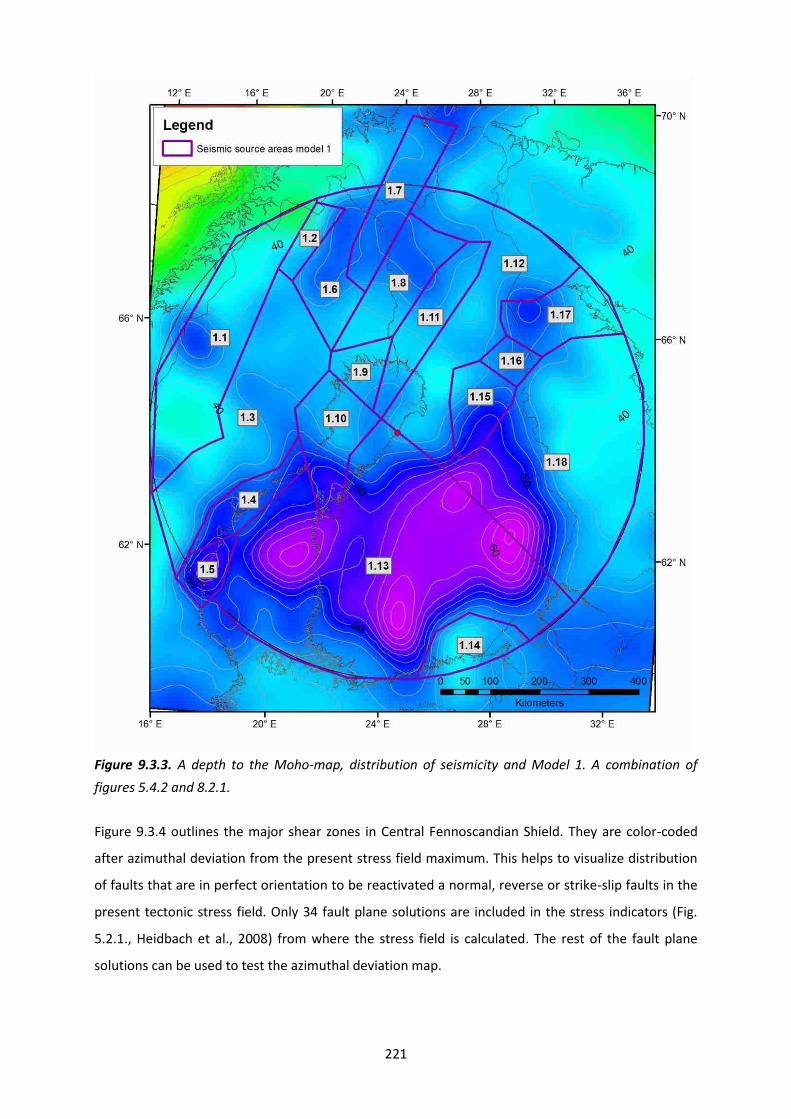
221
Figure 9.3.3. A depth to the Moho-map, distribution of seismicity and Model 1. A combination of
figures 5.4.2 and 8.2.1.
Figure 9.3.4 outlines the major shear zones in Central Fennoscandian Shield. They are color-coded
after azimuthal deviation from the present stress field maximum. This helps to visualize distribution
of faults that are in perfect orientation to be reactivated a normal, reverse or strike-slip faults in the
present tectonic stress field. Only 34 fault plane solutions are included in the stress indicators (Fig.
5.2.1., Heidbach et al., 2008) from where the stress field is calculated. The rest of the fault plane
solutions can be used to test the azimuthal deviation map.

222
Figure 9.3.4. Deformation zones and Model 2. A combination of figures 3.1.2.1 and 8.3.1. Ellipsoids
point out areas where Model polygons transect larger structural domains. Hanhikivi site: black dot.
Another interesting observation from the map is that e.g. in the Central Finland granitoid complex
(Fig. 9.3.4; northern part of Model 2) the suggested release mechanism is the same as the one
prevailing during its formation in the Precambrian. (For more detailed descriptions of the fault zones
in Central Finland see: Nironen et al., 2000; Sorjonen-Ward, 2006; Korja et al., 2009). That is thrust
faults in the current stress field have once been moving as thrust faults in the Precambrian, transfer
faults have been described as transtensional faults etc. This observation suggests that the stress field
stemming from the opening of the North Atlantic is partly reactivated per-existing weak zones of the
Eurasian plate (Fennoscandia). Pascal and Cloetingh (2009) suggested that similarly to South-Atlantic
also the North Atlantic opening may have partly inherited an older stress field.
Koskinen (2013) and Koskinen and Korja (2014) noted that in Finland only in Lapland seismicity
patterns could be linked with individual reactivated fault zones. There seismicity seems to be
associated with the reactivation of the pre-existing orthogonal pair of NE-SW and NW-SE faults,
associated with reverse (PGF) and transfer faults (Fig. 9.3.4). Tiira et al. (2013) suggested that the set
223
of NW-SE striking strike slip faults (Western Lapland fault zone) that transect Central Lapland may
have are inherited their direction from the transfer faults of the buried Paleoproterozoic Lapland rift.
It is suggested that the lower crust has attained its elastic properties already in the Paleoproterozoic
rifting phase and that those lower crustal properties have been inherited through the different
inversion periods as suggested by Watts and Burov (2003). It is not clear whether the Western
Lapland fault zone and Lapland paleorift structures are just parallel to each other, or if they have a
more profound relationship.
Overall, the relatively young fault sets with presumably brittle-ductile deformation appear to be
confined to the area underlain by Archean crust (Fig. 3.1.1.1) or rather Archean crust that was
extended and dismembered during Paleoproterozoic rifting event. The consequence of this is that
areas underlain by Archean crust host old inverted crustal scale deformation zones. It might be that
because they were once formed in brittle environment they might continue to be more susceptible
to be reactivated than the ones that were formed as ductile shear zones in the Paleoproterozoic. This
reasoning could explain the existence of PGF faults in Lapland.
PGF faults are usually associated with reactivated fault systems. For instance a thrust system may
have complex internal 3D structures composed of synthetic, antithetic and transfer parts that
associated with fault plane solutions indicating reverse, normal and strike slip regimes respectively.
In the NE-SW trending Pärvie Fault, the earthquakes affiliated with the main fault and synthetic faults
to it would produce fault plane solutions compatible with NE-SW striking reverse faults with varying
dips. Earthquakes affiliated with the antithetic faults would have fault plane solutions suggesting NE-
SW striking normal faults with opposing dips. Earthquakes associated with the transfer/strike slip
faults should suggest movement in NW-SE direction along rather steep faults. These would
compensate for the different velocities of the different parts of the fault. We suggest that the wide
range of fault plane solutions documented within the Pärvie Fault (Lindblom and Lund, 2011;
Lindholm et al., 2011) could be signaling the movement of a complex thrust system.
9.4 Seismogenic zone
A seismogenic zone is defined as a zone where the majority of earthquakes takes place. The depth of
the seismogenic zone is time and place dependent. In the study area, earthquakes occur at depths
between 0 and 45 km (Fig. 9.4.1). Most of the earthquakes (2000-2012) (80%) occur in the upper
crust down to 17 km in depth, a minority (19%) in the middle crust (17-31 km) and only a few in the
lower crust 31-45 km (1%). Lamontagne and Ranalli (1996) suggested that the lower limit of the
seismogenic zone is where 99% of the earthquakes occur. According to this definition the thickness
of the seismogenic zone is 31 km in the study area. Kaikkonen et al. (2000) deduced quite similar

224
values for Finland (eastern part of the study area) by using FENCAT earthquake catalogue data from
the years 1965–1997. They evaluated that most of the earthquakes (80%) take place at depths
between 0 km and 14 km, 19 % between depths of 14 and 31 km, and less than 1% at deeper levels
and that the seismogenic thickness above which (99%) of the earthquakes occur is 31 km. Our results
confirm the result that the seismogenic layer is at the depth of 31 km. The layer seems to be rather
uniform across Fennoscandia.
Figure 9.4.1. A histogram of depth distribution of earthquakes in 2000-2012.
Kaikkonen et al. (2000) associated the lower boundary of the seismicity (31 km) with 350 oC isotherm
related to transition from velocity weakening to velocity strengthening in granitic rocks (Scholz,
1990). In the study area, the isosurface is located between depths of 30-45 km, when wet rheologies
are assumed (Fig. 5.6.1). The isosurface is in close proximity to the seismically determined boundary
between high velocity gabbroic lower crust and granodioritic middle crust found between depths of
34 to 42 km (Korja et al., 1993). We suggest that the middle-lower crustal boundary may add
compositional and rheological constraints to the depth extent of seismogenic zone in the study area.
After numerical modeling studies where wet crustal rheologies applicable to Finnish crust were used,
Moisio and Kaikkonen (2000) suggested that distinct decoupling of strong upper crust, weak lower
crust and strong upper mantle (Moisio and Kaikkonen, 2000). They suggested that decoupling
interrupts the transmission of differential stress from the brittle upper crust to the ductile lower
crust and upper mantle. This corroborates the idea that seismogenic layer is restricted to the middle
and upper crust in the study area.
According numerical experiments by Moisio and and Kaikkonen (2006, 2012) the depth of the
modelled brittle-ductile transition zone is highly dependent on the number of layers and other model
225
parameters. In areas where the crust is clearly layered, BTZ is located at around the depth of 10 km
(e.g. Central Finland lithotectonic unit), whereas in other areas it may be found at larger depths
down to 40 km (Karelia lithotectonic unit). The observed depth distribution (Fig. 5.7.1) is generally in
agreement with the rheological models by Moisio and Kaikkonen (2006, 2012). In Central Finland,
where crustal layering with a pronounced décollement zone between upper and middle crust is
found (Korja and Heikkinen, 2008), the majority of well-defined earthquakes are confined to the
upper crust. Note that small to moderate size earthquakes tend to occur along pre-existing zones of
weakness with a limited depth extent. Only few of the major large shear zones or rather block
boundaries have continuations to the middle crust and even fewer to the lower crust. One of such
regions could be Norra Kvarken from where deep earthquakes have been reported (Fig. 5.7.1). From
the same area BABEL reflection profiles have identified a paleo-subduction and collision zone
accompanied by a step in the Moho and deep penetrating NE dipping shear zones (Fig. 5.5.1.1;
BABEL Working Group 1990; Korja and Heikkinen, 2005). It is suggested that the décollement
controlling the depth extent of fault zones is controlling the lower limit of present seismicity within a
given source area.
In the Kuusamo area and Hirvaskoski and Auho-Kandalaksha deformation zones (Karelia lithotectonic
unit) which on one hand belong to the precollisional rift areas and, on the other hand, to areas
where the high velocity lower crust is either thin or missing, earthquakes occur deeper, down to 30
km in depth. Although the earthquakes take place at deeper levels and over half of the earthquakes
occur between 15 km and 30 km, the events are still located above the onset of brittle-ductile
transition as argued by Uski et al. (2012) and thus they are placed within the seismogenic zone (31
km). The implied link between increased seismicity in Kuusamo and Hirvaskoski and Auho-
Kandalaksha deformation zones to inverted rift structures should be looked more carefully into.
9.5 Alternative seismic source area (SSA) models
We have outlined three alternative models in section 8. The models were designed by two
independent expert groups (see section 8). Group 1 drafted Model 1 (Figs. 8.2.1-8.2.3 and 9.5.1) that
is based on geological, historical and instrumental seismicity data in the database (Figs. 2.8.1.1-
2.8.1.2), lithotectonic units (Fig.3.1.1.1) and deformation zones found in structural, aeromagnetic or
Bouguer anomaly maps (Section 2.1 and 2.5). The model draws from the influence of
Paleoproterozoic bedrock structures and structural evolution on the source of seismicity. Group 2
drafted Models 2 and 3 (Figs. 8.3.1-8.3.6 and 9.5.2) and Model 3 is a more detailed version of Model
2. They focused their analysis on the recently active structures using data sets bearing on
instrumentally recorded seismicity (1971-2012 + SNSN extra data; Figs. 2.8.1.2-2.8.1.3), post-glacial
faults (PGF; Fig. 2.7.2), topography and bathymetry (Fig. 2.2.1), lineaments defined on the basis of

226
magnetic data and the current stress field (Fig. 5.2.1-5.2.2). Model 3 is an evolved version of spatial
model 2 and contains additional minor polygons. The location of the Hanhikivi site was not included
in the maps used in the workshop. This has resulted in the fact that the site is right on the polygon
margin in Model 1.
Although two independent expert groups have drafted Models 1 and 2 (3) and have used mostly
different data sets, the three models share many similarities and have only minor deviations (Table
9.5.1). The similarities can be seen in Figures 9.5.1 - 9.5.3. The models are similar in that the majority
of the polygons are overlapping in shape and size for the most parts. Some discrepancies are found
on the margins. Most of the differences are found in the offshore areas (Fig. 9.5.4), where structural
control of neither the Precambrian deformation zones nor the PGFs or bathymetry is not optimal.
The similarity of the models stems from the fact that both groups have used seismicity as the primary
descriptor and other materials as secondary descriptors. The models are quite similar because 1)
seismicity is linked to reactivation of old faults in the present stress field, 2) post-glacial faults are
associated with reactivation of old faults, 3) topography is influenced by the structure and
composition of the Precambrian bedrock, 4) the current tectonic stress field might be influenced by
the structure of the Precambrian bedrock. It is concluded that the three seismic source area Models
1, 2 and 3 are closely related.
In these models, the spatial grouping of earthquakes has been the major decision criteria and other
criteria come only as second. The polygon boundaries are located between the areas of increased
seismicity i.e. in the in between areas, which results in certain freedom in drafting the polygons. In
this project, two expert groups produced rather similar sets of polygons, which add to the credibility
of the models. The closeness of the sub-parallel parts of the polygon lines could perhaps be used as
an error estimate of the line positions. Polygons characterized by increased seismicity have deviation
around + 15 km. Polygons with less earthquakes the boundaries are less well defined and thus
deviations are in the order of 5-50 km for large polygons (250- 500 km wide) and in the order 25-50
km for smaller polygons (40-100 km wide). The smallest polygons have the largest error estimates
and thus they are the most unreliable polygons.
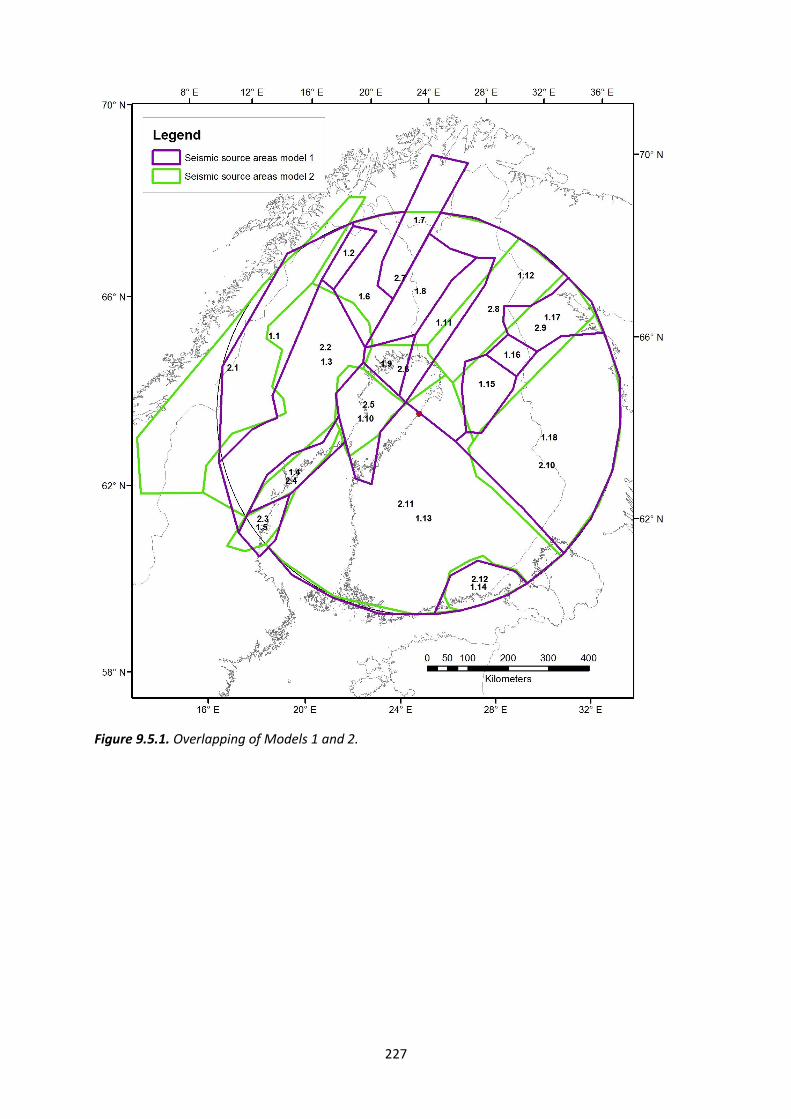
227
Figure 9.5.1. Overlapping of Models 1 and 2.

228
Figure 9.5.2. Overlapping of
Models 2 and 3. Model 3 is a more
detailed version of Model 2 and it
has extra polygons included within
the larger polygons of Model 2.
Figure 9.5.3. Overlapping of
Models 1 and 3. Note that the
models have many similarities
and only minor major
deflections.

229
Table 9.5.1. A comparison of polygons in Models 1, 2 and 3. Model 3 has extra subpolygons that are
included within the larger polygons of Model 2. These subpolygons are listed in groups that begin
with the same row. Polygons with overlapping geometries are placed on the same row. Polygons of
Model 3 that have only minor overlapping with Model 1 are in brackets, whereas larger polygons of
Model 1 that spread over several smaller polygons of Model 3 are highlighted in colours. Polygons
with large parts outside the study area have a note on the observation column as well as those
located offshore.
Model 2 Model3 Model 1 obs2.1 3.1 1.1 outside2.2 3.3 1.32.3 3.4 1.52.4 3.5 1.42.5 3.6 1.10 offshore- " - 3.7 1.10 offshore2.6 3.8 1.9 offshore- " - 3.9 1.11 offshore- " - - " - 1.9 offshore- " - - " - 1.12- " - (3.7) 1.10 offshore2.7 3.2 1.2- " - 3.12 1.7 outside- " - 3.11 1.8- " - 3.10 1.11- " - 3.15 1.11- " - (3.14) (1.12) outside- " - (3.13) outside2.8 3.16 1.122.9 3.17 1.17- " - - " - 1.15- " - 3.18 1.162.10 3.19 1.182.11 3.20 1.13- " - - " - (1.12)- " - - " - (1.10)2.12 3.21 1.14
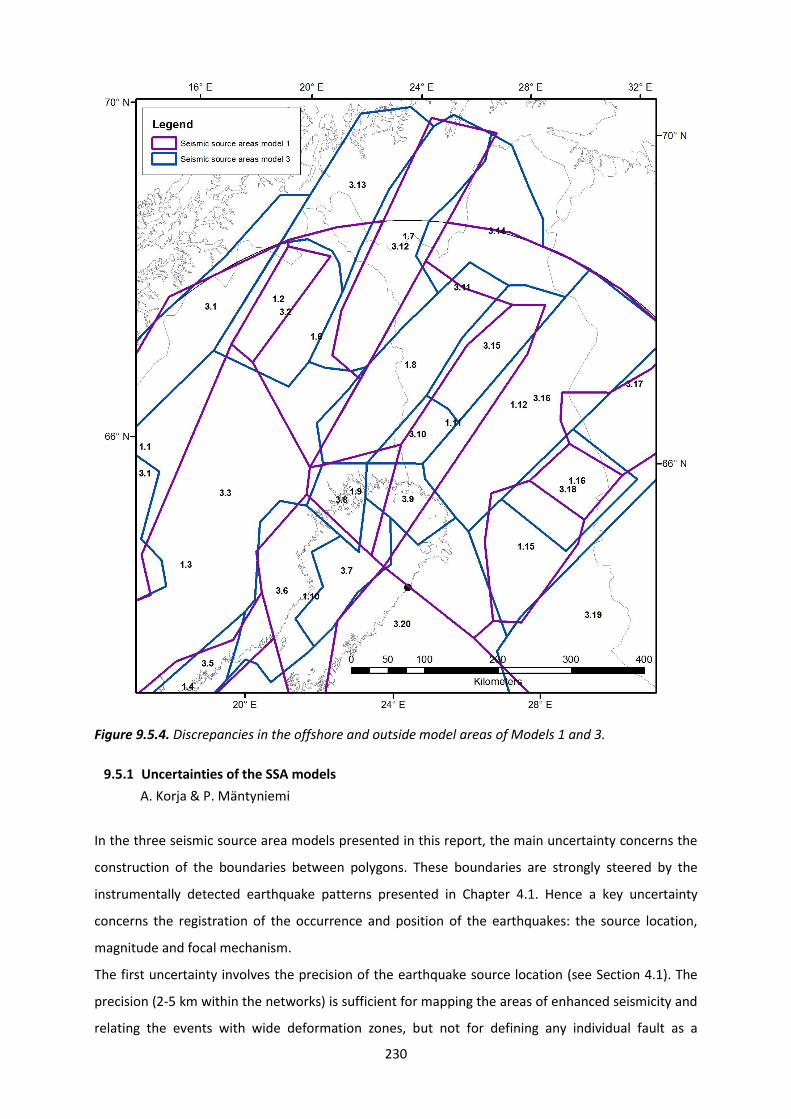
230
Figure 9.5.4. Discrepancies in the offshore and outside model areas of Models 1 and 3.
9.5.1 Uncertainties of the SSA models
A. Korja & P. Mäntyniemi
In the three seismic source area models presented in this report, the main uncertainty concerns the
construction of the boundaries between polygons. These boundaries are strongly steered by the
instrumentally detected earthquake patterns presented in Chapter 4.1. Hence a key uncertainty
concerns the registration of the occurrence and position of the earthquakes: the source location,
magnitude and focal mechanism.
The first uncertainty involves the precision of the earthquake source location (see Section 4.1). The
precision (2-5 km within the networks) is sufficient for mapping the areas of enhanced seismicity and
relating the events with wide deformation zones, but not for defining any individual fault as a
231
capable fault. The correlation is further complicated by the fact that deep structure of the
deformation zones is mostly unknown. Seismic reflection data from the area suggest that the style of
deformation changes with depth and that upper and middle crust may be detached (see Fig. 5.5.1;
Korja and Heikkinen, 2008). This implies that it may not be possible to extend the structures
observed at surface to great depths and to correlate earthquakes at depth with outcropping
structures or lineaments.
As is mentioned in Section 4.1, the bulk of routinely determined focal depths in FENCAT may contain
large uncertainties, the shallowest depths in particular. The depth distribution is best resolved within
the areas where dense temporary networks have been operational. Waveform modeling of depth-
sensitive phases has provided additional constraints on focal depth estimation, verifying, for
example, the unusually shallow depth pattern in Wiborg batholith area (source areas: 1.14 and 2.12;
Uski et al., 2006) and the mid-crustal activity within the Kuusamo block (Fig. 5.7.2.; source areas: 1.16
and 3.18; Uski et al., 2012). However, convincing data on seismic activity within the lower crust
(depths below ~32 km) are still lacking.
There are no apparent regional variations in the magnitude of earthquakes in central and eastern
Fennoscandia, and thus no relations between deformation zone trends and earthquake magnitude
can be found. We emphasize that magnitudes used in this study are those provided by the different
seismological agencies for FENCAT and they have to be homogenized prior to hazard calculations. In
addition, possible systematic magnitude differences between historical and instrumental data should
be evaluated.
It is reasonable that earthquakes were on average better recorded in the instrumental than the non-
instrumental era. In the semi-instrumental period, however, the instrumental observations may be of
poorer quality than macroseismic ones, in areas where the detection threshold and location accuracy
of existing seismograph networks were low. In Finland, the 1930’s were covered quite well by
macroseismic observations, while the data quantity and quality in the semi-instrumental era in the
1960’s were rather poor and inconsistent. The data quality of two historical earthquakes that
occurred close together in time in the distant past may differ significantly, and every one of them
should be subjected to an individual assessment in order to understand the associated uncertainties.
In historical earthquake data the largest uncertainties of location and magnitude are sometimes
associated with the strongest earthquakes whose areas of perceptibility extended to several
countries. An example is the Lurøy, Norway earthquake of the 31 August 1819. The felt observations
were compiled by Ehrenheim (1824) and Kjellén (1903) for Sweden, and Musketov and Orlov (1893)
for Russia, and sometimes the epicenter was subsequently taken to be located in these countries.
232
Macroseismic maps displaying the whole area of perceptibility were not compiled until Ambraseys
(1985) and Muir Wood (1988).
It has been generally noticed that the first efforts to derive parameters, in particular macroseismic
magnitudes, tended to overestimate rather than underestimate the value. This has been observed in
the study area as well. For instance, Penttilä (1978) assigned a magnitude of 5.2 to the earthquake of
23 June 1882 at the bottom of the Bay of Bothnia. The upgrading is sometimes attributed to colourful
details of primary data that received too much weight in intensity assessments. This does not hold
true in the study area, where the primary macroseismic data are matter-of-fact and typically concise.
The views of contemporary writers about the nature of earthquakes are the part of reports that ages
fast, whereas the observations remain usable throughout centuries. Since the first studies, better
intensity scales, better ways of assessing intensity on the basis of textual materials, and more
rigorous ways of deriving parameters from intensity data points have been developed. An improved
understanding of attenuation has emerged (Husebye et al., 1978). Also more seismicity data have
accumulated, and they allow calibration of macroseismic magnitudes against instrumental
magnitudes.
Earthquake focal mechanisms (Fig. 4.3.3; Table 4.3.1) provide a unique source of information on the
stresses acting deep in the crust. It is, however, important to understand their limitations, because
each individual fault plane solution may deviate significantly from the regional pattern. In Finland
and Sweden, recent focal mechanisms are computed from P wave polarities and P to S wave
amplitude ratios (see references in Section 4.3). However, the best-fitting solutions of small
earthquakes are seldom unambiguous. This stems from a sparse distribution of input data on the
focal sphere and uncertainties in model parameters (e.g. the velocity model used). The well-
constrained fault plane solutions of large events may be uncertain by + 10o for all source angles (dip,
strike, rake), and even larger uncertainties may be associated with solutions of small events. Small
earthquakes are also more influenced by local stress conditions than the large, regionally more
significant events. In spite of the uncertainties, the available focal mechanism data give a surprisingly
consistent view on prevailing stress directions in the study area (Section 4.3).
Neither of the Models 1 and 2 have used the shear zone classification as a prime descriptor. This has
resulted structurally very heterogeneous seismic source areas such as 1.13 and 2.11, which include
Central Finland, RLSC, Southern Finland and Bothnian Sea rift basin in one seismic source area. It has
also resulted in splitting of the Lapland area into several NE-SW striking source areas, 1.2, 1.7, 1.8,
1.11, 1.12, (1.6, 1.12) following the seismicity patterns that mimic the reverse fault patterns. This
splitting of the Lapland into several areas may underestimate the importance of the NW-SE striking
233
deep strike-slip faults stemming from the rift-stage. We can conclude that the rift stages are not well
represented in the Models 1, 2 and 3.
The polygons in source models 1-3 (Section 8) are mainly based on instrumental earthquake
locations. Also historical earthquake data were used to define Model 1. Due to the brief observation
time of earthquake occurrences, little is known about the episodicity of earthquake activity in
Fennoscandia. At active plate boundaries, seismicity may migrate over time along major structures
(e.g. North Anatolian Fault Zone). The temporal and spatial variation of activity would most likely
affect the source area definitions. Also, as argued by Stein and Liu (2009), intraplate earthquake
clusters may in fact be long-lived aftershock sequences caused by large earthquakes. It is not
appropriate to estimate earthquake recurrence rates using such data.
9.6 Comparison to existing SSA models
A. Korja
The model by Mäntyniemi et al. (1993) has 4 polygons that overlap with our study area (Fig. 9.6.1.).
Hanhikivi is situated in a low seismicity area number 5. The model by Mäntyniemi et al (1993) has
much larger polygons that incorporate several polygons of Models 1-3. The NE-SW trending of the
polygons in the western part of the study area are roughly included in polygons 3 and 4. The high
seismicity polygons are included in polygon 3. The high seismicity polygons of Model 1 are included
in polygon 6 of Mäntyniemi et al. (1993). The major difference is found at the boundary between the
northern high/intermediate seismicity area and low seismicity region in the south. Mäntyniemi
emphasizes similarities of seismicity patterns of Kuusamo-Kandalaksa zone to Lapland whereas
Model 1 emphasizes the lithotectonic boundary. Models 1 and 3 have several smaller polygons that
are incorporated into the larger polygons of the Mäntyniemi et al. (1993) model.
The GSHAP model has six polygons (1-6) that overlap with our study area (Fig. 9.6.2). Hanhikivi is
situated in low seismicity source area 6. The fit between the models is rather good. The shapes and
trend in both models are similar but Model 1 and 3 have several smaller polygons that are
incorporated in the larger polygons of the GSHAP model.
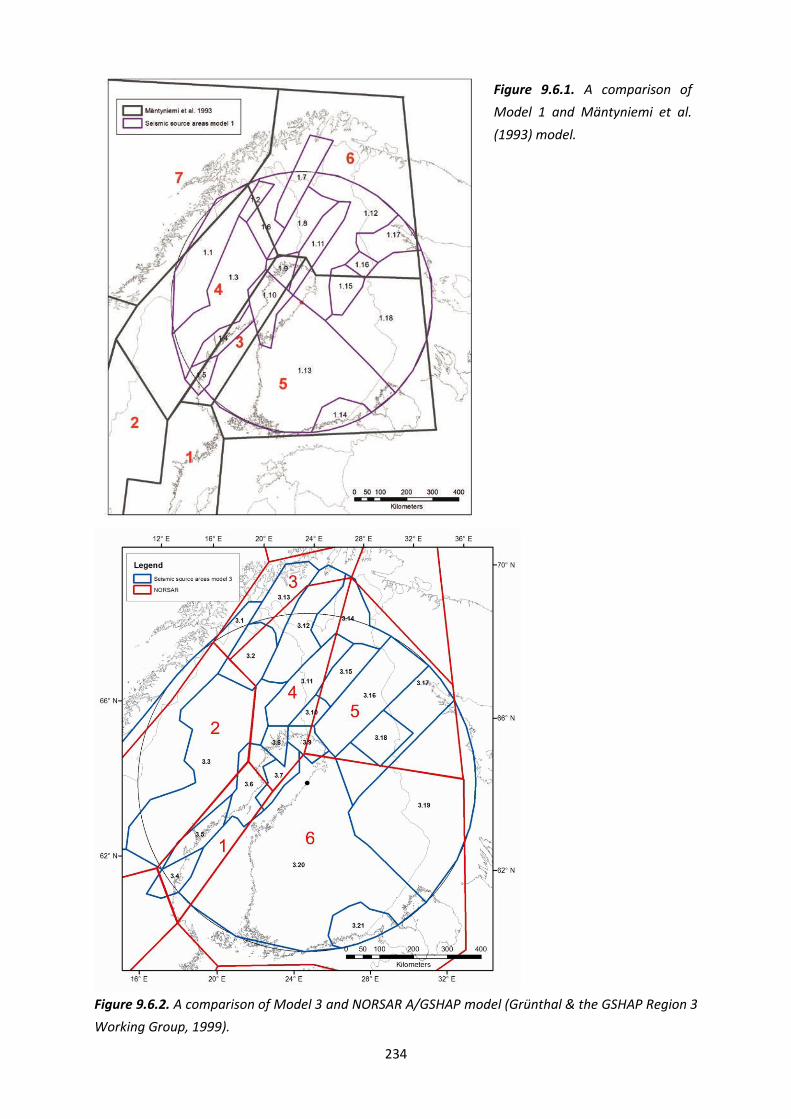
234
Figure 9.6.2. A comparison of Model 3 and NORSAR A/GSHAP model (Grünthal & the GSHAP Region 3
Working Group, 1999).
Figure 9.6.1. A comparison of
Model 1 and Mäntyniemi et al.
(1993) model.
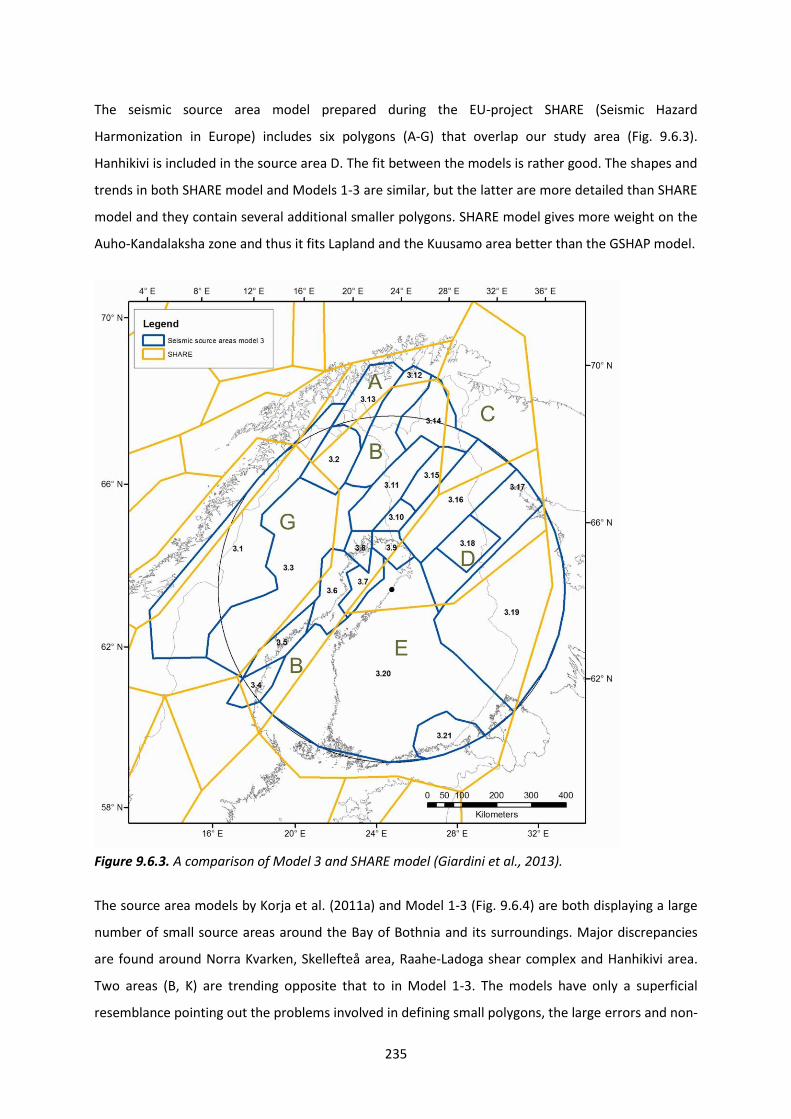
235
The seismic source area model prepared during the EU-project SHARE (Seismic Hazard
Harmonization in Europe) includes six polygons (A-G) that overlap our study area (Fig. 9.6.3).
Hanhikivi is included in the source area D. The fit between the models is rather good. The shapes and
trends in both SHARE model and Models 1-3 are similar, but the latter are more detailed than SHARE
model and they contain several additional smaller polygons. SHARE model gives more weight on the
Auho-Kandalaksha zone and thus it fits Lapland and the Kuusamo area better than the GSHAP model.
Figure 9.6.3. A comparison of Model 3 and SHARE model (Giardini et al., 2013).
The source area models by Korja et al. (2011a) and Model 1-3 (Fig. 9.6.4) are both displaying a large
number of small source areas around the Bay of Bothnia and its surroundings. Major discrepancies
are found around Norra Kvarken, Skellefteå area, Raahe-Ladoga shear complex and Hanhikivi area.
Two areas (B, K) are trending opposite that to in Model 1-3. The models have only a superficial
resemblance pointing out the problems involved in defining small polygons, the large errors and non-
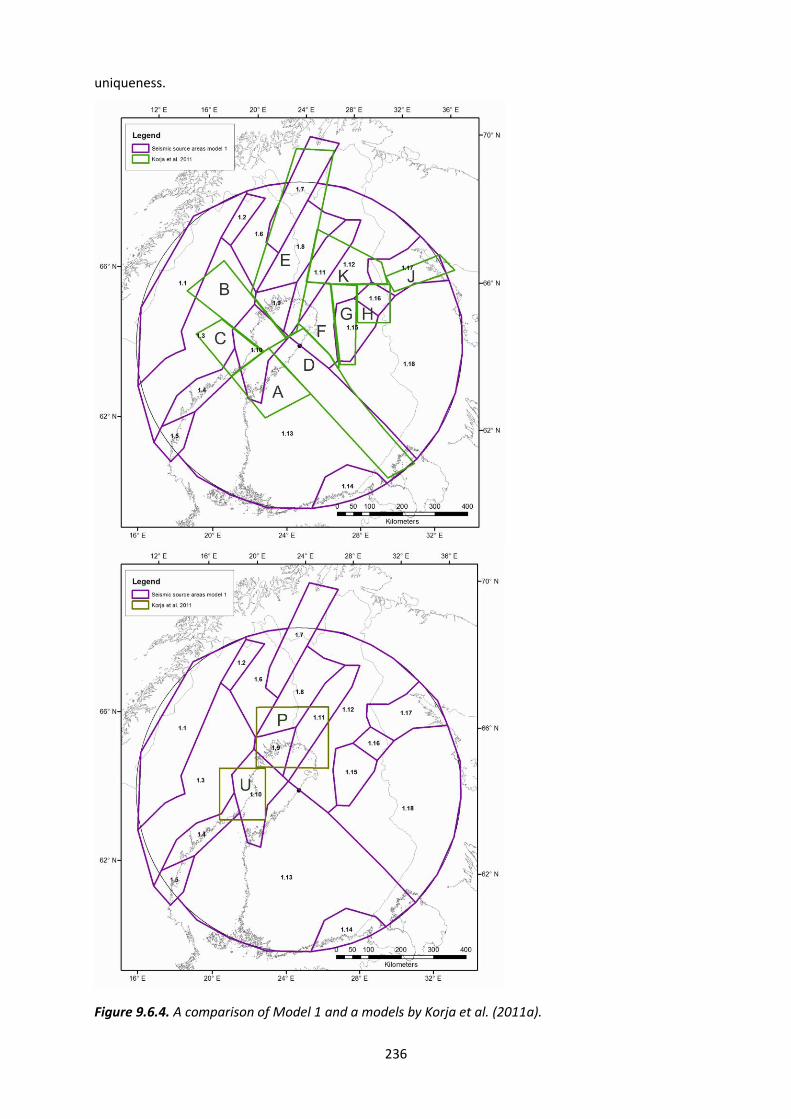
236
uniqueness.
Figure 9.6.4. A comparison of Model 1 and a models by Korja et al. (2011a).
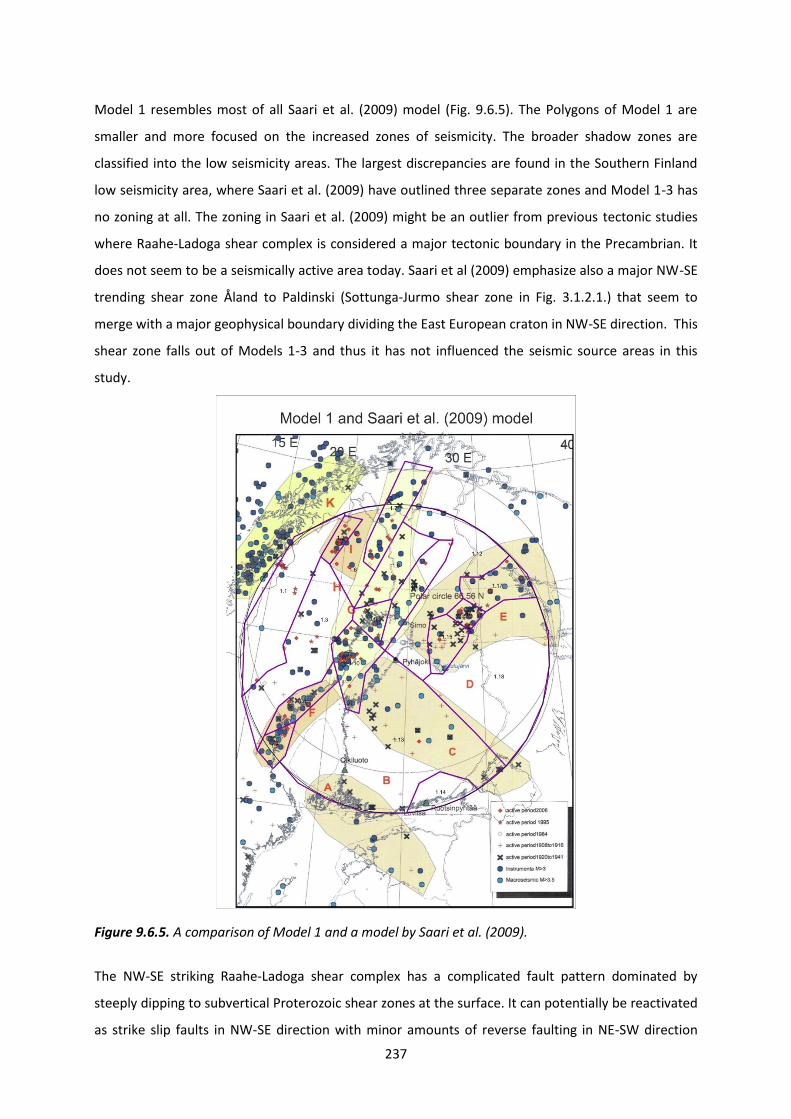
237
Model 1 resembles most of all Saari et al. (2009) model (Fig. 9.6.5). The Polygons of Model 1 are
smaller and more focused on the increased zones of seismicity. The broader shadow zones are
classified into the low seismicity areas. The largest discrepancies are found in the Southern Finland
low seismicity area, where Saari et al. (2009) have outlined three separate zones and Model 1-3 has
no zoning at all. The zoning in Saari et al. (2009) might be an outlier from previous tectonic studies
where Raahe-Ladoga shear complex is considered a major tectonic boundary in the Precambrian. It
does not seem to be a seismically active area today. Saari et al (2009) emphasize also a major NW-SE
trending shear zone Åland to Paldinski (Sottunga-Jurmo shear zone in Fig. 3.1.2.1.) that seem to
merge with a major geophysical boundary dividing the East European craton in NW-SE direction. This
shear zone falls out of Models 1-3 and thus it has not influenced the seismic source areas in this
study.
Figure 9.6.5. A comparison of Model 1 and a model by Saari et al. (2009).
The NW-SE striking Raahe-Ladoga shear complex has a complicated fault pattern dominated by
steeply dipping to subvertical Proterozoic shear zones at the surface. It can potentially be reactivated
as strike slip faults in NW-SE direction with minor amounts of reverse faulting in NE-SW direction

238
(Fig. 3.1.2.1). The reverse faulting could take place as dip slip faulting on the steep to subvertical
faults. The Raahe-Ladoga shear complex is the main structural divider in Finland and it seems to be a
seismicity pattern divider as well, yet it does not host many instrumentally detected earthquakes.
Within the zone seismicity is subdued with shallow earthquakes. This may be related to the fact that
it is mostly located in the thick crust part of Finland. In previous articles dealing with seismicity and
tectonics (Talvitie, 1971; Lahtinen et al., 2005; Saari et al., 2009; Korja et al., 2011) the importance of
this structural divider has been highlighted, whereas in this paper it has been included in the Central
Finland lithotectonic unit and in the low seismicity source areas encompassing Central and southern
Finland (1.13, 2.11).
9.7 Comparison to conceptual models
When comparing Model 1 and the conceptual seismogenic model of Redfield and Osmundsen (2013)
it is quite clear that the models have much in common (Fig. 9.7.1). The western polygons could be
classified as located in the hinterland of Scandes, the high seismicity polygons overlap with the
hinterland-break-in-slope and the eastern blocks are located with the craton part. The seismicity
zone is located in close proximity to the western boundary of the Bay of Bothnia basin that was
active already in the Mesoproterozoic and maybe even earlier. It may well be that the present
increased seismicity at the eastern coast of Sweden is linked to an old lithospheric scale weakness
zone. The weakness zone may have initiated during the Mesoproterozoic rifting when the western
boundary of the Bay of Bothnia basin was formed and it is now reactivated as the the hinterland-
break-in slope.
According to Muir Wood (2000), deglaciation dominates the current crustal strain field in many high
latitude stable continental regions such as Fennoscandia. His conceptual model predicts the
strongest seismicity to take place in the northeast and southwest quadrants of the former fore bulge
(Fig. 9.7.2 in pink colour), whereas the quadrants of aseismicity are located in the northwest and
southeast (no colour). Muir-Woods conceptual model and Models 1-3 have little in common (Fig.
9.7.2.). The polygons of Model 1 with increased seismic activity in the north are located in both the
seismic dome quarter and the aseismic quarter of Muir and Wood’s model. The low seismicity
polygons are situated in the aseismic quarter. The boundaries do not match well with the Model 1-3
polygon boundaries. Consequently, the Muir-Woods model is not well-supported by Models 1-3.
In Model 1 NE-SW trending polygons have the same direction as the long axes of the GIA anomaly
(Fig. 9.7.3). Polygons 1.4, 1.5, 1.11 are along the axes. Also polygons 1.15-1.17 that are associated
with the Auho-Kandalaksha fault zone are trending parallel to the GIA ellipsoid. The known PGFs, on
the other hand, are not parallel to the isolines of the rebound ellipsoid. The elongation axis of GIA
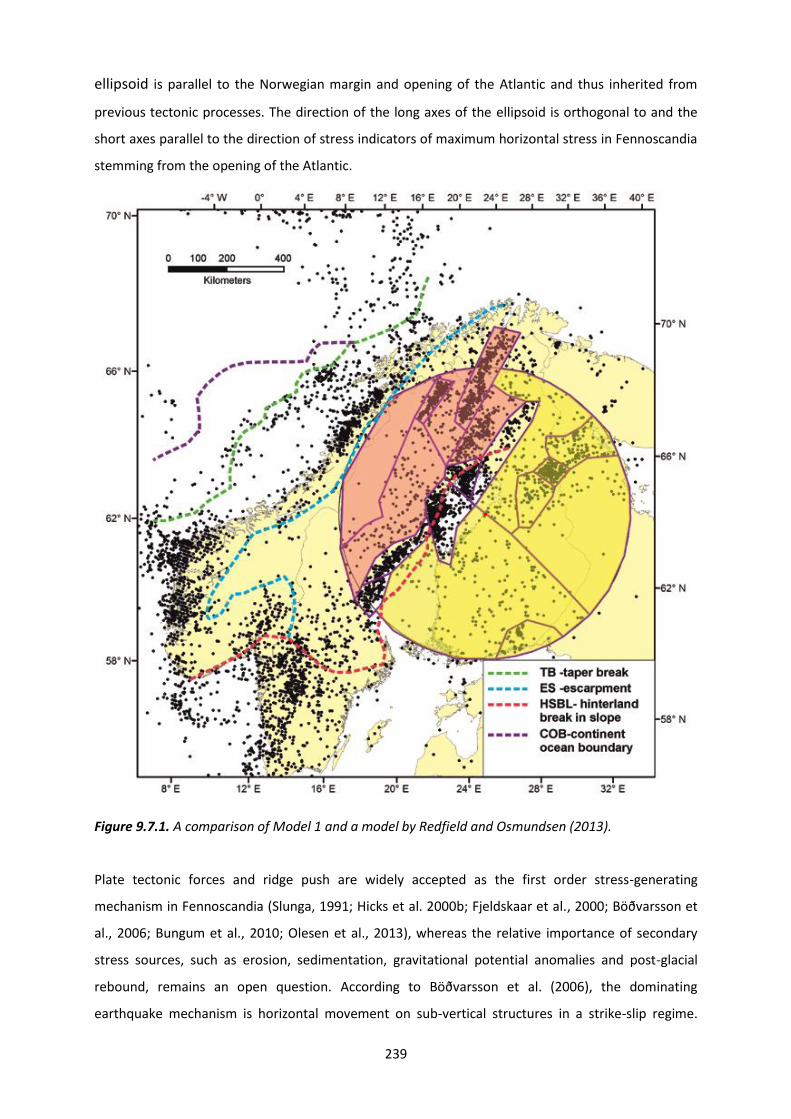
239
ellipsoid is parallel to the Norwegian margin and opening of the Atlantic and thus inherited from
previous tectonic processes. The direction of the long axes of the ellipsoid is orthogonal to and the
short axes parallel to the direction of stress indicators of maximum horizontal stress in Fennoscandia
stemming from the opening of the Atlantic.
Figure 9.7.1. A comparison of Model 1 and a model by Redfield and Osmundsen (2013).
Plate tectonic forces and ridge push are widely accepted as the first order stress-generating
mechanism in Fennoscandia (Slunga, 1991; Hicks et al. 2000b; Fjeldskaar et al., 2000; Böðvarsson et
al., 2006; Bungum et al., 2010; Olesen et al., 2013), whereas the relative importance of secondary
stress sources, such as erosion, sedimentation, gravitational potential anomalies and post-glacial
rebound, remains an open question. According to Böðvarsson et al. (2006), the dominating
earthquake mechanism is horizontal movement on sub-vertical structures in a strike-slip regime.
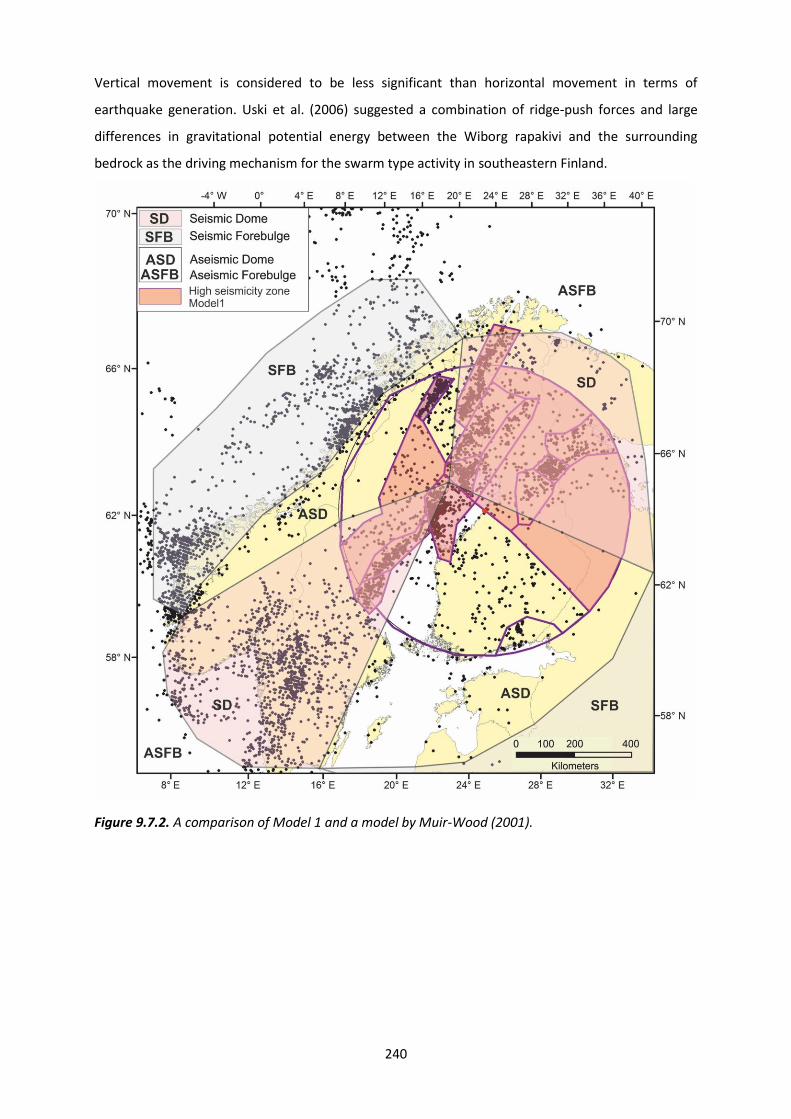
240
Vertical movement is considered to be less significant than horizontal movement in terms of
earthquake generation. Uski et al. (2006) suggested a combination of ridge-push forces and large
differences in gravitational potential energy between the Wiborg rapakivi and the surrounding
bedrock as the driving mechanism for the swarm type activity in southeastern Finland.
Figure 9.7.2. A comparison of Model 1 and a model by Muir-Wood (2001).
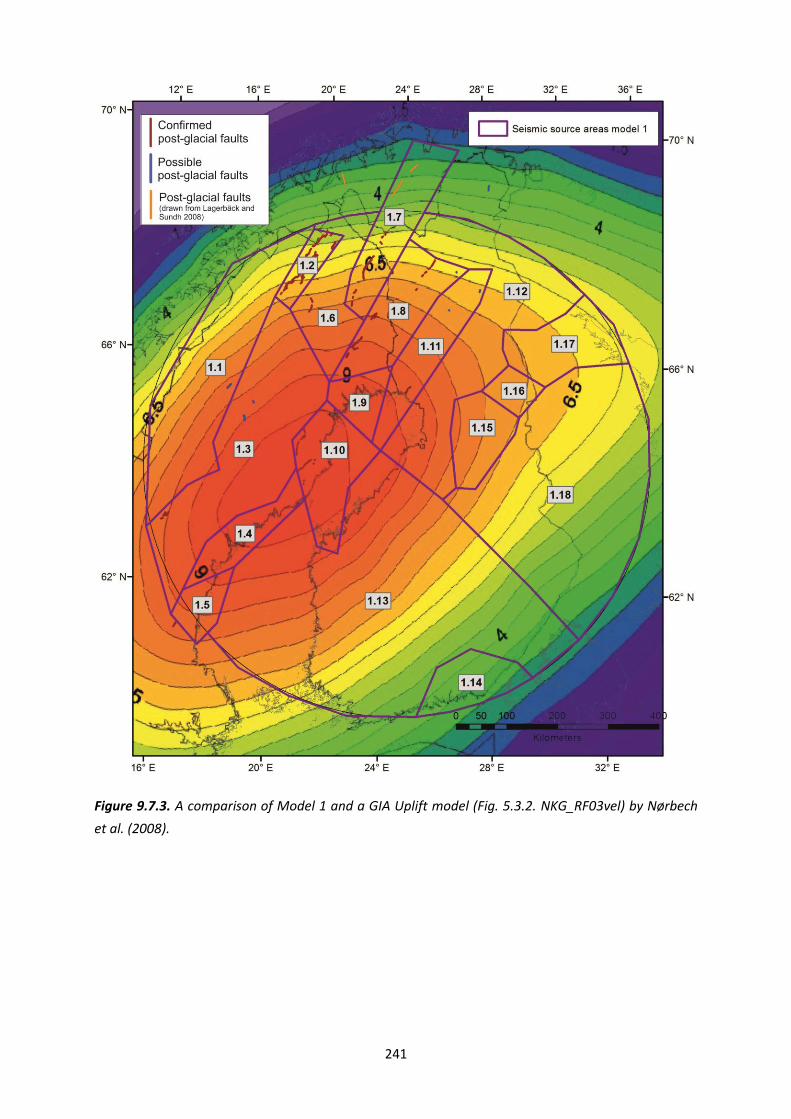
241
Figure 9.7.3. A comparison of Model 1 and a GIA Uplift model (Fig. 5.3.2. NKG_RF03vel) by Nørbech
et al. (2008).
242
10 Conclusions
A. Korja
The compiled database is digital and upgradable and fulfills the formal database requirements of
IAEA. The data and results are accessible for future projects and inspections. Each geological and
geophysical dataset is internally of uniform quality over the entire study area. Overlapping data
across national borders have been cross-checked and as consequence anomalies along and across
the national border zone are easier to interpret. Because the datasets are in a GIS database it is
possible directly to compare the data and draw new conclusions.
We conclude that the existing marine acoustic data sets should only be used at regional scale (1: 1M)
studies.
The updated seismicity catalogue is more complete and its location precision is better than that of
the FENCAT catalogue. We conclude that the new seismic catalogue is well-suited for earthquake
studies and hazard estimations, provided that the magnitudes are homogenized prior to the
calculations.
Most occurrences of very large (paleo)earthquakes in the study region have been dated to have
taken place shortly after the deglaciation, thus belonging to a stress regime different from that of
today. It is an open question whether other large (paleo)earthquakes have occurred in the study area
more recently.
Lithotectonic unit approach emphasizes the effect of orogenies on the structural development of the
terranes and stresses the importance of orogenic folding and faulting as source of structures that can
be later reactivated in the current stress field. The classification overlooks the possibility that
precollisional rift structures could be inverted and later be reactivated in following orogenies and
during the current stress field. The changes in seismicity patterns are not associated with
lithotectonic boundaries except at the western boundaries of the Mesoproterozoic units and at
Norbotten-Karelia contact.
The seismically active areas are located in areas with thin to normal thickness crust (<50 km). Where
the crustal thickness change is trending in NE-SW direction, like in western flank of Bothnian Sea and
Auho-Kandalaksha fault zone, the gradient seems to be associated with a zone of increased
seismicity.
It is suggested that seismically active Western Lapland fault system is underlain by an inverted rift
system which may have inherited its elastic properties from the Paleoporpterozoic rifting phase. The

243
relationships between precollisional inverted rift structures of the lower crust, the Western Lapland
fault system and orthogonal PGF faulting should be studied more carefully before any final
conclusions. We suggest that the wide range of fault plane solutions documented within the Pärvie
Fault could be signaling the movement of a complex thrust system. The implied link between
inverted rift structures and the increased seismicity of the Kuusamo area and Hirvaskoski and Auho
deformation zones deformation zones could be a topic of further studies.
Earthquakes in the study area are generally small and there are roughly 2 magnitude ≥ 3 events per
year. The seismicity in the study area is clustered along NE–SW-trending zones that are parallel to the
Norwegian margin and the opening of the Atlantic Ocean along the Mid-Atlantic ridge. Based on a
subset of the most recent earthquake data (2000-2012), the majority of the earthquakes (80%) occur
in the upper crust down to 17 km in depth, a minority (19%) in the middle crust (17-31 km) and only
a few in the lower crust 31-45 km (1%). Our results support the observation by Kaikkonen et al.
(2000) that the seismogenic layer stretches to the depths of about 30 km in Finland. We suggest that
the middle-lower crustal boundary may add compositional and rheological constraints to the
thickness of seismogenic zone in the study area. Furthermore, it is suggested that the upper-middle
and middle-lower crustal boundaries that have acted as décollement surfaces in the past, still control
the depth extent of fault zones and thus limit the depth extent of present seismicity.
The major source of seismicity is the opening of the Atlantic. Local sources such as post-glacial
rebound or local changes in topography or crustal thickness are only secondary sources. The
relationship between post-glacial rebound and seismicity patterns is problematic and not easy to
solve. First of all, the known PGFs are not parallel to the isolines of the rebound ellipsoid. We note,
however, that the zones of increased seismicity in the western flank of the Gulf of Bothnia are
parallel and along the long axes of the GIA anomaly (Fig. 5.3.3.). The elongation axis of GIA ellipsoid is
parallel to the Norwegian margin and opening of the Atlantic and thus inherited from previous
tectonic processes. The direction of the long axes of the ellipsoid is orthogonal to and the short axis
is parallel to the maximum horizontal stress in Fennoscandia stemming from the opening of the
Atlantic. It seems that plate boundary forces, GIA and seismicity have complex interwoven
relationships that should be subjected to futher studied in the future.
The three seismic source area models (Models 1, 2 and 3) are related because: 1) Seismicity is linked
to reactivation of old faults in the present stress field. 2) Post-glacial faults are associated with
reactivation of old faults. 3) Topography is influenced by the structure and composition of the
Precambrian bedrock. 4) The current tectonic stress field might be influenced by the structure of the
Precambrian bedrock.

244
The models are similar in that the majority of the polygons are overlapping in shape and size for the
most parts. Some discrepancies are found on the margins. Most of the minor differences between
the models are found in the Bay of Bothnia where structural control of neither the Precambrian
faults nor the PGFs or bathymetry is optimal and the seismic location accuracy is the poorest.
Although the Models 1-3 have been designed by two different expert groups, they resemble each
other. They have many similarities and only minor differences, which adds to the credibility of the
models. Because the models are based on a larger amount of additional data, the Models 1-3 are as
reliable, if not more, when compared to previous source area models of the area. Although the
source area Models 1-3 are more detailed than SHARE - the recently published global scale source
area model for EUROPE, they share the same overall geometry in large scale.
The distribution of Model polygon boundaries are aligned with the major tectonic boundaries
presented in Redfield and Osmundsen (2013). The western polygons could be classified as located in
the hinterland of the Scandes, the high seismicity polygons overlap with the hinterland-break-in-
slope and the eastern blocks are located with the craton part. The seismicity zone is located in close
proximity to the western boundary of the Bay of Bothnia basin that was active already in the
Mesoproterozoic and maybe even earlier.
Acknowledgements:
We are grateful for fruitful discussions during the Fennovoima seismotectonics workshops. The
report was greatly improved by the through reviews by the project management group members:
Jari Puttonen, Juho Helander and Jouni Saari and the external review group members: David Whipp,
Andrej Kijco and Olav Eklund. We also thank Kati Oinonen for her help in drafting the figures and in
final editing of the manuscript.

245
11 References
Agnew, D.C. & Sieh, K.E., 1978. A documentary study of the felt effects of the great California
earthquake of 1857. Bull Seismol Soc Am 68(6), 1717–1729.
Ahjos, T. & Uski, M., 1992. Earthquakes in northern Europe in 1375-1989. Tectonophysics, 207, 1-23.
Airo, M.-L., 1999. Aeromagnetic and petrophysical investigations applied to tectonic analysis in the northern Fennoscandian shield. Geol. Surv. Finl., Rep. Invest. 145. 51 pp.
Airo, M.-L., Leväniemi, H. & Valjus, T., 2011a. Geofysikaalisten aineistojen tulkinta. Geologian tutkimuskeskus, Etelä-Suomen yksikkö, raportti 21.3.2011, 24 s. (Fennovoiman arkistotunnus RE-02-0000092)
Airo, M.-L., Hautaniemi, H., Korhonen, J. V., Kurimo, M. & Leväniemi, H., 2011b. Airborne geophysical data management and interpretation. In: Nenonen, K. and Nurmi, P. A. (eds.) 2011. Geoscience for Society : 125th Anniversary Volume. Geological Survey of Finland, Special Paper 49: 349-358.
Alanen U., Alvi, K., Hämäläinen J., Kaskela A. & Rantataro J., 2013. Pyhäjoen Hanhikiven edustan merialueen akustis-seismiset tutkimukset 2012. Geologian tutkimuskeskus, tilaustyöraportti 18.1.2013, 13 s. (Fennovoiman arkistotunnus AG-00-0000217)
Alekseev, M.N., 1996. Possible 'Cromerian Complex' equivalent sequences in the Russian Plain. In: Turner, C. (ed.) The early Middle Pleistocene in Europe. 273-277. Balkema, Rotterdam.
Alm, E., Sundblad, K. & Huhma, H., 2005. Sm-Nd isotope determination of low-temperature fluorite-calcite-galena mineralization in the margins of the Fennoscandian Shield. Swedish Nuclear Fuel and Waste Management Company, SKB Report R-05-66, 68 pp. http:/www.skb.se/publications.
Ambraseys, N.N., 1985. The seismicity of western Scandinavia. Earthquake Engineering Structural
Dynamics 13, 361399.
Anderson, E.M., 1951. The dynamics of faulting, Oliver & Boyd, Edinburgh. 206 p.
Andersson, U.B., 2001. An overview of the geochemical evolution in the Mesoproterozoic (1.58–1.50 Ga) anorogenic complexes of central Sweden. Zeitschrift für Geologische Wissenschaften 29, 455–470.
Andrén, T., Björck, S., Andrén, E., Conley, D., Zillén, L. & Anjar, J., 2011. The Development of the Baltic Sea Basin During the Last 130 ka. In: Harff, J., Björck, S. & Hoth, P. (Eds.) The Baltic Sea Basin, Central and Eastern European Development Studies (CEEDES), Springer-Verlag, Berlin Heidelberg, 75–95.
Artemieva, I.M., 2009. The continental lithosphere: reconciling thermal, seismic, and petrologic data. Lithos 109 (1–2), 23–46.
Artemieva, I.M. & Thybo, H., 2013. EUNAseis: A seismic model for Moho and crustal structure in Europe, Greenland, and the North Atlantic region. Tectonophysics. TECTO-126005 (in press).
Artemieva, I.M., Thybo, H. & Kaban, M.K., 2006. Deep Europe today: geophysical synthesis of the upper mantle structure and lithospheric processes over 3.5 Ga In: GEE, D. G. & STEPHENSON, R. A. (eds) 2006. European Lithosphere Dynamics. Geological Society, London, Memoirs, 32, 11–41.
Arvidsson, R., 1996. Fennoscandian earthquakes: Whole crustal rupturing related to postglacial rebound. Science 274, 744–746.
246
Arvidsson, R. & Kulhanek, O., 1994. Seismodynamics of Sweden deduced from earthquake focal mechanisms. Geophys. J. Int., 16, 377–392.
Arvidsson R. and Grünthal G. and the SHARE Working Group on the Seismic Source Zone Model (2010). D3.1 – Compilation of existing regional and national seismic source zones. 20 p. http://www.share-eu.org/sites/default/files/D3.1_SHARE.pdf
Assinovskaya, B.A., 1986. Focal mechanisms for earthquakes in the north-eastern part of the Baltic Shield. Izvestiya, Earth Physics, Vol. 22, No. 1, 73-75.
Astakhov, V., 2004. Middle Pleistocene glaciations of the Russian North. Quaternary Science Reviews 23, 1285-1311.
Atakan, K., Lindholm, C.D. & Havskov, J., 1994. Earthquake swarm in Steigen, northern Norway: an unusual example of intraplate seismicity. Terra Nova 6, 180-194.
Axberg, S., 1980. Seismic stratigraphy and bedrock geology of the Bothnian Sea, northern Baltic. Stockholm Contributions in Geology 36(3), 153–213.
BABEL Working Group, 1990. Evidence for Early Proterozoic plate tectonics from seismic reflection profiles in the Baltic Shield. Nature 348, 34–38.
BABEL Working Group, 1993. Integrated seismic studies of the Baltic Shield using data in the Gulf of Bothnia region. Geophysical Journal International 112, 305–324.
Baluev, A.S. 2006. Geodynamics of the Riphean Stage in the Evolution of the Northern Passive Margin of the East European Craton. Geotectonics 40, 3, 183–196.
Bauer, T.E., Skyttä, P., Weihed, P. & Allen, R., 2011. Syn-extensional faulting controlling structural inversion – Insights from the Paleoproterozoic Vargfors syncline, Skellefte mining district, Sweden. Precambrian Research 191, 166–183.
Bergman, S., Kübler, L. & Martinsson, O., 2001. Description of regional geological and geophysical maps of northern Norrbotten county (east of the Caledonian orogen). Geological Survey of Sweden Ba 56, 110 pp.
Bergman, S., Billström, K., Persson, P.-O., Skiöld, T. & Evins, P., 2006. U-Pb age evidence for repeated Palaeoproterozoic metamorphism and deformation near the Pajala shear zone in the northern Fennoscandian shield. GFF 128, 7–20.
Bergman, S., Stephens, M.B., Andersson , J., Kathol, B., & Bergman, T., 2012. Bedrock map of Sweden, scale 1:1 million. Geological Survey of Sweden K 423.
Berthelsen, A. & Marker, M., 1986. 1.9– 1.8 Ga old strike-slip megashears in the Baltic Shield, and their plate tectonic interpretation. Tectonophysics 128, 163–181.
Bingen, B., Andersson, J., Söderlund, U. & Möller, C., 2008. The Mesoproterozoic in the Nordic countries. Episodes 31, 29–34.
Björck, S., 1995. A review of the history of the Baltic Sea, 13.0–8.0 ka BP. Quaternary International 27, 19–40.
Björck, S., 2008. The late Quaternary development of the Baltic Sea basin. In: The BACC Author Team (Eds.) Assessment of climate change for the Baltic Sea Basin. Springer-Verlag, Berlin Heidelberg, 398–407
Brown, M., 2009. Metamorphic patterns in orogenic systems and the geological record. In: P.A. Cawood & A. Kröner (eds.), Earth Accretionary Systems in Space and Time. Geological Society London Special Publications 318, 37–74.
Brown, D., Spadea, P., Puchkov, V., Alvarez-Marron, J., Herrington, R., Willner, A.P., Hetzel, R., Gorozhanina, Y. & Juhlin, C., 2006. Arc-continent collision in the Southern Urals. Earth-Sci.Rev. 79, 261-287.

247
Bungum, H. & Fyen, J., 1979. Hypocenter distribution, focal mechanisms, and tectonic implications of
Fennoscandian earthquakes, 19541978. Geologiska Föreningens i Stockholm Förhandlingar 101, 261-273.
Bungum, H. & Lindholm, C., 1996. Seismo- and neotectonics in Finnmark, Kola and the southern Barents sea: 2. Seismological analysis and seismotectonics. Tectonophysics 270, 15– 28.
Bungum, H., Hokland, B.K., Husebye, E.S. & Ringdal, F., 1979. An exceptional intraplate earthquake sequence in Meloy, northern Norway. Nature, 280, 32-35.
Bungum, H., Vaage, S. & Husebye, E., 1982. The Meloy earthquake sequence, northern Norway: source parameters and their scaling relations. Bull. Seismol. Soc. Am. 72, 197-206.
Bungum, H., Olesen, O., Pascal, C., Gibbons, S., Lindholm, C., & Vestøl, O., 2010. To what extent is the present seismicity of Norway driven by post-glacial rebound? Journal of the Geological Society, 167, 373-384.
Byerlee, J.D., 1978. "Friction of rocks". Pure and Applied Geophysics 116 (4–5): 615–626.
Båth, M., 1956. An Earthquake Catalogue for Fennoscandia for the Years 1891-1950. Sveriges Geologiska Undersökning, Ser.C, No.545, Stockholm, Sweden.
Böðvarsson, R. & Lund, B., 2003. The SIL seismological data acquisition system - as operated in Iceland and in Swede. In: T. Takanami and G. Kitagawa (eds.), Methods and Applications of Signal Processing in Seismic Network Operations, Lecture Notes in Earth Sciences, 98, Springer, Berlin.
Böðvarsson, R., Lund, L., Roberts, R. & Slunga, R., 2006. Earthquake activity in Sweden. Study in connection with a proposed nuclear waste repository in Forsmark or Oskarshamn. Swedish Nuclear Fuel and Waste Management Company, SKB Report R-06-67, 40 pp. http:/www.skb.se/publications.
Cai, J., & Grafarend, E.W., 2007. Statistical analysis of geodetic deformation (strain rate) from the space geodetic measurements of BIFROST Project in Fennoscandia. J. Geodyn., 43, 214-238.
Cato, I., 1987. On the definitive connection of the Swedish Time Scale with the present. Sveriges Geologiska Undersökning Ca 68, 55 pp.
Cohen K.M. & Gibbard, P., 2011. Global chronostratigraphical correlation table for the last 2.7 million years. Subcommission on Quaternary Stratigraphy (International Commission on Stratigraphy), Cambridge, England.
Corfu, F. & Evins, P.M., 2002. Late Palaeoproterozoic monazite and titanite U-Pb ages in the Archaean Suomujärvi Complex, N-Finland. Precambrian Research 116, 171–181.
Daly, J.S., Balagansky, V.V., Timmerman, M.J. & Whitehouse, M.J., 2006. The Lapaland-Kola orogen: Palaeoproterozoic collision and accretion of the northern Fennoscandian lithosphere. In: D.G. Gee & R.A. Stephenson (eds.), European lithosphere Dynamics. Geological Society London Memoirs 32, 579–598.
Deutsch, A., Buhl, D. & Langenhorst, F., 1992. On the significance of crater ages: new ages for Dellen (Sweden) and Araguainha (Brazil). Tectonophysics 216, 205–218.
Donner, J., 1995. The Quaternary History of Scandinavia. Cambridge University Press, Cambridge, 200pp
Downes, G.L., 2004. Procedures and tools used in the investigation of New Zealand’s historical earthquakes. Ann Geophys 47(2–3), 399–419.
Drake, H., Tullborg, E.-L. & Page, L., 2009. Distinguished multiple events of fracture mineralization related to far-field orogenic effects in Paleoproterozoic crystalline rocks, Simpevarp area, SE Sweden. Lithos 110, 37–49.

248
Dypvik, H., Plado, J., Heinberg, C., Håkansson, E., Pesonen, L.J. & Raiskila S., 2008. Impact structures and events – a Nordic perspective. Episodes 31(1), 107–114.
Ehlers J. & Gibbard, P.L., 2011. Quaternary glaciation. In: Singh, V.P., Singh, P. & Haritashya, U.K. (Eds.) Encyclopedia of Snow, Ice and Glaciers. Springer: Berlin. 1st edition., 2011, XLVI, 1254 p. 659.
Ehlers, C., Lindroos, A. & Selonen, O., 1993. The late Svecofennian granite-migmatite zone of southern Finland - a belt of transpressive deformation and granite emplacement. Precambrian Research 64, 295-309.
Ehlers, J., Gibbard, P.L. & Hughes, P.D., 2011. Chapter 1 - Introduction. Developments in Quaternary Sciences. Quaternary Glaciations - Extent and Chronology. A Closer Look. Volume 15, Pages 1–14.
Ehrenheim, V., 1824. Om climaternas rörlighet. Tal hållet vid Praesidii nedläggande uti Kongl. Vetenskaps Akademien. 208 pp. Stockholm.
Elminen, T., Lohva, J. & Härmä, P., 2008, Ydinvoimalaitoksen mahdollisten sijoituspaikkojen geologiset esiselvitykset, Etelä-Suomen yksikkö, raportti 13.10.2008, 78 s.
Elo, S., 1991a. Geophysical features indicating deep fractures in the Kuusamo area. Geol. Surv. Finland, Spec. Paper 13, 27–37.
Elo, S., 1991b. Geophysical indications of deep fractures in the Näränkävaara-Syöte and Kandalaksha-Puolanka zones. Geol. Surv. Finland, Spec. Paper 13, 43–50.
Elo, S., 1997. Interpretations of the gravity anomaly map of Finland. In: Pesonen, L. J. (ed.) The lithosphere in Finland - a geophysical perspective. Geophysica 33 (1), 51-80.
Elo, S. & Pirttijärvi, M., 2013. The effect of lateral density variations on the state of stress in the uppermost crust in Finland, International Journal of Rock Mechanics and Mining Sciences, 63, 131-137.
Elo, S. & Sipola, V., 2003. Digitaalisten korkeusmallien käytöstä painovoimamittausten käsittelyssä. In: Hyvönen E. & Sandgren E. (Eds.) Sovelletun geofysiikan XIV neuvottelupäivät, Rovaniemi, hotelli Pohjanhovi 4. - 5.11.2003 abstraktikokoelma, Vuorimiesyhdistys, Sarja B. 81 pages, in Finnish, ISBN 952-9618-51-4
Erlström, M. & Sivhed, U., 2001. Intra-cratonic dextral transtension and inversion of the southern Kattegat on the southwest margin of Baltica – Seismostratigraphy and structural development. Geological Survey of Sweden C 832, 33 pp.
Evins, P.M. & Laajoki, K., 2002. Early Proterozoic nappe formation: an example from Sodankylä, Finland, Northern Baltic Shield. Geological Magazine 139, 73-87.
Fejerskov, M. & Lindholm, C.D., 2000. Crustal stress in and around Norway; an evaluation of stress-generating mechanisms. In Nøttvedt. A. (ed.): Dynamics of the Norwegian margin, Geological Society, London, Special Publications 167, 451-467.
Fjeldskaar, W., Lindholm, C., Dehls, JF. & Fjeldskaar, I., 2000. Postglacial uplift, neotectonics and seismicity in Fennoscandia. Quaternary Science Reviews 19, 1413-1422.
Fossen, H., 2010. Structural Geology. Cambridge University Press, Cambridge. 463 p.
Fredén, C. (ed.), 2002. Berg och jord. Sveriges nationalatlas. Third edition,. 208 pp.
Gaál, G., 1980. Geological setting and intrusion tectonics of the Kotalahti nickel-copper deposit, Finland. Bulletin of the Geological Society of Finland 52, 101-128.
Gaál, G., 1982. Proterozoic tectonic evolution and late Svecokarelian plate deformation of the Central Baltic Shield. Geologisch Rundschau 71, 158–170.

249
Gaál, G. & Gorbatschev, R., 1987. An outline of the Precambrian evolution of the Baltic Shield. Precambrian Research 35, 15–52.
Gaál, G., Berthelsen, A., Gorbatschev, R., Kesola, R., Lehtonen, M.I., Marker, M. & Raase, P., 1989. Structure and composition of the Precambrian crust along the POLAR Profile in the northern Baltic Shield. In: Freeman, R., von Knorring, M., Korhonen, H., Lund, C., Mueller, St. (Eds.) The European Geotraverse, Part 5: The POLAR Profile. Tectonophysics 162, 1-25.
Gee, D.G., 1975. A tectonic model for the central part of the Scandinavian Caledonides. American Journal of Science 275A, 468–515.
Gee, D.G., Bogolepova, O.K. & Lorenz, H., 2006. The Timanide, Caledonide and Uralide Orogens in the Eurasian high Arctic, and relationships to the palaeo-continents Laurentia, Baltica and Siberia. In: D. Gee, R. Stephenson (Eds.) European Lithosphere Dynamics, Geological Society, London, Memoirs, 32, 507-520.
Gee, D.G., Juhlin, C., Pascal, C. & Robinson, P., 2010. Collisional Orogeny in the Scandinavian Caledonides (COSC). Geologiska Föreningens i Stockholm Förhandlingar 132, 29–44.
Ghosh, A., Holt, W.E. & Flesch, L.M., 2009. Contribution of gravitational potential energy differences to the global stress field. Geophys. J. Int. 179, 787-812.
Giardini, D., Woessner, J., Danciu, L., Valensise, G., Grünthal, G., Cotton, F., Akkar, S., Basili, R., Stucchi, M., Rovida, A., Stromeyer, D., Arvidsson, R., Meletti, F., Musson, R., Sesetyan, K., Demircioglu, M.B., Crowley, H., Pinho, R., Pitilakis, K., Douglas, J., Fonseca, J., Erdik, M., Campos-Costa, A., Glavatovic, B., Makropoulos, K., Lindholm, C. & Cameelbeeck, T., 2013. Seismic Hazard Harmonization in Europe (SHARE): Online Data Resource, http://portal.share-eu.org:8080/jetspeed/portal/, doi: 10.12686/SED-00000001-SHARE, 2013.
Gibbard, P. & Cohen K.M., 2008. Global chronostratigraphical correlation table for the last 2.7 million years. Episodes, 31, No.2, 243-247.
Gibbard, P. & Head, M.J., 2009 The definition of the Quaternary System/Period and the Pleistocene Series/Epoch. Quaternaire 20, 125-133.
GLOBE Task Team and others (Hastings, David A., Paula K. Dunbar, Gerald M. Elphingstone, Mark Bootz, Hiroshi Murakami, Hiroshi Maruyama, Hiroshi Masaharu, Peter Holland, John Payne, Nevin A. Bryant, Thomas L. Logan, J.-P. Muller, Gunter Schreier & John S. MacDonald), eds., 1999. The Global Land One-kilometer Base Elevation (GLOBE) Digital Elevation Model, Version 1.0. National Oceanic and Atmospheric Administration, National Geophysical Data Center, 325 Broadway, Boulder, Colorado 80305-3328, U.S.A.
Grad, M., Tiira, T. & ESC Working Group, 2009. The Moho depth map of the European Plate. Geophys. J. Int. 176, 279–292.
Gregersen, S., Korhonen, H. & Husebye, E.S., 1991. Fennoscandian dynamics: Presentday earthquake
activity. Tectonophysics 189, 333344.
Gregersen, S., Wiejacz, P., Dębski, W., Domanski, B., Assinovskaya, B., Guterch, B., Mäntyniemi, P., Nikulin, V.G., Pacesa, A., Puura, V., Aronov, A.G., Aronova, T.I., Grünthal, G., Husebye, E.S. & Sliaupa, S., 2007. The exceptional earthquakes in Kaliningrad district, Russia on September
21, 2004. Physics of the Earth and Planetary Interiors 164: 6374.
Greiling, R.O., Garfunkel, Z. & Zachrisson, E., 1998. The orogenic wedge in the central Scandinavian Caledonides: Scandian structural evolution and possible influence on the foreland basin. In: Sundquist, B & Stephens, M.B. (eds.), Tectonics and Geological History of some Phanerozoic Orogens. GFF 120, 181–190.
Grünthal, G., (Ed.) 1998. European Macroseismic Scale 1998. Cahiers du Centre Européen de Géodynamique et de Séismologie 15, Luxembourg.

250
Grünthal, G. & the GSHAP Region 3 Working Group, 1999. Seismic Hazard Assessment for Central, North and Northwest Europe: GSHAP Region 3. Annali di Geofisica 42, 999-1011. http://www.seismo.ethz.ch/static/gshap/ceurope/report.html
Gudmundsson, A., 1999. Postglacial crustal doming, stresses and fracture formation with application to Norway. Tectonophysics 307,407-419.
Gölke, M. & Coblentz, D., 1996. Origins of the European regional stress field. Tectonophysics, 266, 11-24.
Halden, N.M., 1982. Structural, metamorphic and igneous history of migmatites in the deep levels of a wrench fault regime, Savonranta, eastern Finland. Transactions of the Royal Society of Edinburgh: Earth Sciences 73, 17-30.
Hanski, E., 1997. The Nuttio serpentinite belt, Central Lapland: An example of Paleoproterozoic ophiolitic mantle rocks in Finland. Ofioliti 22, 35-46.
Hasegawa, H. S., Adams, J. & Yamazaki, K., 1985. Upper Crustal stresses and vertical stress migration in eastern Canada. Journal of Geophysical Researc,. 90(B5), 3637-3648.
Haudenschild, U., 1988. K-Ar age determination on biotite and muscovite in the Pihtipudas‒Iisalmi and Joroinen areas, eastern Finland. In: Korsman, K. (Ed.) Tectono-metamorphic evolution of the Raahe‒Ladoga zone. Geological Survey of Finland, Bulletin 343, 33-50.
Haudenschild, U., 1995. The Vaaraslahti pyroxene granitoid intrusion and its contact aureole: isotope geology. In: Hölttä, P. (Ed.) Relationship of granitoids, structures and metamorphism at the eastern margin of the Central Finland Granitoid Complex. Geological Survey of Finland, Bulletin 382, 81-89.
Hautaniemi, H., Kurimo, M., Multala, J., Leväniemi. H. & Vironmäki, J., 2005. The “Three In One” aerogeophysical concept of GTK in 2004. In Airo, M.-L. (Ed): Geological Survey of Finland, Special Paper 39, 21–74.
Heidbach, O., Tingay, M., Barth, A., Reinecker, J., Kurfeß, D. & Müller, B., 2008. The World Stress Map database release 2008. doi:10.1594/GFZ.WSM.Rel2008, 2008. Database last accessed 15th of June 2013 at: http://www.world-stress-map.org
Heinonen, A., 2012. Isotopic evidence for the origin of Proterozoic massif-type anorthosites and their relation to rapakivi granites in southern Finland and northern Brazil Department of Geosciences and Geography A; no. A18. 44 p.
Henderson, J., 1991. An estimate of the stress tensor in Sweden using earthquake focal mechanisms. Tectonophysics 192, 231-244.
Henkel, H. & Pesonen, L.J., 1992. Impact craters and craterform structures in Fennoscandia. Tectonophysics 216, 31–40.
Hermansson, T., Stephens, M.B., Corfu, F., Page, L.M. & Andersson, J., 2008. Migratory tectonic switching, western Svecofennian orogen, central Sweden: Constraints from U/Pb zircon and titanite geochronology. Precambrian Research 161, 250–278.
Hicks, E.C., Bungum, H. & Lindholm, C.D., 2000a. Seismic activity, inferred crustal stresses and seismotectonics in the Rana region, Northern Norway. Quaternary Science Reviews 19, 1423-1436.
Hicks, E.C., Bungum, H. & Lindholm, C.D., 2000b. Stress inversion of earthquake focal mechanism solutions from onshore and offshore Norway. Norsk Geologisk Tidsskrift, 80, pp. 235–250
Hietanen, A., 1975. Generation of potassium-poor magmas in the northern Sierra Nevada and the Svecofennian of Finland. U.S. Geological Survey Journal of Research 3, 631–645.
Hirvas, H., 1991. Pleistocene stratigraphy of Finnish Lapland. Geological survey of Finland Bulletin 354, 123pp.
251
Hiärne, U.L., 1706. Den korta anledningen, til åthskillige malm och bergarters, mineraliers och jordeslags &c. efterspörjande och angifwande. Del 2: Den beswarade och förklarade anledningens andra flock, om jorden och landskap i gemen. Stockholm, tryckt af Mich.
Laurelio, 133416.
Husebye, E.S. & Kebeasy, T.R.M., 2004. A re-assessment of the 31st of August 1819 Lurøy earthquake
– Not the largest in NW Europe. Norwegian Journal of Geology 84, 5766.
Husebye, E.S., Bungum, H., Fyen, J. & Gjøystdal, H., 1978. Earthquake activity in Fennoscandia
between 1497 and 1975 and intraplate tectonics. Nor. Geol. Tidsskr. 58, 5168.
Hutri, K.-L., Heinsalu, A., Kotilainen, A.T. & Ojala, A.K.E., 2007. Dating early Holocene palaeoseismic event(s) in the Gulf of Bothnia, Baltic Sea. Boreas, 36, 56-64.
Högdahl, K. & Sjöström, H., 2001. Evidence for 1.82 Ga transpressive shearing in a 1.85 Ga granitoid in central Sweden: implications for the regional evolution. Precambrian Research 105, 37–56.
Högdahl, K., Sjöström, H., Andersson. U.B. & Ahl, M., 2008. Continental margin magmatism and migmatisation in the west-central Fennoscandian Shield. Lithos 102, 435–459.
Högdahl, K., Sjöström, H. & Bergman, S., 2009. Ductile shear zones related to crustral shortening and domain boundary evolution in the central Fennoscandian Shield. Tectonics 28 (TC1003, doi:10.1029/2008TC002277), 18 pp.
Högdahl, K., Majka, J., Sjöström, H., Persson Nilsson K., Claesson, S. & Konecný P., 2011. Reactive monazite and robust zircon growth in diatexites and leucogranites from a hot, slowly cooled orogen: implications for the Palaeoproterozoic tectonic evolution of the central Fennoscandian Shield, Sweden. Contributions to Mineralogy and Petrology, 22 pp.
Hölttä, P., Väisänen, M., Väänänen, J. & Manninen, T., 2007. Paleoproterozoic metamorphism and deformation in Central Lapland, Finland. In: Ojala, V.J. (Ed.) Gold in the Central Lapland Greenstone Belt, Finland. Geological Survey of Finland, Special Paper 44, 7-56.
Hölttä, P., Balagansky, V., Garde, A.A., Mertanen, S., Peltonen, P., Slabunov, A., Sorjonen-Ward, P. & Whitehouse, M., 2008. Archaean of Greenland and Fennoscandia. Episodes 31, 13–19.
International Atomic Energy Agency (IAEA), 2010. Seismic hazards in site evaluation for nuclear installations. Specific safety guide SSG-9, Vienna, 60 pp.
IOC, IHO & BODC, 2003. Centenary Edition of the GEBCO Digital Atlas, published on CD-ROM on behalf of the Intergovernmental Oceanographic Commission and the International Hydrographic Organization as part of the General Bathymetric Chart of the Oceans, British Oceanographic Data Centre, Liverpool, U.K.
Jakobsson, M., Björck, S., O'Regan, M., Flodén, T., Greenwood, S.L., Swärd, H., Lif, A., Ampel, L.,Koyi, H. & Skelton, A., 2014. Major earthquake at the Pleistocene-Holocene transition in Lake Vättern, southern Sweden. Geology. doi:10.1130/G35499.1
Janik T., Kozlovskaya, E., Heikkinen, P., Yliniemi, J. & Silvennoinen, H., 2009. Evidence for preservation of crustal root beneath the Proterozoic Lapland-Kola orogen in the northern Fennoscandian shield derived from P- and S- wave velocity models of POLAR and HUKKA wide-angle reflection and refraction profiles and FIRE4 reflection transect, J. Geophys. Res. 114, B06308, doi:10.1029/2008JB005689.
Johansson, K. & Ransed, G., 2003. Map of the Quaternary deposits 23H Stensele, scale 1:100 000. Sveriges geologiska undersökning, Ak 43.
Johansson, J.M., Davis, J.L., Scherneck, H.-G., Milne, G.A., Vermeer, M., Mitrovica, J.X., Bennett, R.A., Jonsson, B., Elgered, G., Elósegui, P., Koivula, H., Poutanen, M., Rönnäng, B.O. & Shapiro, I.I., 2002. Continuous GPS measurements of postglacial adjustment in Fennoscandia, 1. Geodetic Results. J. Geophys. Res., Vol. 107, Issue B8, ETG 3-1-ETG 3-27.

252
Johannson, P., Lunkka, J.-P. & Sarala, P., 2011. Chapter 9 - The Glaciation of Finland. Developments in Quaternary Sciences. Quaternary Glaciations - Extent and ChronologyA Closer Look. Volume 15, Pages 105–116.
Jones, A.G.., Plomerova, J., Korja, T., Sodoudi, F. & Spakman, W., 2010. Europe from the bottom up : a statistical examination of the central and northern European lithosphere-asthenosphere boundary from comparing seismological and electromagnetic observations. Lithos 120 (1-2), 14-29.
Juhlin, C. & Cosma C., 2007. A 3D surface seismic pilot study at Olkiluoto, Finland: Acquisition and processing report. Eurajoki, Finland: Posiva Oy. Working Report 2007-65. 47 p.
Jules Verne Voyager, 2011. http://jules.unavco.org/Voyager/ILP_GSRM Last accessed 20th of October 2013.
Kaikkonen, P., Moisio, K. & Heeremans, M., 2000. Thermomechanical lithospheric structure of the central Fennoscandian Shield. Phys. Earth Planet. Inter., 119, 209-235.
Kathol, B. & Weihed, P. (eds.), 2005. Description of regional geological and geophysical maps of the Skellefte District and surrounding areas. Geological Survey of Sweden Ba 57, 197 pp.
Kebeasy, T.R.M. & Husebye, E.S., 2003. Revising the 1759 Kattegat earthquake questionnaires using synthetic wavefield analysis. Physics of the Earth and Planetary Interiors 139, 269-284.Keefer, D.K., 2002. Investigating landslides caused by earthquakes - A historical review. Surveys in
Geophysics 23, 473-510.
Kjellén, R., 1903. Meddelanden om jordstötar i Sverige före 1846. Geologiska Föreningens i
Stockholm Förhandlingar 25, pp. 129170, 191228.
Kijko, A., Skordas, E., Wahlström, R. & Mäntyniemi, P., 1993. Maximum likelihood estimation of
seismic hazard for Sweden. Natural Hazards 7: 4157.
Kim, W.-Y., Kulhánek, O., van Eck, T. & Wahlström, R., 1985. The Solberg, Sweden, Earthquake of September 29, 1983. Report No.1-85, Seismological Department, University of Uppsala, Sweden, ISSN 0280-3070
Kohonen, J., 1995. From continental rifting to collisional shortening - Paleoproterozoic Kaleva metasediments of the Höytiäinen area in North Karelia, Finland. Geological Survey of Finland, Bulletin 380, 79 pp.
Kohonen, J. & Rämö, O.T., 2005. Sedimentary rocks, diabases, and late cratonic evolution. In: Lehtinen, M., Nurmi, P. and Rämö, T. (Eds.) The Precambrian Bedrock of Finland - Key to the evolution of the Fennoscandian Shield. Elsevier Science B.V, 563-604.
Koistinen, T., 1981. Structural evolution of an early Proterozoic strata-bound Cu-Co-Zn deposit, Outokumpu, Finland. Transactions of the Royal Society of Edinburgh, Earth Sciences 72, 115-158.
Koistinen, T. (Ed.) 1994. Precambrian basement of the Gulf of Finland and surrounding area 1 : 1 000 000. Geological Survey of Finland.
Koistinen, T., Stephens, M.B., Bogatchev, V., Nordgulen, Ø., Wennerström, M. & Korhonen, J., 2001. Geological map of the Fennoscandian Shield, scale 1 : 2 000 000. Geological Surveys of Finland, Norway and Sweden and the North-West Department of Natural Resources of Russia.
Korhonen, J. V., Aaro, S., All, T., Elo, S., Haller, L. Å., Kääriäinen, J., Kulinich, A., Skilbrei, J. R., Solheim, D., Säävuori, H., Vaher, R., Zhdanova, L. & Koistinen, T., 2002a. Bouguer anomaly map of the Fennoscandian Shield: IGSN 71 gravity system, GRS80 normal gravity formula. Bouguer density 2670 kg/m³, terrain correction applied. Anomaly continued upwards to 500 m above ground: scale 1:2 000 000.

253
Korhonen, J.V., Aaro, S., All, T., Nevanlinna, H., Skilbrei, J. R., Säävuori, H., Vaher, R., Zhdanova, L. & Koistinen, T., 2002b. Magnetic anomaly map of the Fennoscandian Shield: DGRF-65 anomaly of total field. Anomaly continued upwards to 500 m above ground: scale 1:2 000 000.
Korja, A. & Heikkinen, P.J., 1995. Proterozoic extensional tectonics of the central Fennoscandian Shield: Results from the Baltic and Bothnian Echoes from the Lithosphere experiment. Tectonics 14, 504-517.
Korja, A. & Heikkinen, P.J., 2005. The accretionary Svecofennian orogen – Insight from the BABEL profiles. Precambrian Research 136, 241–268.
Korja, A. & Heikkinen, P.J., 2008. Seismic images of Paleoproterozoic microplate boundaries in the Fennoscandian Shield. In: K.C. Condie & V. Pease (eds.), When did plate tectonics begin on planet Earth? Geological Society of America Special Paper 440, 220–248.
Korja, A., Korja, T., Luosto, U. & Heikkinen, P., 1993. Seismic and geoelectric evidence for collisional and extensional events in the Fennoscandian Shield - implications for Precambrian crustal evolution. Tectonophysics 219, 129-152.
Korja, A., Heikkinen, P. & Aaro, S., 2001. Crustal structure of the northern Baltic Sea palaeorift. Tectonophysics 331, 341-358.
Korja, A., Lahtinen, R., Heikkinen, P., Kukkonen, I.T. & FIRE Working Group, 2006a. A geological interpretation of the upper crust along FIRE 1. In: Kukkonen, I.T. & Lahtinen, R., (Eds.) Finnish Reflection Experiment FIRE 2001-2005. Geological Survey of Finland, Special Paper 43, 45-76.
Korja, A., Lahtinen, R. & Nironen, M., 2006b. The Svecofennian Orogen: a collage of microcontinents and island arcs. In: D. Gee, R. Stephenson (Eds.) European Lithosphere Dynamics, Geological Society, London, Memoirs, 32, 561-578.
Korja, A., Kosunen, P. & Heikkinen, P., 2009. A case study of lateral spreading: the Precambrian Svecofennian Orogen. Geological Society, London, Special Publications 321, 225-251.
Korja, A., Kortström, J., Lindblom, P., Mäntyniemi, P., Uski, M. & Valtonen, O., 2011. Seismisten aineistojen kerääminen ja tulkinta Pyhäjoen alueelta. Tilaustutkimuksen raportti, Seismologian instituutti, HY. 64 p.
Korsman, K. & Glebovitsky, V. (eds.) 1999. Raahe-Ladoga Zone structure-lithology, metamorphism and metallogeny : a Finnish-Russian cooperation project 1996-1999. Map 2: Metamorphism of the Raahe-Ladoga Zone 1:1 000 000. Espoo: Geological Survey of Finland.
Korsman, K., Hölttä, P., Hautala, T. & Wasenius, P., 1984. Metamorphism as indicator of evolution and structure of the crust in Eastern Finland. Geological Survey of Finland, Bulletin 328, 40 pp.
Korsman, K., Koistinen, T., Kohonen, J., Wennerström, M., Ekdahl, E., Honkamo, M., Idman, H. & Pekkala, Y. (Eds.), 1997. Suomen kallioperäkartta– Berggrundskarta över Finland – Bedrock map of Finland 1:1 000 000. Geological Survey of Finland, Espoo, Finland.
Korsman, K., Korja, T., Pajunen, M., Virransalo, P. & GGT/SVEKA Working Group, 1999. The GGT/SVEKA Transect: structure and evolution of the continental crust in the Palaeoproterozoic Svecofennian orogen in Finland, International Geology Review, 41, 287-333.
Kortström, J., Lindblom, P. & Korja, A., 2011. Seismiset asemat TOF ja OUF, Raportti T-83, Seismologian Instituutti, Helsingin Yliopisto, Helsinki, 15 s.
Kortström, J., Uski, M., Tiira, T. & Korja, A., 2012. Data processing and analysis system for the Pyhäjoki seismic network, Report T-86, Institute of Seismology, University of Helsinki. 15 pp.
Koskinen, P., 2013. Orientation of faults and their potential for reactivation in the present stress field in Finland. M.Sc. thesis, University of Helsinki, Finland.
Koskinen, P. and Korja, A. 2014. Orientation of faults in the present stress field – Work Report. Institute of Seismology, University of Helsinki, Report S-60, pp. 24.

254
Kotilainen, A. & Hutri, K-L., 2004. Submarine Holocene sedimentary disturbances in the Olkiluoto area of the Gulf of Bothnia, Baltic Sea: a case of postglacial palaeoseismicity. Quaternary Science Reviews, 23, pp. 1125-1135.
Kousa, J. & Lundqvist, Th., 2000. Svecofennian Domain. In: Lundqvist, Th., Autio, S. (Eds.) Description to the Bedrock Map of Central Fennoscandia (Mid-Norden). Geological Survey of Finland, Special Paper 28, 47-75.
Kreemer, C., Holt, W.E. & Haines, A.J., 2003. An integrated global model of present-day plate motions and plate boundary deformation. Geophys. J. Int., 154, 8-34. Updates on the model at: <http://gsrm.unavco.org/>
Kresten, P., Åhman, E. & Brunfelt, A.O., 1981. Alkaline ultramafic lamprophyres and associated carbonatite dykes from the Kalix area, northern Sweden. Geologische Rundschau 70, 1215–1231.
Kresten, P., Rex, D.C. & Guise P.G., 1997. 40Ar-39Ar ages of ultramafic lamprophyres from the Kalix area, northern Sweden. In Th. Lundqvist (ed.): Radiometric dating results 3. Geological Survey of Sweden C 830, 14–19.
Krogh, T.E., Mysen, B.O. & Davis, G.L., 1974. A Palaeozoic age for the primary minerals of a Norwegian eclogite. Carnegie Institute Washington Yearbook 73, 575–576.
Kuivamäki, A., 1986. Havaintoja Venejärven ja Ruostejärven postglasiaalisista siiroksista. (In Finnish). Abstract: Observations of the Venejärvi and Ruostejärvi postglacial faults. Geol. Surv. Finland, Nuclear Waste Disposal Research Report YST-52. 20 pp.
Kuivamäki, A., Vuorela, P. & Paananen, M., 1998. Indications of postglacial and recent bedrock movements in Finland and Russian Karelia. Geol. Surv. Finland, Nuclear Waste Disposal Research Report YST-99. 92 pp.
Kuivamäki, A., Paananen, M. & Vuorela, P. 2001. Postglacial faults and bedrock movements in Finland. Final report of investigations in 1987-2001. Geological Survey of Finland, Espoo.
Kuivamäki, A., Wennerström, M., Vaarma, M., Härmä, P., Nyholm, T. & Turunen, T., 2011. Simon Karsikon ja Pyhäjoen Hanhikiven mahdollisilla ydinvoimalan sijoitusalueilla ja niiden ympäristössä mahdollisesti tapahtuneiden nuorten (postglasiaalisten) kallioliikuntojen selvittäminen. Vaihe I – kallioperäaineistojen kokoaminen, tulkinta ja analysointi. Geologian tutkimuskeskus, Etelä-Suomen yksikkö, raportti 31.3.2011, 41 s. (Fennovoiman arkistotunnus RE-02-0000093)
Kujansuu, R., 1964. Nuorista siirroksista Lapissa. (Summary: Recent Faulting in Lapland). Geologi 16, 30–36.
Kujansuu, R., 1972. On landslides in Finland Lapland. Geological Survey of Finland, Bulletin 256, 1-22.
Kukkonen, I., 2011. Yhteenvetoraportti postglasiaalisten siirrosten selvityksistä Simon Karsikon ja Pyhäjoen Hanhikiven mahdollisilla ydinvoimalan sijoitusalueilla. Geologian tutkimuskeskus, Etelä-Suomen yksikkö, raportti 24.5.2011, 13 s. (Fennovoiman arkistotunnus RE-02-0000098)
Kukkonen, I.T. & Peltonen, P., 1999. Xenolith-controlled geotherm for the central Fennoscandian Shield: implications for lithosphere-asthenosphere relations. Tectonophysics, 304, 301-315.
Kukkonen, I.T. & Lahtinen, R., (Eds.) 2006. Finnish Reflection Experiment FIRE 2001-2005. Geological Survey of Finland, Special Paper 43, 247 pp.
Kukkonen, I.T., Heikkinen, P., Ekdahl, E., Hjelt, S.-E., Yliniemi, J., Jalkanen, E. & FIRE Working Group, 2006. Acquisition and geophysical characteristics of reflection seismic data on FIRE transects, Fennoscandian Shield. In: Kukkonen IT, Lahtinen R (eds) Finnish Reflection Experiment FIRE 2001-2005. Geological Survey of Finland, Special Paper 43, 13-43.
Kukkonen, I.T., Olesen, O. & Ask, M.V.S., 2010. Postglacial faults in Fennoscandia: targets for scientific drilling. GFF 132 (1), 71-81.
255
Kukkonen, I.T., Ask, M.V.S. & Olesen, O., 2011a. Postglacial Fault Drilling in Northern Europe: Workshop in Skokloster, Sweden. Scientific Drilling No. 11, 56-59.
Kukkonen, I. T., Heikkinen, P., Heinonen, S., Laitinen, J. & HIRE Working Group of the Geological Survey of Finland, 2011b. Reflection seismics in exploration for mineral deposits: initial results from the HIRE project. Geological Survey of Finland, Special Paper 49, 49–58.
Kulling, O., 1972. The Swedish Caledonides. In: Strand, T. & Kulling, O. (Eds.), Scandinavian Caledonides.
Kärki, A. & Laajoki K., 1995. An interlinked system of folds and ductile shear zones ‒ late stage Svecokarelian deformation in the central Fennoscandian Shield, Finland. Journal of Structural Geology 17, 9, 1233-1247.
Kärki, A., Laajoki, K. & Luukas, J., 1993. Major Palaeoproterozoic shear zones of the central Fennoscandian Shield. Precambrian Research 64, 207–223.
Kärki, A., Korja, T., Mahmoud, M., Pirttijärvi, M., Tirronniemi, J., Tuisku, P. & Woodard, J., 2012. Structure of the Raahe‒Ladoga Shear Complex. Lithosphere 2012 ‒ Seventh symposium on the structure, composition and evolution of the lithosphere in Finland. Geological Survey of Finland, Espoo, November 6-8, 2012, Programme and extended abstracts. Institute of Seismology, University of Helsinki, Report S-56, 55-58.
Kärkkäinen, N. & Lohva, J., 2008. Ydinvoimalaitoksen mahdollisten sijoituspaikkojen kallioperän malmipotentiaaliselvitys, Etelä-Suomen yksikkö, raportti 16.12.2008, 58 s.
Laajoki, K., 2005. Karelian supracrustal rocks. In: Lehtinen, M., Nurmi, P.A., Rämö, O.T. (Eds.) Precambrian Geology of Finland – Key to the Evolution of the Fennoscandian Shield. Elsevier B.V., Amsterdam, 279-342.
Lagerbäck, R., 1979. Neotectonic structures in northern Sweden. Geologiska Föreningens i Stockholm Förhandlingar 100, 263–269.
Lagerbäck, R., 1988. The Veiki moraines in northern Sweden - widespread evidence of an Early Weichselian deglaciation. Boreas 17, 469-486.
Lagerbäck, R., 1990. Late Quaternary faulting and paleoseismicity in northern Fennoscandia, with particular reference to the Lansjärv area, northern Sweden. Geologiska Föreningens i Stockholm Förhandlingar 112, 333–354.
Lagerbäck, R. & Henkel, H., 1977. Studier av neotektonisk aktivitet i mellersta och norra Sverige, flygbildsgenomgång och geofysisk tolkning av recenta förkastningar (with a short English summary). KBS Teknisk Rapport 19, Kärnbränslesäkerhet, Stockholm, 35 pp.
Lagerbäck, R. & Witschard, F., 1983. Neotectonics in Northern Sweden – geological investigations. SKBF/KBS Technical Report 83-58. Svensk Kärnbränslehantering AB, Stockholm, 58 pp.
Lagerbäck, R. & Sundh, M., 2003. Searching for evidence of late- or postglacial faulting in the Forsmark region. Results from 2002. SKB P-03-76, Svensk Kärnbränslehantering AB.
Lagerbäck, R. & Sundh, M., 2008. Early Holocene faulting and paleoseismicity in northern Sweden. Geological Survey of Sweden C 836, 80 pp.
Lagerbäck, R., Sundh, M. & Johansson, H., 2004a. Searching for evidence of late- or postglacial faulting in the Forsmark region. Results from 2003. SKB P-04-123, Svensk Kärnbränslehantering AB.
Lagerbäck, R., Sundh, M. & Svedlund, J.-O., 2004b. Searching for evidence of late- or postglacial faulting in the Oskarshamn region. Results from 2003. SKB P-04-192, Svensk Kärnbränslehantering AB.

256
Lagerbäck, R., Sundh, M., Svedlund, J.-O. & Johansson, H., 2005a. Searching for evidence of late- or postglacial faulting in the Forsmark region. Results from 2002-4. SKB R-05-51, Svensk Kärnbränslehantering AB.
Lagerbäck, R., Sundh, M., Svantesson, S.-I. & Svedlund, J.-O., 2005b. Searching for evidence of late- or postglacial faulting in the Forsmark region. Results from 2004. SKB P-05-232, Svensk Kärnbränslehantering AB.
Lagerbäck, R., Sundh, M. & Svantesson, S.-I., 2006. Searching for evidence of late- or postglacial faulting in the Oskarshamn region. Results from 2005. SKB P-06-160, Svensk Kärnbränslehantering AB.
Lahtinen, R., Korja, A. & Nironen, M., 2005. Paleoproterozoic tectonic evolution. In: M. Lehtinen, P.A. Nurmi & O.T. Rämö (eds.), Precambrian Geology of Finland – Key to the Evolution of the Fennoscandian Shield. Elsevier B.V., Amsterdam, 481–532.
Lahtinen, R., Garde, A.A. & Melezhik, V.A., 2008. Paleoproterozoic evolution of Fennoscandia and Greenland. Episodes 31, 20–28.
Lamontagne, M. & Ranalli, G., 1996. Thermal and rheological constraints on the earthquake depth distribution in the Charlevoix, Canada, intraplate seismic zone. Tectonophysics 257, 55-69.
Lehtinen, M., 1976. Lake Lappajärvi, a meteorite impact site in western Finland. Geological Survey of Finland, Bulletin 282, 92 pp.
Lehtonen, M., Airo, M.-L., Eilu, P., Hanski, E., Kortelainen, V., Lanne, E., Manninen, T., Rastas, P., Räsänen, J. & Virransalo, P., 1998. Kittilän vihreäkivialueen geologia. Lapin vulkaniittiprojektin raportti. Summary: The stratigraphy, petrology and geochemistry of the Kittilä greenstone area, northern Finland. A report of the Lapland Volcanite Project. Geological Survey of Finland, Report of Investigation 140, 144 p.
Lehtovaara, J., 1976. Apatite fission track dating of Finnish Precambrian intrusives. Annales Academiae Scientiarum Fennicae. Series A III, Geologica – Geographica 117. , 94 pp.
Lindblom, E. & Lund, B., 2011. Focal mechanisms and the state of stress along the Pärvie end-glacial fault, northern Sweden. In: Lindblom, E. Microearthquake Study of End-glacial Faults in Northern Sweden. Phil.lic thesis in seismology, University of Uppsala, Sweden.
Lindblom, E., Lund, B., Tryggvason, A., Uski, M., Juhlin, C., Böðvarsson, R. & Roberts, R., 2011. Microearthquake activity on the Pärvie end-glacial fault, northern Sweden. In: Lindblom, E. Microearthquake Study of End-glacial Faults in Northern Sweden. Phil.lic thesis in seismology, University of Uppsala, Sweden.
Lidberg, M., Johansson, J.M., Scherneck, H.-G. & Milned, G.A., 2010. Recent results based on continuous GPS observations of the GIA process in Fennoscandia from BIFROST. Journal of Geodynamics 50, 8–18. ISSN 0264-3707, DOI: 10.1016/j.jog.2009.11.010.
Lindström, M., Schmitz, B., Sturkell, E. & Ormö, J., 2008. 33rd IGC excursion guide ”Paleozoic Impact Craters”, 54 pp.
Lisiecki, L.E. & Raymo, M.E., 2005. A Plio-Pleistocene Stack of 57 Globally Distributed Benthic δ18O Records. Paleoceanography 20, PA1003, 17 pp.
Litt, T., Behre, K.-E., Meyer, K.-D., Stephan, H.J. & Wansa, S., 2007. Stratigraphische Begriffe für das Quartär des norddeutschen Vereisungsgebietes. Eiszeitalter und Gegenwart 56 (1/2), 7. 7-65.
Lukashov, A.D., 1995. Paleoseismotectonics in the northern part of Lake Onega (Zaonezhkij Peninsula, Russian Karelia). Geological Survey of Finland, Nuclear Waste Disposal Research, Report YST-90. 36 pp.
Lund, B., 2005. Effects of Deglaciation on the Crustal Stress Field and Implications for Endglacial Faulting: A Parametric Study of Simple Earth and Ice Models. Swedish Nuclear Fuel and Waste Management Co., Stockholm. Technical Report TR-05-04, 68 pp.
257
Lund, B., Schmidt, P. & Hieronymus, C., 2009. Stress evolution and fault stability during the Weichselian glacial cycle. Tech. Rep. TR-09-15, Swedish Nuclear Fuel and Waste Management Co. (SKB), Stockholm, Sweden. 106 p.
Lundqvist, J., 1958. Studies of the Quaternary History and Deposits of Wärmland, Sweden. Sveriges Geologiska Undersökning, Ser. С. 559, 57 pp.
Lundqvist, J., 1992. Glacial stratigraphy in Sweden. Geological Survey of Finland, Special Paper 15, 43–59
Lundqvist, J., 2004. Glacial history of Sweden. Developments in Quaternary Sciences. Quaternary Glaciations- Extent and Chronology — Part I: Europe. Vol 2, Part 1, Pages 401-412.
Lundqvist, J. & Lagerbäck, R., 1976. The Pärvie Fault: A late-glacial fault in the Precambrian of Swedish Lapland. Geologiska Föreningens i Stockholm Förhandlingar 98, 45–51.
Lundqvist, T., Gee, D.G., Kumpulainen, R., Karis, L. & Kresten, P., 1990. Beskrivning till berggrundskartan över Västernorrlands län. Geological Survey of Sweden Ba 31, 429 pp.
Lundqvist, T., Bøe, R., Kousa, J., Lukkarinen, H., Lutro, O., Roberts, D., Solli, A., Stephens, M.B. & Weihed, P., 1996. Bedrock map of Central Fennoscandia 1 : 1 000 000. Geological Survey of Finland (GSF), Geological Survey of Norway (NGU), Geological Survey of Sweden (SGU).
Lunkka, J.P., Saarnisto, M., Gey, V., Demidov, I. & Kiselova, V., 2001. Extent and age of the Last Glacial Maximum in the southeastern sector of the Scandinavian Ice Sheet. Global and Planetary Change 31, 407–425.
Lunkka, J.-P., Johansson, P., Saarnisto, M. & Sallasmaa, O., 2004. Glaciation of Finland. In: Ehlers, J & Gibbard, P.L. (editors). Quaternary Glaciations – Extent and Chronology. Elsevier. 93-100.
Luosto, U., Lanne, E., Korhonen, H., Guterch, A., Grad, M., Materzok, R. & Perchuc, E., 1984. Deep structure of the Earth's crust on the SVEKA profile in central Finland. Annales Geophysicae 2, 5, 559-570.
Marotta, A.M., Mitrovica, J.X., Sabadini, R. & Milne, G., 2004. Combined effects of tectonics and glacial isostatic adjustment on intraplate deformation in central and northern Europe: Applications to geodetic baseline analyses. Journal of Geophysical Research: Solid Earth 109.B1, DOI: 10.1029/2002JB002337.
McCue, K., 2004. Australia: historical earthquake studies. Ann Geophys 47(2–3), 387–397.
Mellqvist, C., Öhlander, B., Skiöld, T. & Wikström, A., 1999. The Archaean–Proterozoic Palaeoboundary in the Luleå area,northern Sweden: field and isotope geochemical evidence for a sharp terrane boundary. Precambrian Research 96, 225–243.
Midzi, V., Bommer, J.J., Strasser, F.O., Albini, P., Zulu, B.S., Prasad, K. & Flint, N.S., 2013. An intensity database for earthquakes in South Africa from 1912 to 2011. Journal of Seismology 17, 1183–1205.
Mikko, H., Smith, C.A., Lund, B., Ask, M., Munier, R. 2014. Neotectonic faulting in Sweden: Surface expression from a LiDAR based digital elevation model. Abstract, 31st Nordic winter meeting, Lund, p. 139
Milne, G.A., Davis, J.L., Mitrovica, J.X., Scherneck, H.-G., Johansson, J.M., Vermeer, M. & Koivula, H., 2001. Space-geodetic constraints on glacial isostatic adjustment in Fennoscandia. Science 291, 2381– 2385.
Moberg, K.A., 1891. Jordskalfven i Finland år 1882 (Earthquakes in Finland in 1882). Fennia 4(8), 36 pp. (in Swedish)
Moberg, K.A., 1901. Jordskalfvet den 5 Nov. 1898. (Earthquake of the 5th of November 1898). Fennia 18(6), 28 pp. (in Swedish)
258
Moisio, K. & Kaikkonen, P., 2000. Rheological structure and numerical geodynamical modelling in the Fennoscandian Shield. In: Pesonen, L.J., Korja, A. and Hjelt, S.-E., 2000 (Eds.) Lithosphere 2000: A Symposium on the Structure, Composition and Evolution of the Lithosphere in Finland. Programme and Extended Abstracts, Espoo, Finland, October 4-5, 2000. Institute of Seismology, University of Helsinki, Report S-41, p. 71-75.
Moisio, K. & Kaikkonen, P., 2004. The present day rheology, stress field and deformation along the DSS profile FENNIA in the central Fennoscandian Shield. Journal of Geodynamics, 38: 161-184.
Moisio, K. & Kaikkonen, P., 2006. Three-dimensional numerical thermal and rheological modelling in the central Fennoscandian Shield. J. Geodyn., 42, 95–114.
Moisio, K. & Kaikkonen, P., 2012. Thermal and rheological structures along the seismic POLAR profile in the northern Fennoscandian Shield. Terra Nova 25, 2–12. doi: 10.1111/j.1365-3121.2012.01084.x
Muir Wood, R., 1988. The Scandinavian earthquakes of 22 December 1759 and 31 August 1819. Disasters 12, 223–236.
Muir Wood, R., 1993. A review of the seismotectonics of Sweden. SKB Report TR-93-13, Svensk Kärnbränslehantering AB.
Muir Wood, R., 1995. Reconstructing the tectonic history of Fennoscandia from its margins: The past 100 million years. Swedish Nuclear Fuel and Waste Management Company, SKB Report TR-95-36. http:/www.skb.se/publications.
Muir Wood, R., 2000. Deglaciation Seismotectonics: a principal influence on intraplate seismogenesis at high latitudes. Quarternary Science Reviews, 19, 1399-1411.
Munier, R. & Fenton, C., 2004. Appendix 3: Review of postglacial faulting. In: Munier, R. and Hökmark, H. Respect distances, Rationale and means of computation. R-04-17, 157-218.
Musketov, I. & Orlov, A., 1893. Katalog zemletrasenii Rossiiskoi Imperii. Zapiski Imper. Russ. geograf. objestv., vol. 26.
Musson, R.M.W., 1986. The use of newspaper data in historical earthquake studies. Disasters 10(3), 217–223.
Musson, R.M.W., 1995. Historical seismicity of South China from European sources: example of the Hong Kong Newspaper Press. Acta Seismol Sin 8(3), 487–490.
Mäkilä, M. & Muurinen, T., 2008. Kuinka vanhoja ovat pohjois-Suomen suot? Geologi, 60, 179-184. (In Finnish with English summary).
Mäntyniemi, P., 2004a. Pre-instrumental earthquakes in a low-seismicity region: A reinvestigation of the macroseismic data for the 16 November 1931 events in Central Finland using statistical
analysis. Journal of Seismology 8: 7190.
Mäntyniemi, P., 2004b. A list of previously unknown earthquakes in Finland between 1877 and 1887 based on newspaper reports. Geophysica 40(1–2), 15–22.
Mӓntyniemi, P., 2005. A tale of two earthquakes in the Gulf of Bothnia, Northern Europe in the 1880s. Geophysica 41, 73-91.
Mäntyniemi, P., 2008a. Seismisyyshistorioiden tarkastelu ja YVL 2.6 –ohjeiston mukaisen suunnittelu-maanjäristyksen määrittäminen ydinvoimaloiden mahdollisille sijoituspaikoille Pyhäjoella, Ruotsinpyhtäällä ja Simossa (An investigation of the seismic histories and estimation of a design earthquake according to YVL 2.6 guodelaines to possible nuclear power point sites in Pyhäjoki, Ruotsinpyhtää and Simo). Unpublished report, 31 pp. and Appendices (in Finnish).
Mäntyniemi, P., 2008b. The earthquake of 4 November 1898 in northern Europe: New insights. Journal of Geophysical Research 113, B11303, doi:10.1029/2007JB005461
259
Mäntyniemi, P., 2012a. Pyhäjoen seismisyyshistoriasta (On the historical seismicity in Pyhäjoki). Unpublished report, 25 pp. and Appendices (in Finnish).
Mäntyniemi, P., 2012b. Intraplate Seismicity and Seismic Hazard: The Gulf of Bothnia Area in Northern Europe Revisited. In: Earthquake Research and Analysis - New frontiers in
Seismology, Sebastiano D'Amico (Ed.), InTechOpen, pp. 283298
Mäntyniemi, P. & Wahlström, R., 2013. Macroseismic reports and intensity assessments for the earthquakes in the Bay of Bothnia area, northern Europe on 15 and 23 June 1882. Institute of Seismology, University of Helsinki, Report S-57, 88 pp.
Mäntyniemi, P., Wahlström, R., Lindholm, C. & Kijko, A., 1993. Seismic hazard in Fennoscandia: a
regionalized study. Tectonophysics 227: 205213.
Mäntyniemi, P., Kijko, A. & Retief, P., 2001. Parametric-historic procedure for seismic hazard
assessment and its application to northern Europe. Boll. Geofis. teor. appl. 42, 4155.
Mörner, N.-A., 1985. Paleoseismicity and geodynamics in Sweden: Tectonophysics, v. 117, p. 139–153. doi:10.1016/0040-1951(85)90242-2.
Mörner, N.-A., 1990. Glacial isostasy and long-term crustal movements in Fennoscandia with respect to lithospheric and asthenospheric processes and properties. Tectonophysics 176, 13-24.
Mörner, N.-A., 2003. Paleoseismicity of Sweden, a novel paradigm. Paleogeophysics and Geodynamics, Stockholm University.
Mörner, N.-A., 2005. An interpretation and catalogue of paleoseismicity in Sweden. Tectonophysics 408, 265–307.
Mörner, N.-A., 2009. Late Holocene earthquake geology in Sweden. In: Reicherter, K., Michetti, A. M. & Silva, P. G. (eds) Palaeoseismology: Historical and Prehistorical Records of Earthquake Ground Effects for Seismic Hazard Assessment. Geological Society, London, Special Publications, 316, 179-188.
Nenonen, J. & Huhta, P., 1993. Quaternary glacial history of the Hattu schist belt and adjacent parts of the Ilomantsi district, eastern Finland. Geological Survey of Finland, Special Paper 17, pp. 185-191.
Neuendorf, K.K.E., Mehl, Jr., J.P. & Jackson, J.A. (eds.), 2005. Glossary of Geology. American Geological Institute United Book Press, United States of America, 779 p.
NFR/NORSAR & NGI, 1998. Seismic Zonation for Norway. Report for the Norwegian Council for Building Standardization, 162 pp.
Nikishin, A.M., Ziegler, P.A., Stephenson, R.A., Cloetingh, S.A.P.L., Fume, A.V., Fokin, P.A., Ershov, A.V, Bolotov, S.N., Korotaev, M.V., Alekseeva, A.S., Gorbachev, V.I., Shipilov, E.V., Lankreijer, A., Bembinova, E.Y. & Shamilov, I.V., 1996.Late Precambrian to Triassic history of the East European Craton: dynamics of sedimentary basin evolution. Tectonophysics 268, 23-63.
Nikonov, A. A., 2004. Istoricheskiye zemletryaseniya (Historical earthquakes), In: Deep structure and seismicity of the Karelian region and its margins, Sharov N. V. (Ed.), Petrozavodsk, 192–213 (in Russian).
Nironen, M., 1997. The Svecofennian Orogen: a tectonic model. Precambrian Research 86, 21–44.
Nironen, M., Elliott, B.A. & Rämö, O.T., 2000. 1.88-1.87 Ga post-kinematic intrusions of the Central Finland Granitoid Complex: a shift from C-type to A-type magmatism during lithospheric convergence. Lithos 53, 37-58.
Nironen, M., Kuosmanen, E. & Wasenius, P. 2002. Central Finland Granitoid Complex. Bedrock map 1:400 000. Geological Survey of Finland.

260
Nironen, M., Korja, A., Heikkinen, P. & FIRE Working Group, 2006. A geological interpretation of the upper crust along FIRE 2 and FIRE 2A. In: Kukkonen, I.T. & Lahtinen, R., (Eds.) Finnish Reflection Experiment FIRE 2001-2005. Geological Survey of Finland, Special Paper 43, 77-103.
North, R.G., Wetmiller, R.J., Adams, J., Anglin, F.M., Hasegawa, H.S., Lamontagne, M., Du Berger, R., Seeber, L. & Armbruster, J., 1989. Preliminary results from the November 25, 1988 Saguenay
(Quebec) earthquake, Seism. Res. Lett. 60, 8993.
Nørbech, T., Engsager, K., Jivall, L., Knudsen, O., Koivula, H., Lidberg, M., Ollikainen, M. & Weber, M., 2008. Transformation from a common Nordic reference frame to ETRS89 in Denmark, Finland, Norway, and Sweden – status report. In: Knudsen, P. (Ed.), Proceedings of the NKG General Assembly, May 29 – June 2, Copenhagen, Denmark, 2006, Technical Report No. 1, 2008, DTU Space National Space Institute.
O’Brien, H.E., Peltonen, P. & Vartianen, H., 2005. Kimberlites, carbonatites, and alkaline rocks. In: Lehtinen, M. et al. (eds.) Precambrian geology of Finland – Key to the evolution of the Fennoscandian Shield. Developments in Precambrian geology 14. Elsevier B.V., Amsterdam, pp. 605–644.
Okko, V. 1964. Maaperä. In: Rankama, K. (Ed.) Suomen geologia. Helsinki, Kirjayhtymä, 239–332. (in Finnish).
Oksanen, P.O. 2006. Holocene development of the Vaisjeäggi palsa mire, Finnish Lapland. Boreas 35, 81-95.
Olesen, O., 1988. The Stuoragurra Fault, evidence of neotectonics in the Precambrian of Finnmark, northern Norway. Nor. Geol. Tidsskr., 68: 107-118.
Olesen, O., Blikra, L.H., Braathen, A., Dehls, J.F., Olsen, L., Rise, L.., Roberts, D., Riis, F., Faleide, J.I. & Anda, E., 2004. Neotectonic deformation in Norway and its implications: a review. Norwegian Journal of Geology 84, 3-34.
Olesen, O., Bungum, H., Dehls, J., Lindholm, C., Pascal, C. & Roberts, D., 2013. Neotectonics, seismicity and contemporary stress field in Norway – mechanisms and implications. In: Olsen, L., Fredin, O. and Olesen, O. (eds.) Quaternary Geology of Norway, Geological Survey of Norway Special Publication, 13, pp. 145–174.
Pajunen, M., 1986. Deformation analysis of cataclastic structures and faults in the Tervo area, Central Finland. In: Korsman, K. (Ed.) Development of deformation, metamorphism and metamorphic blocks in eastern and southern Finland. Geological Survey of Finland, Bulletin 339, 16-31.
Pajunen, M., Airo, M-L., Elminen, T., Mänttäri, I., Niemelä, R., Vaarma, M., Wasenius, P. & Wennerström, M., 2008. Tectonic evolution of the Svecofennian crust in southern Finland. In: Pajunen, M. (Ed.) Tectonic evolution of the Svecofennian crust in Finland – a basis for characterizing bedrock technical properties. Geological Survey Finland, Special Paper 47, 15-160.
Pascal, C. & Cloetingh, S.A.P.L., 2009. Gravitational potential stresses and stress field of passive continental margins: Insights from the South-Norway shelf. Earth and Planetary Science Letters, 277, pp. 464-473.
Pascal, C., Roberts, D. & Gabrielsen, R.H., 2005. Quantification of neotectonic stress orientations and magnitudes from field observations in Finnmark, northern Norway. Journal of Structural Geology, 27, 859-870.
Pasquale, V., Verdoya, M. & Chiozzi, P., 2001. Heat flux and the seismicity in the Fennoscandian Shield. Phys. Earth Planet. Int., 126, 147–162.
Patison, N.L., Korja, A., Lahtinen, R., Ojala, V.J. & FIRE Working Group, 2006. FIRE seismic reflection profiles 4, 4A and 4B: insights into the crustal structure of northern Finland from Ranua to Näätämö. In: Kukkonen, I.T. & Lahtinen, R., (Eds.) Finnish Reflection Experiment FIRE 2001-2005. Geological Survey of Finland, Special Paper 43, 161-222.
261
Park, A.F., 1985. Accretion tectonism in the Proterozoic Svecokarelides of the Baltic Shield. Geology 13, 725–729.
Peltonen, P. & Kontinen, A., 2004. The Jormua ophiolite: a mafic-ultramafic complex from an ancient ocean-continent transition zone. In: Kusky, T.M. (Ed.) Precambrian Ophiolites and Related Rocks. Developments in Precambrian Geology 13, 35-71.
Peltonen, P., Kontinen, A., Huhma, H. & Kuronen, U., 2008. Outokumpu revisited: New mineral deposit model for the mantle peridotite-associated Cu–Co–Zn–Ni–Ag–Au sulphide deposits. Ore Geology Reviews 33, 559-617.
Penttilä, E., 1978. Earthquakes in Finland 16101976. Institute of Seismology, University of Helsinki, Report S-1, 15 pp.
Phillips, J.D., 2007. Geosoft eXecutables (GX’s) developed by the U.S. Geological Survey, version 2.0, with notes on GX development from Fortran code: U.S. Geological Survey Open-File Report 2007-1355.
Pietikäinen, K.J., 1994.The geology of the Paleoproterozoic Pori shear zone, southwestern Finland, with special reference to the evolution of veined gneisses from tonalitic protoliths. Ph.D. thesis, Michigan Technological University, 129 pp.
Pitkäranta, R., 2013. Lithostratigraphy and age of pre-late Weichselian sediments in the Suupohja area, Finland. Lithostratigraphy and age of pre-Late Weichselian sediments in the Suupohja area, western Finland. Annales Universitatis Turkuensis, Ser. AII 284, 66 pp.
Pokki, J., Kohonen, J., Lahtinen, R., Rämö, O. T. & Andersen, T., 2013a. Petrology and provenance of the Mesoproterozoic Satakunta formation, SW Finland. Geological Survey of Finland, Report of Investigation 204, pp. 47.
Pokki, J., Kohonen, J., Rämö, O.T. & Andersen, T., 2013b. The Suursaari conglomerate (SE Fennoscandian shield; Russia) – Indication of cratonic conditions and rapid reworking of quartz arenitic cover at the outset of the emplacement of the rapakivi granites at ca. 1.65 Ga. Precambrian Research 233, 132-143.
Poutanen, M., Häkli, P., Kallio, U., Nyberg, S., Rouhiainen, P. & Saaranen, V., 2011. Geodeettisten havaintoaineistojen kokoaminen, käsittely ja analyysi Simon-Pyhäjoen alueelta mahdollisen ydinvoimalan sijoitusalueen liikuntojen selvittämiseksi.
Putkinen, N.& Valpola, S., 2011. Pyhäjoen Hanhikiven nuoret siirrokset. Geologian tutkimuskeskus, Länsi-Suomen yksikkö, raportti LSY Y99/9999/2011/9/99, 2 s. (Fennovoiman arkistotunnus RE-02-0000096)
Påsse T, 2004. The amount of glacial erosion of the bedrock. SKB TR-04-25, Svensk Kärnbränslehantering AB.
Ransed, G. & Wahlroos J.-E., 2007. Map of the Quaternary deposits 24H Sorsele, scale 1:100 000. Sveriges geologiska undersökning K 42.
Rantataro, J., Kaskela, A. & Alvi, K., 2011. Simosel - Simo Merigeologia/vaihe 1 v.2011.Geologian tutkimuskeskus, tilaustyöraportti 31.3.2011, 9 s + 1 liite (Fennovoiman arkistotunnus RE-02-0000095).
Redfield, T.F. & Osmundsen, P.T., 2013. The Long –term topographic response of a continent adjacent to a hyperextended margin: a case study from Scandinavia. Geological Society of America Bulletin, v. 125, no. ½, p. 184-200.
Reimold, W.U., 1982. The Lappajärvi meteorite crater, Finland: petrography, Rb-Sr, major and trace element geochemistry of the impact melt and basement rocks. Geochimica et Cosmochimica Acta 46, 1203-1225.

262
Rinterknecht, V. R., Clark, P. U., Raisbeck, G. M., Yiou, F., Brook, E. J., Tschudi, S. & Lunkka, J. P., 2004. Cosmogenic 10Be dating of the Salpausselkä I Moraine in southwestern Finland. Quaternary Science Reviews 23, 2283 - 2289.
Roberts, D. & Gee, D.G., 1985. An introduction to the structure of the Scandinavian Caledonides. In: Gee, D.G. & Sturt, B.A. (eds.), The Caledonide Orogen - Scandinavia and related areas, Chichester, Wiley, 55–68.
Robertsson, A.-M., 2000. The Eemian interglacial in Sweden, and comparison with Finland. Geologie en Mijnbouw/Netherlands Journal of Geosciences 79, 325–333.
Robertsson, A.-M., Svedlund, J.-O., Andrén, Th. & Sundh, M., 1997. Pleistocene stratigraphy in the Dellen region, central Sweden. Boreas 26, 237–260.
Romer, R.L. & Nisca, D.H., 1995. Svecofennian crustal deformation of the Baltic Shield and U-Pb age of late-kinmatic tonalitic intrusions in the Burträsk Shear Zone, northern Sweden. Precambrian Research 75, 17–29.
Root, D. & Corfu, F., 2012. U-Pb geochronology of two discrete Ordovician high pressure metamorphic events in the Seve nappe complex, Scandinavian Caledonides. Contributions to Mineralogy and Petrology 163, 769–788.
Rosberg, J.E., 1912. Jordskalf i Finland 19041911 (Earthquakes in Finland 19041911). Fennia, 32(5),
125 (in Swedish).
Roth, M. & Bungum, H., 2003. Waveform modeling of the 17 August 1999 Kola Peninsula earthquake. Bull. Seismol. Soc. Am., 93, 1559-1572, doi: 10.1785/0120020015.
Rukhlov, A.S. & Bell, K., 2010. Geochronology of carbonatites from the Canadian and Baltic Shields, and the Canadian Cordillera: clues to mantle evolution. Mineralogy and Petrology 98, 11–54.
Rutland, R.W.R, Skiöld, T. & Page, R.W., 2001. Age of deformation episodes in the Palaeoproterozoic domain of northern Sweden, and evidence for a pre-1.9 Ga crustal layer. Precambrian Research 112, 239–259.
Rämö, O.T. & Haapala, I., 2005. Rapakivi granites. In: Lehtinen, M., Nurmi, P.A., Rämö, O.T. (Eds.) Precambrian Geology of Finland – Key to the Evolution of the Fennoscandian Shield. Elsevier B.V., Amsterdam, 533-562.
Saari J., 1998. Regional and local seismotectonic characteristics of the area surrounding the Loviisa nuclear power plant in SE Finland. Ph.D. thesis. Inst Seismology, Univ. Helsinki, Report S-36, 78p.
Saari, J., 2008. Seismicity in the Olkiluoto area. Posiva report, POSIVA 2008-04, Posiva Oy, Eurajoki, Finland. 55 p.
Saari, J., 2012. Seismic activity parameters of the Olkiluoto site. Posiva report, POSIVA-2012-34, Posiva Oy, Eurajoki, Finland. 60 p.
Saari, J. & Slunga, R., 1996. Fault plane solutions of microearthquakes in the Loviisa region in south-eastern Finland. Posiva report, POSIVA-96-02, Posiva Oy, Eurajoki, Finland. 55 p.
Saari, J., Heikkinen, P.J., Varpasuo, P., Malm, M., Turunen, E., Karkkulainen, K., Valtonen, O. & Uski, M., 2009. Estimation of seismic hazard in territory of Finland, Report number EXP-500, ÅF-Consult Ltd.
Saarnisto, M. & Salonen, V-P., 1995. Glacial history of Finland. In: Ehlers, J., Kozarski, S., Gibbard, P. (eds). Glacial deposits in North-east Europe. A.A.Balkema, Rotterdam, 3-10.
Saarnisto, M. & Saarinen, T., 2001. Deglaciation chronology of the Scandinavian Ice Sheet from the Lake Onega Basin to the Salpausselkä End Moraines. Global and Planetary Change, volume 31, pages 387-405.
263
Sahlström, K.E., 1911. Jordskalf i Sverige 19071910 (Earthquakes in Sweden 19071910). Sveriges Geologiska Undersökning (Geological Survey of Sweden), Ser.C, No.238, Stockholm, Sweden (in Swedish).
Saintot, A., Stephens, M.B., Viola, G. & Nordgulen, Ø. 2011: Brittle tectonic evolution and paleostress field reconstruction in the southwestern part of the Fennoscandian Shield, Forsmark, Sweden. Tectonics 30, TC4002, doi:10.1029/2010TC002781.
Salonen, V.-P., Kaakinen, A., Kultti, S., Miettinen, A., Eskola, K.O. & Lunkka, J.P. 2008. Middle Weichselian glacial event in the central part of the Scandinavian Ice Sheet recorded in the Hitura pit, Ostrobothnia, Finland. Boreas 37, 38–54.
Sandström, B., Tullborg, E.-L., Larson, S.Å. & Page, L., 2009. Brittle tectonothermal evolution in the Forsmark area, central Fennoscandian Shield, recorded by paragenesis, orientation and 40Ar/39Ar geochronology of fracture minerals. Tectonophysics 478, 158–174.
Sauber, J., Plafker, G., Molnia, B.F. & Bryant, M.A., 2000. Crustal deformation associated with glacial fluctuations in the eastern Chugach Mountains, Alaska. J. Geophys. Res., 105(B4), 8055-8077.
Sauramo, M. 1923. Studies on the Quaternary varve sediments in southern Finland. Bulletin de la Commision géologique de Finlande 60, 164 pp
Scherneck, H.-G., Lidberg, M., Haas, R., Johansson, J.M. & Milne, G.A., 2010. Fennoscandian strain rates from BIFROST GPS: A gravitating, thick-plate approach. J. Geodyn., 50, 19-26.
Scholz, C.H. 1990. The Mechanics of Earthquakes and Faulting. Cambridge University Press, Cambridge, 439 pp.
Seeber, L. & Armbruster, J.G., 1987. The 1886–1889 aftershocks of the Charleston, South Carolina, earthquake: a widespread burst of seismicity. J Geophys Res 92(B3), 2663–2696.
Shackleton, N.J., 1997. The deep-sea sediment record and the Pliocene-Pleistocene boundary. Quaternary International 40, 33–35.
Shearer, P.M., 2009. Introduction to Seismology. Cambridge University Press, Cambridge. 396 pp.
Sibson, R.H., 1982. Fault zone models, heat flow, and the depth distribution of earthquakes in the continental crust of the United States. Bull. Seismol. Soc. Am., 72, 151-163.
Sigfúsdóttir, Th., 2013. A sedimentological and stratigraphical study of Veiki moraine in northernmost Sweden. Dissertations in Geology at Lund University, No. 354, 27 pp.
Skyttä, P. & Mänttäri, I., 2008. Structural setting of late Svecofennian granites and pegmatites in Uusimaa Belt, SW Finland: Age constraints and implications for crustal evolution. Precambrian Research 164, 86-109.
Skyttä, P., Bauer, T.E., Tavakoli, S., Hermansson, T., Andersson, J. & Weihed, P., 2012. Pre-1.87 Ga development of crustal domains overprinted by 1.87 Ga transpression in the Palaeoproterozoic Skellefte district, Sweden. Precambrian Research 206–207, 109–136.
Slunga, R.S., 1991. The Baltic Shield earthquakes. In: S. Bjiimsson, S. Gregersen, E.S. Husebye, H. Korhonen & C.-E. Lund (Eds.), Imaging and Understanding the Lithosphere of Scandinavia and Iceland. Tectonophysics, 189: 323-3111..
Slunga, R. & Ahjos, T., 1986. Fault mechanism of Finnish earthquakes, crustal stresses and faults. Geophysica 22, 1 – 13.
Smedberg, I., Uski, M., Tiira, T., Komminaho, K. & Korja, A., 2012. Intraplate earthquake swarm in Kouvola, south-eastern Finland. Geophysical Research Abstracts. 2012;14:EGU2012-8446.
Smith, C.A., Sundh, M., Mikko, H. 2014. Surficial geology indicates early Holocene faulting and seismicity, central Sweden. International Journal of Earth Sciences (Geologische Rundschau) 103, 1711-1724
264
Sohlenius, G. & Hedenström, H., 2008. Geological development during the Quaternary period. In Söderbäck, B. (ed.), Geological evolution, palaeoclimate and historical development of the Forsmark and Laxemar-Simpevarp areas. Site descriptive modelling SDM-Site. Swedish Nuclear Fuel and Waste Management Company, SKB Report R-08-19, 89–134. http:/www.skb.se/publications.
Sorjonen-Ward, P. 2006. Geological and structural framework and preliminary interpretation of the FIRE 3 and FIRE 3A reflection seismic profiles, central Finland. Geological Survey of Finland, Special Paper 43, 105–159.
Spencer, K.J., Hacker, B.R., Kylander-Clark, A.R.C., Andersen, T.B., Cottle, J.M., Stearns, M.A., Poletti, J.E. & Seward, G.G.E., 2013. Campaign-style titanite U–Pb dating by laser-ablation ICP: Implications for crustal flow, phase transformations and titanite closure. Chemical Geology 341, 84–101.
St-Onge, M.R., Searle, M.P. & Wodicka, N., 2006. Trans-Hudson Orogen of North Amererica and Himalaya-Karakoram-Tibetan Orogen of Asia: Structural and thermal characteristics of the lower and upper plates. Tectonics 25, TC4006, doi:10.1029/2005TC001907.
Stein, S. & Liu, M., 2009. Long aftershock sequences within continents and implications for earthquake hazard assessment. Nature 462, 87-89.
Stephens, M.B., 1988. The Scandinavian Caledonides: A complexity of collisions. Geology Today 4, 20–26.
Stephens, M.B. & Wahlgren, C.-H., 2008. Bedrock evolution. In: Söderbäck, B. (ed.), Geological evolution, palaeoclimate and historical development of the Forsmark and Laxemar-Simpevarp areas. Site descriptive modelling SDM-Site. Swedish Nuclear Fuel and Waste Management Company, SKB Report R-08-19, 25–88. http:/www.skb.se/publications.
Stephens, M.B. & Weihed, P., 2013.Tectonic evolution and mineral resources in the Fennoscandian Shield, Sweden. In: Allen, R., Jansson N. & Ripa, M. (eds.), Bergslagen: Geology of the volcanic- and limestone-hosted base metal and iron oxide deposits. Geological Survey of Sweden SGA excursion guidebook SWE4, 10–20.
Stephens, M.B., Ripa, M., Lundström, I., Persson, L., Bergman, T., Ahl, M., Wahlgren, C.-H., Persson, P.-O. & Wickström, L., 2009. Synthesis of the bedrock geology in the Bergslagen region, Fennoscandian Shield, south-central Sweden. Geological Survey of Sweden Ba 58, 259 pp.
Stucchi, M., 1993. Through catalogues and historical records: an introduction to the project «Review of Historical Seismicity in Europe», in Historical Investigation of European Earthquakes, edited
by M. Stucchi and J. Vogt (CNR, Milano), 1, 314.
Stucchi, M., Albini, P. & Rubbia Rinaldi, G., 2000. Historical earthquake data in Europe and the Euro-Mediterranean Intensity Database. Euro-Mediterranean Seismological Centre Newsletter 16,
57.
Suominen, V., 1991. The chronostratigraphy of southwestern Finland with special reference to Postjotnian and Subjotnian diabases. Geological Survey of Finland Bulletin 356, 106 pp.
Sutinen, R., 1992: Glacial deposits, their electrical properties and surveying by image interpretation and ground penetrating radar. Bulletin de la commission Géologique de Finlande 359, 123 pp.
Sutinen, R., 2005. Timing of early Holocene landslides in Kittilä, Finnish Lapland. Geological Survey of Finland, Special Paper 40, 53-58.
Sutinen, R., Jakonen, M., Liwata, P. & Hyvönen E., 2007. Late-Weichselian sheetflow drainage of subglacial Lokka ice lake. Geol. Surv. Finl. Spec. Paper. 46, 55-62.
Sutinen, R., Piekkari, M. & Middleton, M., 2009. Glacial geomorphology in Utsjoki, Finnish Lapland proposes Younger Dryas fault-instability. Global and Planetary Change, 69, 16-28.
265
Sutinen R., Hyvönen E., Närhi P., Haavikko P., Piekkari M. & Middleton M., 2010. Sedimentary anisotropy diverges from flute trends in south-east Finnish Lapland. Sedimentary Geology 232 (3-4), 190-197.
Sutinen, R., Hyvönen, E. & Kukkonen, I., 2013. LiDAR detection of paleolandslides in the vicinity of the Suasselkä posglacial fault, Finnish Lapland. International Journal of Applied Earth Observation and Geoinformation 27, 91-99.
Sutinen, R., Hyvönen E., Middleton, M. & Ruskeeniemi, T., 2014. Airborne LiDAR detection of postglacial faults and Pulju moraine in Palojärvi, Finnish Lapland. Global and Planetary Change 115, 24-32.
Svendsen, J.I., Alexanderson, H., Astakhov, V.I., Demidov, I., Julian, A.D., Funder, S.,Gataulling, V., Henriksen, M., Hjort, J., Houmark-Nielsen, M., Hubberten, H.W., Ingulfsson, O., Jakobsson, M., Kjer, K.H., Larsen, E., Lokrantz, H., Lunkka, J.P., Lys, A., Mangerud, J., Matiouchkov, A., Murray, A., Muller, P., Niessen, F., Nikolskaya, O., Polyak, L., Saarnisto, M., Siegert, C., Siegert, M.J., Spielhagen, R.W., & Ruedige, S. 2004. Late Quaternary ice sheet history of northern Eurasia. Quaternary Science Reviews 23, 1229–1271.
Sylvester, A.G., 1988. Strike-slip faults. Geol. Soc. Am. Bull., 100(11), 1666-1703.
Söderlund, U., Isachsen, C., Bylund, G., Heaman, L., Patchett, P.J., Vervoort. J.D. & Andersson, U.B., 2005. U-Pb baddeleyite ages and Hf, Nd isotope chemistry constraining repeated mafic magmatism in the Fennoscandian Shield from 1.6 to 0.9 Ga. Contributions to Mineralogy and Petrology 150, 174–194.
Söderlund, U., Elming, S.-Å., Ernst, R.E & Schissel, D., 2006. The central Scandinavian Dolerite Group - protracted hotspot activity or back-arc magmatism? Constraints from U-Pb baddeleyite geochronology and Hf isotopic data. Precambrian Research 150, 136–152.
Söderlund, P., Hermansson, T., Page, L.M. & Stephens, M.B., 2009. Biotite and muscovite 40Ar-39Ar geochronological constraints on the post-Svecofennian tectonothermal evolution, Forsmark site, central Sweden. International Journal of Earth Sciences 98, 1835–1851.
Talvitie, J., 1971. Seismotectonics of the Kuopio region, Finland. Bull. Comm. Géol. Finlande. vol 248, 41 p.
Talwani, P. & Sharma, N., 1999. Reevaluation of the magnitudes of three destructive aftershocks of the 1886 Charleston earthquake. Seismol Res Lett 70(3), 360–367.
Tatevossian, R.E. & Mäntyniemi, P., 2014. Earthquake scenarios: A practical way to handle alternative solutions to historical earthquakes and to increase the transparency of seismic hazard
assessment. Natural Hazards 72, 549564.
Tatevossian, R.E., Mäntyniemi, P. & Tatevossian, T.N., 2011. On the earthquakes in the Northern
Baltic Shield in the spring of 1626. Natural Hazards 57: 133150.
Tatevossian, R.E., Tatevossian, T.N. & Mäntyniemi, P., 2013. Earthquake activity in Finland and the Russian North in December 1758: rare reports and their interpretation. Annals of Geophysics 56(5), 1-18. doi:10.4401/ag-5829.
Tiira, T., Uski, M., Kortstrom, J., Valtonen, O. & Korja, A., 2011. Pyhäjoki Seismic Network – a Preliminary Proposal, Report T-84, Institute of Seismology, University of Helsinki, Helsinki, 37 pp.
Tiira, T., Janik., T.Kozlovskaya, E., Grad., M., Korja, A., Komminaho, K., Hegedüs, E., Kocács, C.A, Silvennoinen, H. & Brückl, E., 2013. Crustal architecture of the inverted Central Lapland rift along HUKKA 2007 profile. Pure and Applied Geophysics, DOI 10.1007/s00024-013-0725-3.
Tiira, T., Janik, T., Kozlovskaya, E., Grad, M., Korja, A., Komminaho, K., HEGEDŰS, E., KOVÁCS, C.A., Silvennoinen, H. & BRŰCKL, E., 2014. Crustal architecture of the inverted Central Lapland rift along HUKKA 2007 profile. Pure and Applied Geophysics (in press).
266
Tolgensbakk, J. & Sollid, J. L. 1988. Kåfjord, kvartærgeologi og geomorfologi 1:50 000, 1634 II. Geografisk institutt, University of Oslo.
Torvela, T. & Ehlers, C., 2010. Microstructures associated with the Sottunga-Jurmo shear zone and their implications for the 1.83–1.79 Ga tectonic development of SW Finland. Bull. Geol. Soc. Finland 82,5–29.
Torvela, T., Mänttäri, I. & Hermansson, T., 2008. Timing of deformation phases within the South Finland shear zone, SW Finland. Precambrian Research 160, 277-298.
Torvela, T., Moreau, J., Butler, R., Korja, A. & Heikkinen, P., 2013. The mode of extension in the orogenic mid-crust revealed by seismic attribute analysis. G3: Geochemistry, Geophysics, Geosystems, vol 14, nr. 4, s. 1069–1086.
Trouw, R.A.J., 1986. Structural geology of the Marsfjällen area, Caledonides of Västerbotten, Sweden. Geological Survey of Sweden C 689, 115 pp.
Tuisku, P. & Laajoki, K., 1990. Metamorphic and structural evolution of the Early Proterozoic Puolankajärvi Formation, Finland – II. The pressure-temperature-deformation-composition path. Journal of metamorphic Geology 8, 375-391.
Tuisku, P. & Huhma, H., 2006. Evolution of migmatitic granulite complexes: implications from Lapland granulite belt, Part II: Isotopic dating. Bulletin of the Geological Society of Finland 78, 143-175.
UNAVCO Plate Motion Calculator, 2012. http://www.unavco.org/community_science/science-support/crustal_motion/dxdt/model.html Last accessed 20th of September 2013.
Uski, M. & Korja, A., 2007. Hypocenter distribution of earthquakes in north-western Finnish Lapland: preliminary investigation. Abstract in: The 38th Nordic Seismology Seminar, Helsinki, 12-15.6.2007
Uski, M., Hyvönen, T., Korja, A. & Airo,M.-L., 2003. Focal mechanisms of three earthquakes in Finland and their relation to surface faults. Tectonophysics 363, 141–157.
Uski, M., Tiira, T., Korja, A. & Elo, S., 2006. The 2003 earthquake swarm in Anjalankoski, south-eastern Finland. Tectonophysics 422, 55–69. doi:10.1016/j.tecto.2006.05.014.
Uski, M., Tiira, T., Grad, M. & Yliniemi, J., 2012. Crustal seismic structure and depth distribution of earthquakes in the Archean Kuusamo region, Fennoscandian Shield. Journal of Geodynamics 53, 61– 80. doi:10.1016/j.jog.2011.08.005
Vaasjoki, M. & Sakko, M., 1988. The evolution of the Raahe-Ladoga zone in Finland: isotopic constraints. In: Korsman, K. (Ed.) Tectono-metamorphic evolution of the Raahe-Ladoga zone. Geological Survey of Finland, Bulletin 343, 7-32.
Valjus, T., 2008. Geofysikaaliset kallionpintaselvitykset Ruotsinpyhtäällä, Simossa ja Pyhäjoella, Etelä-Suomen yksikkö, raportti 28.11.2008, 6+58 s.
Valtonen, O., Uski, M., Korja, A., Tiira, T. & Kortström, J. 2012a. Simulations of a Microearthquake Network, Geophysical Research Abstracts. Vol 14, EGU2012-8121.
Valtonen, O., Lindblom, P., Komminaho, K., Kortsrtöm, J., Keskinen, J., Smedberg, I. & Korja, A., 2012b. Suunnitelma Pyhäjoen seismisestä paikallisverkosta, Raportti T-85, Seismologian Instituutti, Helsingin Yliopisto, Helsinki, 19 s.
Valtonen, O., Uski, M., Tiira, T., Kortström, J. & Korja, A. 2012c. Yhteenveto Pyhäjoen seismisen paikallisverkon ja aineiston käsittelyn suunnittelusta, Seismologian instituutti, raportti T-87, Helsingin yliopisto, Helsinki, 13 pp.
267
Valtonen, O., Kortström, J. & Korja, A., 2012d. Pyhäjoen seisminen paikallisverkko - vaihe 1, Seismologian Instituutti, raportti T-88. Helsinki, 26 pp.
Valtonen, O., Uski, M., Korja, A., Tiira, T. & Kortström, J., 2013a. Optimal configuration of a micro-earthquake network, Advances in Geosciences, 34, 33-36 pp.
Valtonen, O., Uski, M., Tiira, T., Kortström, J. & Korja, A., 2013b. Optimal configuration of the local Ostrobothnian seismic network OBF, XXVI Geofysiikan päivät, Helsinki, 131-133 pp.
Valtonen, O., Kortström, J. & Korja, A., 2013c. OBF-verkko - vaiheen 1 loppuraportti, Seismologian Instituutti, raportti T-89, 17 pp.
Valtonen, O., Kortström, J. & Korja, A., 2013d. OBF-verkon detektio- ja paikannuskyky – vaiheessa 1 . Seismologian Instituutti, raportti T-91.
Valtonen, O., Uski, M., Kortström, J. ja Korja, A. 2014. OBF-verkon toiminta ja seismiset havainnot vuonna 2013, Seismologian instituutti, raportti T-92. Helsinki, 29 pp
Velichko, A.A, Faustova, M.A., Pisareva, V.V, Gribchenko, Yu.N., Sudakova, N.G. & Lavrentiev, N.V., 2011. Chapter 26 - Glaciations of the East European Plain: Distribution and Chronology. In: Ehlers and Gibbard (Eds.) Developments in Quaternary Sciences. Quaternary Glaciations - Extent and Chronology. A Closer Look. Volume 15, Pages 337–360.
Veltheim, V., 1962. On the pre-Quaternary geology of the bottom of the Bothnian Sea. Bull. Comm. Geol. Finlande, 200, p. 1-166.
Veltheim, V., 1969. On the pre-Quaternary geology of the Bothnian Bay area in the Baltic Sea. Bull. Comm. Géol. Finlande, 239, p. 1-56.
Vestøl O., 2006. Determination of postglacial land uplift in Fennoscandia from leveling, tide-gauges and continuous GPS stations using least squares collocation. J. Geodesy, 80, 248–258, doi:10.1007/s00190-006-0063-7
Viola, G., Venvik Ganerød, G. & Wahlgren, C.-H., 2009. Unraveling 1.5 Ga of brittle deformation history in the Laxemar-Simpevarp area, southeast Sweden: A contribution to the Swedish site investigation study for the disposal of highly radioactive nuclear waste. Tectonics 28, TC 5007, DOI: 10.1029/2009TC002461.
Viola, G., Zwingmann, H., Mattila, J. & Käpyaho, A., 2013. K-Ar illite age constraints on the Proterozoic formation and reactivation history of a brittle fault in Fennoscandia. Terra Nova 25, 236-244.
Vuollo, J. & Huhma, H., 2005. Paleoproterozoic mafic dikes in NE Finland. In: Lehtinen, M., Nurmi, P.A., Rämö, O.T. (Eds.) Precambrian Geology of Finland – Key to the Evolution of the Fennoscandian Shield. Elsevier B.V., Amsterdam, 195-236.
Väisänen, M. & Hölttä, P., 1999. Structural and metamorphic evolution of the Turku migmatite complex, southwestern Finland. Bulletin of the Geological Society of Finland 71, 1, 177-218.
Väisänen, M. & Skyttä, P., 2007.Late Svecofennian shear zones in southwestern Finland. GFF 129, 55-64.
Wahlström, R., 1990. A catalogue of earthquakes in Sweden in 13751890. Geologiska Föreningens i
Stockholm Förhandlingar 112(3), 215225
Wahlström, R. & Grünthal, G., 2000. Probabilistic seismic hazard assessment (horizontal PGA) for Sweden, Finland and Denmark using different logic tree approaches. Soil Dynamics and
Earthquake Engineering 20, 4558.
Wahlström, R. & Grünthal, G., 2001. Probabilistic seismic hazard assessment (horizontal PGA) for Fennoscandia using the logic tree approach for regionalization and nonregionalization models. Seismological Research Letters, 72, 1, 33-45.
Wannäs, K.O., 1989. Seismic stratigraphy and tectonic development of the Upper Proterozoic to Lower Paleozoic of the Bothnian Bay, Baltic Sea. Stockholm Contributions in Geology 40(3), 83–168.
268
Ward, P., 1987. Early Proterozoic deposition and deformation at the Karelian craton margin in southeastern Finland. Precambrian Research 35, 71-93.
Watts A.B. and Burov, E.B. 2003. Lithospheric strength and its relationship to the elastic and seismogenic layer thickness. Earth and Planetary Science Letters 213, 113-131.
Weihed, P. & Mäki, T. (Eds.) 1997. Research and exploration – where do they meet? 4th Biennial SGA Meeting, August 11-13, 1997, Turku, Finland. Excursion guidebook A2: volcanic hosted massive sulphide and gold deposits in the Skellefte district, Sweden and western Finland. Geological Survey of Finland, Guide 41, 81 pp.
Weihed, P., Billström, K., Persson, P.-O. & Bergman Weihed, J., 2002. Relationship between 1.90–1.85 Ga accretionary processes and 1.82–1.80 Ga oblique subduction at the Karelian craton margin, Fennoscandian Shield. GFF 124, 163–180.
Wickman F E, 1988. Possible impact structures in Sweden. In: A. Boden and K.-G Eriksson, (eds.), Deep Drilling in Crystalline Bedrock. Volume 1: The Deep Gas Drilling in the Siljan Impact Structure, Sweden and Astroblemes. Springer-Verlag, Berlin.
Wik, N.-G., Albrecht, L., Bergman, S., Kübler, L. & Sundberg, A., 2009. Malmer, industriella mineral och bergarter I Gävleborgs län. Geological Survey of Sweden RM 130, 310 pp.
Wikström, A., Skiöld, T. & Öhlander, B., 1996. The relationship between 1.88 Ga pld magmatism and the Baltic–Bothnian shear zone in northern Sweden. In: Brewer, T.S. (ed.), Precambrian Crustal Evolution in the North Atlantic Region. Geological Society Special publication 112, 249–259.
Winterhalter, B., 1972. On the geology of the Bothnian Sea, an epeiric sea that has undergone Pleitocene glaciation. Geological Survey of Finland, Bulletin 258, 66 pp.
Winterhalter, B., 2000. Sedimentary rocks underlying the Gulf of Bothnia. In Lundqvist, T. & Autio, S. (eds.), Description to the bedrock map of central Fennoscandia (Mid-Norden). Geological Survey of Finland, Special paper 28, 76–79.
Wu, P. & Hasegawa, H.S., 1996a. "Induced stresses and fault potential in Eastern Canada due to a realistic load: a preliminary analysis". Geophysical Journal International 125: 415-430.
Wu, P. & Hasegawa, H.S. 1996b. "Induced stresses and fault potential in Eastern Canada due to a realistic load: a preliminary analysis". Geophysical Journal International 127: 215–229.
Wu, P. Johnston, P. & Lambeck, K. 1999: Postglacial rebound and fault instability in Fennoscandia. Geophysical Journal International 139, 657-670.
Zhu, H. & Tromp, J., 2013. Mapping Tectonic Deformation in the Crust and Upper Mantle Beneath Europe and the North Atlantic Ocean. Science Vol. 341, no. 6148, pp. 871-875.
Ågren, J. & Svensson, R., 2007. Postglacial Land Uplift Model and System Definition for the New Swedish Height System RH 2000. Reports in Geodesy and Geographical Information Systems Rapportserie, LMV-Rapport 2007:4, Lantmäteriet, Gävle, Sweden.
Åhäll, K.-I., Connelly, J. & Brewer, T.S., 2000. Episodic rapakivi magmatism due to distal orogenesis? Correlation of 1.69–1.50 Ga orogenic and inboard “anorogenic” events in the Baltic Shield. Geology 28, 823–826.
Öhlander, B., Skiöld, T. & Elming S.A., BABELWorking Group, Claesson, S. & Nisca, D.H., 1993. Delineation and character of the Archaean–Proterozoic boundary in northern Sweden. Precambrian Research 64, 67–84.
269
Appendixes
Appendix 1. Previous studies around the Hanhikivi site
Appendix 2. On historical earthquake data
P. Mäntyniemi
Technical information on the revision of historical earthquakes
According to the IAEA guidelines (2010, p. 12), information about earthquakes in the study area shall
be collected and documented before conducting a PSHA for a NPP. This includes historical
earthquakes that occurred before the advent of seismic instruments. Various written documentary
materials testify of the effects of local and regional earthquakes in the past. The textual information
can be utilized in seismicity studies using the rigorous rules of historical seismology. The seismicity
record should be extended as far back in time as possible. Macroseismic data provide constraints on
earthquake effects when no instrumental records are available. They make an important
contribution to loss modeling by seismological and engineering communities.
It was known on the basis of earlier seismological compilations that information on earthquakes
observed in the study area is available since the first half of the 1700s. It was judged that chances to
uncover usable reports older than 300 years are extremely small. This was based on general
considerations of the history of settlement and learning. The semi-nomad indigenous people in
Lapland in the north did not prepare written accounts. Town rights were accorded to several
harbours and old marketplaces on the coasts of the Gulf of Bothnia in the reign of King Gustaf II Adolf
of Sweden between 1611 and 1632, reflecting the growing importance of this region to the Crown. A
milestone in learning was the work of U. Hiärne (1706) that included observations of ground tremor
in southern Sweden.
The search strategy was to focus on the two and a half centuries of the historical seismicity record
available. Efforts were taken to expand the data by re-appraising known earthquakes and searching
for possible forgotten earthquakes (forgotten by catalogue compilers) and cases where the
parametric entry in a catalogue relies on erroneous information, so-called fake earthquakes.
It was decided that primary written documentary materials should be consulted and maps plotted on
the basis of available data. Intensity data points (IDPs) represent the formalization of historical
records of earthquake effects. They become macroseismic data through IDPs (Stucchi et al. 2000). An
IDP carries at least the information about time, place name and its coordinates, and the respective
macroseismic intensity. A historical earthquake is constructed with the help of the IDPs carrying the

270
same time. The concept of macroseismic data point (MDP) is used when discussing historical
earthquakes in the Fennoscandian Shield, because intensity cannot always be assessed due to a lack
of detailed documentation available there.
The distribution of population and centres of documentation and learning influences how the effects
of local and regional earthquakes can be reported in writing. The study area includes the Gulf of
Bothnia, where observations can mainly be obtained from islands not far from the coastline.
Sometimes observations were made on boats, for instance on 23 June 1882 (Mäntyniemi and
Wahlström, 2013). Offshore seismicity cannot be investigated reliably using historical earthquake
observations alone, because it can be hard to separate near-shore earthquakes from those further
away at the open sea. Individual earthquakes strong enough to be felt on both coasts are an
exception. Settlements concentrated along water-ways, so the coastlines can be studied.
Maps allow a quick evaluation of the quantity, spatial distribution, and intensity values of the MDPs
available for a given historical earthquake. The maximum intensity, when available and reliable,
immediately tells us about possible damages caused by the earthquake, and the distribution and
quantity of the MDPs give insights into the uncertainties associated with the earthquake location and
magnitude.
The more extensive non-instrumental catalogue may be helpful in the search for rare earthquakes
that have no modern counterparts. In particular, there can be large earthquakes that occur far more
seldom than small ones. The study region includes a water area, so offshore seismicity cannot be
investigated reliably using historical observations alone, except for individual earthquakes strong
enough to be felt on both coasts. It was decided to pay special attention to such cases in this project.
No single threshold magnitude can be associated with these earthquakes, because magnitude is
coupled with epicenter and the width of the Gulf of Bothnia varies. However, microearthquakes are
not felt over very long distances, so an earthquake felt both on the eastern and western coast is
relatively large.
Contemporary newspapers have reported felt effects of local and regional earthquakes and
constitute a valuable source of information, especially for earthquakes for which seismologists did
not distribute questionnaires or conduct field studies. Such reports have been widely used in the
assessment of macroseismic intensities worldwide (Agnew and Sieh, 1978; Musson, 1986, 1995;
Seeber and Armbruster, 1987; Talwani and Sharma, 1999; Downes, 2004; McCue, 2004; Midzi et al.,
2013; among many others). Mäntyniemi (2005) improved the macroseismic data sets of two
historical earthquakes in the study area with the help of contemporary newspapers.
271
The search had to be tailored to the investigated time interval. Newspapers published inside the area
of perceptibility and local newspapers distributed inside one to two municipalities are promising
sources of earthquake reports, but they appeared in northern Fennoscandia rather late. For instance,
the Swedish newspaper Norrbottens Kuriren, established in Luleå in 1861, was instrumental in
publishing felt reports of the 23 June 1882 earthquake from Swedish Lapland (Mäntyniemi and
Wahlström, 2013). National newspapers were the main source of information in the latter half of the
1700s. In addition to focusing on specific time intervals, efforts were taken to systematically browse
important newspaper titles, in particular Swedish Inrikes Tidningar (“Domestic Papers”), established
in 1760.
Archives were searched in specific cases. Further information related to the important earthquake of
23 June 1882 was uncovered; however, it was not sufficient to resolve whether intensity value I = 6
or I = 7 was closer to the true maximum; it was assigned as I = 6-7, reflecting uncertainty following
from a lack of detailed information. Mäntyniemi (2012a) listed other sources that were considered in
the course of the work. They included previous seismological compilations, such as descriptive
earthquake catalogues and studies on individual earthquakes (see, e.g., Wahlström, 1990 for
references). One limitation is that possible private correspondences and diaries are hard to locate.
A classification of the quality of written source materials was given in Korja et al. (2011). Individual
written accounts were divided into three groups according to how detailed they were and how well
the event described could be assessed using seismological criteria. Intensities were assessed on the
European Macroseismic Scale (EMS-98; Grünthal, 1998). The MDP maps prepared for the historical
earthquakes in the study area are given in Mäntyniemi (2012a,b).
Output of the search
Re-appraisal of known historical earthquakes typically resulted in an improved understanding of the
area of perceptibility. In many cases, the newspaper reports referred to places not previously listed
as ones where the respective earthquake was felt. The uncovered reports were sometimes located
on the outskirts of the area of perceptibility, which increases the confidence in the respective
macroseismic magnitude. For instance, Mäntyniemi and Wahlström (2013) revised the macroseismic
dataset for the earthquakes of 15 June and 23 June 1882. They listed 80 contemporary newspaper
reports, out of which 40 were previously disregarded, fully or partly.
In some cases, the uncovered reports improved the intensity assessment for a given place. In
particular, archive documentation related to the Norwegian earthquake of 31 August 1819 was
found for Tornio, Finland. With the help of the expanded documentation for this town, it could be
confirmed that the intensity was not smaller than I = 4 (EMS-98) there. Husebye and Kebeasy (2004,

272
p. 63) proposed to downgrade this intensity value to “Felt (II?)”, but this is ungrounded in the light of
the available documentation.
It was not very surprising that not many new historical earthquakes (i.e. dates) were uncovered.
Mäntyniemi (2004b) found seven earthquakes attested to by one or two MDPs in Finland in the late
1800s. This supports the notion that the larger earthquakes (wider areas of perceptibility) have not
passed unnoticed by earlier compilers of seismological works. Alternatively, some areas of
perceptibility are incompletely reported and cannot be resolved using the documentation available.
The problems of investigating seismicity in border areas are well known (e.g., Stucchi, 1993). The Gulf
of Bothnia has been crossed by a state border since 1809, and the older times were often forgotten
by seismologists, who typically focused on their own territory only. A straightforward task was to
combine the MDPs carrying the same time from Finnish and Swedish publications for a number of
earthquakes. They include historical earthquakes from the late 1700s until the early 1900s. For
example, the largest earthquake in the study area in the 1900s, on 9 March 1909, was investigated
separately by Sahlström (1911) for Sweden and Rosberg (1912) for Finland.
The efforts taken to reappraise important historical earthquakes in the study region prior to this
project and during it have resulted in 20 revised macroseismic datasets (Table A2.1). Macroseismic
data points (MDPs), i.e. triplets with place coordinates and the respective macroseismic intensity
accompanied by the place name, are readily available for these earthquakes. Figure A2.1 shows all
the available data points with intensity I=2 or above. There are a total of 1230 such data points
associated with the 20 earthquakes (data points with information confined to ‘felt’ were not plotted)
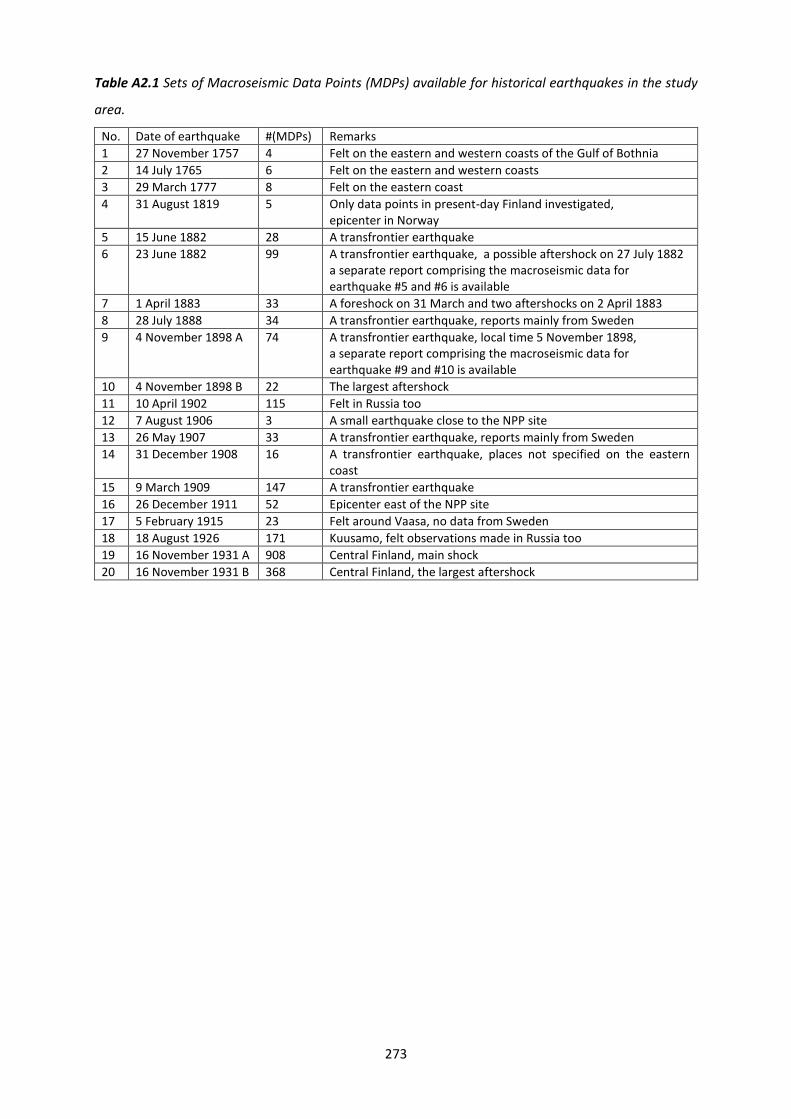
273
Table A2.1 Sets of Macroseismic Data Points (MDPs) available for historical earthquakes in the study
area.
No. Date of earthquake #(MDPs) Remarks
1 27 November 1757 4 Felt on the eastern and western coasts of the Gulf of Bothnia
2 14 July 1765 6 Felt on the eastern and western coasts
3 29 March 1777 8 Felt on the eastern coast
4 31 August 1819 5 Only data points in present-day Finland investigated, epicenter in Norway
5 15 June 1882 28 A transfrontier earthquake
6 23 June 1882 99 A transfrontier earthquake, a possible aftershock on 27 July 1882 a separate report comprising the macroseismic data for earthquake #5 and #6 is available
7 1 April 1883 33 A foreshock on 31 March and two aftershocks on 2 April 1883
8 28 July 1888 34 A transfrontier earthquake, reports mainly from Sweden
9 4 November 1898 A 74 A transfrontier earthquake, local time 5 November 1898, a separate report comprising the macroseismic data for earthquake #9 and #10 is available
10 4 November 1898 B 22 The largest aftershock
11 10 April 1902 115 Felt in Russia too
12 7 August 1906 3 A small earthquake close to the NPP site
13 26 May 1907 33 A transfrontier earthquake, reports mainly from Sweden
14 31 December 1908 16 A transfrontier earthquake, places not specified on the eastern coast
15 9 March 1909 147 A transfrontier earthquake
16 26 December 1911 52 Epicenter east of the NPP site
17 5 February 1915 23 Felt around Vaasa, no data from Sweden
18 18 August 1926 171 Kuusamo, felt observations made in Russia too
19 16 November 1931 A 908 Central Finland, main shock
20 16 November 1931 B 368 Central Finland, the largest aftershock

274
Figure A2.1 The available data points with intensity I=2 or above for the 20 historical earthquakes
listed in Table A2.1.
Seismic histories
An investigation on the intensities experienced at different places on the Gulf of Bothnia allows
seismic histories to be compiled for them. For instance, seismic histories were presented for two
coastal towns, Vaasa (Swedish Vasa) and Tornio (Torneå), from 1730 to 1920. The earthquake effects
recorded in writing in Vaasa are attributed to earthquakes in the Gulf of Bothnia and west of it. The
maximum effects were estimated at macroseismic intensity I = 4-5 (EMS-98). The effects experienced
in Tornio are attributed to local earthquakes at the bottom of the Gulf of Bothnia, except for the
1819 Lurøy earthquake in Norway. The maximum intensity recorded in Tornio was estimated at I = 6-
7 (EMS-98). No historical earthquake was reportedly felt in both towns.
The seismic history of Vaasa shows an absence of earthquake effects between 1787 and 1883. No
earthquakes felt in the vicinity of the town, or on both sides of the Gulf of Bothnia, are known from
275
that time. The gap may follow from a combination of missing reports and an absence of earthquakes.
There may have been a seismic quiescence spanning several decades. When the seismicity level
increased from 1882 onward, earthquakes surprised observers and no recollections of previous
occurrences emerged. The seismic history of Tornio is less intermittent.
In particular, the seismic history of Pyhäjoki from 1740 to 1930 was compiled using the available data
(Mäntyniemi, 2012a; see Appendix 1 p. 284). Few primary documents from Pyhäjoki are available,
but it can be inferred using reports from surrounding towns that many of the largest known historical
earthquakes were felt there. The epicenters of these earthquakes were located in Finnish, Swedish,
or Norwegian territory. The estimated intensities experienced at Pyhäjoki were no larger than I = 4
(EMS-98). The compiled seismic history cannot be used to infer the locations of future earthquakes
that will be felt in Pyhäjoki and strengths of earthquake effects there.
The revised macroseismic datasets and corresponding MDP maps give an improved understanding of
the spatial extent and effects of historical earthquakes in the study area. The most ample datasets
allow to reassess macroseismic magnitudes (that can be converted into moment magnitudes) and
other macroseismic parameters. The re-assessed parameters are used in computations of seismic
hazard for the NPP site.
276
Appendix 3. Metadatabase
E. Kosonen & T. Huotari-Halkosaari
Stored in Fennovoima Oy Maintenance: Fennovoima Oy Contact person: Juho Helander Address: Salmisaarenaukio 1, FI-00180 Helsinki, Finland

277
Appendix 4. Seismic source area coordinates
E. Kosonen
Table A4.1. Seismic source areas and coordinates for spatial model 1 (section 8.2).
Polygon POINT X (m) POINT Y (m) Point X Point Y Polygon POINT X (m) POINT Y (m) Point X Point Y
1.1 43226.31 7555019.17 16.1444 67.7484 1.12 336312.61 7186687.29 23.5578 64.7648
1.1 206445.40 7632618.61 19.7607 68.6498
1.12 532281.35 7477019.13 27.7530 67.4076
1.1 205775.80 7623725.81 19.7700 68.5700
1.12 556504.12 7544039.93 28.3520 68.0050
1.1 128073.27 7490607.99 18.3410 67.2981
1.12 511607.14 7544369.76 27.2778 68.0133
1.1 5811.95 7203050.43 16.6431 64.5881
1.12 445633.48 7566867.07 25.6875 68.2101
1.1 17782.94 7148163.17 17.0676 64.1204
1.12 393708.89 7604213.67 24.3971 68.5301
1.1 -8675.45 7137579.81 16.5686 63.9891
1.12 422788.07 7656658.17 25.0683 69.0097
1.1 -43926.36 7118880.27 15.9274 63.7713
1.12 508035.16 7643224.84 27.2000 68.9000
1.1 -126834.64 7037026.60 14.6029 62.9167
1.12 590081.40 7607839.22 29.2095 68.5683
1.1 -117864.42 7275535.98 13.8123 65.0201
1.12 659429.29 7566266.24 30.8432 68.1654
1.1 43226.31 7555019.17 16.1444 67.7484
1.12 739491.23 7494835.51 32.6077 67.4720
1.2 128073.27 7490607.99 18.3410 67.2981
1.12 700915.88 7456292.44 31.6412 67.1562
1.2 205775.80 7623725.81 19.7700 68.5700
1.12 644423.53 7424059.47 30.3000 66.9000
1.2 263591.74 7610516.55 21.2110 68.5070
1.12 579861.00 7424641.29 28.8265 66.9290
1.2 157175.19 7465763.18 19.0834 67.1123
1.12 577263.71 7386545.71 28.7428 66.5881
1.2 128073.27 7490607.99 18.3410 67.2981
1.12 589693.22 7354783.16 29.0000 66.3000
1.3 -126834.64 7037026.60 14.6029 62.9167
1.12 535487.97 7304004.92 27.7775 65.8553
1.3 -43926.36 7118880.27 15.9274 63.7713
1.12 482845.52 7286877.14 26.6264 65.7032
1.3 -8675.45 7137579.81 16.5686 63.9891
1.12 474112.61 7220868.73 26.4488 65.1104
1.3 17782.94 7148163.17 17.0676 64.1204
1.12 485442.84 7112590.04 26.7009 64.1395
1.3 5811.95 7203050.43 16.6431 64.5881
1.12 459149.02 7089457.87 26.1669 63.9298
1.3 128073.27 7490607.99 18.3410 67.2981
1.12 336312.61 7186687.29 23.5578 64.7648
1.3 157175.19 7465763.18 19.0834 67.1123
1.13 336312.61 7186687.29 23.5578 64.7648
1.3 235272.09 7322290.37 21.1808 65.9111
1.13 459149.02 7089457.87 26.1669 63.9298
1.3 230770.24 7285305.47 21.1578 65.5773
1.13 628939.15 6920156.90 29.4942 62.3904
1.3 162231.07 7207243.29 19.8739 64.8183
1.13 728269.53 6812374.62 31.2735 61.3780
1.3 169851.31 7152037.50 20.1583 64.3341
1.13 637428.21 6738087.06 29.5219 60.7545
1.3 130699.07 7086556.33 19.5137 63.7116
1.13 606849.70 6768064.83 28.9778 61.0329
1.3 53238.25 7057640.75 18.0461 63.3658
1.13 514368.41 6794380.36 27.2681 61.2834
1.3 -7996.59 7005905.71 17.0001 62.8271
1.13 447111.04 6757100.65 26.0238 60.9454
1.3 -77831.43 6863552.56 16.1200 61.4700
1.13 406268.53 6660524.78 25.3158 60.0711
1.3 -126834.64 7037026.60 14.6029 62.9167
1.13 269389.98 6662954.06 22.8589 60.0388
1.4 48014.89 6957139.18 18.2160 62.4681
1.13 154833.08 6702512.82 20.7465 60.3117
1.4 -54377.20 6911362.27 16.4074 61.9262
1.13 54636.72 6758301.69 18.8253 60.7103
1.4 -7996.59 7005905.71 17.0001 62.8271
1.13 -4786.41 6827004.07 17.5704 61.2485
1.4 53238.88 7057663.22 18.0460 63.3660
1.13 13529.96 6845991.54 17.8580 61.4400
1.4 130699.07 7086556.33 19.5137 63.7116
1.13 48014.89 6957139.18 18.2160 62.4681
1.4 169851.31 7152037.50 20.1583 64.3341
1.13 186591.05 7089344.08 20.6319 63.7907
1.4 186591.05 7089344.08 20.6319 63.7907
1.13 211286.90 6996853.59 21.2973 62.9861
1.4 48014.89 6957139.18 18.2160 62.4681
1.13 251305.21 6983293.66 22.1044 62.8944
1.5 -54377.20 6911362.27 16.4074 61.9262
1.13 272809.27 7112773.95 22.3408 64.0668

278
1.5 48014.89 6957139.18 18.2160 62.4681
1.13 336312.61 7186687.29 23.5578 64.7648
1.5 13529.96 6845991.54 17.8580 61.4400
1.14 406268.53 6660524.78 25.3158 60.0711
1.5 -26378.77 6804620.57 17.2357 61.0220
1.14 434768.73 6727702.19 25.8059 60.6797
1.5 -77831.43 6863552.56 16.1200 61.4700
1.14 447111.04 6757100.65 26.0238 60.9454
1.5 -54377.20 6911362.27 16.4074 61.9262
1.14 514368.41 6794380.36 27.2681 61.2834
1.6 157175.19 7465763.18 19.0834 67.1123
1.14 606849.70 6768064.83 28.9778 61.0329
1.6 263591.74 7610516.55 21.2110 68.5070
1.14 637428.21 6738087.06 29.5219 60.7545
1.6 205775.80 7623725.81 19.7700 68.5700
1.14 588359.26 6709629.62 28.6092 60.5130
1.6 206445.40 7632618.61 19.7607 68.6498
1.14 531774.12 6687018.47 27.5752 60.3185
1.6 272362.51 7650281.05 21.3350 68.8692
1.14 472096.48 6670460.27 26.4972 60.1701
1.6 335406.75 7658515.57 22.8842 68.9877
1.14 406268.53 6660524.78 25.3158 60.0711
1.6 278279.10 7536610.23 21.7230 67.8590
1.15 535487.97 7304004.92 27.7775 65.8553
1.6 265976.26 7475083.12 21.5600 67.3000
1.15 610234.45 7250649.53 29.3700 65.3600
1.6 304257.60 7442640.11 22.5006 67.0375
1.15 601477.56 7218450.04 29.1582 65.0741
1.6 235272.09 7322290.37 21.1808 65.9111
1.15 524044.32 7110639.85 27.4937 64.1214
1.6 157175.19 7465763.18 19.0834 67.1123
1.15 485442.84 7112590.04 26.7009 64.1395
1.7 265976.26 7475083.12 21.5600 67.3000
1.15 474112.61 7220868.73 26.4488 65.1104
1.7 278279.10 7536610.23 21.7230 67.8590
1.15 482845.52 7286877.14 26.6264 65.7032
1.7 401380.79 7799286.88 24.3805 70.2806
1.15 535487.97 7304004.92 27.7775 65.8553
1.7 490280.96 7778649.34 26.7440 70.1144
1.16 535487.97 7304004.92 27.7775 65.8553
1.7 304257.60 7442640.11 22.5006 67.0375
1.16 589693.22 7354783.16 29.0000 66.3000
1.7 265976.26 7475083.12 21.5600 67.3000
1.16 661732.80 7311704.49 30.5490 65.8853
1.8 255224.94 7325976.62 21.6100 65.9600
1.16 610234.45 7250649.53 29.3700 65.3600
1.8 235272.09 7322290.37 21.1808 65.9111
1.16 535487.97 7304004.92 27.7775 65.8553
1.8 304024.15 7442175.03 22.4960 67.0332
1.17 589693.22 7354783.16 29.0000 66.3000
1.8 393708.89 7604213.67 24.3971 68.5301
1.17 577263.71 7386545.71 28.7428 66.5881
1.8 445633.48 7566867.07 25.6875 68.2101
1.17 579861.00 7424641.29 28.8265 66.9290
1.8 511607.14 7544369.76 27.2778 68.0133
1.17 644423.53 7424059.47 30.3000 66.9000
1.8 450223.20 7489502.96 25.8335 67.5172
1.17 700915.88 7456292.44 31.6412 67.1562
1.8 359939.20 7353411.77 23.8801 66.2692
1.17 739491.23 7494835.51 32.6077 67.4720
1.8 255224.94 7325976.62 21.6100 65.9600
1.17 796658.86 7434629.63 33.7825 66.8841
1.9 255224.94 7325976.62 21.6100 65.9600
1.17 827117.44 7358813.36 34.2713 66.1784
1.9 359939.20 7353411.77 23.8801 66.2692
1.17 720627.38 7349797.43 31.9017 66.1906
1.9 319444.29 7202129.62 23.1844 64.8944
1.17 661732.80 7311704.49 30.5490 65.8853
1.9 230770.24 7285305.47 21.1578 65.5773
1.17 589693.22 7354783.16 29.0000 66.3000
1.9 235272.09 7322290.37 21.1808 65.9111
1.18 728269.53 6812374.62 31.2735 61.3780
1.9 255224.94 7325976.62 21.6100 65.9600
1.18 628939.15 6920156.90 29.4942 62.3904
1.10 162231.07 7207243.29 19.8739 64.8183
1.18 459149.02 7089457.87 26.1669 63.9298
1.10 230770.24 7285305.47 21.1578 65.5773
1.18 485442.84 7112590.04 26.7009 64.1395
1.10 319444.29 7202129.62 23.1844 64.8944
1.18 524044.32 7110639.85 27.4937 64.1214
1.10 336312.61 7186687.29 23.5578 64.7648
1.18 601477.56 7218450.04 29.1582 65.0741
1.10 272809.27 7112773.95 22.3408 64.0668
1.18 610234.45 7250649.53 29.3700 65.3600
1.10 251305.21 6983293.66 22.1044 62.8944
1.18 661732.80 7311704.49 30.5490 65.8853
1.10 211286.90 6996853.59 21.2973 62.9861
1.18 720627.38 7349797.43 31.9017 66.1906
1.10 186591.05 7089344.08 20.6319 63.7907
1.18 827117.44 7358813.36 34.2713 66.1784
1.10 169851.31 7152037.50 20.1583 64.3341
1.18 865486.93 7249302.23 34.8138 65.1632
1.10 162231.07 7207243.29 19.8739 64.8183
1.18 867993.63 7136855.51 34.5807 64.1605
1.11 359939.20 7353411.77 23.8801 66.2692
1.18 846959.01 7014394.83 33.8811 63.0915
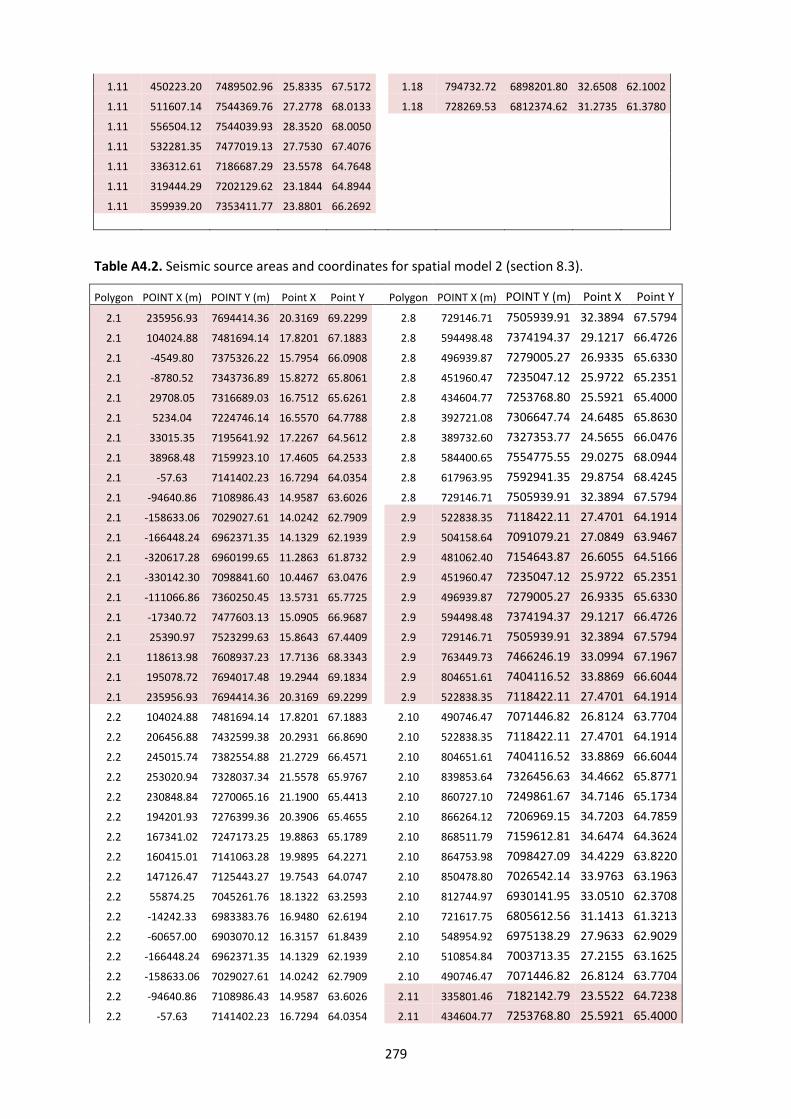
279
1.11 450223.20 7489502.96 25.8335 67.5172
1.18 794732.72 6898201.80 32.6508 62.1002
1.11 511607.14 7544369.76 27.2778 68.0133
1.18 728269.53 6812374.62 31.2735 61.3780
1.11 556504.12 7544039.93 28.3520 68.0050
1.11 532281.35 7477019.13 27.7530 67.4076
1.11 336312.61 7186687.29 23.5578 64.7648
1.11 319444.29 7202129.62 23.1844 64.8944
1.11 359939.20 7353411.77 23.8801 66.2692
Table A4.2. Seismic source areas and coordinates for spatial model 2 (section 8.3).
Polygon POINT X (m) POINT Y (m) Point X Point Y Polygon POINT X (m) POINT Y (m) Point X Point Y
2.1 235956.93 7694414.36 20.3169 69.2299 2.8 729146.71 7505939.91 32.3894 67.5794
2.1 104024.88 7481694.14 17.8201 67.1883
2.8 594498.48 7374194.37 29.1217 66.4726
2.1 -4549.80 7375326.22 15.7954 66.0908
2.8 496939.87 7279005.27 26.9335 65.6330
2.1 -8780.52 7343736.89 15.8272 65.8061
2.8 451960.47 7235047.12 25.9722 65.2351
2.1 29708.05 7316689.03 16.7512 65.6261
2.8 434604.77 7253768.80 25.5921 65.4000
2.1 5234.04 7224746.14 16.5570 64.7788
2.8 392721.08 7306647.74 24.6485 65.8630
2.1 33015.35 7195641.92 17.2267 64.5612
2.8 389732.60 7327353.77 24.5655 66.0476
2.1 38968.48 7159923.10 17.4605 64.2533
2.8 584400.65 7554775.55 29.0275 68.0944
2.1 -57.63 7141402.23 16.7294 64.0354
2.8 617963.95 7592941.35 29.8754 68.4245
2.1 -94640.86 7108986.43 14.9587 63.6026
2.8 729146.71 7505939.91 32.3894 67.5794
2.1 -158633.06 7029027.61 14.0242 62.7909
2.9 522838.35 7118422.11 27.4701 64.1914
2.1 -166448.24 6962371.35 14.1329 62.1939
2.9 504158.64 7091079.21 27.0849 63.9467
2.1 -320617.28 6960199.65 11.2863 61.8732
2.9 481062.40 7154643.87 26.6055 64.5166
2.1 -330142.30 7098841.60 10.4467 63.0476
2.9 451960.47 7235047.12 25.9722 65.2351
2.1 -111066.86 7360250.45 13.5731 65.7725
2.9 496939.87 7279005.27 26.9335 65.6330
2.1 -17340.72 7477603.13 15.0905 66.9687
2.9 594498.48 7374194.37 29.1217 66.4726
2.1 25390.97 7523299.63 15.8643 67.4409
2.9 729146.71 7505939.91 32.3894 67.5794
2.1 118613.98 7608937.23 17.7136 68.3343
2.9 763449.73 7466246.19 33.0994 67.1967
2.1 195078.72 7694017.48 19.2944 69.1834
2.9 804651.61 7404116.52 33.8869 66.6044
2.1 235956.93 7694414.36 20.3169 69.2299
2.9 522838.35 7118422.11 27.4701 64.1914
2.2 104024.88 7481694.14 17.8201 67.1883
2.10 490746.47 7071446.82 26.8124 63.7704
2.2 206456.88 7432599.38 20.2931 66.8690
2.10 522838.35 7118422.11 27.4701 64.1914
2.2 245015.74 7382554.88 21.2729 66.4571
2.10 804651.61 7404116.52 33.8869 66.6044
2.2 253020.94 7328037.34 21.5578 65.9767
2.10 839853.64 7326456.63 34.4662 65.8771
2.2 230848.84 7270065.16 21.1900 65.4413
2.10 860727.10 7249861.67 34.7146 65.1734
2.2 194201.93 7276399.36 20.3906 65.4655
2.10 866264.12 7206969.15 34.7203 64.7859
2.2 167341.02 7247173.25 19.8863 65.1789
2.10 868511.79 7159612.81 34.6474 64.3624
2.2 160415.01 7141063.28 19.9895 64.2271
2.10 864753.98 7098427.09 34.4229 63.8220
2.2 147126.47 7125443.27 19.7543 64.0747
2.10 850478.80 7026542.14 33.9763 63.1963
2.2 55874.25 7045261.76 18.1322 63.2593
2.10 812744.97 6930141.95 33.0510 62.3708
2.2 -14242.33 6983383.76 16.9480 62.6194
2.10 721617.75 6805612.56 31.1413 61.3213
2.2 -60657.00 6903070.12 16.3157 61.8439
2.10 548954.92 6975138.29 27.9633 62.9029
2.2 -166448.24 6962371.35 14.1329 62.1939
2.10 510854.84 7003713.35 27.2155 63.1625
2.2 -158633.06 7029027.61 14.0242 62.7909
2.10 490746.47 7071446.82 26.8124 63.7704
2.2 -94640.86 7108986.43 14.9587 63.6026
2.11 335801.46 7182142.79 23.5522 64.7238
2.2 -57.63 7141402.23 16.7294 64.0354
2.11 434604.77 7253768.80 25.5921 65.4000
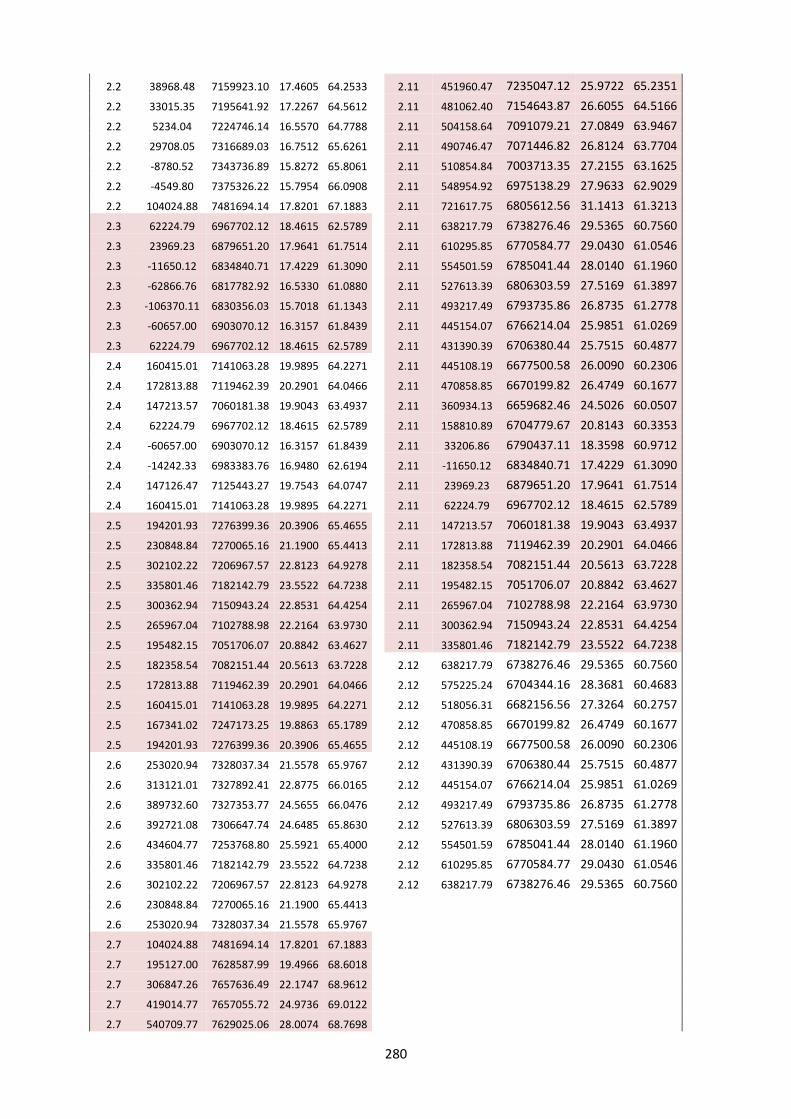
280
2.2 38968.48 7159923.10 17.4605 64.2533
2.11 451960.47 7235047.12 25.9722 65.2351
2.2 33015.35 7195641.92 17.2267 64.5612
2.11 481062.40 7154643.87 26.6055 64.5166
2.2 5234.04 7224746.14 16.5570 64.7788
2.11 504158.64 7091079.21 27.0849 63.9467
2.2 29708.05 7316689.03 16.7512 65.6261
2.11 490746.47 7071446.82 26.8124 63.7704
2.2 -8780.52 7343736.89 15.8272 65.8061
2.11 510854.84 7003713.35 27.2155 63.1625
2.2 -4549.80 7375326.22 15.7954 66.0908
2.11 548954.92 6975138.29 27.9633 62.9029
2.2 104024.88 7481694.14 17.8201 67.1883
2.11 721617.75 6805612.56 31.1413 61.3213
2.3 62224.79 6967702.12 18.4615 62.5789
2.11 638217.79 6738276.46 29.5365 60.7560
2.3 23969.23 6879651.20 17.9641 61.7514
2.11 610295.85 6770584.77 29.0430 61.0546
2.3 -11650.12 6834840.71 17.4229 61.3090
2.11 554501.59 6785041.44 28.0140 61.1960
2.3 -62866.76 6817782.92 16.5330 61.0880
2.11 527613.39 6806303.59 27.5169 61.3897
2.3 -106370.11 6830356.03 15.7018 61.1343
2.11 493217.49 6793735.86 26.8735 61.2778
2.3 -60657.00 6903070.12 16.3157 61.8439
2.11 445154.07 6766214.04 25.9851 61.0269
2.3 62224.79 6967702.12 18.4615 62.5789
2.11 431390.39 6706380.44 25.7515 60.4877
2.4 160415.01 7141063.28 19.9895 64.2271
2.11 445108.19 6677500.58 26.0090 60.2306
2.4 172813.88 7119462.39 20.2901 64.0466
2.11 470858.85 6670199.82 26.4749 60.1677
2.4 147213.57 7060181.38 19.9043 63.4937
2.11 360934.13 6659682.46 24.5026 60.0507
2.4 62224.79 6967702.12 18.4615 62.5789
2.11 158810.89 6704779.67 20.8143 60.3353
2.4 -60657.00 6903070.12 16.3157 61.8439
2.11 33206.86 6790437.11 18.3598 60.9712
2.4 -14242.33 6983383.76 16.9480 62.6194
2.11 -11650.12 6834840.71 17.4229 61.3090
2.4 147126.47 7125443.27 19.7543 64.0747
2.11 23969.23 6879651.20 17.9641 61.7514
2.4 160415.01 7141063.28 19.9895 64.2271
2.11 62224.79 6967702.12 18.4615 62.5789
2.5 194201.93 7276399.36 20.3906 65.4655
2.11 147213.57 7060181.38 19.9043 63.4937
2.5 230848.84 7270065.16 21.1900 65.4413
2.11 172813.88 7119462.39 20.2901 64.0466
2.5 302102.22 7206967.57 22.8123 64.9278
2.11 182358.54 7082151.44 20.5613 63.7228
2.5 335801.46 7182142.79 23.5522 64.7238
2.11 195482.15 7051706.07 20.8842 63.4627
2.5 300362.94 7150943.24 22.8531 64.4254
2.11 265967.04 7102788.98 22.2164 63.9730
2.5 265967.04 7102788.98 22.2164 63.9730
2.11 300362.94 7150943.24 22.8531 64.4254
2.5 195482.15 7051706.07 20.8842 63.4627
2.11 335801.46 7182142.79 23.5522 64.7238
2.5 182358.54 7082151.44 20.5613 63.7228
2.12 638217.79 6738276.46 29.5365 60.7560
2.5 172813.88 7119462.39 20.2901 64.0466
2.12 575225.24 6704344.16 28.3681 60.4683
2.5 160415.01 7141063.28 19.9895 64.2271
2.12 518056.31 6682156.56 27.3264 60.2757
2.5 167341.02 7247173.25 19.8863 65.1789
2.12 470858.85 6670199.82 26.4749 60.1677
2.5 194201.93 7276399.36 20.3906 65.4655
2.12 445108.19 6677500.58 26.0090 60.2306
2.6 253020.94 7328037.34 21.5578 65.9767
2.12 431390.39 6706380.44 25.7515 60.4877
2.6 313121.01 7327892.41 22.8775 66.0165
2.12 445154.07 6766214.04 25.9851 61.0269
2.6 389732.60 7327353.77 24.5655 66.0476
2.12 493217.49 6793735.86 26.8735 61.2778
2.6 392721.08 7306647.74 24.6485 65.8630
2.12 527613.39 6806303.59 27.5169 61.3897
2.6 434604.77 7253768.80 25.5921 65.4000
2.12 554501.59 6785041.44 28.0140 61.1960
2.6 335801.46 7182142.79 23.5522 64.7238
2.12 610295.85 6770584.77 29.0430 61.0546
2.6 302102.22 7206967.57 22.8123 64.9278
2.12 638217.79 6738276.46 29.5365 60.7560
2.6 230848.84 7270065.16 21.1900 65.4413
2.6 253020.94 7328037.34 21.5578 65.9767
2.7 104024.88 7481694.14 17.8201 67.1883
2.7 195127.00 7628587.99 19.4966 68.6018
2.7 306847.26 7657636.49 22.1747 68.9612
2.7 419014.77 7657055.72 24.9736 69.0122
2.7 540709.77 7629025.06 28.0074 68.7698

281
2.7 579820.92 7612766.71 28.9619 68.6155
2.7 617963.95 7592941.35 29.8754 68.4245
2.7 584400.65 7554775.55 29.0275 68.0944
2.7 389732.60 7327353.77 24.5655 66.0476
2.7 313121.34 7327892.41 22.8775 66.0165
2.7 253020.94 7328037.34 21.5578 65.9767
2.7 245015.74 7382554.88 21.2729 66.4571
2.7 206456.88 7432599.38 20.2931 66.8690
2.7 104024.88 7481694.14 17.8201 67.1883
Table A4.3. Seismic source areas and coordinates for spatial model 3 (section 8.3).
Polygon POINT X (m) POINT Y (m) Point X Point Y Polygon POINT X (m) POINT Y (m) Point X Point Y
3.1 235956.93 7694414.36 20.3169 69.2299 3.13 195127.00 7628587.99 19.4966 68.6018
3.1 104024.88 7481694.14 17.8201 67.1883
3.13 235956.93 7694414.36 20.3169 69.2299
3.1 -4549.80 7375326.22 15.7954 66.0908
3.13 305244.51 7805464.03 21.8228 70.2807
3.1 -8780.52 7343736.89 15.8272 65.8061
3.13 373214.98 7814324.13 23.6115 70.4028
3.1 29708.05 7316689.03 16.7512 65.6261
3.13 404547.69 7787798.80 24.4771 70.1789
3.1 5234.04 7224746.14 16.5570 64.7788
3.13 343412.94 7702073.63 23.0131 69.3821
3.1 33015.35 7195641.92 17.2267 64.5612
3.13 303725.36 7621110.97 22.1687 68.6326
3.1 38968.48 7159923.10 17.4605 64.2533
3.13 279912.82 7561579.60 21.7109 68.0833
3.1 -57.63 7141402.23 16.7294 64.0354
3.13 275608.18 7600820.79 21.5246 68.4303
3.1 -94640.86 7108986.43 14.9587 63.6026
3.13 266083.16 7617489.57 21.2557 68.5713
3.1 -158633.06 7029027.61 14.0242 62.7909
3.13 232318.89 7633586.49 20.3907 68.6845
3.1 -166448.24 6962371.35 14.1329 62.1939
3.13 195127.00 7628587.99 19.4966 68.6018
3.1 -320617.28 6960199.65 11.2863 61.8732
3.14 410173.24 7559966.23 24.8379 68.1393
3.1 -330142.30 7098841.60 10.4467 63.0476
3.14 380287.16 7611245.81 24.0608 68.5877
3.1 -111066.86 7360250.45 13.5731 65.7725
3.14 398215.48 7658729.72 24.4521 69.0202
3.1 -17340.72 7477603.13 15.0905 66.9687
3.14 431778.12 7690988.45 25.2688 69.3198
3.1 25390.97 7523299.63 15.8643 67.4409
3.14 474469.24 7740586.71 26.3384 69.7720
3.1 118613.98 7608937.23 17.7136 68.3343
3.14 483113.22 7777480.03 26.5554 70.1035
3.1 195078.72 7694017.48 19.2944 69.1834
3.14 511052.96 7761806.98 27.2891 69.9633
3.1 235956.93 7694414.36 20.3169 69.2299
3.14 535224.51 7702232.42 27.8982 69.4270
3.2 104024.88 7481694.14 17.8201 67.1883
3.14 554274.55 7660163.59 28.3600 69.0466
3.2 195127.00 7628587.99 19.4966 68.6018
3.14 553702.40 7624052.73 28.3262 68.7230
3.2 232318.89 7633586.49 20.3907 68.6845
3.14 580393.87 7612499.10 28.9757 68.6130
3.2 266083.16 7617489.57 21.2557 68.5713
3.14 617963.95 7592941.35 29.8754 68.4245
3.2 275608.18 7600820.79 21.5246 68.4303
3.14 584400.65 7554775.55 29.0275 68.0944
3.2 279912.82 7561579.60 21.7109 68.0833
3.14 529331.94 7571133.73 27.7094 68.2520
3.2 233875.22 7466329.41 20.8389 67.1950
3.14 506804.39 7570390.24 27.1645 68.2468
3.2 206456.88 7432599.38 20.2931 66.8690
3.14 453887.62 7602140.31 25.8711 68.5279
3.2 104024.88 7481694.14 17.8201 67.1883
3.14 410173.24 7559966.23 24.8379 68.1393
3.3 104024.88 7481694.14 17.8201 67.1883
3.15 506804.39 7570390.24 27.1645 68.2468
3.3 150288.52 7459520.38 18.9449 67.0489
3.15 529331.94 7571133.73 27.7094 68.2520
3.3 206456.88 7432599.38 20.2931 66.8690
3.15 584400.65 7554775.55 29.0275 68.0944
3.3 233875.22 7466329.41 20.8389 67.1950
3.15 525529.41 7485945.88 27.5975 67.4884
3.3 255540.56 7458421.00 21.3539 67.1429
3.15 437868.90 7383589.22 25.5999 66.5650

282
3.3 292793.97 7453764.32 22.2186 67.1293
3.15 424025.29 7402039.19 25.2767 66.7274
3.3 311420.67 7459056.00 22.6382 67.1889
3.15 394621.16 7420106.61 24.5945 66.8806
3.3 287850.33 7428229.34 22.1508 66.8976
3.15 443304.26 7499481.77 25.6664 67.6054
3.3 245015.74 7382554.88 21.2729 66.4571
3.15 506804.39 7570390.24 27.1645 68.2468
3.3 253020.94 7328037.34 21.5578 65.9767
3.16 729146.05 7505939.91 32.3894 67.5794
3.3 230848.84 7270065.16 21.1900 65.4413
3.16 594498.48 7374194.37 29.1217 66.4726
3.3 194201.93 7276399.36 20.3906 65.4655
3.16 496939.87 7279005.27 26.9335 65.6330
3.3 167341.02 7247173.25 19.8863 65.1789
3.16 451960.47 7235047.12 25.9722 65.2351
3.3 160415.01 7141063.28 19.9895 64.2271
3.16 434604.77 7253768.80 25.5921 65.4000
3.3 147126.47 7125443.27 19.7543 64.0747
3.16 392721.08 7306647.74 24.6485 65.8630
3.3 55874.25 7045261.76 18.1322 63.2593
3.16 389732.60 7327353.77 24.5655 66.0476
3.3 -14242.33 6983383.76 16.9480 62.6194
3.16 584400.65 7554775.55 29.0275 68.0944
3.3 -60657.00 6903070.12 16.3157 61.8439
3.16 617963.95 7592941.35 29.8754 68.4245
3.3 -166448.24 6962371.35 14.1329 62.1939
3.16 729146.05 7505939.91 32.3894 67.5794
3.3 -158633.06 7029027.61 14.0242 62.7909
3.17 522838.35 7118422.11 27.4701 64.1914
3.3 -123831.03 7072513.06 14.5261 63.2329
3.17 504158.64 7091079.21 27.0849 63.9467
3.3 -94640.86 7108986.43 14.9587 63.6026
3.17 481062.40 7154643.87 26.6055 64.5166
3.3 -57.63 7141402.23 16.7294 64.0354
3.17 451960.47 7235047.12 25.9722 65.2351
3.3 38968.48 7159923.10 17.4605 64.2533
3.17 496939.87 7279005.27 26.9335 65.6330
3.3 33015.35 7195641.92 17.2267 64.5612
3.17 584701.66 7208116.47 28.7954 64.9862
3.3 5234.04 7224746.14 16.5570 64.7788
3.17 682244.13 7306333.46 30.9904 65.8262
3.3 29708.05 7316689.03 16.7512 65.6261
3.17 594498.48 7374194.37 29.1217 66.4726
3.3 -8780.52 7343736.89 15.8272 65.8061
3.17 729146.71 7505939.91 32.3894 67.5794
3.3 -4549.80 7375326.22 15.7954 66.0908
3.17 763449.73 7466246.19 33.0994 67.1967
3.3 104024.88 7481694.14 17.8201 67.1883
3.17 804651.61 7404116.52 33.8869 66.6044
3.4 62224.79 6967702.12 18.4615 62.5789
3.17 522838.35 7118422.11 27.4701 64.1914
3.4 23969.23 6879651.20 17.9641 61.7514
3.18 496939.87 7279005.27 26.9335 65.6330
3.4 -11650.12 6834840.71 17.4229 61.3090
3.18 594498.48 7374194.37 29.1217 66.4726
3.4 -62866.76 6817782.92 16.5330 61.0880
3.18 682244.13 7306333.46 30.9904 65.8262
3.4 -106370.11 6830356.03 15.7018 61.1343
3.18 584701.66 7208116.47 28.7954 64.9862
3.4 -60657.00 6903070.12 16.3157 61.8439
3.18 496939.87 7279005.27 26.9335 65.6330
3.4 62224.79 6967702.12 18.4615 62.5789
3.19 490746.47 7071446.82 26.8124 63.7704
3.5 55874.25 7045261.76 18.1322 63.2593
3.19 522838.35 7118422.11 27.4701 64.1914
3.5 147126.47 7125443.27 19.7543 64.0747
3.19 804651.61 7404116.52 33.8869 66.6044
3.5 137846.01 7088424.32 19.6528 63.7357
3.19 839853.64 7326456.63 34.4662 65.8771
3.5 121247.36 7031926.64 19.4539 63.2156
3.19 860727.10 7249861.67 34.7146 65.1734
3.5 62224.79 6967702.12 18.4615 62.5789
3.19 866264.12 7206969.15 34.7203 64.7859
3.5 -60657.00 6903070.12 16.3157 61.8439
3.19 868511.79 7159612.81 34.6474 64.3624
3.5 -14242.33 6983383.76 16.9480 62.6194
3.19 864753.98 7098427.09 34.4229 63.8220
3.5 55874.25 7045261.76 18.1322 63.2593
3.19 850478.80 7026542.14 33.9763 63.1963
3.6 121247.36 7031926.64 19.4539 63.2156
3.19 812744.97 6930141.95 33.0510 62.3708
3.6 137846.01 7088424.32 19.6528 63.7357
3.19 721617.75 6805612.56 31.1413 61.3213
3.6 147126.47 7125443.27 19.7543 64.0747
3.19 548954.92 6975138.29 27.9633 62.9029
3.6 160415.01 7141063.28 19.9895 64.2271
3.19 510854.84 7003713.35 27.2155 63.1625
3.6 167341.02 7247173.25 19.8863 65.1789
3.19 490746.47 7071446.82 26.8124 63.7704
3.6 194201.93 7276399.36 20.3906 65.4655
3.20 346700.12 7190043.62 23.7722 64.7997
3.6 230848.84 7270065.16 21.1900 65.4413
3.20 345251.32 7253616.12 23.6713 65.3685
3.6 277424.76 7228820.40 22.2575 65.1077
3.20 383325.13 7216594.38 24.5204 65.0525
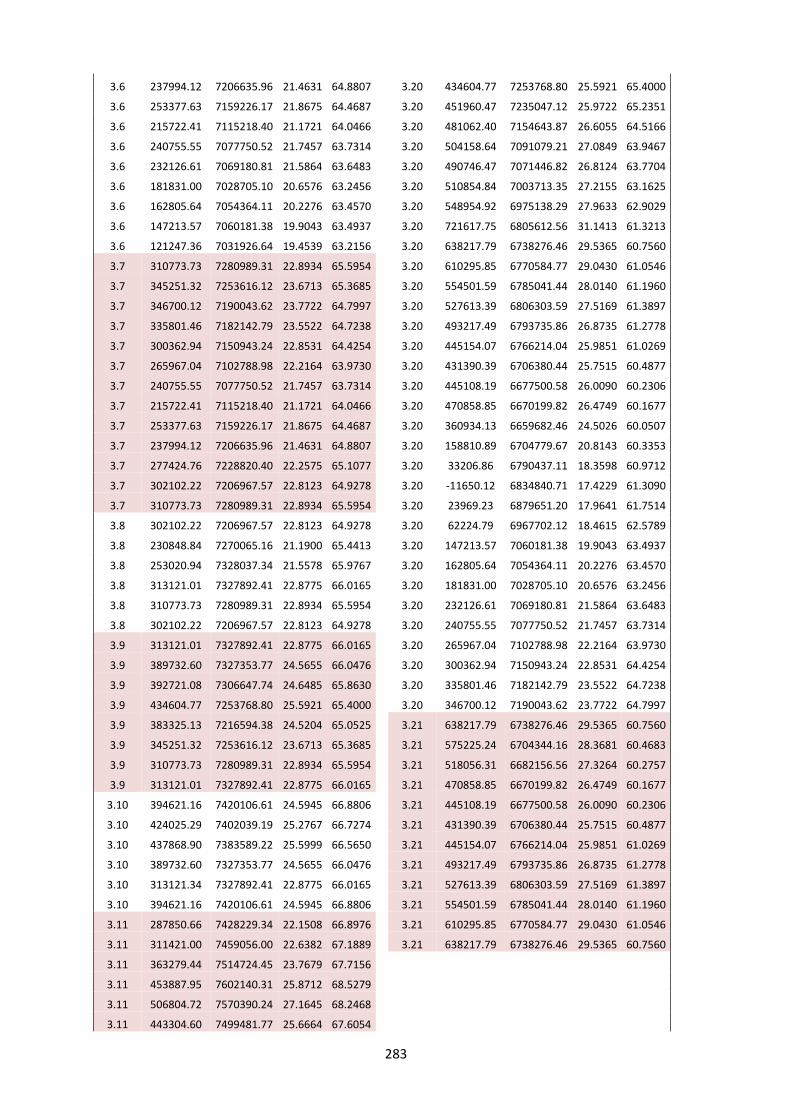
283
3.6 237994.12 7206635.96 21.4631 64.8807
3.20 434604.77 7253768.80 25.5921 65.4000
3.6 253377.63 7159226.17 21.8675 64.4687
3.20 451960.47 7235047.12 25.9722 65.2351
3.6 215722.41 7115218.40 21.1721 64.0466
3.20 481062.40 7154643.87 26.6055 64.5166
3.6 240755.55 7077750.52 21.7457 63.7314
3.20 504158.64 7091079.21 27.0849 63.9467
3.6 232126.61 7069180.81 21.5864 63.6483
3.20 490746.47 7071446.82 26.8124 63.7704
3.6 181831.00 7028705.10 20.6576 63.2456
3.20 510854.84 7003713.35 27.2155 63.1625
3.6 162805.64 7054364.11 20.2276 63.4570
3.20 548954.92 6975138.29 27.9633 62.9029
3.6 147213.57 7060181.38 19.9043 63.4937
3.20 721617.75 6805612.56 31.1413 61.3213
3.6 121247.36 7031926.64 19.4539 63.2156
3.20 638217.79 6738276.46 29.5365 60.7560
3.7 310773.73 7280989.31 22.8934 65.5954
3.20 610295.85 6770584.77 29.0430 61.0546
3.7 345251.32 7253616.12 23.6713 65.3685
3.20 554501.59 6785041.44 28.0140 61.1960
3.7 346700.12 7190043.62 23.7722 64.7997
3.20 527613.39 6806303.59 27.5169 61.3897
3.7 335801.46 7182142.79 23.5522 64.7238
3.20 493217.49 6793735.86 26.8735 61.2778
3.7 300362.94 7150943.24 22.8531 64.4254
3.20 445154.07 6766214.04 25.9851 61.0269
3.7 265967.04 7102788.98 22.2164 63.9730
3.20 431390.39 6706380.44 25.7515 60.4877
3.7 240755.55 7077750.52 21.7457 63.7314
3.20 445108.19 6677500.58 26.0090 60.2306
3.7 215722.41 7115218.40 21.1721 64.0466
3.20 470858.85 6670199.82 26.4749 60.1677
3.7 253377.63 7159226.17 21.8675 64.4687
3.20 360934.13 6659682.46 24.5026 60.0507
3.7 237994.12 7206635.96 21.4631 64.8807
3.20 158810.89 6704779.67 20.8143 60.3353
3.7 277424.76 7228820.40 22.2575 65.1077
3.20 33206.86 6790437.11 18.3598 60.9712
3.7 302102.22 7206967.57 22.8123 64.9278
3.20 -11650.12 6834840.71 17.4229 61.3090
3.7 310773.73 7280989.31 22.8934 65.5954
3.20 23969.23 6879651.20 17.9641 61.7514
3.8 302102.22 7206967.57 22.8123 64.9278
3.20 62224.79 6967702.12 18.4615 62.5789
3.8 230848.84 7270065.16 21.1900 65.4413
3.20 147213.57 7060181.38 19.9043 63.4937
3.8 253020.94 7328037.34 21.5578 65.9767
3.20 162805.64 7054364.11 20.2276 63.4570
3.8 313121.01 7327892.41 22.8775 66.0165
3.20 181831.00 7028705.10 20.6576 63.2456
3.8 310773.73 7280989.31 22.8934 65.5954
3.20 232126.61 7069180.81 21.5864 63.6483
3.8 302102.22 7206967.57 22.8123 64.9278
3.20 240755.55 7077750.52 21.7457 63.7314
3.9 313121.01 7327892.41 22.8775 66.0165
3.20 265967.04 7102788.98 22.2164 63.9730
3.9 389732.60 7327353.77 24.5655 66.0476
3.20 300362.94 7150943.24 22.8531 64.4254
3.9 392721.08 7306647.74 24.6485 65.8630
3.20 335801.46 7182142.79 23.5522 64.7238
3.9 434604.77 7253768.80 25.5921 65.4000
3.20 346700.12 7190043.62 23.7722 64.7997
3.9 383325.13 7216594.38 24.5204 65.0525
3.21 638217.79 6738276.46 29.5365 60.7560
3.9 345251.32 7253616.12 23.6713 65.3685
3.21 575225.24 6704344.16 28.3681 60.4683
3.9 310773.73 7280989.31 22.8934 65.5954
3.21 518056.31 6682156.56 27.3264 60.2757
3.9 313121.01 7327892.41 22.8775 66.0165
3.21 470858.85 6670199.82 26.4749 60.1677
3.10 394621.16 7420106.61 24.5945 66.8806
3.21 445108.19 6677500.58 26.0090 60.2306
3.10 424025.29 7402039.19 25.2767 66.7274
3.21 431390.39 6706380.44 25.7515 60.4877
3.10 437868.90 7383589.22 25.5999 66.5650
3.21 445154.07 6766214.04 25.9851 61.0269
3.10 389732.60 7327353.77 24.5655 66.0476
3.21 493217.49 6793735.86 26.8735 61.2778
3.10 313121.34 7327892.41 22.8775 66.0165
3.21 527613.39 6806303.59 27.5169 61.3897
3.10 394621.16 7420106.61 24.5945 66.8806
3.21 554501.59 6785041.44 28.0140 61.1960
3.11 287850.66 7428229.34 22.1508 66.8976
3.21 610295.85 6770584.77 29.0430 61.0546
3.11 311421.00 7459056.00 22.6382 67.1889
3.21 638217.79 6738276.46 29.5365 60.7560
3.11 363279.44 7514724.45 23.7679 67.7156
3.11 453887.95 7602140.31 25.8712 68.5279
3.11 506804.72 7570390.24 27.1645 68.2468
3.11 443304.60 7499481.77 25.6664 67.6054

284
3.11 394621.16 7420106.61 24.5945 66.8806
3.11 313121.34 7327892.41 22.8775 66.0165
3.11 253021.27 7328037.34 21.5578 65.9767
3.11 245016.07 7382554.88 21.2729 66.4571
3.11 287850.66 7428229.34 22.1508 66.8976
3.12 255540.56 7458421.00 21.3539 67.1429
3.12 233875.22 7466329.41 20.8389 67.1950
3.12 279912.82 7561579.60 21.7109 68.0833
3.12 303725.36 7621110.97 22.1687 68.6326
3.12 343412.94 7702073.63 23.0131 69.3821
3.12 404547.69 7787798.80 24.4771 70.1789
3.12 431399.55 7803844.90 25.1736 70.3313
3.12 483113.22 7777480.03 26.5554 70.1035
3.12 474469.24 7740586.71 26.3384 69.7720
3.12 431778.12 7690988.45 25.2688 69.3198
3.12 398215.48 7658729.72 24.4521 69.0202
3.12 380287.16 7611245.81 24.0608 68.5877
3.12 410173.24 7559966.23 24.8379 68.1393
3.12 363279.11 7514724.45 23.7679 67.7156
3.12 311420.67 7459056.00 22.6382 67.1889
3.12 292793.97 7453764.32 22.2186 67.1293
3.12 255540.56 7458421.00 21.3539 67.1429

ISSN 0357-3060
ISBN 978-952-10-9583-2 (PDF)
ISBN 978-952-10-5078-7 (Paperback)
Unigrafia
Helsinki 2015